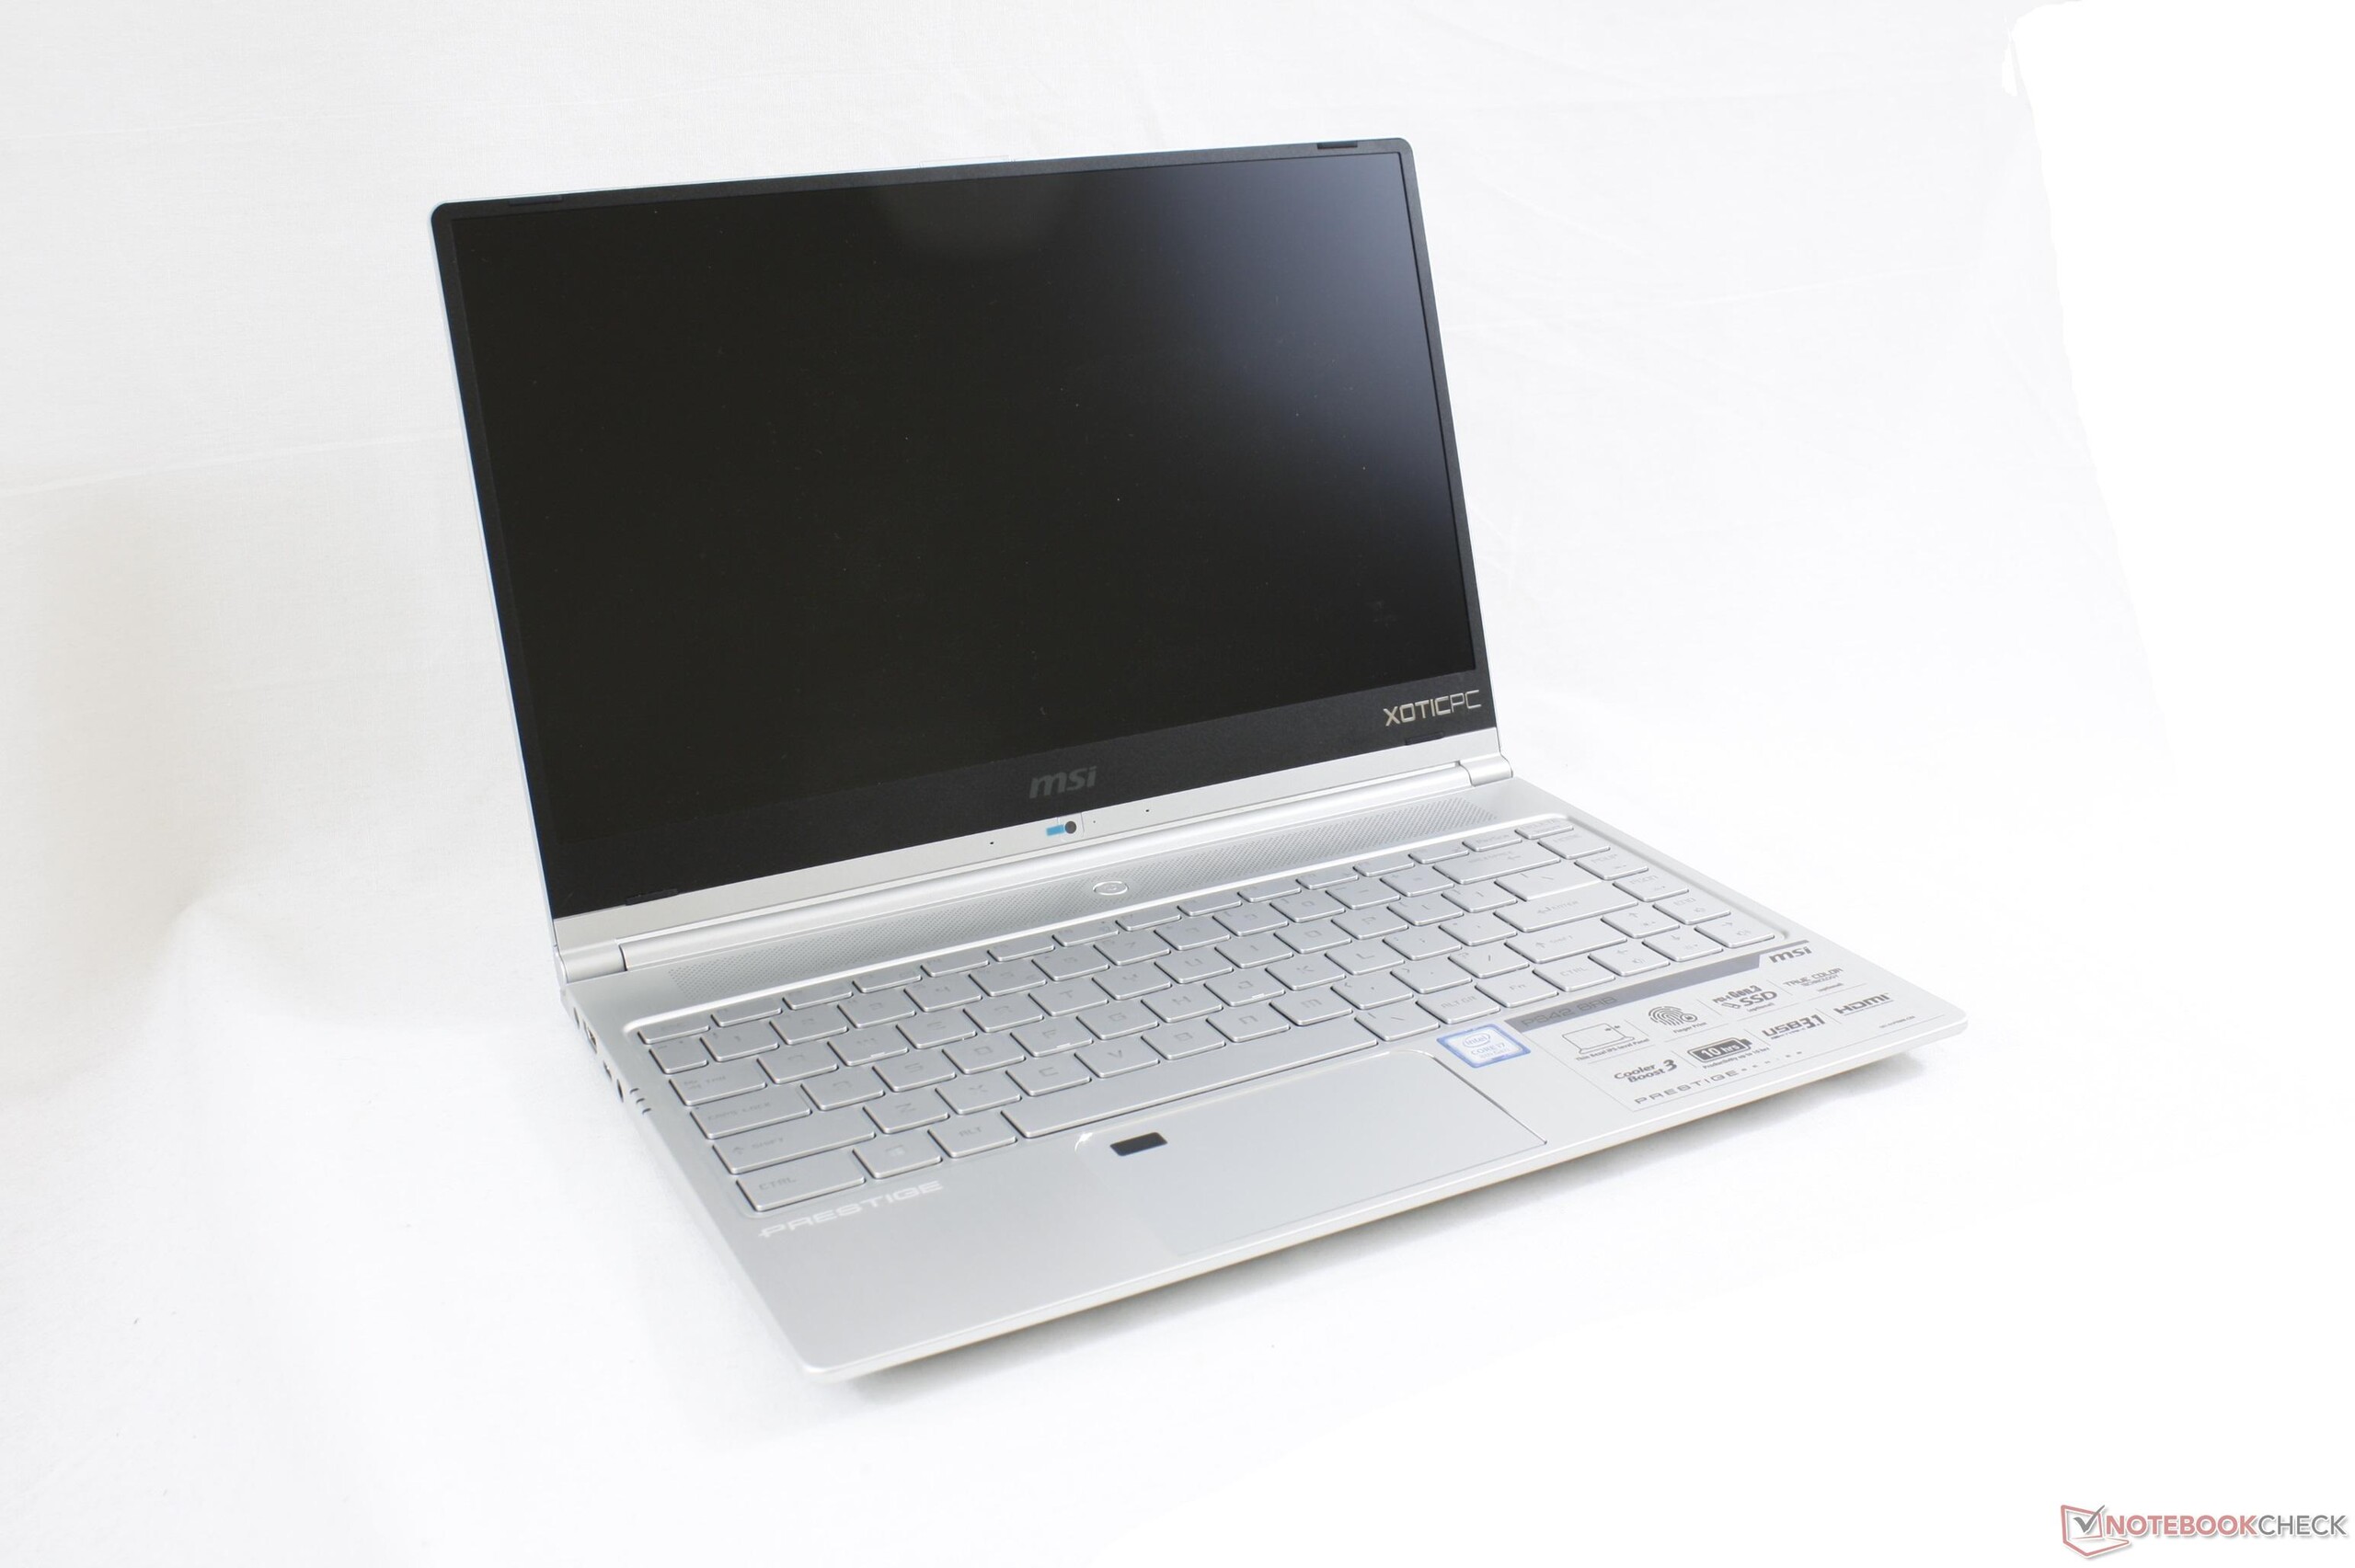
Kort testrapport MSI PS42 8RB Prestige (i7-8550U, GeForce MX150) Laptop
| SD Card Reader | |
| average JPG Copy Test (av. of 3 runs) | |
| Dell XPS 13 9370 i7 UHD (Toshiba Exceria Pro UHS-II) | |
| Lenovo ThinkPad T480s-20L7002AUS (Toshiba Exceria Pro SDXC 64 GB UHS-II) | |
| MSI Prestige PS42 8RB-059 (Toshiba Exceria Pro SDXC 64 GB UHS-II) | |
| maximum AS SSD Seq Read Test (1GB) | |
| Dell XPS 13 9370 i7 UHD (Toshiba Exceria Pro UHS-II) | |
| Lenovo ThinkPad T480s-20L7002AUS (Toshiba Exceria Pro SDXC 64 GB UHS-II) | |
| MSI Prestige PS42 8RB-059 (Toshiba Exceria Pro SDXC 64 GB UHS-II) | |
| Networking | |
| iperf3 transmit AX12 | |
| Huawei Matebook X Pro i5 | |
| Dell XPS 13 9370 i7 UHD | |
| MSI Prestige PS42 8RB-059 | |
| iperf3 receive AX12 | |
| Dell XPS 13 9370 i7 UHD | |
| Huawei Matebook X Pro i5 | |
| MSI Prestige PS42 8RB-059 | |
| |||||||||||||||||||||||||
Helderheidsverdeling: 86 %
Helderheid in Batterij-modus: 285.4 cd/m²
Contrast: 921:1 (Zwart: 0.31 cd/m²)
ΔE ColorChecker Calman: 1 | ∀{0.5-29.43 Ø4.73}
calibrated: 0.98
ΔE Greyscale Calman: 1.4 | ∀{0.09-98 Ø4.97}
98.91% sRGB (Argyll 1.6.3 3D)
63.82% AdobeRGB 1998 (Argyll 1.6.3 3D)
69.6% AdobeRGB 1998 (Argyll 3D)
98.6% sRGB (Argyll 3D)
67.5% Display P3 (Argyll 3D)
Gamma: 2.25
CCT: 6699 K
| MSI Prestige PS42 8RB-059 CMN N140HCE-EN2, IPS, 14", 1920x1080 | Dell XPS 13 9370 i7 UHD ID: Sharp SHP148B, Name: LQ133D1, Dell P/N: 8XDHY, IPS, 13.3", 3840x2160 | Huawei Matebook X Pro i5 Tianma XM, IPS, 13.9", 3000x2000 | Lenovo ThinkPad T480s-20L7002AUS NV140FHM-N46, TFT-LCD, 14", 1920x1080 | Asus Zenbook UX3430UN-GV174T Chi Mei CMN14D2 / N140HCE-EN1, IPS, 14", 1920x1080 | HP Spectre x360 13t-ae000 LGD0588, IPS, 13.3", 3840x2160 | |
|---|---|---|---|---|---|---|
| Display | 1% | -3% | -41% | -2% | 4% | |
| Display P3 Coverage (%) | 67.5 | 68.9 2% | 65.9 -2% | 39.69 -41% | 65.6 -3% | 71.9 7% |
| sRGB Coverage (%) | 98.6 | 98.4 0% | 95.2 -3% | 59.2 -40% | 97.4 -1% | 98.1 -1% |
| AdobeRGB 1998 Coverage (%) | 69.6 | 69.5 0% | 67.6 -3% | 41 -41% | 67.8 -3% | 73.1 5% |
| Response Times | -90% | -10% | -33% | 6% | -41% | |
| Response Time Grey 50% / Grey 80% * (ms) | 34.4 ? | 69.6 ? -102% | 40.4 ? -17% | 44 ? -28% | 30 ? 13% | 51.6 ? -50% |
| Response Time Black / White * (ms) | 24.8 ? | 44 ? -77% | 25.6 ? -3% | 34 ? -37% | 25 ? -1% | 32.4 ? -31% |
| PWM Frequency (Hz) | 25000 ? | 3759 ? | 990 | |||
| Screen | -29% | -61% | -149% | -77% | -16% | |
| Brightness middle (cd/m²) | 285.4 | 478.5 68% | 442.7 55% | 288.3 1% | 377 32% | 329.8 16% |
| Brightness (cd/m²) | 269 | 466 73% | 428 59% | 281 4% | 339 26% | 318 18% |
| Brightness Distribution (%) | 86 | 86 0% | 84 -2% | 86 0% | 76 -12% | 74 -14% |
| Black Level * (cd/m²) | 0.31 | 0.43 -39% | 0.31 -0% | 0.21 32% | 0.4 -29% | 0.25 19% |
| Contrast (:1) | 921 | 1113 21% | 1428 55% | 1373 49% | 943 2% | 1319 43% |
| Colorchecker dE 2000 * | 1 | 3.09 -209% | 2.24 -124% | 6.16 -516% | 3.33 -233% | 2.37 -137% |
| Colorchecker dE 2000 max. * | 3.65 | 5.94 -63% | 7.19 -97% | 18.99 -420% | 8.02 -120% | 4.08 -12% |
| Colorchecker dE 2000 calibrated * | 0.98 | 2.06 -110% | 1.11 -13% | 4.51 -360% | 3.5 -257% | |
| Greyscale dE 2000 * | 1.4 | 2.4 -71% | 9.7 -593% | 6.3 -350% | 4.89 -249% | 2.8 -100% |
| Gamma | 2.25 98% | 2.063 107% | 1.42 155% | 2.517 87% | 2.37 93% | 2.145 103% |
| CCT | 6699 97% | 6883 94% | 6227 104% | 6886 94% | 7620 85% | 6441 101% |
| Color Space (Percent of AdobeRGB 1998) (%) | 63.82 | 69.47 9% | 61.6 -3% | 37.67 -41% | 62 -3% | 67 5% |
| Color Space (Percent of sRGB) (%) | 98.91 | 98.36 -1% | 95 -4% | 58.9 -40% | 98 -1% | 98 -1% |
| Totaal Gemiddelde (Programma / Instellingen) | -39% /
-31% | -25% /
-43% | -74% /
-114% | -24% /
-52% | -18% /
-16% |
* ... kleiner is beter
Responstijd Scherm
| ↔ Responstijd Zwart naar Wit | ||
|---|---|---|
| 24.8 ms ... stijging ↗ en daling ↘ gecombineerd | ↗ 14.8 ms stijging | 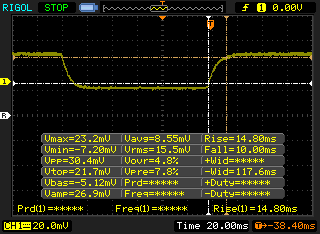 |
| ↘ 10 ms daling | ||
| Het scherm vertoonde prima responstijden in onze tests maar is misschien wat te traag voor competitieve games. Ter vergelijking: alle testtoestellen variëren van 0.1 (minimum) tot 240 (maximum) ms. » 58 % van alle toestellen zijn beter. Dit betekent dat de gemeten responstijd slechter is dan het gemiddelde (19.9 ms) van alle geteste toestellen. | ||
| ↔ Responstijd 50% Grijs naar 80% Grijs | ||
| 34.4 ms ... stijging ↗ en daling ↘ gecombineerd | ↗ 18 ms stijging | 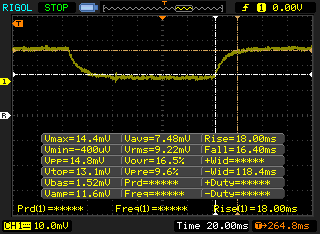 |
| ↘ 16.4 ms daling | ||
| Het scherm vertoonde trage responstijden in onze tests en is misschien te traag voor games. Ter vergelijking: alle testtoestellen variëren van 0.165 (minimum) tot 636 (maximum) ms. » 48 % van alle toestellen zijn beter. Dit betekent dat de gemeten responstijd slechter is dan het gemiddelde (31.1 ms) van alle geteste toestellen. | ||
Screen Flickering / PWM (Pulse-Width Modulation)
| Screen flickering / PWM waargenomen | 25000 Hz | ≤ 22 % helderheid instelling | 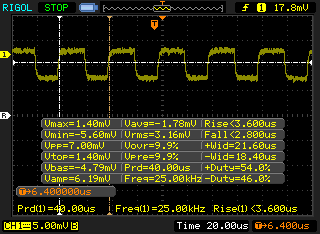 |
De achtergrondverlichting van het scherm flikkert op 25000 Hz (in het slechtste geval, bijvoorbeeld bij gebruik van PWM) aan een helderheid van 22 % en lager. Boven deze helderheid zou er geen flickering / PWM mogen optreden. De frequentie van 25000 Hz is redelijk hoog en de meeste mensen die gevoelig zijn aan flickering zouden dit dus niet mogen waarnemen of geïrriteerde ogen krijgen. Ter vergelijking: 52 % van alle geteste toestellen maakten geen gebruik van PWM om de schermhelderheid te verlagen. Als het wel werd gebruikt, werd een gemiddelde van 7798 (minimum: 5 - maximum: 343500) Hz waargenomen. | |||
| PCMark 8 Home Score Accelerated v2 | 3740 punten | |
| PCMark 8 Work Score Accelerated v2 | 5077 punten | |
| PCMark 10 Score | 3753 punten | |
Help | ||
| MSI Prestige PS42 8RB-059 Toshiba KSG60ZMV512G | Dell XPS 13 9370 i7 UHD Toshiba XG5 KXG50ZNV512G | Huawei Matebook X Pro i5 Samsung PM961 MZVLW256HEHP | Lenovo ThinkPad T480s-20L7002AUS Samsung PM961 MZVLW256HEHP | Lenovo ThinkPad 13 20J1005TPB Intel SSD 600p SSDPEKKW256G7 | Gemiddeld Toshiba KSG60ZMV512G | |
|---|---|---|---|---|---|---|
| AS SSD | 61% | 96% | 141% | 44% | -3% | |
| Copy Game MB/s (MB/s) | 587 | 503 -14% | 486.3 -17% | 546 ? -7% | ||
| Copy Program MB/s (MB/s) | 439.5 | 570 30% | 312.3 -29% | 326 ? -26% | ||
| Copy ISO MB/s (MB/s) | 700 | 585 -16% | 739 6% | 563 ? -20% | ||
| Score Total (Points) | 1110 | 1911 72% | 2575 132% | 3048 175% | 1305 18% | 1089 ? -2% |
| Score Write (Points) | 442 | 596 35% | 620 40% | 921 108% | 655 48% | 412 ? -7% |
| Score Read (Points) | 436 | 926 112% | 1329 205% | 1435 229% | 449 3% | 446 ? 2% |
| Access Time Write * (ms) | 0.076 | 0.055 28% | 0.036 53% | 0.038 50% | 0.033 57% | 0.064 ? 16% |
| Access Time Read * (ms) | 0.154 | 0.059 62% | 0.058 62% | 0.055 64% | 0.081 47% | 0.112 ? 27% |
| 4K-64 Write (MB/s) | 311.3 | 444.8 43% | 399.6 28% | 706 127% | 481.7 55% | 285 ? -8% |
| 4K-64 Read (MB/s) | 363.2 | 678 87% | 1039 186% | 1183 226% | 278.2 -23% | 373 ? 3% |
| 4K Write (MB/s) | 82.2 | 107.4 31% | 103.1 25% | 97.8 19% | 113.9 39% | 87 ? 6% |
| 4K Read (MB/s) | 26.86 | 29.36 9% | 48.33 80% | 42.09 57% | 33.1 23% | 25.3 ? -6% |
| Seq Write (MB/s) | 481 | 435.8 -9% | 1170 143% | 1172 144% | 590 23% | 391 ? -19% |
| Seq Read (MB/s) | 460.4 | 2205 379% | 2416 425% | 2094 355% | 1375 199% | 467 ? 1% |
* ... kleiner is beter

| 3DMark | |
| 1920x1080 Fire Strike Graphics | |
| Dell XPS 15 9575 i5-8305G | |
| Dell XPS 15 2018 i5 FHD 97Wh | |
| MSI Prestige PS42 8RB-059 | |
| Gemiddeld NVIDIA GeForce MX150 (2323 - 3739, n=44) | |
| Huawei Matebook X Pro i5 | |
| Dell Latitude 5591 | |
| Apple MacBook Pro 13 2018 Touchbar i5 | |
| Asus VivoBook S410UQ-NH74 | |
| Lenovo Ideapad 720S-13ARR | |
| 1280x720 Cloud Gate Standard Graphics | |
| Dell XPS 15 9575 i5-8305G | |
| Dell XPS 15 2018 i5 FHD 97Wh | |
| MSI Prestige PS42 8RB-059 | |
| Gemiddeld NVIDIA GeForce MX150 (16227 - 22183, n=43) | |
| Huawei Matebook X Pro i5 | |
| Dell Latitude 5591 | |
| Apple MacBook Pro 13 2018 Touchbar i5 | |
| Asus VivoBook S410UQ-NH74 | |
| HP EliteBook x360 1030 G3 | |
| Lenovo Ideapad 720S-13ARR | |
| 3DMark 11 Performance | 5021 punten | |
| 3DMark Cloud Gate Standard Score | 13394 punten | |
| 3DMark Fire Strike Score | 3312 punten | |
Help | ||
| BioShock Infinite - 1920x1080 Ultra Preset, DX11 (DDOF) | |
| Dell G3 15 3579 | |
| Dell XPS 15 9575 i5-8305G | |
| MSI Prestige PS42 8RB-059 | |
| Gemiddeld NVIDIA GeForce MX150 (27.8 - 35.2, n=33) | |
| Huawei Matebook X Pro i5 | |
| Asus VivoBook S410UQ-NH74 | |
| HP EliteBook 755 G5 3UN79EA | |
| HP EliteBook x360 1030 G3 | |
| Rise of the Tomb Raider - 1920x1080 Very High Preset AA:FX AF:16x | |
| Dell G3 15 3579 | |
| Dell XPS 15 9575 i5-8305G | |
| MSI Prestige PS42 8RB-059 | |
| Gemiddeld NVIDIA GeForce MX150 (14.8 - 26, n=23) | |
| Asus VivoBook S410UQ-NH74 | |
| The Witcher 3 - 1920x1080 Ultra Graphics & Postprocessing (HBAO+) | |
| Dell XPS 15 9575 i5-8305G | |
| Dell G3 15 3579 | |
| MSI Prestige PS42 8RB-059 | |
| Gemiddeld NVIDIA GeForce MX150 (6.5 - 17, n=25) | |
| Apple MacBook Pro 13 2018 Touchbar i5 | |
| lage | gem. | hoge | ultra | |
|---|---|---|---|---|
| BioShock Infinite (2013) | 187.2 | 113.1 | 95.6 | 34.8 |
| The Witcher 3 (2015) | 66.8 | 39.6 | 22.1 | 11.8 |
| Rise of the Tomb Raider (2016) | 77.1 | 42.5 | 22.1 | 18.8 |
Geluidsniveau
| Onbelast |
| 28.7 / 28.7 / 28.7 dB (A) |
| Belasting |
| 33.4 / 45 dB (A) |
 | ||
30 dB stil 40 dB(A) hoorbaar 50 dB(A) luid |
||
min: | ||
| MSI Prestige PS42 8RB-059 GeForce MX150, i5-8550U, Toshiba KSG60ZMV512G | Dell XPS 13 9370 i7 UHD UHD Graphics 620, i5-8550U, Toshiba XG5 KXG50ZNV512G | Huawei Matebook X Pro i5 GeForce MX150, i5-8250U, Samsung PM961 MZVLW256HEHP | Lenovo ThinkPad T480s-20L7002AUS UHD Graphics 620, i5-8250U, Samsung PM961 MZVLW256HEHP | HP EliteBook x360 1030 G3 UHD Graphics 620, i5-8250U, Samsung PM871b MZNLN128HAHQ | Asus Zenbook UX3430UN-GV174T GeForce MX150, i5-8250U, SK Hynix HFS256G39TND-N210A | |
|---|---|---|---|---|---|---|
| Noise | 3% | -2% | 2% | 6% | -5% | |
| uit / omgeving * (dB) | 28.3 | 28 1% | 27.9 1% | 28.1 1% | 28.5 -1% | 30 -6% |
| Idle Minimum * (dB) | 28.7 | 28 2% | 27.9 3% | 28.1 2% | 28.5 1% | 30 -5% |
| Idle Average * (dB) | 28.7 | 28 2% | 27.9 3% | 28.1 2% | 28.5 1% | 30 -5% |
| Idle Maximum * (dB) | 28.7 | 28 2% | 27.9 3% | 28.1 2% | 28.5 1% | 33.1 -15% |
| Load Average * (dB) | 33.4 | 32.5 3% | 36.2 -8% | 35.5 -6% | 31.3 6% | 37.6 -13% |
| Witcher 3 ultra * (dB) | 38.2 | 45 -18% | ||||
| Load Maximum * (dB) | 45 | 42.2 6% | 45.2 -0% | 41.5 8% | 33.5 26% | 37.6 16% |
* ... kleiner is beter
(-) De maximumtemperatuur aan de bovenzijde bedraagt 47 °C / 117 F, vergeleken met het gemiddelde van 34.3 °C / 94 F, variërend van 21.2 tot 62.5 °C voor de klasse Office.
(-) De bodem warmt op tot een maximum van 63.4 °C / 146 F, vergeleken met een gemiddelde van 36.8 °C / 98 F
(+) Bij onbelast gebruik bedraagt de gemiddelde temperatuur voor de bovenzijde 22.5 °C / 73 F, vergeleken met het apparaatgemiddelde van 29.5 °C / 85 F.
(±) Bij het spelen van The Witcher 3 is de gemiddelde temperatuur voor de bovenzijde 33.5 °C / 92 F, vergeleken met het apparaatgemiddelde van 29.5 °C / 85 F.
(+) De palmsteunen en het touchpad zijn met een maximum van ###max## °C / 84.2 F koeler dan de huidtemperatuur en voelen daarom koel aan.
(±) De gemiddelde temperatuur van de handpalmsteun van soortgelijke toestellen bedroeg 27.5 °C / 81.5 F (-1.5 °C / -2.7 F).
MSI Prestige PS42 8RB-059 audioanalyse
(-) | niet erg luide luidsprekers (68.2 dB)
Bas 100 - 315 Hz
(-) | bijna geen lage tonen - gemiddeld 23.5% lager dan de mediaan
(±) | lineariteit van de lage tonen is gemiddeld (13.1% delta ten opzichte van de vorige frequentie)
Midden 400 - 2000 Hz
(+) | evenwichtige middens - slechts 3.9% verwijderd van de mediaan
(±) | lineariteit van de middentonen is gemiddeld (8.1% delta ten opzichte van de vorige frequentie)
Hoog 2 - 16 kHz
(+) | evenwichtige hoogtepunten - slechts 4.9% verwijderd van de mediaan
(±) | lineariteit van de hoogtepunten is gemiddeld (7.1% delta ten opzichte van de vorige frequentie)
Algemeen 100 - 16.000 Hz
(±) | lineariteit van het totale geluid is gemiddeld (27.4% verschil met de mediaan)
Vergeleken met dezelfde klasse
» 85% van alle geteste apparaten in deze klasse waren beter, 5% vergelijkbaar, 10% slechter
» De beste had een delta van 7%, het gemiddelde was 21%, de slechtste was 53%
Vergeleken met alle geteste toestellen
» 83% van alle geteste apparaten waren beter, 4% gelijk, 13% slechter
» De beste had een delta van 4%, het gemiddelde was 24%, de slechtste was 134%
Apple MacBook 12 (Early 2016) 1.1 GHz audioanalyse
(+) | luidsprekers kunnen relatief luid spelen (83.6 dB)
Bas 100 - 315 Hz
(±) | verminderde zeebaars - gemiddeld 11.3% lager dan de mediaan
(±) | lineariteit van de lage tonen is gemiddeld (14.2% delta ten opzichte van de vorige frequentie)
Midden 400 - 2000 Hz
(+) | evenwichtige middens - slechts 2.4% verwijderd van de mediaan
(+) | de middentonen zijn lineair (5.5% delta ten opzichte van de vorige frequentie)
Hoog 2 - 16 kHz
(+) | evenwichtige hoogtepunten - slechts 2% verwijderd van de mediaan
(+) | de hoge tonen zijn lineair (4.5% delta naar de vorige frequentie)
Algemeen 100 - 16.000 Hz
(+) | het totale geluid is lineair (10.2% verschil met de mediaan)
Vergeleken met dezelfde klasse
» 7% van alle geteste apparaten in deze klasse waren beter, 2% vergelijkbaar, 91% slechter
» De beste had een delta van 5%, het gemiddelde was 18%, de slechtste was 53%
Vergeleken met alle geteste toestellen
» 5% van alle geteste apparaten waren beter, 1% gelijk, 94% slechter
» De beste had een delta van 4%, het gemiddelde was 24%, de slechtste was 134%
| Uit / Standby | |
| Inactief | |
| Belasting |
|
Key:
min: | |
| MSI Prestige PS42 8RB-059 i5-8550U, GeForce MX150, Toshiba KSG60ZMV512G, IPS, 1920x1080, 14" | Dell XPS 13 9370 i7 UHD i5-8550U, UHD Graphics 620, Toshiba XG5 KXG50ZNV512G, IPS, 3840x2160, 13.3" | Huawei Matebook X Pro i5 i5-8250U, GeForce MX150, Samsung PM961 MZVLW256HEHP, IPS, 3000x2000, 13.9" | Asus Zenbook UX3430UN-GV174T i5-8250U, GeForce MX150, SK Hynix HFS256G39TND-N210A, IPS, 1920x1080, 14" | HP EliteBook x360 1030 G3 i5-8250U, UHD Graphics 620, Samsung PM871b MZNLN128HAHQ, IPS, 1920x1080, 13.3" | Lenovo ThinkPad T480s-20L7002AUS i5-8250U, UHD Graphics 620, Samsung PM961 MZVLW256HEHP, TFT-LCD, 1920x1080, 14" | |
|---|---|---|---|---|---|---|
| Power Consumption | 5% | 1% | 5% | 22% | 27% | |
| Idle Minimum * (Watt) | 5.6 | 5 11% | 3.5 37% | 4.5 20% | 3.8 32% | 3.1 45% |
| Idle Average * (Watt) | 6.5 | 8.3 -28% | 8.9 -37% | 7.8 -20% | 7.5 -15% | 6.4 2% |
| Idle Maximum * (Watt) | 7.9 | 8.8 -11% | 12.3 -56% | 8.1 -3% | 8.6 -9% | 9.4 -19% |
| Load Average * (Watt) | 62.3 | 46.4 26% | 54.2 13% | 52 17% | 33.1 47% | 29.8 52% |
| Witcher 3 ultra * (Watt) | 55.7 | 42.4 24% | ||||
| Load Maximum * (Watt) | 67 | 48.6 27% | 52.1 22% | 59 12% | 31.8 53% | 31.2 53% |
* ... kleiner is beter
| MSI Prestige PS42 8RB-059 i5-8550U, GeForce MX150, 50 Wh | Apple MacBook Pro 15 2018 (2.6 GHz, 560X) i7-8850H, Radeon Pro 560X, 83 Wh | Dell XPS 13 9370 i7 UHD i5-8550U, UHD Graphics 620, 52 Wh | Huawei Matebook X Pro i5 i5-8250U, GeForce MX150, 57.4 Wh | Lenovo ThinkPad T480s-20L7002AUS i5-8250U, UHD Graphics 620, 57 Wh | Asus Zenbook UX3430UN-GV174T i5-8250U, GeForce MX150, 48 Wh | HP EliteBook x360 1030 G3 i5-8250U, UHD Graphics 620, 56.2 Wh | |
|---|---|---|---|---|---|---|---|
| Batterijduur | -32% | -25% | -2% | -40% | -7% | 21% | |
| Reader / Idle (h) | 16.8 | 13.7 -18% | 20.7 23% | 22.8 36% | 23 37% | ||
| WiFi v1.3 (h) | 14.9 | 10.2 -32% | 7.8 -48% | 9.3 -38% | 9 -40% | 8.1 -46% | 10 -33% |
| Load (h) | 2 | 1.8 -10% | 2.2 10% | 1.8 -10% | 3.2 60% | ||
| Witcher 3 ultra (h) | 1.5 |
Pro
Contra

Voor het volledige, Engelse testrapport, klik hier.
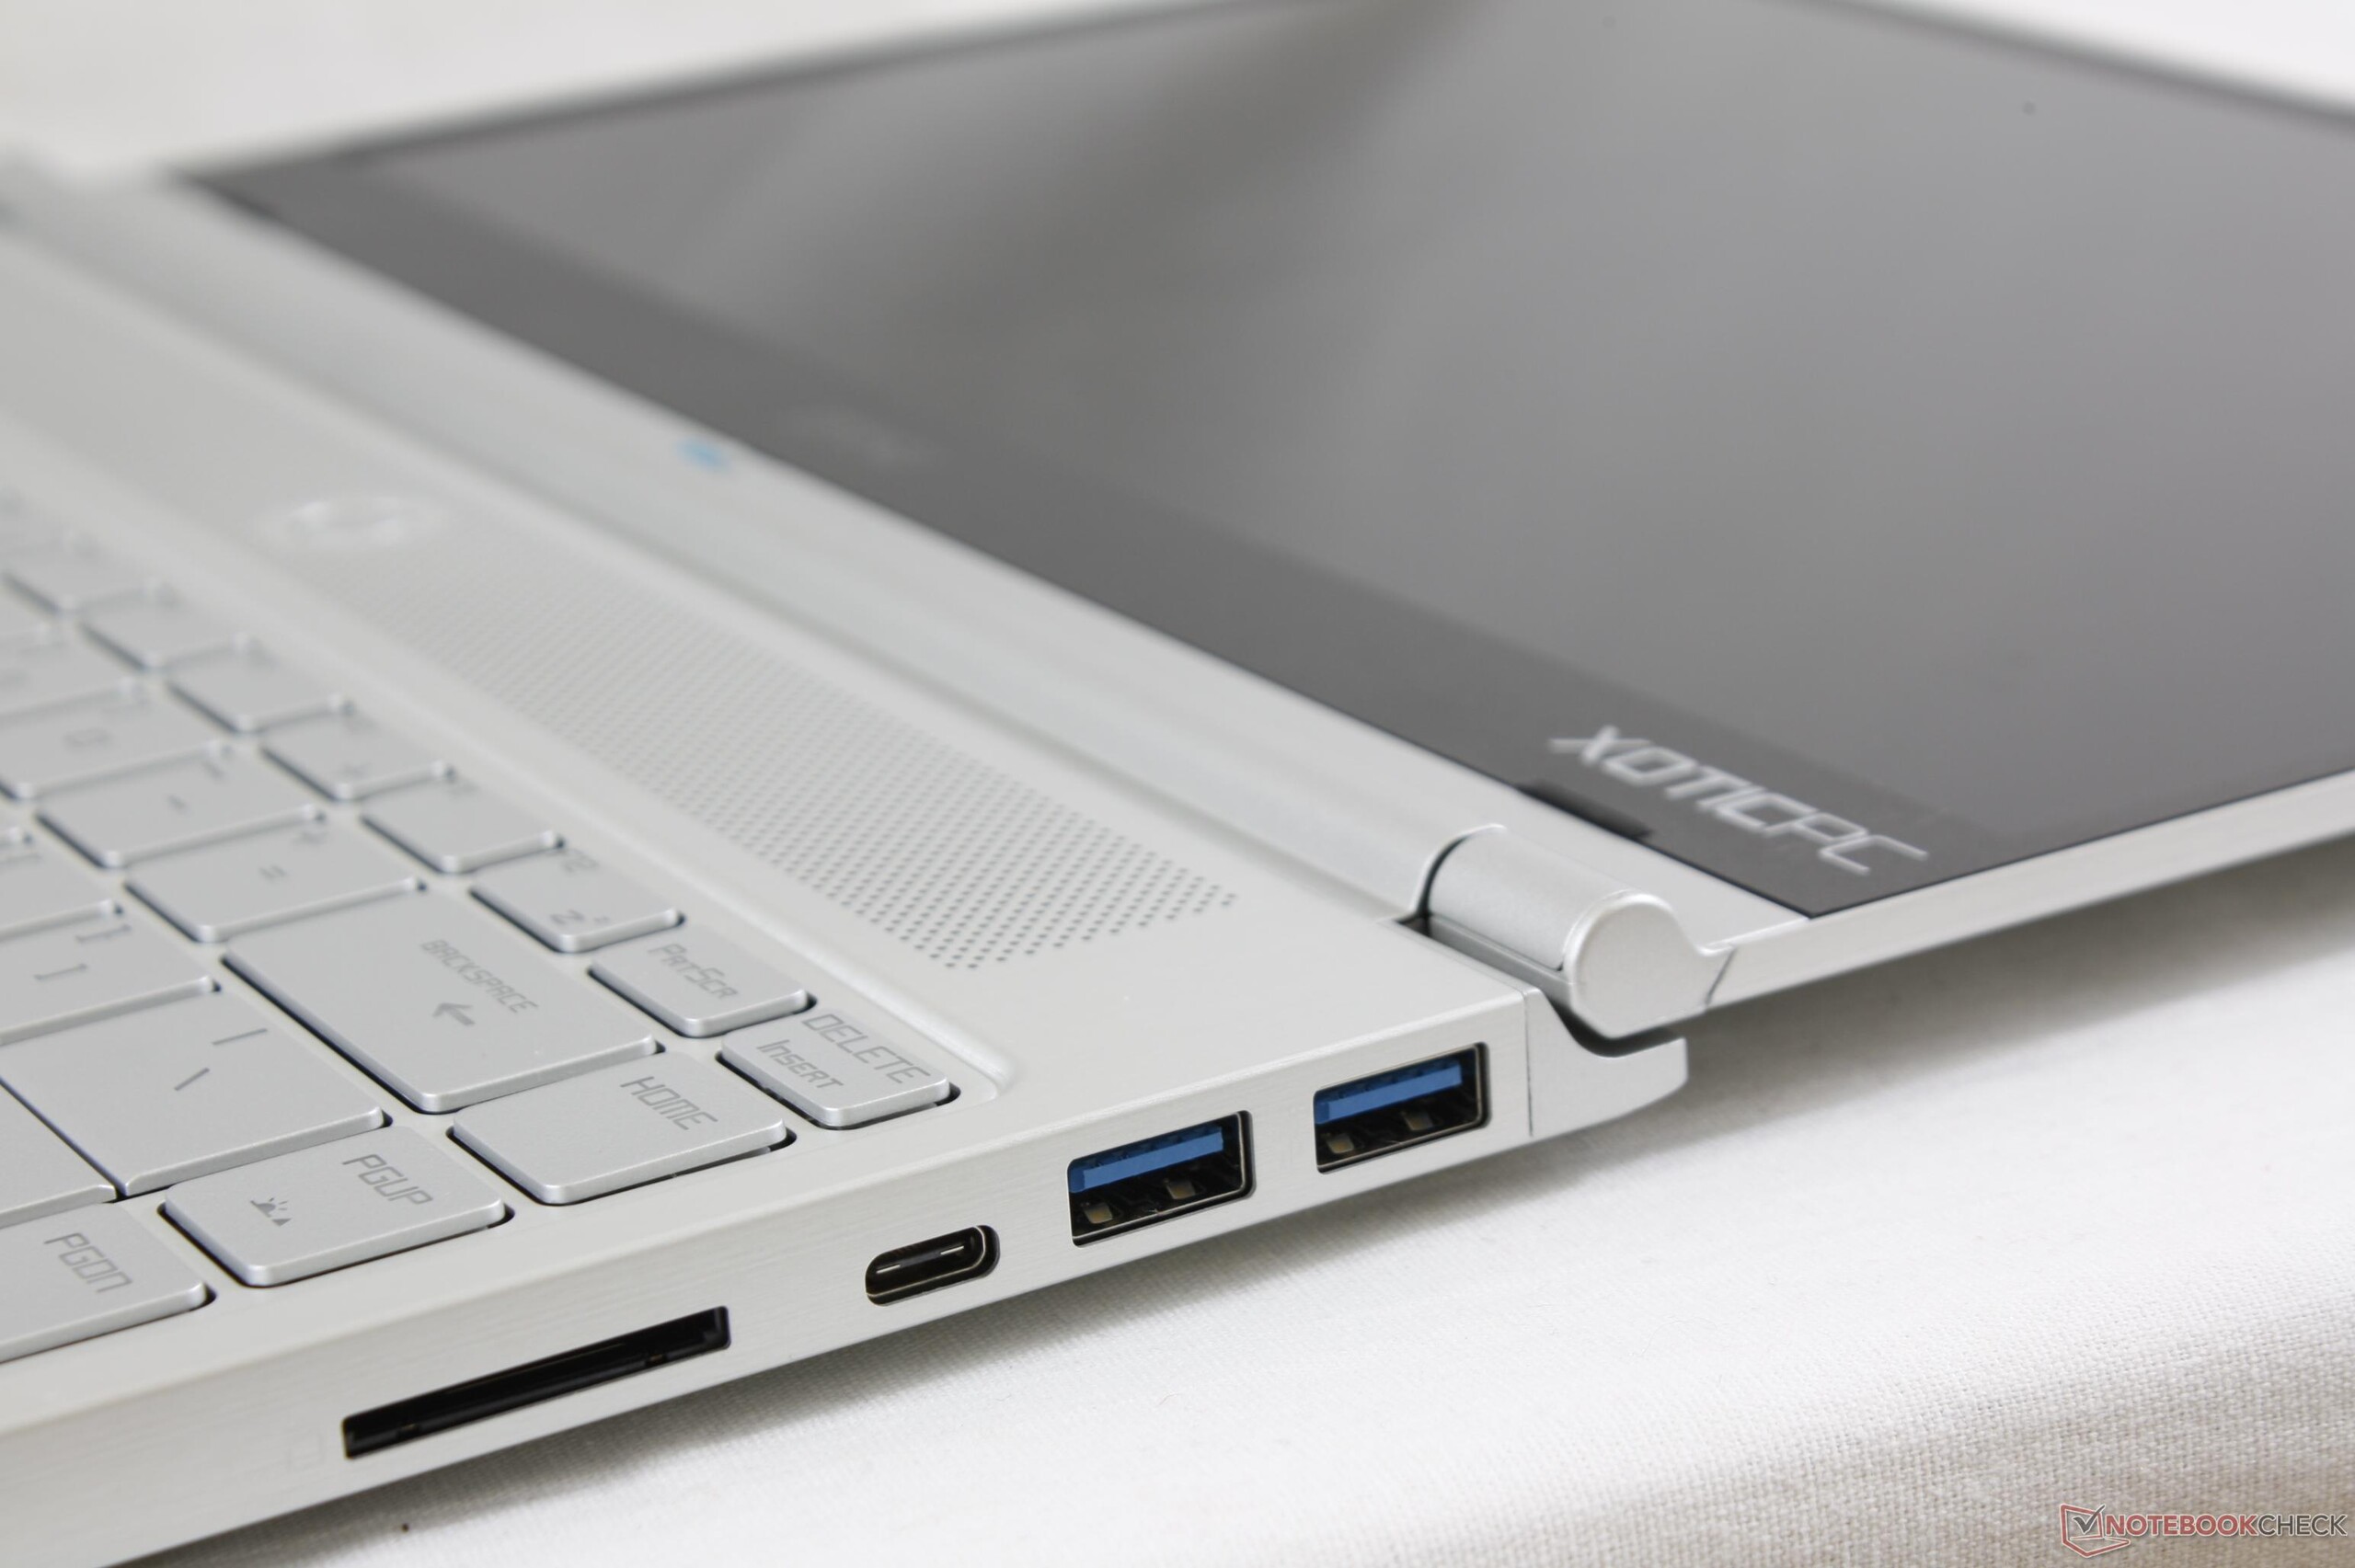
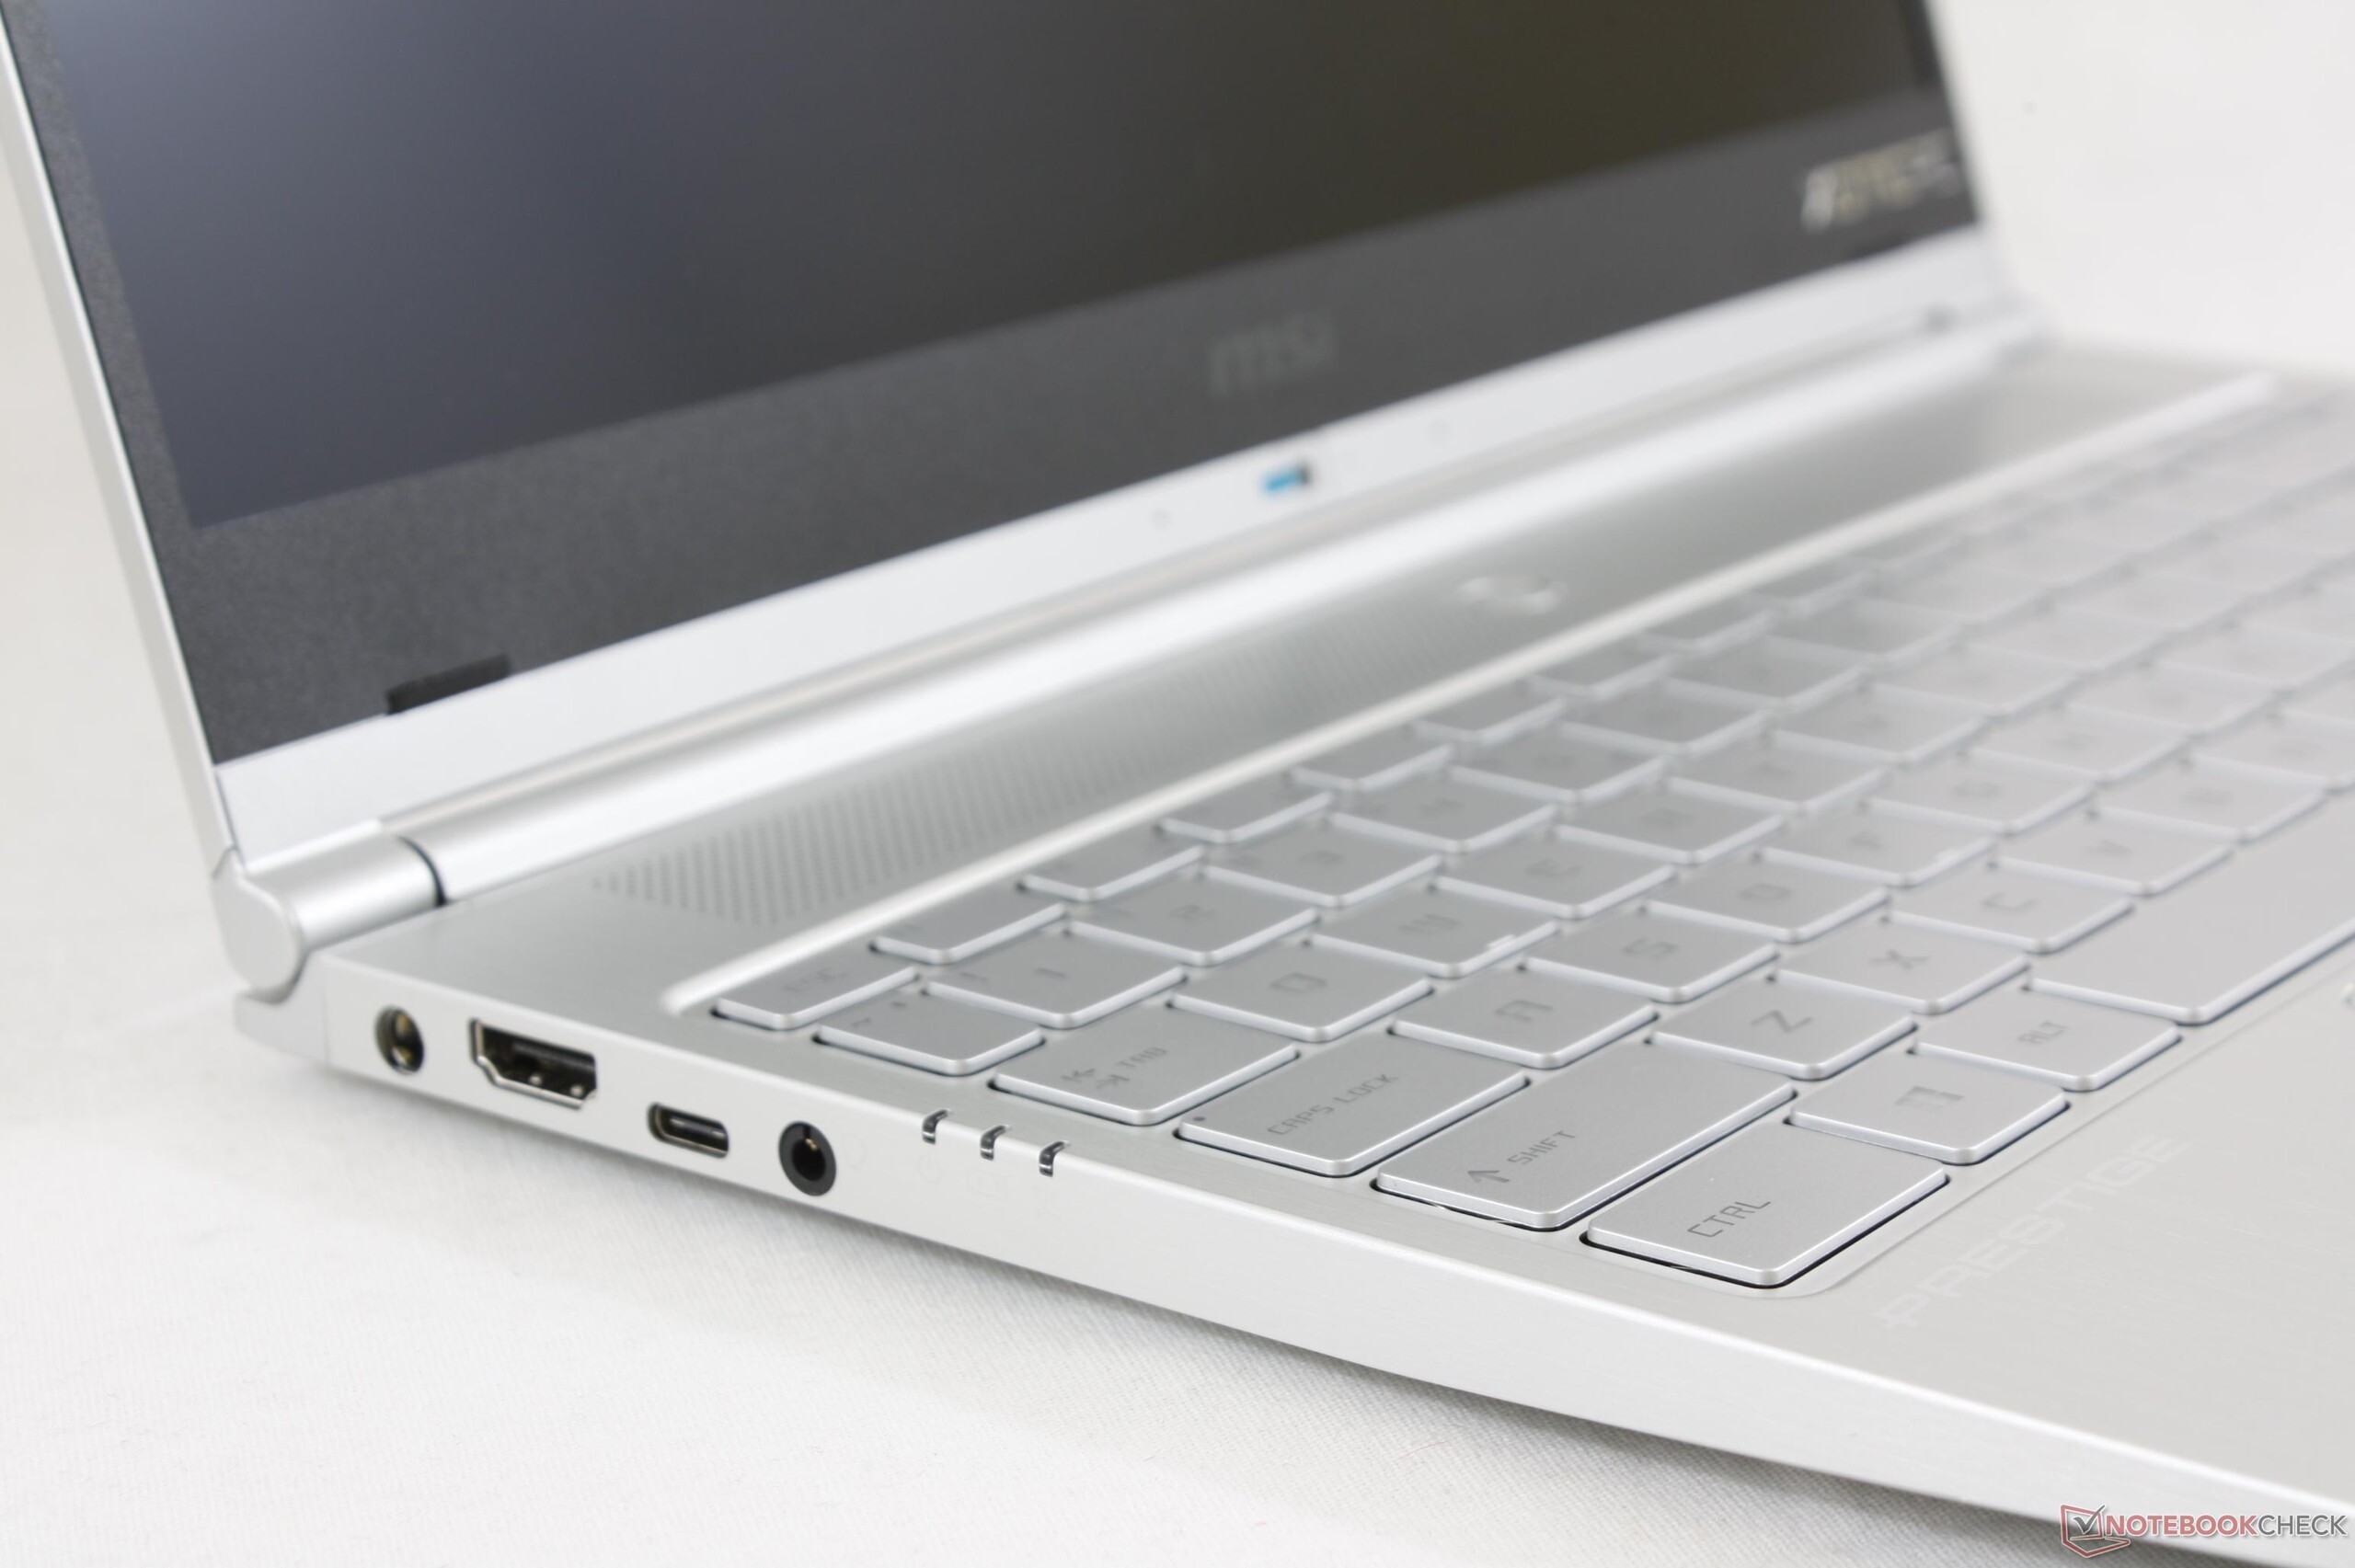
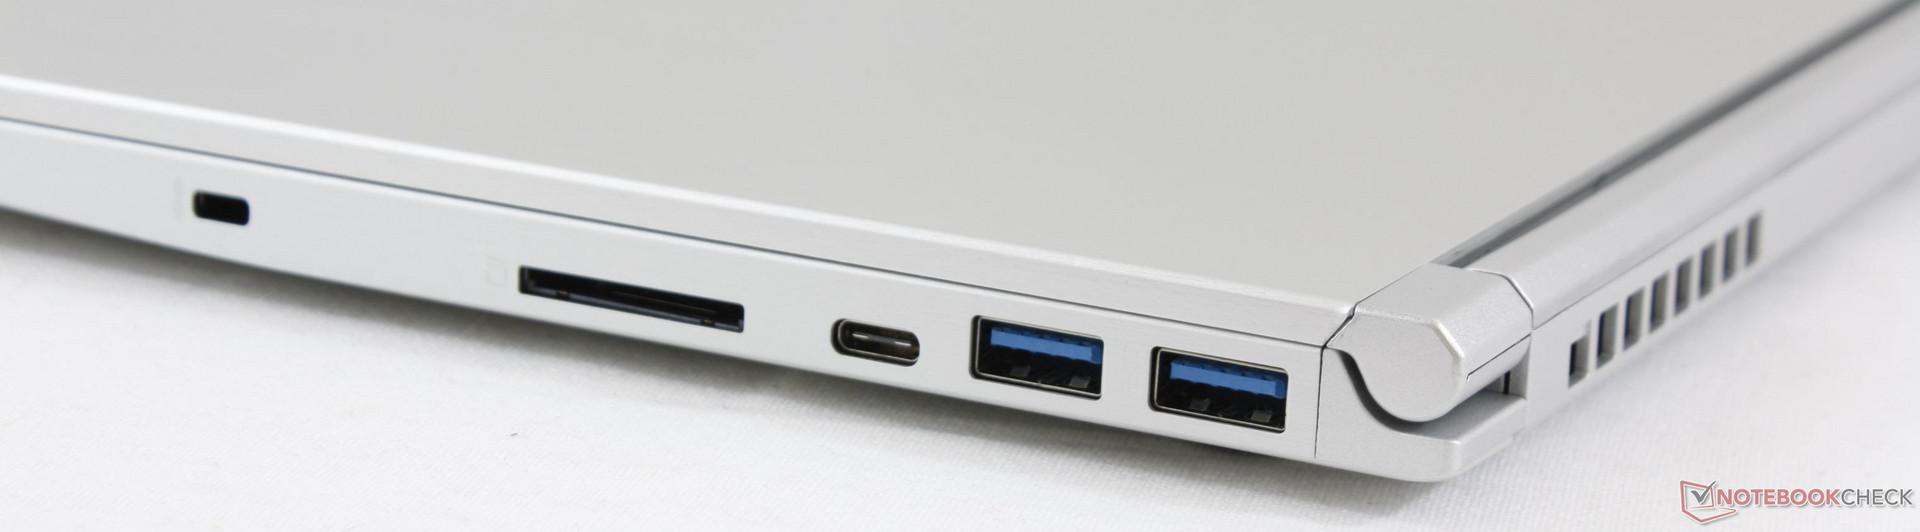
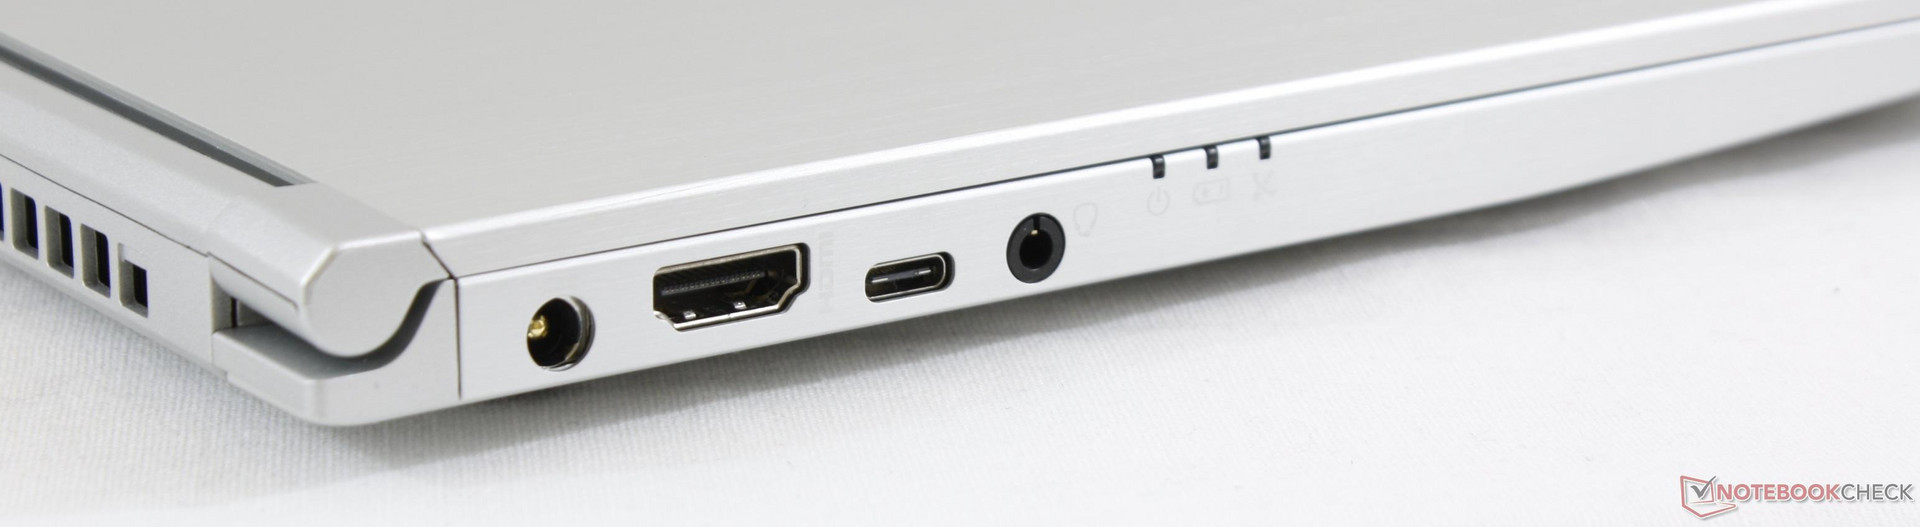
De MSI PS42 heeft veel te bieden, maar de kostenbesparingen zijn moeilijk te negeren. Ten eerste beperkt het ontbreken van Thunderbolt 3 de connectiviteit en veelzijdigheid. Dit zou geen probleem zijn geweest als de PS42 goedkoper was, maar hij is te koop voor ongeveer dezelfde prijs als de XPS 13, HP Spectre 13 of MateBook X Pro die allemaal standaard Thunderbolt 3 hebben. Het donkerder beeldscherm, langzamer 1x1 WiFi, single-channel RAM, iets minder goed presterende CPU, weglating van NVMe en minder robuuste behuizing zijn allemaal teleurstellend om te zien wanneer de meeste concurrenten betere opties bieden.
De positieve kanten van de PS42 zijn het lichte gewicht, het zeer nauwkeurige 1080p-matte beeldscherm en de krachtige GeForce MX150 GPU. Dit is waarschijnlijk de enige 14-inch laptop die een 25 Watt '1D10' MX150 GPU gebruikt in plaats van de langzamere 10 Watt variant. Gebruikers kunnen games spelen of grafisch intensieve taken uitvoeren zonder bang te hoeven zijn voor GPU-throttling.
Als de prestaties en draagbaarheid van de GPU optimaal zijn, kan de PS42 een goede optie zijn. Anders is de 13,9-inch MateBook X Pro op bijna elke andere manier superieur voor in wezen dezelfde vraagprijs van $1000.
De PS42 is een respectabele eerste poging tot een traditionele Ultrabook van MSI met zijn sterke grafische prestaties, lichte gewicht en nauwkeurige kleuren. Niettemin heeft MSI, met een aantal zichtbare bezuinigingen, nog een lange weg te gaan voordat het zich kan meten met doorgewinterde Ultrabook fabrikanten.
MSI Prestige PS42 8RB-059
- 26-10-2019 v7 (old)
Allen Ngo
Price comparison
