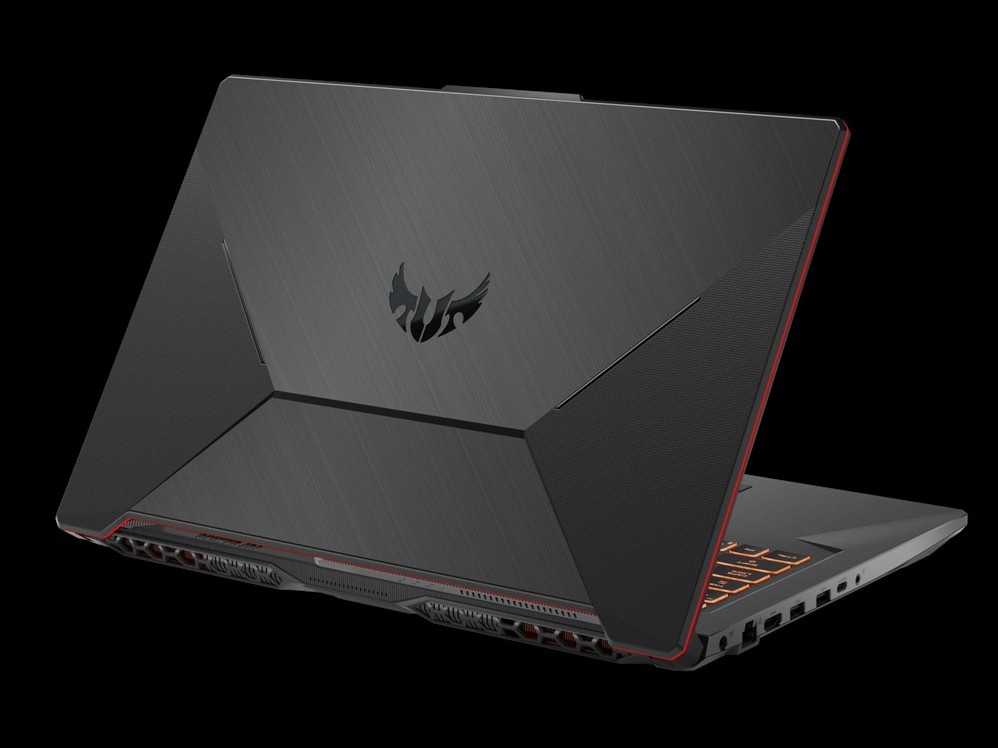
Kort testrapport Asus TUF A17 FA706IU Ryzen 7 Laptop: Core i9-prestaties voor 1100 euro
Evaluatie | Datum | Model | Gewicht | Hoogte | Formaat | Resolutie | Beste prijs |
|---|---|---|---|---|---|---|---|
| 82.9 % v7 (old) | 05-2020 | Asus TUF A17 FA706IU-AS76 R7 4800H, GeForce GTX 1660 Ti Mobile | 2.6 kg | 26 mm | 17.30" | 1920x1080 | |
| 85.1 % v6 (old) | 06-2019 | MSI GP75 Leopard 9SD i7-9750H, GeForce GTX 1660 Ti Mobile | 2.6 kg | 29 mm | 17.30" | 1920x1080 | |
| 85.3 % v6 (old) | 06-2019 | Dell G7 17 7790 i7-8750H, GeForce RTX 2070 Max-Q | 3.2 kg | 25 mm | 17.30" | 1920x1080 | |
| 81.6 % v7 (old) | 07-2019 | HP Pavilion Gaming 17-cd0085cl i7-9750H, GeForce GTX 1660 Ti Max-Q | 2.8 kg | 25 mm | 17.30" | 1920x1080 | |
| 82.3 % v7 (old) | 08-2019 | Lenovo Legion Y540-17IRH i5-9300H, GeForce GTX 1660 Ti Mobile | 2.8 kg | 26.3 mm | 17.30" | 1920x1080 | |
| 77.8 % v7 (old) | 06-2019 | Asus TUF FX705DT-AU068T R5 3550H, GeForce GTX 1650 Mobile | 2.7 kg | 26.6 mm | 17.30" | 1920x1080 |
| Networking | |
| iperf3 transmit AX12 | |
| Asus Zephyrus G14 GA401IV | |
| Schenker XMG Apex 15 NH57AF1 | |
| MSI GS66 10SGS | |
| Asus TUF A17 FA706IU-AS76 | |
| iperf3 receive AX12 | |
| MSI GS66 10SGS | |
| Schenker XMG Apex 15 NH57AF1 | |
| Asus Zephyrus G14 GA401IV | |
| Asus TUF A17 FA706IU-AS76 | |


| |||||||||||||||||||||||||
Helderheidsverdeling: 90 %
Helderheid in Batterij-modus: 264.8 cd/m²
Contrast: 854:1 (Zwart: 0.31 cd/m²)
ΔE ColorChecker Calman: 4.73 | ∀{0.5-29.43 Ø4.73}
calibrated: 4.64
ΔE Greyscale Calman: 1.4 | ∀{0.09-98 Ø4.97}
59.3% sRGB (Argyll 1.6.3 3D)
38.4% AdobeRGB 1998 (Argyll 1.6.3 3D)
41.89% AdobeRGB 1998 (Argyll 3D)
59.7% sRGB (Argyll 3D)
40.55% Display P3 (Argyll 3D)
Gamma: 2.16
CCT: 6641 K
| Asus TUF A17 FA706IU-AS76 BOE NV173FHM-NX1, IPS, 17.3", 1920x1080 | MSI GP75 Leopard 9SD Chi Mei N173HCE-G33 (CMN175C), IPS, 17.3", 1920x1080 | Dell G7 17 7790 AU Optronics AUO409D, B173HAN, IPS, 17.3", 1920x1080 | HP Pavilion Gaming 17-cd0085cl BOE0825, IPS, 17.3", 1920x1080 | Lenovo Legion Y540-17IRH AU Optronics B173HAN04.4 (AUO449D), IPS, 17.3", 1920x1080 | Asus TUF FX705DT-AU068T AU Optronics B173HAN04.2, IPS, 17.3", 1920x1080 | |
|---|---|---|---|---|---|---|
| Display | 57% | 51% | 53% | 68% | 52% | |
| Display P3 Coverage (%) | 40.55 | 63.4 56% | 61.9 53% | 63.3 56% | 69 70% | 62.3 54% |
| sRGB Coverage (%) | 59.7 | 94.9 59% | 89.6 50% | 90.2 51% | 98.3 65% | 89.1 49% |
| AdobeRGB 1998 Coverage (%) | 41.89 | 65.1 55% | 63.2 51% | 64.3 53% | 70.7 69% | 63.7 52% |
| Response Times | 59% | 30% | -22% | 27% | -70% | |
| Response Time Grey 50% / Grey 80% * (ms) | 22.4 ? | 8 ? 64% | 17.2 ? 23% | 31.6 ? -41% | 18 ? 20% | 41 ? -83% |
| Response Time Black / White * (ms) | 19.2 ? | 8.8 ? 54% | 12 ? 37% | 19.6 ? -2% | 12.8 ? 33% | 30 ? -56% |
| PWM Frequency (Hz) | 25510 ? | |||||
| Screen | 26% | 2% | 6% | 18% | 14% | |
| Brightness middle (cd/m²) | 264.8 | 420 59% | 308.6 17% | 299.6 13% | 286 8% | 316 19% |
| Brightness (cd/m²) | 253 | 393 55% | 299 18% | 285 13% | 282 11% | 294 16% |
| Brightness Distribution (%) | 90 | 91 1% | 92 2% | 86 -4% | 87 -3% | 84 -7% |
| Black Level * (cd/m²) | 0.31 | 0.32 -3% | 0.29 6% | 0.33 -6% | 0.19 39% | 0.32 -3% |
| Contrast (:1) | 854 | 1313 54% | 1064 25% | 908 6% | 1505 76% | 988 16% |
| Colorchecker dE 2000 * | 4.73 | 3.04 36% | 4.26 10% | 3.68 22% | 3.57 25% | 3.39 28% |
| Colorchecker dE 2000 max. * | 18.89 | 7.22 62% | 7.83 59% | 8.05 57% | 7.5 60% | 5.56 71% |
| Colorchecker dE 2000 calibrated * | 4.64 | 0.89 81% | 2.93 37% | 3.15 32% | 1.31 72% | 2.14 54% |
| Greyscale dE 2000 * | 1.4 | 3.91 -179% | 5 -257% | 3.8 -171% | 4.51 -222% | 3.17 -126% |
| Gamma | 2.16 102% | 2.26 97% | 2.07 106% | 2.12 104% | 2.36 93% | 2.39 92% |
| CCT | 6641 98% | 7138 91% | 7488 87% | 7240 90% | 7411 88% | 7098 92% |
| Color Space (Percent of AdobeRGB 1998) (%) | 38.4 | 60 56% | 57.8 51% | 58.1 51% | 64 67% | 51 33% |
| Color Space (Percent of sRGB) (%) | 59.3 | 95 60% | 89.2 50% | 89.8 51% | 98 65% | 89 50% |
| Totaal Gemiddelde (Programma / Instellingen) | 47% /
36% | 28% /
15% | 12% /
11% | 38% /
28% | -1% /
10% |
* ... kleiner is beter
Responstijd Scherm
| ↔ Responstijd Zwart naar Wit | ||
|---|---|---|
| 19.2 ms ... stijging ↗ en daling ↘ gecombineerd | ↗ 9.6 ms stijging | 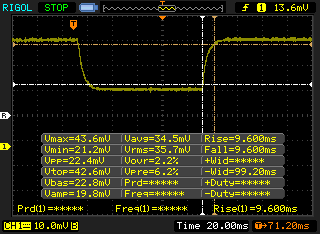 |
| ↘ 9.6 ms daling | ||
| Het scherm vertoonde prima responstijden in onze tests maar is misschien wat te traag voor competitieve games. Ter vergelijking: alle testtoestellen variëren van 0.1 (minimum) tot 240 (maximum) ms. » 42 % van alle toestellen zijn beter. Dit betekent dat de gemeten responstijd vergelijkbaar is met het gemiddelde (19.9 ms) van alle geteste toestellen. | ||
| ↔ Responstijd 50% Grijs naar 80% Grijs | ||
| 22.4 ms ... stijging ↗ en daling ↘ gecombineerd | ↗ 11.6 ms stijging | 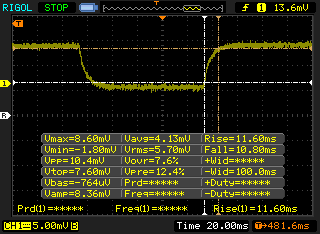 |
| ↘ 10.8 ms daling | ||
| Het scherm vertoonde prima responstijden in onze tests maar is misschien wat te traag voor competitieve games. Ter vergelijking: alle testtoestellen variëren van 0.165 (minimum) tot 636 (maximum) ms. » 34 % van alle toestellen zijn beter. Dit betekent dat de gemeten responstijd beter is dan het gemiddelde (31.1 ms) van alle geteste toestellen. | ||
Screen Flickering / PWM (Pulse-Width Modulation)
| Screen flickering / PWM niet waargenomen |  | ||
Ter vergelijking: 52 % van alle geteste toestellen maakten geen gebruik van PWM om de schermhelderheid te verlagen. Als het wel werd gebruikt, werd een gemiddelde van 7791 (minimum: 5 - maximum: 343500) Hz waargenomen. | |||
Cinebench R15: CPU Multi 64Bit | CPU Single 64Bit
Blender: v2.79 BMW27 CPU
7-Zip 18.03: 7z b 4 -mmt1 | 7z b 4
Geekbench 5.5: Single-Core | Multi-Core
HWBOT x265 Benchmark v2.2: 4k Preset
LibreOffice : 20 Documents To PDF
R Benchmark 2.5: Overall mean
| Cinebench R20 / CPU (Multi Core) | |
| Eurocom Sky X4C i9-9900KS | |
| Asus Zephyrus G14 GA401IV | |
| Gemiddeld AMD Ryzen 7 4800H (3692 - 4663, n=18) | |
| Asus TUF A17 FA706IU-AS76 | |
| MSI GS66 Stealth 10SFS | |
| MSI GE65 Raider 9SF-049US | |
| Intel Core i5-10600K | |
| Gigabyte Aero 17 HDR XB | |
| MSI GS66 10SGS | |
| Gemiddeld Intel Core i7-9750H (2017 - 3133, n=55) | |
| Gigabyte Aero 15-Y9 | |
| Asus ROG Zephyrus S GX701GXR | |
| Asus ROG Zephyrus G15 GA502DU | |
| MSI GF63 Thin 9SC | |
| Asus TUF FX705DT-AU068T | |
| Cinebench R20 / CPU (Single Core) | |
| Eurocom Sky X4C i9-9900KS | |
| Gigabyte Aero 17 HDR XB | |
| Asus Zephyrus G14 GA401IV | |
| Gemiddeld AMD Ryzen 7 4800H (462 - 491, n=17) | |
| MSI GS66 Stealth 10SFS | |
| Asus TUF A17 FA706IU-AS76 | |
| MSI GE65 Raider 9SF-049US | |
| Intel Core i5-10600K | |
| MSI GS66 10SGS | |
| Gemiddeld Intel Core i7-9750H (416 - 486, n=55) | |
| Asus ROG Zephyrus S GX701GXR | |
| MSI GF63 Thin 9SC | |
| Gigabyte Aero 15-Y9 | |
| Asus TUF FX705DT-AU068T | |
| Asus ROG Zephyrus G15 GA502DU | |
| Cinebench R15 / CPU Multi 64Bit | |
| Eurocom Sky X4C i9-9900KS | |
| Asus Zephyrus G14 GA401IV | |
| Gemiddeld AMD Ryzen 7 4800H (1652 - 1995, n=21) | |
| Asus TUF A17 FA706IU-AS76 | |
| Gigabyte Aero 17 HDR XB | |
| MSI GS66 Stealth 10SFS | |
| MSI GE65 Raider 9SF-049US | |
| Intel Core i5-10600K | |
| MSI GS66 10SGS | |
| Gigabyte Aero 15-Y9 | |
| Gemiddeld Intel Core i7-9750H (952 - 1306, n=85) | |
| Asus ROG Zephyrus S GX701GXR | |
| Asus ROG Zephyrus G15 GA502DU | |
| MSI GF63 Thin 9SC | |
| Asus TUF FX705DT-AU068T | |
| Cinebench R15 / CPU Single 64Bit | |
| Eurocom Sky X4C i9-9900KS | |
| Gigabyte Aero 17 HDR XB | |
| Intel Core i5-10600K | |
| MSI GS66 Stealth 10SFS | |
| MSI GE65 Raider 9SF-049US | |
| Gigabyte Aero 15-Y9 | |
| Asus Zephyrus G14 GA401IV | |
| Asus TUF A17 FA706IU-AS76 | |
| MSI GS66 10SGS | |
| Gemiddeld AMD Ryzen 7 4800H (186 - 191, n=15) | |
| Gemiddeld Intel Core i7-9750H (170 - 194, n=82) | |
| Asus ROG Zephyrus S GX701GXR | |
| MSI GF63 Thin 9SC | |
| Asus TUF FX705DT-AU068T | |
| Asus ROG Zephyrus G15 GA502DU | |
| Blender / v2.79 BMW27 CPU | |
| Asus ROG Zephyrus G15 GA502DU | |
| Gemiddeld Intel Core i7-9750H (342 - 495, n=21) | |
| MSI GS66 10SGS | |
| Gigabyte Aero 17 HDR XB | |
| Intel Core i5-10600K | |
| Asus Zephyrus G14 GA401IV | |
| MSI GS66 Stealth 10SFS | |
| Asus TUF A17 FA706IU-AS76 | |
| Gemiddeld AMD Ryzen 7 4800H (248 - 299, n=15) | |
| Eurocom Sky X4C i9-9900KS | |
| 7-Zip 18.03 / 7z b 4 -mmt1 | |
| Eurocom Sky X4C i9-9900KS | |
| Gigabyte Aero 17 HDR XB | |
| Intel Core i5-10600K | |
| MSI GS66 Stealth 10SFS | |
| MSI GS66 10SGS | |
| Gemiddeld Intel Core i7-9750H (4580 - 5090, n=21) | |
| Asus TUF A17 FA706IU-AS76 | |
| Gemiddeld AMD Ryzen 7 4800H (4575 - 4743, n=15) | |
| Asus Zephyrus G14 GA401IV | |
| Asus ROG Zephyrus G15 GA502DU | |
| 7-Zip 18.03 / 7z b 4 | |
| Eurocom Sky X4C i9-9900KS | |
| Gemiddeld AMD Ryzen 7 4800H (44827 - 53883, n=15) | |
| Asus TUF A17 FA706IU-AS76 | |
| Asus Zephyrus G14 GA401IV | |
| Gigabyte Aero 17 HDR XB | |
| MSI GS66 Stealth 10SFS | |
| Intel Core i5-10600K | |
| MSI GS66 10SGS | |
| Gemiddeld Intel Core i7-9750H (28512 - 35174, n=21) | |
| Asus ROG Zephyrus G15 GA502DU | |
| Geekbench 5.5 / Single-Core | |
| Eurocom Sky X4C i9-9900KS | |
| Intel Core i5-10600K | |
| MSI GS66 Stealth 10SFS | |
| Gigabyte Aero 17 HDR XB | |
| Asus Zephyrus G14 GA401IV | |
| MSI GS66 10SGS | |
| Gemiddeld Intel Core i7-9750H (1117 - 1251, n=13) | |
| Asus TUF A17 FA706IU-AS76 | |
| Gemiddeld AMD Ryzen 7 4800H (1154 - 1207, n=17) | |
| Geekbench 5.5 / Multi-Core | |
| Eurocom Sky X4C i9-9900KS | |
| Asus TUF A17 FA706IU-AS76 | |
| Gemiddeld AMD Ryzen 7 4800H (5920 - 8672, n=17) | |
| Asus Zephyrus G14 GA401IV | |
| MSI GS66 Stealth 10SFS | |
| Gigabyte Aero 17 HDR XB | |
| Intel Core i5-10600K | |
| MSI GS66 10SGS | |
| Gemiddeld Intel Core i7-9750H (4859 - 6262, n=13) | |
| HWBOT x265 Benchmark v2.2 / 4k Preset | |
| Eurocom Sky X4C i9-9900KS | |
| Gemiddeld AMD Ryzen 7 4800H (10.8 - 14.1, n=16) | |
| MSI GS66 Stealth 10SFS | |
| Intel Core i5-10600K | |
| Asus TUF A17 FA706IU-AS76 | |
| Asus Zephyrus G14 GA401IV | |
| Gigabyte Aero 17 HDR XB | |
| MSI GS66 10SGS | |
| Gemiddeld Intel Core i7-9750H (7.1 - 10.7, n=21) | |
| Asus ROG Zephyrus G15 GA502DU | |
| LibreOffice / 20 Documents To PDF | |
| Gigabyte Aero 17 HDR XB | |
| Gemiddeld AMD Ryzen 7 4800H (28.6 - 95.8, n=14) | |
| Asus TUF A17 FA706IU-AS76 | |
| Gemiddeld Intel Core i7-9750H (54.5 - 64.7, n=9) | |
| MSI GS66 10SGS | |
| MSI GS66 Stealth 10SFS | |
| Intel Core i5-10600K | |
| R Benchmark 2.5 / Overall mean | |
| Gemiddeld Intel Core i7-9750H (0.608 - 0.695, n=14) | |
| MSI GS66 10SGS | |
| Asus TUF A17 FA706IU-AS76 | |
| Intel Core i5-10600K | |
| MSI GS66 Stealth 10SFS | |
| Gemiddeld AMD Ryzen 7 4800H (0.562 - 0.603, n=15) | |
| Gigabyte Aero 17 HDR XB | |
Cinebench R15: CPU Multi 64Bit | CPU Single 64Bit
Blender: v2.79 BMW27 CPU
7-Zip 18.03: 7z b 4 -mmt1 | 7z b 4
Geekbench 5.5: Single-Core | Multi-Core
HWBOT x265 Benchmark v2.2: 4k Preset
LibreOffice : 20 Documents To PDF
R Benchmark 2.5: Overall mean
* ... kleiner is beter
| PCMark 8 | |
| Home Score Accelerated v2 | |
| Asus TUF A17 FA706IU-AS76 | |
| Asus TUF FX705DT-AU068T | |
| HP Pavilion Gaming 17-cd0085cl | |
| Dell G7 17 7790 | |
| MSI GP75 Leopard 9SD | |
| Work Score Accelerated v2 | |
| Asus TUF A17 FA706IU-AS76 | |
| MSI GP75 Leopard 9SD | |
| Dell G7 17 7790 | |
| HP Pavilion Gaming 17-cd0085cl | |
| Asus TUF FX705DT-AU068T | |
| PCMark 8 Home Score Accelerated v2 | 4780 punten | |
| PCMark 8 Work Score Accelerated v2 | 5749 punten | |
| PCMark 10 Score | 5617 punten | |
Help | ||
| DPC Latencies / LatencyMon - interrupt to process latency (max), Web, Youtube, Prime95 | |
| Asus TUF A17 FA706IU-AS76 | |
| Asus Zephyrus G14 GA401IV | |
| MSI GS66 10SGS | |
| MSI GP65 10SFK-047US | |
* ... kleiner is beter
| Asus TUF A17 FA706IU-AS76 Intel SSD 660p 1TB SSDPEKNW010T8 | MSI GP75 Leopard 9SD Kingston RBUSNS8154P3256GJ1 | Dell G7 17 7790 Toshiba BG3 KBG30ZMS256G | HP Pavilion Gaming 17-cd0085cl Samsung SSD PM981 MZVLB256HAHQ | Asus TUF FX705DT-AU068T WDC PC SN520 SDAPNUW-256G | |
|---|---|---|---|---|---|
| AS SSD | -71% | -90% | 7% | -34% | |
| Seq Read (MB/s) | 1320 | 748 -43% | 1033 -22% | 1709 29% | 1546 17% |
| Seq Write (MB/s) | 1539 | 219 -86% | 218.3 -86% | 1345 -13% | 1182 -23% |
| 4K Read (MB/s) | 56.3 | 25.7 -54% | 24.12 -57% | 49.73 -12% | 36.54 -35% |
| 4K Write (MB/s) | 158.5 | 82.4 -48% | 55 -65% | 108.2 -32% | 109.2 -31% |
| 4K-64 Read (MB/s) | 586 | 259.3 -56% | 330.3 -44% | 731 25% | 612 4% |
| 4K-64 Write (MB/s) | 820 | 190.2 -77% | 155.8 -81% | 1233 50% | 436.6 -47% |
| Access Time Read * (ms) | 0.043 | 0.159 -270% | 0.18 -319% | 0.073 -70% | 0.113 -163% |
| Access Time Write * (ms) | 0.113 | 0.058 49% | 0.314 -178% | 0.034 70% | 0.034 70% |
| Score Read (Points) | 775 | 360 -54% | 458 -41% | 951 23% | 803 4% |
| Score Write (Points) | 1132 | 294 -74% | 233 -79% | 1476 30% | 664 -41% |
| Score Total (Points) | 2333 | 821 -65% | 891 -62% | 2909 25% | 1869 -20% |
| Copy ISO MB/s (MB/s) | 1736 | 382.9 -78% | 1284 -26% | 698 -60% | |
| Copy Program MB/s (MB/s) | 553 | 234.9 -58% | 589 7% | 114.1 -79% | |
| Copy Game MB/s (MB/s) | 1264 | 218.7 -83% | 1107 -12% | 379.6 -70% | |
| CrystalDiskMark 5.2 / 6 | -51% | -58% | 5% | -26% | |
| Write 4K (MB/s) | 189.7 | 105.8 -44% | 78.6 -59% | 135.3 -29% | 145 -24% |
| Read 4K (MB/s) | 62.3 | 27.89 -55% | 31.89 -49% | 63.7 2% | 45.28 -27% |
| Write Seq (MB/s) | 1681 | 270.8 -84% | 230.4 -86% | 1337 -20% | 1301 -23% |
| Read Seq (MB/s) | 1608 | 879 -45% | 925 -42% | 1617 1% | 1362 -15% |
| Write 4K Q32T1 (MB/s) | 468.6 | 273.3 -42% | 159.1 -66% | 568 21% | 249.1 -47% |
| Read 4K Q32T1 (MB/s) | 541 | 361.2 -33% | 315.6 -42% | 645 19% | 342.1 -37% |
| Write Seq Q32T1 (MB/s) | 1770 | 253 -86% | 230.7 -87% | 1428 -19% | 1301 -26% |
| Read Seq Q32T1 (MB/s) | 1898 | 1505 -21% | 1323 -30% | 3184 68% | 1732 -9% |
| Totaal Gemiddelde (Programma / Instellingen) | -61% /
-63% | -74% /
-78% | 6% /
6% | -30% /
-31% |
* ... kleiner is beter

Disk Throttling: DiskSpd Read Loop, Queue Depth 8
| 3DMark 11 Performance | 18607 punten | |
| 3DMark Cloud Gate Standard Score | 35957 punten | |
| 3DMark Fire Strike Score | 14010 punten | |
| 3DMark Time Spy Score | 6045 punten | |
Help | ||
| Shadow of the Tomb Raider | |
| 1280x720 Lowest Preset | |
| Walmart EVOO Gaming 17 | |
| HP Omen 15-dc0015ng | |
| Gemiddeld NVIDIA GeForce GTX 1660 Ti Mobile (88 - 151, n=6) | |
| Lenovo Legion Y740-17IRH | |
| Asus Strix Scar III G531GW-AZ062T | |
| Asus TUF A17 FA706IU-AS76 | |
| Dell G5 15 5590-PCNJJ | |
| Alienware 17 R4 | |
| 1920x1080 Highest Preset AA:T | |
| Walmart EVOO Gaming 17 | |
| Asus Strix Scar III G531GW-AZ062T | |
| Alienware 17 R4 | |
| Lenovo Legion Y740-17IRH | |
| Asus TUF A17 FA706IU-AS76 | |
| Gemiddeld NVIDIA GeForce GTX 1660 Ti Mobile (62 - 73, n=8) | |
| HP Omen 15-dc0015ng | |
| Asus TUF FX705GM | |
| Dell G5 15 5590-PCNJJ | |
| The Witcher 3 | |
| 1024x768 Low Graphics & Postprocessing | |
| Walmart EVOO Gaming 17 | |
| Lenovo Legion Y740-17IRH | |
| Asus Strix Scar III G531GW-AZ062T | |
| Asus TUF A17 FA706IU-AS76 | |
| Gemiddeld NVIDIA GeForce GTX 1660 Ti Mobile (177.3 - 298, n=14) | |
| HP Omen 15-dc0015ng | |
| Dell G5 15 5590-PCNJJ | |
| 1920x1080 Ultra Graphics & Postprocessing (HBAO+) | |
| Asus Strix Scar III G531GW-AZ062T | |
| Walmart EVOO Gaming 17 | |
| Lenovo Legion Y740-17IRH | |
| Gemiddeld NVIDIA GeForce GTX 1660 Ti Mobile (51.6 - 65.1, n=21) | |
| Asus TUF A17 FA706IU-AS76 | |
| HP Omen 15-dc0015ng | |
| Asus TUF FX705GM | |
| Dell G5 15 5590-PCNJJ | |
| Dota 2 Reborn | |
| 1920x1080 ultra (3/3) best looking | |
| Gemiddeld NVIDIA GeForce GTX 1660 Ti Mobile (94.6 - 125, n=11) | |
| HP Omen 15-dc0015ng | |
| Asus TUF A17 FA706IU-AS76 | |
| Asus Strix Scar III G531GW-AZ062T | |
| 1280x720 min (0/3) fastest | |
| Asus Strix Scar III G531GW-AZ062T | |
| Gemiddeld NVIDIA GeForce GTX 1660 Ti Mobile (109 - 150, n=11) | |
| HP Omen 15-dc0015ng | |
| Asus TUF A17 FA706IU-AS76 | |
| Metro Exodus | |
| 1920x1080 Ultra Quality AF:16x | |
| Alienware 17 R4 | |
| Asus Strix Scar III G531GW-AZ062T | |
| Lenovo Legion Y740-17IRH | |
| Asus TUF A17 FA706IU-AS76 | |
| Gemiddeld NVIDIA GeForce GTX 1660 Ti Mobile (38.2 - 43.1, n=4) | |
| Dell G5 15 5590-PCNJJ | |
| 1920x1080 Medium Quality AF:4x | |
| Alienware 17 R4 | |
| Asus Strix Scar III G531GW-AZ062T | |
| Lenovo Legion Y740-17IRH | |
| Asus TUF A17 FA706IU-AS76 | |
| Gemiddeld NVIDIA GeForce GTX 1660 Ti Mobile (64 - 73.7, n=4) | |
| Dell G5 15 5590-PCNJJ | |
| Borderlands 3 | |
| 1280x720 Very Low Overall Quality (DX11) | |
| Lenovo Legion Y740-17IRH | |
| Gemiddeld NVIDIA GeForce GTX 1660 Ti Mobile (107.9 - 131, n=2) | |
| Alienware 17 R4 | |
| Asus TUF A17 FA706IU-AS76 | |
| Dell G5 15 5590-PCNJJ | |
| 1920x1080 Badass Overall Quality (DX11) | |
| Alienware 17 R4 | |
| Lenovo Legion Y740-17IRH | |
| Asus TUF A17 FA706IU-AS76 | |
| Gemiddeld NVIDIA GeForce GTX 1660 Ti Mobile (46.6 - 48.6, n=3) | |
| Dell G5 15 5590-PCNJJ | |
| lage | gem. | hoge | ultra | |
|---|---|---|---|---|
| The Witcher 3 (2015) | 254 | 175.1 | 103 | 55.6 |
| Dota 2 Reborn (2015) | 122 | 113 | 110 | 104 |
| X-Plane 11.11 (2018) | 93 | 83.7 | 70.2 | |
| Shadow of the Tomb Raider (2018) | 108 | 87 | 81 | 73 |
| Metro Exodus (2019) | 112.4 | 73.7 | 54.4 | 42.6 |
| Borderlands 3 (2019) | 107.9 | 87.5 | 61.7 | 47.8 |
| Asus TUF A17 FA706IU-AS76 GeForce GTX 1660 Ti Mobile, R7 4800H, Intel SSD 660p 1TB SSDPEKNW010T8 | MSI GP75 Leopard 9SD GeForce GTX 1660 Ti Mobile, i7-9750H, Kingston RBUSNS8154P3256GJ1 | Dell G7 17 7790 GeForce RTX 2070 Max-Q, i7-8750H, Toshiba BG3 KBG30ZMS256G | HP Pavilion Gaming 17-cd0085cl GeForce GTX 1660 Ti Max-Q, i7-9750H, Samsung SSD PM981 MZVLB256HAHQ | Lenovo Legion Y540-17IRH GeForce GTX 1660 Ti Mobile, i5-9300H, WDC PC SN520 SDAPNUW-512G | Asus TUF FX705DT-AU068T GeForce GTX 1650 Mobile, R5 3550H, WDC PC SN520 SDAPNUW-256G | |
|---|---|---|---|---|---|---|
| Noise | -8% | 7% | 11% | -3% | 2% | |
| uit / omgeving * (dB) | 28.7 | 29 -1% | 28.2 2% | 28.2 2% | 30 -5% | 30.8 -7% |
| Idle Minimum * (dB) | 28.7 | 29 -1% | 28.6 -0% | 30.1 -5% | 30 -5% | 30.8 -7% |
| Idle Average * (dB) | 30.5 | 34 -11% | 28.6 6% | 30.1 1% | 32 -5% | 30.8 -1% |
| Idle Maximum * (dB) | 32.5 | 37 -14% | 28.6 12% | 30.1 7% | 34 -5% | 32.2 1% |
| Load Average * (dB) | 42.5 | 53 -25% | 31.8 25% | 34.2 20% | 44 -4% | 38.6 9% |
| Witcher 3 ultra * (dB) | 50.1 | 51 -2% | 50.6 -1% | 34.2 32% | 50 -0% | |
| Load Maximum * (dB) | 53.4 | 55 -3% | 50.8 5% | 43.8 18% | 52 3% | 44.8 16% |
* ... kleiner is beter
Geluidsniveau
| Onbelast |
| 28.7 / 30.5 / 32.5 dB (A) |
| Belasting |
| 42.5 / 53.4 dB (A) |
 | ||
30 dB stil 40 dB(A) hoorbaar 50 dB(A) luid |
||
min: | ||
(-) De maximumtemperatuur aan de bovenzijde bedraagt 47.6 °C / 118 F, vergeleken met het gemiddelde van 40.4 °C / 105 F, variërend van 21.2 tot 68.8 °C voor de klasse Gaming.
(-) De bodem warmt op tot een maximum van 50.8 °C / 123 F, vergeleken met een gemiddelde van 43.2 °C / 110 F
(+) Bij onbelast gebruik bedraagt de gemiddelde temperatuur voor de bovenzijde 29.3 °C / 85 F, vergeleken met het apparaatgemiddelde van 33.9 °C / 93 F.
(±) Bij het spelen van The Witcher 3 is de gemiddelde temperatuur voor de bovenzijde 32.3 °C / 90 F, vergeleken met het apparaatgemiddelde van 33.9 °C / 93 F.
(+) De palmsteunen en het touchpad zijn met een maximum van ###max## °C / 83.5 F koeler dan de huidtemperatuur en voelen daarom koel aan.
(±) De gemiddelde temperatuur van de handpalmsteun van soortgelijke toestellen bedroeg 28.8 °C / 83.8 F (+0.2 °C / 0.3 F).
Asus TUF A17 FA706IU-AS76 audioanalyse
(±) | luidspreker luidheid is gemiddeld maar goed (74 dB)
Bas 100 - 315 Hz
(±) | verminderde zeebaars - gemiddeld 12.7% lager dan de mediaan
(±) | lineariteit van de lage tonen is gemiddeld (11.5% delta ten opzichte van de vorige frequentie)
Midden 400 - 2000 Hz
(+) | evenwichtige middens - slechts 4.8% verwijderd van de mediaan
(±) | lineariteit van de middentonen is gemiddeld (9.1% delta ten opzichte van de vorige frequentie)
Hoog 2 - 16 kHz
(+) | evenwichtige hoogtepunten - slechts 3.1% verwijderd van de mediaan
(±) | lineariteit van de hoogtepunten is gemiddeld (8.7% delta ten opzichte van de vorige frequentie)
Algemeen 100 - 16.000 Hz
(±) | lineariteit van het totale geluid is gemiddeld (23.5% verschil met de mediaan)
Vergeleken met dezelfde klasse
» 85% van alle geteste apparaten in deze klasse waren beter, 5% vergelijkbaar, 10% slechter
» De beste had een delta van 6%, het gemiddelde was 18%, de slechtste was 132%
Vergeleken met alle geteste toestellen
» 70% van alle geteste apparaten waren beter, 6% gelijk, 24% slechter
» De beste had een delta van 4%, het gemiddelde was 24%, de slechtste was 134%
Apple MacBook 12 (Early 2016) 1.1 GHz audioanalyse
(+) | luidsprekers kunnen relatief luid spelen (83.6 dB)
Bas 100 - 315 Hz
(±) | verminderde zeebaars - gemiddeld 11.3% lager dan de mediaan
(±) | lineariteit van de lage tonen is gemiddeld (14.2% delta ten opzichte van de vorige frequentie)
Midden 400 - 2000 Hz
(+) | evenwichtige middens - slechts 2.4% verwijderd van de mediaan
(+) | de middentonen zijn lineair (5.5% delta ten opzichte van de vorige frequentie)
Hoog 2 - 16 kHz
(+) | evenwichtige hoogtepunten - slechts 2% verwijderd van de mediaan
(+) | de hoge tonen zijn lineair (4.5% delta naar de vorige frequentie)
Algemeen 100 - 16.000 Hz
(+) | het totale geluid is lineair (10.2% verschil met de mediaan)
Vergeleken met dezelfde klasse
» 7% van alle geteste apparaten in deze klasse waren beter, 2% vergelijkbaar, 91% slechter
» De beste had een delta van 5%, het gemiddelde was 18%, de slechtste was 53%
Vergeleken met alle geteste toestellen
» 5% van alle geteste apparaten waren beter, 1% gelijk, 94% slechter
» De beste had een delta van 4%, het gemiddelde was 24%, de slechtste was 134%
| Uit / Standby | |
| Inactief | |
| Belasting |
|
Key:
min: | |
| Asus TUF A17 FA706IU-AS76 R7 4800H, GeForce GTX 1660 Ti Mobile, Intel SSD 660p 1TB SSDPEKNW010T8, IPS, 1920x1080, 17.3" | Asus ROG Strix G GL731GU-RB74 i7-9750H, GeForce GTX 1660 Ti Mobile, Intel SSD 660p SSDPEKNW512G8, IPS, 1920x1080, 17.3" | Dell G7 17 7790 i7-8750H, GeForce RTX 2070 Max-Q, Toshiba BG3 KBG30ZMS256G, IPS, 1920x1080, 17.3" | Lenovo Legion Y540-17IRH i5-9300H, GeForce GTX 1660 Ti Mobile, WDC PC SN520 SDAPNUW-512G, IPS, 1920x1080, 17.3" | Asus TUF FX705DT-AU068T R5 3550H, GeForce GTX 1650 Mobile, WDC PC SN520 SDAPNUW-256G, IPS, 1920x1080, 17.3" | Gigabyte Aero 17 HDR XB i7-10875H, GeForce RTX 2070 Super Max-Q, Samsung SSD PM981a MZVLB512HBJQ, IPS, 3840x2160, 17.3" | |
|---|---|---|---|---|---|---|
| Power Consumption | -61% | -23% | -56% | 37% | -57% | |
| Idle Minimum * (Watt) | 7.4 | 13.6 -84% | 9.5 -28% | 19 -157% | 3.9 47% | 16 -116% |
| Idle Average * (Watt) | 10.5 | 26.2 -150% | 16.2 -54% | 22 -110% | 9.6 9% | 19 -81% |
| Idle Maximum * (Watt) | 17 | 35 -106% | 23.8 -40% | 30 -76% | 12.2 28% | 30 -76% |
| Load Average * (Watt) | 103.7 | 113.6 -10% | 101.7 2% | 79 24% | 59 43% | 109 -5% |
| Witcher 3 ultra * (Watt) | 128.1 | 134.1 -5% | 155 -21% | 134 -5% | 167 -30% | |
| Load Maximum * (Watt) | 183.2 | 200.2 -9% | 172.2 6% | 201 -10% | 80 56% | 246 -34% |
* ... kleiner is beter
| Asus TUF A17 FA706IU-AS76 R7 4800H, GeForce GTX 1660 Ti Mobile, 90 Wh | MSI GP75 Leopard 9SD i7-9750H, GeForce GTX 1660 Ti Mobile, 51 Wh | Dell G7 17 7790 i7-8750H, GeForce RTX 2070 Max-Q, 60 Wh | HP Pavilion Gaming 17-cd0085cl i7-9750H, GeForce GTX 1660 Ti Max-Q, 52.5 Wh | Lenovo Legion Y540-17IRH i5-9300H, GeForce GTX 1660 Ti Mobile, 57 Wh | Asus TUF FX705DT-AU068T R5 3550H, GeForce GTX 1650 Mobile, 64 Wh | |
|---|---|---|---|---|---|---|
| Batterijduur | -64% | -33% | -25% | -55% | 2% | |
| Reader / Idle (h) | 9.1 | 4.8 -47% | 8.5 -7% | 11.6 27% | 5.2 -43% | 13.6 49% |
| WiFi v1.3 (h) | 8.5 | 3.2 -62% | 3.9 -54% | 5.7 -33% | 3.7 -56% | 7.8 -8% |
| Load (h) | 3.3 | 0.6 -82% | 2 -39% | 1 -70% | 1.1 -67% | 2.1 -36% |
Pro
Contra
Conclusie - Beter dan de FX705 in bijna elk opzicht
Dit is de verkorte versie van het originele artikel. Het volledige, Engelse testrapport vind je hier.
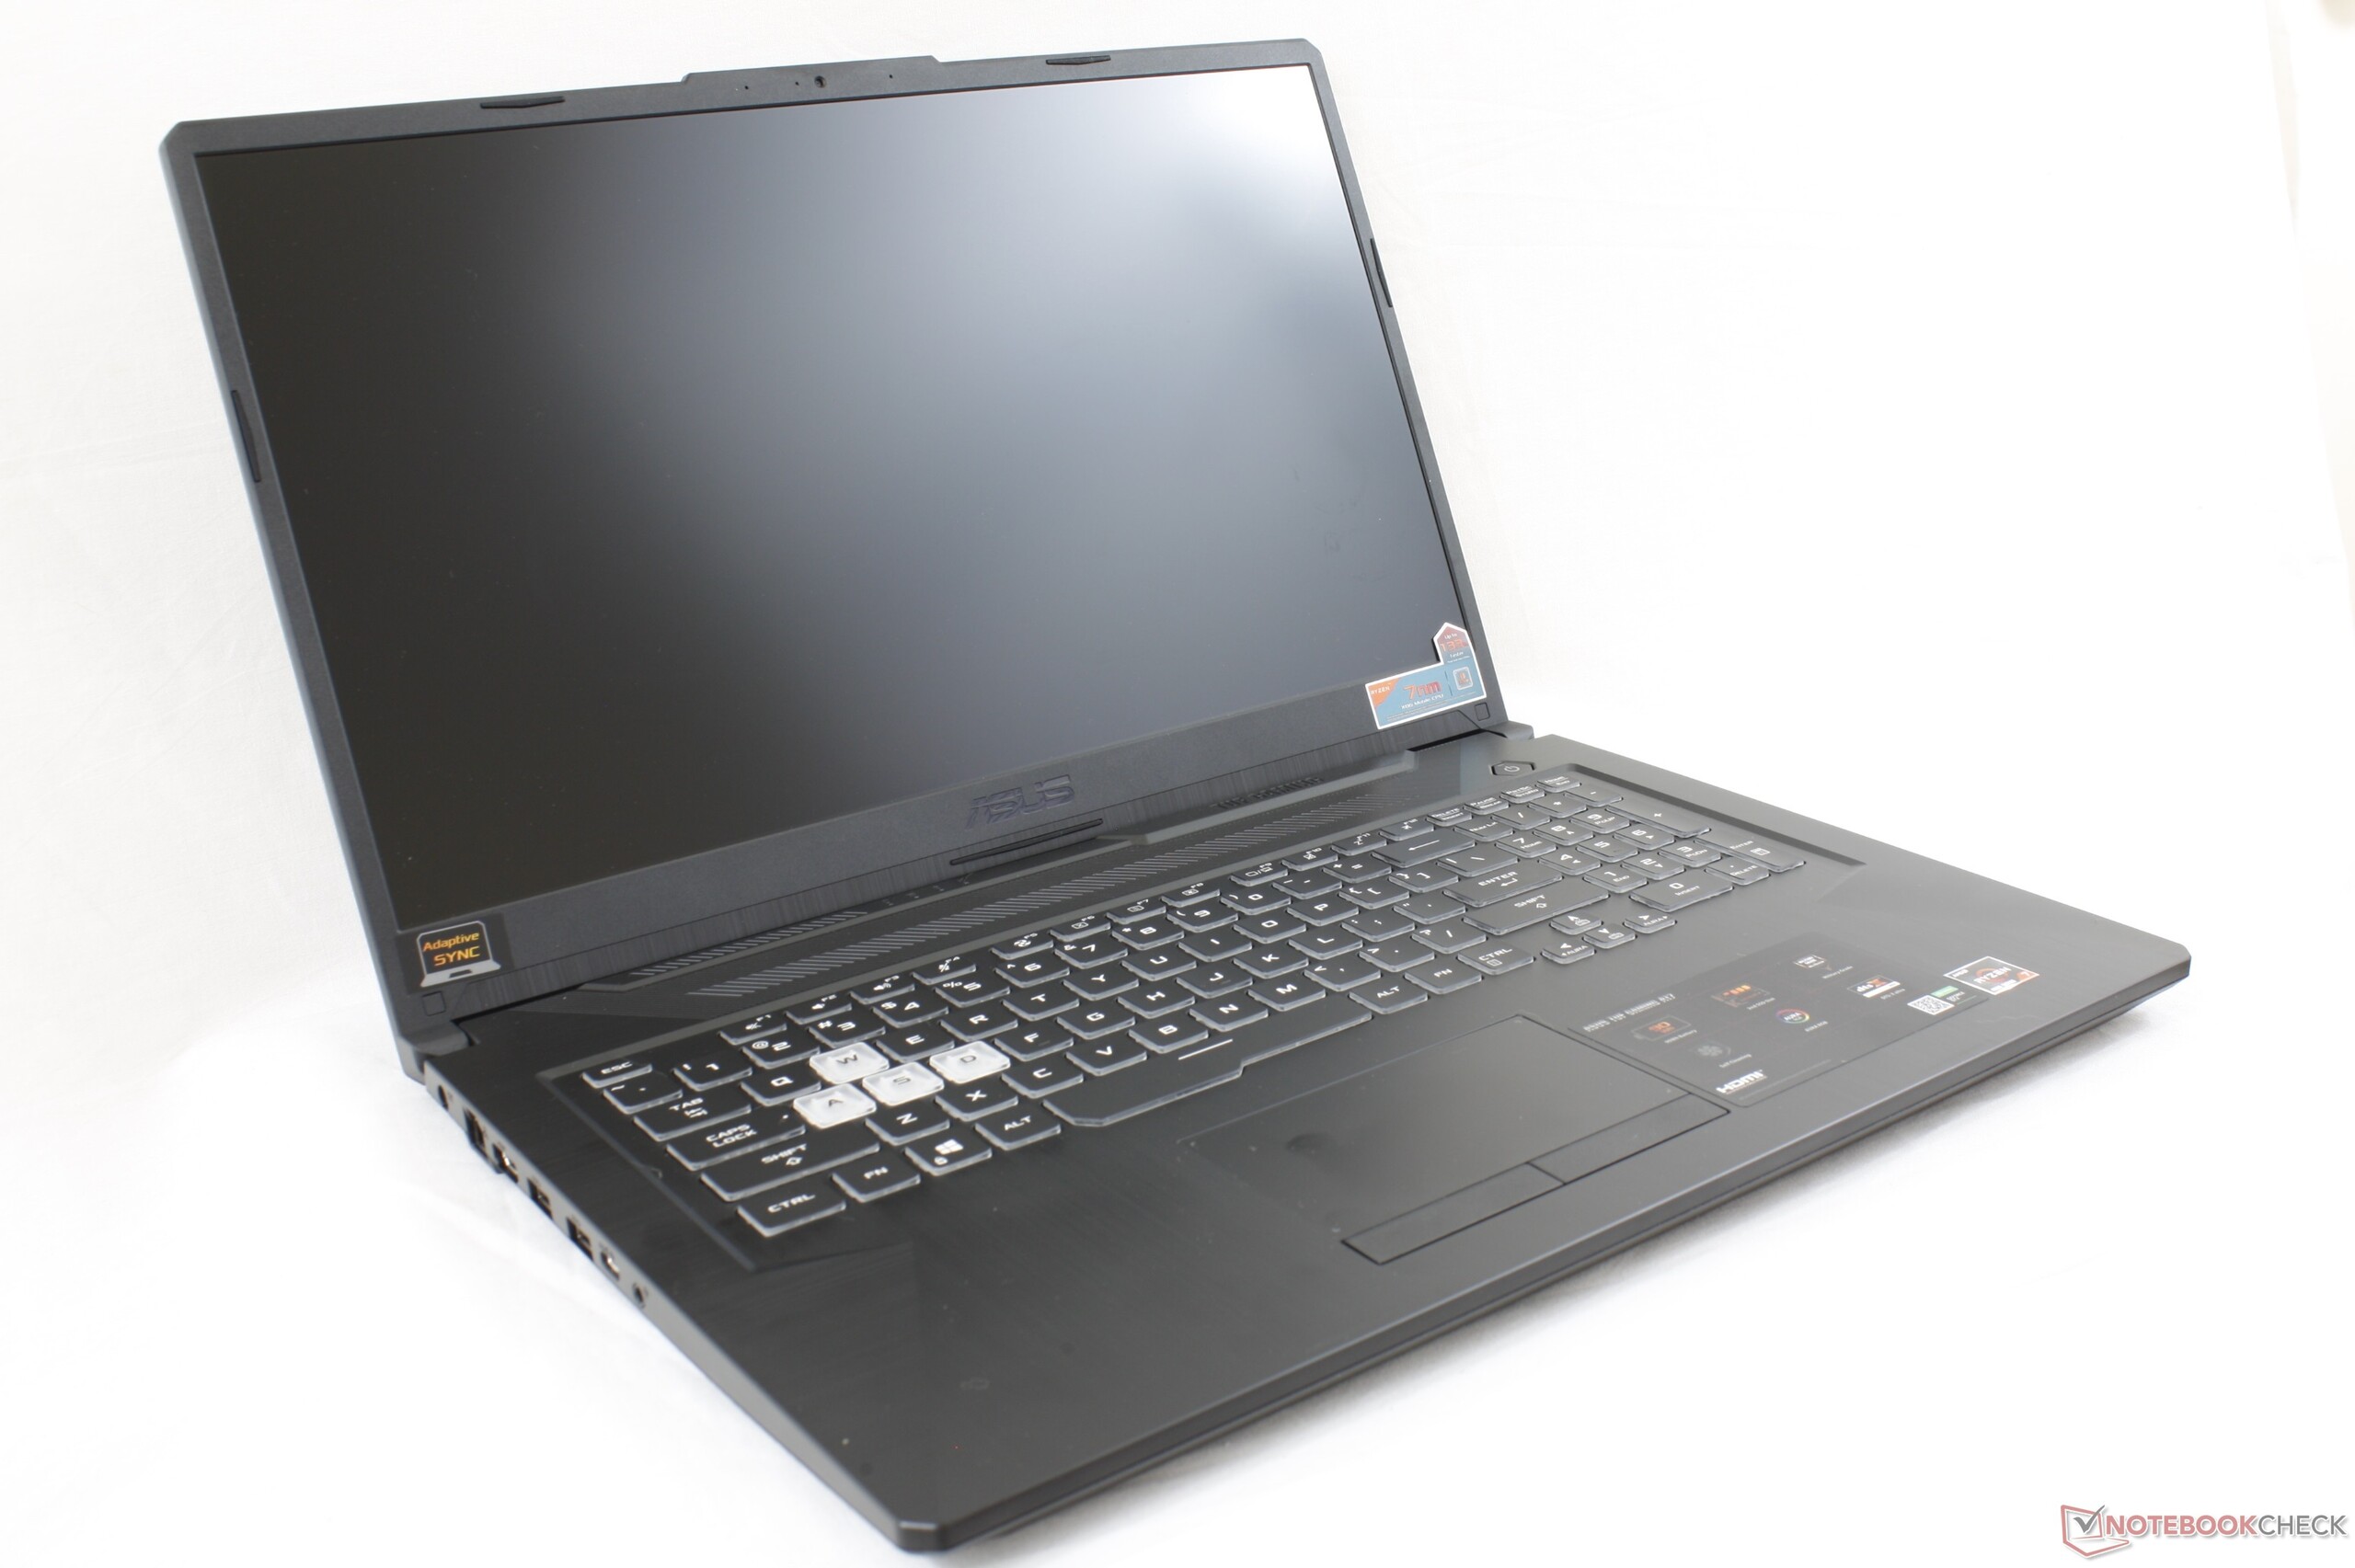
De TUF-serie zou het budgetvriendelijke aanbod van gaming-laptops van Asus moeten zijn, in tegenstelling tot de duurdere ROG-series. Dit nieuwste model brengt het echter veel dichter bij zijn duurdere broers en zussen dan we hadden verwacht op het vlak van features en prestaties. Het feit dat je een 120 Hz-scherm kunt krijgen met snelle refresh-rates, zowel adaptive sync als Optimus, een lange batterijduur, gemakkelijk toegankelijke opslagopties, een stevige behuizing en zelfs Core i9-achtige prestaties - en dat alles in een gaming-laptop van 1100 euro - is behoorlijk opmerkelijk. Het is nog maar een paar jaar geleden dat sommige van deze features exclusief te vinden waren in dure Zephyrus-laptops of andere ultradunne toestellen.
Natuurlijk moest er hier en daar ook wat worden bespaard, maar dit blijft gelukkig beperkt. Gamers die RGB-verlichting per toets, WiFi 6, 144+ Hz refresh-rates, nog snellere zwart-wit-responstijden, krachtigere luidsprekers, bredere sRGB-dekking, Thunderbolt 3 en een niet-plastic behuizing willen, zullen meer moeten uitgeven en de betaalbare TUF-serie overslaan. De gaming-ervaring is de beste ooit voor de TUF-serie, zolang je de luide ventilatoren en onredelijk kleine pijltoetsen voor lief neemt.
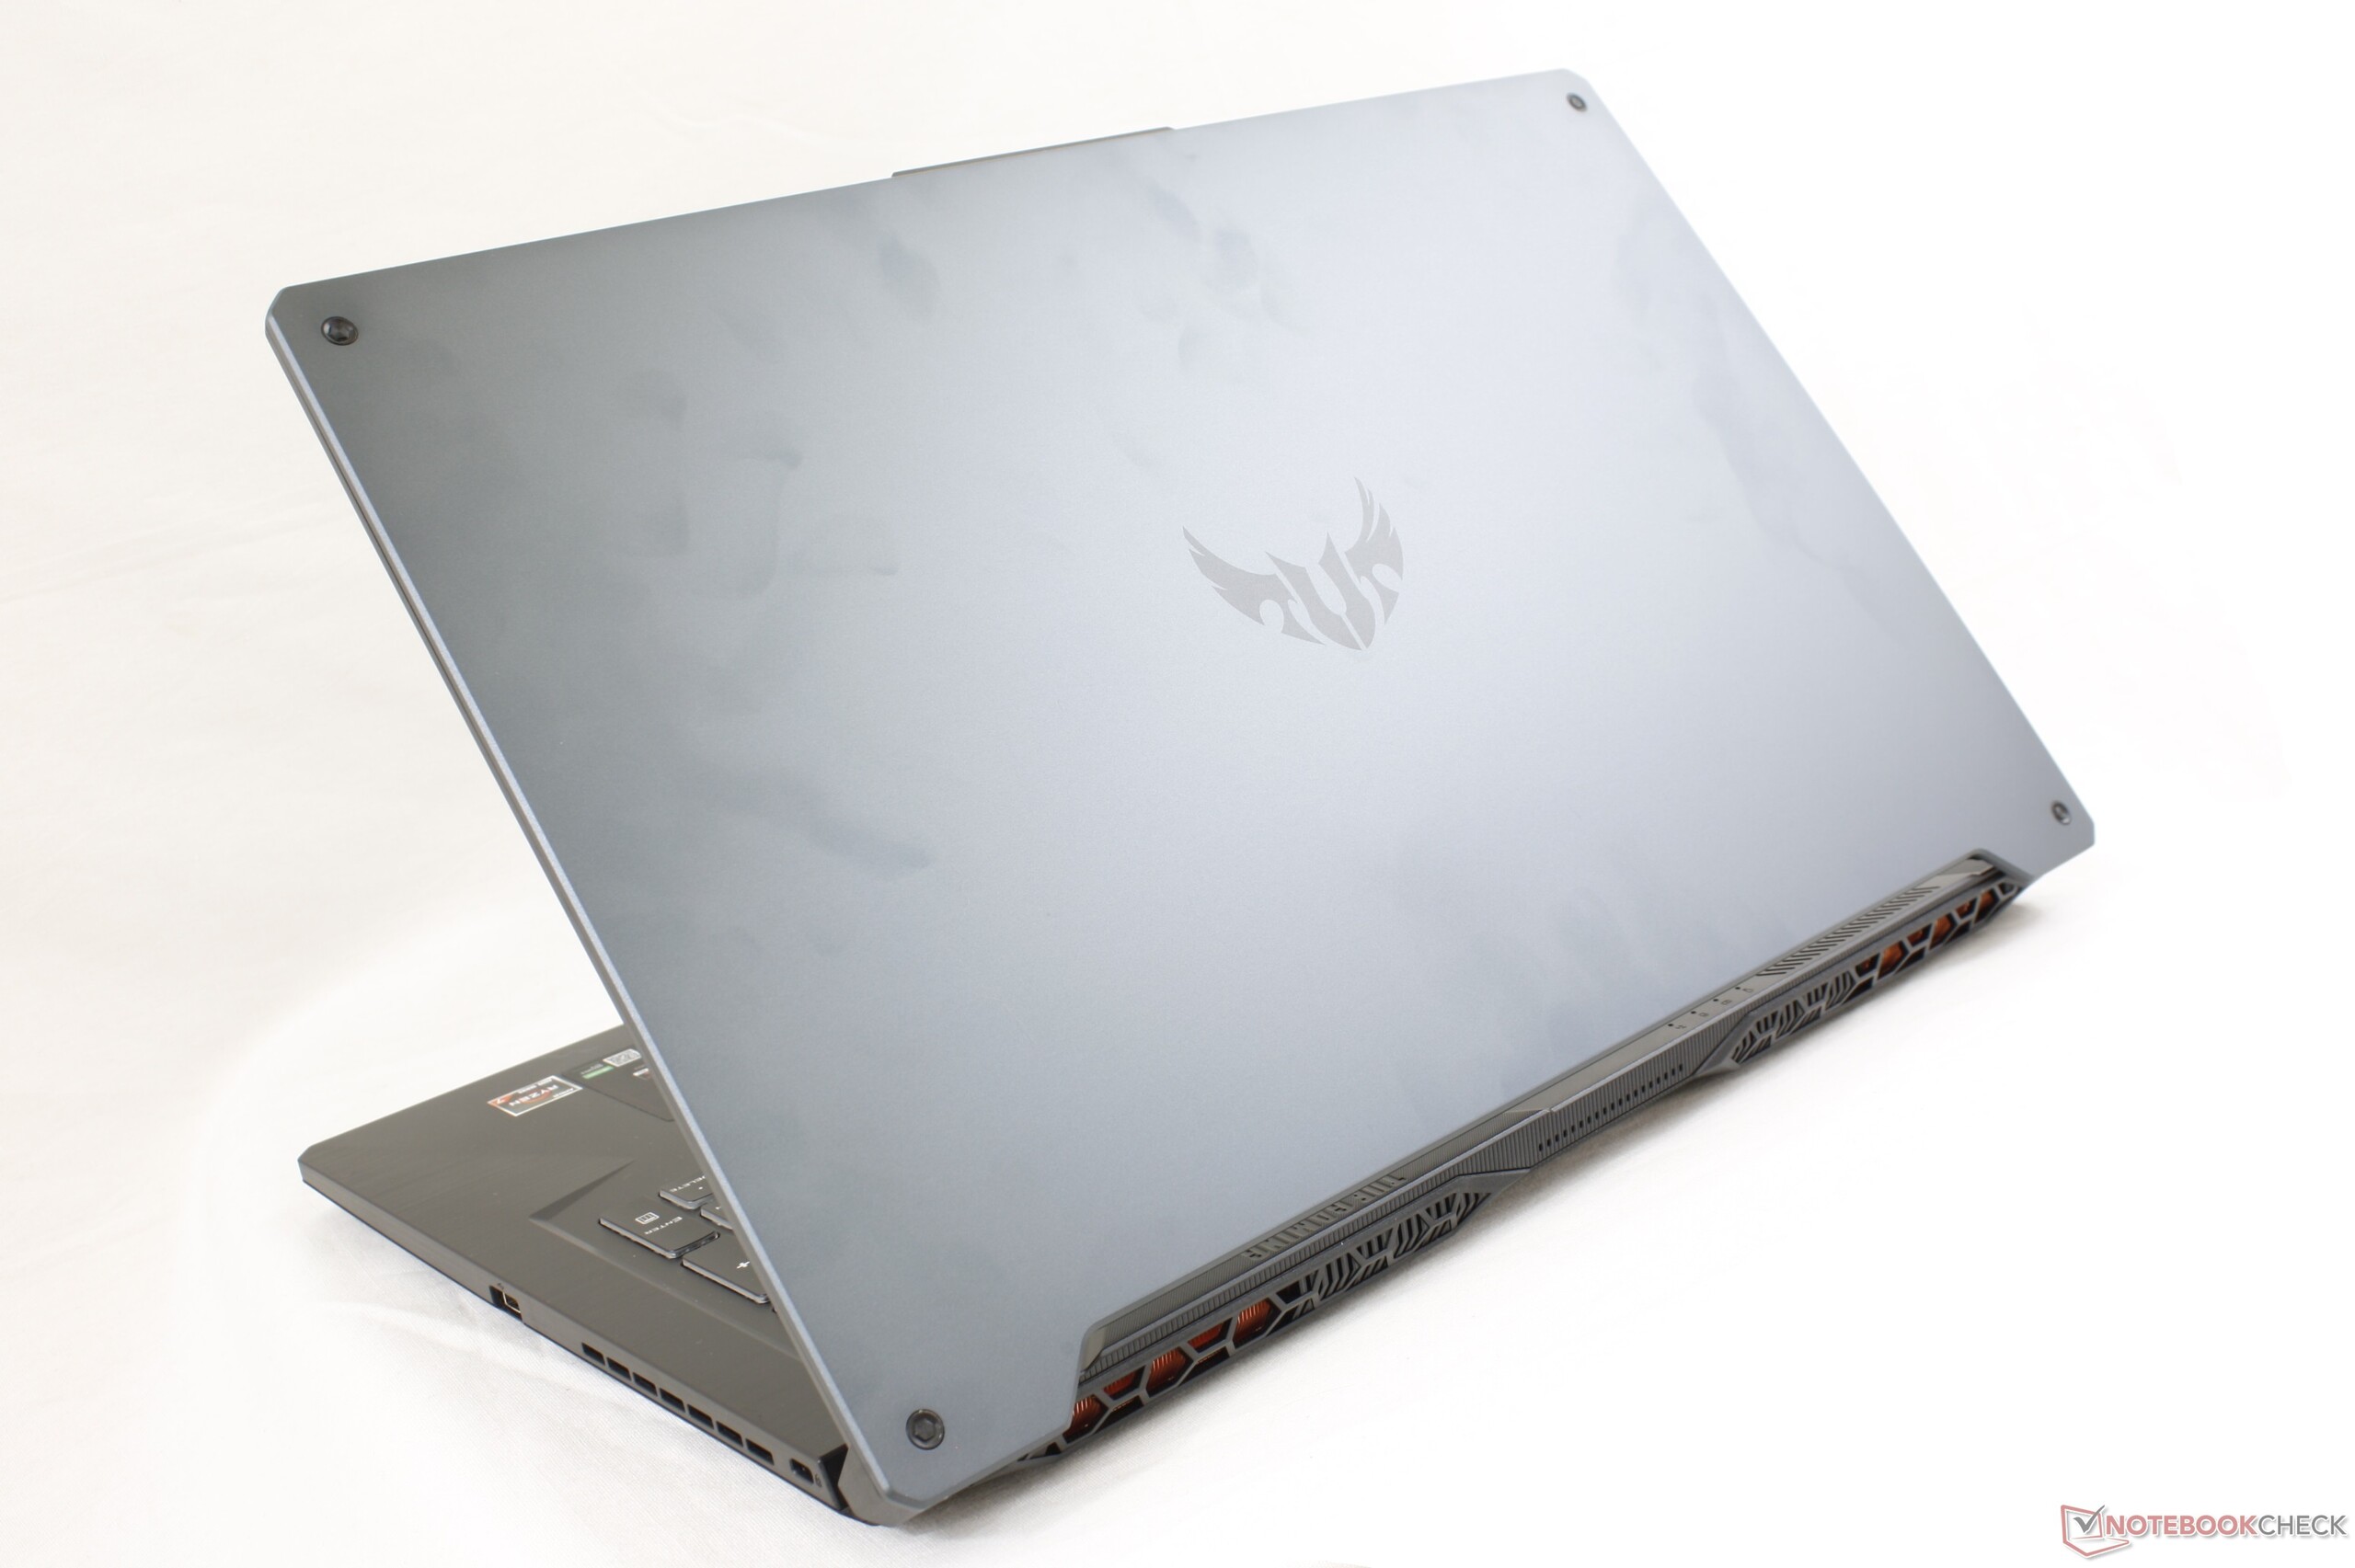
De TUF FA706 is zo'n enorme upgrade van generatie op generatie dat de vorige TUF FX705-serie in het niets verdwijnt. Dit is gemakkelijk een van de betere budget gaming-laptops die je momenteel kunt kopen, met zowel CPU-prestaties die concurreren met de meeste Core i9-laptops als een stevigere behuizing dan de meeste andere plastic gaming-laptops.
Asus TUF A17 FA706IU-AS76
- 25-05-2020 v7 (old)
Allen Ngo
Price comparison
