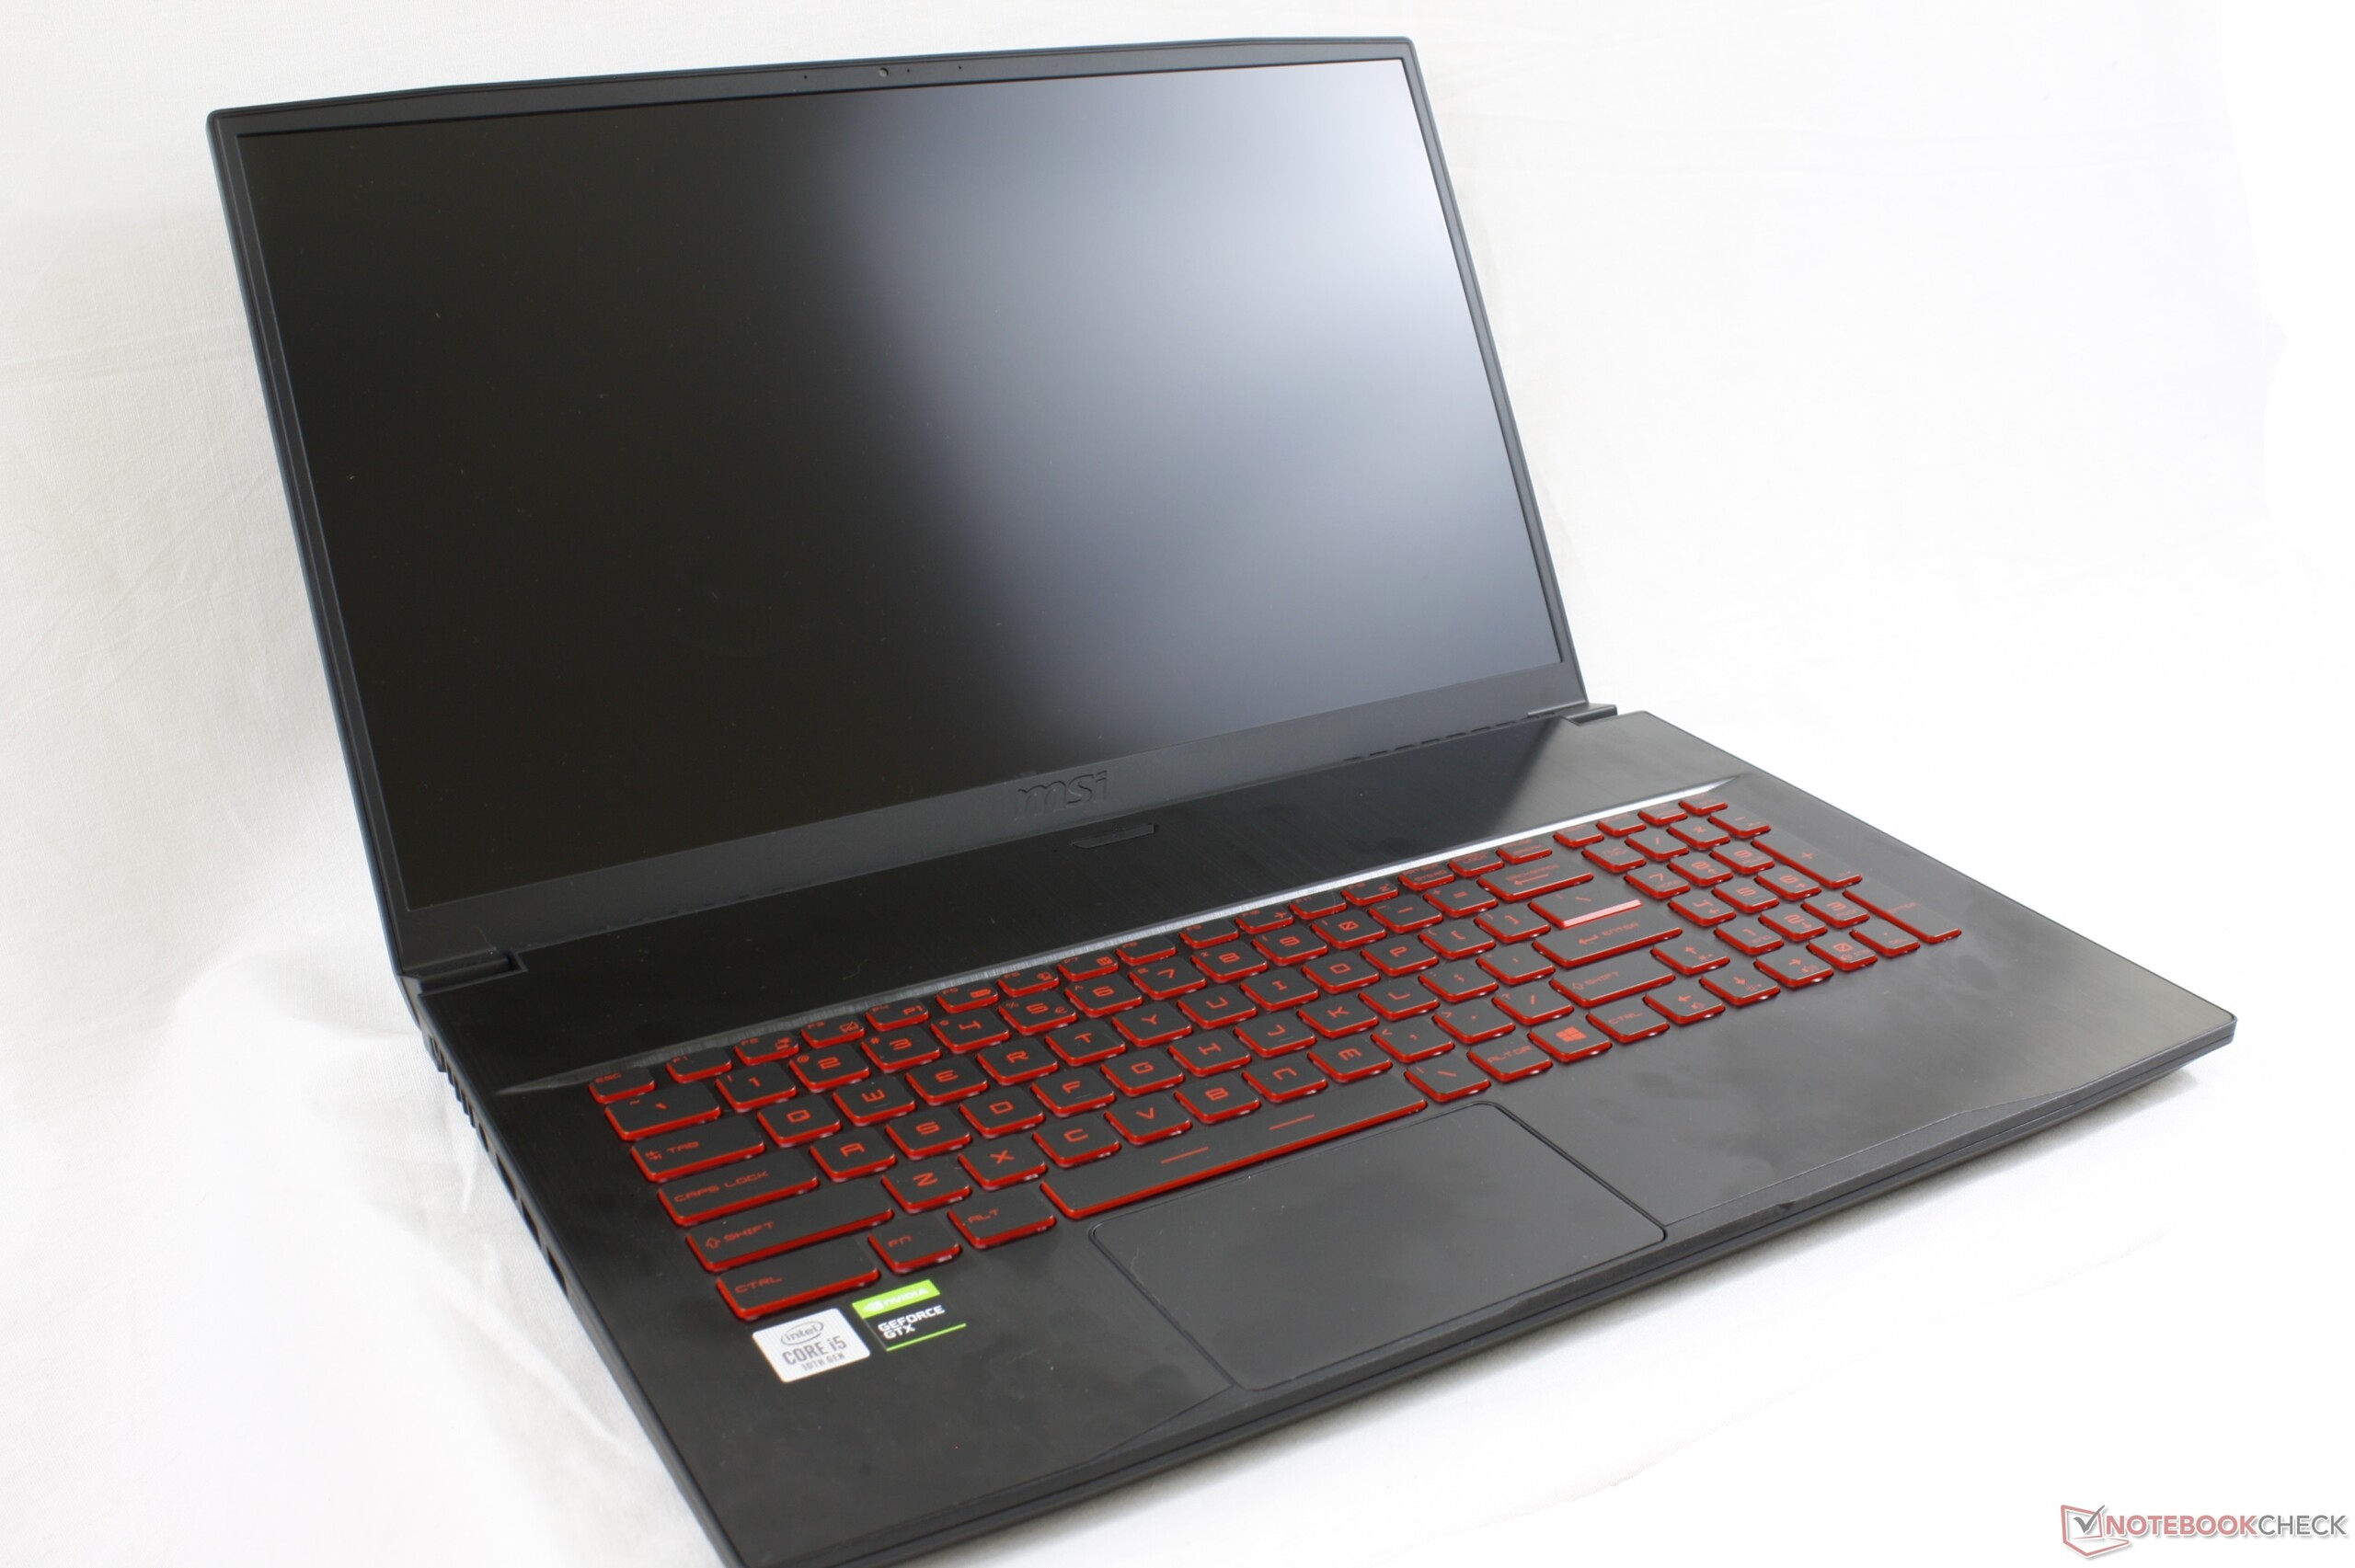
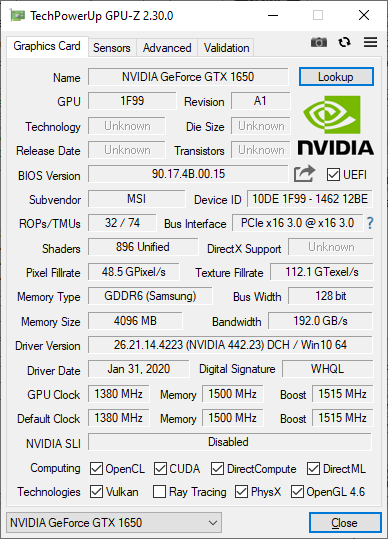
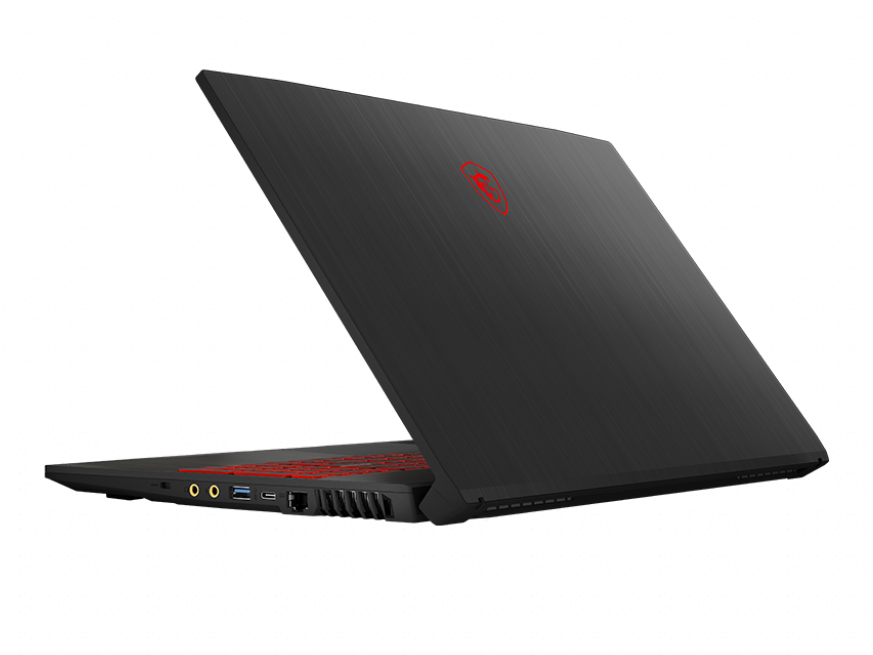
Kort testrapport MSI GF75 Thin 10SCXR Laptop: 10e Generatie Core i5 Comet Lake-H Debut
Evaluatie | Datum | Model | Gewicht | Hoogte | Formaat | Resolutie | Beste prijs |
|---|---|---|---|---|---|---|---|
| 78.5 % v7 (old) | 04-2020 | MSI GF75 Thin 10SCXR i5-10300H, GeForce GTX 1650 Mobile | 2.2 kg | 23.1 mm | 17.30" | 1920x1080 | |
| 84.3 % v6 (old) | 08-2019 | Acer Aspire Nitro 5 AN517-51-7887 i7-9750H, GeForce GTX 1660 Ti Mobile | 2.8 kg | 26.9 mm | 17.30" | 1920x1080 | |
| 85.1 % v6 (old) | 06-2019 | MSI GP75 Leopard 9SD i7-9750H, GeForce GTX 1660 Ti Mobile | 2.6 kg | 29 mm | 17.30" | 1920x1080 | |
| 77.9 % v7 (old) | 09-2021 | Lenovo Ideapad L340-17IRH 81LL001YGE i5-9300H, GeForce GTX 1650 Mobile | 2.5 kg | 25.3 mm | 17.30" | 1920x1080 | |
| 81.6 % v7 (old) | 07-2019 | HP Pavilion Gaming 17-cd0085cl i7-9750H, GeForce GTX 1660 Ti Max-Q | 2.8 kg | 25 mm | 17.30" | 1920x1080 |

| Networking | |
| iperf3 transmit AX12 | |
| Asus Zephyrus G14 GA401IV | |
| Lenovo ThinkPad X1 Carbon G7 20R1-000YUS | |
| MSI GF75 Thin 10SCXR | |
| LG Gram 14T90N | |
| iperf3 receive AX12 | |
| MSI GF75 Thin 10SCXR | |
| Asus Zephyrus G14 GA401IV | |
| Lenovo ThinkPad X1 Carbon G7 20R1-000YUS | |
| LG Gram 14T90N | |


| |||||||||||||||||||||||||
Helderheidsverdeling: 92 %
Helderheid in Batterij-modus: 251.2 cd/m²
Contrast: 739:1 (Zwart: 0.34 cd/m²)
ΔE ColorChecker Calman: 4.5 | ∀{0.5-29.43 Ø4.72}
calibrated: 3.91
ΔE Greyscale Calman: 4 | ∀{0.09-98 Ø4.97}
58.1% sRGB (Argyll 1.6.3 3D)
37.3% AdobeRGB 1998 (Argyll 1.6.3 3D)
40.77% AdobeRGB 1998 (Argyll 3D)
58.4% sRGB (Argyll 3D)
39.46% Display P3 (Argyll 3D)
Gamma: 2.25
CCT: 5882 K
| MSI GF75 Thin 10SCXR AU Optronics B173HAN04.7, IPS, 17.3", 1920x1080 | Acer Aspire Nitro 5 AN517-51-7887 LP173WF5-SPB3, IPS, 17.3", 1920x1080 | Asus ROG Strix G GL731GU-RB74 AU Optronics B173HAN04.0, IPS, 17.3", 1920x1080 | Lenovo Ideapad L340-17IRH 81LL001YGE Chi Mei N173HCE-E31, IPS, 17.3", 1920x1080 | MSI GP75 Leopard 9SD Chi Mei N173HCE-G33 (CMN175C), IPS, 17.3", 1920x1080 | HP Pavilion Gaming 17-cd0085cl BOE0825, IPS, 17.3", 1920x1080 | MSI GF75 Thin 9SC AU Optronics B173HAN04.2, IPS, 17.3", 1920x1080 | |
|---|---|---|---|---|---|---|---|
| Display | 58% | 55% | 63% | 61% | 57% | 56% | |
| Display P3 Coverage (%) | 39.46 | 62.7 59% | 61.9 57% | 66.3 68% | 63.4 61% | 63.3 60% | 62.5 58% |
| sRGB Coverage (%) | 58.4 | 92.5 58% | 89.4 53% | 92.7 59% | 94.9 63% | 90.2 54% | 90 54% |
| AdobeRGB 1998 Coverage (%) | 40.77 | 63.5 56% | 63.3 55% | 66.6 63% | 65.1 60% | 64.3 58% | 64 57% |
| Response Times | -4% | 70% | 10% | 72% | 17% | -8% | |
| Response Time Grey 50% / Grey 80% * (ms) | 34 ? | 37 ? -9% | 6.4 ? 81% | 32 ? 6% | 8 ? 76% | 31.6 ? 7% | 34 ? -0% |
| Response Time Black / White * (ms) | 26.4 ? | 26 ? 2% | 11.2 ? 58% | 23 ? 13% | 8.8 ? 67% | 19.6 ? 26% | 30.4 ? -15% |
| PWM Frequency (Hz) | 250 ? | 25510 ? | |||||
| Screen | 26% | 27% | 38% | 47% | 24% | 34% | |
| Brightness middle (cd/m²) | 251.2 | 407 62% | 294.3 17% | 318 27% | 420 67% | 299.6 19% | 344.7 37% |
| Brightness (cd/m²) | 242 | 364 50% | 289 19% | 292 21% | 393 62% | 285 18% | 332 37% |
| Brightness Distribution (%) | 92 | 84 -9% | 89 -3% | 85 -8% | 91 -1% | 86 -7% | 91 -1% |
| Black Level * (cd/m²) | 0.34 | 0.3 12% | 0.3 12% | 0.21 38% | 0.32 6% | 0.33 3% | 0.3 12% |
| Contrast (:1) | 739 | 1357 84% | 981 33% | 1514 105% | 1313 78% | 908 23% | 1149 55% |
| Colorchecker dE 2000 * | 4.5 | 4.55 -1% | 3.95 12% | 4.04 10% | 3.04 32% | 3.68 18% | 3.08 32% |
| Colorchecker dE 2000 max. * | 20 | 12.44 38% | 6.49 68% | 6.59 67% | 7.22 64% | 8.05 60% | 6.32 68% |
| Colorchecker dE 2000 calibrated * | 3.91 | 3.08 21% | 2.06 47% | 0.89 77% | 3.15 19% | 2.94 25% | |
| Greyscale dE 2000 * | 4 | 7.61 -90% | 3.7 7% | 4.21 -5% | 3.91 2% | 3.8 5% | 3.8 5% |
| Gamma | 2.25 98% | 2.51 88% | 2.07 106% | 2.5 88% | 2.26 97% | 2.12 104% | 2.17 101% |
| CCT | 5882 111% | 7212 90% | 7155 91% | 7189 90% | 7138 91% | 7240 90% | 7284 89% |
| Color Space (Percent of AdobeRGB 1998) (%) | 37.3 | 59 58% | 57.7 55% | 60 61% | 60 61% | 58.1 56% | 58 55% |
| Color Space (Percent of sRGB) (%) | 58.1 | 92 58% | 89 53% | 93 60% | 95 64% | 89.8 55% | 89.6 54% |
| Totaal Gemiddelde (Programma / Instellingen) | 27% /
29% | 51% /
37% | 37% /
40% | 60% /
52% | 33% /
30% | 27% /
33% |
* ... kleiner is beter
Responstijd Scherm
| ↔ Responstijd Zwart naar Wit | ||
|---|---|---|
| 26.4 ms ... stijging ↗ en daling ↘ gecombineerd | ↗ 15.6 ms stijging | 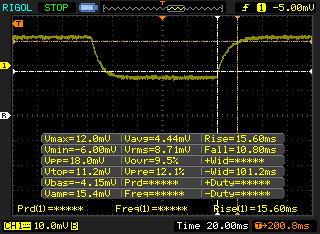 |
| ↘ 10.8 ms daling | ||
| Het scherm vertoonde relatief trage responstijden in onze tests en is misschien te traag voor games. Ter vergelijking: alle testtoestellen variëren van 0.1 (minimum) tot 240 (maximum) ms. » 66 % van alle toestellen zijn beter. Dit betekent dat de gemeten responstijd slechter is dan het gemiddelde (19.8 ms) van alle geteste toestellen. | ||
| ↔ Responstijd 50% Grijs naar 80% Grijs | ||
| 34 ms ... stijging ↗ en daling ↘ gecombineerd | ↗ 18 ms stijging | 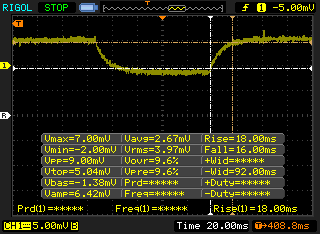 |
| ↘ 16 ms daling | ||
| Het scherm vertoonde trage responstijden in onze tests en is misschien te traag voor games. Ter vergelijking: alle testtoestellen variëren van 0.165 (minimum) tot 636 (maximum) ms. » 47 % van alle toestellen zijn beter. Dit betekent dat de gemeten responstijd vergelijkbaar is met het gemiddelde (31 ms) van alle geteste toestellen. | ||
Screen Flickering / PWM (Pulse-Width Modulation)
| Screen flickering / PWM niet waargenomen | 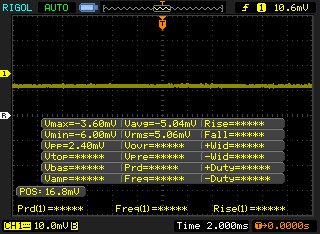 | ||
Ter vergelijking: 52 % van alle geteste toestellen maakten geen gebruik van PWM om de schermhelderheid te verlagen. Als het wel werd gebruikt, werd een gemiddelde van 7769 (minimum: 5 - maximum: 343500) Hz waargenomen. | |||
| wPrime 2.10 - 1024m | |
| MSI GF75 Thin 10SCXR | |
| Asus ROG Zephyrus G15 GA502DU | |
| Asus Zephyrus G14 GA401IV | |
* ... kleiner is beter
| PCMark 10 | |
| Score | |
| Asus ROG Strix G GL731GU-RB74 | |
| MSI GP75 Leopard 9SD | |
| MSI GF75 Thin 10SCXR | |
| MSI GF75 Thin 9SC | |
| MSI GF63 Thin 9SC | |
| Asus ROG Zephyrus G15 GA502DU | |
| Dell G3 15 3579 | |
| Essentials | |
| Asus ROG Strix G GL731GU-RB74 | |
| MSI GP75 Leopard 9SD | |
| MSI GF75 Thin 9SC | |
| MSI GF75 Thin 10SCXR | |
| MSI GF63 Thin 9SC | |
| Asus ROG Zephyrus G15 GA502DU | |
| Dell G3 15 3579 | |
| Productivity | |
| MSI GF75 Thin 10SCXR | |
| MSI GF75 Thin 9SC | |
| Asus ROG Strix G GL731GU-RB74 | |
| MSI GP75 Leopard 9SD | |
| MSI GF63 Thin 9SC | |
| Asus ROG Zephyrus G15 GA502DU | |
| Dell G3 15 3579 | |
| Digital Content Creation | |
| Asus ROG Strix G GL731GU-RB74 | |
| MSI GP75 Leopard 9SD | |
| MSI GF75 Thin 10SCXR | |
| MSI GF75 Thin 9SC | |
| MSI GF63 Thin 9SC | |
| Asus ROG Zephyrus G15 GA502DU | |
| Dell G3 15 3579 | |
| PCMark 8 | |
| Home Score Accelerated v2 | |
| Asus ROG Strix G GL731GU-RB74 | |
| MSI GF75 Thin 9SC | |
| Dell G3 15 3579 | |
| MSI GF75 Thin 10SCXR | |
| Asus ROG Zephyrus G15 GA502DU | |
| MSI GP75 Leopard 9SD | |
| Work Score Accelerated v2 | |
| Asus ROG Strix G GL731GU-RB74 | |
| MSI GP75 Leopard 9SD | |
| MSI GF75 Thin 9SC | |
| MSI GF75 Thin 10SCXR | |
| Asus ROG Zephyrus G15 GA502DU | |
| Dell G3 15 3579 | |
| PCMark 8 Home Score Accelerated v2 | 3797 punten | |
| PCMark 8 Work Score Accelerated v2 | 5276 punten | |
| PCMark 10 Score | 5301 punten | |
Help | ||
| DPC Latencies / LatencyMon - interrupt to process latency (max), Web, Youtube, Prime95 | |
| MSI GF75 Thin 10SCXR | |
* ... kleiner is beter
| MSI GF75 Thin 10SCXR WDC PC SN530 SDBPNPZ-512G | Acer Aspire Nitro 5 AN517-51-7887 WDC PC SN520 SDAPNUW-512G | MSI GF75 Thin 9SC Crucial P1 SSD CT1000P1SSD8 | MSI GP75 Leopard 9SD Kingston RBUSNS8154P3256GJ1 | Asus ROG Strix G GL731GU-RB74 Intel SSD 660p SSDPEKNW512G8 | |
|---|---|---|---|---|---|
| AS SSD | 42% | 30% | -45% | 22% | |
| Seq Read (MB/s) | 1007 | 1578 57% | 1079 7% | 748 -26% | 1319 31% |
| Seq Write (MB/s) | 1755 | 1381 -21% | 1566 -11% | 219 -88% | 930 -47% |
| 4K Read (MB/s) | 39.88 | 44.79 12% | 48.68 22% | 25.7 -36% | 49.43 24% |
| 4K Write (MB/s) | 111.6 | 108.7 -3% | 106.7 -4% | 82.4 -26% | 104.3 -7% |
| 4K-64 Read (MB/s) | 751 | 1045 39% | 656 -13% | 259.3 -65% | 321.9 -57% |
| 4K-64 Write (MB/s) | 402.6 | 1121 178% | 751 87% | 190.2 -53% | 774 92% |
| Access Time Read * (ms) | 0.084 | 0.083 1% | 0.044 48% | 0.159 -89% | 0.055 35% |
| Access Time Write * (ms) | 0.151 | 0.034 77% | 0.131 13% | 0.058 62% | 0.138 9% |
| Score Read (Points) | 892 | 1248 40% | 812 -9% | 360 -60% | 503 -44% |
| Score Write (Points) | 690 | 1368 98% | 1014 47% | 294 -57% | 971 41% |
| Score Total (Points) | 2085 | 3252 56% | 2281 9% | 821 -61% | 1731 -17% |
| Copy ISO MB/s (MB/s) | 1828 | 1254 -31% | 1414 -23% | 1707 -7% | |
| Copy Program MB/s (MB/s) | 307.2 | 443.8 44% | 531 73% | 852 177% | |
| Copy Game MB/s (MB/s) | 532 | 722 36% | 1483 179% | 930 75% | |
| CrystalDiskMark 5.2 / 6 | -15% | 7% | -41% | -6% | |
| Write 4K (MB/s) | 140.7 | 104.6 -26% | 133 -5% | 105.8 -25% | 127.6 -9% |
| Read 4K (MB/s) | 43.18 | 39.76 -8% | 55.6 29% | 27.89 -35% | 56 30% |
| Write Seq (MB/s) | 1829 | 1268 -31% | 1623 -11% | 270.8 -85% | 986 -46% |
| Read Seq (MB/s) | 1095 | 1414 29% | 1386 27% | 879 -20% | 1605 47% |
| Write 4K Q32T1 (MB/s) | 431.7 | 287.9 -33% | 501 16% | 273.3 -37% | 451.5 5% |
| Read 4K Q32T1 (MB/s) | 527 | 381.1 -28% | 584 11% | 361.2 -31% | 343.3 -35% |
| Write Seq Q32T1 (MB/s) | 1831 | 1319 -28% | 1696 -7% | 253 -86% | 983 -46% |
| Read Seq Q32T1 (MB/s) | 1708 | 1735 2% | 1572 -8% | 1505 -12% | 1810 6% |
| Write 4K Q8T8 (MB/s) | 768 | ||||
| Read 4K Q8T8 (MB/s) | 1090 | ||||
| Totaal Gemiddelde (Programma / Instellingen) | 14% /
21% | 19% /
22% | -43% /
-44% | 8% /
12% |
* ... kleiner is beter

| 3DMark 11 | |
| 1280x720 Performance GPU | |
| Eurocom Nightsky RX17 | |
| Walmart EVOO Gaming 17 | |
| MSI GP75 Leopard 9SD | |
| MSI Alpha 15 A3DDK-034 | |
| Gainward GeForce GTX 1650 4 GB | |
| MSI GF75 Thin 10SCXR | |
| Gemiddeld NVIDIA GeForce GTX 1650 Mobile (10885 - 13575, n=30) | |
| Asus Zephyrus S GX531GM | |
| Lenovo IdeaPad S740-15IRH | |
| HP Pavilion Gaming 15-ec0002ng | |
| Asus ZenBook Flip 15 UX563FD-A1027T | |
| 1280x720 Performance Combined | |
| Eurocom Nightsky RX17 | |
| Walmart EVOO Gaming 17 | |
| MSI GP75 Leopard 9SD | |
| Gainward GeForce GTX 1650 4 GB | |
| Lenovo IdeaPad S740-15IRH | |
| Gemiddeld NVIDIA GeForce GTX 1650 Mobile (5870 - 12662, n=28) | |
| MSI GF75 Thin 10SCXR | |
| MSI Alpha 15 A3DDK-034 | |
| Asus ZenBook Flip 15 UX563FD-A1027T | |
| HP Pavilion Gaming 15-ec0002ng | |
| Asus Zephyrus S GX531GM | |
| 3DMark 06 Standard Score | 34955 punten | |
| 3DMark 11 Performance | 11727 punten | |
| 3DMark Ice Storm Standard Score | 77860 punten | |
| 3DMark Cloud Gate Standard Score | 25707 punten | |
| 3DMark Fire Strike Score | 8581 punten | |
| 3DMark Time Spy Score | 3554 punten | |
Help | ||
| Shadow of the Tomb Raider | |
| 1280x720 Lowest Preset | |
| HP Omen 15-dc0015ng | |
| MSI GF75 Thin 9SC | |
| Dell G3 3590 | |
| Gemiddeld NVIDIA GeForce GTX 1650 Mobile (57 - 128, n=13) | |
| MSI GF75 Thin 10SCXR | |
| HP Pavilion Gaming 15-ec0017ng | |
| HP Pavilion Gaming 15-ec0002ng | |
| MSI PS63 Modern 8RC | |
| 1920x1080 Medium Preset | |
| HP Omen 15-dc0015ng | |
| Dell G3 3590 | |
| MSI GF75 Thin 10SCXR | |
| MSI GF75 Thin 9SC | |
| Gemiddeld NVIDIA GeForce GTX 1650 Mobile (42 - 63, n=14) | |
| HP Pavilion Gaming 15-ec0017ng | |
| HP Pavilion Gaming 15-ec0002ng | |
| MSI PS63 Modern 8RC | |
| 1920x1080 High Preset AA:SM | |
| HP Omen 15-dc0015ng | |
| MSI Alpha 15 A3DDK | |
| Asus TUF FX705GM | |
| HP Pavilion Gaming 15-ec0017ng | |
| MSI GF75 Thin 9SC | |
| Dell G3 3590 | |
| MSI GF75 Thin 10SCXR | |
| Gemiddeld NVIDIA GeForce GTX 1650 Mobile (38 - 53, n=15) | |
| HP Pavilion Gaming 15-ec0002ng | |
| MSI PS63 Modern 8RC | |
| 1920x1080 Highest Preset AA:T | |
| HP Omen 15-dc0015ng | |
| MSI Alpha 15 A3DDK | |
| HP Pavilion Gaming 15-ec0017ng | |
| Asus TUF FX705GM | |
| MSI GF75 Thin 9SC | |
| MSI GF75 Thin 10SCXR | |
| Gemiddeld NVIDIA GeForce GTX 1650 Mobile (34 - 47, n=15) | |
| HP Pavilion Gaming 15-ec0002ng | |
| MSI PS63 Modern 8RC | |
| The Witcher 3 | |
| 1024x768 Low Graphics & Postprocessing | |
| HP Omen 15-dc0015ng | |
| MSI GF75 Thin 9SC | |
| HP Pavilion Gaming 15-ec0017ng | |
| Dell G3 3590 | |
| MSI GF75 Thin 10SCXR | |
| Gemiddeld NVIDIA GeForce GTX 1650 Mobile (127 - 209, n=22) | |
| MSI Alpha 15 A3DDK | |
| HP Pavilion Gaming 15-ec0002ng | |
| 1920x1080 Ultra Graphics & Postprocessing (HBAO+) | |
| HP Omen 15-dc0015ng | |
| HP Pavilion Gaming 15-ec0017ng | |
| MSI Alpha 15 A3DDK | |
| MSI GF75 Thin 9SC | |
| MSI GF75 Thin 10SCXR | |
| Asus TUF FX705GM | |
| Dell G3 3590 | |
| Gemiddeld NVIDIA GeForce GTX 1650 Mobile (29.9 - 40.3, n=31) | |
| HP Pavilion Gaming 15-ec0002ng | |
| Rocket League | |
| 1280x720 Performance | |
| MSI GF75 Thin 10SCXR | |
| HP Pavilion Gaming 15-ec0017ng | |
| Dell G3 3590 | |
| Gemiddeld NVIDIA GeForce GTX 1650 Mobile (214 - 249, n=5) | |
| 1920x1080 Performance | |
| MSI GF75 Thin 10SCXR | |
| Gemiddeld NVIDIA GeForce GTX 1650 Mobile (189.8 - 228, n=3) | |
| 1920x1080 Quality AA:Medium FX | |
| HP Pavilion Gaming 15-ec0017ng | |
| MSI GF75 Thin 10SCXR | |
| Gemiddeld NVIDIA GeForce GTX 1650 Mobile (152.5 - 229, n=6) | |
| Dell G3 3590 | |
| 1920x1080 High Quality AA:High FX | |
| MSI Alpha 15 A3DDK | |
| HP Pavilion Gaming 15-ec0017ng | |
| MSI GF75 Thin 10SCXR | |
| Dell G3 3590 | |
| Gemiddeld NVIDIA GeForce GTX 1650 Mobile (96.4 - 162.2, n=6) | |
| lage | gem. | hoge | ultra | |
|---|---|---|---|---|
| BioShock Infinite (2013) | 241.5 | 212.7 | 200.1 | 93.6 |
| The Witcher 3 (2015) | 169.4 | 116.6 | 70.4 | 37.7 |
| Dota 2 Reborn (2015) | 117 | 104 | 93.7 | 87.5 |
| Rocket League (2017) | 248.4 | 198.5 | 162.2 | |
| X-Plane 11.11 (2018) | 75.7 | 65.1 | 57.4 | |
| Shadow of the Tomb Raider (2018) | 88 | 60 | 51 | 44 |
| MSI GF75 Thin 10SCXR GeForce GTX 1650 Mobile, i5-10300H, WDC PC SN530 SDBPNPZ-512G | Acer Aspire Nitro 5 AN517-51-7887 GeForce GTX 1660 Ti Mobile, i7-9750H, WDC PC SN520 SDAPNUW-512G | MSI GF75 Thin 9SC GeForce GTX 1650 Mobile, i7-9750H, Crucial P1 SSD CT1000P1SSD8 | MSI GP75 Leopard 9SD GeForce GTX 1660 Ti Mobile, i7-9750H, Kingston RBUSNS8154P3256GJ1 | Asus ROG Strix G GL731GU-RB74 GeForce GTX 1660 Ti Mobile, i7-9750H, Intel SSD 660p SSDPEKNW512G8 | Lenovo Ideapad L340-17IRH 81LL001YGE GeForce GTX 1650 Mobile, i5-9300H, WDC PC SN520 SDAPMUW-512 | |
|---|---|---|---|---|---|---|
| Noise | -3% | -1% | -14% | -11% | 2% | |
| uit / omgeving * (dB) | 28.4 | 30 -6% | 28.2 1% | 29 -2% | 28.2 1% | 30 -6% |
| Idle Minimum * (dB) | 33 | 30.2 8% | 33.6 -2% | 29 12% | 31.8 4% | 30 9% |
| Idle Average * (dB) | 33 | 30.2 8% | 33.6 -2% | 34 -3% | 32 3% | 30 9% |
| Idle Maximum * (dB) | 33.1 | 31 6% | 33.8 -2% | 37 -12% | 40.6 -23% | 30.4 8% |
| Load Average * (dB) | 37.7 | 43.4 -15% | 37.2 1% | 53 -41% | 48 -27% | 40.9 -8% |
| Witcher 3 ultra * (dB) | 39.2 | 48.5 -24% | 40.6 -4% | 51 -30% | 48 -22% | 43.8 -12% |
| Load Maximum * (dB) | 46 | 45.5 1% | 44.4 3% | 55 -20% | 51.5 -12% | 40.9 11% |
* ... kleiner is beter
Geluidsniveau
| Onbelast |
| 33 / 33 / 33.1 dB (A) |
| Belasting |
| 37.7 / 46 dB (A) |
 | ||
30 dB stil 40 dB(A) hoorbaar 50 dB(A) luid |
||
min: | ||
(±) De maximumtemperatuur aan de bovenzijde bedraagt 42 °C / 108 F, vergeleken met het gemiddelde van 40.4 °C / 105 F, variërend van 21.2 tot 68.8 °C voor de klasse Gaming.
(-) De bodem warmt op tot een maximum van 53.4 °C / 128 F, vergeleken met een gemiddelde van 43.2 °C / 110 F
(+) Bij onbelast gebruik bedraagt de gemiddelde temperatuur voor de bovenzijde 31.5 °C / 89 F, vergeleken met het apparaatgemiddelde van 33.9 °C / 93 F.
(+) Bij het spelen van The Witcher 3 is de gemiddelde temperatuur voor de bovenzijde 31.3 °C / 88 F, vergeleken met het apparaatgemiddelde van 33.9 °C / 93 F.
(+) De palmsteunen en het touchpad zijn met een maximum van ###max## °C / 84.2 F koeler dan de huidtemperatuur en voelen daarom koel aan.
(±) De gemiddelde temperatuur van de handpalmsteun van soortgelijke toestellen bedroeg 28.8 °C / 83.8 F (-0.2 °C / -0.4 F).
MSI GF75 Thin 10SCXR audioanalyse
(+) | luidsprekers kunnen relatief luid spelen (83.6 dB)
Bas 100 - 315 Hz
(-) | bijna geen lage tonen - gemiddeld 18.5% lager dan de mediaan
(±) | lineariteit van de lage tonen is gemiddeld (14.2% delta ten opzichte van de vorige frequentie)
Midden 400 - 2000 Hz
(+) | evenwichtige middens - slechts 2.2% verwijderd van de mediaan
(±) | lineariteit van de middentonen is gemiddeld (7.7% delta ten opzichte van de vorige frequentie)
Hoog 2 - 16 kHz
(+) | evenwichtige hoogtepunten - slechts 3.4% verwijderd van de mediaan
(±) | lineariteit van de hoogtepunten is gemiddeld (9.4% delta ten opzichte van de vorige frequentie)
Algemeen 100 - 16.000 Hz
(±) | lineariteit van het totale geluid is gemiddeld (18.2% verschil met de mediaan)
Vergeleken met dezelfde klasse
» 57% van alle geteste apparaten in deze klasse waren beter, 8% vergelijkbaar, 35% slechter
» De beste had een delta van 6%, het gemiddelde was 18%, de slechtste was 132%
Vergeleken met alle geteste toestellen
» 39% van alle geteste apparaten waren beter, 8% gelijk, 53% slechter
» De beste had een delta van 4%, het gemiddelde was 24%, de slechtste was 134%
Apple MacBook 12 (Early 2016) 1.1 GHz audioanalyse
(+) | luidsprekers kunnen relatief luid spelen (83.6 dB)
Bas 100 - 315 Hz
(±) | verminderde zeebaars - gemiddeld 11.3% lager dan de mediaan
(±) | lineariteit van de lage tonen is gemiddeld (14.2% delta ten opzichte van de vorige frequentie)
Midden 400 - 2000 Hz
(+) | evenwichtige middens - slechts 2.4% verwijderd van de mediaan
(+) | de middentonen zijn lineair (5.5% delta ten opzichte van de vorige frequentie)
Hoog 2 - 16 kHz
(+) | evenwichtige hoogtepunten - slechts 2% verwijderd van de mediaan
(+) | de hoge tonen zijn lineair (4.5% delta naar de vorige frequentie)
Algemeen 100 - 16.000 Hz
(+) | het totale geluid is lineair (10.2% verschil met de mediaan)
Vergeleken met dezelfde klasse
» 7% van alle geteste apparaten in deze klasse waren beter, 2% vergelijkbaar, 91% slechter
» De beste had een delta van 5%, het gemiddelde was 18%, de slechtste was 53%
Vergeleken met alle geteste toestellen
» 5% van alle geteste apparaten waren beter, 1% gelijk, 94% slechter
» De beste had een delta van 4%, het gemiddelde was 24%, de slechtste was 134%
| Uit / Standby | |
| Inactief | |
| Belasting |
|
Key:
min: | |
| MSI GF75 Thin 10SCXR i5-10300H, GeForce GTX 1650 Mobile, WDC PC SN530 SDBPNPZ-512G, IPS, 1920x1080, 17.3" | Acer Aspire Nitro 5 AN517-51-7887 i7-9750H, GeForce GTX 1660 Ti Mobile, WDC PC SN520 SDAPNUW-512G, IPS, 1920x1080, 17.3" | MSI GF75 Thin 9SC i7-9750H, GeForce GTX 1650 Mobile, Crucial P1 SSD CT1000P1SSD8, IPS, 1920x1080, 17.3" | MSI GP75 Leopard 9SD i7-9750H, GeForce GTX 1660 Ti Mobile, Kingston RBUSNS8154P3256GJ1, IPS, 1920x1080, 17.3" | Asus ROG Strix G GL731GU-RB74 i7-9750H, GeForce GTX 1660 Ti Mobile, Intel SSD 660p SSDPEKNW512G8, IPS, 1920x1080, 17.3" | Lenovo Ideapad L340-17IRH 81LL001YGE i5-9300H, GeForce GTX 1650 Mobile, WDC PC SN520 SDAPMUW-512, IPS, 1920x1080, 17.3" | HP Pavilion Gaming 17-cd0085cl i7-9750H, GeForce GTX 1660 Ti Max-Q, Samsung SSD PM981 MZVLB256HAHQ, IPS, 1920x1080, 17.3" | |
|---|---|---|---|---|---|---|---|
| Power Consumption | 18% | 2% | -15% | -41% | 34% | 17% | |
| Idle Minimum * (Watt) | 13 | 3.9 70% | 6.1 53% | 10 23% | 13.6 -5% | 3.4 74% | 5.4 58% |
| Idle Average * (Watt) | 15.7 | 8.9 43% | 11.2 29% | 15 4% | 26.2 -67% | 7.7 51% | 9.2 41% |
| Idle Maximum * (Watt) | 21 | 12.2 42% | 24.5 -17% | 22 -5% | 35 -67% | 9.6 54% | 13 38% |
| Load Average * (Watt) | 87 | 83 5% | 94.7 -9% | 92 -6% | 113.6 -31% | 75 14% | 85.9 1% |
| Witcher 3 ultra * (Watt) | 96.4 | 130 -35% | 105.8 -10% | 153 -59% | 134.1 -39% | 92 5% | 107.9 -12% |
| Load Maximum * (Watt) | 145.8 | 168 -15% | 192.2 -32% | 216 -48% | 200.2 -37% | 135 7% | 182.2 -25% |
* ... kleiner is beter
| MSI GF75 Thin 10SCXR i5-10300H, GeForce GTX 1650 Mobile, 51 Wh | Acer Aspire Nitro 5 AN517-51-7887 i7-9750H, GeForce GTX 1660 Ti Mobile, 57 Wh | MSI GF75 Thin 9SC i7-9750H, GeForce GTX 1650 Mobile, 51 Wh | MSI GP75 Leopard 9SD i7-9750H, GeForce GTX 1660 Ti Mobile, 51 Wh | Asus ROG Strix G GL731GU-RB74 i7-9750H, GeForce GTX 1660 Ti Mobile, 66 Wh | Lenovo Ideapad L340-17IRH 81LL001YGE i5-9300H, GeForce GTX 1650 Mobile, 45 Wh | |
|---|---|---|---|---|---|---|
| Batterijduur | 54% | 0% | -38% | 20% | 32% | |
| Reader / Idle (h) | 7.7 | 13.4 74% | 4.8 -38% | 8.6 12% | ||
| WiFi v1.3 (h) | 4.7 | 6.2 32% | 4.7 0% | 3.2 -32% | 4.9 4% | 6.2 32% |
| Load (h) | 1.1 | 1.7 55% | 0.6 -45% | 1.6 45% |
Pro
Contra
Voor het volledige, Engelse testrapport, klik hier.
Het beste deel van de 2020 MSI GF75 10SCXR is dat het 2019-model nu goedkoper is. De Core i5-9300H van vorig jaar staat net achter de Core i5-10300H tot het punt waarop het verschil in prestaties tussen deze twee onmerkbaar is tijdens het gamen. Dat is geweldig nieuws als je een upgrade uitvoert van een veel oudere gaming-laptop, omdat je hierdoor geld kunt besparen door een 9e generatie Core i5-laptop te kopen in plaats van een 10e generatie zonder de prestaties op te offeren.
Wat de laptop zelf betreft, zijn de beste kenmerken het lage gewicht, het kleine formaat en relatief stille ventilatoren tijdens het gamen. Het model is misschien niet zo slank als de GS75, maar het is moeilijk om te argumenteren tegen de lage prijs en de snelle verversingssnelheid van 120 Hz. We raden aan om 16 GB RAM te krijgen in plaats van slechts 8 GB op het model van 2019 en om bij de klantenservice te controleren of eenvoudige RAM- en HDD-upgrades mogelijk zijn, omdat je hiervoor een garantiesticker moet breken. Houd ook een muis bij de hand om de sponsachtige clickpad te vermijden.
Een kleine vernieuwing van de prestaties van het model van vorig jaar. Je kan beter investeren in een 9e generatie Core i5-gaminglaptop in plaats van deze 10e generatie om meer waar voor je geld te krijgen.
MSI GF75 Thin 10SCXR
- 24-04-2020 v7 (old)
Allen Ngo
Price comparison
