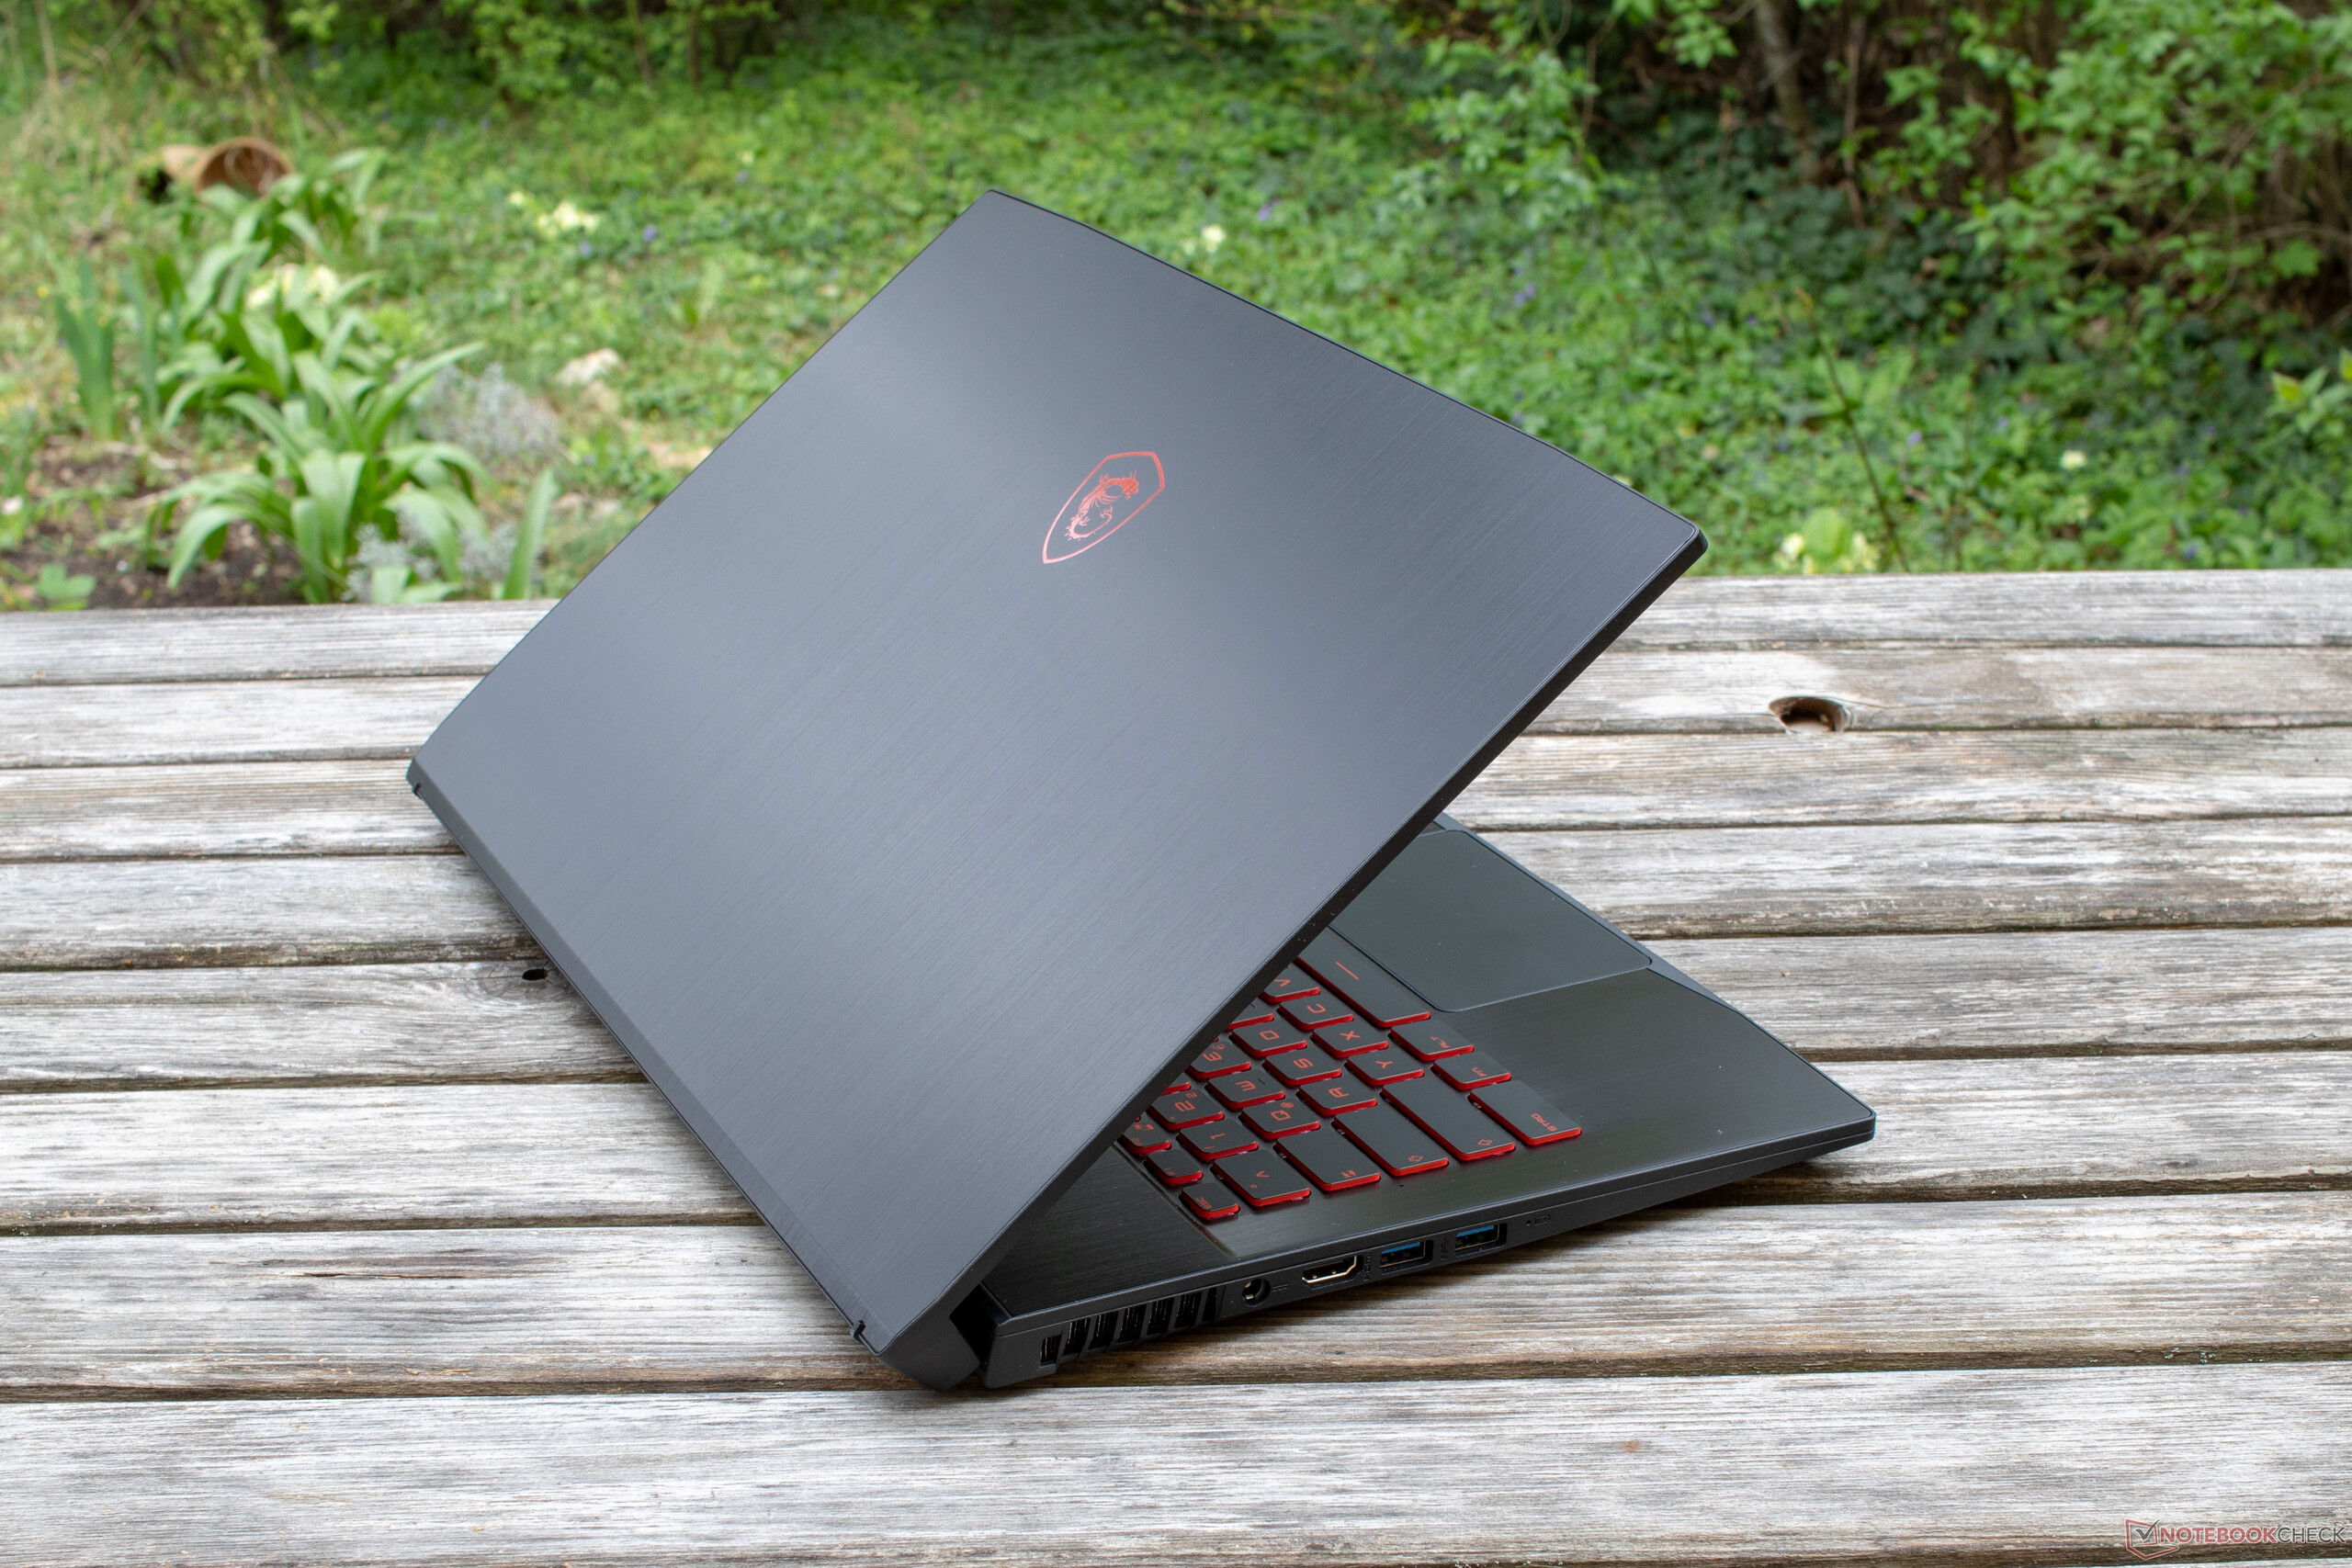
Kort testrapport MSI GF75 Thin 3RD (i7-8750H, GTX 1050Ti Max-Q) Laptop


| Networking | |
| iperf3 transmit AX12 | |
| HP Pavilion Gaming 15-cx0003ng | |
| Asus TUF FX705GE-EW096T | |
| Medion Erazer P6705-MD61131 | |
| Acer Aspire 7 A715-72G-704Q | |
| Lenovo Legion Y730-17ICH, i7-8750H | |
| MSI GF75 8RD-001 | |
| iperf3 receive AX12 | |
| Medion Erazer P6705-MD61131 | |
| Asus TUF FX705GE-EW096T | |
| Lenovo Legion Y730-17ICH, i7-8750H | |
| HP Pavilion Gaming 15-cx0003ng | |
| Acer Aspire 7 A715-72G-704Q | |
| MSI GF75 8RD-001 | |
| |||||||||||||||||||||||||
Helderheidsverdeling: 89 %
Helderheid in Batterij-modus: 356 cd/m²
Contrast: 1319:1 (Zwart: 0.27 cd/m²)
ΔE ColorChecker Calman: 2.73 | ∀{0.5-29.43 Ø4.73}
calibrated: 2.14
ΔE Greyscale Calman: 2.38 | ∀{0.09-98 Ø4.97}
90% sRGB (Argyll 1.6.3 3D)
59% AdobeRGB 1998 (Argyll 1.6.3 3D)
65.2% AdobeRGB 1998 (Argyll 3D)
90.1% sRGB (Argyll 3D)
64% Display P3 (Argyll 3D)
Gamma: 2.48
CCT: 6643 K
| MSI GF75 8RD-001 B173HAN04.2, , 1920x1080, 17.3" | Asus TUF FX705GE-EW096T AU Optronics B173HAN04.2, , 1920x1080, 17.3" | Lenovo Legion Y730-17ICH, i7-8750H LP173WF4-SPF6, , 1920x1080, 17.3" | Medion Erazer P6705-MD61131 AU Optronics B156HTN03.8 (AUO38ED), , 1920x1080, 15.6" | HP Pavilion Gaming 15-cx0003ng BOE07A1, , 1920x1080, 15.6" | Acer Aspire 7 A715-72G-704Q LG Philips LP156WFC-SPP1, , 1920x1080, 15.6" | |
|---|---|---|---|---|---|---|
| Display | -3% | -2% | -41% | -36% | -38% | |
| Display P3 Coverage (%) | 64 | 63.1 -1% | 66.4 4% | 36.4 -43% | 39.72 -38% | 38.34 -40% |
| sRGB Coverage (%) | 90.1 | 86.8 -4% | 84.9 -6% | 54.8 -39% | 59.3 -34% | 57.5 -36% |
| AdobeRGB 1998 Coverage (%) | 65.2 | 63.5 -3% | 62.1 -5% | 37.61 -42% | 41.04 -37% | 39.65 -39% |
| Response Times | -2% | 9% | 13% | -18% | 11% | |
| Response Time Grey 50% / Grey 80% * (ms) | 38 ? | 39 ? -3% | 36.8 ? 3% | 44.8 ? -18% | 47 ? -24% | 35 ? 8% |
| Response Time Black / White * (ms) | 28 ? | 28 ? -0% | 24 ? 14% | 16 ? 43% | 31 ? -11% | 24 ? 14% |
| PWM Frequency (Hz) | 208 ? | |||||
| Screen | -9% | -47% | -124% | -36% | -55% | |
| Brightness middle (cd/m²) | 356 | 299 -16% | 328.7 -8% | 200 -44% | 241 -32% | 280 -21% |
| Brightness (cd/m²) | 332 | 291 -12% | 318 -4% | 186 -44% | 236 -29% | 248 -25% |
| Brightness Distribution (%) | 89 | 90 1% | 91 2% | 85 -4% | 75 -16% | 81 -9% |
| Black Level * (cd/m²) | 0.27 | 0.28 -4% | 0.51 -89% | 0.43 -59% | 0.15 44% | 0.56 -107% |
| Contrast (:1) | 1319 | 1068 -19% | 645 -51% | 465 -65% | 1607 22% | 500 -62% |
| Colorchecker dE 2000 * | 2.73 | 3.02 -11% | 4.91 -80% | 11.39 -317% | 4.85 -78% | 4.75 -74% |
| Colorchecker dE 2000 max. * | 4.7 | 5.27 -12% | 10.15 -116% | 19.36 -312% | 8.82 -88% | 8.04 -71% |
| Colorchecker dE 2000 calibrated * | 2.14 | 2.76 -29% | 4.27 -100% | 3.05 -43% | 4.93 -130% | |
| Greyscale dE 2000 * | 2.38 | 2.18 8% | 3.9 -64% | 11.73 -393% | 5.15 -116% | 3.21 -35% |
| Gamma | 2.48 89% | 2.48 89% | 2.13 103% | 1.97 112% | 2.49 88% | 2.59 85% |
| CCT | 6643 98% | 6392 102% | 6911 94% | 12614 52% | 7042 92% | 6601 98% |
| Color Space (Percent of AdobeRGB 1998) (%) | 59 | 57 -3% | 55.6 -6% | 35 -41% | 38 -36% | 36 -39% |
| Color Space (Percent of sRGB) (%) | 90 | 87 -3% | 84.7 -6% | 55 -39% | 59 -34% | 57 -37% |
| Totaal Gemiddelde (Programma / Instellingen) | -5% /
-7% | -13% /
-32% | -51% /
-91% | -30% /
-34% | -27% /
-44% |
* ... kleiner is beter
Responstijd Scherm
| ↔ Responstijd Zwart naar Wit | ||
|---|---|---|
| 28 ms ... stijging ↗ en daling ↘ gecombineerd | ↗ 16 ms stijging | 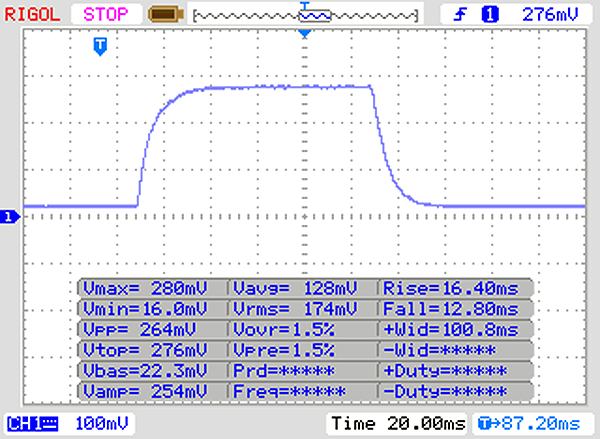 |
| ↘ 12 ms daling | ||
| Het scherm vertoonde relatief trage responstijden in onze tests en is misschien te traag voor games. Ter vergelijking: alle testtoestellen variëren van 0.1 (minimum) tot 240 (maximum) ms. » 71 % van alle toestellen zijn beter. Dit betekent dat de gemeten responstijd slechter is dan het gemiddelde (19.9 ms) van alle geteste toestellen. | ||
| ↔ Responstijd 50% Grijs naar 80% Grijs | ||
| 38 ms ... stijging ↗ en daling ↘ gecombineerd | ↗ 18 ms stijging | 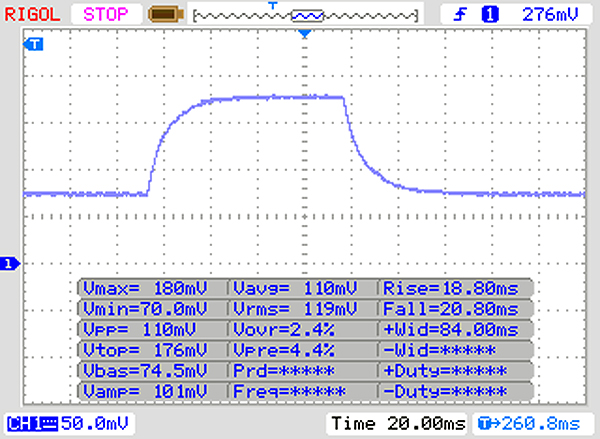 |
| ↘ 20 ms daling | ||
| Het scherm vertoonde trage responstijden in onze tests en is misschien te traag voor games. Ter vergelijking: alle testtoestellen variëren van 0.165 (minimum) tot 636 (maximum) ms. » 55 % van alle toestellen zijn beter. Dit betekent dat de gemeten responstijd slechter is dan het gemiddelde (31.1 ms) van alle geteste toestellen. | ||
Screen Flickering / PWM (Pulse-Width Modulation)
| Screen flickering / PWM niet waargenomen | 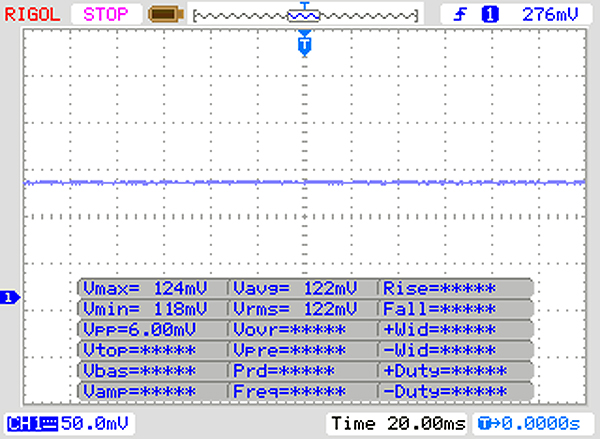 | ||
Ter vergelijking: 52 % van alle geteste toestellen maakten geen gebruik van PWM om de schermhelderheid te verlagen. Als het wel werd gebruikt, werd een gemiddelde van 7794 (minimum: 5 - maximum: 343500) Hz waargenomen. | |||
| PCMark 8 | |
| Home Score Accelerated v2 | |
| Gemiddelde van klas Gaming (n=1laatste 2 jaar) | |
| HP Pavilion Gaming 15-cx0003ng | |
| MSI GL73 8RD-418US | |
| Asus TUF FX705GE-EW096T | |
| Lenovo Legion Y730-17ICH, i7-8750H | |
| Acer Aspire 7 A715-72G-704Q | |
| Medion Erazer P6705-MD61131 | |
| MSI GF75 8RD-001 | |
| MSI GF63 8RC | |
| Gemiddeld Intel Core i7-8750H, NVIDIA GeForce GTX 1050 Ti Max-Q (3494 - 3969, n=4) | |
| Work Score Accelerated v2 | |
| Asus TUF FX705GE-EW096T | |
| MSI GL73 8RD-418US | |
| Medion Erazer P6705-MD61131 | |
| Lenovo Legion Y730-17ICH, i7-8750H | |
| MSI GF75 8RD-001 | |
| Acer Aspire 7 A715-72G-704Q | |
| HP Pavilion Gaming 15-cx0003ng | |
| MSI GF63 8RC | |
| Gemiddeld Intel Core i7-8750H, NVIDIA GeForce GTX 1050 Ti Max-Q (4316 - 5317, n=4) | |
| Gemiddelde van klas Gaming (n=1laatste 2 jaar) | |
| PCMark 8 Home Score Accelerated v2 | 3969 punten | |
| PCMark 8 Work Score Accelerated v2 | 5317 punten | |
| PCMark 10 Score | 4437 punten | |
Help | ||
| MSI GF75 8RD-001 Kingston RBUSNS8154P3256GJ1 | Asus TUF FX705GE-EW096T SK hynix BC501 HFM128GDJTNG-831 | Lenovo Legion Y730-17ICH, i7-8750H Toshiba KBG30ZMT128G | Medion Erazer P6705-MD61131 Samsung SSD PM981 MZVLB256HAHQ | HP Pavilion Gaming 15-cx0003ng Intel Optane 16 GB MEMPEK1J016GAH + HGST HTS721010A9E630 1 TB HDD | Acer Aspire 7 A715-72G-704Q Intel SSD 760p SSDPEKKW256G8 | Gemiddeld Kingston RBUSNS8154P3256GJ1 | |
|---|---|---|---|---|---|---|---|
| CrystalDiskMark 5.2 / 6 | -13% | -39% | 62% | -7% | 37% | 47% | |
| Write 4K (MB/s) | 72.1 | 90.3 25% | 71.4 -1% | 107 48% | 59.2 -18% | 103.4 43% | 141.1 ? 96% |
| Read 4K (MB/s) | 28.12 | 37.03 32% | 29.98 7% | 39.91 42% | 91.3 225% | 56 99% | 82.4 ? 193% |
| Write Seq (MB/s) | 746 | 320.3 -57% | 129.6 -83% | 1439 93% | 158.3 -79% | 808 8% | 722 ? -3% |
| Read Seq (MB/s) | 834 | 1012 21% | 843 1% | 2011 141% | 880 6% | 1939 132% | 974 ? 17% |
| Write 4K Q32T1 (MB/s) | 313.7 | 196.8 -37% | 88.9 -72% | 282.1 -10% | 161.8 -48% | 281.3 -10% | 418 ? 33% |
| Read 4K Q32T1 (MB/s) | 348.7 | 271.5 -22% | 196.4 -44% | 326.6 -6% | 286.5 -18% | 326.5 -6% | 571 ? 64% |
| Write Seq Q32T1 (MB/s) | 854 | 268.8 -69% | 130.5 -85% | 1441 69% | 159.8 -81% | 474.1 -44% | 717 ? -16% |
| Read Seq Q32T1 (MB/s) | 1587 | 1595 1% | 1037 -35% | 3516 122% | 929 -41% | 2735 72% | 1413 ? -11% |
| AS SSD | -56% | -147% | 12% | -1524% | 4% | -11% | |
| Seq Read (MB/s) | 1416 | 878 -38% | 979 -31% | 2724 92% | 854 -40% | 2493 76% | 1195 ? -16% |
| Seq Write (MB/s) | 798 | 336.8 -58% | 125.4 -84% | 1365 71% | 147 -82% | 1241 56% | 668 ? -16% |
| 4K Read (MB/s) | 38.92 | 23.76 -39% | 19.73 -49% | 46.14 19% | 105.1 170% | 41.22 6% | 33.6 ? -14% |
| 4K Write (MB/s) | 100.1 | 92 -8% | 38.73 -61% | 102.6 2% | 59.5 -41% | 112.4 12% | 82.6 ? -17% |
| 4K-64 Read (MB/s) | 726 | 248.9 -66% | 168.6 -77% | 567 -22% | 42.09 -94% | 522 -28% | 667 ? -8% |
| 4K-64 Write (MB/s) | 584 | 112.5 -81% | 31.38 -95% | 459.8 -21% | 137.3 -76% | 470.7 -19% | 561 ? -4% |
| Access Time Read * (ms) | 0.072 | 0.141 -96% | 0.519 -621% | 0.08 -11% | 14.99 -20719% | 0.058 19% | 0.117 ? -63% |
| Access Time Write * (ms) | 0.044 | 0.054 -23% | 0.324 -636% | 0.037 16% | 0.043 2% | 0.099 -125% | 0.05571 ? -27% |
| Score Read (Points) | 907 | 360 -60% | 286 -68% | 886 -2% | 233 -74% | 812 -10% | 820 ? -10% |
| Score Write (Points) | 764 | 238 -69% | 86 -89% | 699 -9% | 211 -72% | 707 -7% | 710 ? -7% |
| Score Total (Points) | 2112 | 764 -64% | 479 -77% | 1983 -6% | 577 -73% | 1883 -11% | 1931 ? -9% |
| Copy ISO MB/s (MB/s) | 608 | 224.1 -63% | 272.7 -55% | 110.1 -82% | 968 59% | 773 ? 27% | |
| Copy Program MB/s (MB/s) | 350.7 | 111.9 -68% | 182.9 -48% | 94.1 -73% | 319.4 -9% | 375 ? 7% | |
| Copy Game MB/s (MB/s) | 478.7 | 229.2 -52% | 134.6 -72% | 81.7 -83% | 648 35% | 509 ? 6% | |
| Totaal Gemiddelde (Programma / Instellingen) | -35% /
-41% | -93% /
-108% | 37% /
33% | -766% /
-972% | 21% /
16% | 18% /
10% |
* ... kleiner is beter

| 3DMark 11 Performance | 9171 punten | |
| 3DMark Cloud Gate Standard Score | 28253 punten | |
| 3DMark Fire Strike Score | 6714 punten | |
Help | ||
| The Witcher 3 | |
| 1920x1080 High Graphics & Postprocessing (Nvidia HairWorks Off) | |
| Gemiddelde van klas Gaming (181 - 341, n=3, laatste 2 jaar) | |
| Schenker XMG Neo 17 | |
| Gigabyte Aero 15-Y9 | |
| MSI GF75 8RD-001 | |
| Lenovo Legion Y730-17ICH, i7-8750H | |
| Acer Aspire 7 A715-72G-704Q | |
| Gemiddeld NVIDIA GeForce GTX 1050 Ti Max-Q (42.6 - 60, n=6) | |
| Asus TUF FX705GE-EW096T | |
| HP Spectre x360 15-df0126ng | |
| Medion Erazer P6705-MD61131 | |
| HP Pavilion Gaming 15-cx0003ng | |
| Acer Aspire 5 A515-52G-723L | |
| 1920x1080 Ultra Graphics & Postprocessing (HBAO+) | |
| Gemiddelde van klas Gaming (95 - 240, n=8, laatste 2 jaar) | |
| MSI GS75 8SG Stealth | |
| Schenker XMG Neo 17 | |
| Gigabyte Aero 15-Y9 | |
| MSI GF75 8RD-001 | |
| Acer Aspire 7 A715-72G-704Q | |
| Gemiddeld NVIDIA GeForce GTX 1050 Ti Max-Q (23.5 - 43, n=7) | |
| Lenovo Legion Y730-17ICH, i7-8750H | |
| Asus TUF FX705GE-EW096T | |
| HP Spectre x360 15-df0126ng | |
| Medion Erazer P6705-MD61131 | |
| HP Pavilion Gaming 15-cx0003ng | |
| Acer Aspire 5 A515-52G-723L | |
| Far Cry New Dawn | |
| 1920x1080 High Preset | |
| MSI GS75 8SG Stealth | |
| Schenker XMG Neo 17 | |
| Gigabyte Aero 15-Y9 | |
| MSI GF75 8RD-001 | |
| Gemiddeld NVIDIA GeForce GTX 1050 Ti Max-Q (43 - 46, n=2) | |
| HP Spectre x360 15-df0126ng | |
| MSI GE72 7RE | |
| Acer Aspire 5 A515-52G-723L | |
| 1920x1080 Ultra Preset | |
| MSI GS75 8SG Stealth | |
| Schenker XMG Neo 17 | |
| Gigabyte Aero 15-Y9 | |
| MSI GF75 8RD-001 | |
| Gemiddeld NVIDIA GeForce GTX 1050 Ti Max-Q (40 - 43, n=2) | |
| HP Spectre x360 15-df0126ng | |
| MSI GE72 7RE | |
| Acer Aspire 5 A515-52G-723L | |
| 2560x1440 Ultra Preset | |
| Schenker XMG Neo 17 | |
| MSI GF75 8RD-001 | |
| Gemiddeld NVIDIA GeForce GTX 1050 Ti Max-Q (n=1) | |
| MSI GE72 7RE | |
| 3840x2160 Ultra Preset | |
| Schenker XMG Neo 17 | |
| Gigabyte Aero 15-Y9 | |
| MSI GF75 8RD-001 | |
| Gemiddeld NVIDIA GeForce GTX 1050 Ti Max-Q (14 - 15, n=2) | |
| HP Spectre x360 15-df0126ng | |
| MSI GE72 7RE | |
| Metro Exodus | |
| 1920x1080 Medium Quality AF:4x | |
| Schenker XMG Neo 17 | |
| Gigabyte Aero 15-Y9 | |
| HP Spectre x360 15-df0126ng | |
| Gemiddeld NVIDIA GeForce GTX 1050 Ti Max-Q (31.4 - 49.8, n=2) | |
| MSI GF75 8RD-001 | |
| MSI GE72 7RE | |
| Acer Aspire 5 A515-52G-723L | |
| Lenovo V145-15AST | |
| 1920x1080 High Quality AF:16x | |
| MSI GS75 8SG Stealth | |
| Schenker XMG Neo 17 | |
| Gigabyte Aero 15-Y9 | |
| HP Spectre x360 15-df0126ng | |
| Gemiddeld NVIDIA GeForce GTX 1050 Ti Max-Q (23.5 - 36.5, n=2) | |
| MSI GF75 8RD-001 | |
| MSI GE72 7RE | |
| Acer Aspire 5 A515-52G-723L | |
| 1920x1080 Ultra Quality AF:16x | |
| Schenker XMG Neo 17 | |
| MSI GS75 8SG Stealth | |
| Gigabyte Aero 15-Y9 | |
| HP Spectre x360 15-df0126ng | |
| Gemiddeld NVIDIA GeForce GTX 1050 Ti Max-Q (19.3 - 28.3, n=2) | |
| MSI GF75 8RD-001 | |
| MSI GE72 7RE | |
| Acer Aspire 5 A515-52G-723L | |
| lage | gem. | hoge | ultra | QHD | 4K | |
|---|---|---|---|---|---|---|
| The Witcher 3 (2015) | 145 | 99 | 60 | 43 | ||
| Final Fantasy XV Benchmark (2018) | 75.1 | 37.7 | 25 | |||
| Far Cry New Dawn (2019) | 89 | 50 | 46 | 43 | 29 | 15 |
| Metro Exodus (2019) | 60.4 | 31.4 | 23.5 | 19.3 |
Geluidsniveau
| Onbelast |
| 32 / 32 / 32.1 dB (A) |
| Belasting |
| 33.6 / 40.6 dB (A) |
 | ||
30 dB stil 40 dB(A) hoorbaar 50 dB(A) luid |
||
min: | ||
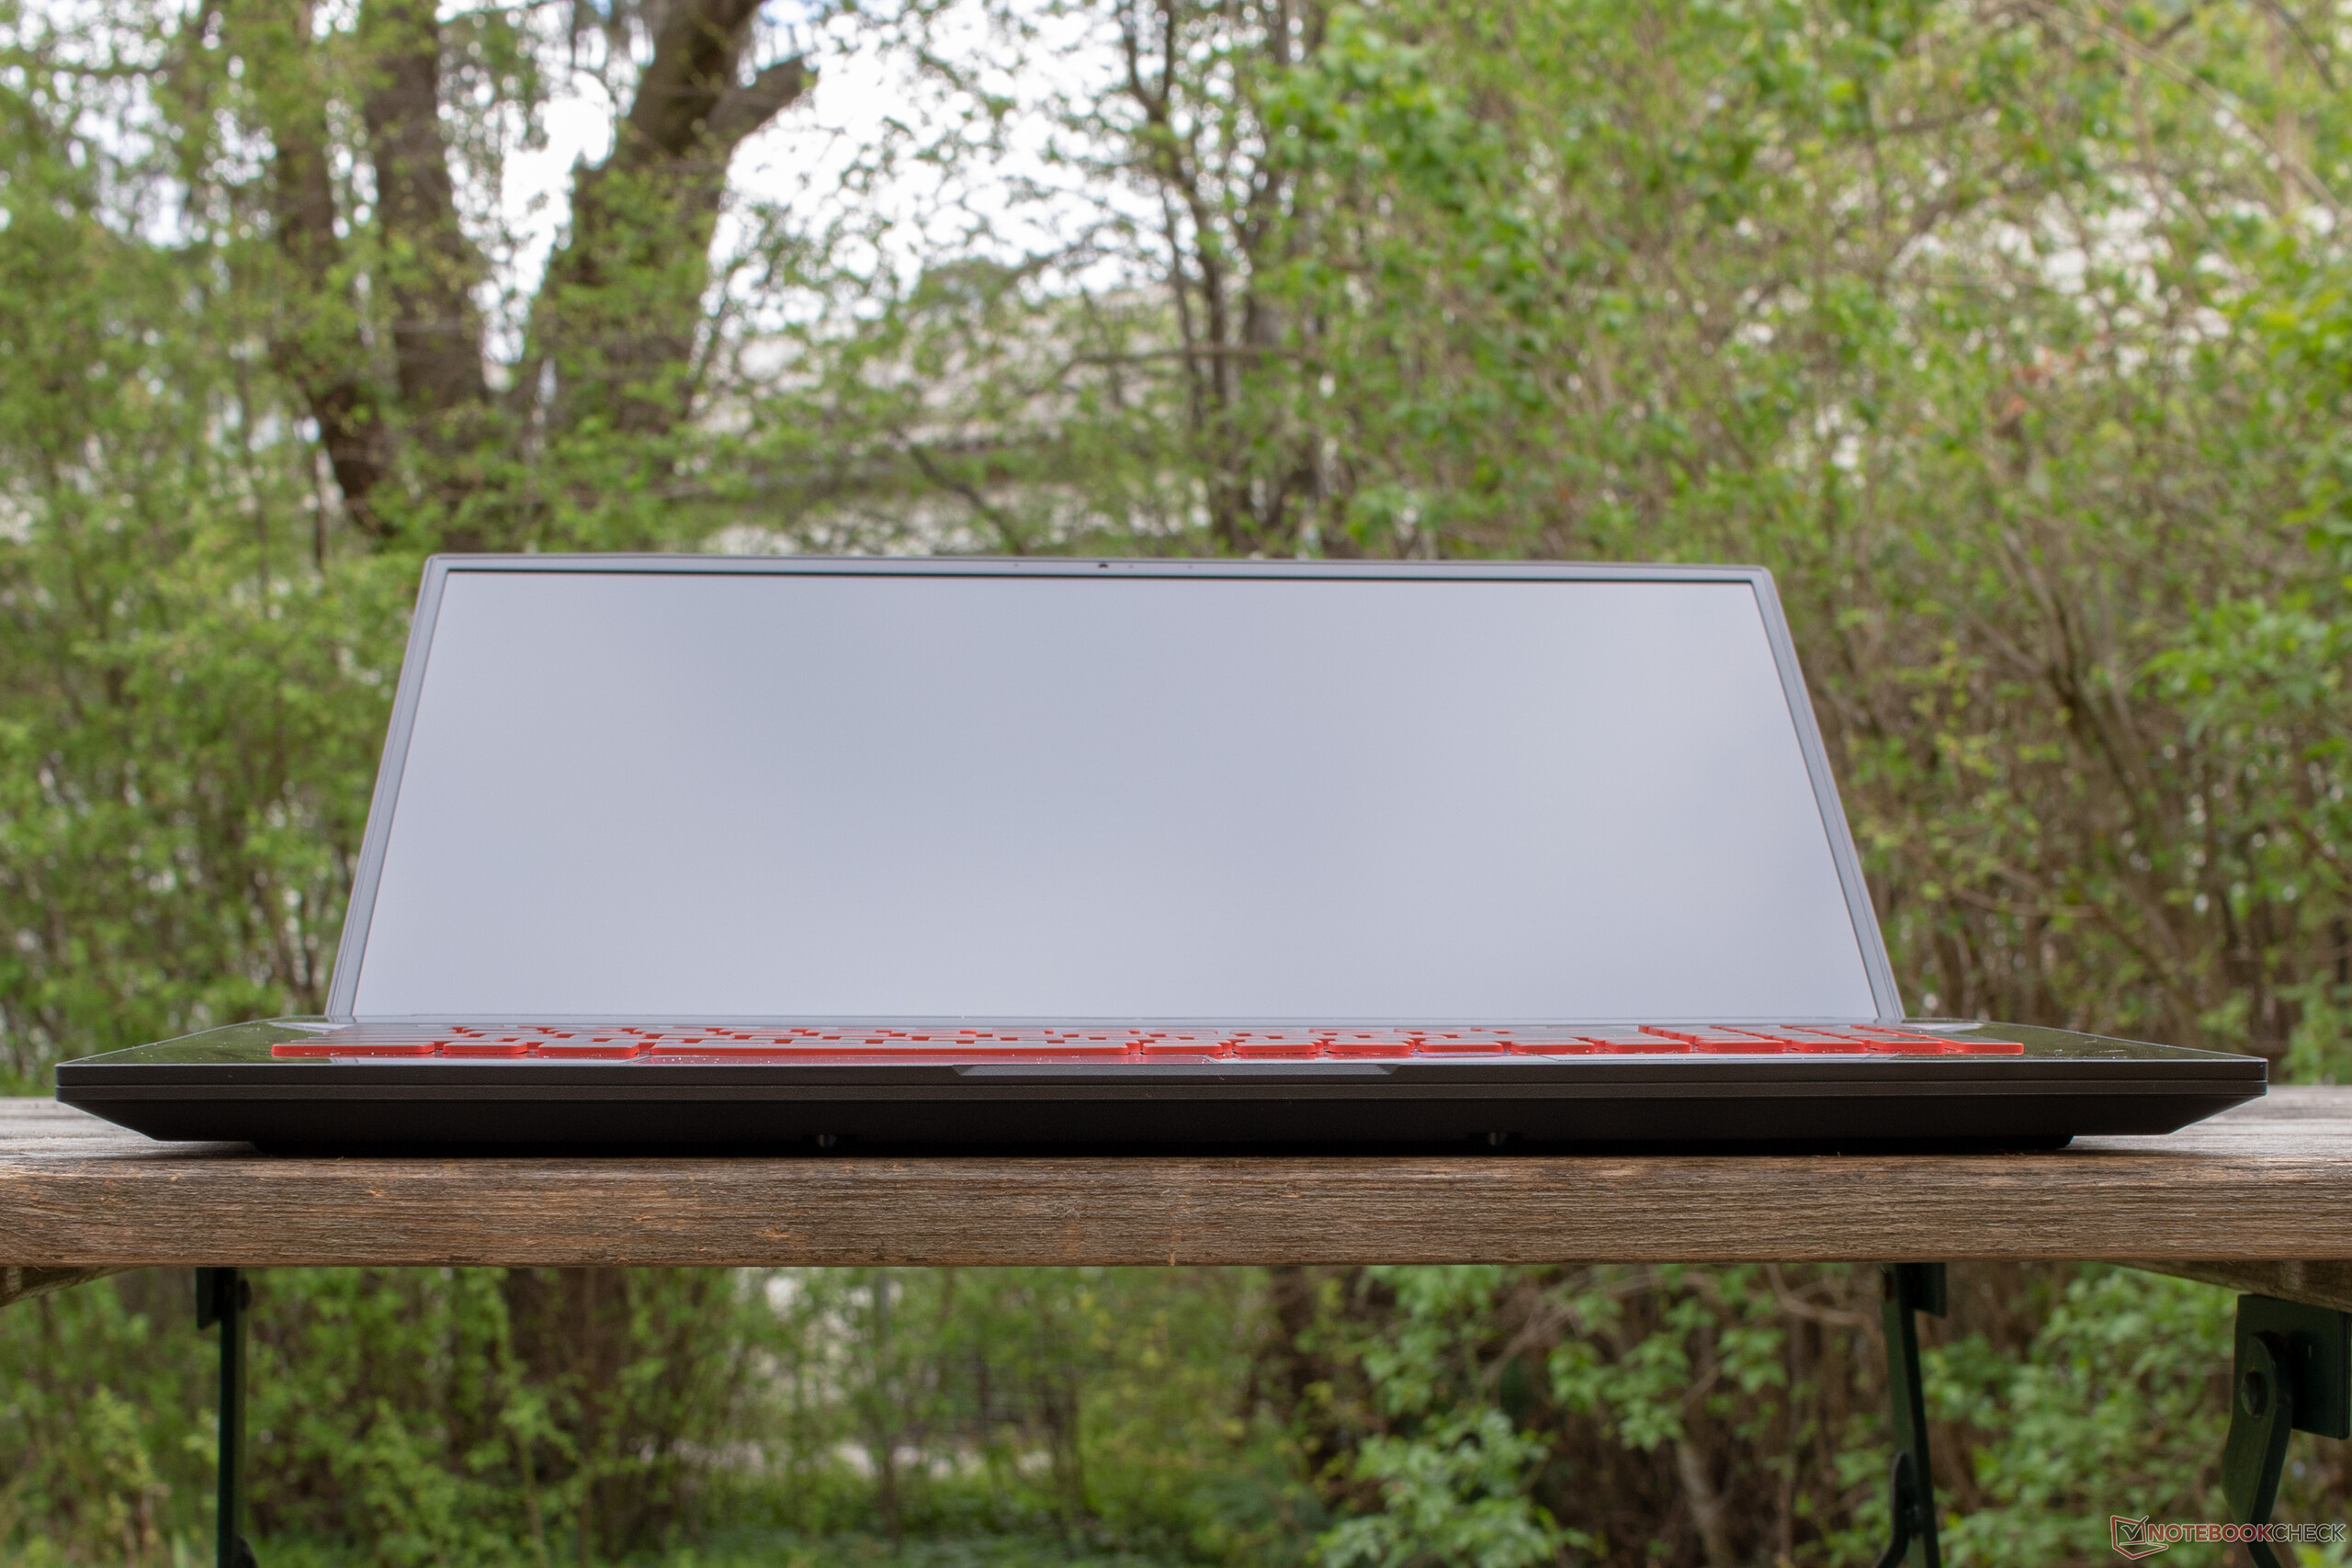
(±) De maximumtemperatuur aan de bovenzijde bedraagt 44.2 °C / 112 F, vergeleken met het gemiddelde van 40.4 °C / 105 F, variërend van 21.2 tot 68.8 °C voor de klasse Gaming.
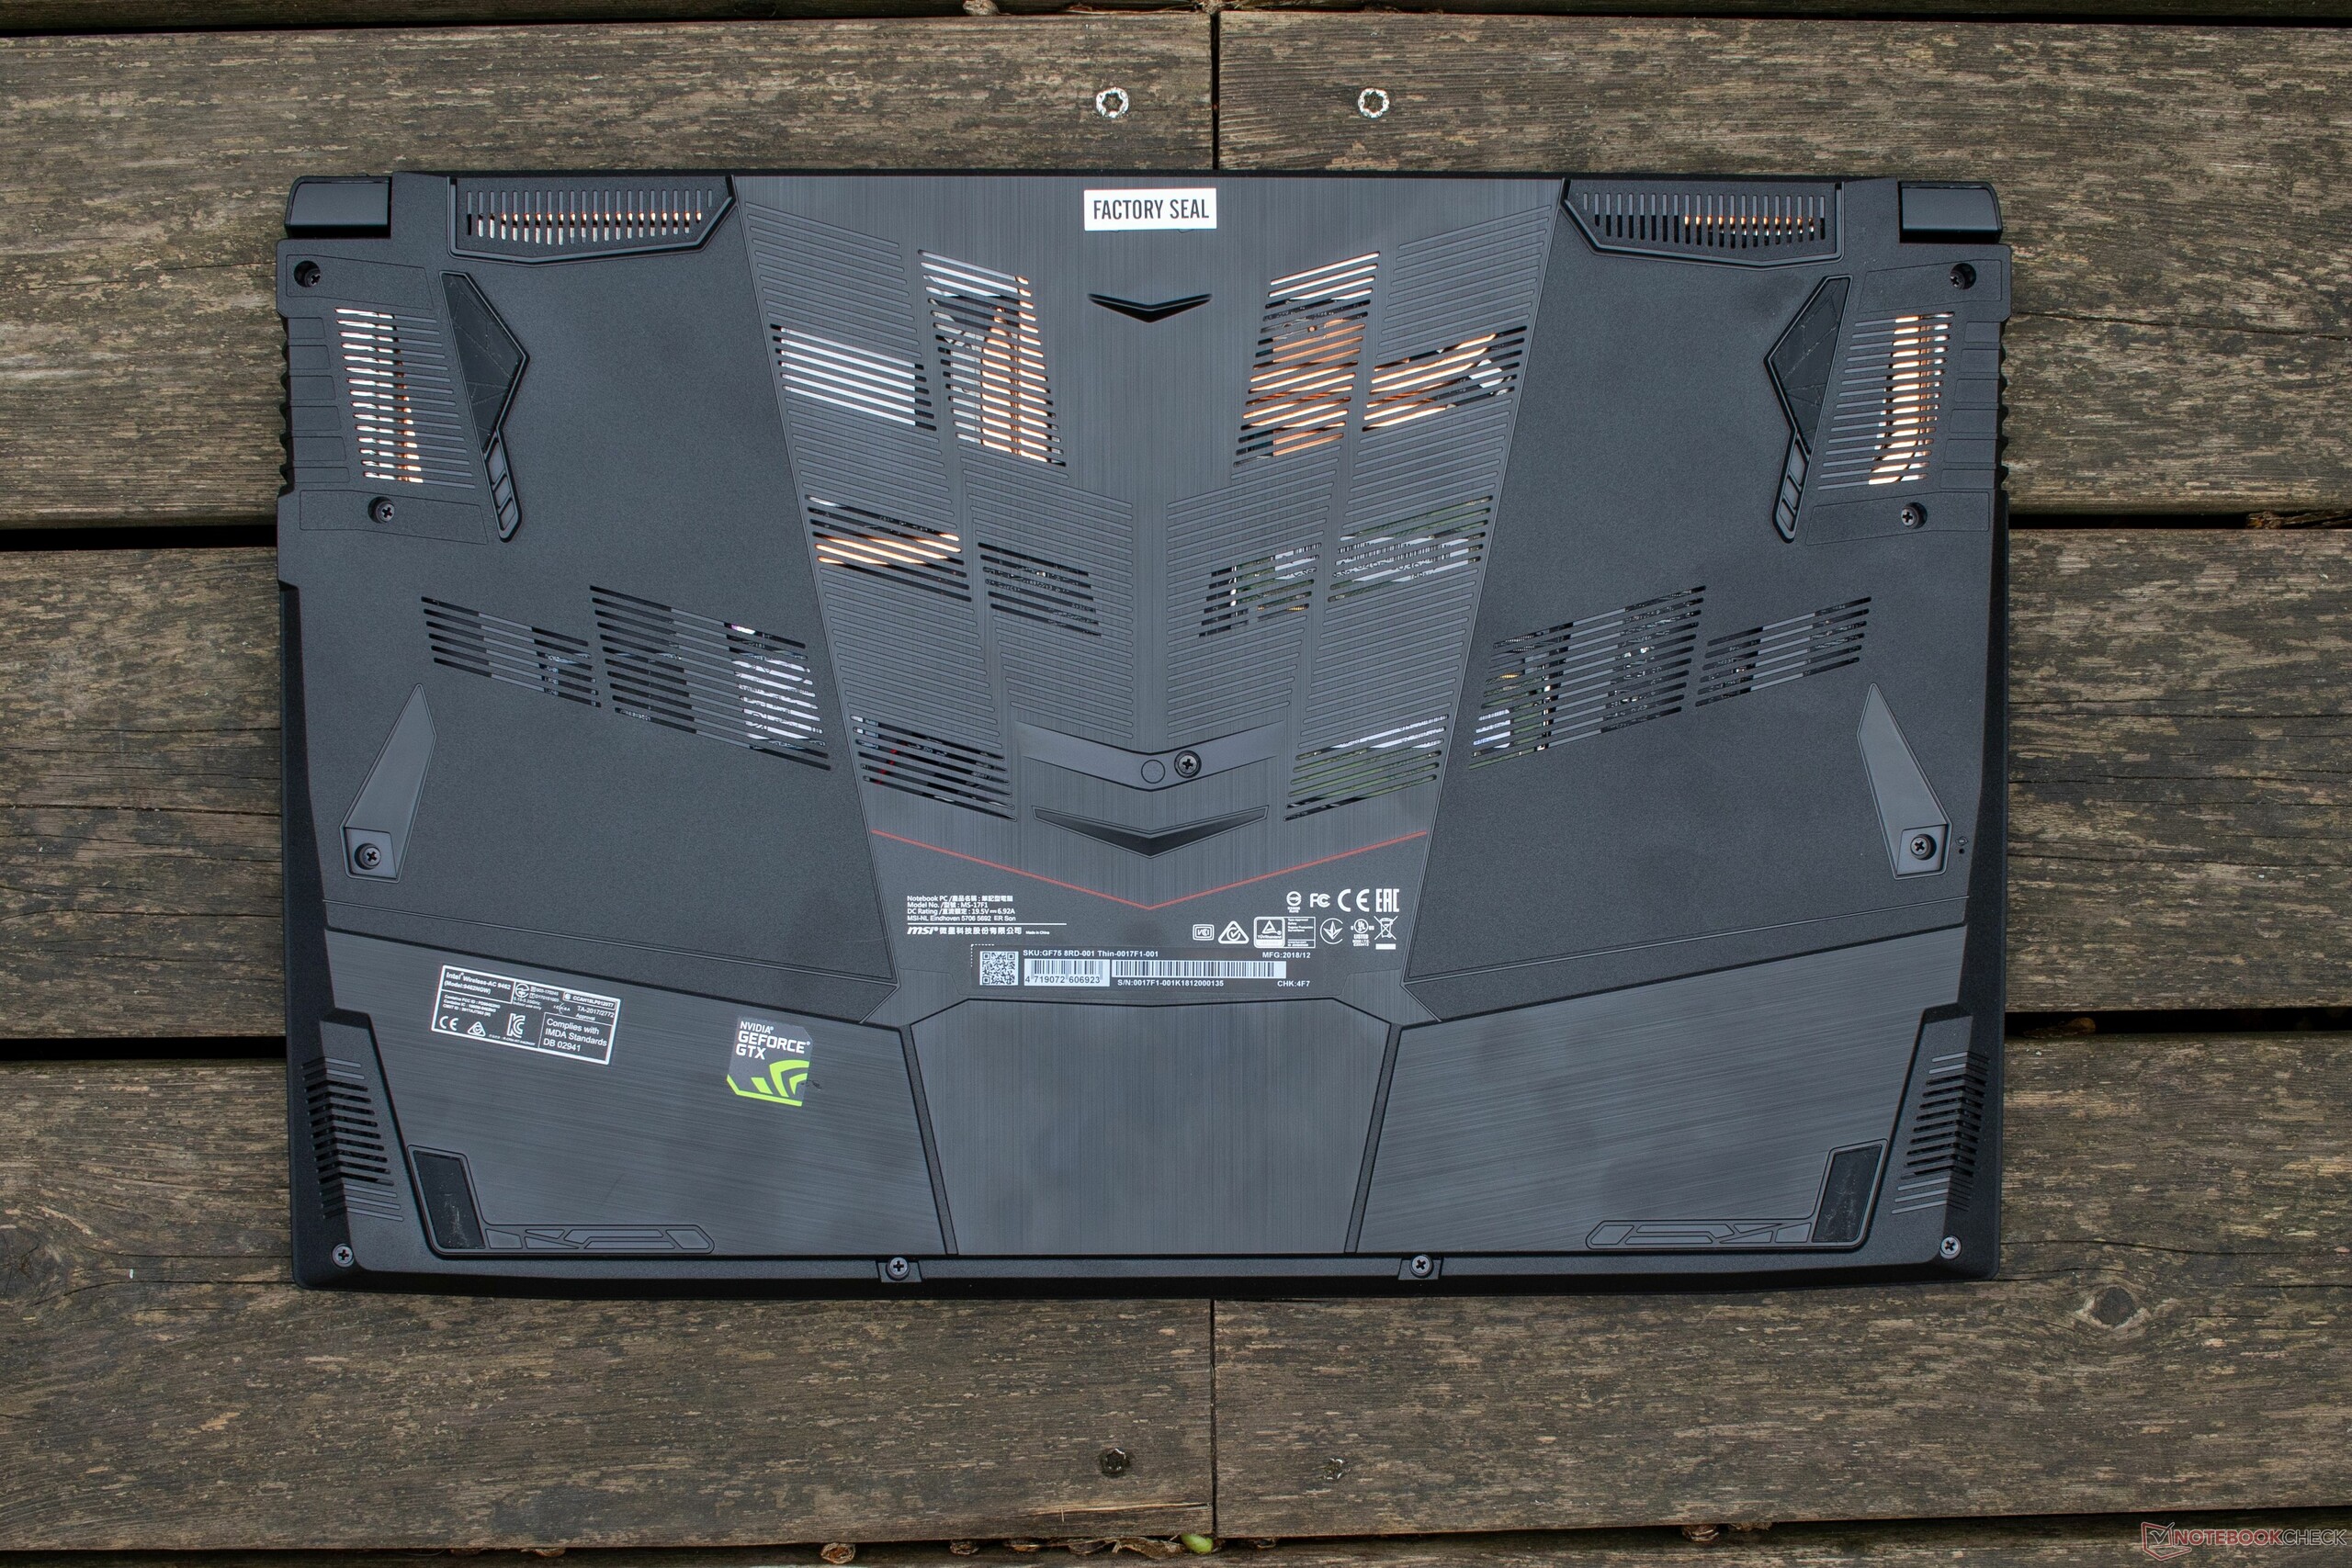
(+) De bodem warmt op tot een maximum van 39.1 °C / 102 F, vergeleken met een gemiddelde van 43.2 °C / 110 F
(+) Bij onbelast gebruik bedraagt de gemiddelde temperatuur voor de bovenzijde 23.3 °C / 74 F, vergeleken met het apparaatgemiddelde van 33.9 °C / 93 F.
(+) De palmsteunen en het touchpad zijn met een maximum van ###max## °C / 80.2 F koeler dan de huidtemperatuur en voelen daarom koel aan.
(±) De gemiddelde temperatuur van de handpalmsteun van soortgelijke toestellen bedroeg 28.8 °C / 83.8 F (+2 °C / 3.6 F).
MSI GF75 8RD-001 audioanalyse
(-) | niet erg luide luidsprekers (66.8 dB)
Bas 100 - 315 Hz
(-) | bijna geen lage tonen - gemiddeld 17.3% lager dan de mediaan
(±) | lineariteit van de lage tonen is gemiddeld (13.5% delta ten opzichte van de vorige frequentie)
Midden 400 - 2000 Hz
(±) | hogere middens - gemiddeld 6.9% hoger dan de mediaan
(-) | de middentonen zijn niet lineair (16.5% delta ten opzichte van de vorige frequentie)
Hoog 2 - 16 kHz
(+) | evenwichtige hoogtepunten - slechts 3.8% verwijderd van de mediaan
(±) | lineariteit van de hoogtepunten is gemiddeld (9.8% delta ten opzichte van de vorige frequentie)
Algemeen 100 - 16.000 Hz
(-) | het totale geluid is niet lineair (31.4% verschil met de mediaan)
Vergeleken met dezelfde klasse
» 97% van alle geteste apparaten in deze klasse waren beter, 1% vergelijkbaar, 2% slechter
» De beste had een delta van 6%, het gemiddelde was 18%, de slechtste was 132%
Vergeleken met alle geteste toestellen
» 90% van alle geteste apparaten waren beter, 2% gelijk, 8% slechter
» De beste had een delta van 4%, het gemiddelde was 24%, de slechtste was 134%
Apple MacBook 12 (Early 2016) 1.1 GHz audioanalyse
(+) | luidsprekers kunnen relatief luid spelen (83.6 dB)
Bas 100 - 315 Hz
(±) | verminderde zeebaars - gemiddeld 11.3% lager dan de mediaan
(±) | lineariteit van de lage tonen is gemiddeld (14.2% delta ten opzichte van de vorige frequentie)
Midden 400 - 2000 Hz
(+) | evenwichtige middens - slechts 2.4% verwijderd van de mediaan
(+) | de middentonen zijn lineair (5.5% delta ten opzichte van de vorige frequentie)
Hoog 2 - 16 kHz
(+) | evenwichtige hoogtepunten - slechts 2% verwijderd van de mediaan
(+) | de hoge tonen zijn lineair (4.5% delta naar de vorige frequentie)
Algemeen 100 - 16.000 Hz
(+) | het totale geluid is lineair (10.2% verschil met de mediaan)
Vergeleken met dezelfde klasse
» 7% van alle geteste apparaten in deze klasse waren beter, 2% vergelijkbaar, 91% slechter
» De beste had een delta van 5%, het gemiddelde was 18%, de slechtste was 53%
Vergeleken met alle geteste toestellen
» 5% van alle geteste apparaten waren beter, 1% gelijk, 94% slechter
» De beste had een delta van 4%, het gemiddelde was 24%, de slechtste was 134%
| Uit / Standby | |
| Inactief | |
| Belasting |
|
Key:
min: | |
| MSI GF75 8RD-001 i7-8750H, GeForce GTX 1050 Ti Max-Q, Kingston RBUSNS8154P3256GJ1, IPS, 1920x1080, 17.3" | Asus TUF FX705GE-EW096T i7-8750H, GeForce GTX 1050 Ti Mobile, SK hynix BC501 HFM128GDJTNG-831, IPS, 1920x1080, 17.3" | Lenovo Legion Y730-17ICH, i7-8750H i7-8750H, GeForce GTX 1050 Ti Mobile, Toshiba KBG30ZMT128G, IPS, 1920x1080, 17.3" | Medion Erazer P6705-MD61131 i7-8750H, GeForce GTX 1050 Ti Mobile, Samsung SSD PM981 MZVLB256HAHQ, TN, 1920x1080, 15.6" | HP Pavilion Gaming 15-cx0003ng i7-8750H, GeForce GTX 1050 Ti Mobile, Intel Optane 16 GB MEMPEK1J016GAH + HGST HTS721010A9E630 1 TB HDD, IPS, 1920x1080, 15.6" | Acer Aspire 7 A715-72G-704Q i7-8750H, GeForce GTX 1050 Ti Mobile, Intel SSD 760p SSDPEKKW256G8, IPS, 1920x1080, 15.6" | Gemiddeld NVIDIA GeForce GTX 1050 Ti Max-Q | Gemiddelde van klas Gaming | |
|---|---|---|---|---|---|---|---|---|
| Power Consumption | 15% | 4% | 18% | 7% | 23% | 4% | -73% | |
| Idle Minimum * (Watt) | 6.5 | 3.8 42% | 6.3 3% | 4 38% | 5.5 15% | 3.9 40% | 5.8 ? 11% | 13.2 ? -103% |
| Idle Average * (Watt) | 11.9 | 9 24% | 11 8% | 7 41% | 8.5 29% | 6.6 45% | 11.2 ? 6% | 18.9 ? -59% |
| Idle Maximum * (Watt) | 13.1 | 11.2 15% | 11.5 12% | 11 16% | 11.9 9% | 8.5 35% | 13.5 ? -3% | 24.3 ? -85% |
| Load Average * (Watt) | 86 | 101 -17% | 89.8 -4% | 72 16% | 94 -9% | 89 -3% | 86.9 ? -1% | 108 ? -26% |
| Load Maximum * (Watt) | 131 | 119.7 9% | 130.7 -0% | 158 -21% | 144 -10% | 134 -2% | 122.4 ? 7% | 254 ? -94% |
| Witcher 3 ultra * (Watt) | 102 | 79 | 86 |
* ... kleiner is beter
| MSI GF75 8RD-001 i7-8750H, GeForce GTX 1050 Ti Max-Q, 51 Wh | Lenovo ThinkPad X1 Extreme-20MF000XGE i7-8750H, GeForce GTX 1050 Ti Max-Q, 80 Wh | HP Spectre x360 15-df0126ng i7-8750H, GeForce GTX 1050 Ti Max-Q, 84 Wh | Acer Aspire 7 A715-72G-704Q i7-8750H, GeForce GTX 1050 Ti Mobile, 48.9 Wh | Asus Zephyrus S GX531GX i7-8750H, GeForce RTX 2080 Max-Q, 50 Wh | Medion Erazer P6705-MD61131 i7-8750H, GeForce GTX 1050 Ti Mobile, 62 Wh | Gemiddelde van klas Gaming | |
|---|---|---|---|---|---|---|---|
| Batterijduur | 71% | 130% | 54% | -36% | 70% | 66% | |
| Reader / Idle (h) | 6.3 | 11.5 83% | 18.8 198% | 12.3 95% | 8.9 41% | 8.71 ? 38% | |
| H.264 (h) | 3.4 | 6.2 82% | 7.7 126% | 6 76% | 8.26 ? 143% | ||
| WiFi v1.3 (h) | 4.7 | 6.4 36% | 8.8 87% | 6.4 36% | 3 -36% | 6.7 43% | 7.02 ? 49% |
| Load (h) | 1.1 | 2 82% | 2.3 109% | 1.2 9% | 2.5 127% | 1.47 ? 34% | |
| Witcher 3 ultra (h) | 1.1 |
Pro
Contra
Dit is de verkorte versie van het originele artikel. Het volledige, Engelse testrapport vind je hier.
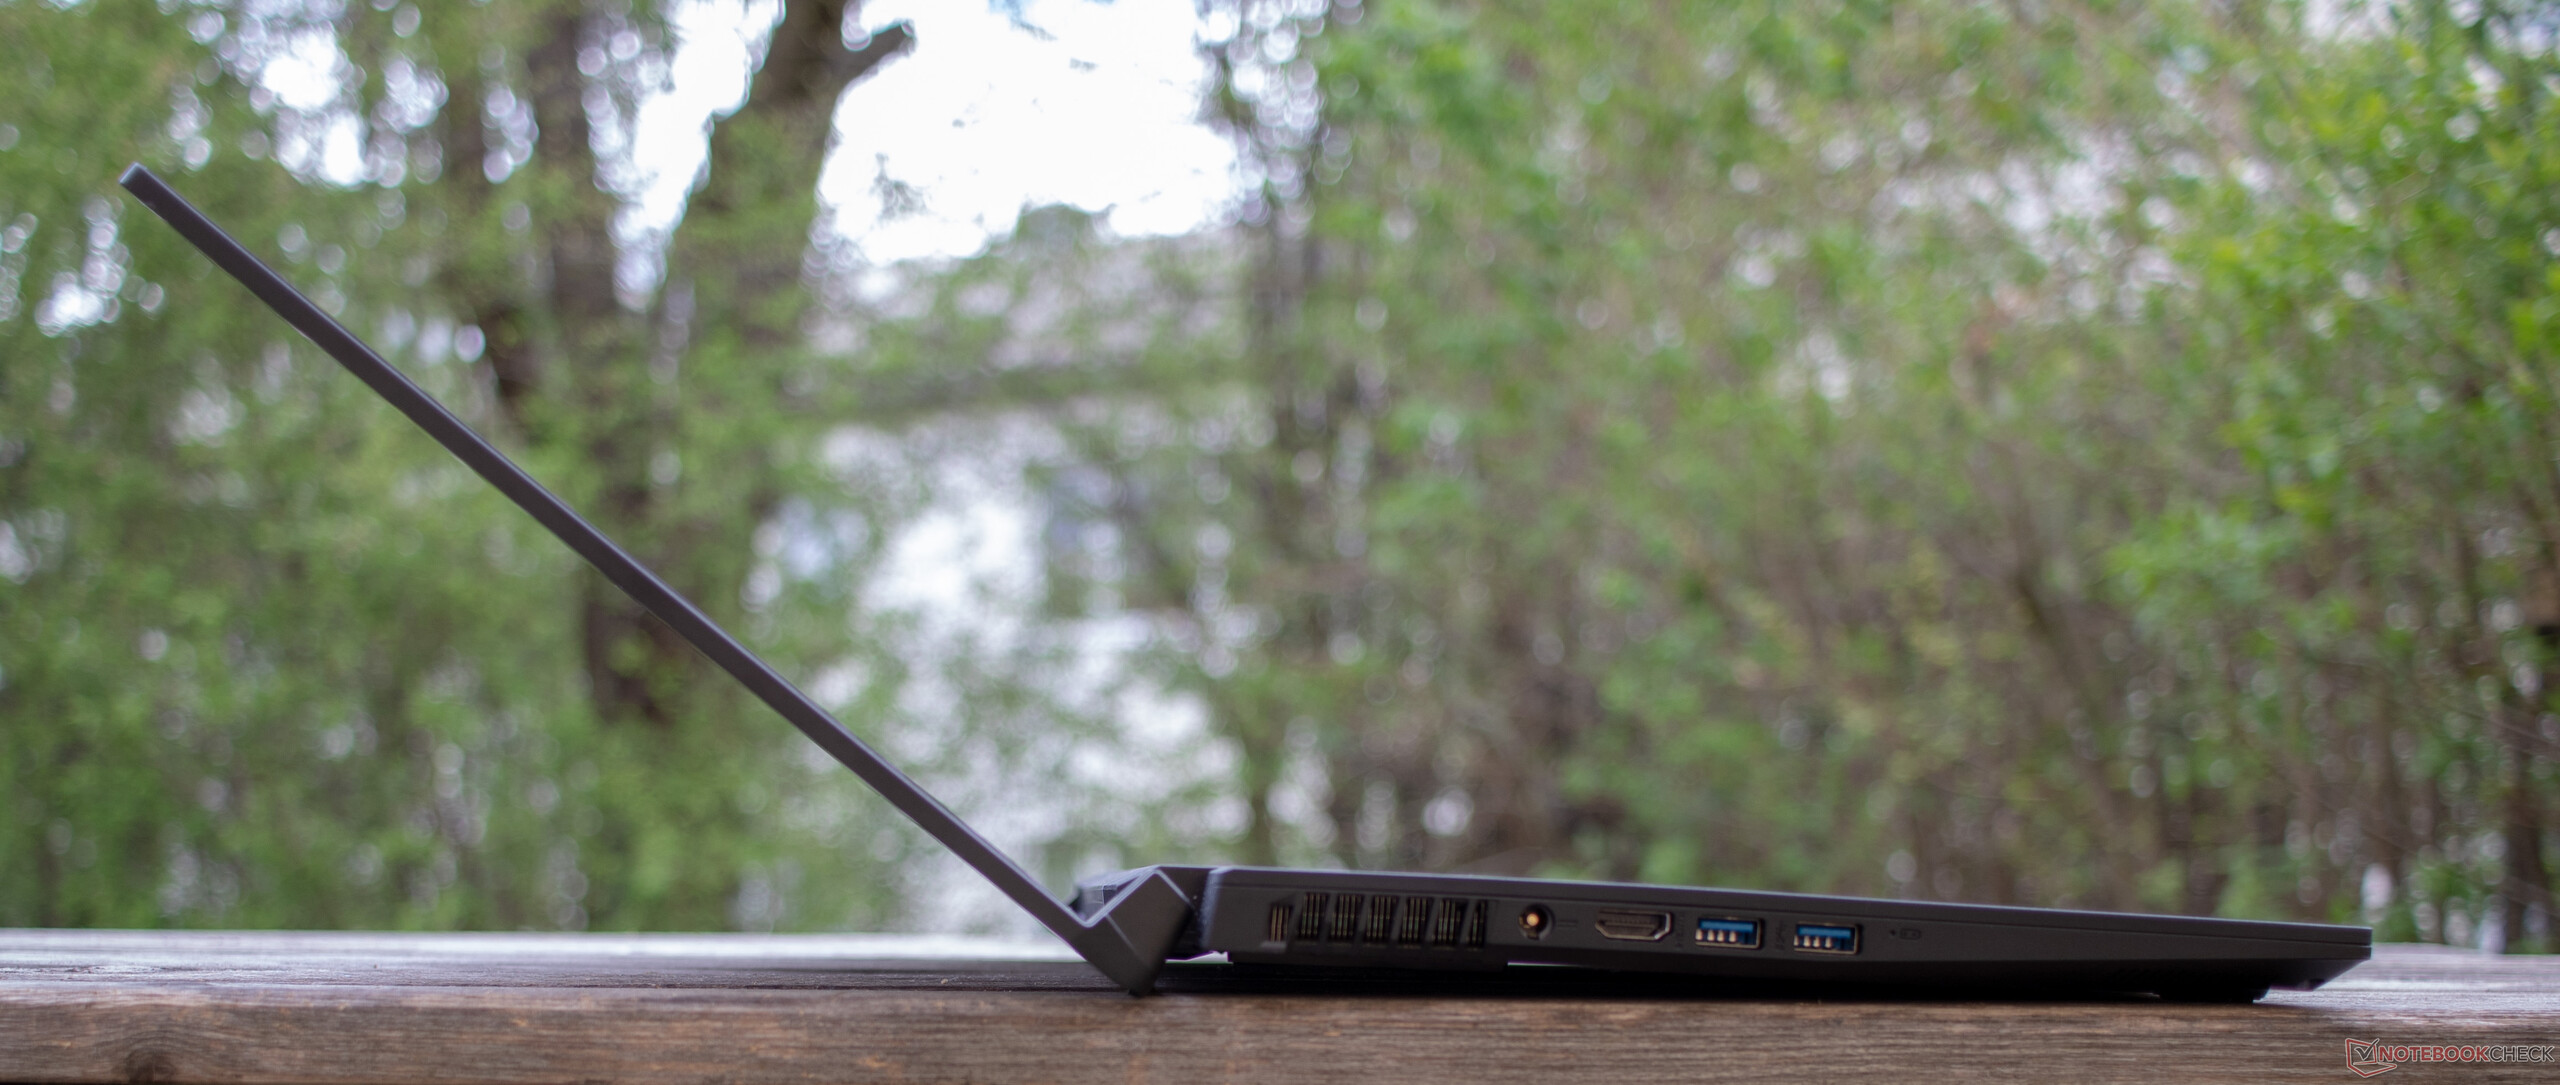
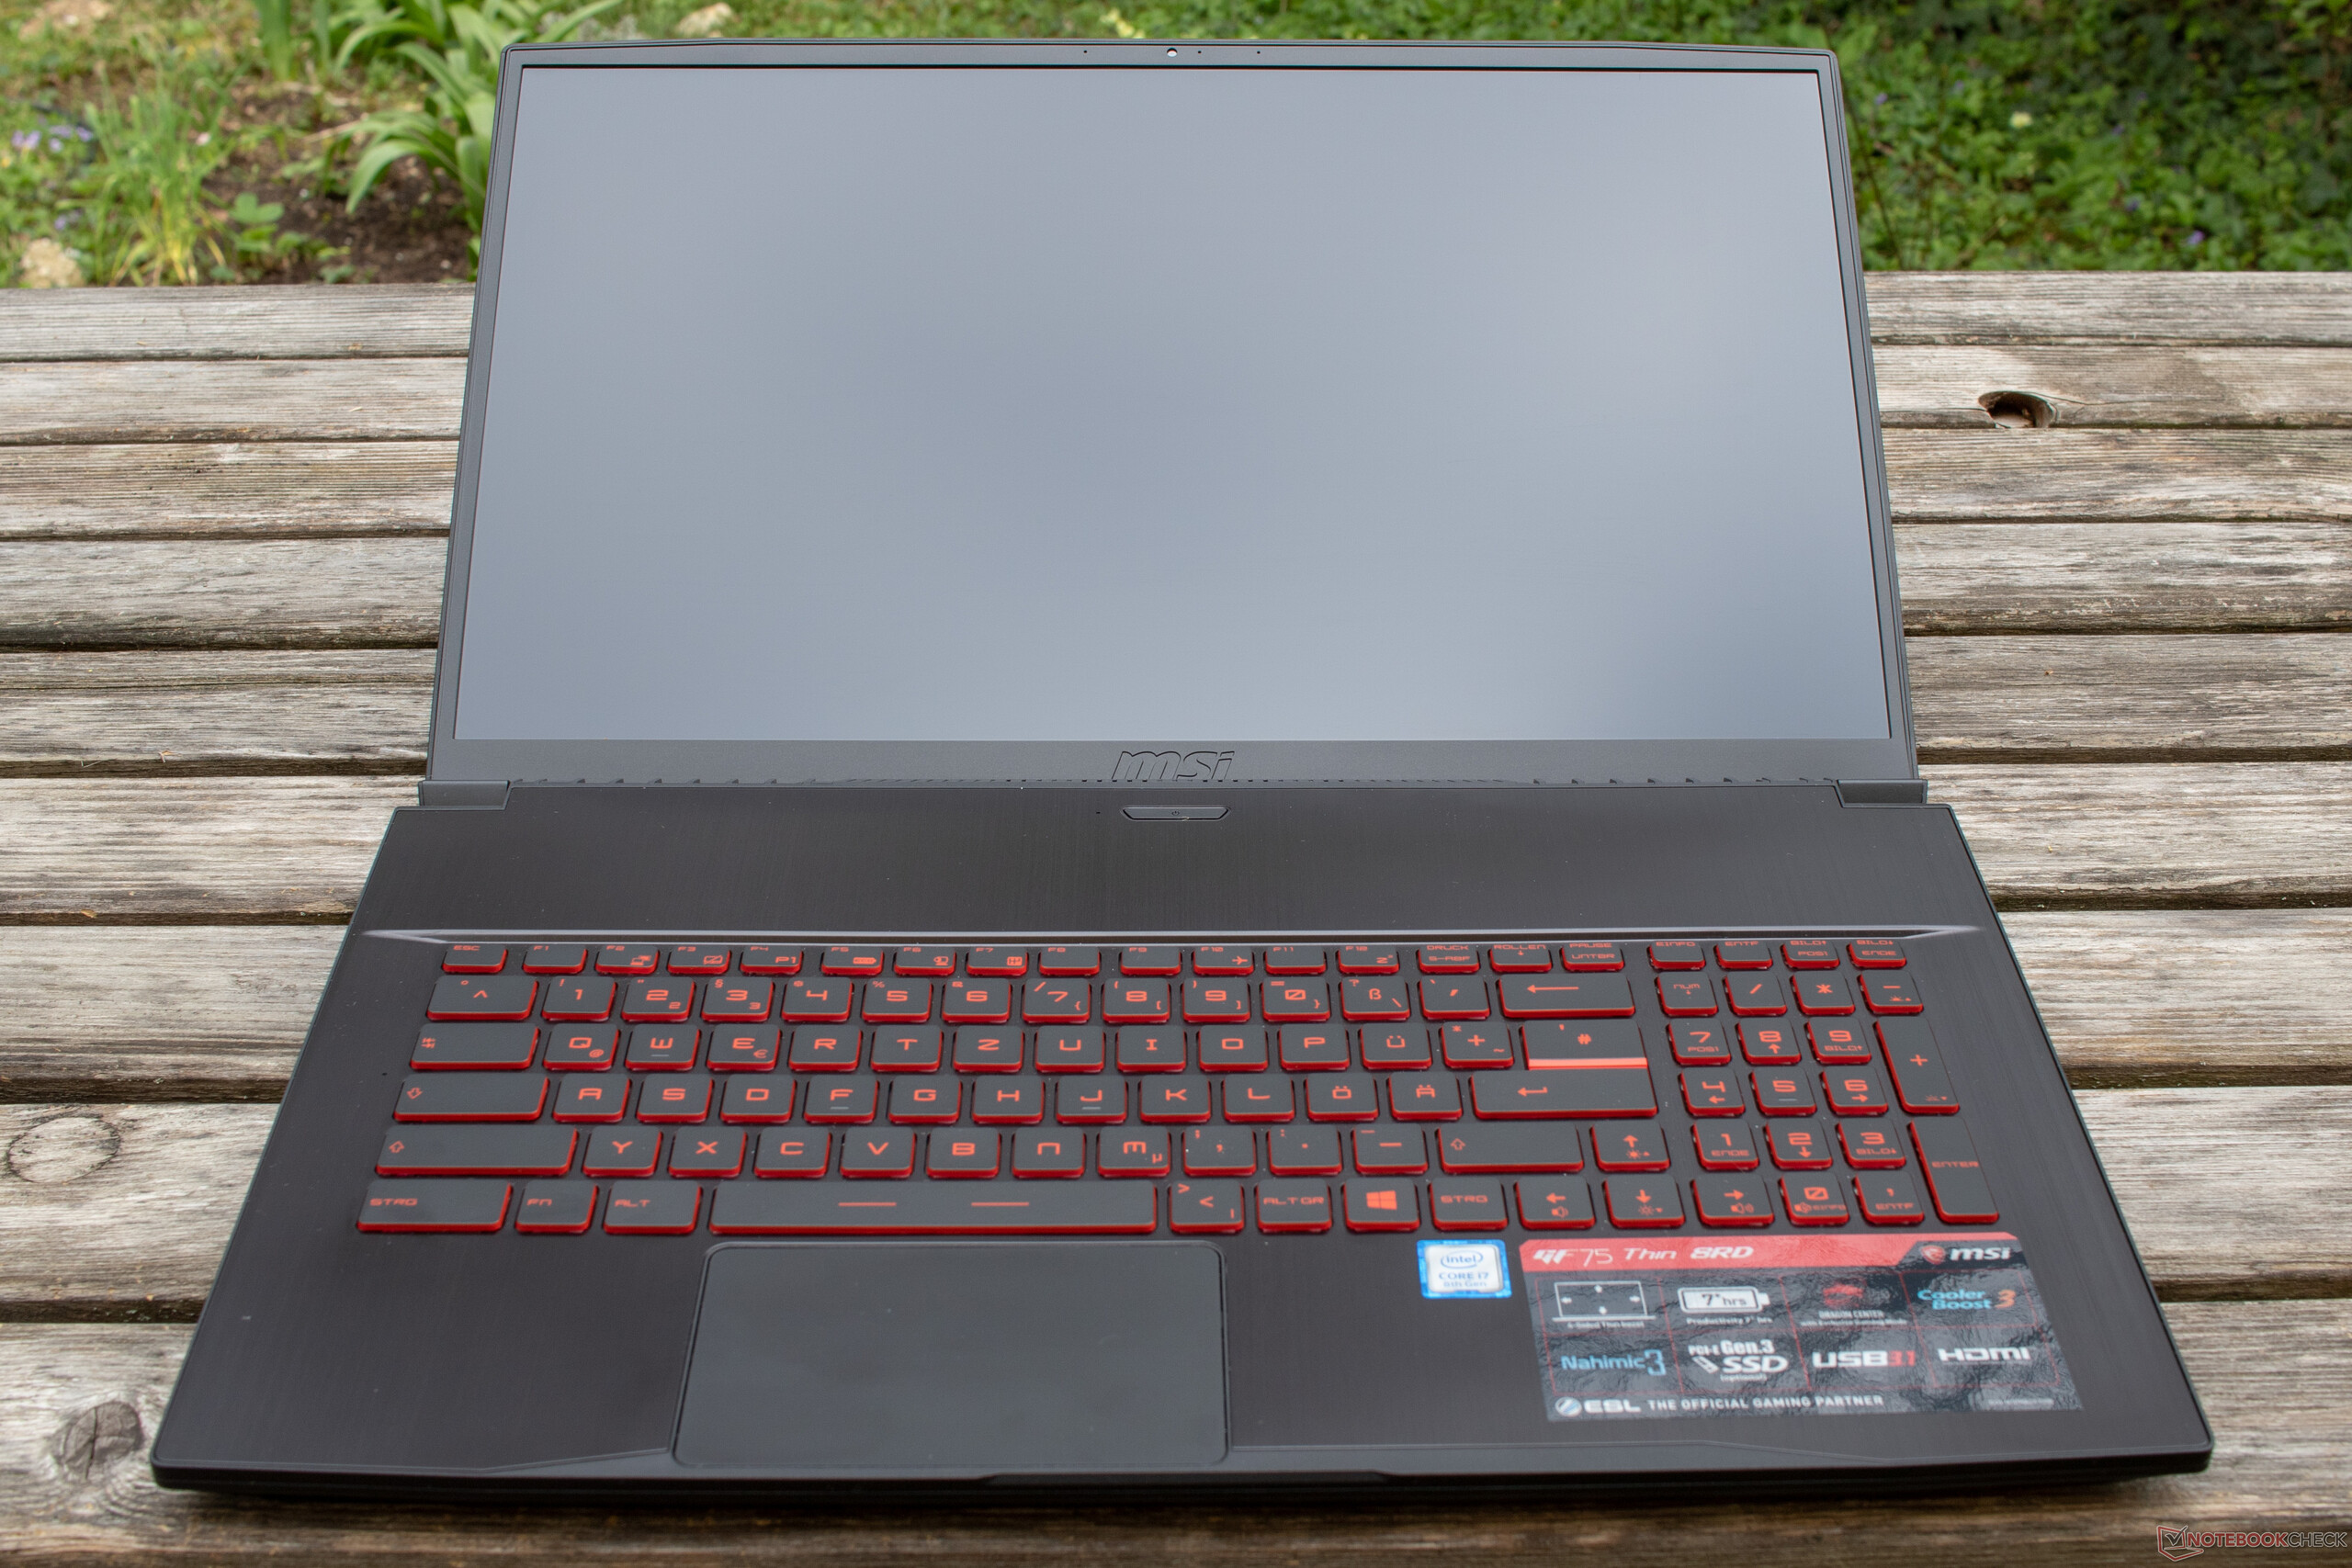
MSI probeert met de GF75 zich te concentreren op de essentiële zaken en het is erin geslaagd om een fatsoenlijk notebook te maken. De prestaties zijn voldoende om het notebook te gebruiken voor gamen, terwijl het een dun en lichtgewicht design heeft. Hoewel de energiezuinige GeForce 1050 Ti Max-Q iets ingeperkte kloksnelheden heeft en daardoor huidige games niet op de maximale detailinstellingen kan weergeven, draaien de meeste games vloeiend op gemiddelde detailinstellingen.
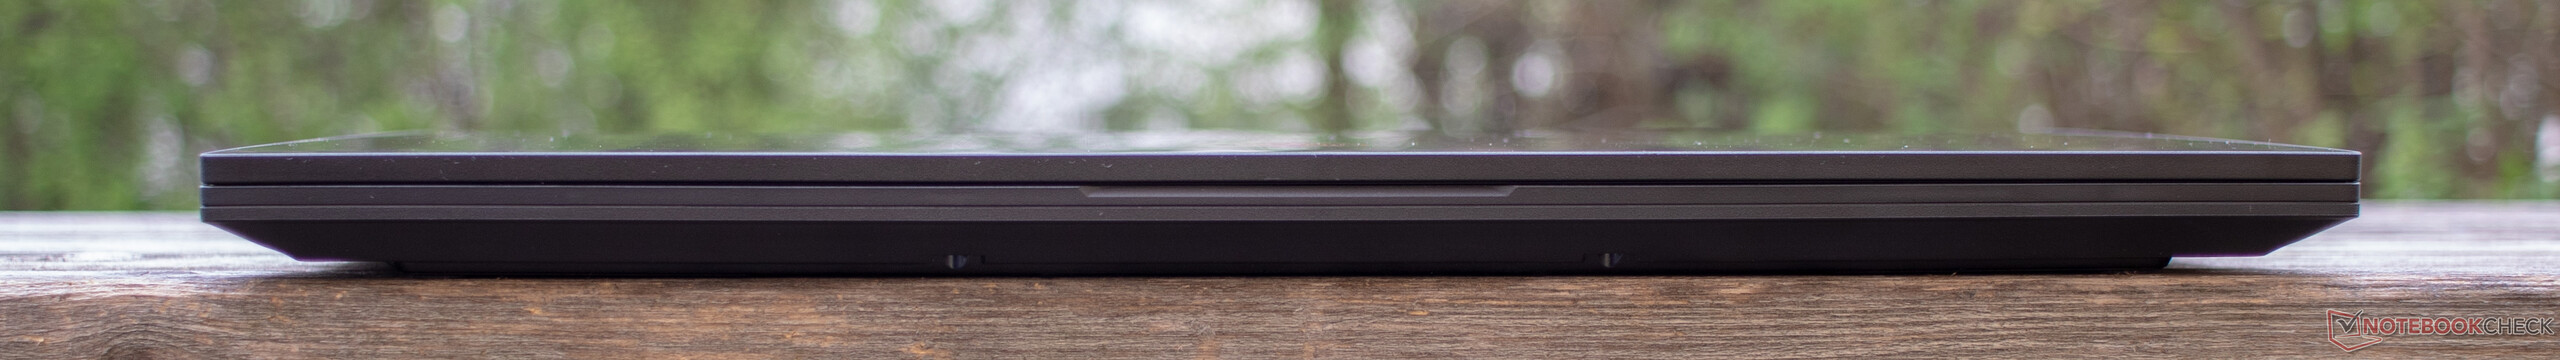
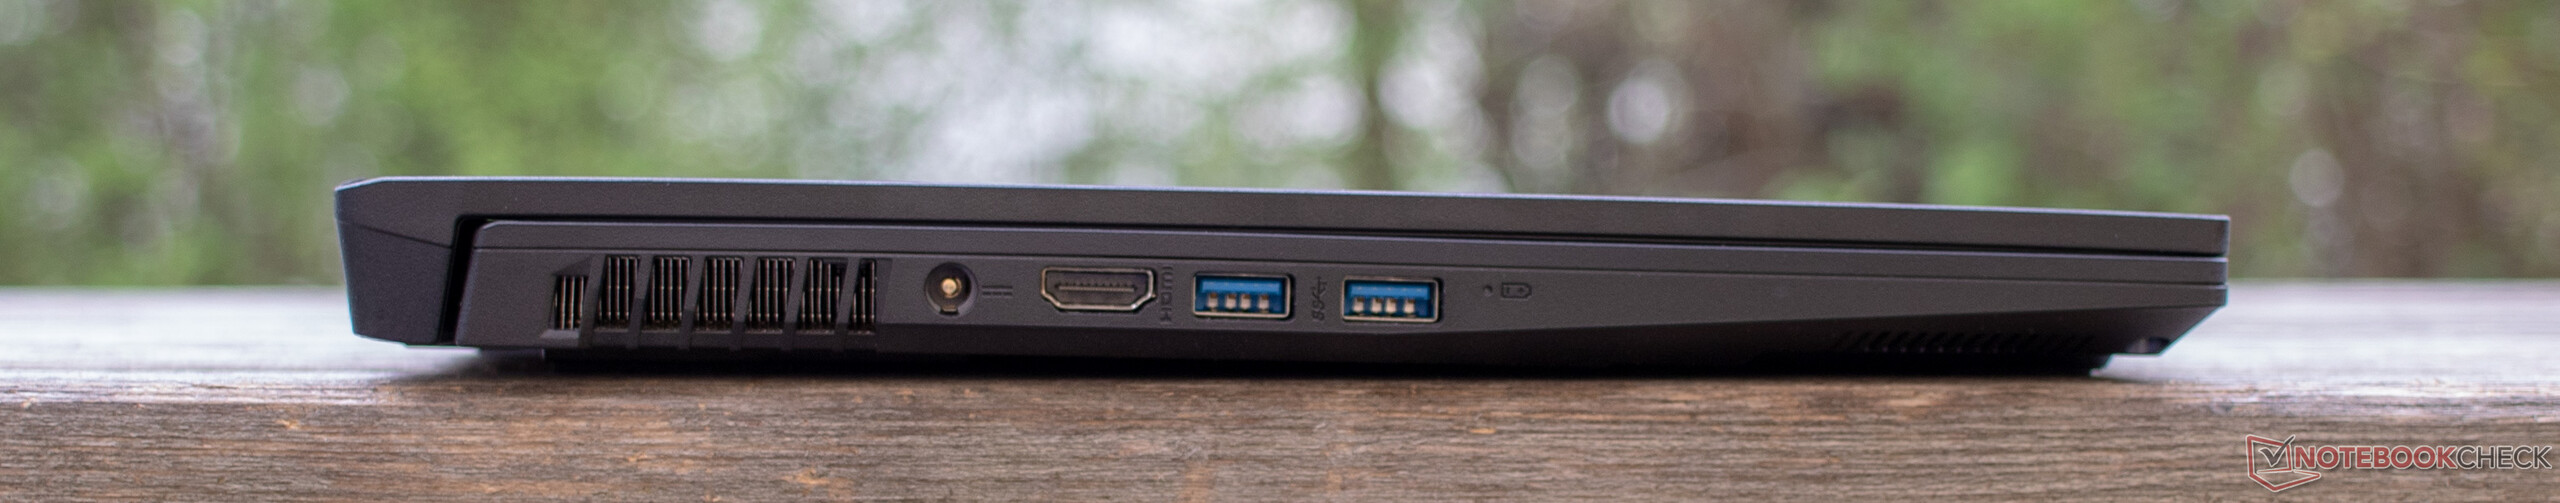
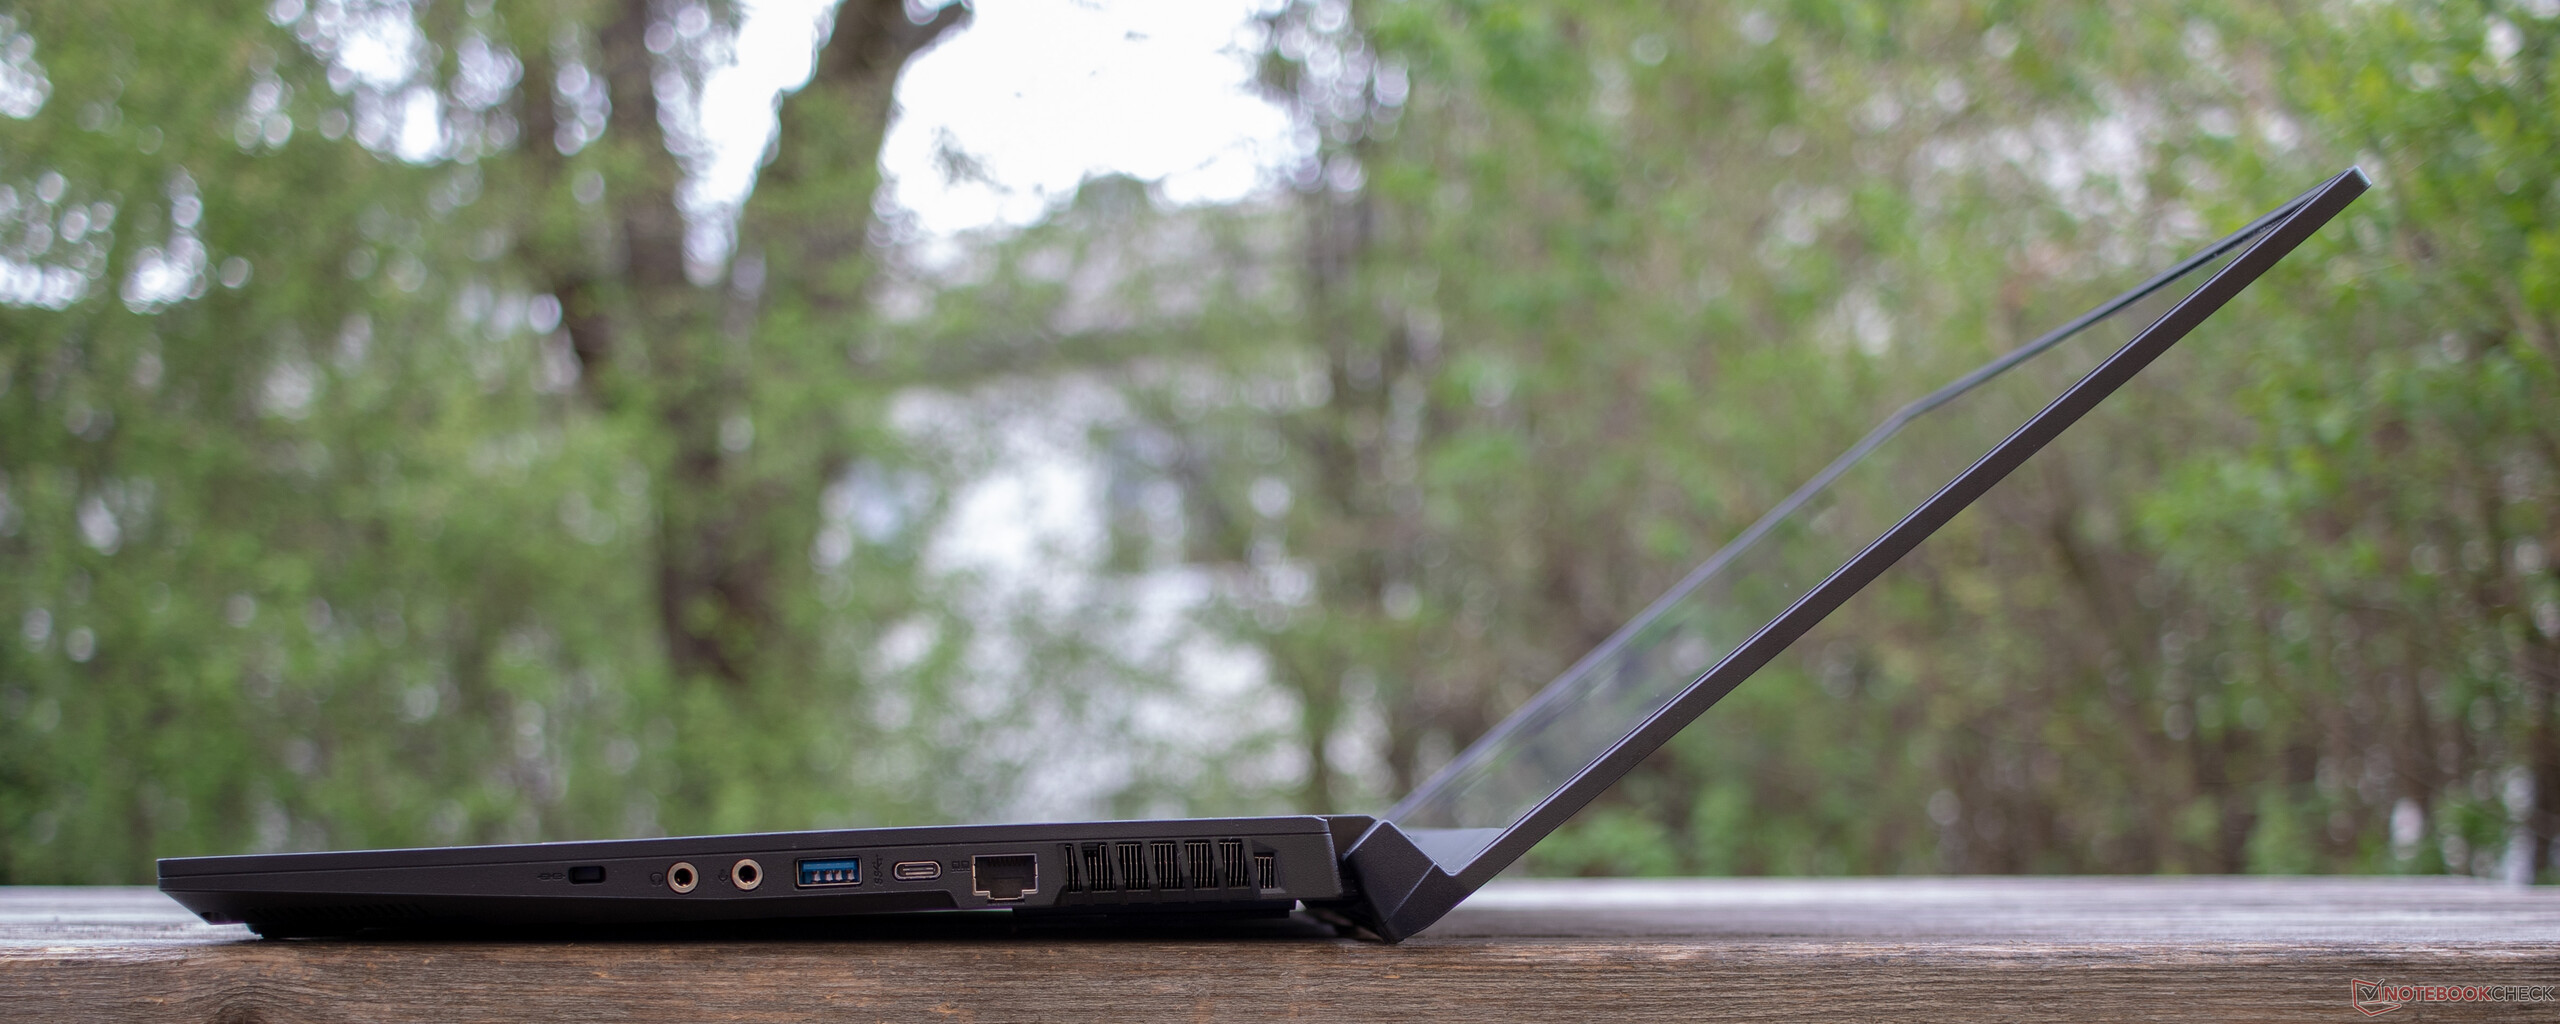
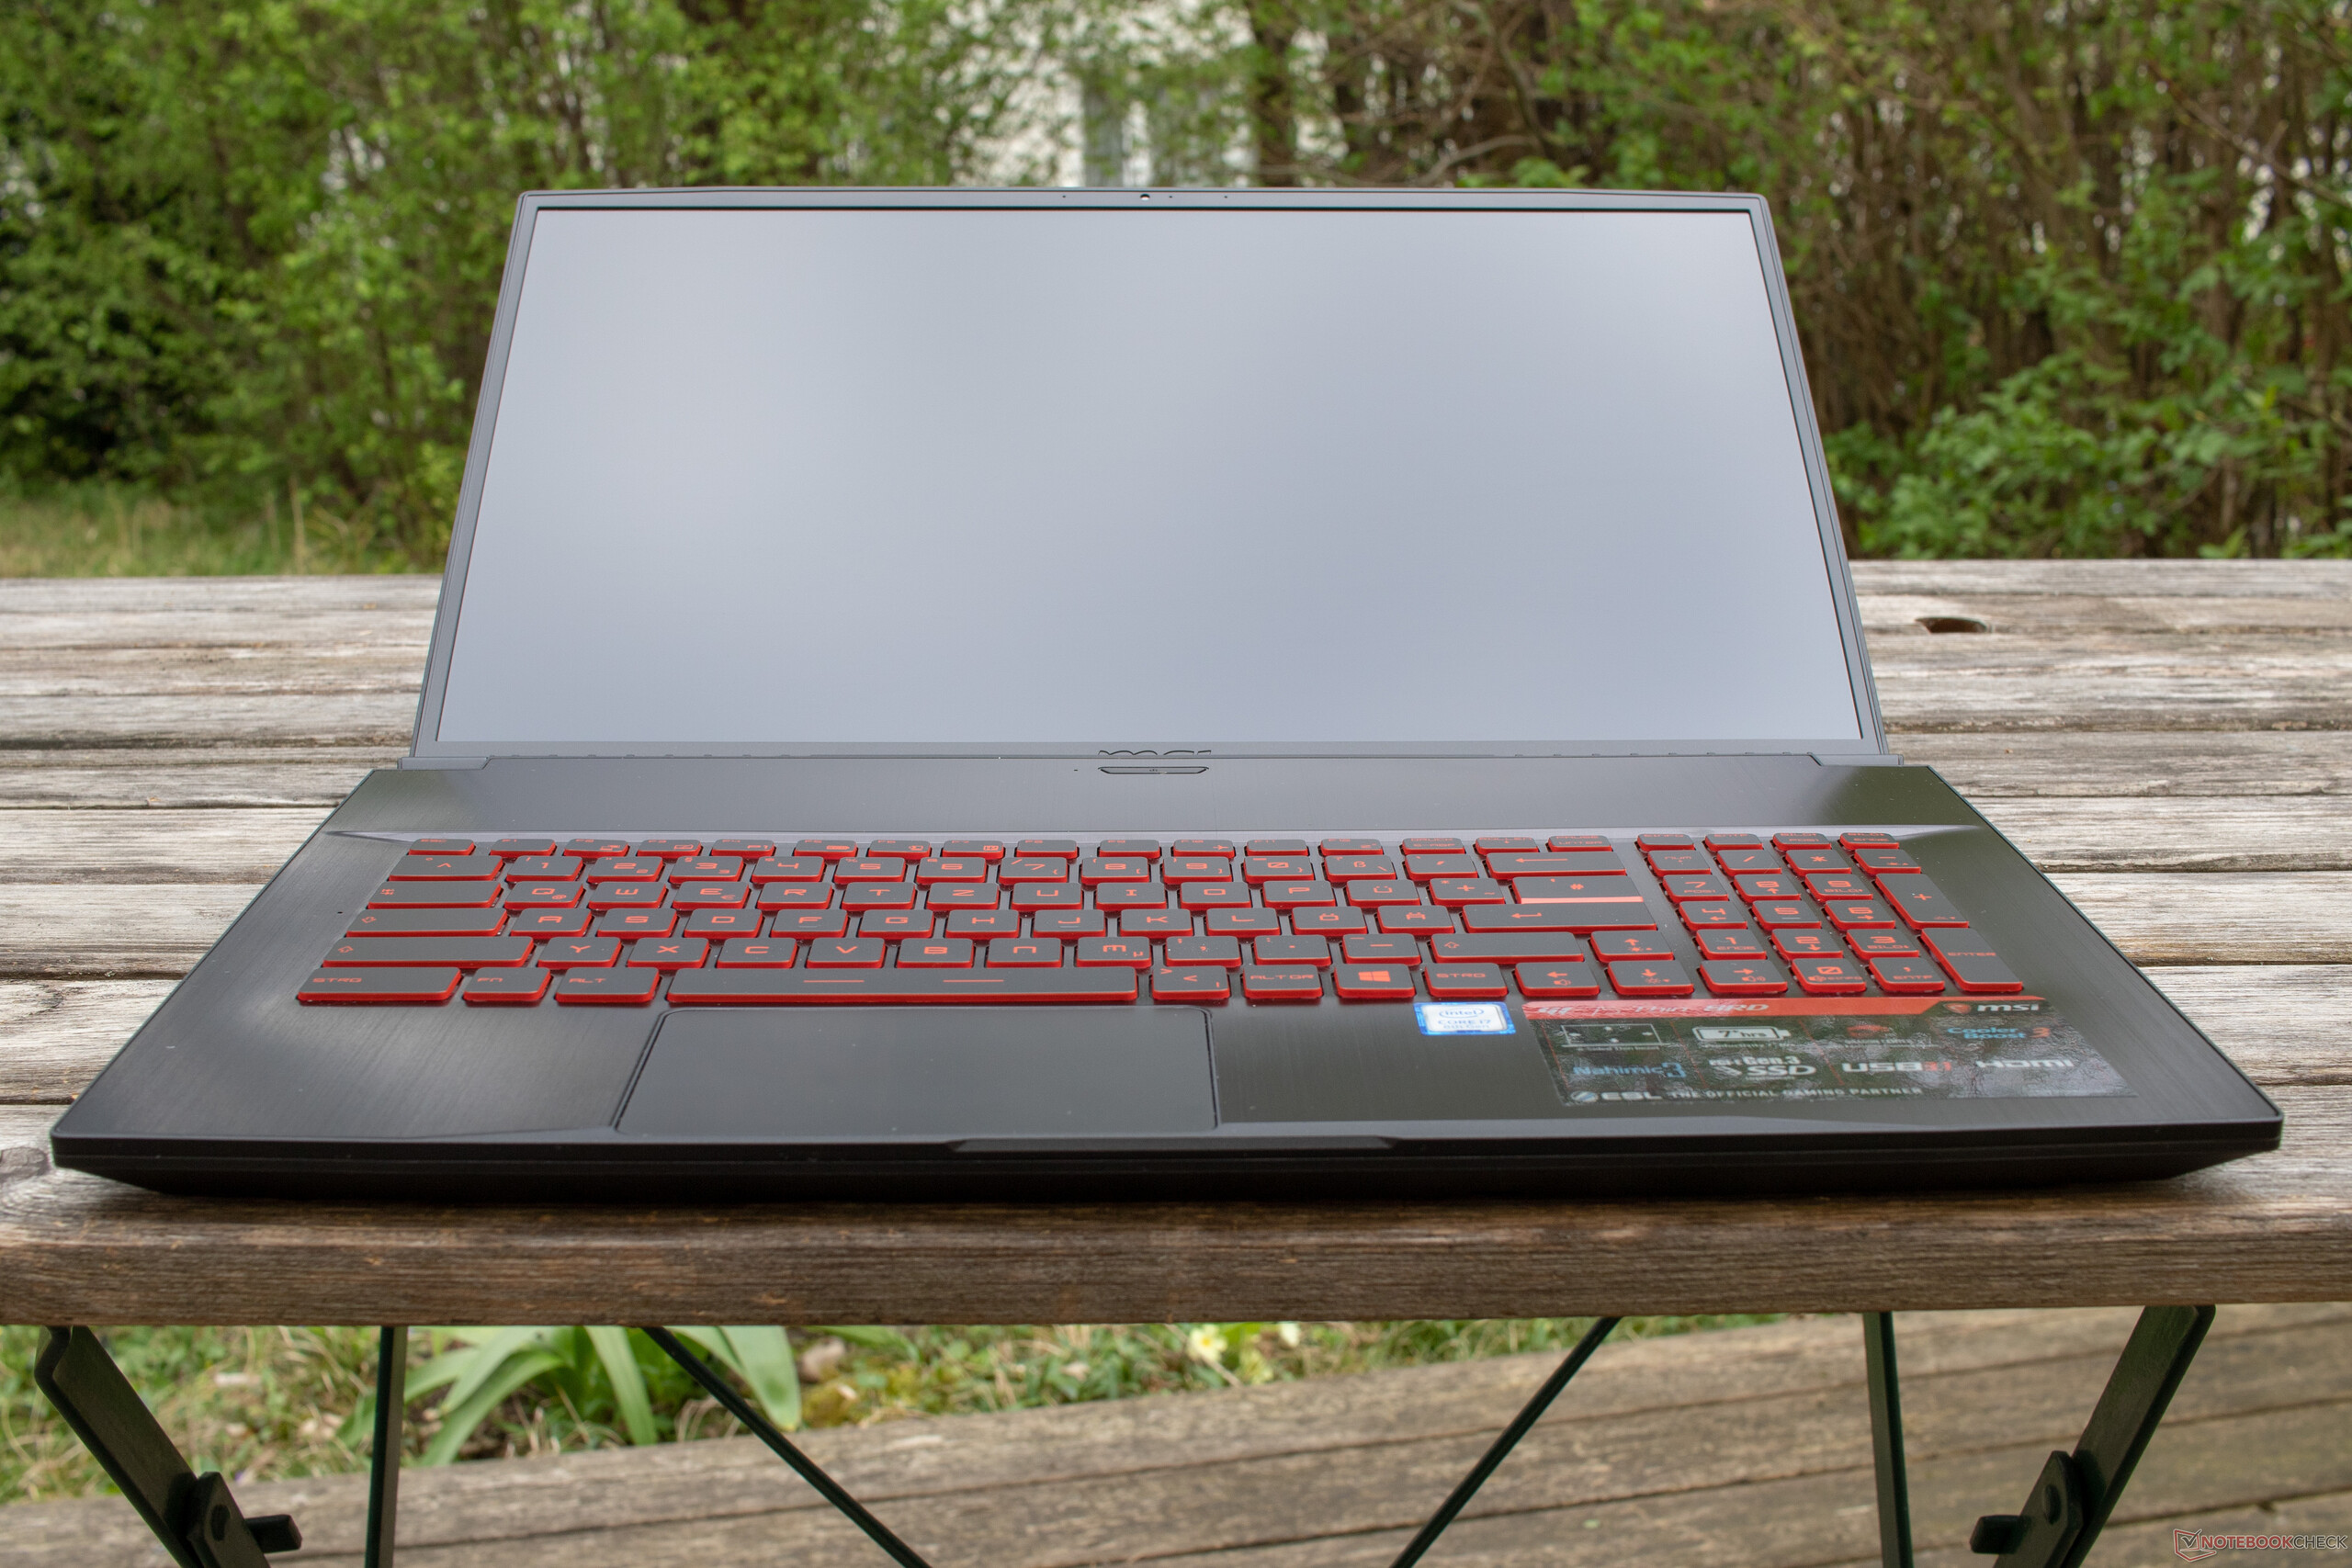
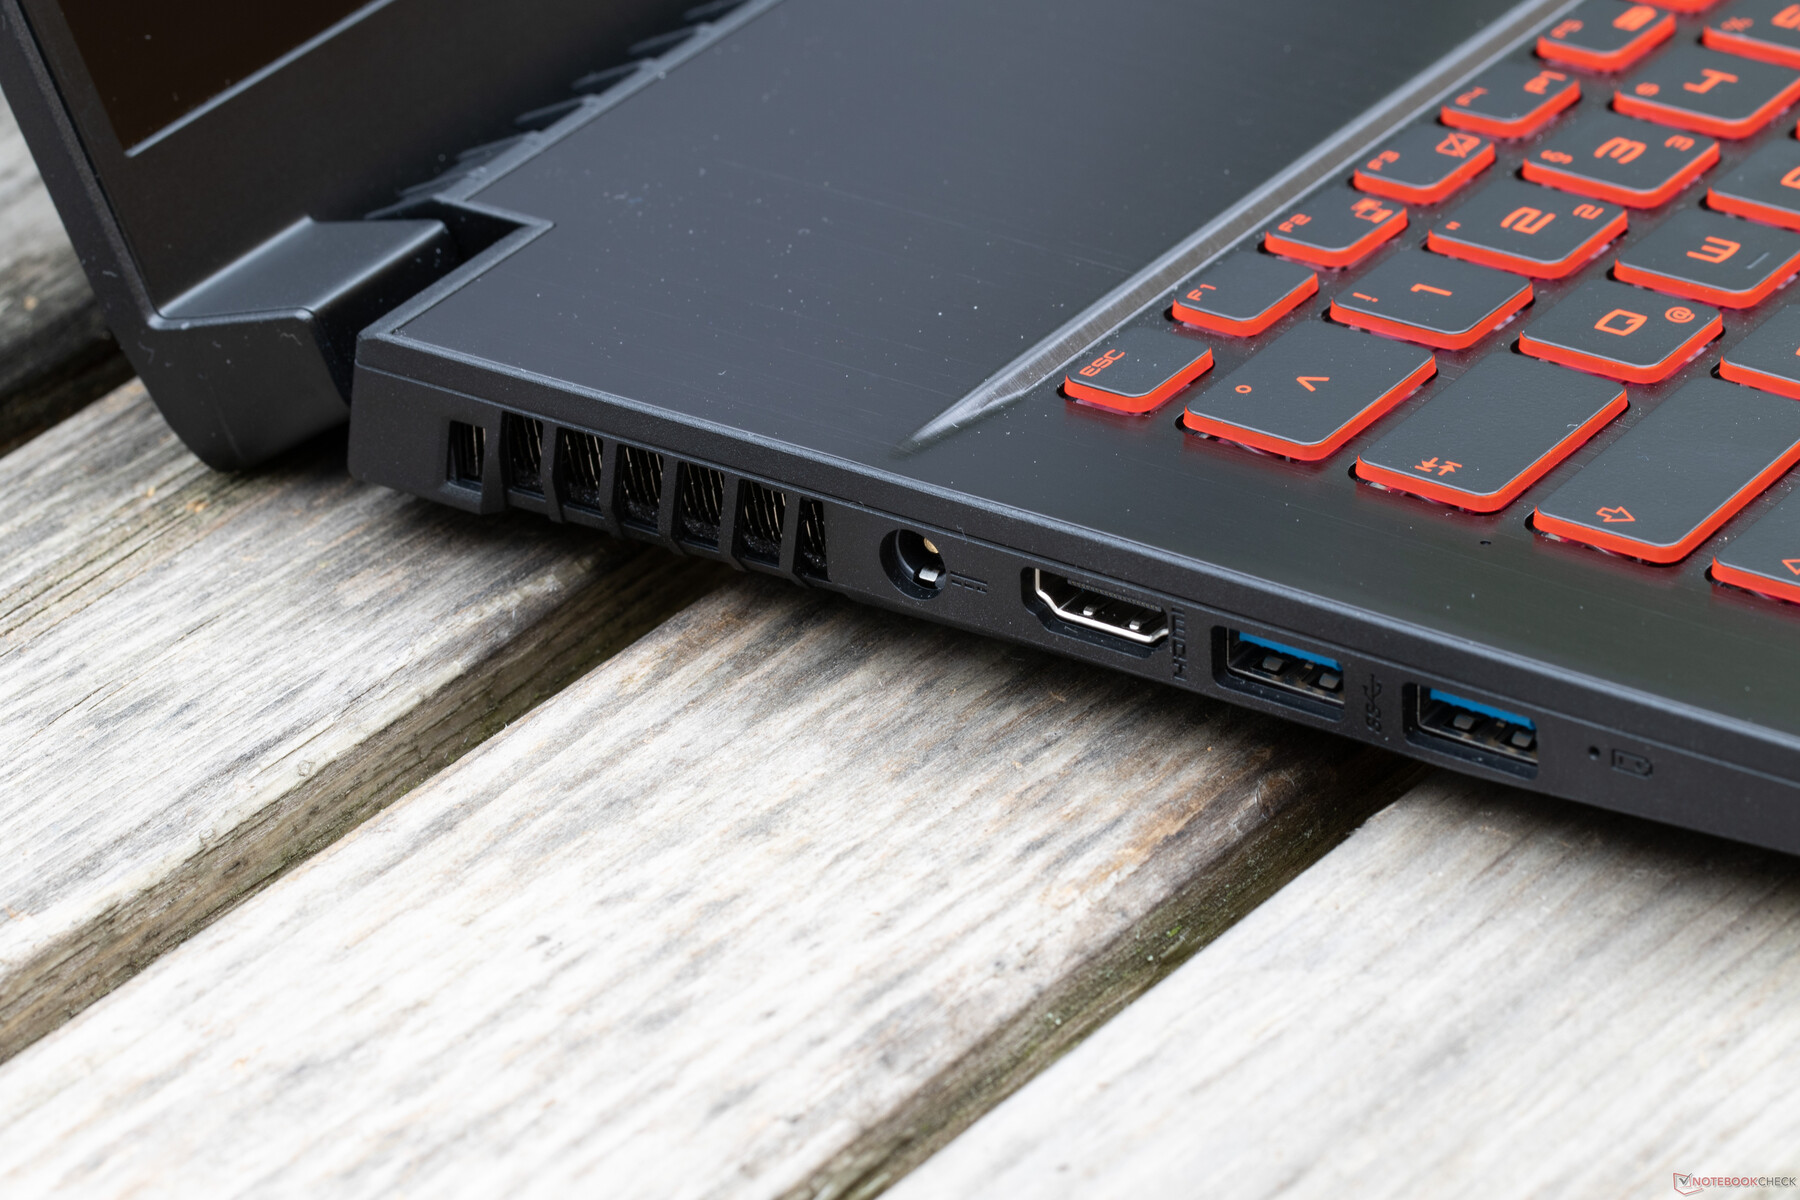
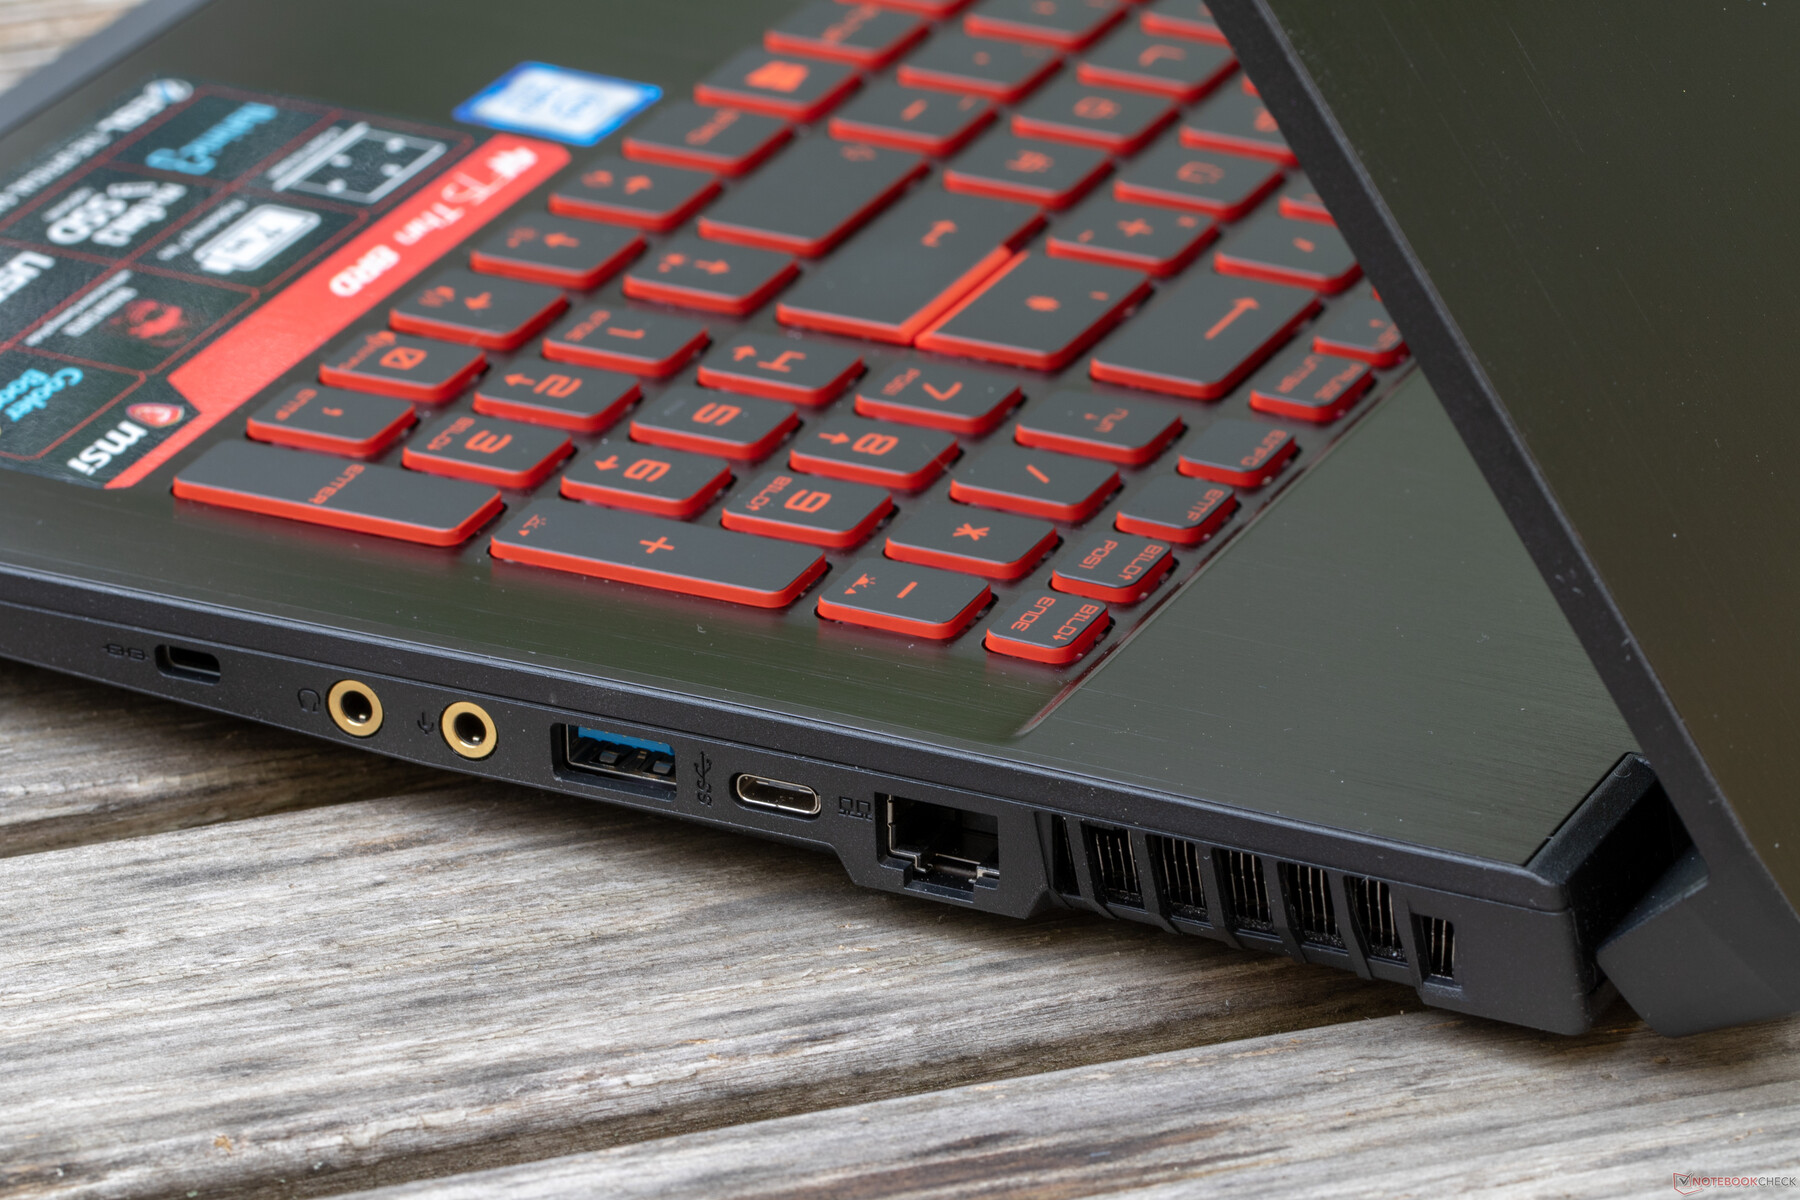
MSI heeft ervoor gekozen om de poorten tot het absolute minimum te beperken. Dit is waarschijnlijk zowel vanwege het dunne ontwerp als om de prijs van het notebook onder een bepaalde grens te houden.
Als je kunt leven zonder Thunderbolt 3 en DisplayPort en geen SD-kaartlezer nodig hebt of speciale beveiligingsfeatures zoals een vingerafdrukscanner nodig hebt, dan zul je zeker blij zijn met dit betaalbare notebook dat komt met een GTX 1050 Ti Max-Q.
Het IPS-beeldscherm is erg goed en kan makkelijk de concurrenten van de GF75 bijhouden. De Cinebench resultaten zijn echter niet zo rooskleurig en de GF75 blijft onderaan hangen. We krijgen de indruk dat de fabrikant teveel bezig was met het in toom houden van het systeemgeluid. De ventilator is erg stil en had een hogere RPM kunnen krijgen. De batterij had ook een grotere capaciteit kunnen krijgen. Hoewel de batterijduur voldoende is voor een 17-inch game notebook die altijd aangesloten is op een stopcontact, zijn de zaken anders voor een mobiel apparaat.
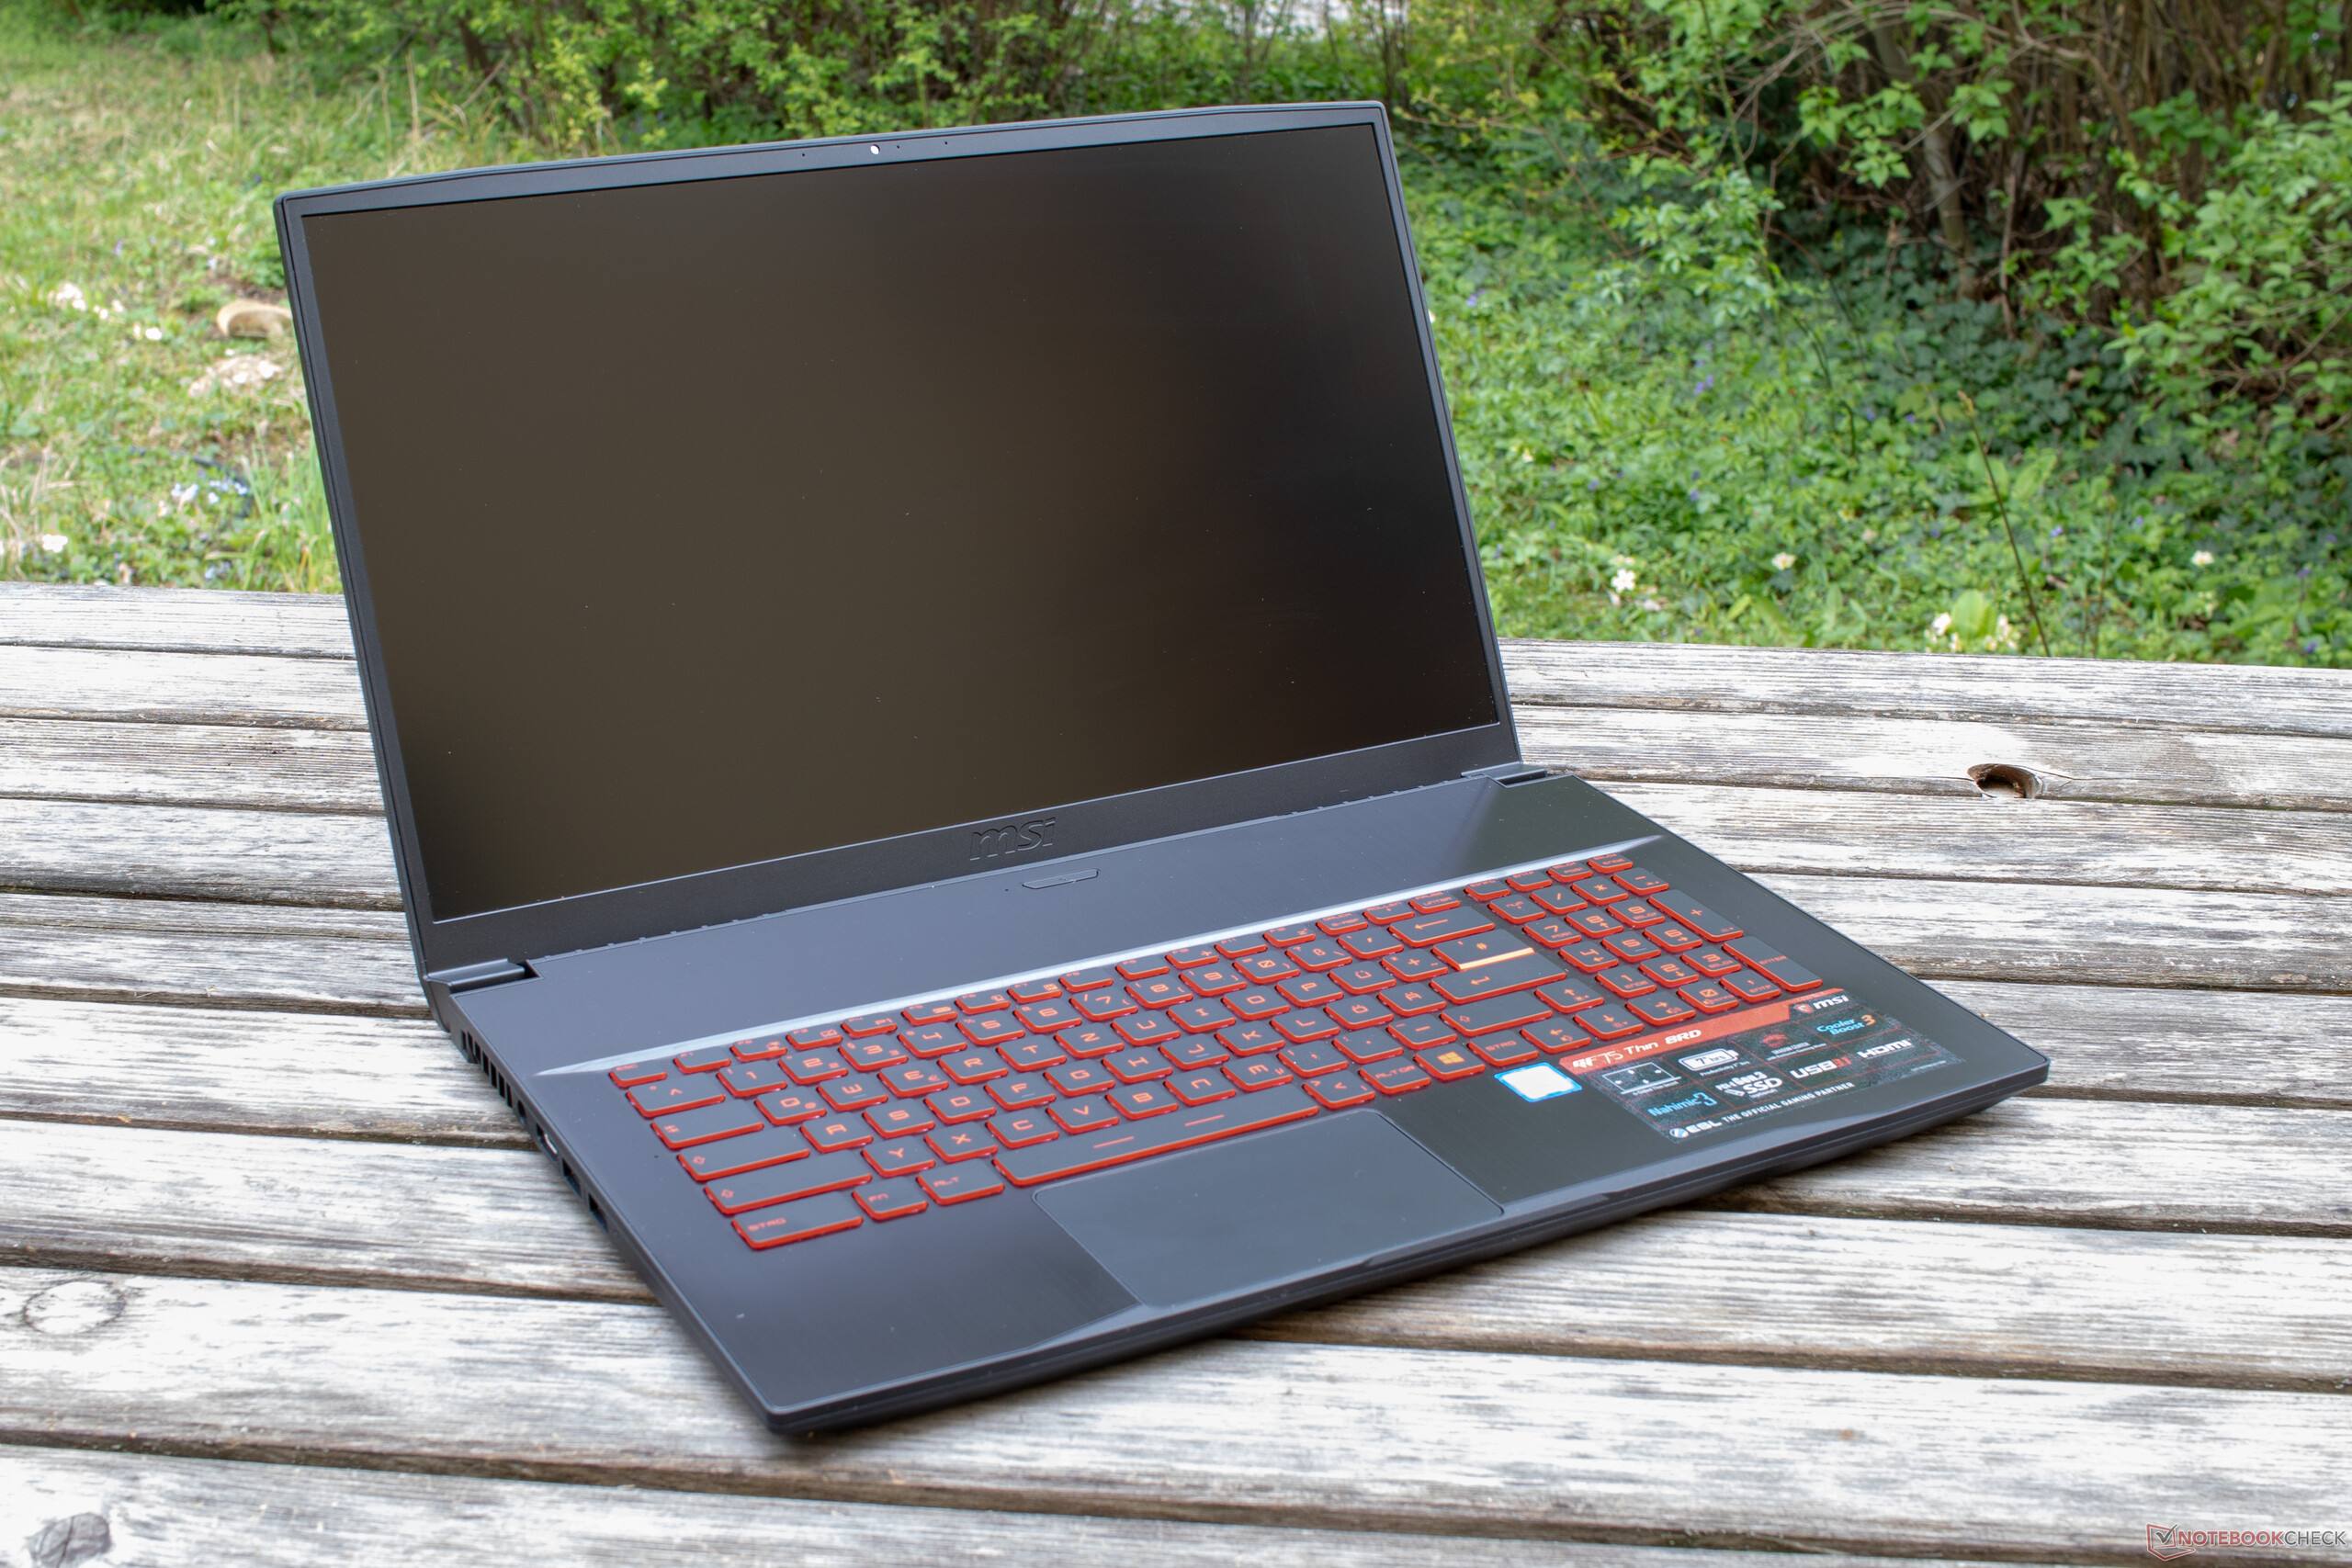
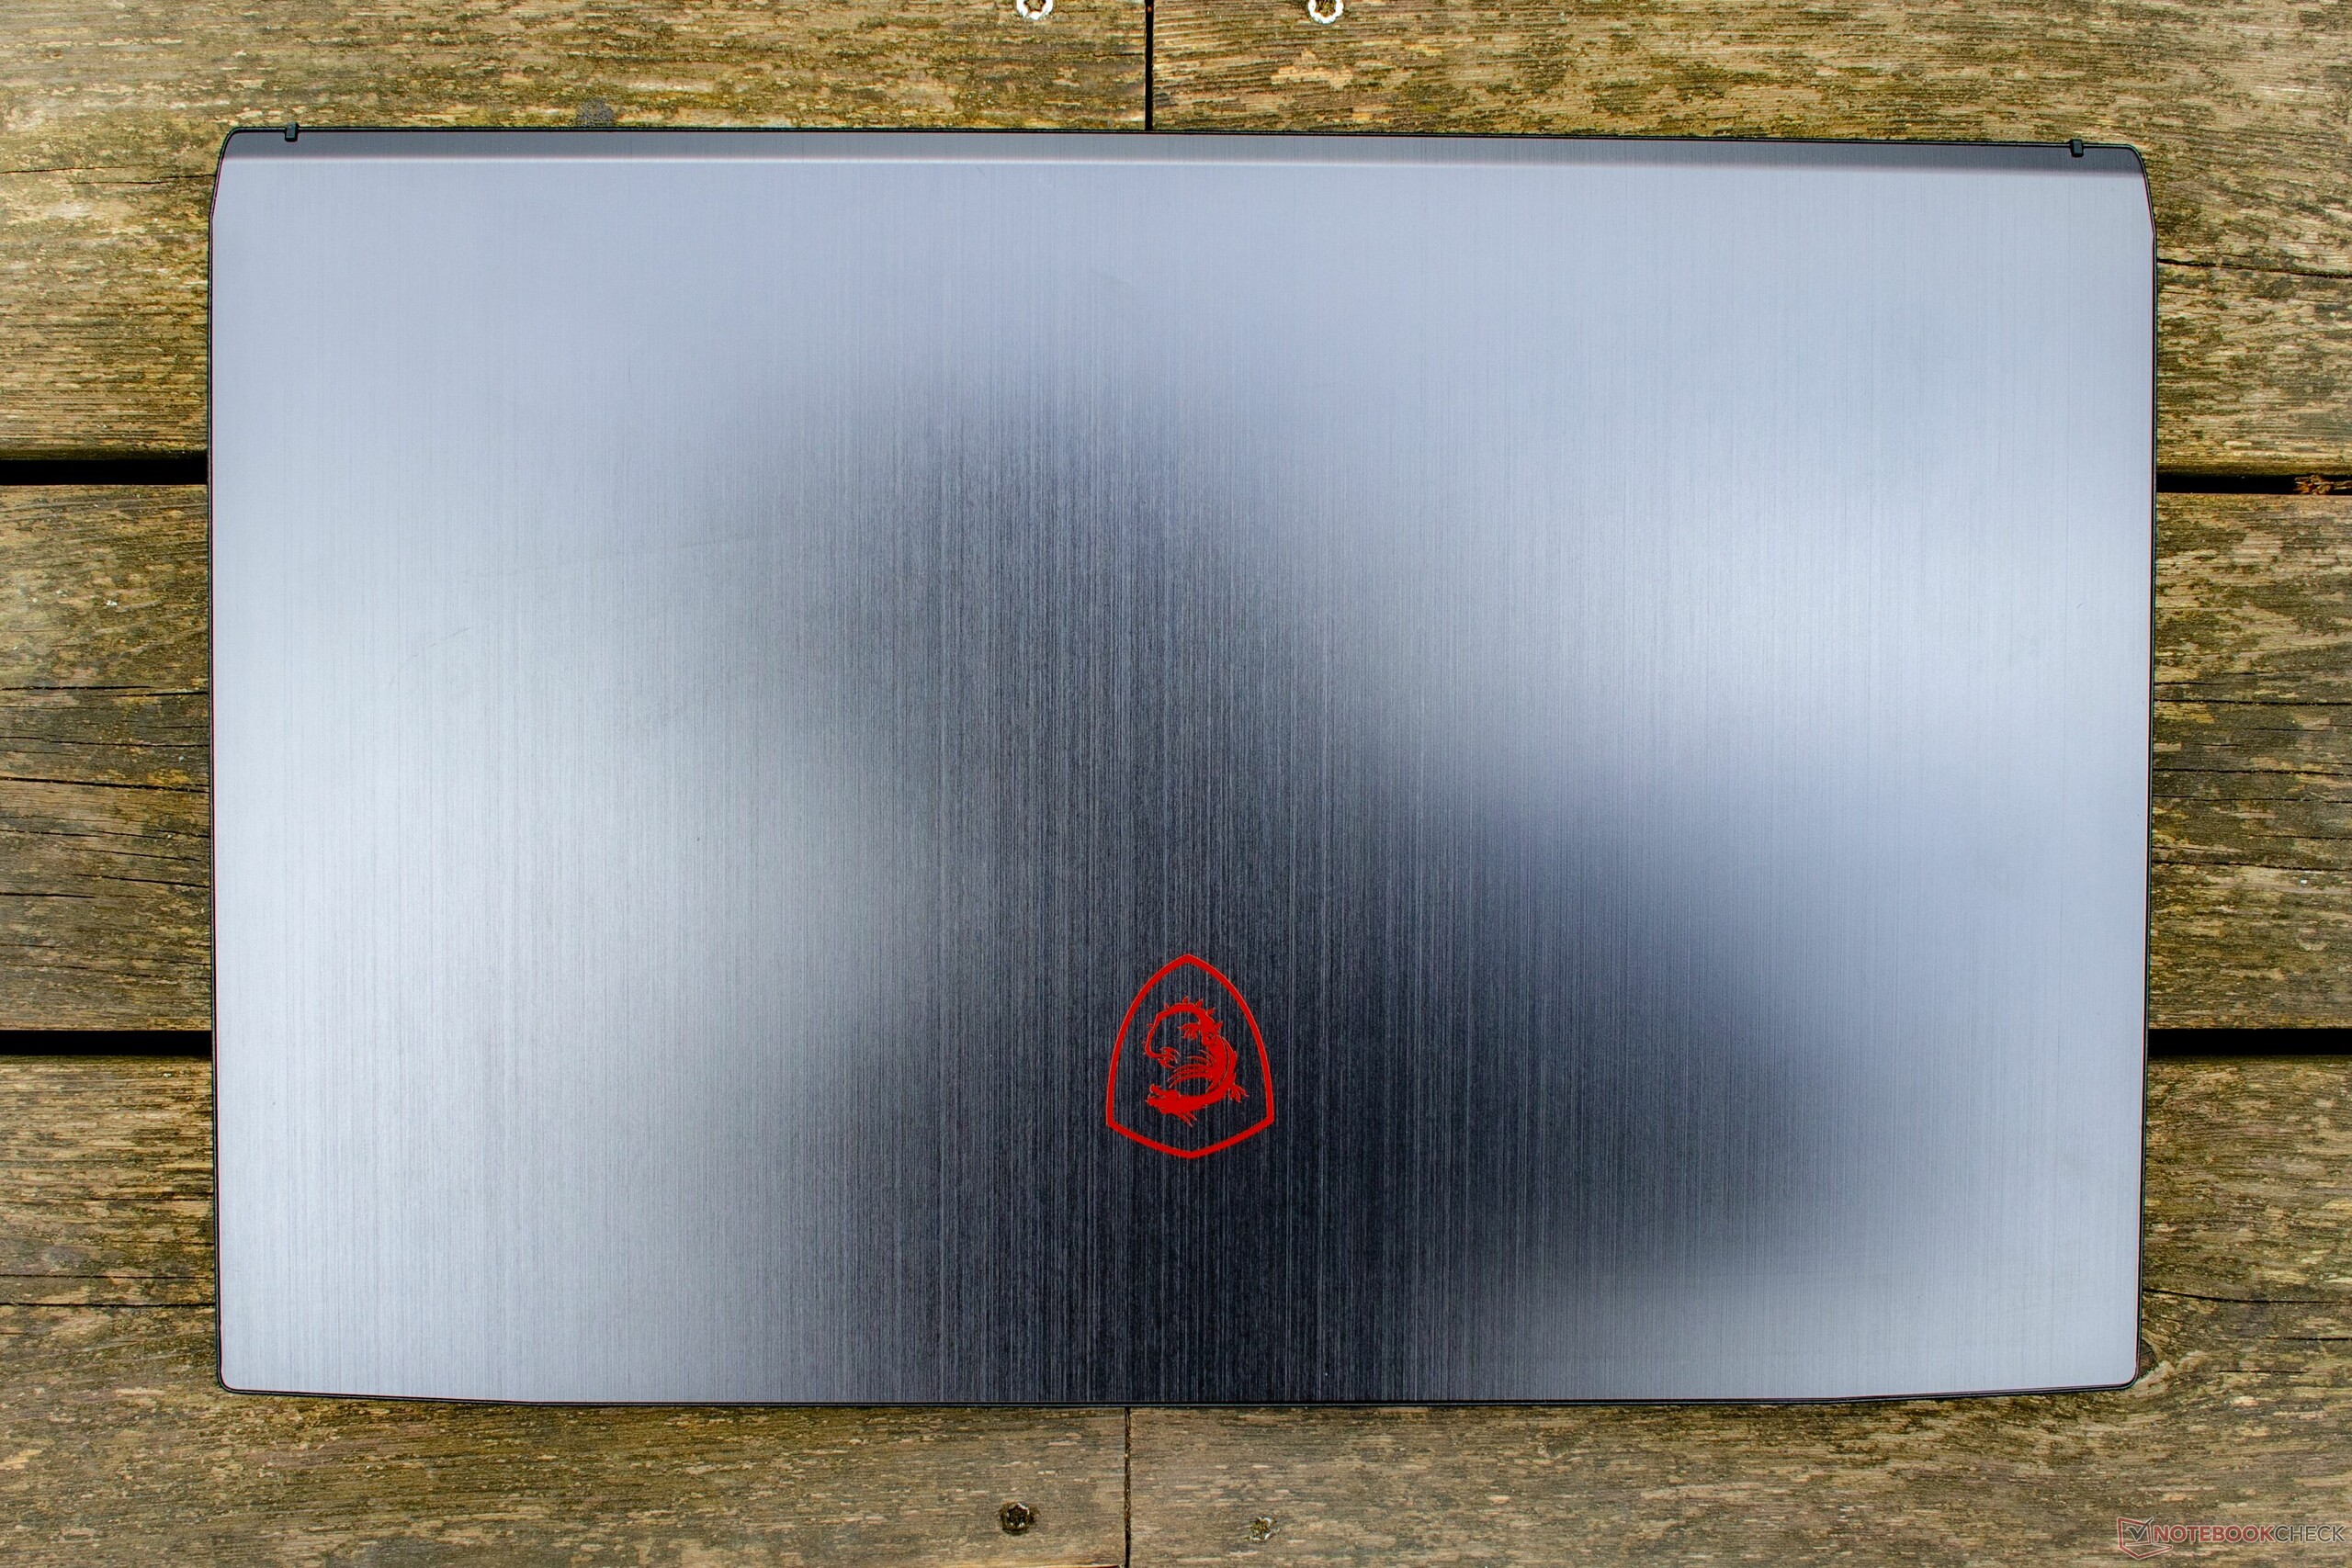
Concluderend kunnen we zeggen dat middenklasse gamers die huidige games spelen erg blij zullen zijn met de prijs/prestatie-verhouding die de MSI GF75 Thin biedt. En het uiterlijk is erg aantrekkelijk. Potentiële kopers zullen voor zichzelf moeten beslissen of ze minpunten als de goedkoop uitziende plastic onderzijde kunnen accepteren. Als dat het geval is, dan zullen ze redelijk snel notebook krijgen met solide prestaties.
MSI GF75 8RD-001
- 30-04-2019 v7 (old)
Daniel Puschina
Price comparison
