Kort testrapport Acer Aspire 7 A715-72G (i7-8750H, GTX 1050 Ti, SSD, FHD) Laptop
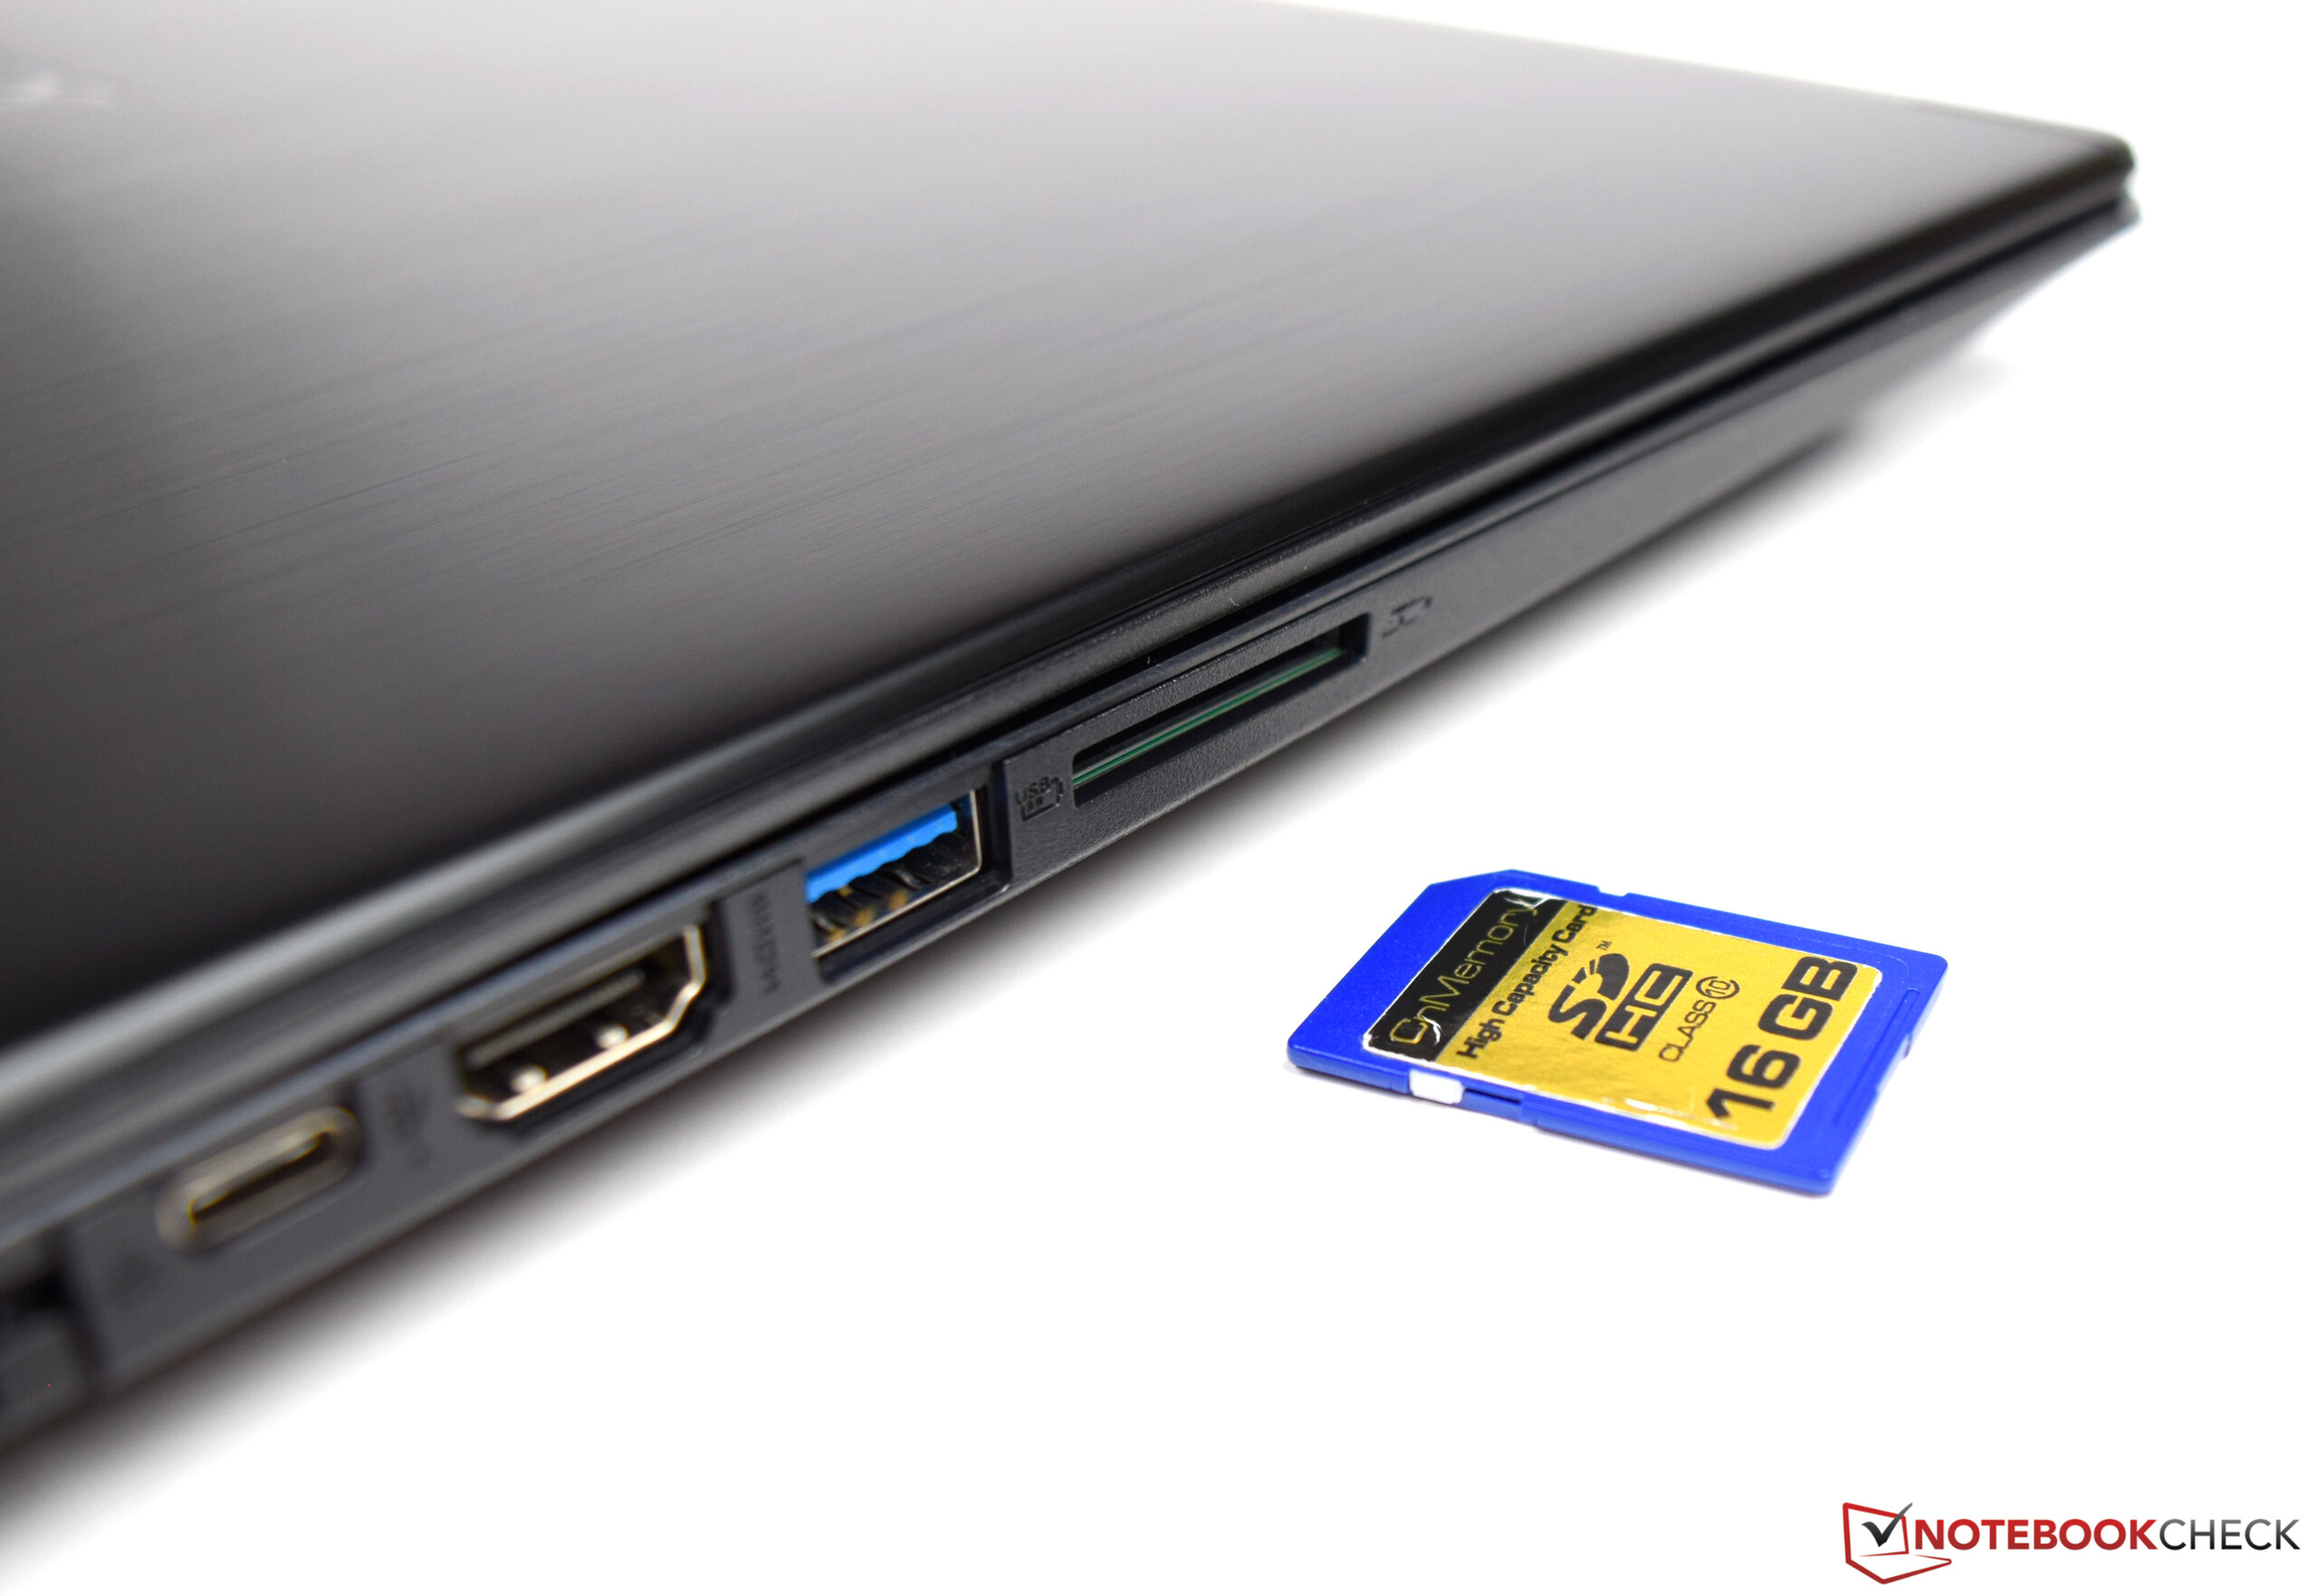
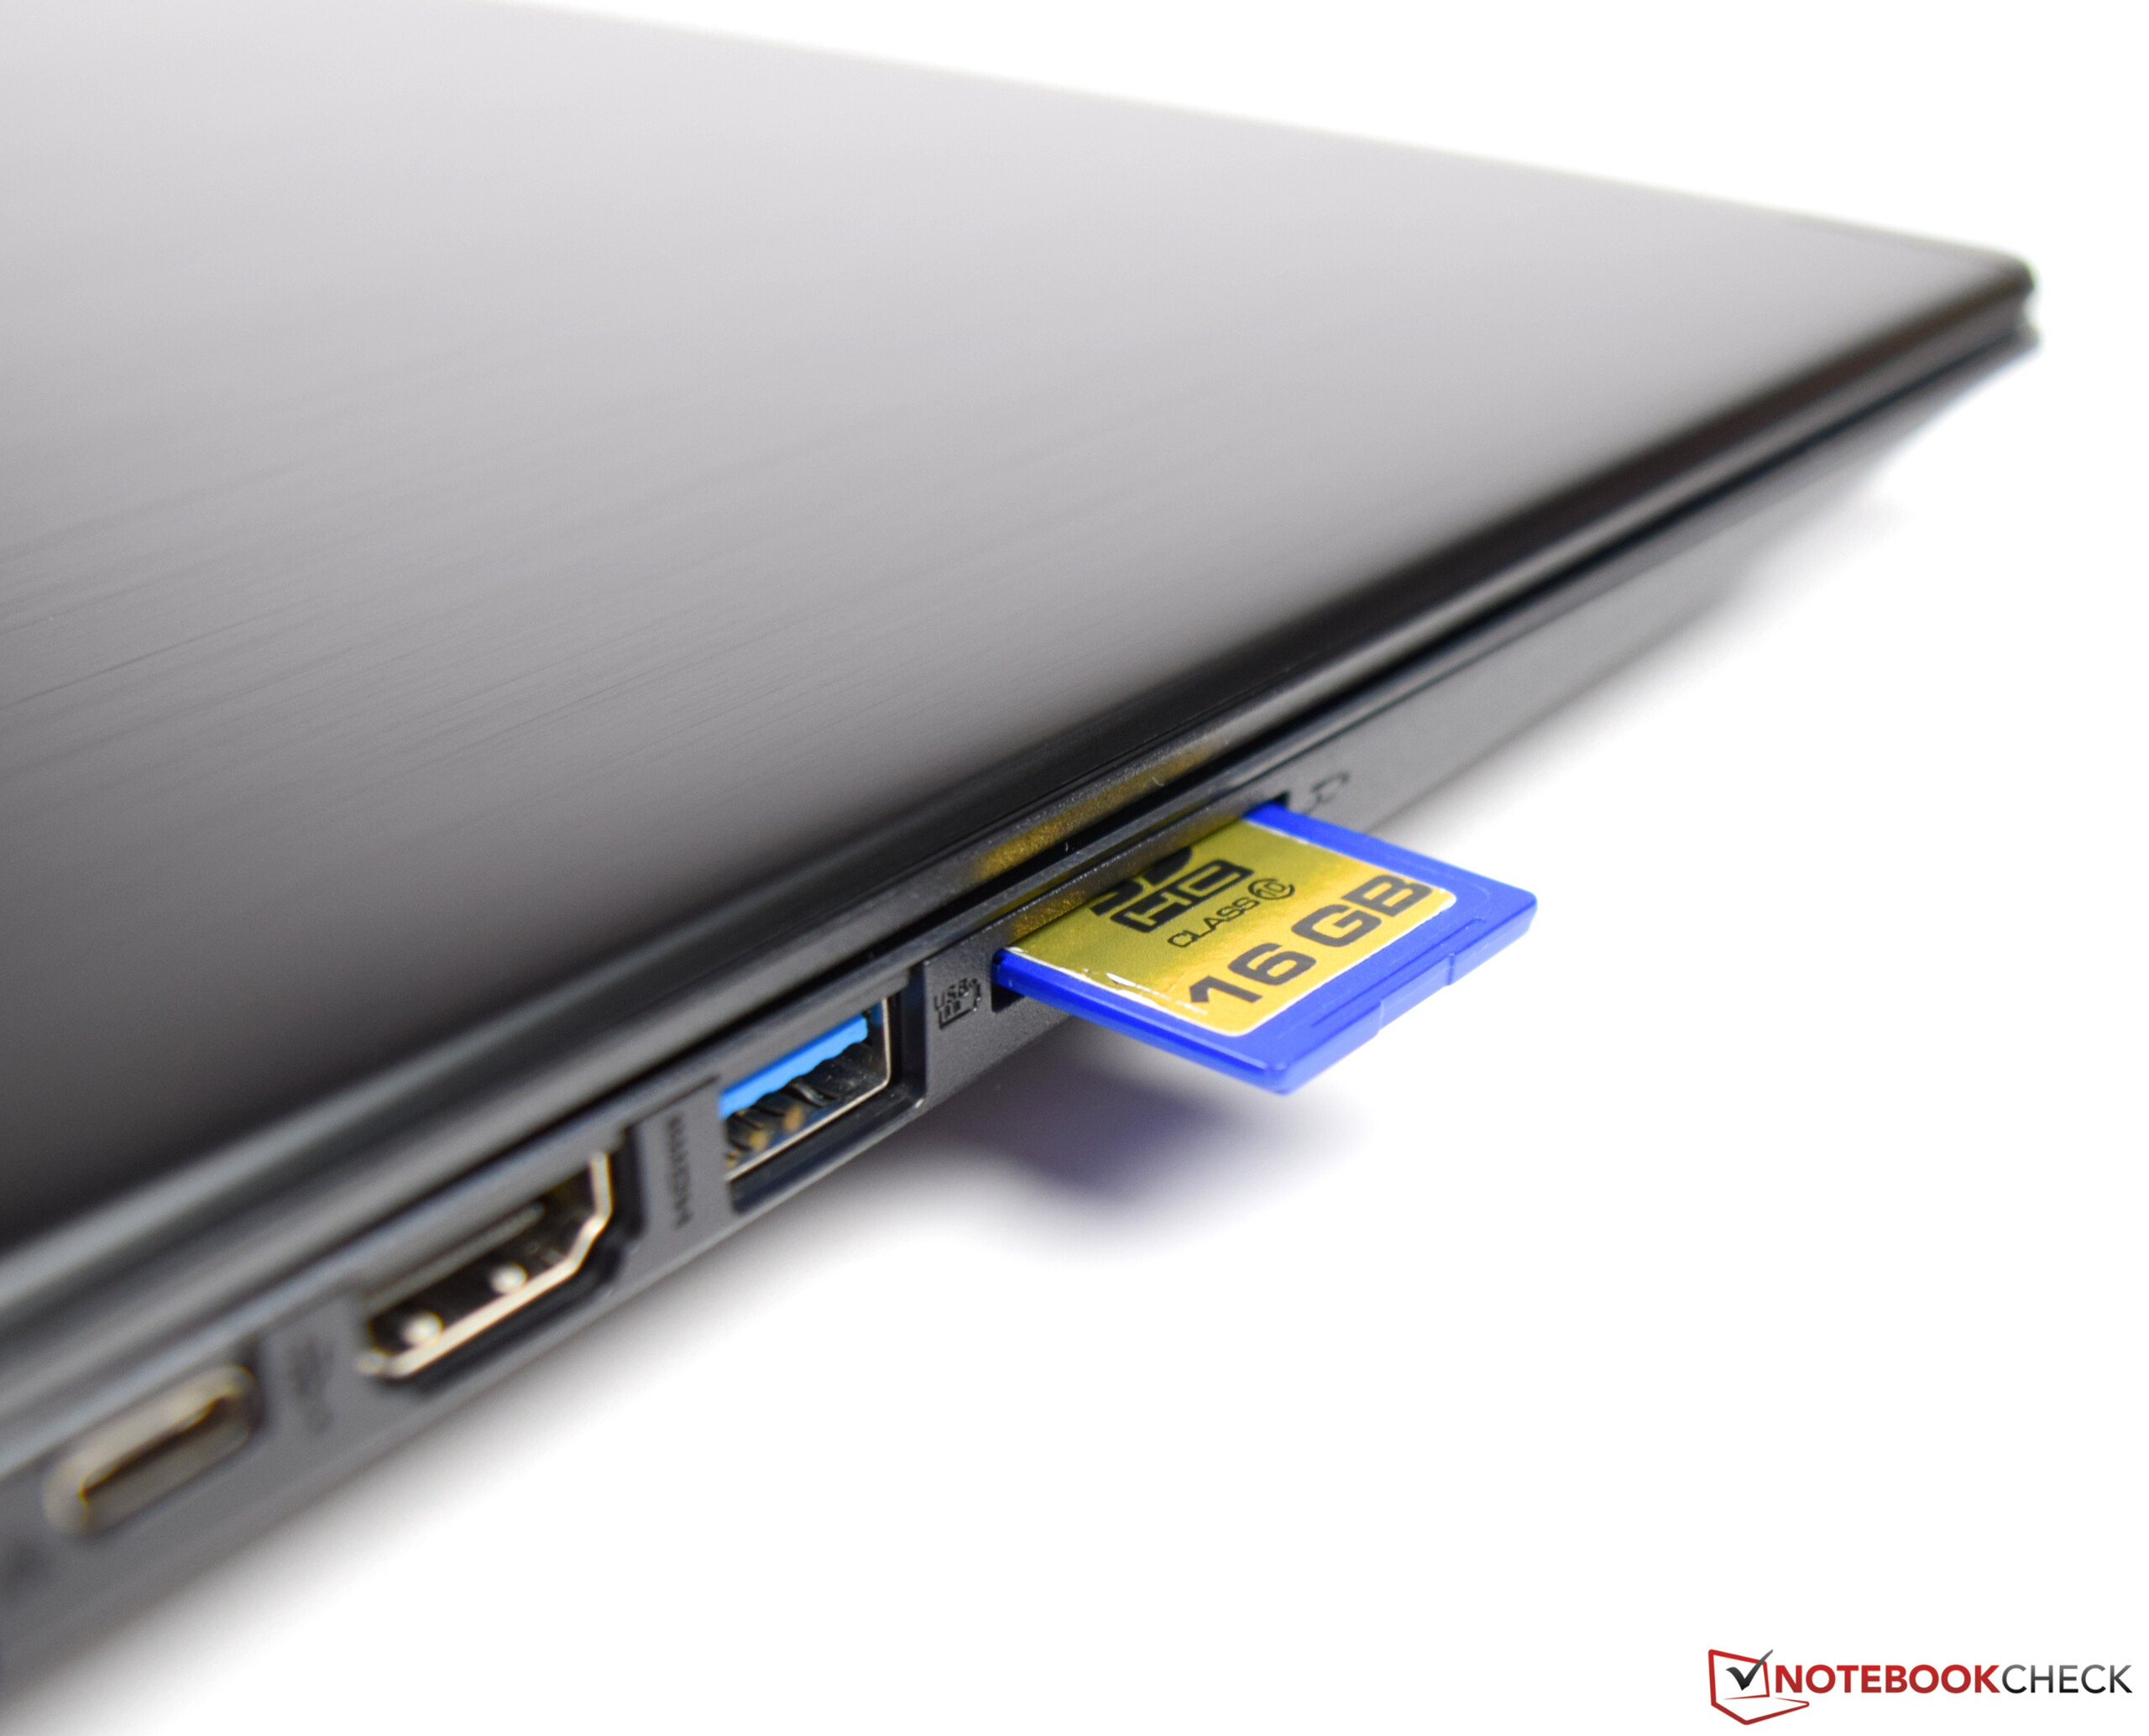
| SD Card Reader | |
| average JPG Copy Test (av. of 3 runs) | |
| Gemiddelde van klas Multimedia (23 - 531, n=36, laatste 2 jaar) | |
| Acer Aspire 7 A715-71G-53TU (Toshiba Exceria Pro SDXC 64 GB UHS-II) | |
| HP Pavilion Gaming 15-cx0003ng (Toshiba Exceria Pro SDXC 64 GB UHS-II) | |
| Acer Aspire 7 A715-72G-704Q (Toshiba Exceria Pro SDXC 64 GB UHS-II) | |
| Dell G3 15 3579 (Toshiba Exceria Pro SDXC 64 GB UHS-II) | |
| maximum AS SSD Seq Read Test (1GB) | |
| Gemiddelde van klas Multimedia (37.3 - 1455, n=35, laatste 2 jaar) | |
| Acer Aspire 7 A715-71G-53TU (Toshiba Exceria Pro SDXC 64 GB UHS-II) | |
| HP Pavilion Gaming 15-cx0003ng (Toshiba Exceria Pro SDXC 64 GB UHS-II) | |
| Acer Aspire 7 A715-72G-704Q (Toshiba Exceria Pro SDXC 64 GB UHS-II) | |
| Dell G3 15 3579 (Toshiba Exceria Pro SDXC 64 GB UHS-II) | |
| |||||||||||||||||||||||||
Helderheidsverdeling: 81 %
Helderheid in Batterij-modus: 276 cd/m²
Contrast: 500:1 (Zwart: 0.56 cd/m²)
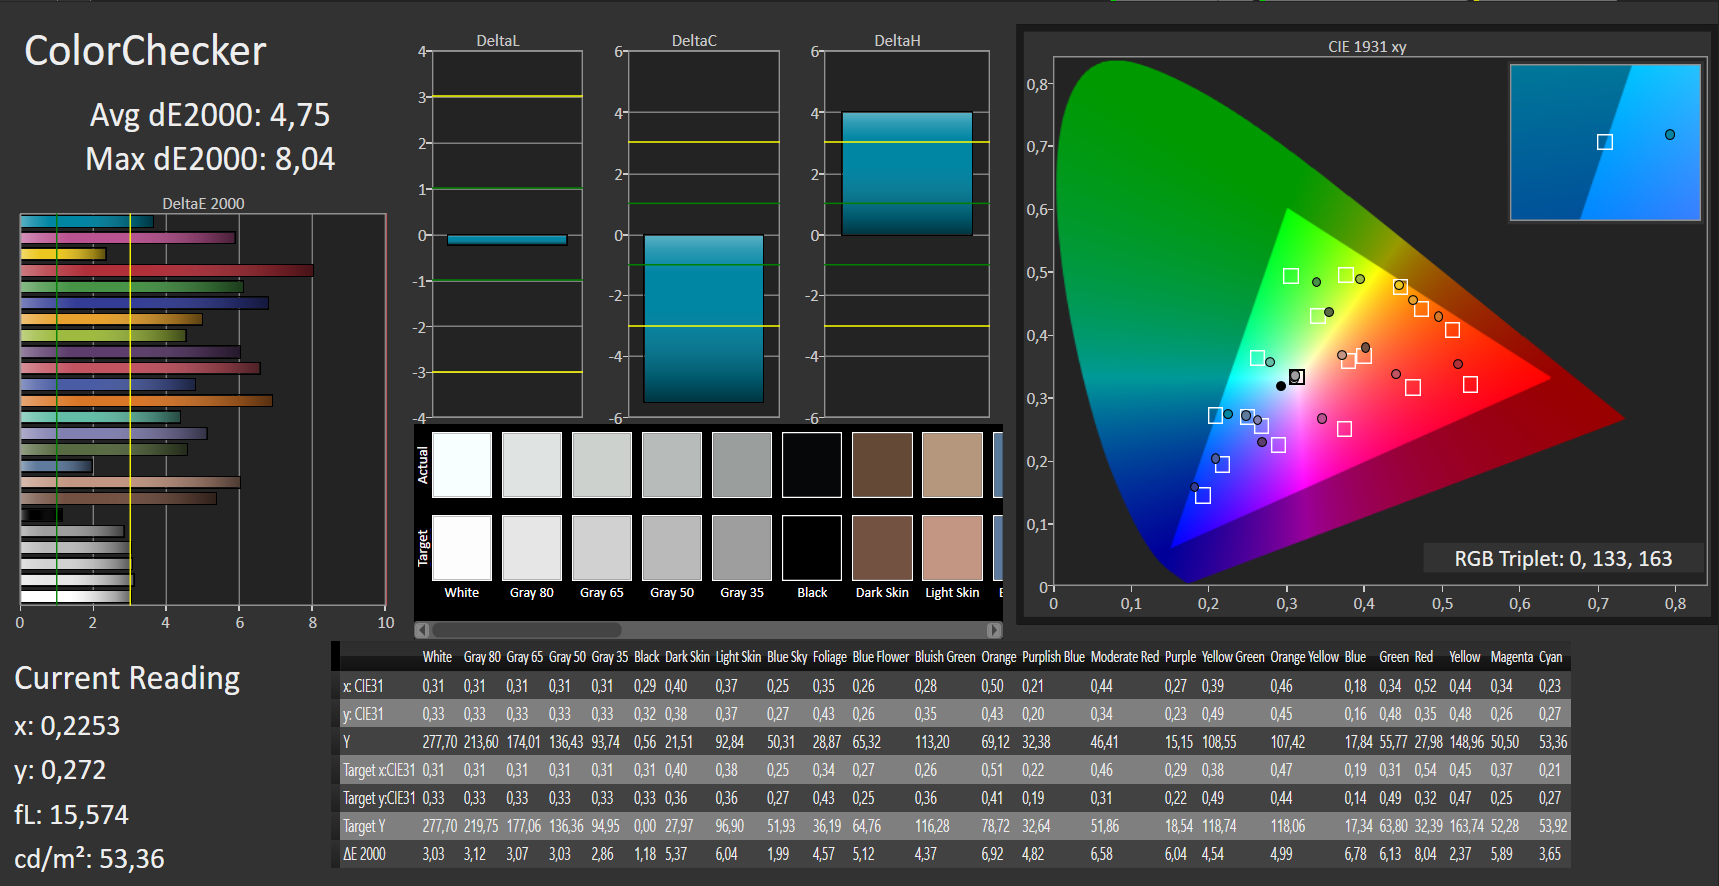
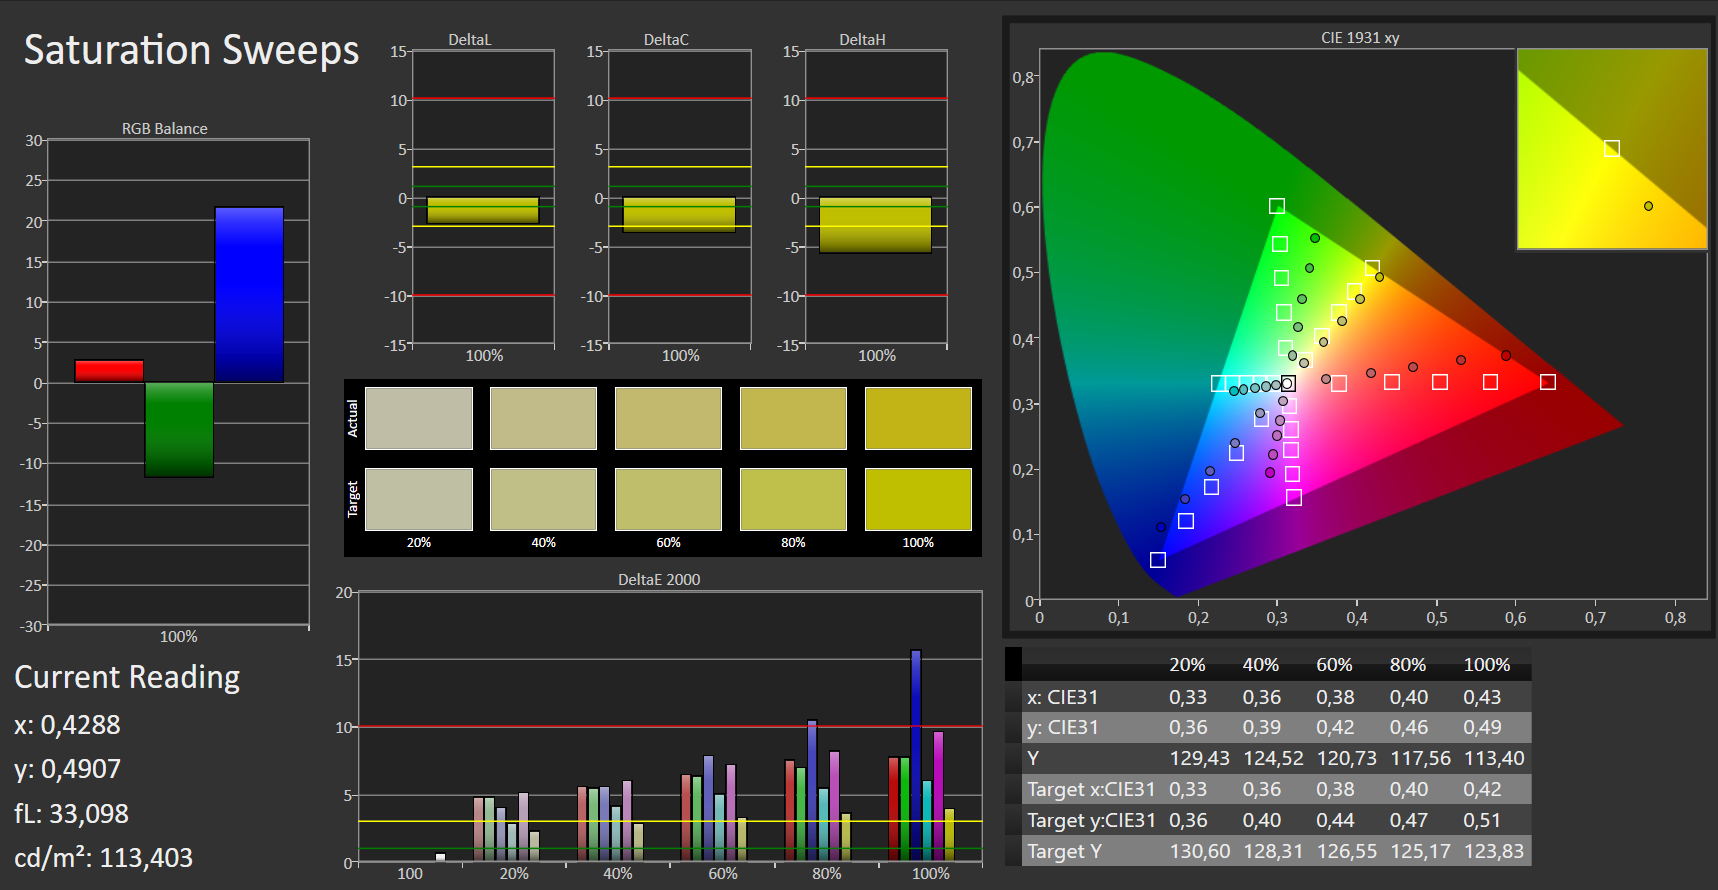
ΔE ColorChecker Calman: 4.75 | ∀{0.5-29.43 Ø4.71}
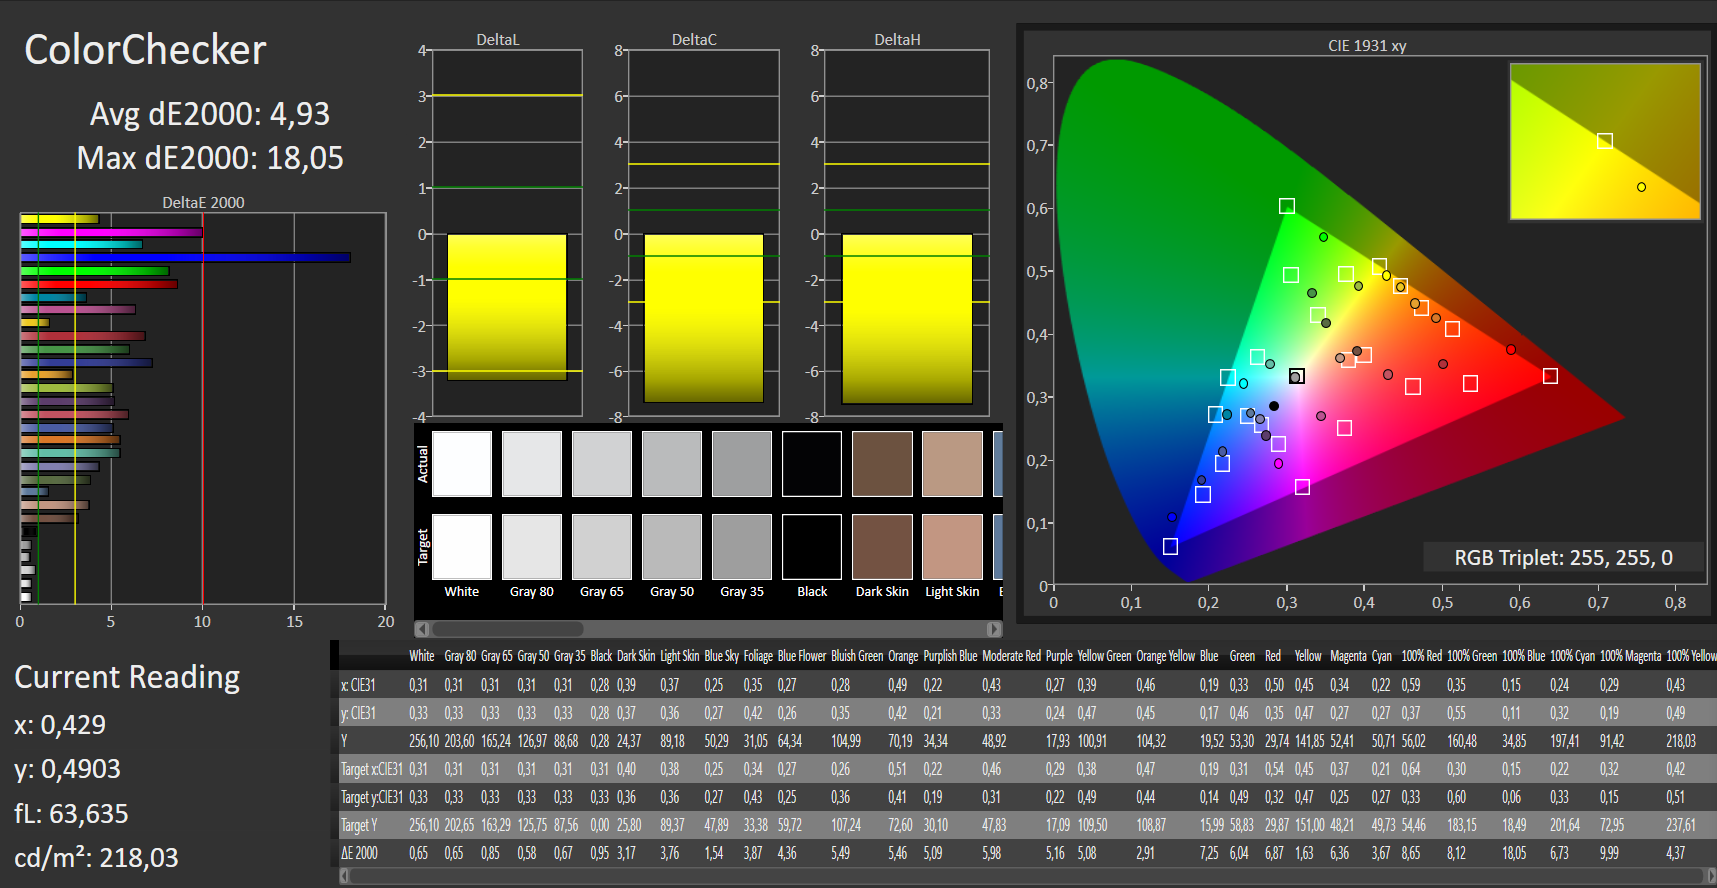
calibrated: 4.93
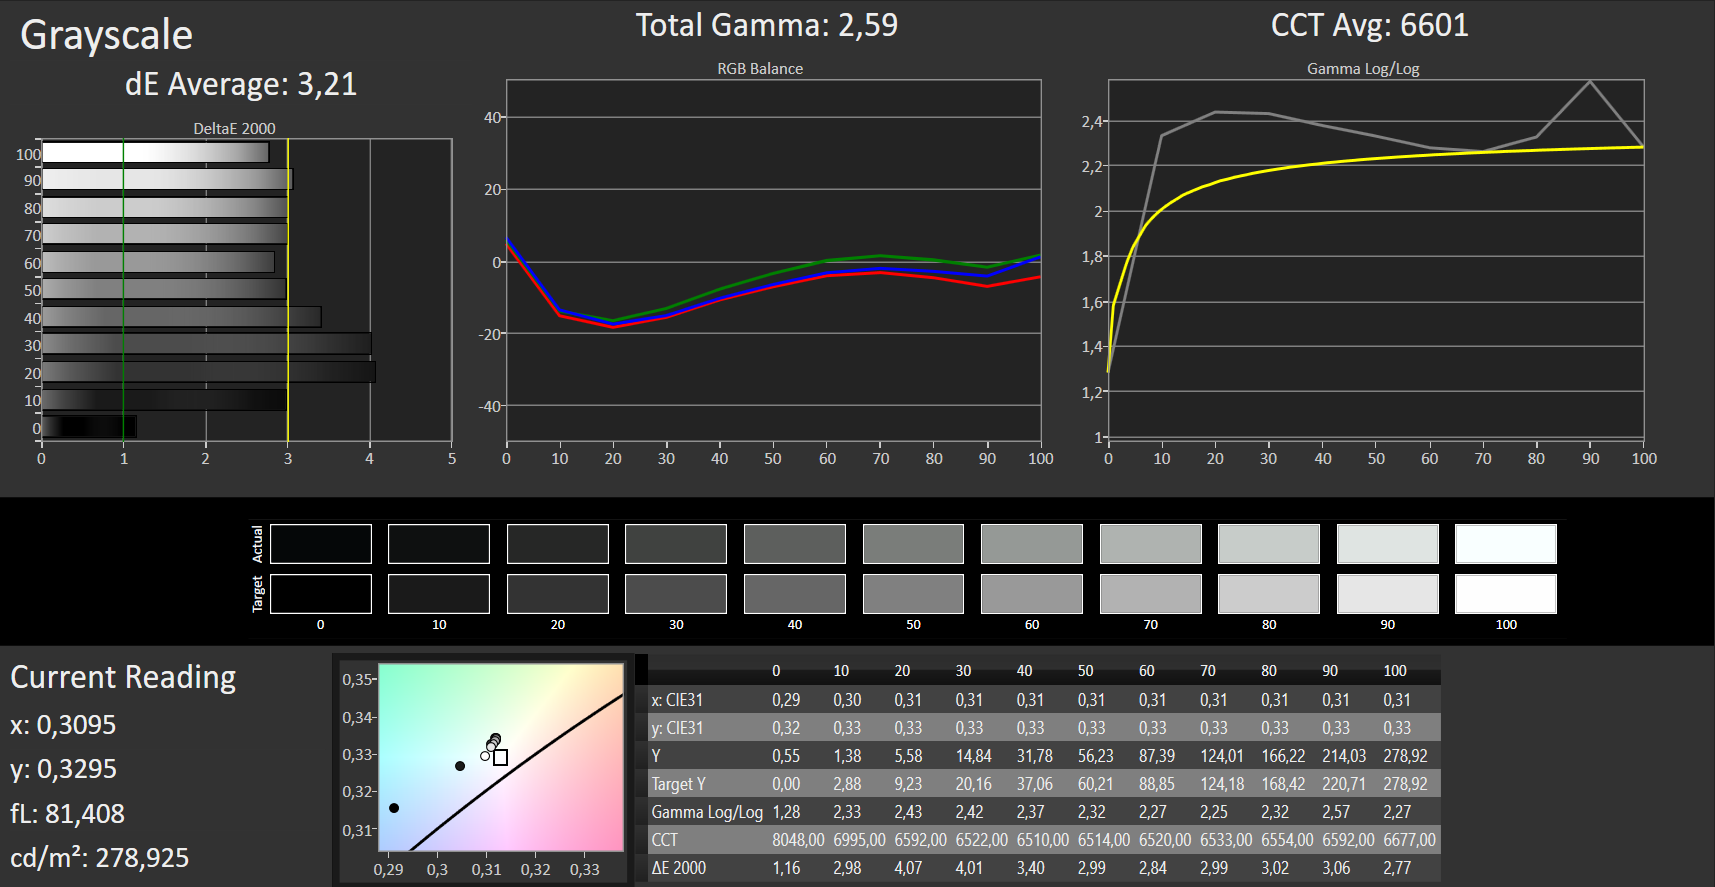
ΔE Greyscale Calman: 3.21 | ∀{0.09-98 Ø4.96}
57% sRGB (Argyll 1.6.3 3D)
36% AdobeRGB 1998 (Argyll 1.6.3 3D)
39.65% AdobeRGB 1998 (Argyll 3D)
57.5% sRGB (Argyll 3D)
38.34% Display P3 (Argyll 3D)
Gamma: 2.59
CCT: 6601 K
| Acer Aspire 7 A715-72G-704Q IPS, 1920x1080, 15.6" | Acer Aspire 7 A715-71G-53TU a-Si TFT-LCD, IPS, 1920x1080, 15.6" | HP Pavilion Gaming 15-cx0003ng IPS, 1920x1080, 15.6" | Dell G3 15 3579 IPS, 1920x1080, 15.6" | Lenovo Legion Y730-15ICH i5-8300H IPS, 1920x1080, 15.6" | |
|---|---|---|---|---|---|
| Display | 5% | 4% | 0% | 60% | |
| Display P3 Coverage (%) | 38.34 | 40.53 6% | 39.72 4% | 38.48 0% | 65.9 72% |
| sRGB Coverage (%) | 57.5 | 59.9 4% | 59.3 3% | 57.9 1% | 85.5 49% |
| AdobeRGB 1998 Coverage (%) | 39.65 | 41.87 6% | 41.04 4% | 39.75 0% | 62.5 58% |
| Response Times | -45% | -32% | 5% | -45% | |
| Response Time Grey 50% / Grey 80% * (ms) | 35 ? | 49 ? -40% | 47 ? -34% | 32.4 ? 7% | 43.2 ? -23% |
| Response Time Black / White * (ms) | 24 ? | 36 ? -50% | 31 ? -29% | 23.2 ? 3% | 40 ? -67% |
| PWM Frequency (Hz) | 20000 ? | 208 ? | 21740 ? | ||
| Screen | 14% | 21% | -7% | 11% | |
| Brightness middle (cd/m²) | 280 | 267 -5% | 241 -14% | 208.2 -26% | 286.5 2% |
| Brightness (cd/m²) | 248 | 250 1% | 236 -5% | 203 -18% | 269 8% |
| Brightness Distribution (%) | 81 | 82 1% | 75 -7% | 81 0% | 84 4% |
| Black Level * (cd/m²) | 0.56 | 0.31 45% | 0.15 73% | 0.34 39% | 0.33 41% |
| Contrast (:1) | 500 | 861 72% | 1607 221% | 612 22% | 868 74% |
| Colorchecker dE 2000 * | 4.75 | 4.65 2% | 4.85 -2% | 4.65 2% | 6.3 -33% |
| Colorchecker dE 2000 max. * | 8.04 | 8.2 -2% | 8.82 -10% | 15.99 -99% | 10.01 -25% |
| Colorchecker dE 2000 calibrated * | 4.93 | 3.84 22% | 4.17 15% | ||
| Greyscale dE 2000 * | 3.21 | 2.65 17% | 5.15 -60% | 4.1 -28% | 5.6 -74% |
| Gamma | 2.59 85% | 2.44 90% | 2.49 88% | 2.3 96% | 2.23 99% |
| CCT | 6601 98% | 6820 95% | 7042 92% | 7352 88% | 6822 95% |
| Color Space (Percent of AdobeRGB 1998) (%) | 36 | 38 6% | 38 6% | 36.7 2% | 55.7 55% |
| Color Space (Percent of sRGB) (%) | 57 | 59 4% | 59 4% | 57.9 2% | 85.1 49% |
| Totaal Gemiddelde (Programma / Instellingen) | -9% /
4% | -2% /
10% | -1% /
-4% | 9% /
13% |
* ... kleiner is beter
Screen Flickering / PWM (Pulse-Width Modulation)
| Screen flickering / PWM niet waargenomen | 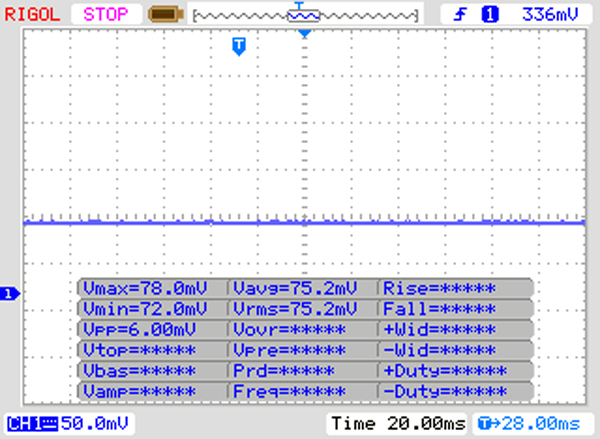 | ||
Ter vergelijking: 52 % van alle geteste toestellen maakten geen gebruik van PWM om de schermhelderheid te verlagen. Als het wel werd gebruikt, werd een gemiddelde van 7748 (minimum: 5 - maximum: 343500) Hz waargenomen. | |||

Responstijd Scherm
| ↔ Responstijd Zwart naar Wit | ||
|---|---|---|
| 24 ms ... stijging ↗ en daling ↘ gecombineerd | ↗ 14 ms stijging | 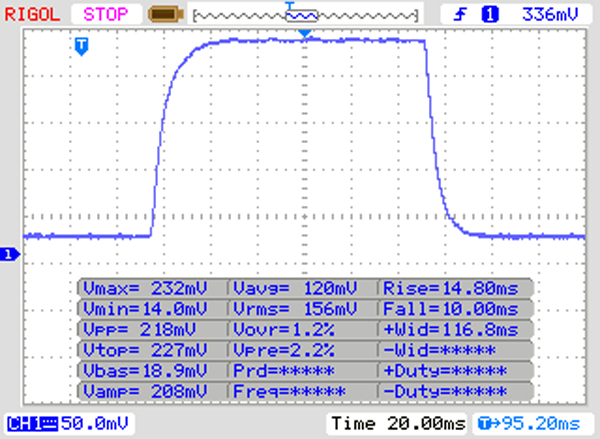 |
| ↘ 10 ms daling | ||
| Het scherm vertoonde prima responstijden in onze tests maar is misschien wat te traag voor competitieve games. Ter vergelijking: alle testtoestellen variëren van 0.1 (minimum) tot 240 (maximum) ms. » 54 % van alle toestellen zijn beter. Dit betekent dat de gemeten responstijd slechter is dan het gemiddelde (19.8 ms) van alle geteste toestellen. | ||
| ↔ Responstijd 50% Grijs naar 80% Grijs | ||
| 35 ms ... stijging ↗ en daling ↘ gecombineerd | ↗ 17 ms stijging | 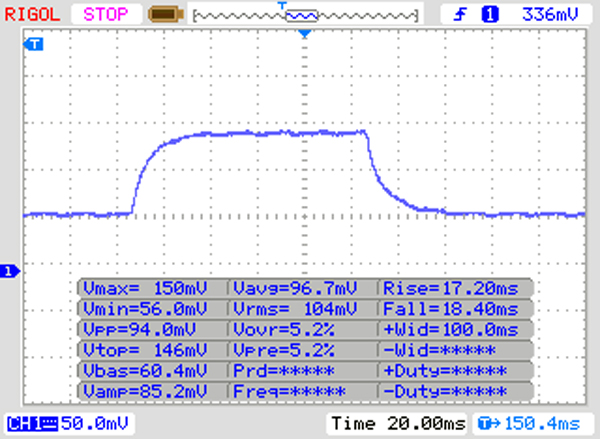 |
| ↘ 18 ms daling | ||
| Het scherm vertoonde trage responstijden in onze tests en is misschien te traag voor games. Ter vergelijking: alle testtoestellen variëren van 0.165 (minimum) tot 636 (maximum) ms. » 49 % van alle toestellen zijn beter. Dit betekent dat de gemeten responstijd slechter is dan het gemiddelde (30.9 ms) van alle geteste toestellen. | ||

| Geekbench 3 | |
| 32 Bit Multi-Core Score | |
| Gemiddeld Intel Core i7-8750H (20725 - 22665, n=13) | |
| HP Pavilion Gaming 15-cx0003ng | |
| Acer Aspire 7 A715-72G-704Q | |
| 32 Bit Single-Core Score | |
| Gemiddeld Intel Core i7-8750H (3734 - 4163, n=13) | |
| HP Pavilion Gaming 15-cx0003ng | |
| Acer Aspire 7 A715-72G-704Q | |
| Mozilla Kraken 1.1 - Total | |
| Dell G3 15 3579 (Edge 42.17134.1.0) | |
| Acer Aspire 7 A715-72G-704Q (Edge 44) | |
| Lenovo Legion Y730-15ICH i5-8300H (Edge 42.17134.1.0) | |
| Gemiddeld Intel Core i7-8750H (695 - 1272, n=50) | |
| HP Pavilion Gaming 15-cx0003ng | |
| Acer Aspire 7 A715-71G-53TU (EDGE: 41.16299.15.0) | |
| Gemiddelde van klas Multimedia (228 - 835, n=65, laatste 2 jaar) | |
| Octane V2 - Total Score | |
| Gemiddelde van klas Multimedia (79641 - 153175, n=29, laatste 2 jaar) | |
| Acer Aspire 7 A715-71G-53TU (EDGE: 41.16299.15.0) | |
| Acer Aspire 7 A715-72G-704Q (Edge 44) | |
| HP Pavilion Gaming 15-cx0003ng | |
| Gemiddeld Intel Core i7-8750H (27460 - 44549, n=47) | |
| Lenovo Legion Y730-15ICH i5-8300H (Edge 42.17134.1.0) | |
| Dell G3 15 3579 (Edge 42.17134.1.0) | |
| JetStream 1.1 - 1.1 Total | |
| Gemiddelde van klas Multimedia (n=1laatste 2 jaar) | |
| Acer Aspire 7 A715-71G-53TU (EDGE: 41.16299.15.0) | |
| Acer Aspire 7 A715-72G-704Q (Edge 44) | |
| HP Pavilion Gaming 15-cx0003ng (Edge 44) | |
| Gemiddeld Intel Core i7-8750H (205 - 299, n=49) | |
| Dell G3 15 3579 (Edge 42.17134.1.0) | |
| Lenovo Legion Y730-15ICH i5-8300H (Edge 42.17134.1.0) | |
* ... kleiner is beter
| PCMark 7 Score | 6380 punten | |
| PCMark 8 Home Score Accelerated v2 | 4125 punten | |
| PCMark 8 Creative Score Accelerated v2 | 5255 punten | |
| PCMark 8 Work Score Accelerated v2 | 5310 punten | |
| PCMark 10 Score | 5162 punten | |
Help | ||

| Acer Aspire 7 A715-72G-704Q Intel SSD 760p SSDPEKKW256G8 | Acer Aspire 7 A715-71G-53TU Kingston RBUSNS8180DS3128GH | HP Pavilion Gaming 15-cx0003ng Intel Optane 16 GB MEMPEK1J016GAH + HGST HTS721010A9E630 1 TB HDD | Dell G3 15 3579 Seagate Mobile HDD 1TB ST1000LX015-1U7172 | Lenovo Legion Y730-15ICH i5-8300H Intel Optane 16 GB MEMPEK1J016GAL + HGST ST1000LM049 1 TB HDD | Gemiddeld Intel SSD 760p SSDPEKKW256G8 | |
|---|---|---|---|---|---|---|
| CrystalDiskMark 5.2 / 6 | -41% | -38% | -96% | -28% | 35% | |
| Write 4K (MB/s) | 103.4 | 74.3 -28% | 59.2 -43% | 0.202 -100% | 66.9 -35% | 148.8 ? 44% |
| Read 4K (MB/s) | 56 | 18.65 -67% | 91.3 63% | 0.461 -99% | 118.5 112% | 64.8 ? 16% |
| Write Seq (MB/s) | 808 | 405.8 -50% | 158.3 -80% | 53.5 -93% | 157.7 -80% | 956 ? 18% |
| Read Seq (MB/s) | 1939 | 480.7 -75% | 880 -55% | 107.2 -94% | 886 -54% | 2325 ? 20% |
| Write 4K Q32T1 (MB/s) | 281.3 | 235.7 -16% | 161.8 -42% | 0.882 -100% | 162.4 -42% | 381 ? 35% |
| Read 4K Q32T1 (MB/s) | 326.5 | 307.2 -6% | 286.5 -12% | 1.057 -100% | 353 8% | 462 ? 42% |
| Write Seq Q32T1 (MB/s) | 474.1 | 451.6 -5% | 159.8 -66% | 63.7 -87% | 159.8 -66% | 954 ? 101% |
| Read Seq Q32T1 (MB/s) | 2735 | 520 -81% | 929 -66% | 77.1 -97% | 926 -66% | 2848 ? 4% |
| 3DMark 06 Standard Score | 34938 punten | |
| 3DMark 11 Performance | 9518 punten | |
| 3DMark Ice Storm Standard Score | 108541 punten | |
| 3DMark Cloud Gate Standard Score | 27353 punten | |
| 3DMark Fire Strike Score | 6997 punten | |
| 3DMark Fire Strike Extreme Score | 3647 punten | |
| 3DMark Time Spy Score | 2595 punten | |
Help | ||
| lage | gem. | hoge | ultra | |
|---|---|---|---|---|
| Tomb Raider (2013) | 433 | 306.7 | 201.5 | 94.5 |
| BioShock Infinite (2013) | 270.6 | 216.5 | 195.4 | 76.7 |
| GTA V (2015) | 150.1 | 141 | 84.3 | 37.4 |
| The Witcher 3 (2015) | 145.5 | 86.5 | 50 | 29.7 |
| Dota 2 Reborn (2015) | 113 | 104 | 94 | 88 |
| World of Warships (2015) | 179.8 | 152.8 | 127.5 | 111.4 |
| The Division (2016) | 147 | 60.3 | 47.3 | 36.4 |
| Civilization 6 (2016) | 127.2 | 102.2 | 58.6 | 48 |
| X-Plane 11.11 (2018) | 87.8 | 78.2 | 65.9 | |
| F1 2018 (2018) | 146 | 86 | 63 | 39 |
| Shadow of the Tomb Raider (2018) | 95 | 42 | 37 | 31 |
| Assassin´s Creed Odyssey (2018) | 75 | 51 | 45 | 34 |
| Call of Duty Black Ops 4 (2018) | 114.7 | 52.9 | 52.3 | 47.7 |
| Hitman 2 (2018) | 71.6 | 49.4 | 44.9 | 42.3 |
| Battlefield V (2018) | 118.6 | 64.4 | 53.3 | 52 |
| Darksiders III (2018) | 167.3 | 70.4 | 55.3 | 46.3 |
| Just Cause 4 (2018) | 83.1 | 54 | 42.5 | 39.9 |
| BioShock Infinite - 1920x1080 Ultra Preset, DX11 (DDOF) | |
| Acer Aspire 7 A715-72G-704Q | |
| Lenovo Legion Y730-15ICH i5-8300H | |
| Gemiddeld NVIDIA GeForce GTX 1050 Ti Mobile (61 - 97, n=23) | |
| HP Pavilion Gaming 15-cx0003ng | |
| Dell G3 15 3579 | |
| Acer Aspire 7 A715-71G-53TU | |
| Shadow of the Tomb Raider - 1920x1080 Medium Preset | |
| Gemiddelde van klas Multimedia (28 - 167, n=8, laatste 2 jaar) | |
| Acer Aspire 7 A715-72G-704Q | |
| Gemiddeld NVIDIA GeForce GTX 1050 Ti Mobile (38 - 42, n=4) | |
| Battlefield V - 1920x1080 Medium Preset | |
| Acer Aspire 7 A715-72G-704Q | |
| Gemiddeld NVIDIA GeForce GTX 1050 Ti Mobile (53.2 - 64.4, n=2) | |
| HP Pavilion Gaming 15-cx0003ng | |
Geluidsniveau
| Onbelast |
| 30.4 / 30.4 / 30.4 dB (A) |
| HDD |
| 32.2 dB (A) |
| Belasting |
| 36.2 / 43.8 dB (A) |
 | ||
30 dB stil 40 dB(A) hoorbaar 50 dB(A) luid |
||
min: | ||
| Acer Aspire 7 A715-72G-704Q i7-8750H, GeForce GTX 1050 Ti Mobile | Acer Aspire 7 A715-71G-53TU i5-7300HQ, GeForce GTX 1050 Mobile | HP Pavilion Gaming 15-cx0003ng i7-8750H, GeForce GTX 1050 Ti Mobile | Dell G3 15 3579 i5-8300H, GeForce GTX 1050 Mobile | Lenovo Legion Y730-15ICH i5-8300H i5-8300H, GeForce GTX 1050 Ti Mobile | Gemiddeld NVIDIA GeForce GTX 1050 Ti Mobile | Gemiddelde van klas Multimedia | |
|---|---|---|---|---|---|---|---|
| Noise | 1% | -5% | -1% | -2% | -6% | 11% | |
| uit / omgeving * (dB) | 30.4 | 30.4 -0% | 30.6 -1% | 28 8% | 28.9 5% | 29.4 ? 3% | 24.1 ? 21% |
| Idle Minimum * (dB) | 30.4 | 30.4 -0% | 30.6 -1% | 29.8 2% | 32.2 -6% | 30.7 ? -1% | 24.3 ? 20% |
| Idle Average * (dB) | 30.4 | 30.8 -1% | 30.6 -1% | 29.8 2% | 32.5 -7% | 31.7 ? -4% | 24.6 ? 19% |
| Idle Maximum * (dB) | 30.4 | 30.8 -1% | 33.2 -9% | 30 1% | 32.7 -8% | 33.8 ? -11% | 26.2 ? 14% |
| Load Average * (dB) | 36.2 | 33.6 7% | 42.8 -18% | 38.6 -7% | 33.2 8% | 41.3 ? -14% | 37.3 ? -3% |
| Load Maximum * (dB) | 43.8 | 43.4 1% | 43 2% | 49.4 -13% | 45 -3% | 47.2 ? -8% | 46 ? -5% |
| Witcher 3 ultra * (dB) | 42.1 | 46.9 | 43.1 |
* ... kleiner is beter
(-) De maximumtemperatuur aan de bovenzijde bedraagt 45.2 °C / 113 F, vergeleken met het gemiddelde van 36.8 °C / 98 F, variërend van 21 tot 71 °C voor de klasse Multimedia.
(±) De bodem warmt op tot een maximum van 43.8 °C / 111 F, vergeleken met een gemiddelde van 39.1 °C / 102 F
(+) Bij onbelast gebruik bedraagt de gemiddelde temperatuur voor de bovenzijde 23.2 °C / 74 F, vergeleken met het apparaatgemiddelde van 31.3 °C / 88 F.
(+) De palmsteunen en het touchpad zijn met een maximum van ###max## °C / 77.2 F koeler dan de huidtemperatuur en voelen daarom koel aan.
(+) De gemiddelde temperatuur van de handpalmsteun van soortgelijke toestellen bedroeg 28.7 °C / 83.7 F (+3.6 °C / 6.5 F).
| Acer Aspire 7 A715-72G-704Q i7-8750H, GeForce GTX 1050 Ti Mobile | Acer Aspire 7 A715-71G-53TU i5-7300HQ, GeForce GTX 1050 Mobile | HP Pavilion Gaming 15-cx0003ng i7-8750H, GeForce GTX 1050 Ti Mobile | Dell G3 15 3579 i5-8300H, GeForce GTX 1050 Mobile | Lenovo Legion Y730-15ICH i5-8300H i5-8300H, GeForce GTX 1050 Ti Mobile | Gemiddeld NVIDIA GeForce GTX 1050 Ti Mobile | Gemiddelde van klas Multimedia | |
|---|---|---|---|---|---|---|---|
| Heat | -5% | -5% | -29% | 11% | -10% | -1% | |
| Maximum Upper Side * (°C) | 45.2 | 41.6 8% | 44.1 2% | 47 -4% | 30 34% | 46.5 ? -3% | 41 ? 9% |
| Maximum Bottom * (°C) | 43.8 | 42.5 3% | 53.8 -23% | 61.2 -40% | 40.8 7% | 48.4 ? -11% | 43.4 ? 1% |
| Idle Upper Side * (°C) | 24.8 | 29.7 -20% | 24.6 1% | 34 -37% | 23.4 6% | 28.6 ? -15% | 26.9 ? -8% |
| Idle Bottom * (°C) | 26.4 | 29.4 -11% | 26.7 -1% | 35.8 -36% | 27.8 -5% | 28.9 ? -9% | 27.8 ? -5% |
* ... kleiner is beter
Acer Aspire 7 A715-72G-704Q audioanalyse
(-) | niet erg luide luidsprekers (65.1 dB)
Bas 100 - 315 Hz
(±) | verminderde zeebaars - gemiddeld 12% lager dan de mediaan
(±) | lineariteit van de lage tonen is gemiddeld (14.5% delta ten opzichte van de vorige frequentie)
Midden 400 - 2000 Hz
(+) | evenwichtige middens - slechts 4.6% verwijderd van de mediaan
(±) | lineariteit van de middentonen is gemiddeld (7.6% delta ten opzichte van de vorige frequentie)
Hoog 2 - 16 kHz
(+) | evenwichtige hoogtepunten - slechts 2.6% verwijderd van de mediaan
(+) | de hoge tonen zijn lineair (4.6% delta naar de vorige frequentie)
Algemeen 100 - 16.000 Hz
(±) | lineariteit van het totale geluid is gemiddeld (19.1% verschil met de mediaan)
Vergeleken met dezelfde klasse
» 61% van alle geteste apparaten in deze klasse waren beter, 7% vergelijkbaar, 32% slechter
» De beste had een delta van 5%, het gemiddelde was 17%, de slechtste was 45%
Vergeleken met alle geteste toestellen
» 46% van alle geteste apparaten waren beter, 7% gelijk, 47% slechter
» De beste had een delta van 4%, het gemiddelde was 23%, de slechtste was 134%
HP Pavilion Gaming 15-cx0003ng audioanalyse
(-) | niet erg luide luidsprekers (70.4 dB)
Bas 100 - 315 Hz
(-) | bijna geen lage tonen - gemiddeld 25.4% lager dan de mediaan
(±) | lineariteit van de lage tonen is gemiddeld (10.3% delta ten opzichte van de vorige frequentie)
Midden 400 - 2000 Hz
(+) | evenwichtige middens - slechts 2.3% verwijderd van de mediaan
(+) | de middentonen zijn lineair (6.9% delta ten opzichte van de vorige frequentie)
Hoog 2 - 16 kHz
(+) | evenwichtige hoogtepunten - slechts 1.8% verwijderd van de mediaan
(+) | de hoge tonen zijn lineair (4.7% delta naar de vorige frequentie)
Algemeen 100 - 16.000 Hz
(±) | lineariteit van het totale geluid is gemiddeld (21.1% verschil met de mediaan)
Vergeleken met dezelfde klasse
» 76% van alle geteste apparaten in deze klasse waren beter, 4% vergelijkbaar, 20% slechter
» De beste had een delta van 6%, het gemiddelde was 18%, de slechtste was 132%
Vergeleken met alle geteste toestellen
» 58% van alle geteste apparaten waren beter, 7% gelijk, 34% slechter
» De beste had een delta van 4%, het gemiddelde was 23%, de slechtste was 134%
| Uit / Standby | |
| Inactief | |
| Belasting |
|
Key:
min: | |
| Acer Aspire 7 A715-72G-704Q i7-8750H, GeForce GTX 1050 Ti Mobile | Acer Aspire 7 A715-71G-53TU i5-7300HQ, GeForce GTX 1050 Mobile | HP Pavilion Gaming 15-cx0003ng i7-8750H, GeForce GTX 1050 Ti Mobile | Dell G3 15 3579 i5-8300H, GeForce GTX 1050 Mobile | Lenovo Legion Y730-15ICH i5-8300H i5-8300H, GeForce GTX 1050 Ti Mobile | Gemiddeld NVIDIA GeForce GTX 1050 Ti Mobile | Gemiddelde van klas Multimedia | |
|---|---|---|---|---|---|---|---|
| Power Consumption | 2% | -25% | -41% | -48% | -51% | -21% | |
| Idle Minimum * (Watt) | 3.9 | 4 -3% | 5.5 -41% | 7.9 -103% | 8 -105% | 7.92 ? -103% | 5.62 ? -44% |
| Idle Average * (Watt) | 6.6 | 6.9 -5% | 8.5 -29% | 9.6 -45% | 11.8 -79% | 11.9 ? -80% | 10.2 ? -55% |
| Idle Maximum * (Watt) | 8.5 | 9.4 -11% | 11.9 -40% | 13 -53% | 13.1 -54% | 15.4 ? -81% | 12.5 ? -47% |
| Load Average * (Watt) | 89 | 72.6 18% | 94 -6% | 93 -4% | 90.2 -1% | 85.1 ? 4% | 65 ? 27% |
| Load Maximum * (Watt) | 134 | 122 9% | 144 -7% | 132.7 1% | 136.2 -2% | 130.5 ? 3% | 111.9 ? 16% |
| Witcher 3 ultra * (Watt) | 86 | 100.6 | 107.8 |
* ... kleiner is beter
| Acer Aspire 7 A715-72G-704Q i7-8750H, GeForce GTX 1050 Ti Mobile, 48.9 Wh | Acer Aspire 7 A715-71G-53TU i5-7300HQ, GeForce GTX 1050 Mobile, 48 Wh | HP Pavilion Gaming 15-cx0003ng i7-8750H, GeForce GTX 1050 Ti Mobile, 52.5 Wh | Dell G3 15 3579 i5-8300H, GeForce GTX 1050 Mobile, 56 Wh | Lenovo Legion Y730-15ICH i5-8300H i5-8300H, GeForce GTX 1050 Ti Mobile, 57 Wh | Gemiddelde van klas Multimedia | |
|---|---|---|---|---|---|---|
| Batterijduur | -4% | -9% | 43% | -19% | 103% | |
| Reader / Idle (h) | 12.3 | 9.9 -20% | 10.8 -12% | 9.6 -22% | 24.9 ? 102% | |
| H.264 (h) | 6 | 5.1 -15% | 4.6 -23% | 16.8 ? 180% | ||
| WiFi v1.3 (h) | 6.4 | 5.6 -13% | 5.3 -17% | 6.5 2% | 5.3 -17% | 12.3 ? 92% |
| Load (h) | 1.2 | 1.6 33% | 1.4 17% | 2.2 83% | 1 -17% | 1.645 ? 37% |
Pro
Contra
Dit is de verkorte versie van het originele artikel. Het volledige, Engelse testrapport vind je hier.
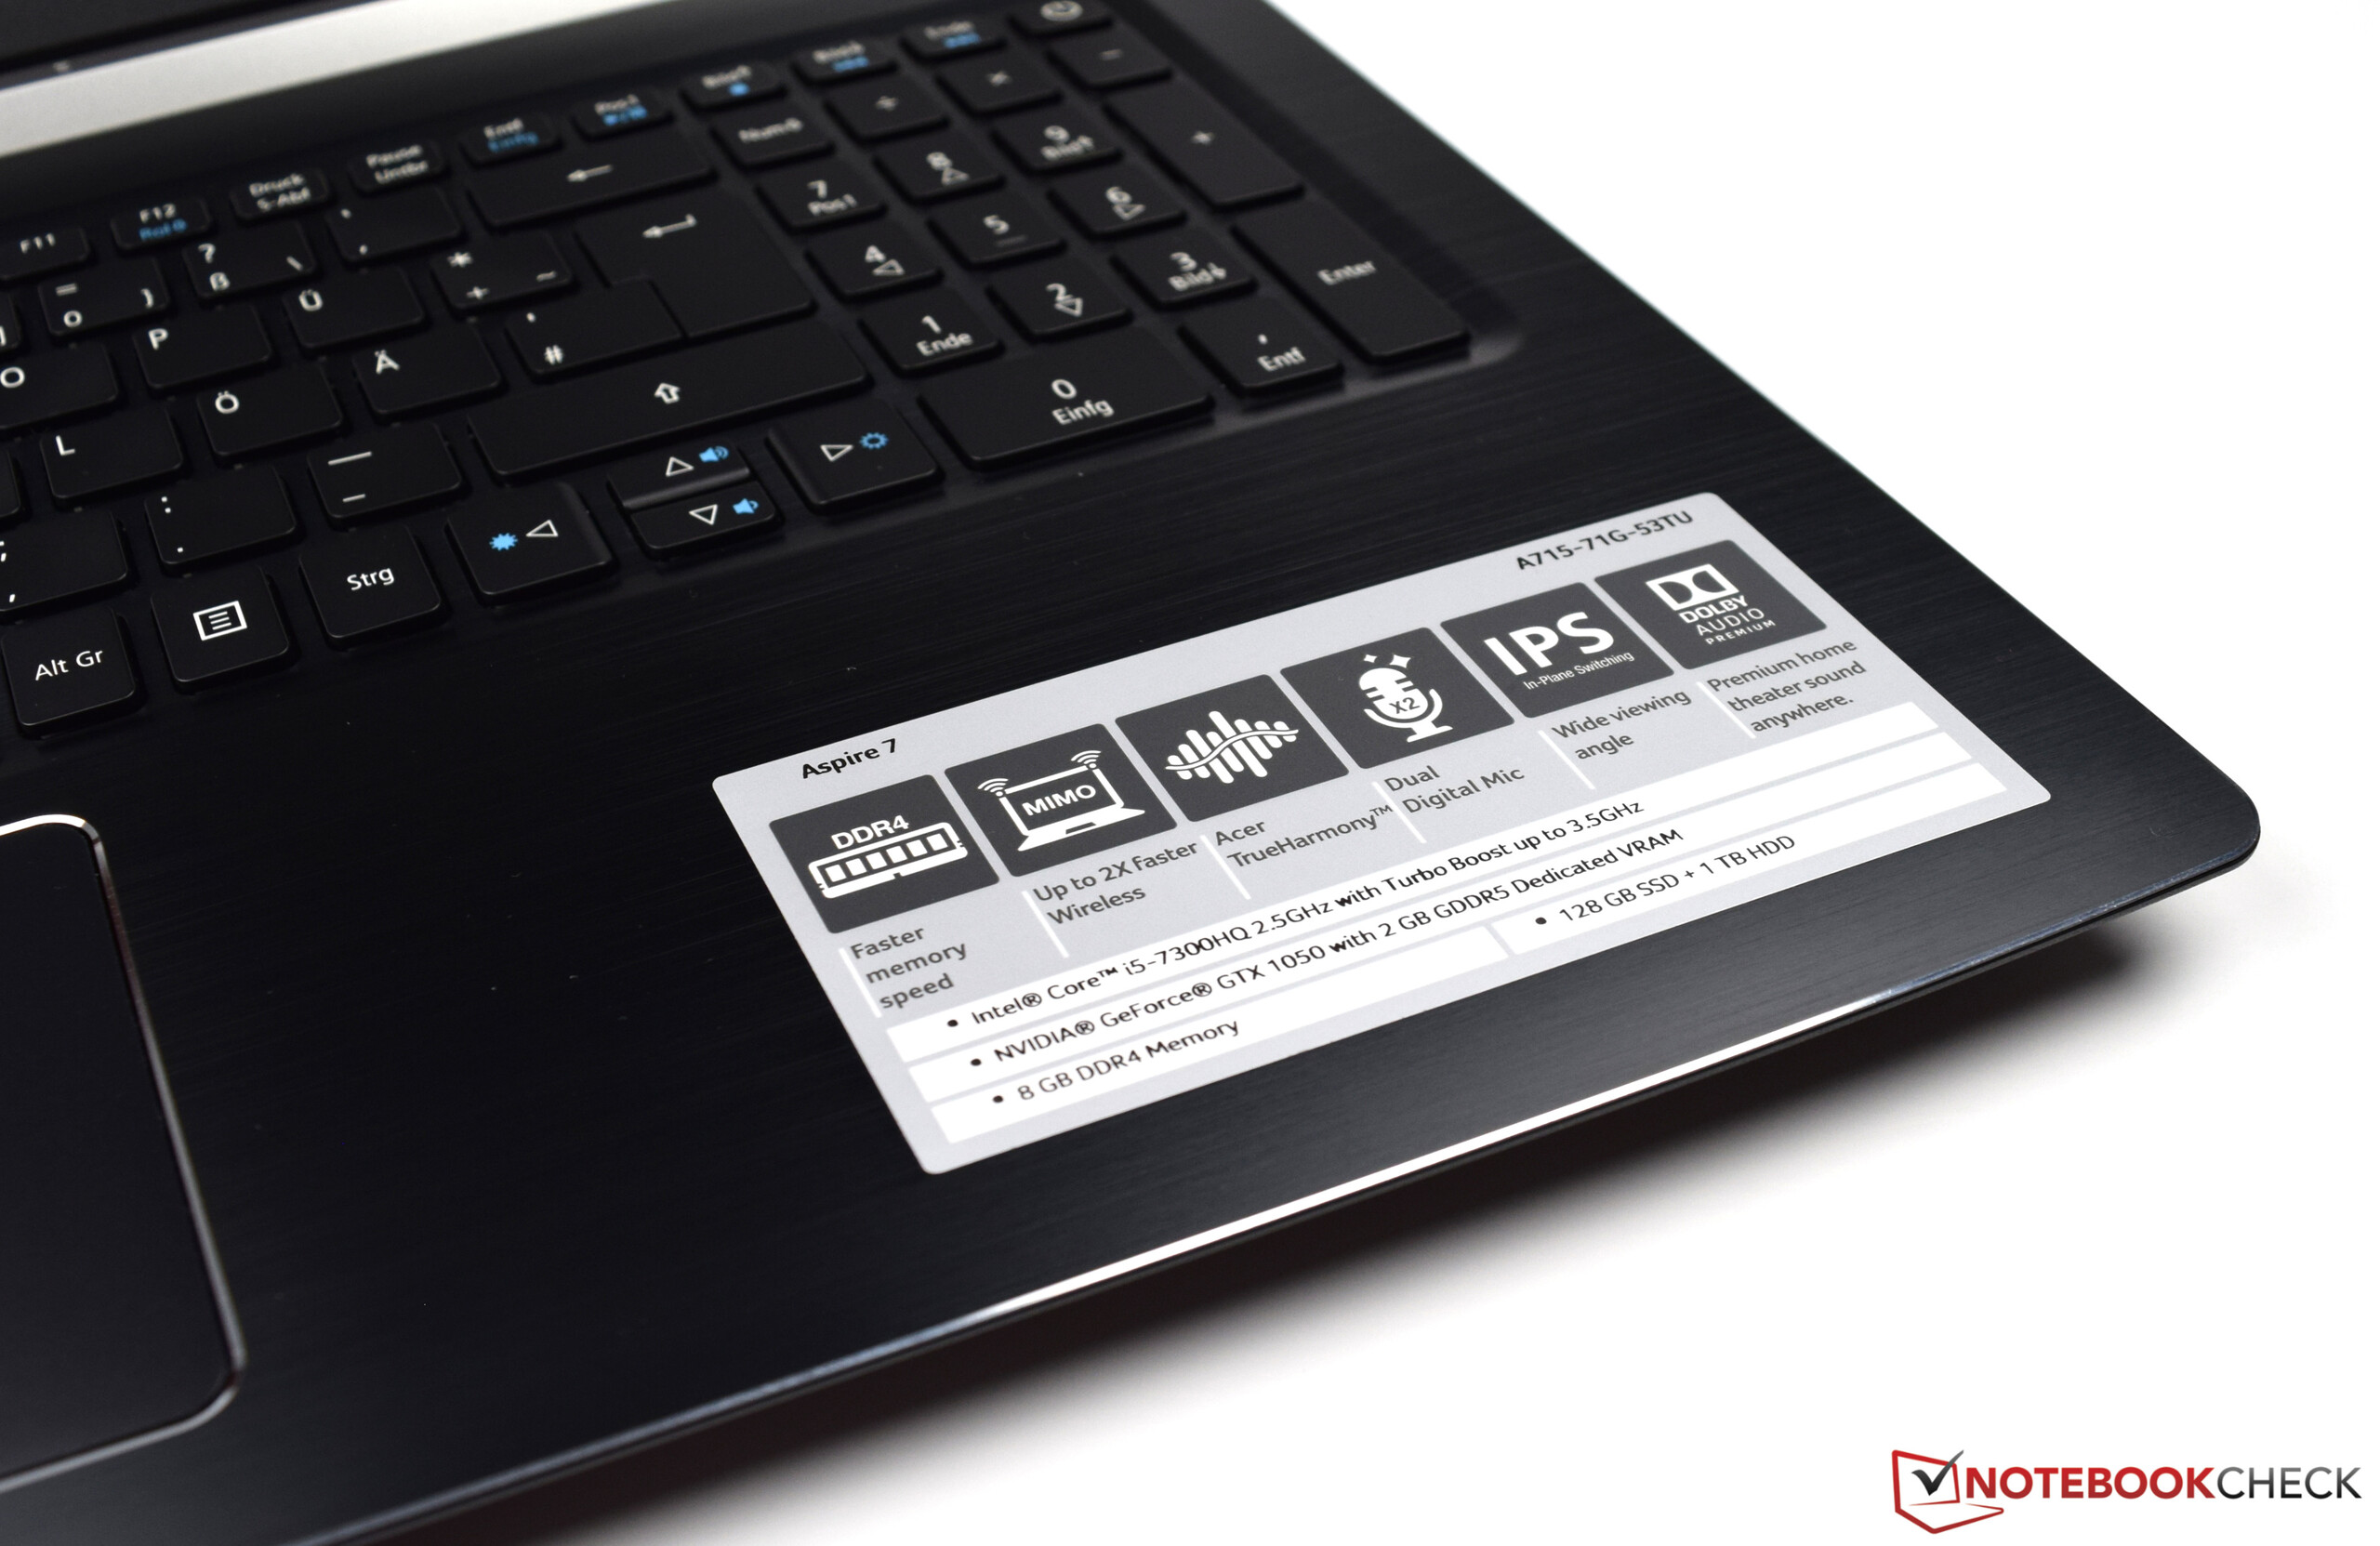
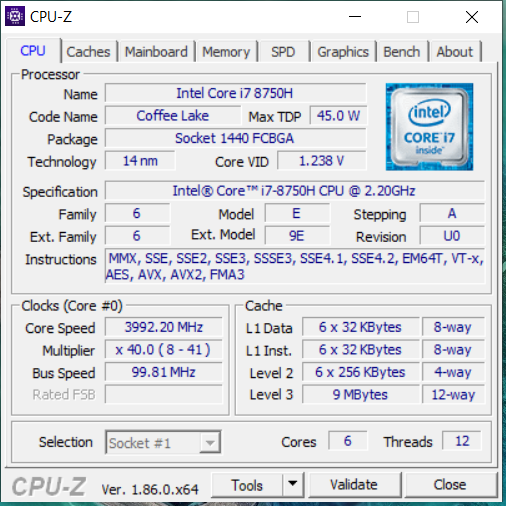
De Aspire 7 A715-72G is een 15.6-inch multimedia notebook dat geschikt is om op te gamen. De Core i7-8750H zal in de nabije toekomst niet verouderd raken. De GeForce GTX 1050 Ti is geschikt om de modernste games vloeiend weer te geven.
Acer's allrounder laat een goede indruk achter, maar niet zonder tekortkomingen.
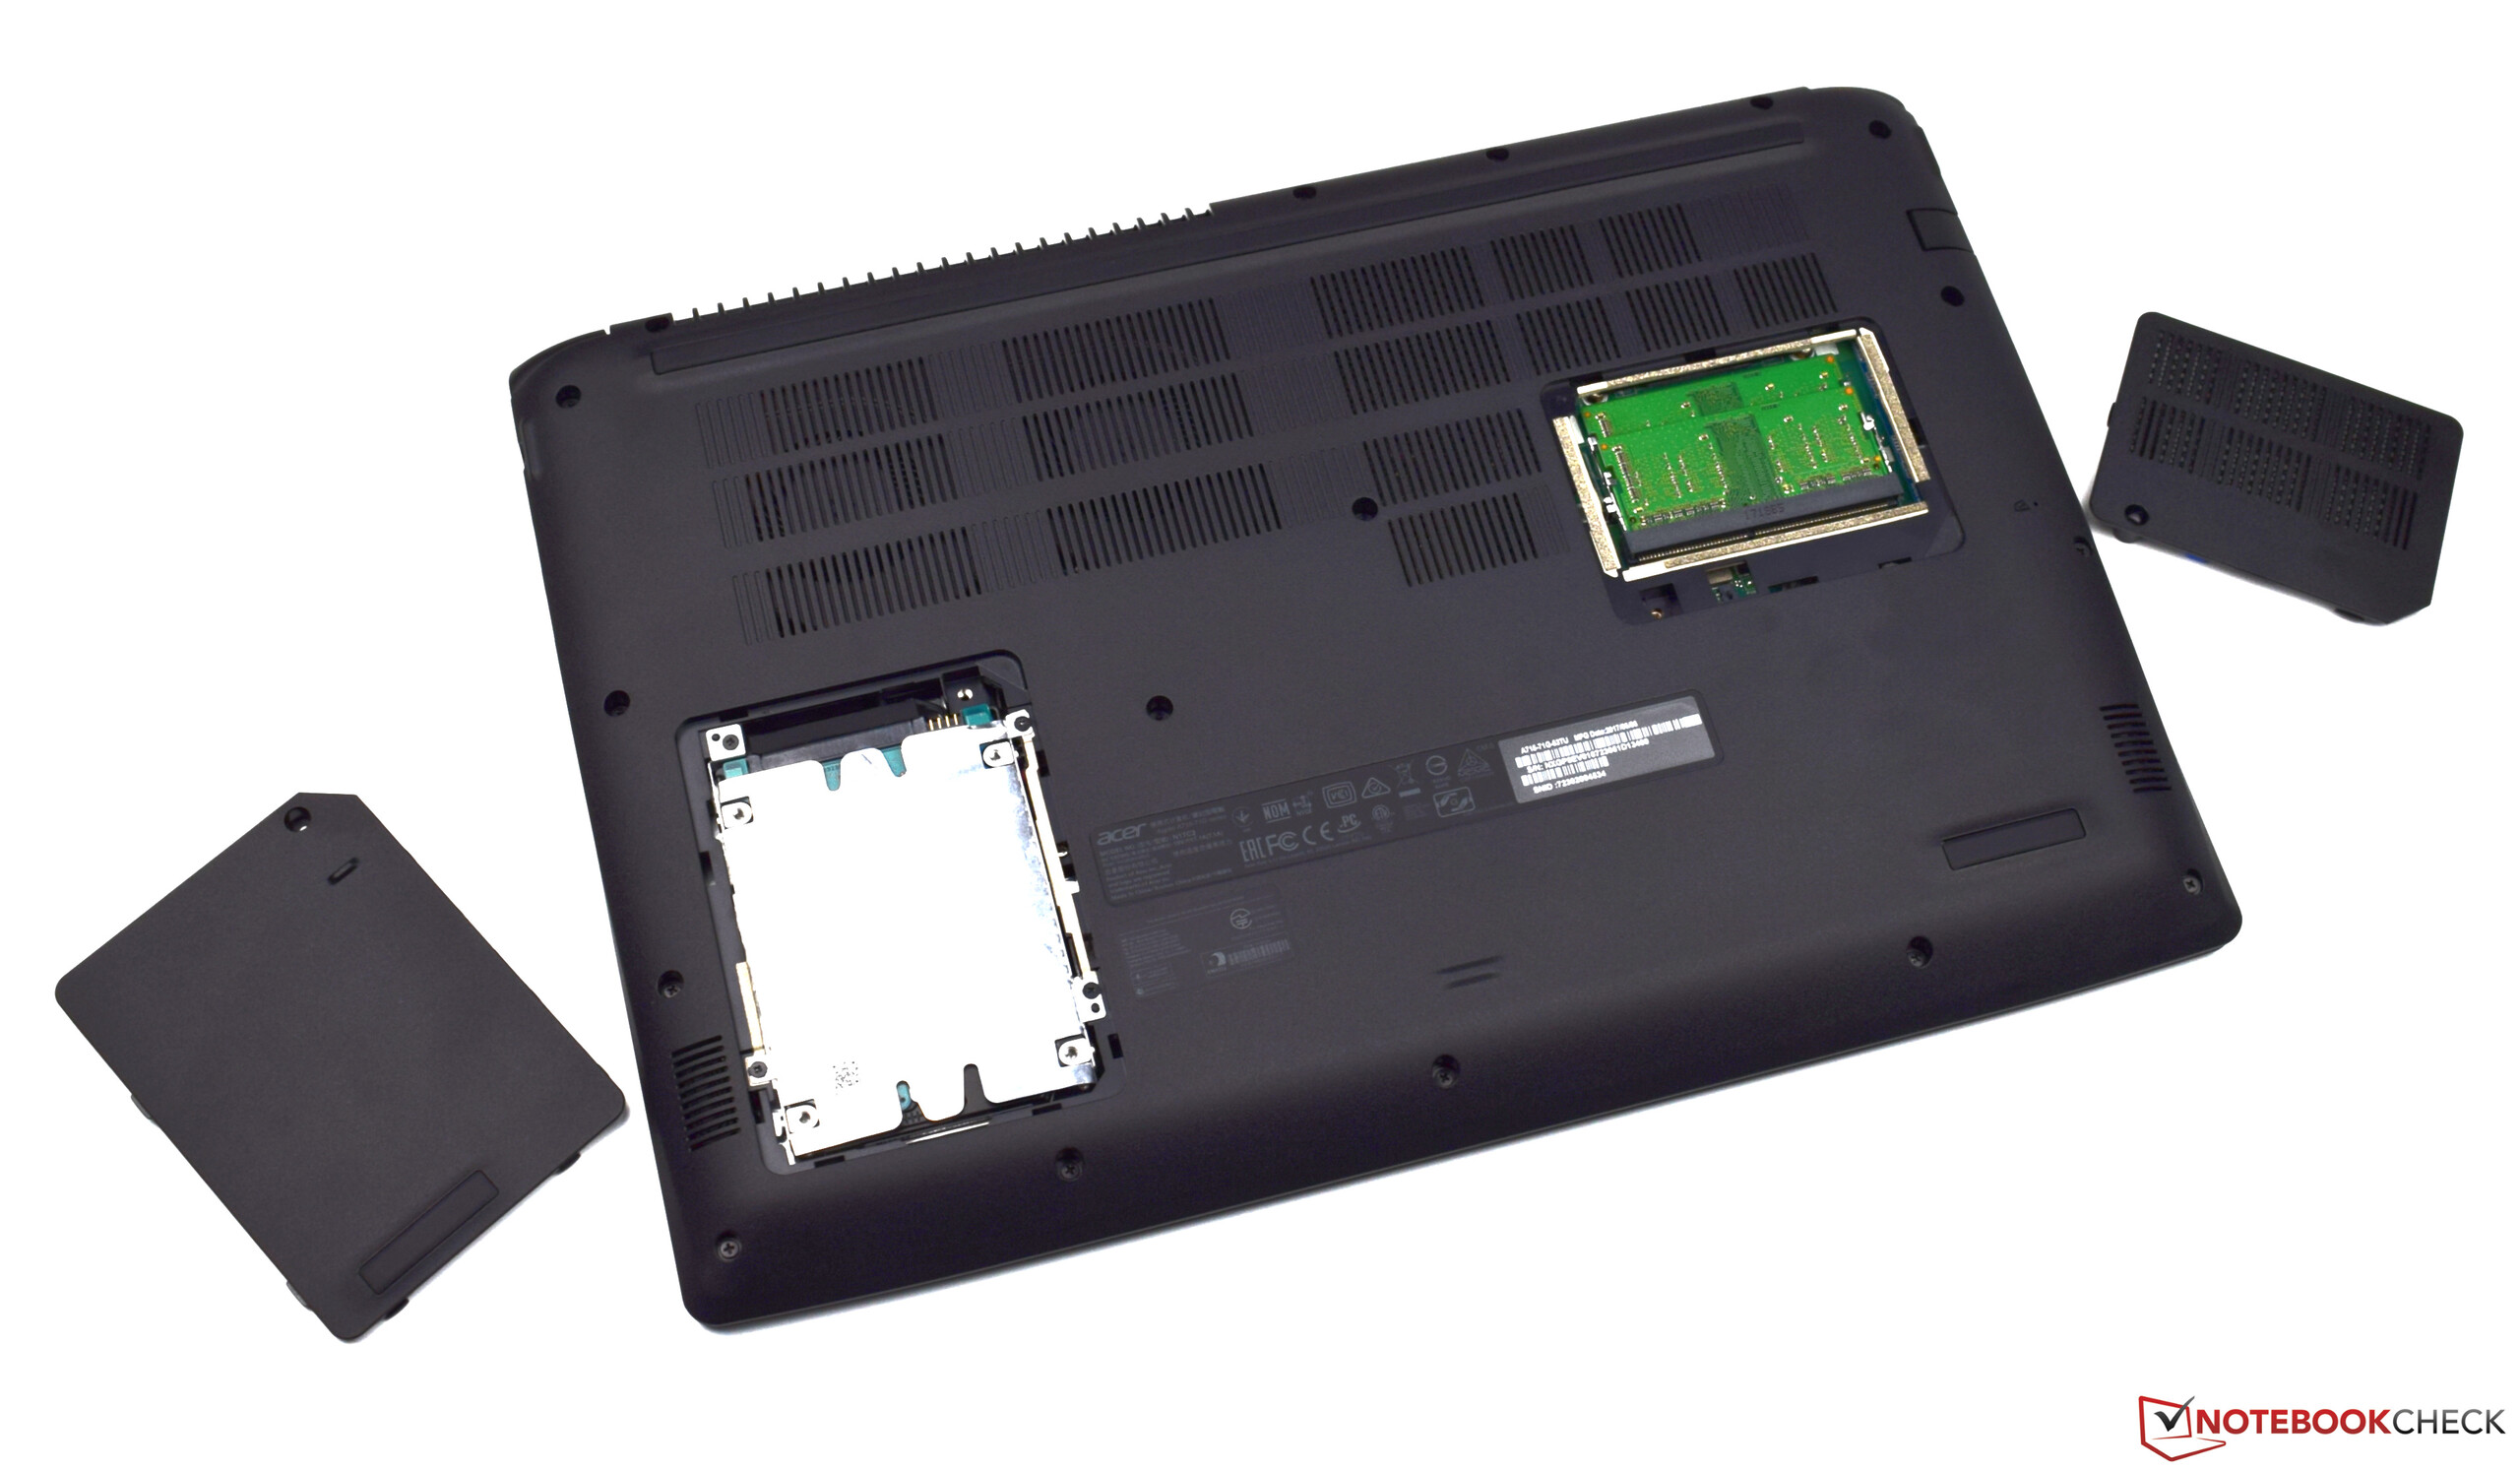
Ondanks krachtige hardware is het notebook vrijwel stil bij kantoortoepassingen en internetten. Het Acer notebook wordt niet erg heet. Een NVMe SSD zorgt voor een erg responsief systeem. De A715 heeft voldoende opslagruimte. Naast de SSD beschikt de Aspire 7 ook over een 1TB harde schijf. De batterijduur is meer dan OK voor een notebook met deze specificaties. En tot slot heeft het Acer notebook ook nog een goed toetsenbord met verlichting.
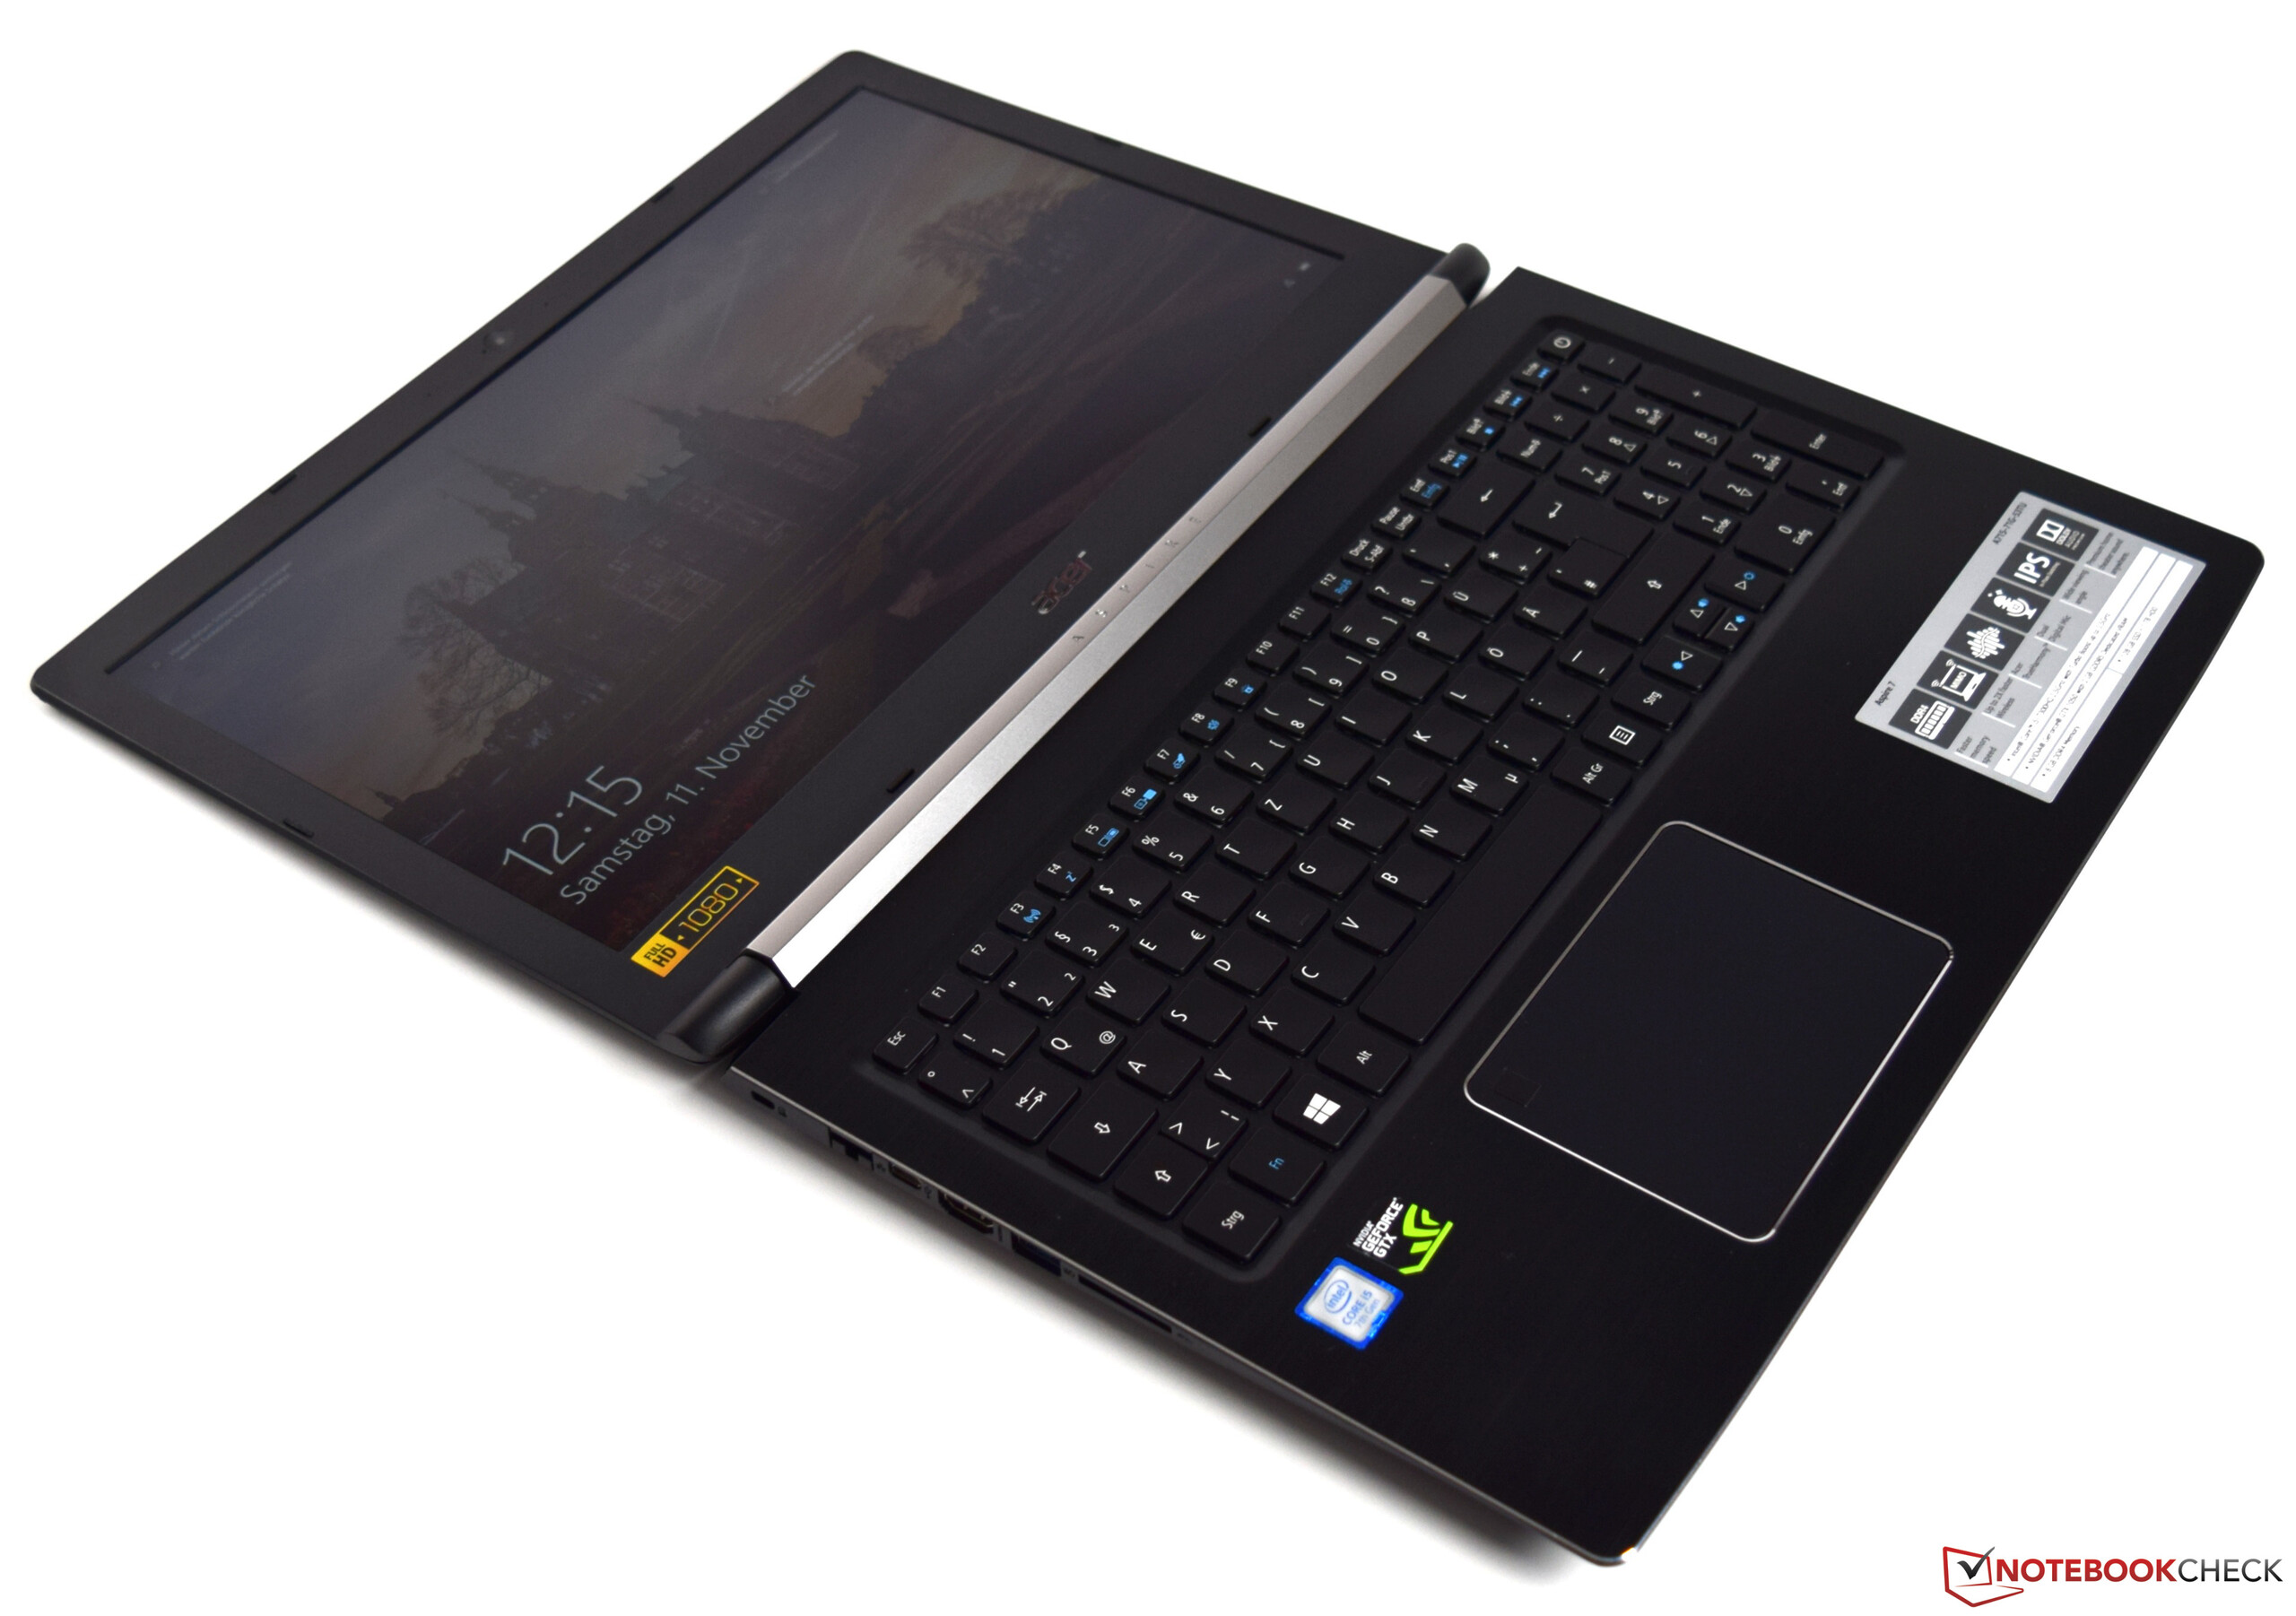
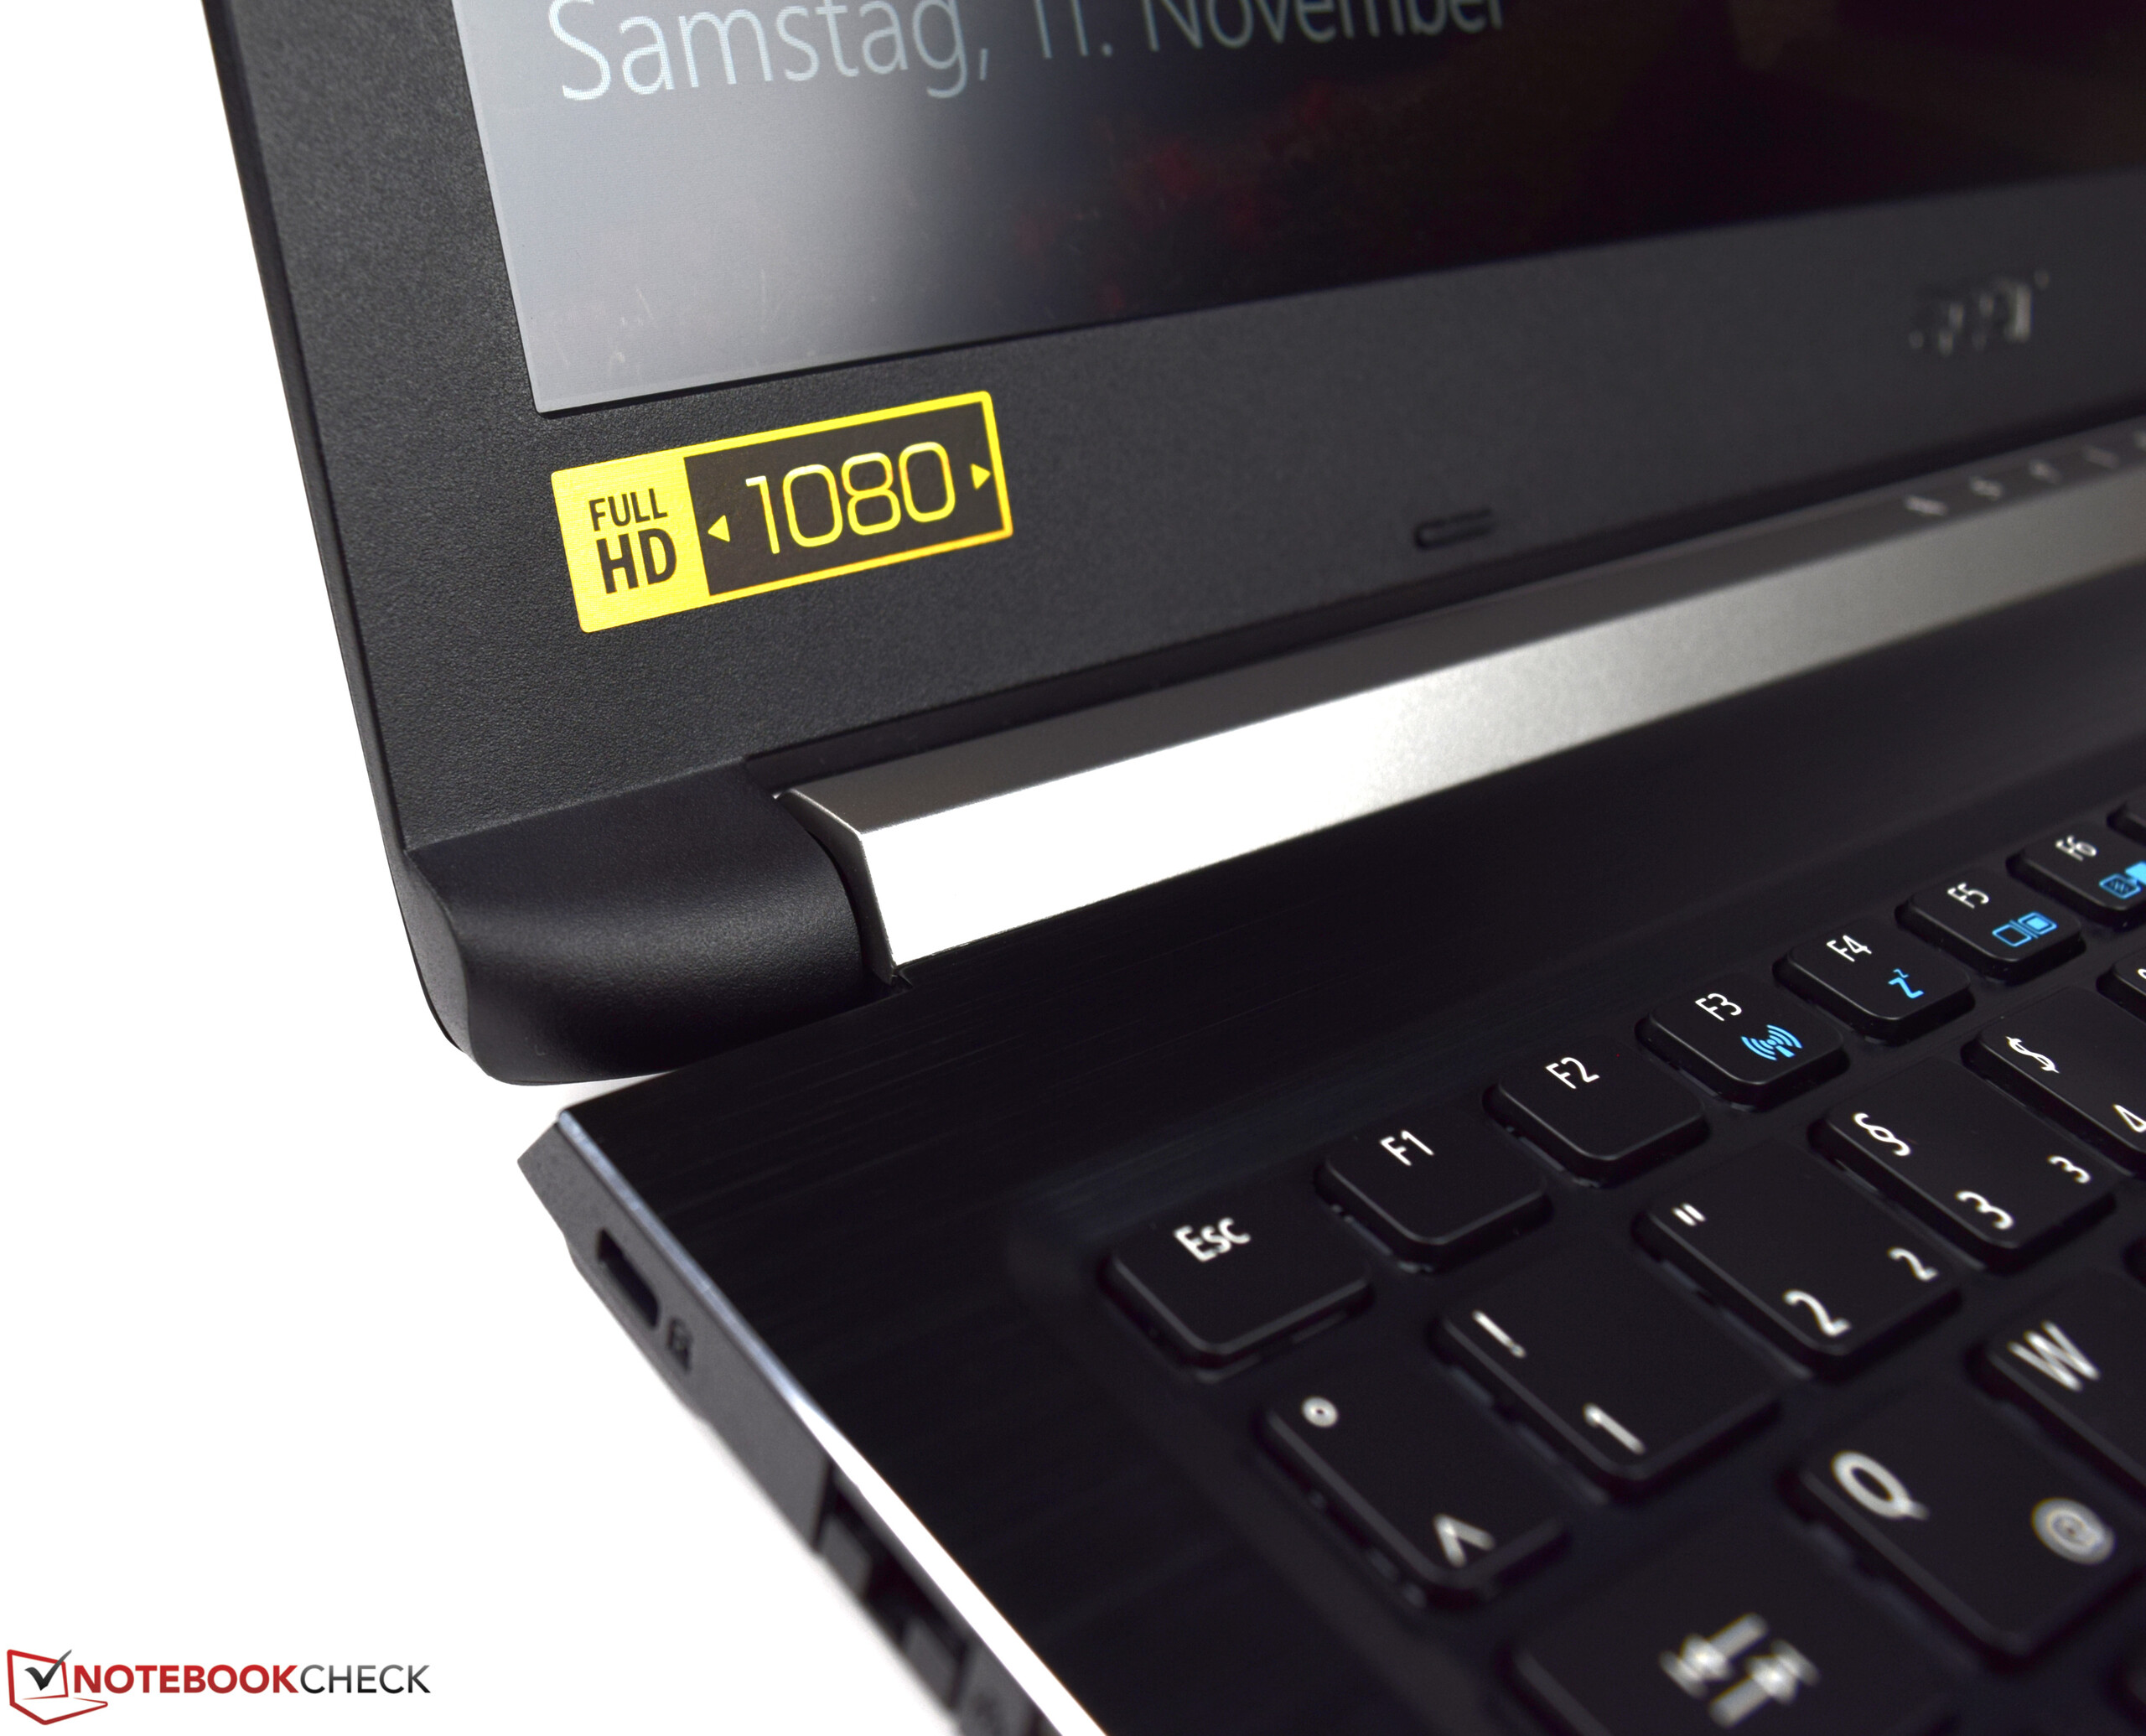
Het IPS beeldscherm maakt weinig indruk. De voornaamste voordelen zijn de matte afwerking en goede kijkhoeken. Zowel de helderheid als de contrastverhouding zijn te laag voor een € 1200 notebook. Fluitende spoelen zijn een ander nadeel. Deze zijn duidelijk te horen en worden hinderlijk in stille omgevingen.
Acer Aspire 7 A715-72G-704Q
- 30-01-2019 v6 (old)
Sascha Mölck