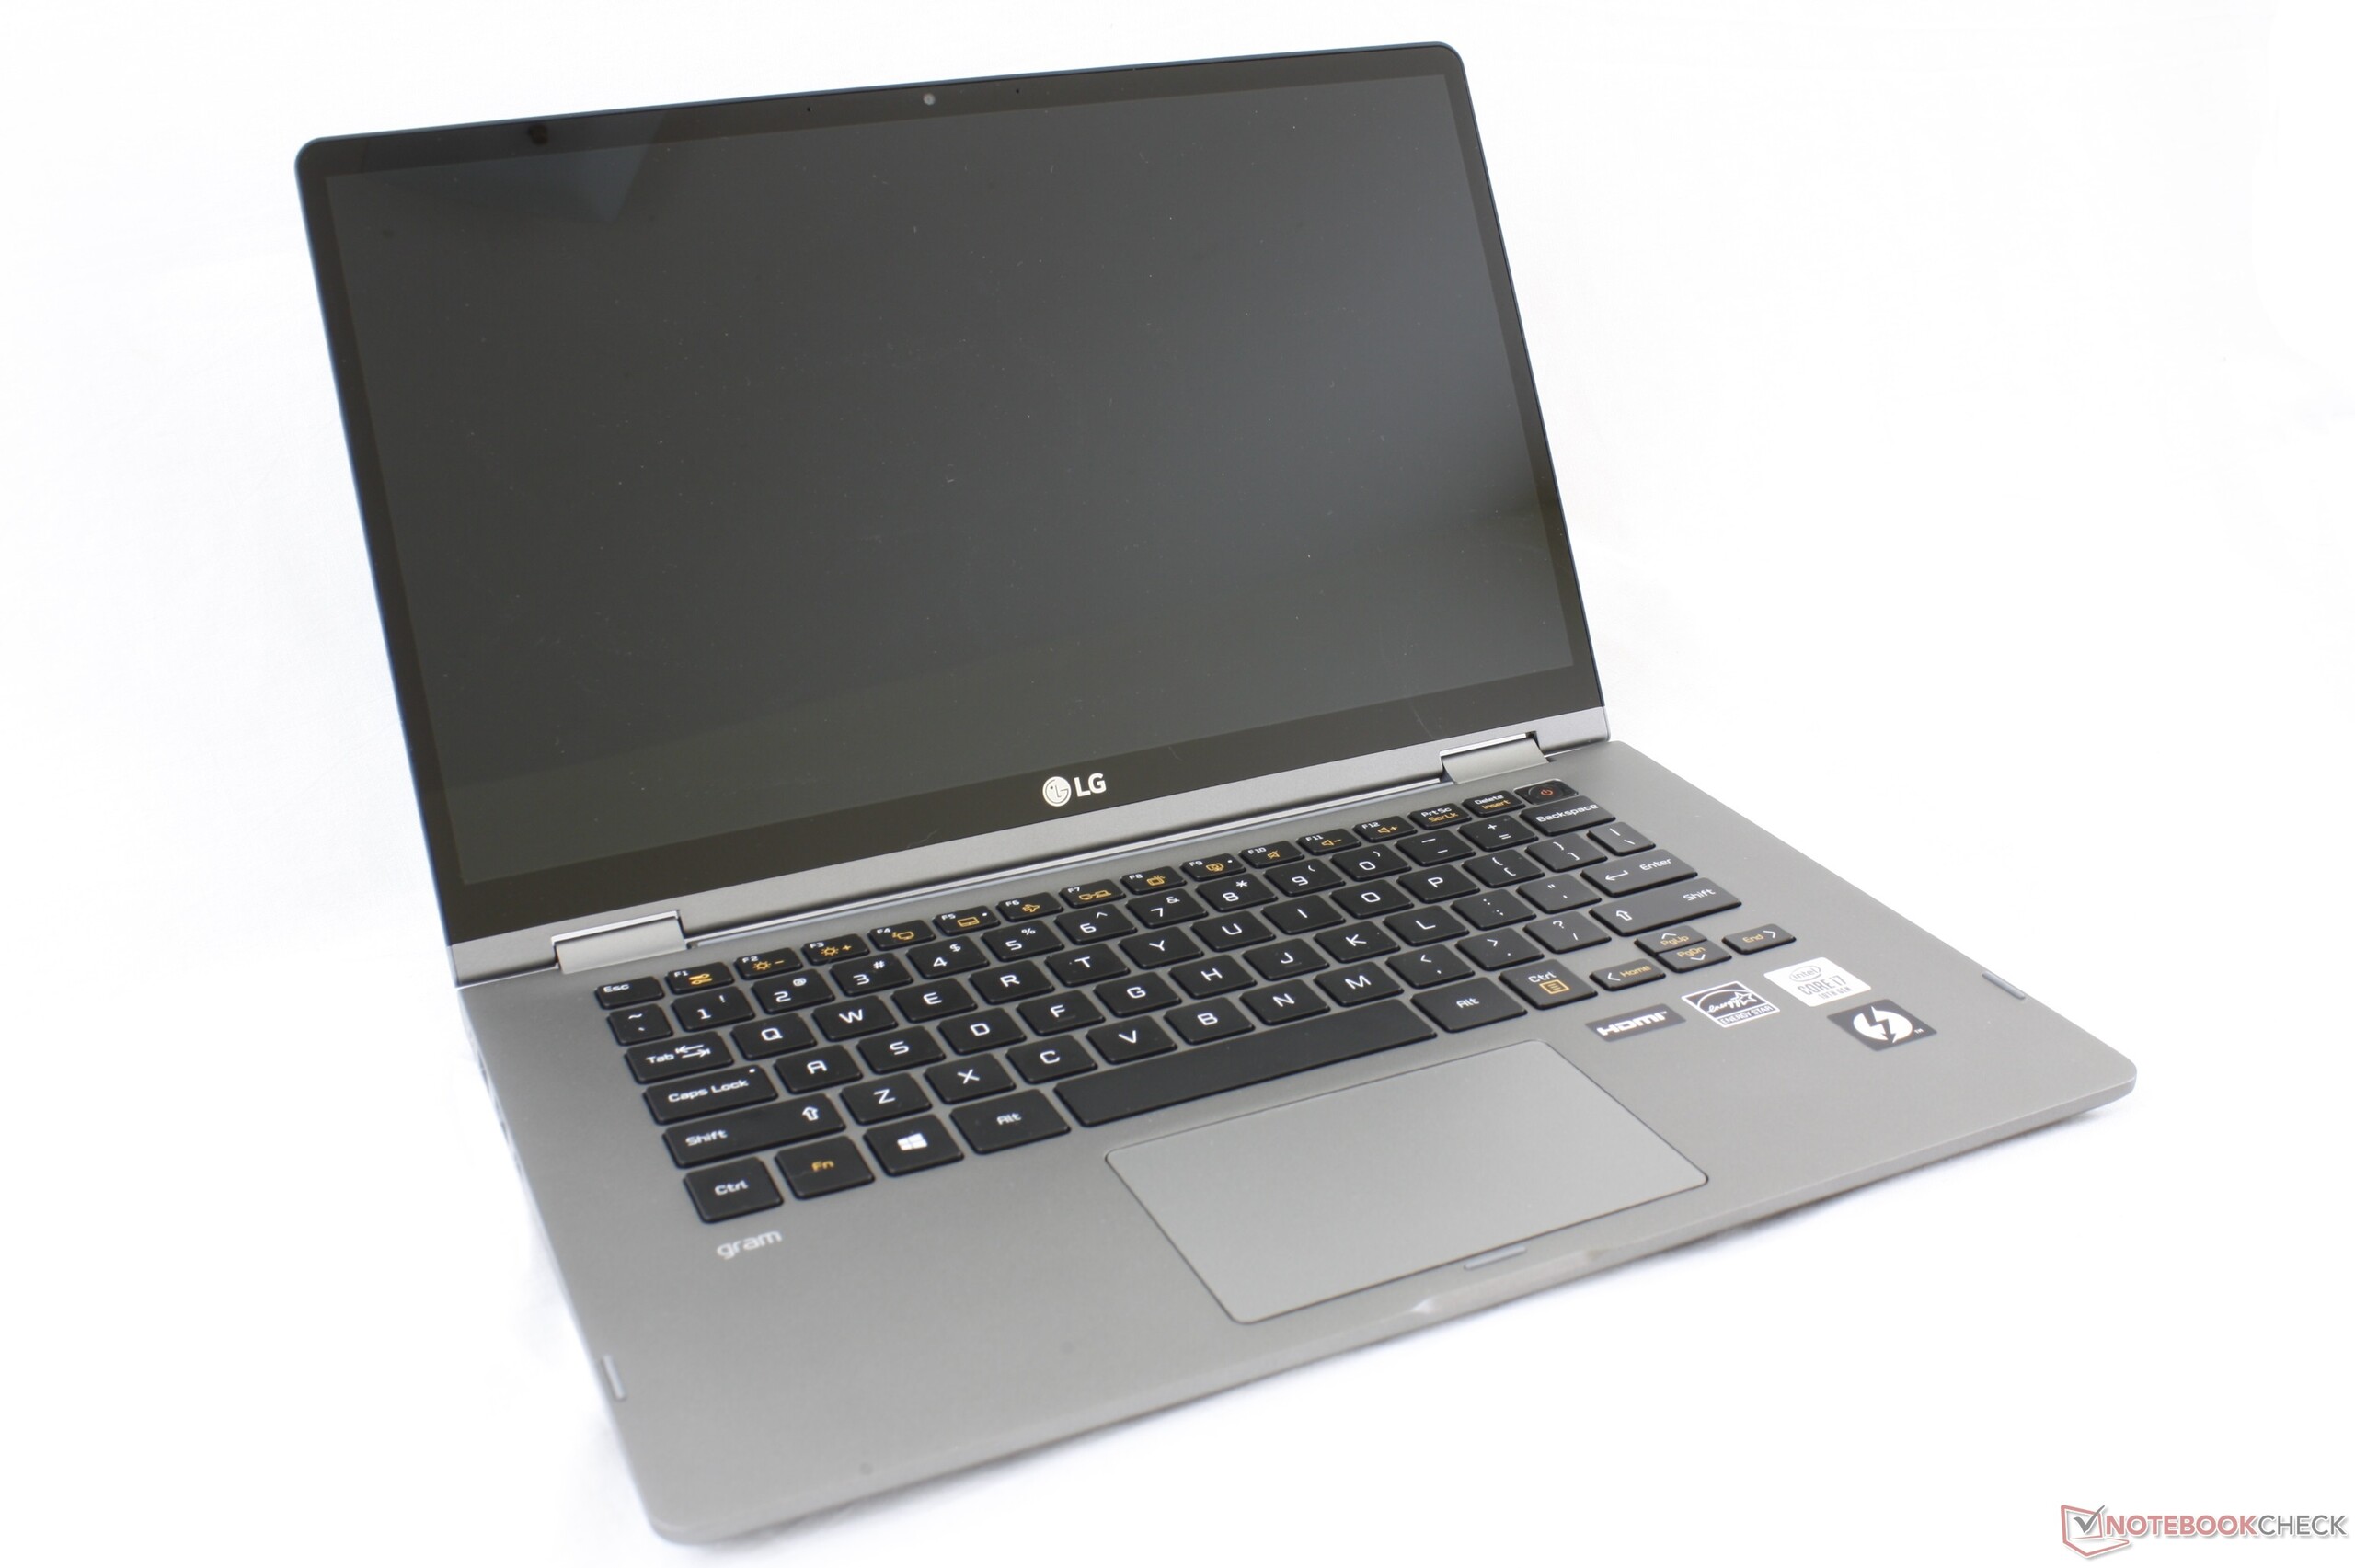
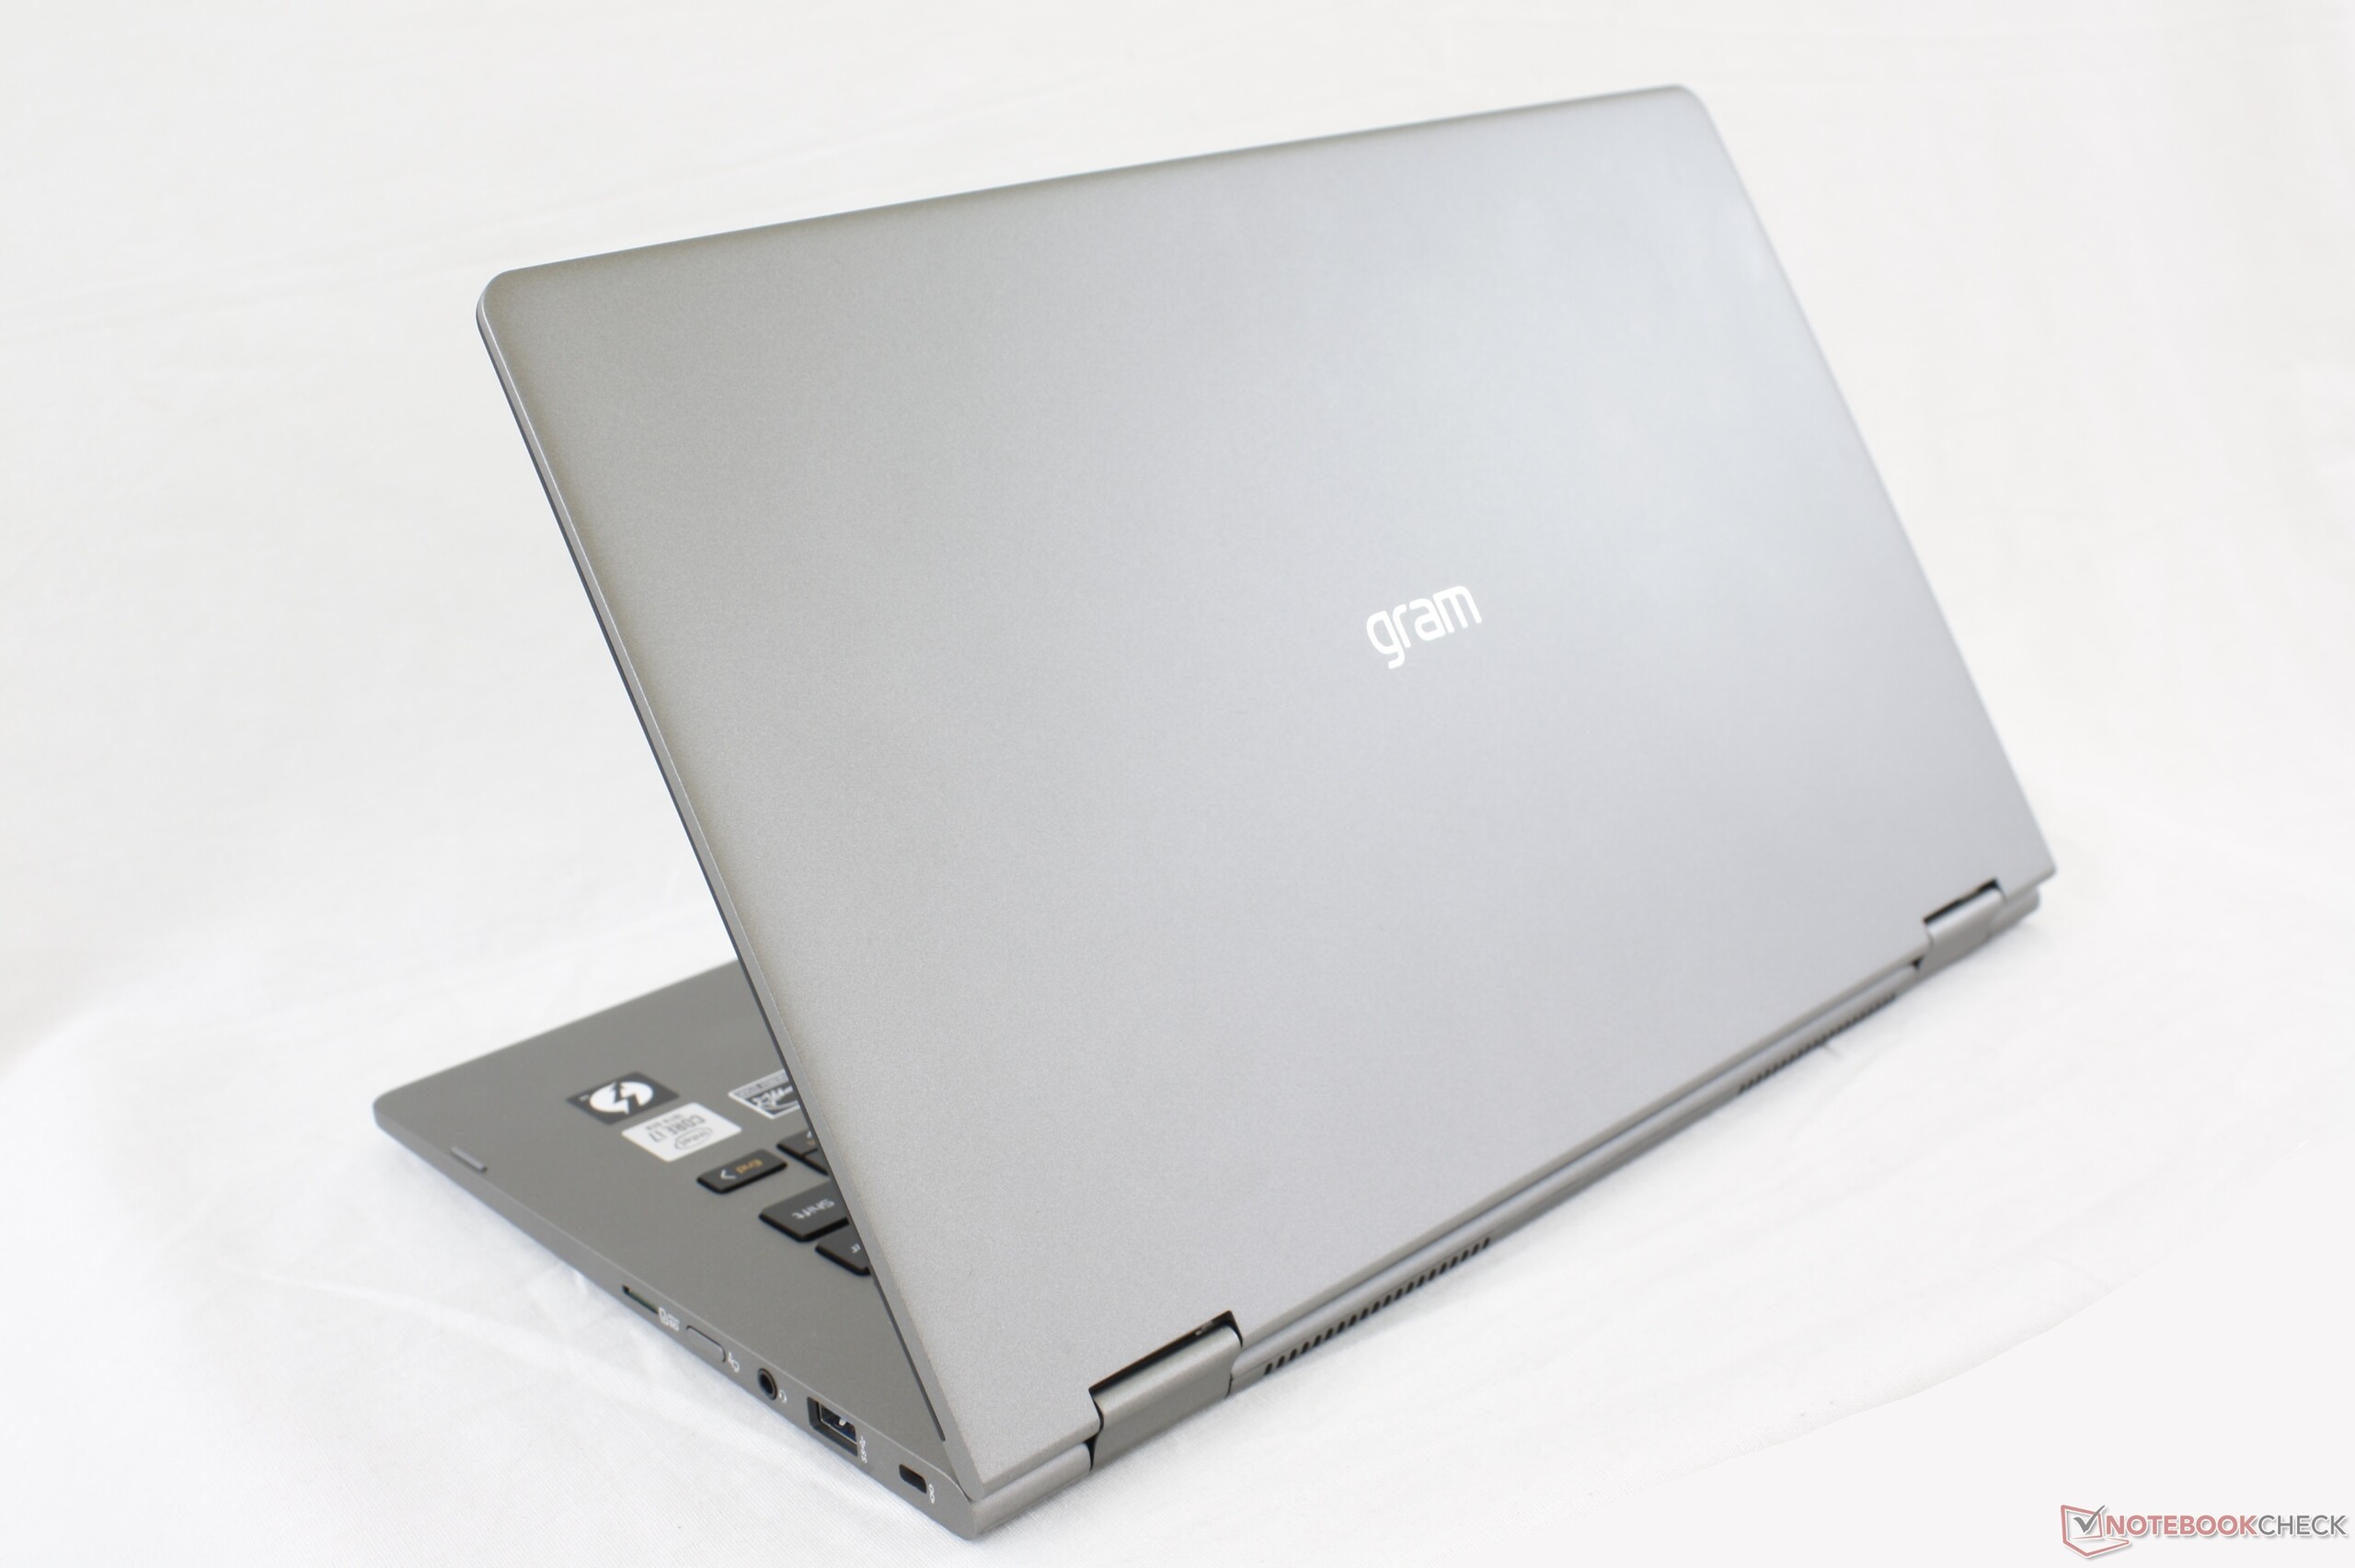
Kort testrapport LG Gram 14T90N Convertible: een CPU-downgrade
Evaluatie | Datum | Model | Gewicht | Hoogte | Formaat | Resolutie | Beste prijs |
|---|---|---|---|---|---|---|---|
| 81.2 % v7 (old) | 04-2020 | LG Gram 14T90N i7-10510U, UHD Graphics 620 | 1.2 kg | 18 mm | 14.00" | 1920x1080 | |
| 81.2 % v7 (old) | 02-2020 | Asus ZenBook 14 UM431DA-AM020T R7 3700U, Vega 10 | 1.4 kg | 16 mm | 14.00" | 1920x1080 | |
| 86.3 % v7 (old) | 11-2019 | Dell XPS 13 7390 2-in-1 Core i7 i7-1065G7, Iris Plus Graphics G7 (Ice Lake 64 EU) | 1.3 kg | 13 mm | 13.40" | 1920x1200 | |
| 88.5 % v7 (old) | Lenovo ThinkPad X1 Carbon G7 20R1-000YUS i7-10510U, UHD Graphics 620 | 1.2 kg | 15.4 mm | 14.00" | 3840x2160 | ||
| 85.9 % v7 (old) | 11-2019 | Dell XPS 13 7390 Core i7-10710U i7-10710U, UHD Graphics 620 | 1.2 kg | 11.6 mm | 13.30" | 3840x2160 |
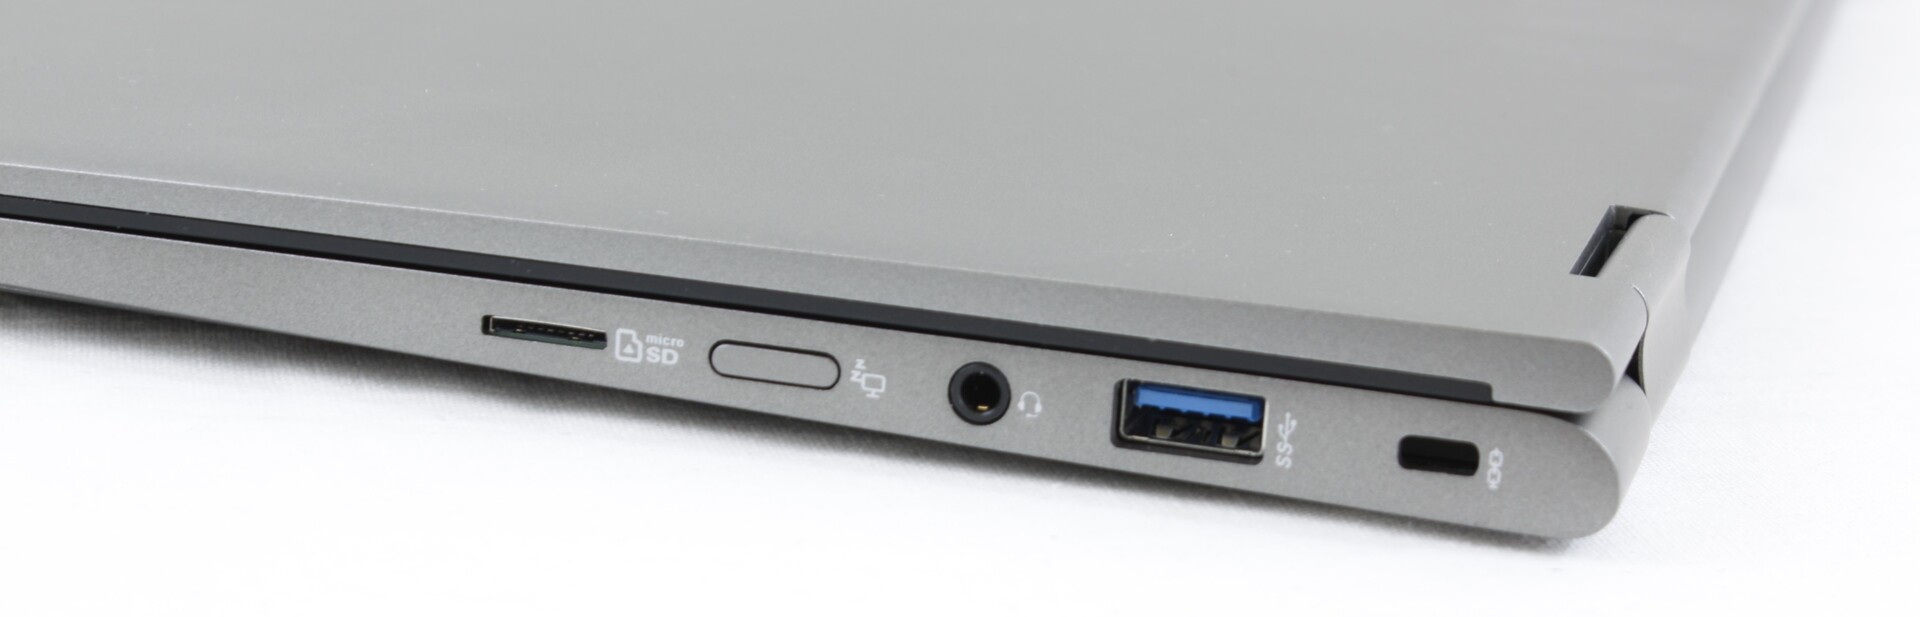
| SD Card Reader | |
| average JPG Copy Test (av. of 3 runs) | |
| Dell XPS 13 7390 2-in-1 Core i7 (Toshiba Exceria Pro M501 64 GB UHS-II) | |
| LG Gram 14T90N (Toshiba Exceria Pro M501 64 GB UHS-II) | |
| LG Gram 14Z980-U.AAW5U1 (Toshiba Exceria Pro M501 microSDXC 64GB) | |
| Asus ZenBook 14 UM431DA-AM020T (Toshiba Exceria Pro SDXC 64 GB UHS-II) | |
| maximum AS SSD Seq Read Test (1GB) | |
| Dell XPS 13 7390 2-in-1 Core i7 (Toshiba Exceria Pro M501 64 GB UHS-II) | |
| LG Gram 14Z980-U.AAW5U1 (Toshiba Exceria Pro M501 microSDXC 64GB) | |
| LG Gram 14T90N (Toshiba Exceria Pro M501 64 GB UHS-II) | |
| Asus ZenBook 14 UM431DA-AM020T (Toshiba Exceria Pro SDXC 64 GB UHS-II) | |
| Networking | |
| iperf3 transmit AX12 | |
| Acer Aspire 5 A514-52 | |
| Microsoft Surface Laptop 3 13 Core i5-1035G7 | |
| Lenovo ThinkPad X1 Carbon G7 20R1-000YUS | |
| LG Gram 14T90N | |
| iperf3 receive AX12 | |
| Acer Aspire 5 A514-52 | |
| Microsoft Surface Laptop 3 13 Core i5-1035G7 | |
| Lenovo ThinkPad X1 Carbon G7 20R1-000YUS | |
| LG Gram 14T90N | |

| |||||||||||||||||||||||||
Helderheidsverdeling: 86 %
Helderheid in Batterij-modus: 322.2 cd/m²
Contrast: 1289:1 (Zwart: 0.25 cd/m²)
ΔE ColorChecker Calman: 3.62 | ∀{0.5-29.43 Ø4.71}
calibrated: 1.22
ΔE Greyscale Calman: 3.9 | ∀{0.09-98 Ø4.96}
95.6% sRGB (Argyll 1.6.3 3D)
61.3% AdobeRGB 1998 (Argyll 1.6.3 3D)
66.7% AdobeRGB 1998 (Argyll 3D)
95.7% sRGB (Argyll 3D)
65% Display P3 (Argyll 3D)
Gamma: 2.43
CCT: 6344 K
| LG Gram 14T90N LG Philips LP140WFA-SPY1, IPS, 14", 1920x1080 | LG Gram 14Z980-U.AAW5U1 LG Philips LP140WF7-SPG1, IPS, 14", 1920x1080 | Asus ZenBook 14 UM431DA-AM020T CEC PA LM140LF-3L03, IPS, 14", 1920x1080 | Dell XPS 13 7390 2-in-1 Core i7 Sharp LQ134N1, IPS, 13.4", 1920x1200 | Huawei Matebook X Pro i5 Tianma XM, IPS, 13.9", 3000x2000 | Lenovo ThinkPad X1 Carbon G7 20R1-000YUS BOE NV140QUM-N53, IPS, 14", 3840x2160 | |
|---|---|---|---|---|---|---|
| Display | -1% | 0% | 6% | 0% | 19% | |
| Display P3 Coverage (%) | 65 | 64.7 0% | 66.7 3% | 69.9 8% | 65.9 1% | 83 28% |
| sRGB Coverage (%) | 95.7 | 94.3 -1% | 92.3 -4% | 99.2 4% | 95.2 -1% | 99.7 4% |
| AdobeRGB 1998 Coverage (%) | 66.7 | 66 -1% | 67.5 1% | 71.5 7% | 67.6 1% | 83.1 25% |
| Response Times | 21% | 27% | 12% | 24% | 6% | |
| Response Time Grey 50% / Grey 80% * (ms) | 54 ? | 36.8 ? 32% | 36 ? 33% | 47.6 ? 12% | 40.4 ? 25% | 49.2 ? 9% |
| Response Time Black / White * (ms) | 32.8 ? | 30 ? 9% | 26 ? 21% | 29.2 ? 11% | 25.6 ? 22% | 32.2 ? 2% |
| PWM Frequency (Hz) | 44 ? | 2500 ? | 201.6 ? | |||
| Screen | -17% | -49% | 20% | -4% | -32% | |
| Brightness middle (cd/m²) | 322.2 | 333.8 4% | 253 -21% | 549.8 71% | 442.7 37% | 532 65% |
| Brightness (cd/m²) | 301 | 307 2% | 245 -19% | 520 73% | 428 42% | 513 70% |
| Brightness Distribution (%) | 86 | 83 -3% | 78 -9% | 86 0% | 84 -2% | 90 5% |
| Black Level * (cd/m²) | 0.25 | 0.4 -60% | 0.225 10% | 0.39 -56% | 0.31 -24% | 0.41 -64% |
| Contrast (:1) | 1289 | 835 -35% | 1124 -13% | 1410 9% | 1428 11% | 1298 1% |
| Colorchecker dE 2000 * | 3.62 | 3.54 2% | 8.89 -146% | 2.12 41% | 2.24 38% | 6.88 -90% |
| Colorchecker dE 2000 max. * | 6.9 | 5.8 16% | 4.56 34% | 3.66 47% | 7.19 -4% | 12.65 -83% |
| Colorchecker dE 2000 calibrated * | 1.22 | 2.36 -93% | 4.9 -302% | 1.37 -12% | 1.11 9% | 2.52 -107% |
| Greyscale dE 2000 * | 3.9 | 4.7 -21% | 6.33 -62% | 2.6 33% | 9.7 -149% | 10.5 -169% |
| Gamma | 2.43 91% | 2.14 103% | 2.52 87% | 2.3 96% | 1.42 155% | 1.98 111% |
| CCT | 6344 102% | 6261 104% | 6745 96% | 6884 94% | 6227 104% | 7394 88% |
| Color Space (Percent of AdobeRGB 1998) (%) | 61.3 | 61.2 0% | 60 -2% | 65.4 7% | 61.6 0% | 74.1 21% |
| Color Space (Percent of sRGB) (%) | 95.6 | 94.7 -1% | 91 -5% | 99.7 4% | 95 -1% | 99.7 4% |
| Totaal Gemiddelde (Programma / Instellingen) | 1% /
-9% | -7% /
-30% | 13% /
16% | 7% /
0% | -2% /
-17% |
* ... kleiner is beter
Responstijd Scherm
| ↔ Responstijd Zwart naar Wit | ||
|---|---|---|
| 32.8 ms ... stijging ↗ en daling ↘ gecombineerd | ↗ 19.6 ms stijging | 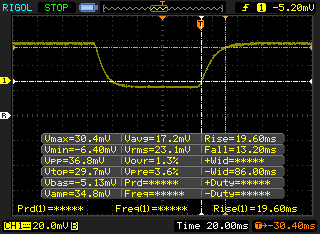 |
| ↘ 13.2 ms daling | ||
| Het scherm vertoonde trage responstijden in onze tests en is misschien te traag voor games. Ter vergelijking: alle testtoestellen variëren van 0.1 (minimum) tot 240 (maximum) ms. » 88 % van alle toestellen zijn beter. Dit betekent dat de gemeten responstijd slechter is dan het gemiddelde (19.8 ms) van alle geteste toestellen. | ||
| ↔ Responstijd 50% Grijs naar 80% Grijs | ||
| 54 ms ... stijging ↗ en daling ↘ gecombineerd | ↗ 28.8 ms stijging | 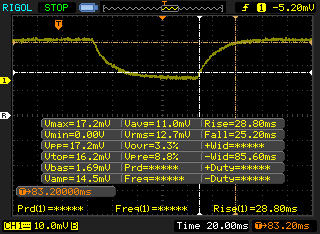 |
| ↘ 25.2 ms daling | ||
| Het scherm vertoonde trage responstijden in onze tests en is misschien te traag voor games. Ter vergelijking: alle testtoestellen variëren van 0.165 (minimum) tot 636 (maximum) ms. » 91 % van alle toestellen zijn beter. Dit betekent dat de gemeten responstijd slechter is dan het gemiddelde (30.9 ms) van alle geteste toestellen. | ||
Screen Flickering / PWM (Pulse-Width Modulation)
| Screen flickering / PWM niet waargenomen | 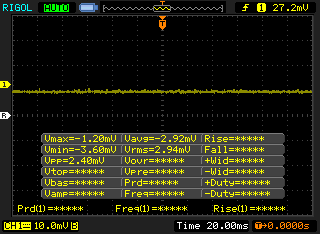 | ||
Ter vergelijking: 52 % van alle geteste toestellen maakten geen gebruik van PWM om de schermhelderheid te verlagen. Als het wel werd gebruikt, werd een gemiddelde van 7748 (minimum: 5 - maximum: 343500) Hz waargenomen. | |||
| wPrime 2.10 - 1024m | |
| Microsoft Surface Laptop 3 13 Core i5-1035G7 | |
| Dell XPS 13 7390 2-in-1 Core i7 | |
| Dell XPS 13 7390 Core i7-10710U | |
* ... kleiner is beter
| PCMark 8 | |
| Home Score Accelerated v2 | |
| Dell XPS 13 7390 2-in-1 Core i7 | |
| LG Gram 14T90N | |
| Gemiddeld Intel Core i7-10510U, Intel UHD Graphics 620 (3157 - 4251, n=13) | |
| Asus ZenBook 14 UM431DA-AM020T | |
| Huawei Matebook X Pro i5 | |
| LG Gram 14Z980-U.AAW5U1 | |
| Lenovo ThinkPad X1 Carbon G7 20R1-000YUS | |
| Work Score Accelerated v2 | |
| LG Gram 14T90N | |
| Dell XPS 13 7390 2-in-1 Core i7 | |
| Gemiddeld Intel Core i7-10510U, Intel UHD Graphics 620 (3734 - 5366, n=13) | |
| Asus ZenBook 14 UM431DA-AM020T | |
| LG Gram 14Z980-U.AAW5U1 | |
| Lenovo ThinkPad X1 Carbon G7 20R1-000YUS | |
| Huawei Matebook X Pro i5 | |
| PCMark 8 Home Score Accelerated v2 | 3646 punten | |
| PCMark 8 Work Score Accelerated v2 | 5153 punten | |
| PCMark 10 Score | 4167 punten | |
Help | ||
| LG Gram 14T90N Samsung SSD PM981a MZVLB512HBJQ | LG Gram 14Z980-U.AAW5U1 SK Hynix SC313 HFS256G39TNF | Asus ZenBook 14 UM431DA-AM020T SK hynix BC501 HFM512GDHTNG-8310A | Dell XPS 13 7390 2-in-1 Core i7 Toshiba BG4 KBG40ZPZ512G | Lenovo ThinkPad X1 Carbon G7 20R1-000YUS WDC PC SN730 SDBPNTY-512G | |
|---|---|---|---|---|---|
| AS SSD | -63% | -32% | -76% | -21% | |
| Seq Read (MB/s) | 1829 | 476.1 -74% | 1417 -23% | 1801 -2% | 1786 -2% |
| Seq Write (MB/s) | 2048 | 487.4 -76% | 781 -62% | 1125 -45% | 1259 -39% |
| 4K Read (MB/s) | 54.2 | 30.57 -44% | 37.03 -32% | 39.7 -27% | 45.86 -15% |
| 4K Write (MB/s) | 120.5 | 66.1 -45% | 80.1 -34% | 67 -44% | 147.9 23% |
| 4K-64 Read (MB/s) | 1512 | 352.9 -77% | 740 -51% | 1253 -17% | 885 -41% |
| 4K-64 Write (MB/s) | 1573 | 263.1 -83% | 748 -52% | 209 -87% | 950 -40% |
| Access Time Read * (ms) | 0.046 | 0.092 -100% | 0.047 -2% | 0.069 -50% | 0.058 -26% |
| Access Time Write * (ms) | 0.091 | 0.055 40% | 0.045 51% | 0.625 -587% | 0.074 19% |
| Score Read (Points) | 1749 | 431 -75% | 918 -48% | 1472 -16% | 1110 -37% |
| Score Write (Points) | 1899 | 378 -80% | 906 -52% | 388 -80% | 1224 -36% |
| Score Total (Points) | 4560 | 1040 -77% | 2270 -50% | 2583 -43% | 2885 -37% |
| Copy ISO MB/s (MB/s) | 1891 | 514 -73% | 1293 -32% | 1384 -27% | |
| Copy Program MB/s (MB/s) | 569 | 259.3 -54% | 560 -2% | 525 -8% | |
| Copy Game MB/s (MB/s) | 1425 | 521 -63% | 927 -35% | 1008 -29% | |
| CrystalDiskMark 5.2 / 6 | -69% | -45% | -23% | -3% | |
| Write 4K (MB/s) | 181.4 | 74.7 -59% | 118.8 -35% | 106.7 -41% | 151.5 -16% |
| Read 4K (MB/s) | 52.5 | 14.89 -72% | 41.62 -21% | 49.94 -5% | 45.83 -13% |
| Write Seq (MB/s) | 1592 | 502 -68% | 796 -50% | 1223 -23% | 2060 29% |
| Read Seq (MB/s) | 1617 | 498.6 -69% | 1101 -32% | 1801 11% | 1973 22% |
| Write 4K Q32T1 (MB/s) | 556 | 214.3 -61% | 234.7 -58% | 325.3 -41% | 489.8 -12% |
| Read 4K Q32T1 (MB/s) | 539 | 225.5 -58% | 313.8 -42% | 551 2% | 386.2 -28% |
| Write Seq Q32T1 (MB/s) | 2955 | 505 -83% | 842 -72% | 1224 -59% | 2703 -9% |
| Read Seq Q32T1 (MB/s) | 3270 | 560 -83% | 1645 -50% | 2350 -28% | 3376 3% |
| Totaal Gemiddelde (Programma / Instellingen) | -66% /
-65% | -39% /
-38% | -50% /
-57% | -12% /
-15% |
* ... kleiner is beter

| 3DMark 11 Performance | 1923 punten | |
| 3DMark Ice Storm Standard Score | 14669 punten | |
| 3DMark Cloud Gate Standard Score | 6582 punten | |
| 3DMark Fire Strike Score | 1056 punten | |
| 3DMark Time Spy Score | 429 punten | |
Help | ||
| lage | gem. | hoge | ultra | |
|---|---|---|---|---|
| BioShock Infinite (2013) | 59.8 | 38.4 | 32 | 10.2 |
| Dota 2 Reborn (2015) | 57.6 | 39.1 | 19 | 17 |
| X-Plane 11.11 (2018) | 20.5 | 13.2 | 12 |
| LG Gram 14T90N UHD Graphics 620, i7-10510U, Samsung SSD PM981a MZVLB512HBJQ | LG Gram 14Z980-U.AAW5U1 UHD Graphics 620, i5-8250U, SK Hynix SC313 HFS256G39TNF | Asus ZenBook 14 UM431DA-AM020T Vega 10, R7 3700U, SK hynix BC501 HFM512GDHTNG-8310A | Dell XPS 13 7390 2-in-1 Core i7 Iris Plus Graphics G7 (Ice Lake 64 EU), i7-1065G7, Toshiba BG4 KBG40ZPZ512G | Huawei Matebook X Pro i5 GeForce MX150, i5-8250U, Samsung PM961 MZVLW256HEHP | Lenovo Yoga C940-14IIL 81Q9 Iris Plus Graphics G7 (Ice Lake 64 EU), i7-1065G7, Samsung PM981a MZVLB1T0HBLR | |
|---|---|---|---|---|---|---|
| Noise | 4% | 1% | 2% | 0% | 2% | |
| uit / omgeving * (dB) | 29 | 28.2 3% | 29.8 -3% | 28.1 3% | 27.9 4% | 28.5 2% |
| Idle Minimum * (dB) | 30 | 28.4 5% | 28 7% | 28.1 6% | 27.9 7% | 28.5 5% |
| Idle Average * (dB) | 30 | 28.4 5% | 28 7% | 28.1 6% | 27.9 7% | 28.5 5% |
| Idle Maximum * (dB) | 30 | 28.4 5% | 28 7% | 28.1 6% | 27.9 7% | 29 3% |
| Load Average * (dB) | 35.2 | 35.7 -1% | 36.8 -5% | 31.7 10% | 36.2 -3% | 33 6% |
| Load Maximum * (dB) | 37 | 34.2 8% | 39 -5% | 43.4 -17% | 45.2 -22% | 39.5 -7% |
| Witcher 3 ultra * (dB) | 43.4 | 45 | 40.7 |
* ... kleiner is beter
Geluidsniveau
| Onbelast |
| 30 / 30 / 30 dB (A) |
| Belasting |
| 35.2 / 37 dB (A) |
 | ||
30 dB stil 40 dB(A) hoorbaar 50 dB(A) luid |
||
min: | ||
(±) De maximumtemperatuur aan de bovenzijde bedraagt 43.2 °C / 110 F, vergeleken met het gemiddelde van 35.4 °C / 96 F, variërend van 19.6 tot 60 °C voor de klasse Convertible.
(±) De bodem warmt op tot een maximum van 41.6 °C / 107 F, vergeleken met een gemiddelde van 36.9 °C / 98 F
(+) Bij onbelast gebruik bedraagt de gemiddelde temperatuur voor de bovenzijde 26.7 °C / 80 F, vergeleken met het apparaatgemiddelde van 30.3 °C / 87 F.
(+) De palmsteunen en het touchpad zijn met een maximum van ###max## °C / 86 F koeler dan de huidtemperatuur en voelen daarom koel aan.
(±) De gemiddelde temperatuur van de handpalmsteun van soortgelijke toestellen bedroeg 28 °C / 82.4 F (-2 °C / -3.6 F).
| Uit / Standby | |
| Inactief | |
| Belasting |
|
Key:
min: | |
| LG Gram 14T90N i7-10510U, UHD Graphics 620, Samsung SSD PM981a MZVLB512HBJQ, IPS, 1920x1080, 14" | LG Gram 14Z980-U.AAW5U1 i5-8250U, UHD Graphics 620, SK Hynix SC313 HFS256G39TNF, IPS, 1920x1080, 14" | Asus ZenBook 14 UM431DA-AM020T R7 3700U, Vega 10, SK hynix BC501 HFM512GDHTNG-8310A, IPS, 1920x1080, 14" | Dell XPS 13 7390 2-in-1 Core i7 i7-1065G7, Iris Plus Graphics G7 (Ice Lake 64 EU), Toshiba BG4 KBG40ZPZ512G, IPS, 1920x1200, 13.4" | Huawei Matebook X Pro i5 i5-8250U, GeForce MX150, Samsung PM961 MZVLW256HEHP, IPS, 3000x2000, 13.9" | Lenovo Yoga C940-14IIL 81Q9 i7-1065G7, Iris Plus Graphics G7 (Ice Lake 64 EU), Samsung PM981a MZVLB1T0HBLR, IPS, 3840x2160, 14" | |
|---|---|---|---|---|---|---|
| Power Consumption | 5% | -26% | -5% | -49% | -73% | |
| Idle Minimum * (Watt) | 2.9 | 2.7 7% | 3.6 -24% | 2.6 10% | 3.5 -21% | 5.6 -93% |
| Idle Average * (Watt) | 5.8 | 6 -3% | 7.2 -24% | 5.3 9% | 8.9 -53% | 10.5 -81% |
| Idle Maximum * (Watt) | 6.2 | 6.5 -5% | 10.8 -74% | 7 -13% | 12.3 -98% | 12 -94% |
| Load Average * (Watt) | 32.9 | 32.5 1% | 38 -16% | 43.1 -31% | 54.2 -65% | 53.3 -62% |
| Load Maximum * (Watt) | 48.5 | 35.5 27% | 45.2 7% | 49 -1% | 52.1 -7% | 64.6 -33% |
| Witcher 3 ultra * (Watt) | 43.1 | 42.4 | 46.9 |
* ... kleiner is beter
| LG Gram 14T90N i7-10510U, UHD Graphics 620, 72 Wh | LG Gram 14Z980-U.AAW5U1 i5-8250U, UHD Graphics 620, 72 Wh | Asus ZenBook 14 UM431DA-AM020T R7 3700U, Vega 10, 47 Wh | Dell XPS 13 7390 2-in-1 Core i7 i7-1065G7, Iris Plus Graphics G7 (Ice Lake 64 EU), 51 Wh | Huawei Matebook X Pro i5 i5-8250U, GeForce MX150, 57.4 Wh | Lenovo ThinkPad X1 Carbon G7 20R1-000YUS i7-10510U, UHD Graphics 620, 51 Wh | |
|---|---|---|---|---|---|---|
| Batterijduur | 5% | -37% | -28% | -26% | -20% | |
| Reader / Idle (h) | 32.8 | 37.3 14% | 17.8 -46% | 20.7 -37% | ||
| WiFi v1.3 (h) | 12.5 | 12 -4% | 6.7 -46% | 9 -28% | 9.3 -26% | 10 -20% |
| Load (h) | 2.6 | 2.7 4% | 2.1 -19% | 2.2 -15% |
Pro
Contra
Dit is de verkorte versie van het originele artikel. Het volledige, Engelse testrapport vind je hier.
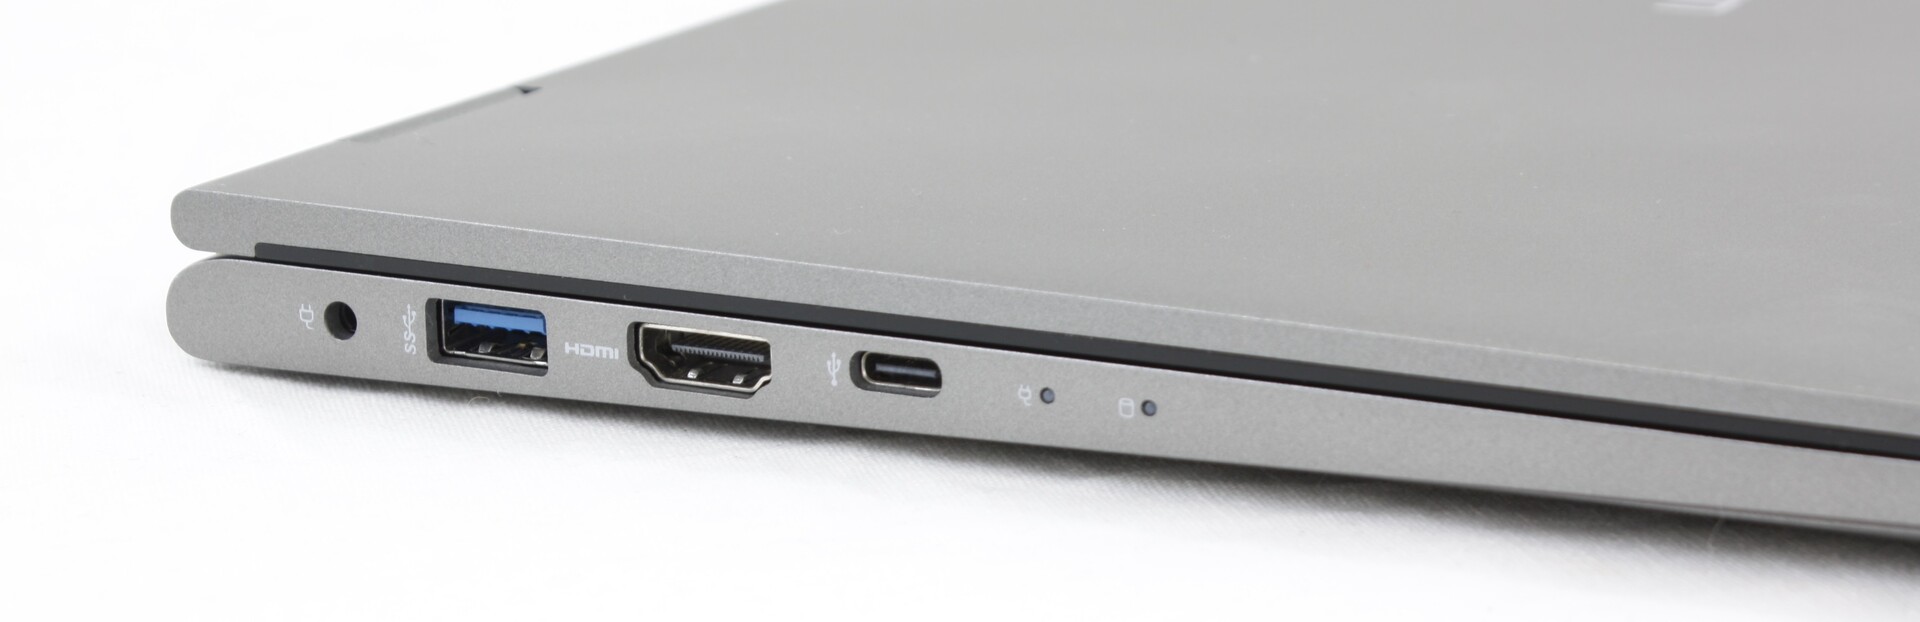
Het verschil tussen de oudere LG Gram14T990 en de nieuwere LG Gram 14T90N is op zijn best marginaal. De processorupdate is nauwelijks merkbaar, waardoor Thunderbolt 3 de belangrijkste onderscheidende factor tussen de twee modellen blijft. Als je van plan bent om op Thunderbolt 3-gebaseerde toestellen zoals dockingstations en externe monitors te gebruiken, zal je baat hebben bij de Gram 14T90N. Anders spaar je jezelf beter een paar honderd euro uit en ga je gewoon voor de Gram14T990.
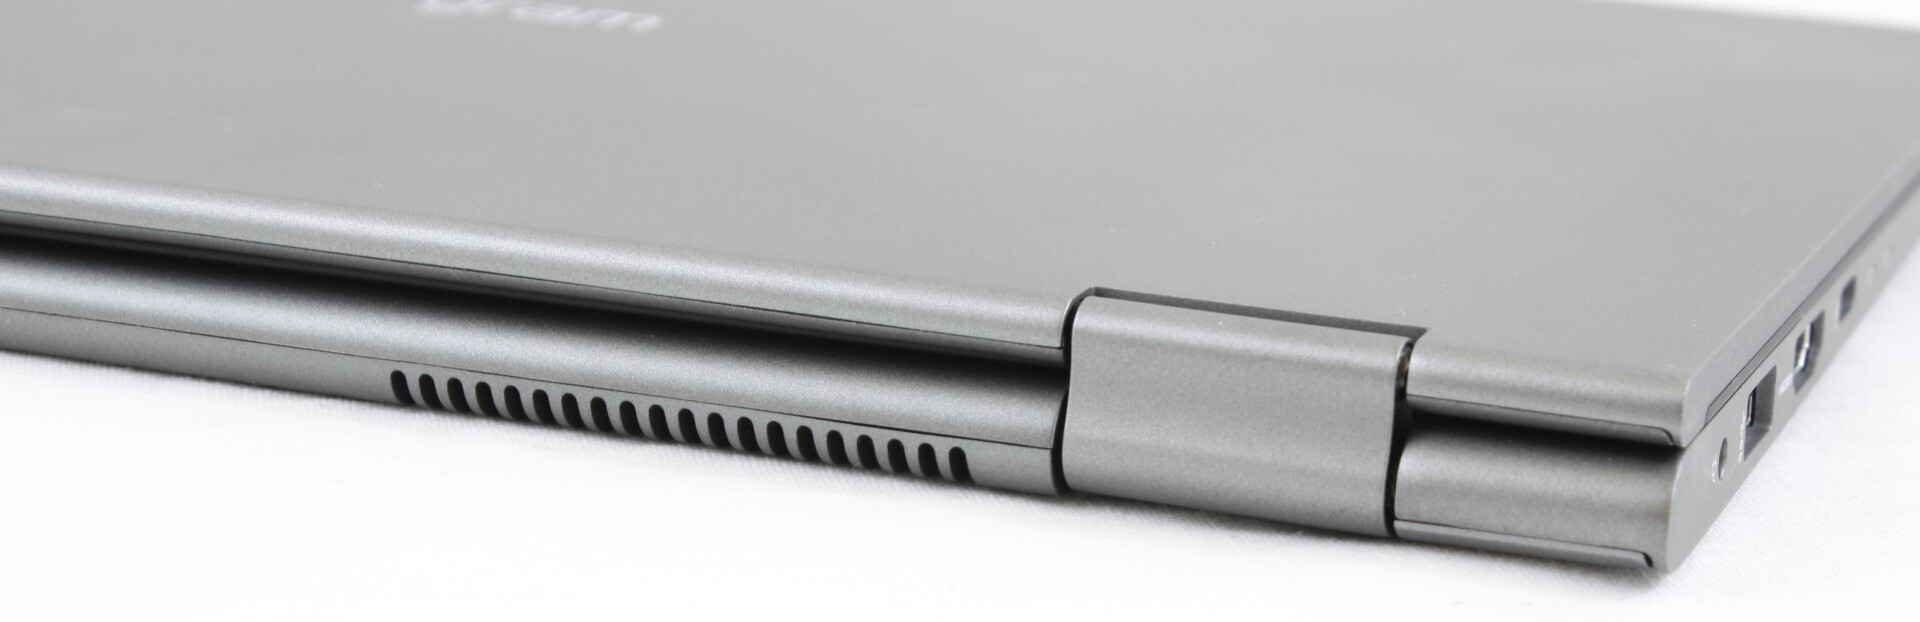
Er zijn een paar opvallende voordelen die de LG-convertible heeft ten opzichte van concurrenten. Het lage gewicht maakt het gemakkelijker om hem in tabletmodus te gebruiken dan bijvoorbeeld de ZenBook 14 Flip en de dubbele interne opslagcompartimenten zijn zeldzaam voor de toestelcategorie. Toch voelt het systeem te zwak aan voor de prijs, vooral op het vlak van grafische prestaties, terwijl algemene privacyfuncties zoals een webcam-sluiter of IR-camera niet aanwezig zijn. Misschien had een Core i7 Ice Lake-CPU beter gewerkt voor de doelgroep. Het scherm had ook helderder mogen zijn voor comfortabeler gebruik buitenshuis.
De Gram 14T90N is een convertible van 1400 euro met een slecht presterende CPU en verder niets bijzonders. Je moet echt baat hebben bij het lichte gewicht, de lange batterijduur en de Thunderbolt 3-poort om het meeste uit het systeem te kunnen halen.
LG Gram 14T90N
- 06-04-2020 v7 (old)
Allen Ngo
Price comparison
