LG Gram 16 16T90P Convertible Review: Lichter dan de meeste 15,6-inch laptops
LG kondigde tijdens CES 2021 twee 16-inch Gram-laptops aan: de Gram 16 clamshell en de Gram 16 convertible, elk aangedreven door de nieuwste Intel 11e gen Tiger Lake-U CPU's. Het toestel dat we vandaag zullen bekijken is de Gram 16 convertible die opmerkelijk is omdat het een van de eerste 16:10 2-in-1 laptops is in zijn grootteklasse. Het systeem is niet goedkoop met een verkoopprijs van rond de $1600+ USD, ondanks het ontbreken van enige discrete grafische opties.
Directe concurrenten zijn er op dit moment nauwelijks. Daarom zullen we de Gram 16 2-in-1 vergelijken met de meer bekende 15.6-inch convertibles zoals de Dell XPS 15 2-in-1, HP Spectre x360 15, Asus ZenBook 15 Flip, of de Lenovo Yoga C940 15.
Meer LG reviews:
potential competitors in comparison
Evaluatie | Datum | Model | Gewicht | Hoogte | Formaat | Resolutie | Beste prijs |
|---|---|---|---|---|---|---|---|
| 85.8 % v7 (old) | 04-2021 | LG Gram 16 2-in-1 16T90P i7-1165G7, Iris Xe G7 96EUs | 1.5 kg | 17 mm | 16.00" | 2560x1600 | |
| 84.1 % v7 (old) | 03-2021 | Honor MagicBook Pro 10210U i5-10210U, GeForce MX350 | 1.7 kg | 16.9 mm | 16.10" | 1920x1080 | |
| 89.7 % v7 (old) | 12-2019 | Apple MacBook Pro 16 2019 i9 5500M i9-9880H, Radeon Pro 5500M | 2 kg | 16.2 mm | 16.00" | 3072x1920 | |
| 86.8 % v7 (old) | 05-2020 | Dell XPS 15 9500 Core i5 i5-10300H, UHD Graphics 630 | 1.8 kg | 18 mm | 15.60" | 1920x1200 | |
| 85 % v7 (old) | 01-2020 | HP Spectre X360 15-5ZV31AV i7-10510U, GeForce MX250 | 2.1 kg | 19.3 mm | 15.60" | 3840x2160 | |
| 87 % v7 (old) | 12-2020 | Asus ZenBook UX535-M01440 i7-10750H, GeForce GTX 1650 Ti Max-Q | 2 kg | 20 mm | 15.60" | 3840x2160 |
Zaak
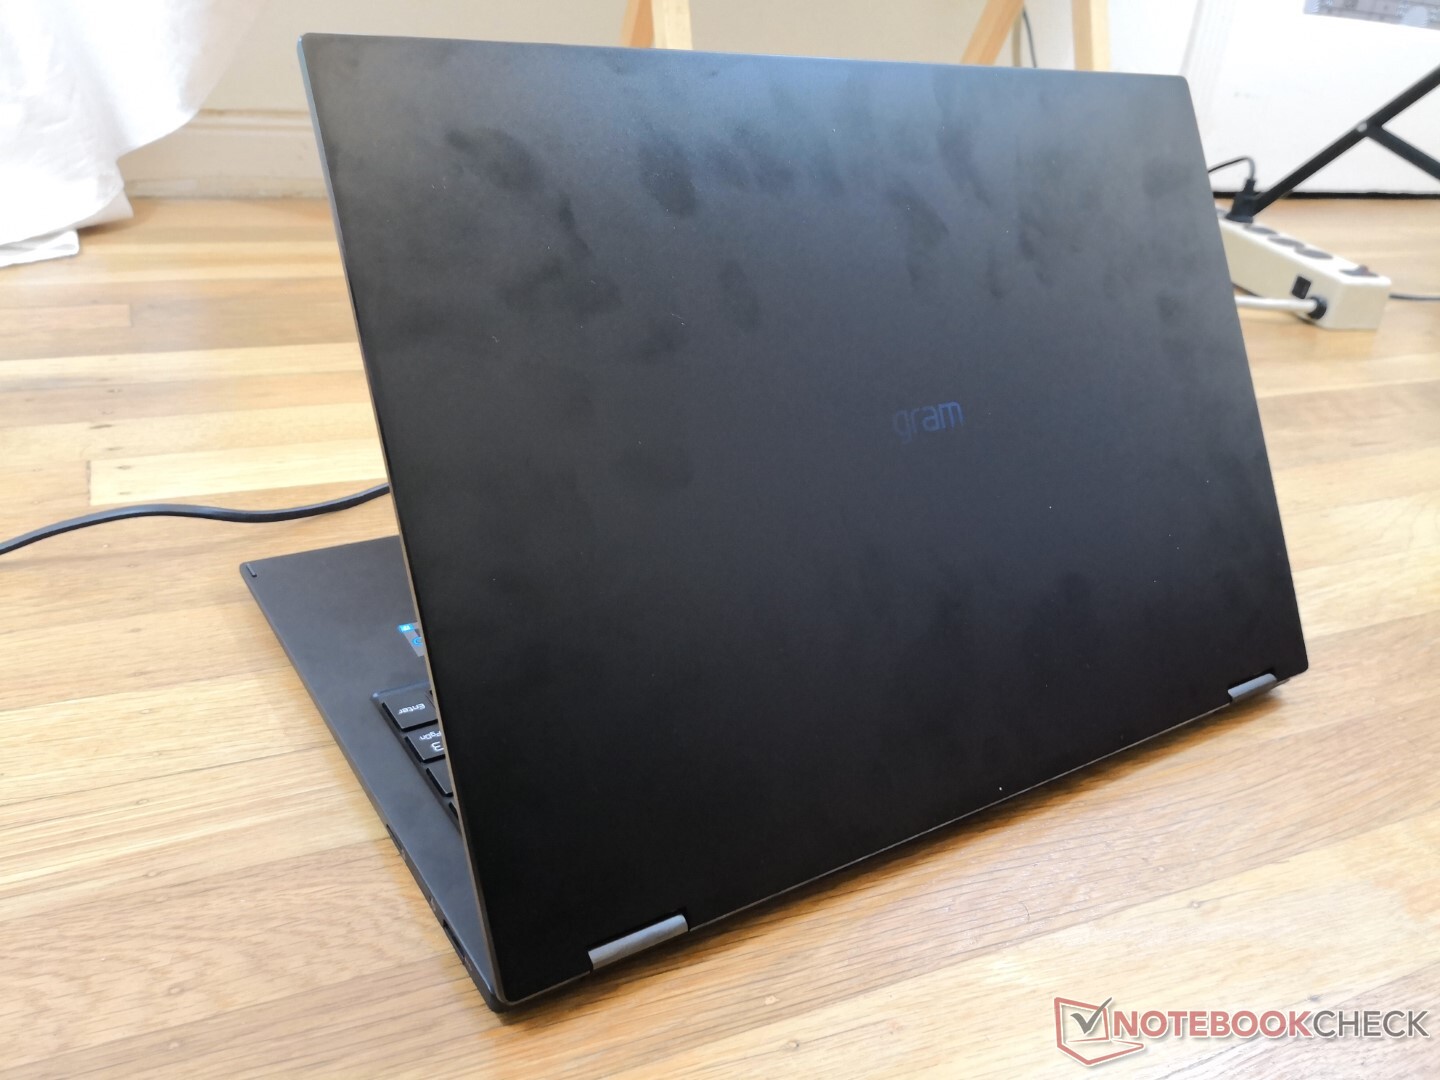
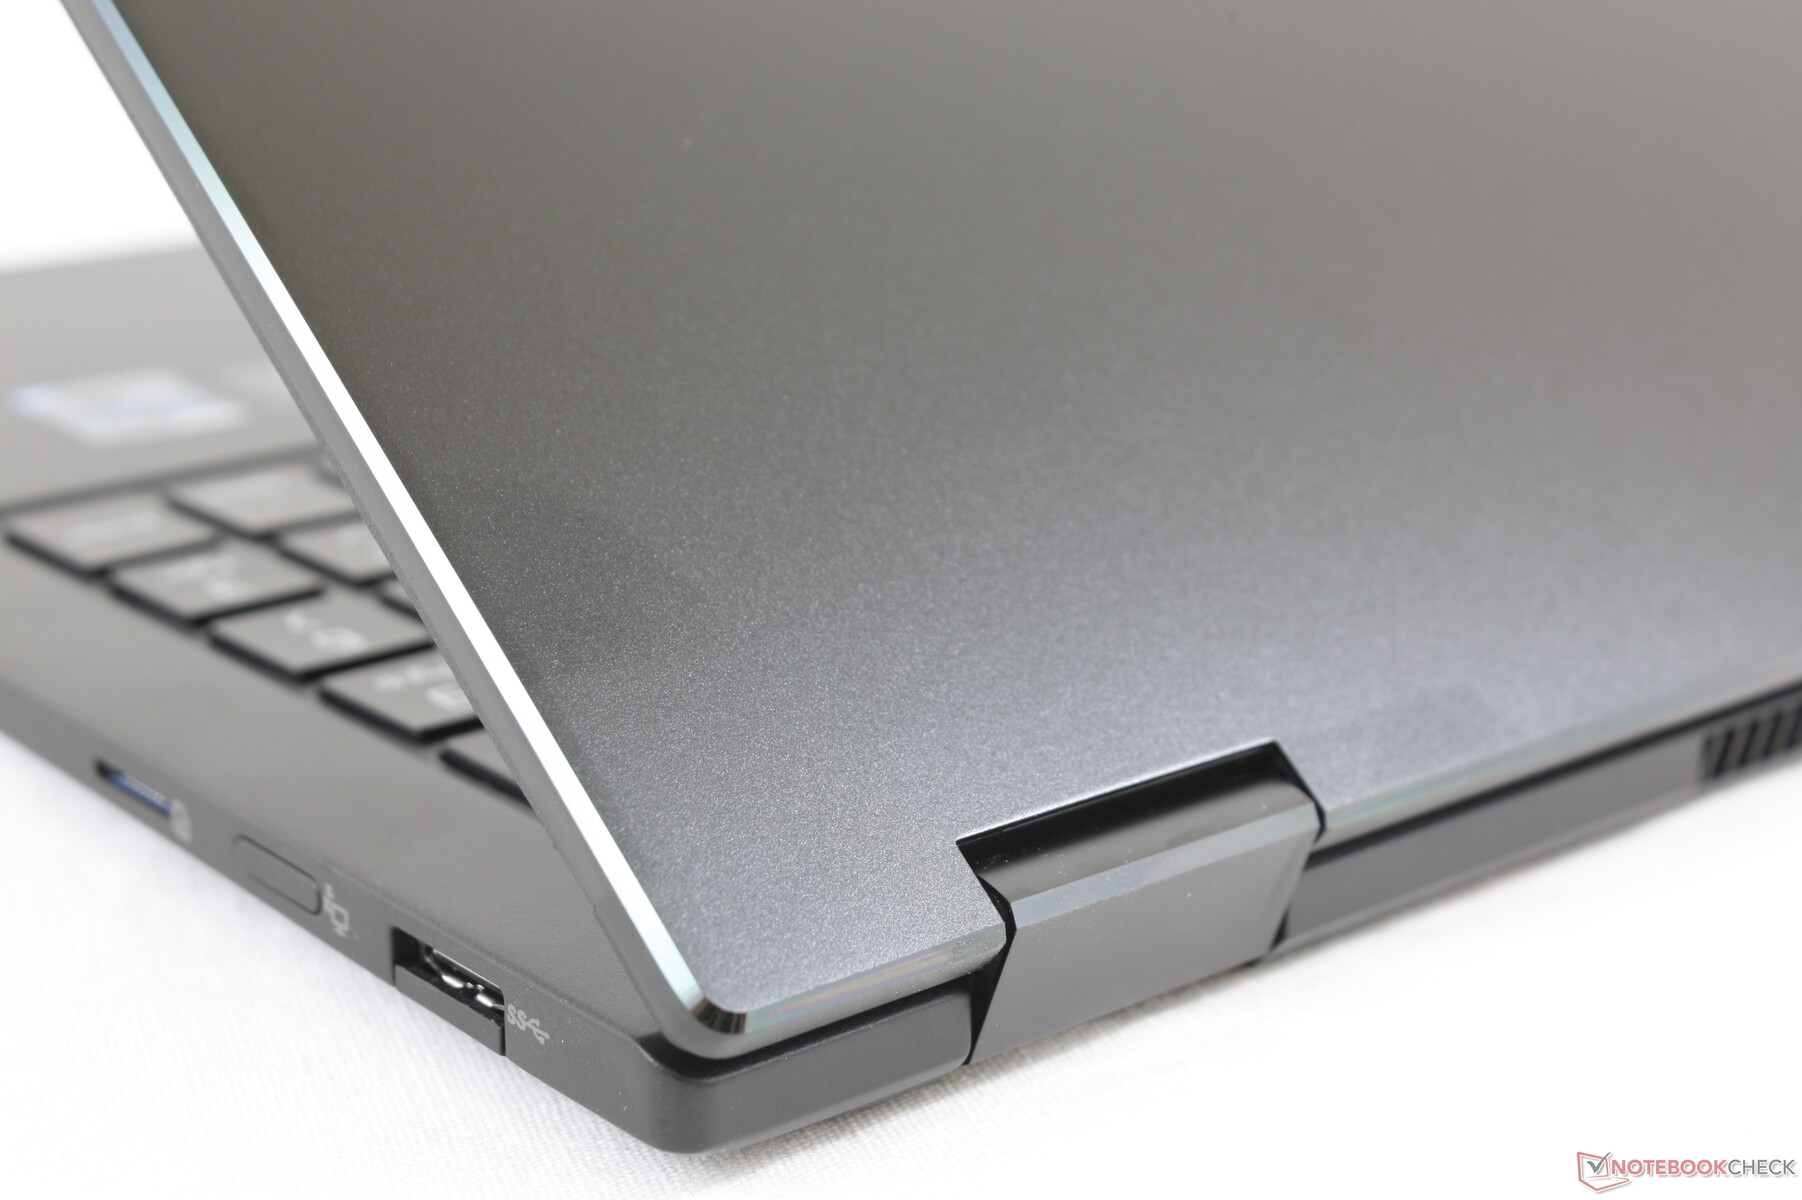
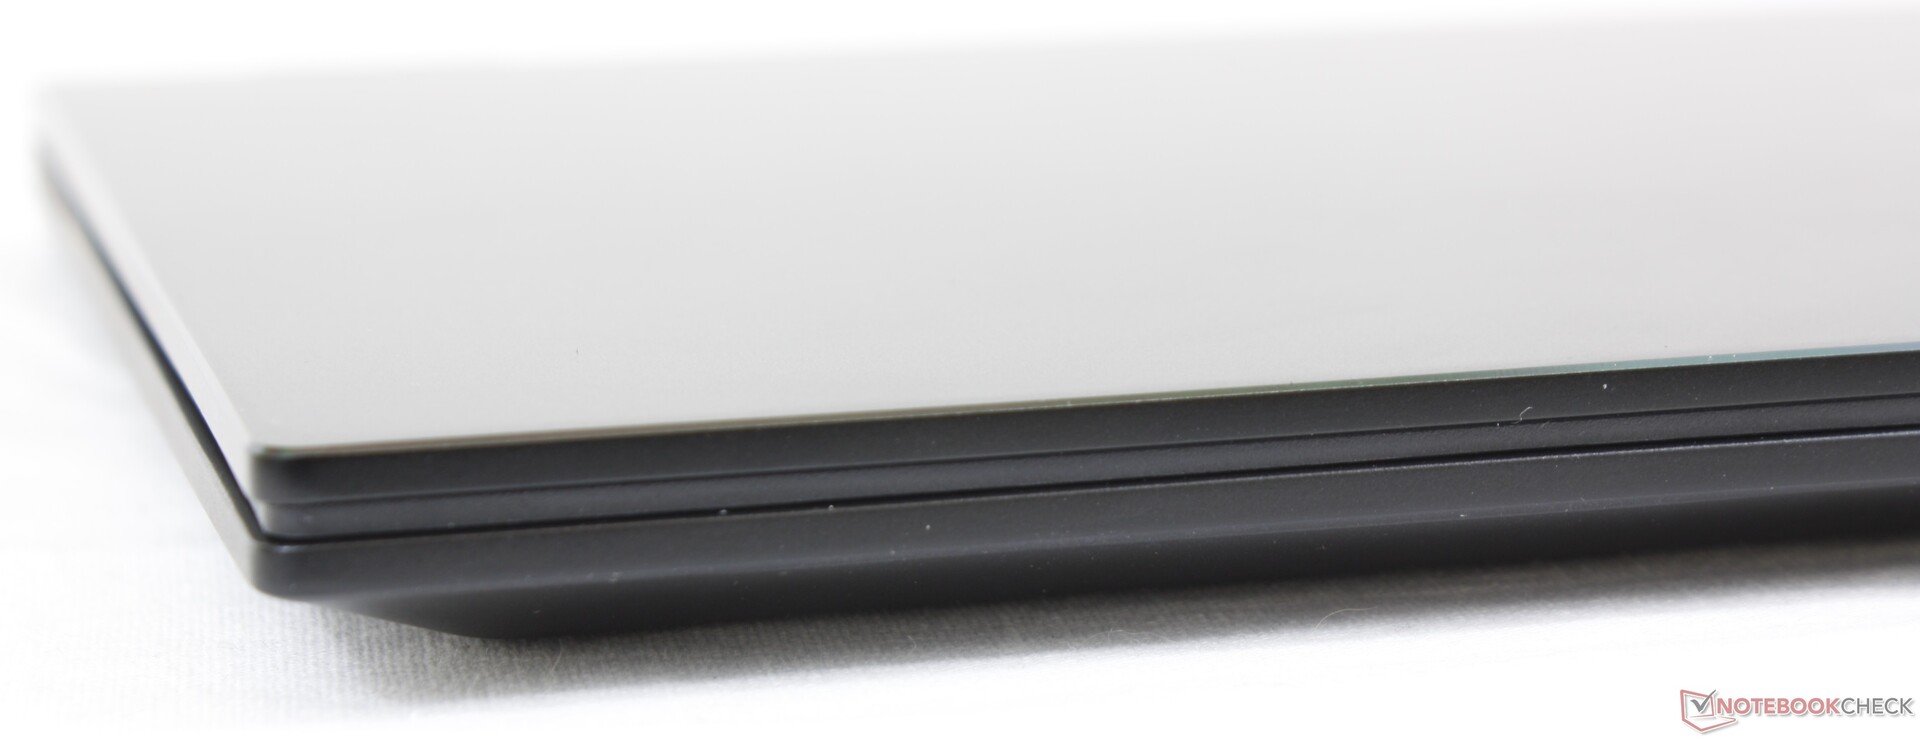
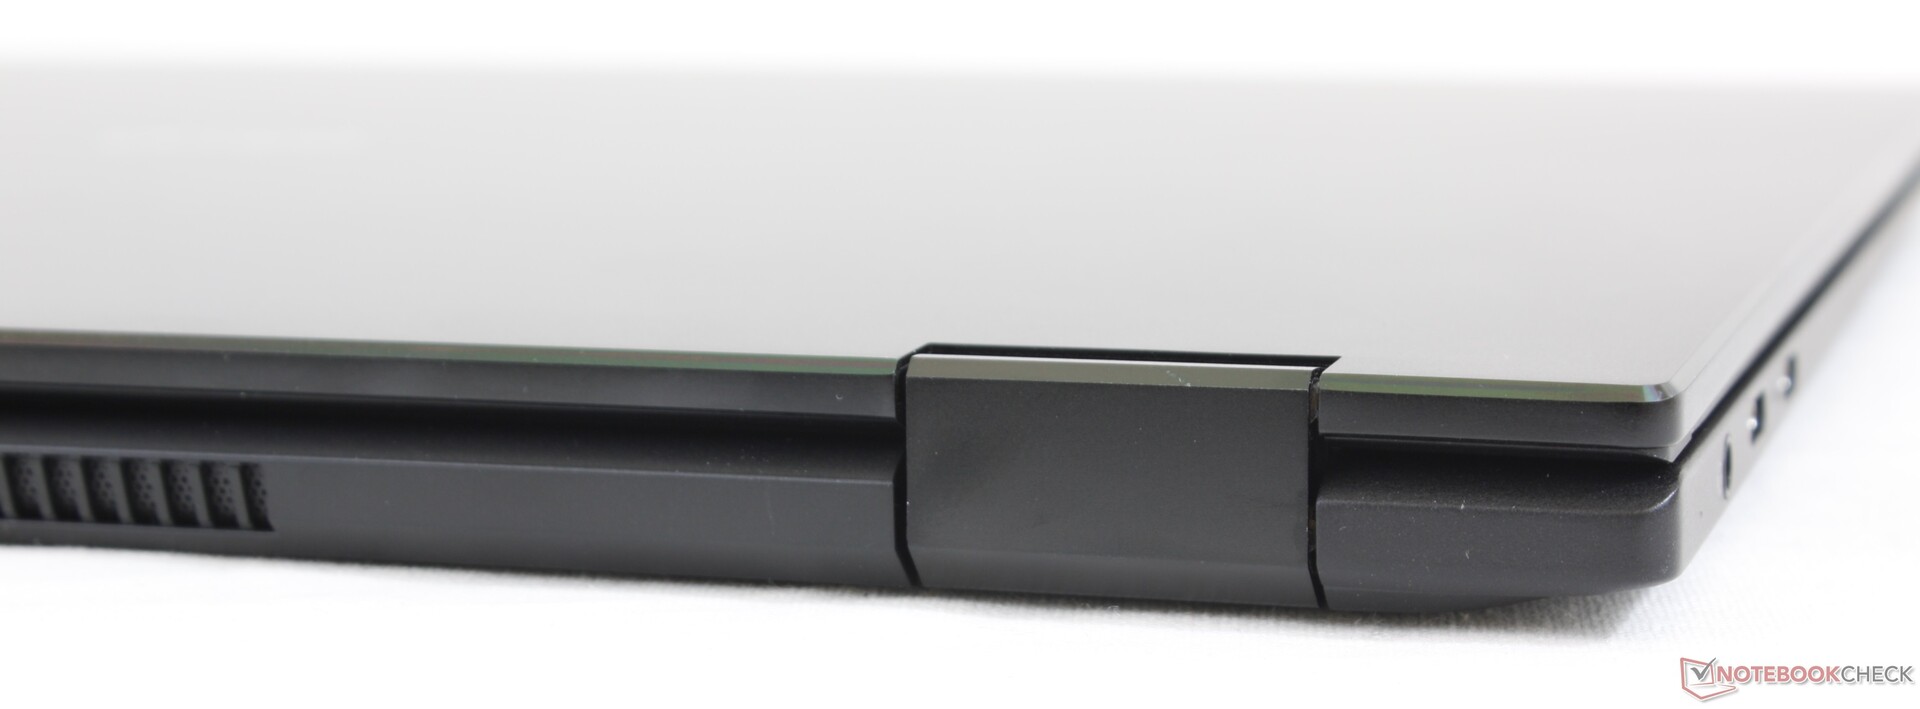
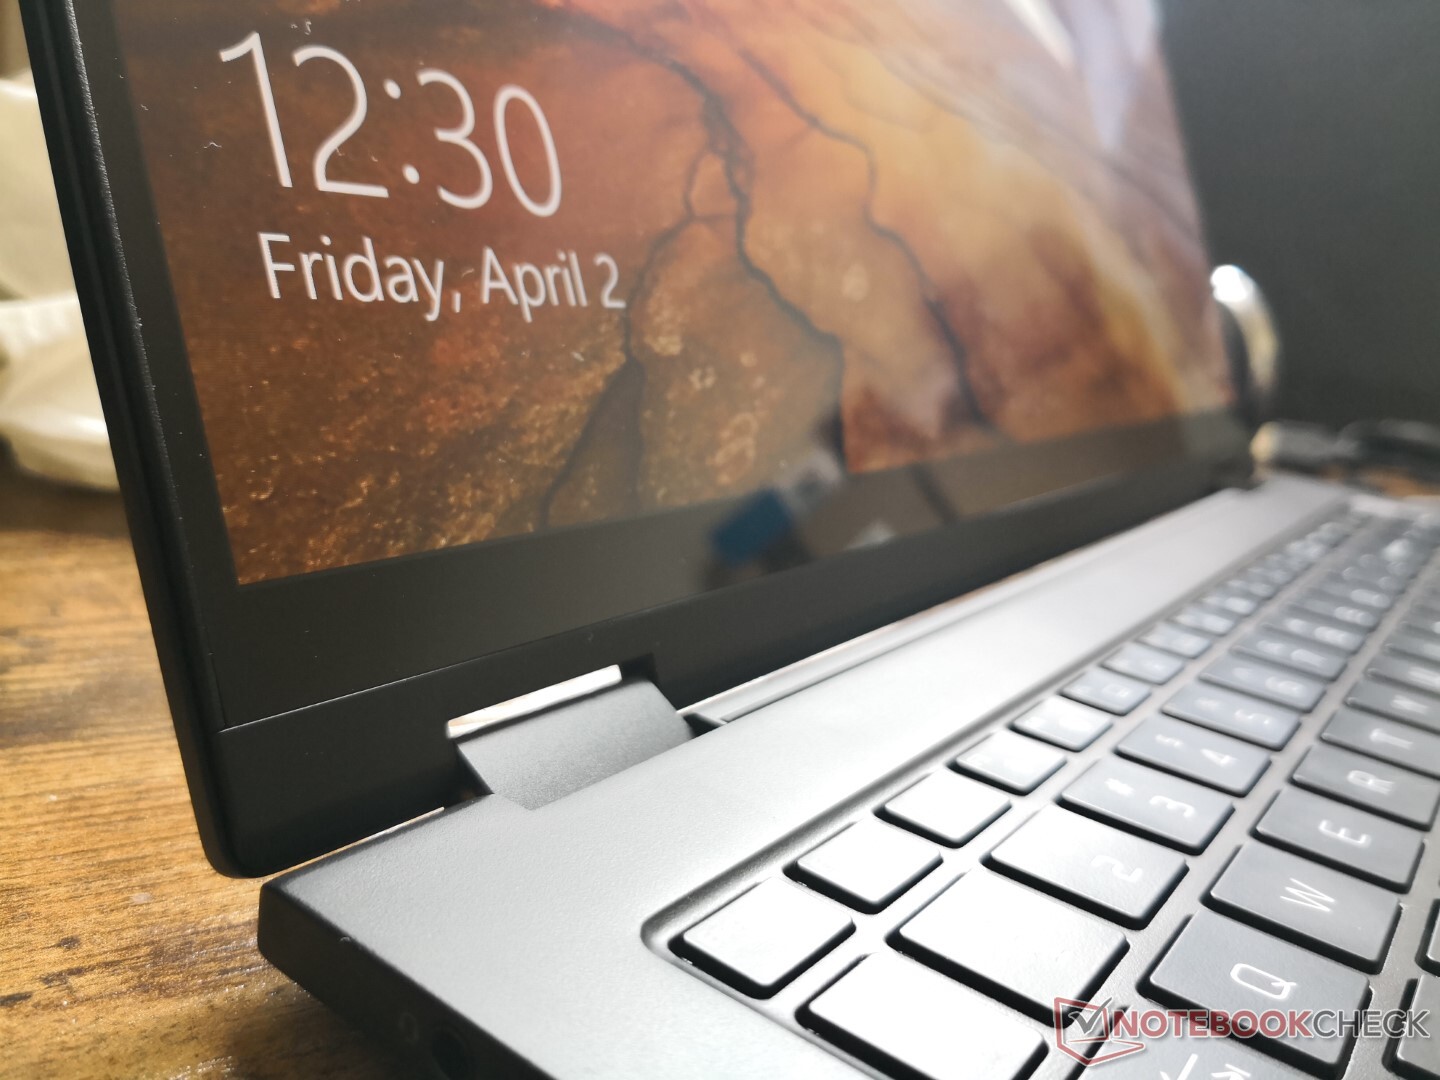
Het metalen chassis ziet er goed uit, maar het is een paar stappen lager dan de vergelijkbaar geprijsde HP Spectre of Dell XPS. De basis, bijvoorbeeld, is gevoeliger voor verdraaien en kraken, terwijl het deksel gemakkelijker buigt. De twee scharnieren in het bijzonder zijn waarschijnlijk het zwakste aspect van het verder slanke chassis, omdat ze slecht werk leveren door te voorkomen dat het deksel gaat wankelen in laptop-modus. De eerste indrukken zijn daarom uitstekend van een afstand en slechts gemiddeld bij het schakelen tussen modi.
De LG is veel lichter dan de meeste 15,6-inch laptops of convertibles, ondanks het grotere 16-inch schermformaat. De Spectre x360 15, bijvoorbeeld, is ruim een halve kilo zwaarder. De totale afmetingen komen sterk overeen met die van de MacBook Pro 16, zij het een haartje dikker

Connectiviteit
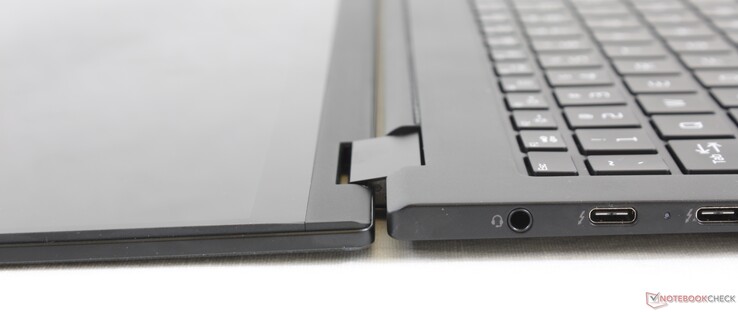
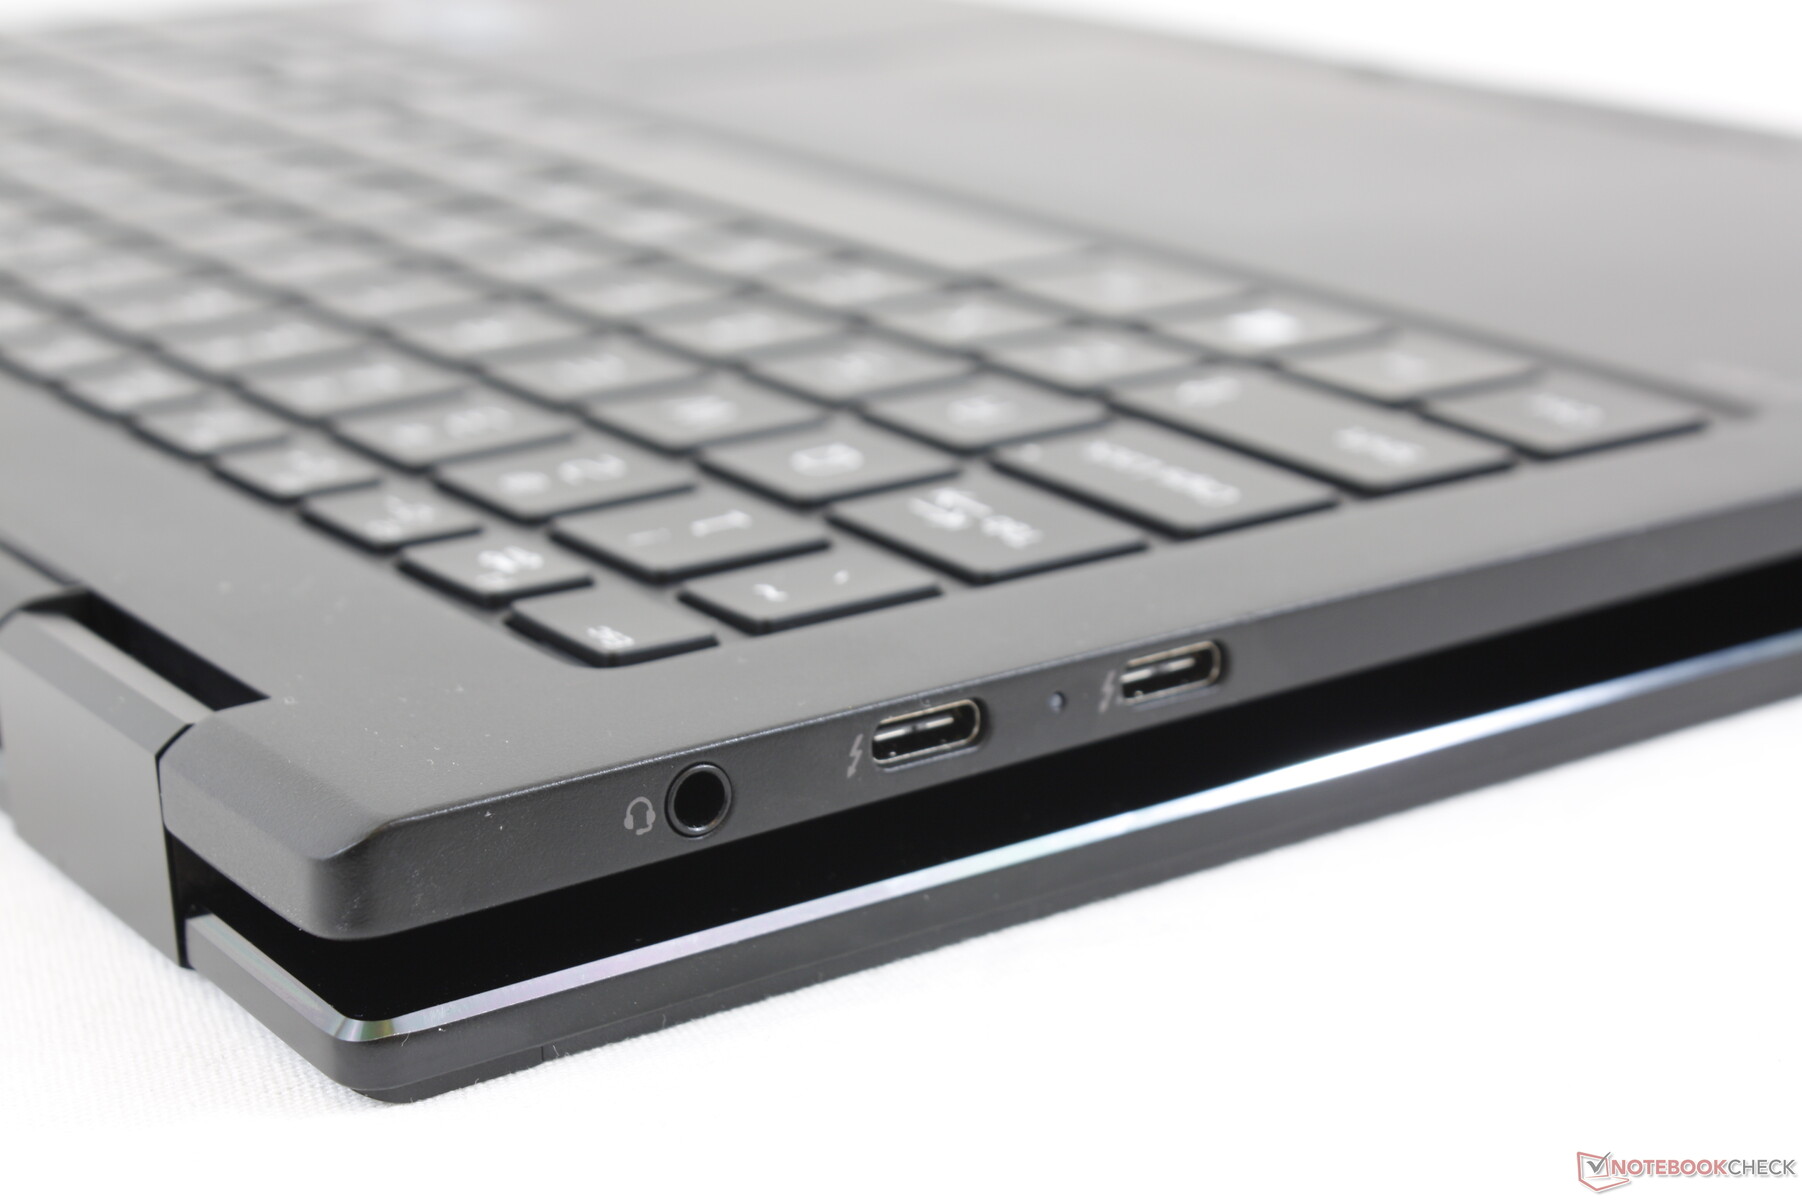
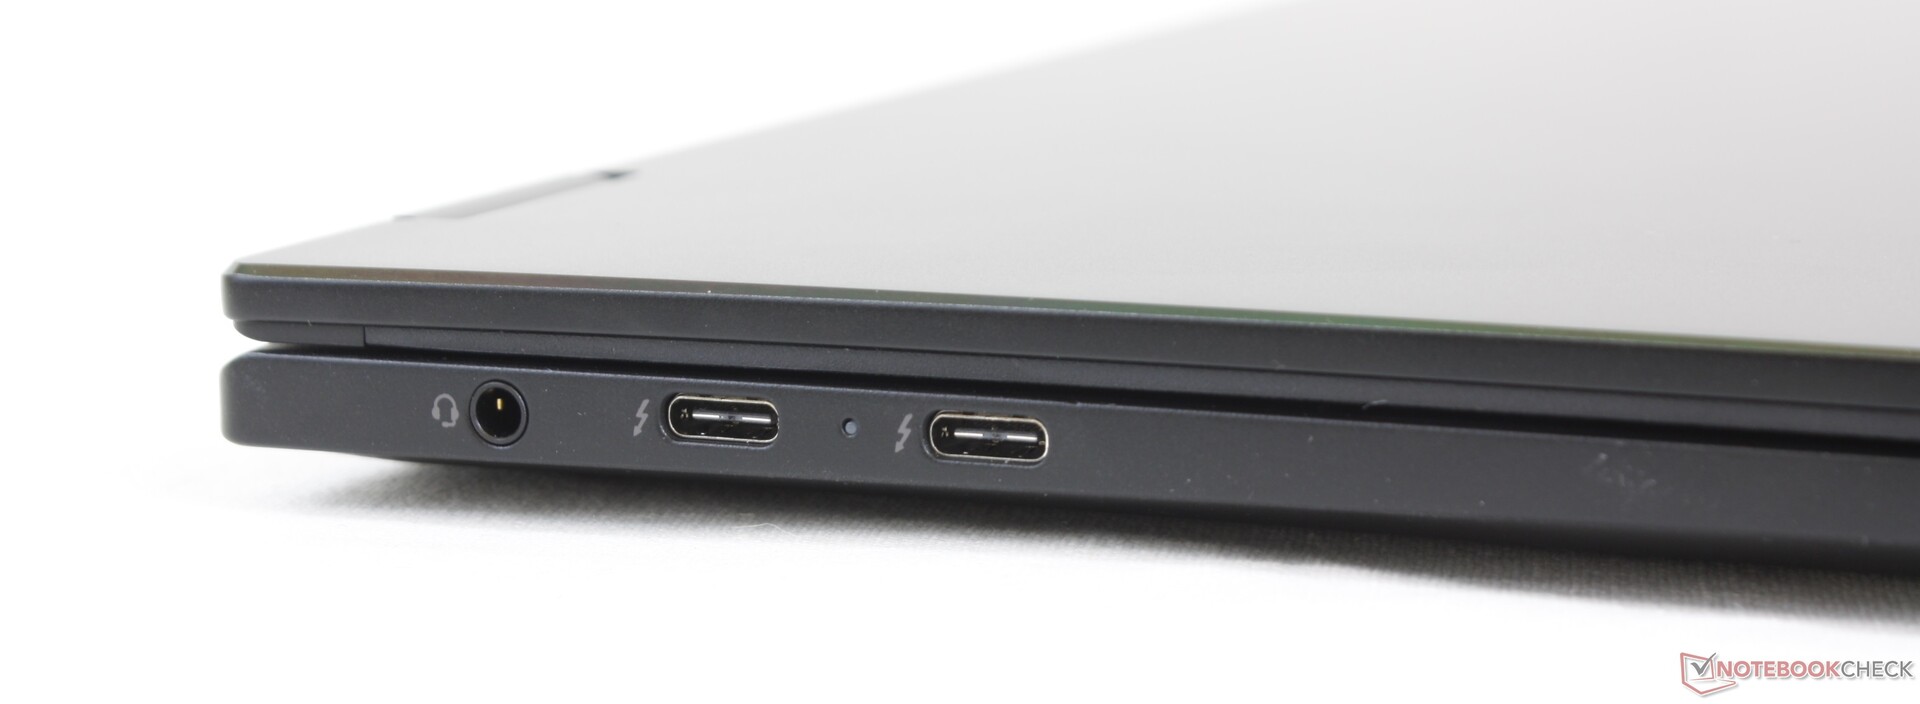
De poortopties zijn behoorlijk voor een 16-inch form factor. Om het maximale uit het systeem te halen, zullen bezitters echter moeten investeren in USB-C-adapters of dockingstations. Hou er rekening mee dat de USB-A poort langs de rechterrand wordt afgedekt door een klep die moeilijk te openen kan zijn zonder eerst de hele laptop op te tillen.
Externe grafische toepassingen worden ondersteund via Thunderbolt 4 om van de Gram 16 een krachtpatser te maken, mochten gebruikers beslissen om die weg in te slaan.
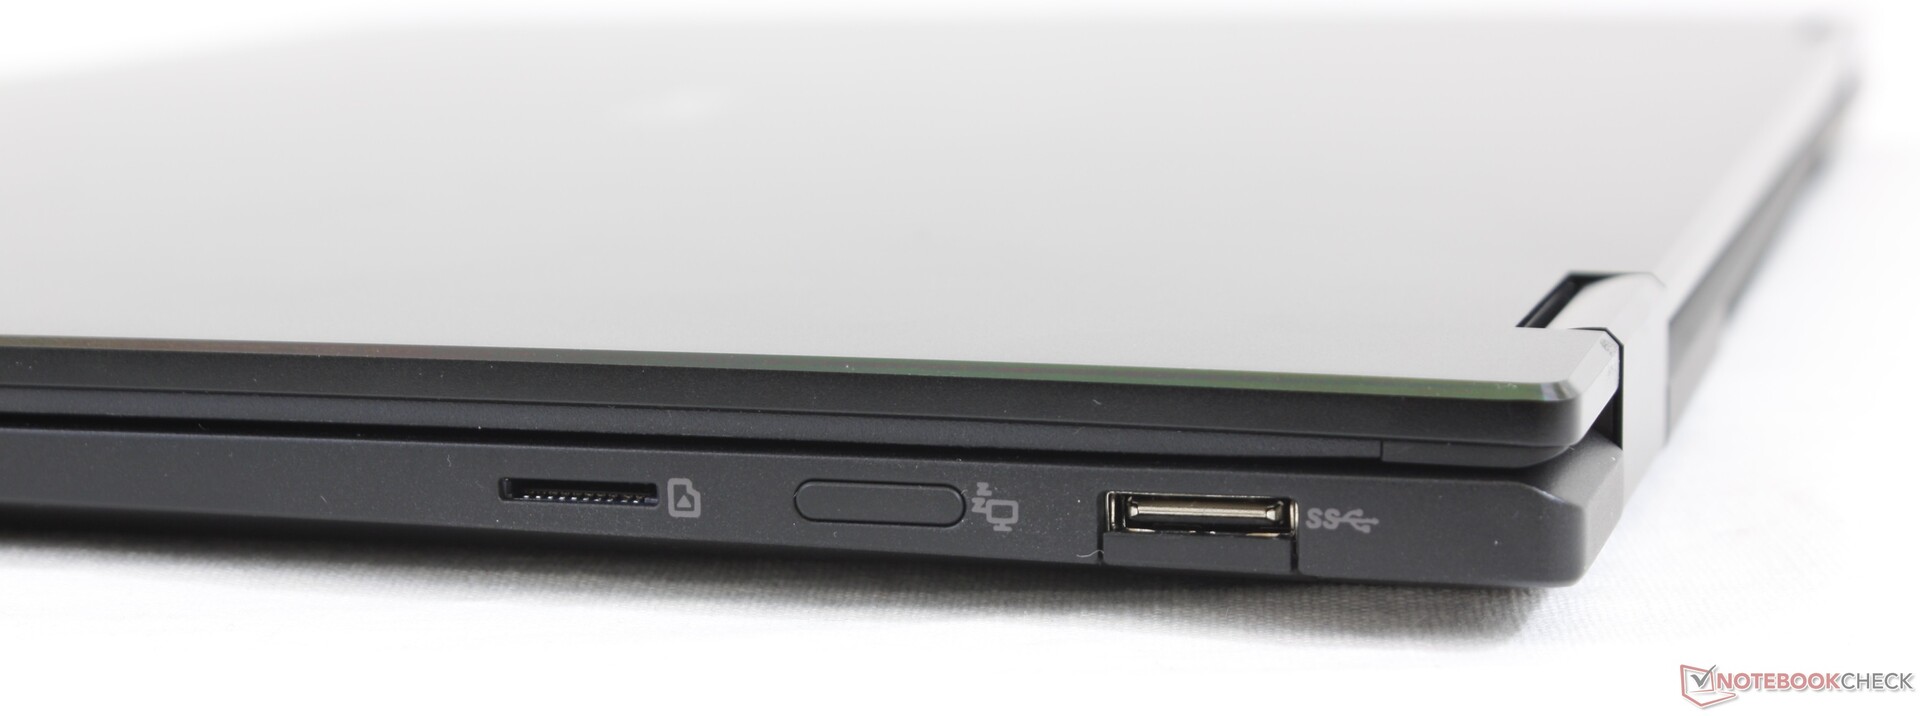
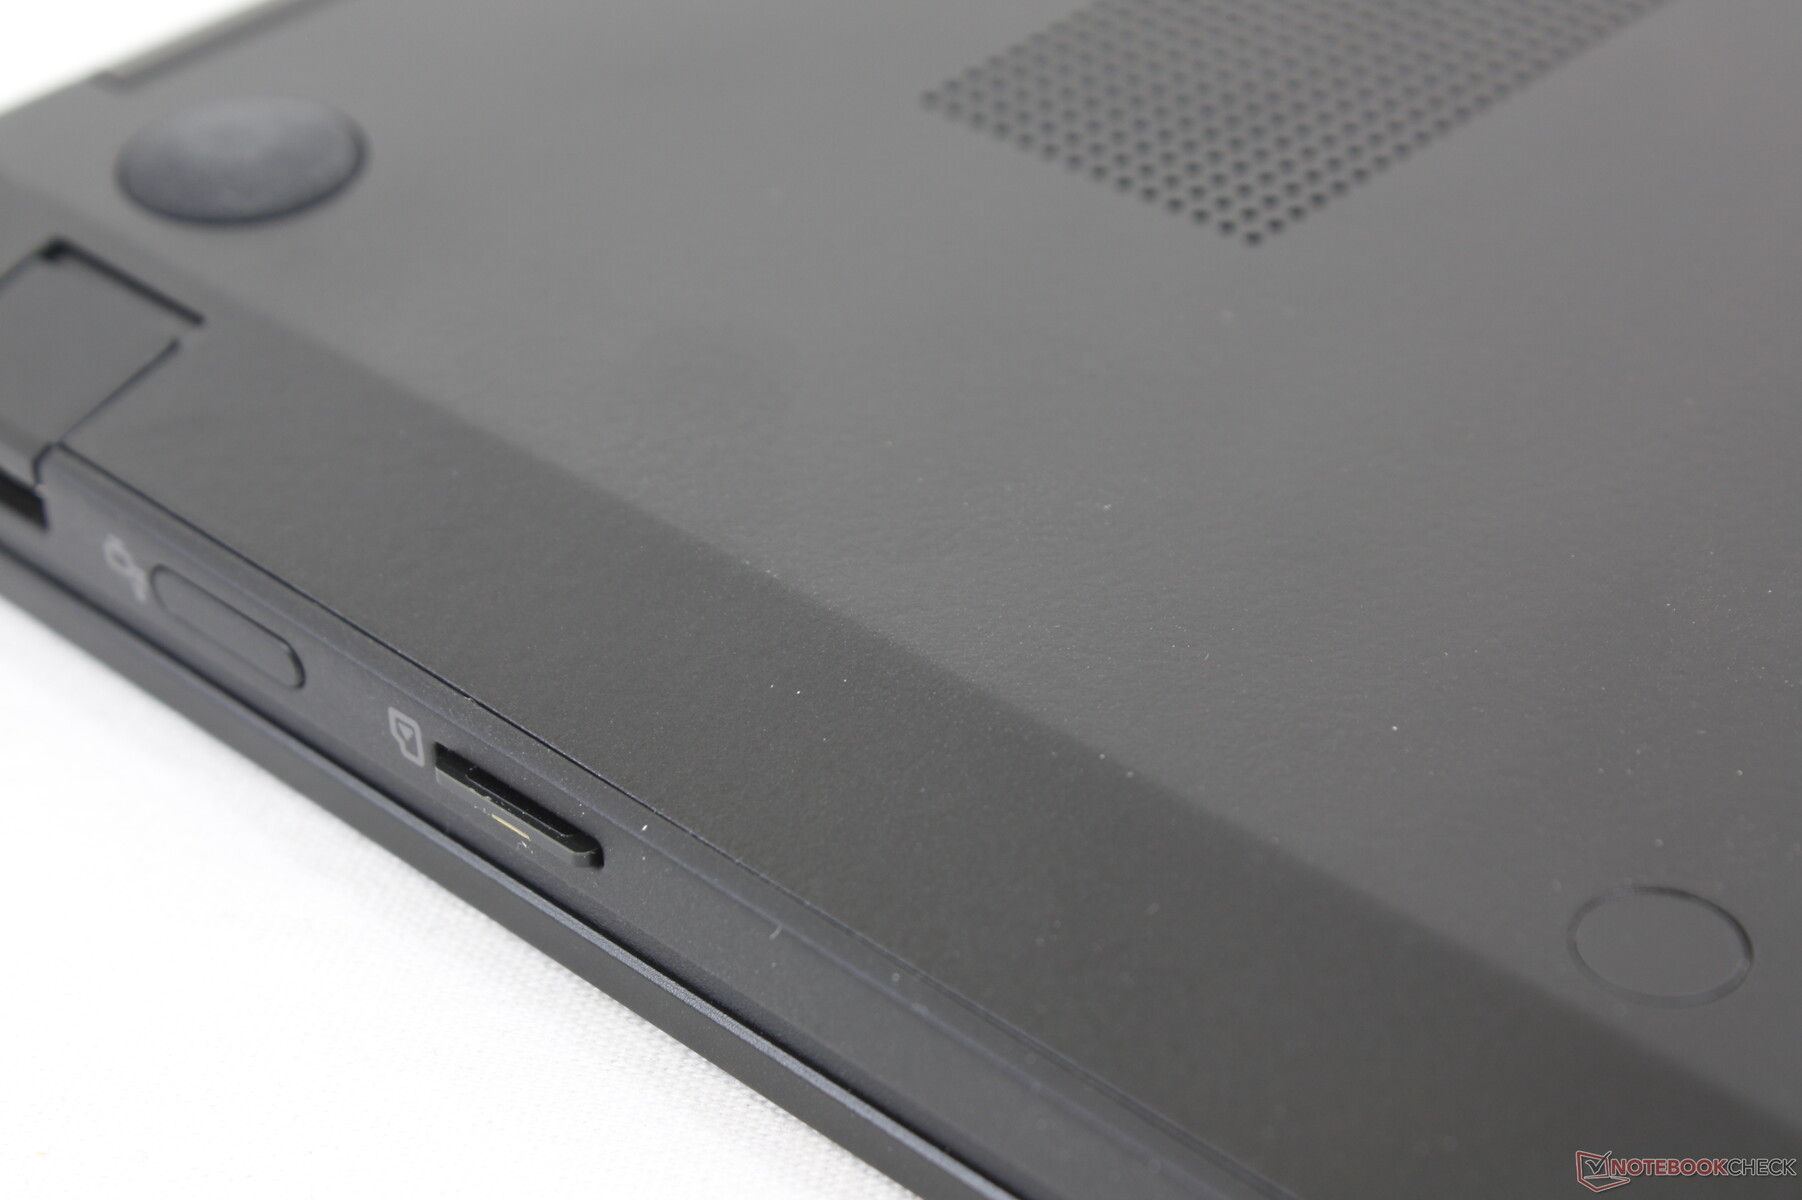
SD-kaartlezer
De overdrachtssnelheden van de verende MicroSD kaartlezer zijn vergelijkbaar met de kaartlezers op vorige Gram laptops om te suggereren dat LG hier geen veranderingen of verbeteringen heeft aangebracht. Voor zo'n dure laptop hadden we gehoopt op hogere snelheden zoals op de XPS 15 of XPS 13 waar de MicroSD kaart overdrachtsnelheden twee tot drie keer sneller zijn.
| SD Card Reader | |
| average JPG Copy Test (av. of 3 runs) | |
| Dell XPS 15 9500 Core i5 (Toshiba Exceria Pro SDXC 64 GB UHS-II) | |
| HP Spectre X360 15-5ZV31AV (Toshiba Exceria Pro M501 UHS-II) | |
| LG Gram 16 2-in-1 16T90P (Toshiba Exceria Pro M501 UHS-II) | |
| Asus ZenBook UX535-M01440 (Toshiba Exceria Pro M501 microSDXC 64GB) | |
| maximum AS SSD Seq Read Test (1GB) | |
| Dell XPS 15 9500 Core i5 (Toshiba Exceria Pro SDXC 64 GB UHS-II) | |
| HP Spectre X360 15-5ZV31AV (Toshiba Exceria Pro M501 UHS-II) | |
| LG Gram 16 2-in-1 16T90P (Toshiba Exceria Pro M501 UHS-II) | |
| Asus ZenBook UX535-M01440 (Toshiba Exceria Pro M501 microSDXC 64GB) | |
Communicatie
Wi-Fi 6 en Bluetooth 5.1 worden geleverd door een gesoldeerde Intel AX201 module. We hebben geen connectiviteitsproblemen ondervonden bij koppeling met onze Netgear RAX200 testrouter.
Webcam

")
")
Onderhoud
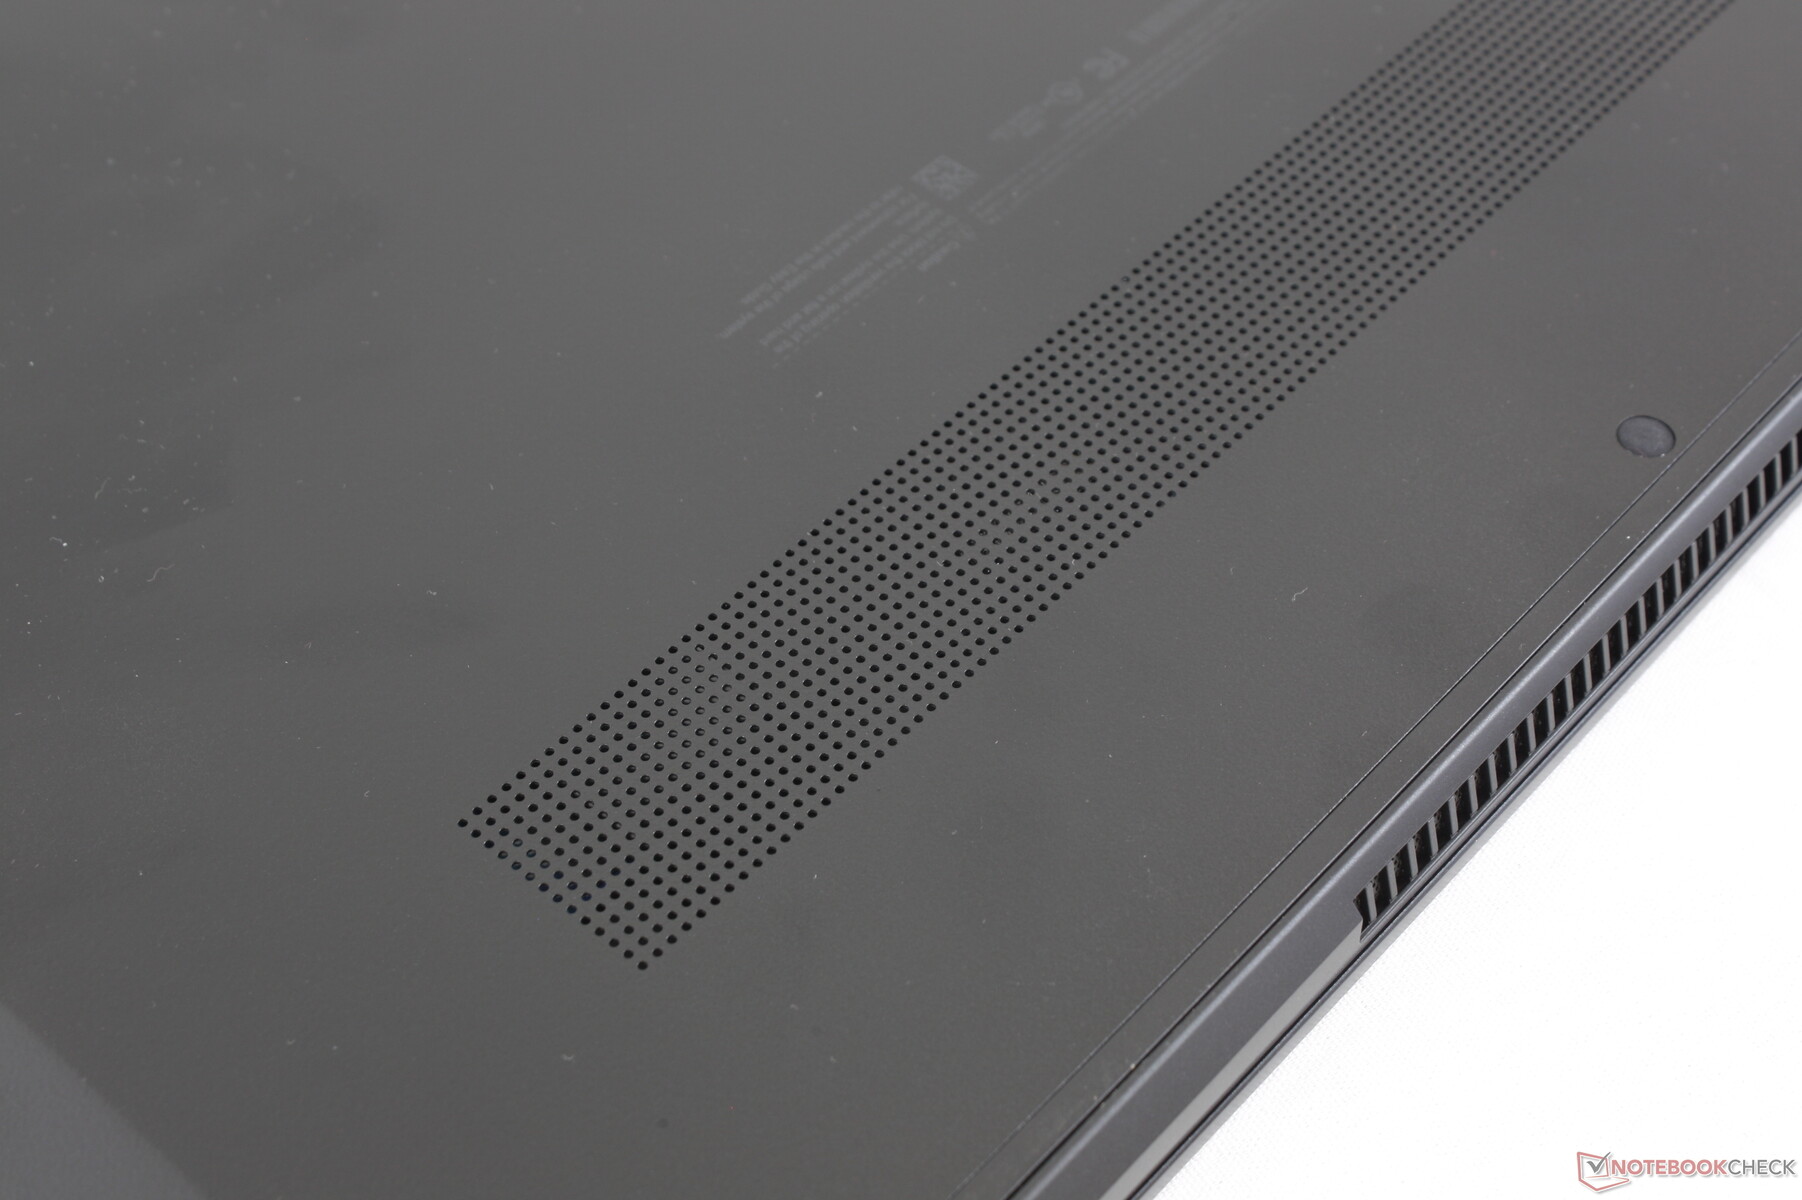
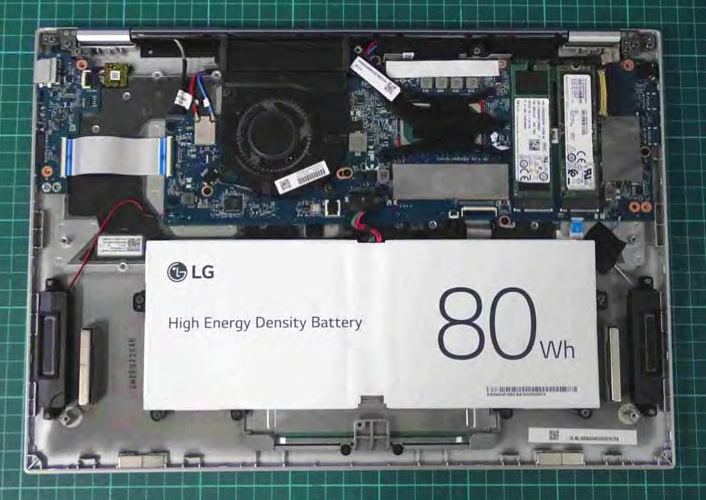
Zoals alle Gram-laptops voor hem, is de Gram 16 2-in-1 niet gemakkelijk te onderhouden. De schroeven aan de onderkant zijn bedekt onder stickers en gelijmde rubberen voetjes om gebruikersupgrades te ontmoedigen. Dit is jammer omdat het systeem wordt geleverd met twee M.2 2280-sleuven die eigenaars gemakkelijk hadden kunnen benutten voor extra opslag.
De Amerikaanse FCC heeft verschillende afbeeldingen van het moederbord van de laptop voor het publiek beschikbaar gesteld.
Accessoires en garantie
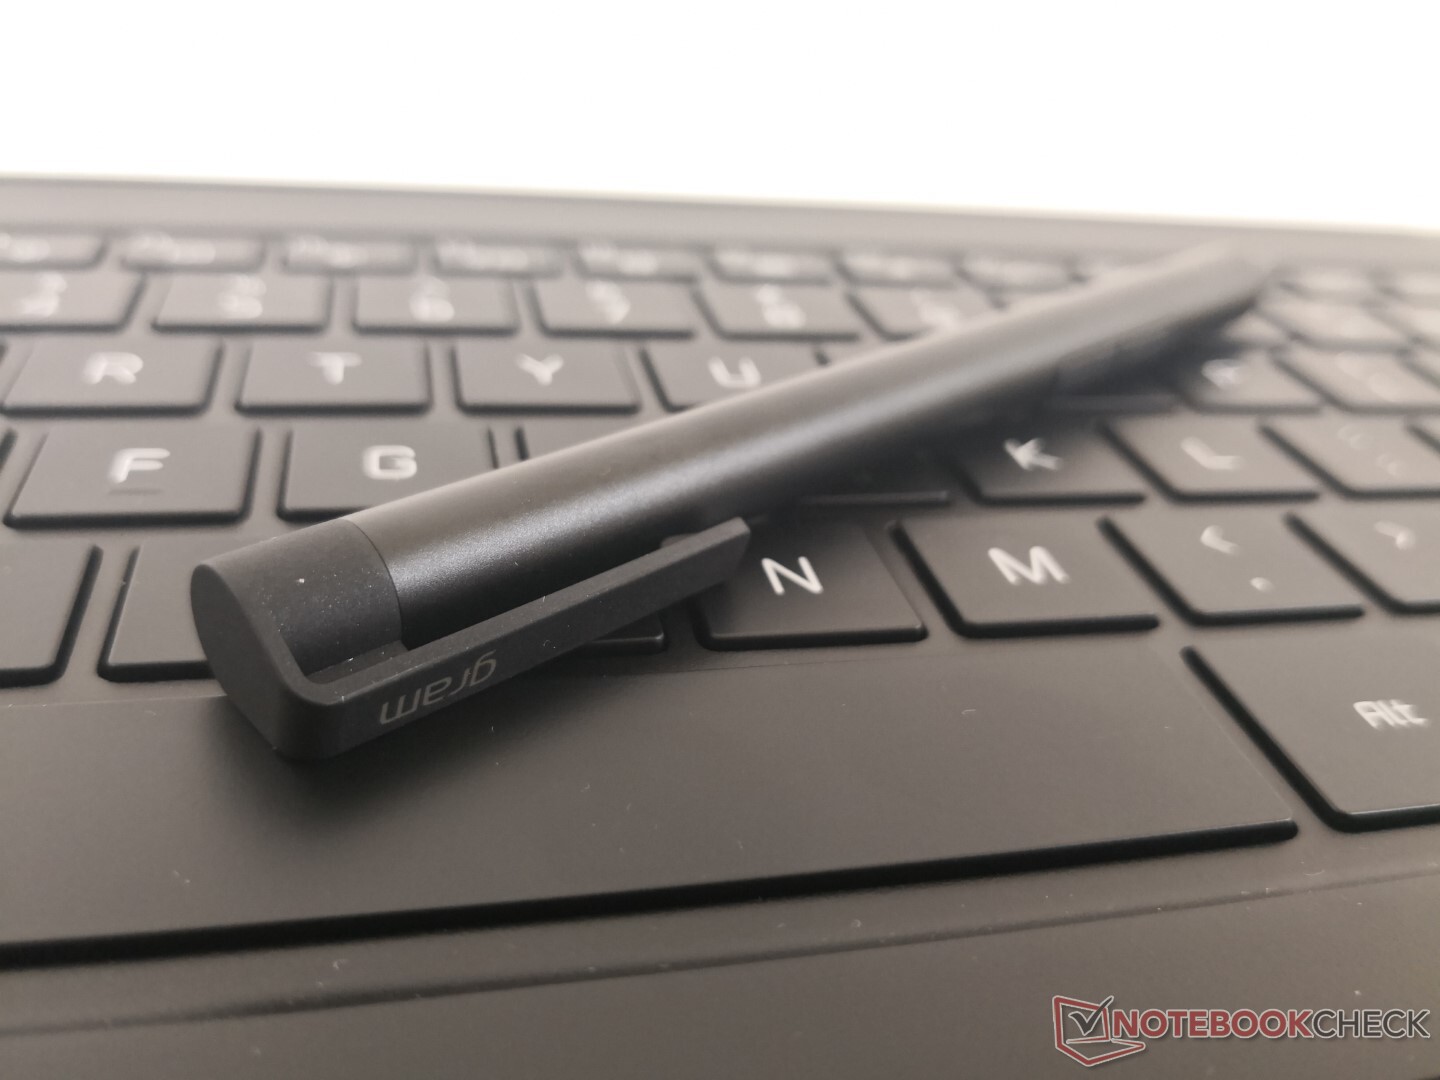
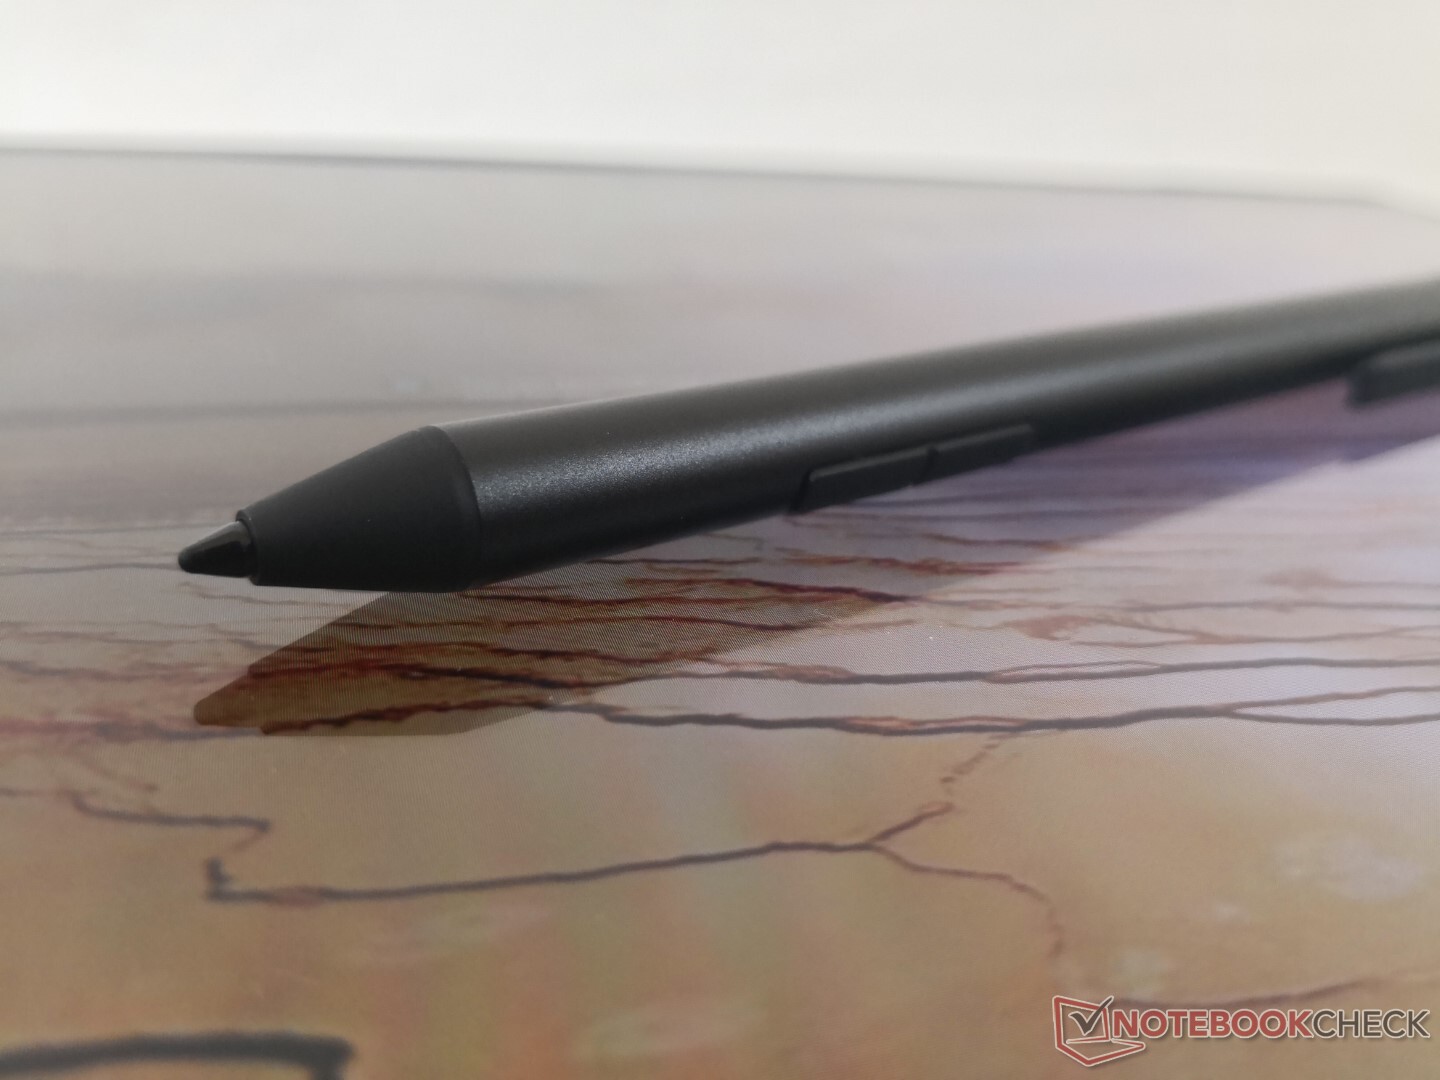
De doos bevat een USB-C naar HDMI-adapter en een actieve styluspen (ESP-201-21A-5) met batterij en twee extra penpunten. Een schoonmaakdoekje zou een leuke extra zijn geweest.
De standaard beperkte fabrieksgarantie van één jaar is van toepassing.
Invoerapparaten
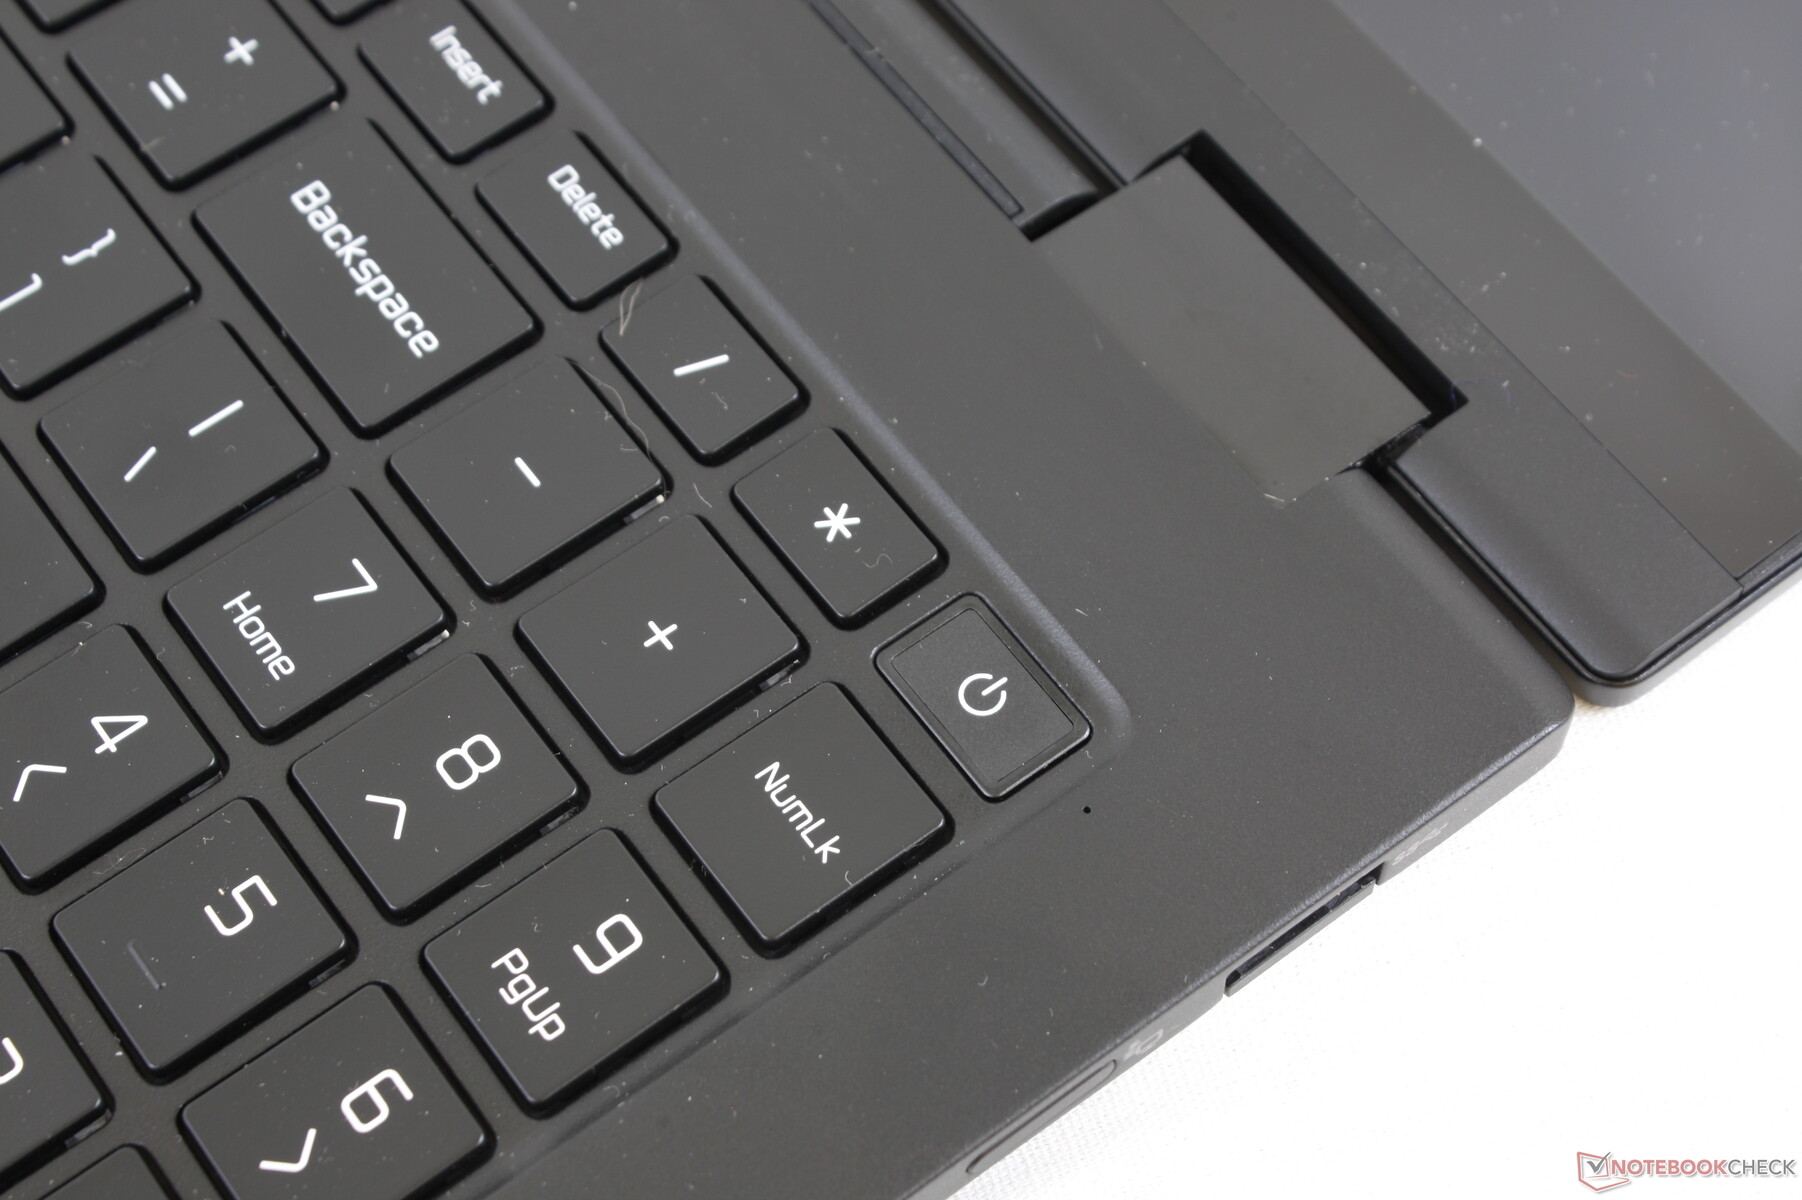
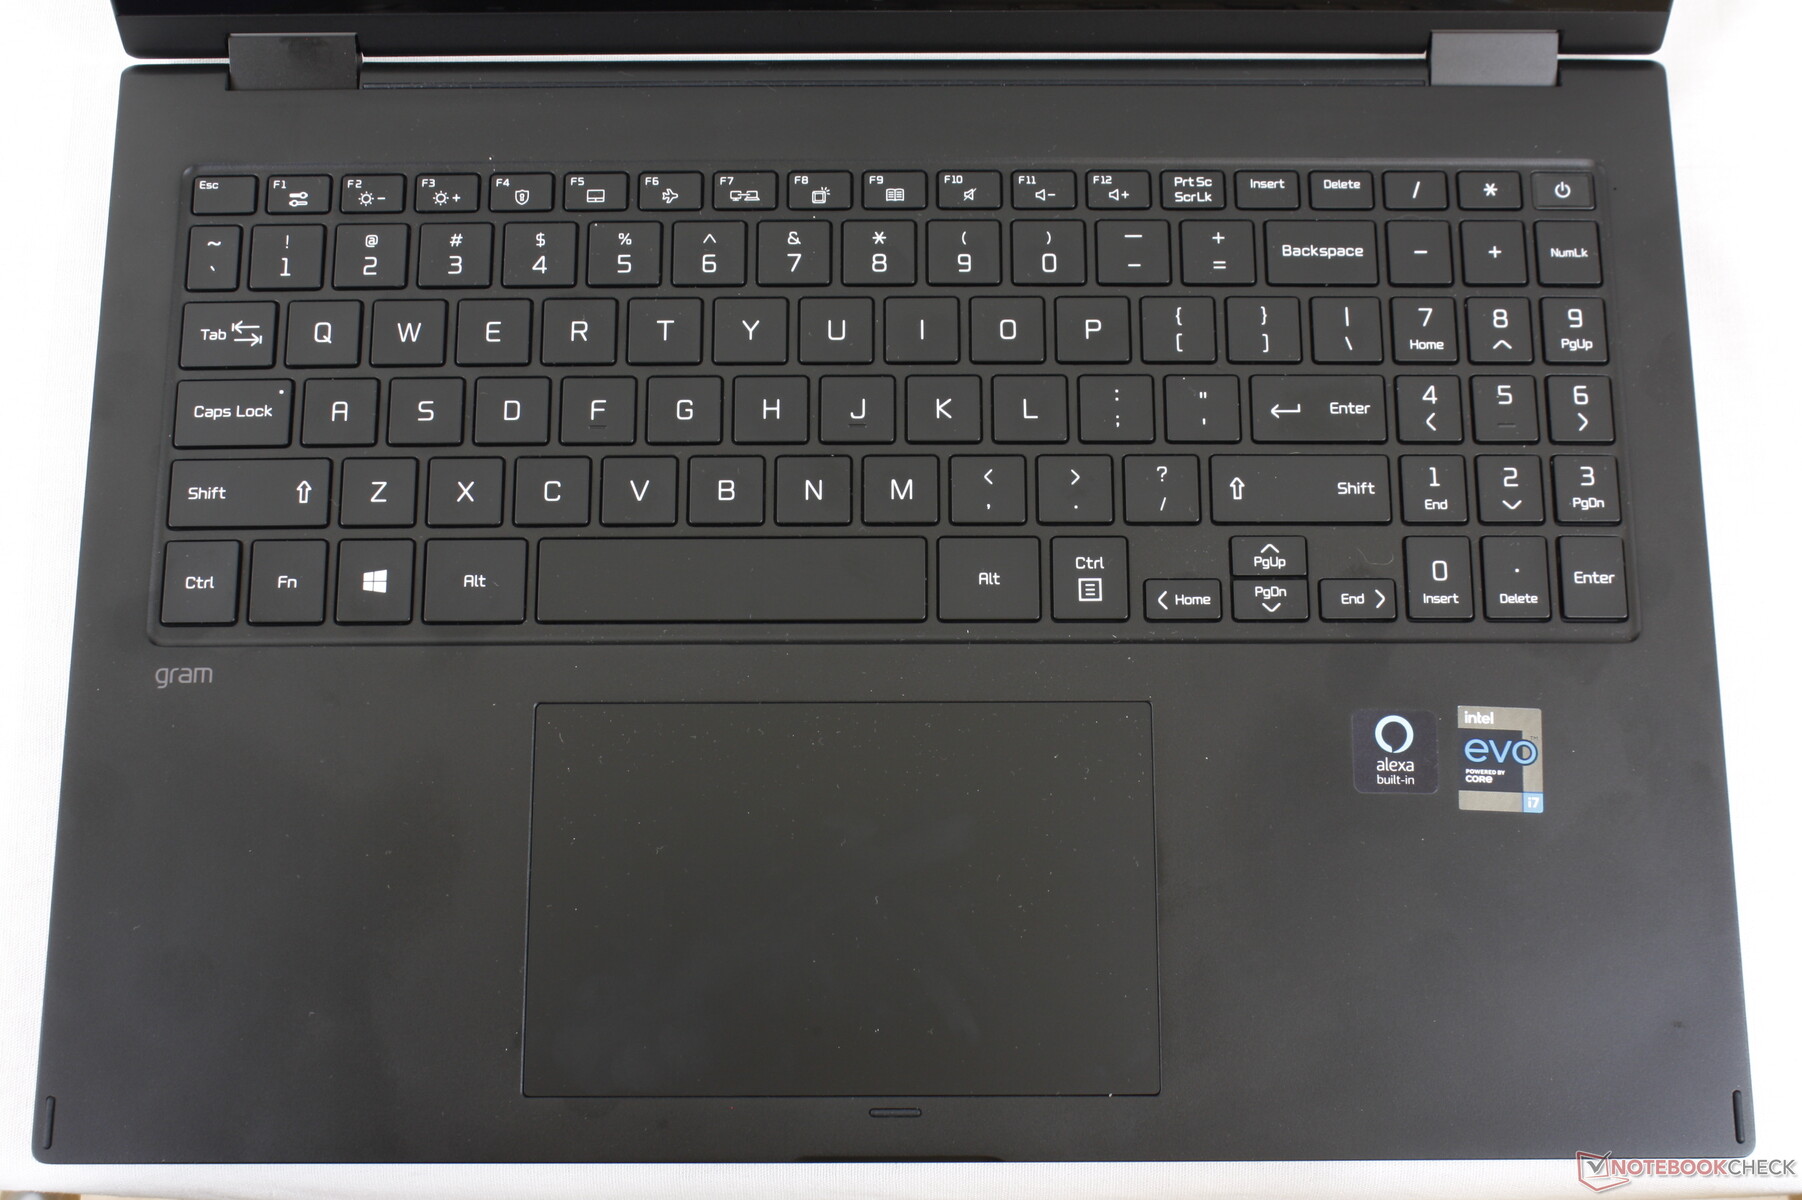
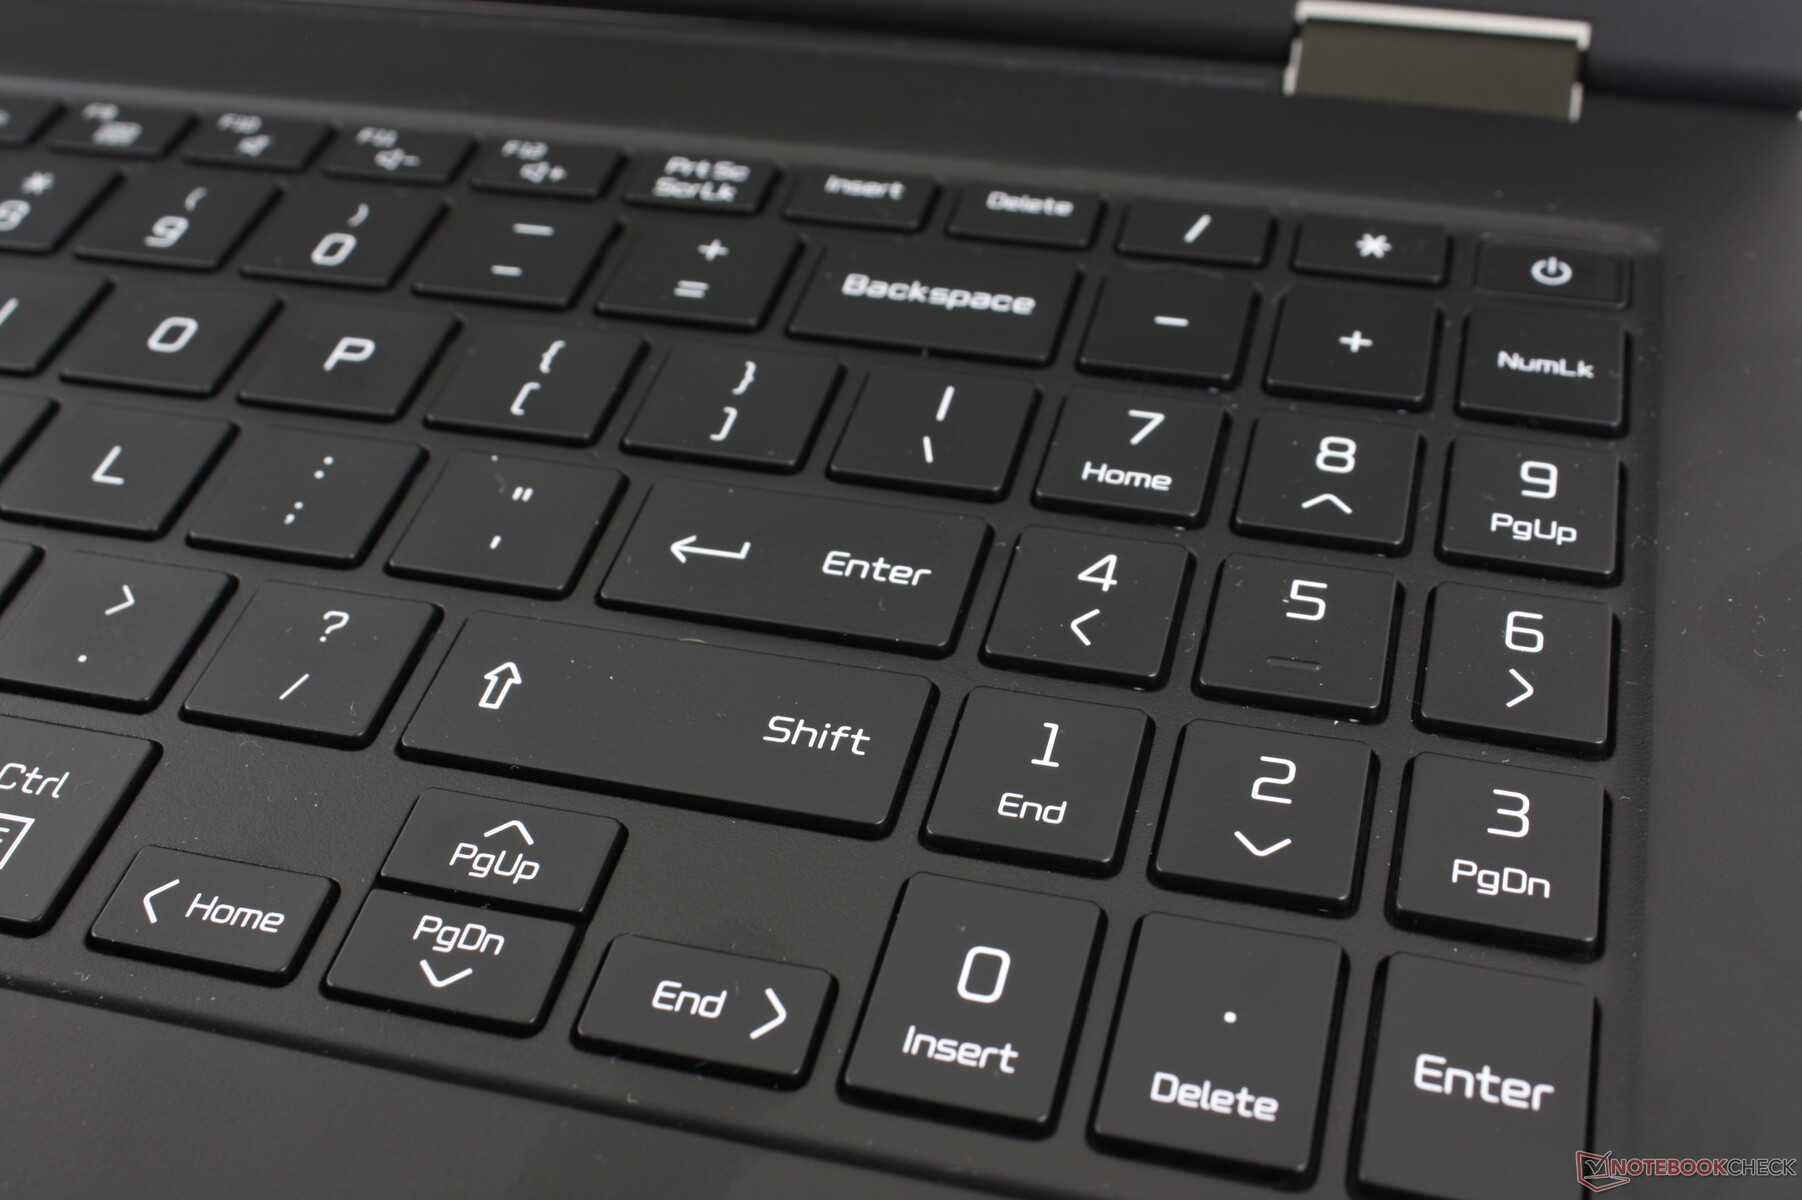
Toetsenbord
De toetsen hier hebben een scherpere feedback dan de Dell XPS 15, Razer Blade 15, Asus ZenBook 15, en vele andere Ultrabooks wat dat betreft om comfortabeler te zijn voor het typen. De aanslag voelt ook dieper aan dan verwacht, ondanks hoe dun en licht het chassis is. Het gekletter is luid als gevolg van de stevige feedback.
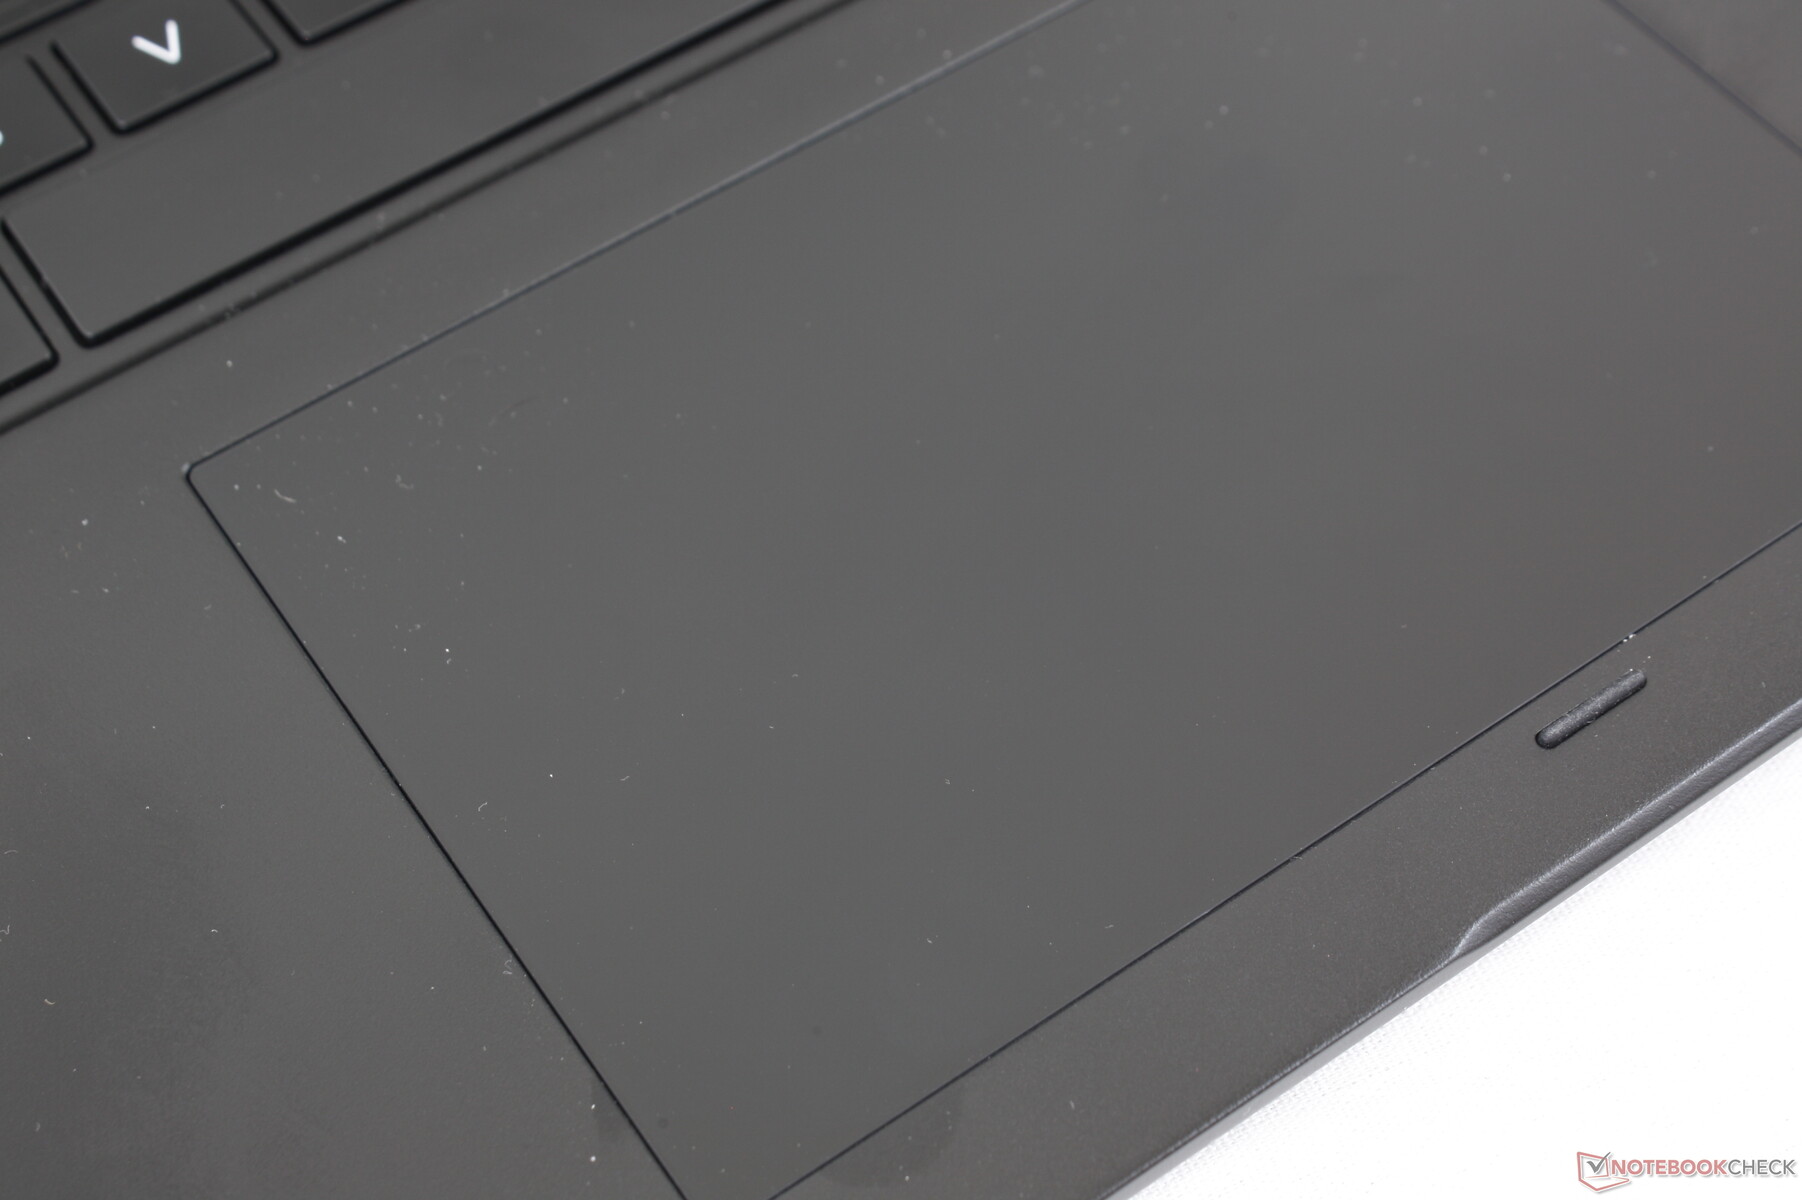
Touchpad
Het clickpad is redelijk groot (13,2 x 8,3 cm) met soepele tractie en net een beetje wrijving om te voorkomen dat het glad aanvoelt. De geïntegreerde kliktoetsen zijn ondiep en geven matig feedback, maar het gekletter is luider dan verwacht. Het is een betrouwbaar en pijnloos trackpad, zolang gebruikers geen last hebben van de hoorbare klik bij het indrukken.

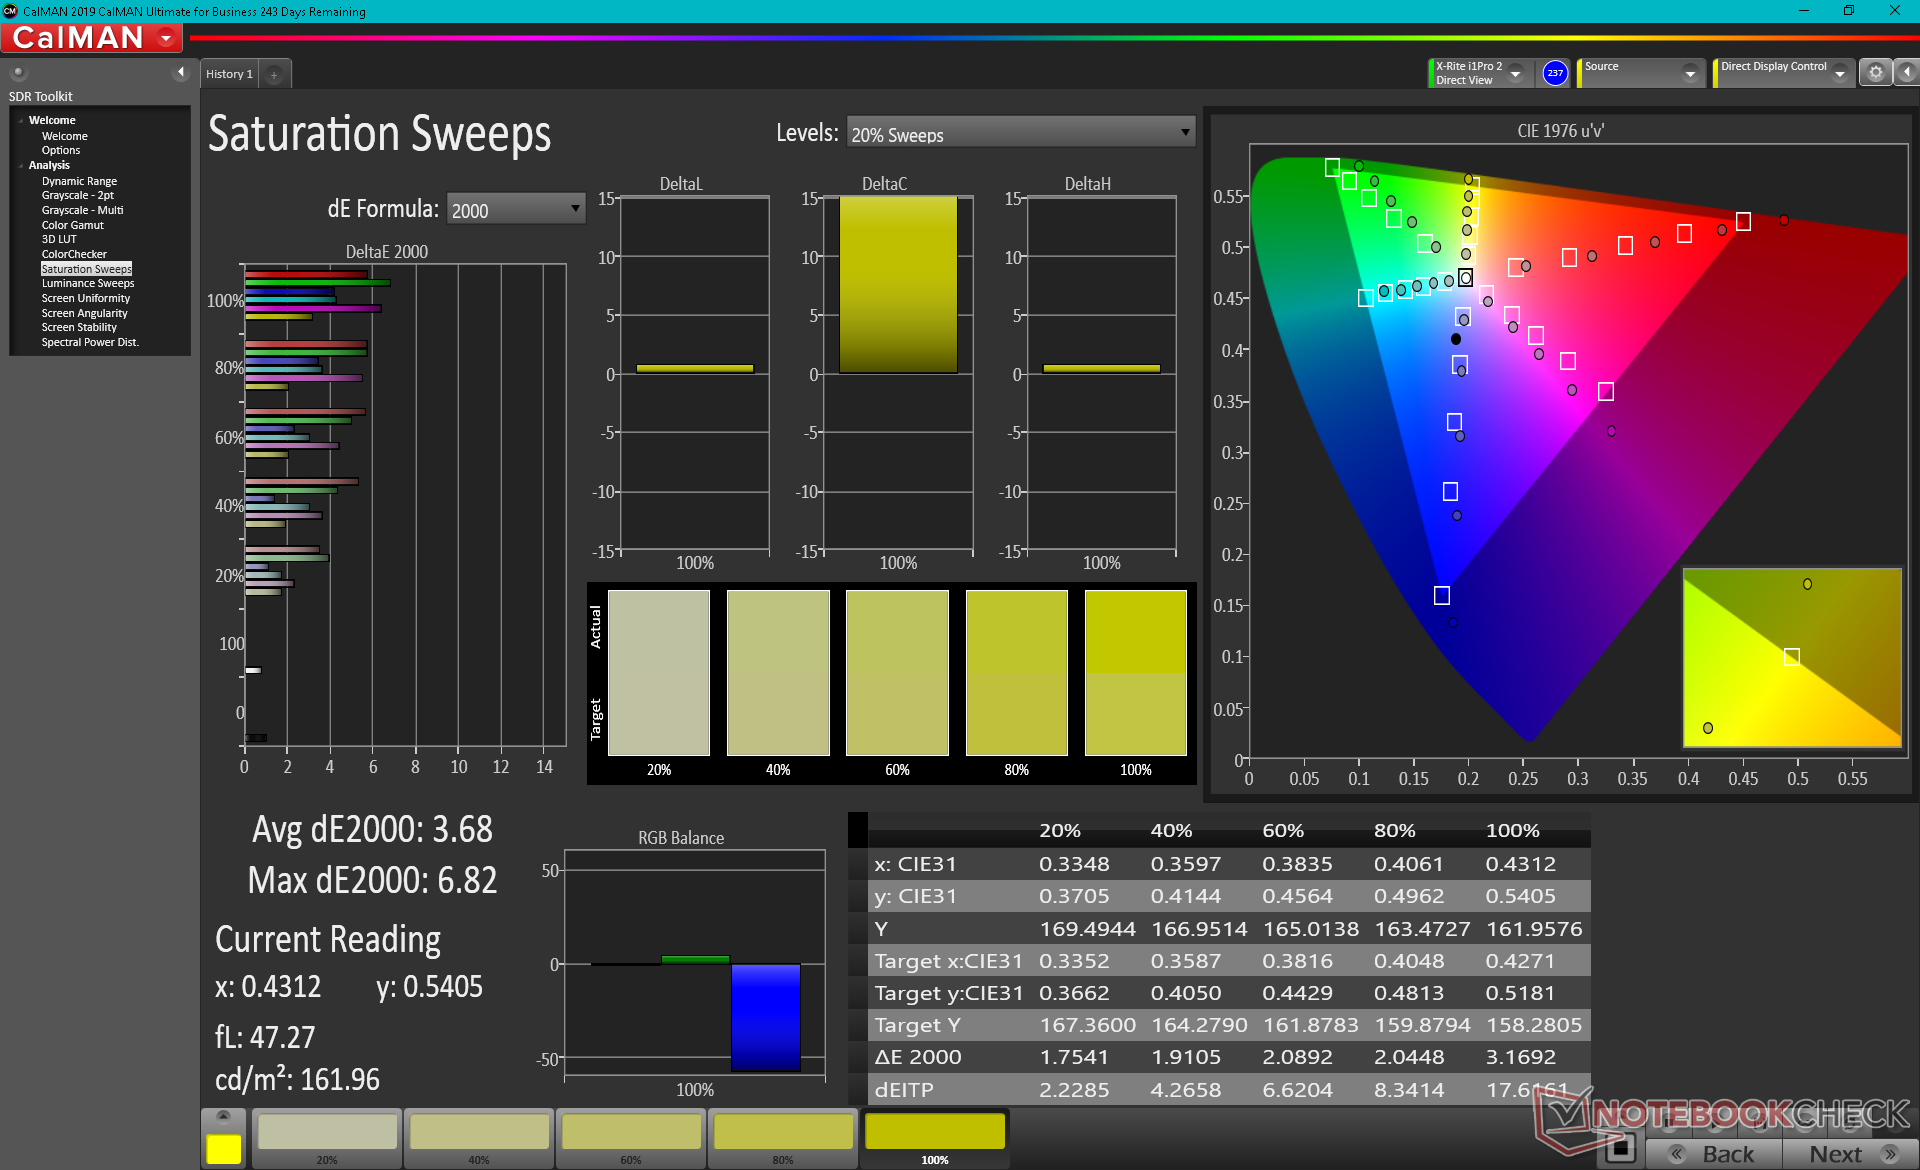
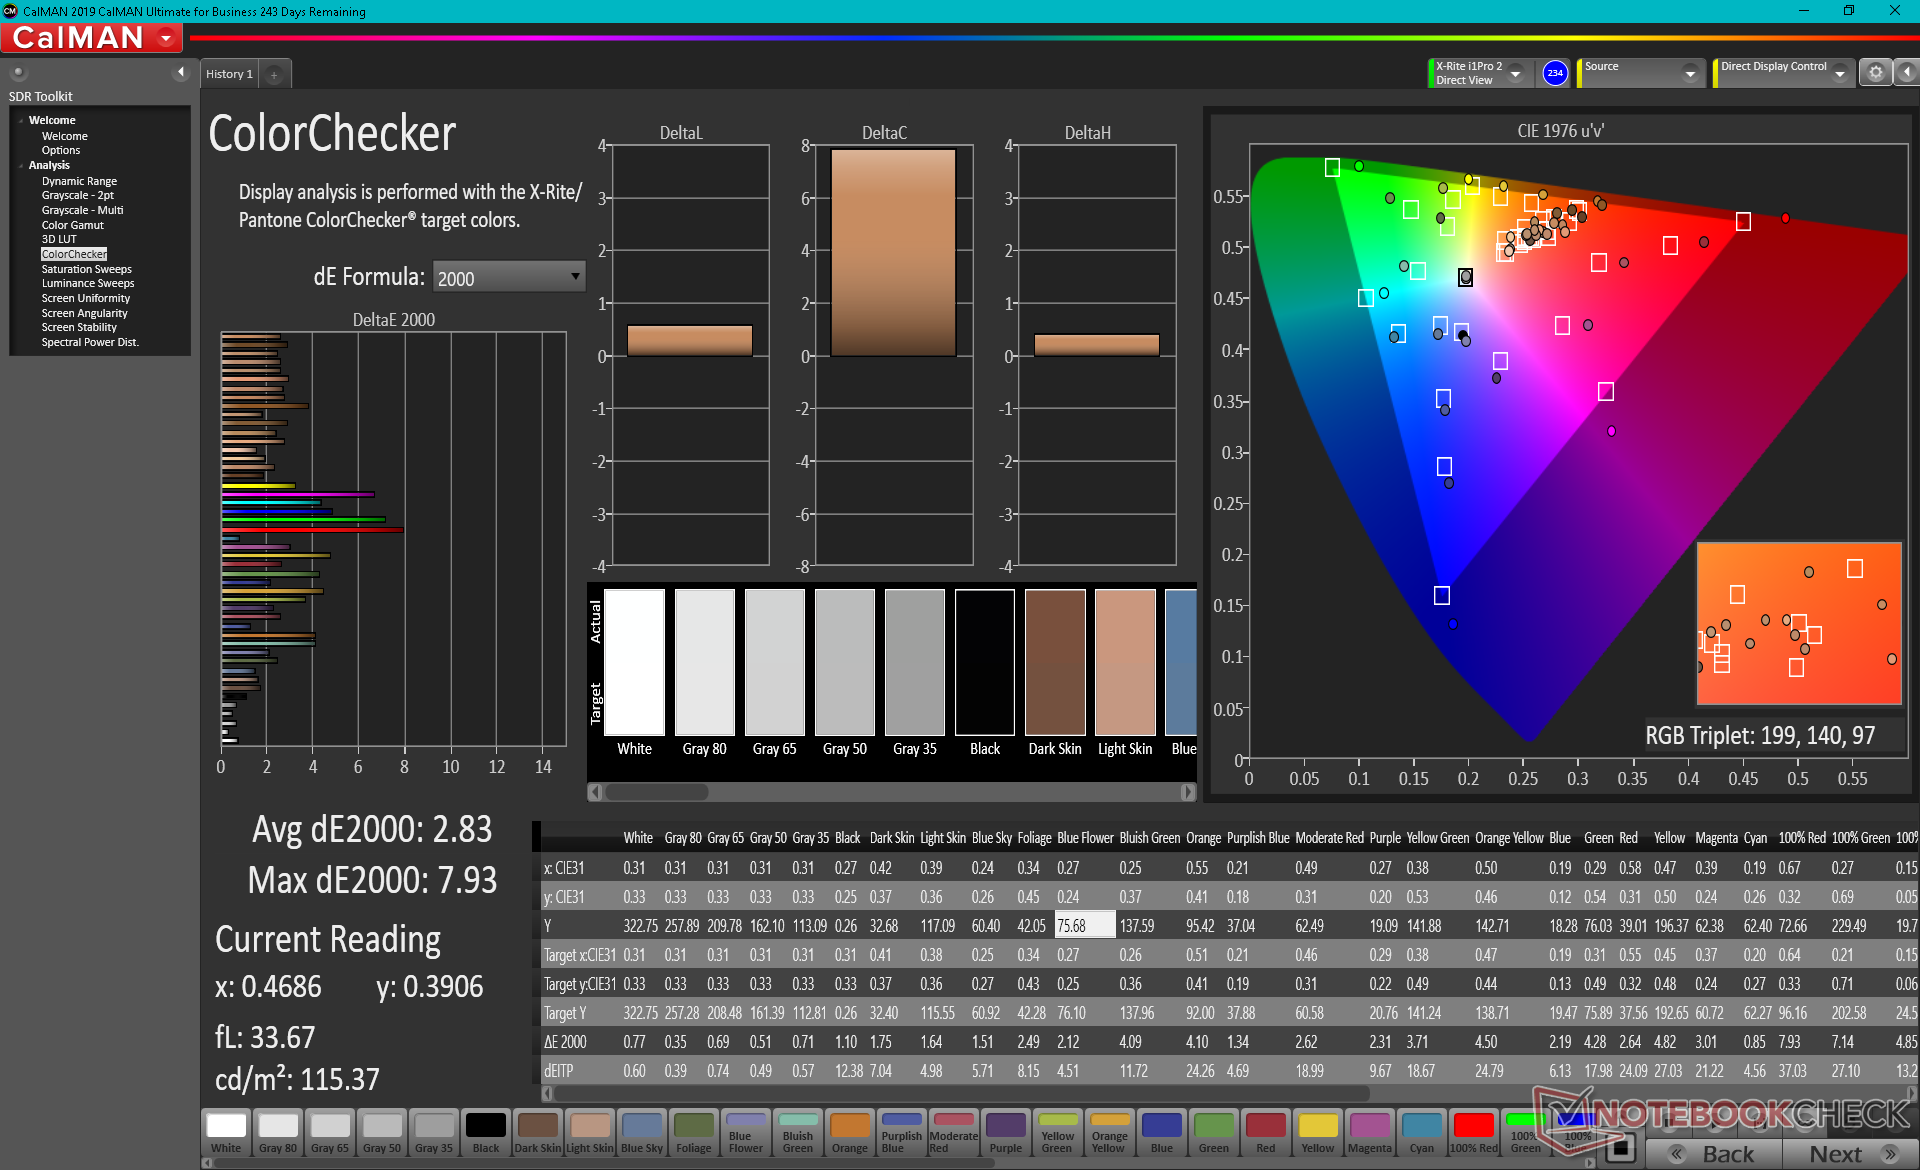
Weergave
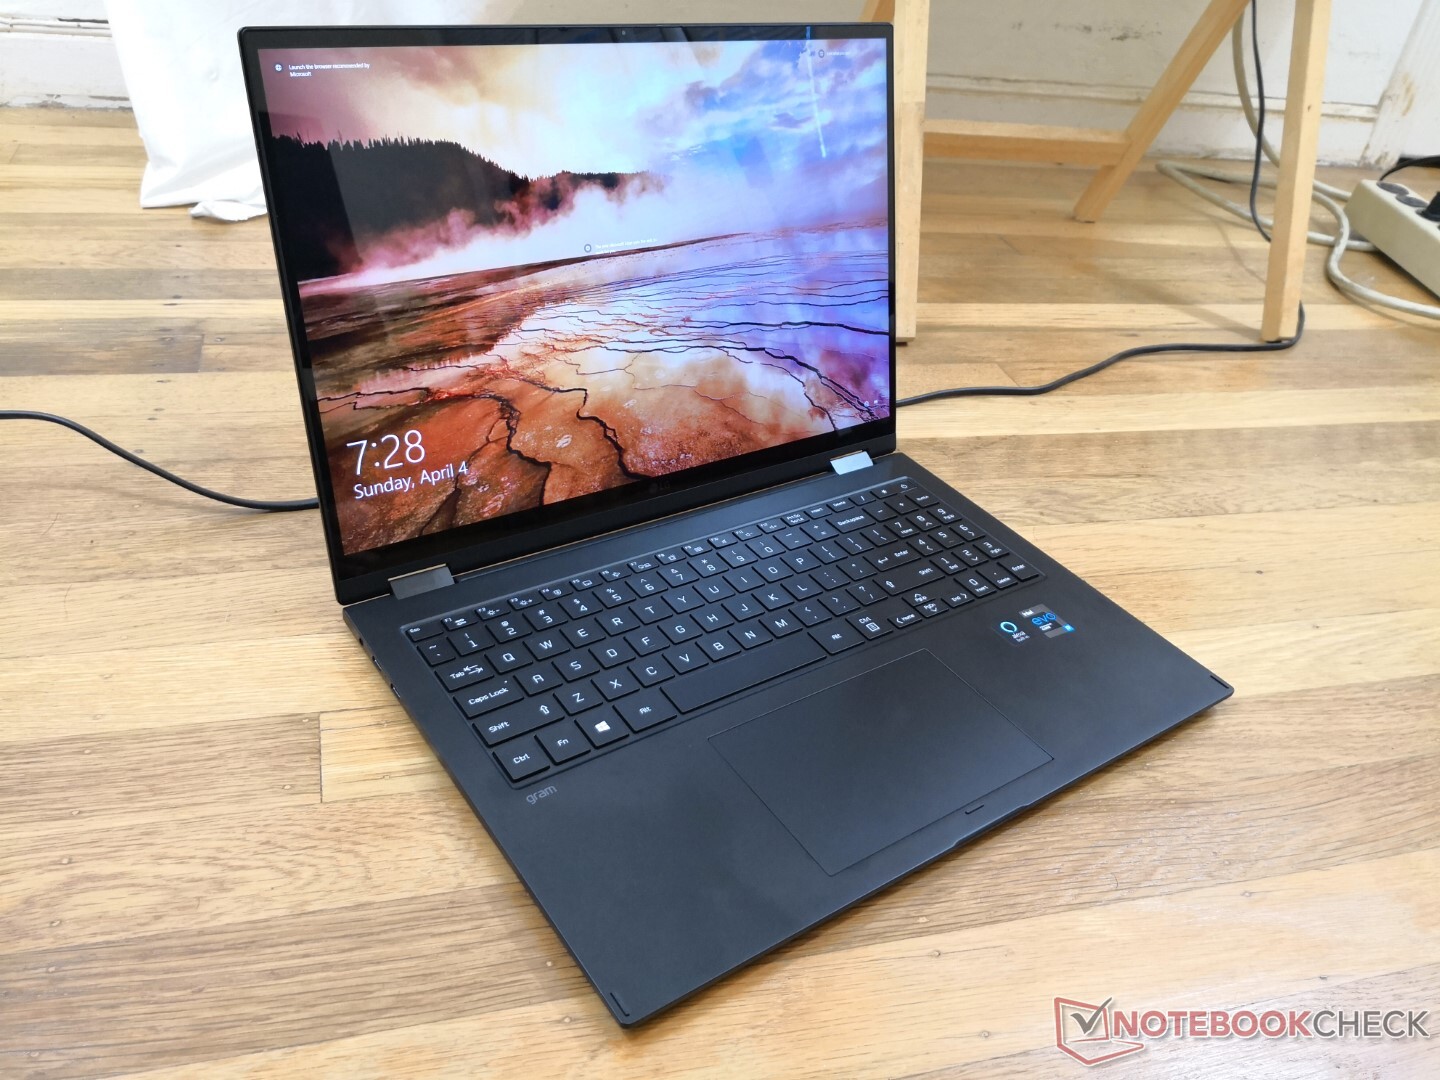
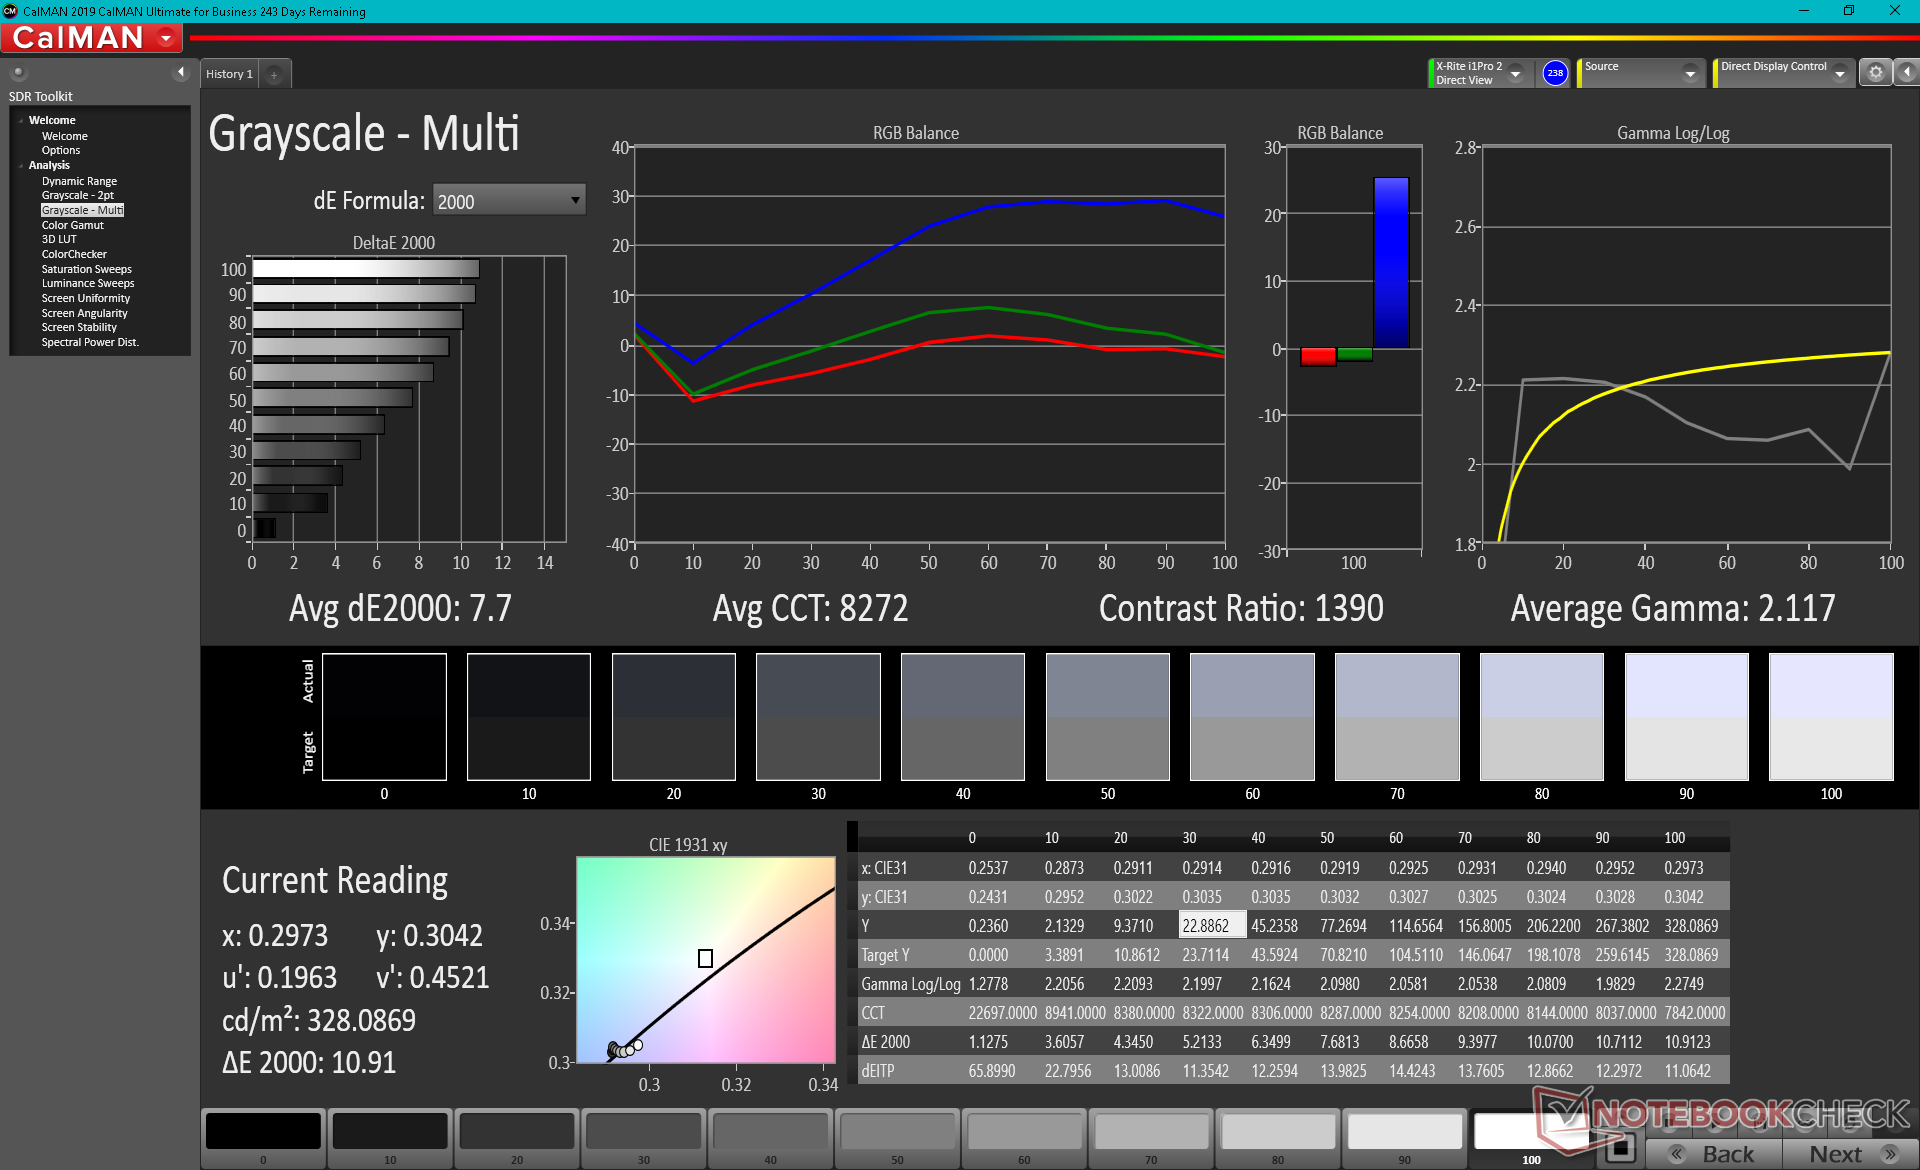
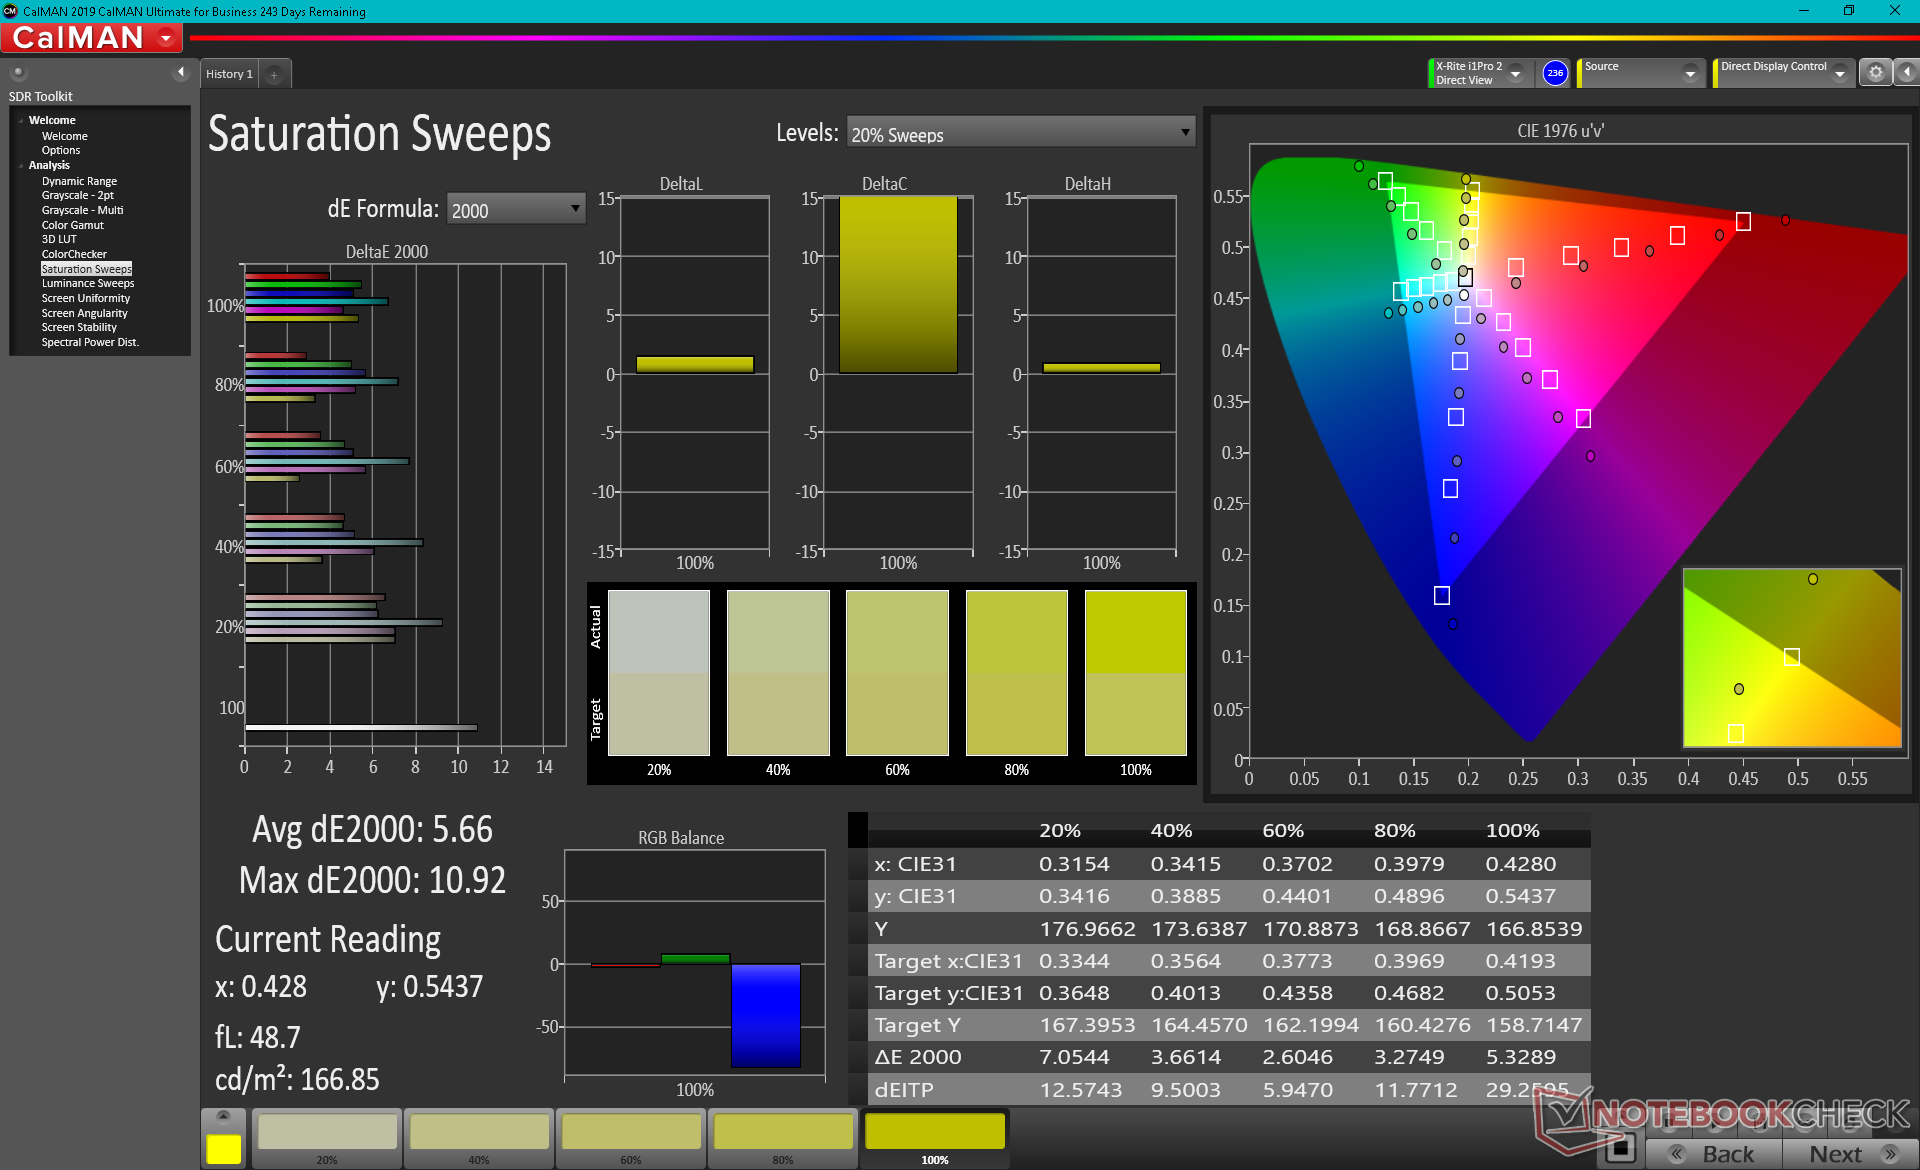
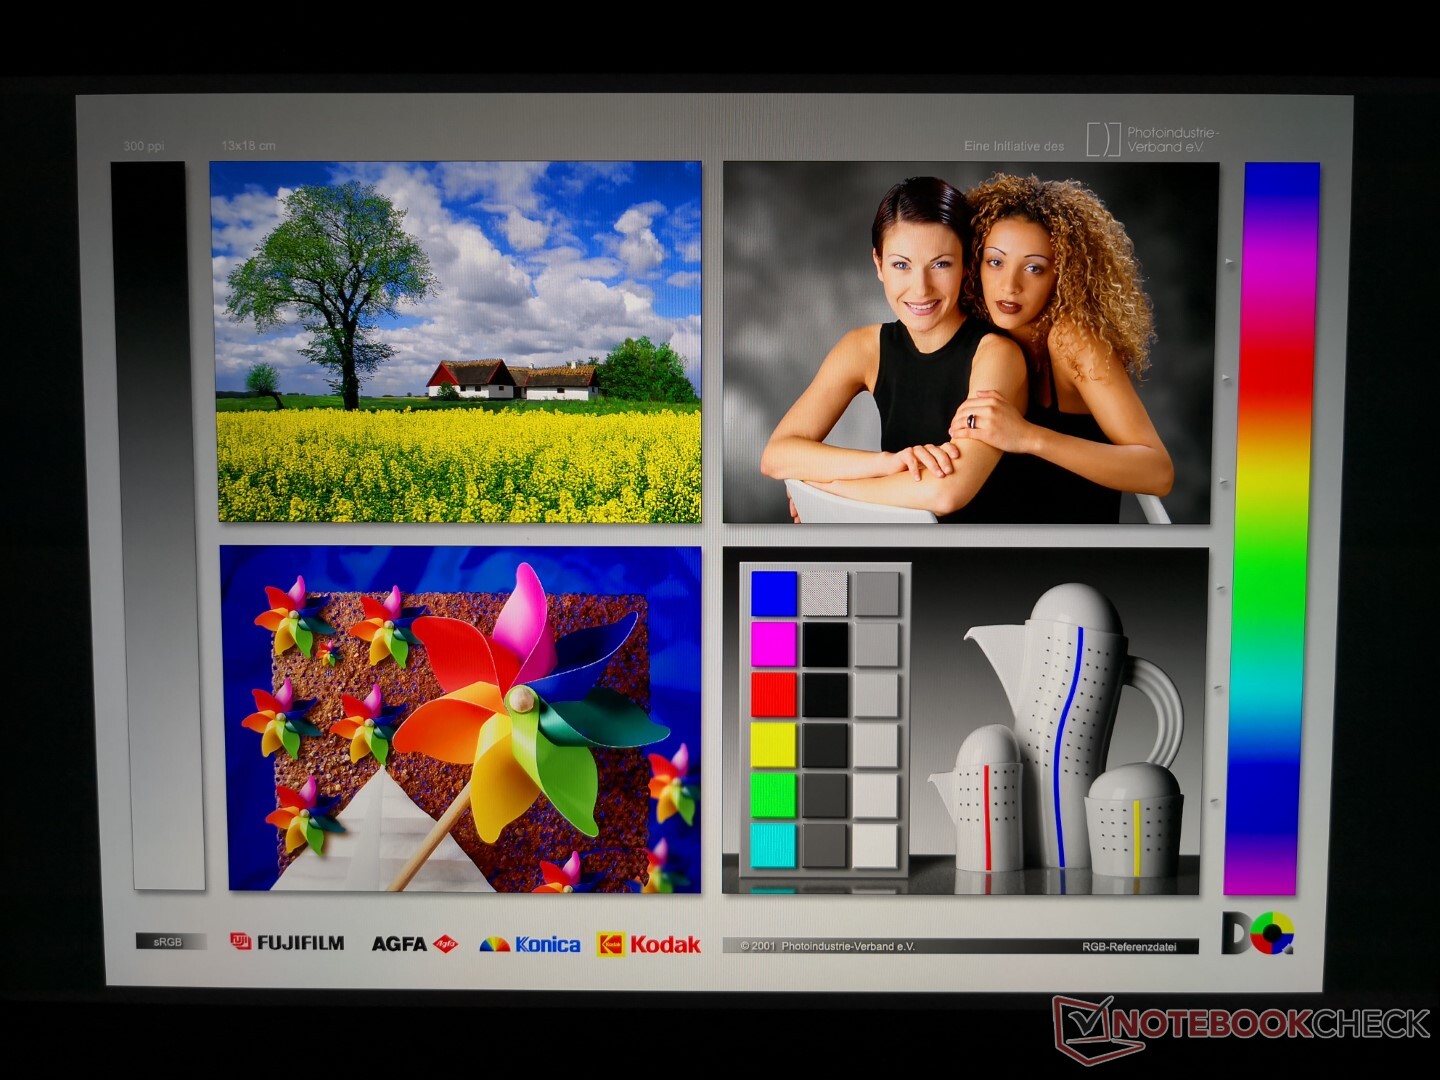
Elke Gram-laptop die we tot nu toe hebben getest, had een verbazingwekkend scherm en de Gram 16 2-in-1 is niet anders. Het 16-inch 16:10 aanraakscherm is hier ongebruikelijk aangezien de meeste andere laptops de neiging hebben om 15- of 17-inch te zijn met ofwel 16:9 of 3:2 beeldverhoudingen. Uiteraard is LG de fabrikant voor zijn eigen LP160WQ1-SPA1 IPS paneel dat op dit moment op geen enkele andere laptop in onze database te vinden is om de Gram 16 nog unieker te maken.
Hoewel de schermkwaliteit uitstekend is, had de maximale helderheid helderder mogen zijn. De Gram 16 2-in-1 is tot 2x zwakker dan de schermen van de MacBook Pro 16 of XPS 15, wat teleurstellend is voor zo'n reisvriendelijk ontwerp.
| |||||||||||||||||||||||||
Helderheidsverdeling: 92 %
Helderheid in Batterij-modus: 325.3 cd/m²
Contrast: 929:1 (Zwart: 0.35 cd/m²)
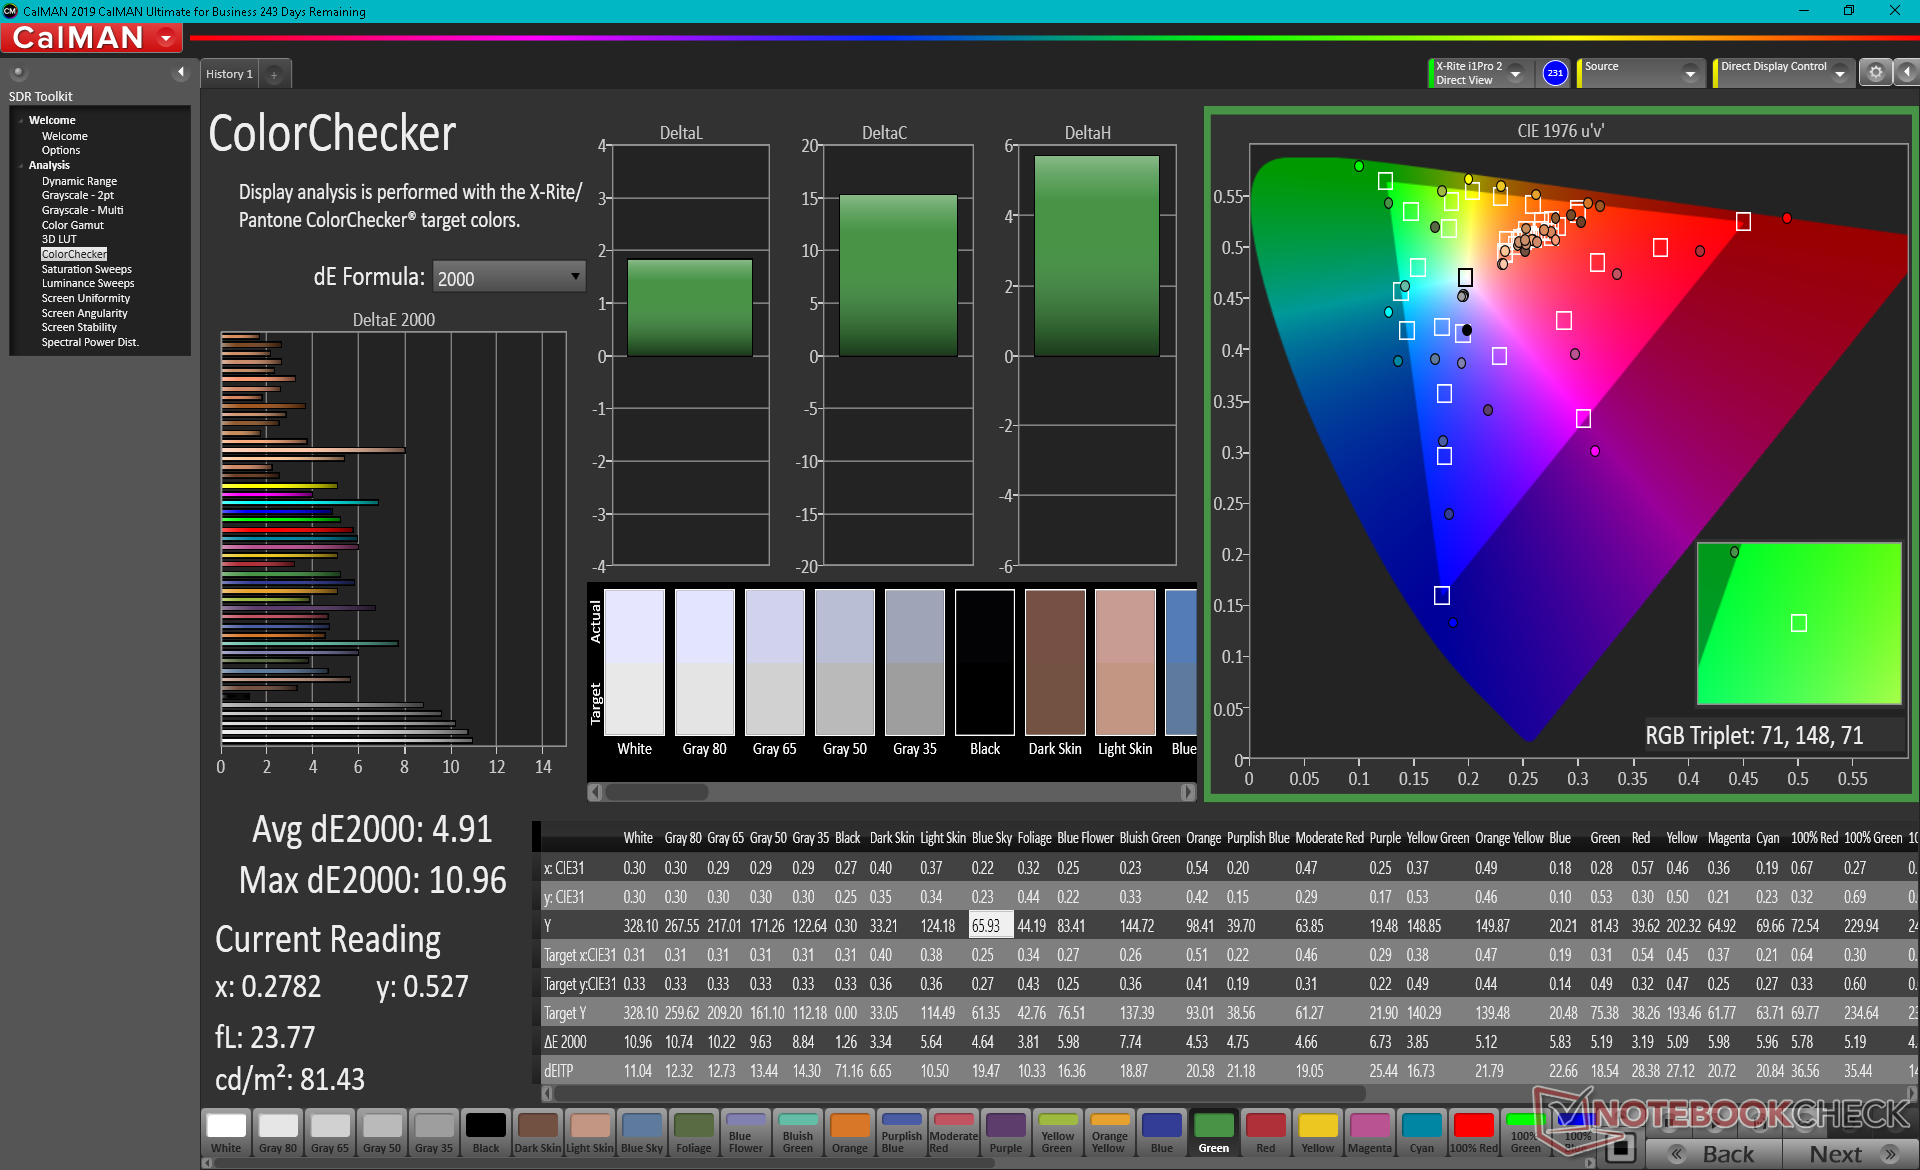
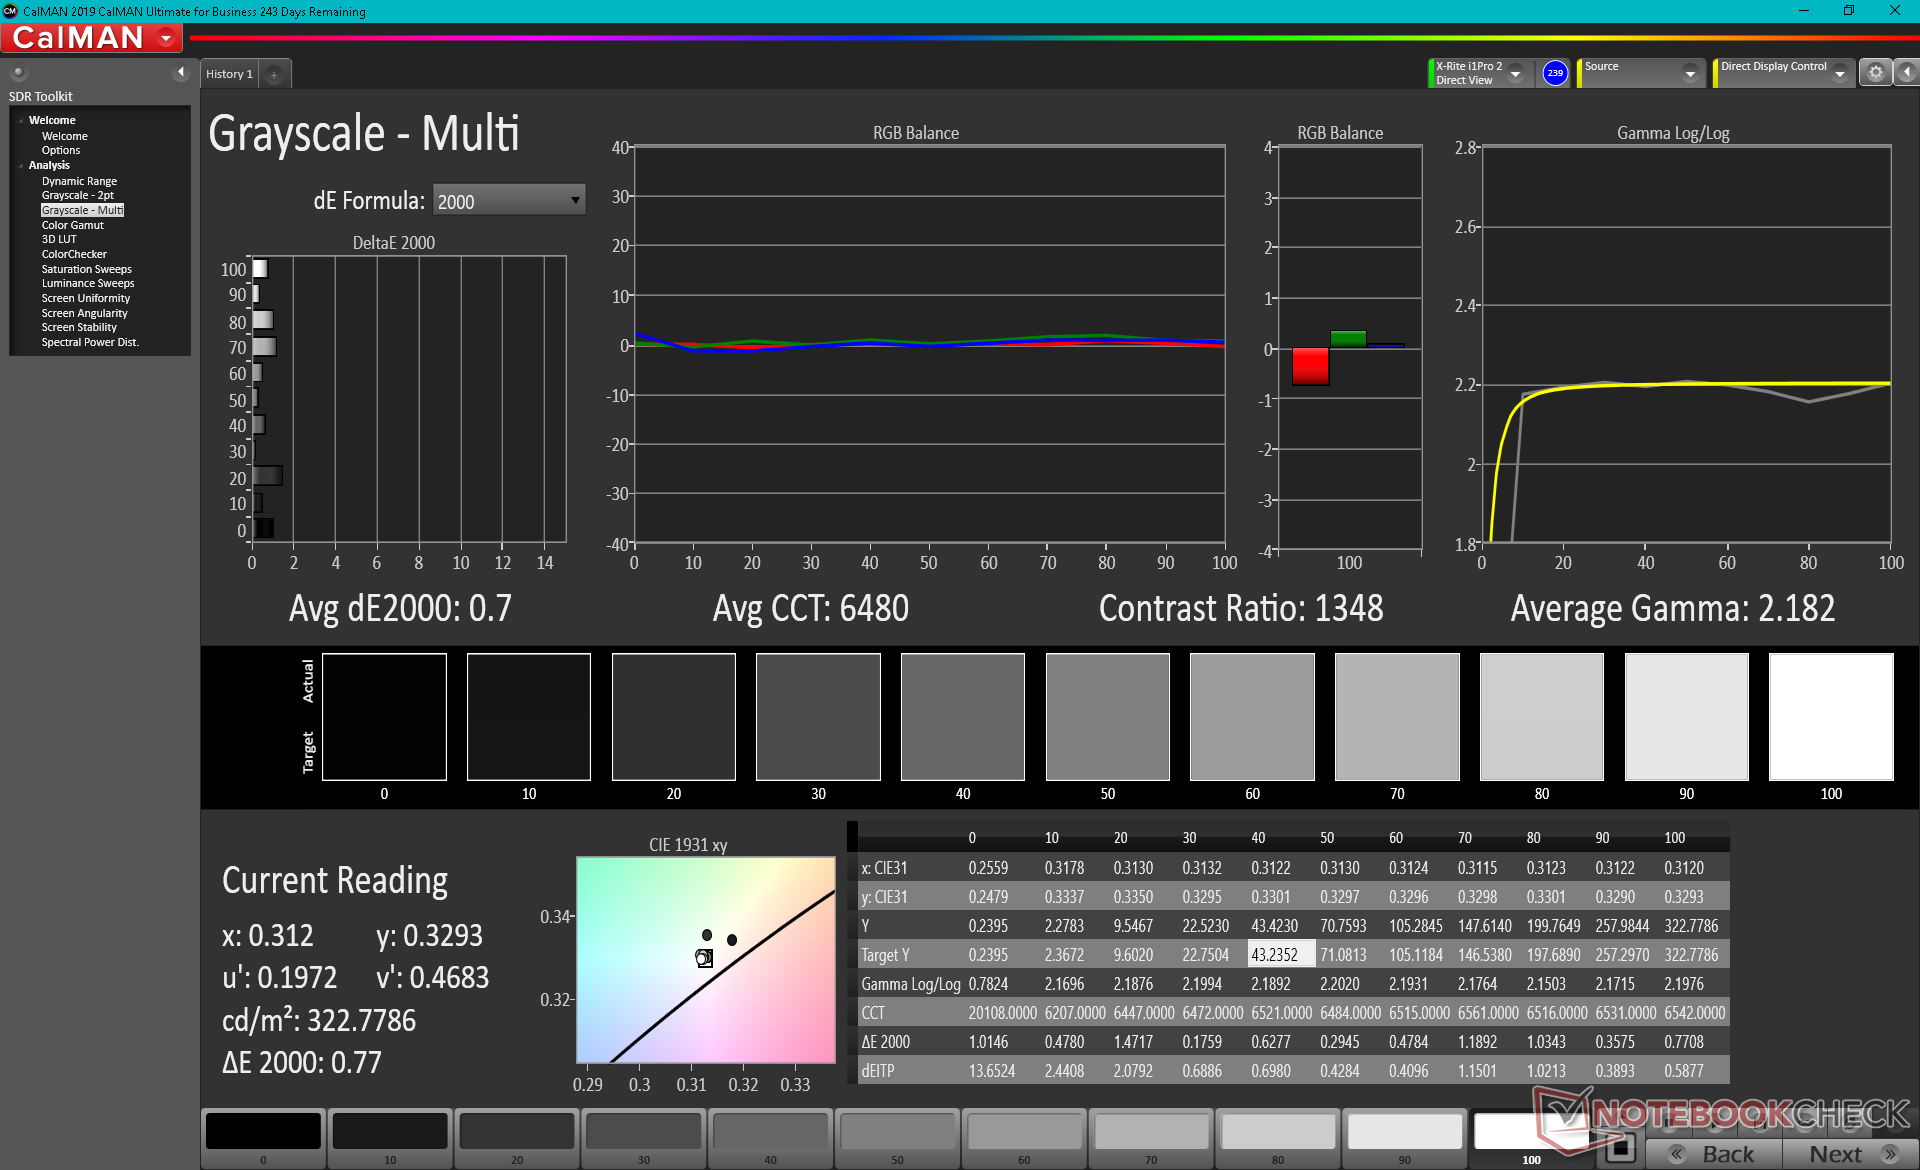
ΔE ColorChecker Calman: 4.91 | ∀{0.5-29.43 Ø4.72}
calibrated: 2.83
ΔE Greyscale Calman: 7.7 | ∀{0.09-98 Ø4.97}
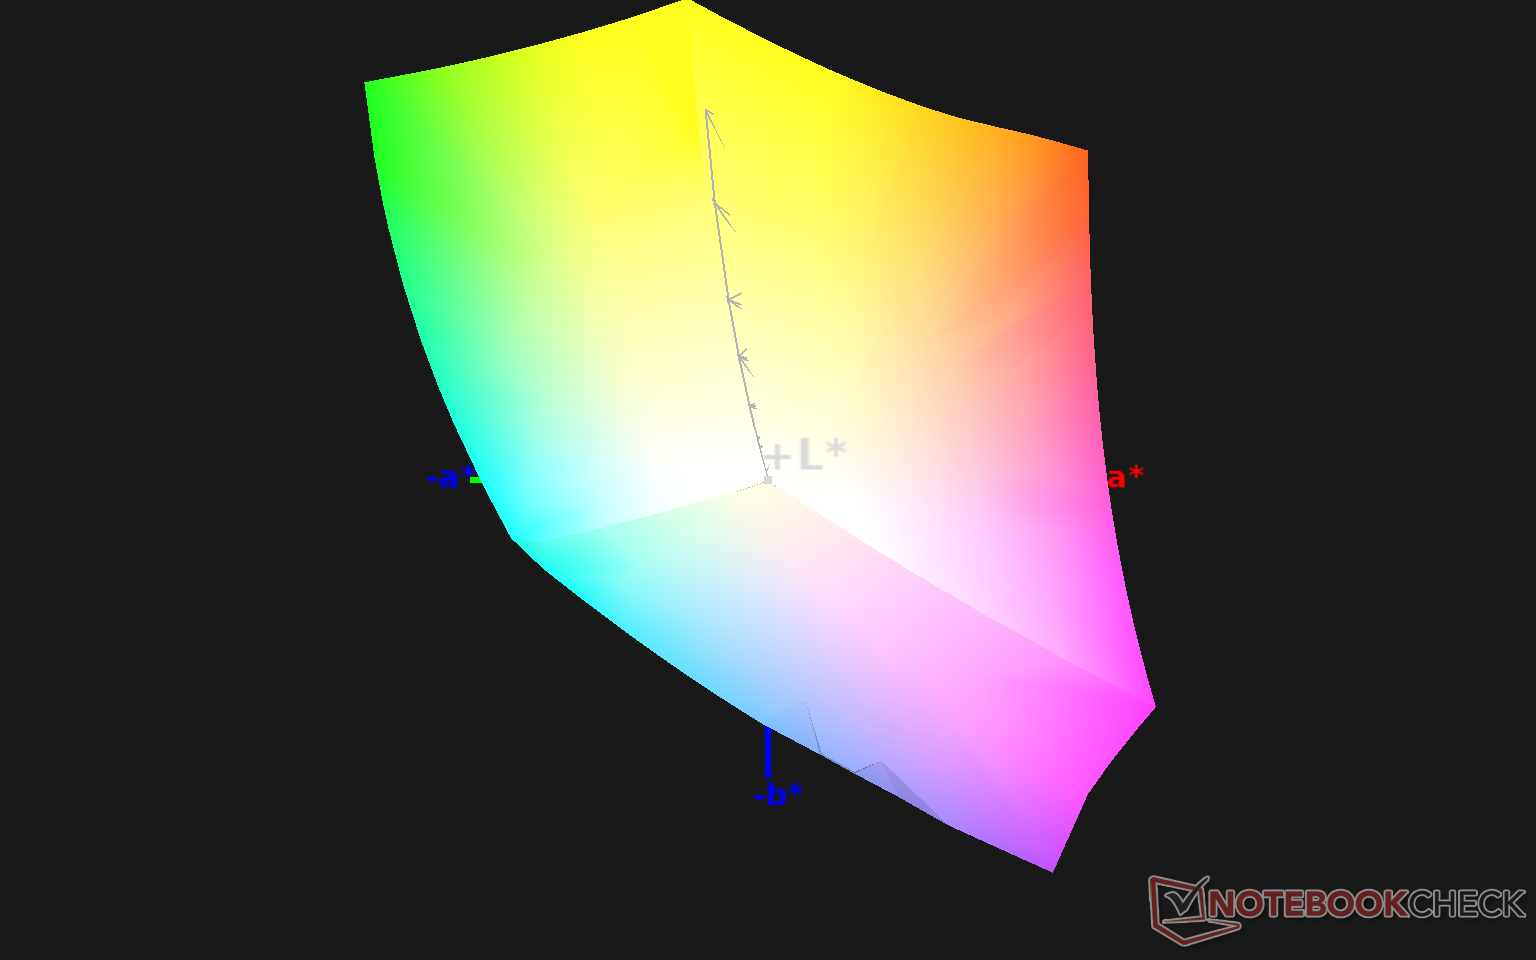
99.8% sRGB (Argyll 1.6.3 3D)
75.8% AdobeRGB 1998 (Argyll 1.6.3 3D)
84.7% AdobeRGB 1998 (Argyll 3D)
99.9% sRGB (Argyll 3D)
96.3% Display P3 (Argyll 3D)
Gamma: 2.12
CCT: 8272 K
| LG Gram 16 2-in-1 16T90P LG Philips LP160WQ1-SPA1, IPS, 16", 2560x1600 | Honor MagicBook Pro 10210U Chi Mei N161HCA-EA3, IPS, 16.1", 1920x1080 | Apple MacBook Pro 16 2019 i9 5500M APPA044, IPS, 16", 3072x1920 | Dell XPS 15 9500 Core i5 Sharp LQ156N1, IPS, 15.6", 1920x1200 | HP Spectre X360 15-5ZV31AV AU Optronics AUO30EB, IPS, 15.6", 3840x2160 | Asus ZenBook UX535-M01440 BOE0866, IPS, 15.6", 3840x2160 | |
|---|---|---|---|---|---|---|
| Display | -16% | -7% | -18% | -15% | ||
| Display P3 Coverage (%) | 96.3 | 67 -30% | 81.5 -15% | 68.3 -29% | 68.8 -29% | |
| sRGB Coverage (%) | 99.9 | 99.3 -1% | 100 0% | 94.3 -6% | 99.5 0% | |
| AdobeRGB 1998 Coverage (%) | 84.7 | 69.2 -18% | 79.6 -6% | 68.4 -19% | 70.1 -17% | |
| Response Times | 11% | -37% | -11% | -54% | 9% | |
| Response Time Grey 50% / Grey 80% * (ms) | 36.4 ? | 35.2 ? 3% | 52.4 ? -44% | 42 ? -15% | 56.8 ? -56% | 34 ? 7% |
| Response Time Black / White * (ms) | 26.8 ? | 22 ? 18% | 34.9 ? -30% | 28.8 ? -7% | 40.8 ? -52% | 24 ? 10% |
| PWM Frequency (Hz) | 25000 ? | 131700 | ||||
| Screen | 33% | 39% | 29% | 11% | 29% | |
| Brightness middle (cd/m²) | 325.3 | 339 4% | 519 60% | 592 82% | 284.6 -13% | 402 24% |
| Brightness (cd/m²) | 311 | 317 2% | 477 53% | 565 82% | 285 -8% | 375 21% |
| Brightness Distribution (%) | 92 | 86 -7% | 86 -7% | 85 -8% | 85 -8% | 84 -9% |
| Black Level * (cd/m²) | 0.35 | 0.25 29% | 0.39 -11% | 0.46 -31% | 0.25 29% | 0.35 -0% |
| Contrast (:1) | 929 | 1356 46% | 1331 43% | 1287 39% | 1138 22% | 1149 24% |
| Colorchecker dE 2000 * | 4.91 | 0.9 82% | 2.28 54% | 3.19 35% | 3.52 28% | 2.47 50% |
| Colorchecker dE 2000 max. * | 10.96 | 2.92 73% | 6.54 40% | 5.45 50% | 5.56 49% | 4.32 61% |
| Colorchecker dE 2000 calibrated * | 2.83 | 0.74 74% | 0.86 70% | 2.03 28% | 3 -6% | 2.36 17% |
| Greyscale dE 2000 * | 7.7 | 2 74% | 0.9 88% | 3.9 49% | 3.2 58% | 2.26 71% |
| Gamma | 2.12 104% | 2.238 98% | 2145 0% | 2.25 98% | 2.28 96% | 2.49 88% |
| CCT | 8272 79% | 6631 98% | 6572 99% | 6522 100% | 7070 92% | 6285 103% |
| Color Space (Percent of AdobeRGB 1998) (%) | 75.8 | 69 -9% | 78 3% | 71.6 -6% | 61.1 -19% | 99 31% |
| Color Space (Percent of sRGB) (%) | 99.8 | 92 -8% | 100 0% | 93.8 -6% | ||
| Totaal Gemiddelde (Programma / Instellingen) | 9% /
21% | 1% /
27% | 4% /
17% | -20% /
-2% | 8% /
17% |
* ... kleiner is beter
De kleurruimte omvat alle sRGB en 76 procent van AdobeRGB. Het volume reikt echter verder dan de AdobeRGB standaard om een DCI-P3 doel aan te duiden in plaats van de Gram 16 clamshell. Het is daarom zeer waarschijnlijk dat LG exact hetzelfde IPS paneel gebruikt voor zowel de Gram 16 clamshell als de 2-in-1 modellen. Dit zou de Gram 16-serie ook tot een van de weinige 16-inch laptops maken die DCI-P3-dekking bieden, met de MacBook Pro 16 als de meest bekende.

X-Rite colorimeter metingen tonen een te koele kleurtemperatuur uit de doos en de kleurnauwkeurigheid lijdt vervolgens bij lagere verzadigingsniveaus. Onze kalibratiepoging verlaagt de kleurtemperatuur om de grijstinten aanzienlijk te verbeteren.
Responstijd Scherm
| ↔ Responstijd Zwart naar Wit | ||
|---|---|---|
| 26.8 ms ... stijging ↗ en daling ↘ gecombineerd | ↗ 14.4 ms stijging | 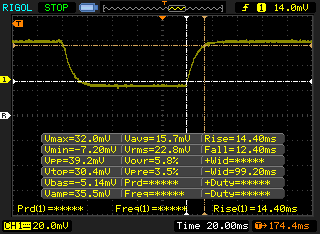 |
| ↘ 12.4 ms daling | ||
| Het scherm vertoonde relatief trage responstijden in onze tests en is misschien te traag voor games. Ter vergelijking: alle testtoestellen variëren van 0.1 (minimum) tot 240 (maximum) ms. » 67 % van alle toestellen zijn beter. Dit betekent dat de gemeten responstijd slechter is dan het gemiddelde (19.8 ms) van alle geteste toestellen. | ||
| ↔ Responstijd 50% Grijs naar 80% Grijs | ||
| 36.4 ms ... stijging ↗ en daling ↘ gecombineerd | ↗ 18 ms stijging | 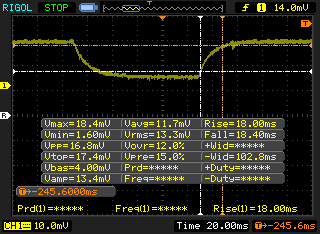 |
| ↘ 18.4 ms daling | ||
| Het scherm vertoonde trage responstijden in onze tests en is misschien te traag voor games. Ter vergelijking: alle testtoestellen variëren van 0.165 (minimum) tot 636 (maximum) ms. » 52 % van alle toestellen zijn beter. Dit betekent dat de gemeten responstijd slechter is dan het gemiddelde (31 ms) van alle geteste toestellen. | ||
Screen Flickering / PWM (Pulse-Width Modulation)
| Screen flickering / PWM niet waargenomen |  | ||
Ter vergelijking: 52 % van alle geteste toestellen maakten geen gebruik van PWM om de schermhelderheid te verlagen. Als het wel werd gebruikt, werd een gemiddelde van 7781 (minimum: 5 - maximum: 343500) Hz waargenomen. | |||
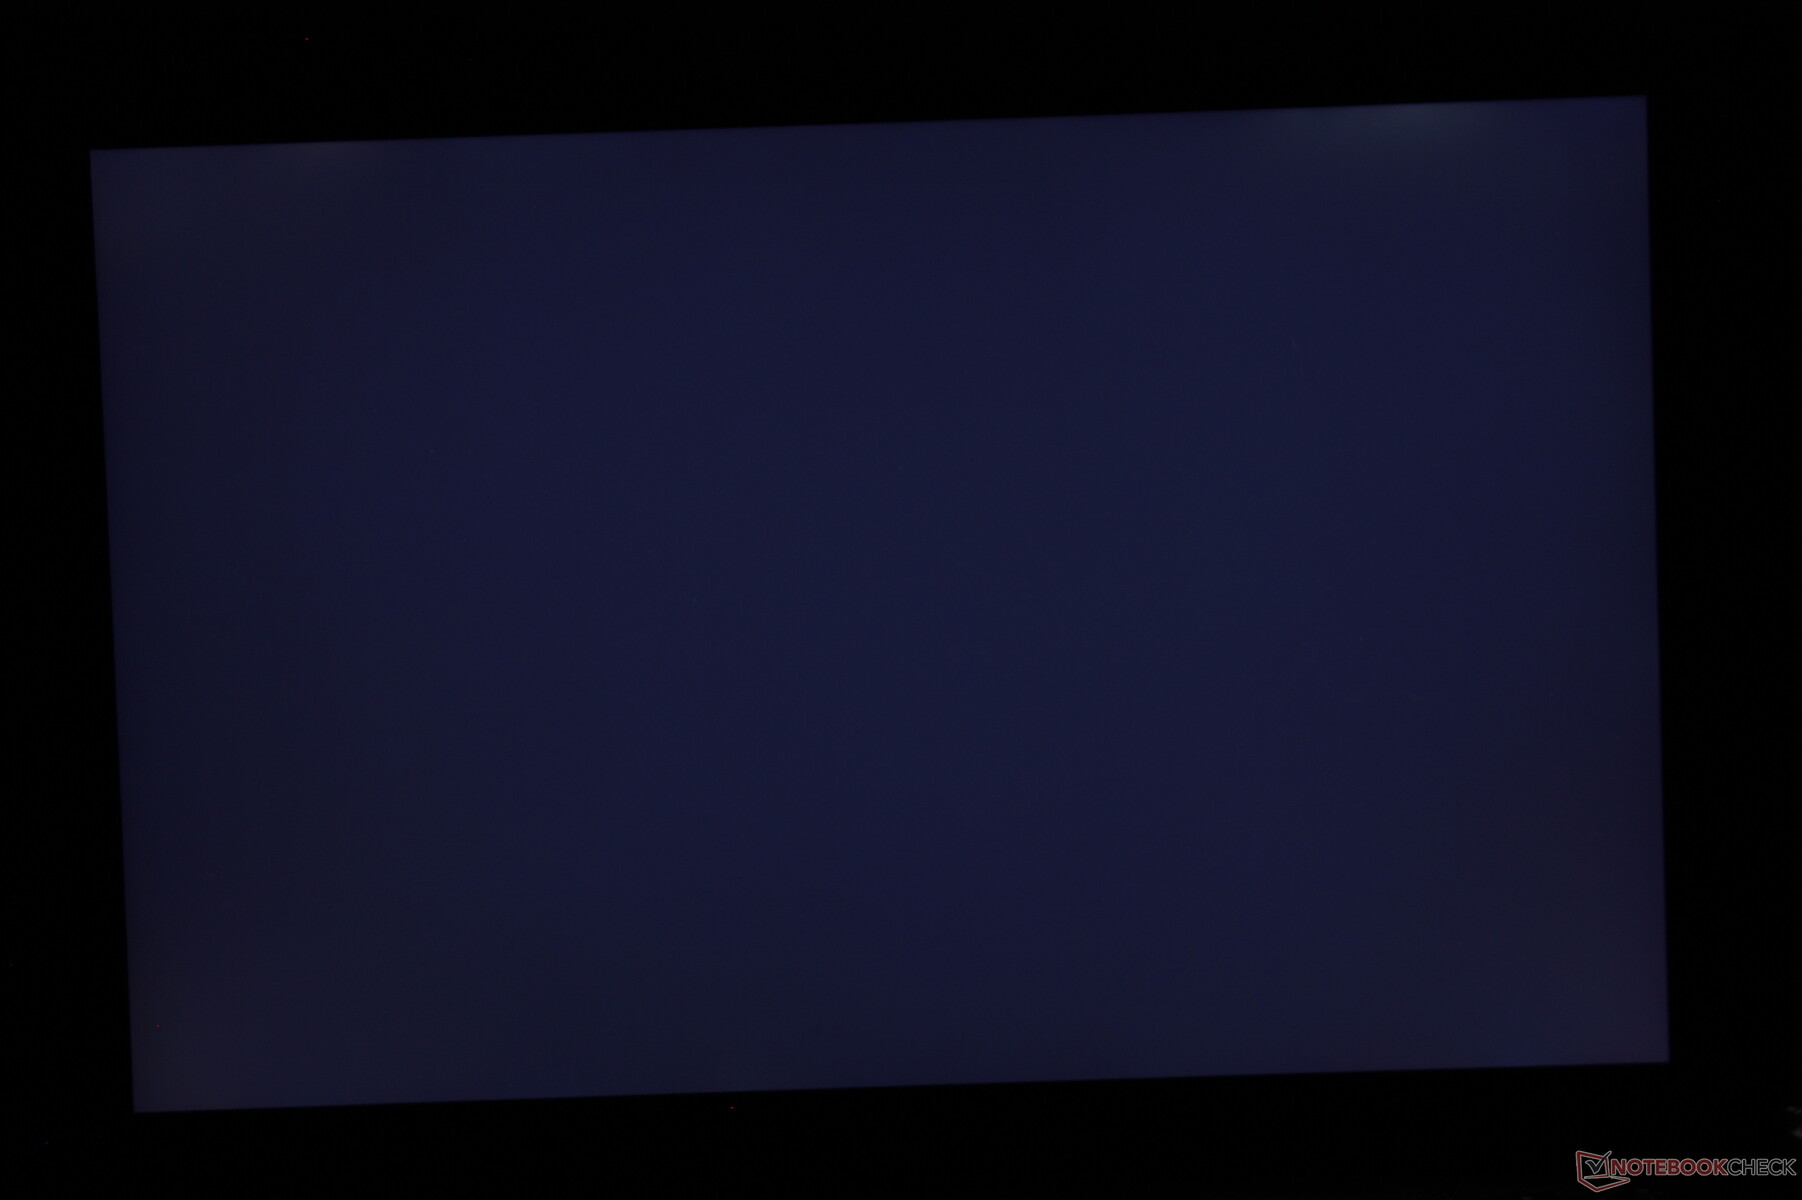
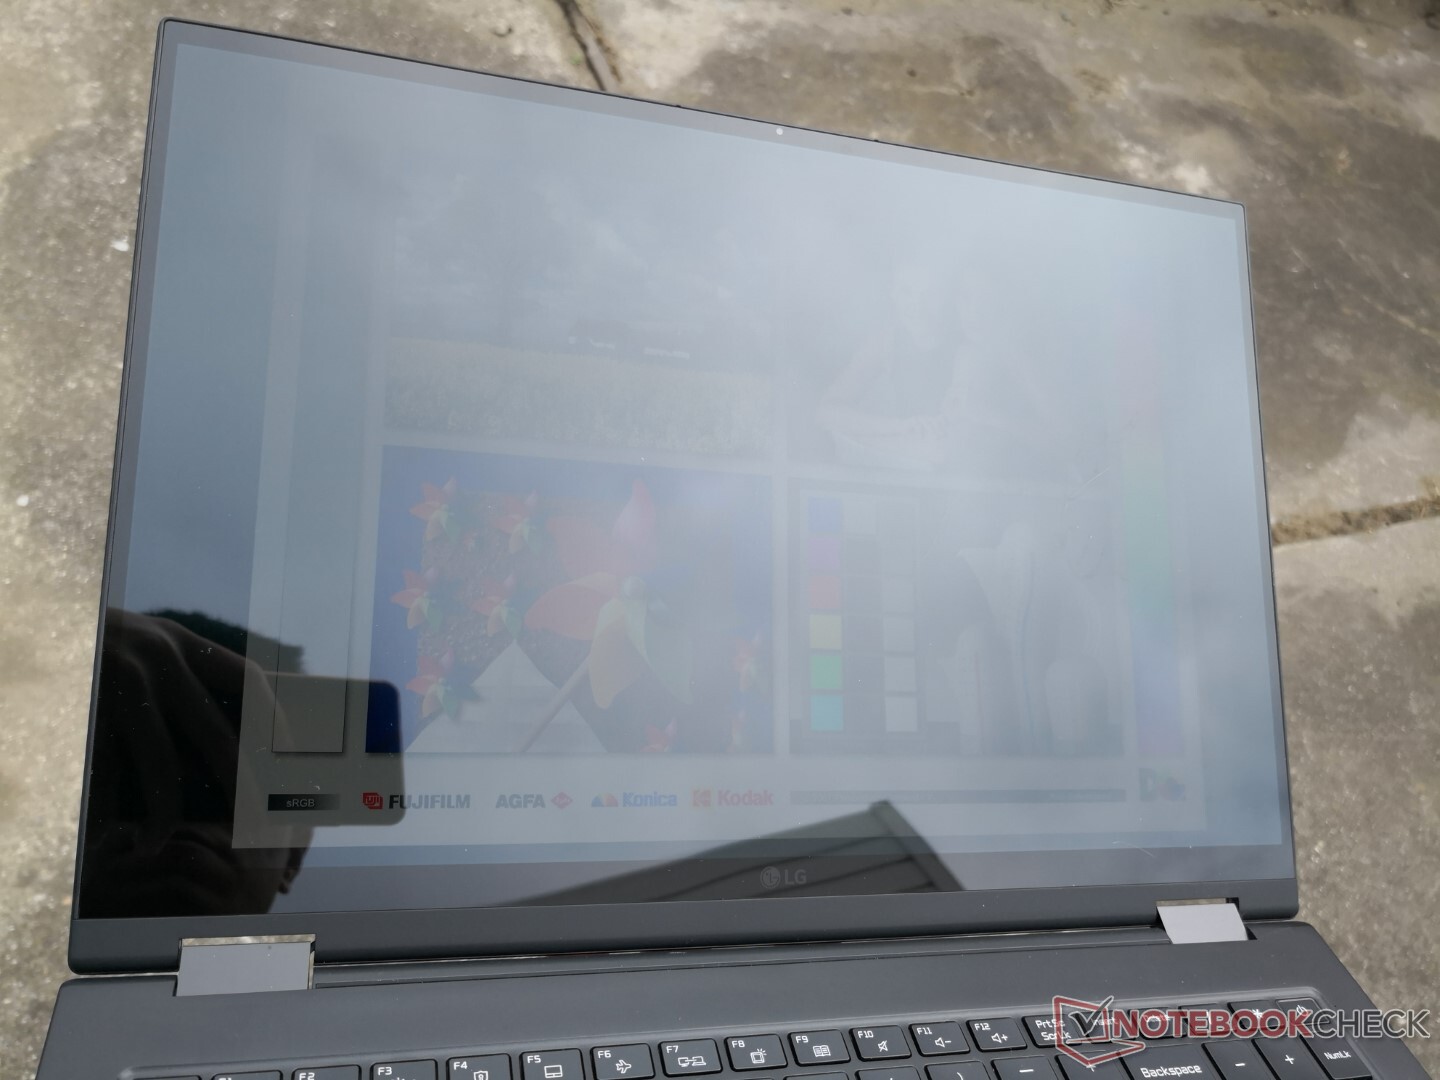
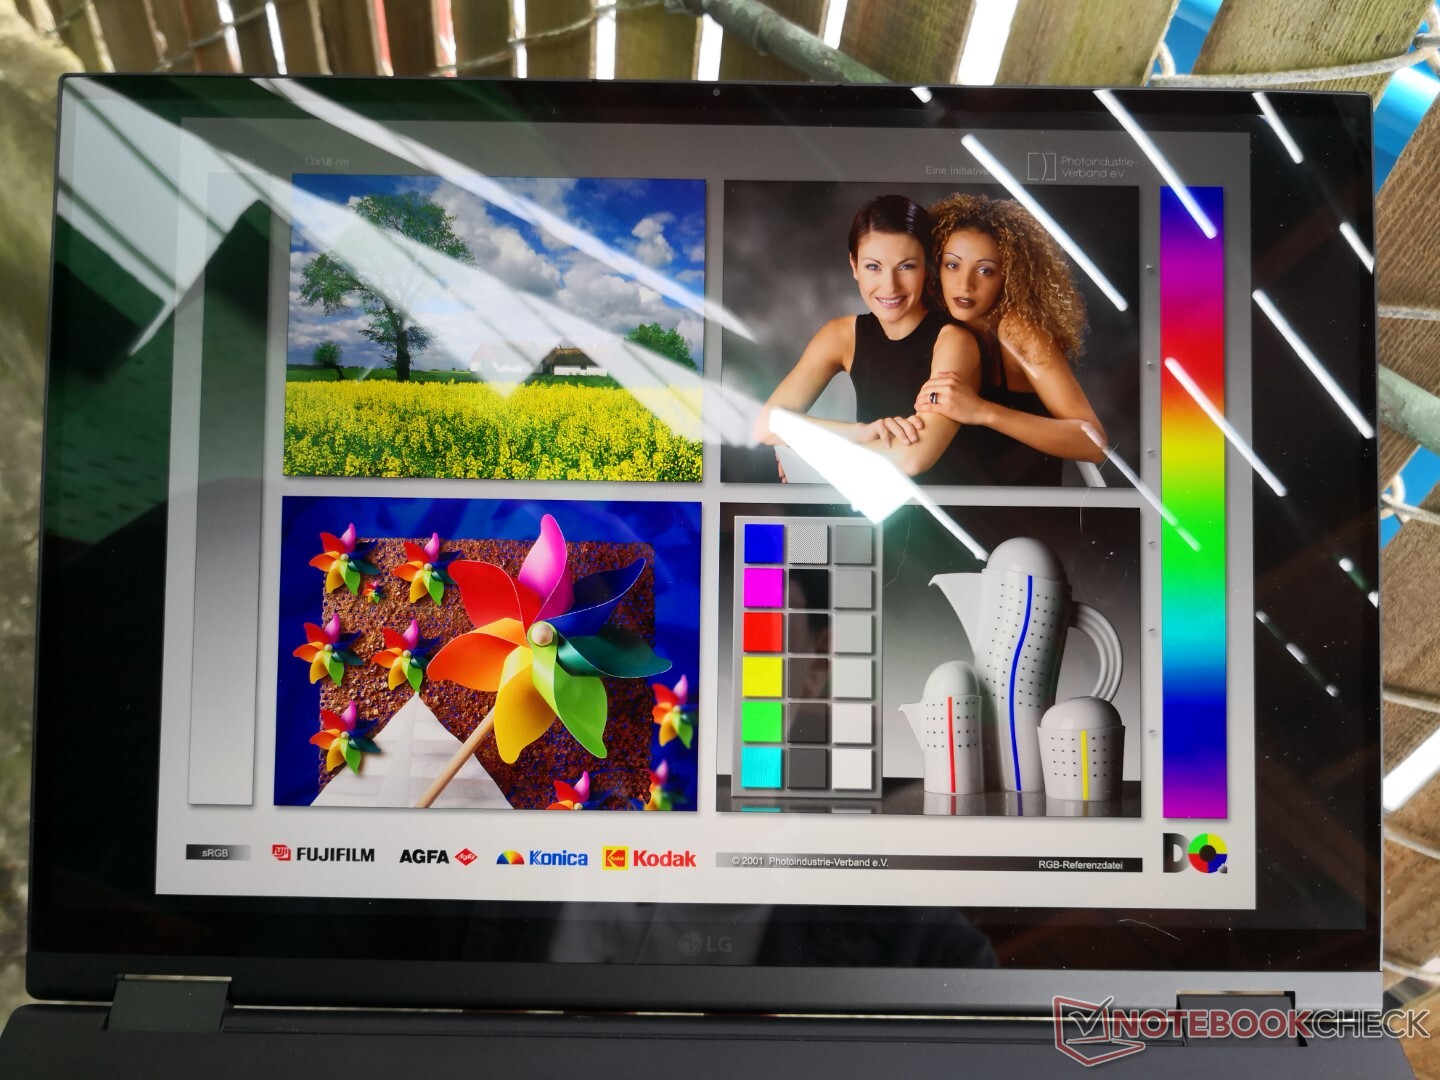
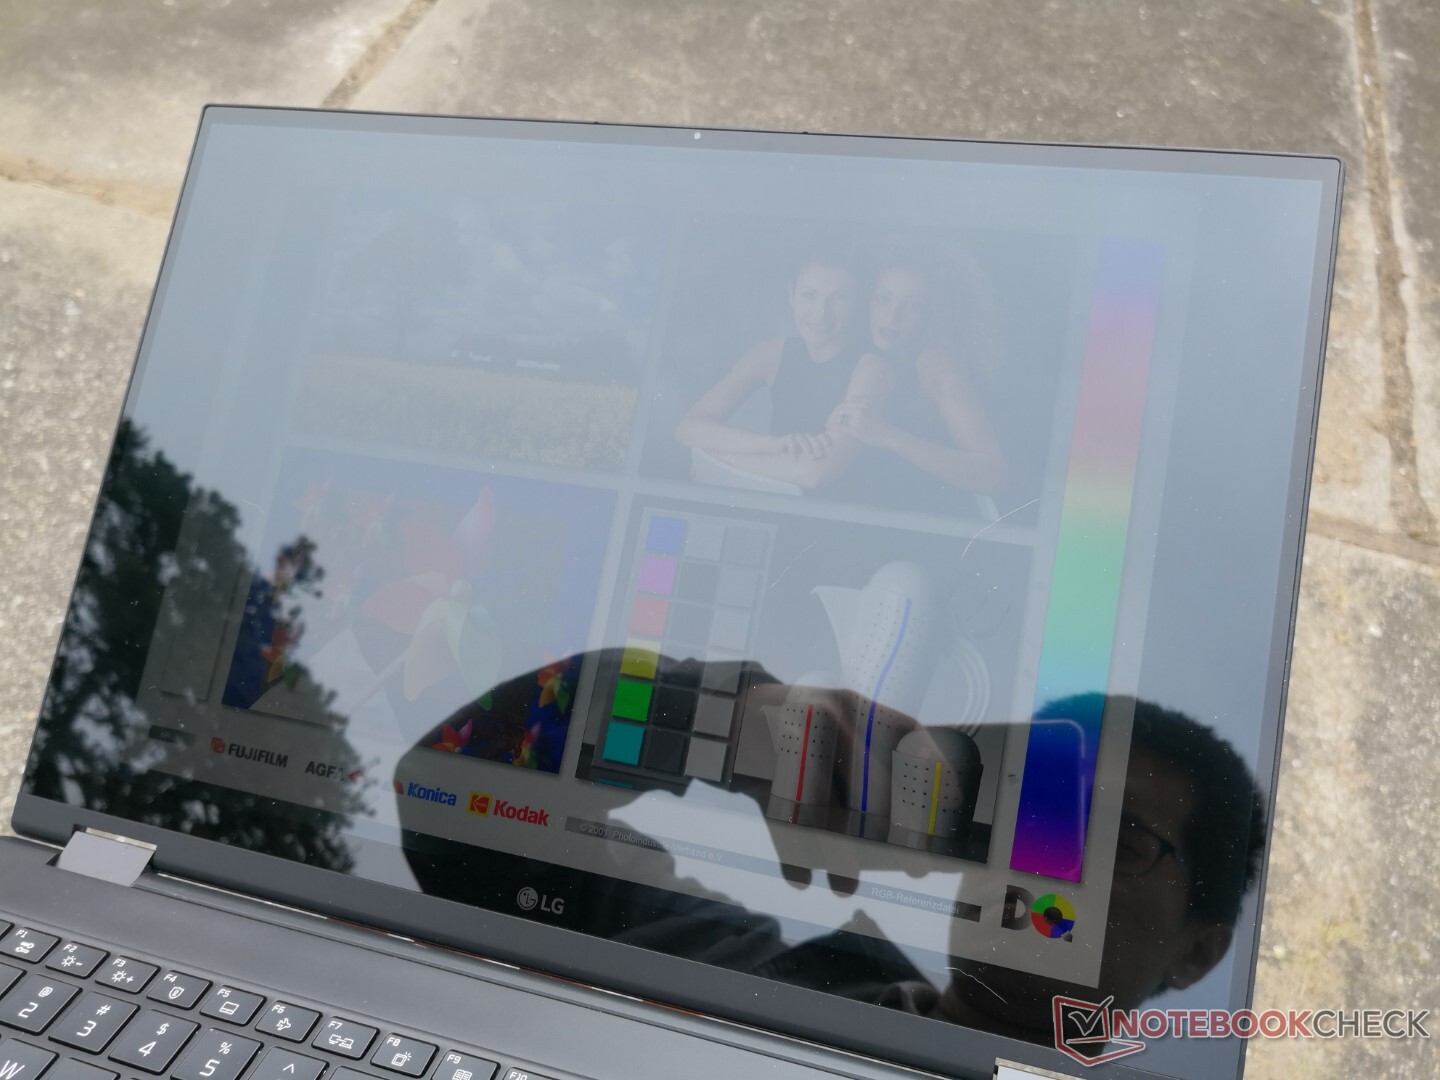
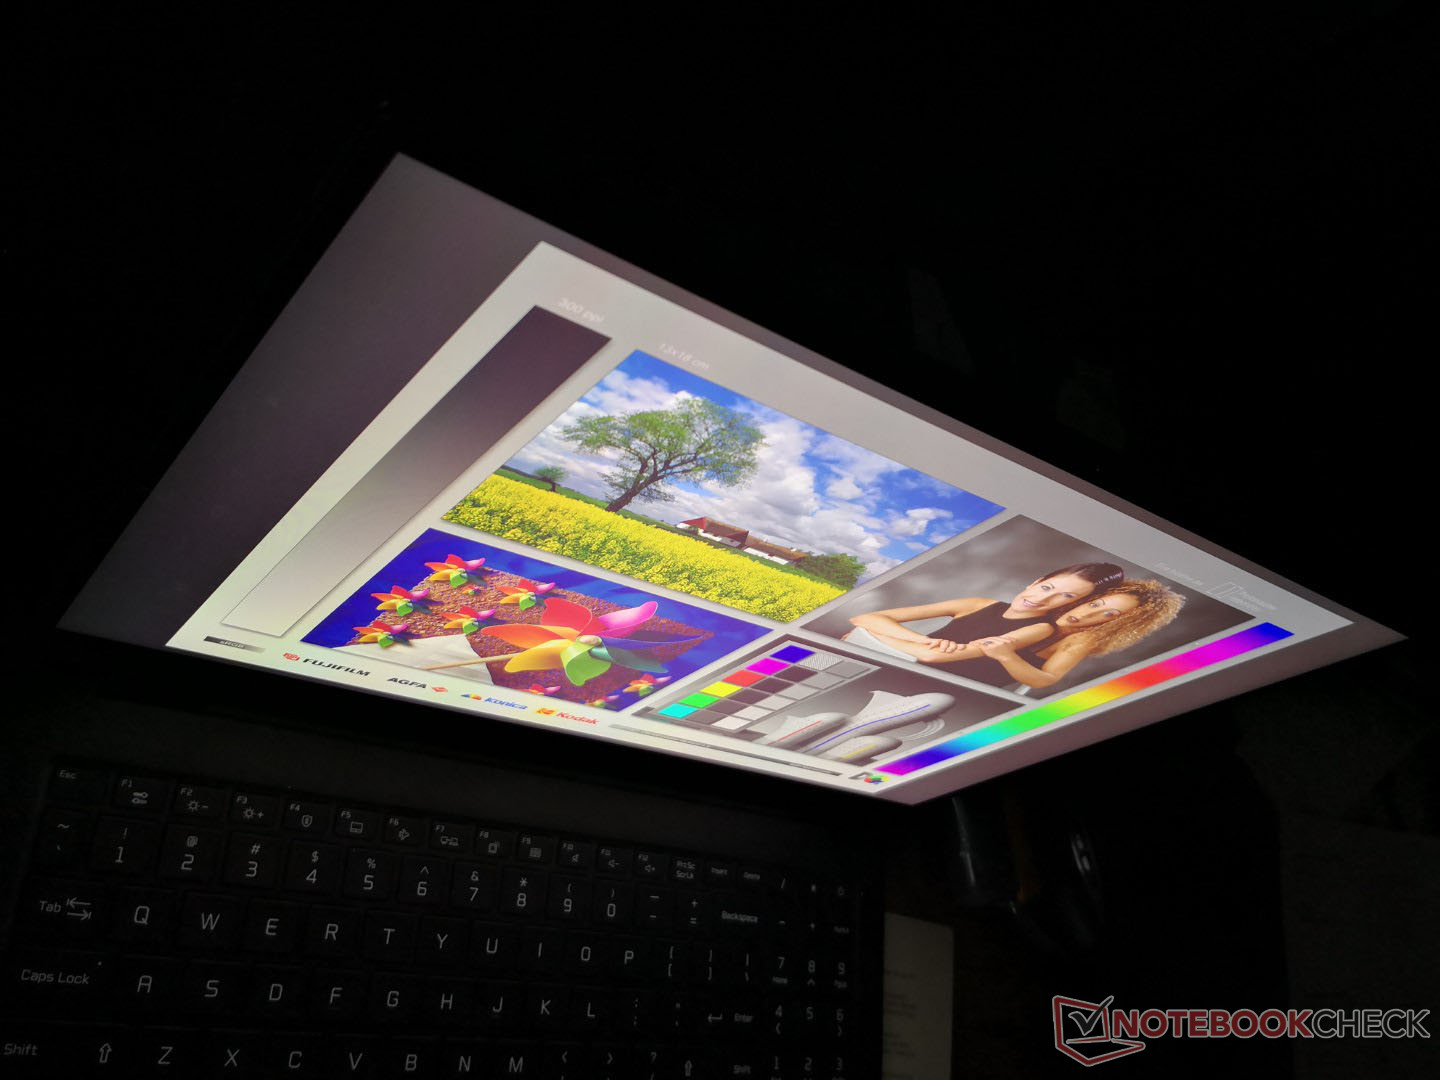
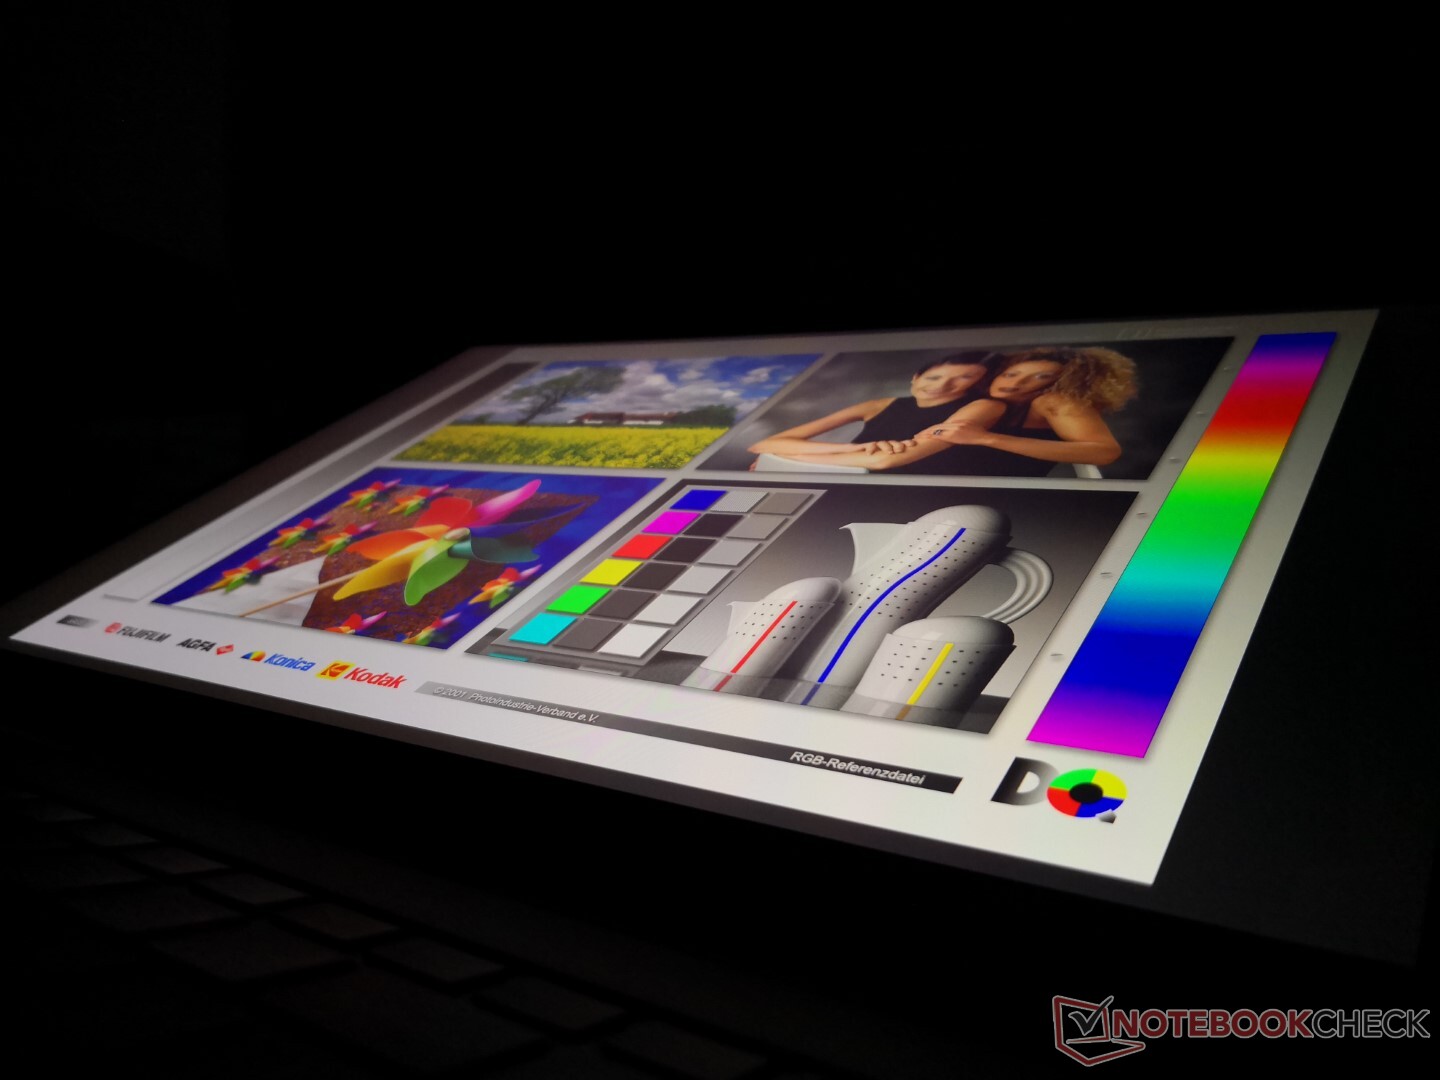
De zichtbaarheid buitenshuis is niet zo goed als we hadden gehoopt. Over het algemeen zijn we van mening dat converteerbare laptops een helderder beeldscherm moeten hebben dan clamshells, omdat eigenaren converteerbare laptops vaker buiten of onderweg gebruiken. Het scherm van de LG Gram 16 2-in-1 is niet significant helderder dan het scherm van de Gram 15 clamshell en dat is teleurstellend om te zien. Schittering is bijna onvermijdelijk, zoals blijkt uit de foto's hieronder.
Prestaties
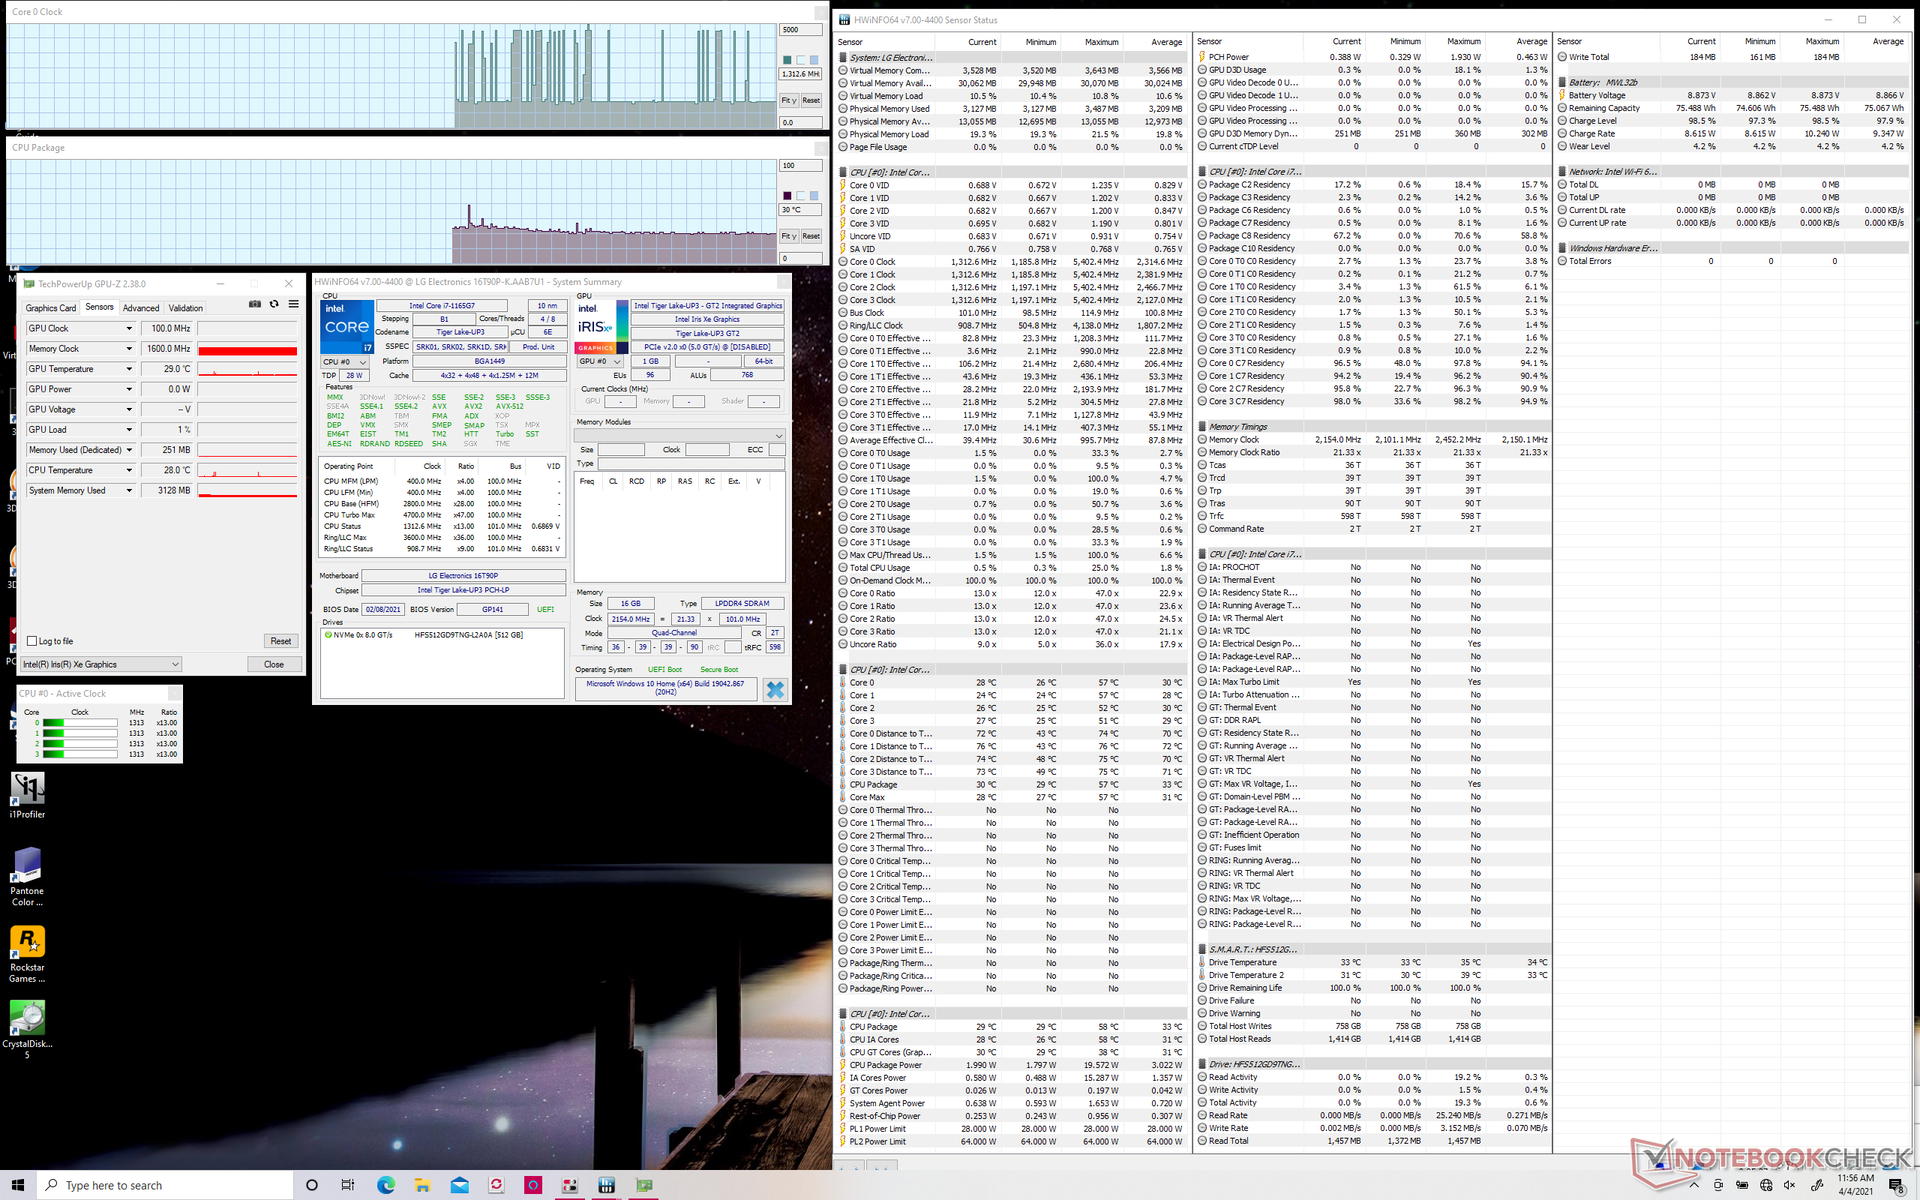
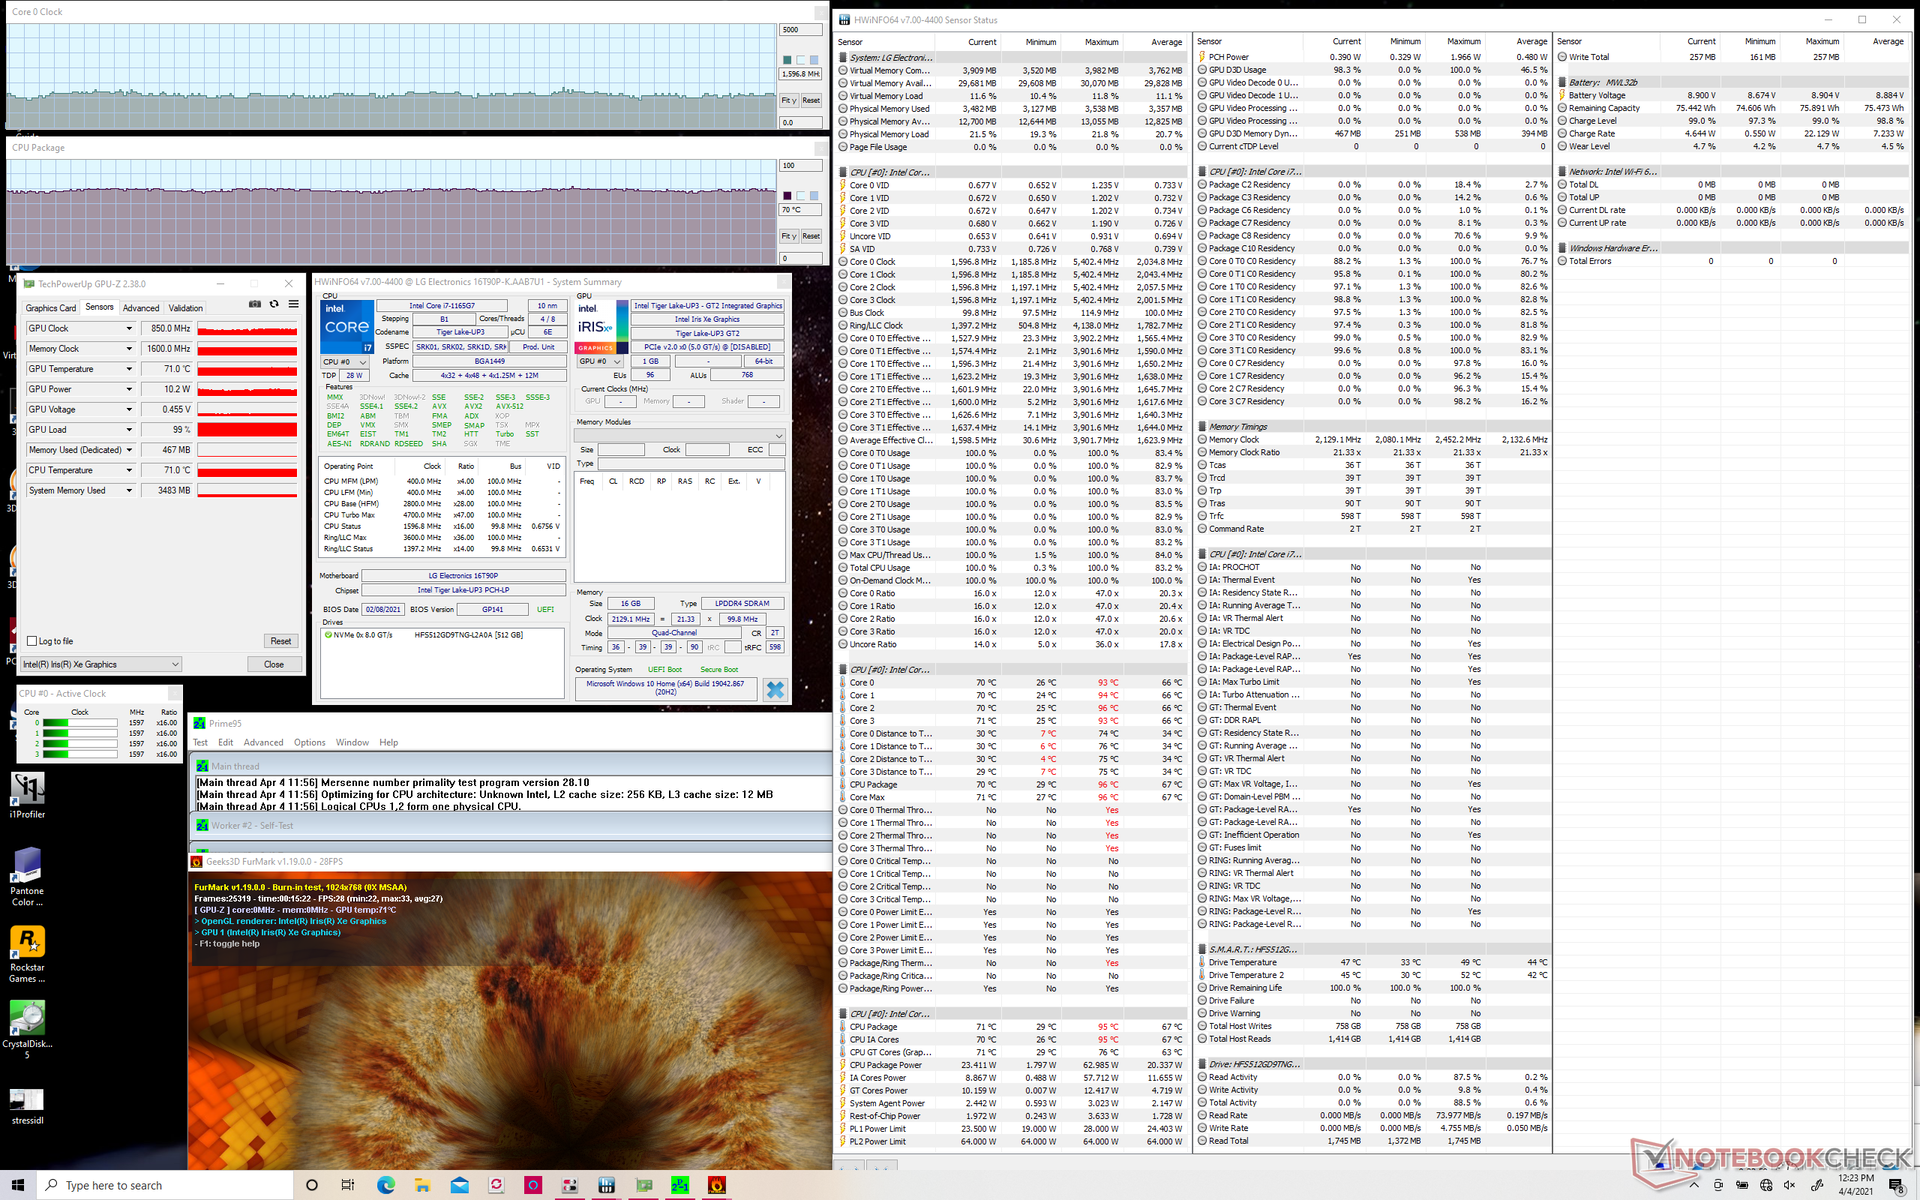
Net als andere Gram-laptops in zijn familie vertrouwt de Gram 16 2-in-1 alleen op een Core U-serie CPU om het totale gewicht en de dikte tot een minimum te beperken. De 11e generatie Core i7-1165G7 is een enorme upgrade ten opzichte van zowel de 10e generatie Ice Lake als de 8e generatie Whiskey Lake-U in termen van grafische prestaties, iets waar het de oudere Gram-laptops ernstig aan ontbrak. Er zijn echter nog steeds geen AMD opties, waarschijnlijk om de productiekosten onder controle te houden.
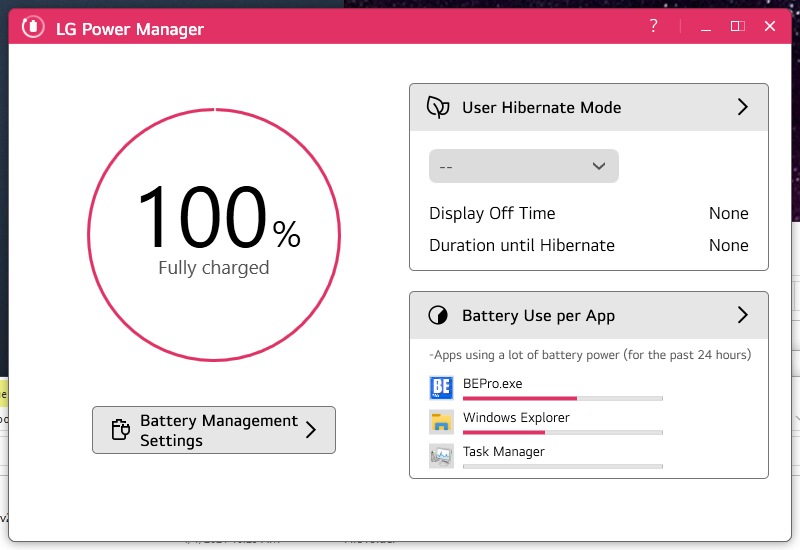
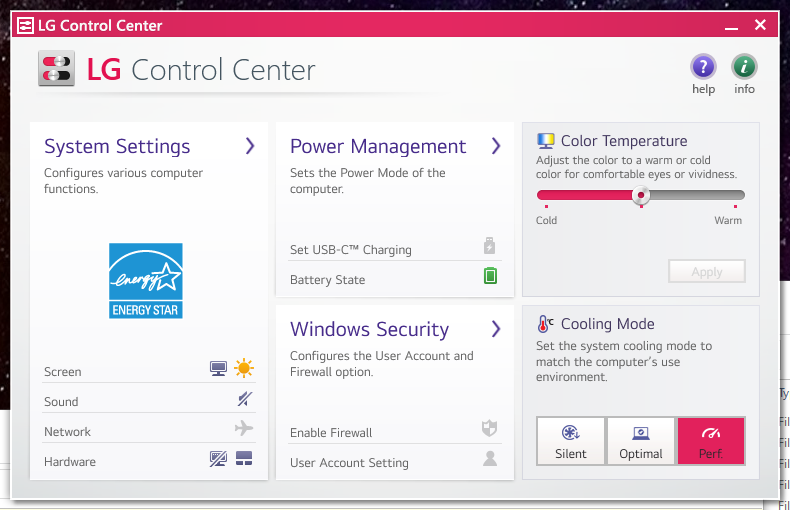
Het is sterk aan te raden dat eigenaars vertrouwd raken met de voorgeïnstalleerde LG Control Center, Update, en Reader Mode applicaties omdat hun in-app instellingen direct invloed hebben op de gebruikerservaring. Control Center in het bijzonder is belangrijk omdat de Silent, Optimal, en Prestatie energie profiel instellingen hier worden omgeschakeld. Ons systeem werd ingesteld op de prestatiemodus voordat we de onderstaande prestatiebenchmarks uitvoerden. Vervelend is dat het energieprofiel automatisch wordt teruggezet naar de Optimale modus telkens wanneer de PC opnieuw wordt opgestart.
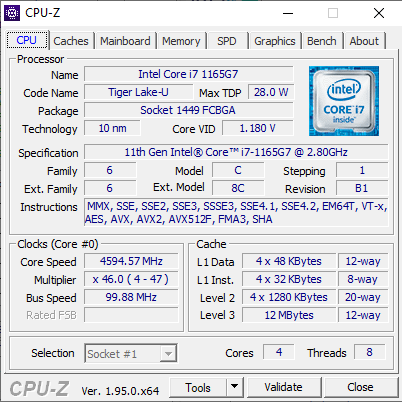
Processor
Terwijl de single-thread prestaties uitstekend zijn, zijn de multi-thread prestaties een gemengde zak met resultaten die over het algemeen lager zijn dan de gemiddelde Core i7-1165G7 laptop in onze database. CineBench R15 xT, bijvoorbeeld, is ruwweg 20 procent langzamer dan verwacht vanwege het zeer korte Turbo Boost potentieel van het systeem. De DellInspiron 15 7506 2-in-1 en Asus VivoBook 15 elk met dezelfde Core i7-1165G7 CPU zijn in staat om consequent te handhaven snellere CPU kloksnelheden dan onze Gram converteerbare wanneer onder dezelfde stressvolle benchmark omstandigheden.
Ondanks de ietwat ondermaatse processorprestaties zijn de algemene prestaties nog steeds een ruime upgrade ten opzichte van bestaande Gram laptops die draaien op Ice Lake of oudere CPU's.

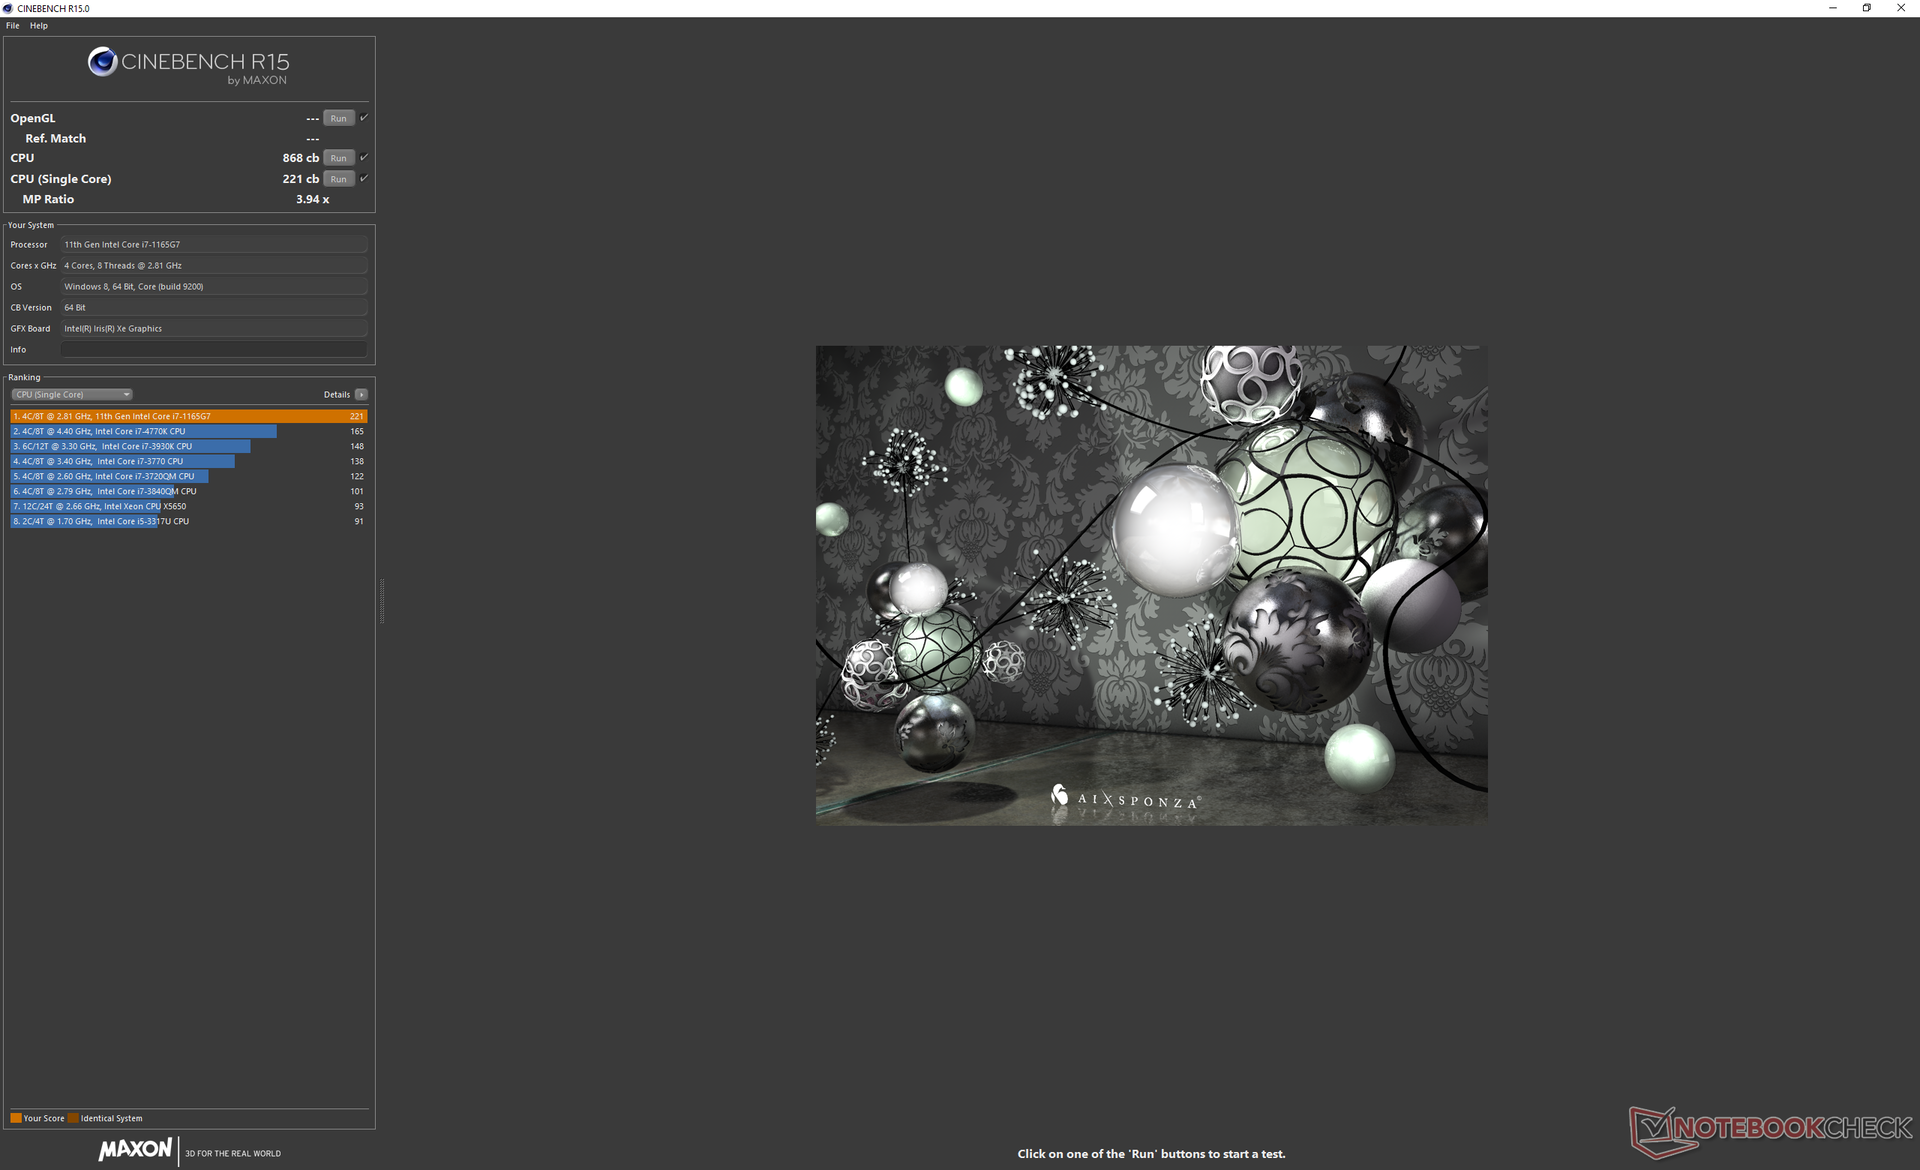
Cinebench R15: CPU Multi 64Bit | CPU Single 64Bit
Blender: v2.79 BMW27 CPU
7-Zip 18.03: 7z b 4 -mmt1 | 7z b 4
Geekbench 5.5: Single-Core | Multi-Core
HWBOT x265 Benchmark v2.2: 4k Preset
LibreOffice : 20 Documents To PDF
R Benchmark 2.5: Overall mean
| Cinebench R20 / CPU (Multi Core) | |
| Apple MacBook Pro 16 2019 i9 5500M | |
| Apple MacBook Pro 16 2019 i9 5500M | |
| Lenovo ThinkPad E15 Gen2-20T9S00K00 | |
| MSI Prestige 15 A10SC | |
| Dell XPS 15 9500 Core i5 | |
| HP Envy x360 15-ee0257ng | |
| Gemiddeld Intel Core i7-1165G7 (1060 - 2657, n=81) | |
| LG Gram 16 2-in-1 16T90P | |
| Microsoft Surface Laptop 3 15 i7-1065G7 | |
| Lenovo ThinkPad T15 Gen1-20S7S02U00 | |
| Acer Aspire 5 A515-56-511A | |
| Honor MagicBook Pro 10210U | |
| Acer Swift 3 SF314-42-R27B | |
| HP Pavilion x360 15-dq0065cl | |
| LG Gram 15Z90N | |
| Cinebench R20 / CPU (Single Core) | |
| Gemiddeld Intel Core i7-1165G7 (442 - 589, n=81) | |
| LG Gram 16 2-in-1 16T90P | |
| Acer Aspire 5 A515-56-511A | |
| Lenovo ThinkPad E15 Gen2-20T9S00K00 | |
| Lenovo ThinkPad T15 Gen1-20S7S02U00 | |
| MSI Prestige 15 A10SC | |
| Microsoft Surface Laptop 3 15 i7-1065G7 | |
| Apple MacBook Pro 16 2019 i9 5500M | |
| Apple MacBook Pro 16 2019 i9 5500M | |
| HP Envy x360 15-ee0257ng | |
| Dell XPS 15 9500 Core i5 | |
| Acer Swift 3 SF314-42-R27B | |
| Honor MagicBook Pro 10210U | |
| HP Pavilion x360 15-dq0065cl | |
| LG Gram 15Z90N | |
| Cinebench R15 / CPU Multi 64Bit | |
| Apple MacBook Pro 16 2019 i9 5500M | |
| Apple MacBook Pro 16 2019 i9 5500M | |
| Lenovo ThinkPad E15 Gen2-20T9S00K00 | |
| MSI Prestige 15 A10SC | |
| Dell XPS 15 9500 Core i5 | |
| HP Envy x360 15-ee0257ng | |
| Gemiddeld Intel Core i7-1165G7 (553 - 1027, n=86) | |
| Honor MagicBook Pro 10210U | |
| Lenovo ThinkPad T15 Gen1-20S7S02U00 | |
| Microsoft Surface Laptop 3 15 i7-1065G7 | |
| LG Gram 16 2-in-1 16T90P | |
| Acer Aspire 5 A515-56-511A | |
| Acer Swift 3 SF314-42-R27B | |
| LG Gram 15Z90N | |
| HP Pavilion x360 15-dq0065cl | |
| Cinebench R15 / CPU Single 64Bit | |
| LG Gram 16 2-in-1 16T90P | |
| Gemiddeld Intel Core i7-1165G7 (115 - 230, n=78) | |
| Acer Aspire 5 A515-56-511A | |
| MSI Prestige 15 A10SC | |
| Lenovo ThinkPad T15 Gen1-20S7S02U00 | |
| Dell XPS 15 9500 Core i5 | |
| Apple MacBook Pro 16 2019 i9 5500M | |
| Apple MacBook Pro 16 2019 i9 5500M | |
| Microsoft Surface Laptop 3 15 i7-1065G7 | |
| Lenovo ThinkPad E15 Gen2-20T9S00K00 | |
| HP Envy x360 15-ee0257ng | |
| HP Pavilion x360 15-dq0065cl | |
| Acer Swift 3 SF314-42-R27B | |
| Honor MagicBook Pro 10210U | |
| LG Gram 15Z90N | |
| Blender / v2.79 BMW27 CPU | |
| LG Gram 15Z90N | |
| Acer Swift 3 SF314-42-R27B | |
| HP Envy x360 15-ee0257ng | |
| Acer Aspire 5 A515-56-511A | |
| Lenovo ThinkPad T15 Gen1-20S7S02U00 | |
| Honor MagicBook Pro 10210U | |
| LG Gram 16 2-in-1 16T90P | |
| Gemiddeld Intel Core i7-1165G7 (468 - 1138, n=80) | |
| Dell XPS 15 9500 Core i5 | |
| Lenovo ThinkPad E15 Gen2-20T9S00K00 | |
| Apple MacBook Pro 16 2019 i9 5500M | |
| 7-Zip 18.03 / 7z b 4 -mmt1 | |
| Gemiddeld Intel Core i7-1165G7 (4478 - 5507, n=80) | |
| LG Gram 16 2-in-1 16T90P | |
| Dell XPS 15 9500 Core i5 | |
| Acer Aspire 5 A515-56-511A | |
| Apple MacBook Pro 16 2019 i9 5500M | |
| Lenovo ThinkPad T15 Gen1-20S7S02U00 | |
| Lenovo ThinkPad E15 Gen2-20T9S00K00 | |
| Honor MagicBook Pro 10210U | |
| HP Envy x360 15-ee0257ng | |
| LG Gram 15Z90N | |
| Acer Swift 3 SF314-42-R27B | |
| 7-Zip 18.03 / 7z b 4 | |
| Apple MacBook Pro 16 2019 i9 5500M | |
| Lenovo ThinkPad E15 Gen2-20T9S00K00 | |
| Dell XPS 15 9500 Core i5 | |
| HP Envy x360 15-ee0257ng | |
| LG Gram 16 2-in-1 16T90P | |
| Gemiddeld Intel Core i7-1165G7 (15347 - 27405, n=80) | |
| Honor MagicBook Pro 10210U | |
| Acer Aspire 5 A515-56-511A | |
| Lenovo ThinkPad T15 Gen1-20S7S02U00 | |
| Acer Swift 3 SF314-42-R27B | |
| LG Gram 15Z90N | |
| Geekbench 5.5 / Single-Core | |
| LG Gram 16 2-in-1 16T90P | |
| Gemiddeld Intel Core i7-1165G7 (1302 - 1595, n=77) | |
| Acer Aspire 5 A515-56-511A | |
| Lenovo ThinkPad T15 Gen1-20S7S02U00 | |
| Dell XPS 15 9500 Core i5 | |
| LG Gram 15Z90N | |
| Lenovo ThinkPad E15 Gen2-20T9S00K00 | |
| Apple MacBook Pro 16 2019 i9 5500M | |
| HP Envy x360 15-ee0257ng | |
| Honor MagicBook Pro 10210U | |
| Acer Swift 3 SF314-42-R27B | |
| Geekbench 5.5 / Multi-Core | |
| Apple MacBook Pro 16 2019 i9 5500M | |
| Lenovo ThinkPad E15 Gen2-20T9S00K00 | |
| LG Gram 16 2-in-1 16T90P | |
| Gemiddeld Intel Core i7-1165G7 (3078 - 5926, n=77) | |
| HP Envy x360 15-ee0257ng | |
| Acer Aspire 5 A515-56-511A | |
| Dell XPS 15 9500 Core i5 | |
| Honor MagicBook Pro 10210U | |
| Lenovo ThinkPad T15 Gen1-20S7S02U00 | |
| Acer Swift 3 SF314-42-R27B | |
| LG Gram 15Z90N | |
| HWBOT x265 Benchmark v2.2 / 4k Preset | |
| Apple MacBook Pro 16 2019 i9 5500M | |
| Lenovo ThinkPad E15 Gen2-20T9S00K00 | |
| Dell XPS 15 9500 Core i5 | |
| LG Gram 16 2-in-1 16T90P | |
| Gemiddeld Intel Core i7-1165G7 (1.39 - 8.47, n=80) | |
| Honor MagicBook Pro 10210U | |
| HP Envy x360 15-ee0257ng | |
| Lenovo ThinkPad T15 Gen1-20S7S02U00 | |
| Acer Aspire 5 A515-56-511A | |
| Acer Swift 3 SF314-42-R27B | |
| LibreOffice / 20 Documents To PDF | |
| HP Envy x360 15-ee0257ng | |
| Dell XPS 15 9500 Core i5 | |
| Acer Swift 3 SF314-42-R27B | |
| Apple MacBook Pro 16 2019 i9 5500M | |
| Apple MacBook Pro 16 2019 i9 5500M | |
| Lenovo ThinkPad E15 Gen2-20T9S00K00 | |
| Honor MagicBook Pro 10210U | |
| Lenovo ThinkPad T15 Gen1-20S7S02U00 | |
| Acer Aspire 5 A515-56-511A | |
| LG Gram 16 2-in-1 16T90P | |
| Gemiddeld Intel Core i7-1165G7 (21.5 - 88.1, n=78) | |
| LG Gram 15Z90N | |
| R Benchmark 2.5 / Overall mean | |
| LG Gram 15Z90N | |
| Honor MagicBook Pro 10210U | |
| Apple MacBook Pro 16 2019 i9 5500M | |
| Apple MacBook Pro 16 2019 i9 5500M | |
| Acer Swift 3 SF314-42-R27B | |
| Lenovo ThinkPad T15 Gen1-20S7S02U00 | |
| Dell XPS 15 9500 Core i5 | |
| Acer Aspire 5 A515-56-511A | |
| HP Envy x360 15-ee0257ng | |
| Lenovo ThinkPad E15 Gen2-20T9S00K00 | |
| LG Gram 16 2-in-1 16T90P | |
| Gemiddeld Intel Core i7-1165G7 (0.552 - 1.002, n=80) | |
Cinebench R15: CPU Multi 64Bit | CPU Single 64Bit
Blender: v2.79 BMW27 CPU
7-Zip 18.03: 7z b 4 -mmt1 | 7z b 4
Geekbench 5.5: Single-Core | Multi-Core
HWBOT x265 Benchmark v2.2: 4k Preset
LibreOffice : 20 Documents To PDF
R Benchmark 2.5: Overall mean
* ... kleiner is beter
Systeemprestaties
PCMark resultaten zijn uitstekend en binnen slechts een paar procentpunten van de gemiddelde laptop in onze database uitgerust met dezelfde Core i7-1165G7 CPU. We hebben geen software- of hardwareproblemen ondervonden tijdens onze tijd met de testunit.
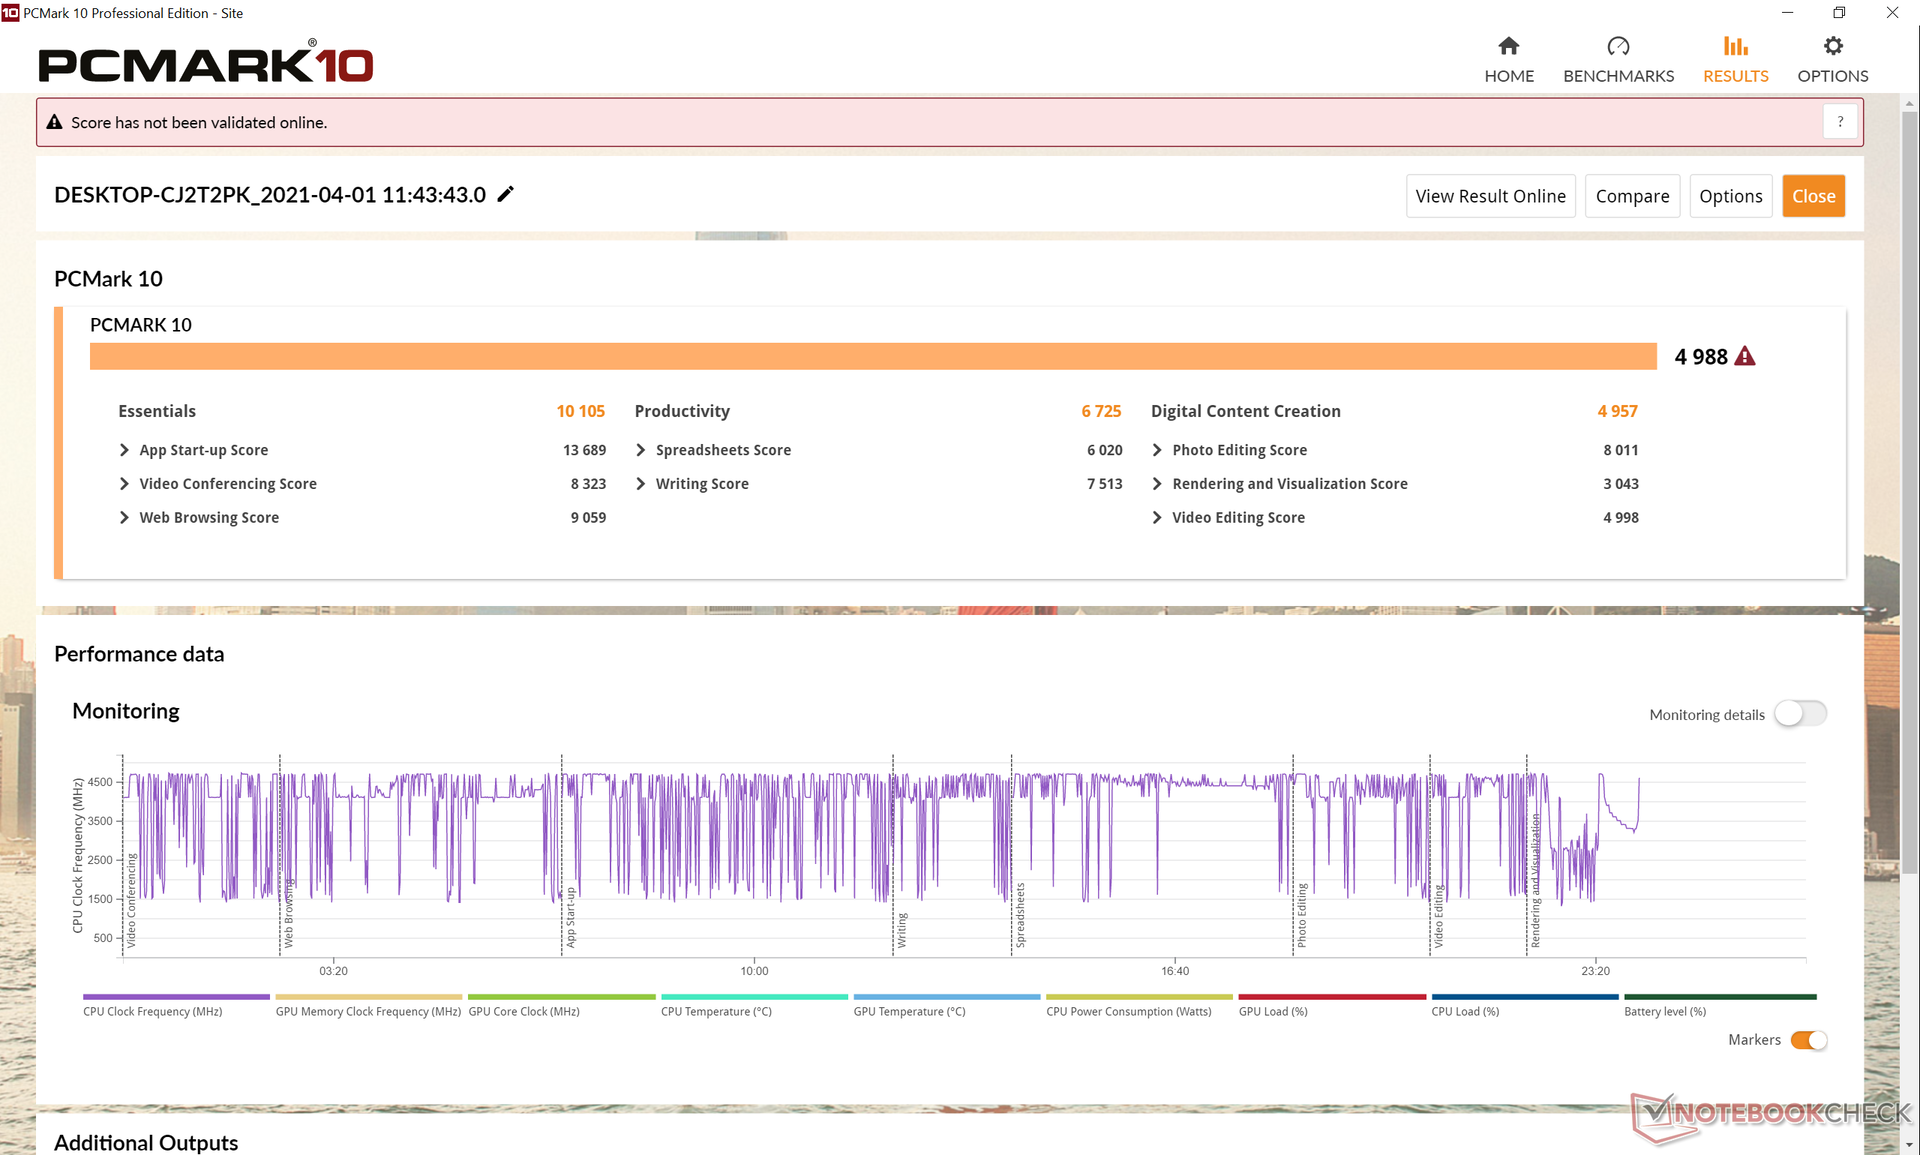
| PCMark 10 Score | 4988 punten | |
Help | ||
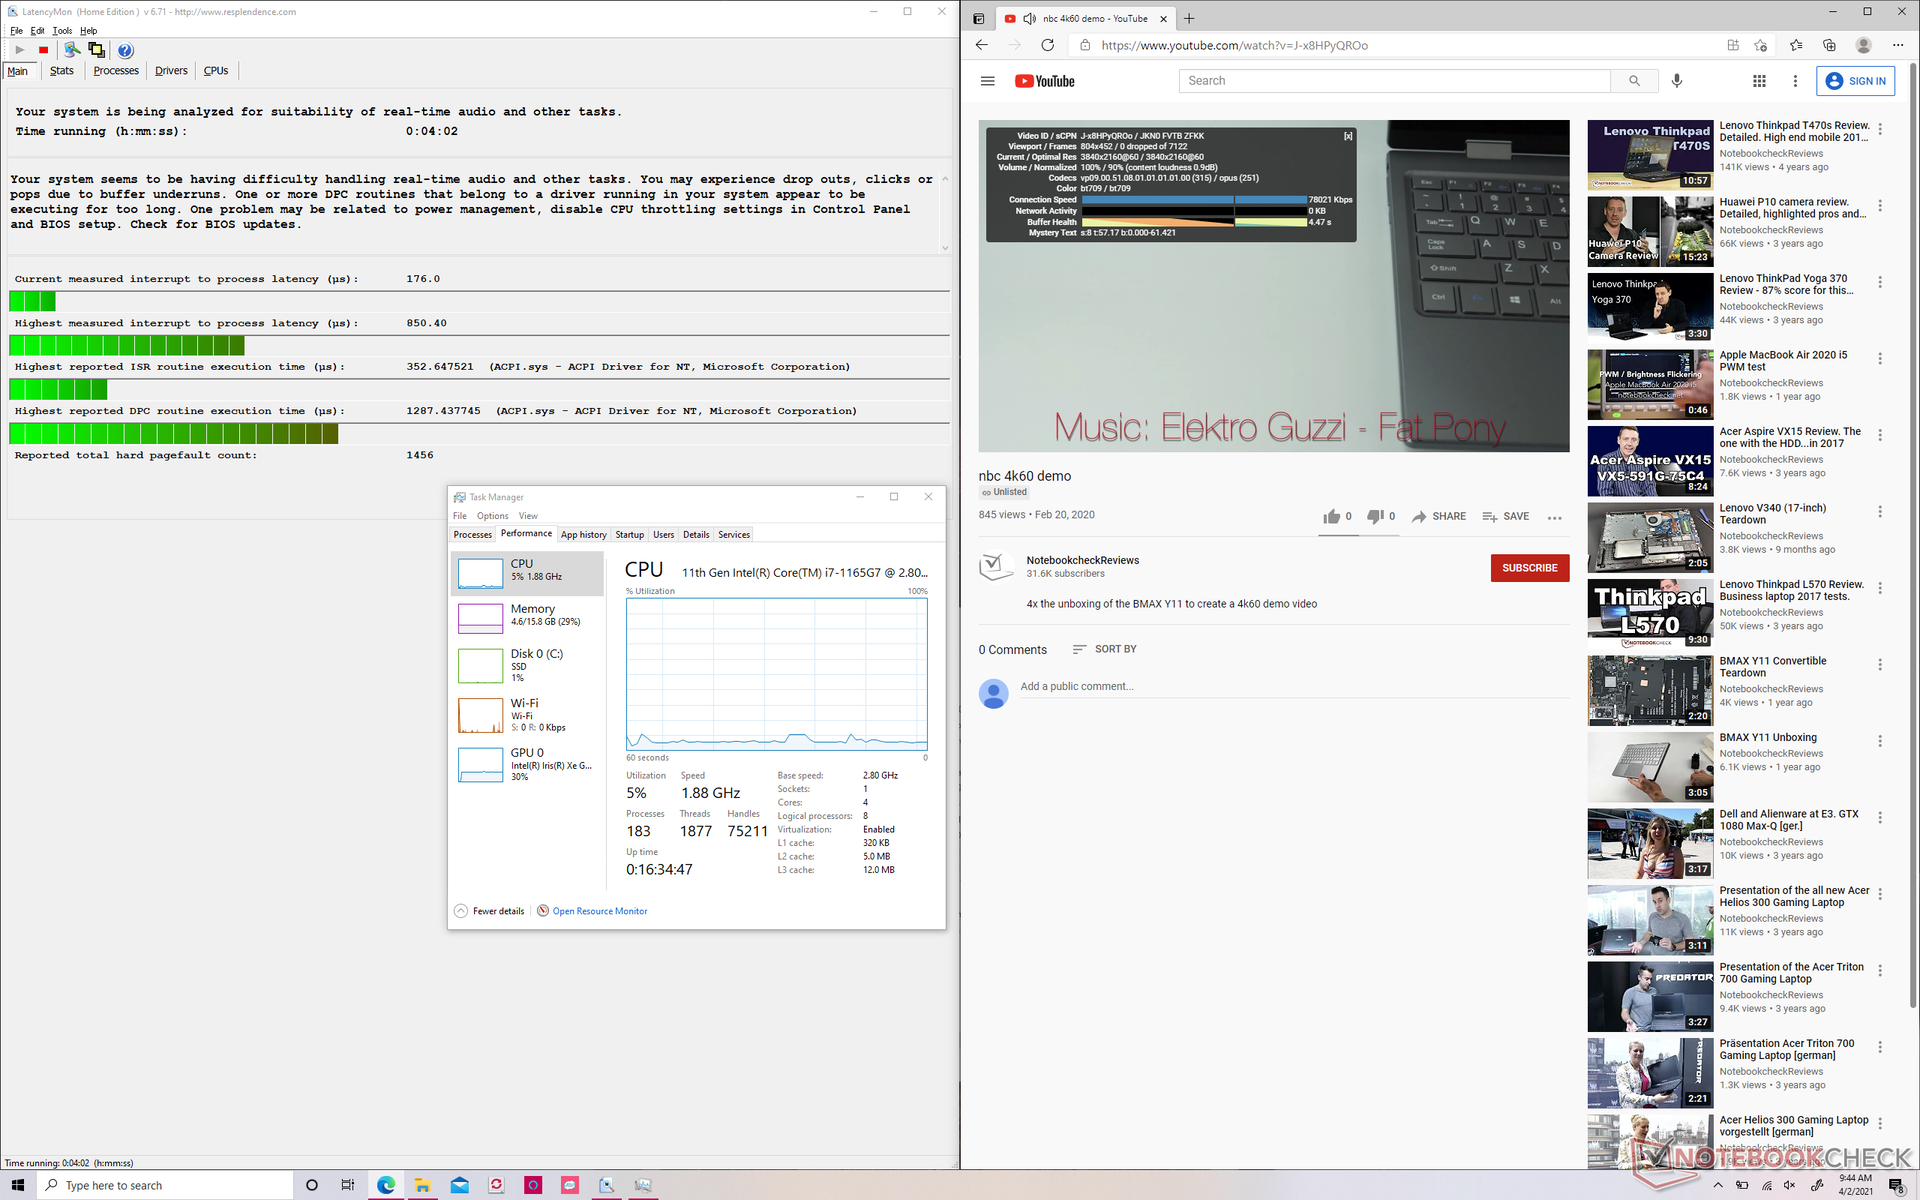
DPC latentie
LatencyMon toont kleine DPC latency problemen bij het openen van meerdere tabbladen op onze homepage. Het afspelen van 4K-video's met 60 FPS verloopt vloeiend en zonder wegvallende frames tijdens het testen.
| DPC Latencies / LatencyMon - interrupt to process latency (max), Web, Youtube, Prime95 | |
| Dell XPS 15 9500 Core i5 | |
| LG Gram 16 2-in-1 16T90P | |
| Asus ZenBook UX535-M01440 | |
| Honor MagicBook Pro 10210U | |
* ... kleiner is beter
Opslagapparaten
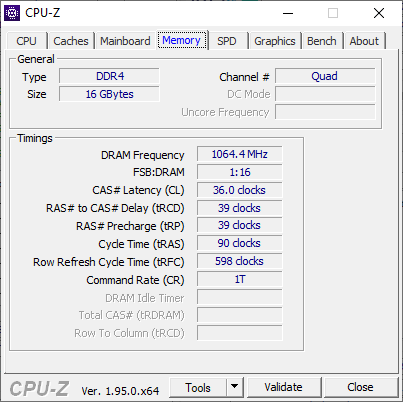
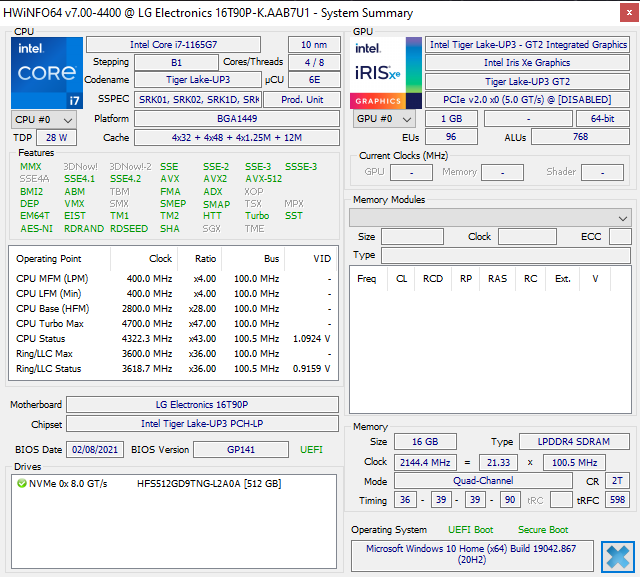
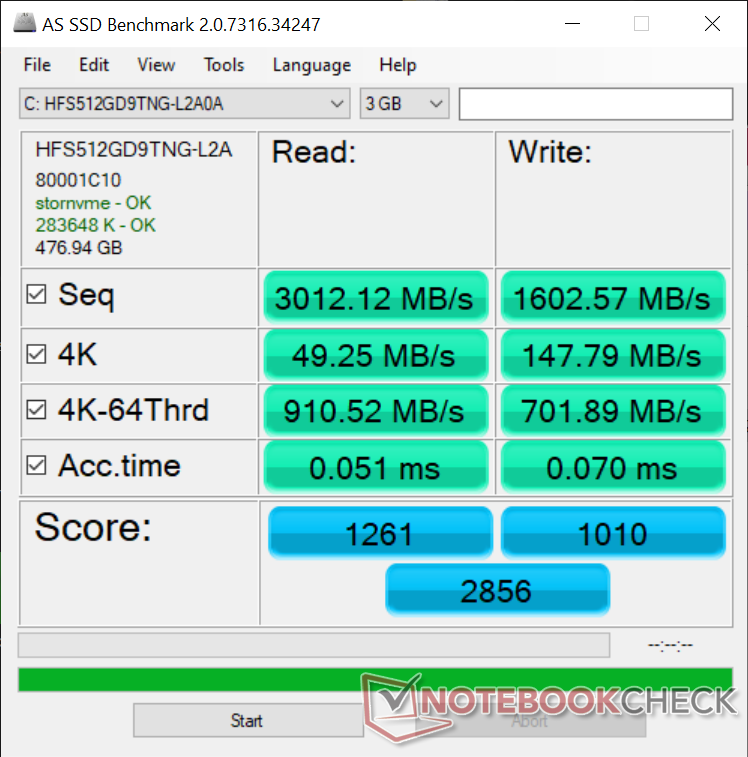
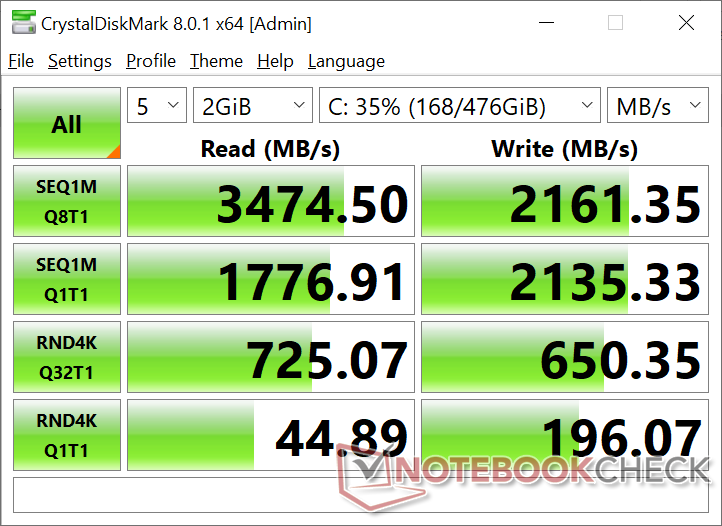
LG Gram-laptops worden geleverd met schijven van SK Hynix of Samsung. In ons geval wordt de Gram 16 2-in-1 geleverd met de SK Hynix PC401 voor uitstekende sequentiële lees- en schrijfsnelheden van 2000 tot 3000 MB/s. Gebruikers kunnen een tweede M.2 schijf toevoegen als ze het bodempaneel voorzichtig kunnen verwijderen.
| LG Gram 16 2-in-1 16T90P SK Hynix PC401 512GB M.2 (HFS512GD9TNG) | Honor MagicBook Pro 10210U Toshiba XG6 KXG60ZNV512G | Apple MacBook Pro 16 2019 i9 5500M Apple SSD AP1024 7171 | Dell XPS 15 9500 Core i5 Toshiba KBG40ZNS256G NVMe | HP Spectre X360 15-5ZV31AV Intel SSD 660p 2TB SSDPEKNW020T8 | |
|---|---|---|---|---|---|
| AS SSD | 12% | 5% | -90% | -17% | |
| Seq Read (MB/s) | 3012 | 2654 -12% | 2531 -16% | 1423 -53% | 1220 -59% |
| Seq Write (MB/s) | 1603 | 802 -50% | 2289 43% | 766 -52% | 1152 -28% |
| 4K Read (MB/s) | 49.25 | 42.15 -14% | 15.85 -68% | 42.21 -14% | 52.3 6% |
| 4K Write (MB/s) | 147.8 | 118.2 -20% | 39.88 -73% | 74.8 -49% | 146.6 -1% |
| 4K-64 Read (MB/s) | 911 | 1411 55% | 1267 39% | 973 7% | 652 -28% |
| 4K-64 Write (MB/s) | 702 | 1344 91% | 1749 149% | 218.8 -69% | 847 21% |
| Access Time Read * (ms) | 0.051 | 0.075 -47% | 0.122 -139% | 0.125 -145% | 0.077 -51% |
| Access Time Write * (ms) | 0.07 | 0.035 50% | 0.095 -36% | 0.552 -689% | 0.106 -51% |
| Score Read (Points) | 1261 | 1718 36% | 1536 22% | 1157 -8% | 826 -34% |
| Score Write (Points) | 1010 | 1542 53% | 2018 100% | 370 -63% | 1109 10% |
| Score Total (Points) | 2856 | 4048 42% | 4317 51% | 2094 -27% | 2371 -17% |
| Copy ISO MB/s (MB/s) | 1891 | 1961 4% | 1995 5% | 1151 -39% | 2070 9% |
| Copy Program MB/s (MB/s) | 595 | 480.5 -19% | 584 -2% | 499.4 -16% | 571 -4% |
| Copy Game MB/s (MB/s) | 1282 | 1191 -7% | 1135 -11% | 733 -43% | 1219 -5% |
| CrystalDiskMark 5.2 / 6 | -21% | -23% | -37% | -23% | |
| Write 4K (MB/s) | 202.4 | 162 -20% | 55.5 -73% | 93.3 -54% | 151.5 -25% |
| Read 4K (MB/s) | 45.48 | 46.52 2% | 16.21 -64% | 45.9 1% | 59.3 30% |
| Write Seq (MB/s) | 2136 | 1638 -23% | 1959 -8% | 1211 -43% | 1424 -33% |
| Read Seq (MB/s) | 1843 | 1922 4% | 1763 -4% | 1633 -11% | 1609 -13% |
| Write 4K Q32T1 (MB/s) | 681 | 410.3 -40% | 398.5 -41% | 273.1 -60% | 393.6 -42% |
| Read 4K Q32T1 (MB/s) | 754 | 493.5 -35% | 648 -14% | 356 -53% | 369.4 -51% |
| Write Seq Q32T1 (MB/s) | 2149 | 1085 -50% | 2727 27% | 1198 -44% | 1946 -9% |
| Read Seq Q32T1 (MB/s) | 3473 | 3212 -8% | 3242 -7% | 2269 -35% | 1934 -44% |
| Totaal Gemiddelde (Programma / Instellingen) | -5% /
-0% | -9% /
-5% | -64% /
-71% | -20% /
-19% |
* ... kleiner is beter

Disk Throttling: DiskSpd Read Loop, Queue Depth 8
GPU prestatie
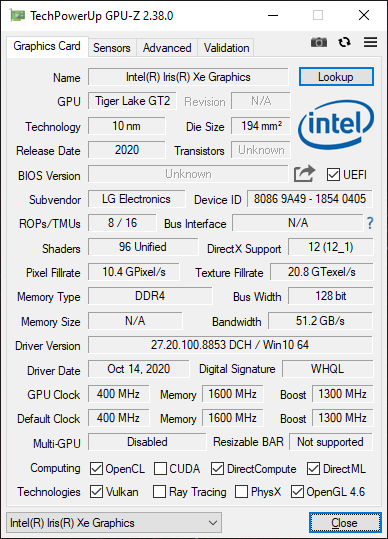
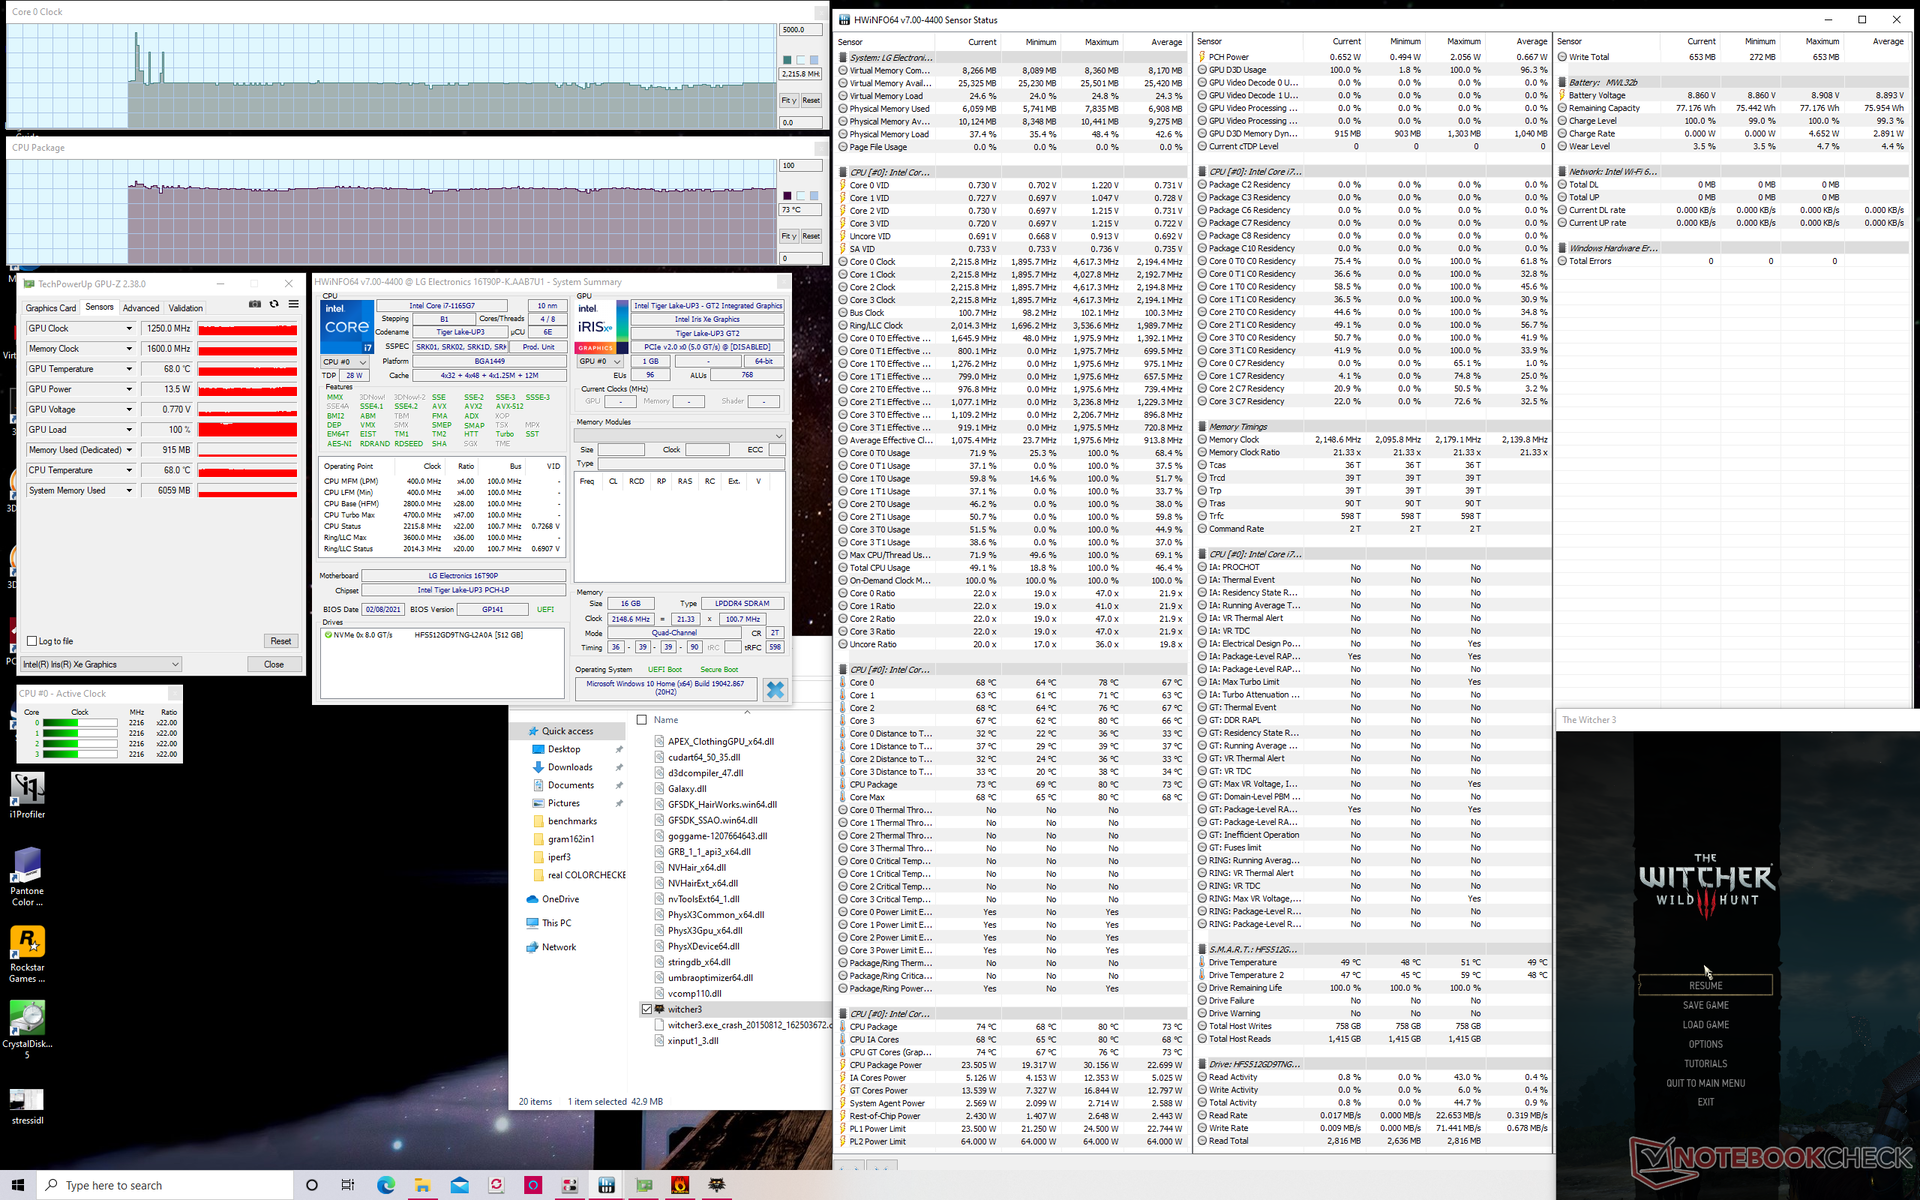
De grafische prestaties zijn waar we ze verwachten te zijn in vergelijking met andere laptops met dezelfde Iris Xe GPU. Ze zijn vooral verbeterd ten opzichte van de ondermaatse Iris Plus Graphics G7 die we ondervonden op de Gram 15 van vorig jaar . Niettemin zijn de prestaties in games misschien niet erg stabiel. Gewoon stationair draaien op Witcher 3, bijvoorbeeld, zou de framerates zien schommelen tussen 53 en 57 FPS, zoals blijkt uit de onderstaande grafiek.

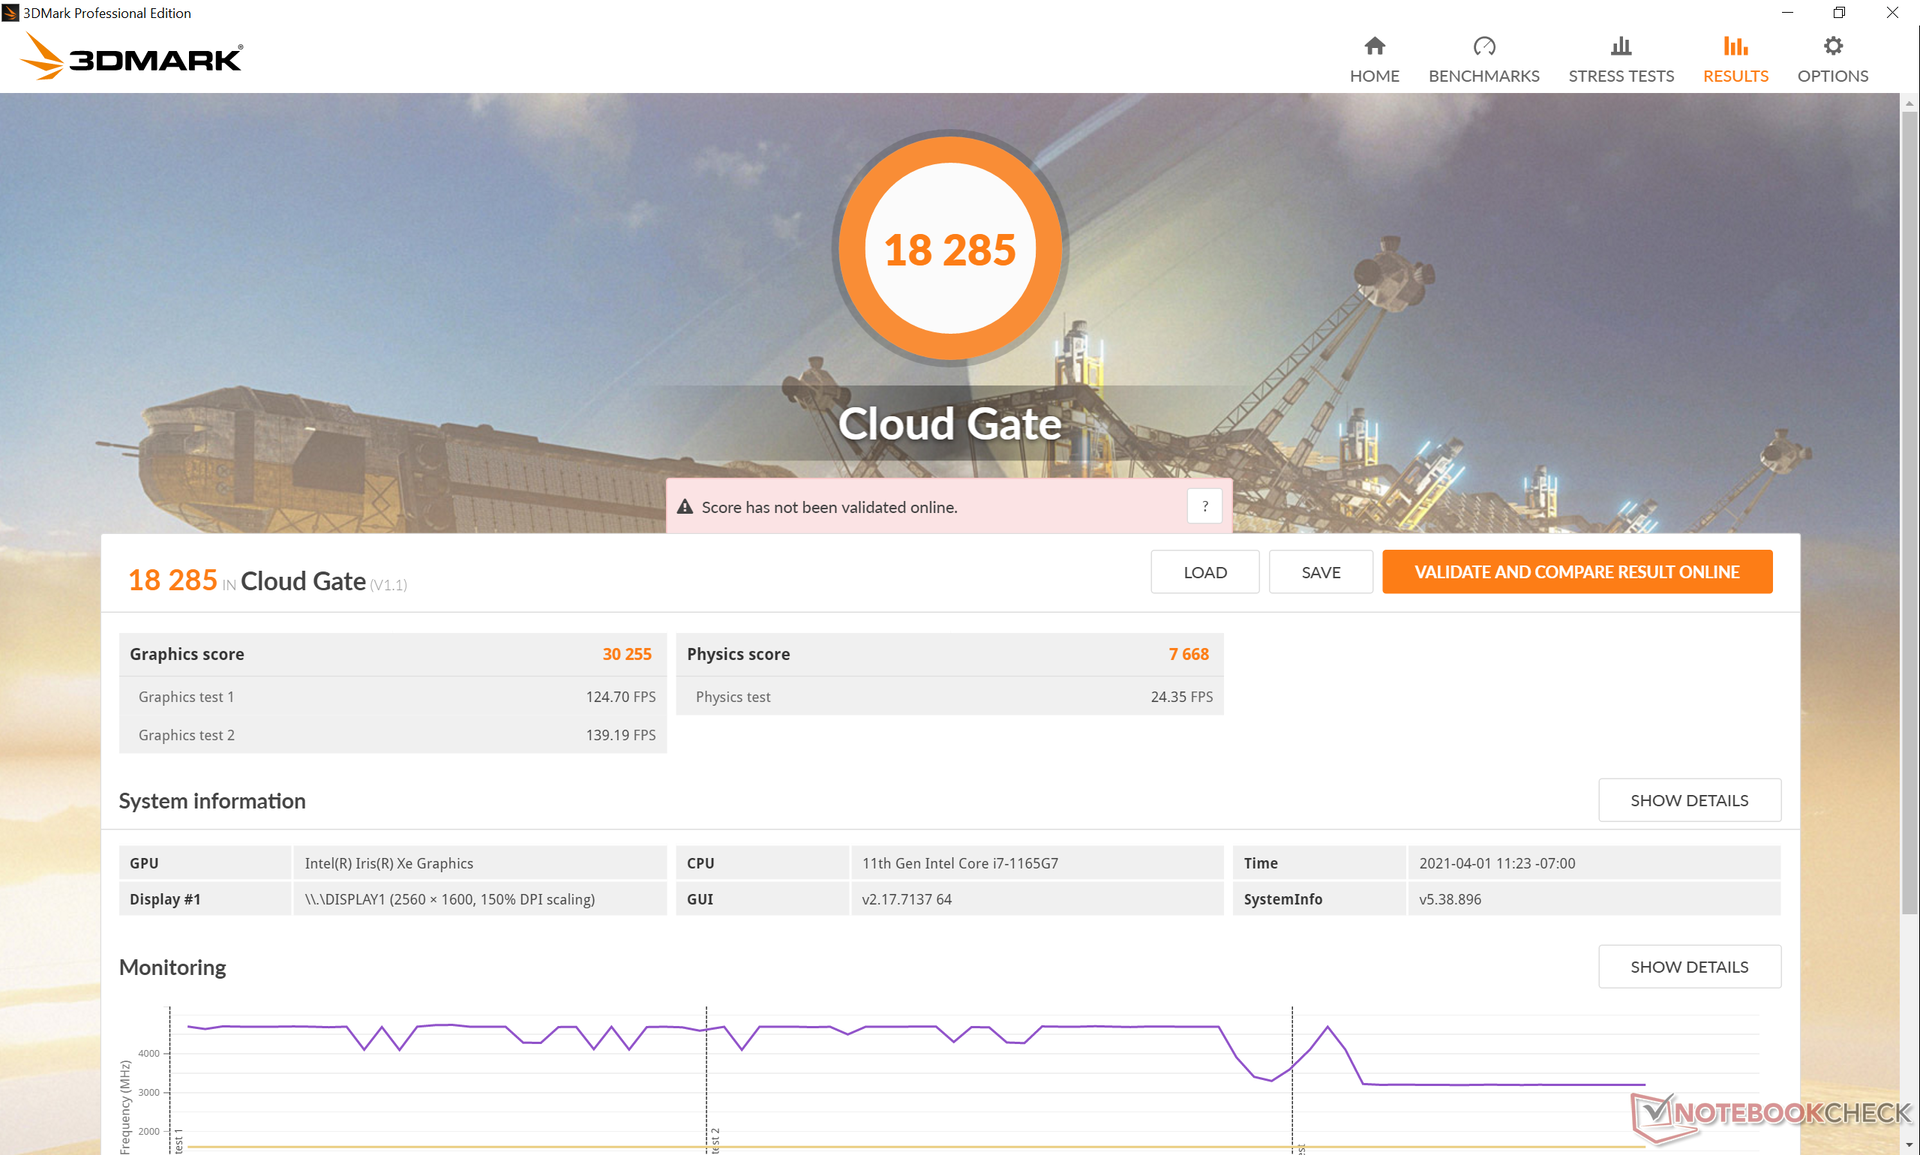
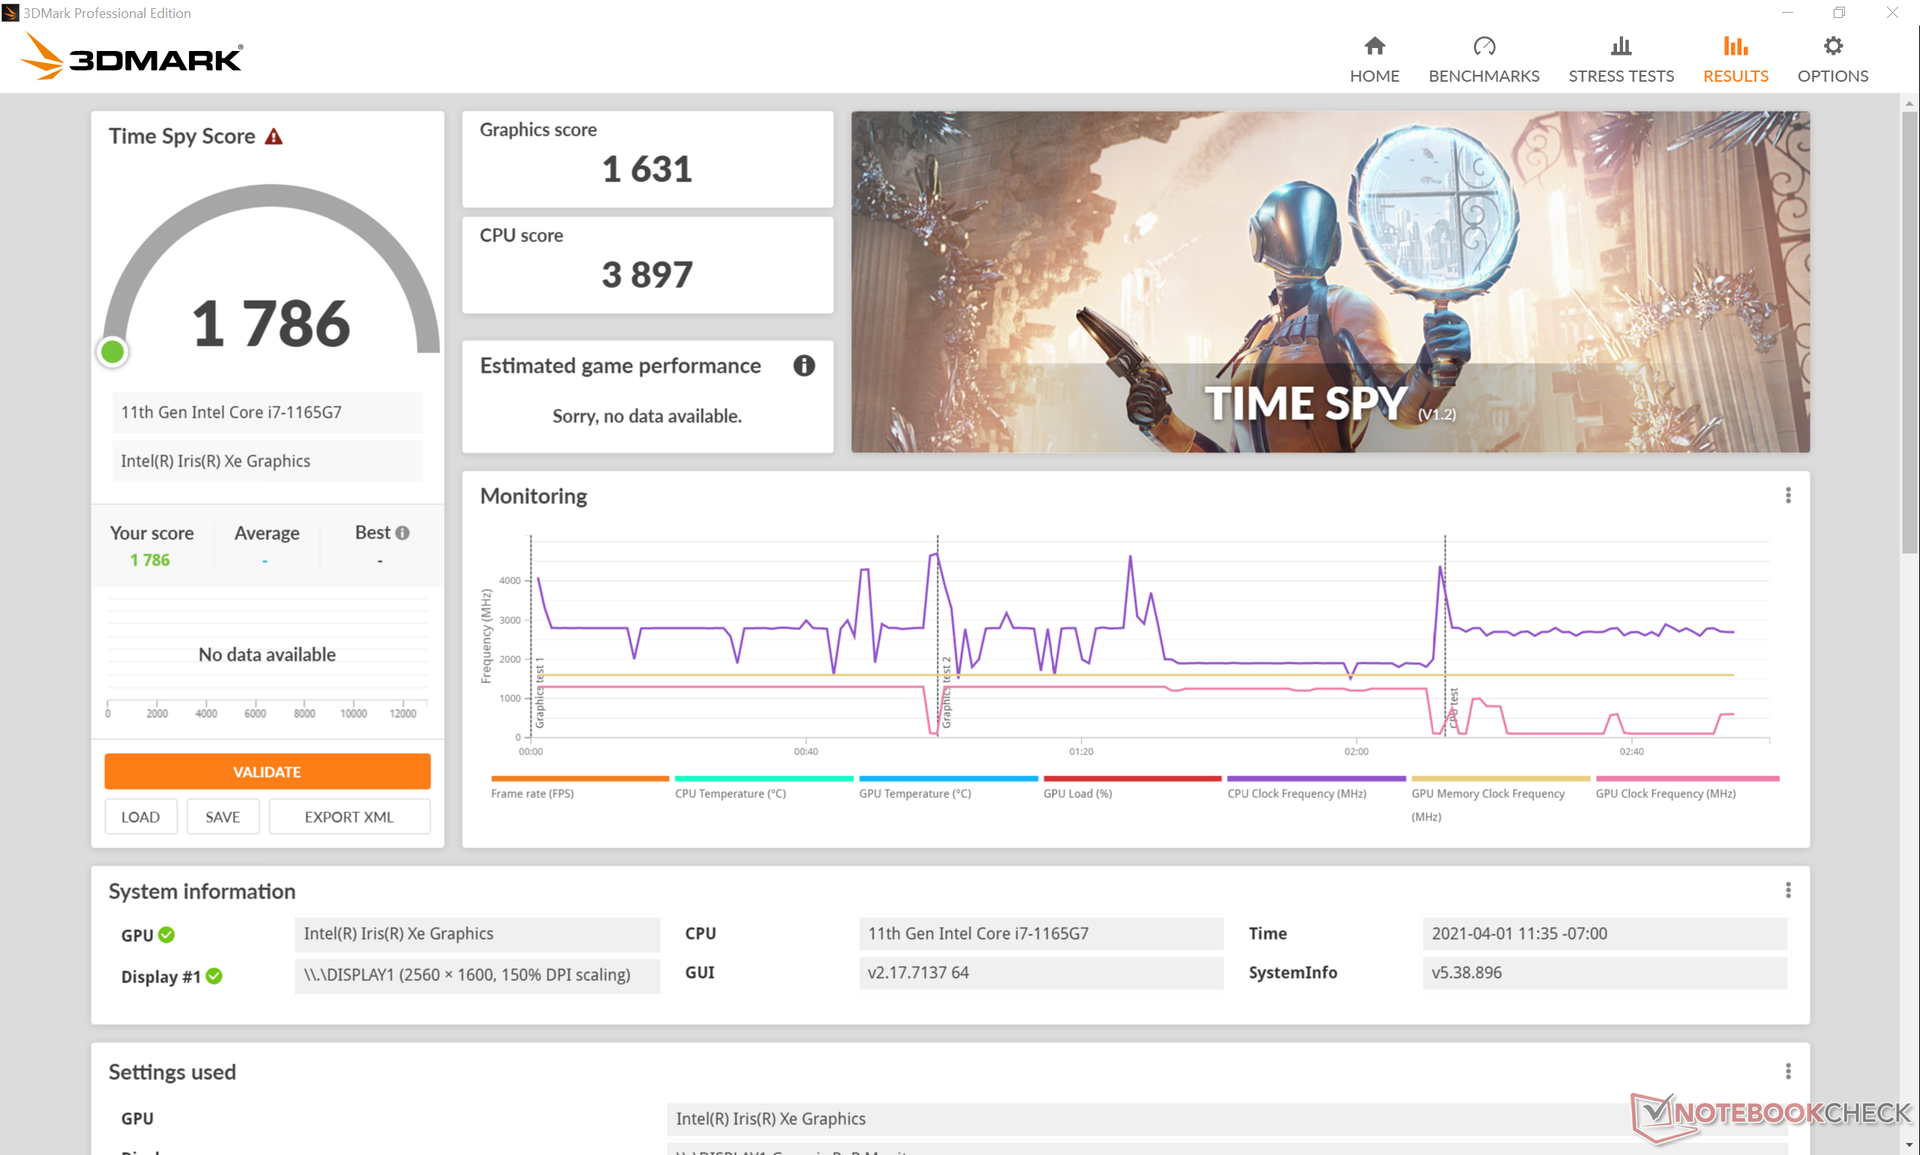
| 3DMark 11 Performance | 7002 punten | |
| 3DMark Cloud Gate Standard Score | 18285 punten | |
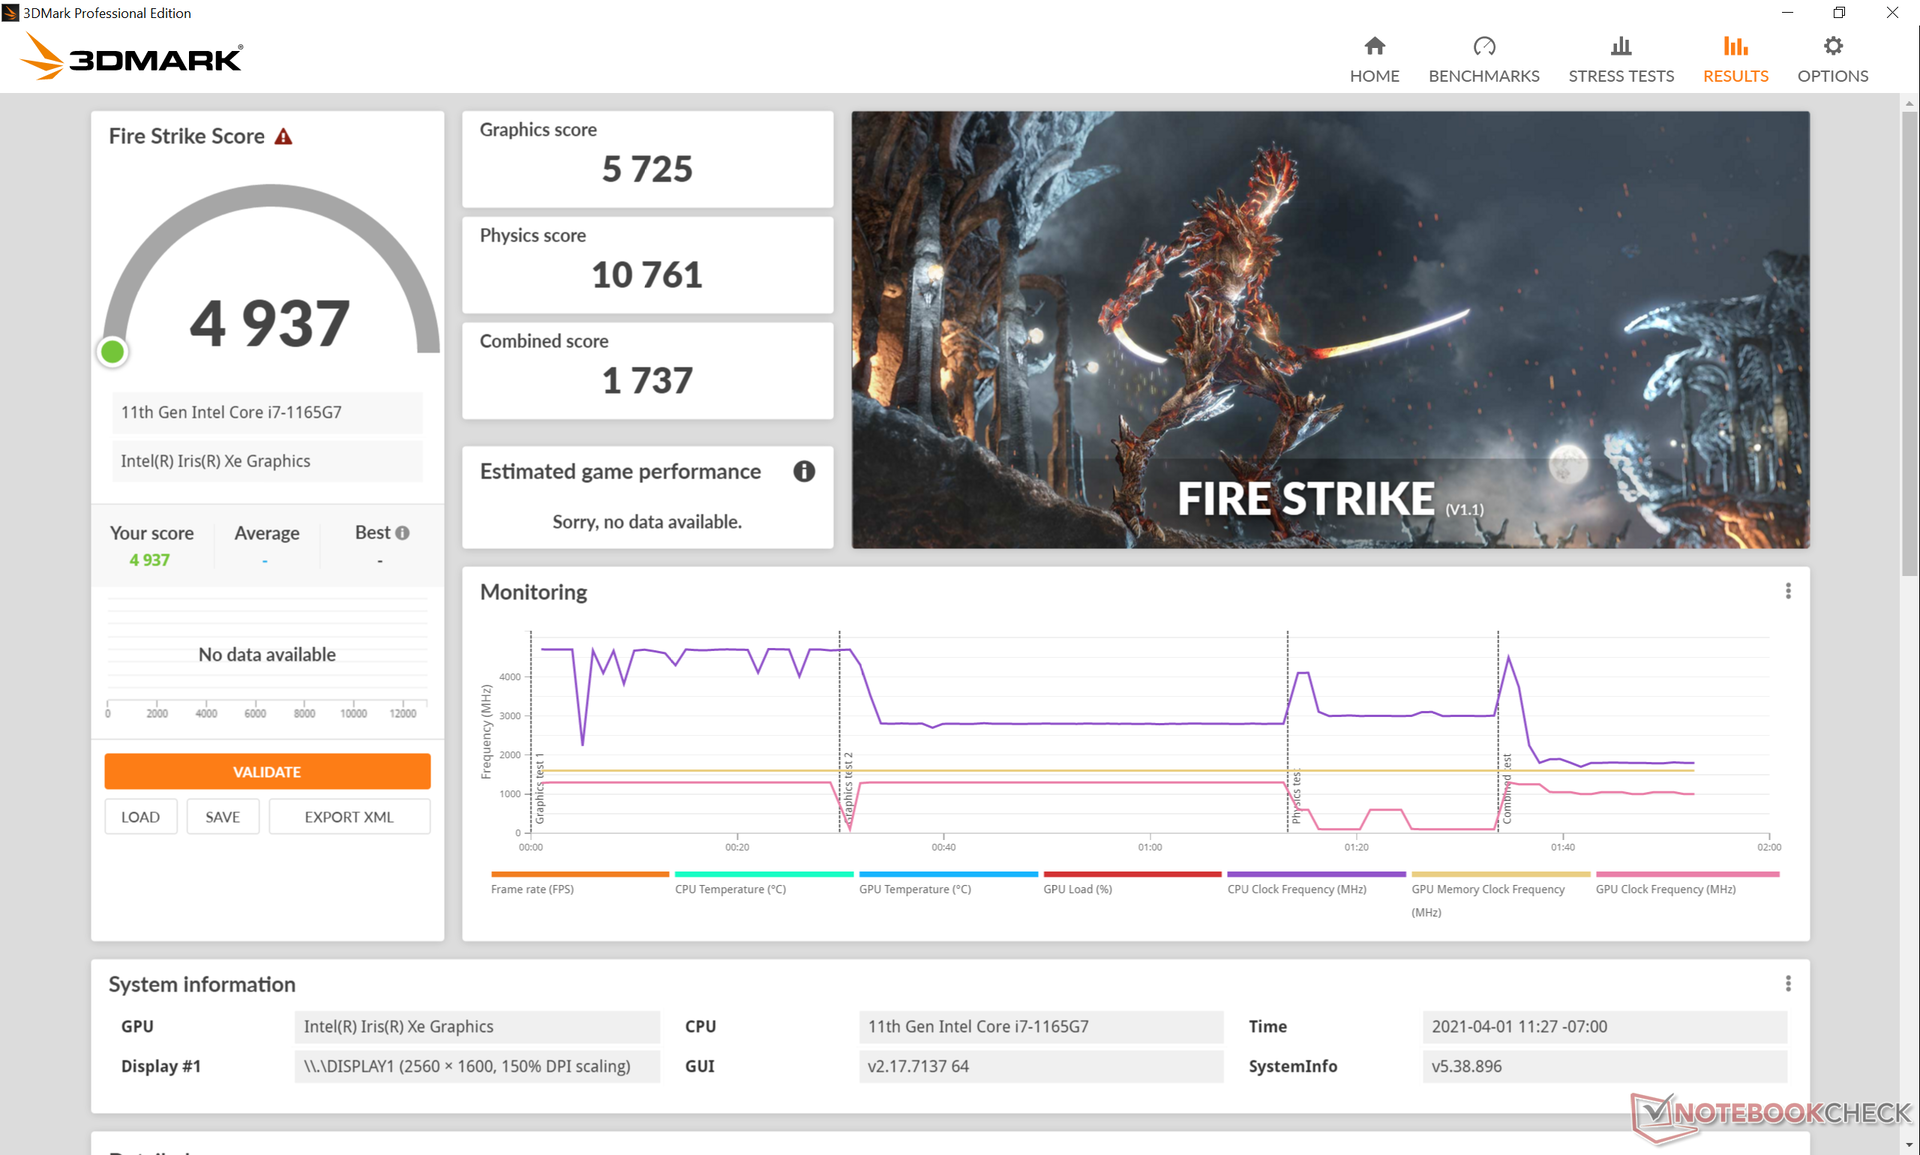
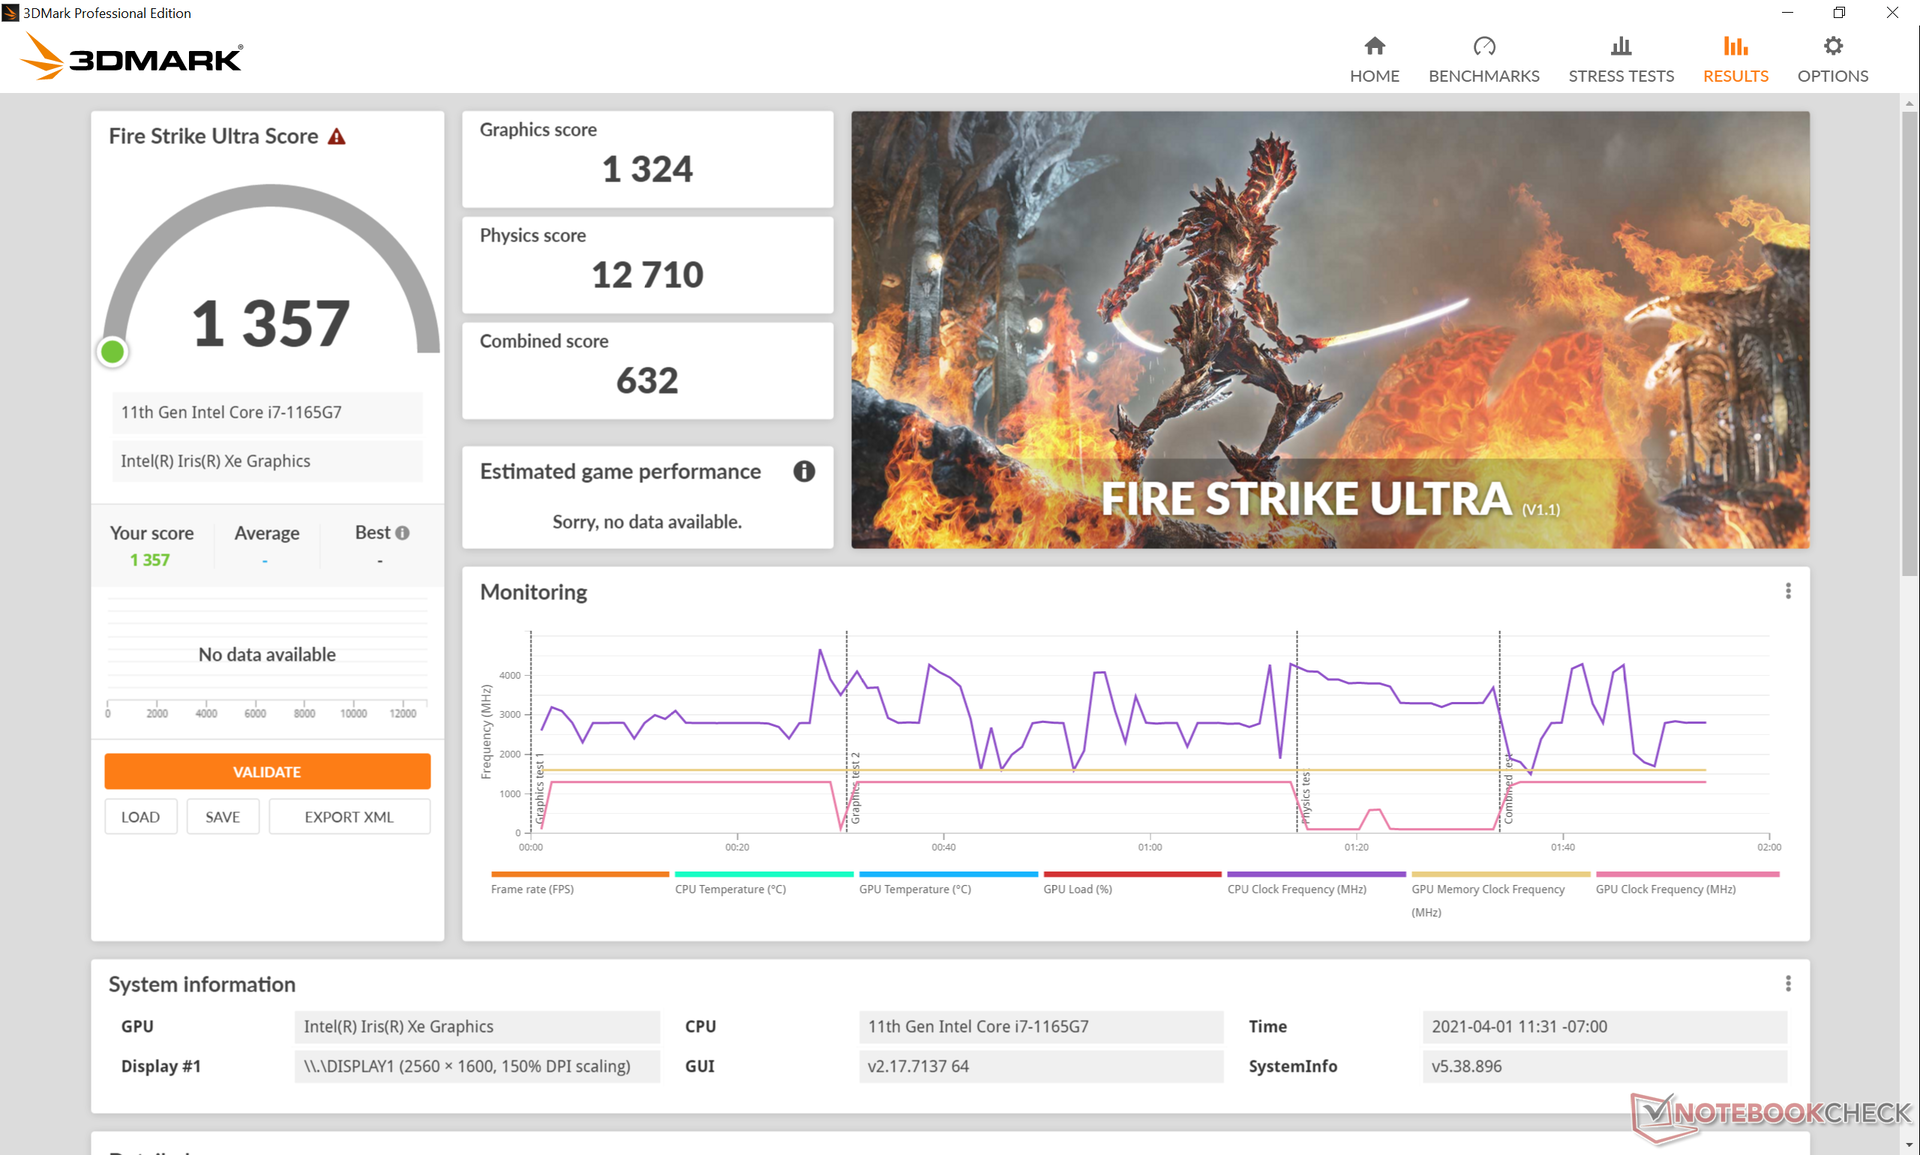
| 3DMark Fire Strike Score | 4937 punten | |
| 3DMark Time Spy Score | 1786 punten | |
Help | ||
| Strange Brigade | |
| 1280x720 lowest AF:1 | |
| LG Gram 16 2-in-1 16T90P | |
| Dell Inspiron 15 7000 7506 2-in-1 Black Edition | |
| Gemiddeld Intel Iris Xe Graphics G7 96EUs (48.5 - 115.1, n=172) | |
| 1920x1080 medium AA:medium AF:4 | |
| LG Gram 16 2-in-1 16T90P | |
| Dell Inspiron 15 7000 7506 2-in-1 Black Edition | |
| Gemiddeld Intel Iris Xe Graphics G7 96EUs (18.2 - 51.4, n=170) | |
| 1920x1080 high AA:high AF:8 | |
| Dell Inspiron 15 7000 7506 2-in-1 Black Edition | |
| LG Gram 16 2-in-1 16T90P | |
| Gemiddeld Intel Iris Xe Graphics G7 96EUs (15.4 - 39.8, n=169) | |
| 1920x1080 ultra AA:ultra AF:16 | |
| Dell Inspiron 15 7000 7506 2-in-1 Black Edition | |
| LG Gram 16 2-in-1 16T90P | |
| Gemiddeld Intel Iris Xe Graphics G7 96EUs (13.2 - 31.7, n=167) | |
| lage | gem. | hoge | ultra | |
|---|---|---|---|---|
| GTA V (2015) | 93.1 | 81.5 | 28 | 12.3 |
| The Witcher 3 (2015) | 97.1 | 60.5 | 44.7 | 15.3 |
| Dota 2 Reborn (2015) | 82.8 | 69 | 50.1 | 40.9 |
| Final Fantasy XV Benchmark (2018) | 36.1 | 20.7 | 16.2 | |
| X-Plane 11.11 (2018) | 43.3 | 35.2 | 35.3 | |
| Strange Brigade (2018) | 97.8 | 41 | 32 | 25.8 |
Emissions
Systeemgeluid
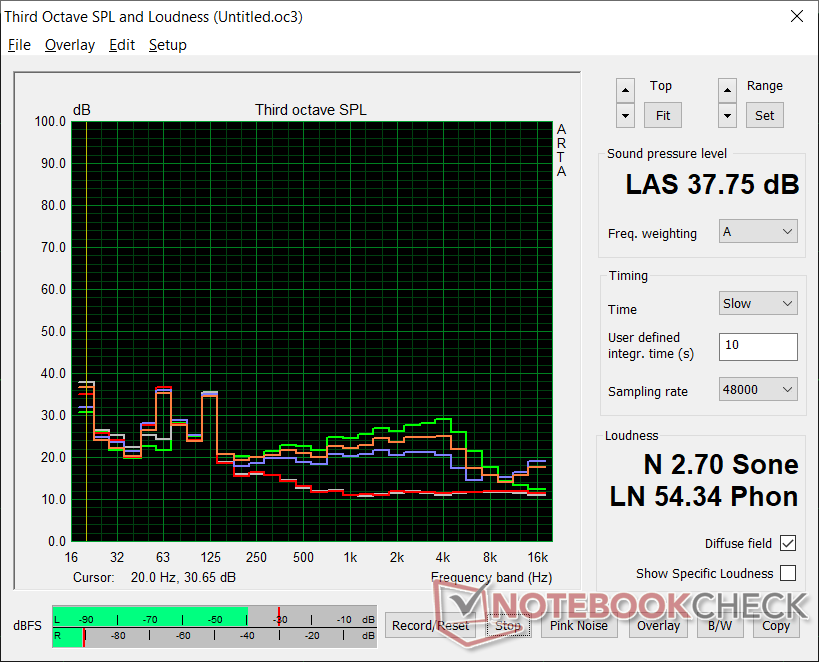
De enkele interne ventilator draait stationair wanneer het systeem niet actief is of zeer weinig wordt belast. Na wat browsen of video streamen kan het ventilatorgeluid oplopen tot 29,2 dB(A), wat nog steeds stil genoeg is om meestal niet op te vallen. Hogere belastingen zoals games kunnen een maximaal ventilatorgeluid van 37,8 dB(A) veroorzaken, wat nog steeds stiller zou zijn dan de meeste andere Ultrabooks onder vergelijkbare omstandigheden.
Ons testexemplaar vertoont een licht elektronisch geluid of spoelgejank dat alleen merkbaar is wanneer een oor in de buurt van de toetsen van het toetsenbord wordt geplaatst.
| LG Gram 16 2-in-1 16T90P Iris Xe G7 96EUs, i7-1165G7, SK Hynix PC401 512GB M.2 (HFS512GD9TNG) | Honor MagicBook Pro 10210U GeForce MX350, i5-10210U, Toshiba XG6 KXG60ZNV512G | Apple MacBook Pro 16 2019 i9 5500M Radeon Pro 5500M, i9-9880H, Apple SSD AP1024 7171 | Dell XPS 15 9500 Core i5 UHD Graphics 630, i5-10300H, Toshiba KBG40ZNS256G NVMe | HP Spectre X360 15-5ZV31AV GeForce MX250, i7-10510U, Intel SSD 660p 2TB SSDPEKNW020T8 | |
|---|---|---|---|---|---|
| Noise | -7% | -23% | -7% | -14% | |
| uit / omgeving * (dB) | 25.1 | 24 4% | 29.8 -19% | 28 -12% | 30.1 -20% |
| Idle Minimum * (dB) | 25.2 | 24 5% | 29.9 -19% | 28 -11% | 30.1 -19% |
| Idle Average * (dB) | 25.2 | 25 1% | 29.9 -19% | 28 -11% | 30.1 -19% |
| Idle Maximum * (dB) | 25.2 | 27 -7% | 29.9 -19% | 28 -11% | 30.1 -19% |
| Load Average * (dB) | 32.1 | 39 -21% | 43 -34% | 28 13% | 30.1 6% |
| Witcher 3 ultra * (dB) | 34.9 | 40 -15% | 45.4 -30% | 39.7 -14% | |
| Load Maximum * (dB) | 37.8 | 44 -16% | 46.1 -22% | 41.9 -11% | 42 -11% |
* ... kleiner is beter
Geluidsniveau
| Onbelast |
| 25.2 / 25.2 / 25.2 dB (A) |
| Belasting |
| 32.1 / 37.8 dB (A) |
 | ||
30 dB stil 40 dB(A) hoorbaar 50 dB(A) luid |
||
min: | ||
Temperatuur
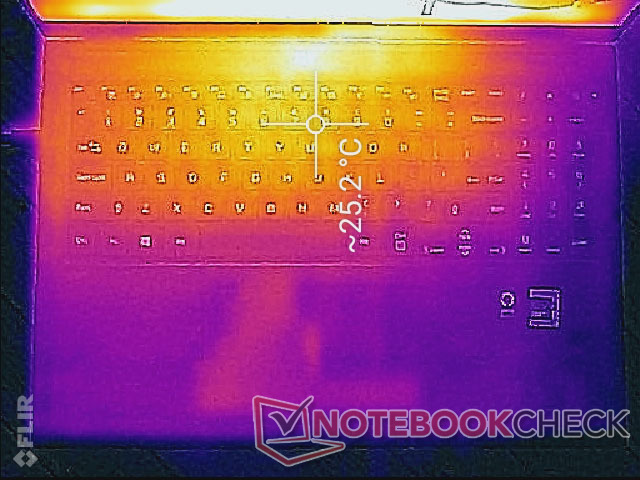
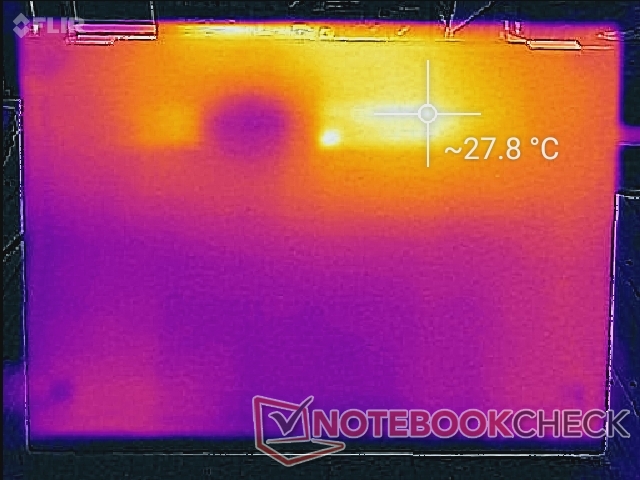
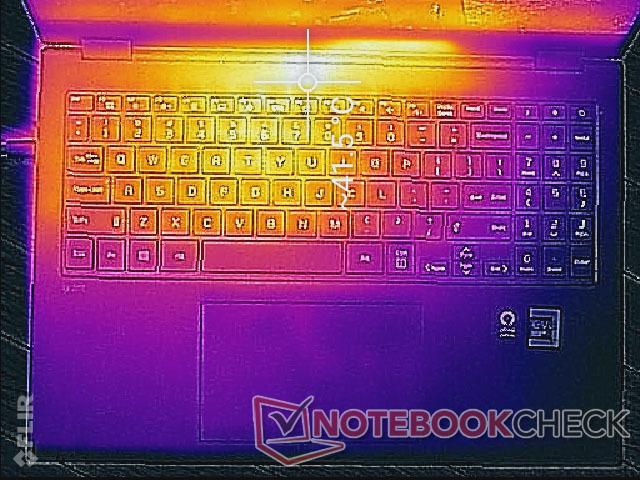
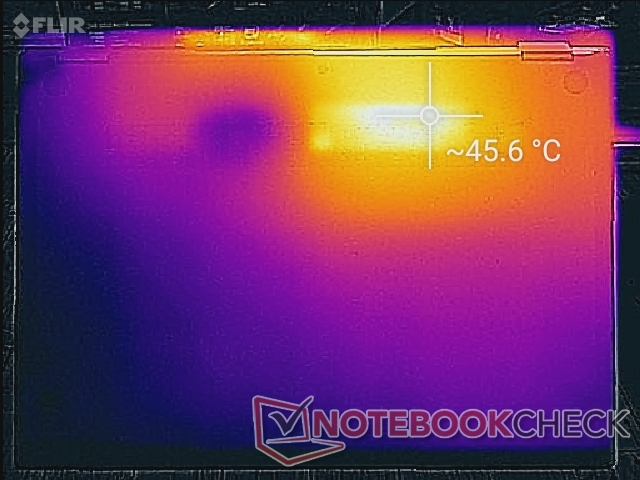
Oppervlaktetemperaturen zijn geen probleem, ongeacht de belasting. Hete plekken kunnen tot 41 C tot 46 C warm worden tijdens het gamen, vergelijkbaar met wat we registreerden op de Dell XPS 15 2-in-1, maar deze gebieden bevinden zich meer naar de achterkant van het chassis, verder weg van de palmsteunen en het toetsenbord.
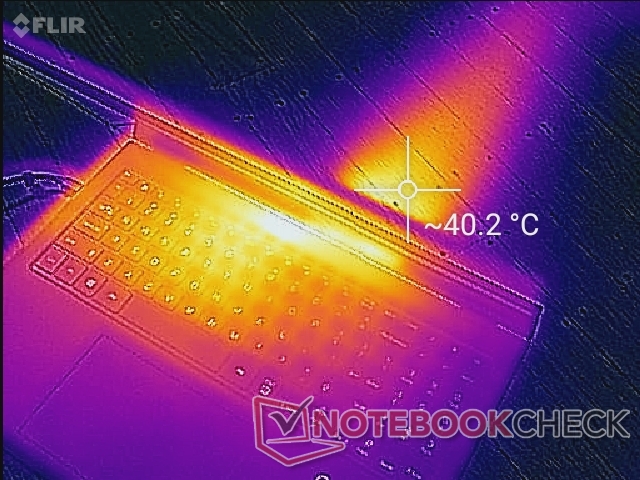
(±) De maximumtemperatuur aan de bovenzijde bedraagt 42.2 °C / 108 F, vergeleken met het gemiddelde van 35.4 °C / 96 F, variërend van 19.6 tot 60 °C voor de klasse Convertible.
(-) De bodem warmt op tot een maximum van 46.2 °C / 115 F, vergeleken met een gemiddelde van 36.9 °C / 98 F
(+) Bij onbelast gebruik bedraagt de gemiddelde temperatuur voor de bovenzijde 23.9 °C / 75 F, vergeleken met het apparaatgemiddelde van 30.3 °C / 87 F.
(+) De palmsteunen en het touchpad zijn met een maximum van ###max## °C / 77.4 F koeler dan de huidtemperatuur en voelen daarom koel aan.
(+) De gemiddelde temperatuur van de handpalmsteun van soortgelijke toestellen bedroeg 28 °C / 82.4 F (+2.8 °C / 5 F).
Stresstest
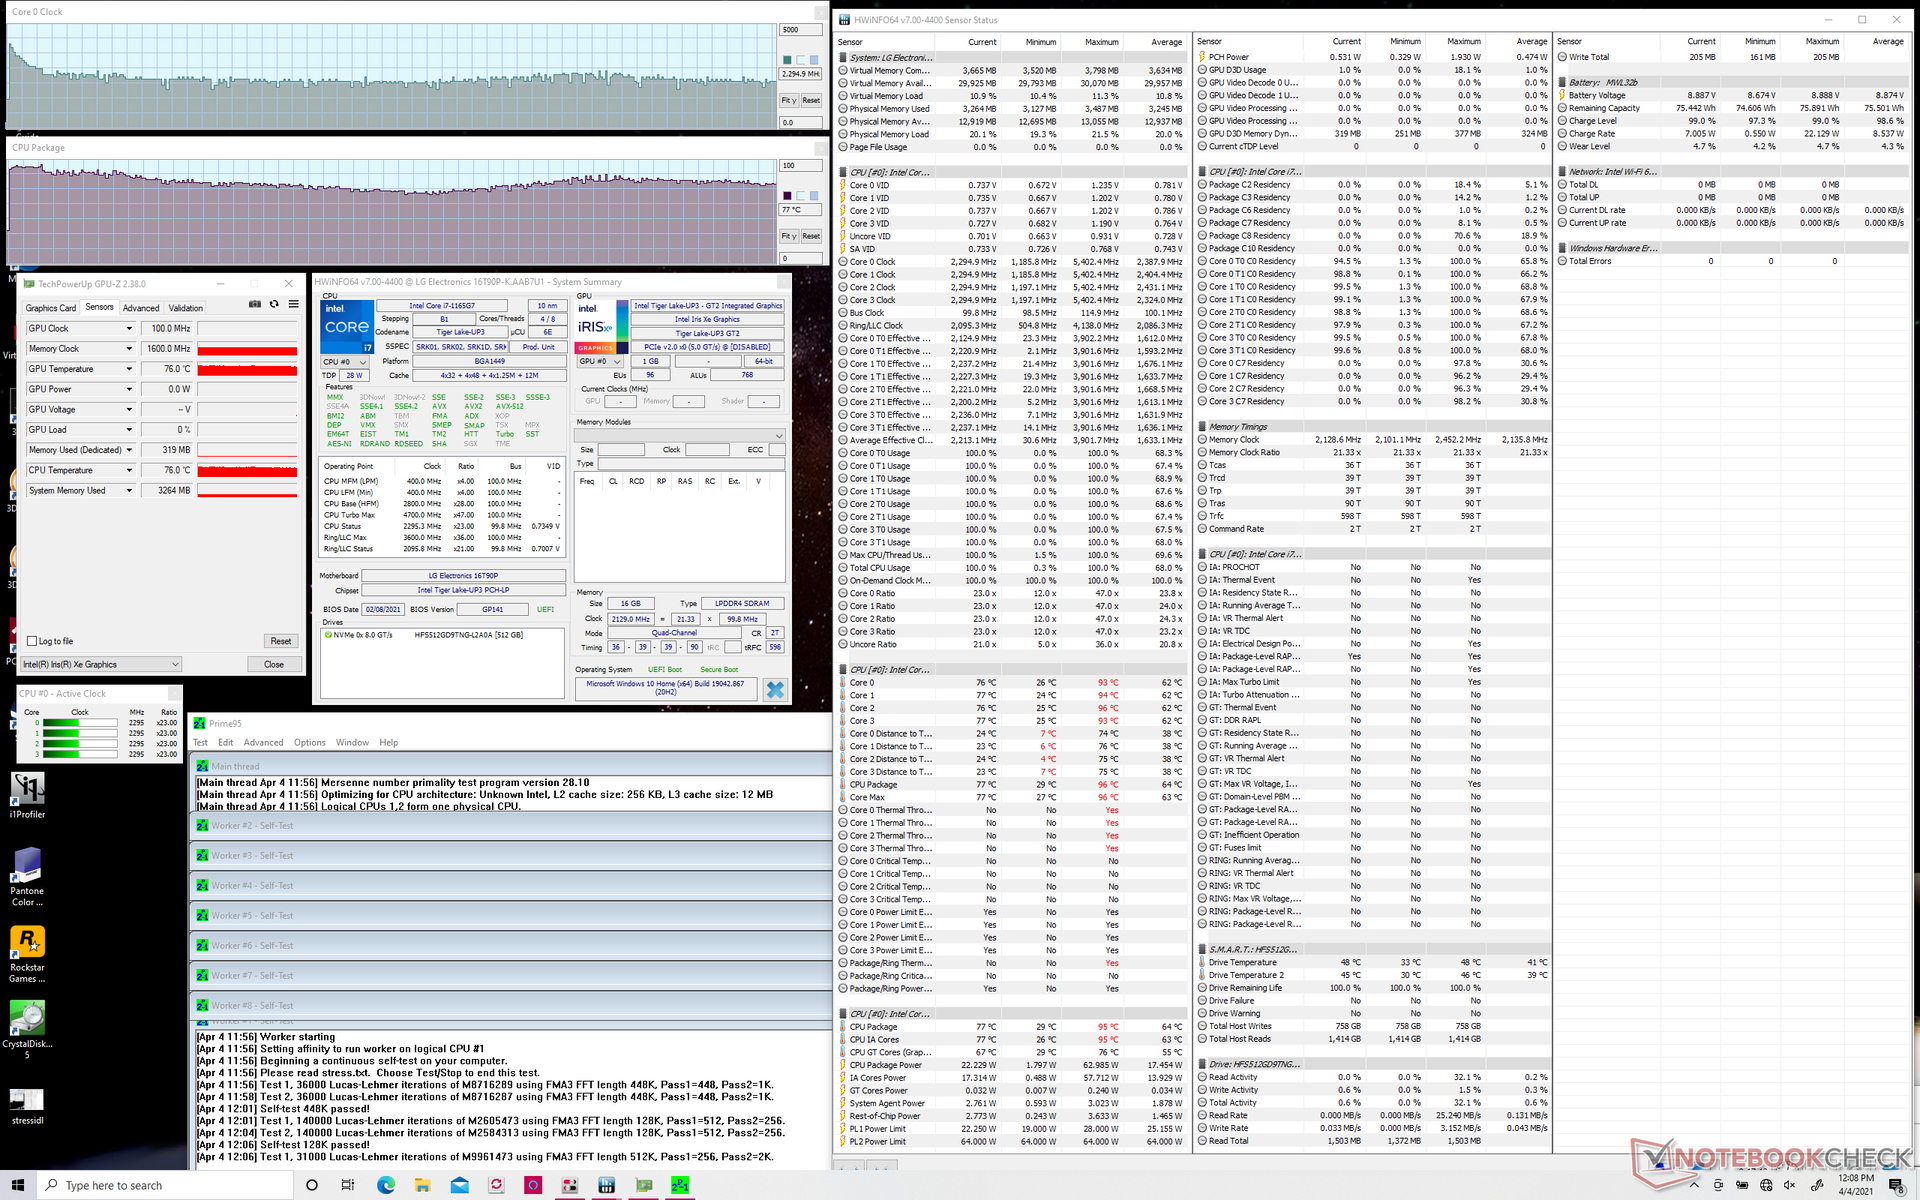
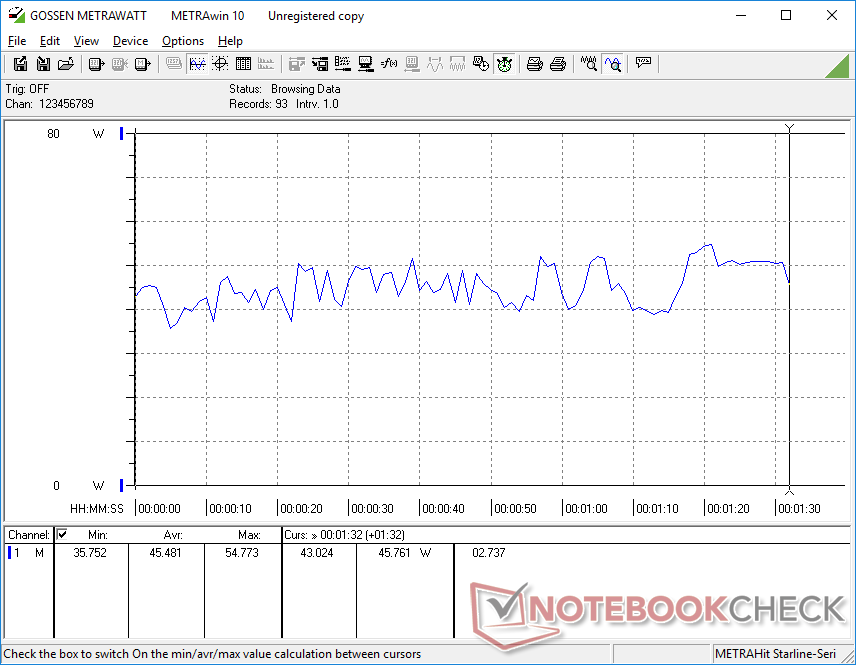
Het draaien van Prime95 laat precies zien hoe slecht de CPU Turbo Boost duurzaamheid kan zijn op de Gram 16. De kloksnelheden worden opgevoerd tot 4.1 GHz gedurende slechts de eerste drie seconden voordat de 96 C wordt bereikt. Daarna dalen de kloksnelheden gestaag en stabiliseren zich op 1.8 GHz tot 2.4 GHz om een koelere kerntemperatuur van ongeveer 77 C te behouden. De beperkte capaciteit van de koeloplossing lijkt volledig verantwoordelijk te zijn voor de zwakke Turbo Boost prestaties.
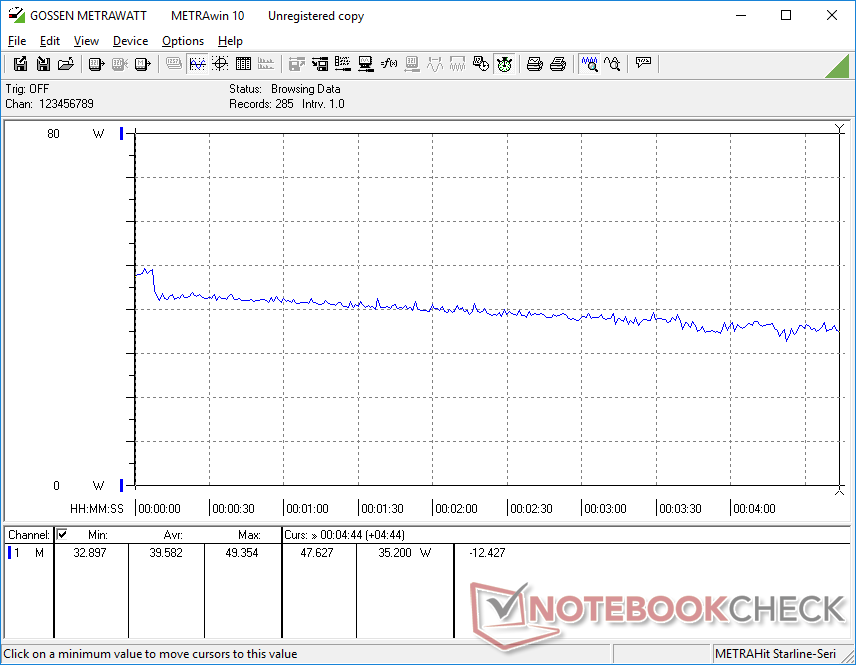
Het draaien van Witcher 3 toont relatief stabiele CPU en GPU kloksnelheden, ondanks de fluctuaties in framerates zoals hierboven vermeld. Het midden 70 C bereik lijkt de sweet spot te zijn die LG heeft ingesteld voor deze laptop bij het uitvoeren van veeleisende belastingen
Het draaien op batterijen resulteert in beperkte grafische prestaties. Een 3DMark 11 test op batterijvoeding zou een Physics en Graphics score opleveren van respectievelijk 10638 en 6355 punten, vergeleken met 9445 en 6939 punten op netvoeding.
| CPUklok (GHz) GPUklok (MHz) GemiddeldeCPU temperatuur (°C) |
| Systeem Idle |
| Prime95 Stress 1.8 - 2.4 |
| Prime95 + FurMark Stress 1.4 - 1.6 850 850 70 |
| Witcher 3 Stress |
Sprekers


LG Gram 16 2-in-1 16T90P audioanalyse
(±) | luidspreker luidheid is gemiddeld maar goed (79.1 dB)
Bas 100 - 315 Hz
(±) | verminderde zeebaars - gemiddeld 12.8% lager dan de mediaan
(±) | lineariteit van de lage tonen is gemiddeld (11.2% delta ten opzichte van de vorige frequentie)
Midden 400 - 2000 Hz
(±) | hogere middens - gemiddeld 5.2% hoger dan de mediaan
(+) | de middentonen zijn lineair (4.5% delta ten opzichte van de vorige frequentie)
Hoog 2 - 16 kHz
(+) | evenwichtige hoogtepunten - slechts 2.5% verwijderd van de mediaan
(+) | de hoge tonen zijn lineair (4.2% delta naar de vorige frequentie)
Algemeen 100 - 16.000 Hz
(±) | lineariteit van het totale geluid is gemiddeld (15.2% verschil met de mediaan)
Vergeleken met dezelfde klasse
» 24% van alle geteste apparaten in deze klasse waren beter, 5% vergelijkbaar, 71% slechter
» De beste had een delta van 6%, het gemiddelde was 20%, de slechtste was 57%
Vergeleken met alle geteste toestellen
» 21% van alle geteste apparaten waren beter, 4% gelijk, 74% slechter
» De beste had een delta van 4%, het gemiddelde was 24%, de slechtste was 134%
Apple MacBook 12 (Early 2016) 1.1 GHz audioanalyse
(+) | luidsprekers kunnen relatief luid spelen (83.6 dB)
Bas 100 - 315 Hz
(±) | verminderde zeebaars - gemiddeld 11.3% lager dan de mediaan
(±) | lineariteit van de lage tonen is gemiddeld (14.2% delta ten opzichte van de vorige frequentie)
Midden 400 - 2000 Hz
(+) | evenwichtige middens - slechts 2.4% verwijderd van de mediaan
(+) | de middentonen zijn lineair (5.5% delta ten opzichte van de vorige frequentie)
Hoog 2 - 16 kHz
(+) | evenwichtige hoogtepunten - slechts 2% verwijderd van de mediaan
(+) | de hoge tonen zijn lineair (4.5% delta naar de vorige frequentie)
Algemeen 100 - 16.000 Hz
(+) | het totale geluid is lineair (10.2% verschil met de mediaan)
Vergeleken met dezelfde klasse
» 7% van alle geteste apparaten in deze klasse waren beter, 2% vergelijkbaar, 91% slechter
» De beste had een delta van 5%, het gemiddelde was 18%, de slechtste was 53%
Vergeleken met alle geteste toestellen
» 5% van alle geteste apparaten waren beter, 1% gelijk, 94% slechter
» De beste had een delta van 4%, het gemiddelde was 24%, de slechtste was 134%
Energy Management
Stroomverbruik
Stationair draaien op een desktop verbruikt tussen de 4 W en 11 W, afhankelijk van de helderheidsinstelling en het stroomprofiel. Gaming verbruikt ongeveer 39 W tot 46 W en is daarmee veel lager dan andere 15.6-inch laptops uitgerust met GeForce MX graphics, maar nog steeds hoger dan de langzamere Ice Lake-aangedreven Gram 15
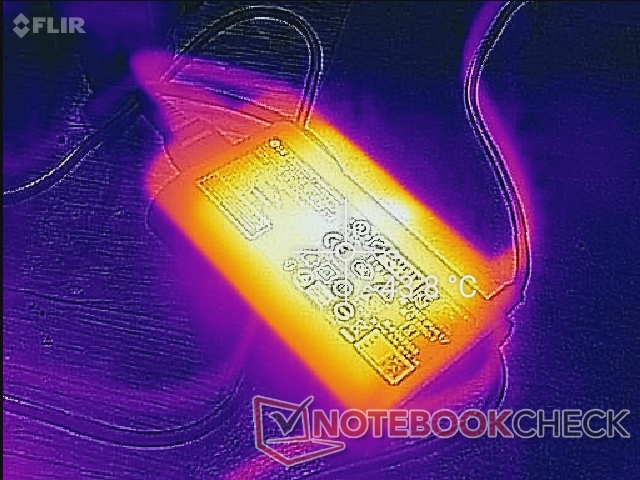
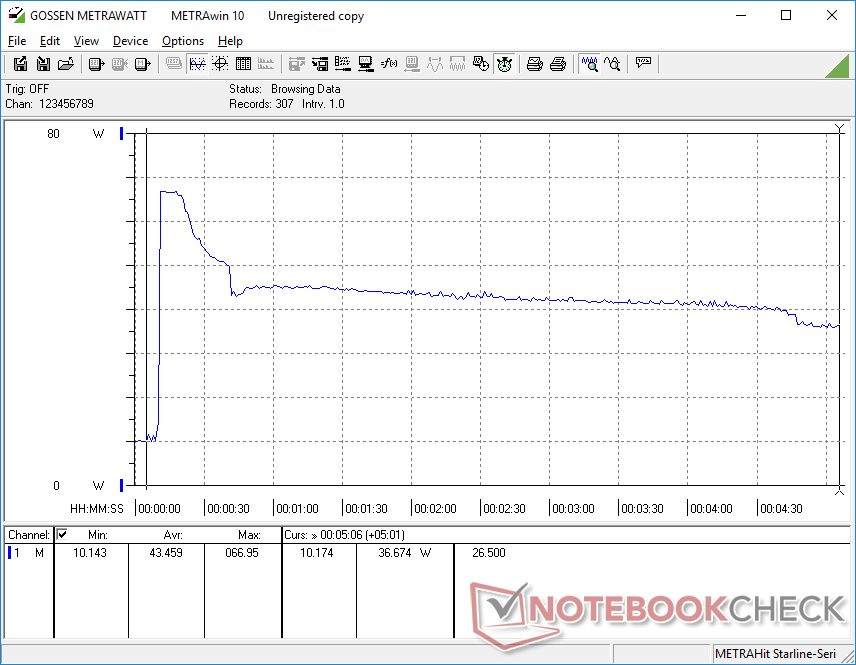
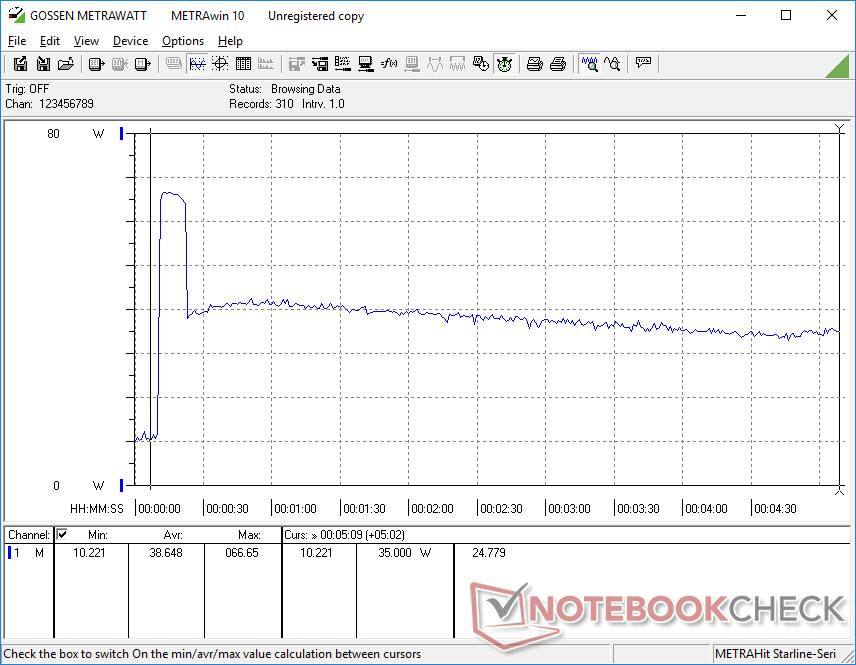
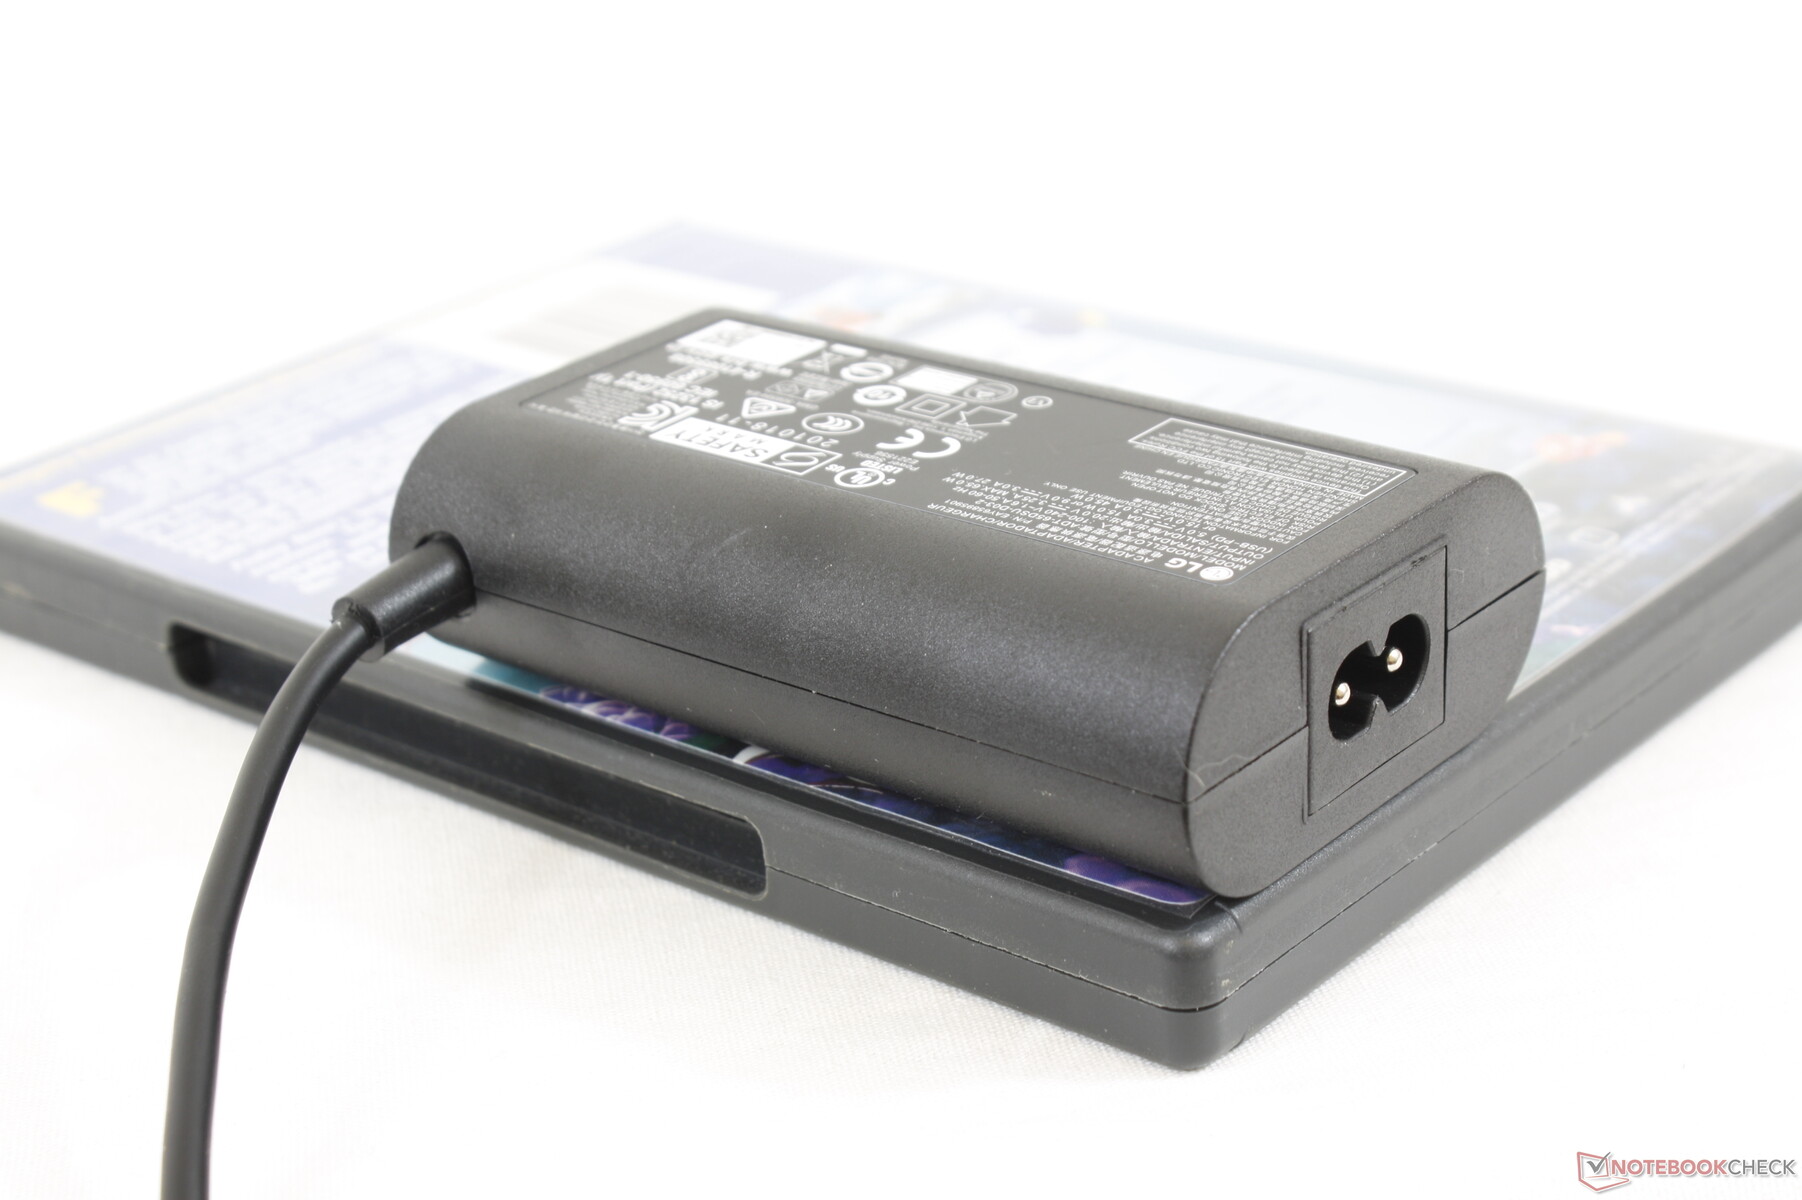
We zijn in staat om een maximum verbruik van 67 W te registreren van de kleine (~9,8 x 8 x 2,7 cm) 65 W AC adapter wanneer onder extreme Prime95 stress. Deze snelheid houdt slechts enkele seconden aan zoals blijkt uit de grafieken hieronder als gevolg van thermische beperkingen.
| Uit / Standby | |
| Inactief | |
| Belasting |
|
Key:
min: | |
| LG Gram 16 2-in-1 16T90P i7-1165G7, Iris Xe G7 96EUs, SK Hynix PC401 512GB M.2 (HFS512GD9TNG), IPS, 2560x1600, 16" | Honor MagicBook Pro 10210U i5-10210U, GeForce MX350, Toshiba XG6 KXG60ZNV512G, IPS, 1920x1080, 16.1" | Apple MacBook Pro 16 2019 i9 5500M i9-9880H, Radeon Pro 5500M, Apple SSD AP1024 7171, IPS, 3072x1920, 16" | Dell XPS 15 9500 Core i5 i5-10300H, UHD Graphics 630, Toshiba KBG40ZNS256G NVMe, IPS, 1920x1200, 15.6" | HP Spectre X360 15-5ZV31AV i7-10510U, GeForce MX250, Intel SSD 660p 2TB SSDPEKNW020T8, IPS, 3840x2160, 15.6" | Asus ZenBook UX535-M01440 i7-10750H, GeForce GTX 1650 Ti Max-Q, WDC PC SN730 SDBPNTY-1T00, IPS, 3840x2160, 15.6" | |
|---|---|---|---|---|---|---|
| Power Consumption | -32% | -67% | 8% | -21% | -48% | |
| Idle Minimum * (Watt) | 4.4 | 7 -59% | 3.7 16% | 2.9 34% | 5.2 -18% | 4.4 -0% |
| Idle Average * (Watt) | 9 | 10 -11% | 12.1 -34% | 7.6 16% | 8.5 6% | 9.8 -9% |
| Idle Maximum * (Watt) | 10.1 | 14 -39% | 17 -68% | 8 21% | 8.7 14% | 14.5 -44% |
| Load Average * (Watt) | 45.5 | 63 -38% | 91.5 -101% | 41.7 8% | 65.6 -44% | 83 -82% |
| Witcher 3 ultra * (Watt) | 39.6 | 59 -49% | 103 -160% | 56.5 -43% | 67 -69% | |
| Load Maximum * (Watt) | 67 | 65 3% | 102.3 -53% | 94.8 -41% | 92.4 -38% | 123 -84% |
* ... kleiner is beter
Levensduur batterij
De grote batterijcapaciteit van 80 Wh en de energiezuinige Tiger Lake-U CPU leiden natuurlijk tot zeer lange runtijden. We zijn in staat om meer dan 15 uur van real-world WLAN gebruik bij 150 nits helderheid te registreren, wat enkele uren langer is dan de meeste andere 15,6-inch laptops. Het opladen van leeg naar volledig is echter iets langzamer met bijna 2,5 uur.
| LG Gram 16 2-in-1 16T90P i7-1165G7, Iris Xe G7 96EUs, 80 Wh | Honor MagicBook Pro 10210U i5-10210U, GeForce MX350, 56 Wh | Apple MacBook Pro 16 2019 i9 5500M i9-9880H, Radeon Pro 5500M, 99.8 Wh | Dell XPS 15 9500 Core i5 i5-10300H, UHD Graphics 630, 56 Wh | HP Spectre X360 15-5ZV31AV i7-10510U, GeForce MX250, 84 Wh | Asus ZenBook UX535-M01440 i7-10750H, GeForce GTX 1650 Ti Max-Q, 96 Wh | |
|---|---|---|---|---|---|---|
| Batterijduur | -29% | -43% | -30% | -14% | -32% | |
| Reader / Idle (h) | 29.6 | 24.7 -17% | 26.4 -11% | 22.6 -24% | 18.3 -38% | |
| WiFi v1.3 (h) | 15.7 | 10.1 -36% | 12 -24% | 9.3 -41% | 10.8 -31% | 10.1 -36% |
| Load (h) | 2.6 | 1.7 -35% | 1 -62% | 1.6 -38% | 2.9 12% | 2 -23% |
| Witcher 3 ultra (h) | 0.9 |
Pro
Contra
Uitspraak
Hoewel converteerbare laptops met grote beeldschermen niets nieuws zijn, staan ze niet bepaald bekend als erg licht. De LG Gram 16 convertible daagt deze perceptie uit door niet alleen een van de lichtste 16-inch laptops op de markt te zijn, maar ook door lichter te zijn dan veel laptops met kleinere 15,6-inch displays. Dit merkbare gewichtsvoordeel is de belangrijkste troef voor de Gram 16 convertible.
De LG Gram 16 2-in-1 is zowel stil als ongelooflijk licht voor zijn categorie. Echter, ruwe CPU prestaties lijden, het scherm is gevoelig voor schittering, en de scharnieren kon zeker strakker zijn geweest.
Aanzienlijk besparen op gewicht heeft zo zijn nadelen. De Gram 16 convertible lijdt aan veel van dezelfde nadelen als de Gram 13, Gram 14, Gram 15, en Gram 17 met inbegrip van een zwakker en flexibeler chassis dan de HP Spectre x360 15, meer moeilijk te onderhouden, en onder het gemiddelde processor prestaties. LG blijft gebruik maken van kleine koeloplossingen met korte heat pipes die het Turbo Boost potentieel van de CPU ernstig beperken. De zwakke scharnieren zijn vooral teleurstellend omdat ze niet het gevoel geven van een lange levensduur die we graag zouden willen hebben voor een laptop van $1500
De rest van de laptop wordt ondersteund door de grote batterij, scherpe en levendige kleuren, Thunderbolt 4 ondersteuning, en een uitstekend toetsenbord. Als je echter geen bezwaar hebt tegen een zwaardere convertible, dan zul je in plaats daarvan zeker veel meer prestaties uit een HP Spectre x360 of Asus ZenBook convertible halen.
Prijs en beschikbaarheid
Op het moment van schrijven is de beschikbaarheid beperkt. Best Buy verkoopt een aantal configuraties vanaf $1749 USD.
LG Gram 16 2-in-1 16T90P
- 05-04-2021 v7 (old)
Allen Ngo
Price comparison

