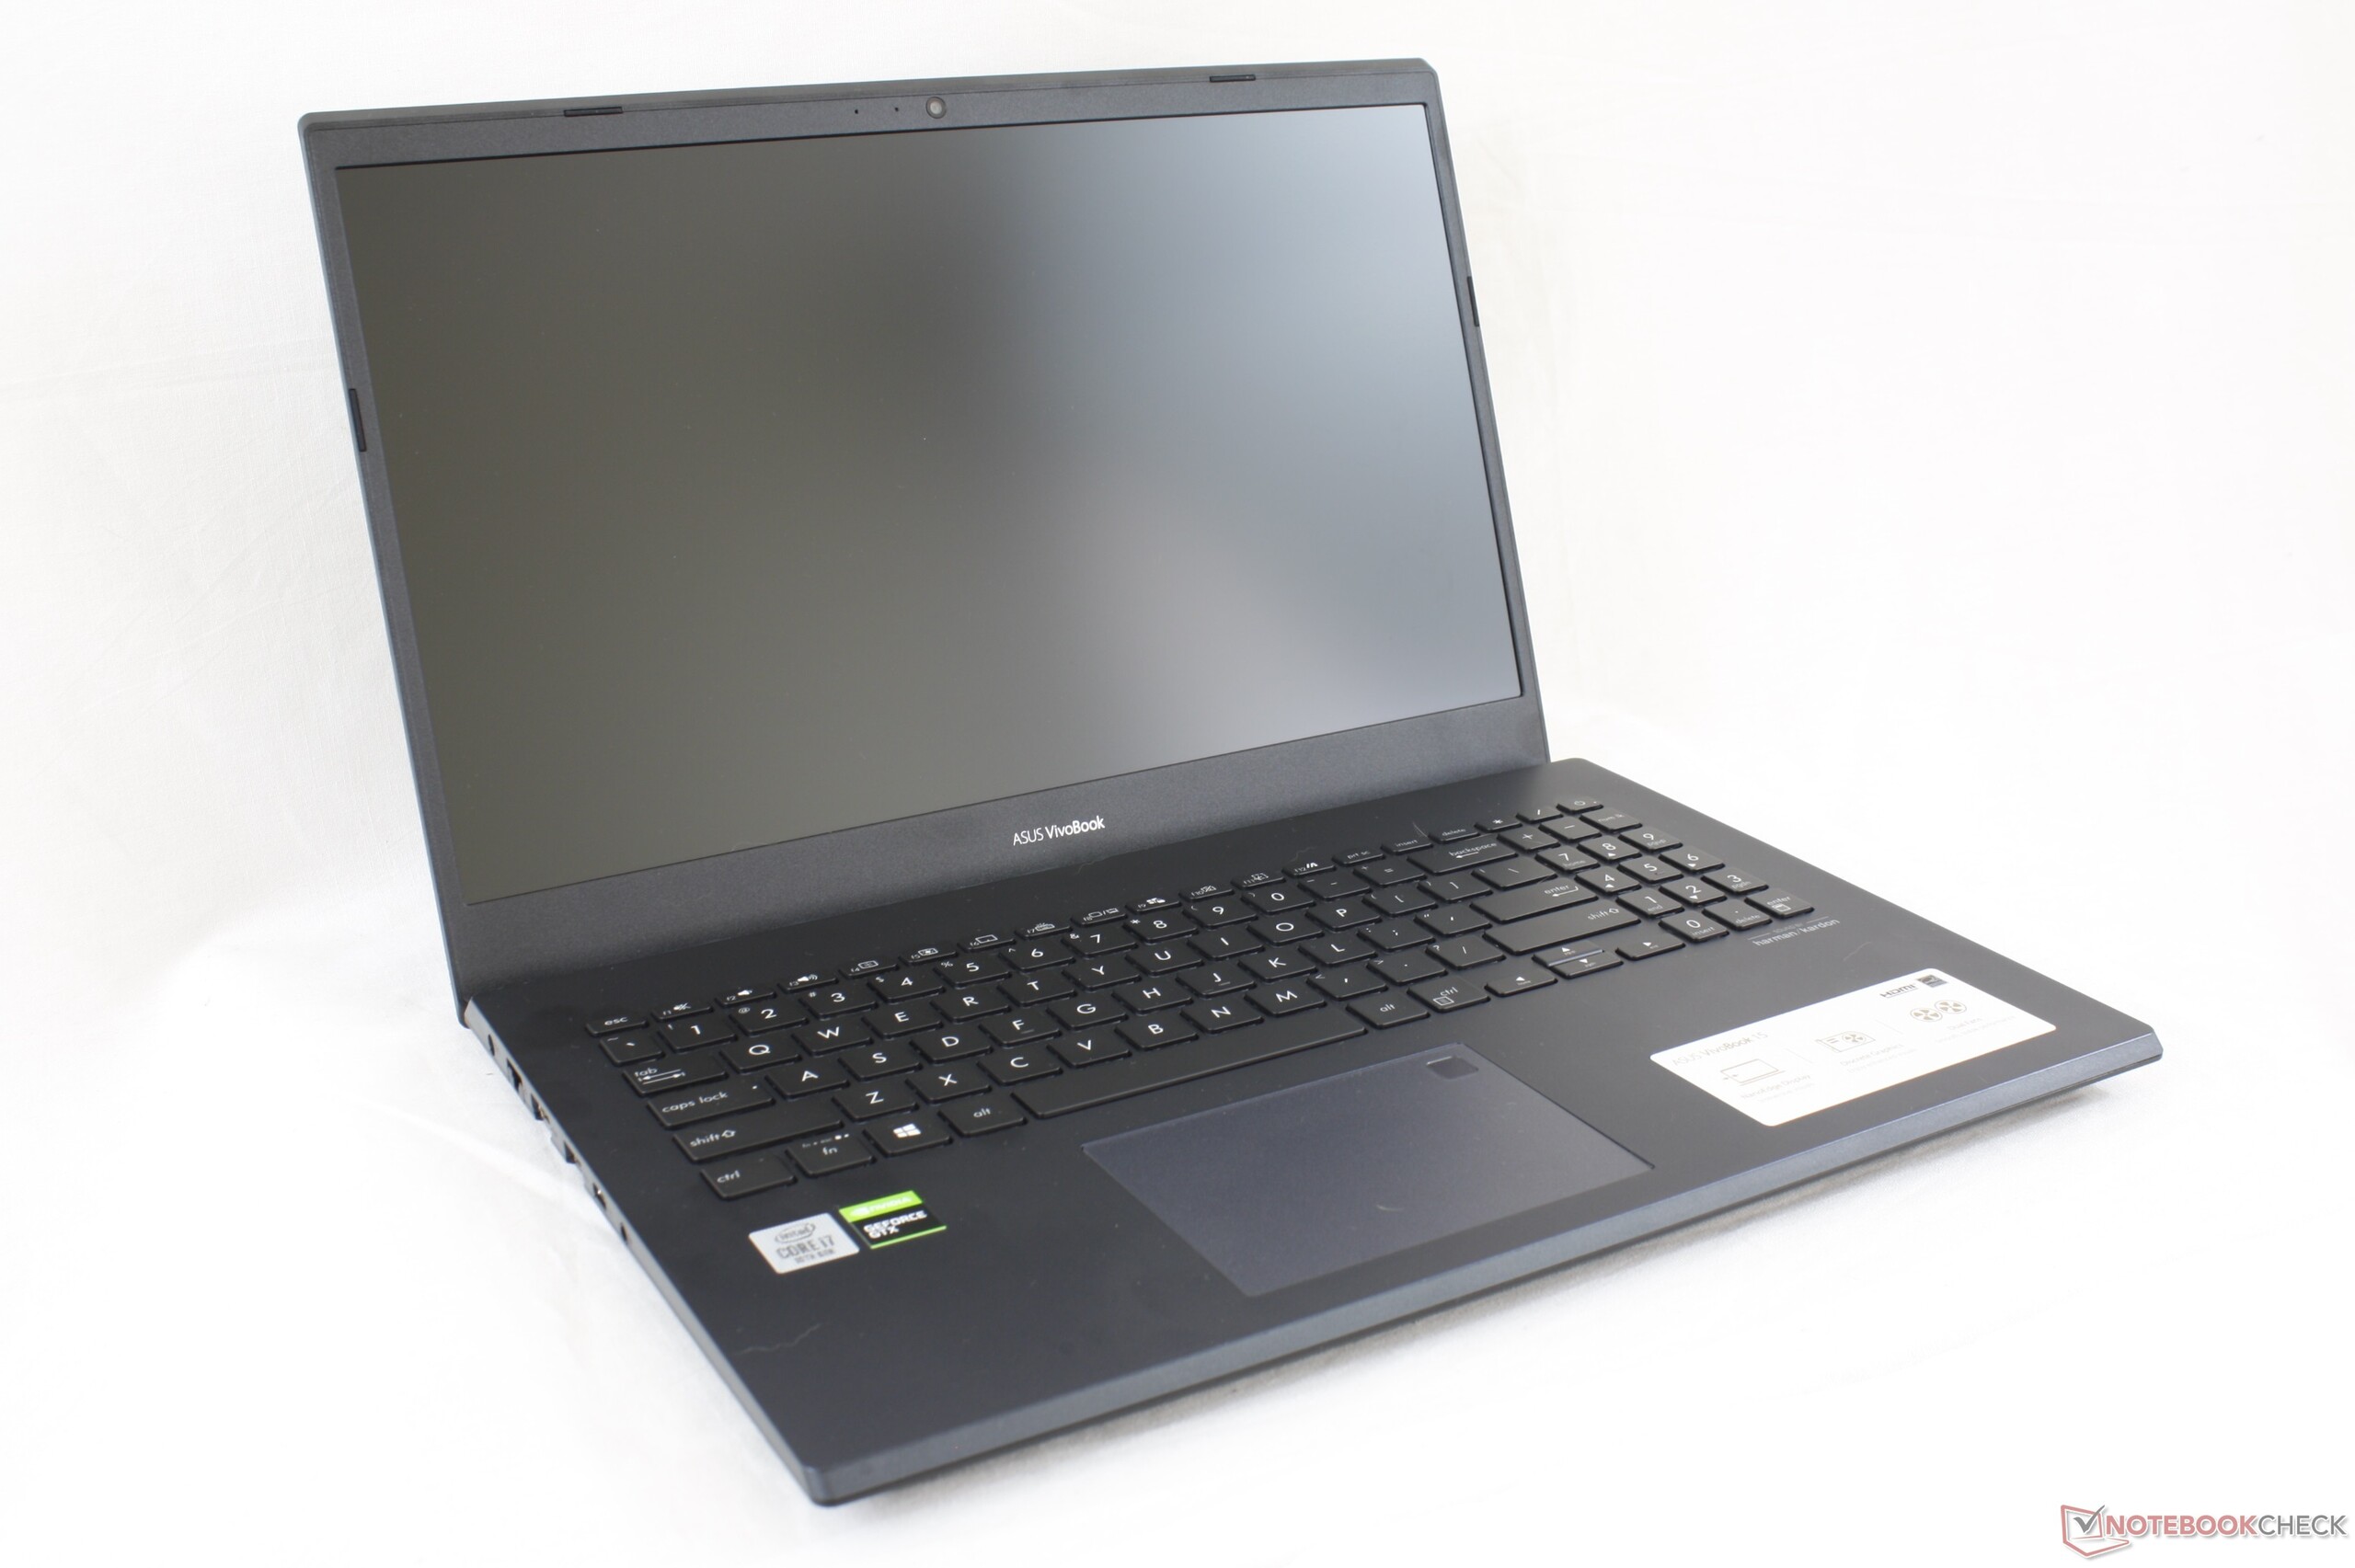
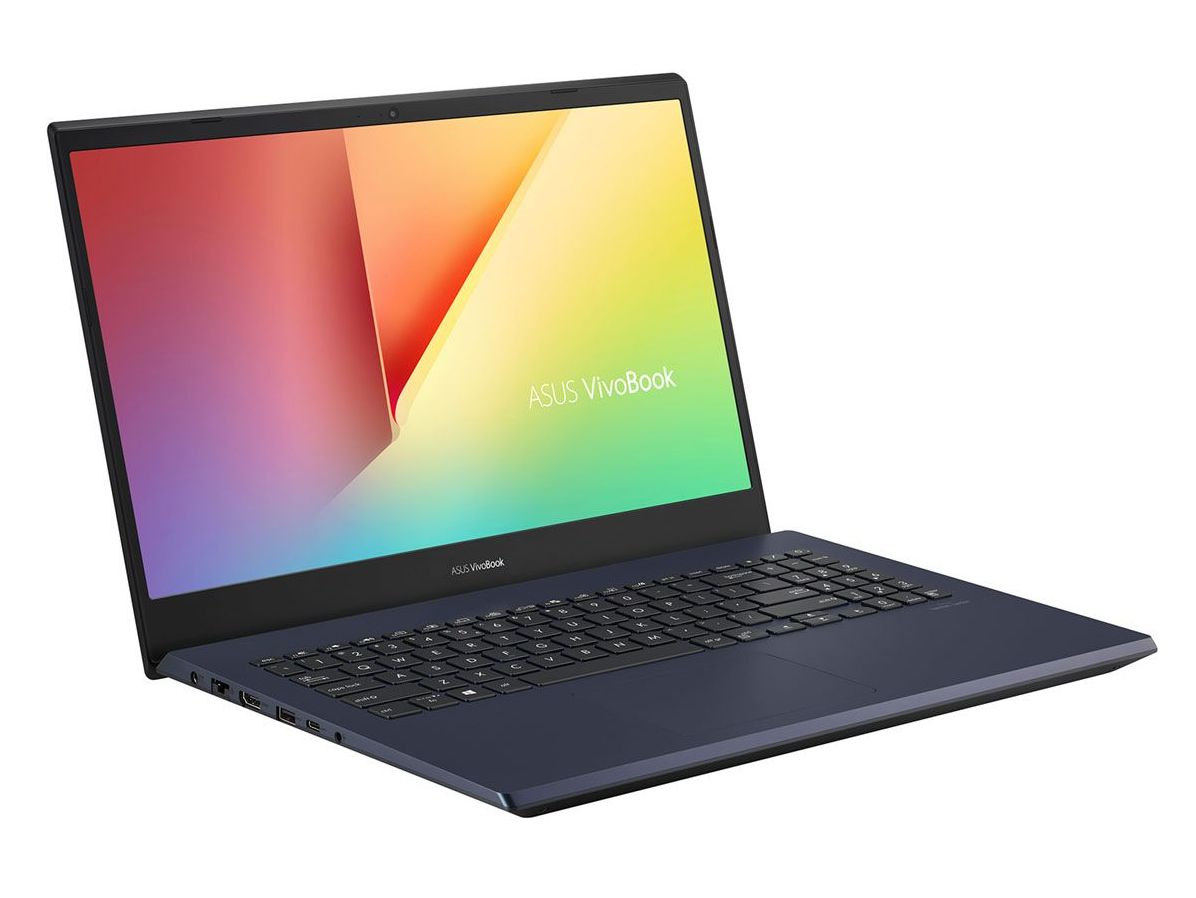
Kort testrapport Asus VivoBook 15 K571LI Laptop: Gaming Multimedia Hybride
Evaluatie | Datum | Model | Gewicht | Hoogte | Formaat | Resolutie | Beste prijs |
|---|---|---|---|---|---|---|---|
| 78.6 % v7 (old) | 09-2020 | Asus VivoBook 15 K571LI-PB71 i7-10750H, GeForce GTX 1650 Ti Mobile | 2.1 kg | 21.9 mm | 15.60" | 1920x1080 | |
| 83 % v7 (old) | 08-2020 | HP Envy 15-ep0098nr i7-10750H, GeForce RTX 2060 Max-Q | 2 kg | 19 mm | 15.60" | 3840x2160 | |
| 81.5 % v7 (old) | Acer Aspire 5 A515-54G i5-10210U, GeForce MX250 | 1.7 kg | 17.9 mm | 15.60" | 1920x1080 | ||
| 85.2 % v7 (old) | 03-2020 | Asus ZenBook 15 UX534FTC-A8190T i7-10510U, GeForce GTX 1650 Max-Q | 1.6 kg | 18.9 mm | 15.60" | 1920x1080 | |
| 81.4 % v7 (old) | 02-2020 | Lenovo Ideapad S540-15IML i5-10210U, GeForce MX250 | 1.9 kg | 17 mm | 15.60" | 1920x1080 | |
| 79.7 % v6 (old) | 08-2019 | Dell Inspiron 15 5000 5585 R7 3700U, Vega 10 | 1.8 kg | 19.5 mm | 15.60" | 1920x1080 |
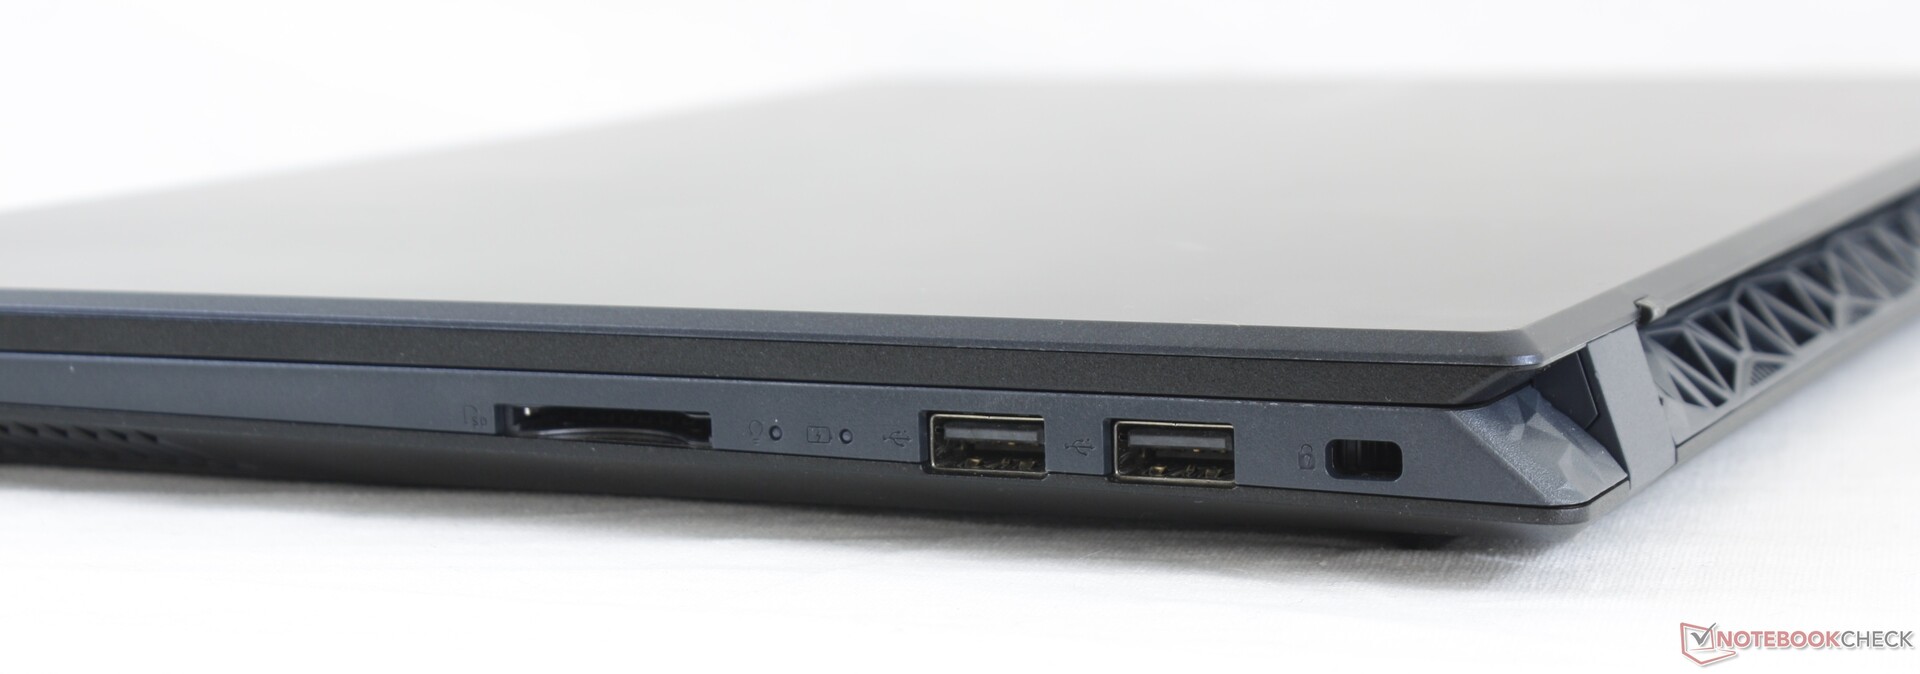
| SD Card Reader | |
| average JPG Copy Test (av. of 3 runs) | |
| Lenovo Ideapad S540-15IML (Toshiba Exceria Pro SDXC 64 GB UHS-II) | |
| HP Envy 15-ep0098nr (Toshiba Exceria Pro M501 UHS-II) | |
| Dell Inspiron 15 5000 5585 (Toshiba Exceria Pro SDXC 64 GB UHS-II) | |
| Asus VivoBook 15 K571LI-PB71 (Toshiba Exceria Pro SDXC 64 GB UHS-II) | |
| maximum AS SSD Seq Read Test (1GB) | |
| HP Envy 15-ep0098nr (Toshiba Exceria Pro M501 UHS-II) | |
| Lenovo Ideapad S540-15IML (Toshiba Exceria Pro SDXC 64 GB UHS-II) | |
| Dell Inspiron 15 5000 5585 (Toshiba Exceria Pro SDXC 64 GB UHS-II) | |
| Asus VivoBook 15 K571LI-PB71 (Toshiba Exceria Pro SDXC 64 GB UHS-II) | |
| Networking | |
| iperf3 transmit AX12 | |
| HP Envy 15-ep0098nr | |
| Asus VivoBook 15 K571LI-PB71 | |
| Acer Aspire 5 A515-54G | |
| Dell Inspiron 15 5000 5585 | |
| Lenovo Ideapad S540-15IML | |
| iperf3 receive AX12 | |
| Asus VivoBook 15 K571LI-PB71 | |
| HP Envy 15-ep0098nr | |
| Acer Aspire 5 A515-54G | |
| Dell Inspiron 15 5000 5585 | |
| Lenovo Ideapad S540-15IML | |


| |||||||||||||||||||||||||
Helderheidsverdeling: 87 %
Helderheid in Batterij-modus: 263.9 cd/m²
Contrast: 1015:1 (Zwart: 0.26 cd/m²)
ΔE ColorChecker Calman: 5.56 | ∀{0.5-29.43 Ø4.72}
calibrated: 4.3
ΔE Greyscale Calman: 5.8 | ∀{0.09-98 Ø4.97}
60.1% sRGB (Argyll 1.6.3 3D)
38.2% AdobeRGB 1998 (Argyll 1.6.3 3D)
41.56% AdobeRGB 1998 (Argyll 3D)
60.4% sRGB (Argyll 3D)
40.2% Display P3 (Argyll 3D)
Gamma: 2.16
CCT: 7828 K
| Asus VivoBook 15 K571LI-PB71 Panda LM156LF-GL03, IPS, 15.6", 1920x1080 | HP Envy 15-ep0098nr Samsung SDC4145, AMOLED, 15.6", 3840x2160 | Acer Aspire 5 A515-54G LG Display LP156WFC SPD1, IPS, 15.6", 1920x1080 | Asus ZenBook 15 UX534FTC-A8190T BOE CQ NV156FHM-N63, IPS, 15.6", 1920x1080 | Lenovo Ideapad S540-15IML BOEhydis NV156FHM-N61 (BOE06FB), IPS, 15.6", 1920x1080 | Dell Inspiron 15 5000 5585 LG Philips 156WFC, IPS, 15.6", 1920x1080 | |
|---|---|---|---|---|---|---|
| Display | 109% | -16% | 52% | 54% | -7% | |
| Display P3 Coverage (%) | 40.2 | 88.5 120% | 33.78 -16% | 65 62% | 66.8 66% | 37.31 -7% |
| sRGB Coverage (%) | 60.4 | 100 66% | 50.8 -16% | 86.2 43% | 86.5 43% | 56.2 -7% |
| AdobeRGB 1998 Coverage (%) | 41.56 | 99.9 140% | 34.9 -16% | 62.9 51% | 63.2 52% | 38.55 -7% |
| Response Times | 93% | -16% | -46% | -60% | -7% | |
| Response Time Grey 50% / Grey 80% * (ms) | 28.4 ? | 0.8 ? 97% | 36 ? -27% | 45 ? -58% | 49.6 ? -75% | 28.4 ? -0% |
| Response Time Black / White * (ms) | 24 ? | 2.7 ? 89% | 25 ? -4% | 32 ? -33% | 34.8 ? -45% | 27.2 ? -13% |
| PWM Frequency (Hz) | 242.7 ? | 202 ? | ||||
| Screen | 45% | 6% | 28% | 25% | -1% | |
| Brightness middle (cd/m²) | 263.9 | 374.3 42% | 248 -6% | 299 13% | 299 13% | 253.6 -4% |
| Brightness (cd/m²) | 246 | 379 54% | 238 -3% | 280 14% | 278 13% | 227 -8% |
| Brightness Distribution (%) | 87 | 91 5% | 86 -1% | 89 2% | 87 0% | 84 -3% |
| Black Level * (cd/m²) | 0.26 | 0.23 12% | 0.21 19% | 0.25 4% | 0.27 -4% | |
| Contrast (:1) | 1015 | 1078 6% | 1424 40% | 1196 18% | 939 -7% | |
| Colorchecker dE 2000 * | 5.56 | 5.47 2% | 5.05 9% | 4.76 14% | 4.32 22% | 6.05 -9% |
| Colorchecker dE 2000 max. * | 16.11 | 8.22 49% | 14.34 11% | 9 44% | 9.3 42% | 14.03 13% |
| Colorchecker dE 2000 calibrated * | 4.3 | 4.61 -7% | 4.76 -11% | 2.58 40% | 4.97 -16% | |
| Greyscale dE 2000 * | 5.8 | 2.3 60% | 1.37 76% | 3.53 39% | 4.21 27% | 3.2 45% |
| Gamma | 2.16 102% | 2.09 105% | 2.4 92% | 2.3 96% | 2.39 92% | 2 110% |
| CCT | 7828 83% | 6340 103% | 6592 99% | 7228 90% | 6799 96% | 6820 95% |
| Color Space (Percent of AdobeRGB 1998) (%) | 38.2 | 87.8 130% | 32 -16% | 56 47% | 57 49% | 35.5 -7% |
| Color Space (Percent of sRGB) (%) | 60.1 | 100 66% | 51 -15% | 86 43% | 86 43% | 55.6 -7% |
| Totaal Gemiddelde (Programma / Instellingen) | 82% /
65% | -9% /
-1% | 11% /
23% | 6% /
20% | -5% /
-3% |
* ... kleiner is beter
Responstijd Scherm
| ↔ Responstijd Zwart naar Wit | ||
|---|---|---|
| 24 ms ... stijging ↗ en daling ↘ gecombineerd | ↗ 13.2 ms stijging | 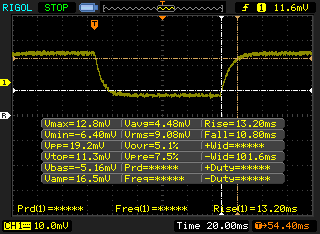 |
| ↘ 10.8 ms daling | ||
| Het scherm vertoonde prima responstijden in onze tests maar is misschien wat te traag voor competitieve games. Ter vergelijking: alle testtoestellen variëren van 0.1 (minimum) tot 240 (maximum) ms. » 54 % van alle toestellen zijn beter. Dit betekent dat de gemeten responstijd slechter is dan het gemiddelde (19.8 ms) van alle geteste toestellen. | ||
| ↔ Responstijd 50% Grijs naar 80% Grijs | ||
| 28.4 ms ... stijging ↗ en daling ↘ gecombineerd | ↗ 16.8 ms stijging | 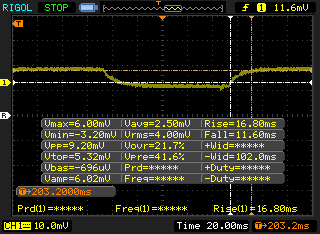 |
| ↘ 11.6 ms daling | ||
| Het scherm vertoonde relatief trage responstijden in onze tests en is misschien te traag voor games. Ter vergelijking: alle testtoestellen variëren van 0.165 (minimum) tot 636 (maximum) ms. » 38 % van alle toestellen zijn beter. Dit betekent dat de gemeten responstijd vergelijkbaar is met het gemiddelde (31 ms) van alle geteste toestellen. | ||
Screen Flickering / PWM (Pulse-Width Modulation)
| Screen flickering / PWM niet waargenomen | 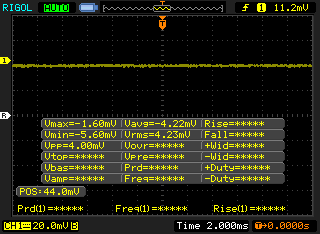 | ||
Ter vergelijking: 52 % van alle geteste toestellen maakten geen gebruik van PWM om de schermhelderheid te verlagen. Als het wel werd gebruikt, werd een gemiddelde van 7772 (minimum: 5 - maximum: 343500) Hz waargenomen. | |||
Cinebench R15: CPU Multi 64Bit | CPU Single 64Bit
Blender: v2.79 BMW27 CPU
7-Zip 18.03: 7z b 4 -mmt1 | 7z b 4
Geekbench 5.5: Single-Core | Multi-Core
HWBOT x265 Benchmark v2.2: 4k Preset
LibreOffice : 20 Documents To PDF
R Benchmark 2.5: Overall mean
| Cinebench R20 / CPU (Multi Core) | |
| Dell G5 15 SE 5505 P89F | |
| Asus ROG Strix Scar 15 G532LWS | |
| HP Pavilion Gaming 15-ec1206ng | |
| Dell XPS 15 9500 Core i7 4K UHD | |
| Gemiddeld Intel Core i7-10750H (1749 - 3325, n=43) | |
| Lenovo IdeaPad S740-15IRH | |
| Asus VivoBook 15 K571LI-PB71 | |
| Dell XPS 15 9500 Core i5 | |
| Asus ZenBook 15 UX534FTC-A8190T | |
| Dell G5 15 5590-PCNJJ | |
| Cinebench R20 / CPU (Single Core) | |
| Dell XPS 15 9500 Core i7 4K UHD | |
| Asus ROG Strix Scar 15 G532LWS | |
| Dell G5 15 SE 5505 P89F | |
| Gemiddeld Intel Core i7-10750H (431 - 504, n=43) | |
| Asus VivoBook 15 K571LI-PB71 | |
| Asus ZenBook 15 UX534FTC-A8190T | |
| Lenovo IdeaPad S740-15IRH | |
| Dell XPS 15 9500 Core i5 | |
| HP Pavilion Gaming 15-ec1206ng | |
| Dell G5 15 5590-PCNJJ | |
| Cinebench R15 / CPU Multi 64Bit | |
| Dell G5 15 SE 5505 P89F | |
| Asus ROG Strix Scar 15 G532LWS | |
| HP Pavilion Gaming 15-ec1206ng | |
| Dell XPS 15 9500 Core i7 4K UHD | |
| Gemiddeld Intel Core i7-10750H (804 - 1418, n=50) | |
| Lenovo IdeaPad S740-15IRH | |
| Asus VivoBook 15 K571LI-PB71 | |
| Dell XPS 15 9500 Core i5 | |
| Asus ZenBook 15 UX534FTC-A8190T | |
| Dell G5 15 5590-PCNJJ | |
| Cinebench R15 / CPU Single 64Bit | |
| Asus ROG Strix Scar 15 G532LWS | |
| Dell XPS 15 9500 Core i7 4K UHD | |
| Gemiddeld Intel Core i7-10750H (184 - 213, n=45) | |
| Asus VivoBook 15 K571LI-PB71 | |
| Lenovo IdeaPad S740-15IRH | |
| Dell G5 15 SE 5505 P89F | |
| Asus ZenBook 15 UX534FTC-A8190T | |
| Dell XPS 15 9500 Core i5 | |
| HP Pavilion Gaming 15-ec1206ng | |
| Dell G5 15 5590-PCNJJ | |
| Blender / v2.79 BMW27 CPU | |
| Dell XPS 15 9500 Core i5 | |
| Asus VivoBook 15 K571LI-PB71 | |
| Gemiddeld Intel Core i7-10750H (322 - 587, n=43) | |
| Dell XPS 15 9500 Core i7 4K UHD | |
| HP Pavilion Gaming 15-ec1206ng | |
| Asus ROG Strix Scar 15 G532LWS | |
| Dell G5 15 SE 5505 P89F | |
| 7-Zip 18.03 / 7z b 4 -mmt1 | |
| Asus ROG Strix Scar 15 G532LWS | |
| Dell XPS 15 9500 Core i7 4K UHD | |
| Asus VivoBook 15 K571LI-PB71 | |
| Gemiddeld Intel Core i7-10750H (4504 - 5470, n=43) | |
| Dell XPS 15 9500 Core i5 | |
| Dell G5 15 SE 5505 P89F | |
| HP Pavilion Gaming 15-ec1206ng | |
| 7-Zip 18.03 / 7z b 4 | |
| Dell G5 15 SE 5505 P89F | |
| Asus ROG Strix Scar 15 G532LWS | |
| HP Pavilion Gaming 15-ec1206ng | |
| Dell XPS 15 9500 Core i7 4K UHD | |
| Gemiddeld Intel Core i7-10750H (26040 - 37345, n=43) | |
| Asus VivoBook 15 K571LI-PB71 | |
| Dell XPS 15 9500 Core i5 | |
| Geekbench 5.5 / Single-Core | |
| Asus ROG Strix Scar 15 G532LWS | |
| Dell XPS 15 9500 Core i7 4K UHD | |
| Asus VivoBook 15 K571LI-PB71 | |
| Gemiddeld Intel Core i7-10750H (1114 - 1333, n=43) | |
| Asus ZenBook 15 UX534FTC-A8190T | |
| Dell XPS 15 9500 Core i5 | |
| Dell G5 15 SE 5505 P89F | |
| HP Pavilion Gaming 15-ec1206ng | |
| Geekbench 5.5 / Multi-Core | |
| Asus ROG Strix Scar 15 G532LWS | |
| Dell XPS 15 9500 Core i7 4K UHD | |
| Dell G5 15 SE 5505 P89F | |
| Asus VivoBook 15 K571LI-PB71 | |
| Gemiddeld Intel Core i7-10750H (4443 - 6674, n=43) | |
| HP Pavilion Gaming 15-ec1206ng | |
| Asus ZenBook 15 UX534FTC-A8190T | |
| Dell XPS 15 9500 Core i5 | |
| HWBOT x265 Benchmark v2.2 / 4k Preset | |
| Asus ROG Strix Scar 15 G532LWS | |
| Dell G5 15 SE 5505 P89F | |
| HP Pavilion Gaming 15-ec1206ng | |
| Dell XPS 15 9500 Core i7 4K UHD | |
| Gemiddeld Intel Core i7-10750H (5.54 - 11.6, n=43) | |
| Asus VivoBook 15 K571LI-PB71 | |
| Dell XPS 15 9500 Core i5 | |
| LibreOffice / 20 Documents To PDF | |
| HP Pavilion Gaming 15-ec1206ng | |
| Dell G5 15 SE 5505 P89F | |
| Dell XPS 15 9500 Core i5 | |
| Gemiddeld Intel Core i7-10750H (43.1 - 99.2, n=43) | |
| Dell XPS 15 9500 Core i7 4K UHD | |
| Asus ROG Strix Scar 15 G532LWS | |
| Asus VivoBook 15 K571LI-PB71 | |
| R Benchmark 2.5 / Overall mean | |
| Dell XPS 15 9500 Core i5 | |
| Gemiddeld Intel Core i7-10750H (0.578 - 0.708, n=42) | |
| HP Pavilion Gaming 15-ec1206ng | |
| Asus VivoBook 15 K571LI-PB71 | |
| Dell XPS 15 9500 Core i7 4K UHD | |
| Dell G5 15 SE 5505 P89F | |
| Asus ROG Strix Scar 15 G532LWS | |
* ... kleiner is beter
| PCMark 8 Home Score Accelerated v2 | 4090 punten | |
| PCMark 8 Work Score Accelerated v2 | 5343 punten | |
| PCMark 10 Score | 4837 punten | |
Help | ||
| DPC Latencies / LatencyMon - interrupt to process latency (max), Web, Youtube, Prime95 | |
| Dell XPS 15 9500 Core i7 4K UHD | |
| HP Envy 15-ep0098nr | |
| Dell G5 15 SE 5505 P89F | |
| Dell XPS 15 9500 Core i5 | |
| Asus ROG Strix Scar 15 G532LWS | |
| Asus ROG Strix G15 G512LI | |
| Asus VivoBook 15 K571LI-PB71 | |
| HP Pavilion Gaming 15-ec1206ng | |
| Acer Nitro 5 AN517-52-77DS | |
* ... kleiner is beter
| Asus VivoBook 15 K571LI-PB71 Mushkin Helix-L 1TB MKNSSDHL1TB-08 | HP Envy 15-ep0098nr Intel Optane Memory H10 with Solid State Storage 32GB + 512GB HBRPEKNX0202A(L/H) | Acer Aspire 5 A515-54G Kingston RBUSNS8154P3512GJ1 | Asus ZenBook 15 UX534FTC-A8190T Samsung SSD PM981 MZVLB1T0HALR | Lenovo Ideapad S540-15IML Samsung SSD PM981a MZVLB512HBJQ | Dell Inspiron 15 5000 5585 WDC PC SN520 SDAPNUW-512G | |
|---|---|---|---|---|---|---|
| AS SSD | -5% | 31% | 63% | 119% | -0% | |
| Seq Read (MB/s) | 1323 | 1005 -24% | 1405 6% | 2643 100% | 2642 100% | 398.9 -70% |
| Seq Write (MB/s) | 1572 | 436.8 -72% | 953 -39% | 1533 -2% | 2433 55% | 884 -44% |
| 4K Read (MB/s) | 38.09 | 51.5 35% | 54 42% | 49.12 29% | 58 52% | 34.54 -9% |
| 4K Write (MB/s) | 127.4 | 88 -31% | 93 -27% | 134.7 6% | 145.3 14% | 82.1 -36% |
| 4K-64 Read (MB/s) | 812 | 517 -36% | 959 18% | 1028 27% | 1431 76% | 647 -20% |
| 4K-64 Write (MB/s) | 276 | 839 204% | 772 180% | 1353 390% | 1753 535% | 985 257% |
| Access Time Read * (ms) | 0.035 | 0.088 -151% | 0.051 -46% | 0.033 6% | 0.072 -106% | 0.072 -106% |
| Access Time Write * (ms) | 0.411 | 0.151 63% | 0.044 89% | 0.028 93% | 0.027 93% | 0.047 89% |
| Score Read (Points) | 983 | 669 -32% | 1153 17% | 1342 37% | 1753 78% | 721 -27% |
| Score Write (Points) | 561 | 970 73% | 961 71% | 1641 193% | 2142 282% | 1155 106% |
| Score Total (Points) | 2066 | 1972 -5% | 2695 30% | 3622 75% | 4790 132% | 2279 10% |
| Copy ISO MB/s (MB/s) | 2846 | 1173 -59% | 2226 -22% | 862 -70% | ||
| Copy Program MB/s (MB/s) | 728 | 769 6% | 506 -30% | 457 -37% | ||
| Copy Game MB/s (MB/s) | 1610 | 1045 -35% | 1230 -24% | 902 -44% | ||
| CrystalDiskMark 5.2 / 6 | -5% | -27% | 15% | 11% | -43% | |
| Write 4K (MB/s) | 169.7 | 100.2 -41% | 100.4 -41% | 138.1 -19% | 170.7 1% | 105.9 -38% |
| Read 4K (MB/s) | 53.2 | 112.8 112% | 47.16 -11% | 45.89 -14% | 49.51 -7% | 36.56 -31% |
| Write Seq (MB/s) | 1679 | 537 -68% | 993 -41% | 2147 28% | 1156 -31% | 1165 -31% |
| Read Seq (MB/s) | 1698 | 1270 -25% | 1176 -31% | 2188 29% | 1136 -33% | 423.2 -75% |
| Write 4K Q32T1 (MB/s) | 450.7 | 480.6 7% | 354.7 -21% | 427.8 -5% | 420.5 -7% | 332.1 -26% |
| Read 4K Q32T1 (MB/s) | 577 | 364.9 -37% | 473 -18% | 404 -30% | 527 -9% | 229.3 -60% |
| Write Seq Q32T1 (MB/s) | 1657 | 1224 -26% | 1034 -38% | 2396 45% | 2984 80% | 1460 -12% |
| Read Seq Q32T1 (MB/s) | 1851 | 2635 42% | 1635 -12% | 3454 87% | 3550 92% | 472.5 -74% |
| Totaal Gemiddelde (Programma / Instellingen) | -5% /
-5% | 2% /
7% | 39% /
45% | 65% /
74% | -22% /
-16% |
* ... kleiner is beter

Disk Throttling: DiskSpd Read Loop, Queue Depth 8
| 3DMark 11 Performance | 12523 punten | |
| 3DMark Cloud Gate Standard Score | 29531 punten | |
| 3DMark Fire Strike Score | 8903 punten | |
| 3DMark Time Spy Score | 3801 punten | |
Help | ||
| Final Fantasy XV Benchmark | |
| 1280x720 Lite Quality | |
| MSI RTX 2060 Gaming Z 6G | |
| HP Envy 15-ep0098nr | |
| Asus VivoBook 15 K571LI-PB71 | |
| MSI Alpha 15 A3DDK-034 | |
| 1920x1080 Standard Quality | |
| MSI RTX 2060 Gaming Z 6G | |
| HP Envy 15-ep0098nr | |
| MSI Alpha 15 A3DDK-034 | |
| Asus VivoBook 15 K571LI-PB71 | |
| 1920x1080 High Quality | |
| MSI RTX 2060 Gaming Z 6G | |
| HP Envy 15-ep0098nr | |
| Asus VivoBook 15 K571LI-PB71 | |
| MSI Alpha 15 A3DDK-034 | |
| lage | gem. | hoge | ultra | |
|---|---|---|---|---|
| The Witcher 3 (2015) | 199.3 | 126.6 | 74.5 | 38.8 |
| Dota 2 Reborn (2015) | 138 | 124 | 115 | 109 |
| Final Fantasy XV Benchmark (2018) | 104 | 54.9 | 39.3 | |
| X-Plane 11.11 (2018) | 95.6 | 80.5 | 71 |
| Asus VivoBook 15 K571LI-PB71 GeForce GTX 1650 Ti Mobile, i7-10750H, Mushkin Helix-L 1TB MKNSSDHL1TB-08 | HP Envy 15-ep0098nr GeForce RTX 2060 Max-Q, i7-10750H, Intel Optane Memory H10 with Solid State Storage 32GB + 512GB HBRPEKNX0202A(L/H) | Acer Aspire 5 A515-54G GeForce MX250, i5-10210U, Kingston RBUSNS8154P3512GJ1 | Asus ZenBook 15 UX534FTC-A8190T GeForce GTX 1650 Max-Q, i7-10510U, Samsung SSD PM981 MZVLB1T0HALR | Lenovo Ideapad S540-15IML GeForce MX250, i5-10210U, Samsung SSD PM981a MZVLB512HBJQ | Dell Inspiron 15 5000 5585 Vega 10, R7 3700U, WDC PC SN520 SDAPNUW-512G | |
|---|---|---|---|---|---|---|
| Noise | -8% | 7% | 9% | 1% | 11% | |
| uit / omgeving * (dB) | 25.7 | 26.4 -3% | 29.8 -16% | 30.3 -18% | 30 -17% | 28.3 -10% |
| Idle Minimum * (dB) | 31.9 | 32.2 -1% | 29.8 7% | 30.3 5% | 30 6% | 28.3 11% |
| Idle Average * (dB) | 31.9 | 32.2 -1% | 29.8 7% | 30.3 5% | 32 -0% | 28.3 11% |
| Idle Maximum * (dB) | 31.9 | 32.2 -1% | 29.8 7% | 30.9 3% | 37 -16% | 28.3 11% |
| Load Average * (dB) | 44.2 | 48.3 -9% | 37.3 16% | 31.3 29% | 41 7% | 31.4 29% |
| Witcher 3 ultra * (dB) | 43.9 | 53.7 -22% | 38.1 13% | 39 11% | 41.4 6% | |
| Load Maximum * (dB) | 50.7 | 58.8 -16% | 40.1 21% | 38.2 25% | 42 17% | 41.4 18% |
* ... kleiner is beter
Geluidsniveau
| Onbelast |
| 31.9 / 31.9 / 31.9 dB (A) |
| Belasting |
| 44.2 / 50.7 dB (A) |
 | ||
30 dB stil 40 dB(A) hoorbaar 50 dB(A) luid |
||
min: | ||
(-) De maximumtemperatuur aan de bovenzijde bedraagt 53 °C / 127 F, vergeleken met het gemiddelde van 36.8 °C / 98 F, variërend van 21 tot 71 °C voor de klasse Multimedia.
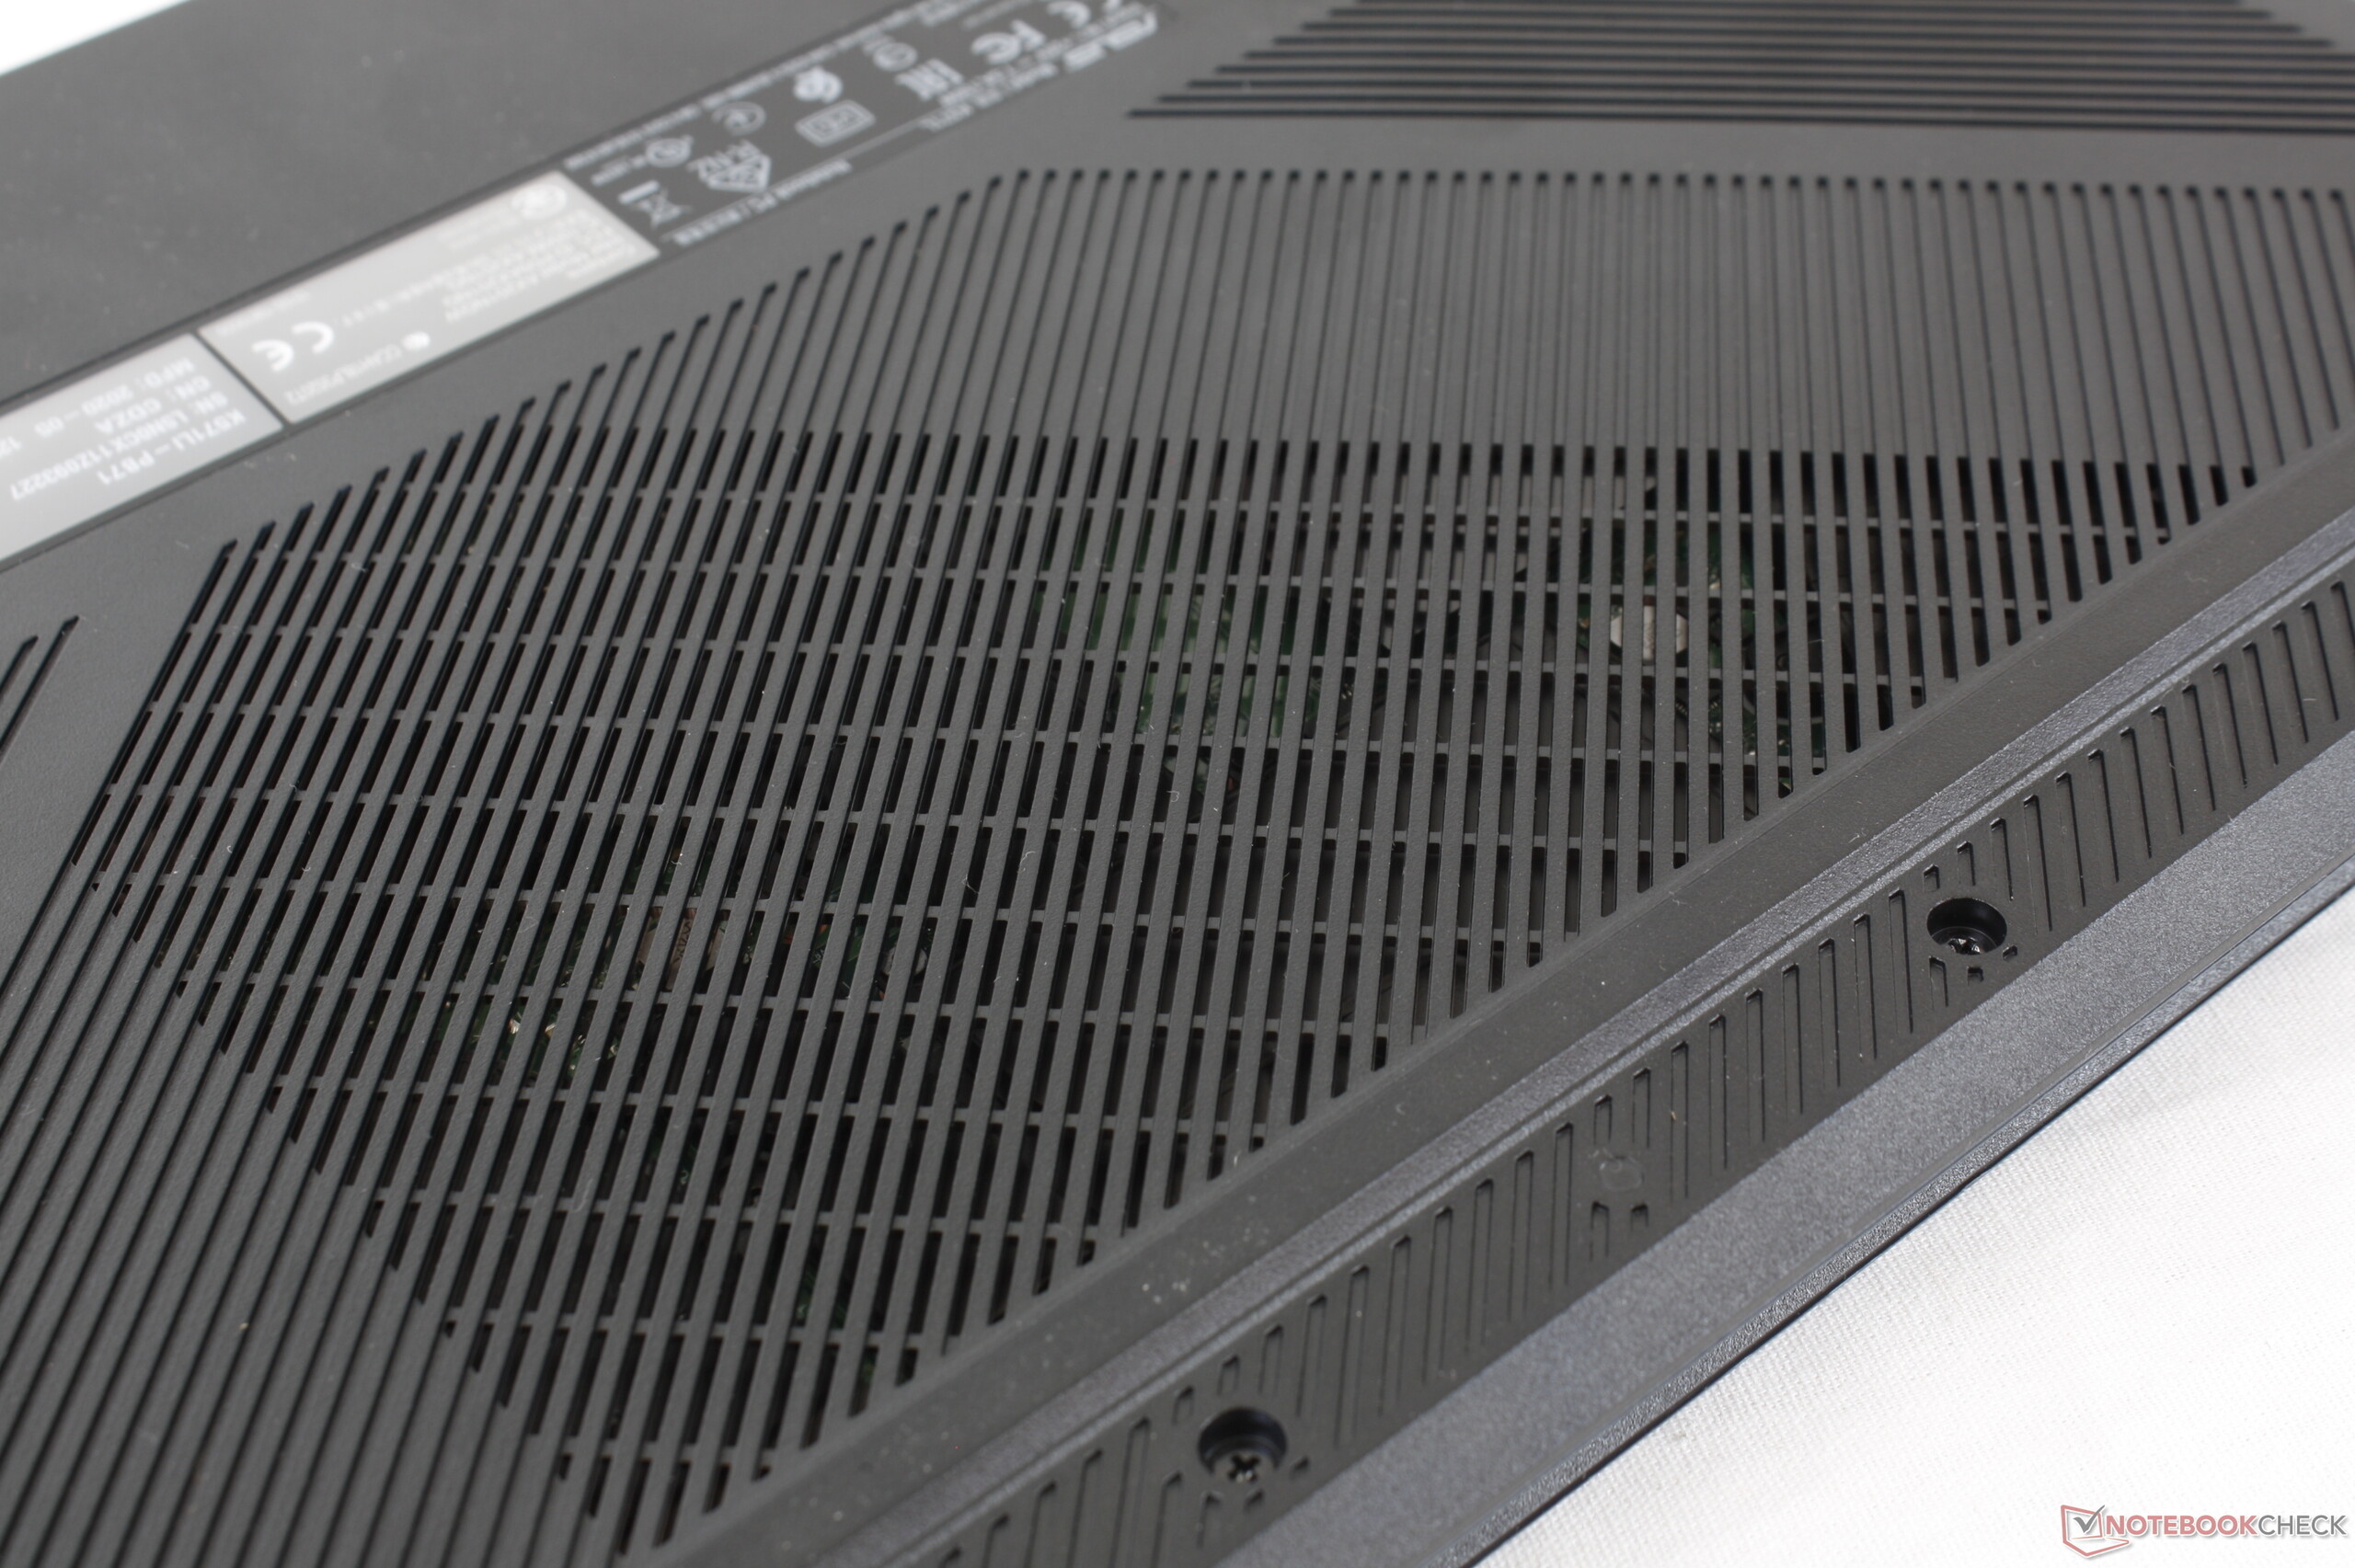
(-) De bodem warmt op tot een maximum van 72 °C / 162 F, vergeleken met een gemiddelde van 39.1 °C / 102 F
(+) Bij onbelast gebruik bedraagt de gemiddelde temperatuur voor de bovenzijde 28.9 °C / 84 F, vergeleken met het apparaatgemiddelde van 31.3 °C / 88 F.
(±) Bij het spelen van The Witcher 3 is de gemiddelde temperatuur voor de bovenzijde 34.7 °C / 94 F, vergeleken met het apparaatgemiddelde van 31.3 °C / 88 F.
(+) De palmsteunen en het touchpad zijn met een maximum van ###max## °C / 86 F koeler dan de huidtemperatuur en voelen daarom koel aan.
(±) De gemiddelde temperatuur van de handpalmsteun van soortgelijke toestellen bedroeg 28.7 °C / 83.7 F (-1.3 °C / -2.3 F).
Asus VivoBook 15 K571LI-PB71 audioanalyse
(±) | luidspreker luidheid is gemiddeld maar goed (78.7 dB)
Bas 100 - 315 Hz
(-) | bijna geen lage tonen - gemiddeld 20.1% lager dan de mediaan
(±) | lineariteit van de lage tonen is gemiddeld (14.6% delta ten opzichte van de vorige frequentie)
Midden 400 - 2000 Hz
(±) | hogere middens - gemiddeld 5% hoger dan de mediaan
(+) | de middentonen zijn lineair (3.9% delta ten opzichte van de vorige frequentie)
Hoog 2 - 16 kHz
(+) | evenwichtige hoogtepunten - slechts 1.1% verwijderd van de mediaan
(+) | de hoge tonen zijn lineair (3.4% delta naar de vorige frequentie)
Algemeen 100 - 16.000 Hz
(±) | lineariteit van het totale geluid is gemiddeld (17.8% verschil met de mediaan)
Vergeleken met dezelfde klasse
» 52% van alle geteste apparaten in deze klasse waren beter, 7% vergelijkbaar, 41% slechter
» De beste had een delta van 5%, het gemiddelde was 17%, de slechtste was 45%
Vergeleken met alle geteste toestellen
» 36% van alle geteste apparaten waren beter, 8% gelijk, 56% slechter
» De beste had een delta van 4%, het gemiddelde was 24%, de slechtste was 134%
Apple MacBook 12 (Early 2016) 1.1 GHz audioanalyse
(+) | luidsprekers kunnen relatief luid spelen (83.6 dB)
Bas 100 - 315 Hz
(±) | verminderde zeebaars - gemiddeld 11.3% lager dan de mediaan
(±) | lineariteit van de lage tonen is gemiddeld (14.2% delta ten opzichte van de vorige frequentie)
Midden 400 - 2000 Hz
(+) | evenwichtige middens - slechts 2.4% verwijderd van de mediaan
(+) | de middentonen zijn lineair (5.5% delta ten opzichte van de vorige frequentie)
Hoog 2 - 16 kHz
(+) | evenwichtige hoogtepunten - slechts 2% verwijderd van de mediaan
(+) | de hoge tonen zijn lineair (4.5% delta naar de vorige frequentie)
Algemeen 100 - 16.000 Hz
(+) | het totale geluid is lineair (10.2% verschil met de mediaan)
Vergeleken met dezelfde klasse
» 7% van alle geteste apparaten in deze klasse waren beter, 2% vergelijkbaar, 91% slechter
» De beste had een delta van 5%, het gemiddelde was 18%, de slechtste was 53%
Vergeleken met alle geteste toestellen
» 5% van alle geteste apparaten waren beter, 1% gelijk, 94% slechter
» De beste had een delta van 4%, het gemiddelde was 24%, de slechtste was 134%
| Uit / Standby | |
| Inactief | |
| Belasting |
|
Key:
min: | |
| Asus VivoBook 15 K571LI-PB71 i7-10750H, GeForce GTX 1650 Ti Mobile, Mushkin Helix-L 1TB MKNSSDHL1TB-08, IPS, 1920x1080, 15.6" | HP Envy 15-ep0098nr i7-10750H, GeForce RTX 2060 Max-Q, Intel Optane Memory H10 with Solid State Storage 32GB + 512GB HBRPEKNX0202A(L/H), AMOLED, 3840x2160, 15.6" | Acer Aspire 5 A515-54G i5-10210U, GeForce MX250, Kingston RBUSNS8154P3512GJ1, IPS, 1920x1080, 15.6" | Asus ZenBook 15 UX534FTC-A8190T i7-10510U, GeForce GTX 1650 Max-Q, Samsung SSD PM981 MZVLB1T0HALR, IPS, 1920x1080, 15.6" | Lenovo Ideapad S540-15IML i5-10210U, GeForce MX250, Samsung SSD PM981a MZVLB512HBJQ, IPS, 1920x1080, 15.6" | Dell Inspiron 15 5000 5585 R7 3700U, Vega 10, WDC PC SN520 SDAPNUW-512G, IPS, 1920x1080, 15.6" | |
|---|---|---|---|---|---|---|
| Power Consumption | -23% | 52% | 40% | 42% | 55% | |
| Idle Minimum * (Watt) | 6.4 | 9.2 -44% | 3.4 47% | 2.8 56% | 5 22% | 4.2 34% |
| Idle Average * (Watt) | 10.6 | 14.5 -37% | 6.4 40% | 7.7 27% | 7 34% | 6.8 36% |
| Idle Maximum * (Watt) | 18.4 | 18 2% | 9.2 50% | 9.4 49% | 10 46% | 7 62% |
| Load Average * (Watt) | 103.7 | 110.9 -7% | 38 63% | 57 45% | 64 38% | 36.5 65% |
| Witcher 3 ultra * (Watt) | 99.1 | 125.5 -27% | 62 37% | 44 56% | 37.9 62% | |
| Load Maximum * (Watt) | 154.9 | 194.6 -26% | 59 62% | 116 25% | 67 57% | 44 72% |
* ... kleiner is beter
| Asus VivoBook 15 K571LI-PB71 i7-10750H, GeForce GTX 1650 Ti Mobile, 42 Wh | HP Envy 15-ep0098nr i7-10750H, GeForce RTX 2060 Max-Q, 83 Wh | Acer Aspire 5 A515-54G i5-10210U, GeForce MX250, 48 Wh | Asus ZenBook 15 UX534FTC-A8190T i7-10510U, GeForce GTX 1650 Max-Q, 71 Wh | Lenovo Ideapad S540-15IML i5-10210U, GeForce MX250, 70 Wh | Dell Inspiron 15 5000 5585 R7 3700U, Vega 10, 42 Wh | |
|---|---|---|---|---|---|---|
| Batterijduur | 62% | 141% | 190% | 160% | 62% | |
| Reader / Idle (h) | 10.2 | 15 47% | 27.2 167% | 30.2 196% | 14.3 40% | |
| WiFi v1.3 (h) | 3.7 | 6 62% | 8.9 141% | 12.4 235% | 12.1 227% | 7 89% |
| Load (h) | 0.9 | 1.6 78% | 2.4 167% | 1.4 56% | 1.4 56% |
Pro
Contra

Voor het volledige, Engelse testrapport, klik hier.
De Asus VivoBook 15 K571 is ideaal voor studenten die een betaalbare laptop willen voor zowel gaming als schoolwerk, die ook relatief draagbaar is. De VivoBook 15 K571 is krachtig voor de grootte en zijn gewicht en is een middenwegoplossing tussen een traditionele Ultrabook en een instapmodel gaminglaptop. Zeer weinig laptops in deze prijsklasse worden ook geleverd met een 120 Hz paneeloptie.
Als u geen gebruik maakt van een Core H-serie CPU of GTX 1650 Ti GPU, dan is een ZenBook de betere optie. De levensduur van de batterij, het geluid van de ventilator en de temperaturen zijn in het beste geval gemiddeld op de VivoBook 15, dankzij de veeleisende processors in het systeem.
Wij raden u aan het display zorgvuldig te kiezen. Asus biedt drie opties: 1080p120 45% NTSC, 1080p60 45% NTSC, of 1080p60 72% NTSC. De 1080p120 45% NTSC-optie zal het beste zijn voor gaming, zelfs na de gemiddelde zwart-witte reactietijden. Voor het bewerken en grafisch werk zal de 1080p60 72% NTSC-optie beter zijn voor de diepere kleuren.
De Asus VivoBook 15 K571 blinkt niet echt uit in één enkel aspect, maar het balanceert vrij goed als multimediamachine en gamingmachine voor zijn goedkope prijs.
Asus VivoBook 15 K571LI-PB71
- 13-09-2020 v7 (old)
Allen Ngo
Price comparison
