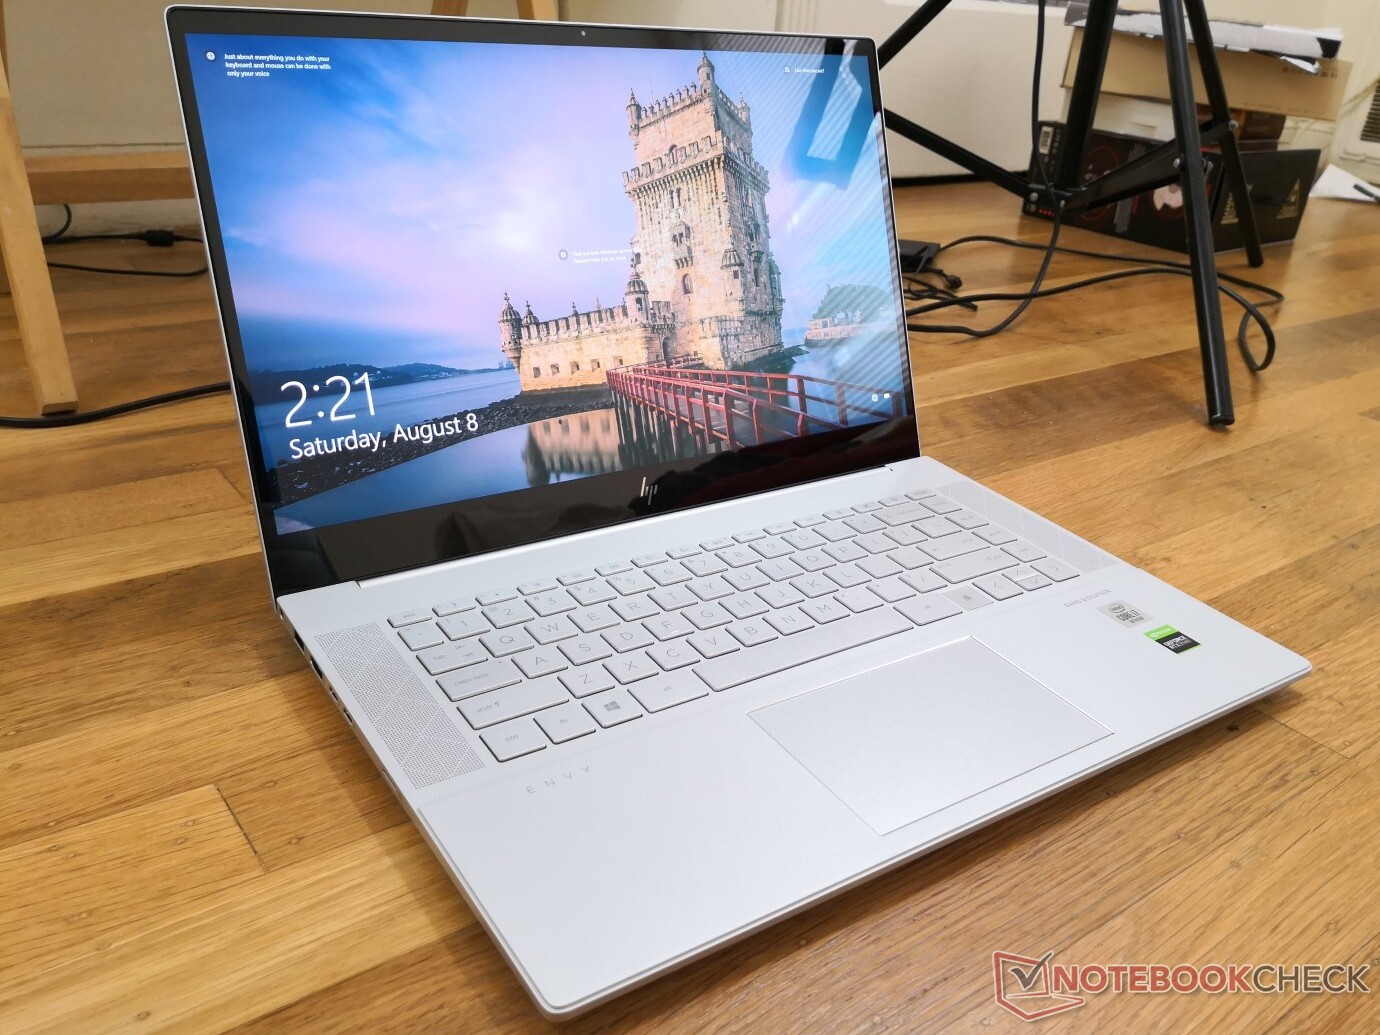
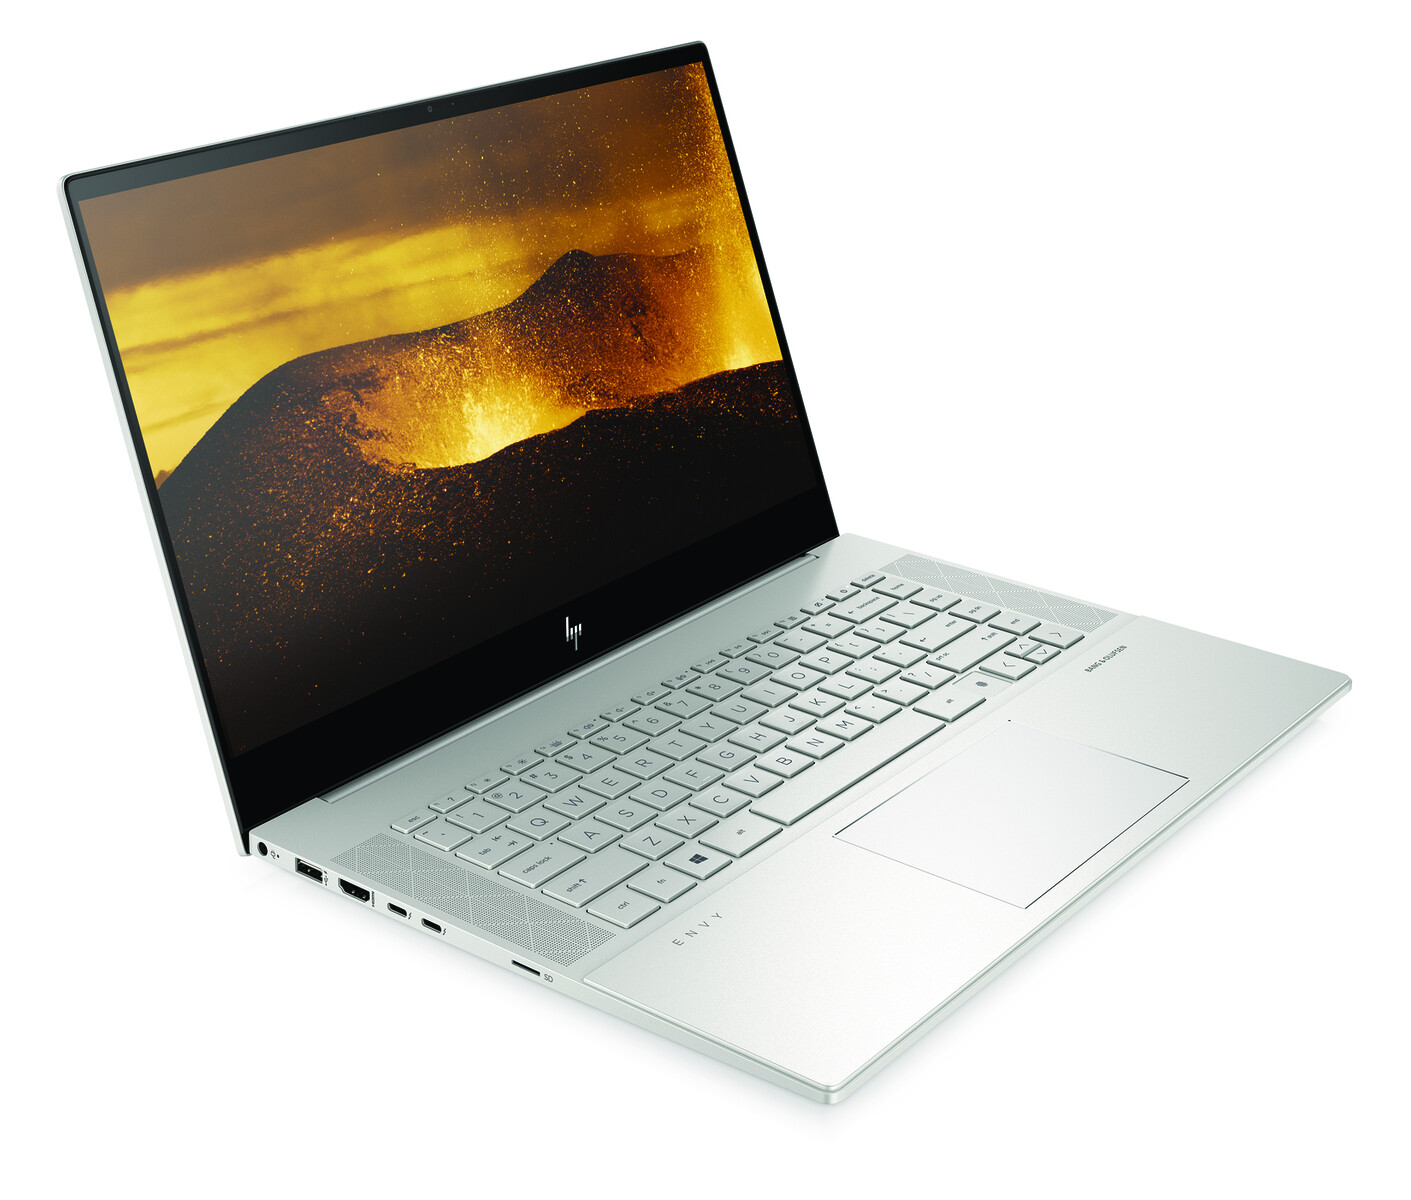
Kort testrapport 2020 Envy 15 Creator Core i7: dit is HP's antwoord op de Apple MacBook Pro
Evaluatie | Datum | Model | Gewicht | Hoogte | Formaat | Resolutie | Beste prijs |
|---|---|---|---|---|---|---|---|
| 83 % v7 (old) | 08-2020 | HP Envy 15-ep0098nr i7-10750H, GeForce RTX 2060 Max-Q | 2 kg | 19 mm | 15.60" | 3840x2160 | |
| 80.4 % v7 (old) | 06-2020 | HP Envy x360 15-dr1679cl i7-10510U, UHD Graphics 620 | 2.1 kg | 17.2 mm | 15.60" | 1920x1080 | |
| 85 % v7 (old) | 01-2020 | HP Spectre X360 15-5ZV31AV i7-10510U, GeForce MX250 | 2.1 kg | 19.3 mm | 15.60" | 3840x2160 | |
| 90.1 % v7 (old) | 06-2020 | Dell XPS 15 9500 Core i7 4K UHD i7-10875H, GeForce GTX 1650 Ti Mobile | 2 kg | 18 mm | 15.60" | 3840x2400 | |
| 86 % v7 (old) | 12-2019 | Lenovo Yoga C940-15IRH i7-9750H, GeForce GTX 1650 Max-Q | 2 kg | 19.7 mm | 15.60" | 1920x1080 | |
| 89.7 % v7 (old) | 12-2019 | Apple MacBook Pro 16 2019 i9 5500M i9-9880H, Radeon Pro 5500M | 2 kg | 16.2 mm | 16.00" | 3072x1920 |
| SD Card Reader | |
| average JPG Copy Test (av. of 3 runs) | |
| Dell XPS 15 9500 Core i7 4K UHD (Toshiba Exceria Pro SDXC 64 GB UHS-II) | |
| HP Spectre X360 15-5ZV31AV (Toshiba Exceria Pro M501 UHS-II) | |
| HP Envy x360 15-dr1679cl (Toshiba Exceria Pro SDXC 64 GB UHS-II) | |
| HP Envy 15-ep0098nr (Toshiba Exceria Pro M501 UHS-II) | |
| maximum AS SSD Seq Read Test (1GB) | |
| Dell XPS 15 9500 Core i7 4K UHD (Toshiba Exceria Pro SDXC 64 GB UHS-II) | |
| HP Spectre X360 15-5ZV31AV (Toshiba Exceria Pro M501 UHS-II) | |
| HP Envy 15-ep0098nr (Toshiba Exceria Pro M501 UHS-II) | |
| HP Envy x360 15-dr1679cl (Toshiba Exceria Pro SDXC 64 GB UHS-II) | |

")
")
| |||||||||||||||||||||||||
Helderheidsverdeling: 91 %
Helderheid in Batterij-modus: 374.3 cd/m²
Contrast: ∞:1 (Zwart: 0 cd/m²)
ΔE ColorChecker Calman: 5.47 | ∀{0.5-29.43 Ø4.71}
calibrated: 4.61
ΔE Greyscale Calman: 2.3 | ∀{0.09-98 Ø4.96}
100% sRGB (Argyll 1.6.3 3D)
87.8% AdobeRGB 1998 (Argyll 1.6.3 3D)
99.9% AdobeRGB 1998 (Argyll 3D)
100% sRGB (Argyll 3D)
88.5% Display P3 (Argyll 3D)
Gamma: 2.09
CCT: 6340 K
| HP Envy 15-ep0098nr Samsung SDC4145, AMOLED, 15.6", 3840x2160 | HP Envy x360 15-dr1679cl AU Optronics B156HW02, IPS, 15.6", 1920x1080 | HP Spectre X360 15-5ZV31AV AU Optronics AUO30EB, IPS, 15.6", 3840x2160 | Dell XPS 15 9500 Core i7 4K UHD Sharp LQ156R1, IPS, 15.6", 3840x2400 | Lenovo Yoga C940-15IRH LG Philips LP156WFC-SPU1, IPS, 15.6", 1920x1080 | Apple MacBook Pro 16 2019 i9 5500M APPA044, IPS, 16", 3072x1920 | |
|---|---|---|---|---|---|---|
| Display | -52% | -20% | 0% | -25% | ||
| Display P3 Coverage (%) | 88.5 | 39.28 -56% | 68.3 -23% | 89.7 1% | 61.5 -31% | |
| sRGB Coverage (%) | 100 | 58.8 -41% | 94.3 -6% | 100 0% | 92.7 -7% | |
| AdobeRGB 1998 Coverage (%) | 99.9 | 40.58 -59% | 68.4 -32% | 99.8 0% | 63.6 -36% | |
| Response Times | -2812% | -4206% | -3890% | -3599% | -3822% | |
| Response Time Grey 50% / Grey 80% * (ms) | 0.8 ? | 39.6 ? -4850% | 56.8 ? -7000% | 54 ? -6650% | 48.4 ? -5950% | 52.4 ? -6450% |
| Response Time Black / White * (ms) | 2.7 ? | 23.6 ? -774% | 40.8 ? -1411% | 33.2 ? -1130% | 36.4 ? -1248% | 34.9 ? -1193% |
| PWM Frequency (Hz) | 242.7 ? | 131700 | ||||
| Screen | -36% | -3% | 10% | -5% | 34% | |
| Brightness middle (cd/m²) | 374.3 | 261.2 -30% | 284.6 -24% | 557.9 49% | 484.8 30% | 519 39% |
| Brightness (cd/m²) | 379 | 248 -35% | 285 -25% | 541 43% | 463 22% | 477 26% |
| Brightness Distribution (%) | 91 | 92 1% | 85 -7% | 91 0% | 82 -10% | 86 -5% |
| Black Level * (cd/m²) | 0.38 | 0.25 | 0.39 | 0.26 | 0.39 | |
| Colorchecker dE 2000 * | 5.47 | 5.4 1% | 3.52 36% | 4.54 17% | 4.5 18% | 2.28 58% |
| Colorchecker dE 2000 max. * | 8.22 | 16.31 -98% | 5.56 32% | 7.92 4% | 7.55 8% | 6.54 20% |
| Colorchecker dE 2000 calibrated * | 4.61 | 3.81 17% | 3 35% | 3.82 17% | 1.19 74% | 0.86 81% |
| Greyscale dE 2000 * | 2.3 | 4.1 -78% | 3.2 -39% | 3.2 -39% | 5.7 -148% | 0.9 61% |
| Gamma | 2.09 105% | 2.53 87% | 2.28 96% | 1.99 111% | 2.45 90% | 2145 0% |
| CCT | 6340 103% | 6611 98% | 7070 92% | 6451 101% | 6101 107% | 6572 99% |
| Color Space (Percent of AdobeRGB 1998) (%) | 87.8 | 37.4 -57% | 61.1 -30% | 89.5 2% | 58.7 -33% | 78 -11% |
| Color Space (Percent of sRGB) (%) | 100 | 58.7 -41% | 93.8 -6% | 100 0% | 92.8 -7% | |
| Contrast (:1) | 687 | 1138 | 1431 | 1865 | 1331 | |
| Totaal Gemiddelde (Programma / Instellingen) | -967% /
-436% | -1410% /
-607% | -1293% /
-549% | -1210% /
-523% | -1894% /
-737% |
* ... kleiner is beter
Responstijd Scherm
| ↔ Responstijd Zwart naar Wit | ||
|---|---|---|
| 2.7 ms ... stijging ↗ en daling ↘ gecombineerd | ↗ 1.3 ms stijging | 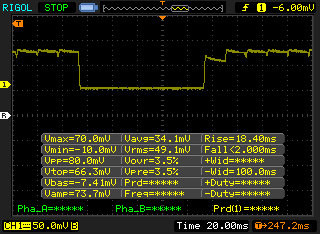 |
| ↘ 1.4 ms daling | ||
| Het scherm vertoonde erg snelle responstijden in onze tests en zou zeer geschikt moeten zijn voor snelle games. Ter vergelijking: alle testtoestellen variëren van 0.1 (minimum) tot 240 (maximum) ms. » 14 % van alle toestellen zijn beter. Dit betekent dat de gemeten responstijd beter is dan het gemiddelde (19.8 ms) van alle geteste toestellen. | ||
| ↔ Responstijd 50% Grijs naar 80% Grijs | ||
| 0.8 ms ... stijging ↗ en daling ↘ gecombineerd | ↗ 0.4 ms stijging | 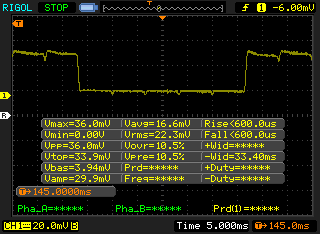 |
| ↘ 0.4 ms daling | ||
| Het scherm vertoonde erg snelle responstijden in onze tests en zou zeer geschikt moeten zijn voor snelle games. Ter vergelijking: alle testtoestellen variëren van 0.165 (minimum) tot 636 (maximum) ms. » 3 % van alle toestellen zijn beter. Dit betekent dat de gemeten responstijd beter is dan het gemiddelde (31 ms) van alle geteste toestellen. | ||
Screen Flickering / PWM (Pulse-Width Modulation)
| Screen flickering / PWM waargenomen | 242.7 Hz | ≤ 44 % helderheid instelling | 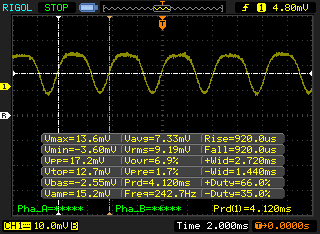 |
De achtergrondverlichting van het scherm flikkert op 242.7 Hz (in het slechtste geval, bijvoorbeeld bij gebruik van PWM) aan een helderheid van 44 % en lager. Boven deze helderheid zou er geen flickering / PWM mogen optreden. De frequentie van 242.7 Hz is redelijk laag en de meeste mensen die gevoelig zijn aan flickering kunnen dit dus waarnemen of geïrriteerde ogen krijgen (gebruikmakend van de vermelde helderheid en lager). Ter vergelijking: 52 % van alle geteste toestellen maakten geen gebruik van PWM om de schermhelderheid te verlagen. Als het wel werd gebruikt, werd een gemiddelde van 7757 (minimum: 5 - maximum: 343500) Hz waargenomen. | |||

Cinebench R15: CPU Multi 64Bit | CPU Single 64Bit
Blender: v2.79 BMW27 CPU
7-Zip 18.03: 7z b 4 -mmt1 | 7z b 4
Geekbench 5.5: Single-Core | Multi-Core
HWBOT x265 Benchmark v2.2: 4k Preset
LibreOffice : 20 Documents To PDF
R Benchmark 2.5: Overall mean
| Cinebench R20 / CPU (Multi Core) | |
| Eurocom Sky X4C i9-9900KS | |
| Asus TUF Gaming A15 FA506IV-HN172 | |
| MSI GS66 Stealth 10SFS | |
| MSI GE65 Raider 9SF-049US | |
| Dell XPS 15 9500 Core i7 4K UHD | |
| Acer Nitro 5 AN515-44-R5FT | |
| HP Envy 15-ep0098nr | |
| Gemiddeld Intel Core i7-10750H (1749 - 3325, n=43) | |
| Lenovo Yoga C940-15IRH | |
| Schenker Work 15 | |
| Cinebench R20 / CPU (Single Core) | |
| Eurocom Sky X4C i9-9900KS | |
| Dell XPS 15 9500 Core i7 4K UHD | |
| Asus TUF Gaming A15 FA506IV-HN172 | |
| MSI GS66 Stealth 10SFS | |
| MSI GE65 Raider 9SF-049US | |
| Gemiddeld Intel Core i7-10750H (431 - 504, n=43) | |
| Lenovo Yoga C940-15IRH | |
| HP Envy 15-ep0098nr | |
| Acer Nitro 5 AN515-44-R5FT | |
| Schenker Work 15 | |
| Cinebench R15 / CPU Multi 64Bit | |
| Eurocom Sky X4C i9-9900KS | |
| Asus TUF Gaming A15 FA506IV-HN172 | |
| MSI GS66 Stealth 10SFS | |
| MSI GE65 Raider 9SF-049US | |
| Acer Nitro 5 AN515-44-R5FT | |
| Dell XPS 15 9500 Core i7 4K UHD | |
| HP Envy 15-ep0098nr | |
| Gemiddeld Intel Core i7-10750H (804 - 1418, n=50) | |
| Lenovo Yoga C940-15IRH | |
| Schenker Work 15 | |
| Cinebench R15 / CPU Single 64Bit | |
| Eurocom Sky X4C i9-9900KS | |
| Dell XPS 15 9500 Core i7 4K UHD | |
| MSI GS66 Stealth 10SFS | |
| MSI GE65 Raider 9SF-049US | |
| HP Envy 15-ep0098nr | |
| Gemiddeld Intel Core i7-10750H (184 - 213, n=45) | |
| Asus TUF Gaming A15 FA506IV-HN172 | |
| Lenovo Yoga C940-15IRH | |
| Acer Nitro 5 AN515-44-R5FT | |
| Schenker Work 15 | |
| Blender / v2.79 BMW27 CPU | |
| Schenker Work 15 | |
| Schenker Work 15 | |
| Gemiddeld Intel Core i7-10750H (322 - 587, n=43) | |
| Dell XPS 15 9500 Core i7 4K UHD | |
| HP Envy 15-ep0098nr | |
| Acer Nitro 5 AN515-44-R5FT | |
| MSI GS66 Stealth 10SFS | |
| Asus TUF Gaming A15 FA506IV-HN172 | |
| Eurocom Sky X4C i9-9900KS | |
| 7-Zip 18.03 / 7z b 4 -mmt1 | |
| Eurocom Sky X4C i9-9900KS | |
| Dell XPS 15 9500 Core i7 4K UHD | |
| MSI GS66 Stealth 10SFS | |
| Gemiddeld Intel Core i7-10750H (4504 - 5470, n=43) | |
| Asus TUF Gaming A15 FA506IV-HN172 | |
| Schenker Work 15 | |
| Schenker Work 15 | |
| HP Envy 15-ep0098nr | |
| Acer Nitro 5 AN515-44-R5FT | |
| 7-Zip 18.03 / 7z b 4 | |
| Eurocom Sky X4C i9-9900KS | |
| Asus TUF Gaming A15 FA506IV-HN172 | |
| MSI GS66 Stealth 10SFS | |
| Acer Nitro 5 AN515-44-R5FT | |
| Dell XPS 15 9500 Core i7 4K UHD | |
| Gemiddeld Intel Core i7-10750H (26040 - 37345, n=43) | |
| HP Envy 15-ep0098nr | |
| Schenker Work 15 | |
| Schenker Work 15 | |
| Geekbench 5.5 / Single-Core | |
| Eurocom Sky X4C i9-9900KS | |
| Dell XPS 15 9500 Core i7 4K UHD | |
| MSI GS66 Stealth 10SFS | |
| HP Envy 15-ep0098nr | |
| Gemiddeld Intel Core i7-10750H (1114 - 1333, n=43) | |
| Asus TUF Gaming A15 FA506IV-HN172 | |
| Acer Nitro 5 AN515-44-R5FT | |
| Geekbench 5.5 / Multi-Core | |
| Eurocom Sky X4C i9-9900KS | |
| Dell XPS 15 9500 Core i7 4K UHD | |
| MSI GS66 Stealth 10SFS | |
| HP Envy 15-ep0098nr | |
| Gemiddeld Intel Core i7-10750H (4443 - 6674, n=43) | |
| Asus TUF Gaming A15 FA506IV-HN172 | |
| Acer Nitro 5 AN515-44-R5FT | |
| HWBOT x265 Benchmark v2.2 / 4k Preset | |
| Eurocom Sky X4C i9-9900KS | |
| MSI GS66 Stealth 10SFS | |
| Asus TUF Gaming A15 FA506IV-HN172 | |
| HP Envy 15-ep0098nr | |
| Dell XPS 15 9500 Core i7 4K UHD | |
| Gemiddeld Intel Core i7-10750H (5.54 - 11.6, n=43) | |
| Acer Nitro 5 AN515-44-R5FT | |
| Schenker Work 15 | |
| Schenker Work 15 | |
| LibreOffice / 20 Documents To PDF | |
| Acer Nitro 5 AN515-44-R5FT | |
| Gemiddeld Intel Core i7-10750H (43.1 - 99.2, n=43) | |
| Dell XPS 15 9500 Core i7 4K UHD | |
| MSI GS66 Stealth 10SFS | |
| HP Envy 15-ep0098nr | |
| Asus TUF Gaming A15 FA506IV-HN172 | |
| R Benchmark 2.5 / Overall mean | |
| Acer Nitro 5 AN515-44-R5FT | |
| Gemiddeld Intel Core i7-10750H (0.578 - 0.708, n=42) | |
| HP Envy 15-ep0098nr | |
| Asus TUF Gaming A15 FA506IV-HN172 | |
| MSI GS66 Stealth 10SFS | |
| Dell XPS 15 9500 Core i7 4K UHD | |
* ... kleiner is beter
| PCMark 8 Home Score Accelerated v2 | 3463 punten | |
| PCMark 8 Work Score Accelerated v2 | 4448 punten | |
| PCMark 10 Score | 5553 punten | |
Help | ||
| DPC Latencies / LatencyMon - interrupt to process latency (max), Web, Youtube, Prime95 | |
| Dell XPS 15 9500 Core i7 4K UHD | |
| HP Envy 15-ep0098nr | |
| HP Envy x360 15-dr1679cl | |
| MSI GS66 Stealth 10SFS | |
| MSI GS66 Stealth 10SE-045 | |
| Razer Blade 15 RZ09-0328 | |
| Asus TUF Gaming A15 FA506IV-HN172 | |
* ... kleiner is beter
| HP Envy 15-ep0098nr Intel Optane Memory H10 with Solid State Storage 32GB + 512GB HBRPEKNX0202A(L/H) | HP Envy x360 15-dr1679cl Intel Optane Memory H10 with Solid State Storage 32GB + 512GB HBRPEKNX0202A(L/H) | HP Spectre X360 15-5ZV31AV Intel SSD 660p 2TB SSDPEKNW020T8 | Dell XPS 15 9500 Core i7 4K UHD SK Hynix PC611 512GB | Apple MacBook Pro 16 2019 i9 5500M Apple SSD AP1024 7171 | |
|---|---|---|---|---|---|
| AS SSD | -13% | 32% | 49% | 80% | |
| Seq Read (MB/s) | 1005 | 931 -7% | 1220 21% | 2072 106% | 2531 152% |
| Seq Write (MB/s) | 436.8 | 331.5 -24% | 1152 164% | 1486 240% | 2289 424% |
| 4K Read (MB/s) | 51.5 | 72.8 41% | 52.3 2% | 47.41 -8% | 15.85 -69% |
| 4K Write (MB/s) | 88 | 119 35% | 146.6 67% | 117.6 34% | 39.88 -55% |
| 4K-64 Read (MB/s) | 517 | 389.7 -25% | 652 26% | 967 87% | 1267 145% |
| 4K-64 Write (MB/s) | 839 | 573 -32% | 847 1% | 715 -15% | 1749 108% |
| Access Time Read * (ms) | 0.088 | 0.07 20% | 0.077 12% | 0.057 35% | 0.122 -39% |
| Access Time Write * (ms) | 0.151 | 0.138 9% | 0.106 30% | 0.096 36% | 0.095 37% |
| Score Read (Points) | 669 | 556 -17% | 826 23% | 1222 83% | 1536 130% |
| Score Write (Points) | 970 | 725 -25% | 1109 14% | 981 1% | 2018 108% |
| Score Total (Points) | 1972 | 1565 -21% | 2371 20% | 2809 42% | 4317 119% |
| Copy ISO MB/s (MB/s) | 1173 | 593 -49% | 2070 76% | 1999 70% | 1995 70% |
| Copy Program MB/s (MB/s) | 769 | 495.5 -36% | 571 -26% | 627 -18% | 584 -24% |
| Copy Game MB/s (MB/s) | 1045 | 566 -46% | 1219 17% | 1001 -4% | 1135 9% |
| CrystalDiskMark 5.2 / 6 | 4% | 26% | 51% | 48% | |
| Write 4K (MB/s) | 100.2 | 125.6 25% | 151.5 51% | 123.3 23% | 55.5 -45% |
| Read 4K (MB/s) | 112.8 | 145.8 29% | 59.3 -47% | 41.85 -63% | 16.21 -86% |
| Write Seq (MB/s) | 537 | 509 -5% | 1424 165% | 2054 282% | 1959 265% |
| Read Seq (MB/s) | 1270 | 1536 21% | 1609 27% | 1617 27% | 1763 39% |
| Write 4K Q32T1 (MB/s) | 480.6 | 362.4 -25% | 393.6 -18% | 413 -14% | 398.5 -17% |
| Read 4K Q32T1 (MB/s) | 364.9 | 307.3 -16% | 369.4 1% | 377.5 3% | 648 78% |
| Write Seq Q32T1 (MB/s) | 1224 | 1320 8% | 1946 59% | 2705 121% | 2727 123% |
| Read Seq Q32T1 (MB/s) | 2635 | 2489 -6% | 1934 -27% | 3442 31% | 3242 23% |
| Totaal Gemiddelde (Programma / Instellingen) | -5% /
-7% | 29% /
30% | 50% /
50% | 64% /
68% |
* ... kleiner is beter

Disk Throttling: DiskSpd Read Loop, Queue Depth 8
| 3DMark 11 Performance | 18109 punten | |
| 3DMark Cloud Gate Standard Score | 25407 punten | |
| 3DMark Fire Strike Score | 14259 punten | |
| 3DMark Time Spy Score | 6052 punten | |
Help | ||
| lage | gem. | hoge | ultra | QHD | 4K | |
|---|---|---|---|---|---|---|
| The Witcher 3 (2015) | 310.8 | 209.6 | 119 | 62.9 | 45.5 | |
| Dota 2 Reborn (2015) | 141 | 129 | 120 | 114 | 83.2 | |
| Final Fantasy XV Benchmark (2018) | 139 | 79 | 61.3 | 43.6 | 24.9 | |
| X-Plane 11.11 (2018) | 103 | 90.7 | 77.4 | 59.3 |
| HP Envy 15-ep0098nr GeForce RTX 2060 Max-Q, i7-10750H, Intel Optane Memory H10 with Solid State Storage 32GB + 512GB HBRPEKNX0202A(L/H) | HP Envy x360 15-dr1679cl UHD Graphics 620, i7-10510U, Intel Optane Memory H10 with Solid State Storage 32GB + 512GB HBRPEKNX0202A(L/H) | HP Spectre X360 15-5ZV31AV GeForce MX250, i7-10510U, Intel SSD 660p 2TB SSDPEKNW020T8 | Dell XPS 15 9500 Core i7 4K UHD GeForce GTX 1650 Ti Mobile, i7-10875H, SK Hynix PC611 512GB | Apple MacBook Pro 16 2019 i9 5500M Radeon Pro 5500M, i9-9880H, Apple SSD AP1024 7171 | |
|---|---|---|---|---|---|
| Noise | 11% | 14% | 11% | 8% | |
| uit / omgeving * (dB) | 26.4 | 28 -6% | 30.1 -14% | 28.4 -8% | 29.8 -13% |
| Idle Minimum * (dB) | 32.2 | 28 13% | 30.1 7% | 28.4 12% | 29.9 7% |
| Idle Average * (dB) | 32.2 | 30.2 6% | 30.1 7% | 28.4 12% | 29.9 7% |
| Idle Maximum * (dB) | 32.2 | 31.5 2% | 30.1 7% | 28.4 12% | 29.9 7% |
| Load Average * (dB) | 48.3 | 35.7 26% | 30.1 38% | 46 5% | 43 11% |
| Witcher 3 ultra * (dB) | 53.7 | 39.7 26% | 42 22% | 45.4 15% | |
| Load Maximum * (dB) | 58.8 | 43.1 27% | 42 29% | 47.1 20% | 46.1 22% |
* ... kleiner is beter
Geluidsniveau
| Onbelast |
| 32.2 / 32.2 / 32.2 dB (A) |
| Belasting |
| 48.3 / 58.8 dB (A) |
 | ||
30 dB stil 40 dB(A) hoorbaar 50 dB(A) luid |
||
min: | ||
(-) De maximumtemperatuur aan de bovenzijde bedraagt 47.6 °C / 118 F, vergeleken met het gemiddelde van 36.8 °C / 98 F, variërend van 21 tot 71 °C voor de klasse Multimedia.
(-) De bodem warmt op tot een maximum van 52 °C / 126 F, vergeleken met een gemiddelde van 39.1 °C / 102 F
(+) Bij onbelast gebruik bedraagt de gemiddelde temperatuur voor de bovenzijde 26.1 °C / 79 F, vergeleken met het apparaatgemiddelde van 31.3 °C / 88 F.
(±) Bij het spelen van The Witcher 3 is de gemiddelde temperatuur voor de bovenzijde 32.4 °C / 90 F, vergeleken met het apparaatgemiddelde van 31.3 °C / 88 F.
(+) De palmsteunen en het touchpad zijn met een maximum van ###max## °C / 89.2 F koeler dan de huidtemperatuur en voelen daarom koel aan.
(-) De gemiddelde temperatuur van de handpalmsteun van soortgelijke toestellen bedroeg 28.7 °C / 83.7 F (-3.1 °C / -5.5 F).
HP Envy 15-ep0098nr audioanalyse
(±) | luidspreker luidheid is gemiddeld maar goed (79.9 dB)
Bas 100 - 315 Hz
(-) | bijna geen lage tonen - gemiddeld 15.8% lager dan de mediaan
(±) | lineariteit van de lage tonen is gemiddeld (14.9% delta ten opzichte van de vorige frequentie)
Midden 400 - 2000 Hz
(+) | evenwichtige middens - slechts 3.7% verwijderd van de mediaan
(+) | de middentonen zijn lineair (5.9% delta ten opzichte van de vorige frequentie)
Hoog 2 - 16 kHz
(+) | evenwichtige hoogtepunten - slechts 1.8% verwijderd van de mediaan
(+) | de hoge tonen zijn lineair (4% delta naar de vorige frequentie)
Algemeen 100 - 16.000 Hz
(±) | lineariteit van het totale geluid is gemiddeld (16.2% verschil met de mediaan)
Vergeleken met dezelfde klasse
» 41% van alle geteste apparaten in deze klasse waren beter, 7% vergelijkbaar, 51% slechter
» De beste had een delta van 5%, het gemiddelde was 17%, de slechtste was 45%
Vergeleken met alle geteste toestellen
» 26% van alle geteste apparaten waren beter, 6% gelijk, 68% slechter
» De beste had een delta van 4%, het gemiddelde was 23%, de slechtste was 134%
Apple MacBook 12 (Early 2016) 1.1 GHz audioanalyse
(+) | luidsprekers kunnen relatief luid spelen (83.6 dB)
Bas 100 - 315 Hz
(±) | verminderde zeebaars - gemiddeld 11.3% lager dan de mediaan
(±) | lineariteit van de lage tonen is gemiddeld (14.2% delta ten opzichte van de vorige frequentie)
Midden 400 - 2000 Hz
(+) | evenwichtige middens - slechts 2.4% verwijderd van de mediaan
(+) | de middentonen zijn lineair (5.5% delta ten opzichte van de vorige frequentie)
Hoog 2 - 16 kHz
(+) | evenwichtige hoogtepunten - slechts 2% verwijderd van de mediaan
(+) | de hoge tonen zijn lineair (4.5% delta naar de vorige frequentie)
Algemeen 100 - 16.000 Hz
(+) | het totale geluid is lineair (10.2% verschil met de mediaan)
Vergeleken met dezelfde klasse
» 7% van alle geteste apparaten in deze klasse waren beter, 2% vergelijkbaar, 90% slechter
» De beste had een delta van 5%, het gemiddelde was 18%, de slechtste was 53%
Vergeleken met alle geteste toestellen
» 5% van alle geteste apparaten waren beter, 1% gelijk, 94% slechter
» De beste had een delta van 4%, het gemiddelde was 23%, de slechtste was 134%
| Uit / Standby | |
| Inactief | |
| Belasting |
|
Key:
min: | |
| HP Envy 15-ep0098nr i7-10750H, GeForce RTX 2060 Max-Q, Intel Optane Memory H10 with Solid State Storage 32GB + 512GB HBRPEKNX0202A(L/H), AMOLED, 3840x2160, 15.6" | HP Envy x360 15-dr1679cl i7-10510U, UHD Graphics 620, Intel Optane Memory H10 with Solid State Storage 32GB + 512GB HBRPEKNX0202A(L/H), IPS, 1920x1080, 15.6" | HP Spectre X360 15-5ZV31AV i7-10510U, GeForce MX250, Intel SSD 660p 2TB SSDPEKNW020T8, IPS, 3840x2160, 15.6" | Dell XPS 15 9500 Core i7 4K UHD i7-10875H, GeForce GTX 1650 Ti Mobile, SK Hynix PC611 512GB, IPS, 3840x2400, 15.6" | Apple MacBook Pro 16 2019 i9 5500M i9-9880H, Radeon Pro 5500M, Apple SSD AP1024 7171, IPS, 3072x1920, 16" | Lenovo Yoga C940-15IRH i7-9750H, GeForce GTX 1650 Max-Q, Intel Optane Memory H10 with Solid State Storage 32GB + 512GB HBRPEKNX0202A(L/H), IPS, 1920x1080, 15.6" | |
|---|---|---|---|---|---|---|
| Power Consumption | 58% | 48% | 15% | 28% | 20% | |
| Idle Minimum * (Watt) | 9.2 | 4.3 53% | 5.2 43% | 5.7 38% | 3.7 60% | 5.2 43% |
| Idle Average * (Watt) | 14.5 | 7.2 50% | 8.5 41% | 13.5 7% | 12.1 17% | 10.7 26% |
| Idle Maximum * (Watt) | 18 | 7.5 58% | 8.7 52% | 19.6 -9% | 17 6% | 24.3 -35% |
| Load Average * (Watt) | 110.9 | 40.4 64% | 65.6 41% | 114.1 -3% | 91.5 17% | 84.4 24% |
| Witcher 3 ultra * (Watt) | 125.5 | 56.5 55% | 93 26% | 103 18% | 83.9 33% | |
| Load Maximum * (Watt) | 194.6 | 65.7 66% | 92.4 53% | 135.2 31% | 102.3 47% | 142.8 27% |
* ... kleiner is beter
| HP Envy 15-ep0098nr i7-10750H, GeForce RTX 2060 Max-Q, 83 Wh | HP Envy x360 15-dr1679cl i7-10510U, UHD Graphics 620, 55.67 Wh | HP Spectre X360 15-5ZV31AV i7-10510U, GeForce MX250, 84 Wh | Dell XPS 15 9500 Core i7 4K UHD i7-10875H, GeForce GTX 1650 Ti Mobile, 86 Wh | Apple MacBook Pro 15 2019 i9 Vega 20 i9-9980HK, Radeon Pro Vega 20, 83 Wh | Lenovo Yoga C940-15IRH i7-9750H, GeForce GTX 1650 Max-Q, 69 Wh | |
|---|---|---|---|---|---|---|
| Batterijduur | 55% | 71% | 43% | 92% | 15% | |
| Reader / Idle (h) | 15 | 25.4 69% | 22.6 51% | 23 53% | 18.2 21% | |
| WiFi v1.3 (h) | 6 | 9.2 53% | 10.8 80% | 9.1 52% | 11.5 92% | 9.7 62% |
| Load (h) | 1.6 | 2.3 44% | 2.9 81% | 2 25% | 1 -37% |
Pro
Contra
Dit is de verkorte versie van het originele artikel. Het volledige, Engelse testrapport vind je hier.
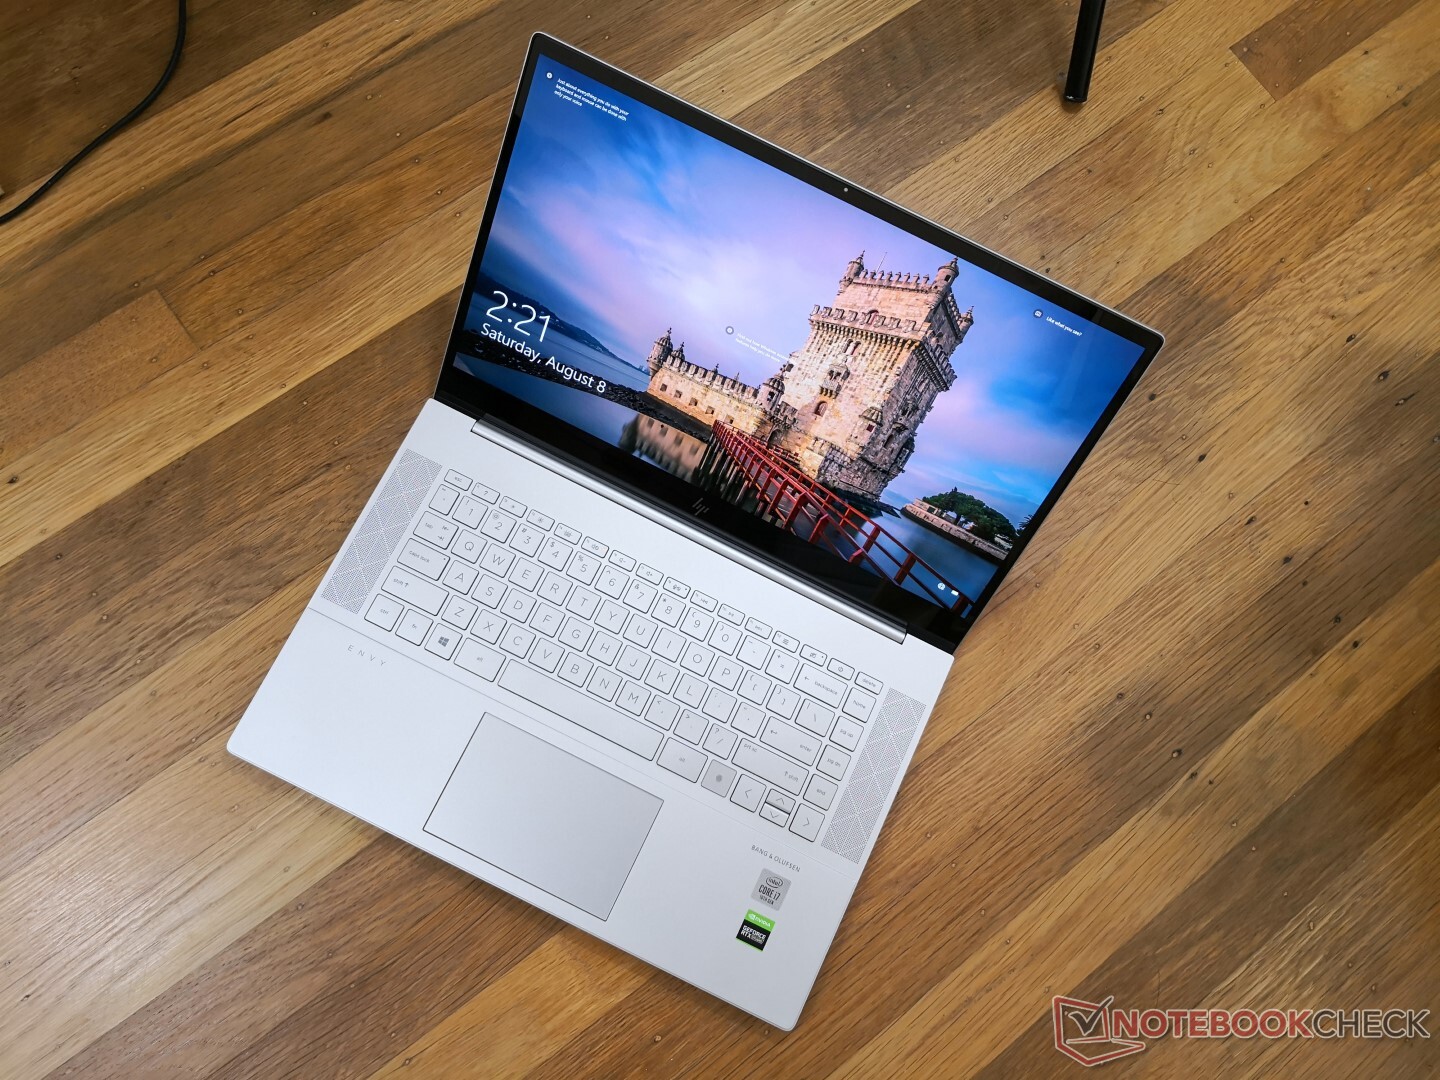
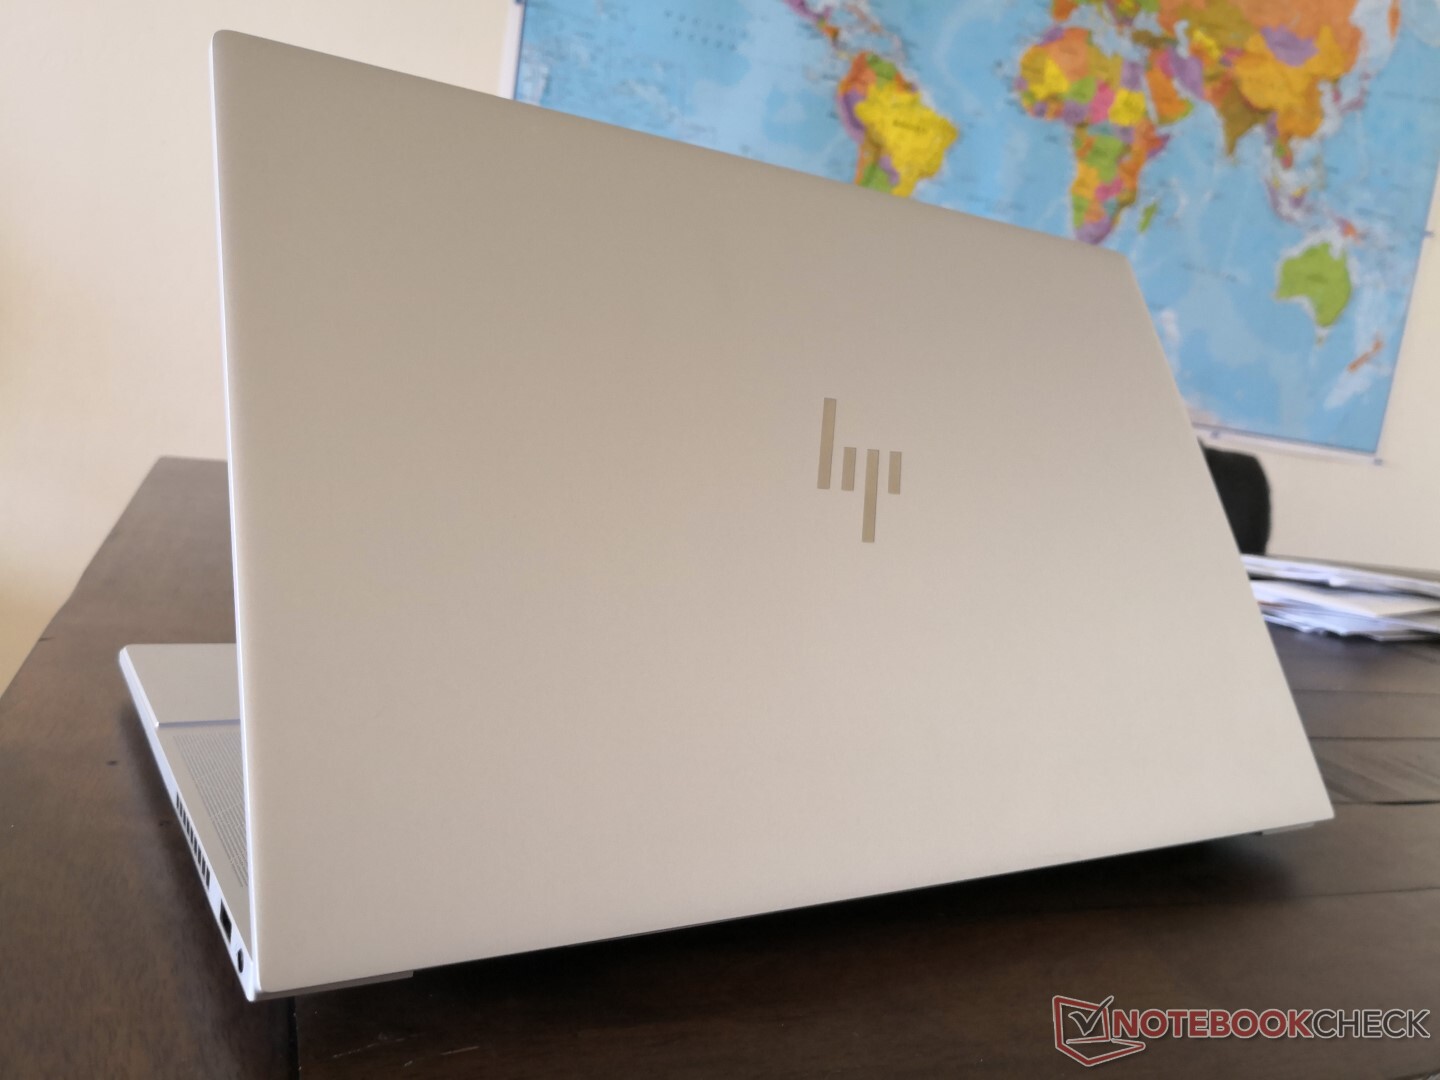
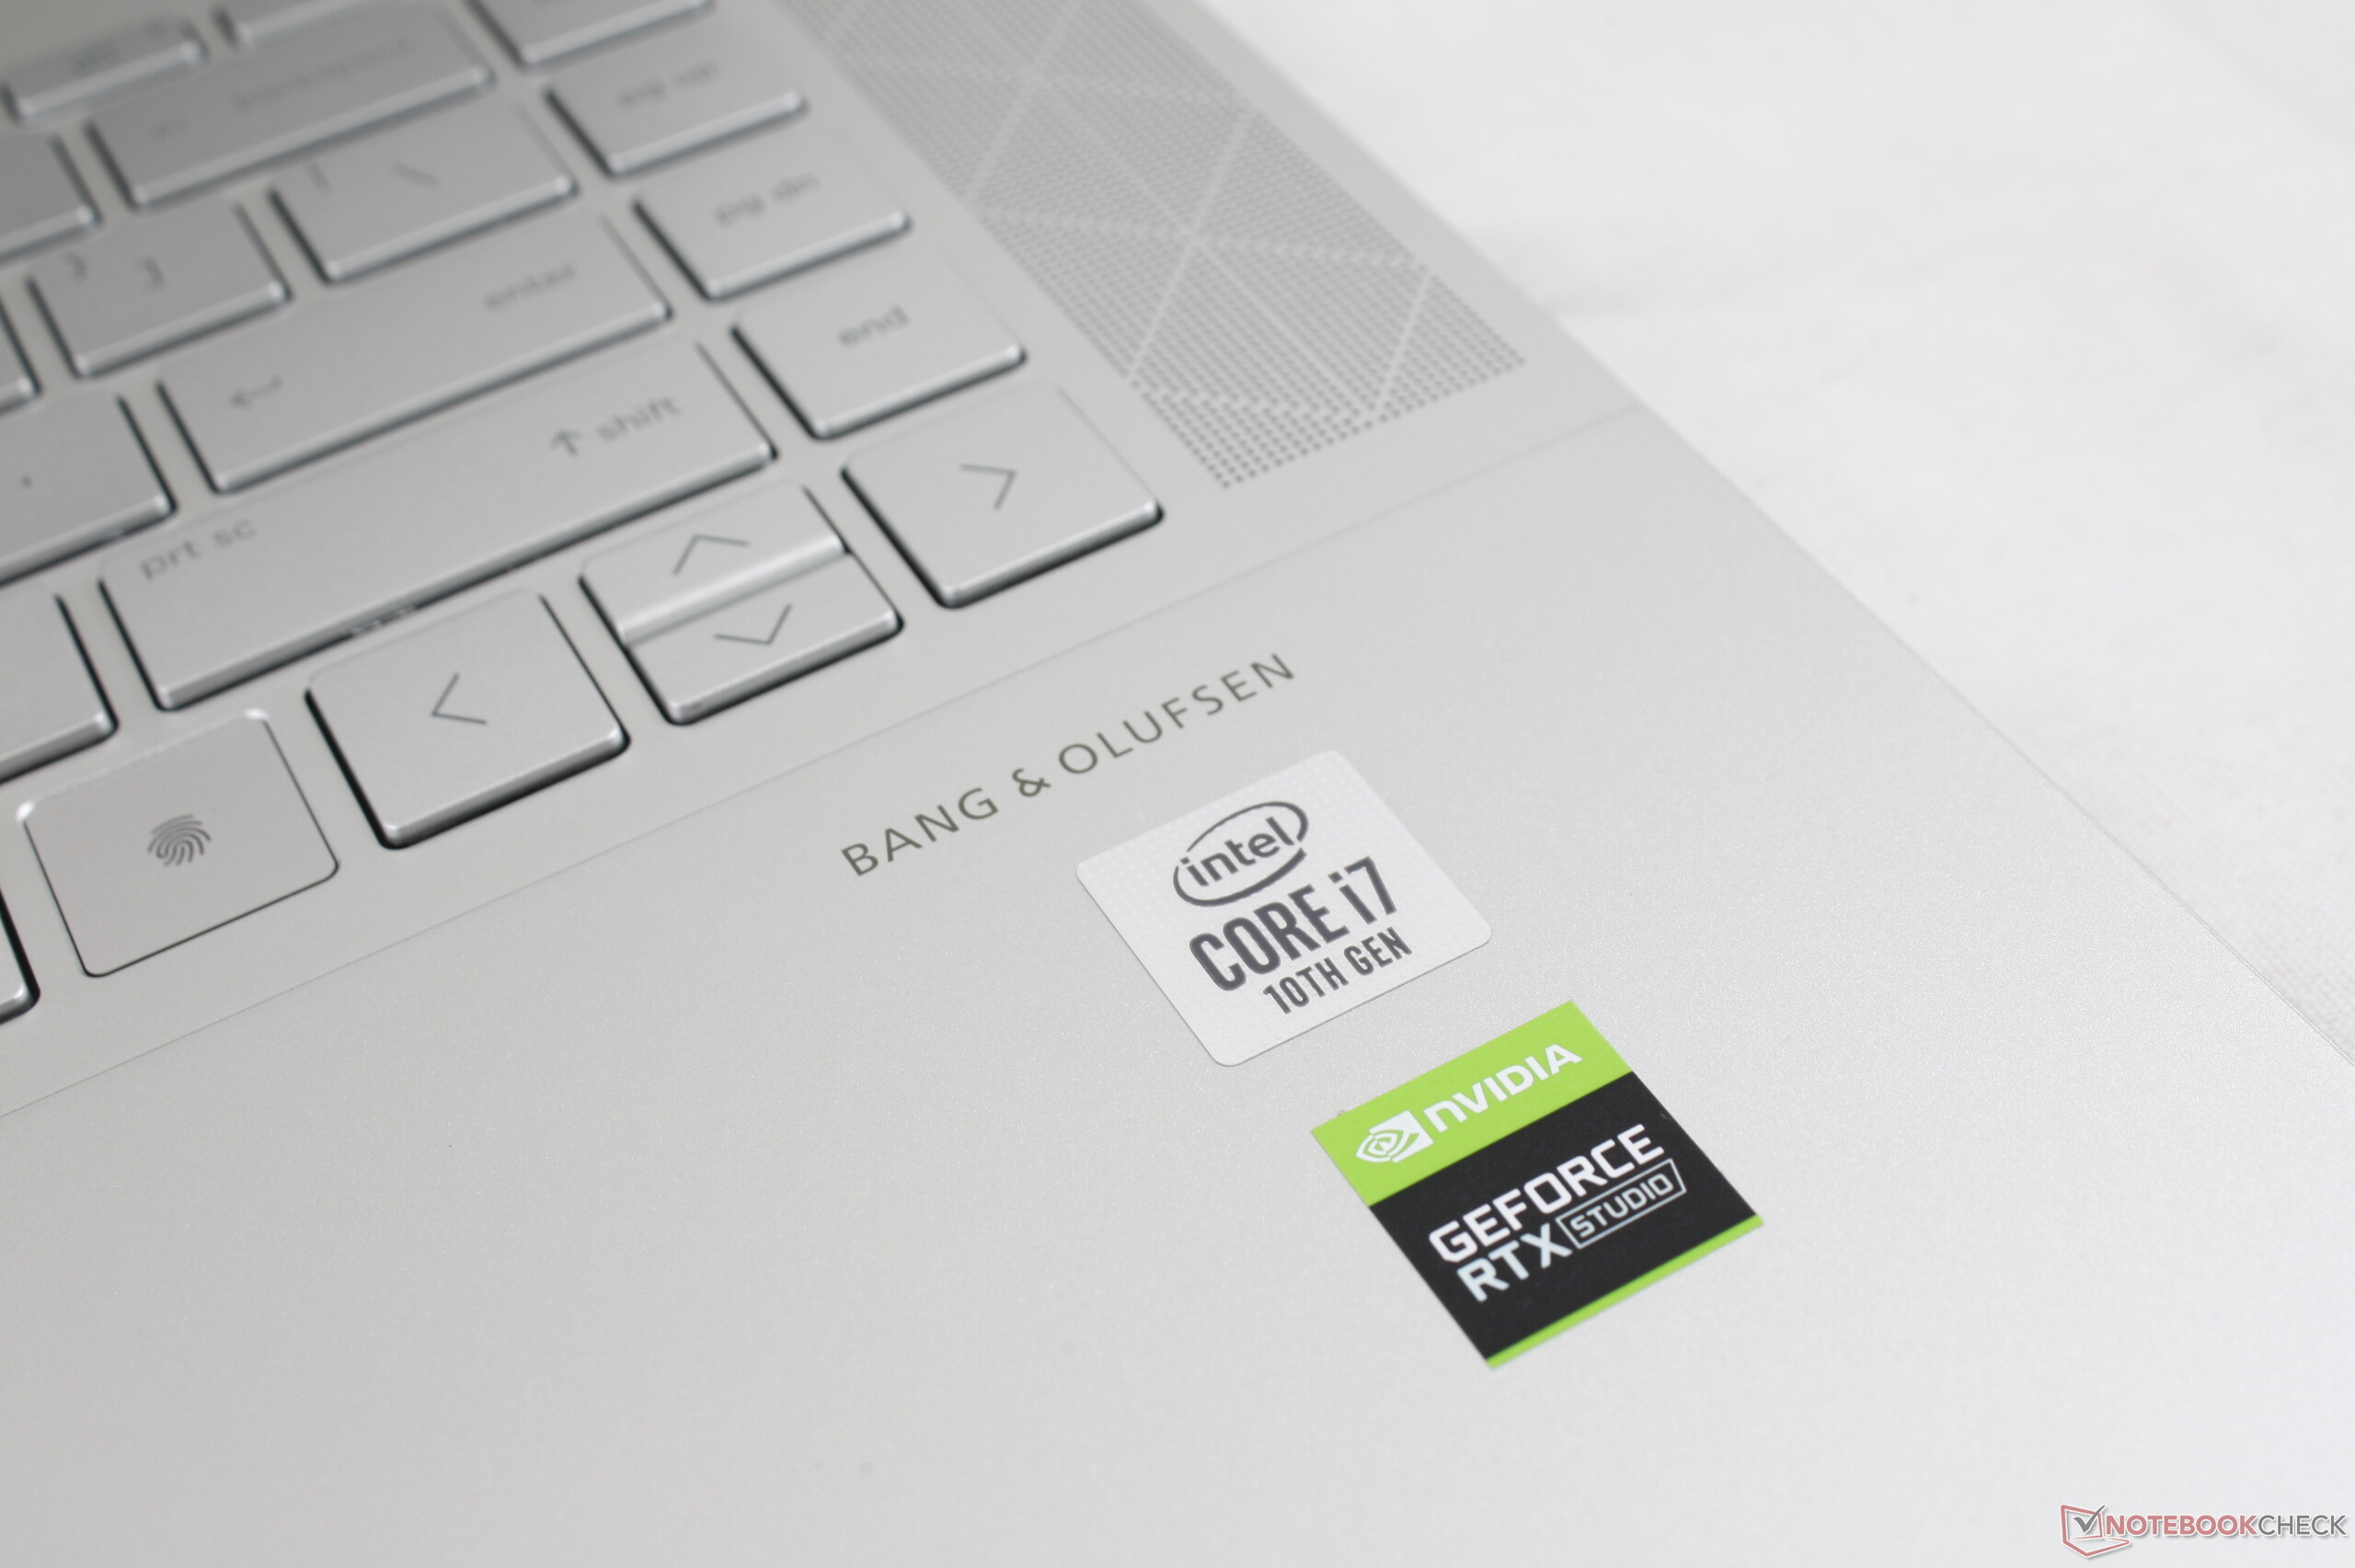
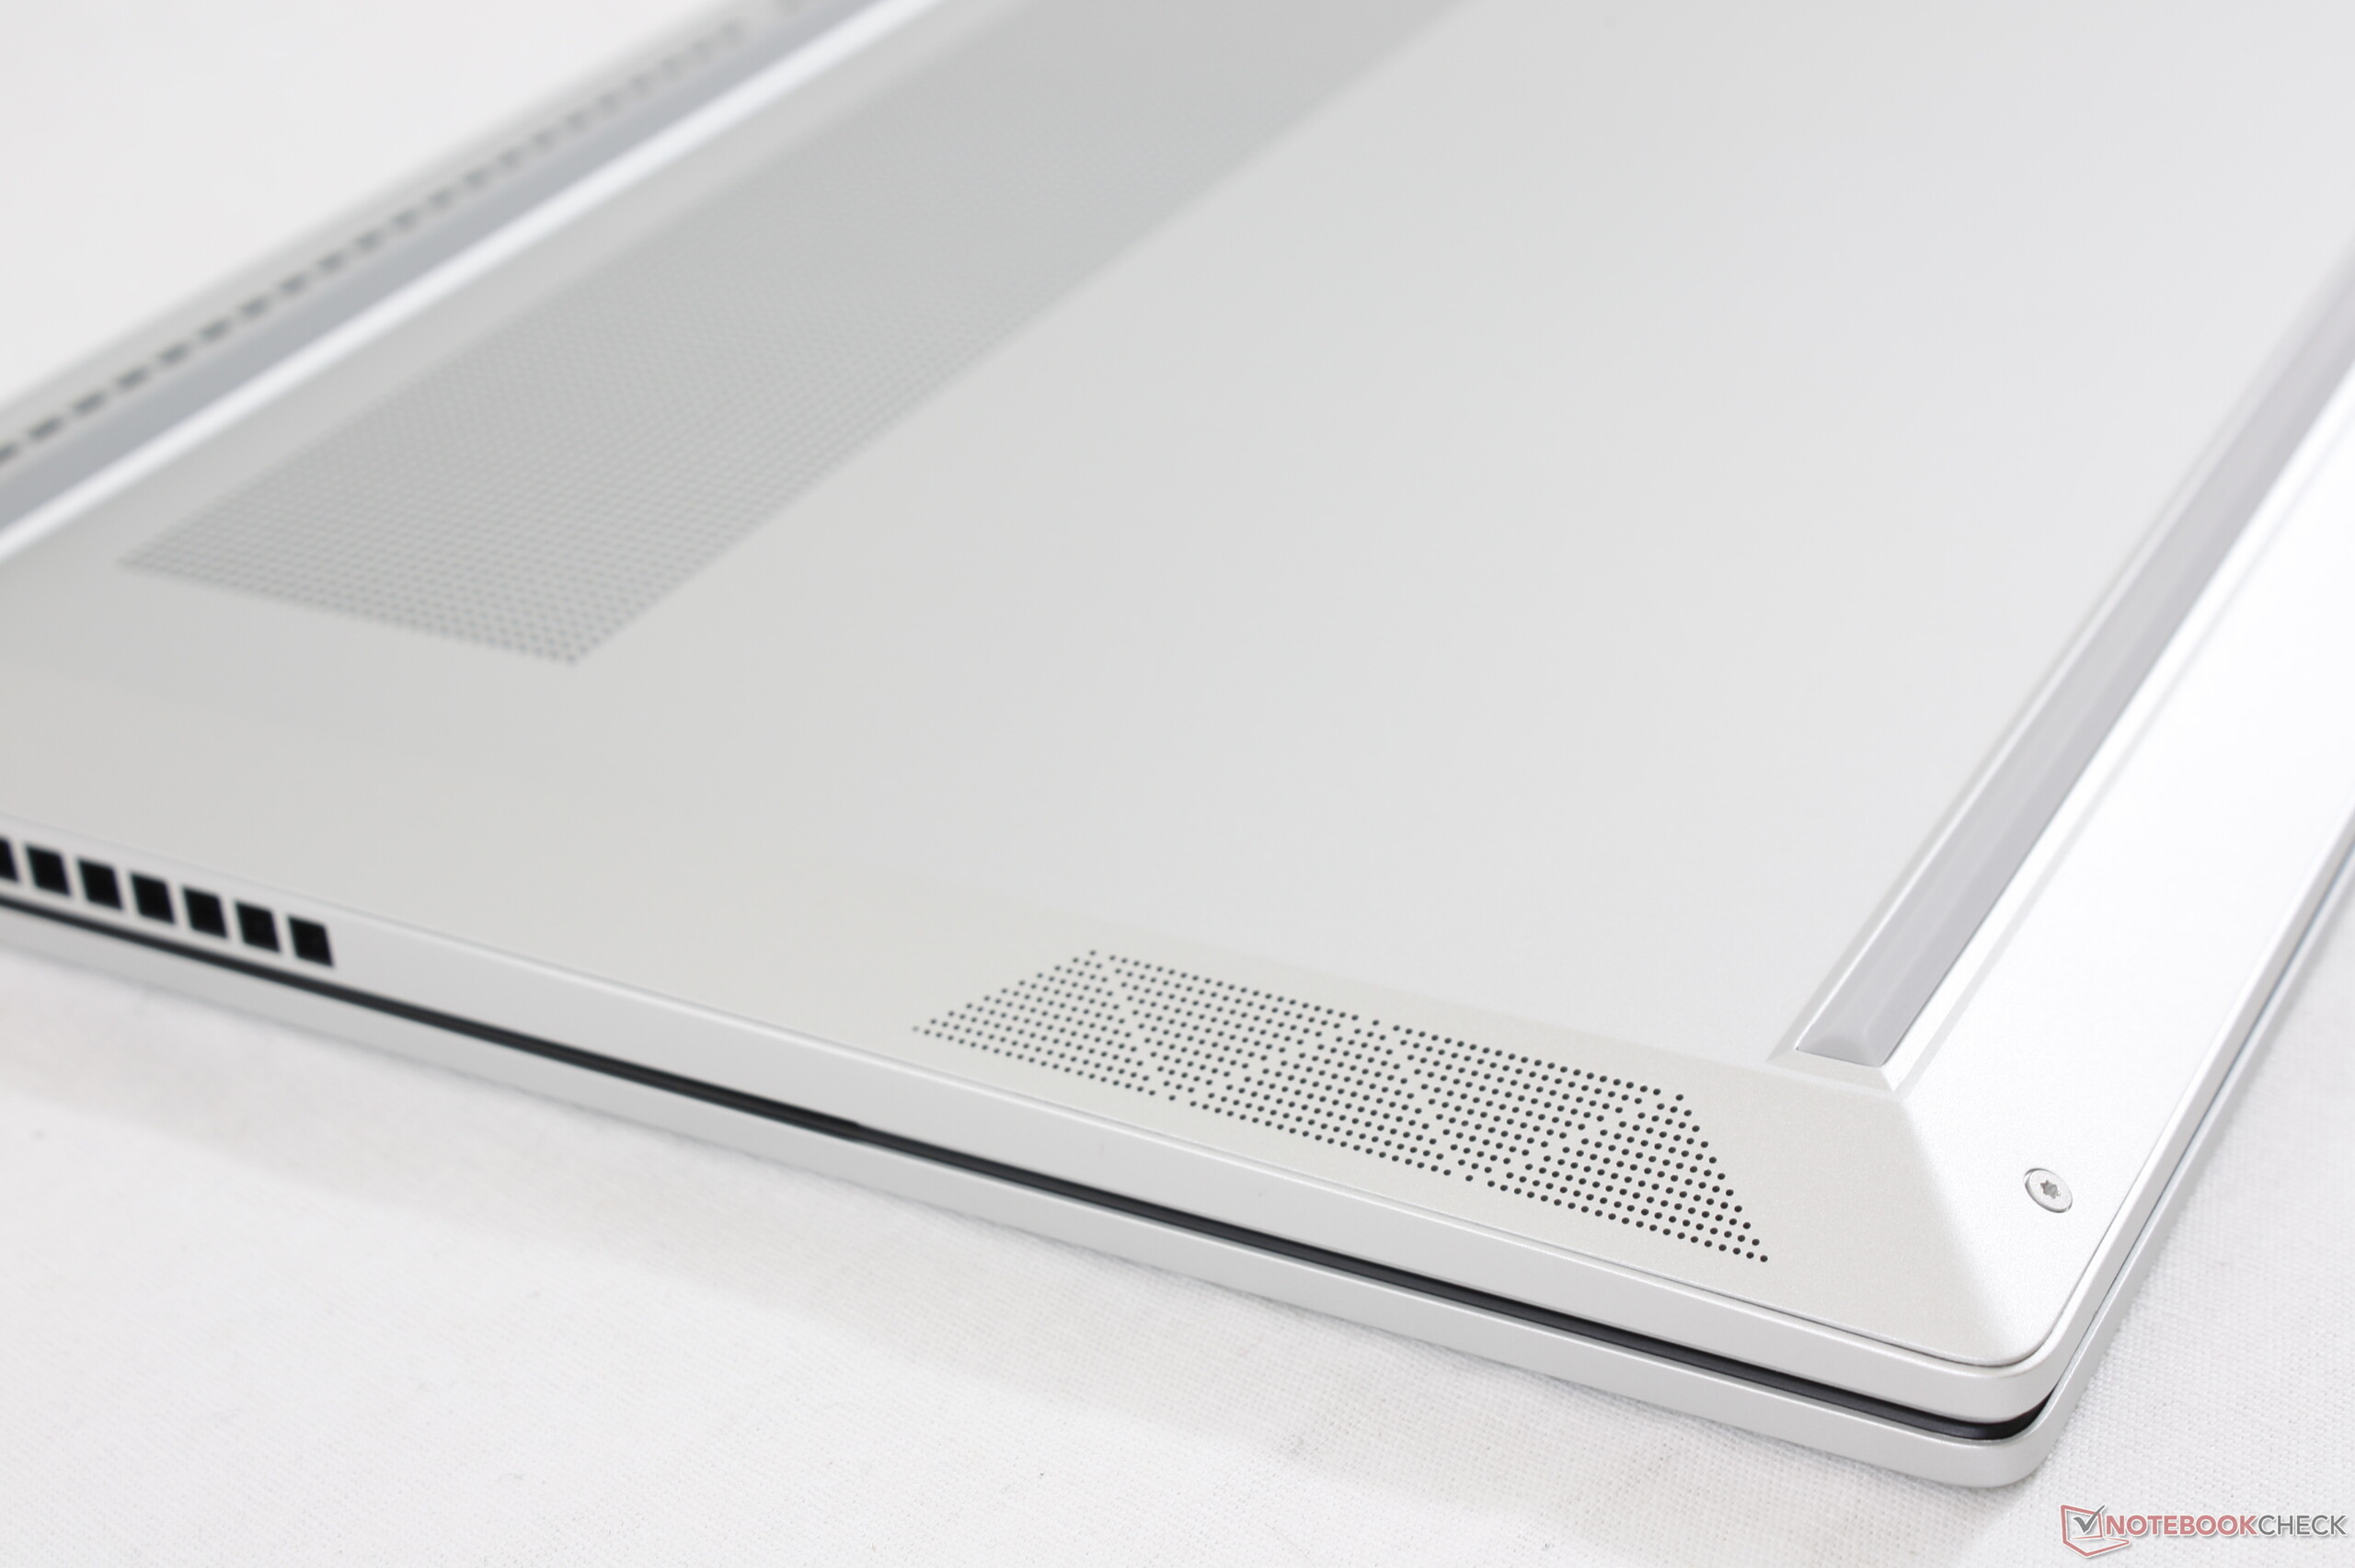
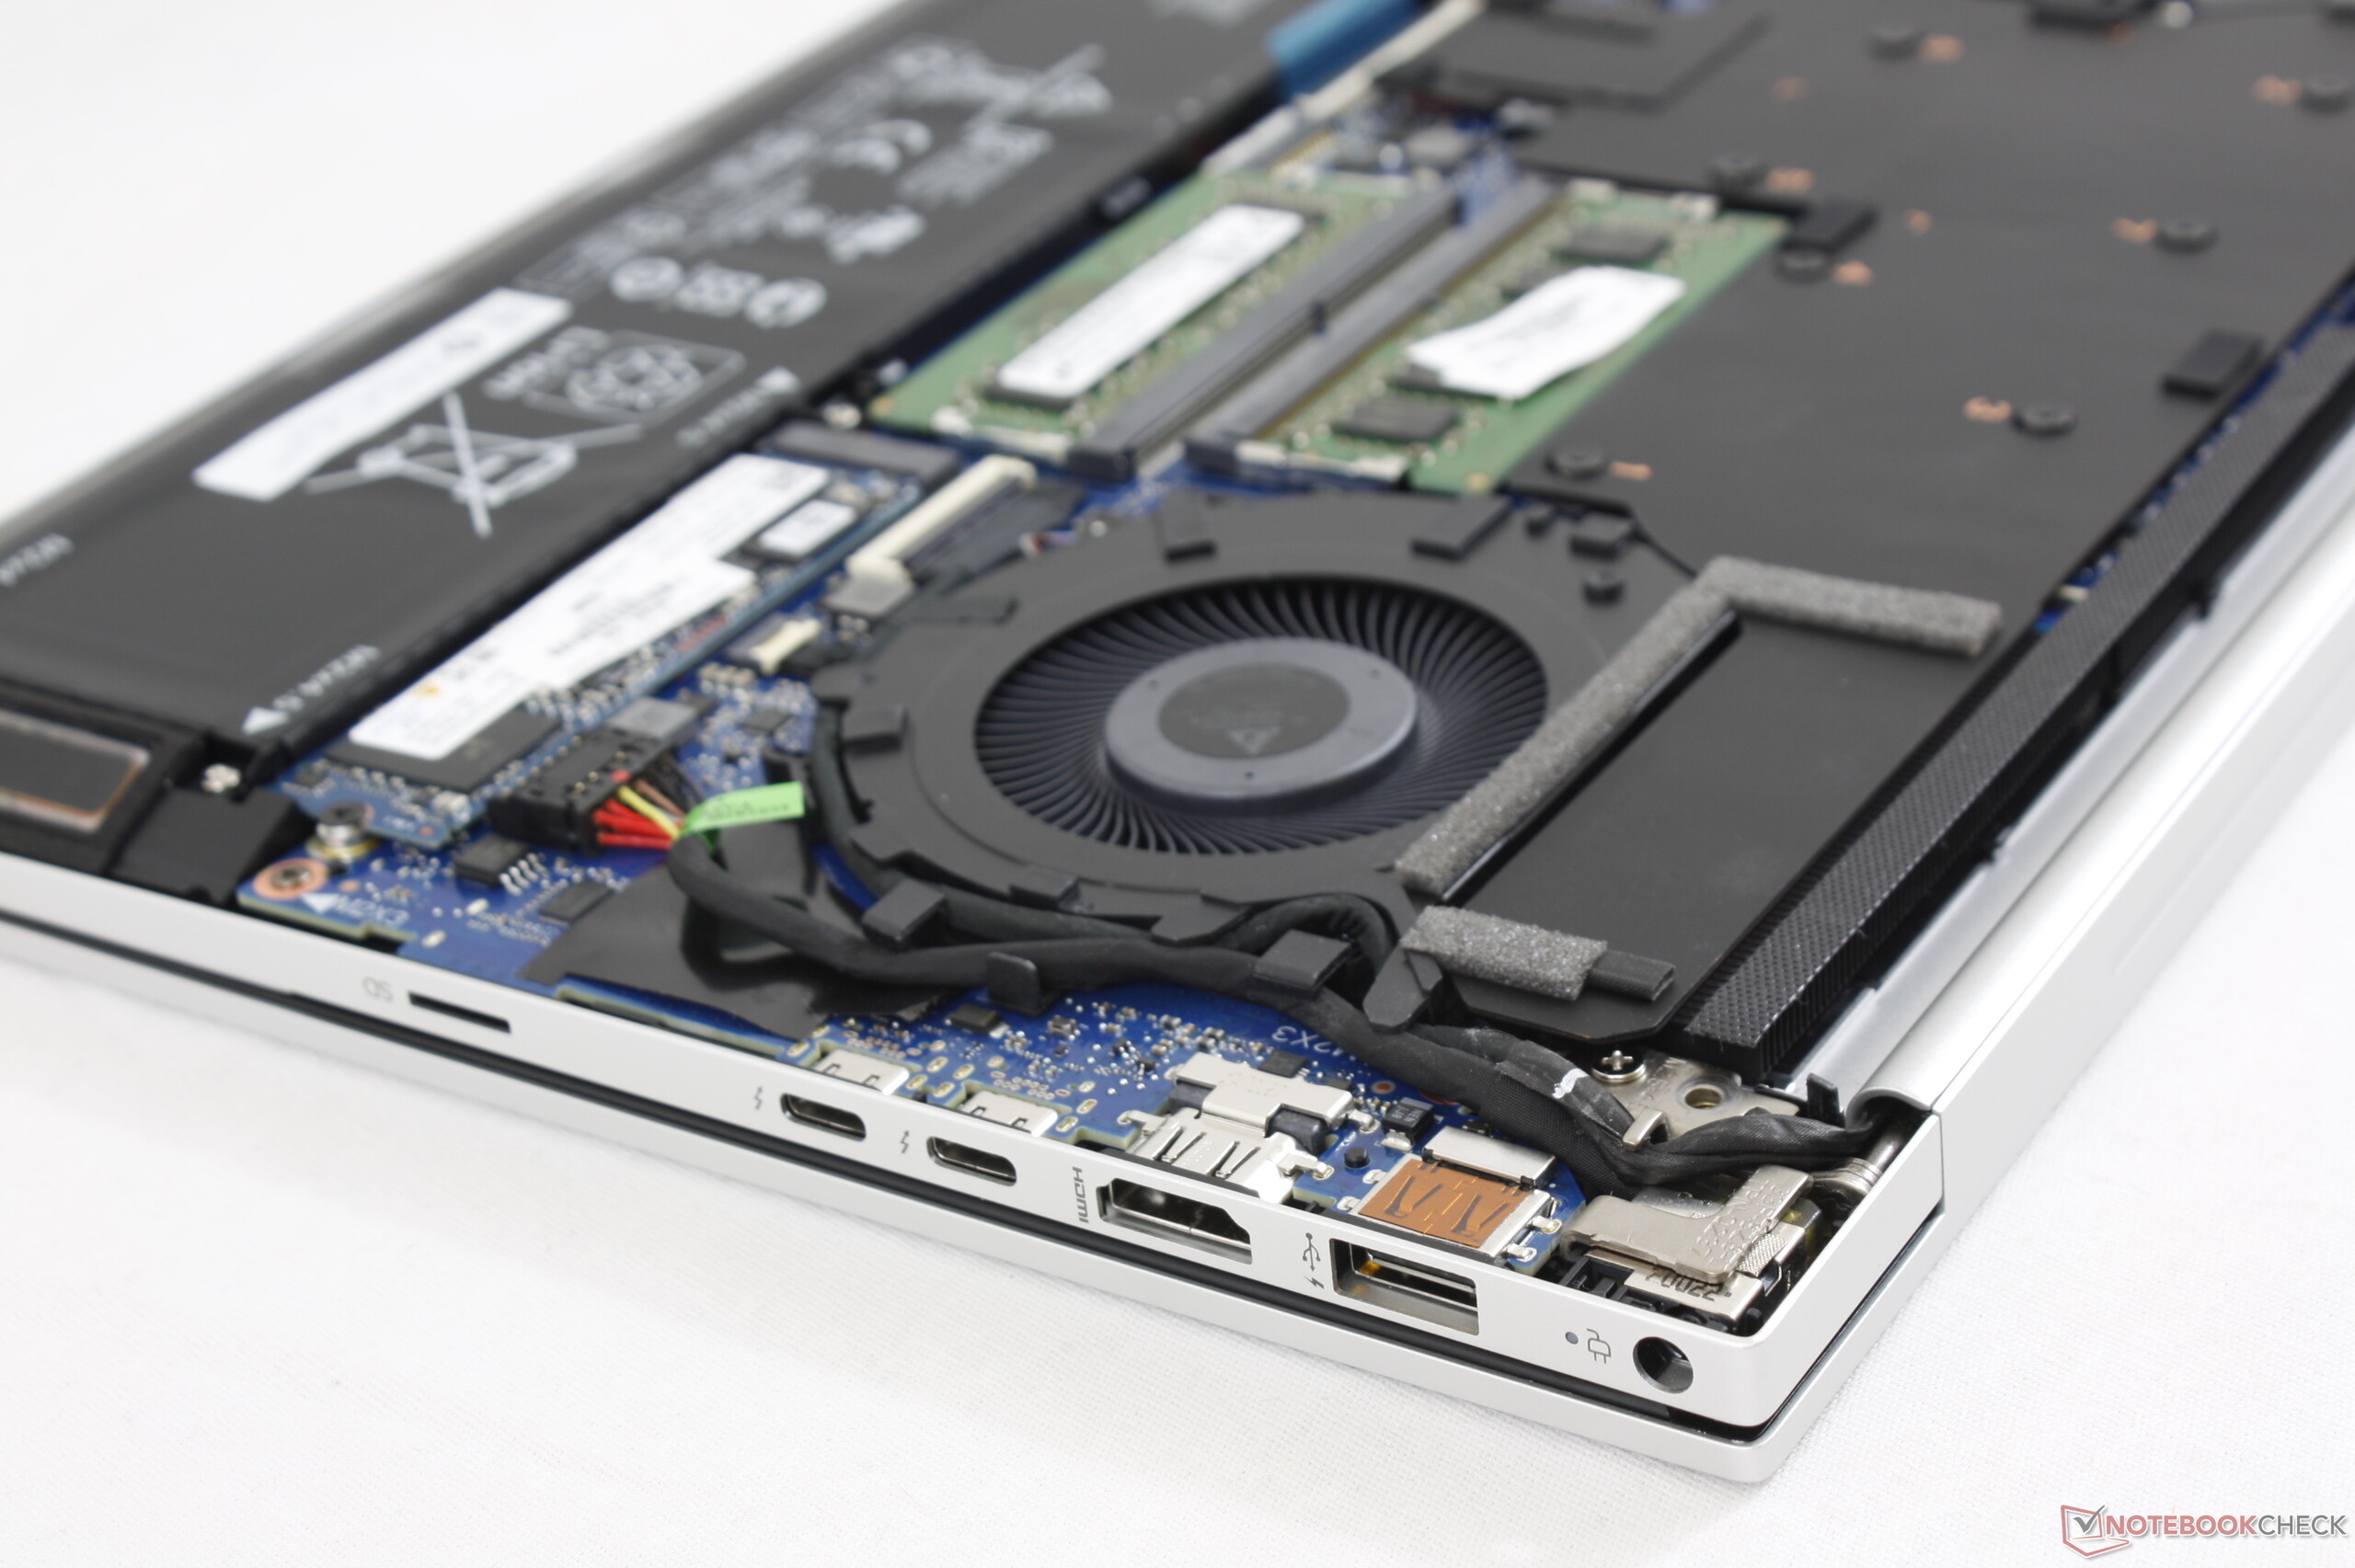
HP heeft zijn Envy 15-serie in wezen opnieuw uitgevonden. Dit nieuwste model is compleet anders dan de versie van de laatste generatie, waarbij bijna alle veranderingen ten goede komen. Afgezien van het professionelere uiterlijk, gemakkelijker onderhoud en nieuwe opties uit de Core H-serie, is de optionele GeForce RTX 2060 Max-Q GPU veel sneller dan wat de MacBook Pro 15 of MacBook Pro 16 op dit moment te bieden heeft, terwijl hij minder kost in de proces dat precies is wat HP wilde.
De hardware op gaming-niveau betekent echter dat de Envy 15 ook veel van dezelfde nadelen erft als een dunne gaming-laptop. Laat u niet misleiden door zijn slanke Ultrabook-achtige uiterlijk, want deze laptop zal niet zo lang werken als een typische Intel UHD of GeForce MX-aangedreven Ultrabook, noch zal hij zo stil of licht zijn. Het is bijna een vermomde gaming-laptop, ook al wordt hij op praktisch dezelfde manier geadverteerd aan professionele creatievelingen als de Gigabyte Aero-serie. De 200-W-adapter is bijvoorbeeld aanzienlijk groter en dus omslachtiger om mee te nemen dan welke Ultrabook dan ook. Als gebruikers deze inherente nadelen begrijpen, zullen ze blij zijn met de nieuwe Envy 15 en zijn hoge prestatieniveau gezien de prijs en vormfactor. Anders zou je beter af zijn met een Spectre als je workloads voornamelijk bestaan uit surfen op het web en tekstverwerking.
Er zijn een handvol aanpassingen die we graag zouden willen zien om de Envy 15 beter te maken. Ondersteuning voor opladen via USB-C zou buitengewoon handig zijn voor reizigers, aangezien de grote AC-adapter van 200 W dan thuis kan blijven wanneer deze niet nodig is. Zowel de clickpad als de scharnieren zouden steviger mogen zijn om de hoge prijs van het nieuwe model beter te weerspiegelen. Een minder opdringerige positionering voor de vingerafdruklezer zou gebruikers die afhangen van de Fn-toets tevreden stellen.
Wil je een MacBook Pro, maar wil je ook snellere graphics, OLED en meer poortopties? Dan is de Envy 15 2020 het bekijken waard. De nieuwe Envy wordt niet langer aangedreven door ULV-processors en herbergt krachtige gaming-achtige hardware-opties verpakt in een Ultrabook-achtige behuizing voor een uitstekende gulden middenweg.
HP Envy 15-ep0098nr
- 31-08-2022 v7 (old)
Allen Ngo
Price comparison
