Kort testrapport Apple MacBook Pro 16 2019 Laptop: Een overtuigende door Core i9-9880H en Radeon Pro 5500M aangedreven laptop
Evaluatie | Datum | Model | Gewicht | Hoogte | Formaat | Resolutie | Beste prijs |
|---|---|---|---|---|---|---|---|
| 89.7 % v7 (old) | 12-2019 | Apple MacBook Pro 16 2019 i9 5500M i9-9880H, Radeon Pro 5500M | 2 kg | 16.2 mm | 16.00" | 3072x1920 | |
| 87.1 % v7 (old) | 02-2020 | Lenovo ThinkPad X1 Extreme 2019 20QV000WGE i7-9750H, GeForce GTX 1650 Mobile | 1.7 kg | 18.7 mm | 15.60" | 3840x2160 | |
| 87.8 % v7 (old) | 08-2019 | Dell XPS 15 7590 9980HK GTX 1650 i9-9980HK, GeForce GTX 1650 Mobile | 2 kg | 17 mm | 15.60" | 3840x2160 | |
| 89.4 % v7 (old) | 03-2020 | Apple MacBook Pro 15 2019 i9 Vega 20 i9-9980HK, Radeon Pro Vega 20 | 1.8 kg | 15.5 mm | 15.40" | 2880x1800 | |
| 87.8 % v6 (old) | 06-2018 | Asus ZenBook Pro 15 UX580GE i9-8950HK, GeForce GTX 1050 Ti Mobile | 1.9 kg | 18.9 mm | 15.60" | 3840x2160 | |
| 85 % v7 (old) | 06-2019 | MSI P65 Creator 9SF-657 i9-9880H, GeForce RTX 2070 Max-Q | 1.9 kg | 18 mm | 15.60" | 3840x2160 |


| |||||||||||||||||||||||||
Helderheidsverdeling: 86 %
Helderheid in Batterij-modus: 519 cd/m²
Contrast: 1331:1 (Zwart: 0.39 cd/m²)
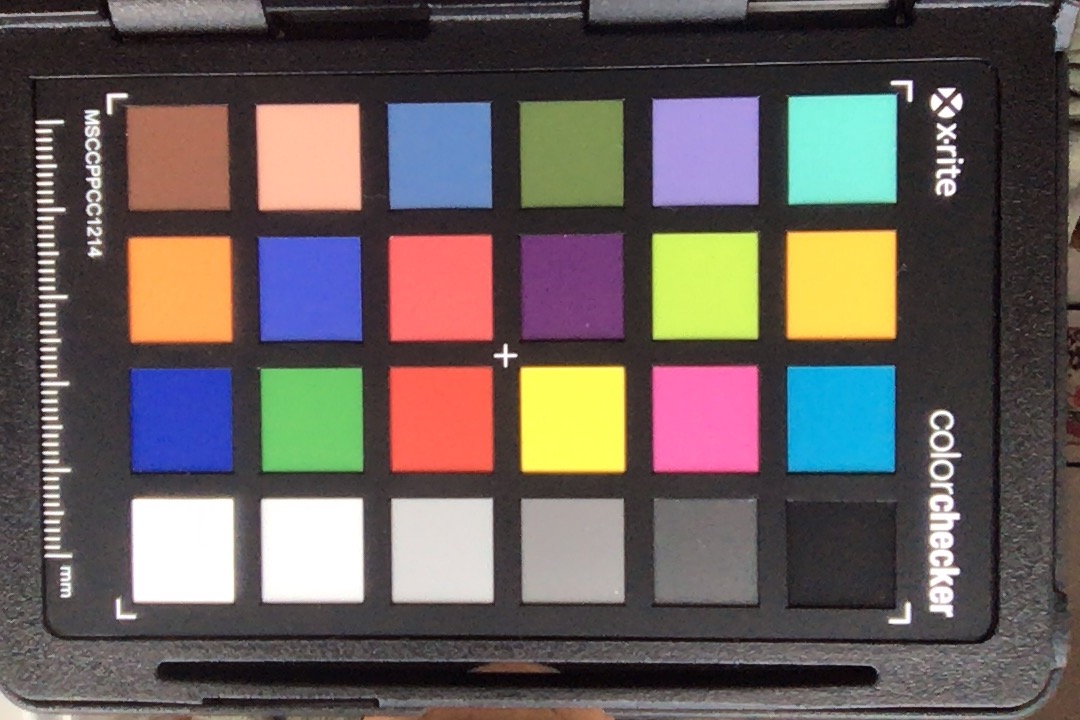
ΔE ColorChecker Calman: 2.28 | ∀{0.5-29.43 Ø4.73}
calibrated: 0.86
ΔE Greyscale Calman: 0.9 | ∀{0.09-98 Ø4.97}
100% sRGB (Calman 2D)
78% AdobeRGB 1998 (Argyll 1.6.3 3D)
Gamma: 2145
CCT: 6572 K
| Apple MacBook Pro 16 2019 i9 5500M APPA044, IPS, 3072x1920, 16" | Dell XPS 15 7590 9980HK GTX 1650 Samsung 156WR04, SDCA029, OLED, 3840x2160, 15.6" | Lenovo ThinkPad X1 Extreme 2019 20QV000WGE NE156QUM-N66, IPS, 3840x2160, 15.6" | Apple MacBook Pro 15 2018 (2.6 GHz, 560X) APPA040, IPS, 2880x1800, 15.4" | Asus ZenBook Pro 15 UX580GE AU Optronics B156ZAN03.1, IPS, 3840x2160, 15.6" | MSI P65 Creator 9SF-657 AU Optronics AUO41EB, IPS, 3840x2160, 15.6" | |
|---|---|---|---|---|---|---|
| Display | ||||||
| Display P3 Coverage (%) | 88.1 | 82 | 98.7 | 85.9 | 84.4 | |
| sRGB Coverage (%) | 99.6 | 99.1 | 99.9 | 100 | 100 | |
| AdobeRGB 1998 Coverage (%) | 91.8 | 96.9 | 86.6 | 99.1 | 98.5 | |
| Response Times | 95% | 12% | 15% | 26% | 7% | |
| Response Time Grey 50% / Grey 80% * (ms) | 52.4 ? | 2.3 ? 96% | 46.4 ? 11% | 43.2 ? 18% | 44 ? 16% | 51 ? 3% |
| Response Time Black / White * (ms) | 34.9 ? | 2.4 ? 93% | 30.4 ? 13% | 31.2 ? 11% | 22.8 ? 35% | 31 ? 11% |
| PWM Frequency (Hz) | 131700 | 59.5 ? | 117000 ? | |||
| Screen | -68% | -85% | 9% | -69% | -66% | |
| Brightness middle (cd/m²) | 519 | 421.2 -19% | 464 -11% | 520 0% | 357.6 -31% | 445 -14% |
| Brightness (cd/m²) | 477 | 417 -13% | 448 -6% | 492 3% | 350 -27% | 462 -3% |
| Brightness Distribution (%) | 86 | 94 9% | 90 5% | 88 2% | 85 -1% | 83 -3% |
| Black Level * (cd/m²) | 0.39 | 0.36 8% | 0.39 -0% | 0.35 10% | 0.5 -28% | |
| Contrast (:1) | 1331 | 1289 -3% | 1333 0% | 1022 -23% | 890 -33% | |
| Colorchecker dE 2000 * | 2.28 | 6.06 -166% | 4.2 -84% | 1.2 47% | 4.12 -81% | 4.75 -108% |
| Colorchecker dE 2000 max. * | 6.54 | 11.89 -82% | 11.4 -74% | 2.3 65% | 9.91 -52% | 7.79 -19% |
| Colorchecker dE 2000 calibrated * | 0.86 | 0.8 7% | 4.23 -392% | |||
| Greyscale dE 2000 * | 0.9 | 2.8 -211% | 7.2 -700% | 1.3 -44% | 1.8 -100% | 4.49 -399% |
| Gamma | 2145 0% | 2.15 102% | 2.17 101% | 2.18 101% | 2.17 101% | 2.49 88% |
| CCT | 6572 99% | 6235 104% | 6345 102% | 6738 96% | 6613 98% | 7374 88% |
| Color Space (Percent of AdobeRGB 1998) (%) | 78 | 81 4% | 85.2 9% | 87.5 12% | 87 12% | |
| Color Space (Percent of sRGB) (%) | 99.6 | 99 | 100 | 100 | ||
| Totaal Gemiddelde (Programma / Instellingen) | 14% /
-32% | -37% /
-69% | 12% /
10% | -22% /
-53% | -30% /
-53% |
* ... kleiner is beter
Responstijd Scherm
| ↔ Responstijd Zwart naar Wit | ||
|---|---|---|
| 34.9 ms ... stijging ↗ en daling ↘ gecombineerd | ↗ 17.8 ms stijging | 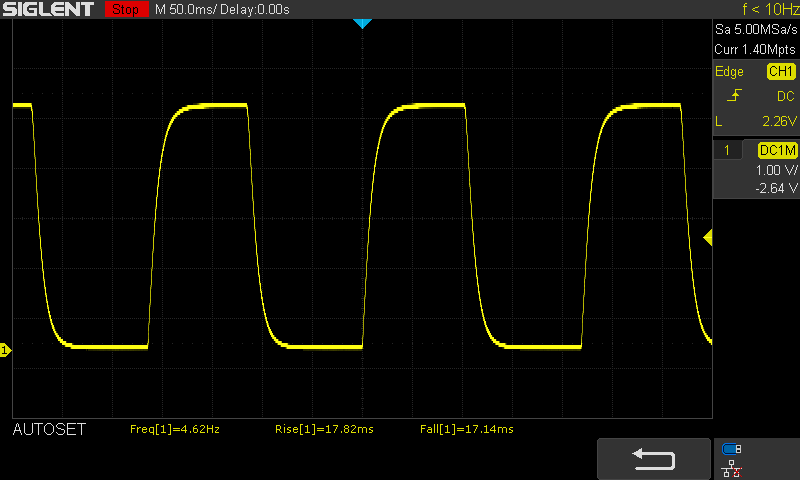 |
| ↘ 17.1 ms daling | ||
| Het scherm vertoonde trage responstijden in onze tests en is misschien te traag voor games. Ter vergelijking: alle testtoestellen variëren van 0.1 (minimum) tot 240 (maximum) ms. » 92 % van alle toestellen zijn beter. Dit betekent dat de gemeten responstijd slechter is dan het gemiddelde (19.9 ms) van alle geteste toestellen. | ||
| ↔ Responstijd 50% Grijs naar 80% Grijs | ||
| 52.4 ms ... stijging ↗ en daling ↘ gecombineerd | ↗ 23.9 ms stijging | 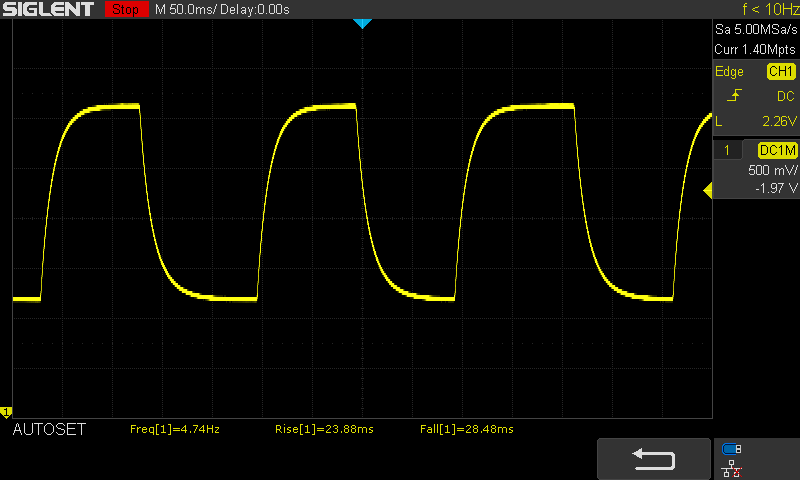 |
| ↘ 28.5 ms daling | ||
| Het scherm vertoonde trage responstijden in onze tests en is misschien te traag voor games. Ter vergelijking: alle testtoestellen variëren van 0.165 (minimum) tot 636 (maximum) ms. » 89 % van alle toestellen zijn beter. Dit betekent dat de gemeten responstijd slechter is dan het gemiddelde (31.1 ms) van alle geteste toestellen. | ||
Screen Flickering / PWM (Pulse-Width Modulation)
| Screen flickering / PWM waargenomen | 131700 Hz | 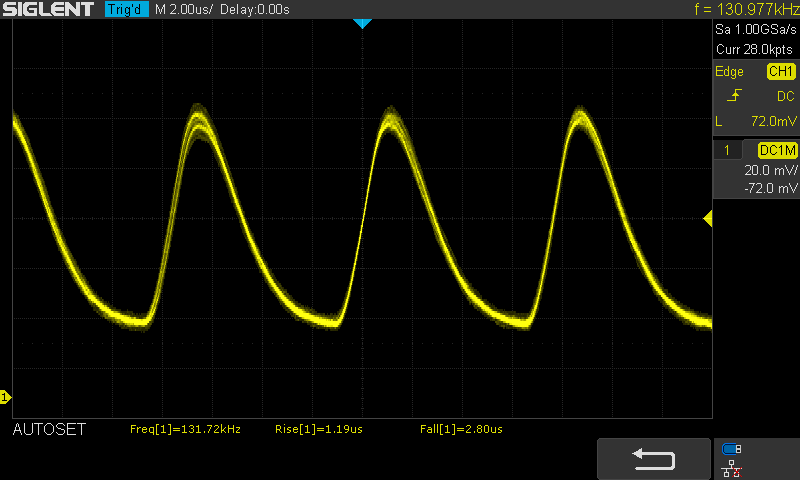 | |
De achtergrondverlichting van het scherm flikkert op 131700 Hz (in het slechtste geval, bijvoorbeeld bij gebruik van PWM) . De frequentie van 131700 Hz is redelijk hoog en de meeste mensen die gevoelig zijn aan flickering zouden dit dus niet mogen waarnemen of geïrriteerde ogen krijgen. Ter vergelijking: 52 % van alle geteste toestellen maakten geen gebruik van PWM om de schermhelderheid te verlagen. Als het wel werd gebruikt, werd een gemiddelde van 7791 (minimum: 5 - maximum: 343500) Hz waargenomen. | |||
| PCMark 8 Home Score Accelerated v2 | 4900 punten | |
| PCMark 8 Creative Score Accelerated v2 | 7359 punten | |
| PCMark 8 Work Score Accelerated v2 | 4812 punten | |
| PCMark 10 Score | 5500 punten | |
Help | ||
| Apple MacBook Pro 16 2019 i9 5500M Apple SSD AP1024 7171 | Dell XPS 15 7590 9980HK GTX 1650 Toshiba XG6 KXG60ZNV1T02 | Microsoft Surface Laptop 3 15 Ryzen 5 3580U SK hynix BC501 HFM256GDGTNG | Dell Precision 5540 SK hynix PC400 512 GB | Gigabyte Aero 17 XA RP77 Intel SSD 760p SSDPEKKW512G8 | Eurocom Nightsky RX15 Samsung SSD 970 Pro 512GB | |
|---|---|---|---|---|---|---|
| CrystalDiskMark 5.2 / 6 | 30% | -11% | 8% | 52% | 58% | |
| Write 4K (MB/s) | 55.5 | 104.3 88% | 99 78% | 98 77% | 169.6 206% | 153 176% |
| Read 4K (MB/s) | 16.21 | 45.23 179% | 35.63 120% | 41.25 154% | 58 258% | 60.5 273% |
| Write Seq (MB/s) | 1959 | 1729 -12% | 706 -64% | 1295 -34% | 1516 -23% | 1938 -1% |
| Read Seq (MB/s) | 1763 | 1861 6% | 1044 -41% | 1441 -18% | 2362 34% | 1932 10% |
| Write 4K Q32T1 (MB/s) | 398.5 | 509 28% | 326.6 -18% | 429.2 8% | 481.8 21% | 482.5 21% |
| Read 4K Q32T1 (MB/s) | 648 | 388.5 -40% | 270 -58% | 400.1 -38% | 506 -22% | 594 -8% |
| Write Seq Q32T1 (MB/s) | 2727 | 2813 3% | 820 -70% | 1366 -50% | 1530 -44% | 2324 -15% |
| Read Seq Q32T1 (MB/s) | 3242 | 2906 -10% | 2028 -37% | 2201 -32% | 2645 -18% | 3539 9% |
| AS SSD | 34% | -26% | 8% | -17% | 21% | |
| Seq Read (MB/s) | 2531 | 1723 -32% | 1122 -56% | 1743 -31% | 1812 -28% | 2352 -7% |
| Seq Write (MB/s) | 2289 | 1386 -39% | 514 -78% | 930 -59% | 1512 -34% | 2184 -5% |
| 4K Read (MB/s) | 15.85 | 43.25 173% | 34.98 121% | 39.1 147% | 32.68 106% | 28.65 81% |
| 4K Write (MB/s) | 39.88 | 98.3 146% | 96.8 143% | 92.1 131% | 107.7 170% | 61.3 54% |
| 4K-64 Read (MB/s) | 1267 | 1078 -15% | 492 -61% | 956 -25% | 504 -60% | 1317 4% |
| 4K-64 Write (MB/s) | 1749 | 1456 -17% | 339.9 -81% | 863 -51% | 534 -69% | 2156 23% |
| Access Time Read * (ms) | 0.122 | 0.05 59% | 0.056 54% | 0.074 39% | 0.05 59% | 0.101 17% |
| Access Time Write * (ms) | 0.095 | 0.039 59% | 0.11 -16% | 0.053 44% | 0.227 -139% | 0.09 5% |
| Score Read (Points) | 1536 | 1294 -16% | 639 -58% | 1170 -24% | 718 -53% | 1581 3% |
| Score Write (Points) | 2018 | 1693 -16% | 488 -76% | 1048 -48% | 793 -61% | 2435 21% |
| Score Total (Points) | 4317 | 3638 -16% | 1434 -67% | 2781 -36% | 1871 -57% | 4813 11% |
| Copy ISO MB/s (MB/s) | 1995 | 3182 59% | 828 -58% | 946 -53% | 2705 36% | |
| Copy Program MB/s (MB/s) | 584 | 984 68% | 200.5 -66% | 414.3 -29% | 666 14% | |
| Copy Game MB/s (MB/s) | 1135 | 1824 61% | 387.4 -66% | 1263 11% | 1583 39% | |
| PCMark 8 | ||||||
| Storage Score v2 (Points) | 1818 | |||||
| Totaal Gemiddelde (Programma / Instellingen) | 32% /
33% | -19% /
-21% | 8% /
8% | 18% /
8% | 40% /
35% |
* ... kleiner is beter

| 3DMark 06 Standard Score | 34321 punten | |
| 3DMark 11 Performance | 14097 punten | |
| 3DMark Cloud Gate Standard Score | 30690 punten | |
| 3DMark Fire Strike Score | 9196 punten | |
| 3DMark Time Spy Score | 3629 punten | |
Help | ||
SpecViewPerf 13
| Performance rating - Percent | |
| Lenovo ThinkPad P53-20QN000YGE | |
| Razer Blade 15 Studio Edition | |
| MSI WS75 9TL-636 | |
| Lenovo ThinkPad P73-20QR002DGE | |
| Apple MacBook Pro 16 2019 i9 5500M | |
| Dell Precision 5540 | |
| Acer Aspire Nitro 5 AN517-51-7887 | |
| Lenovo ThinkPad P1 2019-20QT000RGE | |
| Acer Nitro 5 -1! | |
| Deus Ex Mankind Divided - 1920x1080 Ultra Preset AA:2xMS AF:8x | |
| Gemiddeld NVIDIA GeForce GTX 1660 Ti Mobile (n=1) | |
| Apple MacBook Pro 16 2019 i9 5500M | |
| Gemiddeld NVIDIA GeForce GTX 1650 Mobile (n=1) | |
| Apple MacBook Pro 15 2018 (2.6 GHz, 560X) | |
| Rage 2 - 1920x1080 Ultra Preset (Resolution Scale Off) | |
| Gemiddeld NVIDIA GeForce GTX 1660 Ti Mobile (67.9 - 68.8, n=2) | |
| Gemiddeld NVIDIA GeForce GTX 1660 Ti Max-Q (58.2 - 64.8, n=2) | |
| MSI Alpha 15 A3DDK | |
| Gemiddeld NVIDIA GeForce GTX 1650 Mobile (45.1 - 60, n=3) | |
| Apple MacBook Pro 16 2019 i9 5500M | |
| lage | gem. | hoge | ultra | QHD | 4K | |
|---|---|---|---|---|---|---|
| Counter-Strike: GO (2012) | 208 | 118 | 71.4 | |||
| GTA V (2015) | 168 | 91.4 | 47.6 | 34.5 | 32.3 | |
| The Witcher 3 (2015) | 68 | 38.8 | ||||
| Dota 2 Reborn (2015) | 137 | 125 | 111 | 107 | 53.9 | |
| World of Warships (2015) | 43.4 | |||||
| Rainbow Six Siege (2015) | 126 | 44.8 | ||||
| Overwatch (2016) | 98 | |||||
| Deus Ex Mankind Divided (2016) | 52 | 27.8 | 16.9 | |||
| Rocket League (2017) | 153 | 107 | 59 | |||
| Final Fantasy XV Benchmark (2018) | 48.4 | 20.4 | ||||
| World of Tanks enCore (2018) | 76 | 49.1 | 24.6 | |||
| Far Cry 5 (2018) | 55 | 40 | 20 | |||
| Shadow of the Tomb Raider (2018) | 120 | 58 | 54 | 46 | 30 | 13 |
| Battlefield V (2018) | 85 | 76 | 62 | 58.9 | 47 | 14.4 |
| Apex Legends (2019) | 63 | 43.5 | ||||
| Far Cry New Dawn (2019) | 86 | 67 | 64 | 57 | 41 | 21 |
| Metro Exodus (2019) | 92 | 47.1 | 34.3 | 28.6 | 22 | |
| Dirt Rally 2.0 (2019) | 90 | 50.2 | 35.8 | |||
| The Division 2 (2019) | 56 | 39 | ||||
| Anno 1800 (2019) | 67 | 44.6 | 21.7 | |||
| Rage 2 (2019) | 113 | 53.7 | 45.2 | 44.4 | 28.4 | |
| Total War: Three Kingdoms (2019) | 175 | 64.1 | 40.5 | 29.7 | 19 | 7 |
| F1 2019 (2019) | 174 | 105 | 97 | 65 | 49 | |
| Control (2019) | 139 | 41.5 | 29.2 | 18.1 | ||
| Borderlands 3 (2019) | 41.4 | 30.8 | 21.4 | 3.8 | ||
| FIFA 20 (2019) | 144 | 124 | 90 | |||
| Ghost Recon Breakpoint (2019) | 50 | 35 | ||||
| GRID 2019 (2019) | 46.3 | 36.6 | 23.2 | |||
| Call of Duty Modern Warfare 2019 (2019) | 34.7 | |||||
| Need for Speed Heat (2019) | 74 | 56.7 | 50.9 | 44.7 | 28 | 12.8 |
| Star Wars Jedi Fallen Order (2019) | 75 | 61 | 54.3 | 35 | 16.2 | |
| Red Dead Redemption 2 (2019) | 97.6 | 55.2 | 35.8 | 20.9 | 0 () | 0 () |
| Fall Guys (2020) | 59.4 | 59.4 | 38.1 | |||
| Hearthstone (2020) | 33.2 | 32 | 59.7 | 59.6 | ||
| Doom Eternal (2020) | 84.8 | 47.5 | 27.5 | 21.9 | 15.1 | |
| Gears Tactics (2020) | 60 | 47.6 | 30.7 | |||
| F1 2020 (2020) | 0 het spel wil niet beginnen | |||||
| Flight Simulator 2020 (2020) | 47.4 | 28 | 19.2 | 12.2 | ||
| Mafia Definitive Edition (2020) | 52.5 | 37.5 | ||||
| Star Wars Squadrons (2020) | 95.6 | 69.7 | 26.4 | |||
| FIFA 21 (2020) | 151 | 115 | 70 | |||
| Cyberpunk 2077 1.0 (2020) | 54.8 | 29.9 | 23.5 | |||
| Hitman 3 (2021) | 157 | 81.3 | 66.3 | 62 | ||
| Outriders (2021) | 70.7 | 44.4 | 36 | 27.6 | ||
| Resident Evil Village (2021) | 81.7 | 38.9 | 40.6 | |||
| Far Cry 6 (2021) | 0 het spel wil niet beginnen | |||||
| Riders Republic (2021) | 61 | 41 | 28 | |||
| Call of Duty Vanguard (2021) | 43.1 | 21.7 | ||||
| Forza Horizon 5 (2021) | 85 | 31 |
Geluidsniveau
| Onbelast |
| 29.9 / 29.9 / 29.9 dB (A) |
| Belasting |
| 43 / 46.1 dB (A) |
 | ||
30 dB stil 40 dB(A) hoorbaar 50 dB(A) luid |
||
min: | ||
(±) De maximumtemperatuur aan de bovenzijde bedraagt 42 °C / 108 F, vergeleken met het gemiddelde van 36.8 °C / 98 F, variërend van 21 tot 71 °C voor de klasse Multimedia.
(+) De bodem warmt op tot een maximum van 38 °C / 100 F, vergeleken met een gemiddelde van 39.1 °C / 102 F
(+) Bij onbelast gebruik bedraagt de gemiddelde temperatuur voor de bovenzijde 22.8 °C / 73 F, vergeleken met het apparaatgemiddelde van 31.3 °C / 88 F.
(+) De palmsteunen en het touchpad zijn met een maximum van ###max## °C / 80.6 F koeler dan de huidtemperatuur en voelen daarom koel aan.
(±) De gemiddelde temperatuur van de handpalmsteun van soortgelijke toestellen bedroeg 28.7 °C / 83.7 F (+1.7 °C / 3.1 F).
Apple MacBook Pro 16 2019 i9 5500M audioanalyse
(+) | luidsprekers kunnen relatief luid spelen (82.3 dB)
Bas 100 - 315 Hz
(+) | goede baars - slechts 2.3% verwijderd van de mediaan
(+) | de lage tonen zijn lineair (5% delta naar de vorige frequentie)
Midden 400 - 2000 Hz
(+) | evenwichtige middens - slechts 2.7% verwijderd van de mediaan
(+) | de middentonen zijn lineair (3.4% delta ten opzichte van de vorige frequentie)
Hoog 2 - 16 kHz
(+) | evenwichtige hoogtepunten - slechts 2.1% verwijderd van de mediaan
(+) | de hoge tonen zijn lineair (2.6% delta naar de vorige frequentie)
Algemeen 100 - 16.000 Hz
(+) | het totale geluid is lineair (6.9% verschil met de mediaan)
Vergeleken met dezelfde klasse
» 5% van alle geteste apparaten in deze klasse waren beter, 1% vergelijkbaar, 94% slechter
» De beste had een delta van 5%, het gemiddelde was 17%, de slechtste was 45%
Vergeleken met alle geteste toestellen
» 1% van alle geteste apparaten waren beter, 0% gelijk, 99% slechter
» De beste had een delta van 4%, het gemiddelde was 24%, de slechtste was 134%
Dell XPS 15 7590 9980HK GTX 1650 audioanalyse
(+) | luidsprekers kunnen relatief luid spelen (88.4 dB)
Bas 100 - 315 Hz
(-) | bijna geen lage tonen - gemiddeld 24.9% lager dan de mediaan
(±) | lineariteit van de lage tonen is gemiddeld (14.4% delta ten opzichte van de vorige frequentie)
Midden 400 - 2000 Hz
(+) | evenwichtige middens - slechts 2.8% verwijderd van de mediaan
(±) | lineariteit van de middentonen is gemiddeld (7.8% delta ten opzichte van de vorige frequentie)
Hoog 2 - 16 kHz
(+) | evenwichtige hoogtepunten - slechts 1.9% verwijderd van de mediaan
(+) | de hoge tonen zijn lineair (5.3% delta naar de vorige frequentie)
Algemeen 100 - 16.000 Hz
(±) | lineariteit van het totale geluid is gemiddeld (17.8% verschil met de mediaan)
Vergeleken met dezelfde klasse
» 52% van alle geteste apparaten in deze klasse waren beter, 7% vergelijkbaar, 41% slechter
» De beste had een delta van 5%, het gemiddelde was 17%, de slechtste was 45%
Vergeleken met alle geteste toestellen
» 36% van alle geteste apparaten waren beter, 8% gelijk, 56% slechter
» De beste had een delta van 4%, het gemiddelde was 24%, de slechtste was 134%
Apple MacBook Pro 15 2018 (2.6 GHz, 560X) audioanalyse
(+) | luidsprekers kunnen relatief luid spelen (85 dB)
Bas 100 - 315 Hz
(+) | goede baars - slechts 4.7% verwijderd van de mediaan
(±) | lineariteit van de lage tonen is gemiddeld (8.3% delta ten opzichte van de vorige frequentie)
Midden 400 - 2000 Hz
(+) | evenwichtige middens - slechts 1.8% verwijderd van de mediaan
(+) | de middentonen zijn lineair (3.5% delta ten opzichte van de vorige frequentie)
Hoog 2 - 16 kHz
(+) | evenwichtige hoogtepunten - slechts 2.6% verwijderd van de mediaan
(+) | de hoge tonen zijn lineair (5.7% delta naar de vorige frequentie)
Algemeen 100 - 16.000 Hz
(+) | het totale geluid is lineair (6.4% verschil met de mediaan)
Vergeleken met dezelfde klasse
» 4% van alle geteste apparaten in deze klasse waren beter, 1% vergelijkbaar, 95% slechter
» De beste had een delta van 5%, het gemiddelde was 17%, de slechtste was 45%
Vergeleken met alle geteste toestellen
» 1% van alle geteste apparaten waren beter, 0% gelijk, 99% slechter
» De beste had een delta van 4%, het gemiddelde was 24%, de slechtste was 134%
| Uit / Standby | |
| Inactief | |
| Belasting |
|
Key:
min: | |
| Apple MacBook Pro 16 2019 i9 5500M i9-9880H, Radeon Pro 5500M, Apple SSD AP1024 7171, IPS, 3072x1920, 16" | Apple MacBook Pro 15 2018 (2.6 GHz, 560X) i7-8850H, Radeon Pro 560X, Apple SSD AP0512, IPS, 2880x1800, 15.4" | Dell XPS 15 7590 9980HK GTX 1650 i9-9980HK, GeForce GTX 1650 Mobile, Toshiba XG6 KXG60ZNV1T02, OLED, 3840x2160, 15.6" | MSI P65 Creator 9SF-657 i9-9880H, GeForce RTX 2070 Max-Q, 2x Samsung SSD PM981 MZVLB512HAJQ (RAID 0), IPS, 3840x2160, 15.6" | Lenovo ThinkPad X1 Extreme 2019 20QV000WGE i7-9750H, GeForce GTX 1650 Mobile, Samsung SSD PM981 MZVLB512HAJQ, IPS, 3840x2160, 15.6" | Gemiddelde van klas Multimedia | |
|---|---|---|---|---|---|---|
| Power Consumption | 11% | -18% | -67% | -31% | 2% | |
| Idle Minimum * (Watt) | 3.7 | 3.4 8% | 6.2 -68% | 9.4 -154% | 8.5 -130% | 5.71 ? -54% |
| Idle Average * (Watt) | 12.1 | 11 9% | 9.6 21% | 17.4 -44% | 14.7 -21% | 10.1 ? 17% |
| Idle Maximum * (Watt) | 17 | 14.9 12% | 21.2 -25% | 19.6 -15% | 19.4 -14% | 12.4 ? 27% |
| Load Average * (Watt) | 91.5 | 78.9 14% | 104.3 -14% | 103 -13% | 89.6 2% | 65 ? 29% |
| Witcher 3 ultra * (Watt) | 103 | 91.7 11% | 96.1 7% | |||
| Load Maximum * (Watt) | 102.3 | 91.2 11% | 135.3 -32% | 216 -111% | 129.8 -27% | 112.2 ? -10% |
* ... kleiner is beter
| Apple MacBook Pro 16 2019 i9 5500M i9-9880H, Radeon Pro 5500M, 99.8 Wh | Lenovo ThinkPad X1 Extreme 2019 20QV000WGE i7-9750H, GeForce GTX 1650 Mobile, 80 Wh | Dell XPS 15 7590 9980HK GTX 1650 i9-9980HK, GeForce GTX 1650 Mobile, 97 Wh | Asus ZenBook Pro 15 UX580GE i9-8950HK, GeForce GTX 1050 Ti Mobile, 71 Wh | MSI P65 Creator 9SF-657 i9-9880H, GeForce RTX 2070 Max-Q, 82 Wh | Apple MacBook Pro 15 2018 (2.6 GHz, 560X) i7-8850H, Radeon Pro 560X, 83 Wh | Gemiddelde van klas Multimedia | |
|---|---|---|---|---|---|---|---|
| Batterijduur | -31% | 98% | -9% | -20% | 24% | 46% | |
| H.264 (h) | 9.7 | 4.7 -52% | 11.7 21% | 16.4 ? 69% | |||
| WiFi v1.3 (h) | 12 | 4.8 -60% | 7.8 -35% | 6.3 -47% | 6 -50% | 10.2 -15% | 12 ? 0% |
| Witcher 3 ultra (h) | 0.9 | 1.5 67% | |||||
| Load (h) | 1 | 1.2 20% | 3.3 230% | 1.3 30% | 1.1 10% | 1.675 ? 68% |
Pro
Contra
Samenvatting - Een fantastische, maar dure multimedia-laptop

Voor het volledige, Engelse testrapport, klik hier.
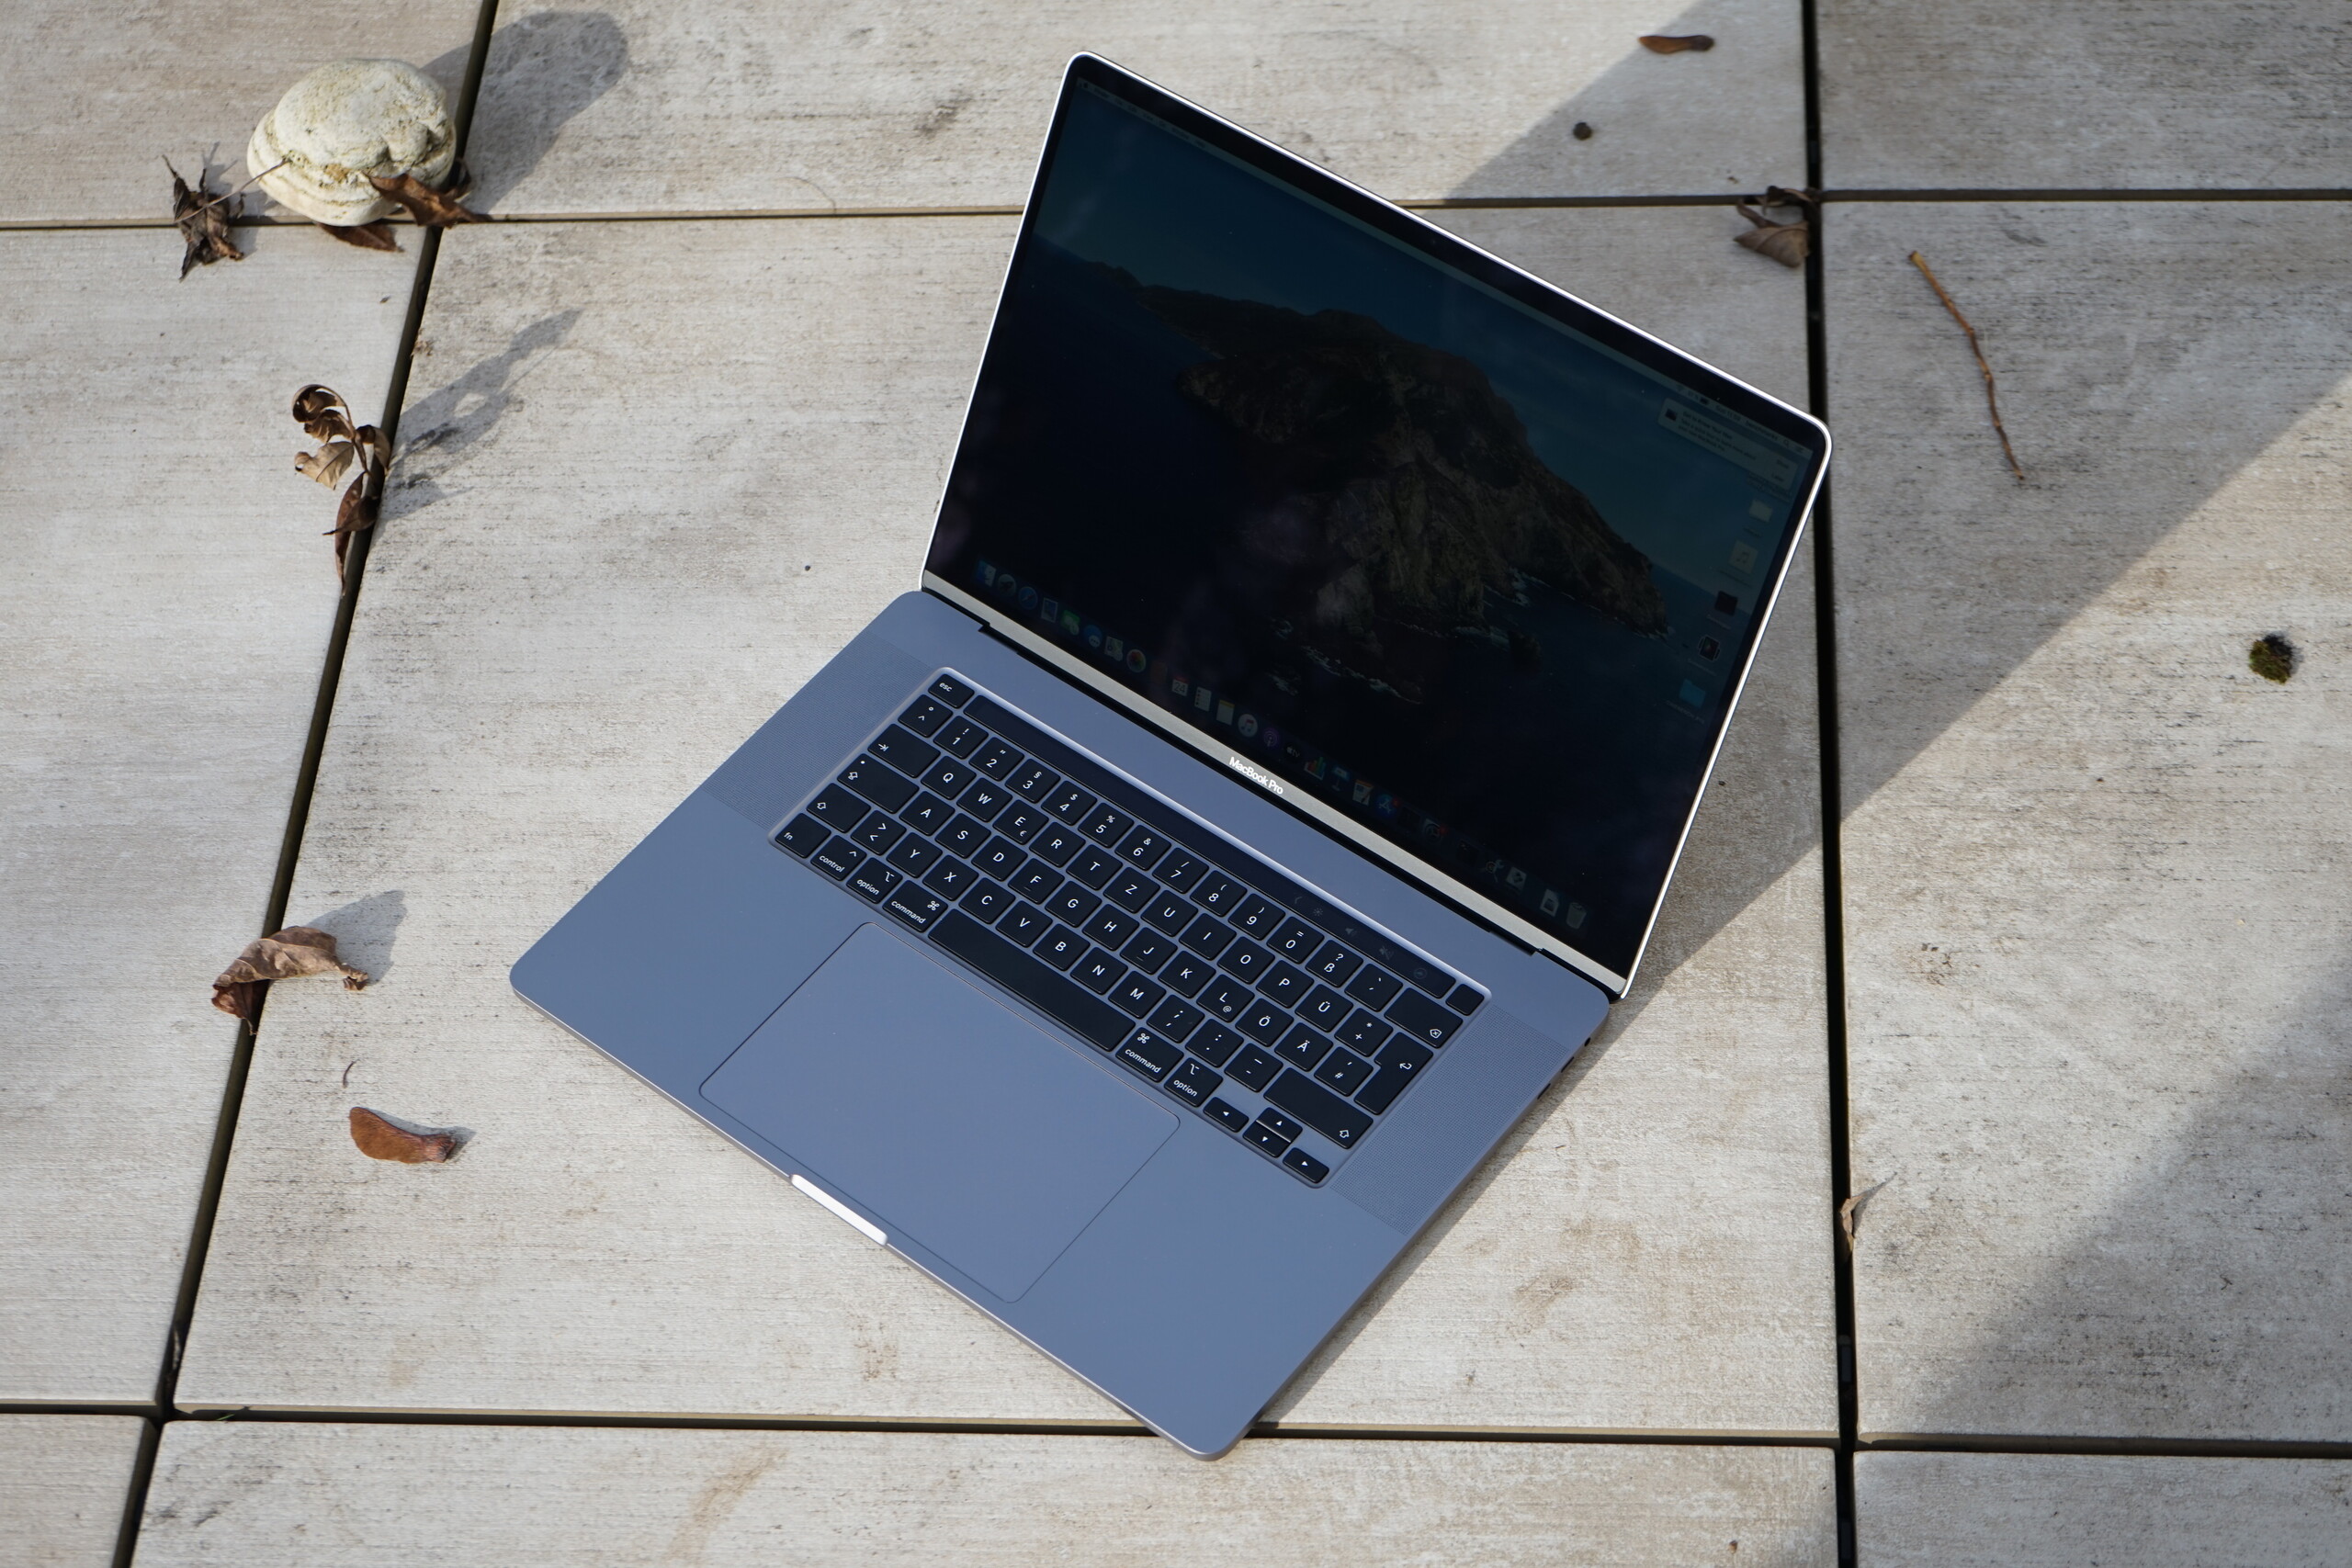
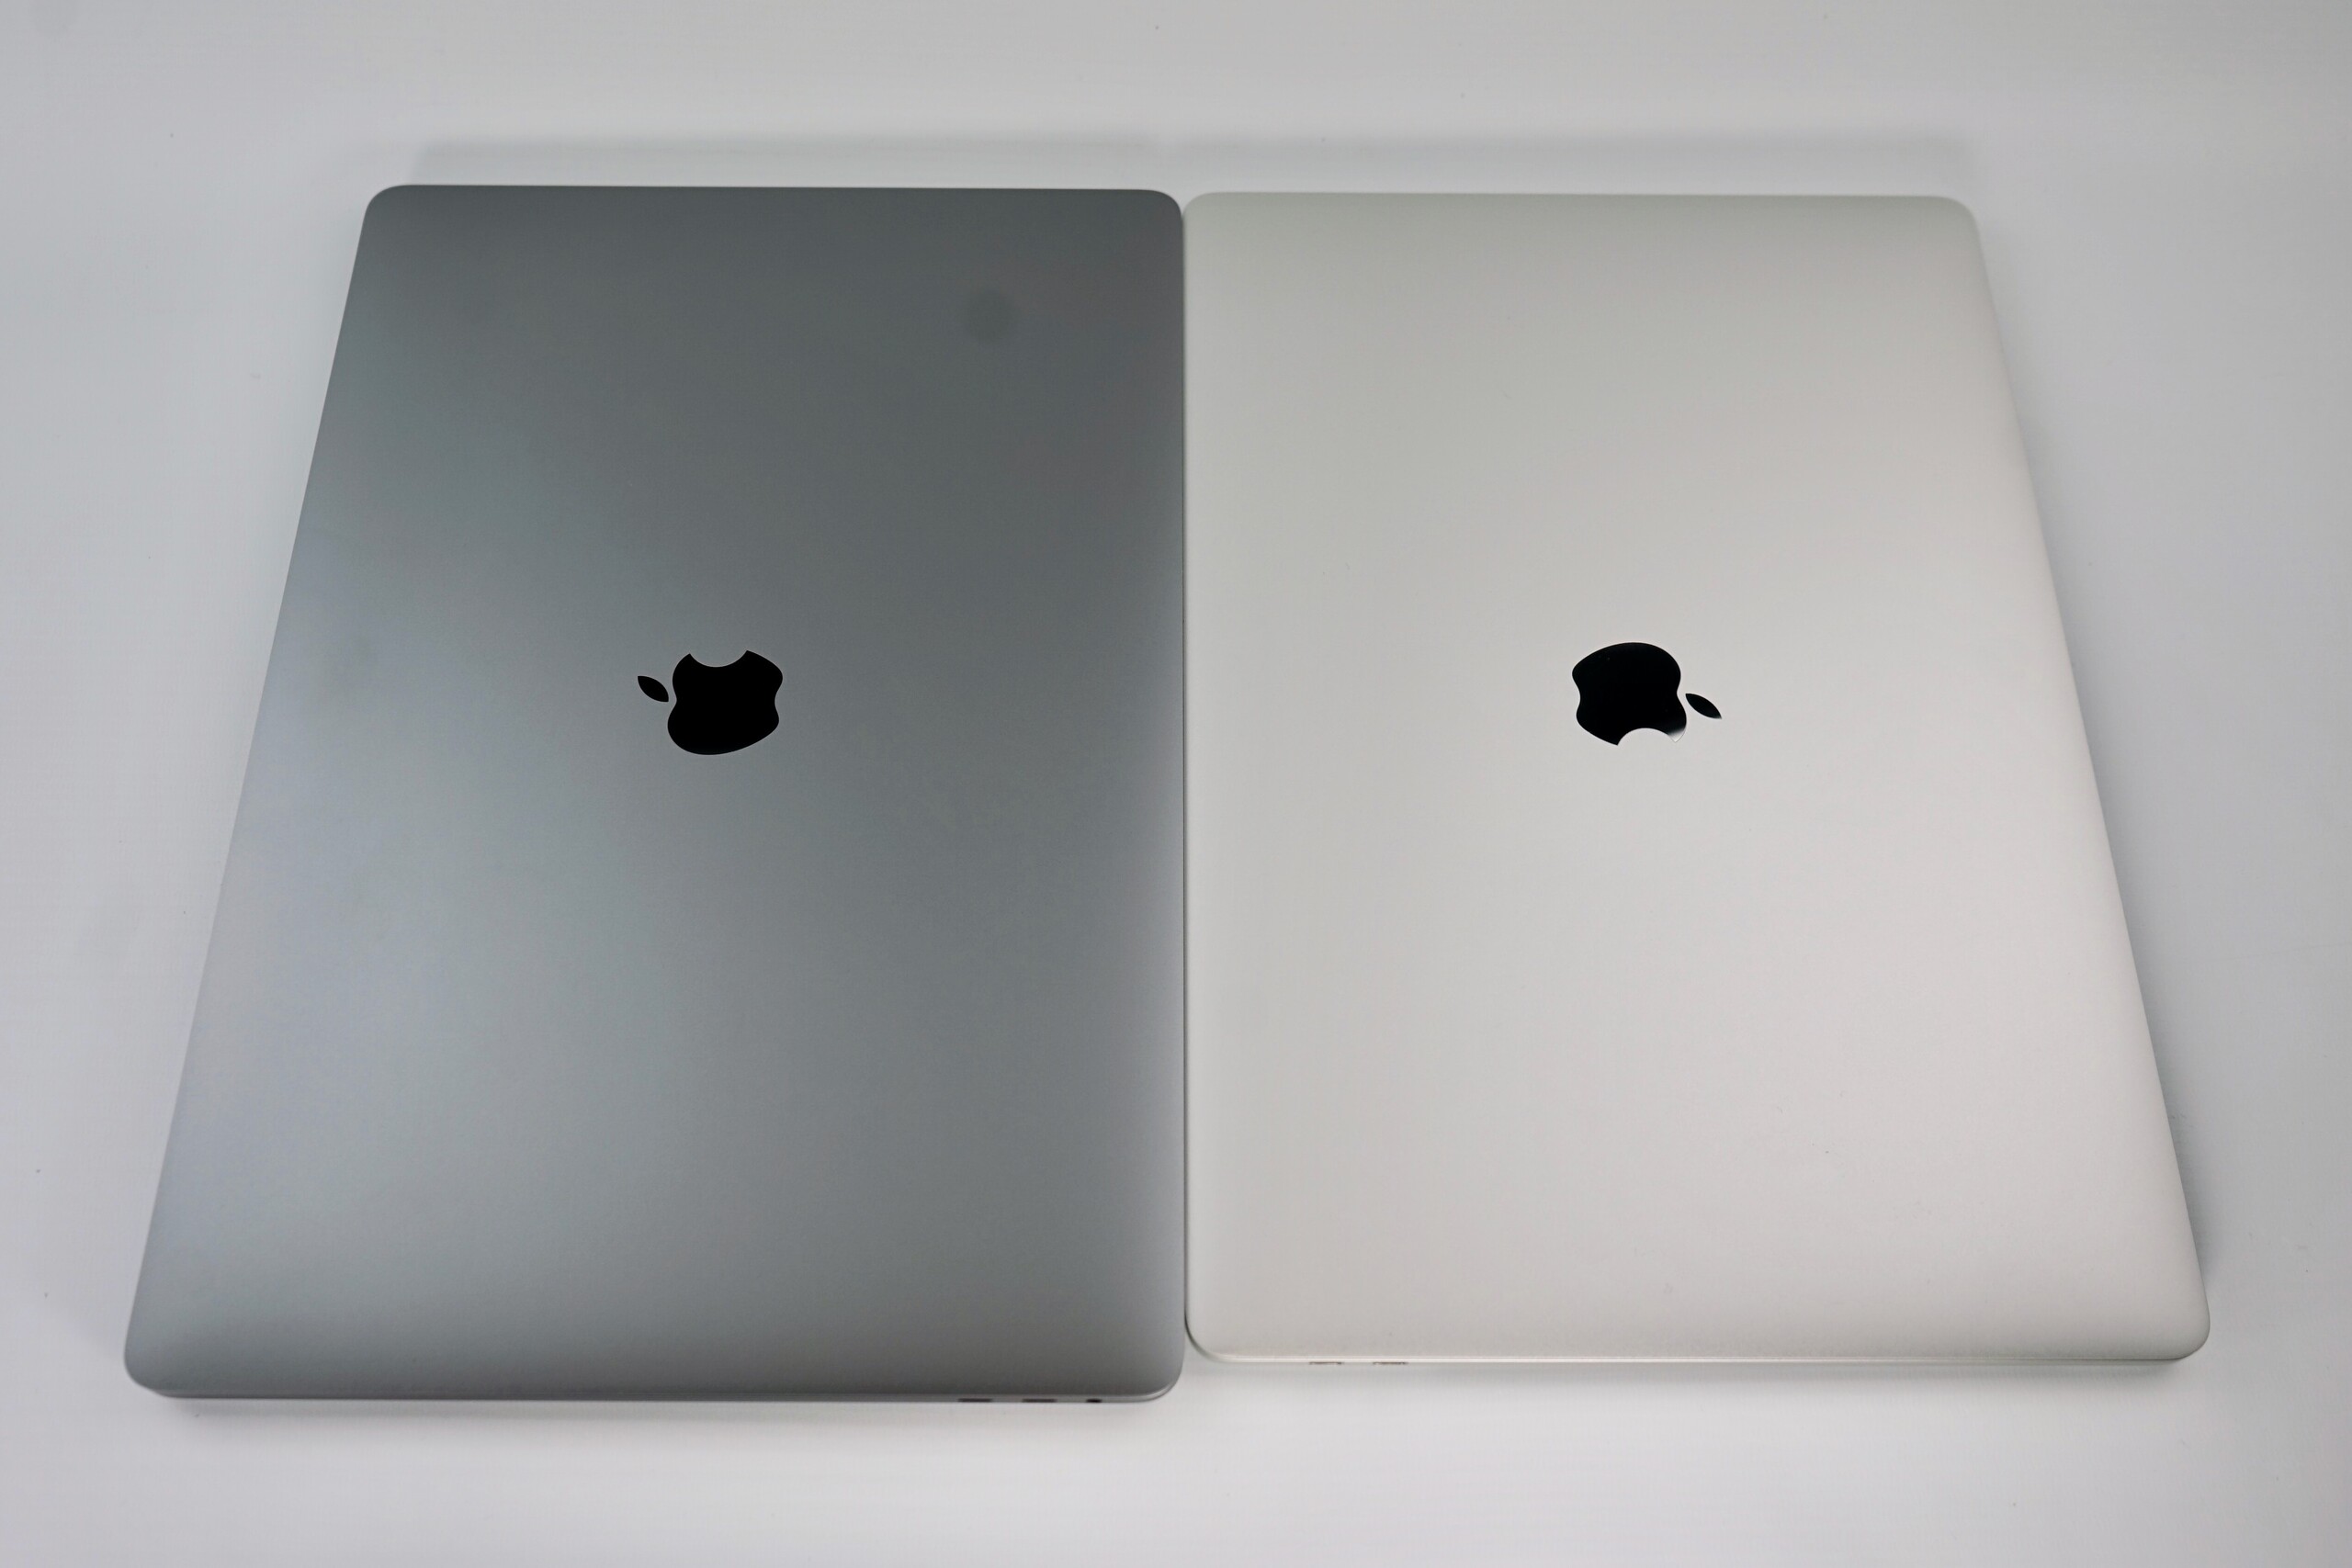
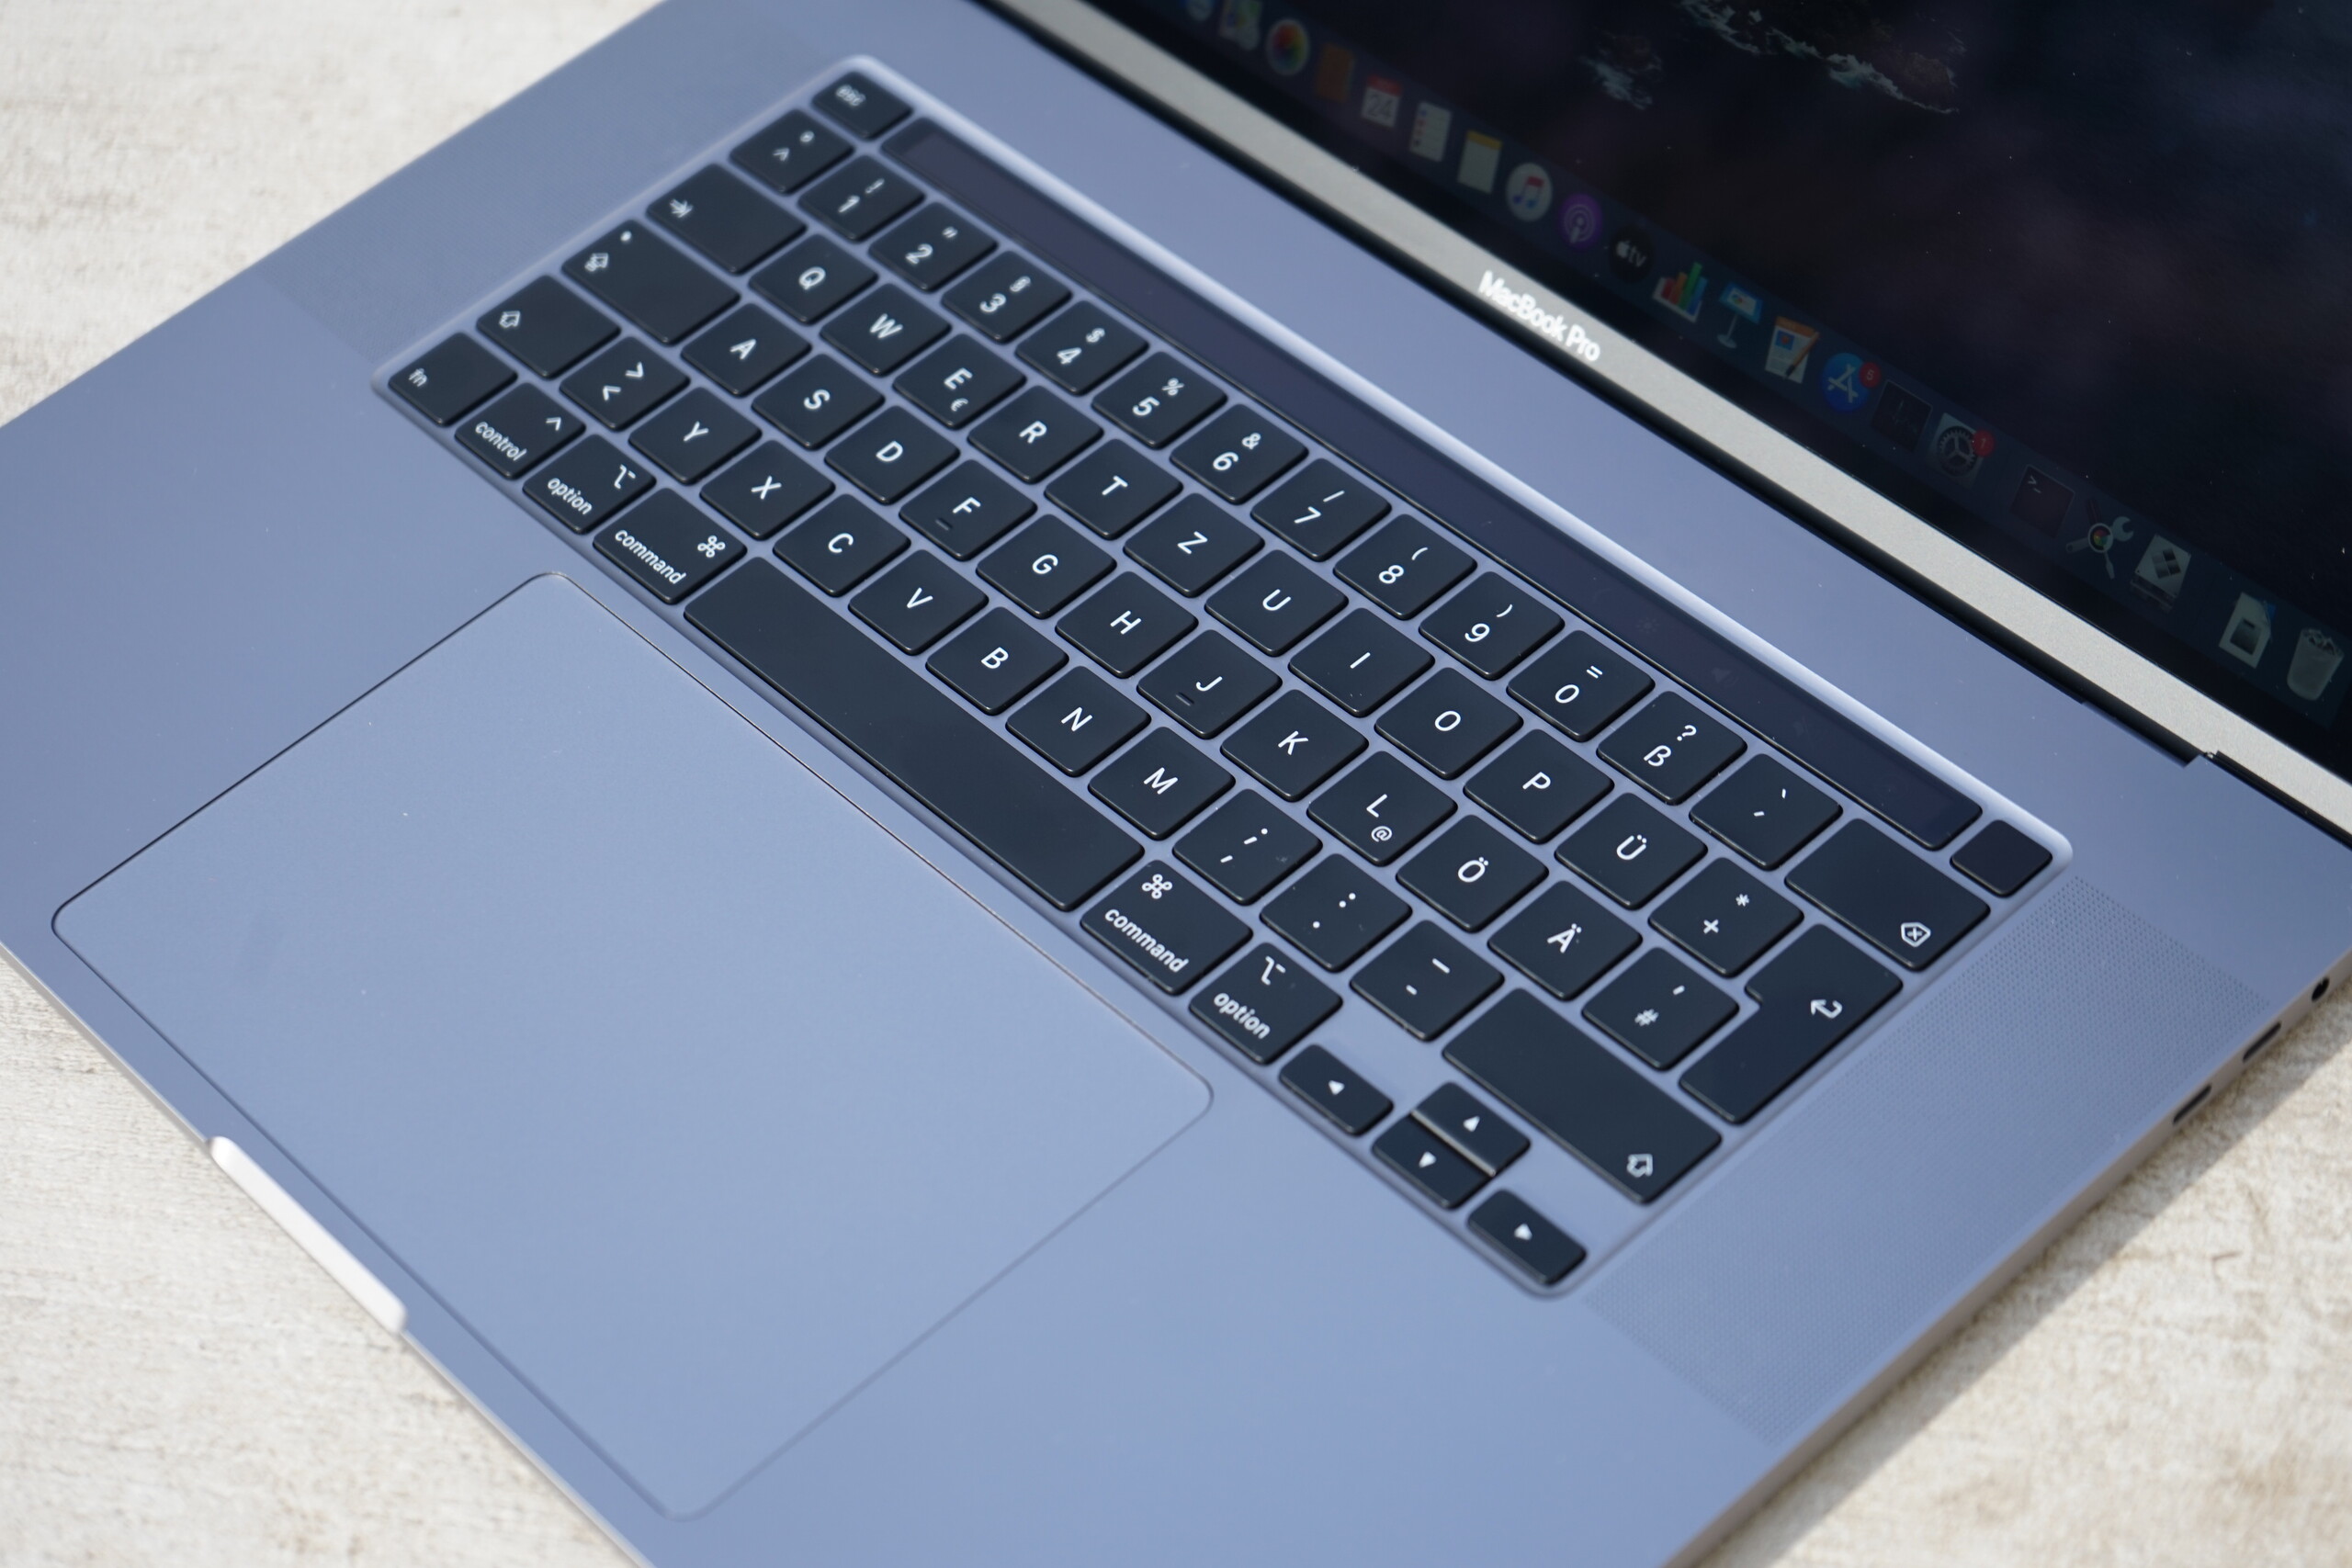
Apple heeft het oude 15-inch ontwerp met de nieuwe 16-inch MacBook Pro verfijnd door enkele kleine maar belangrijke wijzigingen aan te brengen. Ten eerste heeft het bedrijf zijn veel bekritiseerde vlinder-toetsenbordmechanisme vervangen door een schaar-schakelaarontwerp dat niet alleen bewezen is en meer drukafstand biedt dan vlindertoetsen, maar ook langer mee zou moeten gaan. Hoewel Apple zich qua ontwerp zwaar heeft laten inspireren door de meest recente MacBook Pro 15, is het 16 inch model iets dikker dan zijn voorganger en levert het ook efficiëntere koeling.
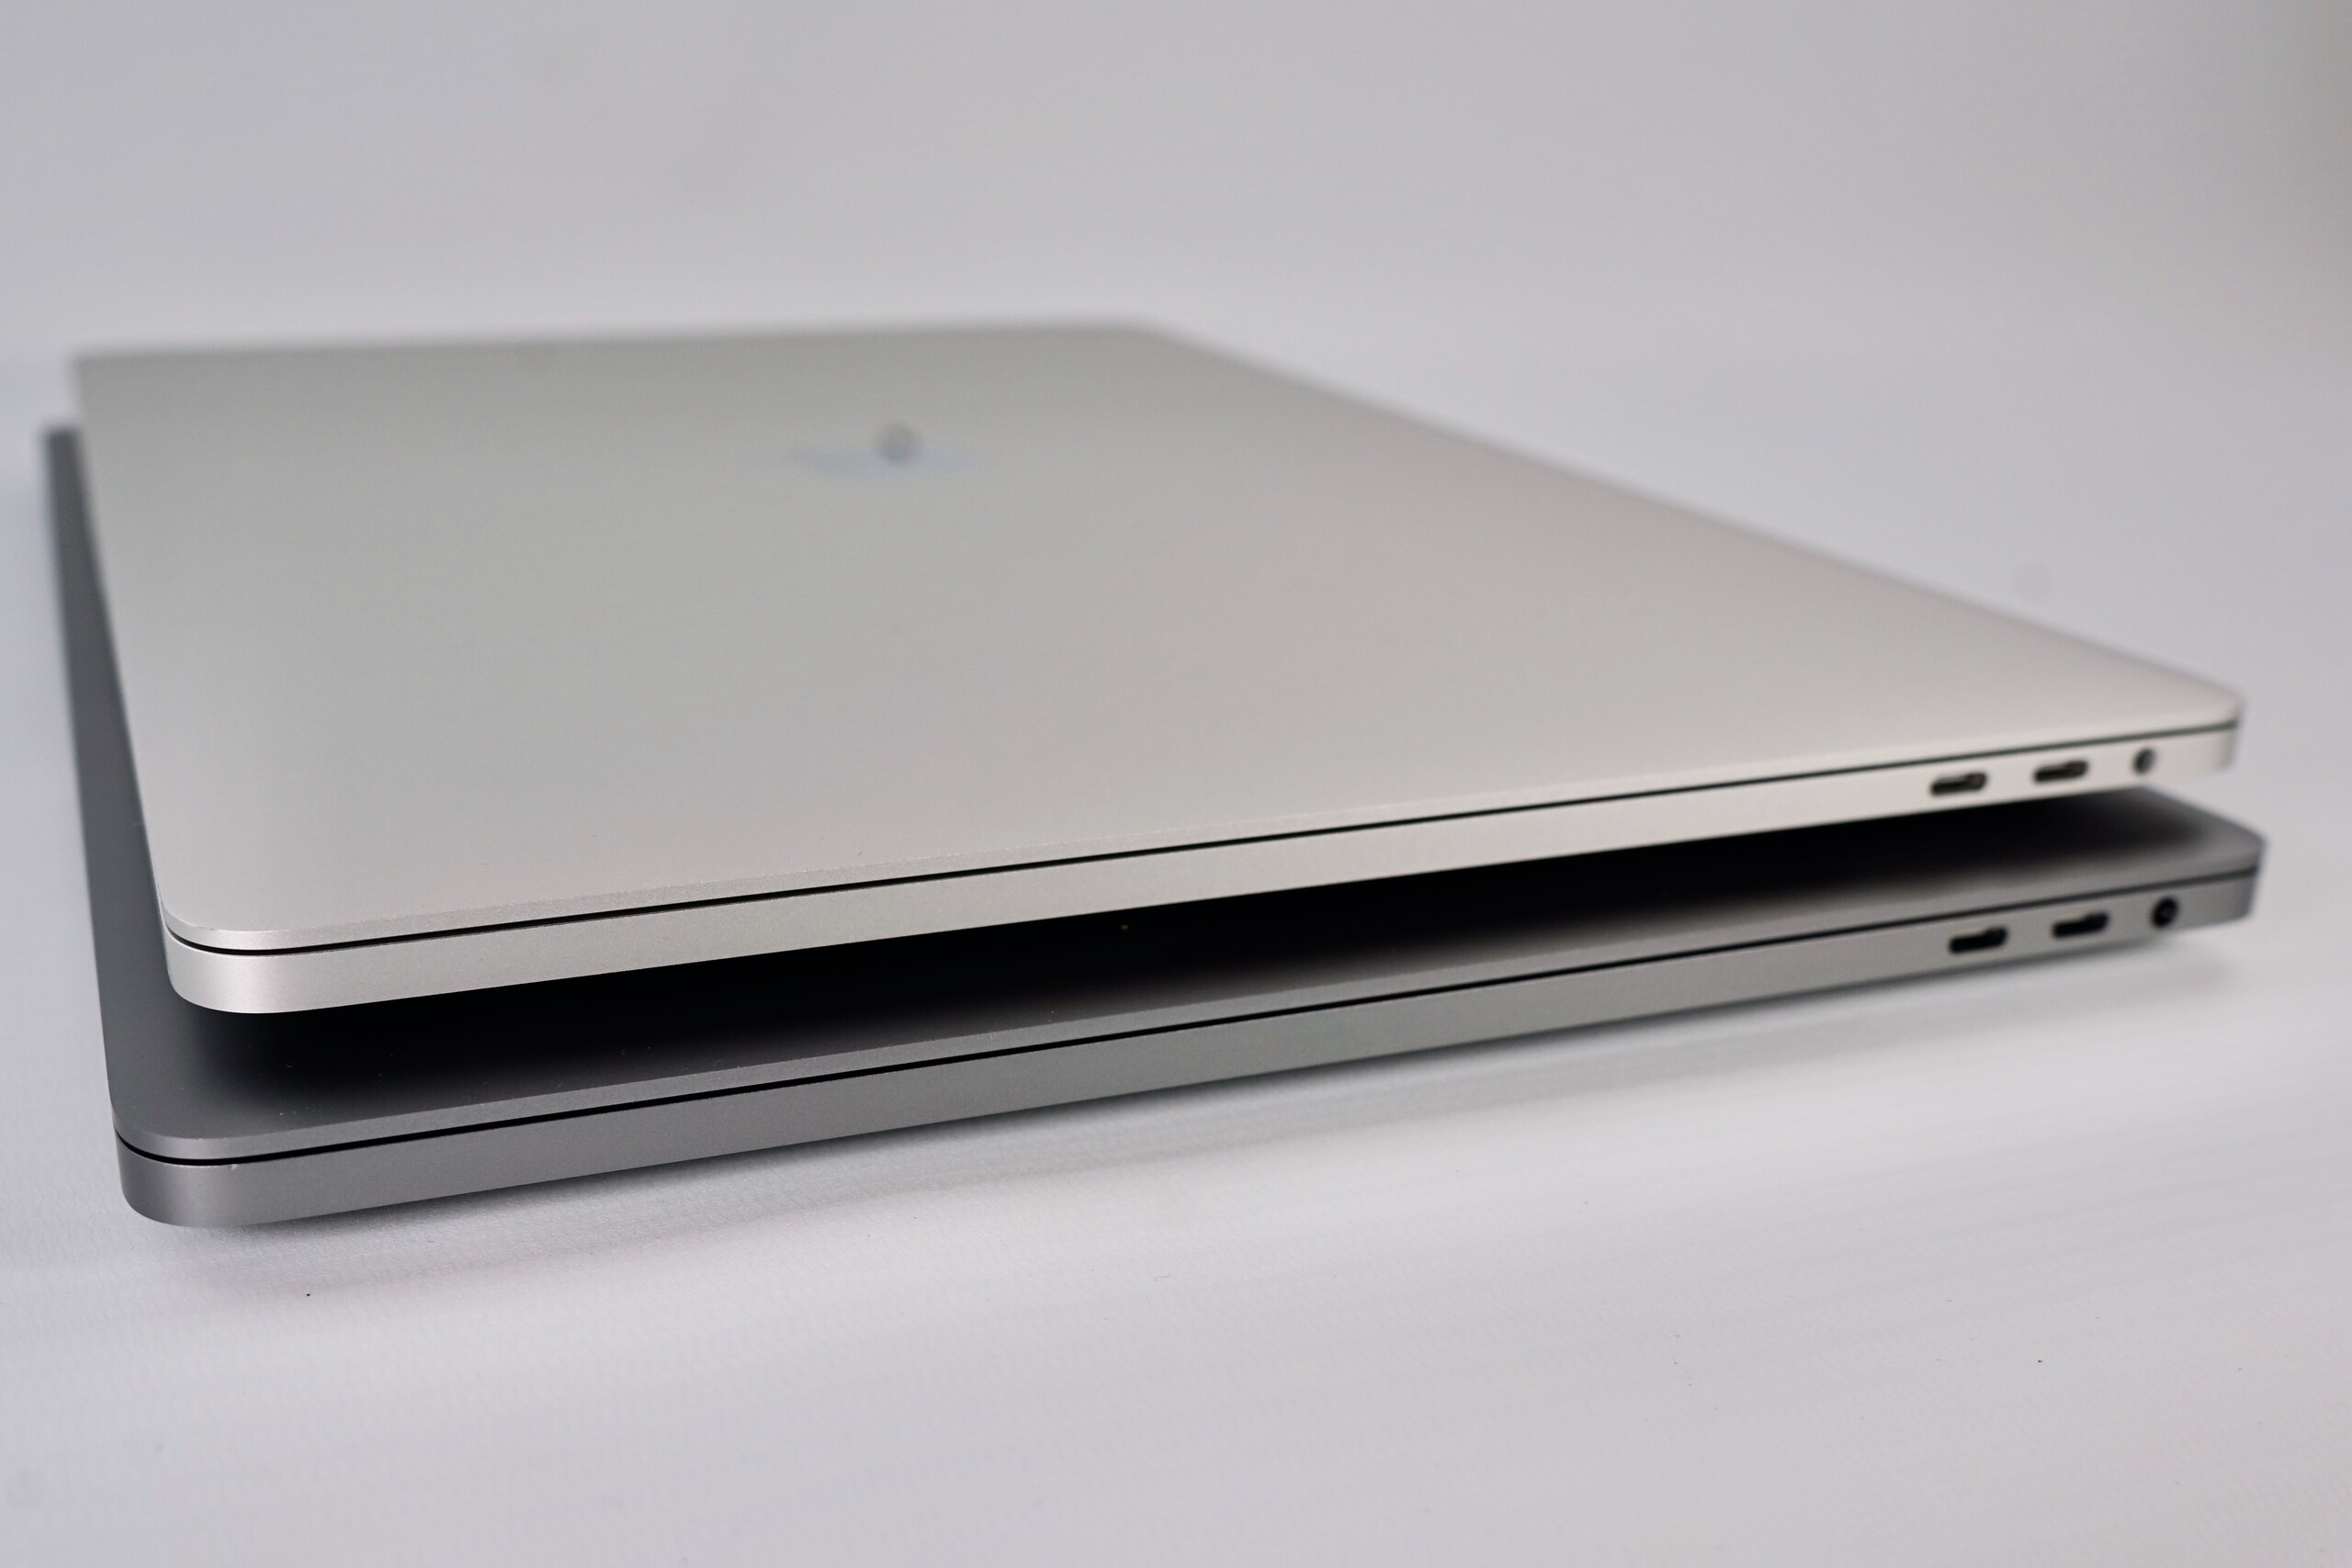
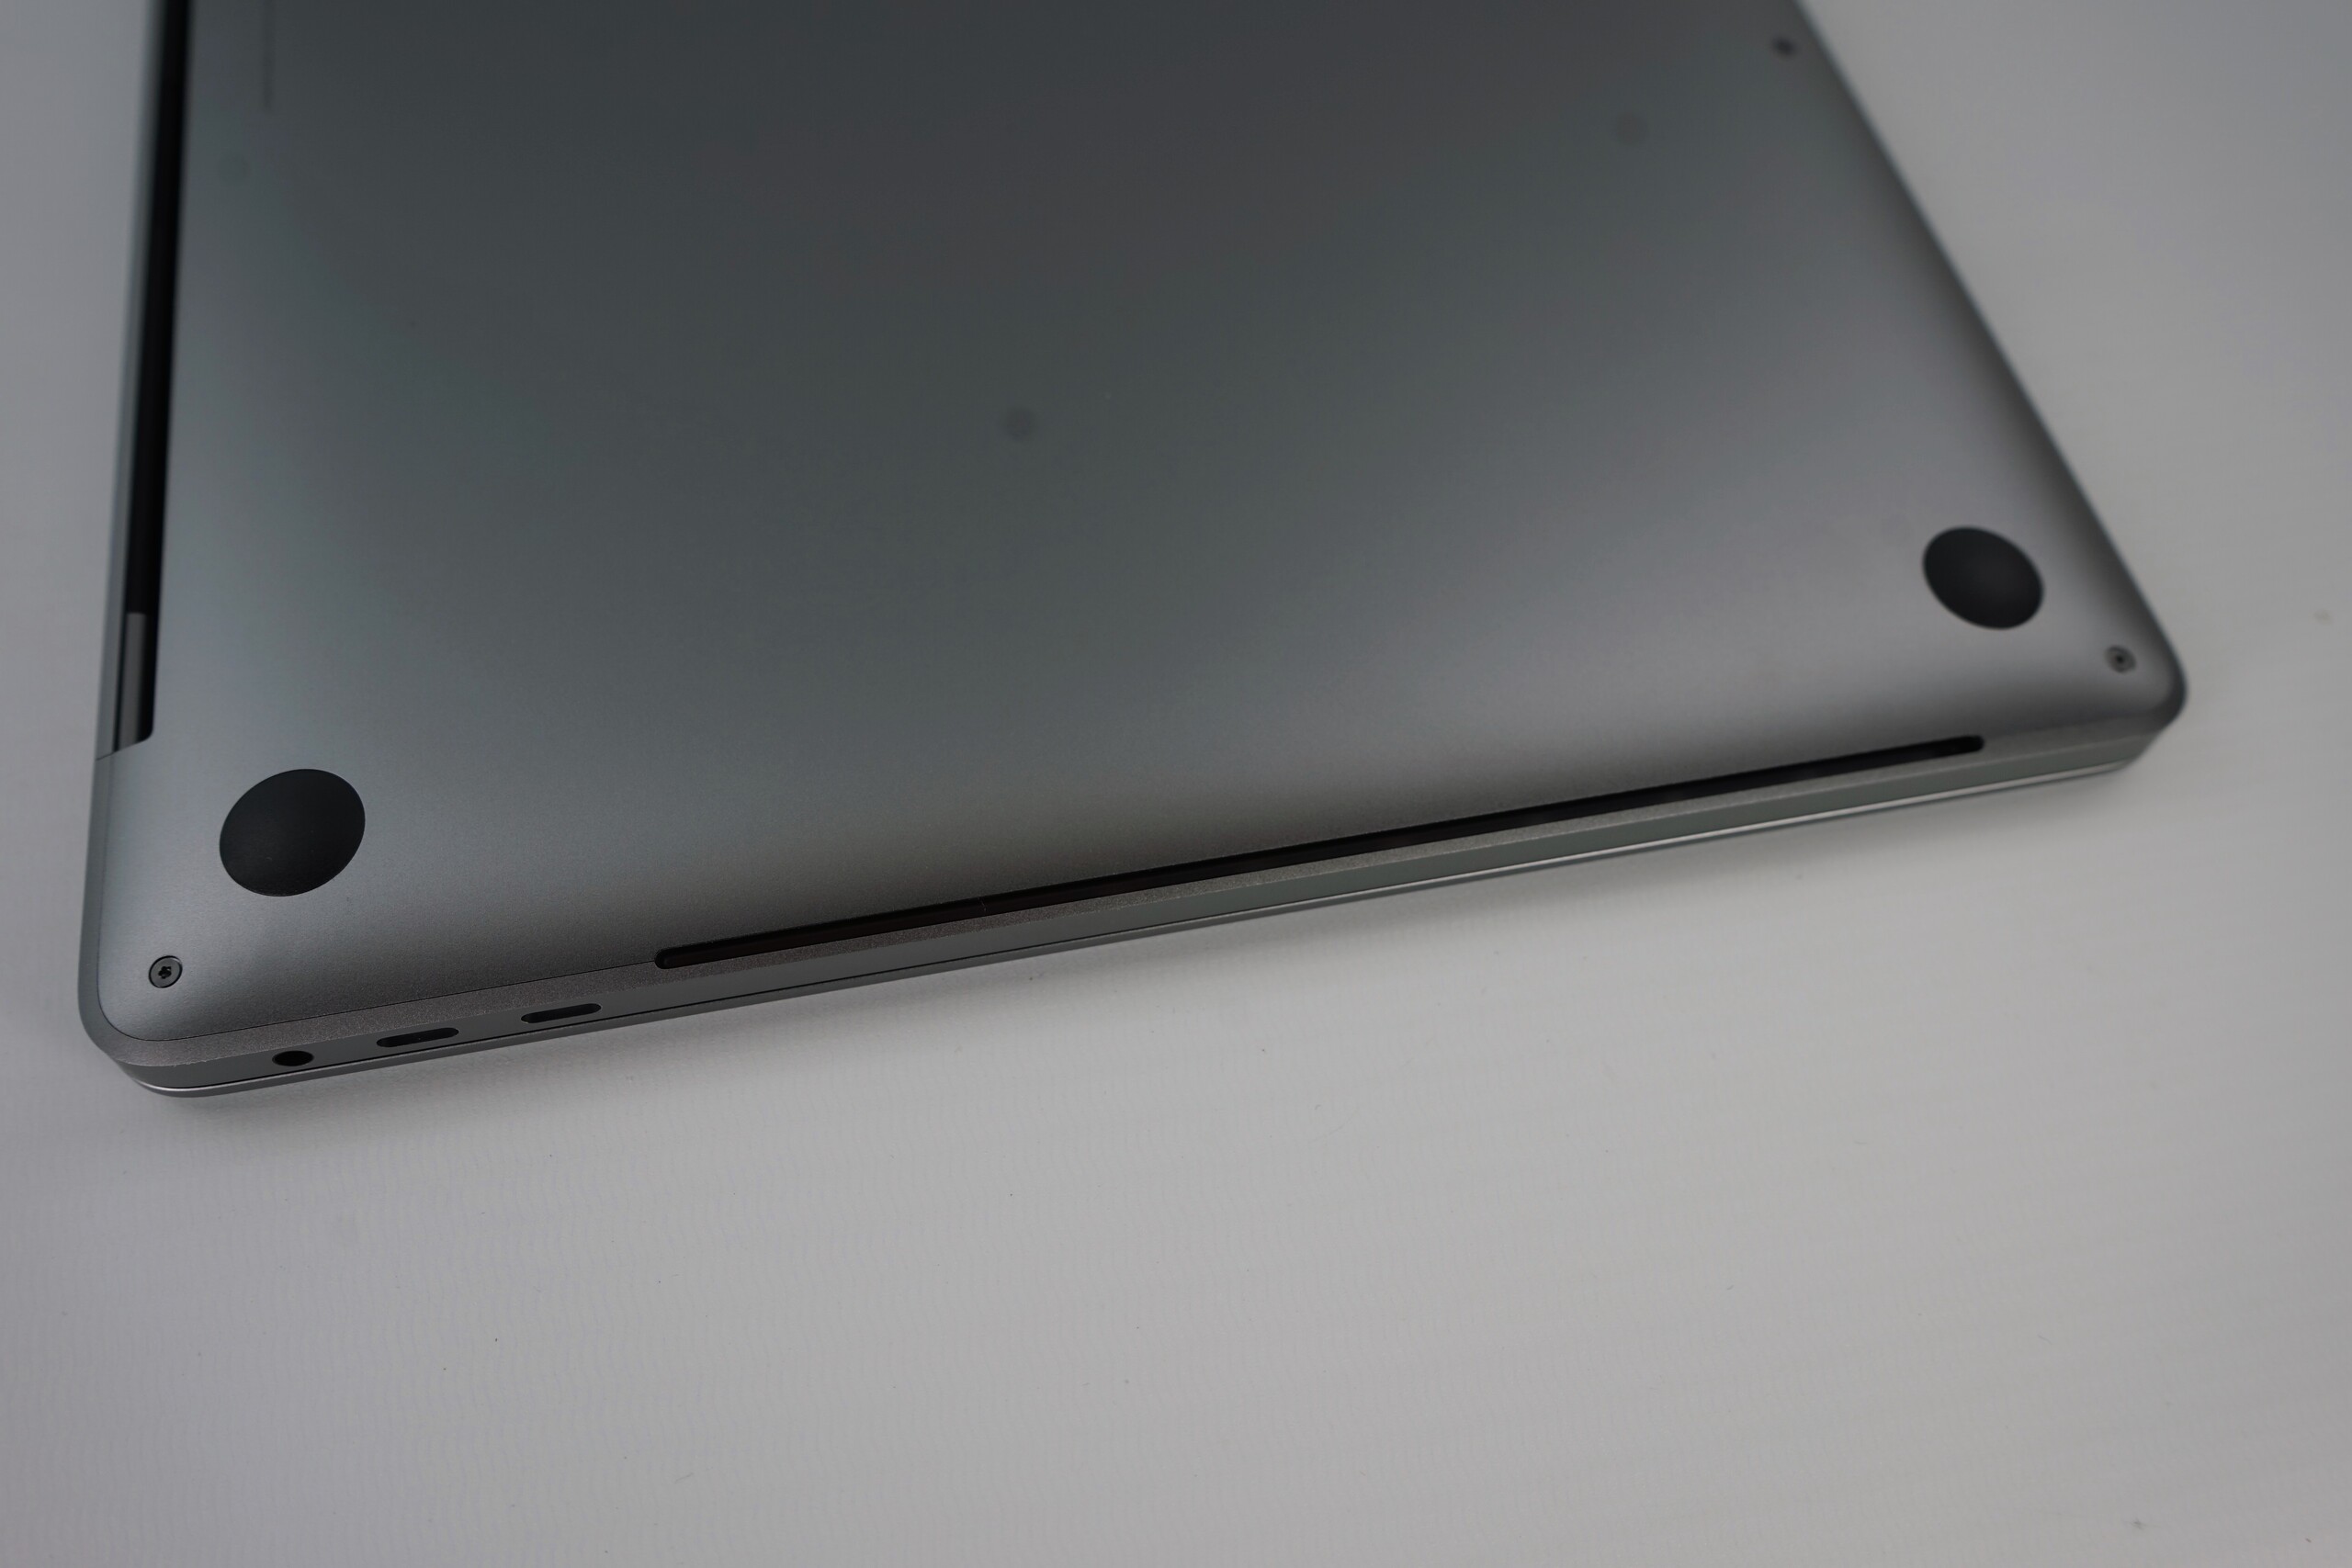
Helaas heeft Apple volgehouden met slechts vier Thunderbolt 3-poorten en een hoofdtelefoonaansluiting in de nieuwe MacBook Pro. Ethernet, HDMI, een kaartlezer en USB Type-A-poorten behoren tot het verleden in het ecosysteem van Apple, dus het kopen van ten minste één dongle is waarschijnlijk noodzakelijk. Evenzo zijn upgrade- en reparatie-opties net zo slecht als voorheen, aangezien Apple de CPU, GPU, RAM, SSD en Wi-Fi-chip soldeert op de printplaat. Dit betekent dat je niet alleen met een verouderde 802.11ac Broadcom Wi-Fi-chip moet leven, maar ook dat je de gehele printplaat moet vervangen als een van deze componenten het begeeft.
De MacBook Pro 16 is een uitstekende en luxe multimedia-laptop met slechte onderhoudsmogelijkheden.
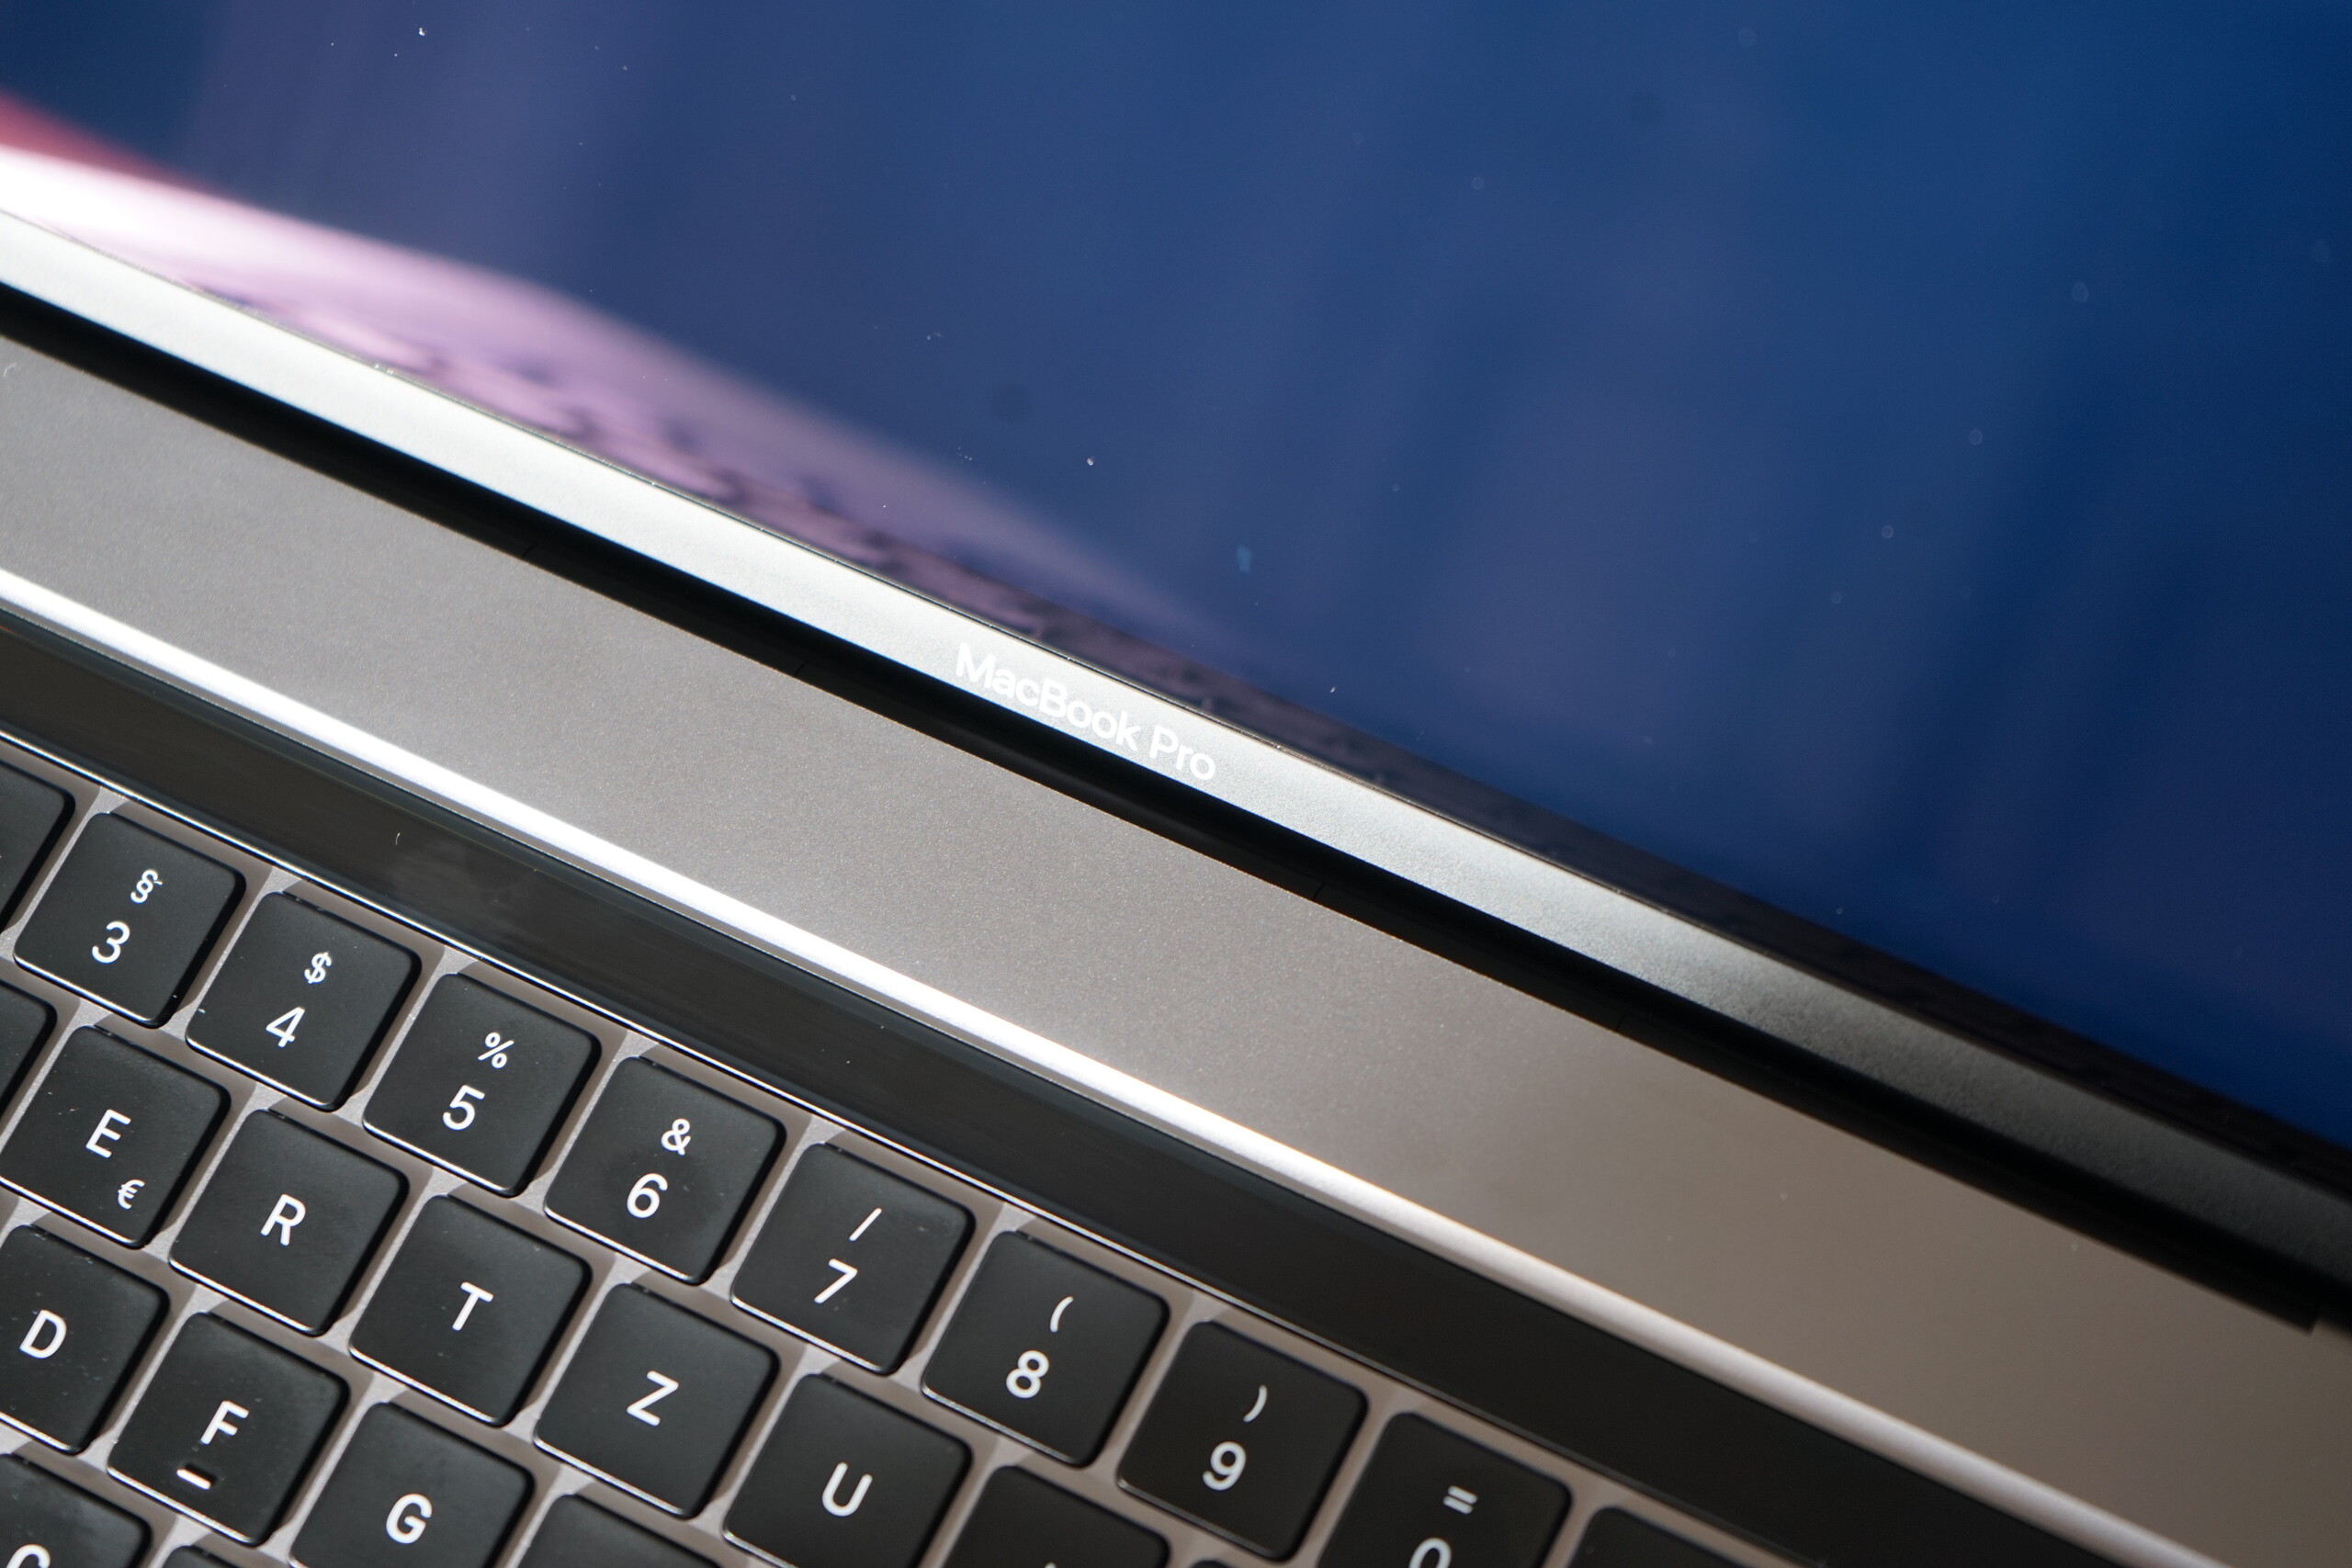
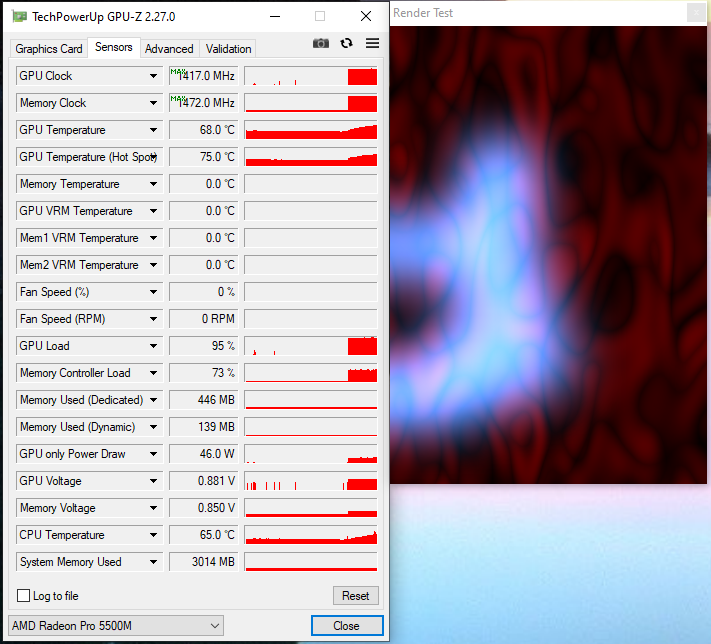
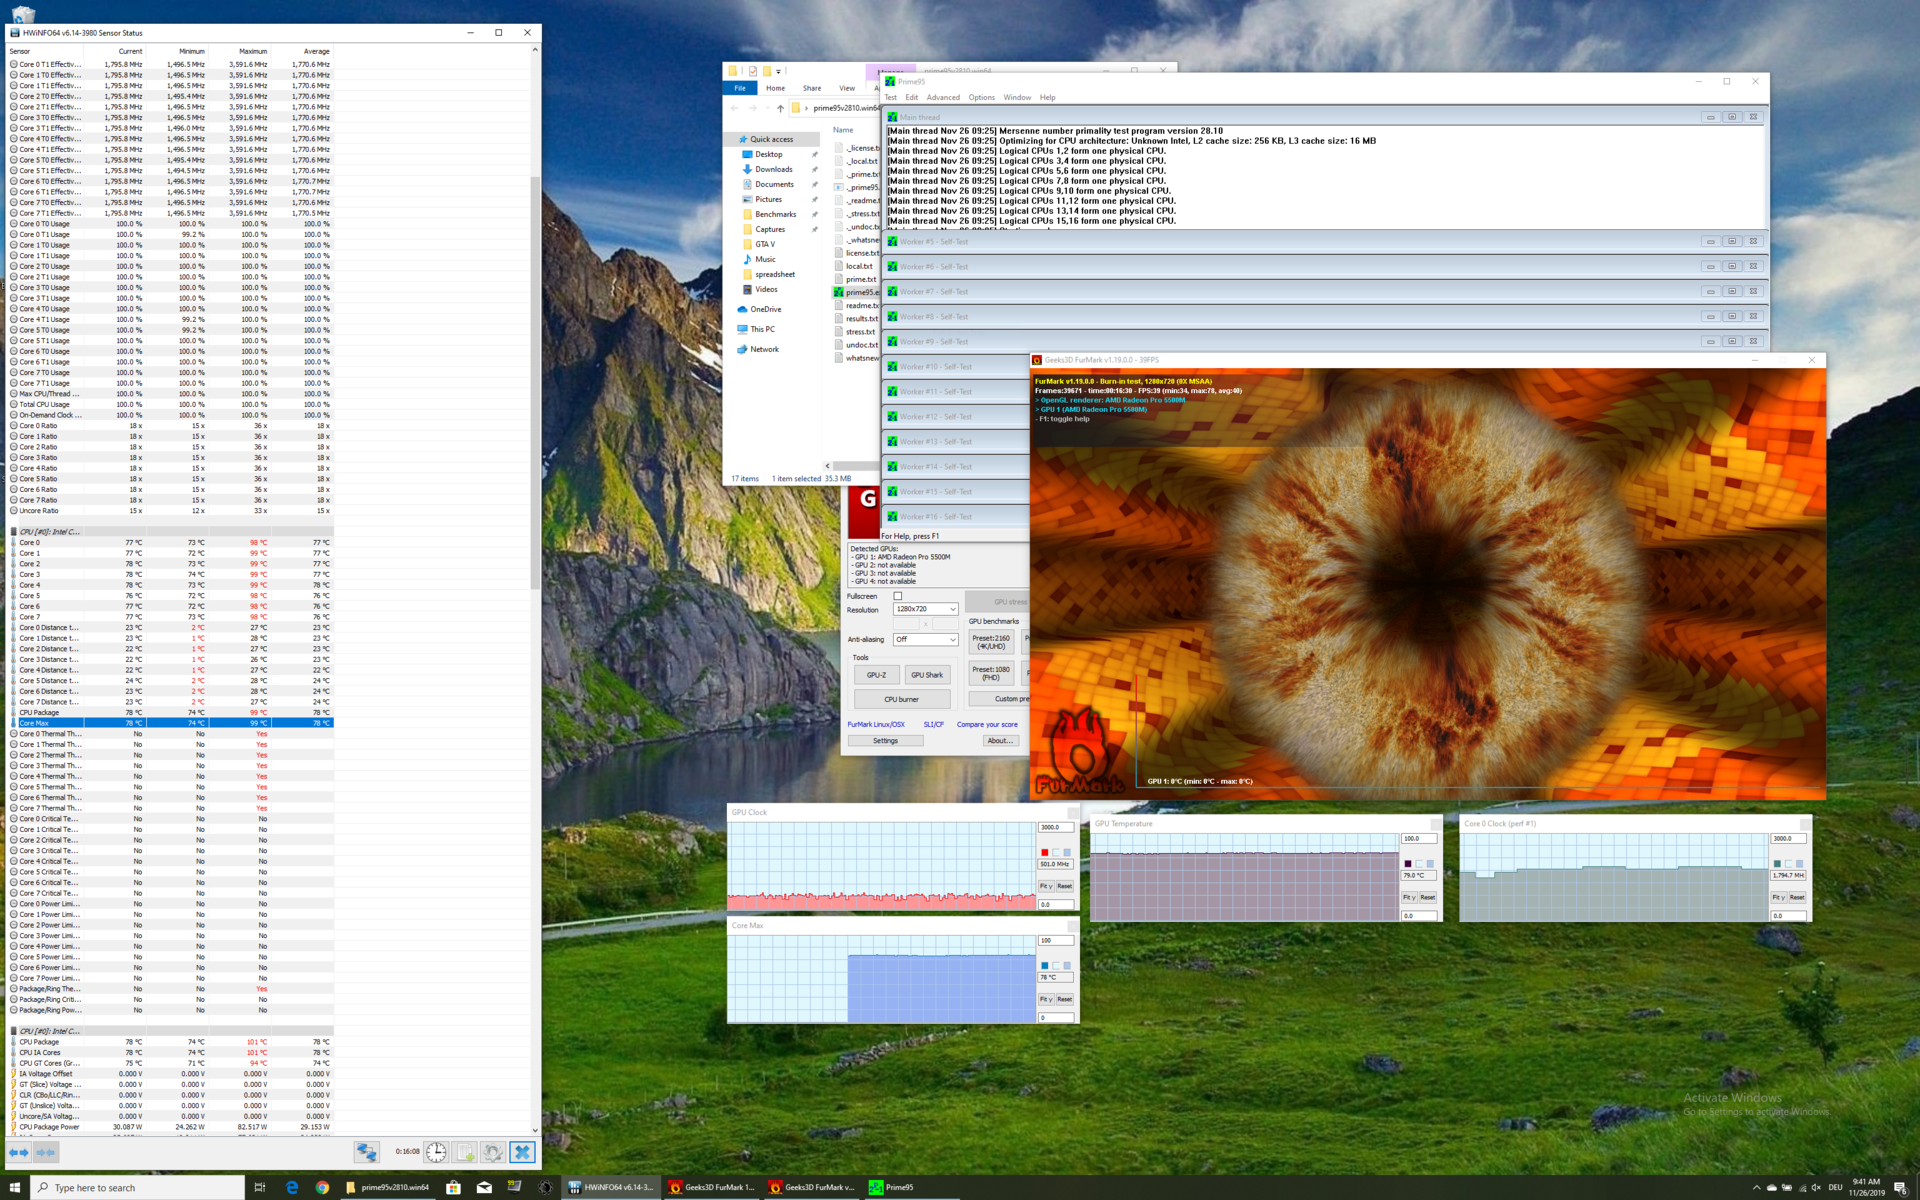
Het nieuwe 16-inch paneel biedt ook geen verrassingen. Het paneel ondersteunt noch 120 Hz verversingsfrequenties noch Adaptive Sync, maar de beeldkwaliteit is net zo goed als de schermen in eerdere MacBook Pro's die we hebben beoordeeld. Dankzij het grotere chassis kon Apple de MacBook Pro 16 ook voorzien van aanzienlijk betere luidsprekers dan zijn 15-inch voorganger. Efficiëntere koeling is ook al tijden welkom en stelt ons testmodel in staat om aanzienlijk betere prestaties uit zijn Core i9-9880H-processor te halen dan zijn voorganger zou kunnen. Hoewel de nieuwe Navi GPU de Windows-wereld niet in rep en roer gaat brengen, vertegenwoordigt het een goede upgrade van de Vega GPU's waarmee Apple de laatste MacBook Pro 15 heeft uitgerust.
De MacBook Pro 16 heeft ondanks een batterij van 100 Wh geen record batterijlevensduur voor multimedia-laptops behaald, omdat de Core i9-processor, het grote beeldscherm en de aparte GPU allemaal energievretende componenten zijn. Als je op internet surft, zou je het echter bijna twee uur langer moeten kunnen volhouden dan met de MacBook Pro 15, wat een tastbare verbetering is. De MacBook Pro 16 zou minstens een volledige werkdag zonder opladen moeten meegaan, iets dat geen van onze vergelijkingsapparaten kon bereiken.
Over het algemeen is de MacBook Pro 16 een uitstekende multimedia-laptop. Het heeft een paar zwakke punten, waarvan de grootste de exorbitante prijs is. Voor $2799 krijg je ook maar een jaar garantie en daarnaast heb je waarschijnlijk minstens één USB Type-C dongle nodig.
Apple MacBook Pro 16 2019 i9 5500M
- 02-12-2019 v7 (old)
Klaus Hinum, Andreas Osthoff
Price comparison
