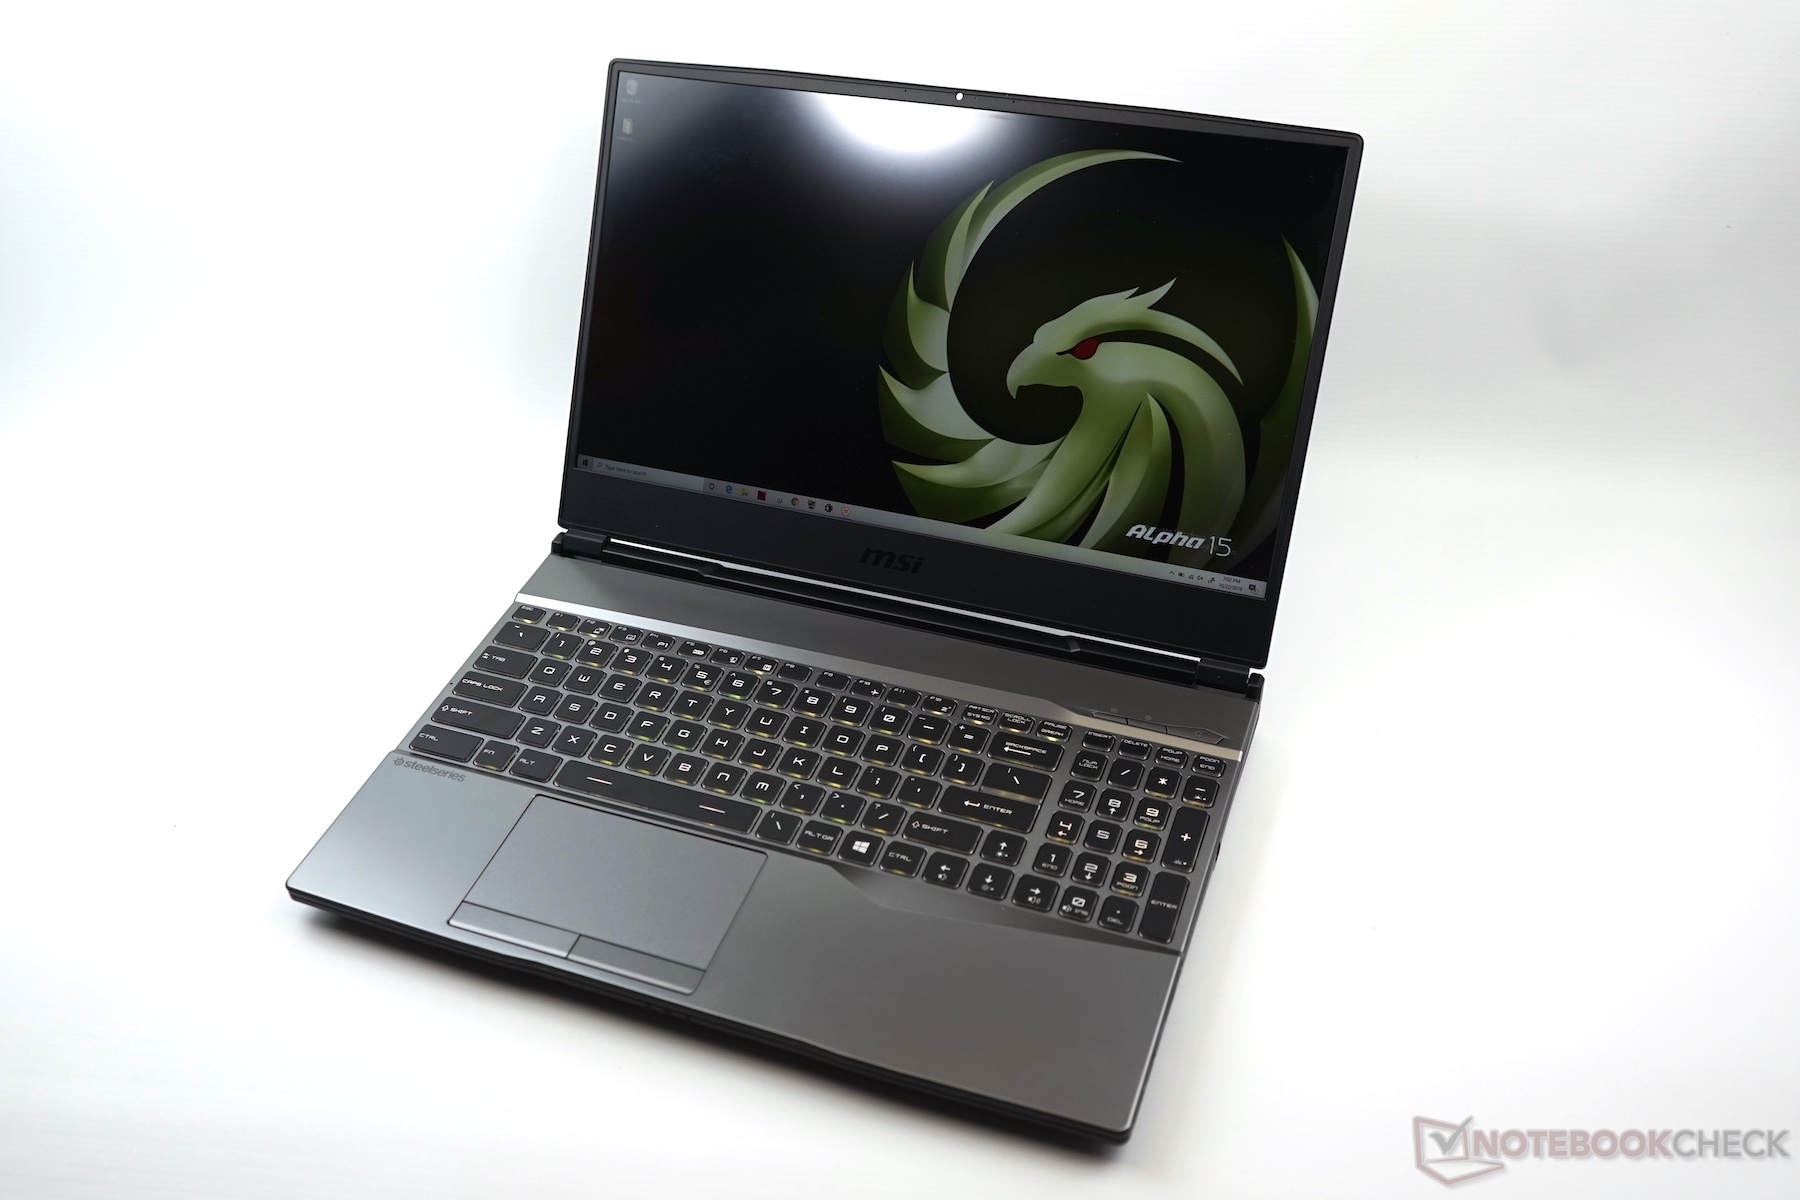
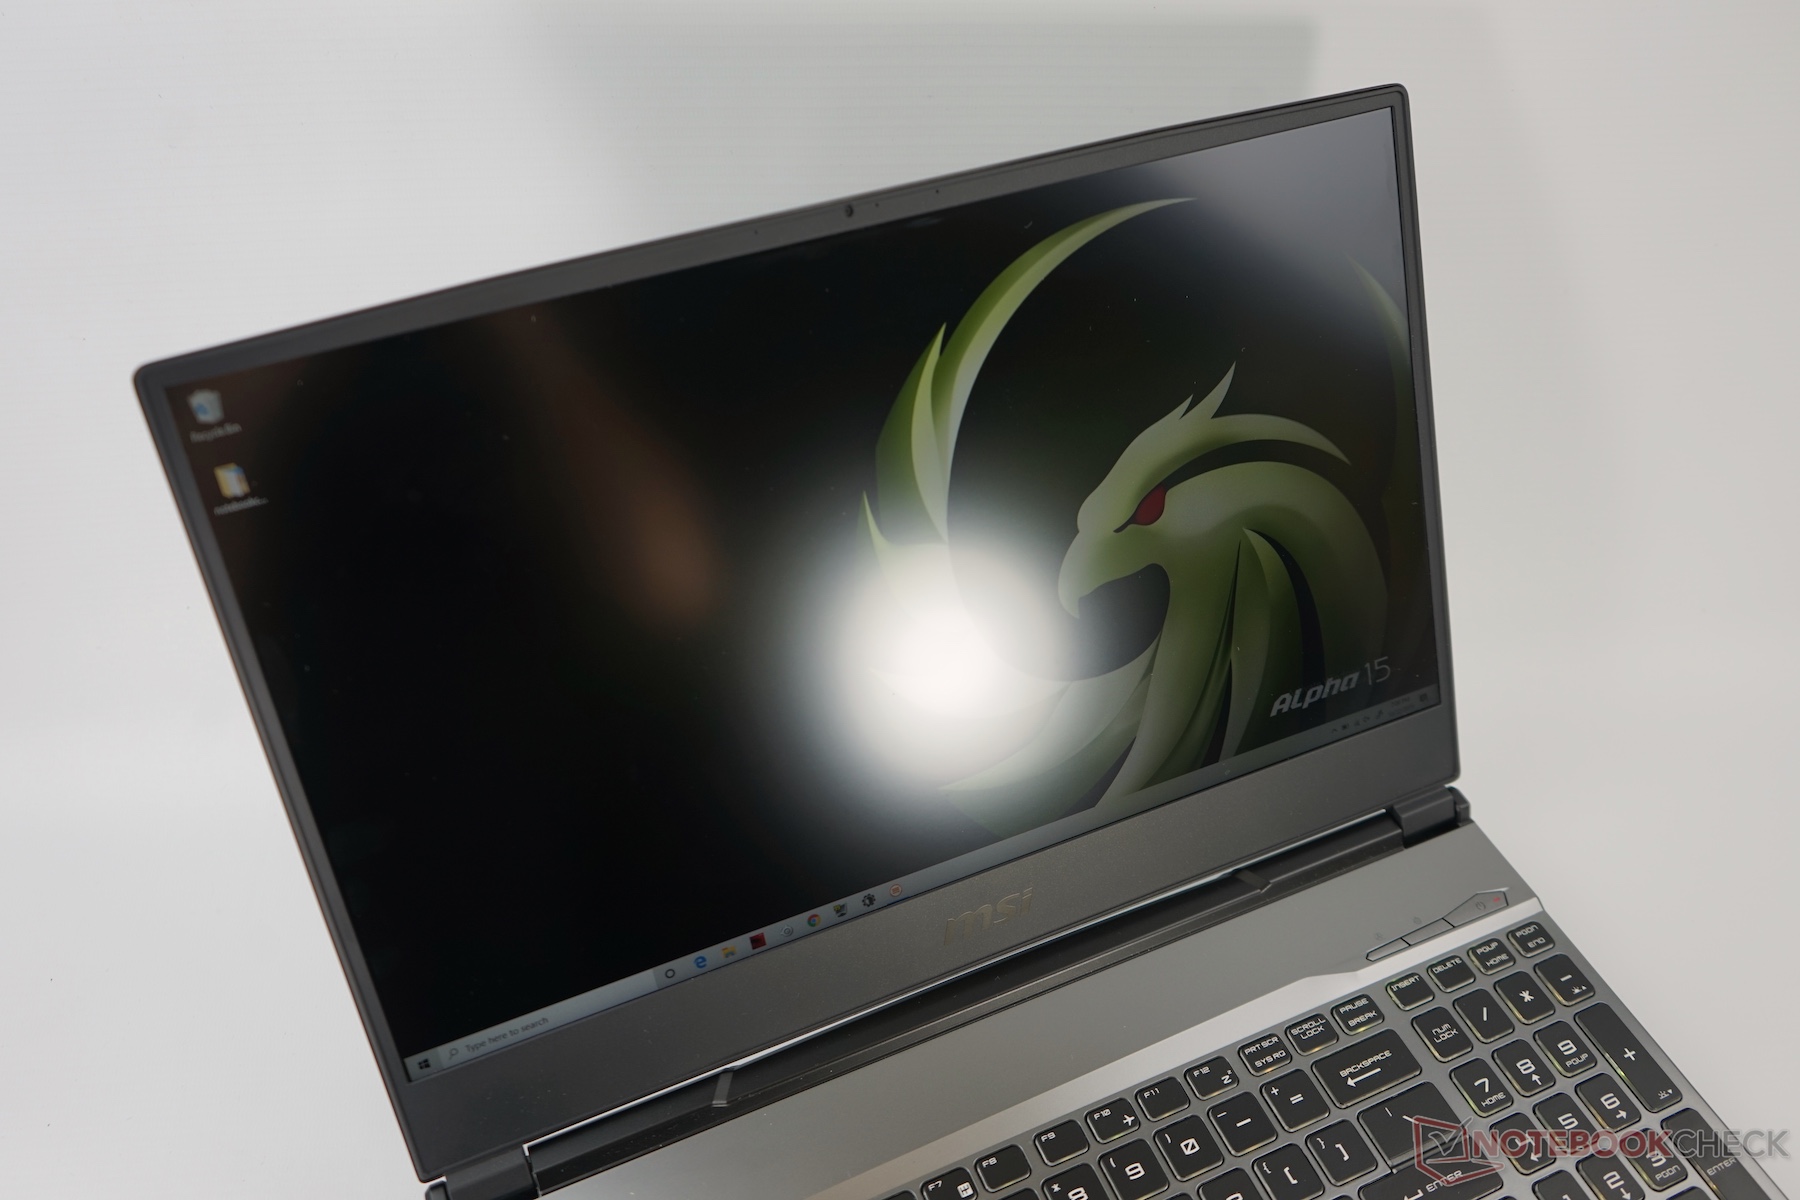
Kort testrapport MSI Alpha 15 Gaming Laptop: Ryzen en Navi in plaats van Intel en Nvidia
Device Overview
Evaluatie | Datum | Model | Gewicht | Hoogte | Formaat | Resolutie | Beste prijs |
|---|---|---|---|---|---|---|---|
v (old) | 11-2019 | MSI Alpha 15 A3DDK R7 3750H, Radeon RX 5500M | 2.3 kg | 27.5 mm | 15.60" | 1920x1080 | |
| 80.4 % v6 (old) | 07-2019 | Asus TUF FX505DT-EB73 R7 3750H, GeForce GTX 1650 Mobile | 2.2 kg | 26.8 mm | 15.60" | 1920x1080 | |
| 79.3 % v7 (old) | 10-2019 | Dell G3 3590 i5-9300H, GeForce GTX 1650 Mobile | 2.5 kg | 21.6 mm | 15.60" | 1920x1080 | |
| 77 % v7 (old) | 10-2019 | Lenovo IdeaPad L340-15IRH 81LK00BMGE i5-9300H, GeForce GTX 1650 Mobile | 2.1 kg | 23.9 mm | 15.60" | 1920x1080 | |
| 81.5 % v7 (old) | 07-2019 | HP Omen 15-dc1020ng i5-9300H, GeForce GTX 1650 Mobile | 2.3 kg | 25 mm | 15.60" | 1920x1080 | |
| 82.5 % v6 (old) | 05-2019 | Acer Aspire Nitro 5 AN515-54-53Z2 i5-9300H, GeForce GTX 1650 Mobile | 2.2 kg | 27 mm | 15.60" | 1920x1080 | |
| 82.3 % v7 (old) | 08-2019 | Lenovo Legion Y540-15IRH-81SX00B2GE i7-9750H, GeForce GTX 1660 Ti Mobile | 2.2 kg | 26 mm | 15.60" | 1920x1080 | |
| 83.9 % v7 (old) | 08-2019 | HP Gaming Pavilion 15-dk0009ng i7-9750H, GeForce GTX 1660 Ti Max-Q | 2.4 kg | 23.4 mm | 15.60" | 1920x1080 | |
| 83.3 % v6 (old) | 05-2019 | Asus ROG Zephyrus G15 GA502DU R7 3750H, GeForce GTX 1660 Ti Max-Q | 2.1 kg | 20.4 mm | 15.60" | 1920x1080 |
| |||||||||||||||||||||||||
Helderheidsverdeling: 91 %
Helderheid in Batterij-modus: 266 cd/m²
Contrast: 1506:1 (Zwart: 0.18 cd/m²)
ΔE ColorChecker Calman: 4.38 | ∀{0.5-29.43 Ø4.73}
calibrated: 4.29
ΔE Greyscale Calman: 2.1 | ∀{0.09-98 Ø4.97}
36.74% AdobeRGB 1998 (Argyll 3D)
53.5% sRGB (Argyll 3D)
35.56% Display P3 (Argyll 3D)
Gamma: 2.15
CCT: 6867 K
| MSI Alpha 15 A3DDK AU Optronics B156HAN13.0 (AUOD0ED), IPS, 1920x1080, 15.6" | Asus TUF FX505DT-EB73 Panda LM156LF-GL, IPS, 1920x1080, 15.6" | Dell G3 3590 BOE NV15N3D, IPS, 1920x1080, 15.6" | Lenovo IdeaPad L340-15IRH 81LK00BMGE CMN 156HCA-EAB, IPS, 1920x1080, 15.6" | Lenovo Legion Y540-15IRH-81SX00B2GE BOE 084D, IPS, 1920x1080, 15.6" | HP Gaming Pavilion 15-dk0009ng LG Philips LGD05FE, IPS, 1920x1080, 15.6" | |
|---|---|---|---|---|---|---|
| Display | 11% | 13% | 20% | 76% | 79% | |
| Display P3 Coverage (%) | 35.56 | 39.56 11% | 40.13 13% | 42.81 20% | 63.6 79% | 64.2 81% |
| sRGB Coverage (%) | 53.5 | 59.5 11% | 59.8 12% | 63.8 19% | 91.7 71% | 95.1 78% |
| AdobeRGB 1998 Coverage (%) | 36.74 | 40.91 11% | 41.47 13% | 44.31 21% | 65.2 77% | 65.8 79% |
| Response Times | 6% | -25% | -22% | 66% | 58% | |
| Response Time Grey 50% / Grey 80% * (ms) | 36.1 | 30.4 ? 16% | 46 ? -27% | 45.6 ? -26% | 8.8 ? 76% | 16.4 ? 55% |
| Response Time Black / White * (ms) | 26.4 | 27.6 ? -5% | 32.4 ? -23% | 30.8 ? -17% | 12 ? 55% | 10.4 ? 61% |
| PWM Frequency (Hz) | 200 ? | 25910 ? | ||||
| Screen | -34% | -20% | -15% | -5% | 15% | |
| Brightness middle (cd/m²) | 271 | 286.2 6% | 276.2 2% | 275 1% | 299 10% | 345 27% |
| Brightness (cd/m²) | 266 | 267 0% | 261 -2% | 253 -5% | 290 9% | 324 22% |
| Brightness Distribution (%) | 91 | 84 -8% | 86 -5% | 83 -9% | 89 -2% | 86 -5% |
| Black Level * (cd/m²) | 0.18 | 0.33 -83% | 0.24 -33% | 0.18 -0% | 0.29 -61% | 0.42 -133% |
| Contrast (:1) | 1506 | 867 -42% | 1151 -24% | 1528 1% | 1031 -32% | 821 -45% |
| Colorchecker dE 2000 * | 4.38 | 5.45 -24% | 5.56 -27% | 5.4 -23% | 3.7 16% | 1.3 70% |
| Colorchecker dE 2000 max. * | 17.6 | 18.08 -3% | 23.45 -33% | 21.3 -21% | 7 60% | 2.8 84% |
| Colorchecker dE 2000 calibrated * | 4.29 | 4.47 -4% | 5.23 -22% | 4.4 -3% | 2 53% | 1.1 74% |
| Greyscale dE 2000 * | 2.1 | 5.3 -152% | 2.8 -33% | 3.7 -76% | 4.1 -95% | 1.2 43% |
| Gamma | 2.15 102% | 2.1 105% | 2.37 93% | 2.12 104% | 2.19 100% | 2.31 95% |
| CCT | 6867 95% | 7679 85% | 6710 97% | 6376 102% | 7166 91% | 6476 100% |
| Color Space (Percent of AdobeRGB 1998) (%) | 37.6 | 37.8 | 40.8 | 59.3 | 60.5 | |
| Color Space (Percent of sRGB) (%) | 59.1 | 59 | 63.6 | 91.5 | 94.9 | |
| Totaal Gemiddelde (Programma / Instellingen) | -6% /
-19% | -11% /
-14% | -6% /
-8% | 46% /
23% | 51% /
35% |
* ... kleiner is beter
Responstijd Scherm
| ↔ Responstijd Zwart naar Wit | ||
|---|---|---|
| 26.4 ms ... stijging ↗ en daling ↘ gecombineerd | ↗ ms stijging | 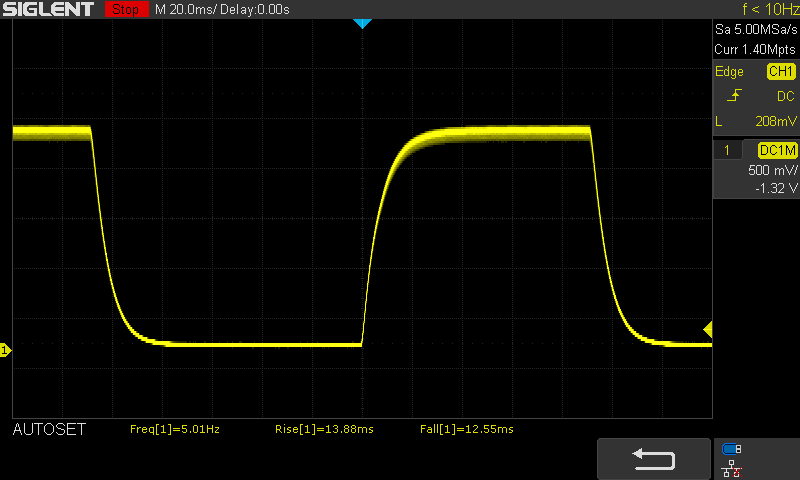 |
| ↘ ms daling | ||
| Het scherm vertoonde relatief trage responstijden in onze tests en is misschien te traag voor games. Ter vergelijking: alle testtoestellen variëren van 0.1 (minimum) tot 240 (maximum) ms. » 66 % van alle toestellen zijn beter. Dit betekent dat de gemeten responstijd slechter is dan het gemiddelde (19.9 ms) van alle geteste toestellen. | ||
| ↔ Responstijd 50% Grijs naar 80% Grijs | ||
| 36.1 ms ... stijging ↗ en daling ↘ gecombineerd | ↗ ms stijging | 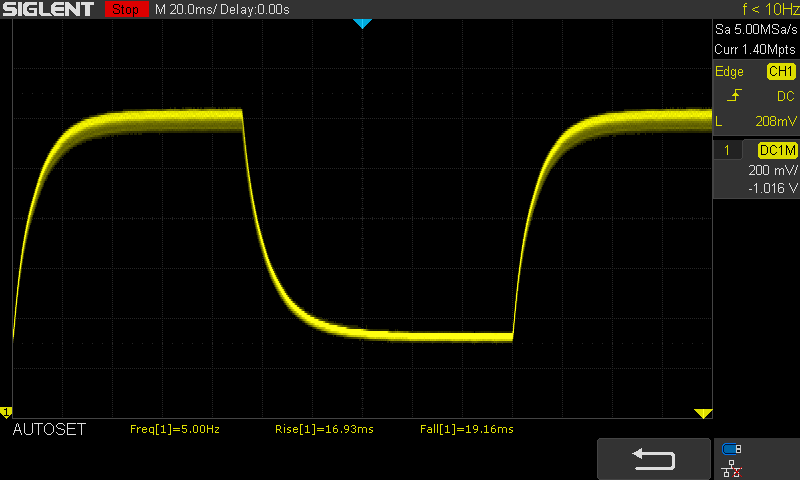 |
| ↘ ms daling | ||
| Het scherm vertoonde trage responstijden in onze tests en is misschien te traag voor games. Ter vergelijking: alle testtoestellen variëren van 0.165 (minimum) tot 636 (maximum) ms. » 52 % van alle toestellen zijn beter. Dit betekent dat de gemeten responstijd slechter is dan het gemiddelde (31.1 ms) van alle geteste toestellen. | ||
Screen Flickering / PWM (Pulse-Width Modulation)
| Screen flickering / PWM niet waargenomen | 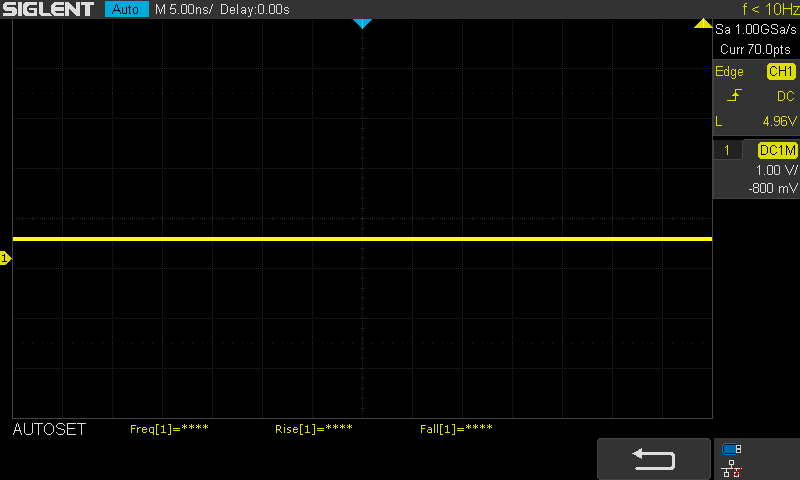 | ||
Ter vergelijking: 52 % van alle geteste toestellen maakten geen gebruik van PWM om de schermhelderheid te verlagen. Als het wel werd gebruikt, werd een gemiddelde van 7798 (minimum: 5 - maximum: 343500) Hz waargenomen. | |||
| PCMark 8 Home Score Accelerated v2 | 4800 punten | |
| PCMark 8 Creative Score Accelerated v2 | 6613 punten | |
| PCMark 8 Work Score Accelerated v2 | 5167 punten | |
| PCMark 10 Score | 4733 punten | |
Help | ||
| 3DMark 06 Standard Score | 26559 punten | |
| 3DMark 11 Performance | 13344 punten | |
| 3DMark Cloud Gate Standard Score | 22627 punten | |
| 3DMark Fire Strike Score | 10080 punten | |
| 3DMark Time Spy Score | 4024 punten | |
Help | ||
| F1 2019 - 1920x1080 Ultra High Preset AA:T AF:16x | |
| Gemiddeld NVIDIA GeForce GTX 1660 Ti Mobile (91 - 99, n=4) | |
| HP Pavilion Gaming 15-ec0017ng | |
| Gemiddeld NVIDIA GeForce GTX 1660 Ti Max-Q (71 - 77, n=2) | |
| HP Gaming Pavilion 15-dk0009ng | |
| MSI Alpha 15 A3DDK | |
| HP Omen 15-dc1020ng | |
| Gemiddeld NVIDIA GeForce GTX 1650 Mobile (59 - 65, n=5) | |
| HP Omen 15-dc1020ng | |
| Dell G5 15 5590-PCNJJ | |
| Rage 2 - 1920x1080 Ultra Preset (Resolution Scale Off) | |
| Gemiddeld NVIDIA GeForce GTX 1660 Ti Mobile (67.9 - 68.8, n=2) | |
| HP Pavilion Gaming 15-ec0017ng | |
| Gemiddeld NVIDIA GeForce GTX 1660 Ti Max-Q (58.2 - 64.8, n=2) | |
| HP Omen 15-dc1020ng | |
| HP Gaming Pavilion 15-dk0009ng | |
| MSI Alpha 15 A3DDK | |
| Gemiddeld NVIDIA GeForce GTX 1650 Mobile (45.1 - 60, n=3) | |
| HP Omen 15-dc1020ng | |
| Dell G5 15 5590-PCNJJ | |
| Ghost Recon Breakpoint - 1920x1080 Ultra Preset AA:T | |
| Gemiddeld NVIDIA GeForce GTX 1660 Ti Mobile (51 - 55, n=2) | |
| Gemiddeld NVIDIA GeForce GTX 1660 Ti Max-Q (48 - 51, n=2) | |
| HP Pavilion Gaming 15-ec0017ng | |
| Gemiddeld NVIDIA GeForce GTX 1650 Mobile (30 - 37, n=2) | |
| Dell G5 15 5590-PCNJJ | |
| MSI Alpha 15 A3DDK | |
| Borderlands 3 - 1920x1080 Badass Overall Quality (DX11) | |
| Gemiddeld NVIDIA GeForce GTX 1660 Ti Mobile (46.6 - 48.6, n=3) | |
| Gemiddeld NVIDIA GeForce GTX 1660 Ti Max-Q (41.5 - 42.3, n=2) | |
| HP Pavilion Gaming 15-ec0017ng | |
| MSI Alpha 15 A3DDK | |
| Gemiddeld NVIDIA GeForce GTX 1650 Mobile (29 - 34.6, n=5) | |
| Dell G5 15 5590-PCNJJ | |
| Total War: Three Kingdoms - 1920x1080 Ultra (incl textures) | |
| Gemiddeld NVIDIA GeForce GTX 1660 Ti Mobile (n=1) | |
| HP Gaming Pavilion 15-dk0009ng | |
| Gemiddeld NVIDIA GeForce GTX 1660 Ti Max-Q (41.1 - 41.6, n=2) | |
| HP Pavilion Gaming 15-ec0017ng | |
| MSI Alpha 15 A3DDK | |
| Gemiddeld NVIDIA GeForce GTX 1650 Mobile (24.4 - 26.9, n=4) | |
| Dell G5 15 5590-PCNJJ | |
| lage | gem. | hoge | ultra | QHD | 4K | |
|---|---|---|---|---|---|---|
| Counter-Strike: GO (2012) | 191 | 137 | 76.3 | |||
| BioShock Infinite (2013) | 201 | 169 | 123 | |||
| GTA V (2015) | 93 | 48.6 | 20.2 | |||
| The Witcher 3 (2015) | 165 | 72 | 43.6 | |||
| Dota 2 Reborn (2015) | 93 | 86 | 81 | 72 | 53 | |
| World of Warships (2015) | 93 | 54.9 | ||||
| Rainbow Six Siege (2015) | 151 | 143 | 59.6 | |||
| Overwatch (2016) | 124 | 109 | 74 | |||
| Rocket League (2017) | 175 | 175 | 72 | |||
| Playerunknown's Battlegrounds (PUBG) (2017) | 59.4 | |||||
| Middle-earth: Shadow of War (2017) | 70 | 24 | ||||
| Assassin´s Creed Origins (2017) | 41 | 35 | ||||
| Fortnite (2018) | 65 | |||||
| Far Cry 5 (2018) | 62 | 59 | 48 | |||
| Shadow of the Tomb Raider (2018) | 59 | 53 | 32 | 15 | ||
| Assassin´s Creed Odyssey (2018) | 48 | 43 | 40 | 31 | ||
| Call of Duty Black Ops 4 (2018) | 67.5 | 53.9 | 28.8 | |||
| Battlefield V (2018) | 61 | 43.7 | 16.2 | |||
| Farming Simulator 19 (2018) | 70 | 49.1 | 32.8 | |||
| Apex Legends (2019) | 72 | 51.7 | 28.4 | |||
| Far Cry New Dawn (2019) | 51 | 47 | 25 | |||
| Metro Exodus (2019) | 92.3 | 45.4 | 38.1 | 32.2 | 25 | |
| Anthem (2019) | 48 (stuttering) | 47 (stuttering) | 44 (stuttering) | 32 (stuttering) | ||
| Dirt Rally 2.0 (2019) | 58.4 | 38.1 | 22.8 | |||
| The Division 2 (2019) | 51 | 42 | ||||
| Anno 1800 (2019) | 60 | 46.3 | 23.9 | |||
| Rage 2 (2019) | 67 | 55.7 | 53.4 | 15.4 | ||
| Total War: Three Kingdoms (2019) | 134 | 69.1 | 48.7 | 35.8 | 19.4 | 6.9 |
| F1 2019 (2019) | 79 | 74 | 64 | 64 | 49.1 | 33.3 |
| Control (2019) | 119 | 47.5 | 34.2 | |||
| Borderlands 3 (2019) | 76 | 66 | 47.2 | 35.6 | 23.9 | 6.7 |
| FIFA 20 (2019) | 122 | 122 | 96 | |||
| Ghost Recon Breakpoint (2019) | 58 | 53 | 48 | 26 | ||
| GRID 2019 (2019) | 81 | 67 | 36.7 | 29.9 | 15.2 | |
| Call of Duty Modern Warfare 2019 (2019) | 112 | 94 | 81 | 64 | 35.4 | 20.1 |
| Need for Speed Heat (2019) | 63 | 57.7 | 52.3 | 45.8 | 41 | 14.1 |
| Star Wars Jedi Fallen Order (2019) | 58.6 | 40.1 | 19.8 | |||
| Red Dead Redemption 2 (2019) | 92 | 63 | 40.5 | 23.8 | ||
| God of War (2022) | 36.1 | 36 | 33 | 9.06 | ||
| Rainbow Six Extraction (2022) | 95 | 78 | 76 | 36 | ||
| GRID Legends (2022) | 81 | 71.8 | 71.1 | 59.2 | ||
| Elden Ring (2022) | 37 | 35.8 | 35.2 | 35.2 | ||
| Cyberpunk 2077 1.6 (2022) | 55.9 | 44.9 | 34.4 | 27.7 | ||
| Elex 2 (2022) | 20.1 | 19.3 | 19.4 | 18.8 | ||
| Ghostwire Tokyo (2022) | 56 | 56 | 55.7 | 54.9 | ||
| Tiny Tina's Wonderlands (2022) | 88.5 | 71.2 | 38.6 | 28.3 | ||
| Vampire Bloodhunt (2022) | 93.8 | 82.1 | 78.7 | 77.3 | ||
| F1 22 (2022) | 95 | 92 | 78 | 66 | ||
| The Quarry (2022) | 65.5 | 47 | 40.3 | 23.8 | ||
| FIFA 23 (2022) | 46.6 | 38.4 | 33.3 | 33.2 | ||
| A Plague Tale Requiem (2022) | 47.2 | 36.9 | 26.9 | 20.7 | ||
| Uncharted Legacy of Thieves Collection (2022) | 36.6 | 32.3 | 20.6 | 18.6 | ||
| Call of Duty Modern Warfare 2 2022 (2022) | 70 | 66 | 56 | 43 | ||
| Spider-Man Miles Morales (2022) | 48 | 43.3 | 30.6 | 26 | ||
| The Callisto Protocol (2022) | 57.7 | 47.4 | 29.8 | 28.6 | ||
| Need for Speed Unbound (2022) | 43.2 | 41 | 34.7 | 27.3 |
Geluidsniveau
| Onbelast |
| 31.1 / 34.8 / 35.5 dB (A) |
| Belasting |
| 43 / 53.6 dB (A) |
 | ||
30 dB stil 40 dB(A) hoorbaar 50 dB(A) luid |
||
min: | ||
(±) De maximumtemperatuur aan de bovenzijde bedraagt 42 °C / 108 F, vergeleken met het gemiddelde van 40.4 °C / 105 F, variërend van 21.2 tot 68.8 °C voor de klasse Gaming.
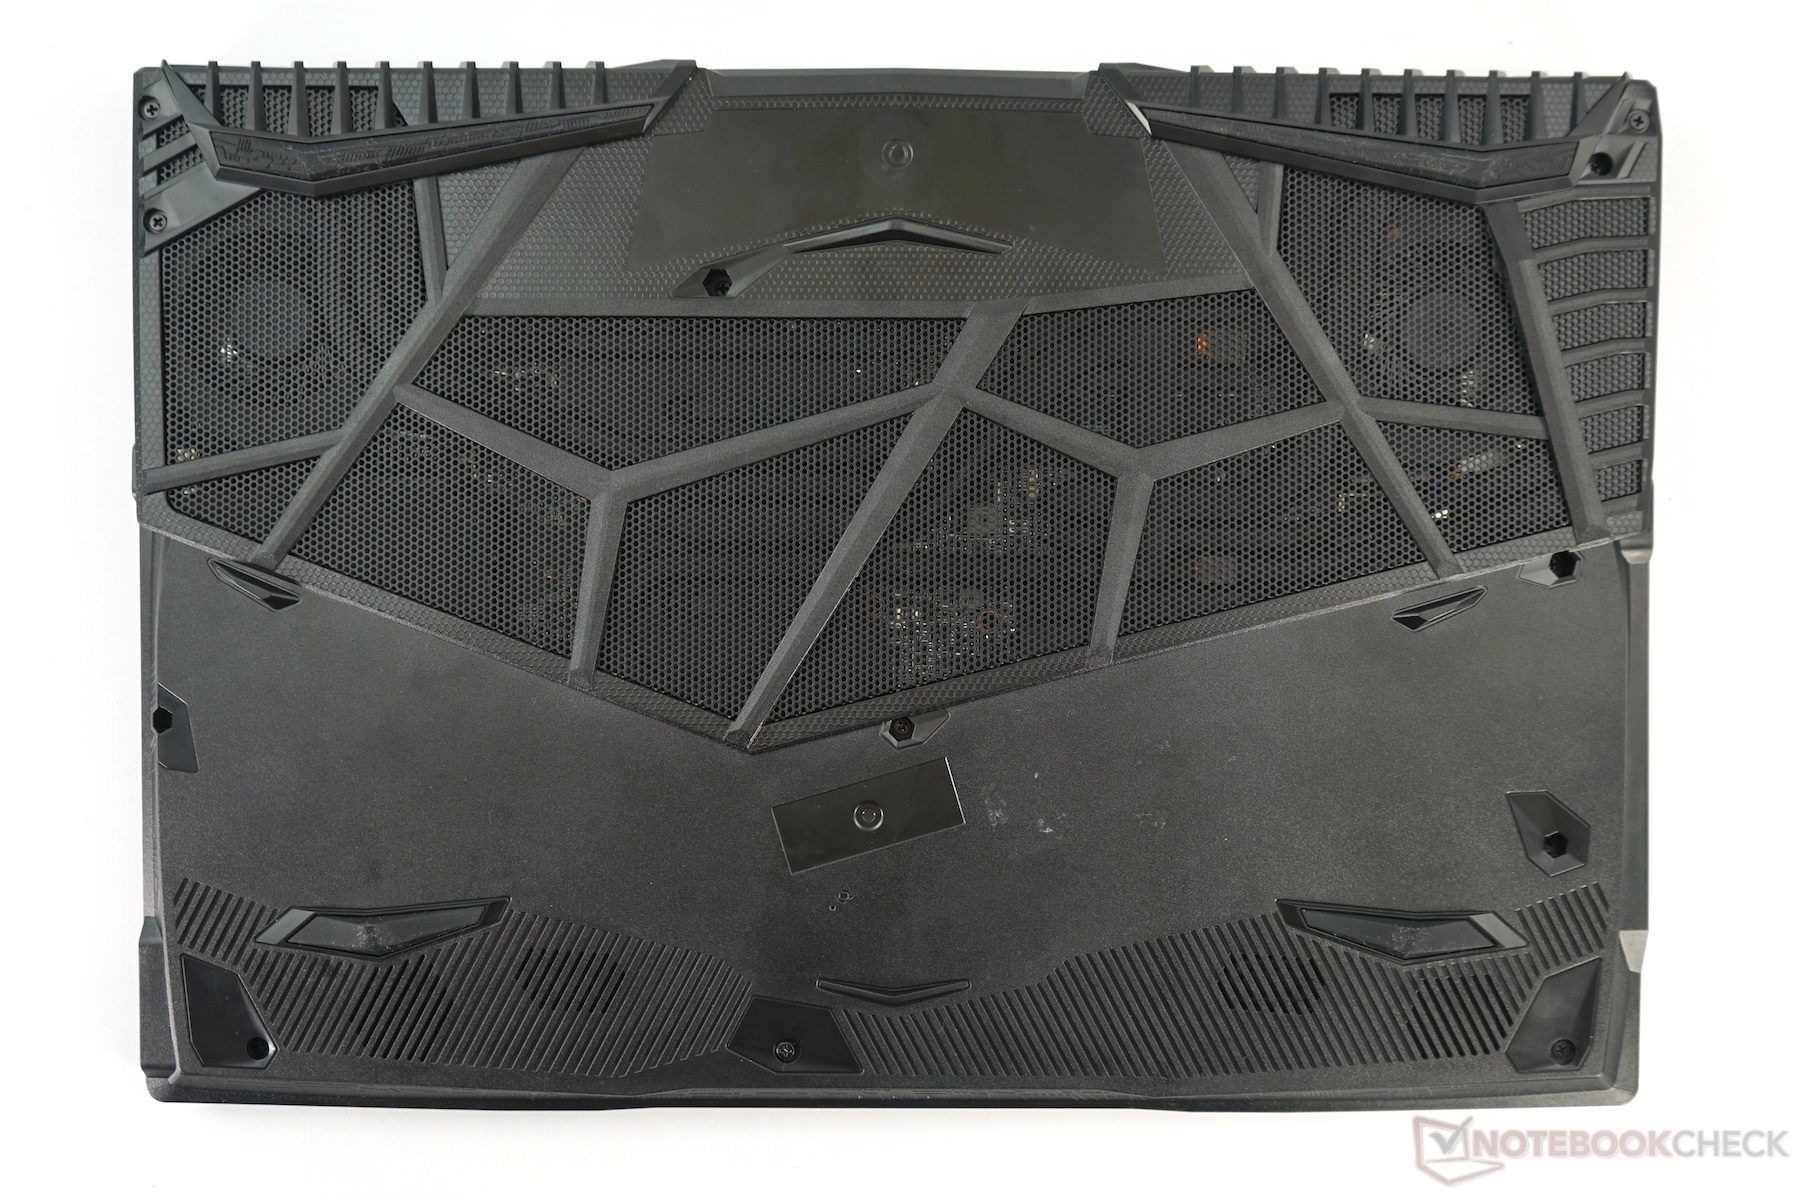
(±) De bodem warmt op tot een maximum van 45 °C / 113 F, vergeleken met een gemiddelde van 43.2 °C / 110 F
(+) Bij onbelast gebruik bedraagt de gemiddelde temperatuur voor de bovenzijde 29.1 °C / 84 F, vergeleken met het apparaatgemiddelde van 33.9 °C / 93 F.
(+) Bij het spelen van The Witcher 3 is de gemiddelde temperatuur voor de bovenzijde 31.3 °C / 88 F, vergeleken met het apparaatgemiddelde van 33.9 °C / 93 F.
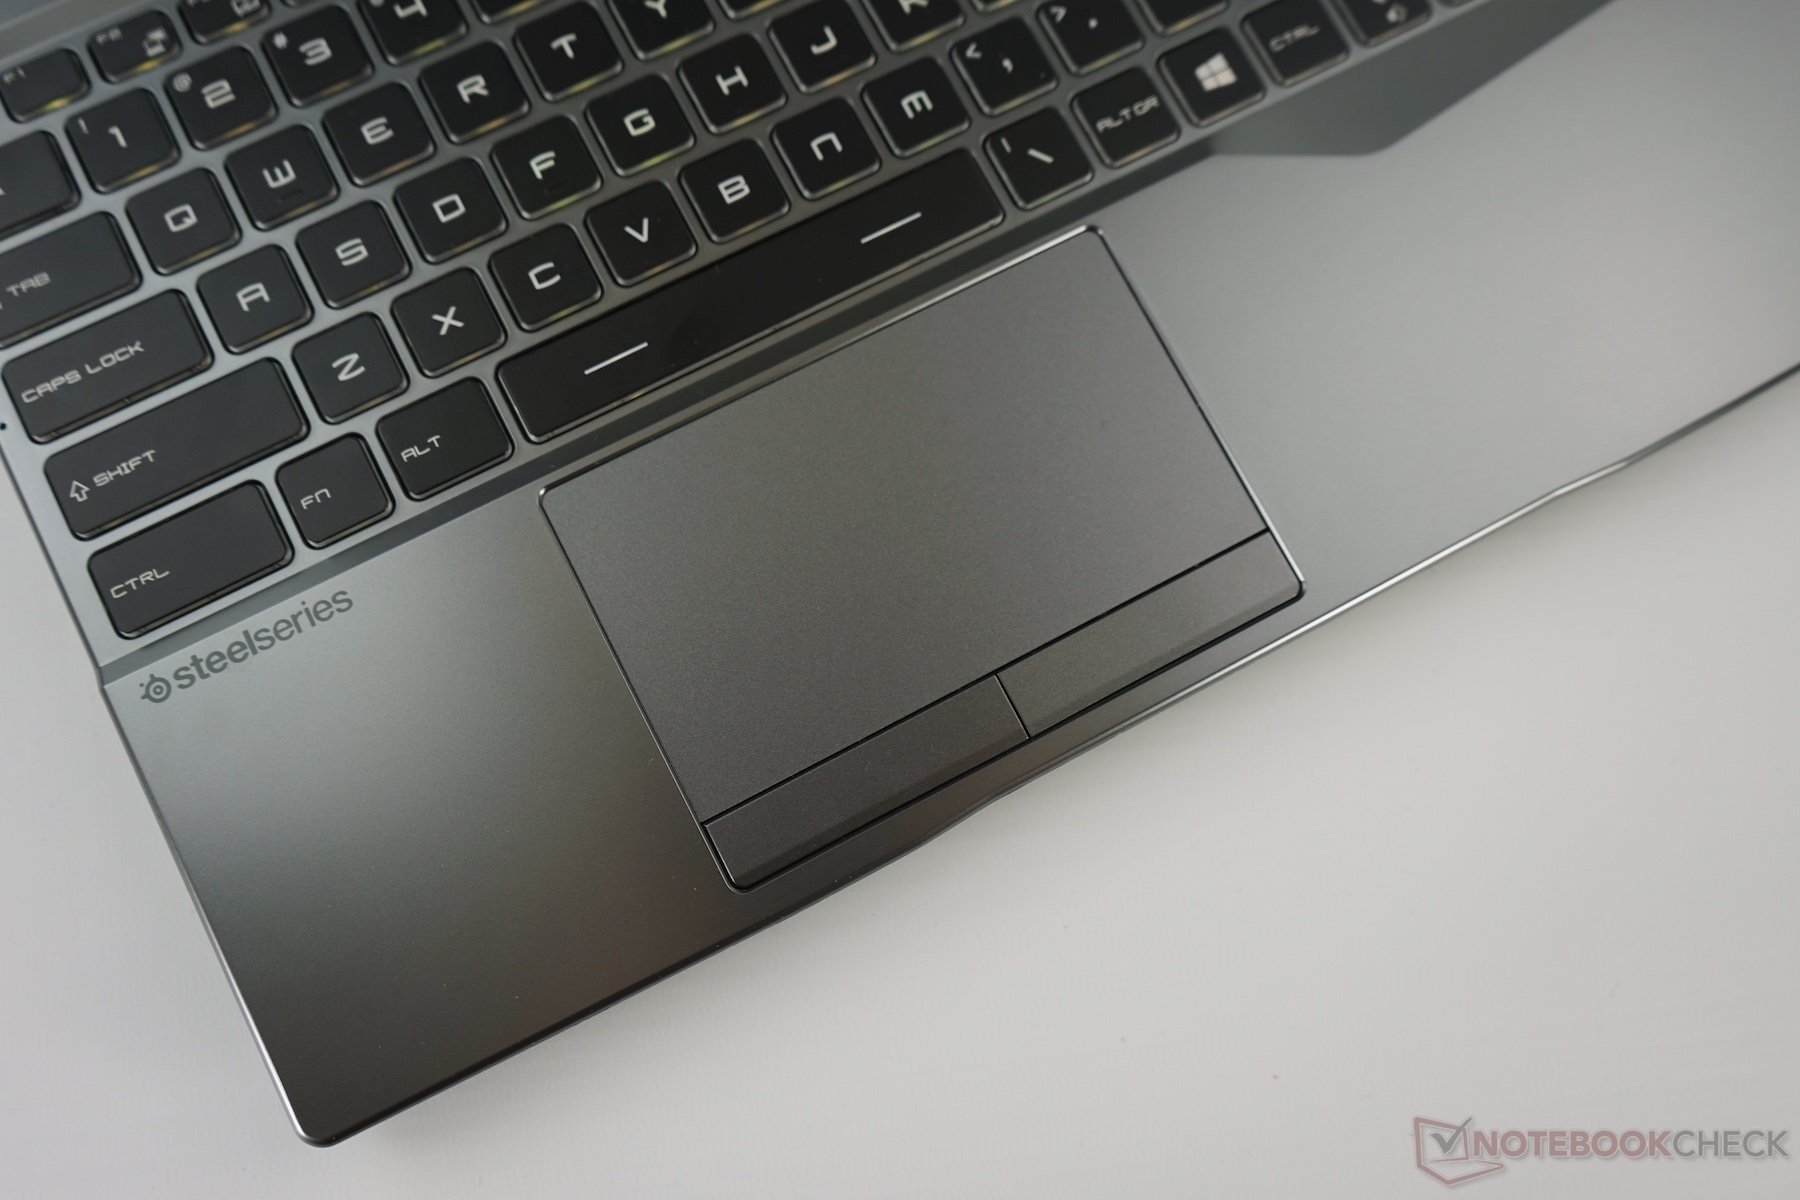
(+) De handpalmsteunen en het touchpad bereiken maximaal de huidtemperatuur (32 °C / 89.6 F) en zijn dus niet heet.
(-) De gemiddelde temperatuur van de handpalmsteun van soortgelijke toestellen bedroeg 28.8 °C / 83.8 F (-3.2 °C / -5.8 F).
MSI Alpha 15 A3DDK audioanalyse
(+) | luidsprekers kunnen relatief luid spelen (90.6 dB)
Bas 100 - 315 Hz
(-) | bijna geen lage tonen - gemiddeld 26.4% lager dan de mediaan
(±) | lineariteit van de lage tonen is gemiddeld (7.3% delta ten opzichte van de vorige frequentie)
Midden 400 - 2000 Hz
(±) | hogere middens - gemiddeld 6.9% hoger dan de mediaan
(±) | lineariteit van de middentonen is gemiddeld (7.6% delta ten opzichte van de vorige frequentie)
Hoog 2 - 16 kHz
(+) | evenwichtige hoogtepunten - slechts 2% verwijderd van de mediaan
(+) | de hoge tonen zijn lineair (6.2% delta naar de vorige frequentie)
Algemeen 100 - 16.000 Hz
(±) | lineariteit van het totale geluid is gemiddeld (17.7% verschil met de mediaan)
Vergeleken met dezelfde klasse
» 52% van alle geteste apparaten in deze klasse waren beter, 10% vergelijkbaar, 38% slechter
» De beste had een delta van 6%, het gemiddelde was 18%, de slechtste was 132%
Vergeleken met alle geteste toestellen
» 35% van alle geteste apparaten waren beter, 8% gelijk, 57% slechter
» De beste had een delta van 4%, het gemiddelde was 24%, de slechtste was 134%
Apple MacBook 12 (Early 2016) 1.1 GHz audioanalyse
(+) | luidsprekers kunnen relatief luid spelen (83.6 dB)
Bas 100 - 315 Hz
(±) | verminderde zeebaars - gemiddeld 11.3% lager dan de mediaan
(±) | lineariteit van de lage tonen is gemiddeld (14.2% delta ten opzichte van de vorige frequentie)
Midden 400 - 2000 Hz
(+) | evenwichtige middens - slechts 2.4% verwijderd van de mediaan
(+) | de middentonen zijn lineair (5.5% delta ten opzichte van de vorige frequentie)
Hoog 2 - 16 kHz
(+) | evenwichtige hoogtepunten - slechts 2% verwijderd van de mediaan
(+) | de hoge tonen zijn lineair (4.5% delta naar de vorige frequentie)
Algemeen 100 - 16.000 Hz
(+) | het totale geluid is lineair (10.2% verschil met de mediaan)
Vergeleken met dezelfde klasse
» 7% van alle geteste apparaten in deze klasse waren beter, 2% vergelijkbaar, 91% slechter
» De beste had een delta van 5%, het gemiddelde was 18%, de slechtste was 53%
Vergeleken met alle geteste toestellen
» 5% van alle geteste apparaten waren beter, 1% gelijk, 94% slechter
» De beste had een delta van 4%, het gemiddelde was 24%, de slechtste was 134%
| Uit / Standby | |
| Inactief | |
| Belasting |
|
Key:
min: | |
| MSI Alpha 15 A3DDK R7 3750H, Radeon RX 5500M, Toshiba KBG30ZMV256G, IPS, 1920x1080, 15.6" | Asus TUF FX505DT-EB73 R7 3750H, GeForce GTX 1650 Mobile, Intel SSD 660p SSDPEKNW512G8, IPS, 1920x1080, 15.6" | Dell G3 3590 i5-9300H, GeForce GTX 1650 Mobile, Toshiba BG4 KBG40ZNS128G, IPS, 1920x1080, 15.6" | Acer Aspire Nitro 5 AN515-54-53Z2 i5-9300H, GeForce GTX 1650 Mobile, WDC PC SN520 SDAPNUW-512G, IPS, 1920x1080, 15.6" | Asus ROG Zephyrus G15 GA502DU R7 3750H, GeForce GTX 1660 Ti Max-Q, Intel SSD 660p SSDPEKNW512G8, IPS, 1920x1080, 15.6" | Lenovo IdeaPad L340-15IRH 81LK00BMGE i5-9300H, GeForce GTX 1650 Mobile, WDC PC SN520 SDAPMUW-512, IPS, 1920x1080, 15.6" | HP Omen 15-dc1020ng i5-9300H, GeForce GTX 1650 Mobile, WDC PC SN720 SDAQNTW-512G, IPS, 1920x1080, 15.6" | Dell G5 15 5590-PCNJJ i5-9300H, GeForce GTX 1650 Mobile, KBG30ZMS128G, IPS, 1920x1080, 15.6" | HP Pavilion Gaming 15-ec0017ng R7 3750H, GeForce GTX 1660 Ti Max-Q, WDC PC SN720 SDAPNTW-256G, IPS, 1920x1080, 15.6" | |
|---|---|---|---|---|---|---|---|---|---|
| Power Consumption | 32% | 18% | 35% | 11% | 43% | 36% | 34% | 38% | |
| Idle Minimum * (Watt) | 11.7 | 7 40% | 6.2 47% | 5 57% | 7.4 37% | 3.8 68% | 4.04 65% | 4 66% | 3.4 71% |
| Idle Average * (Watt) | 15.7 | 9.9 37% | 8.4 46% | 7 55% | 8.6 45% | 6.6 58% | 7.2 54% | 7 55% | 7.6 52% |
| Idle Maximum * (Watt) | 22.4 | 12 46% | 27.7 -24% | 11 51% | 39.1 -75% | 8.9 60% | 11.4 49% | 12 46% | 10.2 54% |
| Load Average * (Watt) | 70.7 | 68.4 3% | 91 -29% | 89 -26% | 65.9 7% | 78.4 -11% | 80.8 -14% | 95 -34% | 73 -3% |
| Witcher 3 ultra * (Watt) | 148 | 94.9 36% | 94.4 36% | 90 39% | 106.9 28% | 82 45% | 93.6 37% | 86 42% | 107 28% |
| Load Maximum * (Watt) | 191 | 130.9 31% | 131.5 31% | 132 31% | 141.3 26% | 124 35% | 144.5 24% | 135 29% | 140.5 26% |
* ... kleiner is beter
Voorlopige Conclusie
Dit is de verkorte versie van het originele artikel. Het volledige, Engelse testrapport vind je hier.
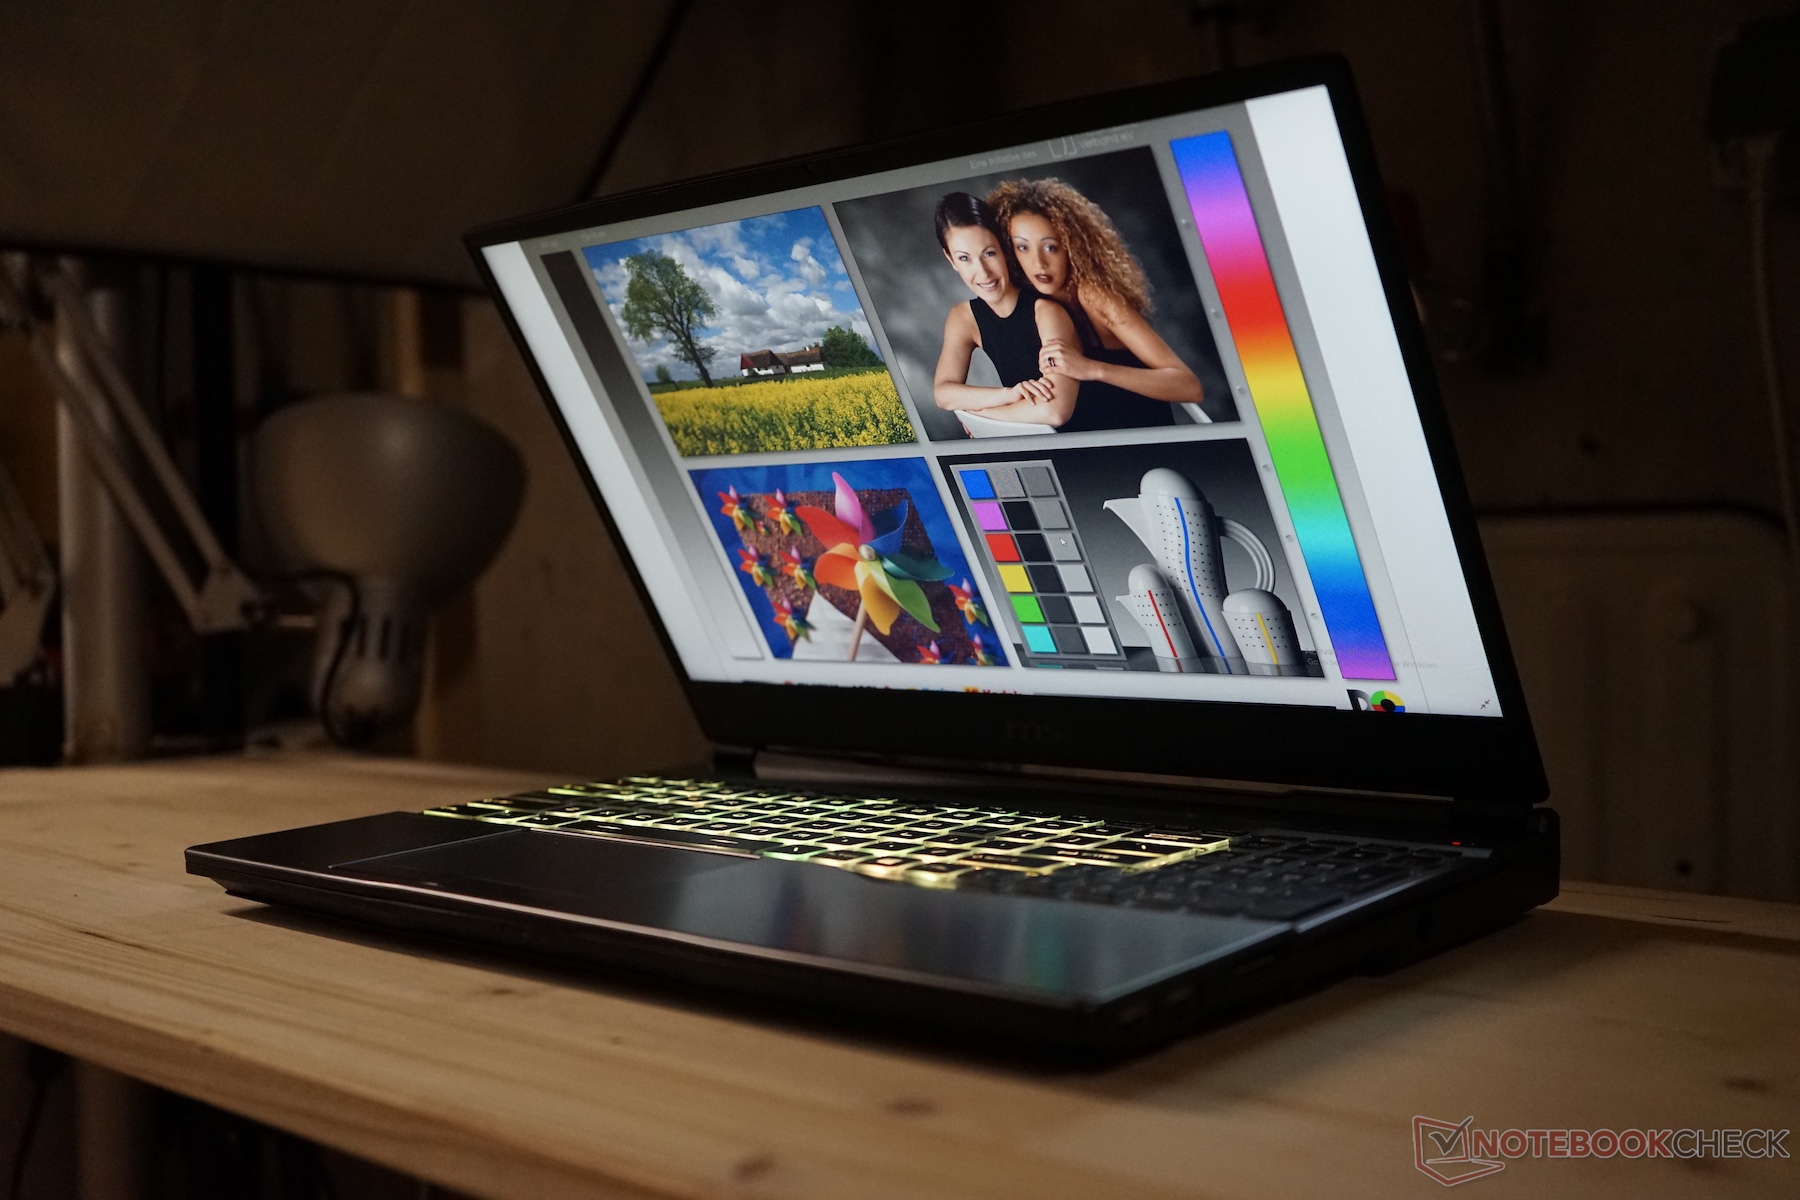
Hoewel MSI met de Alpha 15 niet heeft geprobeerd om de allerbeste concurrenten uit te schakelen, heeft het bedrijf wel een totaalpakket ontwikkelt dat de mid-range markt, die tot nu toe gedomineerd werd door Intel en Nvidia, stevig door elkaar schudt. Kortom, de Alpha 15 is een eerste stap in een markt waarop AMD terug meer grip wilt krijgen.
De belangrijkste feature van de Alpha 15 is zijn Radeon RX 5500M-GPU, gebaseerd op AMD's Navi-architectuur. De GPU, die gefabriceerd is in een 7-nm-proces, positioneert zich op papier tussen de GeForce GTX 1650 en GTX 1660 Ti Max-Q, iets dat onze testen met het pre-productiemodel konden bevestigen. We moeten echter opmerken dat het mogelijke prestatiebereik nog erg breed is. Hoewel de RX 5500M in sommige games bijvoorbeeld niet voorbij een GTX 1650 geraakt, behaalt hij in andere hetzelfde niveau als de GTX 1660 Ti Max-Q. Meestal zit hij ergens ertussen.
De MSI Alpha 15 kan met zijn Ryzen 7 3750H-processor en nieuwe Radeon RX 5500M-GPU opboksen tegen laptops die beschikken over een Core i5-9300H en GeForce 1660 Ti Max-Q.
Of we het toestel nu als een succes voor AMD of MSI kunnen beschouwen, hangt af van de prijs waarmee de Alpha 15 zal lanceren. Voorlopige informatie wijst in de richting van een prijskaartje van 999 tot 1099 euro voor de 120- en 144-Hz-opties, wat de Alpha 15 in prijs boven de toestellen met Core i5-9300H en GTX 1650 plaatst; deze kosten meestal een stuk minder dan 1000 euro. Aan de andere kant kosten laptops met een GTX 1660 Ti Max-Q meestal meer dan 1000 euro, wat een positiever beeld schetst. We kunnen ons voorstellen dat de keuze tussen de drie GPU's ook zal afhangen van de features die de laptop in kwestie te bieden heeft.
Over het algemeen heeft de Alpha 15 een positief beeld geschetst van de Radeon RX 5500M en de RDNA-architectuur voor laptops. Het lijkt erop dat de keuze tussen AMD en Nvidia er opnieuw een echte is, al valt het nog te bekijken of AMD echt kan doorstoten tot de markt van de high-end gaming-laptops. Wat we wel weten is dat krachtigere laptop-GPU's dan de RX 5500M hoogstwaarschijnlijk onderweg zijn.
Price comparison
