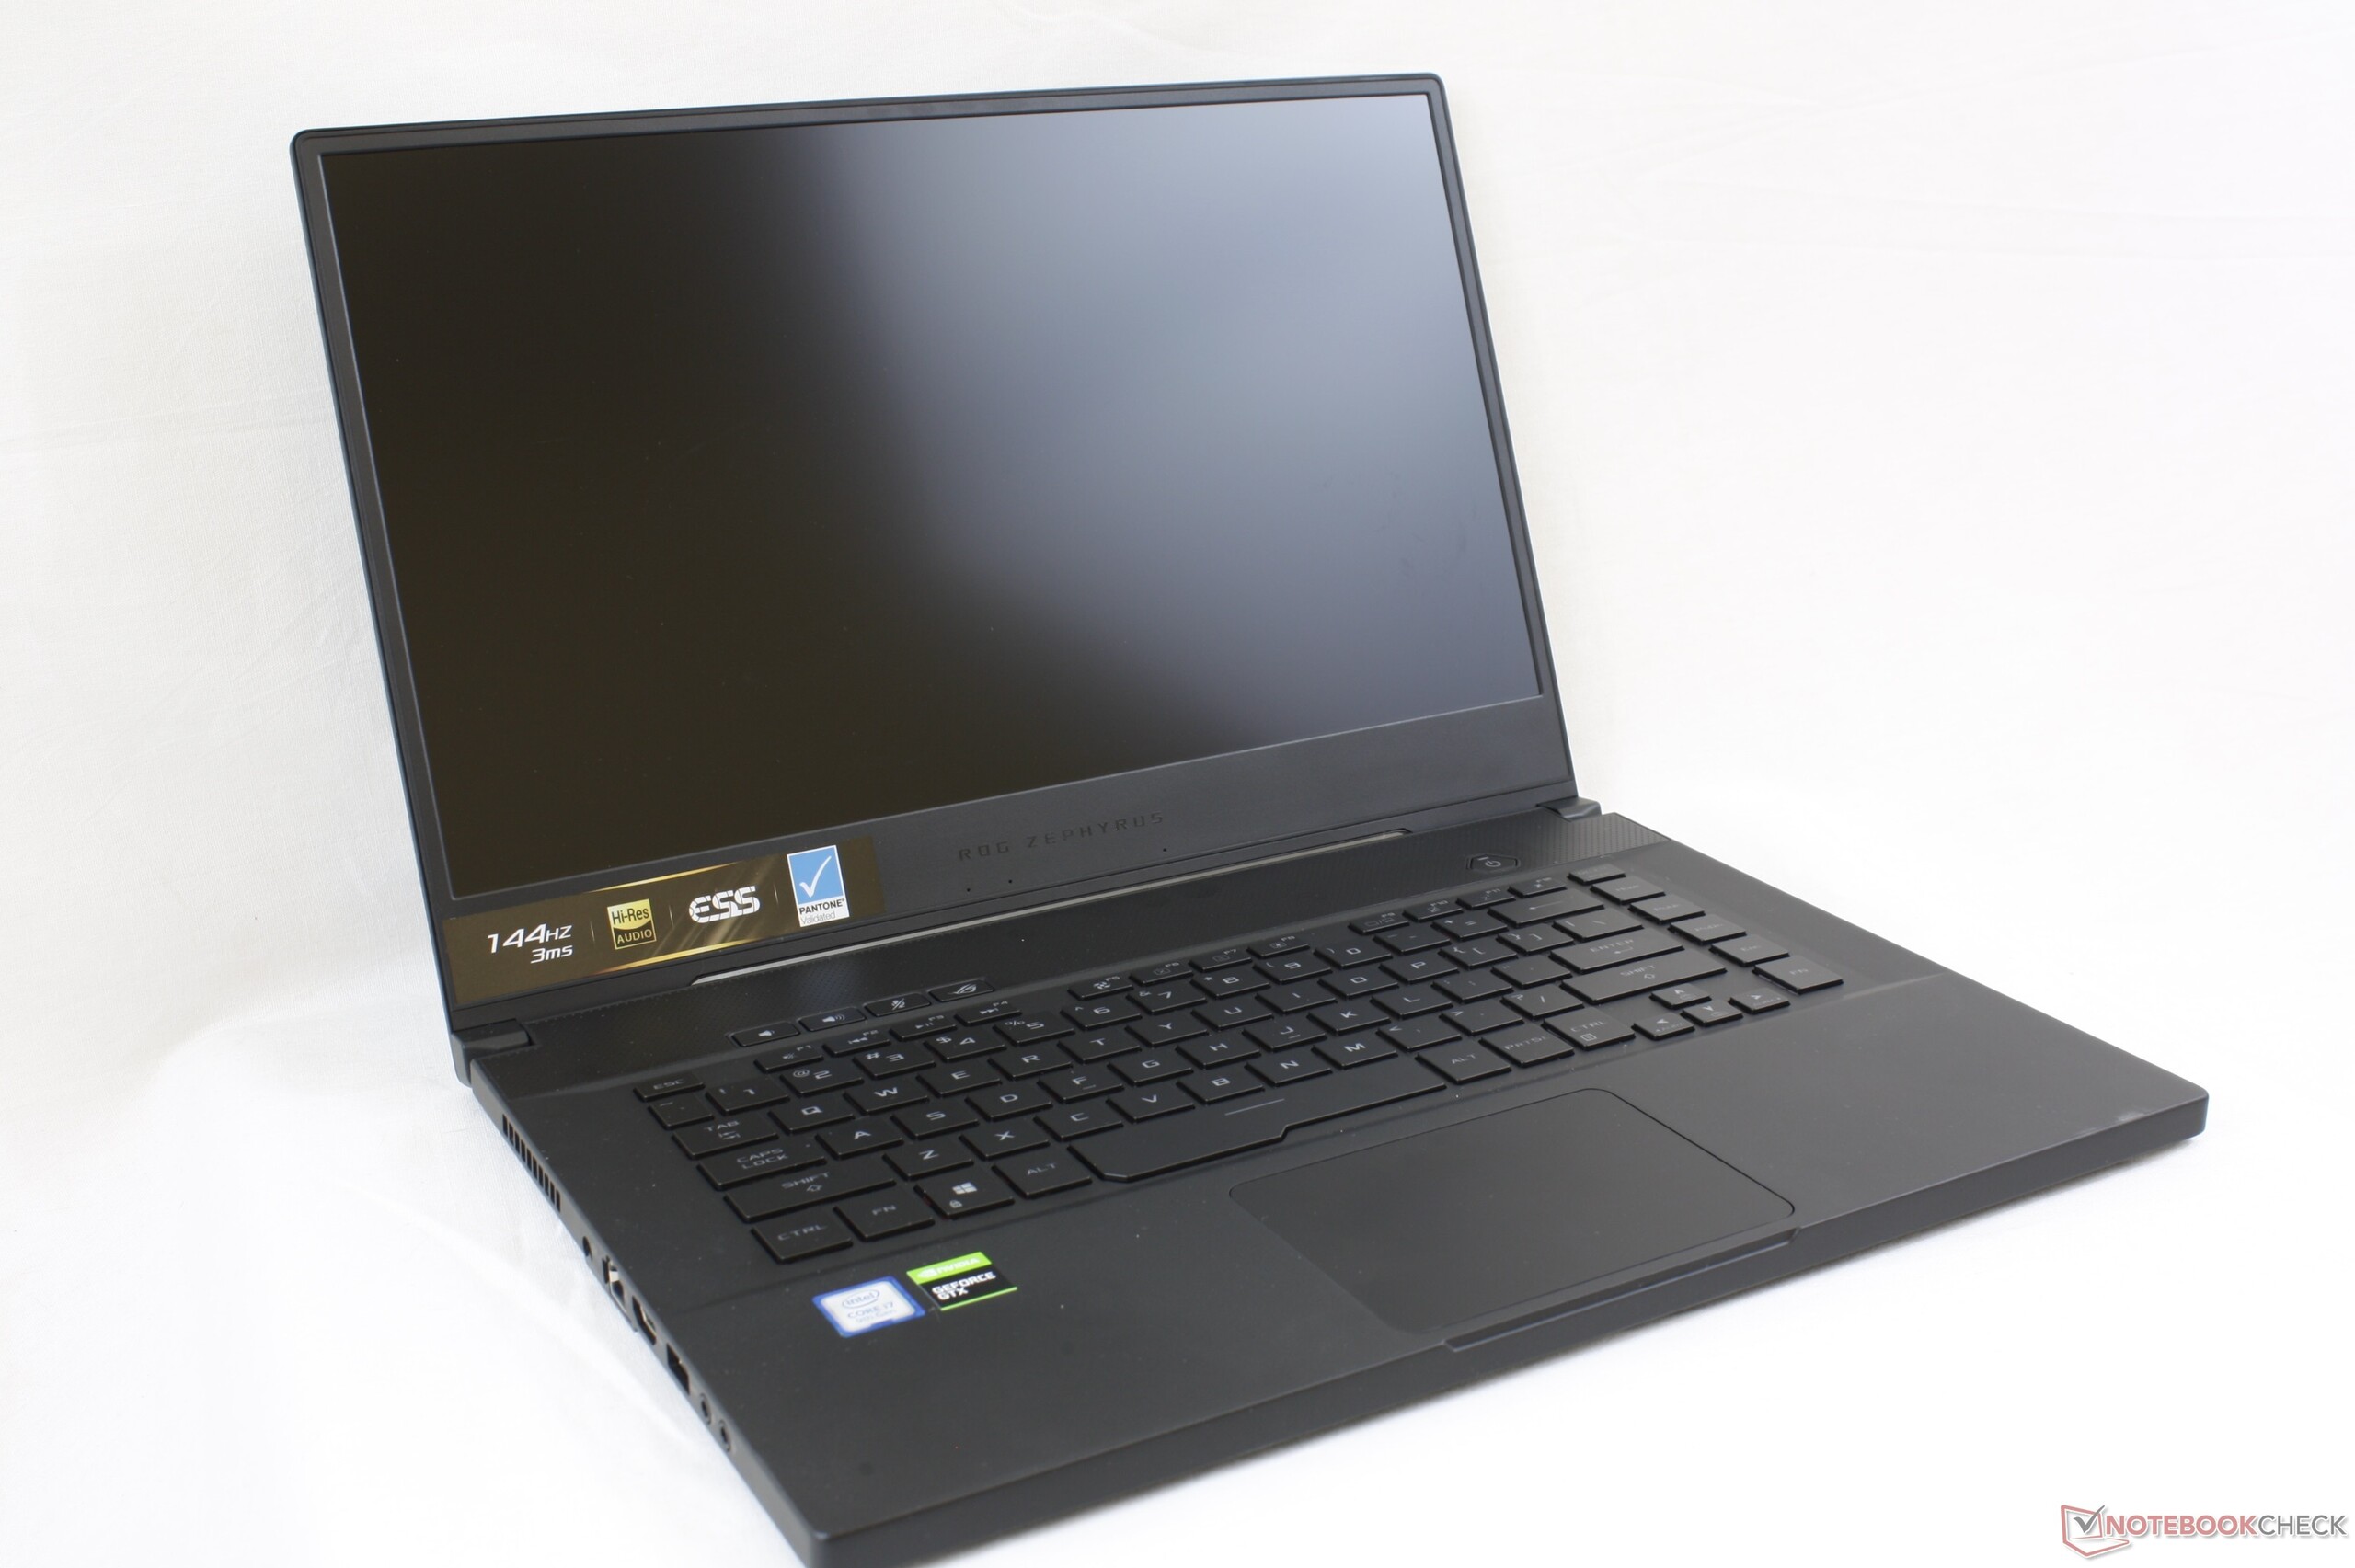
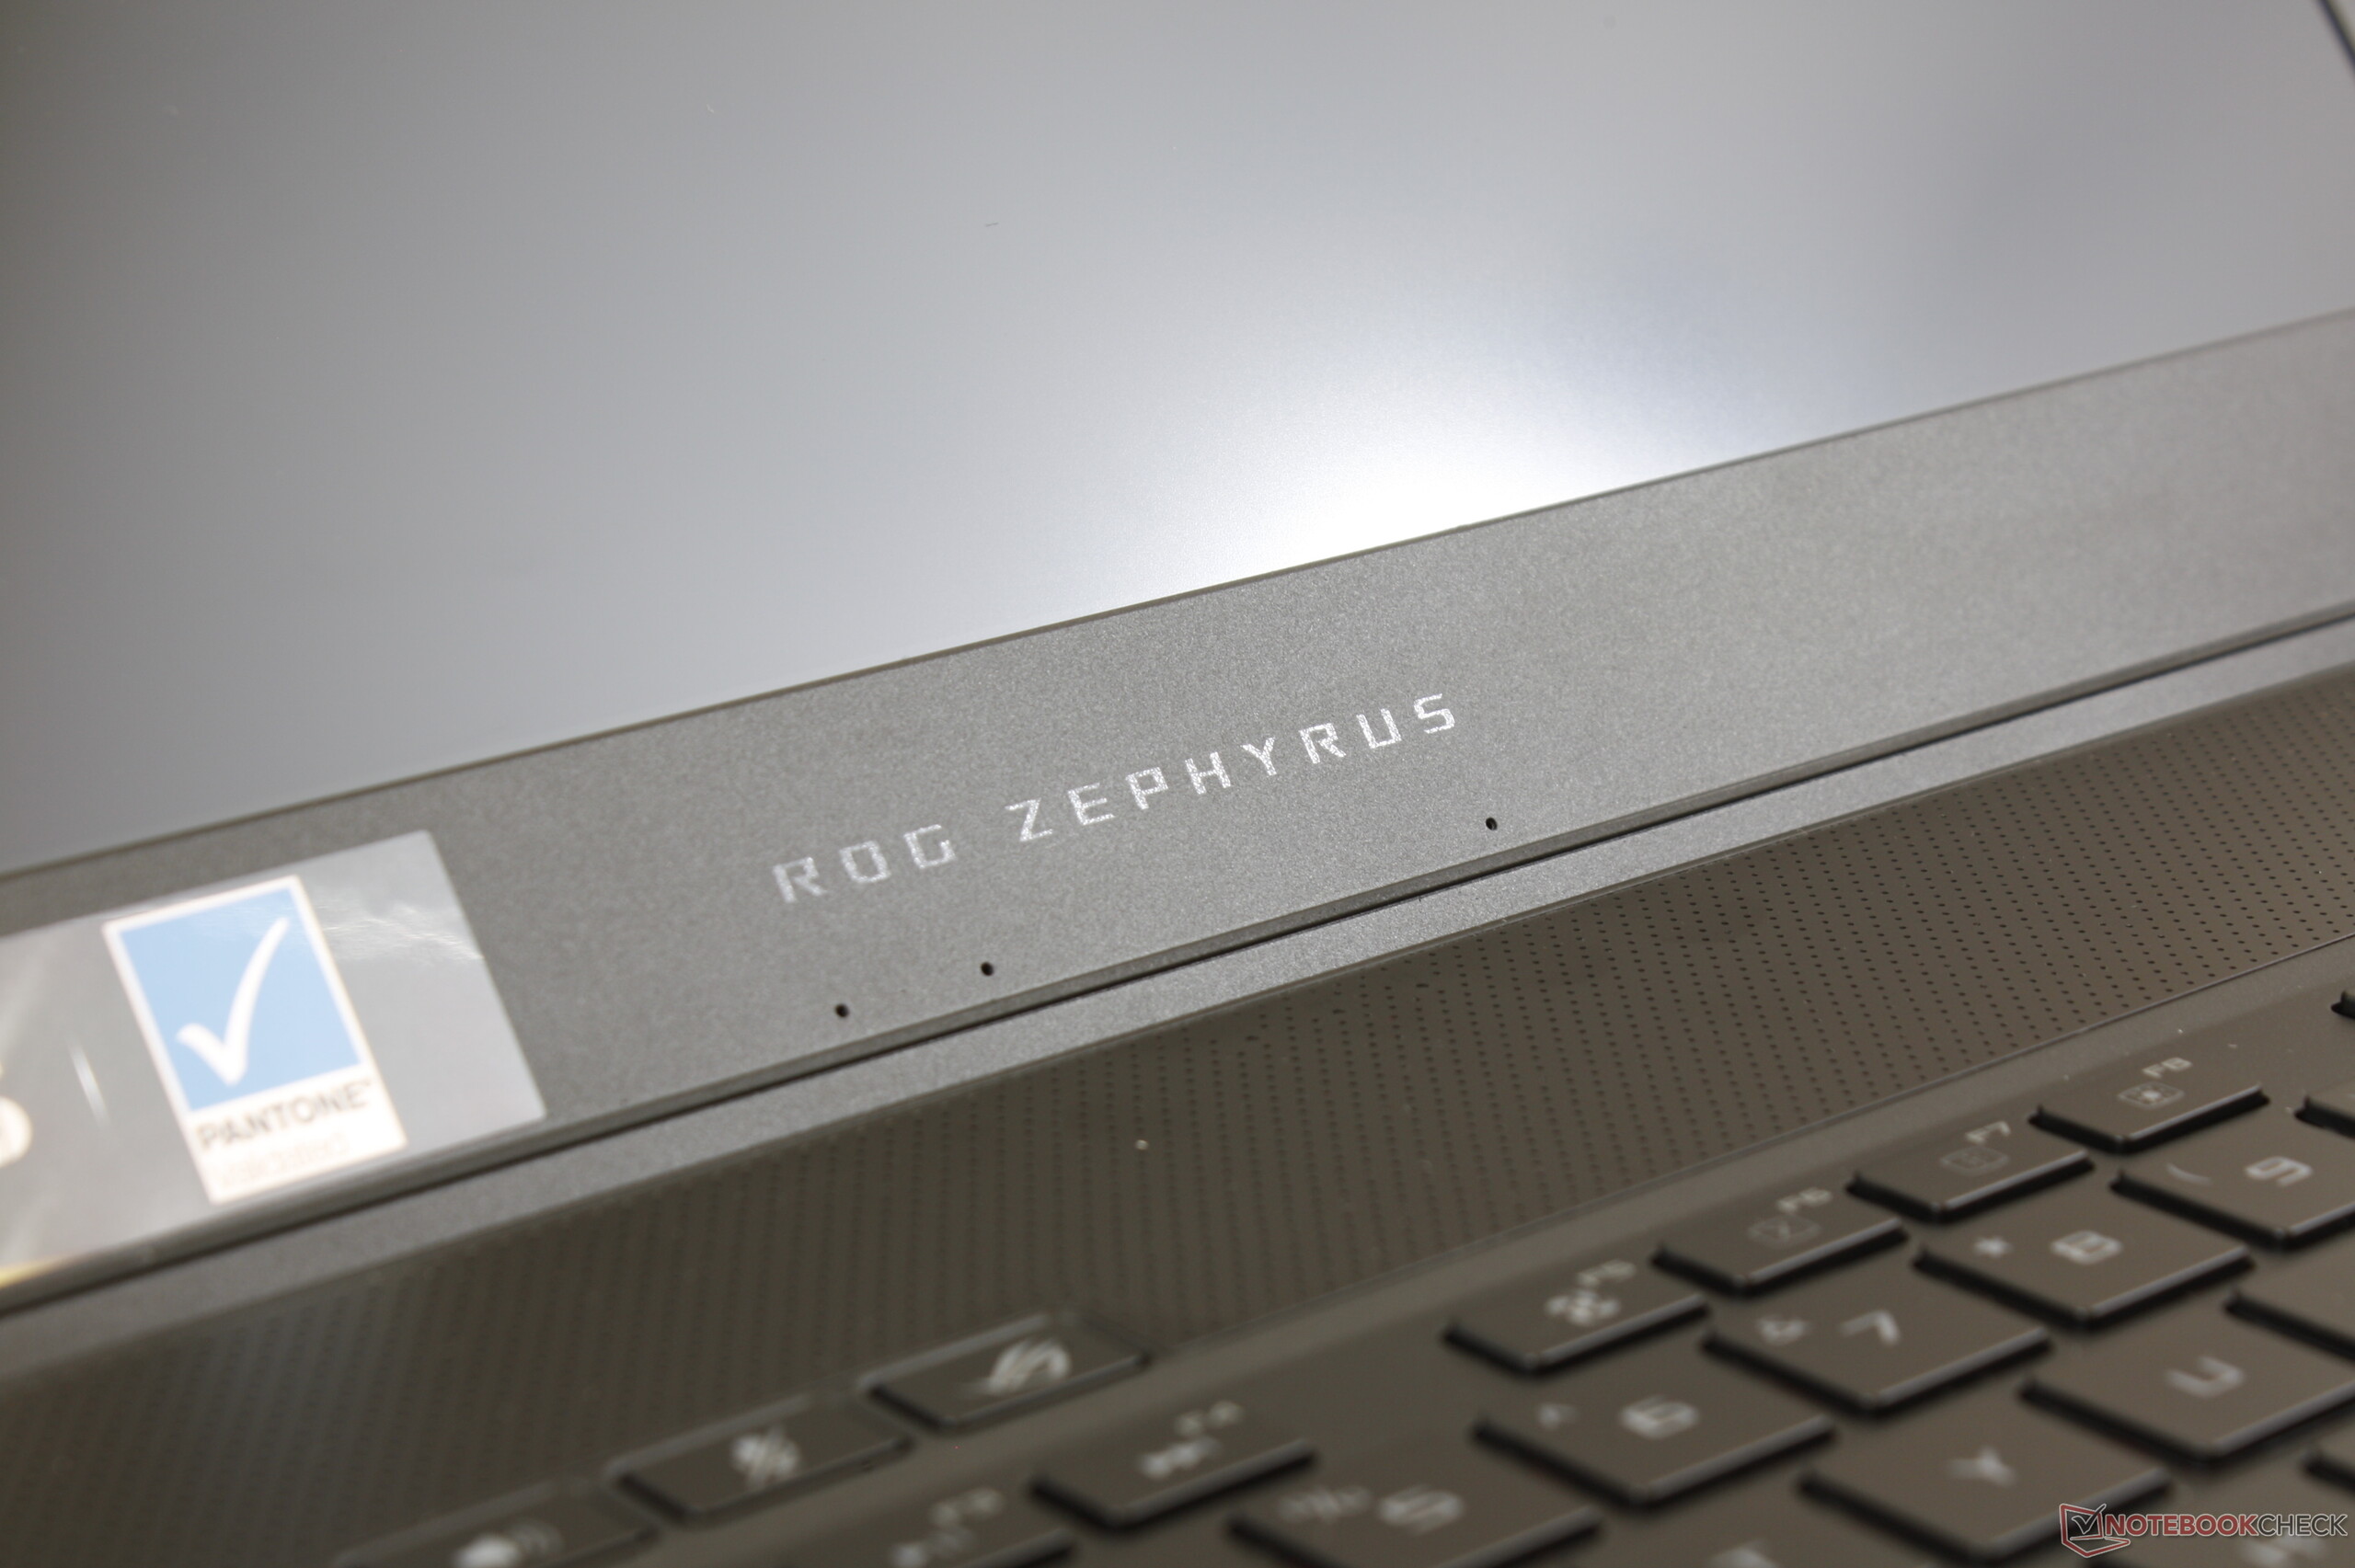
Kort testrapport Asus Zephyrus M GU502GU Laptop: 1800 euro voor single-channel-RAM
Evaluatie | Datum | Model | Gewicht | Hoogte | Formaat | Resolutie | Beste prijs |
|---|---|---|---|---|---|---|---|
| 82.9 % v7 (old) | 10-2019 | Asus ROG Zephyrus M15 GU502GU-XB74 i7-9750H, GeForce GTX 1660 Ti Mobile | 2 kg | 18.9 mm | 15.60" | 1920x1080 |

| Networking | |
| iperf3 transmit AX12 | |
| Asus Zephyrus S GX502GW | |
| Asus Zephyrus S GX531GX | |
| Asus ROG Zephyrus G15 GA502DU | |
| iperf3 receive AX12 | |
| Asus Zephyrus S GX502GW | |
| Asus Zephyrus S GX531GX | |
| Asus ROG Zephyrus G15 GA502DU | |
| |||||||||||||||||||||||||
Helderheidsverdeling: 84 %
Helderheid in Batterij-modus: 297.7 cd/m²
Contrast: 692:1 (Zwart: 0.43 cd/m²)
ΔE ColorChecker Calman: 3.13 | ∀{0.5-29.43 Ø4.71}
calibrated: 3.06
ΔE Greyscale Calman: 1.9 | ∀{0.09-98 Ø4.96}
90.5% sRGB (Argyll 1.6.3 3D)
59.2% AdobeRGB 1998 (Argyll 1.6.3 3D)
66.5% AdobeRGB 1998 (Argyll 3D)
90.8% sRGB (Argyll 3D)
66.5% Display P3 (Argyll 3D)
Gamma: 2.23
CCT: 6325 K
| Asus ROG Zephyrus M15 GU502GU-XB74 AU Optronics B156HAN08.2, IPS, 15.6", 1920x1080 | Asus Zephyrus S GX502GW AU Optronics B156HAN08.2 (AUO82ED), IPS, 15.6", 1920x1080 | Asus TUF FX505DT-EB73 Panda LM156LF-GL, IPS, 15.6", 1920x1080 | Lenovo Legion Y740-15ICHg BOE NV156FHM-N4J, IPS, 15.6", 1920x1080 | MSI GS65 Stealth 9SG Sharp LQ156M1JW03 (SHP14C5), IPS, 15.6", 1920x1080 | Razer Blade 15 GTX 1660 Ti BOE NV156FHM-N4K, IPS, 15.6", 1920x1080 | |
|---|---|---|---|---|---|---|
| Display | -1% | -38% | 1% | 4% | -0% | |
| Display P3 Coverage (%) | 66.5 | 64.9 -2% | 39.56 -41% | 67.7 2% | 67.6 2% | 65.3 -2% |
| sRGB Coverage (%) | 90.8 | 91 0% | 59.5 -34% | 91.6 1% | 97.5 7% | 91.8 1% |
| AdobeRGB 1998 Coverage (%) | 66.5 | 65.9 -1% | 40.91 -38% | 67.1 1% | 68.9 4% | 66.5 0% |
| Response Times | -7% | -295% | -106% | -75% | -64% | |
| Response Time Grey 50% / Grey 80% * (ms) | 6.4 ? | 7.2 ? -13% | 30.4 ? -375% | 19 ? -197% | 13.6 ? -113% | 13.6 ? -113% |
| Response Time Black / White * (ms) | 8.8 ? | 8.8 ? -0% | 27.6 ? -214% | 10 ? -14% | 12 ? -36% | 10 ? -14% |
| PWM Frequency (Hz) | 23260 ? | 200 ? | ||||
| Screen | 10% | -44% | 34% | 26% | -3% | |
| Brightness middle (cd/m²) | 297.7 | 286 -4% | 286.2 -4% | 477 60% | 282.3 -5% | 312.7 5% |
| Brightness (cd/m²) | 280 | 275 -2% | 267 -5% | 431 54% | 269 -4% | 305 9% |
| Brightness Distribution (%) | 84 | 90 7% | 84 0% | 84 0% | 90 7% | 90 7% |
| Black Level * (cd/m²) | 0.43 | 0.37 14% | 0.33 23% | 0.175 59% | 0.32 26% | 0.27 37% |
| Contrast (:1) | 692 | 773 12% | 867 25% | 2726 294% | 882 27% | 1158 67% |
| Colorchecker dE 2000 * | 3.13 | 2.19 30% | 5.45 -74% | 4.17 -33% | 1.17 63% | 4.57 -46% |
| Colorchecker dE 2000 max. * | 7.1 | 4.4 38% | 18.08 -155% | 6.97 2% | 3.29 54% | 6.81 4% |
| Colorchecker dE 2000 calibrated * | 3.06 | 2.27 26% | 4.47 -46% | 2.51 18% | 1.06 65% | 2.91 5% |
| Greyscale dE 2000 * | 1.9 | 2.2 -16% | 5.3 -179% | 3.49 -84% | 1.3 32% | 4.3 -126% |
| Gamma | 2.23 99% | 2.41 91% | 2.1 105% | 2.5 88% | 2.2 100% | 2.29 96% |
| CCT | 6325 103% | 6405 101% | 7679 85% | 7076 92% | 6643 98% | 7098 92% |
| Color Space (Percent of AdobeRGB 1998) (%) | 59.2 | 59 0% | 37.6 -36% | 60 1% | 63.8 8% | 59.4 0% |
| Color Space (Percent of sRGB) (%) | 90.5 | 91 1% | 59.1 -35% | 91 1% | 97.5 8% | 91.3 1% |
| Totaal Gemiddelde (Programma / Instellingen) | 1% /
6% | -126% /
-74% | -24% /
10% | -15% /
9% | -22% /
-10% |
* ... kleiner is beter
Responstijd Scherm
| ↔ Responstijd Zwart naar Wit | ||
|---|---|---|
| 8.8 ms ... stijging ↗ en daling ↘ gecombineerd | ↗ 4.4 ms stijging |  |
| ↘ 4.4 ms daling | ||
| Het scherm vertoonde snelle responstijden in onze tests en zou geschikt moeten zijn voor games. Ter vergelijking: alle testtoestellen variëren van 0.1 (minimum) tot 240 (maximum) ms. » 25 % van alle toestellen zijn beter. Dit betekent dat de gemeten responstijd beter is dan het gemiddelde (19.8 ms) van alle geteste toestellen. | ||
| ↔ Responstijd 50% Grijs naar 80% Grijs | ||
| 6.4 ms ... stijging ↗ en daling ↘ gecombineerd | ↗ 3.4 ms stijging |  |
| ↘ 3 ms daling | ||
| Het scherm vertoonde erg snelle responstijden in onze tests en zou zeer geschikt moeten zijn voor snelle games. Ter vergelijking: alle testtoestellen variëren van 0.165 (minimum) tot 636 (maximum) ms. » 19 % van alle toestellen zijn beter. Dit betekent dat de gemeten responstijd beter is dan het gemiddelde (30.9 ms) van alle geteste toestellen. | ||
Screen Flickering / PWM (Pulse-Width Modulation)
| Screen flickering / PWM niet waargenomen |  | ||
Ter vergelijking: 52 % van alle geteste toestellen maakten geen gebruik van PWM om de schermhelderheid te verlagen. Als het wel werd gebruikt, werd een gemiddelde van 7741 (minimum: 5 - maximum: 343500) Hz waargenomen. | |||
| PCMark 8 | |
| Home Score Accelerated v2 | |
| Lenovo Legion Y740-15ICHg | |
| Gemiddeld Intel Core i7-9750H, NVIDIA GeForce GTX 1660 Ti Mobile (4074 - 5217, n=11) | |
| MSI GS65 Stealth 9SG | |
| Asus ROG Zephyrus M15 GU502GU-XB74 | |
| Razer Blade 15 GTX 1660 Ti | |
| Asus TUF FX505DT-EB73 | |
| Work Score Accelerated v2 | |
| Lenovo Legion Y740-15ICHg | |
| MSI GS65 Stealth 9SG | |
| Asus ROG Zephyrus M15 GU502GU-XB74 | |
| Gemiddeld Intel Core i7-9750H, NVIDIA GeForce GTX 1660 Ti Mobile (5041 - 5913, n=12) | |
| Razer Blade 15 GTX 1660 Ti | |
| Asus TUF FX505DT-EB73 | |
| PCMark 8 Home Score Accelerated v2 | 4094 punten | |
| PCMark 8 Work Score Accelerated v2 | 5610 punten | |
| PCMark 10 Score | 5273 punten | |
Help | ||
| Asus ROG Zephyrus M15 GU502GU-XB74 Intel SSD 660p SSDPEKNW512G8 | Asus Zephyrus S GX502GW 2x Intel SSD 660p SSDPEKNW512G8 (RAID 0) | Asus Zephyrus S GX531GX Intel SSD 660p SSDPEKNW512G8 | Asus TUF FX505DT-EB73 Intel SSD 660p SSDPEKNW512G8 | Lenovo Legion Y740-15ICHg WDC PC SN520 SDAPMUW-128G | Razer Blade 15 GTX 1660 Ti Samsung SSD PM981 MZVLB256HAHQ | |
|---|---|---|---|---|---|---|
| CrystalDiskMark 5.2 / 6 | 27% | -18% | -9% | -29% | 24% | |
| Write 4K (MB/s) | 156 | 97 -38% | 93.9 -40% | 137.5 -12% | 134.2 -14% | 135 -13% |
| Read 4K (MB/s) | 60.7 | 49.58 -18% | 46.29 -24% | 57 -6% | 37.72 -38% | 41.1 -32% |
| Write Seq (MB/s) | 968 | 1838 90% | 974 1% | 984 2% | 389.2 -60% | 1427 47% |
| Read Seq (MB/s) | 1619 | 2421 50% | 1425 -12% | 1564 -3% | 1030 -36% | 1494 -8% |
| Write 4K Q32T1 (MB/s) | 485 | 326.9 -33% | 259.4 -47% | 237.4 -51% | 238.9 -51% | 494.9 2% |
| Read 4K Q32T1 (MB/s) | 337.3 | 372.9 11% | 296.5 -12% | 340.7 1% | 343.9 2% | 578 71% |
| Write Seq Q32T1 (MB/s) | 969 | 1894 95% | 977 1% | 959 -1% | 789 -19% | 1417 46% |
| Read Seq Q32T1 (MB/s) | 1825 | 2828 55% | 1666 -9% | 1732 -5% | 1502 -18% | 3251 78% |
| Write 4K Q8T8 (MB/s) | 293.4 | |||||
| Read 4K Q8T8 (MB/s) | 405.8 |

| 3DMark | |
| 1280x720 Cloud Gate Standard Graphics | |
| Asus Strix Scar III G531GW-AZ062T | |
| Asus Zephyrus S GX701GX | |
| Asus Zephyrus GX501 | |
| Asus G752VS-BA338T | |
| Asus Strix Hero III G731GV | |
| Gemiddeld NVIDIA GeForce GTX 1660 Ti Mobile (59839 - 104780, n=18) | |
| Asus Zephyrus S GX531GM | |
| Asus ROG Zephyrus M15 GU502GU-XB74 | |
| Asus TUF FX505DT-EB73 | |
| 1920x1080 Fire Strike Graphics | |
| Asus Zephyrus S GX701GX | |
| Asus Strix Scar III G531GW-AZ062T | |
| Asus G752VS-BA338T | |
| Asus Zephyrus GX501 | |
| Asus Strix Hero III G731GV | |
| Asus ROG Zephyrus M15 GU502GU-XB74 | |
| Gemiddeld NVIDIA GeForce GTX 1660 Ti Mobile (14186 - 16488, n=24) | |
| Asus Zephyrus S GX531GM | |
| Asus TUF FX505DT-EB73 | |
| 2560x1440 Time Spy Graphics | |
| Asus Zephyrus S GX701GX | |
| Asus Strix Scar III G531GW-AZ062T | |
| Asus Strix Hero III G731GV | |
| Asus ROG Zephyrus M15 GU502GU-XB74 | |
| Gemiddeld NVIDIA GeForce GTX 1660 Ti Mobile (5335 - 6123, n=22) | |
| Asus G752VS-BA338T | |
| Asus Zephyrus GX501 | |
| Asus Zephyrus S GX531GM | |
| Asus TUF FX505DT-EB73 | |
| 3DMark 11 | |
| 1280x720 Performance GPU | |
| Asus Zephyrus S GX701GX | |
| Asus Strix Scar III G531GW-AZ062T | |
| Asus G752VS-BA338T | |
| Asus Zephyrus GX501 | |
| Asus Strix Hero III G731GV | |
| Asus ROG Zephyrus M15 GU502GU-XB74 | |
| Gemiddeld NVIDIA GeForce GTX 1660 Ti Mobile (18610 - 22670, n=24) | |
| Asus TUF FX505DT-EB73 | |
| Asus Zephyrus S GX531GM | |
| 1280x720 Performance Combined | |
| Asus Strix Hero III G731GV | |
| Gemiddeld NVIDIA GeForce GTX 1660 Ti Mobile (9500 - 13311, n=23) | |
| Asus Zephyrus S GX701GX | |
| Asus Strix Scar III G531GW-AZ062T | |
| Asus ROG Zephyrus M15 GU502GU-XB74 | |
| Asus G752VS-BA338T | |
| Asus Zephyrus GX501 | |
| Asus Zephyrus S GX531GM | |
| Asus TUF FX505DT-EB73 | |
| 3DMark 11 Performance | 15912 punten | |
| 3DMark Cloud Gate Standard Score | 31253 punten | |
| 3DMark Fire Strike Score | 13381 punten | |
| 3DMark Time Spy Score | 5641 punten | |
Help | ||
| Shadow of the Tomb Raider | |
| 1920x1080 Highest Preset AA:T | |
| MSI GE75 9SG | |
| Alienware m15 P79F | |
| Lenovo Legion Y740-15ICHg | |
| Asus Strix Scar III G531GW-AZ062T | |
| Asus Zephyrus S GX701GX | |
| Asus Zephyrus S GX502GW | |
| Asus Strix Hero III G731GV | |
| Gemiddeld NVIDIA GeForce GTX 1660 Ti Mobile (62 - 73, n=8) | |
| Razer Blade 15 GTX 1660 Ti | |
| Asus ROG Zephyrus M15 GU502GU-XB74 | |
| Asus ROG Zephyrus G15 GA502DU | |
| Asus Zephyrus S GX531GM | |
| Asus TUF FX505DT-EB73 | |
| 1280x720 Lowest Preset | |
| MSI GE75 9SG | |
| Lenovo Legion Y740-15ICHg | |
| Gemiddeld NVIDIA GeForce GTX 1660 Ti Mobile (88 - 151, n=6) | |
| Alienware m15 P79F | |
| Asus Strix Hero III G731GV | |
| Razer Blade 15 GTX 1660 Ti | |
| Asus Zephyrus S GX531GM | |
| Asus Strix Scar III G531GW-AZ062T | |
| Asus Zephyrus S GX502GW | |
| Asus ROG Zephyrus M15 GU502GU-XB74 | |
| Asus ROG Zephyrus G15 GA502DU | |
| Asus TUF FX505DT-EB73 | |
| Razer Blade Stealth i7-1065G7 Iris Plus | |
| lage | gem. | hoge | ultra | |
|---|---|---|---|---|
| BioShock Infinite (2013) | 235.5 | 216.4 | 201.6 | 121.6 |
| The Witcher 3 (2015) | 177.3 | 148 | 95.9 | 55.2 |
| Shadow of the Tomb Raider (2018) | 88 | 68 | 67 | 62 |
| Asus ROG Zephyrus M15 GU502GU-XB74 GeForce GTX 1660 Ti Mobile, i7-9750H, Intel SSD 660p SSDPEKNW512G8 | Asus Zephyrus S GX502GW GeForce RTX 2070 Mobile, i7-9750H, 2x Intel SSD 660p SSDPEKNW512G8 (RAID 0) | Asus Zephyrus S GX531GX GeForce RTX 2080 Max-Q, i7-8750H, Intel SSD 660p SSDPEKNW512G8 | Asus TUF FX505DT-EB73 GeForce GTX 1650 Mobile, R7 3750H, Intel SSD 660p SSDPEKNW512G8 | MSI GS65 Stealth 9SG GeForce RTX 2080 Max-Q, i7-9750H, Samsung SSD PM981 MZVLB512HAJQ | Razer Blade 15 GTX 1660 Ti GeForce GTX 1660 Ti Mobile, i7-9750H, Samsung SSD PM981 MZVLB256HAHQ | |
|---|---|---|---|---|---|---|
| Noise | -9% | -5% | 5% | 3% | 2% | |
| uit / omgeving * (dB) | 28.2 | 30 -6% | 28.7 -2% | 28.2 -0% | 28.3 -0% | 28.5 -1% |
| Idle Minimum * (dB) | 28.7 | 31 -8% | 29.8 -4% | 28.2 2% | 30.4 -6% | 30.3 -6% |
| Idle Average * (dB) | 30.5 | 33 -8% | 32.4 -6% | 28.2 8% | 30.5 -0% | 30.5 -0% |
| Idle Maximum * (dB) | 31 | 38 -23% | 38 -23% | 31.4 -1% | 30.6 1% | 30.5 2% |
| Load Average * (dB) | 39 | 50 -28% | 38.2 2% | 39.8 -2% | 37.6 4% | 41 -5% |
| Witcher 3 ultra * (dB) | 54.2 | 53 2% | 56.6 -4% | 47 13% | 46 15% | 48 11% |
| Load Maximum * (dB) | 59.6 | 56 6% | 56.6 5% | 50.2 16% | 55.1 8% | 51.9 13% |
* ... kleiner is beter
Geluidsniveau
| Onbelast |
| 28.7 / 30.5 / 31 dB (A) |
| Belasting |
| 39 / 59.6 dB (A) |
 | ||
30 dB stil 40 dB(A) hoorbaar 50 dB(A) luid |
||
min: | ||
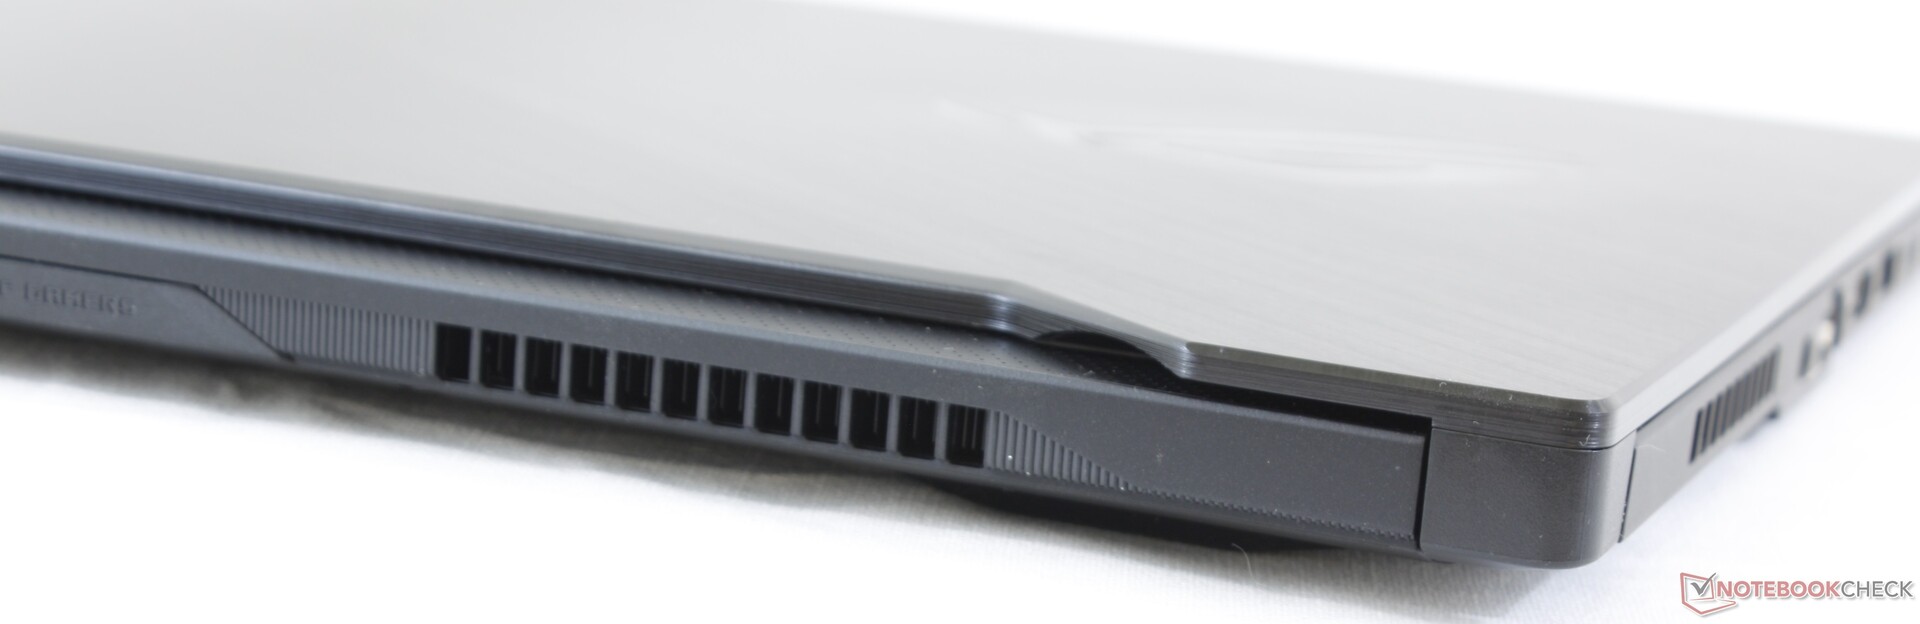
(-) De maximumtemperatuur aan de bovenzijde bedraagt 49.8 °C / 122 F, vergeleken met het gemiddelde van 40.4 °C / 105 F, variërend van 21.2 tot 68.8 °C voor de klasse Gaming.
(-) De bodem warmt op tot een maximum van 63.2 °C / 146 F, vergeleken met een gemiddelde van 43.2 °C / 110 F
(+) Bij onbelast gebruik bedraagt de gemiddelde temperatuur voor de bovenzijde 29.8 °C / 86 F, vergeleken met het apparaatgemiddelde van 33.9 °C / 93 F.
(±) Bij het spelen van The Witcher 3 is de gemiddelde temperatuur voor de bovenzijde 37.2 °C / 99 F, vergeleken met het apparaatgemiddelde van 33.9 °C / 93 F.
(+) De palmsteunen en het touchpad zijn met een maximum van ###max## °C / 88.9 F koeler dan de huidtemperatuur en voelen daarom koel aan.
(-) De gemiddelde temperatuur van de handpalmsteun van soortgelijke toestellen bedroeg 28.8 °C / 83.8 F (-2.8 °C / -5.1 F).
Asus ROG Zephyrus M15 GU502GU-XB74 audioanalyse
(+) | luidsprekers kunnen relatief luid spelen (85.5 dB)
Bas 100 - 315 Hz
(±) | verminderde zeebaars - gemiddeld 7.3% lager dan de mediaan
(-) | de lage tonen zijn niet lineair (15.2% delta naar de vorige frequentie)
Midden 400 - 2000 Hz
(+) | evenwichtige middens - slechts 2.8% verwijderd van de mediaan
(+) | de middentonen zijn lineair (6.3% delta ten opzichte van de vorige frequentie)
Hoog 2 - 16 kHz
(+) | evenwichtige hoogtepunten - slechts 2.9% verwijderd van de mediaan
(+) | de hoge tonen zijn lineair (6.8% delta naar de vorige frequentie)
Algemeen 100 - 16.000 Hz
(+) | het totale geluid is lineair (9.9% verschil met de mediaan)
Vergeleken met dezelfde klasse
» 5% van alle geteste apparaten in deze klasse waren beter, 2% vergelijkbaar, 94% slechter
» De beste had een delta van 6%, het gemiddelde was 18%, de slechtste was 132%
Vergeleken met alle geteste toestellen
» 4% van alle geteste apparaten waren beter, 1% gelijk, 95% slechter
» De beste had een delta van 4%, het gemiddelde was 23%, de slechtste was 134%
Apple MacBook 12 (Early 2016) 1.1 GHz audioanalyse
(+) | luidsprekers kunnen relatief luid spelen (83.6 dB)
Bas 100 - 315 Hz
(±) | verminderde zeebaars - gemiddeld 11.3% lager dan de mediaan
(±) | lineariteit van de lage tonen is gemiddeld (14.2% delta ten opzichte van de vorige frequentie)
Midden 400 - 2000 Hz
(+) | evenwichtige middens - slechts 2.4% verwijderd van de mediaan
(+) | de middentonen zijn lineair (5.5% delta ten opzichte van de vorige frequentie)
Hoog 2 - 16 kHz
(+) | evenwichtige hoogtepunten - slechts 2% verwijderd van de mediaan
(+) | de hoge tonen zijn lineair (4.5% delta naar de vorige frequentie)
Algemeen 100 - 16.000 Hz
(+) | het totale geluid is lineair (10.2% verschil met de mediaan)
Vergeleken met dezelfde klasse
» 7% van alle geteste apparaten in deze klasse waren beter, 2% vergelijkbaar, 90% slechter
» De beste had een delta van 5%, het gemiddelde was 18%, de slechtste was 53%
Vergeleken met alle geteste toestellen
» 5% van alle geteste apparaten waren beter, 1% gelijk, 94% slechter
» De beste had een delta van 4%, het gemiddelde was 23%, de slechtste was 134%
| Uit / Standby | |
| Inactief | |
| Belasting |
|
Key:
min: | |
| Asus ROG Zephyrus M15 GU502GU-XB74 i7-9750H, GeForce GTX 1660 Ti Mobile, Intel SSD 660p SSDPEKNW512G8, IPS, 1920x1080, 15.6" | Asus Zephyrus S GX502GW i7-9750H, GeForce RTX 2070 Mobile, 2x Intel SSD 660p SSDPEKNW512G8 (RAID 0), IPS, 1920x1080, 15.6" | Asus Zephyrus S GX531GX i7-8750H, GeForce RTX 2080 Max-Q, Intel SSD 660p SSDPEKNW512G8, IPS, 1920x1080, 15.6" | Asus TUF FX505DT-EB73 R7 3750H, GeForce GTX 1650 Mobile, Intel SSD 660p SSDPEKNW512G8, IPS, 1920x1080, 15.6" | Lenovo Legion Y740-15ICHg i7-9750H, GeForce RTX 2070 Max-Q, WDC PC SN520 SDAPMUW-128G, IPS, 1920x1080, 15.6" | Razer Blade 15 GTX 1660 Ti i7-9750H, GeForce GTX 1660 Ti Mobile, Samsung SSD PM981 MZVLB256HAHQ, IPS, 1920x1080, 15.6" | |
|---|---|---|---|---|---|---|
| Power Consumption | -11% | 9% | 49% | 4% | 1% | |
| Idle Minimum * (Watt) | 17.6 | 24 -36% | 16.1 9% | 7 60% | 22.2 -26% | 18.7 -6% |
| Idle Average * (Watt) | 24.7 | 27 -9% | 20.9 15% | 9.9 60% | 24.9 -1% | 30.7 -24% |
| Idle Maximum * (Watt) | 56.3 | 33 41% | 27 52% | 12 79% | 30.6 46% | 33.9 40% |
| Load Average * (Watt) | 111.1 | 129 -16% | 93.4 16% | 68.4 38% | 101 9% | 93.4 16% |
| Witcher 3 ultra * (Watt) | 149 | 176 -18% | 168.2 -13% | 94.9 36% | 143 4% | 158.9 -7% |
| Load Maximum * (Watt) | 170 | 216 -27% | 215.3 -27% | 130.9 23% | 186 -9% | 195.3 -15% |
* ... kleiner is beter
| Asus ROG Zephyrus M15 GU502GU-XB74 i7-9750H, GeForce GTX 1660 Ti Mobile, 76 Wh | Asus Zephyrus S GX502GW i7-9750H, GeForce RTX 2070 Mobile, 76 Wh | Asus Zephyrus S GX531GX i7-8750H, GeForce RTX 2080 Max-Q, 50 Wh | Asus TUF FX505DT-EB73 R7 3750H, GeForce GTX 1650 Mobile, 48 Wh | Razer Blade 15 GTX 1660 Ti i7-9750H, GeForce GTX 1660 Ti Mobile, 65 Wh | MSI GS65 Stealth 9SG i7-9750H, GeForce RTX 2080 Max-Q, 82 Wh | |
|---|---|---|---|---|---|---|
| Batterijduur | -25% | -33% | 2% | 22% | 33% | |
| Reader / Idle (h) | 7.1 | 5.9 -17% | 7.8 10% | |||
| WiFi v1.3 (h) | 4.5 | 3.7 -18% | 3 -33% | 4.8 7% | 5.5 22% | 6 33% |
| Load (h) | 1.7 | 1 -41% | 1.5 -12% |
Pro
Contra

Dit is de verkorte versie van het originele artikel. Het volledige, Engelse testrapport vind je hier.
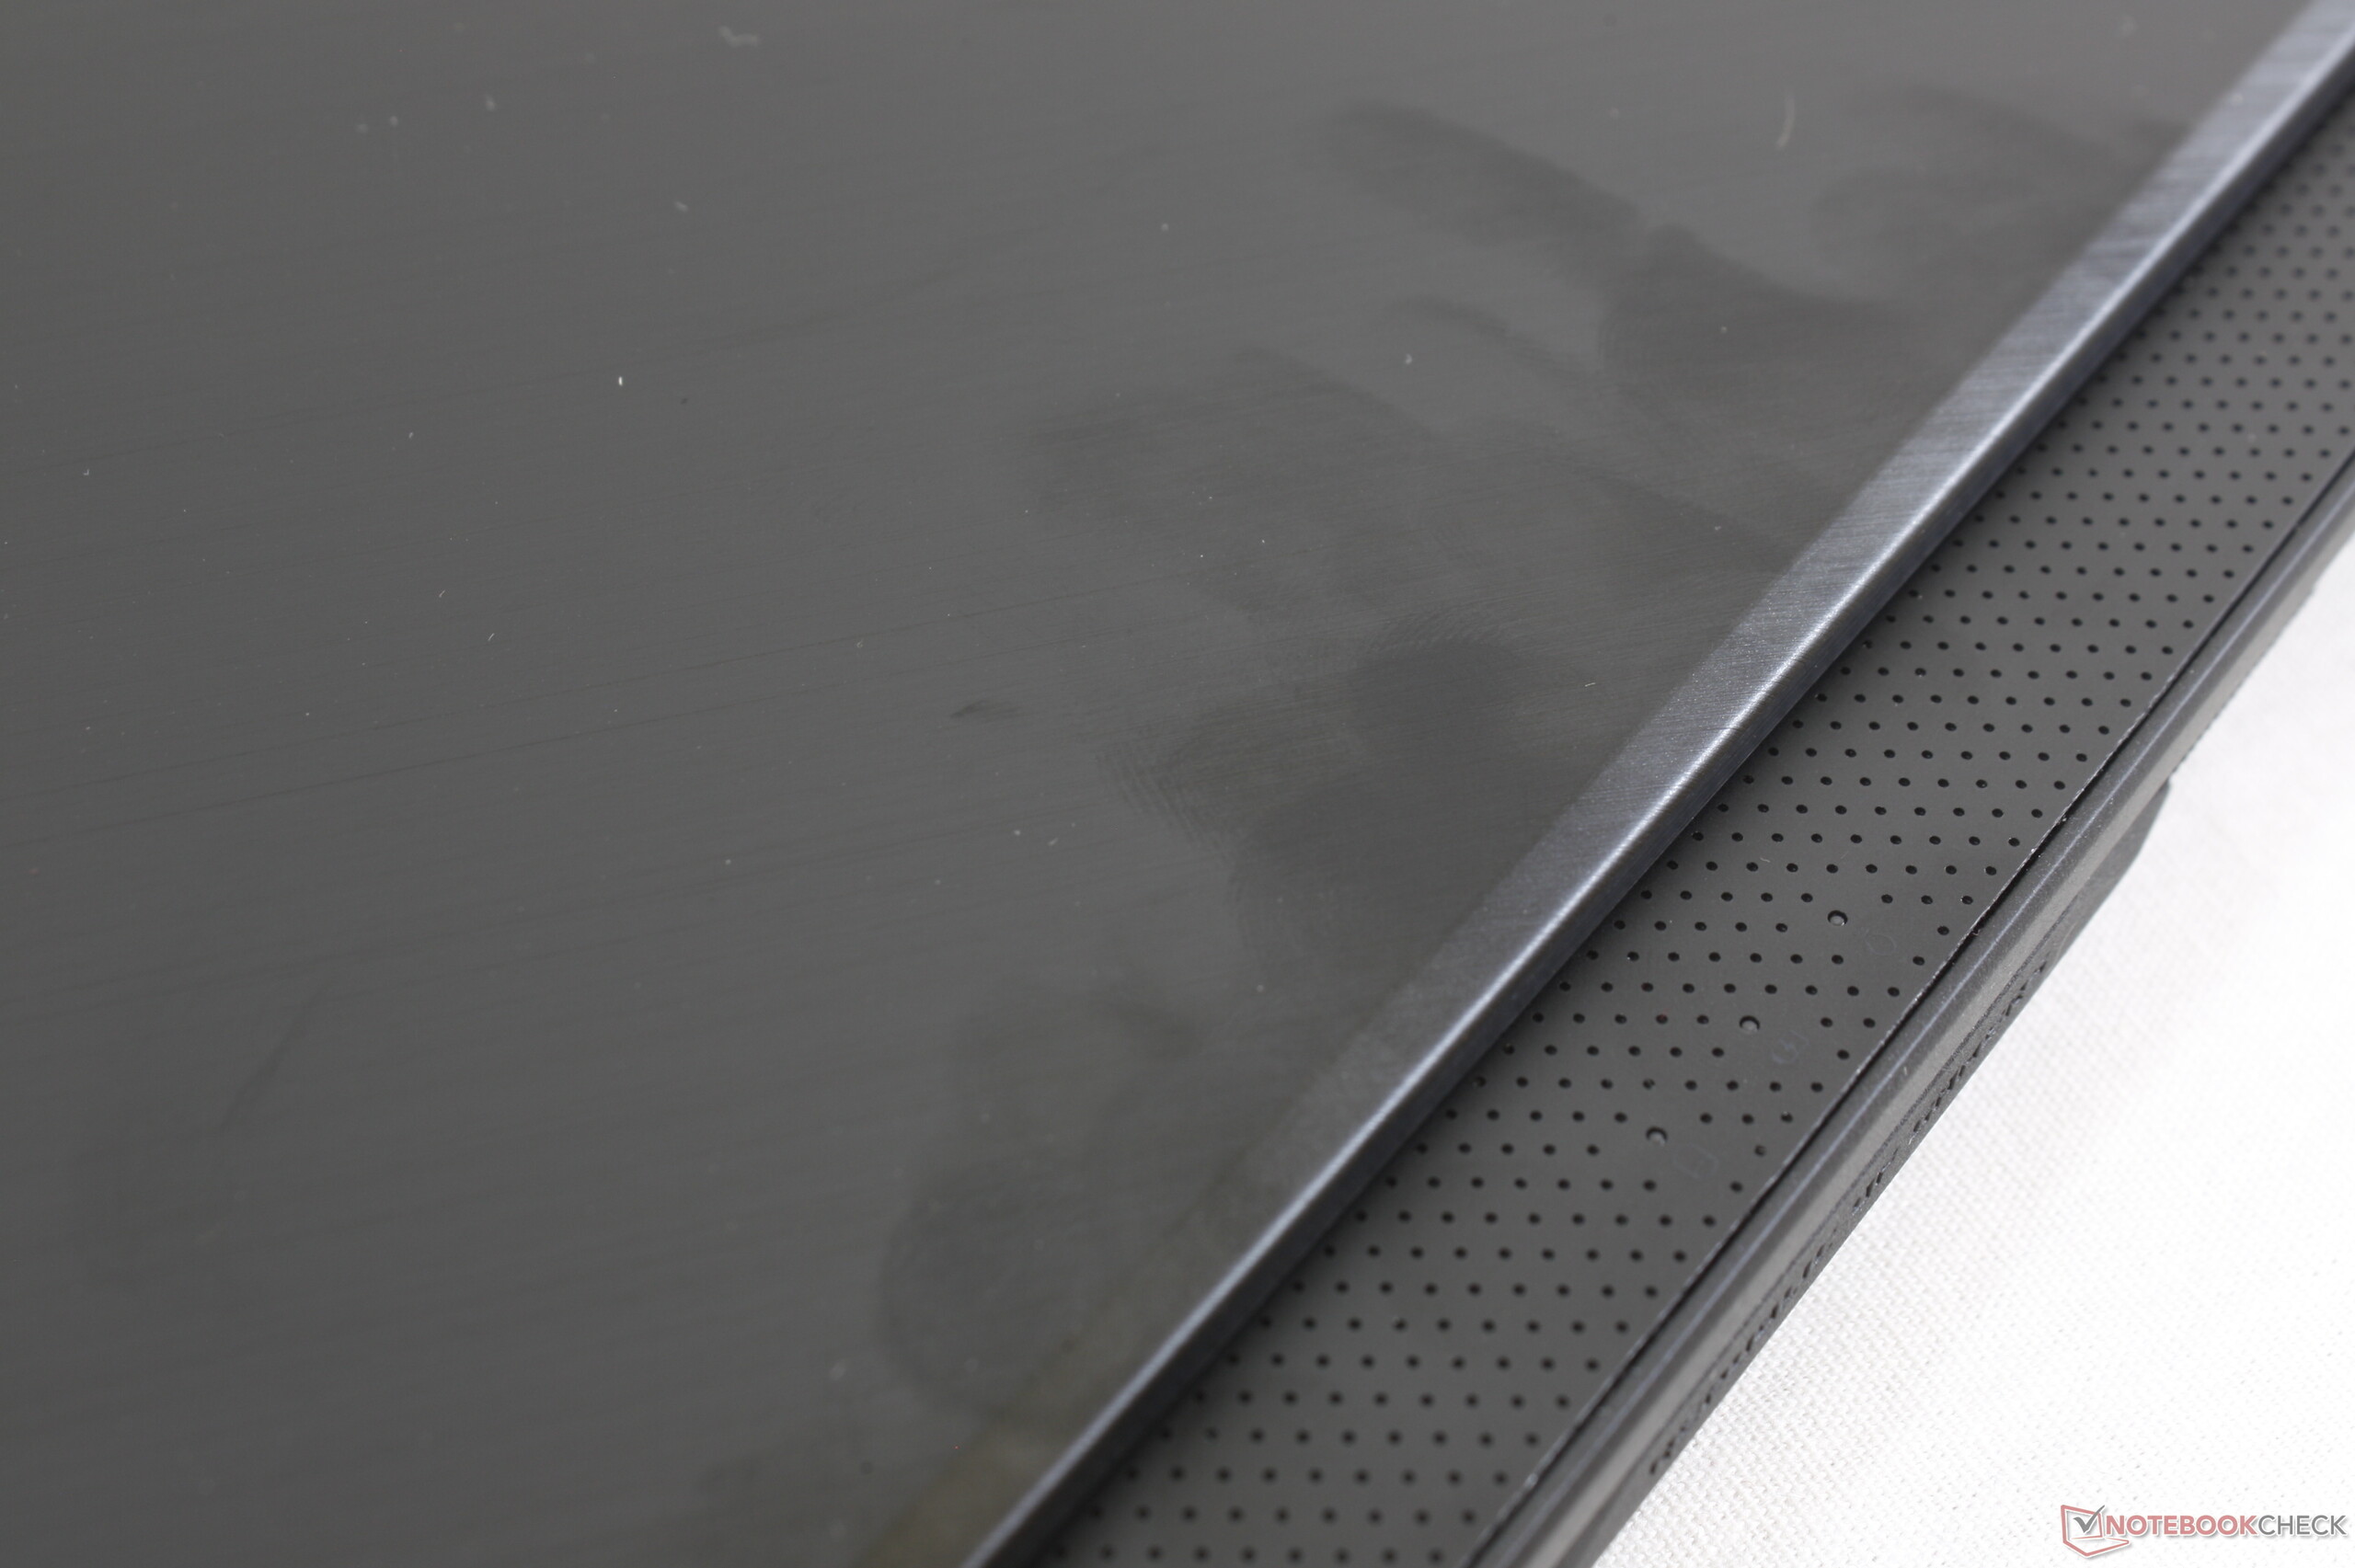
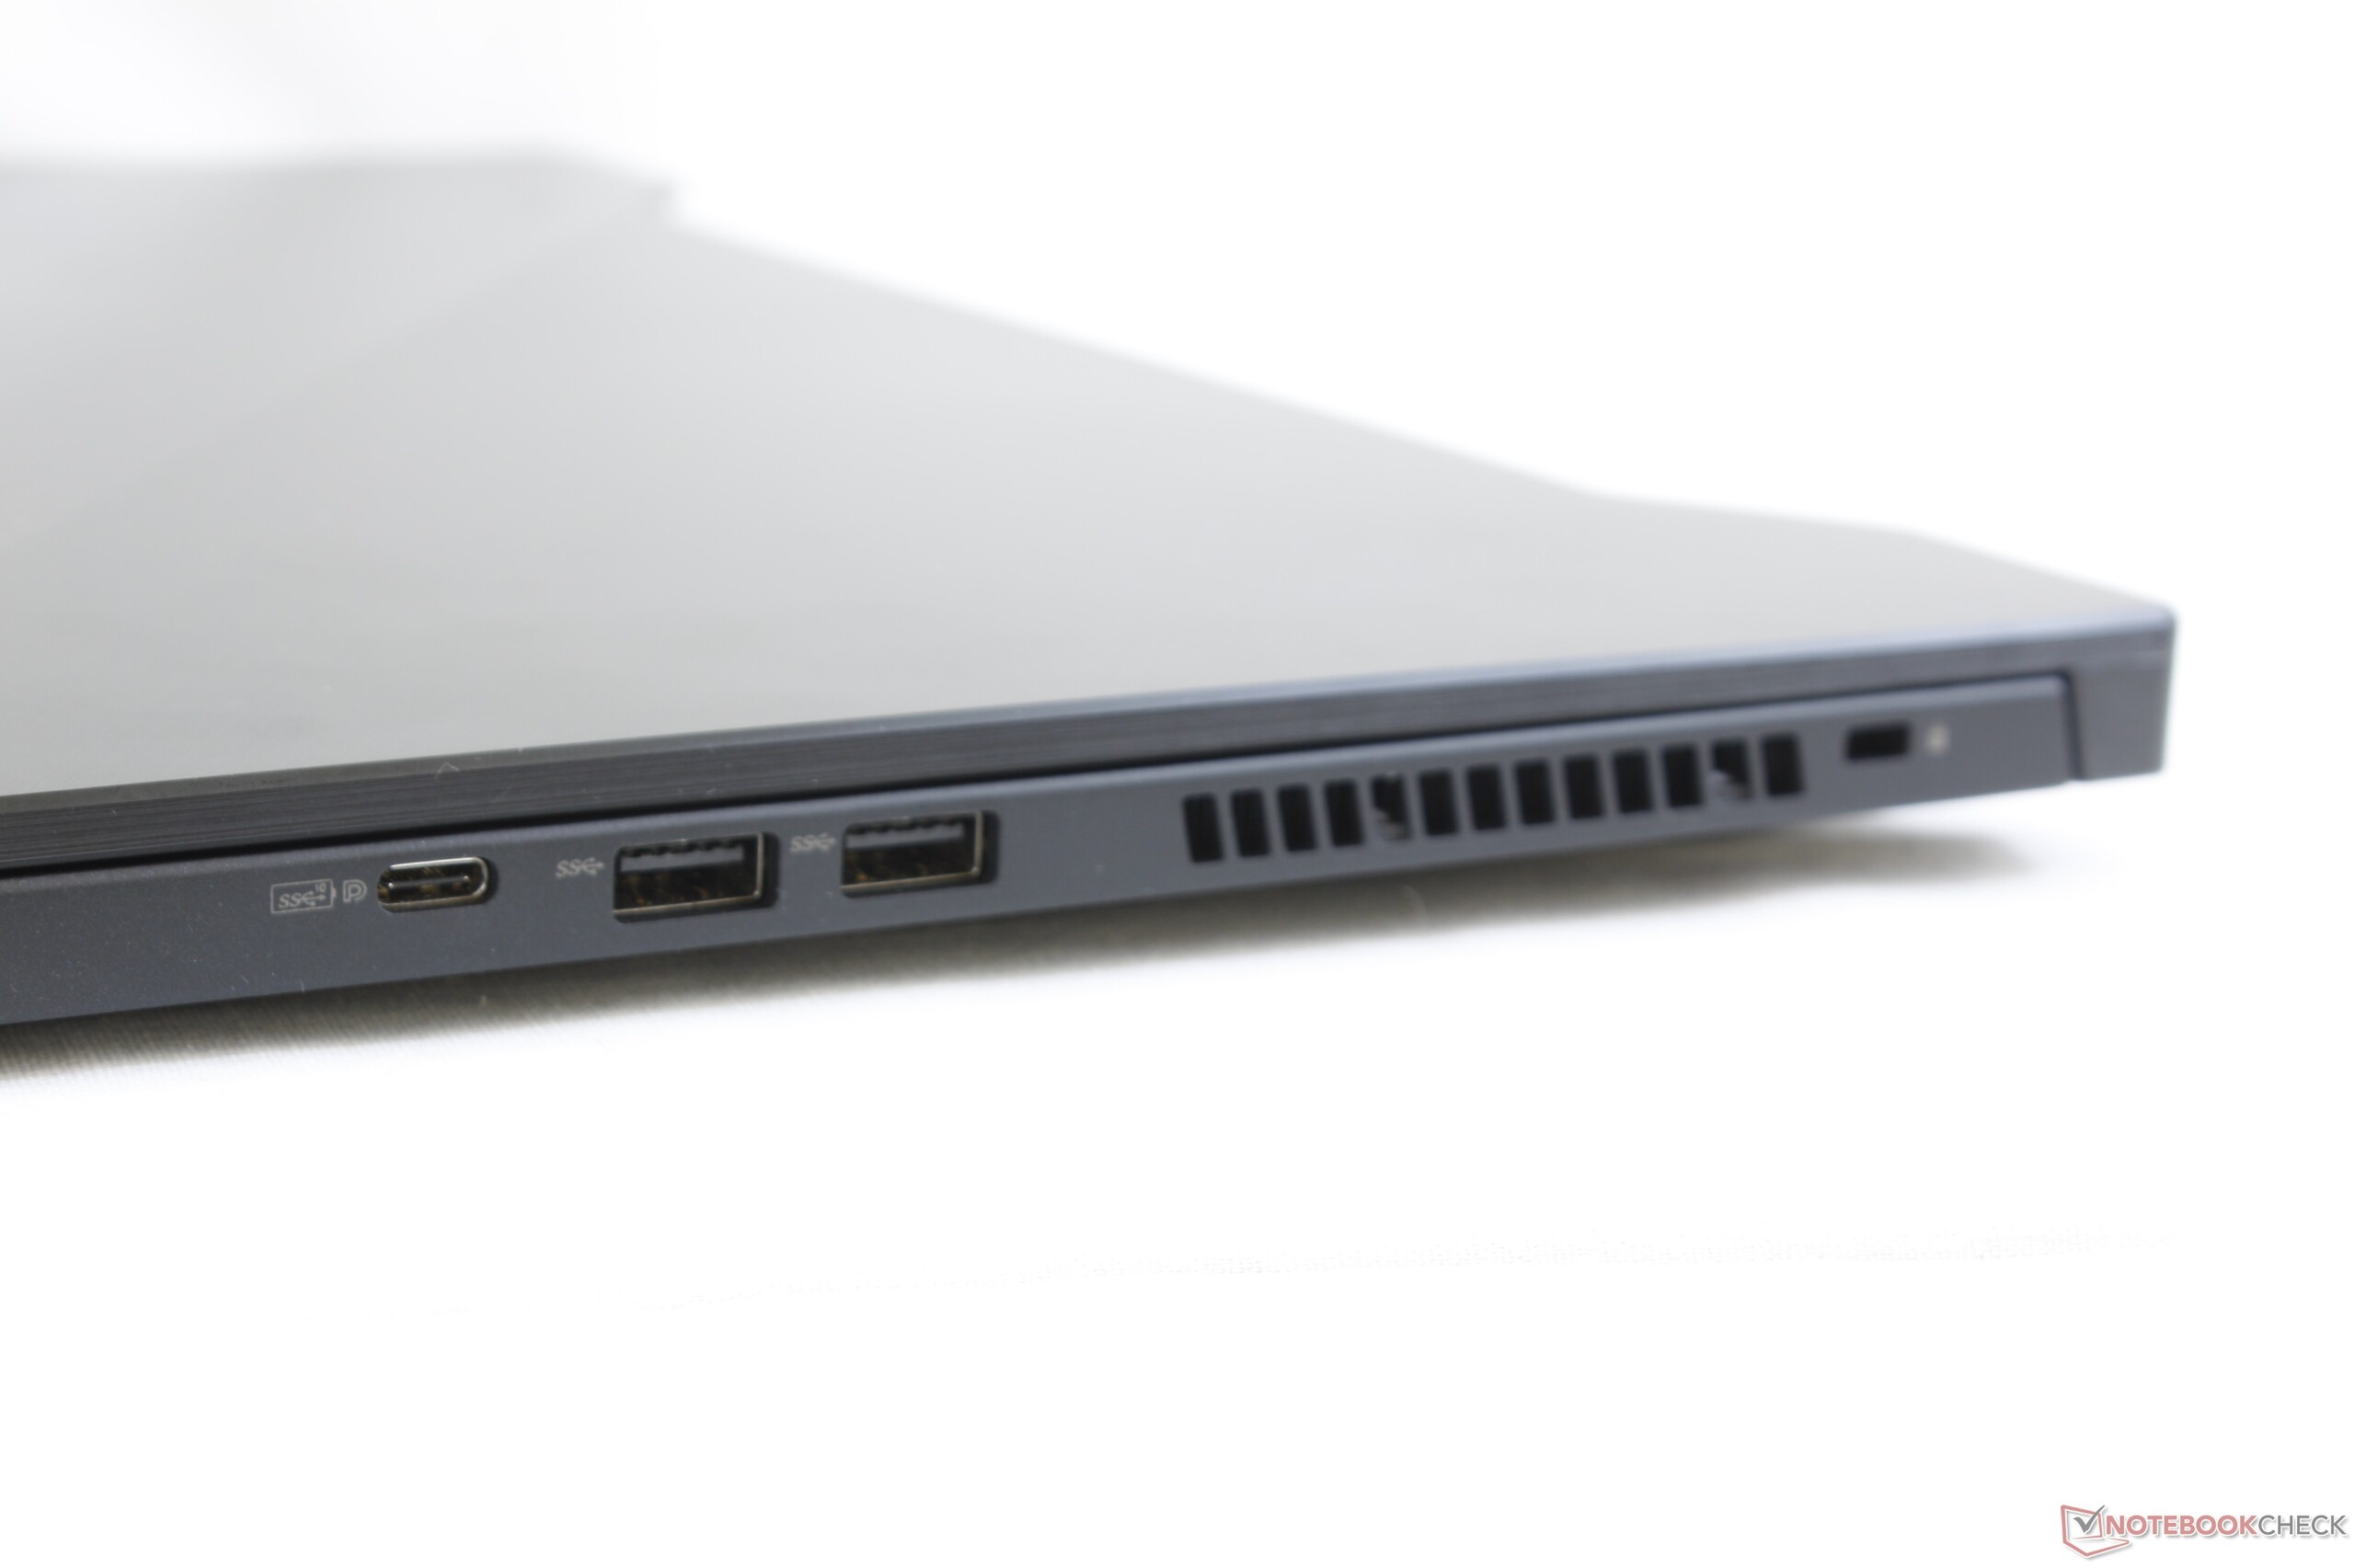
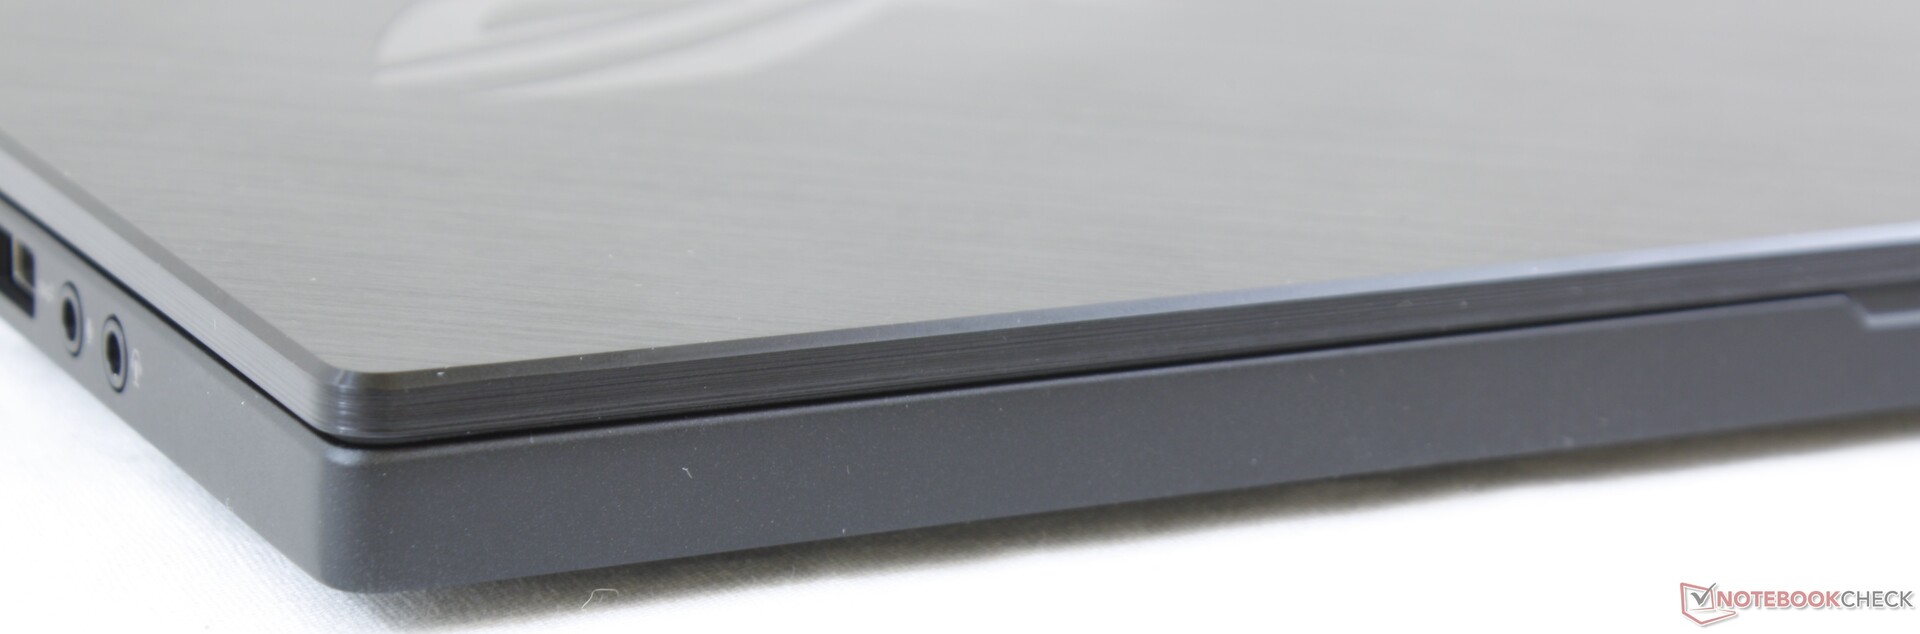
We hebben recentelijk de 15.6-inch MSI GF65 getest die met dezelfde CPU en GPU komt als onze Asus Zephyrus M GU502GU voor bijna de helft van de prijs. Wanneer een concurrerende laptop van minder dan 1000 euro dezelfde gaming-prestaties kan bieden als onze laptop van 2000 euro, kunnen we maar beter hopen dat de extra features de meerpijs kunnen verantwoorden. In het geval van de Asus GU502GU gaat dit niet helemaal op. Het systeem is groter, dikker, luidruchtiger en minder stevig, met kortere batterijduur en minder poorten dan de Razer Blade 15, die evenveel kost als de GF65. Als je dus op zoek bent naar iets steviger en meer luxueus dan een gaming-laptop als de GU502GU, kunnen we de Asus moeilijk aanbevelen aangezien hij zich zelfs niet kan meten met de Razer.
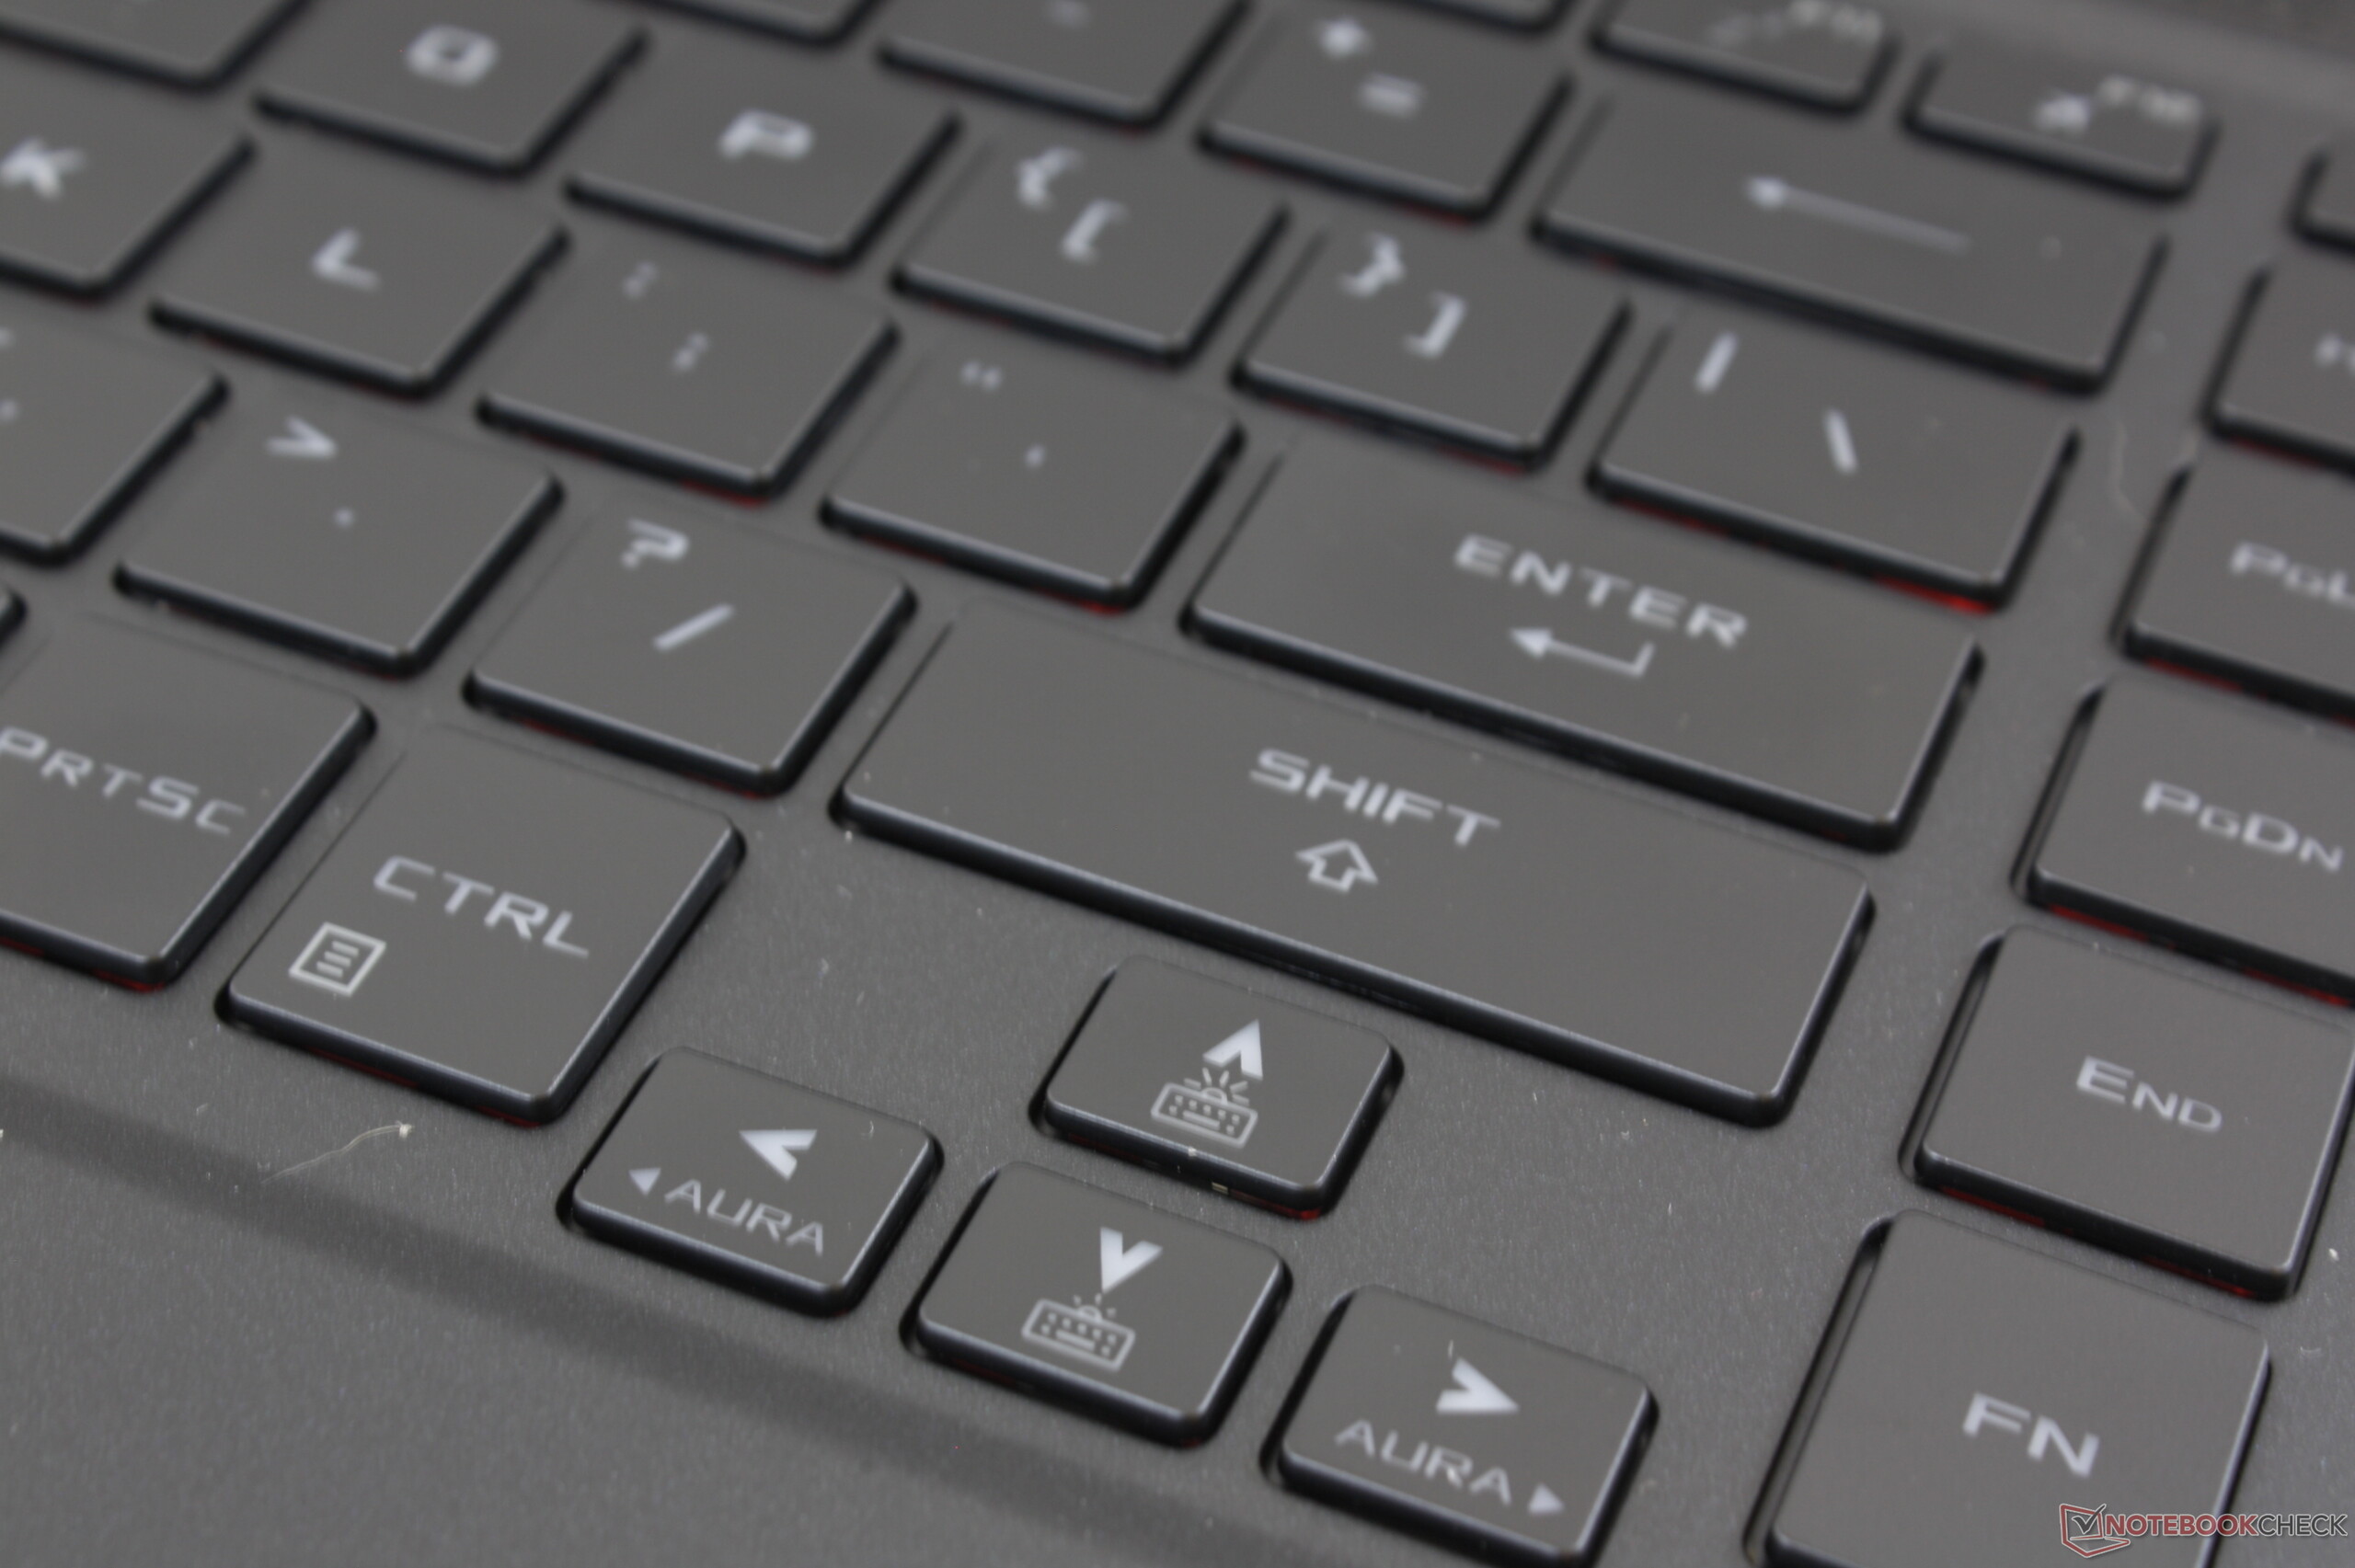
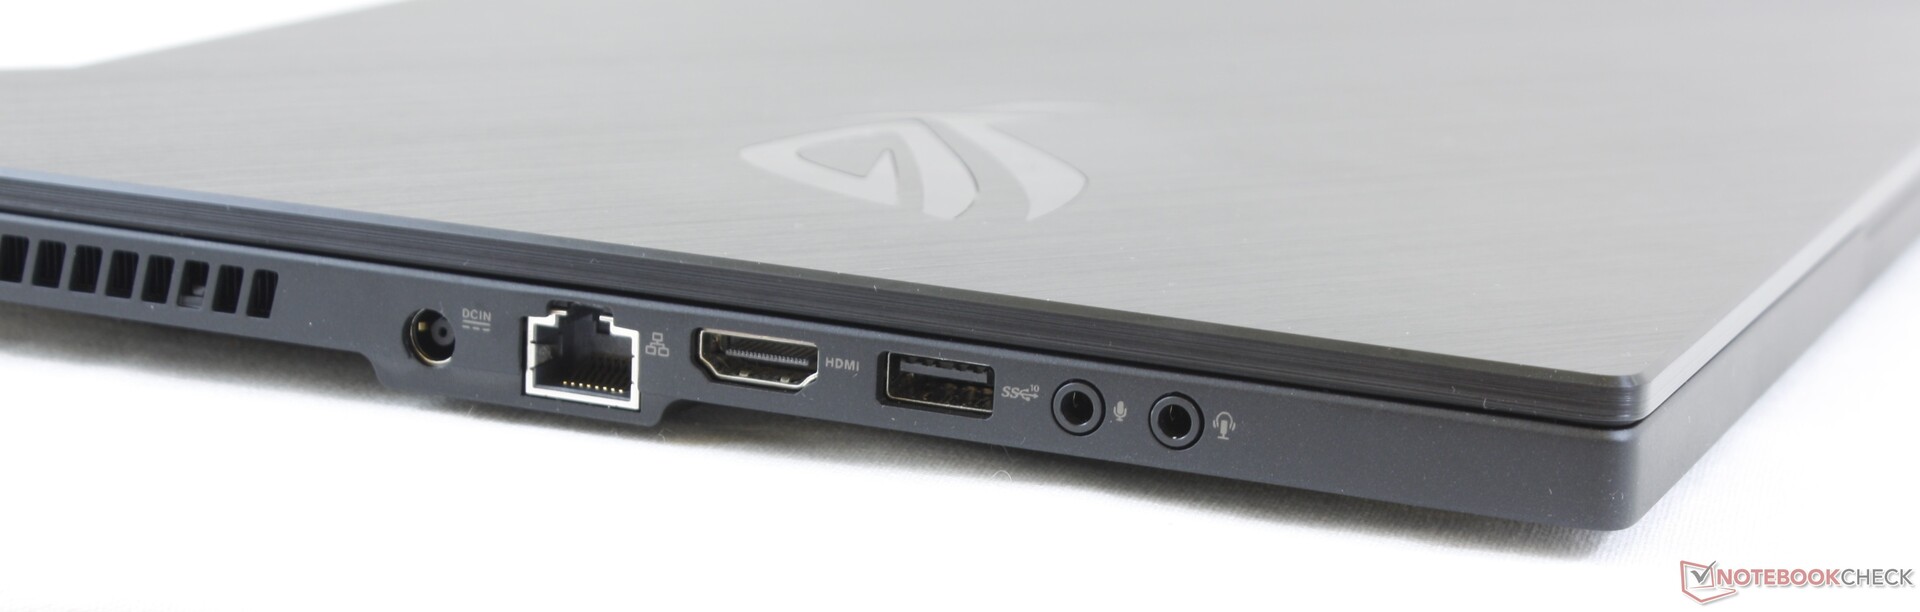
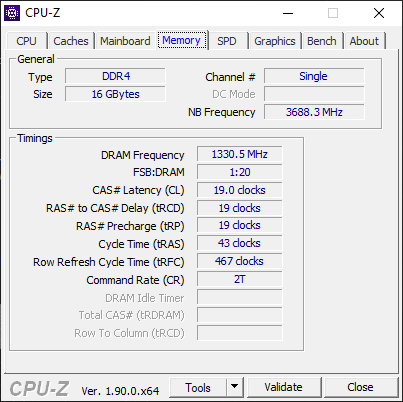
De Asus biedt ook een aantal voordelen die het vermelden waard zijn. Eerst en vooral is dit een van de weinige gaming-laptops met ondersteuning voor USB-PD, wat betekent dat je het systeem kan opladen met eender welke USB Type-C 65-W-lader. Sommige gebruikers zullen het erg handig vinden om onderweg slechts één lader nodig te hebben om hun smartphone, tablet, Switch en gaming-laptop te kunnen opladen. Daarnaast zijn de bovengemiddelde Turbo Boost-prestaties van de CPU erg interessant voor veeleisende gebruikers. Ten slotte is er ook individuele RGB-verlichting per toets, wat een verdachte afwezige was in de concurrerende Razer. Niettemin verbleekt de korte lijst met pluspunten in vergelijking met zijn langere lijst met ontbrekende features, zijn onstabiele behuizing en single-channel-RAM.
De Asus Zephyrus M GU502GU is geen slechte gaming-laptop, maar zijn startprijs van 1800 euro is zo'n 200 tot 300 euro duurder dan wat het had moeten zijn als je rekening houdt met het feit dat de vergelijkbaar geprijsde Razer Blade 15 op bijna alle vlakken superieur is.
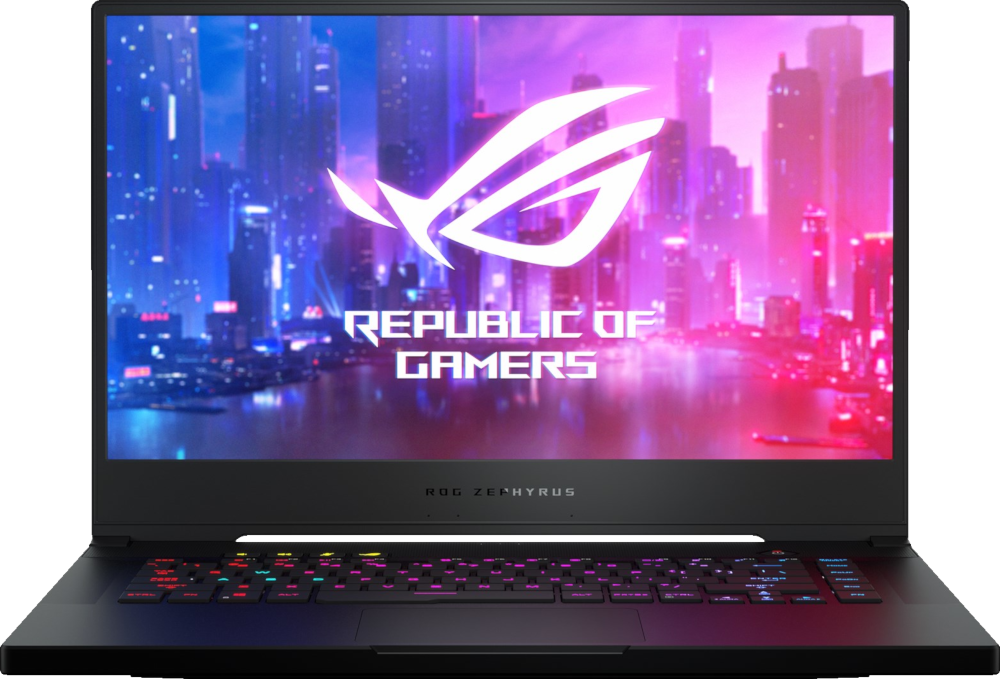
Asus ROG Zephyrus M15 GU502GU-XB74
- 25-10-2019 v7 (old)
Allen Ngo
Price comparison
