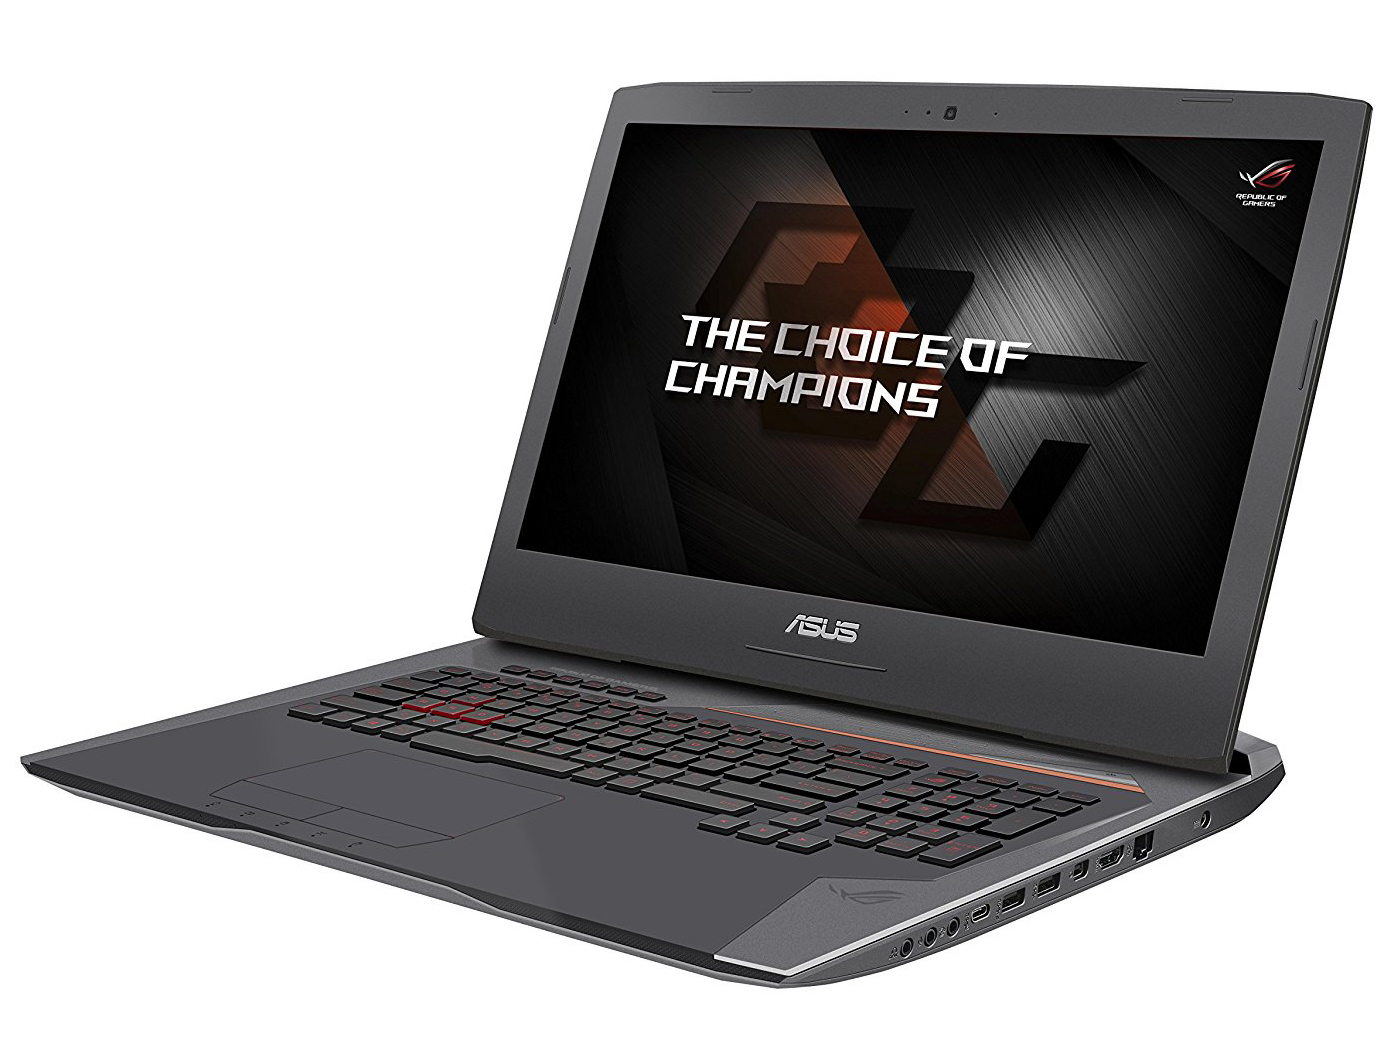
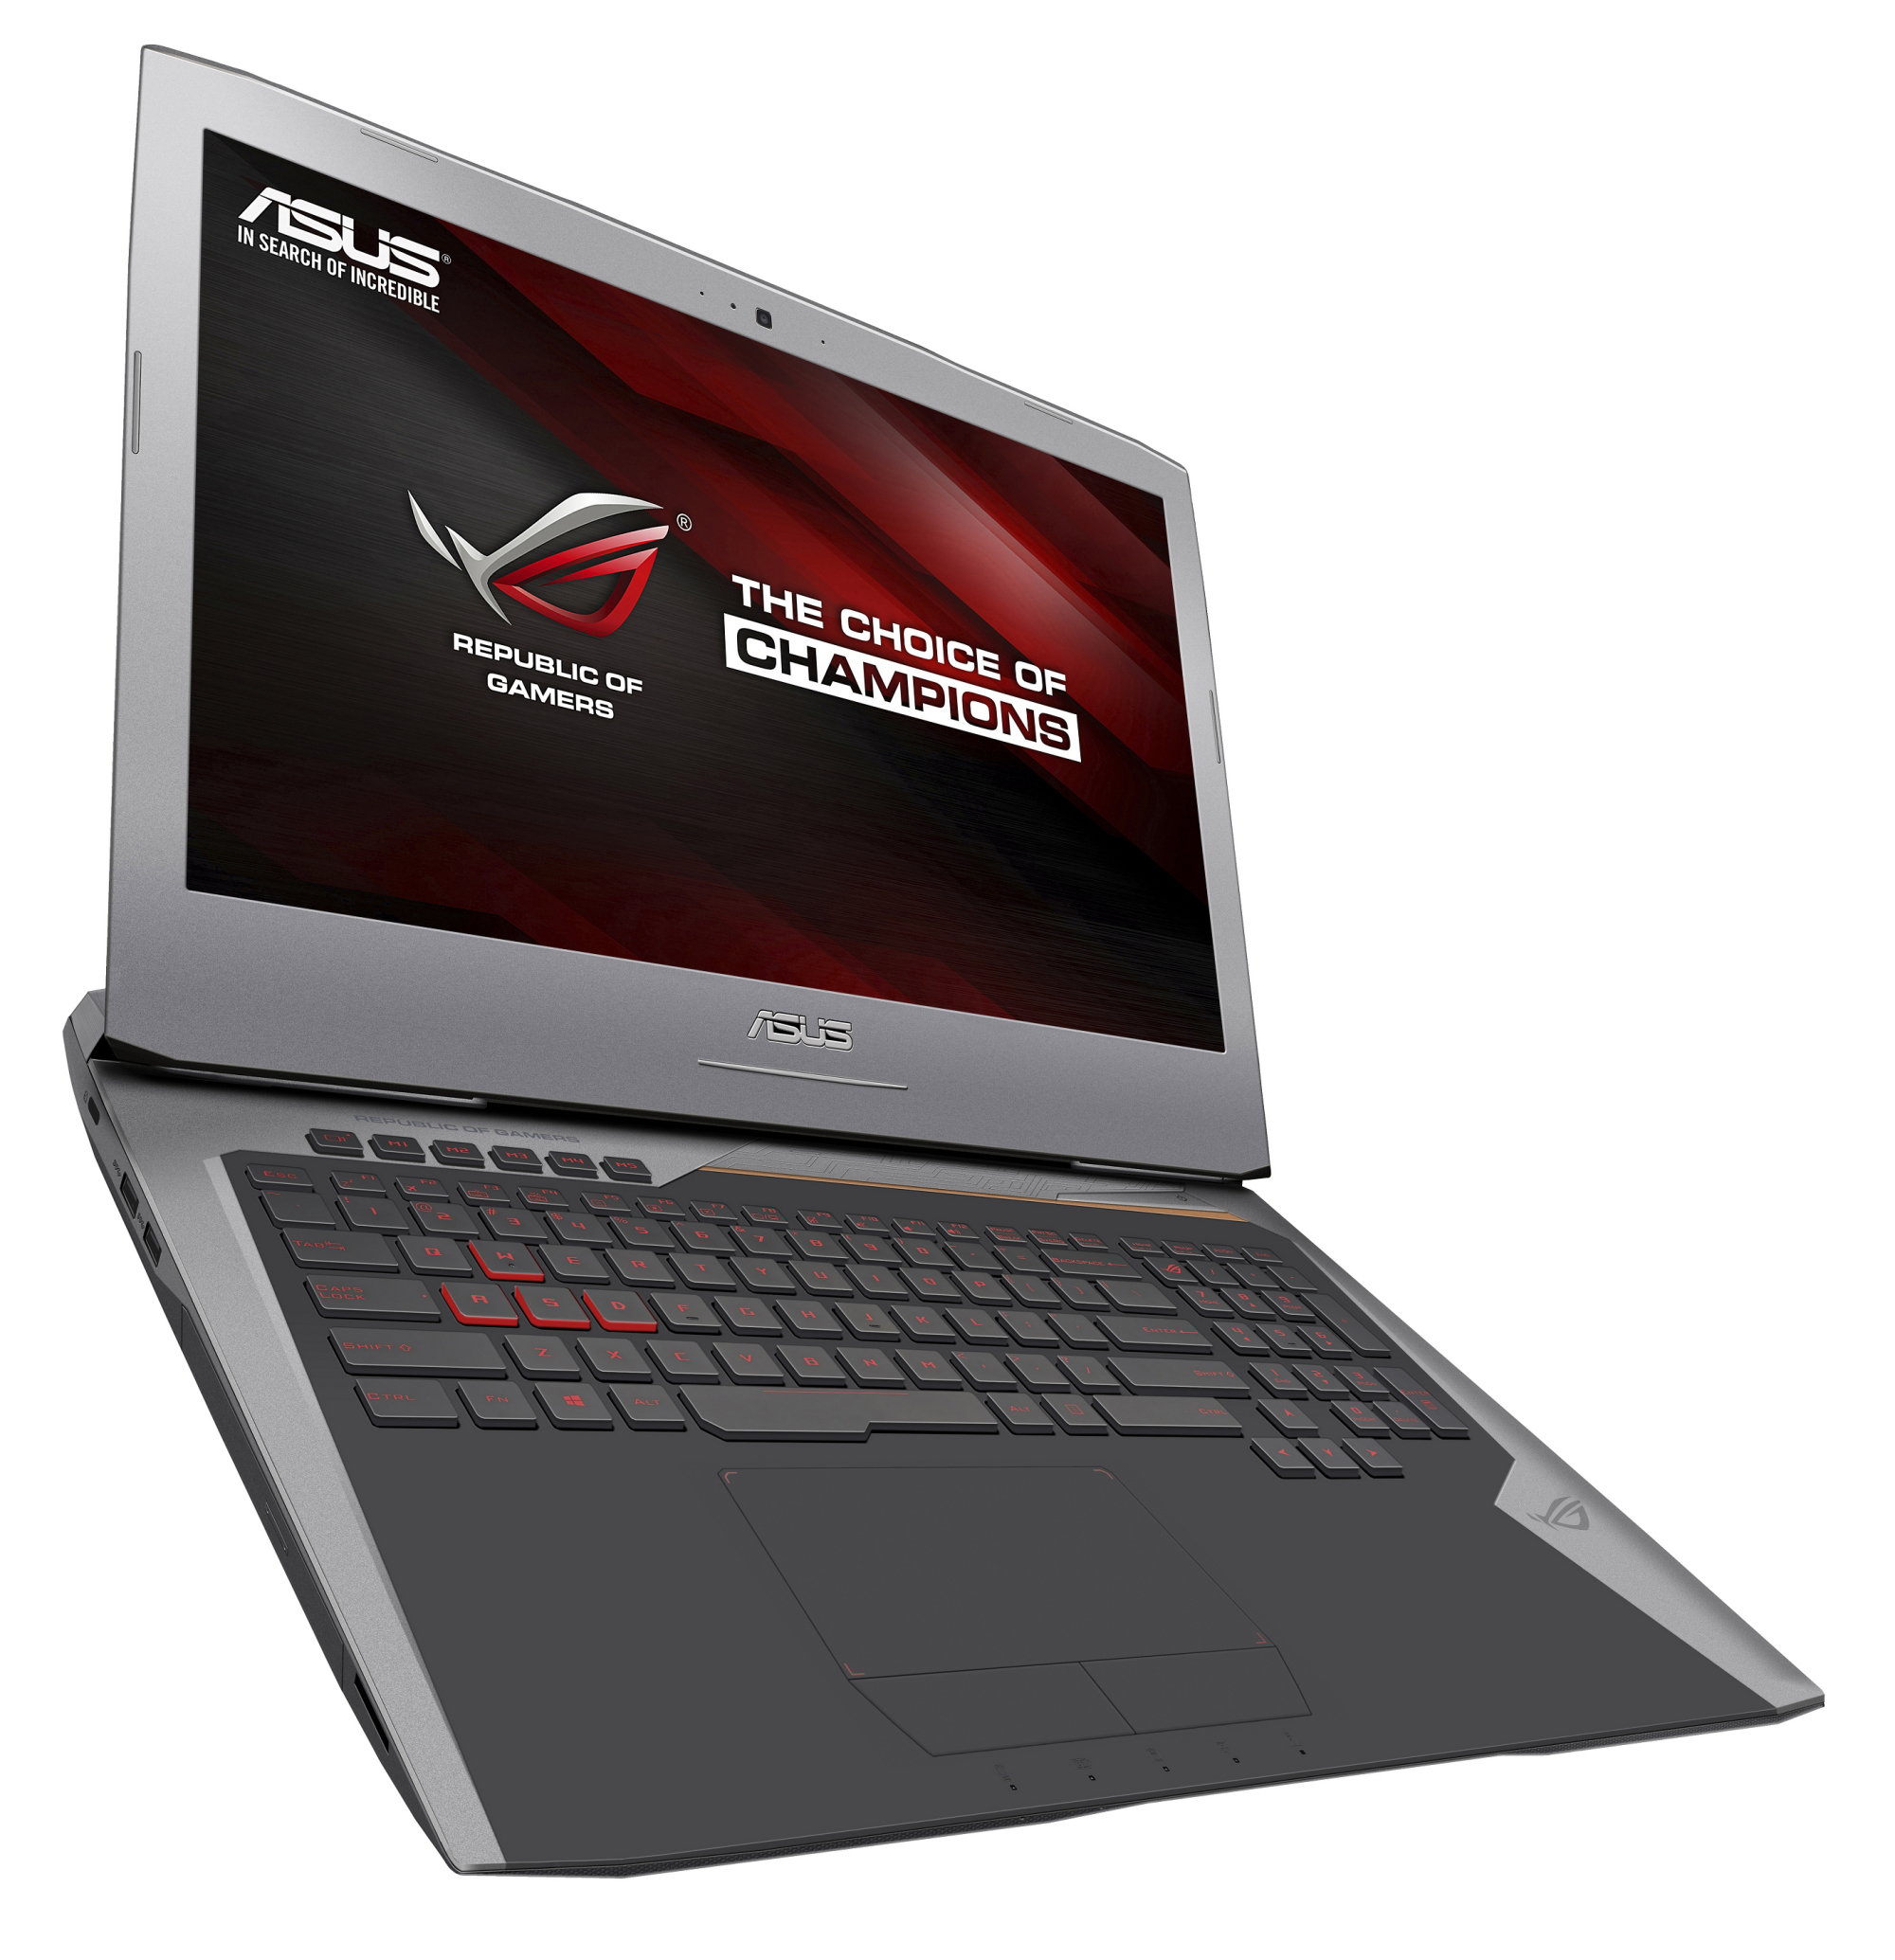
Kort testrapport Asus ROG G752VS (7700HQ, GTX 1070, FHD) Laptop
| SD Card Reader | |
| average JPG Copy Test (av. of 3 runs) | |
| MSI GT72VR 7RE-433 | |
| Acer Predator 17 G9-793-70PJ | |
| Gigabyte P57X v7 | |
| Asus G752VS-BA338T | |
| Asus G752VS-XB78K | |
| Nexoc G734IV | |
| maximum AS SSD Seq Read Test (1GB) | |
| MSI GT72VR 7RE-433 | |
| Gigabyte P57X v7 | |
| Acer Predator 17 G9-793-70PJ | |
| Nexoc G734IV | |
| Asus G752VS-BA338T | |
| Asus G752VS-XB78K | |
| Networking | |
| iperf3 transmit AX12 | |
| Acer Predator 17 G9-793-70PJ | |
| MSI GT72VR 7RE-433 | |
| Alienware 17 R4 | |
| Nexoc G734IV | |
| Asus G752VS-BA338T | |
| iperf3 receive AX12 | |
| Acer Predator 17 G9-793-70PJ | |
| Asus G752VS-BA338T | |
| Nexoc G734IV | |
| MSI GT72VR 7RE-433 | |
| Alienware 17 R4 | |
| |||||||||||||||||||||||||
Helderheidsverdeling: 88 %
Helderheid in Batterij-modus: 307 cd/m²
Contrast: 959:1 (Zwart: 0.32 cd/m²)
ΔE ColorChecker Calman: 5.53 | ∀{0.5-29.43 Ø4.73}
ΔE Greyscale Calman: 7 | ∀{0.09-98 Ø4.97}
90% sRGB (Argyll 1.6.3 3D)
58% AdobeRGB 1998 (Argyll 1.6.3 3D)
62.8% AdobeRGB 1998 (Argyll 3D)
90.3% sRGB (Argyll 3D)
61.6% Display P3 (Argyll 3D)
Gamma: 2.48
CCT: 8103 K
| Asus G752VS-BA338T AU Optronics B173HAN01.1 (AUO119D), IPS, 1920x1080 | Asus G752VS-XB78K LG Philips LP173WF4-SPF3 (LGD04E8), IPS, 1920x1080 | MSI GT72VR 7RE-433 Chi Mei N173HHE-G32 (CMN1747), TN LED, 1920x1080 | Gigabyte P57X v7 SHP145E, IPS, 3840x2160 | Nexoc G734IV LG Philips LP173WF4-SPD1 (LGD046C), IPS, 1920x1080 | Acer Predator 17 G9-793-70PJ AU Optronics B173ZAN01.0 (AUO109B), IPS, 3840x2160 | Alienware 17 R4 TN LED, 2560x1440 | |
|---|---|---|---|---|---|---|---|
| Display | 1% | 3% | 37% | -1% | 36% | -4% | |
| Display P3 Coverage (%) | 61.6 | 66.9 9% | 68.3 11% | 87.8 43% | 66.2 7% | 86.4 40% | 61.2 -1% |
| sRGB Coverage (%) | 90.3 | 85.2 -6% | 86.7 -4% | 100 11% | 83.7 -7% | 99.9 11% | 82.9 -8% |
| AdobeRGB 1998 Coverage (%) | 62.8 | 62.3 -1% | 63.4 1% | 98.9 57% | 61.2 -3% | 99.1 58% | 60.5 -4% |
| Response Times | 5% | 46% | -67% | -13% | -19% | 34% | |
| Response Time Grey 50% / Grey 80% * (ms) | 36 ? | 38 ? -6% | 29 ? 19% | 55.6 ? -54% | 42 ? -17% | 50 ? -39% | 30 ? 17% |
| Response Time Black / White * (ms) | 26 ? | 22 ? 15% | 7 ? 73% | 46.8 ? -80% | 28 ? -8% | 25.6 ? 2% | 12.8 ? 51% |
| PWM Frequency (Hz) | 1000 ? | ||||||
| Screen | 14% | -9% | 17% | 12% | 22% | -4% | |
| Brightness middle (cd/m²) | 307 | 328 7% | 299 -3% | 441.3 44% | 348 13% | 343 12% | 402.3 31% |
| Brightness (cd/m²) | 300 | 317 6% | 277 -8% | 408 36% | 336 12% | 328 9% | 372 24% |
| Brightness Distribution (%) | 88 | 88 0% | 87 -1% | 86 -2% | 91 3% | 84 -5% | 86 -2% |
| Black Level * (cd/m²) | 0.32 | 0.3 6% | 0.27 16% | 0.44 -38% | 0.32 -0% | 0.29 9% | 0.62 -94% |
| Contrast (:1) | 959 | 1093 14% | 1107 15% | 1003 5% | 1088 13% | 1183 23% | 649 -32% |
| Colorchecker dE 2000 * | 5.53 | 3.74 32% | 9.65 -75% | 5.1 8% | 4.13 25% | 4.01 27% | 5.6 -1% |
| Colorchecker dE 2000 max. * | 11.54 | 8.97 22% | 15.43 -34% | 9.8 15% | 9.21 20% | 6.03 48% | 9.8 15% |
| Greyscale dE 2000 * | 7 | 2.67 62% | 9.68 -38% | 4.3 39% | 3.52 50% | 4.7 33% | 4.7 33% |
| Gamma | 2.48 89% | 2.41 91% | 1.89 116% | 2.08 106% | 2.32 95% | 2.4 92% | 2.14 103% |
| CCT | 8103 80% | 6861 95% | 11652 56% | 7345 88% | 6228 104% | 6451 101% | 7519 86% |
| Color Space (Percent of AdobeRGB 1998) (%) | 58 | 56 -3% | 75 29% | 87 50% | 55 -5% | 88 52% | 53.7 -7% |
| Color Space (Percent of sRGB) (%) | 90 | 85 -6% | 100 11% | 100 11% | 84 -7% | 100 11% | 82.2 -9% |
| Totaal Gemiddelde (Programma / Instellingen) | 7% /
10% | 13% /
1% | -4% /
10% | -1% /
6% | 13% /
19% | 9% /
1% |
* ... kleiner is beter
Screen Flickering / PWM (Pulse-Width Modulation)
| Screen flickering / PWM niet waargenomen |  | ||
Ter vergelijking: 52 % van alle geteste toestellen maakten geen gebruik van PWM om de schermhelderheid te verlagen. Als het wel werd gebruikt, werd een gemiddelde van 7794 (minimum: 5 - maximum: 343500) Hz waargenomen. | |||
Responstijd Scherm
| ↔ Responstijd Zwart naar Wit | ||
|---|---|---|
| 26 ms ... stijging ↗ en daling ↘ gecombineerd | ↗ 14.4 ms stijging | 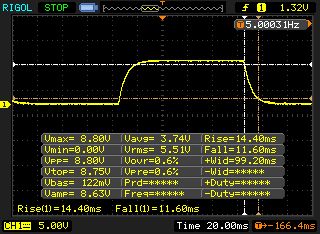 |
| ↘ 11.6 ms daling | ||
| Het scherm vertoonde relatief trage responstijden in onze tests en is misschien te traag voor games. Ter vergelijking: alle testtoestellen variëren van 0.1 (minimum) tot 240 (maximum) ms. » 62 % van alle toestellen zijn beter. Dit betekent dat de gemeten responstijd slechter is dan het gemiddelde (19.9 ms) van alle geteste toestellen. | ||
| ↔ Responstijd 50% Grijs naar 80% Grijs | ||
| 36 ms ... stijging ↗ en daling ↘ gecombineerd | ↗ 18 ms stijging | 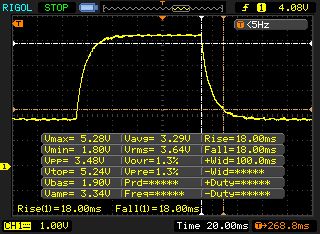 |
| ↘ 18 ms daling | ||
| Het scherm vertoonde trage responstijden in onze tests en is misschien te traag voor games. Ter vergelijking: alle testtoestellen variëren van 0.165 (minimum) tot 636 (maximum) ms. » 50 % van alle toestellen zijn beter. Dit betekent dat de gemeten responstijd slechter is dan het gemiddelde (31.1 ms) van alle geteste toestellen. | ||
| Cinebench R10 | |
| Rendering Multiple CPUs 32Bit | |
| Alienware 17 R4 | |
| Asus G752VS-XB78K | |
| Asus G752VS-BA338T | |
| MSI GT72VR 7RE-433 | |
| Nexoc G734IV | |
| Rendering Single 32Bit | |
| Alienware 17 R4 | |
| Asus G752VS-XB78K | |
| Asus G752VS-BA338T | |
| MSI GT72VR 7RE-433 | |
| Nexoc G734IV | |
| Geekbench 3 | |
| 32 Bit Multi-Core Score | |
| Nexoc G734IV | |
| Asus G752VS-BA338T | |
| MSI GT72VR 7RE-433 | |
| 32 Bit Single-Core Score | |
| Asus G752VS-BA338T | |
| Nexoc G734IV | |
| MSI GT72VR 7RE-433 | |
| Geekbench 4.0 | |
| 64 Bit Multi-Core Score | |
| Nexoc G734IV | |
| Asus G752VS-BA338T | |
| MSI GT72VR 7RE-433 | |
| 64 Bit Single-Core Score | |
| Asus G752VS-BA338T | |
| Nexoc G734IV | |
| MSI GT72VR 7RE-433 | |
| Geekbench 4.4 | |
| 64 Bit Multi-Core Score | |
| Asus G752VS-BA338T | |
| 64 Bit Single-Core Score | |
| Asus G752VS-BA338T | |
| JetStream 1.1 - 1.1 Total | |
| Asus G752VS-BA338T | |
| Nexoc G734IV | |
| MSI GT72VR 7RE-433 | |
| Asus G752VS-XB78K | |
| Alienware 17 R4 | |
| PCMark 7 Score | 6805 punten | |
| PCMark 8 Home Score Accelerated v2 | 5103 punten | |
| PCMark 8 Creative Score Accelerated v2 | 8191 punten | |
| PCMark 8 Work Score Accelerated v2 | 5410 punten | |
Help | ||

| Asus G752VS-BA338T Samsung SM961 MZVKW512HMJP m.2 PCI-e | MSI GT72VR 7RE-433 Kingston RBU-SNS8152S3256GG5 | Gigabyte P57X v7 Transcend MTS800 256GB M.2 (TS256GMTS800) | Nexoc G734IV Samsung SM961 MZVKW512HMJP m.2 PCI-e | Alienware 17 R4 SK Hynix PC300 NVMe 512 GB | Asus G752VS-XB78K Toshiba NVMe THNSN5512GPU7 | |
|---|---|---|---|---|---|---|
| CrystalDiskMark 3.0 | -49% | -58% | -6% | -11% | 19% | |
| Read Seq (MB/s) | 2791 | 521 -81% | 517 -81% | 2268 -19% | 1277 -54% | 1718 -38% |
| Write Seq (MB/s) | 1596 | 311.8 -80% | 305.7 -81% | 1559 -2% | 786 -51% | 1305 -18% |
| Read 512 (MB/s) | 400.8 | 403.1 1% | 315 -21% | 413.8 3% | 894 123% | 1250 212% |
| Write 512 (MB/s) | 1606 | 332.3 -79% | 306.1 -81% | 1167 -27% | 659 -59% | 1438 -10% |
| Read 4k (MB/s) | 55.1 | 33.35 -39% | 26.04 -53% | 54 -2% | 38.11 -31% | 44.42 -19% |
| Write 4k (MB/s) | 163.8 | 111.1 -32% | 82.3 -50% | 154.9 -5% | 128.5 -22% | 154.4 -6% |
| Read 4k QD32 (MB/s) | 607 | 331.1 -45% | 281.3 -54% | 634 4% | 628 3% | 744 23% |
| Write 4k QD32 (MB/s) | 527 | 318.3 -40% | 296 -44% | 509 -3% | 531 1% | 578 10% |
| 3DMark 06 Standard Score | 30279 punten | |
| 3DMark 11 Performance | 17222 punten | |
| 3DMark Ice Storm Standard Score | 122763 punten | |
| 3DMark Cloud Gate Standard Score | 26609 punten | |
| 3DMark Fire Strike Score | 14277 punten | |
| 3DMark Fire Strike Extreme Score | 7961 punten | |
| 3DMark Time Spy Score | 5392 punten | |
Help | ||
| 3DMark - 1920x1080 Fire Strike Graphics | |
| Alienware 17 R4 | |
| Asus G752VS-BA338T | |
| MSI GT72VR 7RE-433 | |
| Nexoc G734IV | |
| Gigabyte P57X v7 | |
| Acer Predator 17 G9-793-70PJ | |
| Asus G752VS-XB78K | |
| 3DMark 11 - 1280x720 Performance GPU | |
| Alienware 17 R4 | |
| Asus G752VS-BA338T | |
| Gigabyte P57X v7 | |
| MSI GT72VR 7RE-433 | |
| Acer Predator 17 G9-793-70PJ | |
| Asus G752VS-XB78K | |
| Nexoc G734IV | |
| BioShock Infinite - 1920x1080 Ultra Preset, DX11 (DDOF) | |
| Alienware 17 R4 | |
| Asus G752VS-BA338T | |
| Asus G752VS-XB78K | |
| MSI GT72VR 7RE-433 | |
| Gigabyte P57X v7 | |
| Nexoc G734IV | |
| The Witcher 3 - 1920x1080 Ultra Graphics & Postprocessing (HBAO+) | |
| Alienware 17 R4 | |
| Asus G752VS-BA338T | |
| Acer Predator 17 G9-793-70PJ | |
| Asus G752VS-XB78K | |
| Far Cry Primal - 1920x1080 Ultra Preset AA:SM | |
| Asus G752VS-XB78K | |
| Asus G752VS-BA338T | |
| Rise of the Tomb Raider - 1920x1080 Very High Preset AA:FX AF:16x | |
| Alienware 17 R4 | |
| Asus G752VS-BA338T | |
| Asus G752VS-XB78K | |
| Nexoc G734IV | |
| For Honor - 1920x1080 Extreme Preset AA:T AF:16x | |
| Asus G752VS-BA338T | |
| Acer Predator 17 G9-793-70PJ | |
| lage | gem. | hoge | ultra | |
|---|---|---|---|---|
| Tomb Raider (2013) | 431.5 | 407.8 | 339 | 192 |
| BioShock Infinite (2013) | 260.3 | 220.8 | 207.5 | 139.4 |
| The Witcher 3 (2015) | 228.1 | 184.4 | 117 | 59.6 |
| Rise of the Tomb Raider (2016) | 219.7 | 180.1 | 117.7 | 99 |
| Far Cry Primal (2016) | 118 | 103 | 93 | 86 |
| For Honor (2017) | 242.6 | 160 | 154 | 113.4 |
| Ghost Recon Wildlands (2017) | 127 | 96.3 | 91 | 54.4 |
| Prey (2017) | 142 | 140.2 | 135.2 | 132.5 |
Geluidsniveau
| Onbelast |
| 30 / 32 / 36 dB (A) |
| HDD |
| 34 dB (A) |
| DVD |
| 40 / dB (A) |
| Belasting |
| 43 / 49 dB (A) |
 | ||
30 dB stil 40 dB(A) hoorbaar 50 dB(A) luid |
||
min: | ||
| Asus G752VS-BA338T i7-7700HQ, GeForce GTX 1070 Mobile | MSI GT72VR 7RE-433 i7-7700HQ, GeForce GTX 1070 Mobile | Gigabyte P57X v7 i7-7700HQ, GeForce GTX 1070 Mobile | Nexoc G734IV i7-7700HQ, GeForce GTX 1070 Mobile | Acer Predator 17 G9-793-70PJ i7-7700HQ, GeForce GTX 1070 Mobile | Alienware 17 R4 i7-7820HK, GeForce GTX 1080 Mobile | Asus G752VS-XB78K 6820HK, GeForce GTX 1070 Mobile | |
|---|---|---|---|---|---|---|---|
| Noise | -1% | 0% | -13% | -4% | -8% | 3% | |
| uit / omgeving * (dB) | 30 | 31 -3% | 29 3% | 30 -0% | 31 -3% | 28.2 6% | 30 -0% |
| Idle Minimum * (dB) | 30 | 34 -13% | 30.4 -1% | 34 -13% | 32 -7% | 35.6 -19% | 31 -3% |
| Idle Average * (dB) | 32 | 35 -9% | 32.1 -0% | 35 -9% | 35 -9% | 35.6 -11% | 32 -0% |
| Idle Maximum * (dB) | 36 | 37 -3% | 32.1 11% | 46 -28% | 38 -6% | 35.7 1% | 33 8% |
| Load Average * (dB) | 43 | 37 14% | 45.6 -6% | 49 -14% | 42 2% | 50.2 -17% | 40 7% |
| Witcher 3 ultra * (dB) | 43 | 44 -2% | 50.2 -17% | ||||
| Load Maximum * (dB) | 49 | 44 10% | 51.5 -5% | 56 -14% | 50 -2% | 50.2 -2% | 47 4% |
* ... kleiner is beter
(±) De maximumtemperatuur aan de bovenzijde bedraagt 41 °C / 106 F, vergeleken met het gemiddelde van 40.4 °C / 105 F, variërend van 21.2 tot 68.8 °C voor de klasse Gaming.
(+) De bodem warmt op tot een maximum van 39.3 °C / 103 F, vergeleken met een gemiddelde van 43.2 °C / 110 F
(+) Bij onbelast gebruik bedraagt de gemiddelde temperatuur voor de bovenzijde 26.8 °C / 80 F, vergeleken met het apparaatgemiddelde van 33.9 °C / 93 F.
(+) Bij het spelen van The Witcher 3 is de gemiddelde temperatuur voor de bovenzijde 31.3 °C / 88 F, vergeleken met het apparaatgemiddelde van 33.9 °C / 93 F.
(+) De palmsteunen en het touchpad zijn met een maximum van ###max## °C / 81.7 F koeler dan de huidtemperatuur en voelen daarom koel aan.
(±) De gemiddelde temperatuur van de handpalmsteun van soortgelijke toestellen bedroeg 28.8 °C / 83.8 F (+1.2 °C / 2.1 F).
| Asus G752VS-BA338T i7-7700HQ, GeForce GTX 1070 Mobile | MSI GT72VR 7RE-433 i7-7700HQ, GeForce GTX 1070 Mobile | Gigabyte P57X v7 i7-7700HQ, GeForce GTX 1070 Mobile | Nexoc G734IV i7-7700HQ, GeForce GTX 1070 Mobile | Acer Predator 17 G9-793-70PJ i7-7700HQ, GeForce GTX 1070 Mobile | Alienware 17 R4 i7-7820HK, GeForce GTX 1080 Mobile | Asus G752VS-XB78K 6820HK, GeForce GTX 1070 Mobile | |
|---|---|---|---|---|---|---|---|
| Heat | -4% | -20% | -15% | 1% | -18% | -7% | |
| Maximum Upper Side * (°C) | 41 | 41.5 -1% | 51.2 -25% | 48.1 -17% | 39.1 5% | 49.6 -21% | 42.9 -5% |
| Maximum Bottom * (°C) | 39.3 | 50.6 -29% | 56.8 -45% | 59.3 -51% | 42.1 -7% | 56 -42% | 41.5 -6% |
| Idle Upper Side * (°C) | 28.8 | 26.4 8% | 29.2 -1% | 28.2 2% | 27.9 3% | 29.6 -3% | 31.6 -10% |
| Idle Bottom * (°C) | 27.3 | 25.4 7% | 29.2 -7% | 26 5% | 26.1 4% | 29.2 -7% | 29.5 -8% |
* ... kleiner is beter
Asus G752VS-BA338T audioanalyse
(±) | luidspreker luidheid is gemiddeld maar goed (80 dB)
Bas 100 - 315 Hz
(±) | verminderde zeebaars - gemiddeld 9.4% lager dan de mediaan
(±) | lineariteit van de lage tonen is gemiddeld (11.1% delta ten opzichte van de vorige frequentie)
Midden 400 - 2000 Hz
(+) | evenwichtige middens - slechts 4.2% verwijderd van de mediaan
(+) | de middentonen zijn lineair (6% delta ten opzichte van de vorige frequentie)
Hoog 2 - 16 kHz
(±) | lagere maxima - gemiddeld 7.7% lager dan de mediaan
(±) | lineariteit van de hoogtepunten is gemiddeld (10% delta ten opzichte van de vorige frequentie)
Algemeen 100 - 16.000 Hz
(±) | lineariteit van het totale geluid is gemiddeld (21.2% verschil met de mediaan)
Vergeleken met dezelfde klasse
» 76% van alle geteste apparaten in deze klasse waren beter, 4% vergelijkbaar, 19% slechter
» De beste had een delta van 6%, het gemiddelde was 18%, de slechtste was 132%
Vergeleken met alle geteste toestellen
» 59% van alle geteste apparaten waren beter, 7% gelijk, 34% slechter
» De beste had een delta van 4%, het gemiddelde was 24%, de slechtste was 134%
Acer Predator 17 G9-793-70PJ audioanalyse
(+) | luidsprekers kunnen relatief luid spelen (87 dB)
Bas 100 - 315 Hz
(±) | verminderde zeebaars - gemiddeld 5.5% lager dan de mediaan
(±) | lineariteit van de lage tonen is gemiddeld (8% delta ten opzichte van de vorige frequentie)
Midden 400 - 2000 Hz
(+) | evenwichtige middens - slechts 2.9% verwijderd van de mediaan
(+) | de middentonen zijn lineair (3.5% delta ten opzichte van de vorige frequentie)
Hoog 2 - 16 kHz
(±) | lagere maxima - gemiddeld 5.2% lager dan de mediaan
(+) | de hoge tonen zijn lineair (6.2% delta naar de vorige frequentie)
Algemeen 100 - 16.000 Hz
(+) | het totale geluid is lineair (10.3% verschil met de mediaan)
Vergeleken met dezelfde klasse
» 6% van alle geteste apparaten in deze klasse waren beter, 2% vergelijkbaar, 93% slechter
» De beste had een delta van 6%, het gemiddelde was 18%, de slechtste was 132%
Vergeleken met alle geteste toestellen
» 5% van alle geteste apparaten waren beter, 1% gelijk, 94% slechter
» De beste had een delta van 4%, het gemiddelde was 24%, de slechtste was 134%
| Uit / Standby | |
| Inactief | |
| Belasting |
|
Key:
min: | |
| Asus G752VS-BA338T i7-7700HQ, GeForce GTX 1070 Mobile | MSI GT72VR 7RE-433 i7-7700HQ, GeForce GTX 1070 Mobile | Gigabyte P57X v7 i7-7700HQ, GeForce GTX 1070 Mobile | Nexoc G734IV i7-7700HQ, GeForce GTX 1070 Mobile | Acer Predator 17 G9-793-70PJ i7-7700HQ, GeForce GTX 1070 Mobile | Alienware 17 R4 i7-7820HK, GeForce GTX 1080 Mobile | Asus G752VS-XB78K 6820HK, GeForce GTX 1070 Mobile | |
|---|---|---|---|---|---|---|---|
| Power Consumption | 4% | -13% | 20% | -14% | -37% | -10% | |
| Idle Minimum * (Watt) | 21 | 20 5% | 15.7 25% | 12 43% | 23 -10% | 37.5 -79% | 24 -14% |
| Idle Average * (Watt) | 27 | 27 -0% | 23.4 13% | 17 37% | 33 -22% | 37.6 -39% | 31 -15% |
| Idle Maximum * (Watt) | 32 | 31 3% | 23.5 27% | 22 31% | 40 -25% | 37.6 -18% | 36 -13% |
| Load Average * (Watt) | 86 | 86 -0% | 184.6 -115% | 86 -0% | 94 -9% | 122.4 -42% | 94 -9% |
| Witcher 3 ultra * (Watt) | 165 | 177 -7% | 180.3 -9% | ||||
| Load Maximum * (Watt) | 206 | 184 11% | 233.1 -13% | 224 -9% | 228 -11% | 277.4 -35% | 204 1% |
* ... kleiner is beter
| Asus G752VS-BA338T i7-7700HQ, GeForce GTX 1070 Mobile, 90 Wh | MSI GT72VR 7RE-433 i7-7700HQ, GeForce GTX 1070 Mobile, 83 Wh | Gigabyte P57X v7 i7-7700HQ, GeForce GTX 1070 Mobile, 75.81 Wh | Nexoc G734IV i7-7700HQ, GeForce GTX 1070 Mobile, 60 Wh | Acer Predator 17 G9-793-70PJ i7-7700HQ, GeForce GTX 1070 Mobile, 88 Wh | Alienware 17 R4 i7-7820HK, GeForce GTX 1080 Mobile, 99 Wh | Asus G752VS-XB78K 6820HK, GeForce GTX 1070 Mobile, 90 Wh | |
|---|---|---|---|---|---|---|---|
| Batterijduur | -17% | -30% | -19% | -20% | -34% | -25% | |
| Reader / Idle (h) | 7.4 | 5.3 -28% | 4.3 -42% | 7.7 4% | 5.4 -27% | 4.6 -38% | 5.2 -30% |
| H.264 (h) | 4.3 | 3.8 -12% | 3.3 -23% | 3.1 -28% | |||
| WiFi v1.3 (h) | 4.9 | 3.8 -22% | 2.6 -47% | 3.4 -31% | 3.6 -27% | 3 -39% | 3.5 -29% |
| Load (h) | 1.6 | 1.5 -6% | 1.6 0% | 1.2 -25% | 1.5 -6% | 1.2 -25% | 1.4 -13% |
Pro
Contra
Voor het volledige, Engelse testrapport, klik hier.
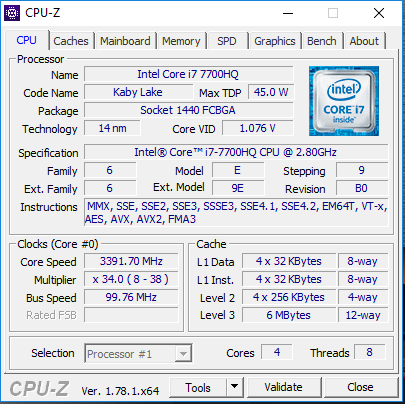
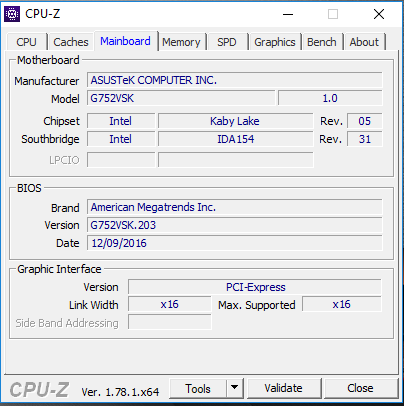
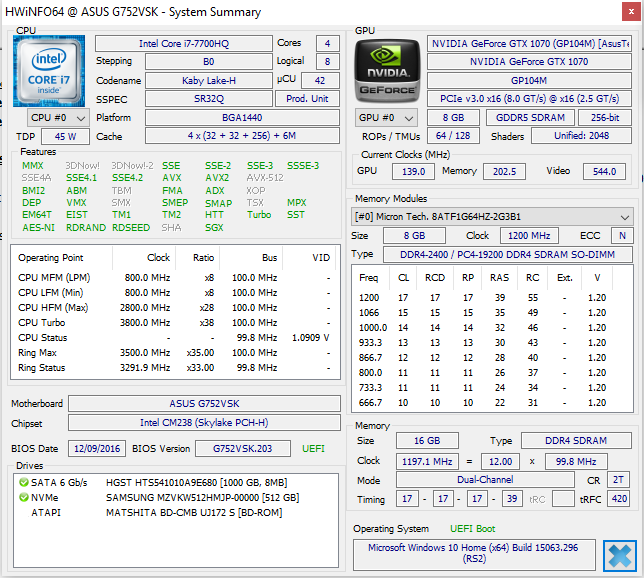
De G752VS-BA338T is de Kaby Lake versie van de 17 inch gaming laptop serie van Asus. De nieuwe Core i7-7700HQ processor is niet veel sneller dan de voorgaande Skylake modellen.
De Kaby Lake CPU resulteert in langere looptijden dankzij verbeterde efficiëntie.
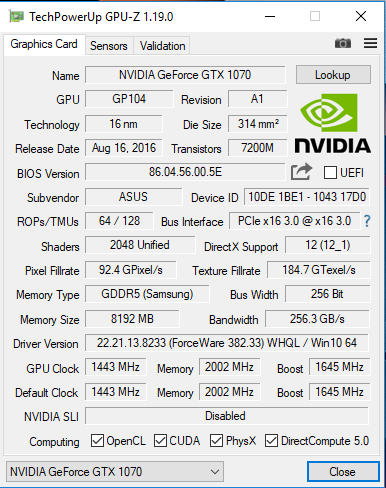
De CPU/GPU combinatie is in staat om alle moderne games in Full HD resolutie soepel te spelen. Nvidia's G-Sync technologie garandeert soepele beelden op het 120 Hz beeldscherm en de grafische kaart heeft voldoende reserves voor een hogere resolutie. Dit kan echter alleen in combinatie met een externe monitor.
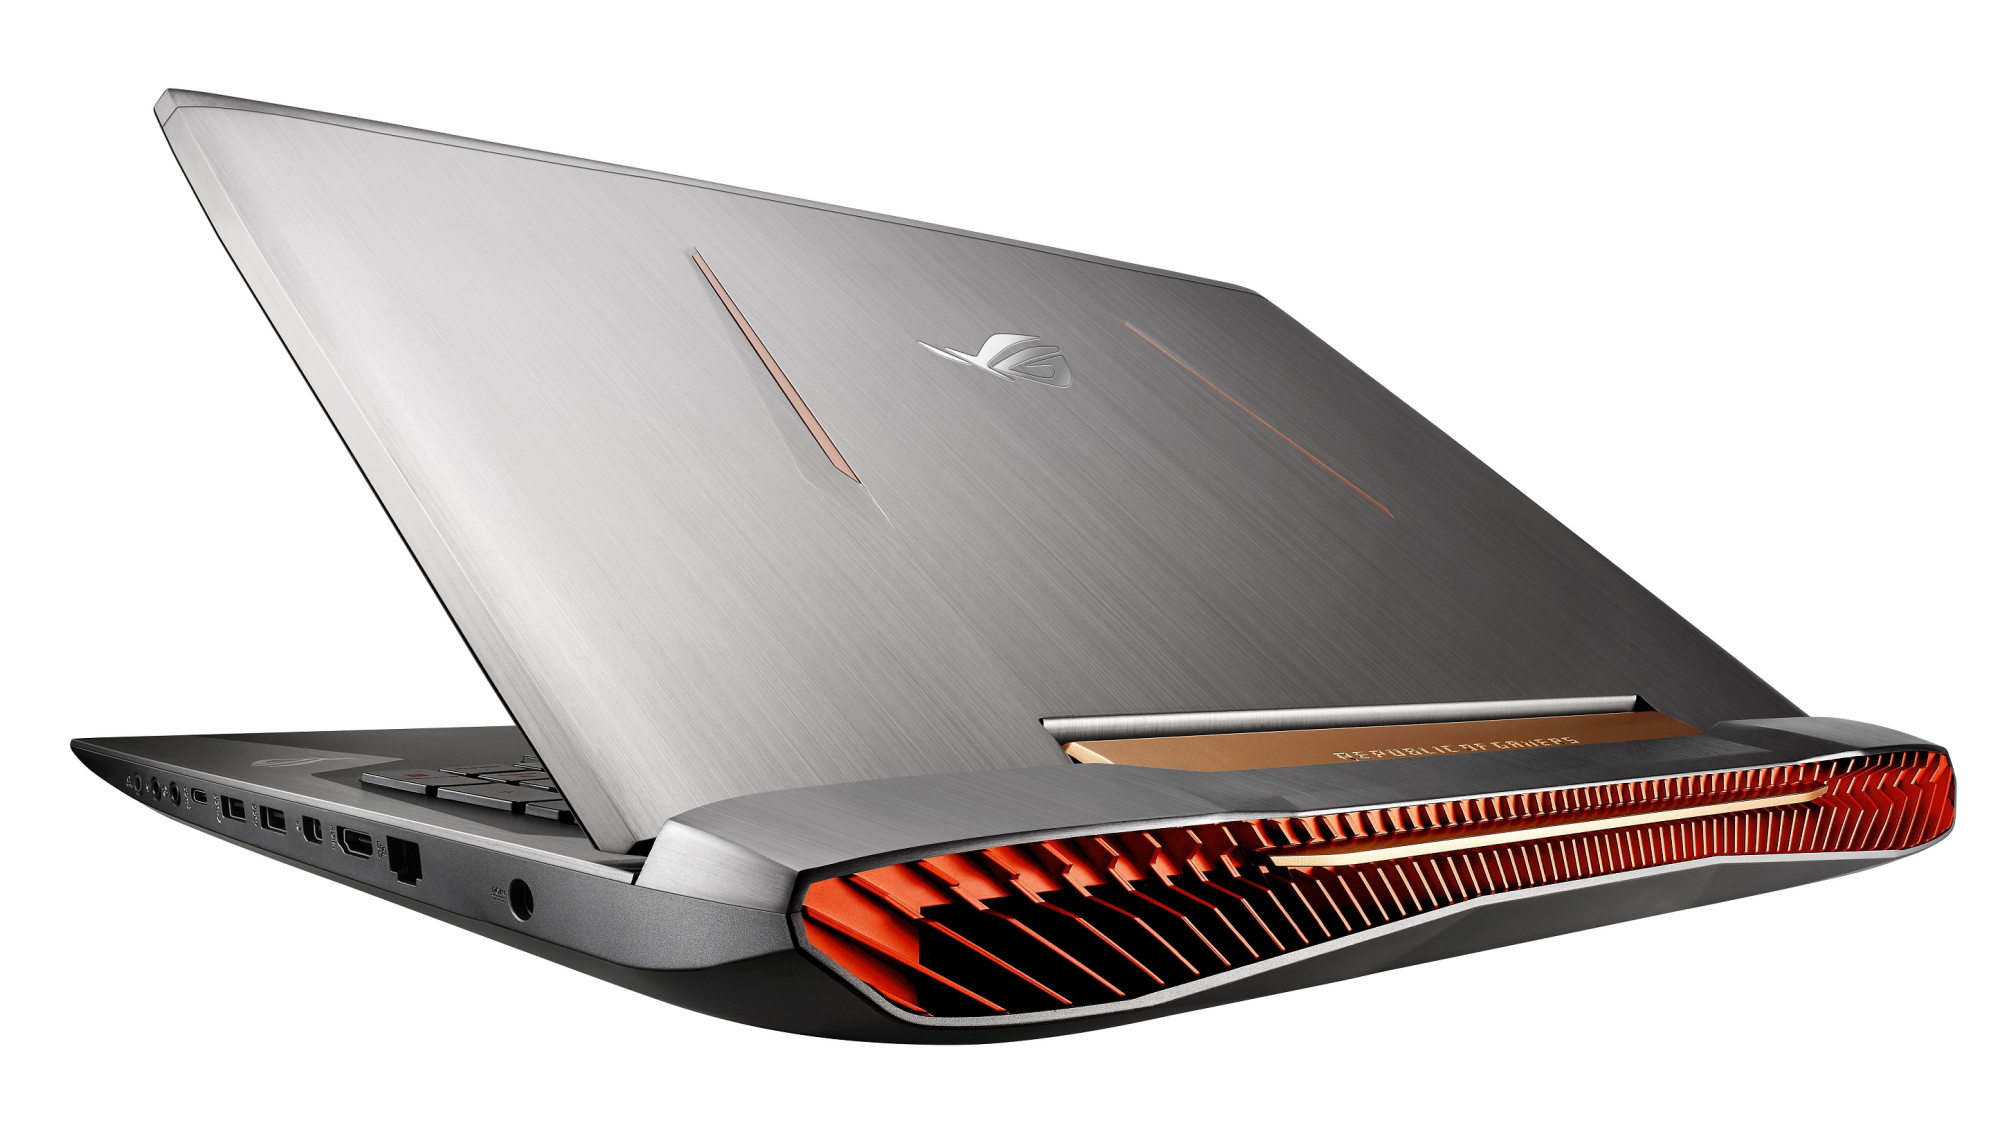
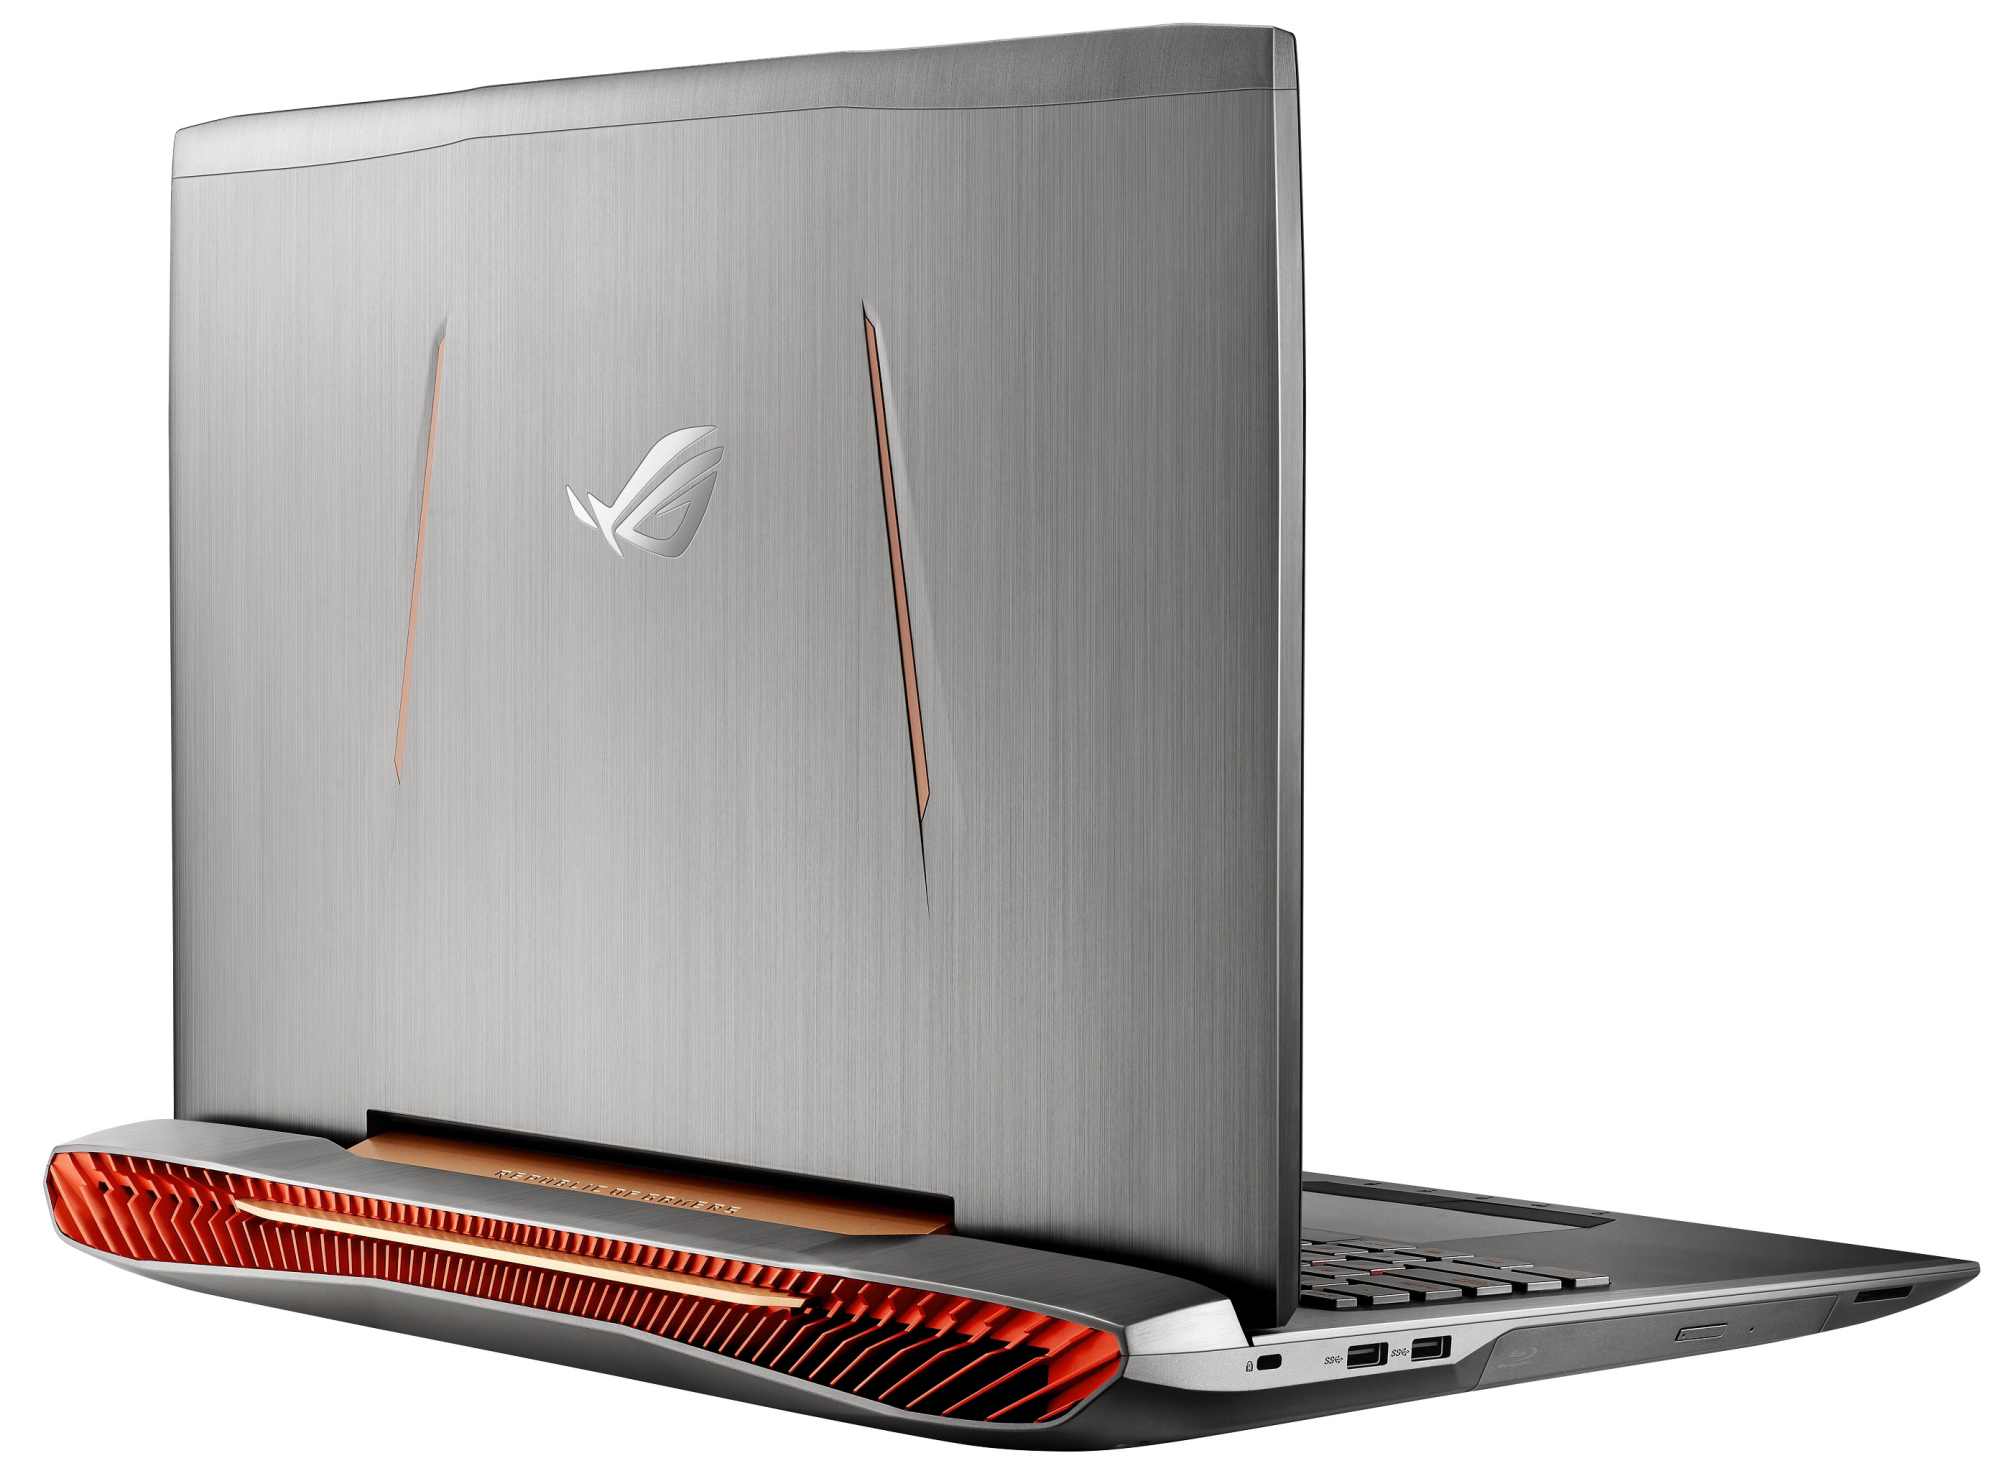
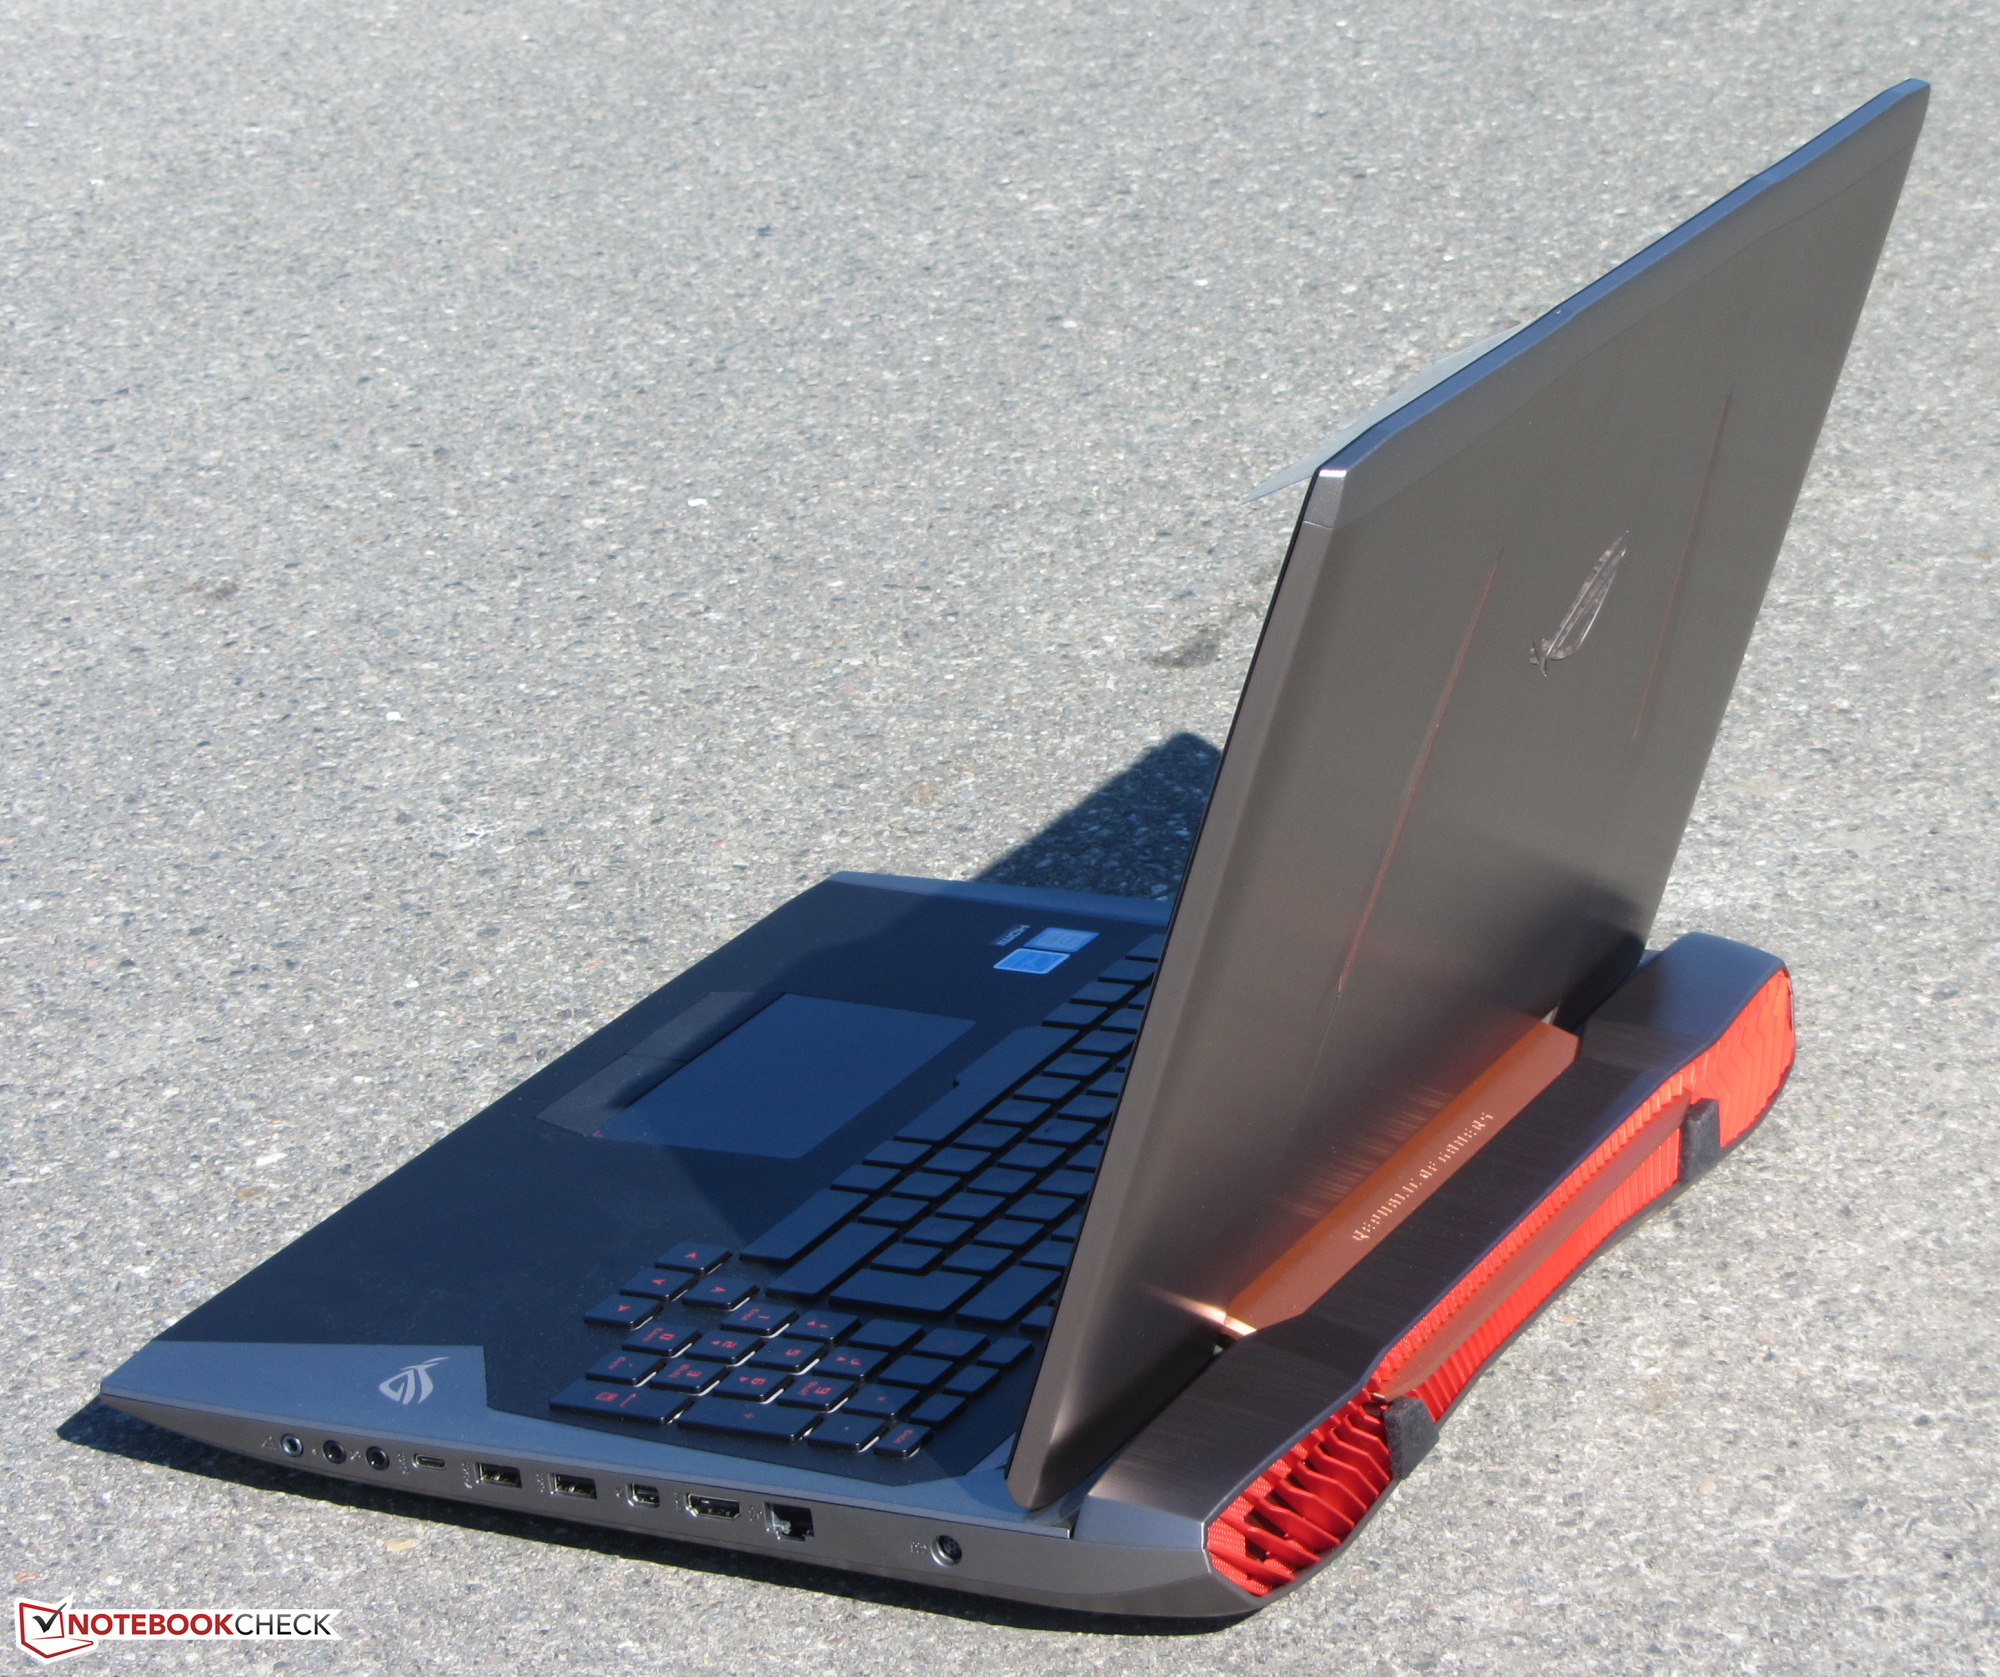
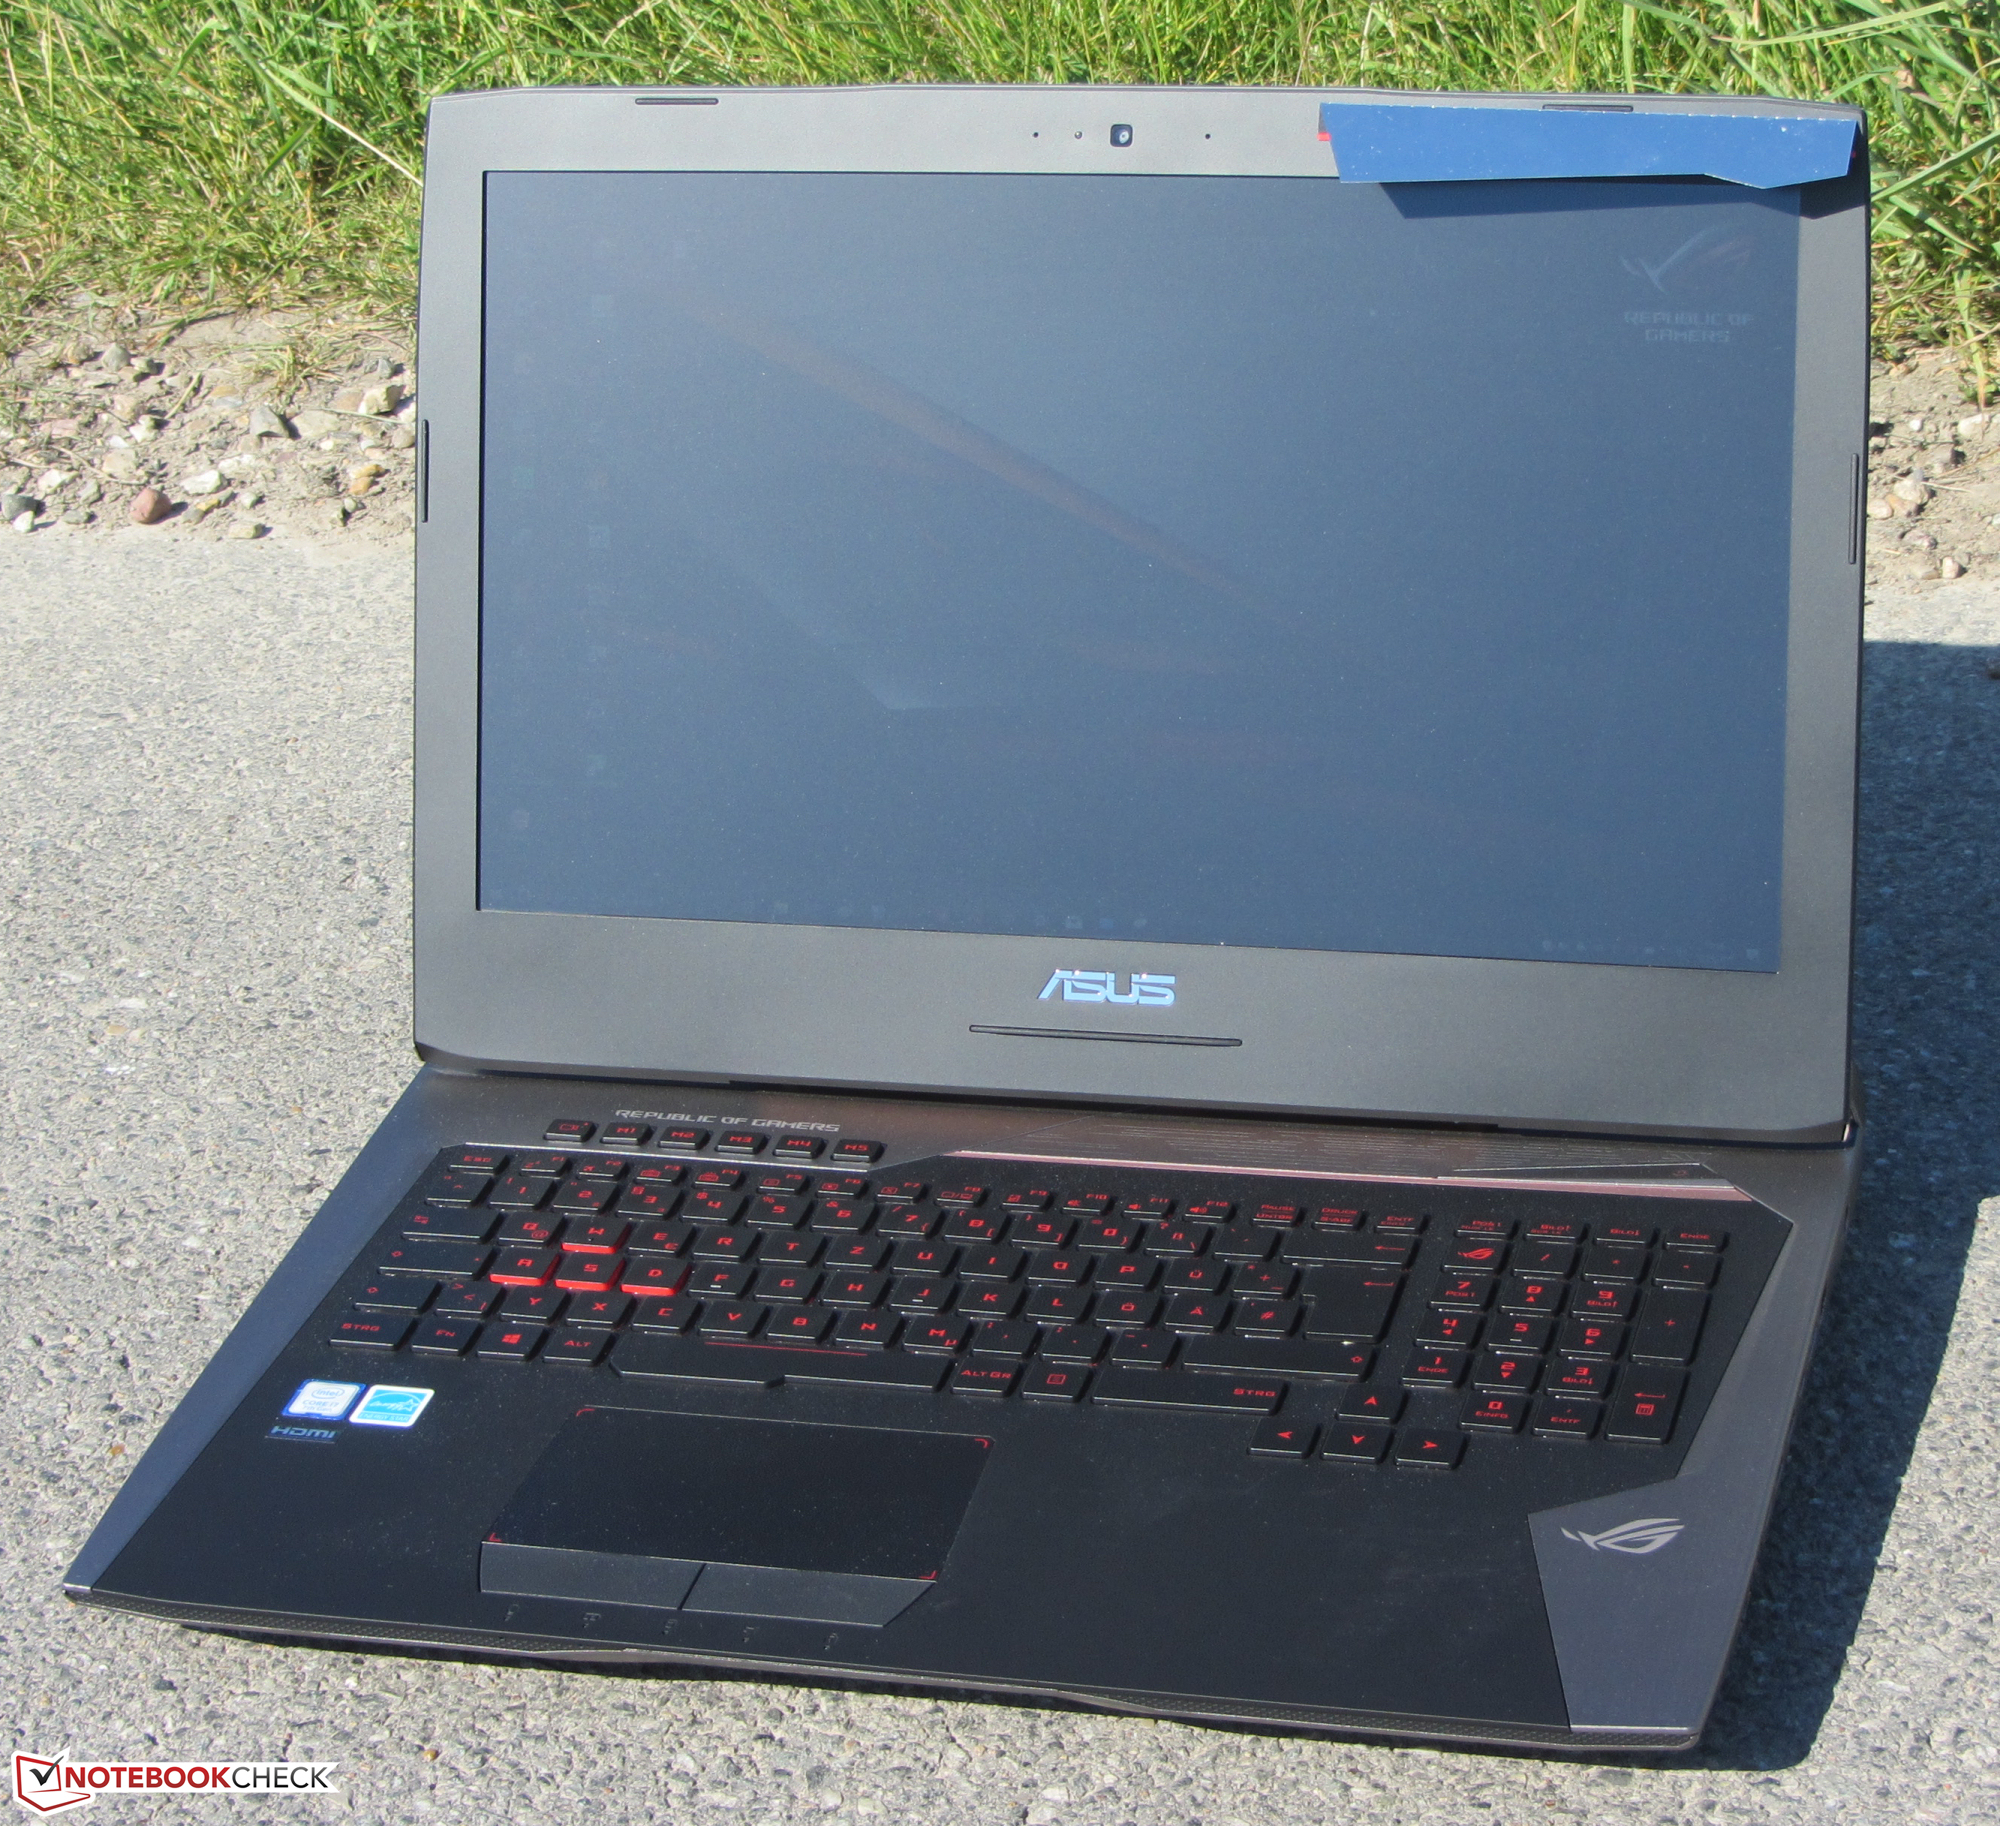
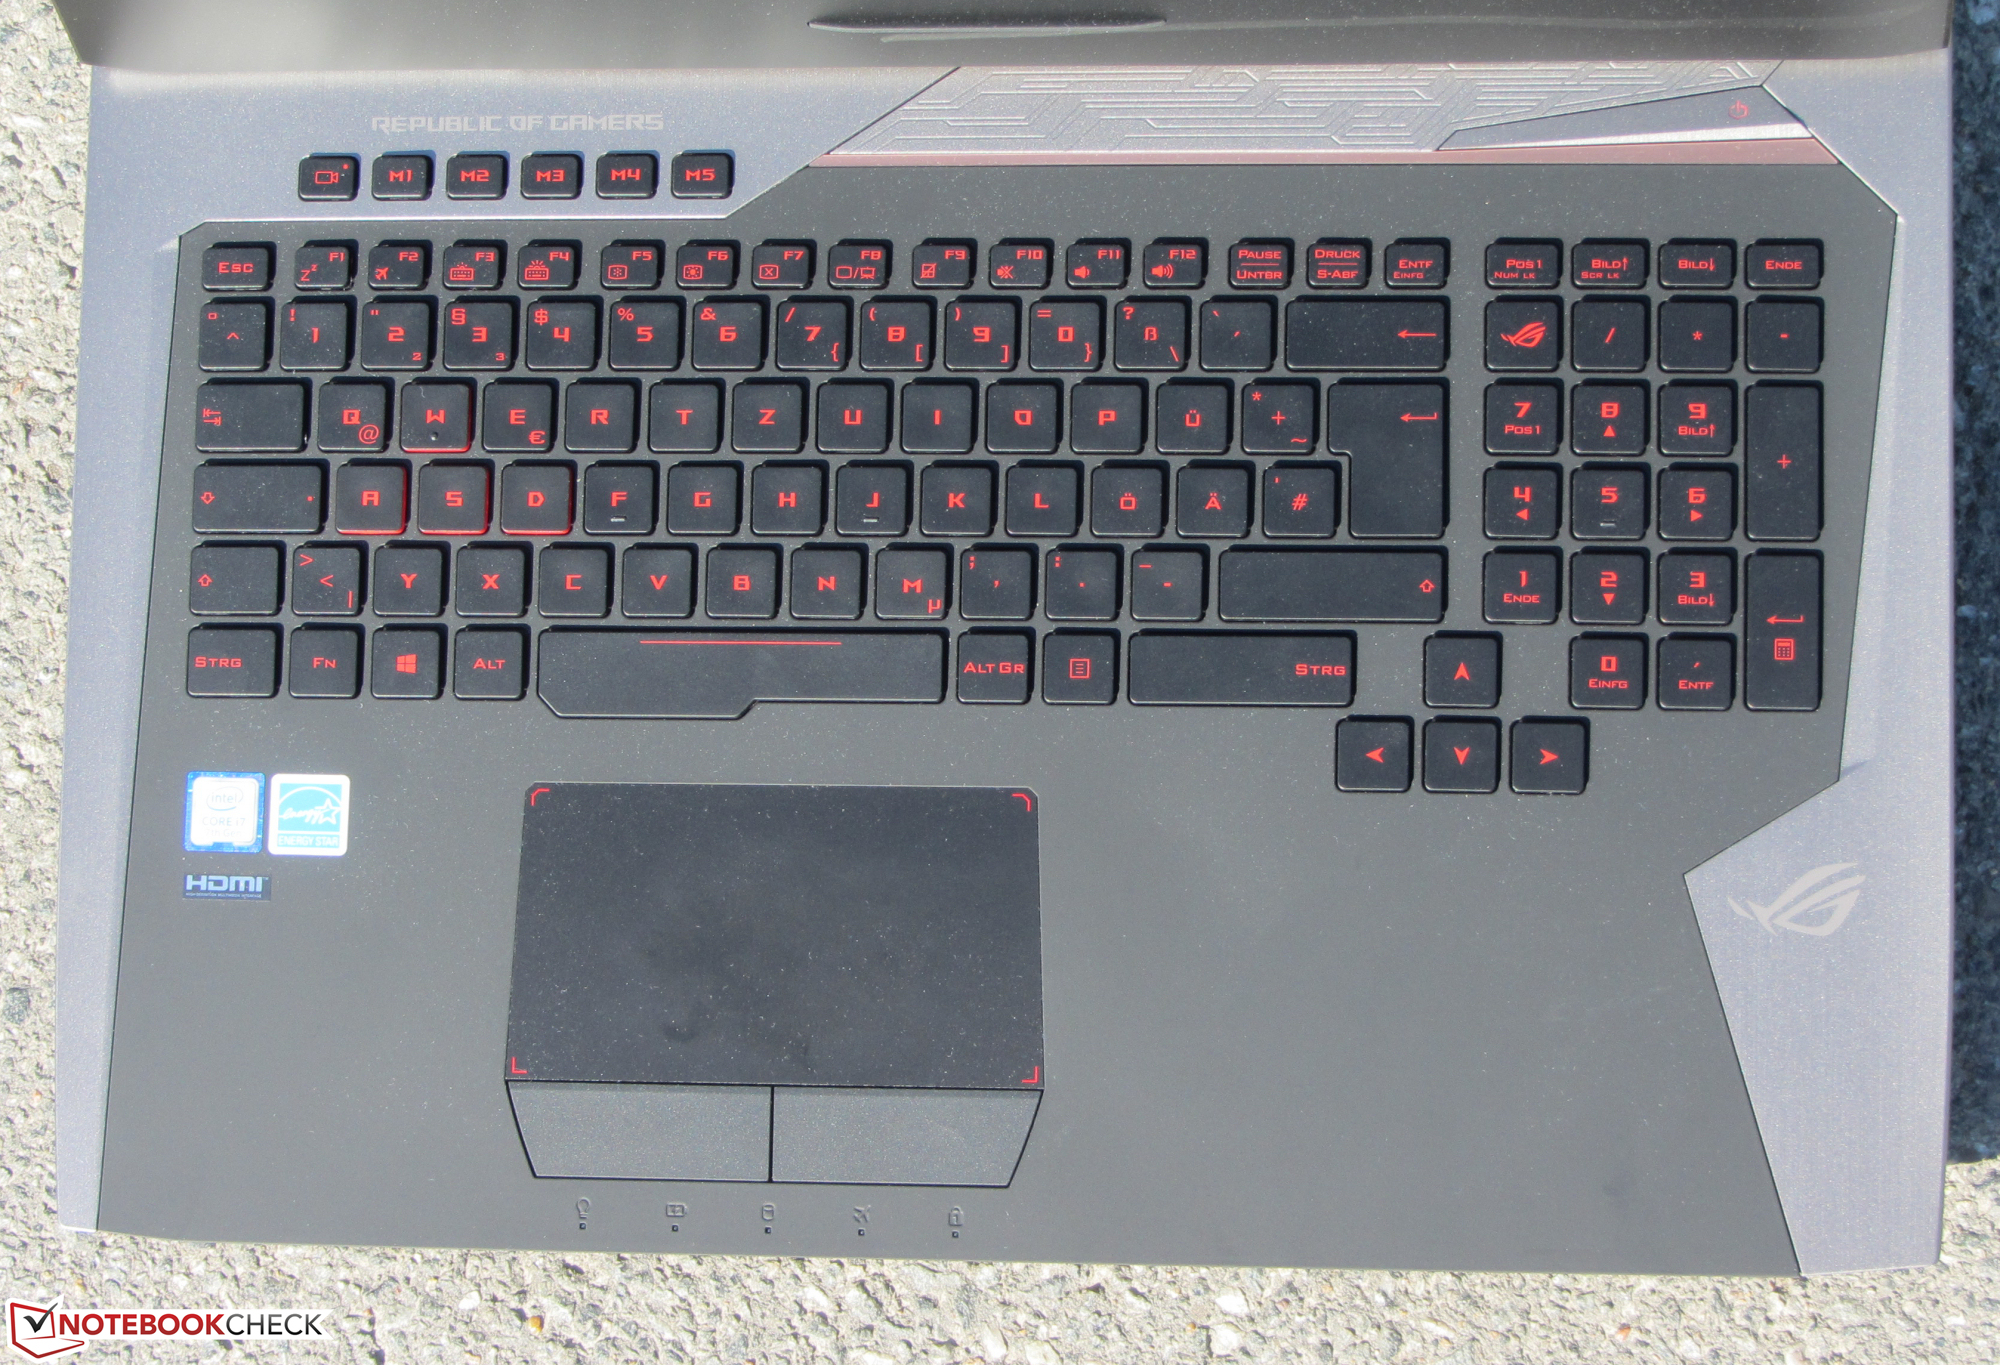
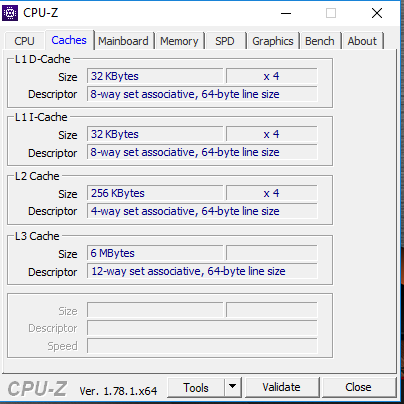
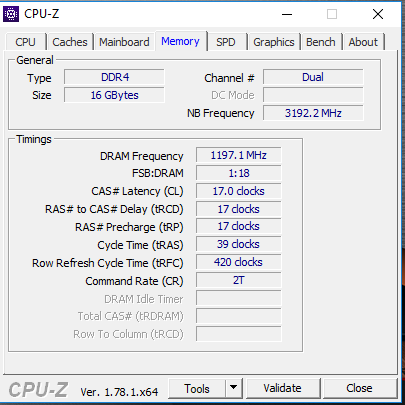
De geluidsproductie blijft ondanks de krachtige hardware beperkt. Dit geldt ook voor de warmte-ontwikkeling. Asus heeft het apparaat uitgerust met een snelle NVMe-SSD en er is een vrije aansluiting beschikbaar voor een tweede NVMe-SSD. Ook bevat het apparaat een conventionele HDD. Dankzij het onderhoudspaneel is het vervangen van opslagstations geen probleem.
Asus G752VS-BA338T
- 30-05-2017 v6 (old)
Sascha Mölck
Price comparison
