Kort testrapport Apple iMac Pro (Xeon W-2140B, Radeon Pro Vega 56)
| SD Card Reader | |
| average JPG Copy Test (av. of 3 runs) | |
| Dell Precision 5520 UHD (Toshiba Exceria Pro SDXC 64 GB UHS-II) | |
| Lenovo ThinkPad P71-20HK0004GE | |
| Apple iMac Pro (Toshiba Exceria Pro SDXC 64 GB UHS-II) | |
| maximum AS SSD Seq Read Test (1GB) | |
| Dell Precision 5520 UHD (Toshiba Exceria Pro SDXC 64 GB UHS-II) | |
| Lenovo ThinkPad P71-20HK0004GE | |
| Apple iMac Pro (Toshiba Exceria Pro SDXC 64 GB UHS-II) | |
| |||||||||||||||||||||||||
Helderheidsverdeling: 87 %
Contrast: 919:1 (Zwart: 0.54 cd/m²)
ΔE ColorChecker Calman: 3 | ∀{0.5-29.43 Ø4.72}
calibrated: 0.9
ΔE Greyscale Calman: 2.5 | ∀{0.09-98 Ø4.97}
100% sRGB (Argyll 1.6.3 3D)
79.4% AdobeRGB 1998 (Argyll 1.6.3 3D)
88.8% AdobeRGB 1998 (Argyll 3D)
100% sRGB (Argyll 3D)
99% Display P3 (Argyll 3D)
Gamma: 2.22
CCT: 6824 K
| Apple iMac Pro APPAE1E, , 5120x2880, 27" | Apple iMac Retina 5K 27 Late 2015 3.2 GHz M390 MK472D/A 5120x2880, 27" | Apple MacBook Pro 15 2017 (2.8 GHz, 555) APPA031, , 2880x1800, 15.4" | Lenovo ThinkPad P71-20HK0004GE LEN4123, VVX17P051J00, , 3840x2160, 17.3" | Dell Precision 5520 UHD SHP1476, , 3840x2160, 15.6" | Dell Precision 7720 SHP1446 (LQ173D1), , 3840x2160, 17.3" | HP ZBook 17 G4-Y3J82AV Sharp SHP144C, , 3840x2160, 17.3" | |
|---|---|---|---|---|---|---|---|
| Display | -0% | -1% | -18% | 0% | 0% | ||
| Display P3 Coverage (%) | 99 | 99.3 0% | 97.9 -1% | 67.4 -32% | 87.6 -12% | 88 -11% | |
| sRGB Coverage (%) | 100 | 100 0% | 99.9 0% | 98.5 -1% | 100 0% | 100 0% | |
| AdobeRGB 1998 Coverage (%) | 88.8 | 88.2 -1% | 85.9 -3% | 68.9 -22% | 99.2 12% | 99.6 12% | |
| Response Times | -6% | -69% | -26% | -108% | -122% | -96% | |
| Response Time Grey 50% / Grey 80% * (ms) | 30.4 ? | 30.4 ? -0% | 48 ? -58% | 39.2 ? -29% | 59.2 ? -95% | 60 ? -97% | 56.8 ? -87% |
| Response Time Black / White * (ms) | 18.8 ? | 20.8 ? -11% | 33.8 ? -80% | 23.2 ? -23% | 41.6 ? -121% | 46.4 ? -147% | 38.4 ? -104% |
| PWM Frequency (Hz) | 208.3 ? | 119000 ? | 1412 ? | 1020 ? | 1020 ? | ||
| Screen | -1% | 23% | 9% | -10% | -5% | 17% | |
| Brightness middle (cd/m²) | 496 | 429 -14% | 545 10% | 358 -28% | 372.4 -25% | 464 -6% | 391 -21% |
| Brightness (cd/m²) | 468 | 424 -9% | 523 12% | 338 -28% | 368 -21% | 441 -6% | 360 -23% |
| Brightness Distribution (%) | 87 | 95 9% | 86 -1% | 83 -5% | 90 3% | 89 2% | 87 0% |
| Black Level * (cd/m²) | 0.54 | 0.58 -7% | 0.44 19% | 0.31 43% | 0.48 11% | 0.45 17% | 0.35 35% |
| Contrast (:1) | 919 | 740 -19% | 1239 35% | 1155 26% | 776 -16% | 1031 12% | 1117 22% |
| Colorchecker dE 2000 * | 3 | 2.8 7% | 1.6 47% | 2.1 30% | 2.6 13% | 3.2 -7% | 1.3 57% |
| Colorchecker dE 2000 max. * | 5.8 | 3.8 34% | 3.6 38% | 5.6 3% | 6.1 -5% | 2.5 57% | |
| Colorchecker dE 2000 calibrated * | 0.9 | ||||||
| Greyscale dE 2000 * | 2.5 | 1.97 21% | 1.9 24% | 2 20% | 3.7 -48% | 4.2 -68% | 1.8 28% |
| Gamma | 2.22 99% | 2.13 103% | 2.26 97% | 2.16 102% | 2.14 103% | 2.01 109% | 2.11 104% |
| CCT | 6824 95% | 6889 94% | 6834 95% | 6216 105% | 7096 92% | 6736 96% | 6461 101% |
| Color Space (Percent of AdobeRGB 1998) (%) | 79.4 | 79 -1% | 77 -3% | 63 -21% | 88.1 11% | 87.9 11% | |
| Color Space (Percent of sRGB) (%) | 100 | 99.97 0% | 99.97 0% | 99 -1% | 100 0% | 100 0% | |
| Totaal Gemiddelde (Programma / Instellingen) | -2% /
-2% | -16% /
3% | -9% /
3% | -45% /
-25% | -42% /
-20% | -26% /
-2% |
* ... kleiner is beter
Responstijd Scherm
| ↔ Responstijd Zwart naar Wit | ||
|---|---|---|
| 18.8 ms ... stijging ↗ en daling ↘ gecombineerd | ↗ 11.2 ms stijging | 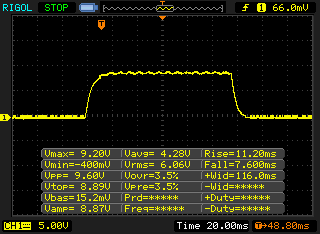 |
| ↘ 7.6 ms daling | ||
| Het scherm vertoonde prima responstijden in onze tests maar is misschien wat te traag voor competitieve games. Ter vergelijking: alle testtoestellen variëren van 0.1 (minimum) tot 240 (maximum) ms. » 42 % van alle toestellen zijn beter. Dit betekent dat de gemeten responstijd vergelijkbaar is met het gemiddelde (19.8 ms) van alle geteste toestellen. | ||
| ↔ Responstijd 50% Grijs naar 80% Grijs | ||
| 30.4 ms ... stijging ↗ en daling ↘ gecombineerd | ↗ 14 ms stijging | 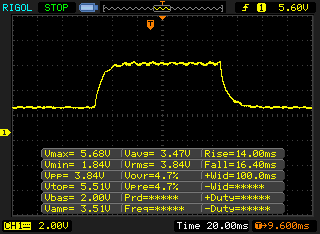 |
| ↘ 16.4 ms daling | ||
| Het scherm vertoonde trage responstijden in onze tests en is misschien te traag voor games. Ter vergelijking: alle testtoestellen variëren van 0.165 (minimum) tot 636 (maximum) ms. » 41 % van alle toestellen zijn beter. Dit betekent dat de gemeten responstijd vergelijkbaar is met het gemiddelde (31 ms) van alle geteste toestellen. | ||
Screen Flickering / PWM (Pulse-Width Modulation)
| Screen flickering / PWM waargenomen | 208.3 Hz | ≤ 50 % helderheid instelling | 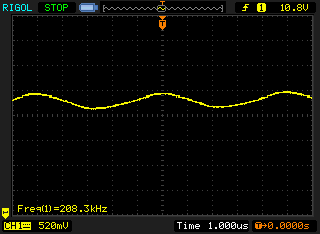 |
De achtergrondverlichting van het scherm flikkert op 208.3 Hz (in het slechtste geval, bijvoorbeeld bij gebruik van PWM) aan een helderheid van 50 % en lager. Boven deze helderheid zou er geen flickering / PWM mogen optreden. De frequentie van 208.3 Hz is redelijk laag en de meeste mensen die gevoelig zijn aan flickering kunnen dit dus waarnemen of geïrriteerde ogen krijgen (gebruikmakend van de vermelde helderheid en lager). Ter vergelijking: 52 % van alle geteste toestellen maakten geen gebruik van PWM om de schermhelderheid te verlagen. Als het wel werd gebruikt, werd een gemiddelde van 7763 (minimum: 5 - maximum: 343500) Hz waargenomen. | |||
| PCMark 8 Home Score Accelerated v2 | 4327 punten | |
| PCMark 8 Creative Score Accelerated v2 | 7689 punten | |
| PCMark 8 Work Score Accelerated v2 | 4614 punten | |
| PCMark 10 Score | 6050 punten | |
Help | ||

| SiSoft Sandra 2016 | |
| Image Processing | |
| Apple iMac Pro | |
| Dell Precision 7720 | |
| HP ZBook 17 G4-Y3J82AV | |
| Lenovo ThinkPad P71-20HK0004GE | |
| GP Cryptography (Higher Security AES256+SHA2-512) | |
| Apple iMac Pro | |
| HP ZBook 17 G4-Y3J82AV | |
| Dell Precision 7720 | |
| Lenovo ThinkPad P71-20HK0004GE | |
| GP Financial Analysis (FP High/Double Precision) | |
| Dell Precision 7720 | |
| HP ZBook 17 G4-Y3J82AV | |
| Apple iMac Pro | |
| Lenovo ThinkPad P71-20HK0004GE | |
| 3DMark 06 Standard Score | 35787 punten | |
| 3DMark 11 Performance | 20785 punten | |
| 3DMark Fire Strike Score | 15302 punten | |
| 3DMark Time Spy Score | 5831 punten | |
Help | ||
| lage | gem. | hoge | ultra | 4K | |
|---|---|---|---|---|---|
| The Witcher 3 (2015) | 115.7 | 63.9 | 41.6 | ||
| Dota 2 Reborn (2015) | 112 | 107.4 | 102.3 | 95.8 | |
| Rainbow Six Siege (2015) | 198.7 | 135.7 | 70.2 | ||
| Rise of the Tomb Raider (2016) | 94 | 74.8 | 39.3 | ||
| For Honor (2017) | 142.6 | 134.9 | 105.6 | 43.6 | |
| Ghost Recon Wildlands (2017) | 81.7 | 76 | 45.1 | 34.7 | |
| Assassin´s Creed Origins (2017) | 70 | 65 | 57 | 33 |
Geluidsniveau
| Onbelast |
| 29.8 / 29.8 / 29.8 dB (A) |
| Belasting |
| 39.7 / 47.9 dB (A) |
 | ||
30 dB stil 40 dB(A) hoorbaar 50 dB(A) luid |
||
min: | ||
(+) De maximumtemperatuur aan de bovenzijde bedraagt 31.2 °C / 88 F, vergeleken met het gemiddelde van 33.9 °C / 93 F, variërend van 25 tot 47 °C voor de klasse Desktop.
(-) De bodem warmt op tot een maximum van 46.1 °C / 115 F, vergeleken met een gemiddelde van 33.6 °C / 92 F
(+) Bij onbelast gebruik bedraagt de gemiddelde temperatuur voor de bovenzijde 24.2 °C / 76 F, vergeleken met het apparaatgemiddelde van 29.5 °C / 85 F.
Apple iMac Pro audioanalyse
(+) | luidsprekers kunnen relatief luid spelen (86.1 dB)
Bas 100 - 315 Hz
(+) | goede baars - slechts 3.5% verwijderd van de mediaan
(±) | lineariteit van de lage tonen is gemiddeld (7.6% delta ten opzichte van de vorige frequentie)
Midden 400 - 2000 Hz
(+) | evenwichtige middens - slechts 1.7% verwijderd van de mediaan
(+) | de middentonen zijn lineair (4.1% delta ten opzichte van de vorige frequentie)
Hoog 2 - 16 kHz
(±) | lagere maxima - gemiddeld 8.2% lager dan de mediaan
(+) | de hoge tonen zijn lineair (4.8% delta naar de vorige frequentie)
Algemeen 100 - 16.000 Hz
(+) | het totale geluid is lineair (9.2% verschil met de mediaan)
Vergeleken met dezelfde klasse
» 33% van alle geteste apparaten in deze klasse waren beter, 11% vergelijkbaar, 56% slechter
» De beste had een delta van 6%, het gemiddelde was 16%, de slechtste was 46%
Vergeleken met alle geteste toestellen
» 3% van alle geteste apparaten waren beter, 1% gelijk, 96% slechter
» De beste had een delta van 4%, het gemiddelde was 23%, de slechtste was 134%
Apple MacBook 12 (Early 2016) 1.1 GHz audioanalyse
(+) | luidsprekers kunnen relatief luid spelen (83.6 dB)
Bas 100 - 315 Hz
(±) | verminderde zeebaars - gemiddeld 11.3% lager dan de mediaan
(±) | lineariteit van de lage tonen is gemiddeld (14.2% delta ten opzichte van de vorige frequentie)
Midden 400 - 2000 Hz
(+) | evenwichtige middens - slechts 2.4% verwijderd van de mediaan
(+) | de middentonen zijn lineair (5.5% delta ten opzichte van de vorige frequentie)
Hoog 2 - 16 kHz
(+) | evenwichtige hoogtepunten - slechts 2% verwijderd van de mediaan
(+) | de hoge tonen zijn lineair (4.5% delta naar de vorige frequentie)
Algemeen 100 - 16.000 Hz
(+) | het totale geluid is lineair (10.2% verschil met de mediaan)
Vergeleken met dezelfde klasse
» 7% van alle geteste apparaten in deze klasse waren beter, 2% vergelijkbaar, 91% slechter
» De beste had een delta van 5%, het gemiddelde was 18%, de slechtste was 53%
Vergeleken met alle geteste toestellen
» 5% van alle geteste apparaten waren beter, 1% gelijk, 94% slechter
» De beste had een delta van 4%, het gemiddelde was 23%, de slechtste was 134%
| Uit / Standby | |
| Inactief | |
| Belasting |
|
Key:
min: | |
Pro
Contra
Voor het volledige, Engelse testrapport, klik hier.
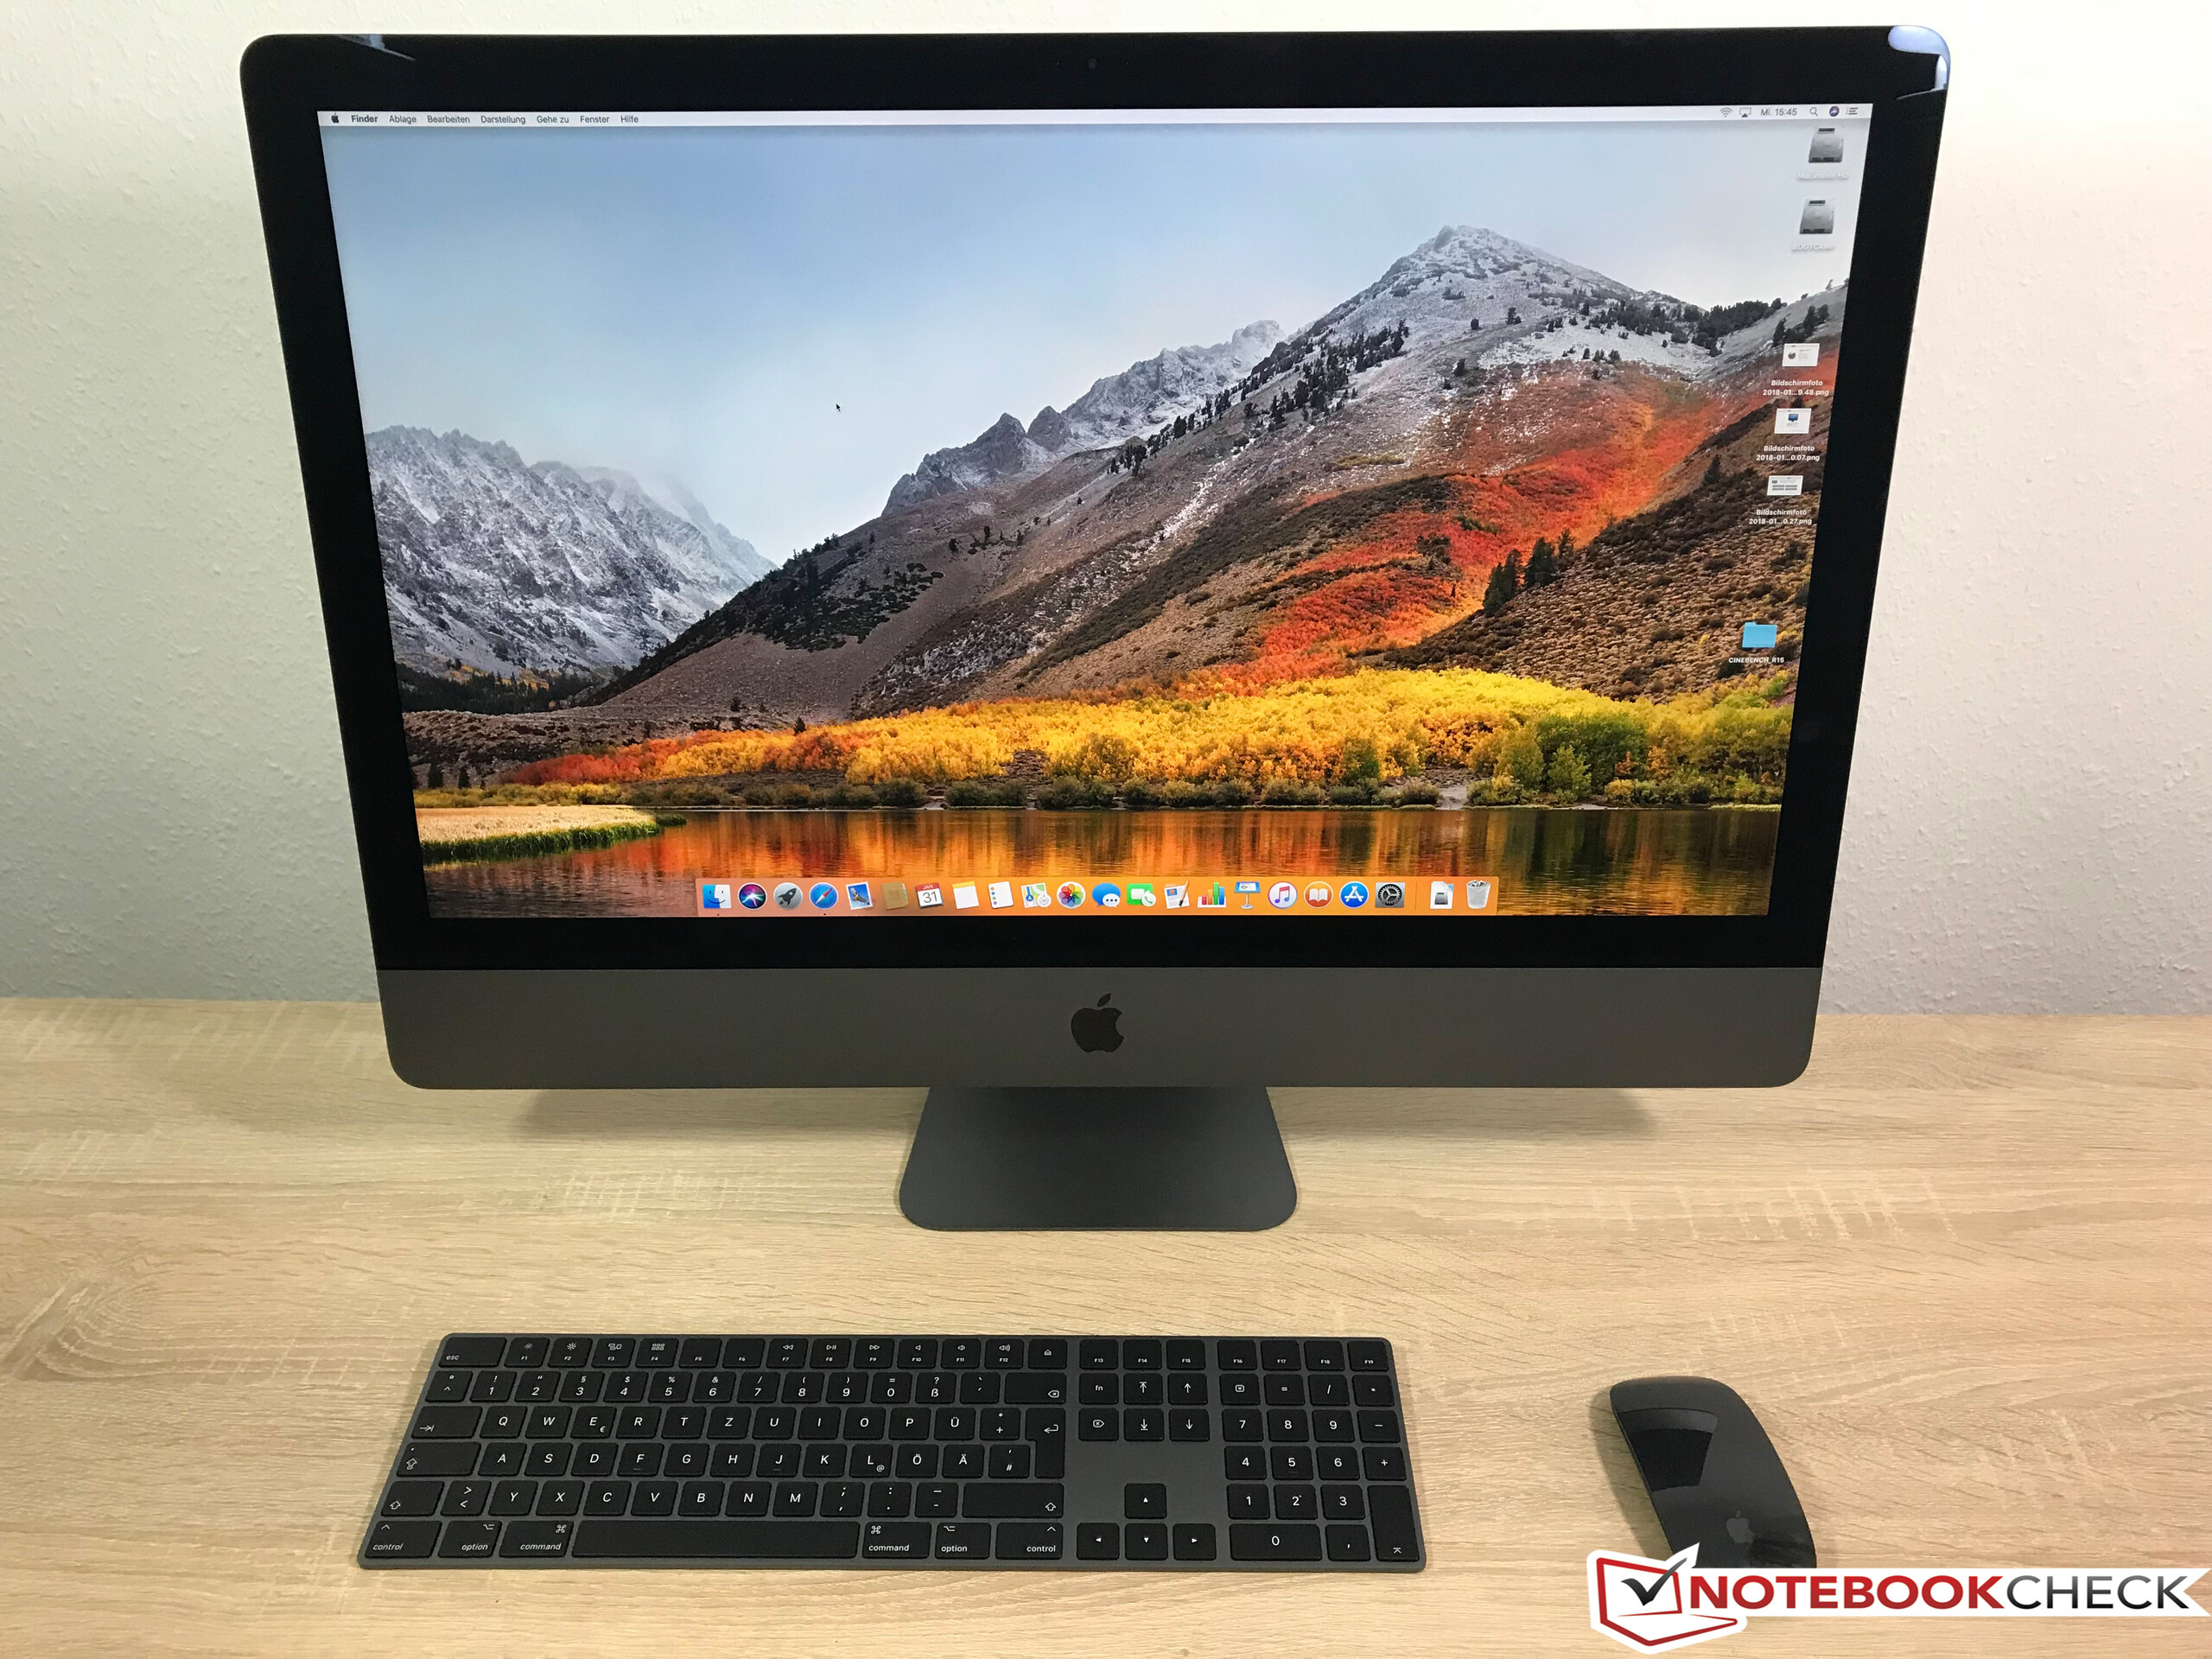
Heb je echt een iMac Pro nodig of volstaat een normale iMac? Als deze vraag in je hoofd speelt, heb je waarschijnlijk de Pro versie niet nodig. De professionele hardware is namelijk bedoeld voor een zeer specifieke doelgroep. Alle extra cores van de Xeon CPU's moeten gebruikt worden om het apparaat sneller te laten zijn. Dit geldt ook voor de grafische kaart. Is dat niet het geval, dan raden wij de reguliere 5K iMac aan, die veel betaalbaarder is en hetzelfde beeldscherm biedt.
Maar de iMac Pro is toch geen echt overtuigend werkstation. Ja, de prestaties zijn zeer goed, maar het koelsysteem heeft al problemen met de minst krachtige configuratie. Ook kan het beeldscherm al vanuit de fabriek beter gekalibreerd zijn en heb je een extern beeldscherm nodig om grafisch werk in de AdobeRGB kleurenruimte te verrichten. Andere nadelen voor een professioneel systeem zijn de beperkte onderhoudsmogelijkheden en service-opties. Als je op een bepaald systeem vertrouwt voor je werk, zal je hoogstwaarschijnlijk extra service aanschaffen. Andere fabrikanten zoals Dell, HP en Lenovo hebben in dit opzicht duidelijk een voordeel.
De instapprijs is hoog, maar zeker niet uitzonderlijk gezien de geïntegreerde hardware. De Intel Xeon processor alleen al kost meer dan $1100, maar we begrijpen de exorbitante meerprijzen voor extra RAM en opslagruimte niet. De iMac Pro heeft zeker een bepaalde aantrekkingskracht en presteert goed, maar het is niet de juiste keuze voor alle professionele gebruikers.
Apple iMac Pro
- 27-06-2018 v6 (old)
Andreas Osthoff
Price comparison
