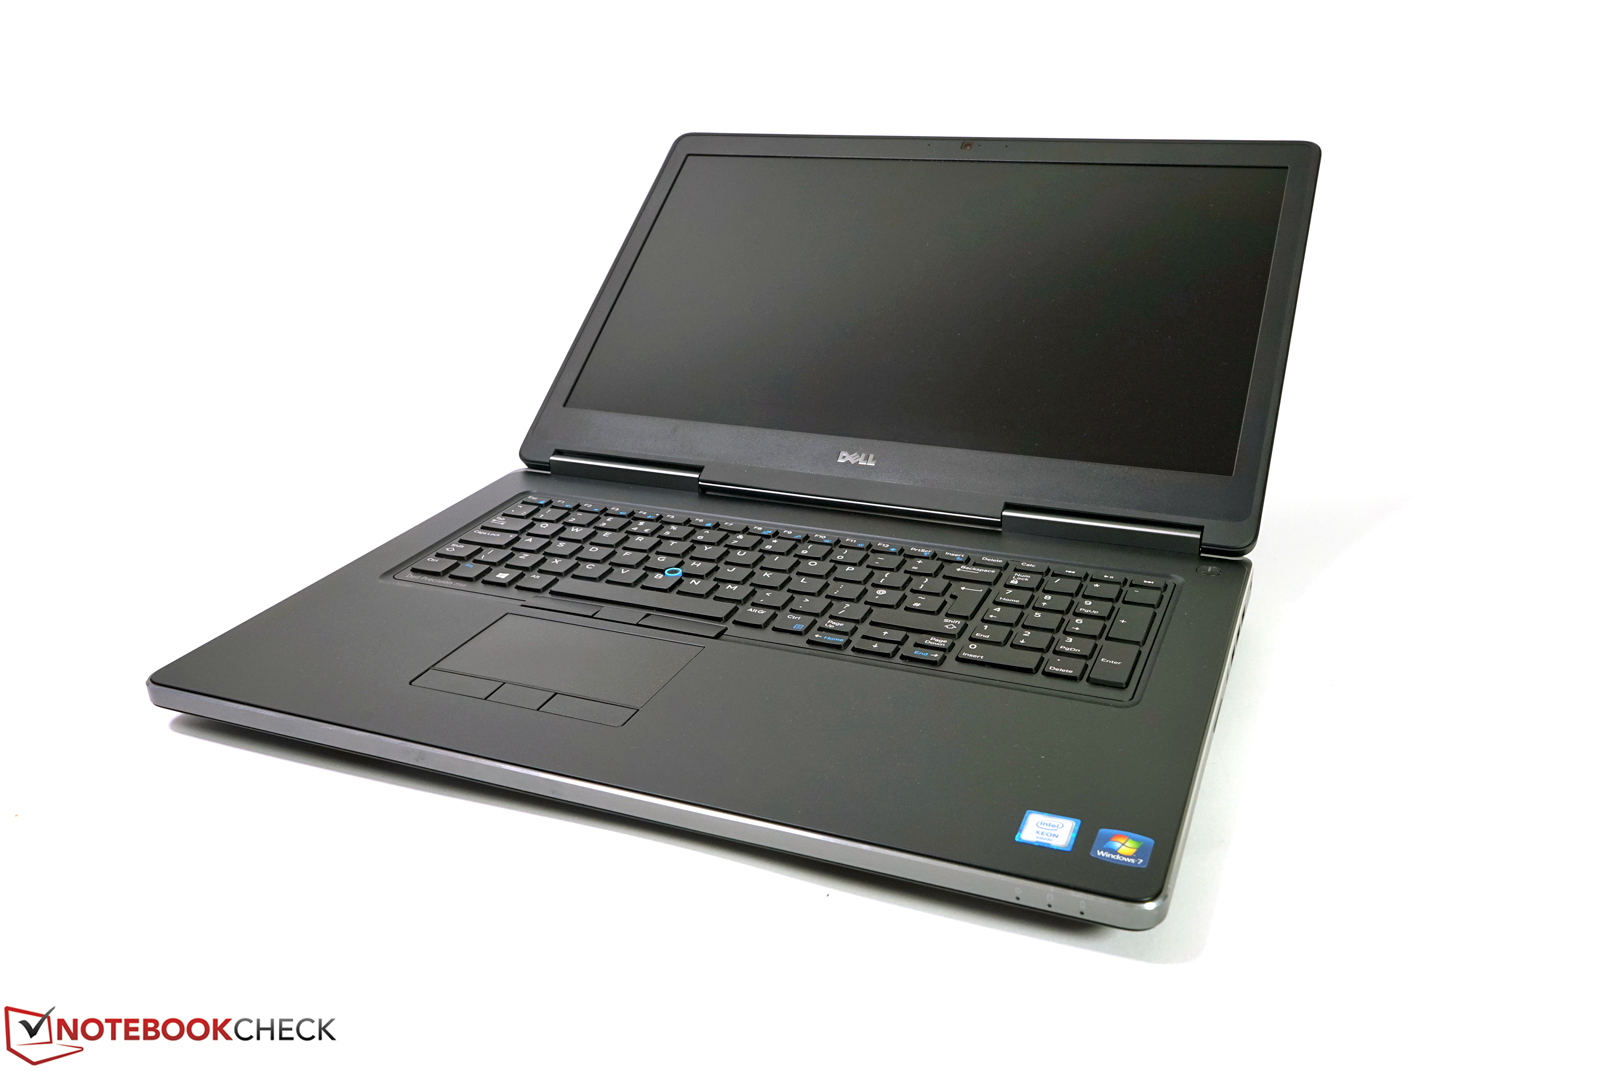
Kort testrapport Dell Precision 7720 (Xeon, P5000, 4K) Workstation
Screen Flickering / PWM (Pulse-Width Modulation)
| Screen flickering / PWM waargenomen | 1020 Hz | ≤ 20 % helderheid instelling | 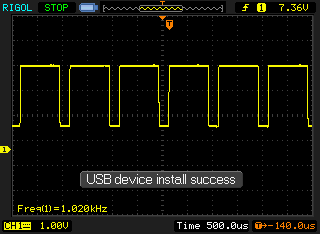 |
De achtergrondverlichting van het scherm flikkert op 1020 Hz (in het slechtste geval, bijvoorbeeld bij gebruik van PWM) aan een helderheid van 20 % en lager. Boven deze helderheid zou er geen flickering / PWM mogen optreden. De frequentie van 1020 Hz is redelijk hoog en de meeste mensen die gevoelig zijn aan flickering zouden dit dus niet mogen waarnemen of geïrriteerde ogen krijgen. Ter vergelijking: 52 % van alle geteste toestellen maakten geen gebruik van PWM om de schermhelderheid te verlagen. Als het wel werd gebruikt, werd een gemiddelde van 7798 (minimum: 5 - maximum: 343500) Hz waargenomen. | |||
| |||||||||||||||||||||||||
Helderheidsverdeling: 89 %
Helderheid in Batterij-modus: 462 cd/m²
Contrast: 1031:1 (Zwart: 0.45 cd/m²)
ΔE ColorChecker Calman: 3.2 | ∀{0.5-29.43 Ø4.73}
ΔE Greyscale Calman: 4.2 | ∀{0.09-98 Ø4.97}
100% sRGB (Argyll 1.6.3 3D)
88.1% AdobeRGB 1998 (Argyll 1.6.3 3D)
99.2% AdobeRGB 1998 (Argyll 3D)
100% sRGB (Argyll 3D)
87.6% Display P3 (Argyll 3D)
Gamma: 2.01
CCT: 6736 K
| Dell Precision 7720 SHP1446 (LQ173D1), , 3840x2160, 17.3" | Lenovo ThinkPad P71-20HK0004GE LEN4123, VVX17P051J00, , 3840x2160, 17.3" | HP ZBook 17 G4-Y3J82AV Sharp SHP144C, , 3840x2160, 17.3" | MSI WE72 7RJ LP173WF4-SPF1, , 1920x1080, 17.3" | Fujitsu Celsius H970 LP173WF4-SPF3, , 1920x1080, 17.3" | Dell Precision 7710 SDC8151, VHN17_173HL, , 1920x1080, 17.3" | |
|---|---|---|---|---|---|---|
| Display | 0% | -25% | -26% | -19% | ||
| Display P3 Coverage (%) | 87.6 | 88 0% | 67.4 -23% | 66.8 -24% | 66.6 -24% | |
| sRGB Coverage (%) | 100 | 100 0% | 85.3 -15% | 84.6 -15% | 96.9 -3% | |
| AdobeRGB 1998 Coverage (%) | 99.2 | 99.6 0% | 62.4 -37% | 61.8 -38% | 68.6 -31% | |
| Response Times | 43% | 11% | 34% | 45% | 20% | |
| Response Time Grey 50% / Grey 80% * (ms) | 60 ? | 39.2 ? 35% | 56.8 ? 5% | 45.2 ? 25% | 32 ? 47% | 50 ? 17% |
| Response Time Black / White * (ms) | 46.4 ? | 23.2 ? 50% | 38.4 ? 17% | 26.4 ? 43% | 26.4 ? 43% | 36 ? 22% |
| PWM Frequency (Hz) | 1020 ? | 1412 ? | 1020 ? | 198 ? | ||
| Screen | 10% | 17% | -33% | -28% | -7% | |
| Brightness middle (cd/m²) | 464 | 358 -23% | 391 -16% | 302 -35% | 368 -21% | 332 -28% |
| Brightness (cd/m²) | 441 | 338 -23% | 360 -18% | 306 -31% | 360 -18% | 307 -30% |
| Brightness Distribution (%) | 89 | 83 -7% | 87 -2% | 93 4% | 91 2% | 83 -7% |
| Black Level * (cd/m²) | 0.45 | 0.31 31% | 0.35 22% | 0.31 31% | 0.3 33% | 0.33 27% |
| Contrast (:1) | 1031 | 1155 12% | 1117 8% | 974 -6% | 1227 19% | 1006 -2% |
| Colorchecker dE 2000 * | 3.2 | 2.1 34% | 1.3 59% | 6.2 -94% | 6.4 -100% | 3 6% |
| Colorchecker dE 2000 max. * | 6.1 | 3.6 41% | 2.5 59% | 10.6 -74% | 10.1 -66% | |
| Greyscale dE 2000 * | 4.2 | 2 52% | 1.8 57% | 7.3 -74% | 7.2 -71% | 4 5% |
| Gamma | 2.01 109% | 2.16 102% | 2.11 104% | 2.08 106% | 2.02 109% | 2 110% |
| CCT | 6736 96% | 6216 105% | 6461 101% | 7020 93% | 6882 94% | 7089 92% |
| Color Space (Percent of AdobeRGB 1998) (%) | 88.1 | 77 -13% | 87.9 0% | 56 -36% | 55.5 -37% | 62 -30% |
| Color Space (Percent of sRGB) (%) | 100 | 99.97 0% | 100 0% | 85.2 -15% | 84.4 -16% | 97 -3% |
| Totaal Gemiddelde (Programma / Instellingen) | 27% /
16% | 9% /
13% | -8% /
-22% | -3% /
-17% | -2% /
-6% |
* ... kleiner is beter
Responstijd Scherm
| ↔ Responstijd Zwart naar Wit | ||
|---|---|---|
| 46.4 ms ... stijging ↗ en daling ↘ gecombineerd | ↗ 28.4 ms stijging | 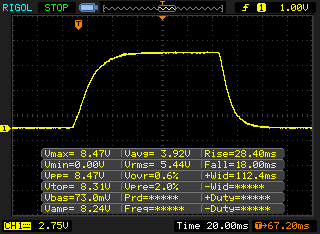 |
| ↘ 18 ms daling | ||
| Het scherm vertoonde trage responstijden in onze tests en is misschien te traag voor games. Ter vergelijking: alle testtoestellen variëren van 0.1 (minimum) tot 240 (maximum) ms. » 99 % van alle toestellen zijn beter. Dit betekent dat de gemeten responstijd slechter is dan het gemiddelde (19.9 ms) van alle geteste toestellen. | ||
| ↔ Responstijd 50% Grijs naar 80% Grijs | ||
| 60 ms ... stijging ↗ en daling ↘ gecombineerd | ↗ 26.8 ms stijging | 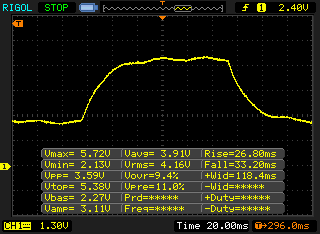 |
| ↘ 33.2 ms daling | ||
| Het scherm vertoonde trage responstijden in onze tests en is misschien te traag voor games. Ter vergelijking: alle testtoestellen variëren van 0.165 (minimum) tot 636 (maximum) ms. » 96 % van alle toestellen zijn beter. Dit betekent dat de gemeten responstijd slechter is dan het gemiddelde (31.1 ms) van alle geteste toestellen. | ||
| PCMark 8 | |
| Home Score Accelerated v2 | |
| Dell Precision 7710 | |
| HP ZBook 17 G4-Y3J82AV | |
| MSI WE72 7RJ | |
| Dell Precision 7720 | |
| Lenovo ThinkPad P71-20HK0004GE | |
| Work Score Accelerated v2 | |
| Dell Precision 7710 | |
| Fujitsu Celsius H970 | |
| MSI WE72 7RJ | |
| HP ZBook 17 G4-Y3J82AV | |
| Dell Precision 7720 | |
| Creative Score Accelerated v2 | |
| HP ZBook 17 G4-Y3J82AV | |
| Fujitsu Celsius H970 | |
| Lenovo ThinkPad P71-20HK0004GE | |
| Dell Precision 7710 | |
| Dell Precision 7720 | |
| PCMark 10 - Score | |
| HP ZBook 17 G4-Y3J82AV | |
| Dell Precision 7720 | |
| Fujitsu Celsius H970 | |
| PCMark 8 Home Score Accelerated v2 | 3772 punten | |
| PCMark 8 Creative Score Accelerated v2 | 5498 punten | |
| PCMark 8 Work Score Accelerated v2 | 4460 punten | |
| PCMark 10 Score | 5248 punten | |
Help | ||

| SiSoft Sandra 2016 | |
| Image Processing | |
| Dell Precision 7720 | |
| HP ZBook 17 G4-Y3J82AV | |
| Dell Precision 7710 | |
| Lenovo ThinkPad P71-20HK0004GE | |
| GP Cryptography (Higher Security AES256+SHA2-512) | |
| HP ZBook 17 G4-Y3J82AV | |
| Dell Precision 7720 | |
| Lenovo ThinkPad P71-20HK0004GE | |
| Dell Precision 7710 | |
| GP Financial Analysis (FP High/Double Precision) | |
| Dell Precision 7720 | |
| HP ZBook 17 G4-Y3J82AV | |
| Dell Precision 7710 | |
| Lenovo ThinkPad P71-20HK0004GE | |
| Unigine Heaven 4.0 | |
| Extreme Preset DX11 | |
| Schenker XMG U507 2017 | |
| Asus Zephyrus GX501 | |
| Dell Precision 7720 | |
| HP ZBook 17 G4-Y3J82AV | |
| Lenovo ThinkPad P71-20HK0004GE | |
| MSI WE72 7RJ | |
| Extreme Preset OpenGL | |
| Dell Precision 7720 | |
| HP ZBook 17 G4-Y3J82AV | |
| Lenovo ThinkPad P71-20HK0004GE | |
| MSI WE72 7RJ | |
| Unigine Valley 1.0 | |
| 1920x1080 Extreme HD DirectX AA:x8 | |
| HP ZBook 17 G4-Y3J82AV | |
| Dell Precision 7720 | |
| Lenovo ThinkPad P71-20HK0004GE | |
| MSI WT72-6QM | |
| Dell Precision 7710 | |
| MSI WE72 7RJ | |
| 1920x1080 Extreme HD Preset OpenGL AA:x8 | |
| HP ZBook 17 G4-Y3J82AV | |
| Dell Precision 7720 | |
| Lenovo ThinkPad P71-20HK0004GE | |
| Dell Precision 7710 | |
| MSI WE72 7RJ | |
| 3DMark 11 Performance | 16158 punten | |
| 3DMark Ice Storm Standard Score | 58131 punten | |
| 3DMark Cloud Gate Standard Score | 28999 punten | |
| 3DMark Fire Strike Score | 12298 punten | |
| 3DMark Time Spy Score | 4823 punten | |
Help | ||
| lage | gem. | hoge | ultra | 4K | |
|---|---|---|---|---|---|
| The Witcher 3 (2015) | 53.4 | 36 | |||
| Star Wars Battlefront (2015) | 118.5 | 44 | |||
| Rainbow Six Siege (2015) | 55.6 | ||||
| Rise of the Tomb Raider (2016) | 97.9 | 84 | 35.8 | ||
| Battlefield 1 (2016) | 40.8 | ||||
| For Honor (2017) | 127.9 | 121.1 | 95.1 | 37.6 | |
| Ghost Recon Wildlands (2017) | 83.9 | 76.5 | 42.8 | 27.5 | |
| Prey (2017) | 125.2 | 47.8 |
Geluidsniveau
| Onbelast |
| 29.5 / 29.5 / 29.5 dB (A) |
| Belasting |
| 35 / 47.8 dB (A) |
 | ||
30 dB stil 40 dB(A) hoorbaar 50 dB(A) luid |
||
min: | ||
| Dell Precision 7720 Quadro P5000, E3-1535M v6, Toshiba NVMe THNSN5512GPU7 | Lenovo ThinkPad P71-20HK0004GE Quadro P3000, i7-7820HQ, Samsung PM961 NVMe MZVLW512HMJP | HP ZBook 17 G4-Y3J82AV Quadro P5000, E3-1535M v6, Samsung SSD SM961 1TB M.2 MZVKW1T0HMLH | MSI WE72 7RJ Quadro M2200, i7-7700HQ, Samsung SM961 MZVPW256 m.2 PCI-e | Fujitsu Celsius H970 Quadro P4000, E3-1535M v6, Samsung SM961 MZVKW512HMJP m.2 PCI-e | |
|---|---|---|---|---|---|
| Noise | 2% | -7% | -14% | -10% | |
| uit / omgeving * (dB) | 29.5 | 29.2 1% | 29.6 -0% | 29.3 1% | 30.2 -2% |
| Idle Minimum * (dB) | 29.5 | 29.2 1% | 29.6 -0% | 36.3 -23% | 30.2 -2% |
| Idle Average * (dB) | 29.5 | 29.2 1% | 31.7 -7% | 36.3 -23% | 32.8 -11% |
| Idle Maximum * (dB) | 29.5 | 32.2 -9% | 34.4 -17% | 36.6 -24% | 32.8 -11% |
| Load Average * (dB) | 35 | 34.7 1% | 41.3 -18% | 40.4 -15% | 47.3 -35% |
| Witcher 3 ultra * (dB) | 41 | 45.6 -11% | |||
| Load Maximum * (dB) | 47.8 | 39.1 18% | 45.6 5% | 46.6 3% | 47.3 1% |
* ... kleiner is beter
(±) De maximumtemperatuur aan de bovenzijde bedraagt 42.3 °C / 108 F, vergeleken met het gemiddelde van 38.2 °C / 101 F, variërend van 22.2 tot 69.8 °C voor de klasse Workstation.
(±) De bodem warmt op tot een maximum van 44.9 °C / 113 F, vergeleken met een gemiddelde van 41.1 °C / 106 F
(+) Bij onbelast gebruik bedraagt de gemiddelde temperatuur voor de bovenzijde 25.2 °C / 77 F, vergeleken met het apparaatgemiddelde van 32 °C / 90 F.
(±) Bij het spelen van The Witcher 3 is de gemiddelde temperatuur voor de bovenzijde 35.1 °C / 95 F, vergeleken met het apparaatgemiddelde van 32 °C / 90 F.
(+) De palmsteunen en het touchpad zijn met een maximum van ###max## °C / 81.1 F koeler dan de huidtemperatuur en voelen daarom koel aan.
(±) De gemiddelde temperatuur van de handpalmsteun van soortgelijke toestellen bedroeg 27.8 °C / 82 F (+0.5 °C / 0.9 F).
| Uit / Standby | |
| Inactief | |
| Belasting |
|
Key:
min: | |
| Dell Precision 7720 E3-1535M v6, Quadro P5000, Toshiba NVMe THNSN5512GPU7, IGZO, 3840x2160, 17.3" | Lenovo ThinkPad P71-20HK0004GE i7-7820HQ, Quadro P3000, Samsung PM961 NVMe MZVLW512HMJP, IPS, 3840x2160, 17.3" | HP ZBook 17 G4-Y3J82AV E3-1535M v6, Quadro P5000, Samsung SSD SM961 1TB M.2 MZVKW1T0HMLH, IPS, 3840x2160, 17.3" | MSI WE72 7RJ i7-7700HQ, Quadro M2200, Samsung SM961 MZVPW256 m.2 PCI-e, IPS, 1920x1080, 17.3" | Fujitsu Celsius H970 E3-1535M v6, Quadro P4000, Samsung SM961 MZVKW512HMJP m.2 PCI-e, IPS LED, 1920x1080, 17.3" | MSI WT72-6QM E3-1505M v5, Quadro M5000M, Toshiba NVMe THNSN5256GPU7, IPS, 1920x1080, 17.3" | |
|---|---|---|---|---|---|---|
| Power Consumption | 17% | -5% | -2% | 14% | -48% | |
| Idle Minimum * (Watt) | 9.6 | 7.44 22% | 12.9 -34% | 15 -56% | 10.7 -11% | 24.8 -158% |
| Idle Average * (Watt) | 20.5 | 18 12% | 19.6 4% | 20.1 2% | 15.8 23% | 29.7 -45% |
| Idle Maximum * (Watt) | 22.9 | 21.8 5% | 23.6 -3% | 23.8 -4% | 17.8 22% | 30.1 -31% |
| Load Average * (Watt) | 96.8 | 77.1 20% | 92.8 4% | 85.6 12% | 92 5% | 105.2 -9% |
| Load Maximum * (Watt) | 202.1 | 150.5 26% | 190 6% | 128 37% | 137 32% | 192.2 5% |
| Witcher 3 ultra * (Watt) | 148.5 |
* ... kleiner is beter
| Dell Precision 7720 E3-1535M v6, Quadro P5000, 91 Wh | Lenovo ThinkPad P71-20HK0004GE i7-7820HQ, Quadro P3000, 96 Wh | HP ZBook 17 G4-Y3J82AV E3-1535M v6, Quadro P5000, 95 Wh | MSI WE72 7RJ i7-7700HQ, Quadro M2200, 51 Wh | Fujitsu Celsius H970 E3-1535M v6, Quadro P4000, 96 Wh | Dell Precision 7710 E3-1535M v5, FirePro W7170M, 72 Wh | |
|---|---|---|---|---|---|---|
| Batterijduur | 10% | -13% | -53% | 33% | -1% | |
| Reader / Idle (h) | 11.4 | 14.5 27% | 7.8 -32% | 4.5 -61% | 16.7 46% | 12.9 13% |
| H.264 (h) | 6.8 | 8.6 26% | 5.3 -22% | 3 -56% | 9.6 41% | 4.7 -31% |
| WiFi v1.3 (h) | 6.3 | 6 -5% | 4.9 -22% | 3 -52% | 9 43% | 6.1 -3% |
| Load (h) | 1.2 | 1.1 -8% | 1.5 25% | 0.7 -42% | 1.2 0% | 1.4 17% |
Pro
Contra
Dit is de verkorte versie van het originele artikel. Het volledige, Engelse testrapport vind je hier.
De Dell Precision 7720 is een erg krachtig mobiel werkstation. De hoge kwaliteit behuizing is vrijwel ongewijzigd in vergelijking met de vorige generatie en een Thunderbolt 3 poort is nu standaard aanwezig. De voorganger had nog problemen om zijn volle prestatiepotentieel te behalen wanneer zowel de CPU als GPU belast werden, maar het lijkt erop dat de fabrikant op dit vlak verbeteringen heeft aangebracht. Ons testmodel is uitgerust met de krachtigste componenten, maar de prestaties kunnen zelfs bij extreme belasting nog vrijwel vol benut worden. Of je zoveel prestaties nodig hebt is uiteraard een andere vraag. Met name deze grafische kaart is in veel situaties geen vereiste.
We zijn een beetje teleurgesteld in het 4K PremierColor beeldscherm. Deze is duidelijk bedoelt voor het hoogste niveau, maar we hadden voor de prijs verwacht daar zelf niet meer heel veel meer aan te hoeven instellen. Een kalibratie is zeker nodig voor het beeldscherm. Het backlight bleeding aan de onderzijde is ook wat hinderlijk en het paneel gebruikt bij lage helderheidsniveau’s PWM.
De Precision 7720 is een goede keuze voor wanneer je veel prestaties nodig hebt, omdat het mobiele werkstation de potentiële prestaties van de dure componenten ook daadwerkelijk kan leveren.
Er is geen probleem met hinderlijke ventilatoren, ondanks de hoge prestaties. Zeker, je zult ze duidelijk horen bij hoge belasting, maar bij eenvoudiger taken zullen de ventilatoren vaak uitstaan. We kunnen ook geen kritiek leveren op de warmteontwikkeling, net als op de batterijlevensduur.
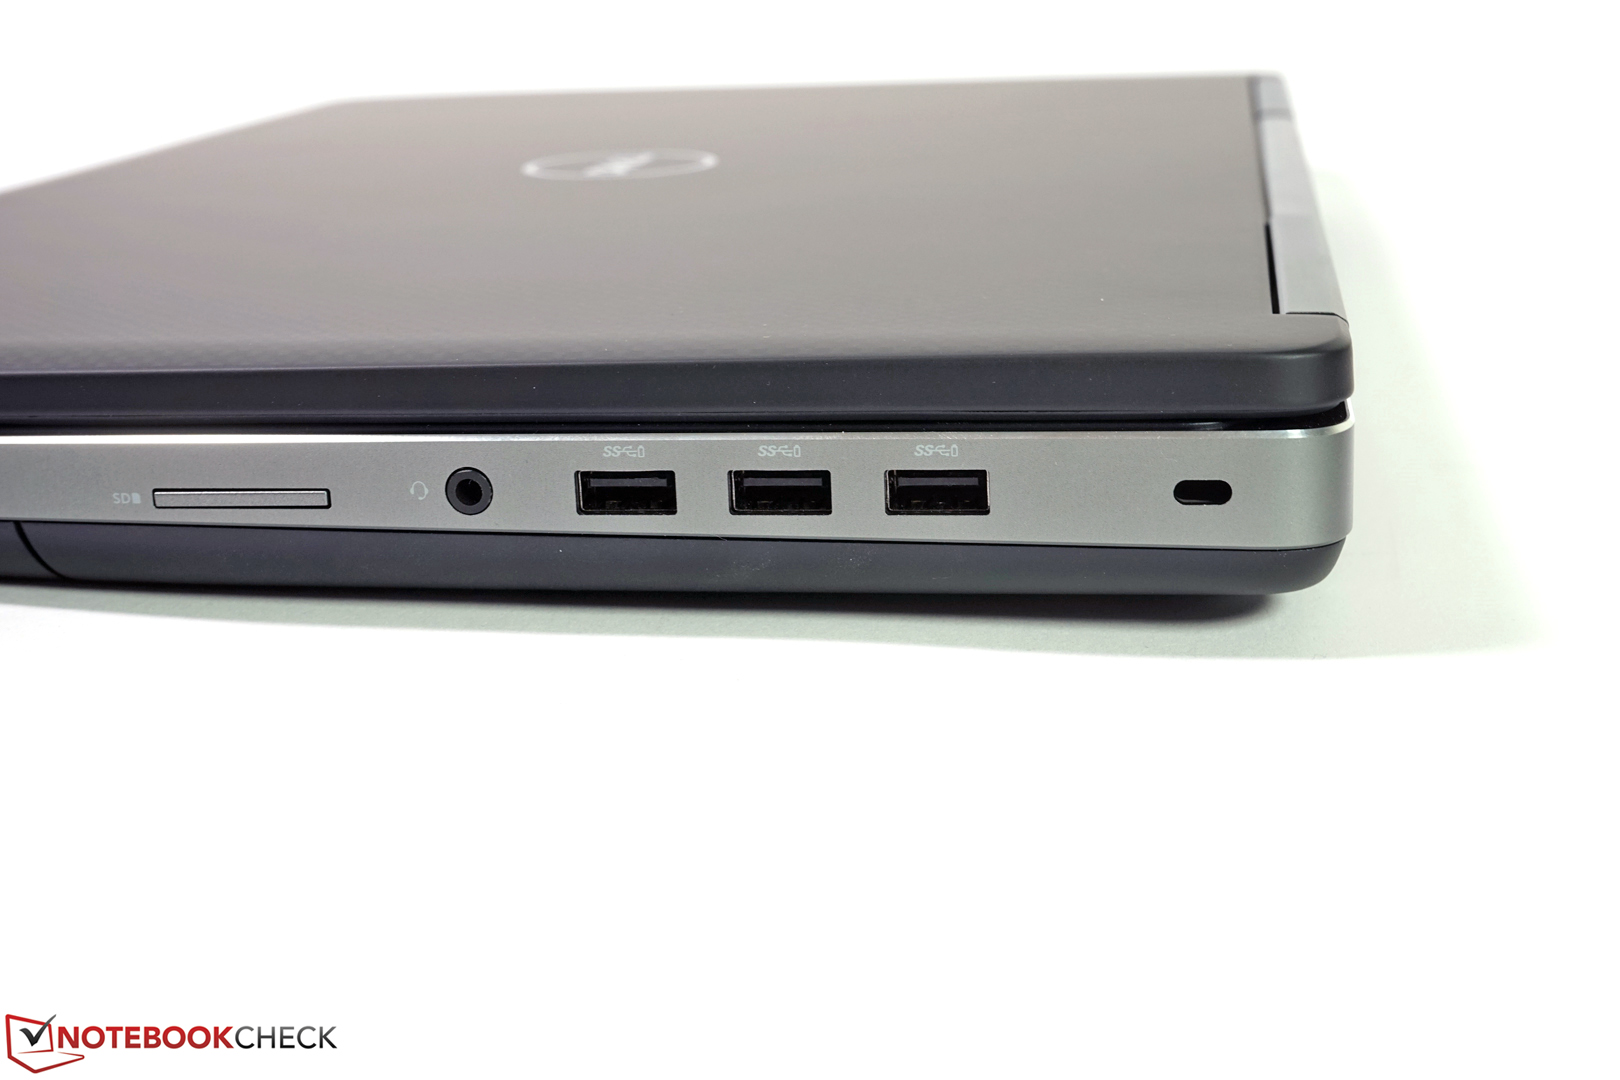
Behalve de kritiek op het beeldscherm, zul je behoorlijk moeten zoeken naar minpunten. Een van de minpunten is uiteraard de SD-kaartlezer, die in ons testmodel defect is, maar dat is waarschijnlijk een geïsoleerd geval. Het SIM-kaartslot is aan de binnenkant van de behuizing geplaatst en is lastig te bereiken. Een SIM-kaart snel omwisselen, bijvoorbeeld bij reizen naar andere landen, zal niet gaan.
Al deze prestaties zijn niet goedkoop, maar dat geld ook voor de concurrentie. Al met al weet de Precision 7720 een erg goed eindoordeel te verkrijgen (89%).
Dell Precision 7720
- 21-01-2018 v6 (old)
Andreas Osthoff
