Kort testrapport MSI WE72 7RJ (7700HQ, FHD, M2200) Workstation
| SD Card Reader | |
| average JPG Copy Test (av. of 3 runs) | |
| Dell Precision 7710 | |
| HP ZBook 17 G3 TZV66eA | |
| Lenovo ThinkPad P70 | |
| MSI WE72 7RJ | |
| maximum AS SSD Seq Read Test (1GB) | |
| HP ZBook 17 G3 TZV66eA | |
| Lenovo ThinkPad P70 | |
| Dell Precision 7710 | |
| MSI WE72 7RJ | |
| Networking | |
| iperf3 transmit AX12 | |
| Lenovo ThinkPad T570-20HAS01E00 | |
| MSI GE72 7RE-046 | |
| MSI WE72 7RJ | |
| iperf3 receive AX12 | |
| Lenovo ThinkPad T570-20HAS01E00 | |
| MSI WE72 7RJ | |
| MSI GE72 7RE-046 | |
| |||||||||||||||||||||||||
Helderheidsverdeling: 93 %
Helderheid in Batterij-modus: 301 cd/m²
Contrast: 974:1 (Zwart: 0.31 cd/m²)
ΔE ColorChecker Calman: 6.2 | ∀{0.5-29.43 Ø4.71}
ΔE Greyscale Calman: 7.3 | ∀{0.09-98 Ø4.96}
85.2% sRGB (Argyll 1.6.3 3D)
56% AdobeRGB 1998 (Argyll 1.6.3 3D)
62.4% AdobeRGB 1998 (Argyll 3D)
85.3% sRGB (Argyll 3D)
67.4% Display P3 (Argyll 3D)
Gamma: 2.08
CCT: 7020 K
| MSI WE72 7RJ LP173WF4-SPF1, , 1920x1080, 17.3" | Dell Precision 7710 SDC8151, VHN17_173HL, , 1920x1080, 17.3" | Lenovo ThinkPad P70 LEN4123, , 3840x2160, 17.3" | HP ZBook 17 G3 TZV66eA SDC3854, , 1920x1080, 17.3" | |
|---|---|---|---|---|
| Display | 8% | 30% | 8% | |
| Display P3 Coverage (%) | 67.4 | 66.6 -1% | 90.8 35% | 67.3 0% |
| sRGB Coverage (%) | 85.3 | 96.9 14% | 100 17% | 95.9 12% |
| AdobeRGB 1998 Coverage (%) | 62.4 | 68.6 10% | 85.4 37% | 69 11% |
| Response Times | -24% | -1% | -10% | |
| Response Time Grey 50% / Grey 80% * (ms) | 45.2 ? | 50 ? -11% | 44 ? 3% | 50.4 ? -12% |
| Response Time Black / White * (ms) | 26.4 ? | 36 ? -36% | 27.6 ? -5% | 28.4 ? -8% |
| PWM Frequency (Hz) | 198 ? | 228 ? | 200 ? | |
| Screen | 13% | 11% | 23% | |
| Brightness middle (cd/m²) | 302 | 332 10% | 365 21% | 252 -17% |
| Brightness (cd/m²) | 306 | 307 0% | 341 11% | 243 -21% |
| Brightness Distribution (%) | 93 | 83 -11% | 85 -9% | 86 -8% |
| Black Level * (cd/m²) | 0.31 | 0.33 -6% | 0.4 -29% | 0.21 32% |
| Contrast (:1) | 974 | 1006 3% | 913 -6% | 1200 23% |
| Colorchecker dE 2000 * | 6.2 | 3 52% | 3.8 39% | 2.2 65% |
| Colorchecker dE 2000 max. * | 10.6 | 3.8 64% | ||
| Greyscale dE 2000 * | 7.3 | 4 45% | 6.09 17% | 2.7 63% |
| Gamma | 2.08 106% | 2 110% | 2.3 96% | 2.28 96% |
| CCT | 7020 93% | 7089 92% | 6332 103% | 6686 97% |
| Color Space (Percent of AdobeRGB 1998) (%) | 56 | 62 11% | 76.01 36% | 62 11% |
| Color Space (Percent of sRGB) (%) | 85.2 | 97 14% | 99.97 17% | 96 13% |
| Totaal Gemiddelde (Programma / Instellingen) | -1% /
7% | 13% /
13% | 7% /
15% |
* ... kleiner is beter
Responstijd Scherm
| ↔ Responstijd Zwart naar Wit | ||
|---|---|---|
| 26.4 ms ... stijging ↗ en daling ↘ gecombineerd | ↗ 14.8 ms stijging | 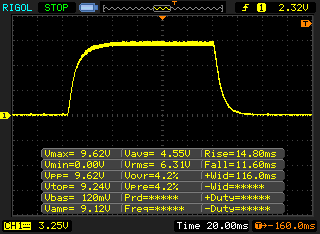 |
| ↘ 11.6 ms daling | ||
| Het scherm vertoonde relatief trage responstijden in onze tests en is misschien te traag voor games. Ter vergelijking: alle testtoestellen variëren van 0.1 (minimum) tot 240 (maximum) ms. » 66 % van alle toestellen zijn beter. Dit betekent dat de gemeten responstijd slechter is dan het gemiddelde (19.8 ms) van alle geteste toestellen. | ||
| ↔ Responstijd 50% Grijs naar 80% Grijs | ||
| 45.2 ms ... stijging ↗ en daling ↘ gecombineerd | ↗ 27.2 ms stijging | 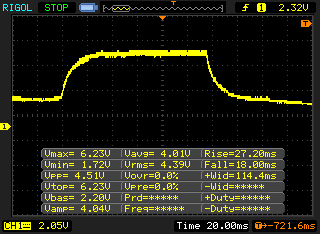 |
| ↘ 18 ms daling | ||
| Het scherm vertoonde trage responstijden in onze tests en is misschien te traag voor games. Ter vergelijking: alle testtoestellen variëren van 0.165 (minimum) tot 636 (maximum) ms. » 78 % van alle toestellen zijn beter. Dit betekent dat de gemeten responstijd slechter is dan het gemiddelde (30.9 ms) van alle geteste toestellen. | ||
Screen Flickering / PWM (Pulse-Width Modulation)
| Screen flickering / PWM niet waargenomen |  | ||
Ter vergelijking: 52 % van alle geteste toestellen maakten geen gebruik van PWM om de schermhelderheid te verlagen. Als het wel werd gebruikt, werd een gemiddelde van 7741 (minimum: 5 - maximum: 343500) Hz waargenomen. | |||

| PCMark 8 | |
| Home Score Accelerated v2 | |
| Dell Precision 7710 | |
| MSI WE72 7RJ | |
| HP ZBook 17 G3 TZV66eA | |
| Lenovo ThinkPad P70 | |
| Work Score Accelerated v2 | |
| Dell Precision 7710 | |
| HP ZBook 17 G3 TZV66eA | |
| MSI WE72 7RJ | |
| Lenovo ThinkPad P70 | |
| PCMark 8 Home Score Accelerated v2 | 4295 punten | |
| PCMark 8 Work Score Accelerated v2 | 5150 punten | |
Help | ||
| MSI WE72 7RJ Samsung SM961 MZVPW256 m.2 PCI-e | Lenovo ThinkPad P70 Samsung SSD PM871 MZNLN512HCJH | HP ZBook 17 G3 TZV66eA Samsung SM951 MZVPV256HDGL m.2 PCI-e | MSI GE72 7RE-046 Toshiba HG6 THNSNJ256G8NY | Dell Precision 5520 UHD Samsung SM961 MZVKW512HMJP m.2 PCI-e | MSI GS63VR 7RF-228US Samsung SM961 MZVKW512HMJP m.2 PCI-e | |
|---|---|---|---|---|---|---|
| CrystalDiskMark 3.0 | -44% | 30% | -45% | 10% | 9% | |
| Read Seq (MB/s) | 1492 | 509 -66% | 1481 -1% | 540 -64% | 2253 51% | 2141 43% |
| Write Seq (MB/s) | 1512 | 457.8 -70% | 1243 -18% | 495.7 -67% | 1662 10% | 1621 7% |
| Read 512 (MB/s) | 312.6 | 420.3 34% | 1202 285% | 455.1 46% | 459.1 47% | 499.7 60% |
| Write 512 (MB/s) | 1483 | 420.5 -72% | 1163 -22% | 481.4 -68% | 1611 9% | 1531 3% |
| Read 4k (MB/s) | 59.9 | 29.88 -50% | 58.7 -2% | 22.7 -62% | 56.1 -6% | 54.2 -10% |
| Write 4k (MB/s) | 184.2 | 104.1 -43% | 207.4 13% | 112.9 -39% | 169.4 -8% | 158.2 -14% |
| Read 4k QD32 (MB/s) | 681 | 391.8 -42% | 832 22% | 372.5 -45% | 633 -7% | 632 -7% |
| Write 4k QD32 (MB/s) | 590 | 350.4 -41% | 377.9 -36% | 212.9 -64% | 506 -14% | 527 -11% |

| 3DMark - 1920x1080 Fire Strike Graphics | |
| MSI GE72VR-6RF16H21 | |
| MSI GE72 7RE-046 | |
| Acer Predator 15 G9-592-7925 | |
| Dell Precision 7710 | |
| HP ZBook 17 G3 TZV66eA | |
| Lenovo ThinkPad P70 | |
| MSI GE72 965M Ti | |
| Asus FX553VD-DM249T | |
| MSI WE72 7RJ | |
| HP Omen 17-w010ng | |
| Dell Precision 5520 UHD | |
| Lenovo ThinkPad P50 | |
| Unigine Heaven 4.0 | |
| Extreme Preset DX11 | |
| MSI GE72VR-6RF16H21 | |
| MSI GE72 7RE-046 | |
| MSI WE72 7RJ | |
| MSI GE72 965M Ti | |
| HP Omen 17-w010ng | |
| Extreme Preset OpenGL | |
| MSI WE72 7RJ | |
| Unigine Valley 1.0 | |
| 1920x1080 Extreme HD DirectX AA:x8 | |
| MSI GE72VR-6RF16H21 | |
| HP ZBook 17 G3 TZV66eA | |
| Lenovo ThinkPad P70 | |
| Dell Precision 7710 | |
| MSI WE72 7RJ | |
| MSI GE72 965M Ti | |
| Lenovo ThinkPad P50 | |
| 1920x1080 Extreme HD Preset OpenGL AA:x8 | |
| HP ZBook 17 G3 TZV66eA | |
| Dell Precision 7710 | |
| MSI WE72 7RJ | |
| Lenovo ThinkPad P70 | |
| Lenovo ThinkPad P50 | |
| 3DMark 06 Standard Score | 26834 punten | |
| 3DMark Vantage P Result | 24622 punten | |
| 3DMark 11 Performance | 7453 punten | |
| 3DMark Ice Storm Standard Score | 93770 punten | |
| 3DMark Cloud Gate Standard Score | 20388 punten | |
| 3DMark Fire Strike Score | 5252 punten | |
| 3DMark Fire Strike Extreme Score | 2627 punten | |
| 3DMark Time Spy Score | 1845 punten | |
Help | ||
| Ghost Recon Wildlands - 1920x1080 High Preset AA:T AF:4x | |
| Gigabyte Aero 15 | |
| Acer Aspire VX5-591G-75C4 VX15 | |
| MSI WE72 7RJ | |
| MSI GL62M 7RD-077 | |
| Apple MacBook Pro 15 2016 (2.6 GHz, 450) | |
| For Honor - 1920x1080 High Preset AA:T AF:8x | |
| Gigabyte Aero 15 | |
| Razer Blade (2017) | |
| MSI WE72 7RJ | |
| MSI GE72 965M Ti | |
| Acer Aspire VX5-591G-75C4 VX15 | |
| Apple MacBook Pro 15 2016 (2.6 GHz, 450) | |
| Battlefield 1 - 1920x1080 High Preset AA:T | |
| Schenker XMG P407 | |
| Acer Aspire VN7-593G-73HP V15 Nitro BE | |
| MSI GE72 965M Ti | |
| Dell XPS 15 2017 9560 (7300HQ, Full-HD) | |
| MSI GL62M 7RD-077 | |
| MSI WE72 7RJ | |
| Apple MacBook Pro 15 2016 (2.9 GHz, 460) | |
| Apple MacBook Pro 15 2016 (2.6 GHz, 450) | |
| lage | gem. | hoge | ultra | |
|---|---|---|---|---|
| Tomb Raider (2013) | 381.4 | 238.8 | 149.3 | 70.2 |
| BioShock Infinite (2013) | 229.4 | 177.2 | 155.5 | 58.6 |
| Battlefield 4 (2013) | 171.5 | 148.3 | 115.9 | 47.8 |
| Thief (2014) | 108.8 | 88.6 | 74.8 | 39.6 |
| The Witcher 3 (2015) | 116.6 | 68.4 | 37.8 | 20.3 |
| Star Wars Battlefront (2015) | 148.8 | 119 | 56.4 | 48.2 |
| Rainbow Six Siege (2015) | 214.2 | 131.2 | 70.4 | 52.4 |
| Rise of the Tomb Raider (2016) | 128.7 | 72.8 | 40.7 | 34.4 |
| Battlefield 1 (2016) | 139.4 | 105.3 | 47.1 | 42 |
| For Honor (2017) | 78 | 52.3 | 50.5 | 36.2 |
| Ghost Recon Wildlands (2017) | 83.4 | 37.1 | 33.7 | 17.6 |
Geluidsniveau
| Onbelast |
| 36.3 / 36.3 / 36.6 dB (A) |
| Belasting |
| 40.4 / 46.6 dB (A) |
 | ||
30 dB stil 40 dB(A) hoorbaar 50 dB(A) luid |
||
min: | ||
(-) De maximumtemperatuur aan de bovenzijde bedraagt 45.7 °C / 114 F, vergeleken met het gemiddelde van 38.2 °C / 101 F, variërend van 22.2 tot 69.8 °C voor de klasse Workstation.
(-) De bodem warmt op tot een maximum van 48.4 °C / 119 F, vergeleken met een gemiddelde van 41.1 °C / 106 F
(+) Bij onbelast gebruik bedraagt de gemiddelde temperatuur voor de bovenzijde 26.7 °C / 80 F, vergeleken met het apparaatgemiddelde van 32 °C / 90 F.
(-) De palmsteunen en het touchpad kunnen zeer heet aanvoelen met een maximum van ###max## °C / 104.7 F.
(-) De gemiddelde temperatuur van de handpalmsteun van soortgelijke toestellen bedroeg 27.8 °C / 82 F (-12.6 °C / -22.7 F).
| Uit / Standby | |
| Inactief | |
| Belasting |
|
Key:
min: | |
| MSI WE72 7RJ i7-7700HQ, Quadro M2200, Samsung SM961 MZVPW256 m.2 PCI-e, IPS, 1920x1080, 17.3" | Dell Precision 7710 E3-1535M v5, FirePro W7170M, Samsung SM951 MZVPV256HDGL m.2 PCI-e, IPS LED, 1920x1080, 17.3" | Lenovo ThinkPad P70 6820HQ, Quadro M3000M, Samsung SSD PM871 MZNLN512HCJH, IPS, 3840x2160, 17.3" | HP ZBook 17 G3 TZV66eA E3-1535M v5, Quadro M3000M, Samsung SM951 MZVPV256HDGL m.2 PCI-e, IPS, 1920x1080, 17.3" | MSI GE72 7RE-046 i7-7700HQ, GeForce GTX 1050 Ti Mobile, Toshiba HG6 THNSNJ256G8NY, TN LED, 1920x1080, 17.3" | |
|---|---|---|---|---|---|
| Power Consumption | -14% | 3% | 13% | 0% | |
| Idle Minimum * (Watt) | 15 | 6.04 60% | 12.1 19% | 6.7 55% | 14 7% |
| Idle Average * (Watt) | 20.1 | 15.2 24% | 19.7 2% | 12.5 38% | 20 -0% |
| Idle Maximum * (Watt) | 23.8 | 42.3 -78% | 20.5 14% | 13.2 45% | 25 -5% |
| Load Average * (Watt) | 85.6 | 112.8 -32% | 94.3 -10% | 128.2 -50% | 82 4% |
| Load Maximum * (Watt) | 128 | 182.2 -42% | 139.6 -9% | 158.9 -24% | 135 -5% |
* ... kleiner is beter
| MSI WE72 7RJ i7-7700HQ, Quadro M2200, 51 Wh | Dell Precision 7710 E3-1535M v5, FirePro W7170M, 72 Wh | Lenovo ThinkPad P70 6820HQ, Quadro M3000M, 96 Wh | HP ZBook 17 G3 TZV66eA E3-1535M v5, Quadro M3000M, 96 Wh | MSI GE72 7RE-046 i7-7700HQ, GeForce GTX 1050 Ti Mobile, 51.4 Wh | |
|---|---|---|---|---|---|
| Batterijduur | 112% | 95% | 134% | 7% | |
| Reader / Idle (h) | 4.5 | 12.9 187% | 7.7 71% | 15.9 253% | |
| H.264 (h) | 3 | 4.7 57% | 7.5 150% | 5 67% | 3.3 10% |
| WiFi v1.3 (h) | 3 | 6.1 103% | 6 100% | 4.8 60% | 3.1 3% |
| Load (h) | 0.7 | 1.4 100% | 1.1 57% | 1.8 157% |
Pro
Contra

Dit is de verkorte versie van het originele artikel. Het volledige, Engelse testrapport vind je hier.
De MSI GE72 is een goede game notebook, maar is het gebruik van een professionele grafische kaart genoeg om er een goed mobiel werkstation van te maken? We zijn na onze test hier niet van overtuigd, en de MSI WE72 heeft het moeilijk tegen de gevestigde rivalen. Je wordt vaak herinnerd aan de gaming oorsprong van het notebook. Er is geen docking poort of Thunderbolt 3, en je kunt dus geen fatsoenlijke docking stations gebruiken.
Dit is afhankelijk van je gebruiksscenario misschien niet een heel groot gemis, maar er zijn ook minpunten op het gebied van prestaties en emissies. De koeling heeft moeite met de warmteontwikkeling van de processor, met als gevolg dat de kloksnelheid onder de standaardsnelheid duikt (throttling) zelfs bij het belasting van enkel de CPU met Cinebench. De 120 Watt adapter is ook een beperkende factor wanneer je zowel de CPU als de GPU belast. De ventilatoren kunnen optimaal gebruikt worden dankzij de voorgeïnstalleerde fancontroller. Door de hoge temperaturen valt er eigenlijk alleen niet veel te beheren.
MSI WE72 7RJ
- 09-05-2017 v6 (old)
Andreas Osthoff
Price comparison
