Kort testrapport Dell Precision 7710 Workstation


| |||||||||||||||||||||||||
Helderheidsverdeling: 83 %
Helderheid in Batterij-modus: 335 cd/m²
Contrast: 1006:1 (Zwart: 0.33 cd/m²)
ΔE ColorChecker Calman: 3 | ∀{0.5-29.43 Ø4.71}
ΔE Greyscale Calman: 4 | ∀{0.09-98 Ø4.96}
97% sRGB (Argyll 1.6.3 3D)
62% AdobeRGB 1998 (Argyll 1.6.3 3D)
68.6% AdobeRGB 1998 (Argyll 3D)
96.9% sRGB (Argyll 3D)
66.6% Display P3 (Argyll 3D)
Gamma: 2
CCT: 7089 K
| Display | |
| Display P3 Coverage (sorteer op waarde) | |
| Dell Precision 7710 | |
| Lenovo ThinkPad P70 | |
| Schenker W706 | |
| MSI WT72-6QM | |
| sRGB Coverage (sorteer op waarde) | |
| Dell Precision 7710 | |
| Lenovo ThinkPad P70 | |
| Schenker W706 | |
| MSI WT72-6QM | |
| AdobeRGB 1998 Coverage (sorteer op waarde) | |
| Dell Precision 7710 | |
| Lenovo ThinkPad P70 | |
| Schenker W706 | |
| MSI WT72-6QM | |
| Response Times | |
| Response Time Grey 50% / Grey 80% (sorteer op waarde) | |
| Dell Precision 7710 (17, 33) | |
| Lenovo ThinkPad P70 (17.2, 26.8) | |
| Schenker W706 (17.2, 26.8) | |
| MSI WT72-6QM (13, 29) | |
| Response Time Black / White (sorteer op waarde) | |
| Dell Precision 7710 (11, 25) | |
| Lenovo ThinkPad P70 (4.8, 22.8) | |
| Schenker W706 (8.4, 20.8) | |
| MSI WT72-6QM (7, 19) | |
| PWM Frequency (sorteer op waarde) | |
| Dell Precision 7710 (25) | |
| Lenovo ThinkPad P70 (95) | |
| Schenker W706 | |
| MSI WT72-6QM (10, 15) | |
* ... kleiner is beter
Responstijd Scherm
| ↔ Responstijd Zwart naar Wit | ||
|---|---|---|
| 36 ms ... stijging ↗ en daling ↘ gecombineerd | ↗ 11 ms stijging | 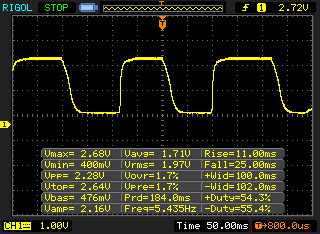 |
| ↘ 25 ms daling | ||
| Het scherm vertoonde trage responstijden in onze tests en is misschien te traag voor games. Ter vergelijking: alle testtoestellen variëren van 0.1 (minimum) tot 240 (maximum) ms. » 94 % van alle toestellen zijn beter. Dit betekent dat de gemeten responstijd slechter is dan het gemiddelde (19.8 ms) van alle geteste toestellen. | ||
| ↔ Responstijd 50% Grijs naar 80% Grijs | ||
| 50 ms ... stijging ↗ en daling ↘ gecombineerd | ↗ 17 ms stijging | 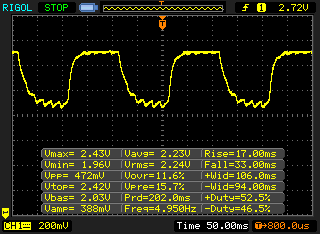 |
| ↘ 33 ms daling | ||
| Het scherm vertoonde trage responstijden in onze tests en is misschien te traag voor games. Ter vergelijking: alle testtoestellen variëren van 0.165 (minimum) tot 636 (maximum) ms. » 86 % van alle toestellen zijn beter. Dit betekent dat de gemeten responstijd slechter is dan het gemiddelde (31 ms) van alle geteste toestellen. | ||
Screen Flickering / PWM (Pulse-Width Modulation)
| Screen flickering / PWM waargenomen | 198 Hz | ≤ 25 % helderheid instelling | 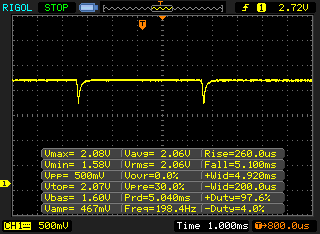 |
De achtergrondverlichting van het scherm flikkert op 198 Hz (in het slechtste geval, bijvoorbeeld bij gebruik van PWM) aan een helderheid van 25 % en lager. Boven deze helderheid zou er geen flickering / PWM mogen optreden. De frequentie van 198 Hz is redelijk laag en de meeste mensen die gevoelig zijn aan flickering kunnen dit dus waarnemen of geïrriteerde ogen krijgen (gebruikmakend van de vermelde helderheid en lager). Ter vergelijking: 52 % van alle geteste toestellen maakten geen gebruik van PWM om de schermhelderheid te verlagen. Als het wel werd gebruikt, werd een gemiddelde van 7754 (minimum: 5 - maximum: 343500) Hz waargenomen. | |||
| Cinebench R15 | |
| CPU Single 64Bit (sorteer op waarde) | |
| Dell Precision 7710 | |
| Lenovo ThinkPad P70 | |
| Acer Aspire V5-591G-50NC | |
| CPU Multi 64Bit (sorteer op waarde) | |
| Dell Precision 7710 | |
| Lenovo ThinkPad P70 | |
| Acer Aspire V5-591G-50NC | |
| Super Pi Mod 1.5 XS 32M - 32M (sorteer op waarde) | |
| Dell Precision 7710 | |
| Lenovo ThinkPad P70 | |
| Acer Aspire V5-591G-50NC | |
| wPrime 2.10 - 1024m (sorteer op waarde) | |
| Dell Precision 7710 | |
| Lenovo ThinkPad P70 | |
| Acer Aspire V5-591G-50NC | |
* ... kleiner is beter
| PCMark 8 | |
| Home Score Accelerated v2 (sorteer op waarde) | |
| Dell Precision 7710 | |
| Lenovo ThinkPad P70 | |
| Schenker W706 | |
| MSI WT72-6QM | |
| Creative Score Accelerated v2 (sorteer op waarde) | |
| Dell Precision 7710 | |
| Schenker W706 | |
| Work Score Accelerated v2 (sorteer op waarde) | |
| Dell Precision 7710 | |
| Lenovo ThinkPad P70 | |
| Schenker W706 | |
| MSI WT72-6QM | |
| PCMark 7 Score | 5072 punten | |
| PCMark 8 Home Score Accelerated v2 | 4770 punten | |
| PCMark 8 Creative Score Accelerated v2 | 5668 punten | |
| PCMark 8 Work Score Accelerated v2 | 5417 punten | |
Help | ||

| LuxMark v2.0 64Bit | |
| Room GPUs-only (sorteer op waarde) | |
| Dell Precision 7710 | |
| Lenovo ThinkPad P70 | |
| Dell Precision 5510 | |
| Sala GPUs-only (sorteer op waarde) | |
| Dell Precision 7710 | |
| Lenovo ThinkPad P70 | |
| Dell Precision 5510 | |
| SiSoft Sandra 2016 | |
| Image Processing (sorteer op waarde) | |
| Dell Precision 7710 | |
| Lenovo ThinkPad P70 | |
| Dell Precision 5510 | |
| GP Cryptography (Higher Security AES256+SHA2-512) (sorteer op waarde) | |
| Dell Precision 7710 | |
| Lenovo ThinkPad P70 | |
| Dell Precision 5510 | |
| GP Financial Analysis (FP High/Double Precision) (sorteer op waarde) | |
| Dell Precision 7710 | |
| Lenovo ThinkPad P70 | |
| Dell Precision 5510 | |
| Unigine Heaven 3.0 | |
| 1920x1080 OpenGL, Normal Tessellation, High Shaders AA:Off AF:Off (sorteer op waarde) | |
| Dell Precision 7710 | |
| Lenovo ThinkPad P70 | |
| Dell Precision 5510 | |
| 1920x1080 DX 11, Normal Tessellation, High Shaders AA:Off AF:Off (sorteer op waarde) | |
| Dell Precision 7710 | |
| Lenovo ThinkPad P70 | |
| Dell Precision 5510 | |
| Unigine Valley 1.0 | |
| 1920x1080 Extreme HD DirectX AA:x8 (sorteer op waarde) | |
| Dell Precision 7710 | |
| Lenovo ThinkPad P70 | |
| Dell Precision 5510 | |
| 1920x1080 Extreme HD Preset OpenGL AA:x8 (sorteer op waarde) | |
| Dell Precision 7710 | |
| Lenovo ThinkPad P70 | |
| Dell Precision 5510 | |
| 3DMark 06 Standard Score | 28430 punten | |
| 3DMark Vantage P Result | 26345 punten | |
| 3DMark 11 Performance | 9580 punten | |
| 3DMark Ice Storm Standard Score | 95675 punten | |
| 3DMark Cloud Gate Standard Score | 21612 punten | |
| 3DMark Fire Strike Score | 6180 punten | |
Help | ||
| lage | gem. | hoge | ultra | |
|---|---|---|---|---|
| Tomb Raider (2013) | 375 | 224 | 167 | 51 |
| BioShock Infinite (2013) | 220 | 178 | 158 | 66 |
| Metro: Last Light (2013) | 120 | 112 | 94 | 44 |
| Company of Heroes 2 (2013) | 57 | 56 | 55 | 28 |
| Total War: Rome II (2013) | 185 | 162 | 153 | 36 |
| Thief (2014) | 62 | 57 | 57 | 40 |
| GRID: Autosport (2014) | 232 | 116 | 99 | 67 |
| Middle-earth: Shadow of Mordor (2014) | 177 | 126 | 70 | 52 |
| Ryse: Son of Rome (2014) | 101 | 93 | 43 | 15 |
| F1 2014 (2014) | 132 | 111 | 95 | 74 |
| Dirt Rally (2015) | 278 | 187 | 89 | 63 |
| The Witcher 3 (2015) | 97 | 72 | 31 | 23 |
| Anno 2205 (2015) | 146 | 93 | 43 | 20 |
Geluidsniveau
| Onbelast |
| 30 / 30 / 30 dB (A) |
| HDD |
| 33.2 dB (A) |
| Belasting |
| 43.2 / 47.13 dB (A) |
 | ||
30 dB stil 40 dB(A) hoorbaar 50 dB(A) luid |
||
min: | ||
(+) De maximumtemperatuur aan de bovenzijde bedraagt 35.6 °C / 96 F, vergeleken met het gemiddelde van 38.2 °C / 101 F, variërend van 22.2 tot 69.8 °C voor de klasse Workstation.
(-) De bodem warmt op tot een maximum van 55 °C / 131 F, vergeleken met een gemiddelde van 41.1 °C / 106 F
(+) Bij onbelast gebruik bedraagt de gemiddelde temperatuur voor de bovenzijde 27 °C / 81 F, vergeleken met het apparaatgemiddelde van 32 °C / 90 F.
(+) De palmsteunen en het touchpad zijn met een maximum van ###max## °C / 80.6 F koeler dan de huidtemperatuur en voelen daarom koel aan.
(±) De gemiddelde temperatuur van de handpalmsteun van soortgelijke toestellen bedroeg 27.8 °C / 82 F (+0.8 °C / 1.4 F).
| Uit / Standby | |
| Inactief | |
| Belasting |
|
Key:
min: | |
Pro
Contra
Voor het volledige, Engelse testrapport, klik hier.
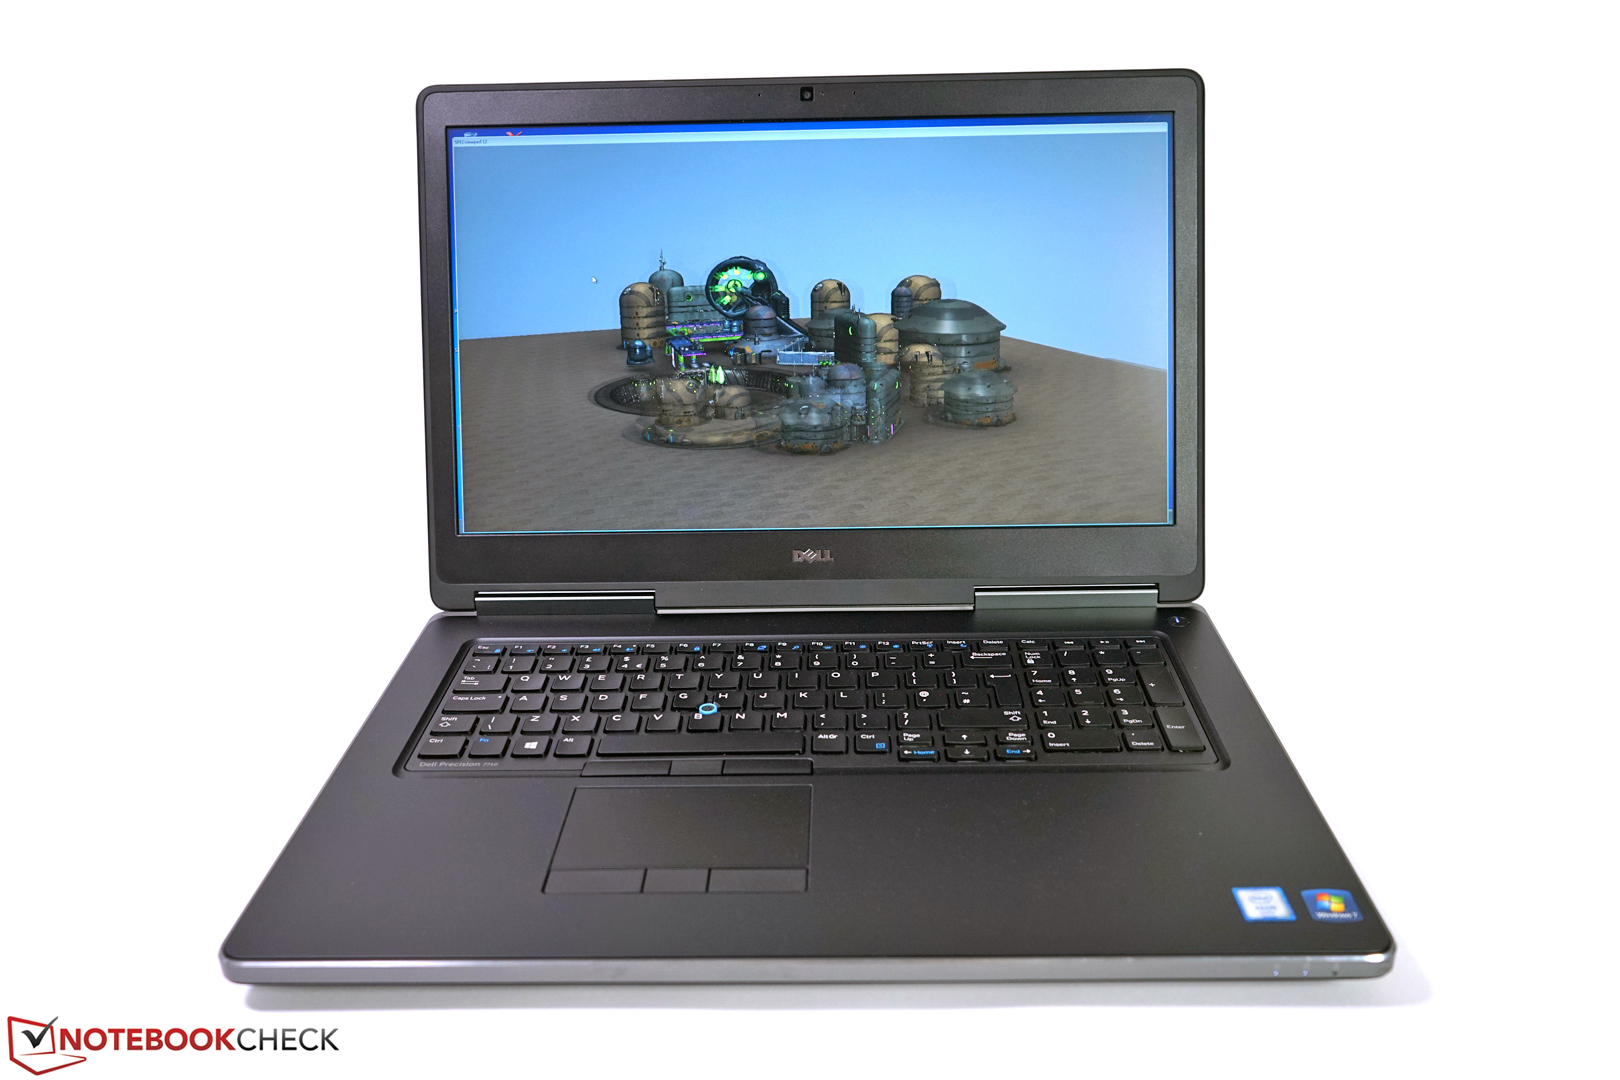
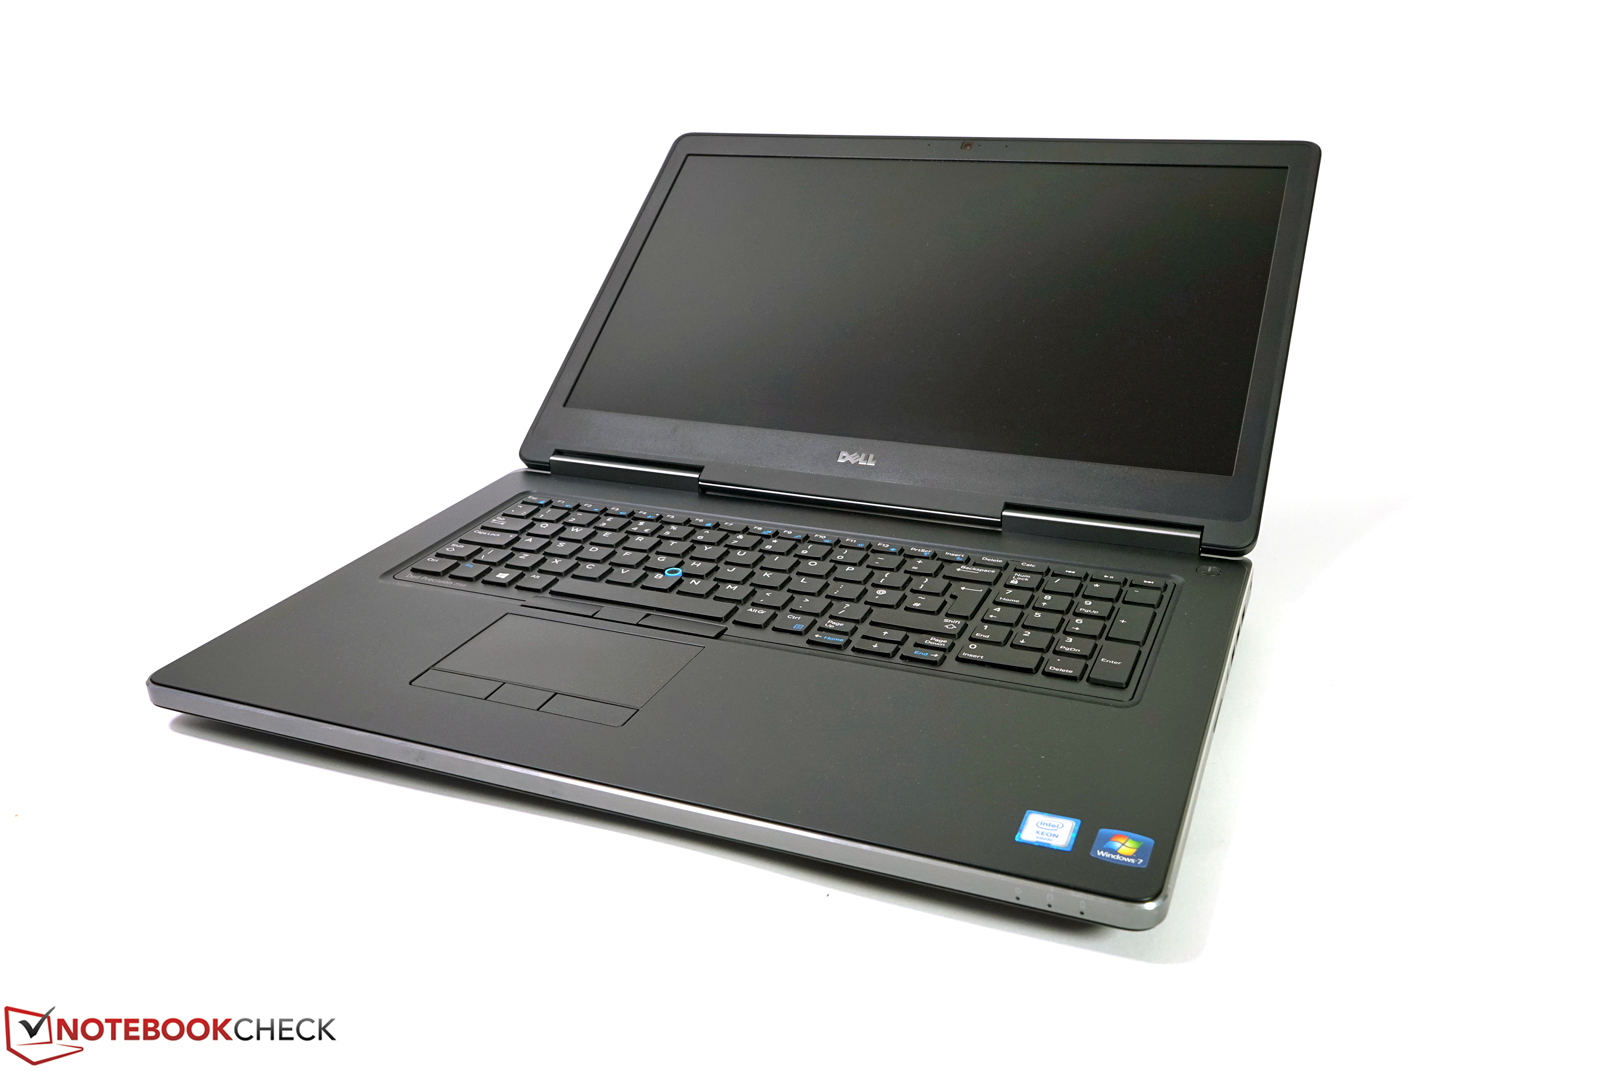
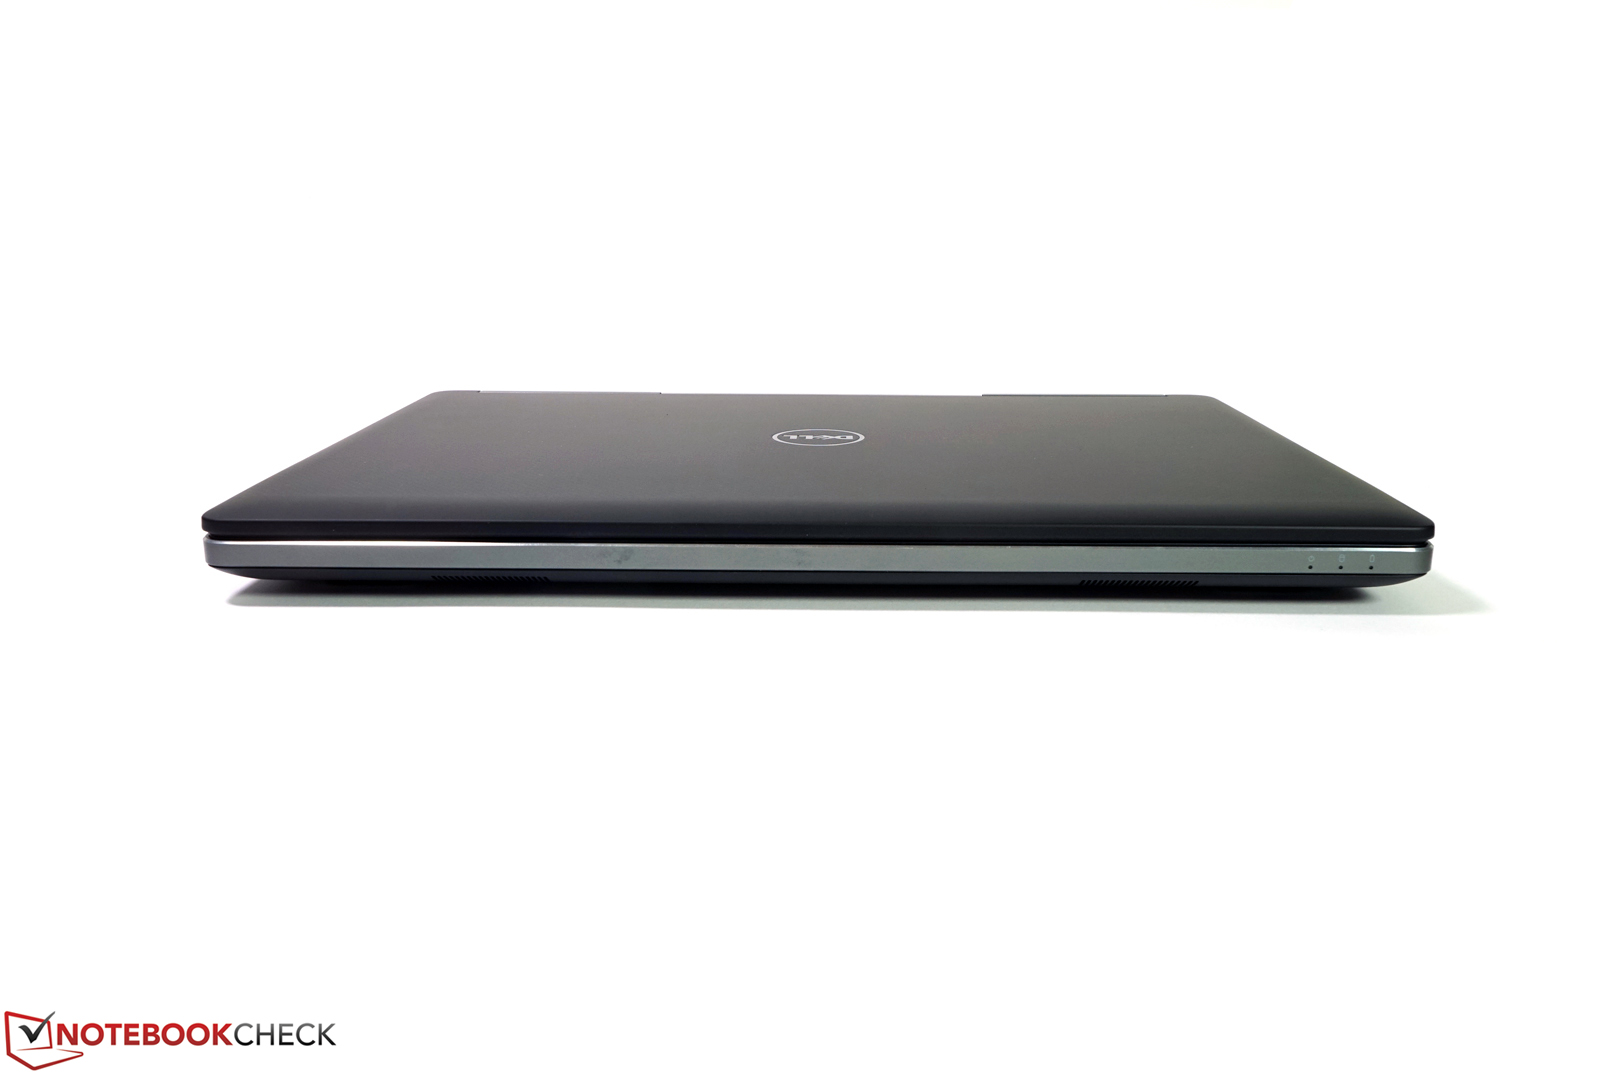
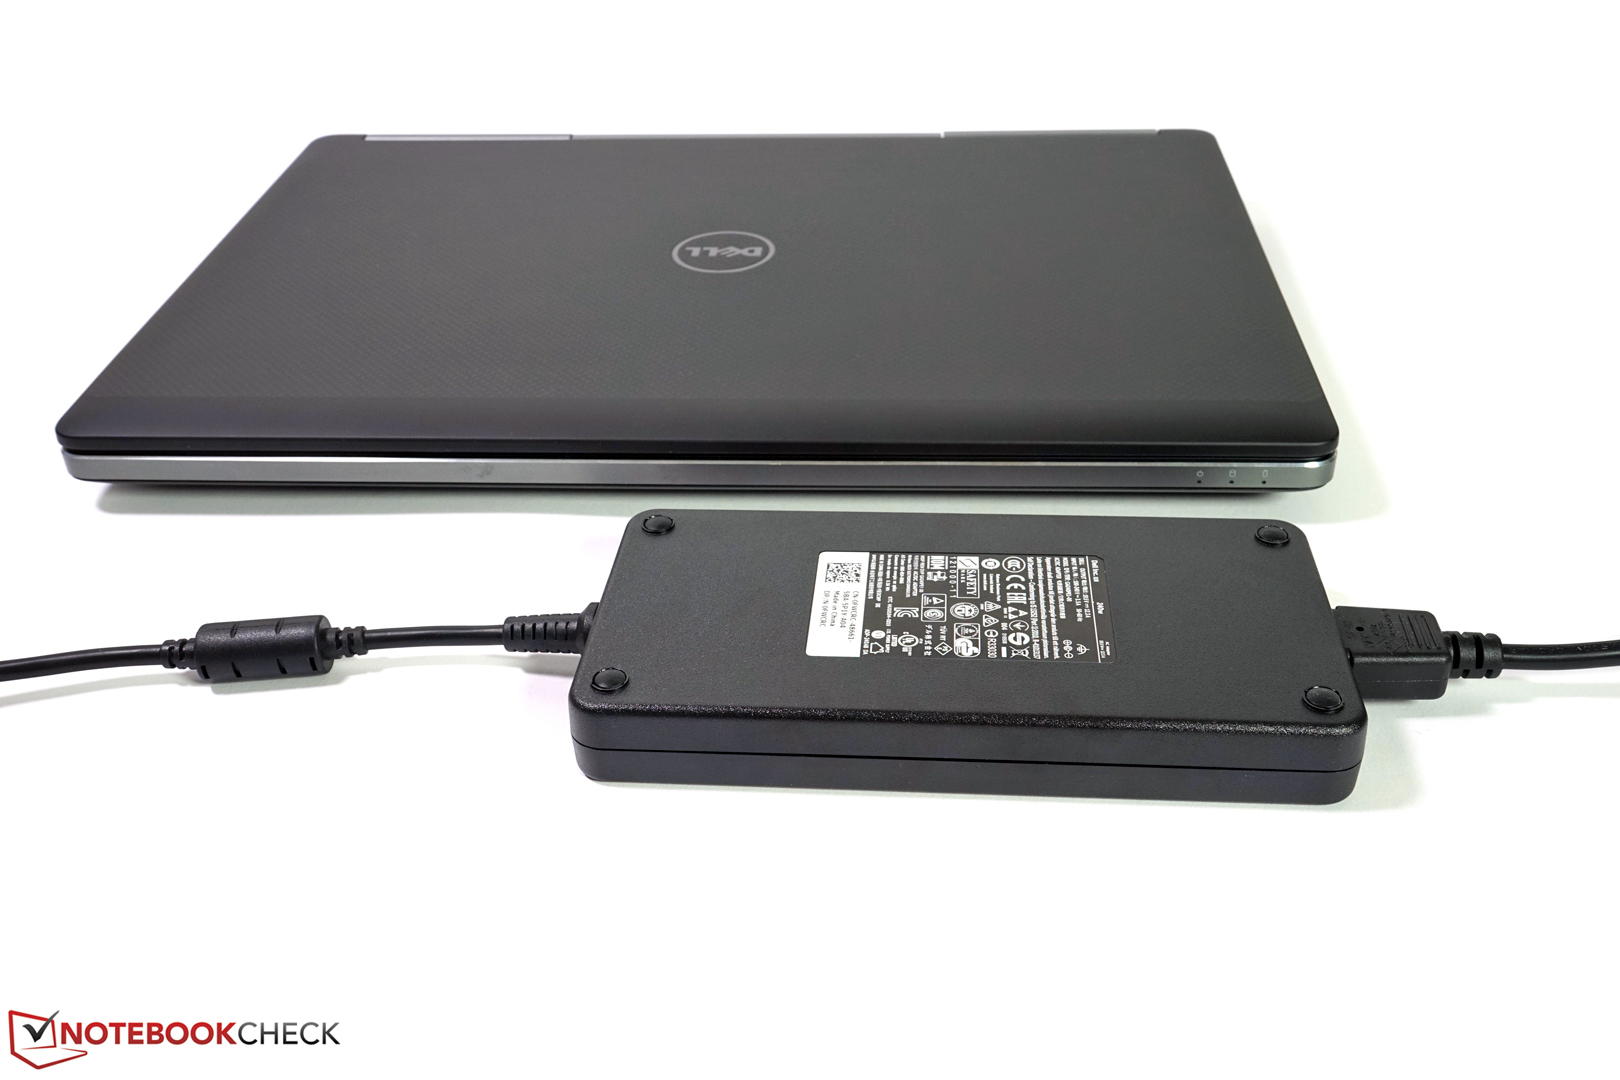
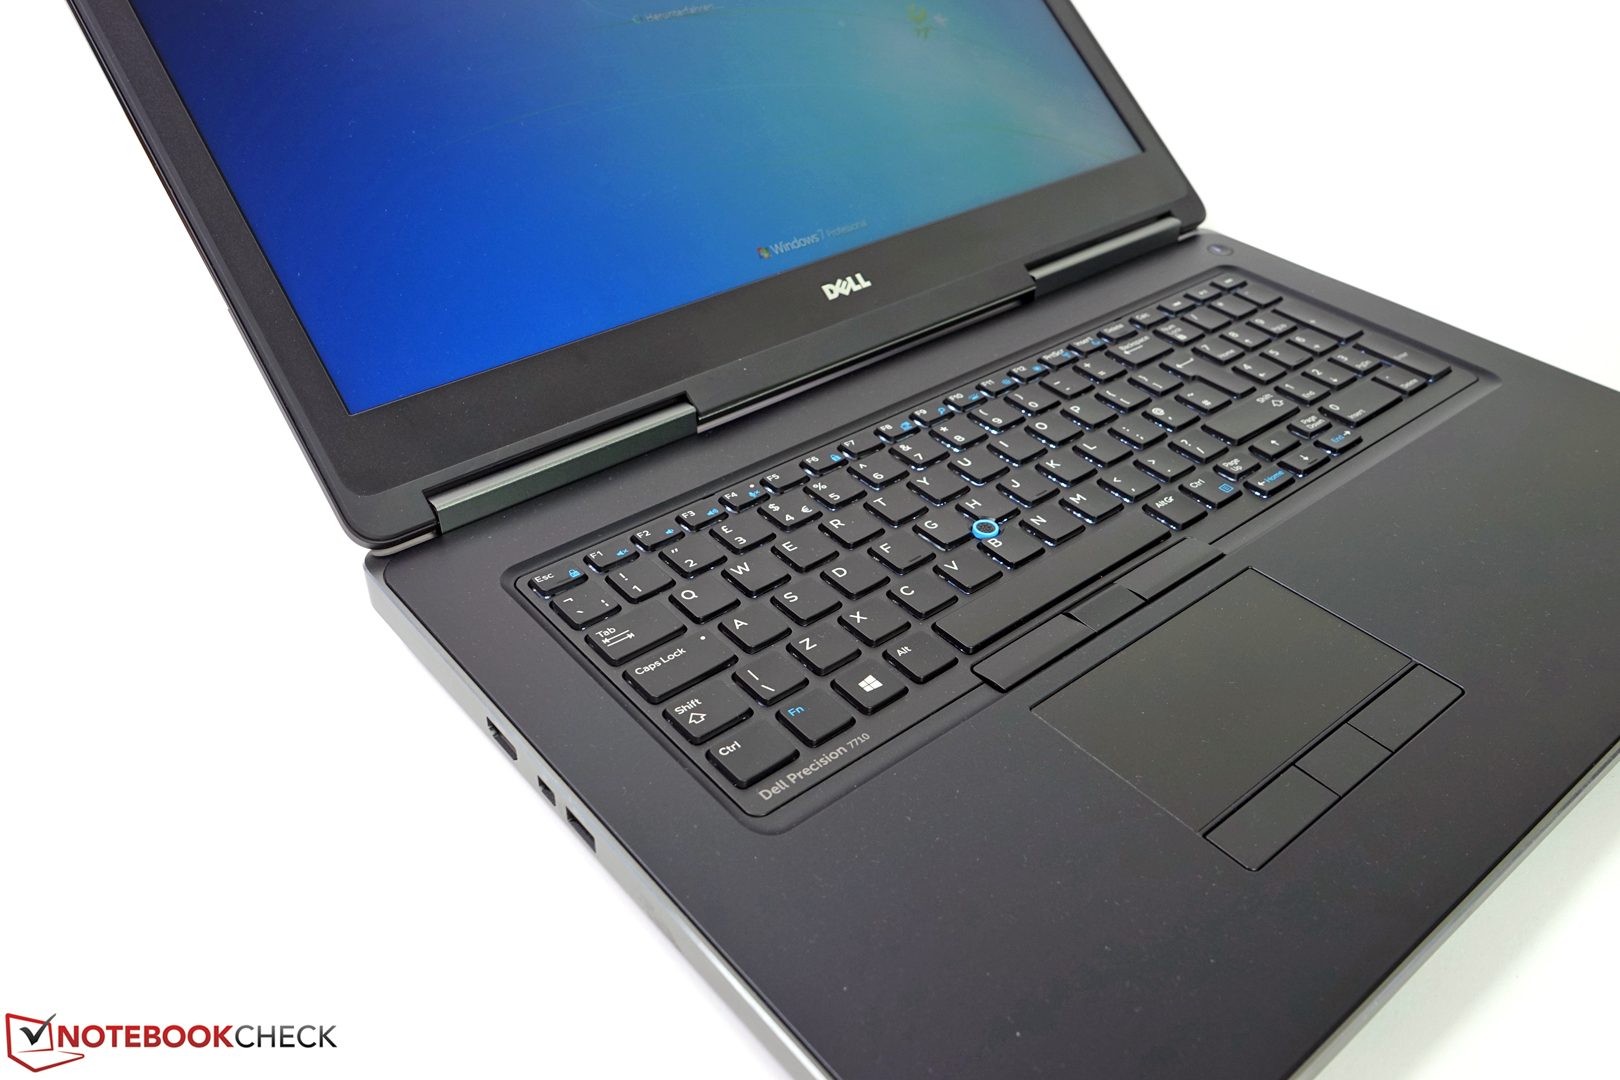
Dells Precision 7710 is volledig vernieuwd en gemoderniseerd.
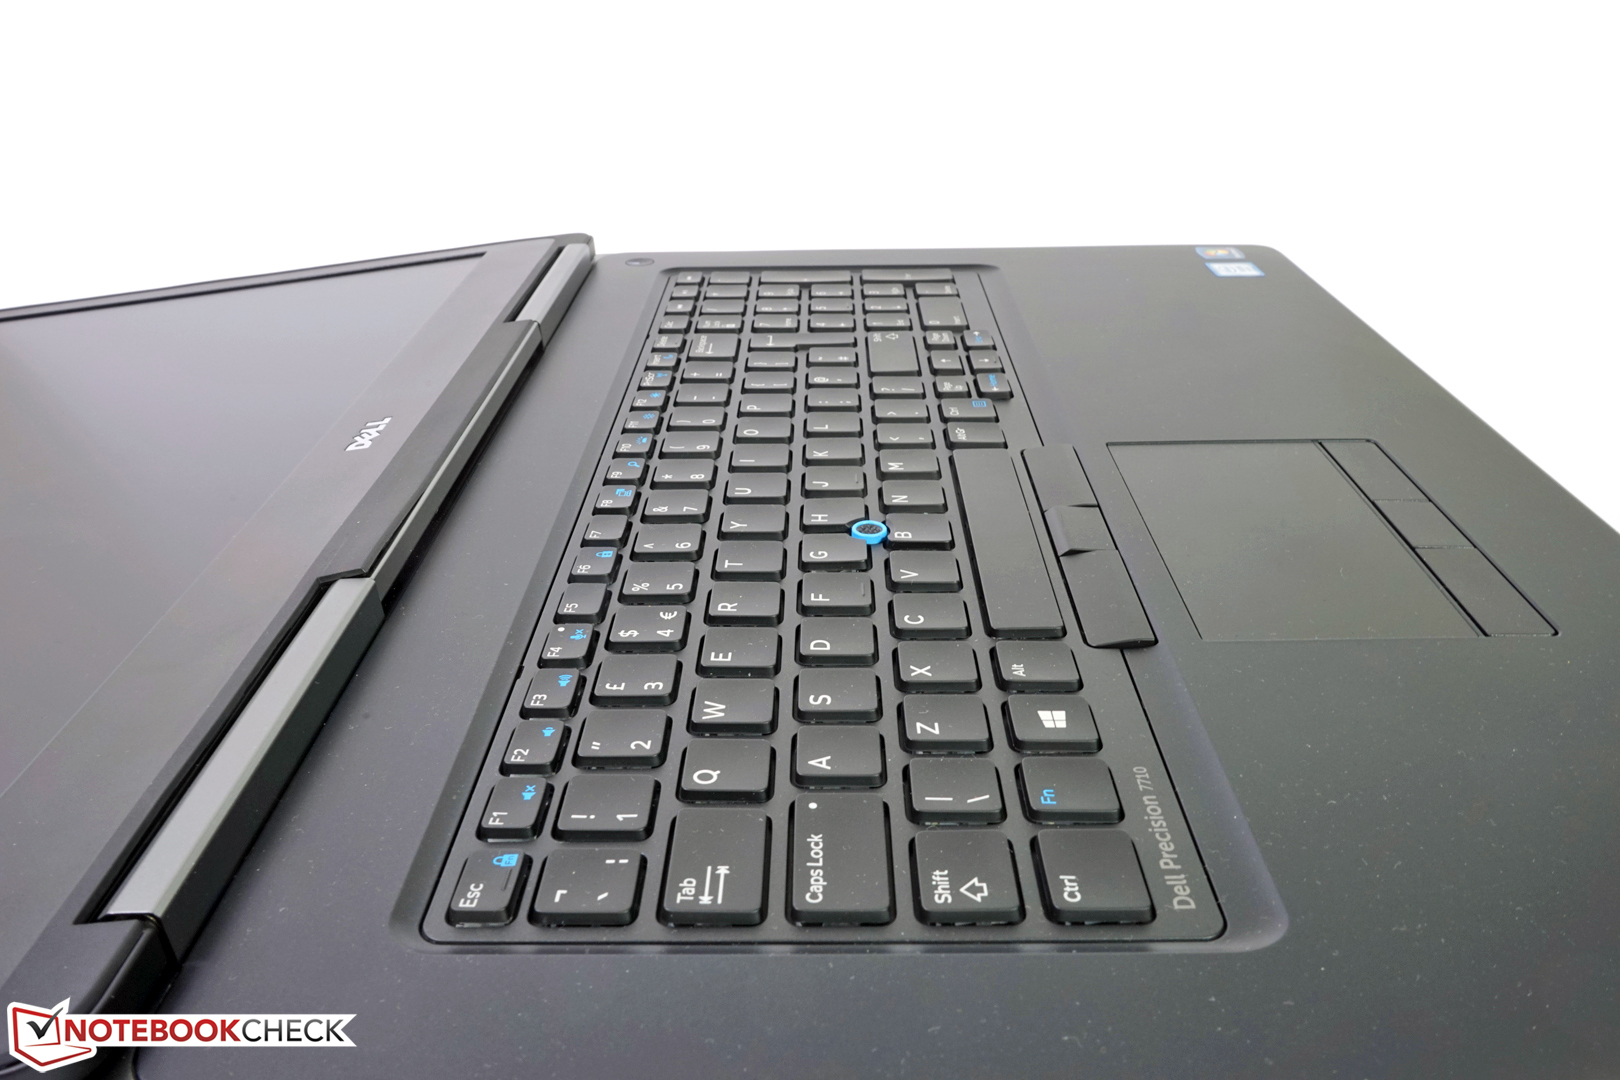
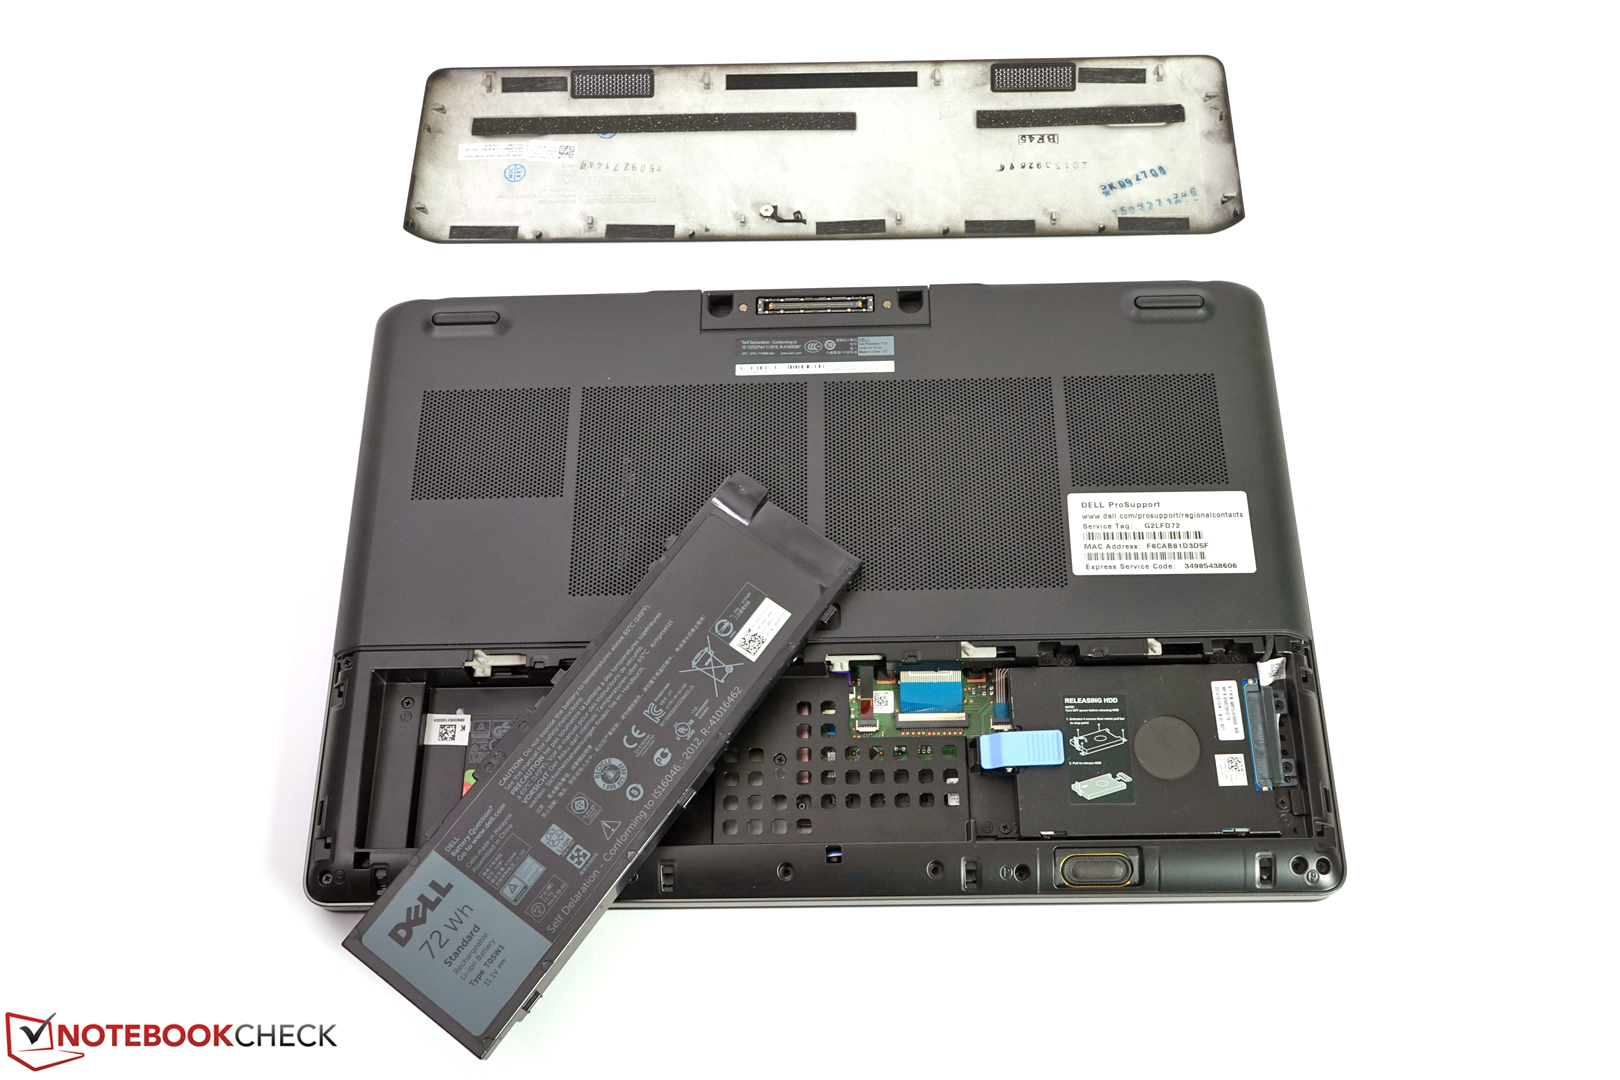
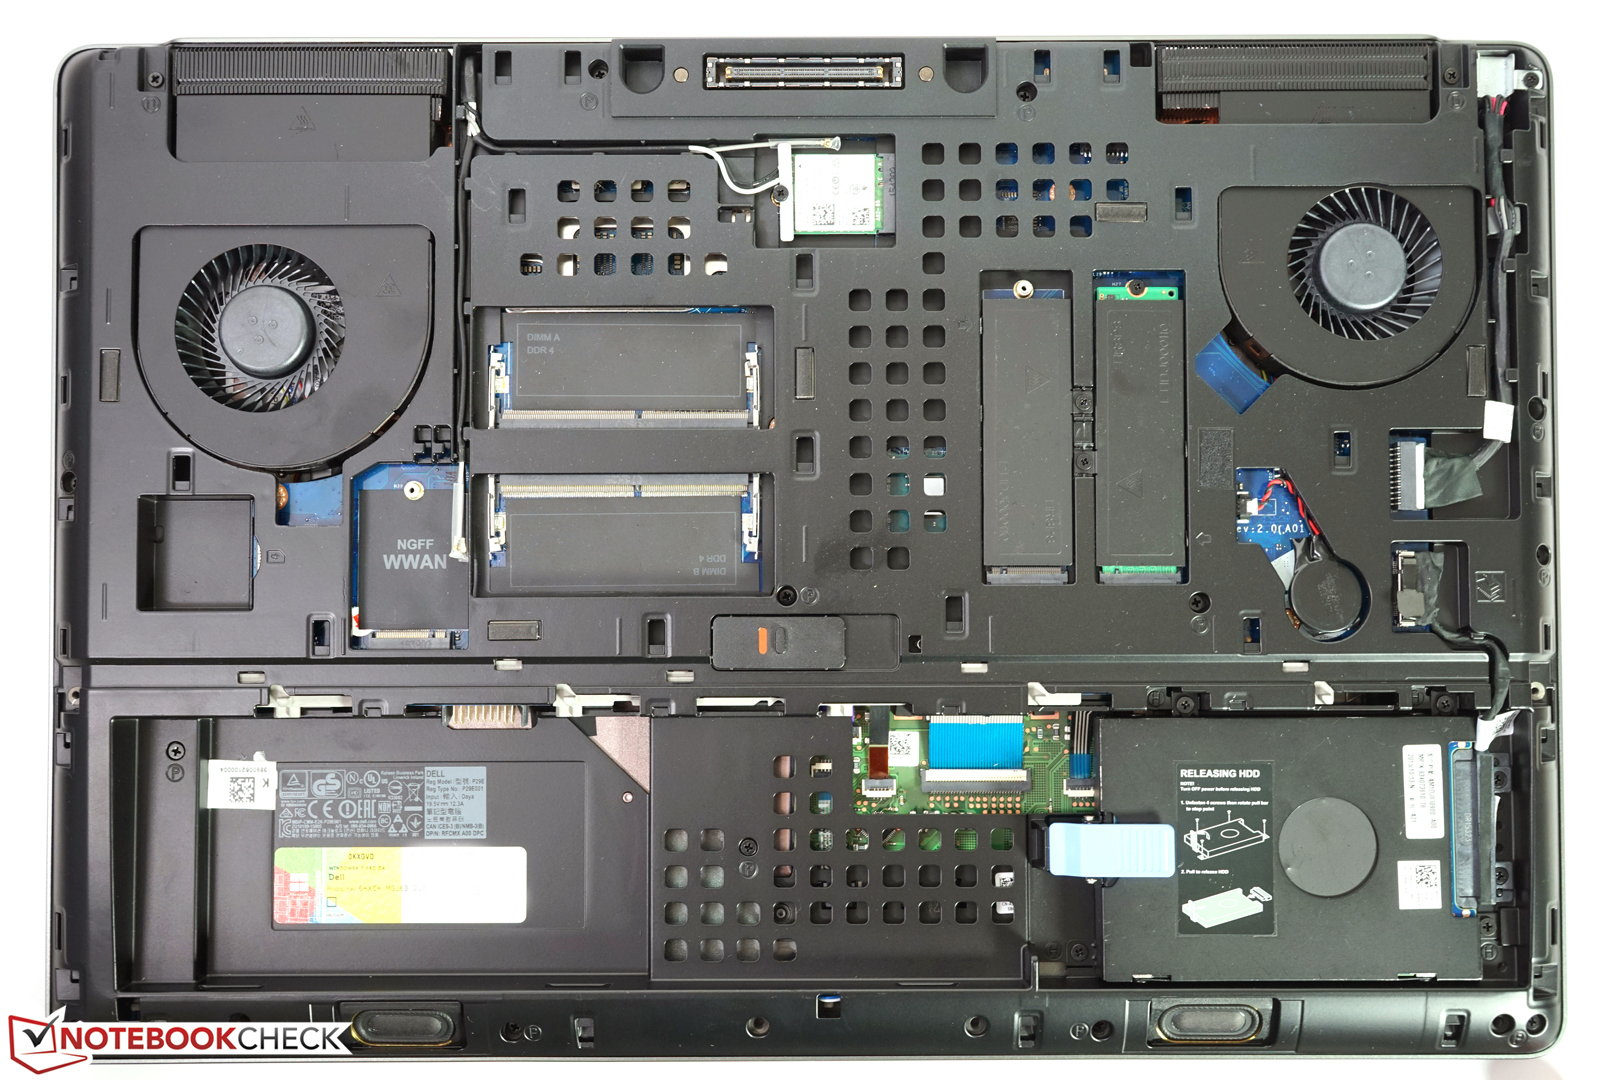
De koper krijgt een mobiel werkstation met zeer goede prestaties, eenvoudig onderhoud, geschikte invoerapparaten en een kwalitatief hoogstaand Full HD beeldscherm.
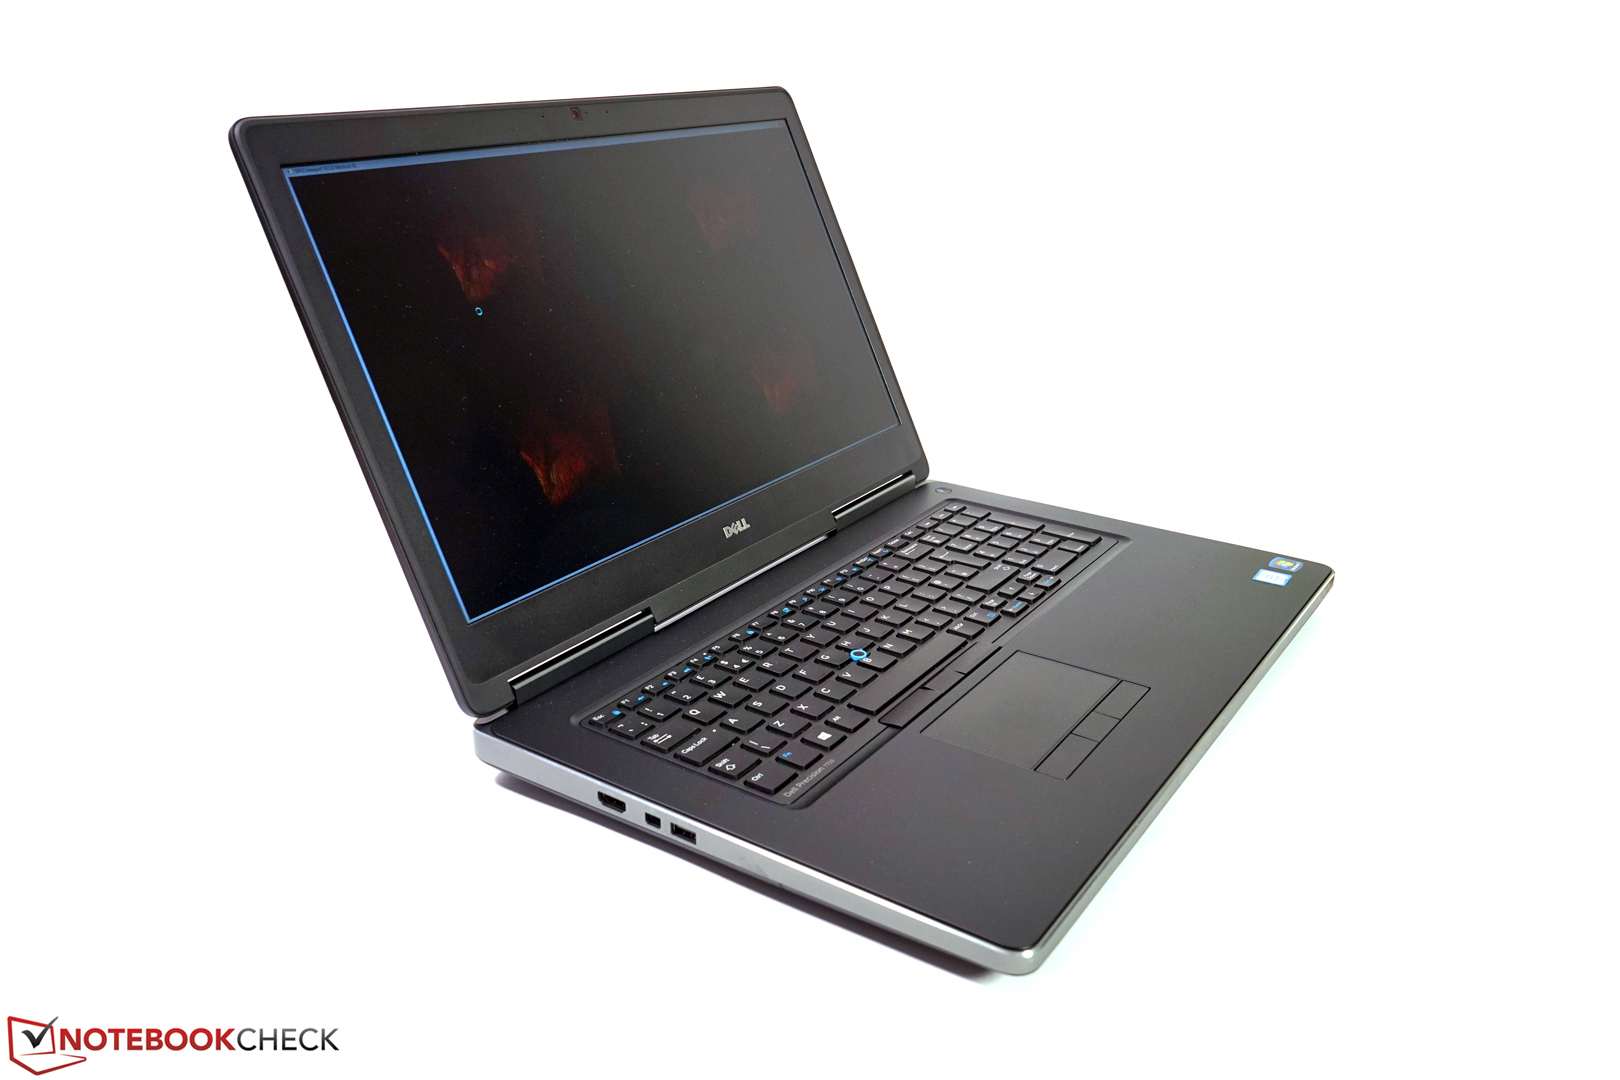
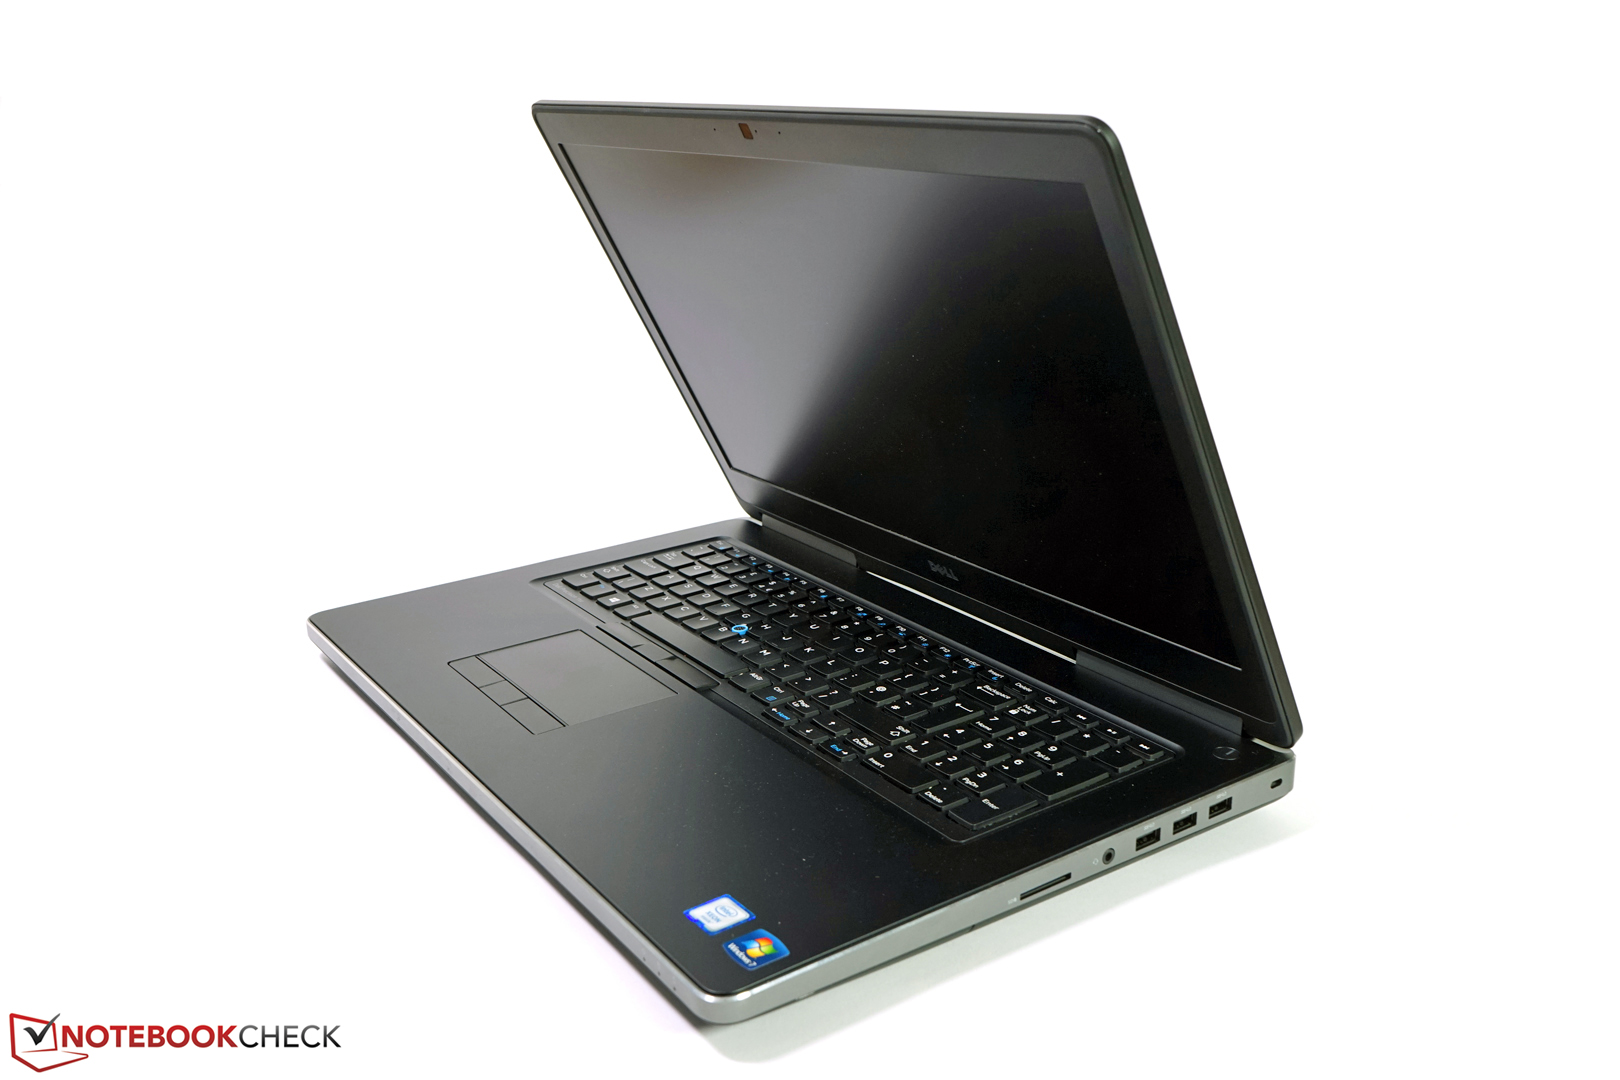
Zoals we gewend zijn van Dell, zijn er veel configuraties verkrijgbaar, inclusief optioneel verlengde garantie.
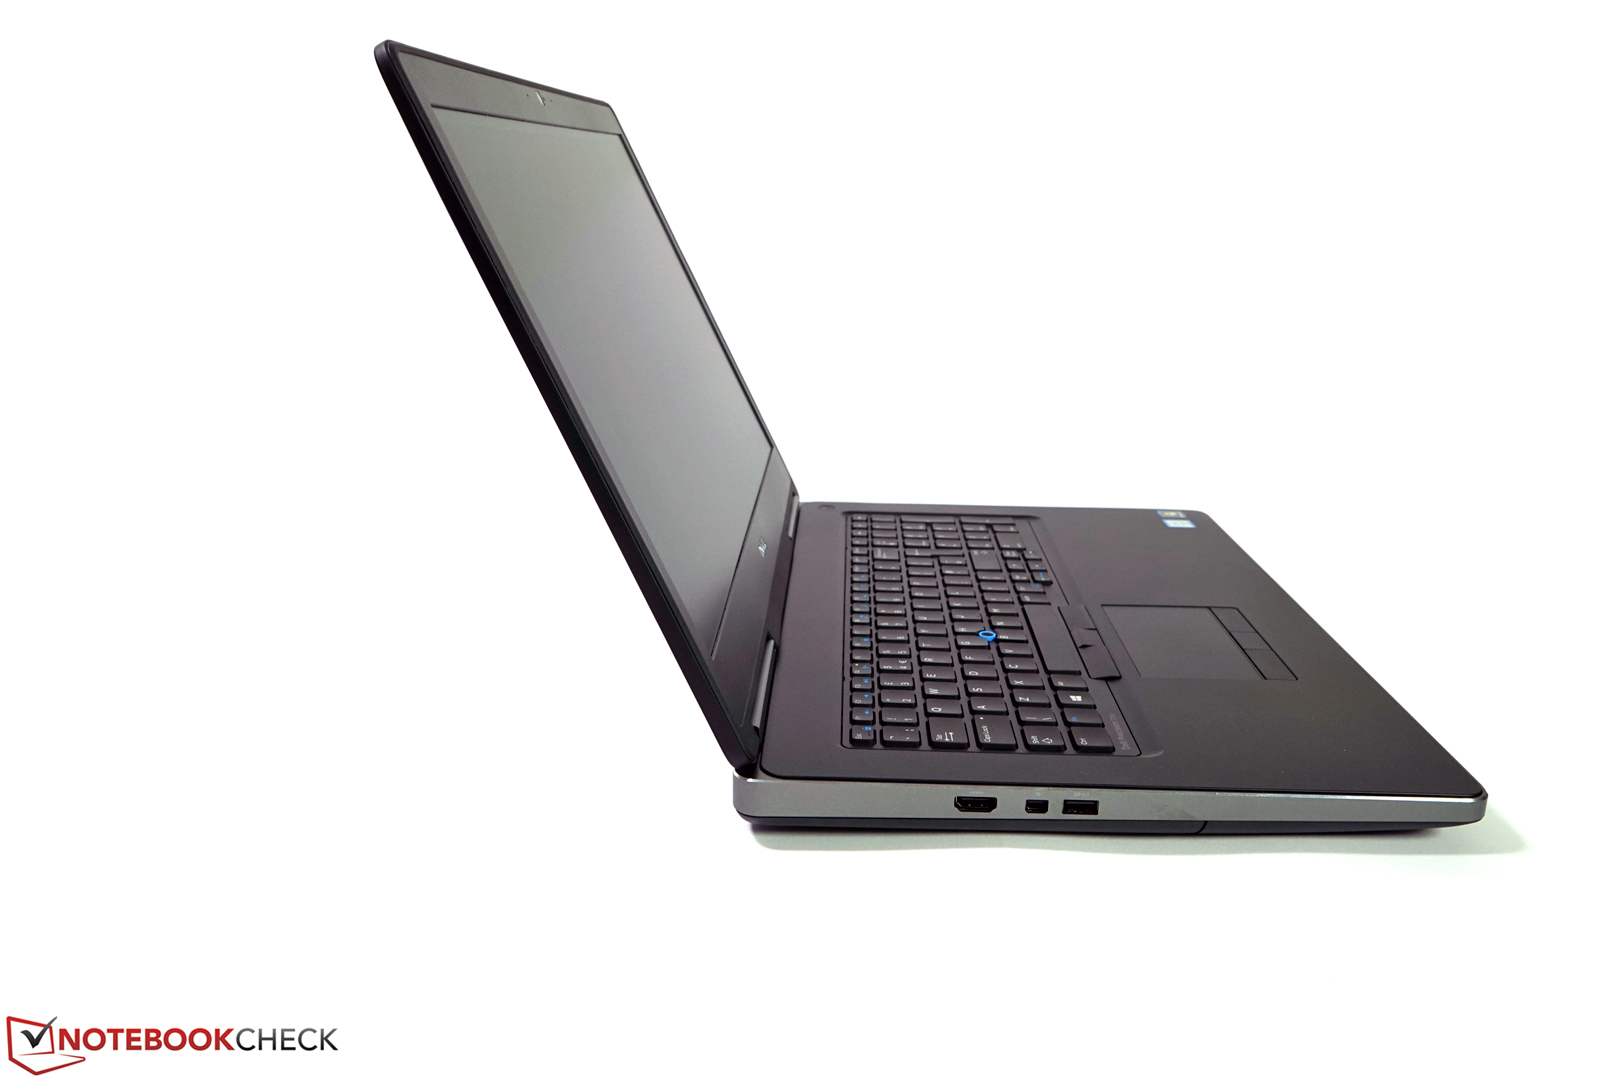
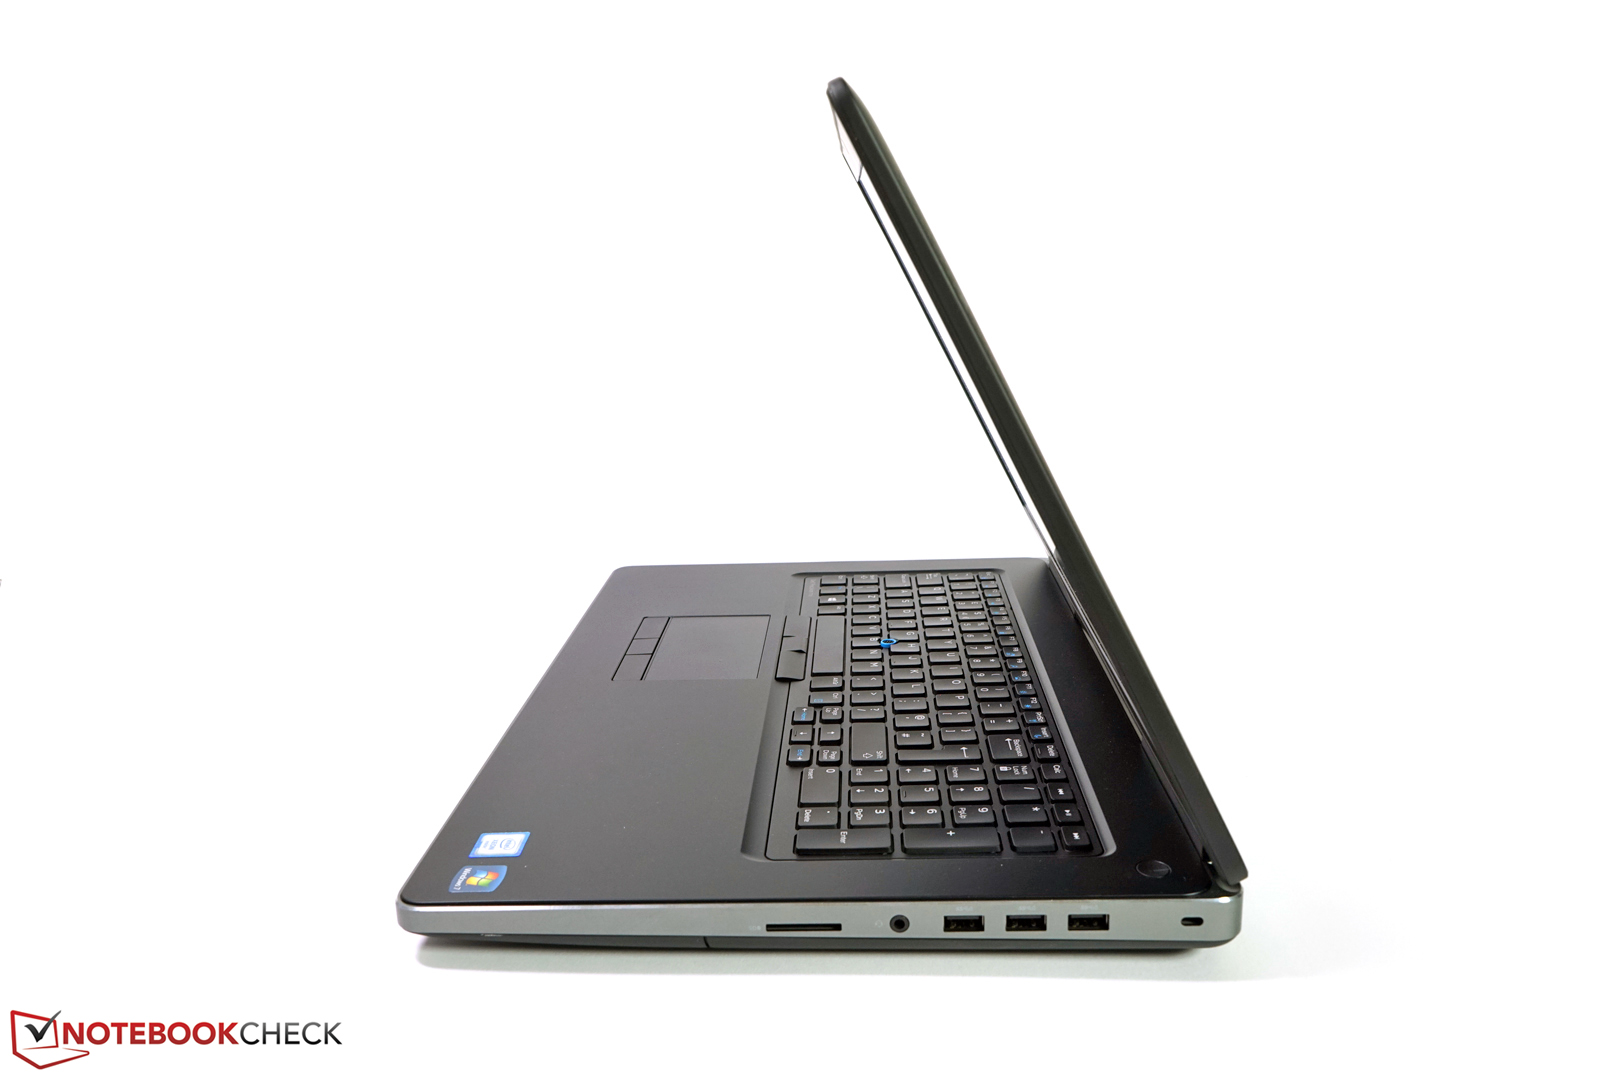
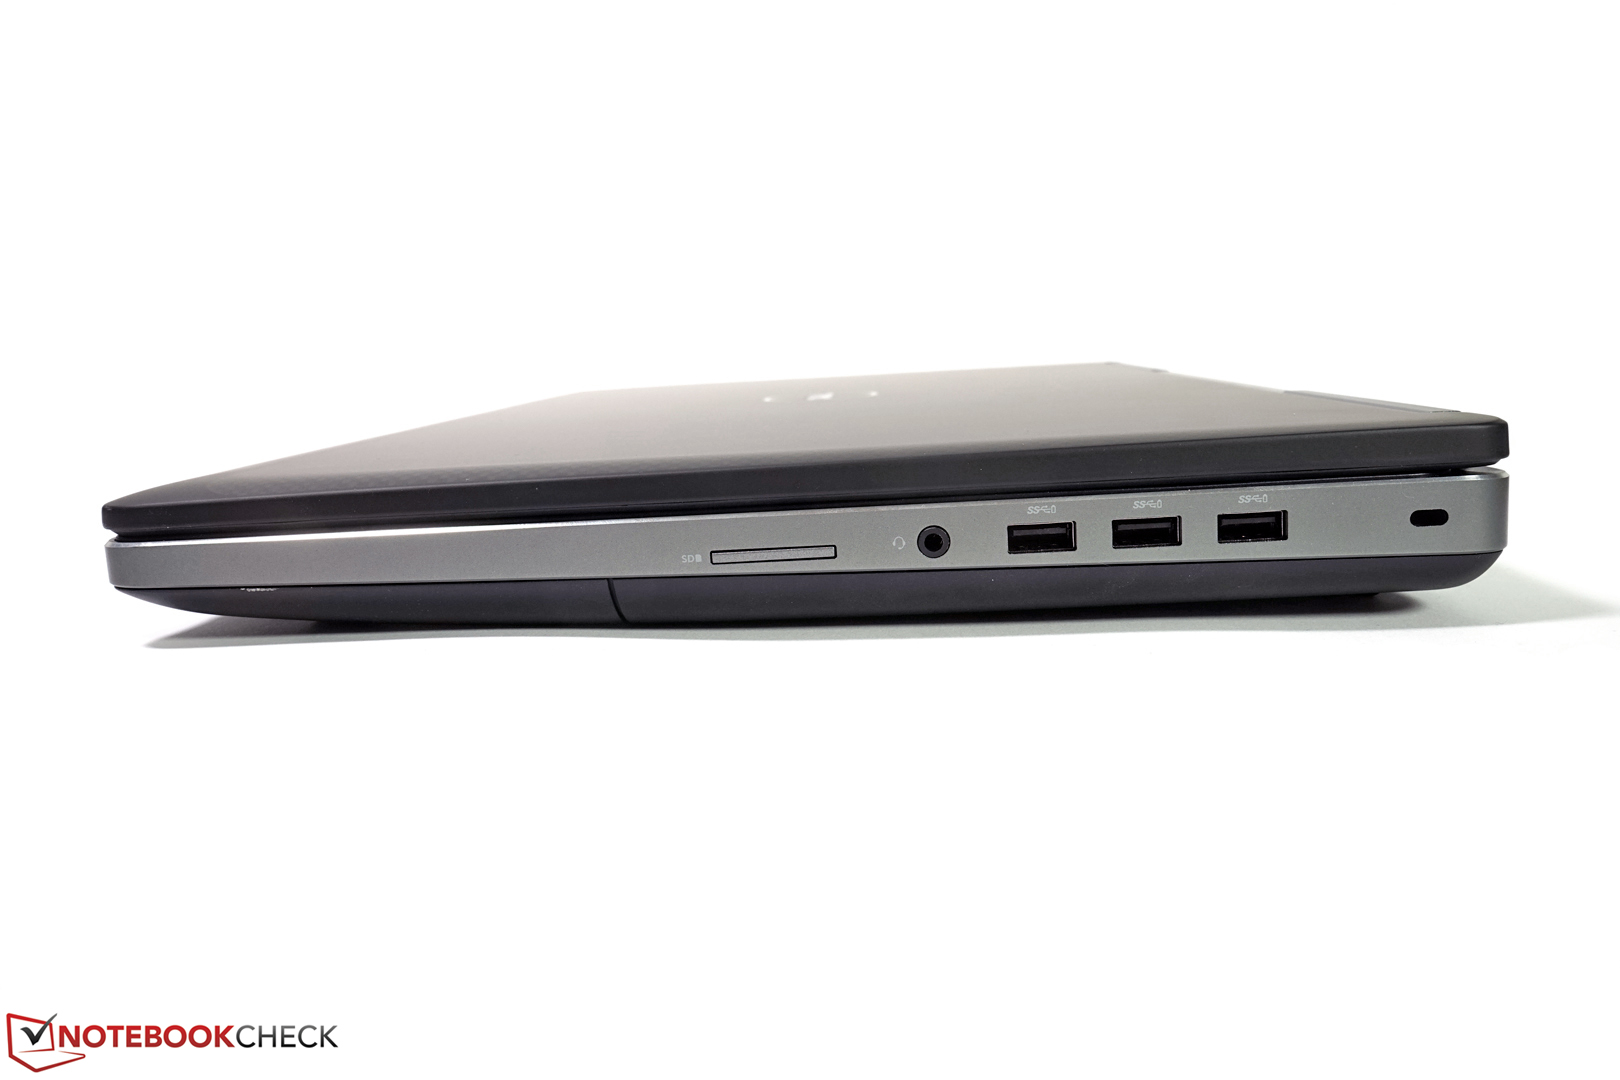
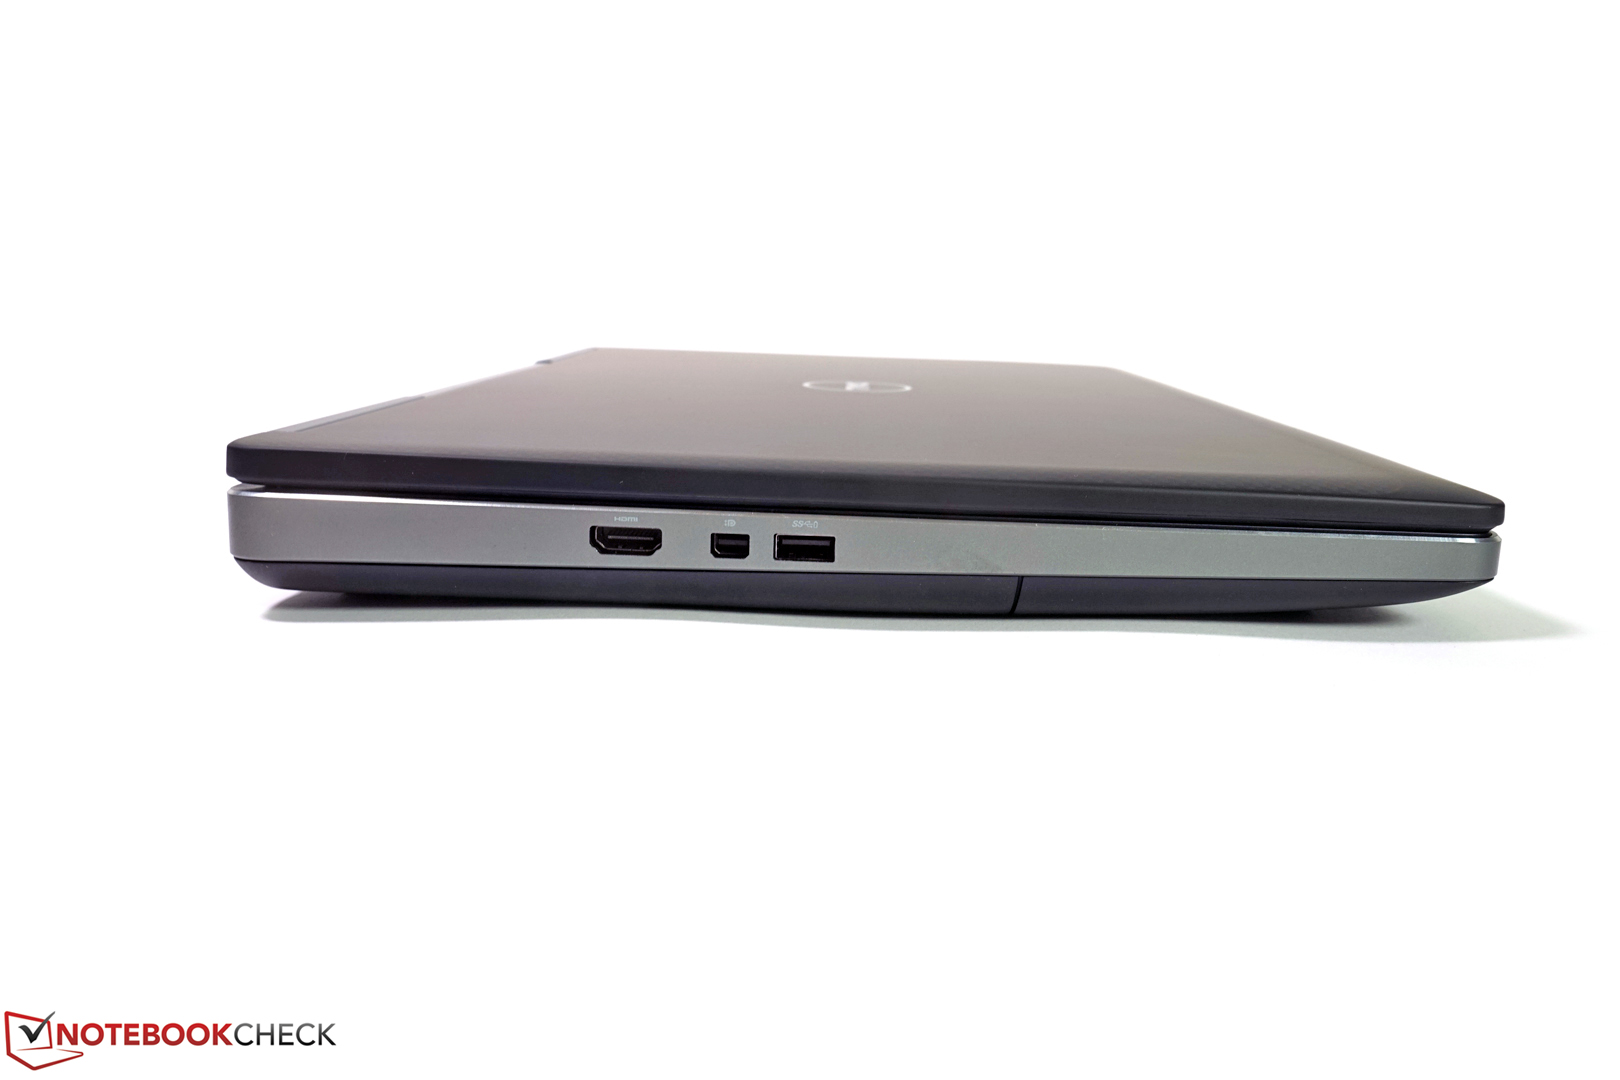
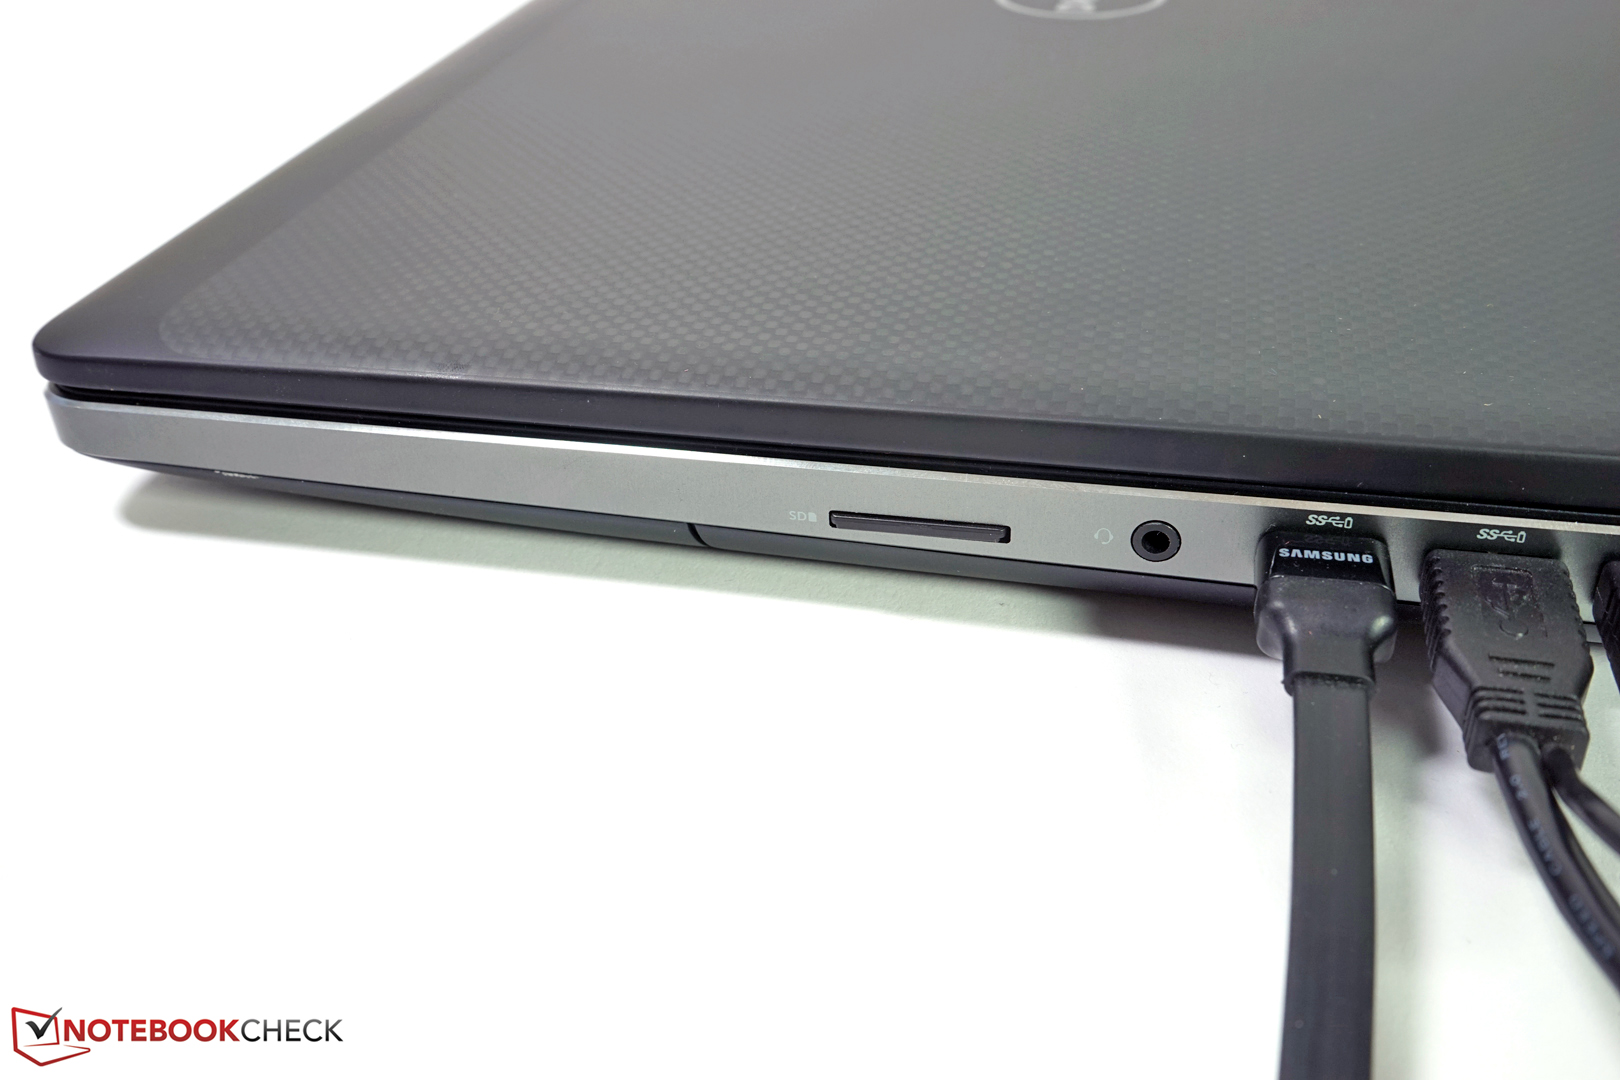
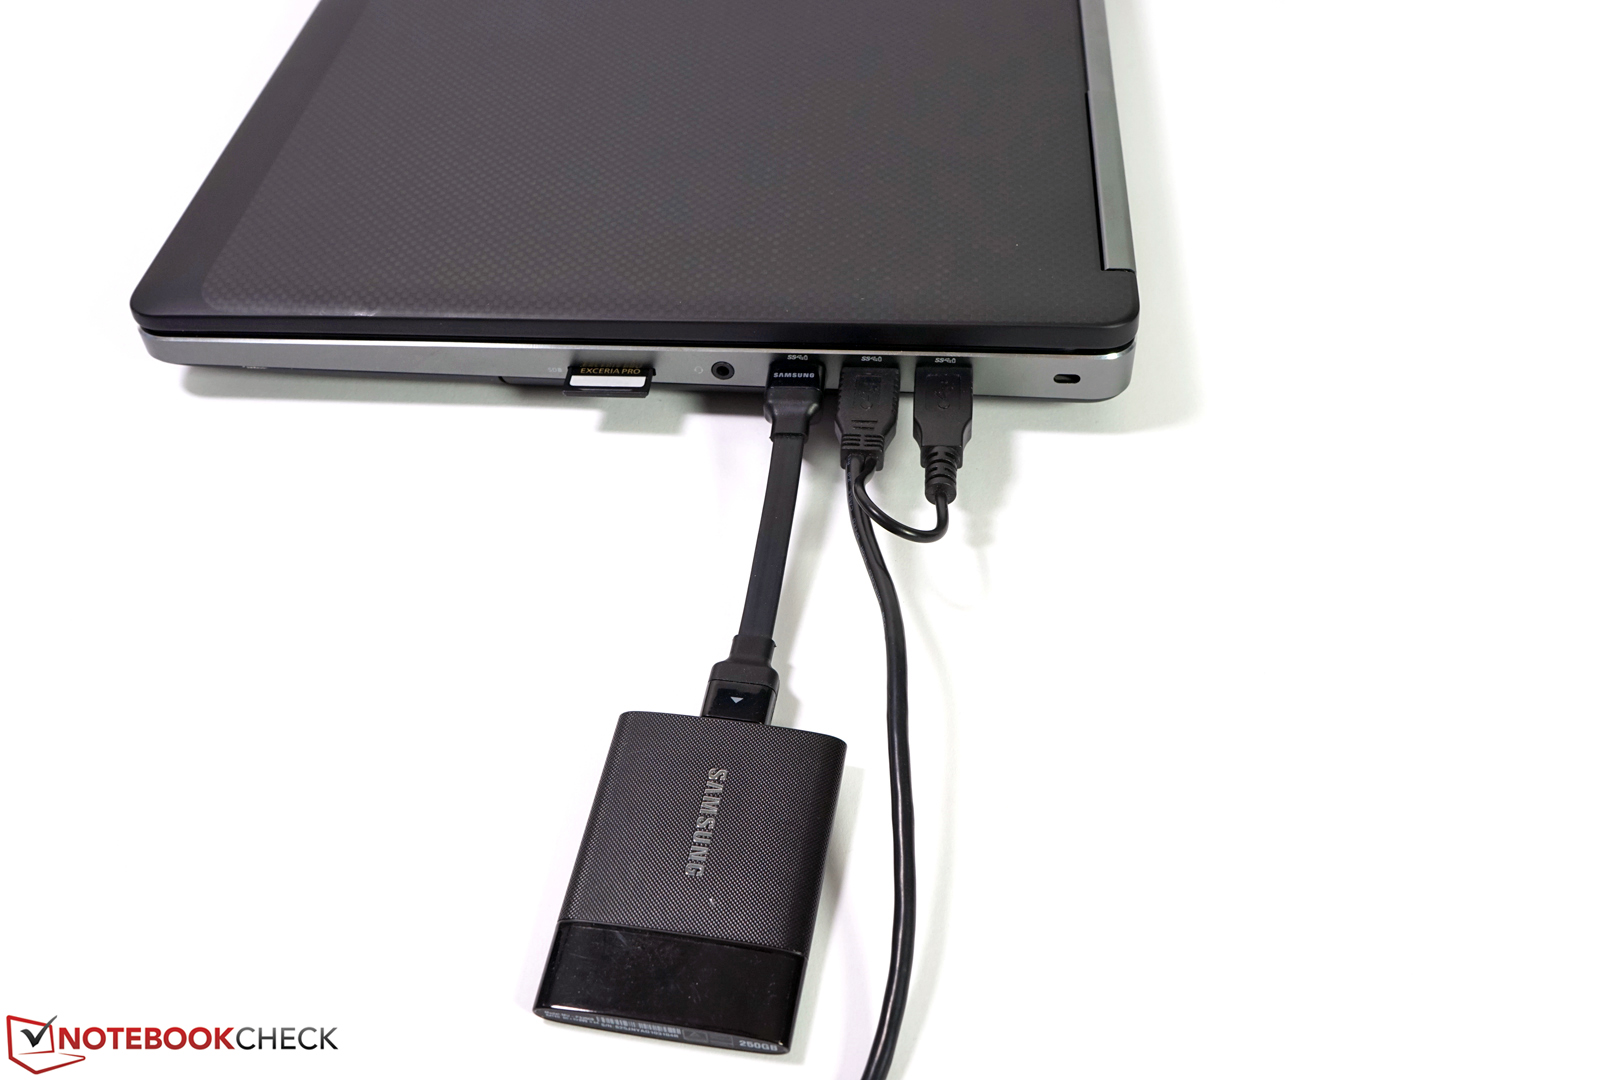
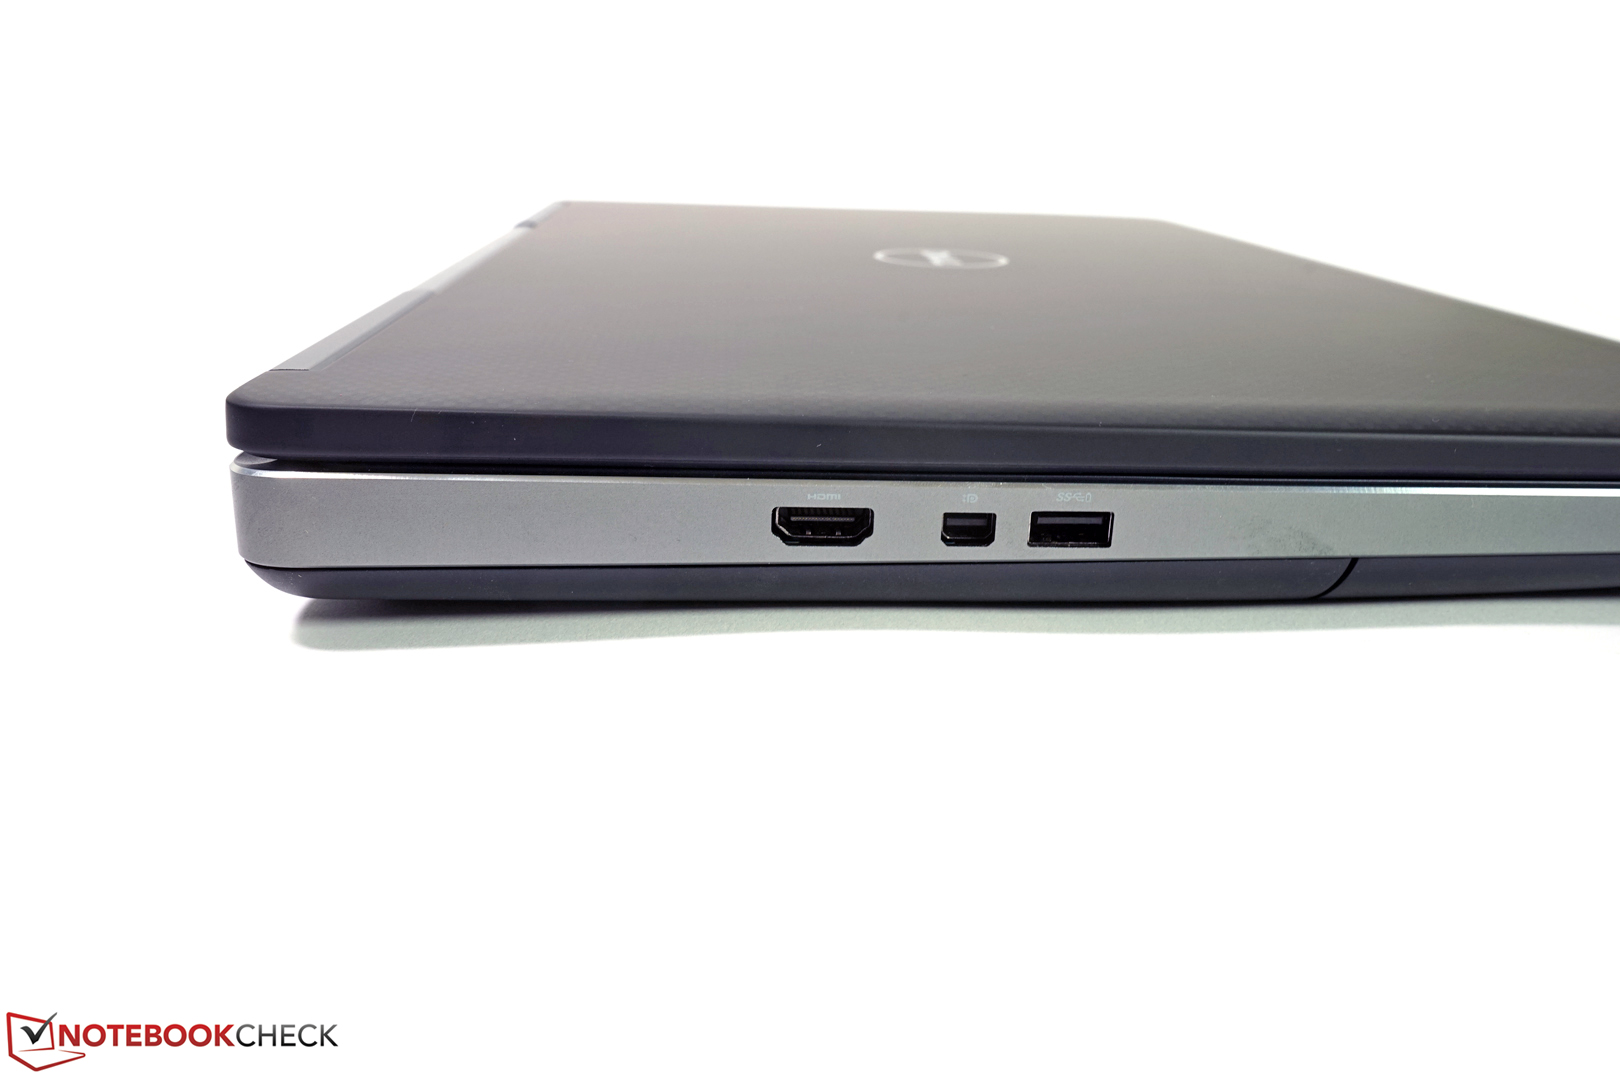
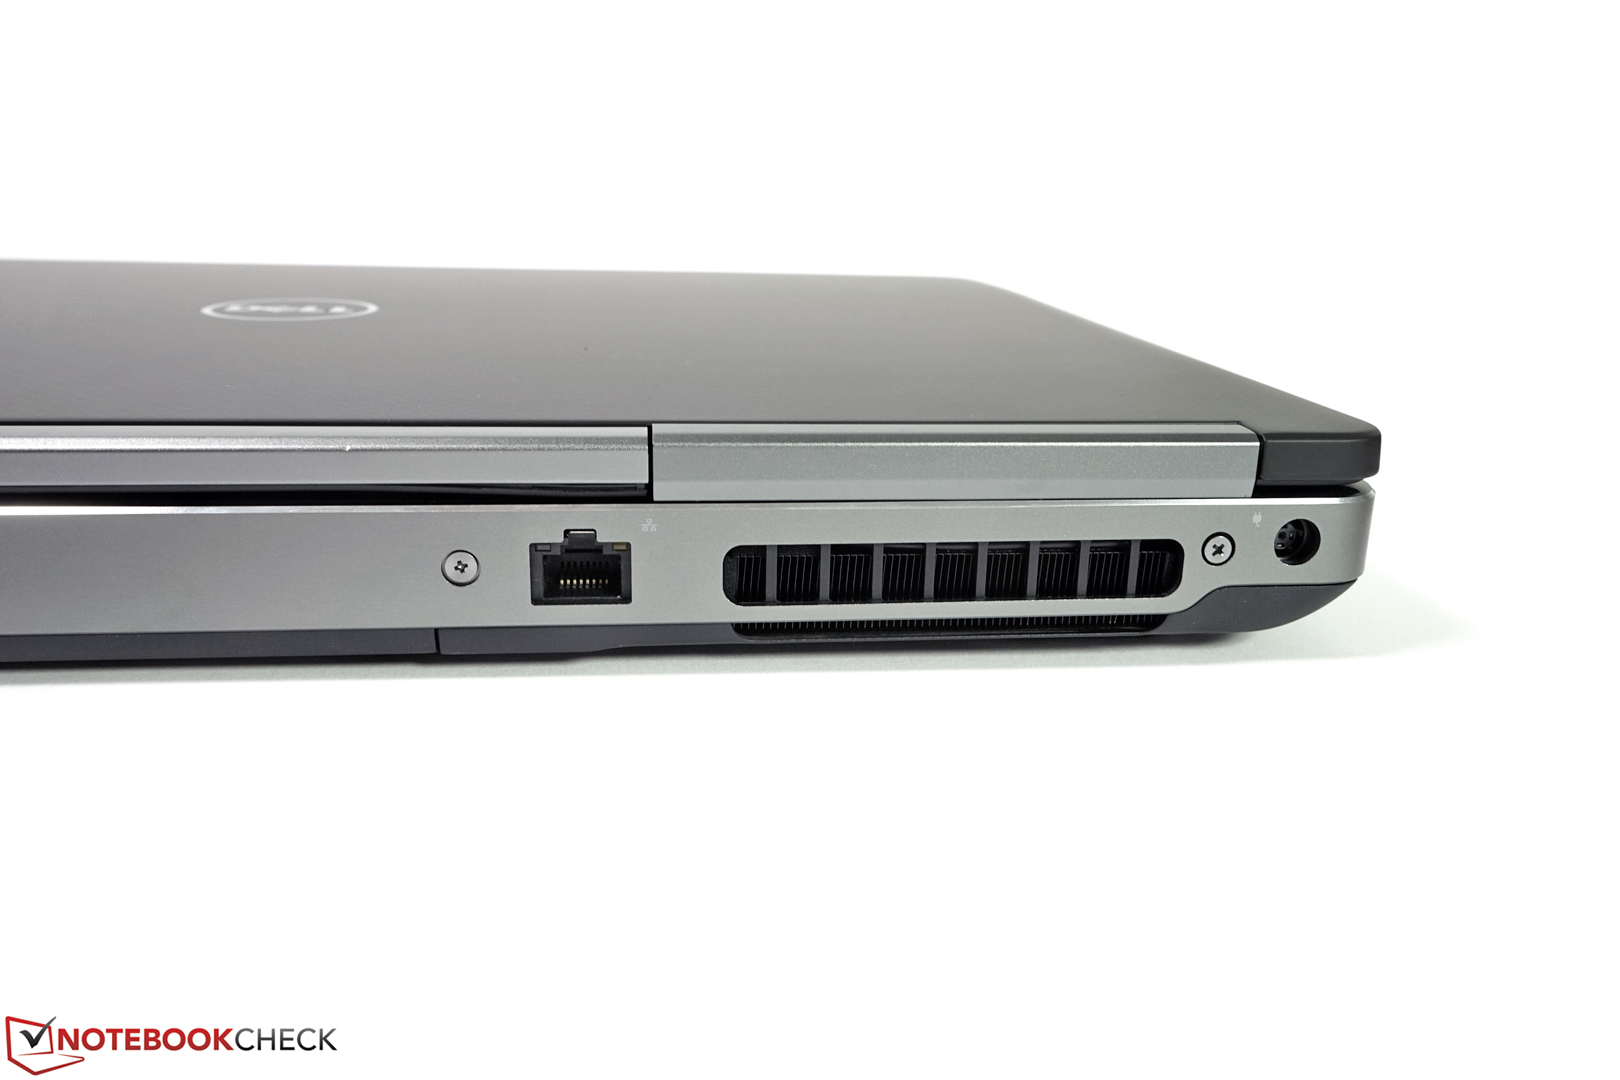
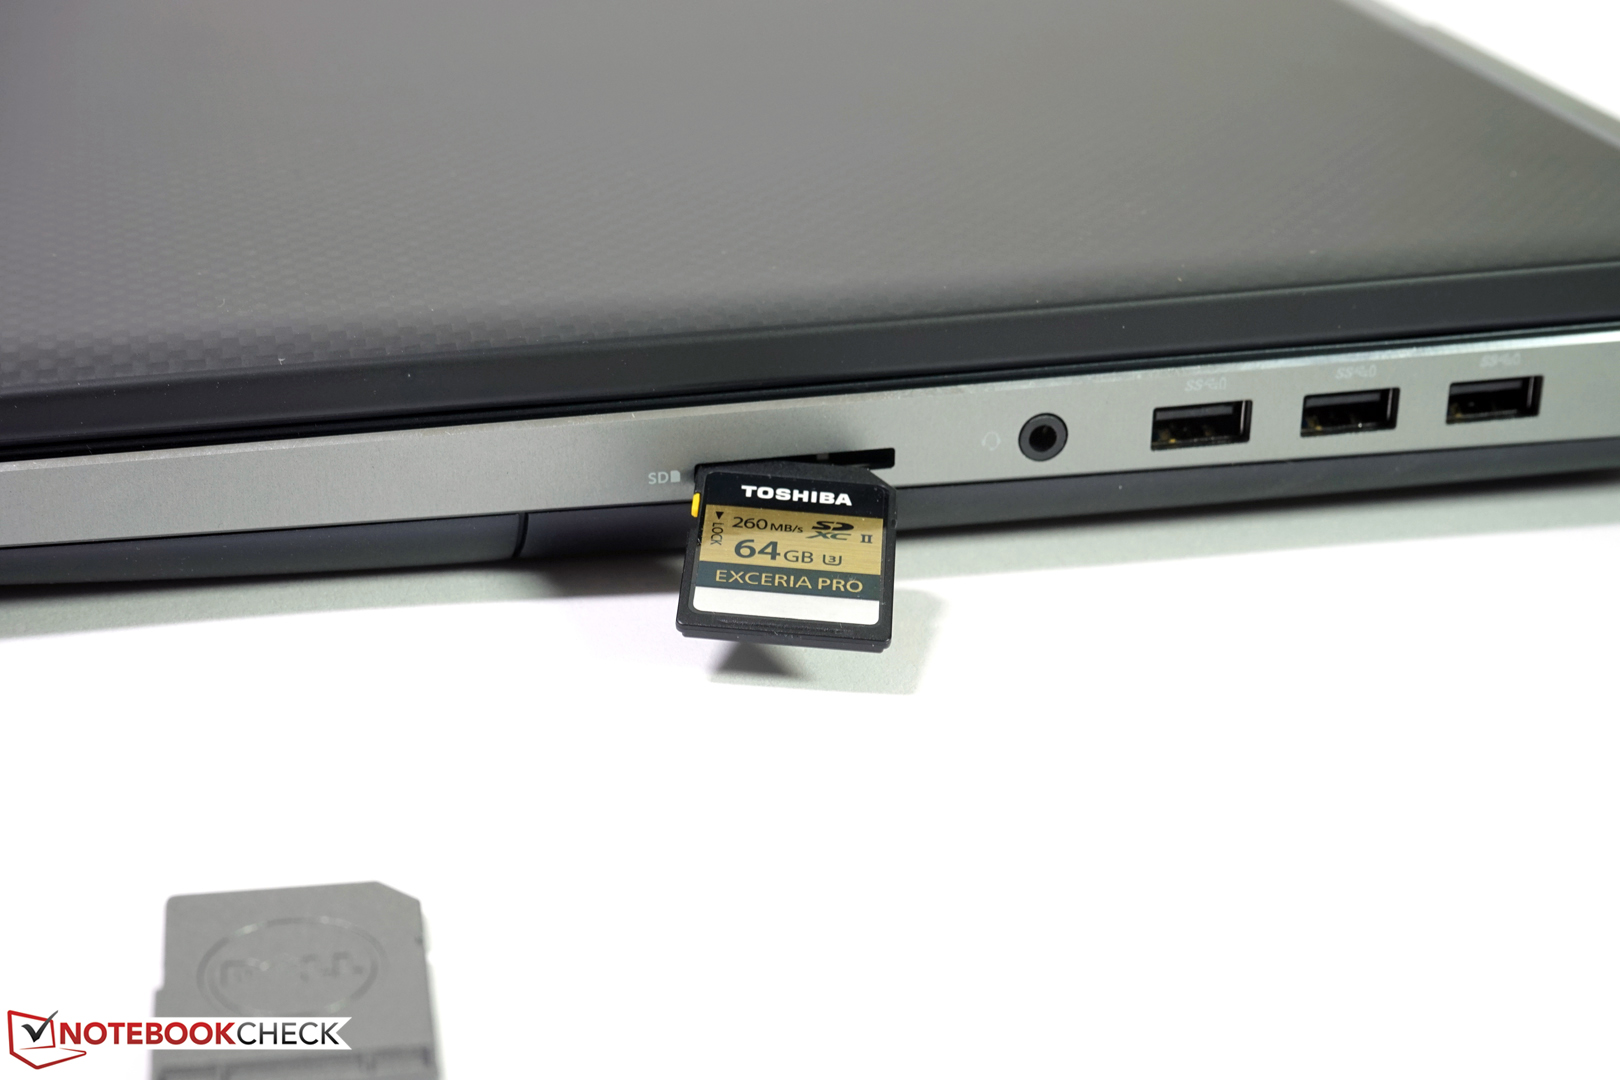
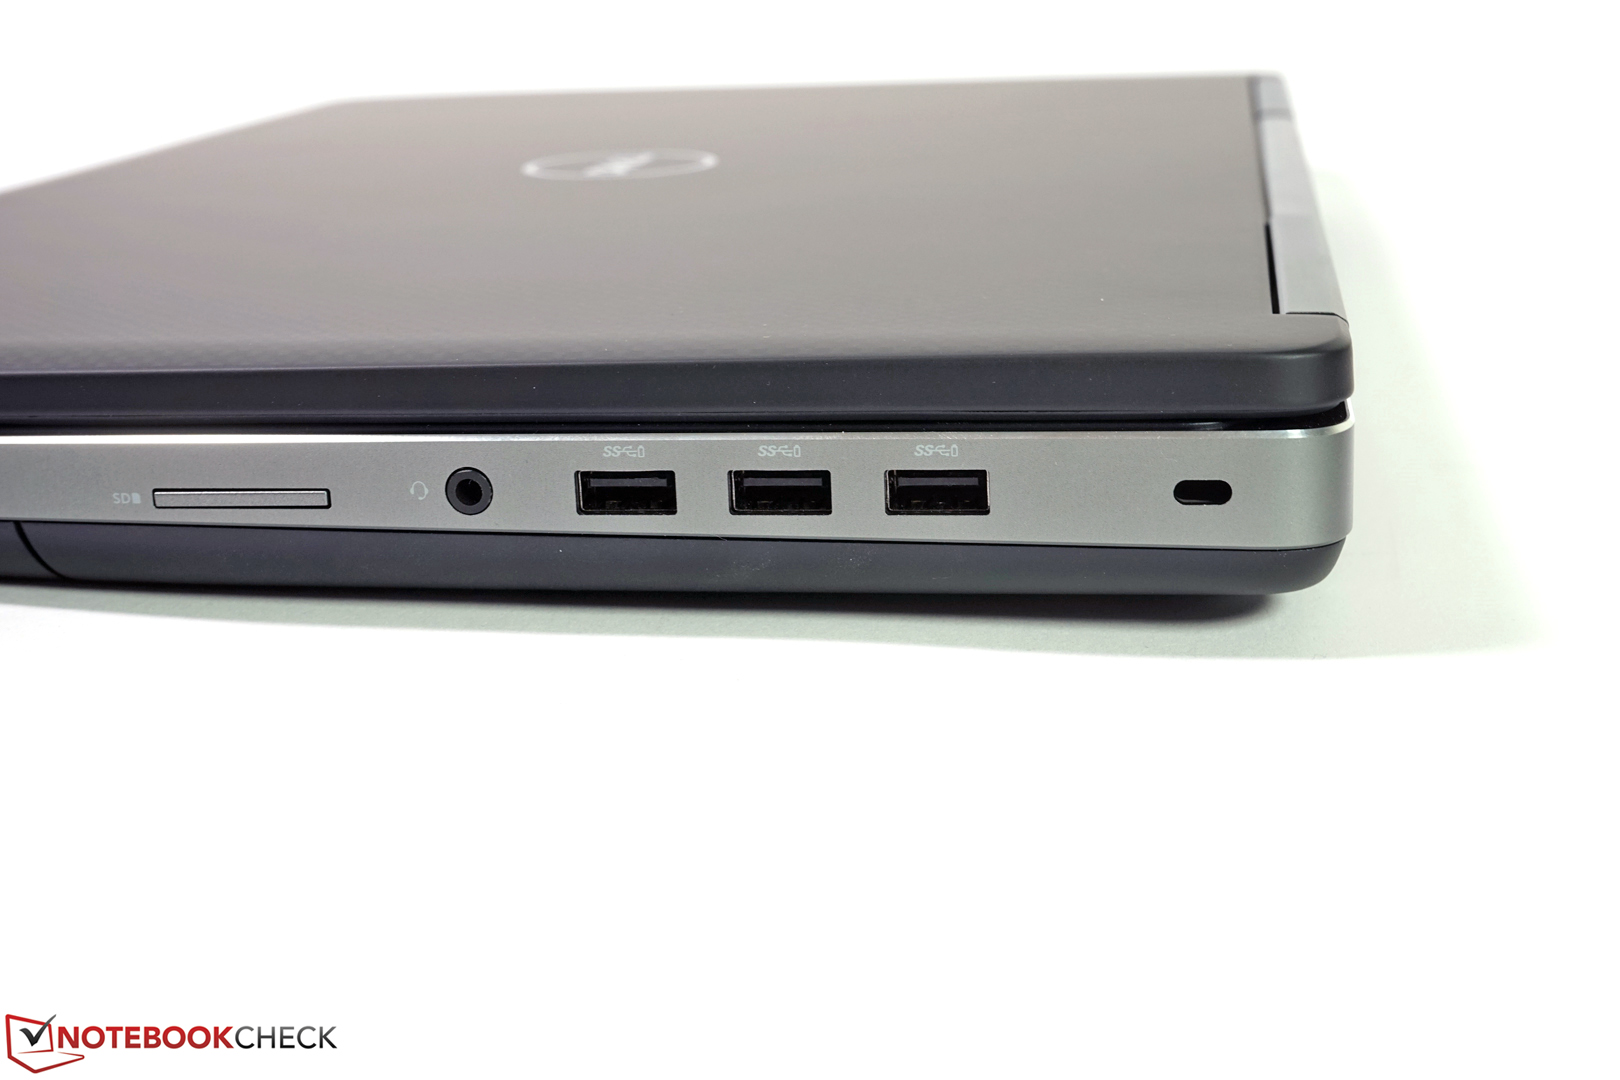
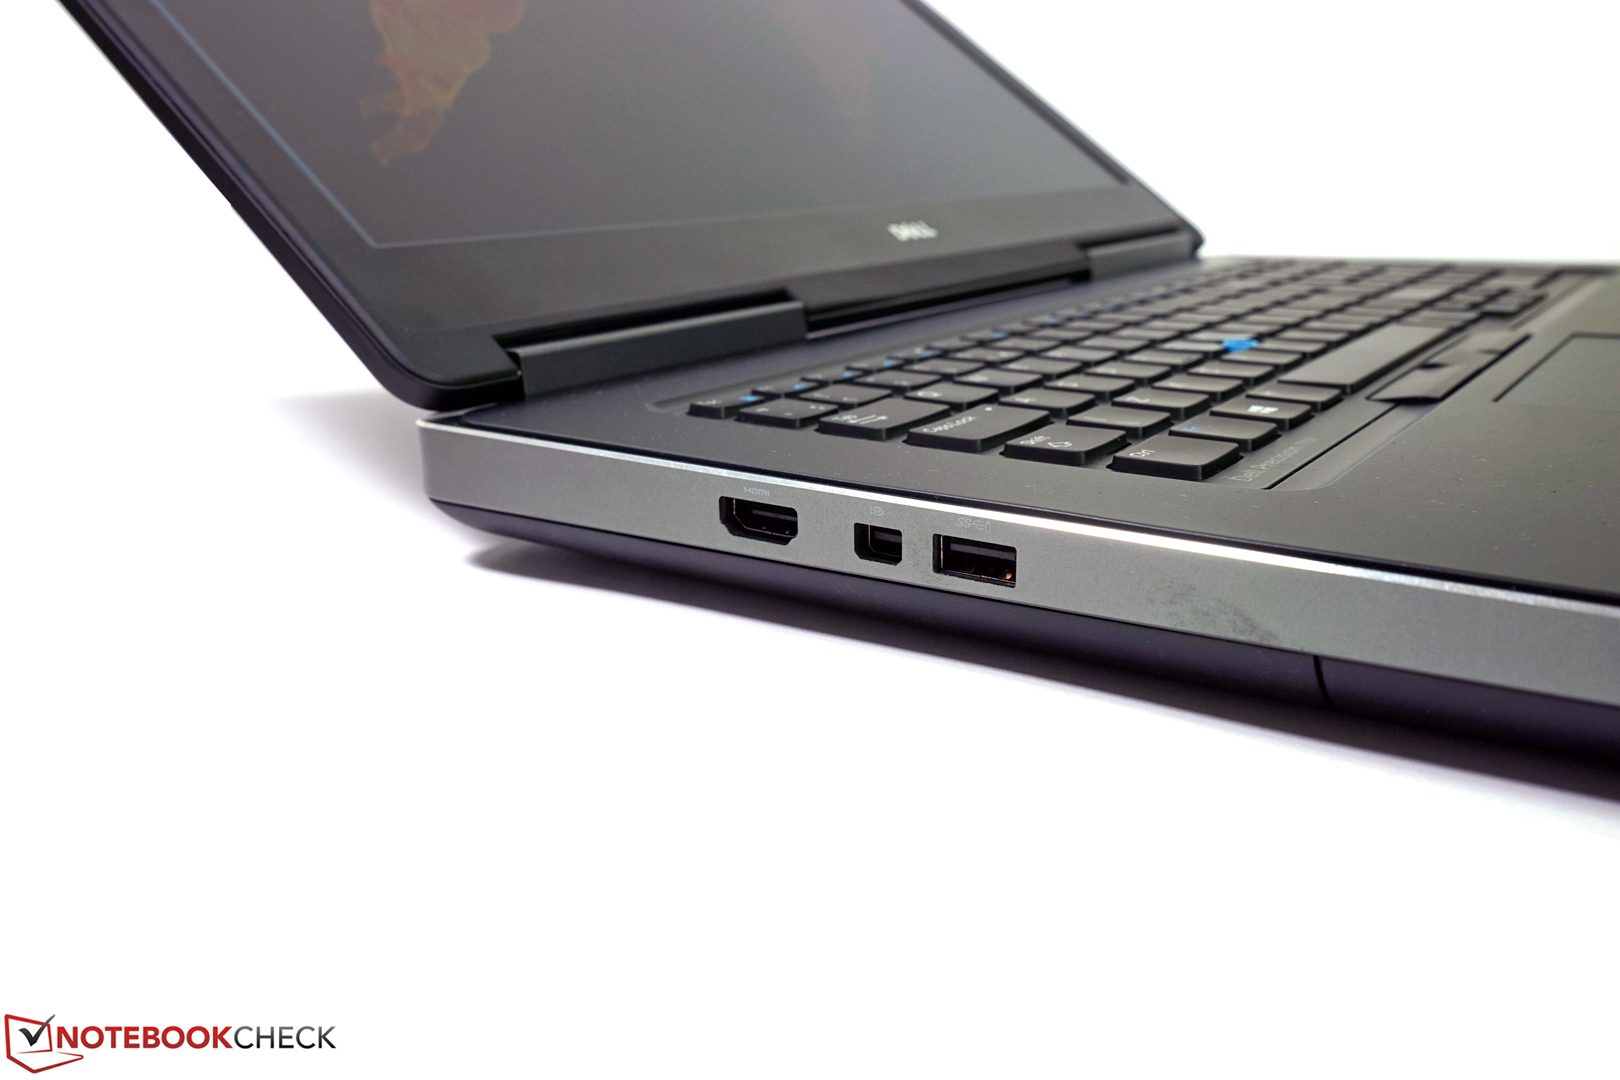
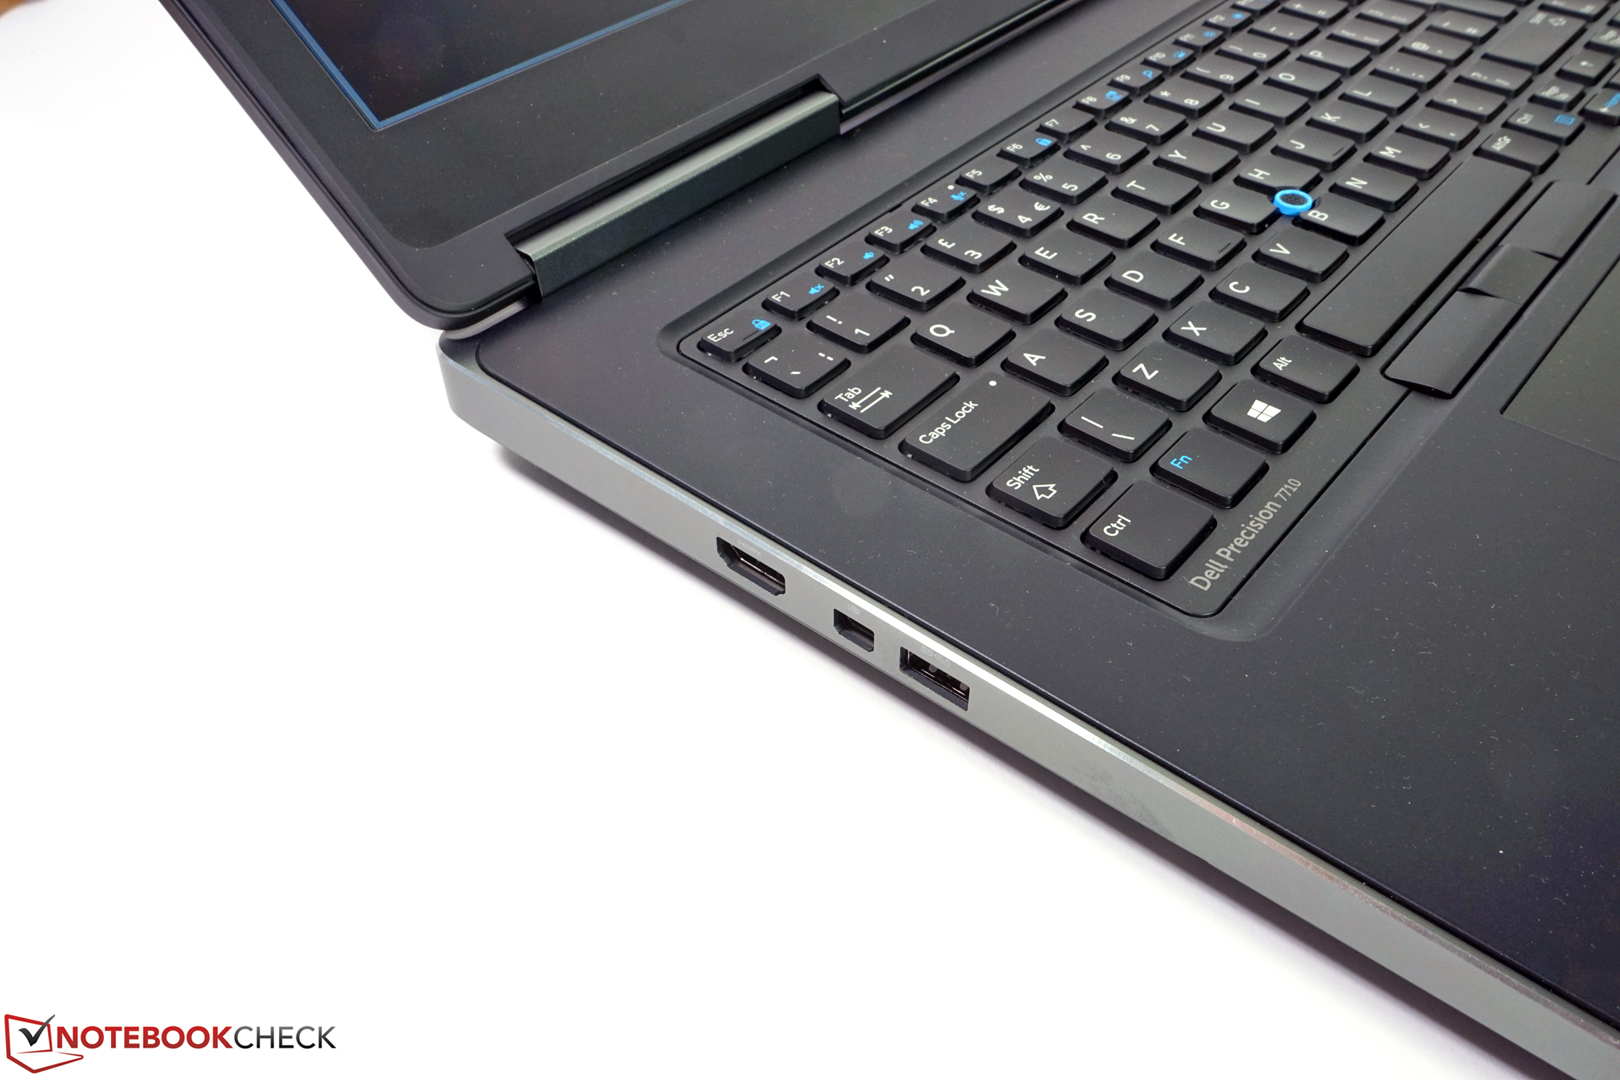
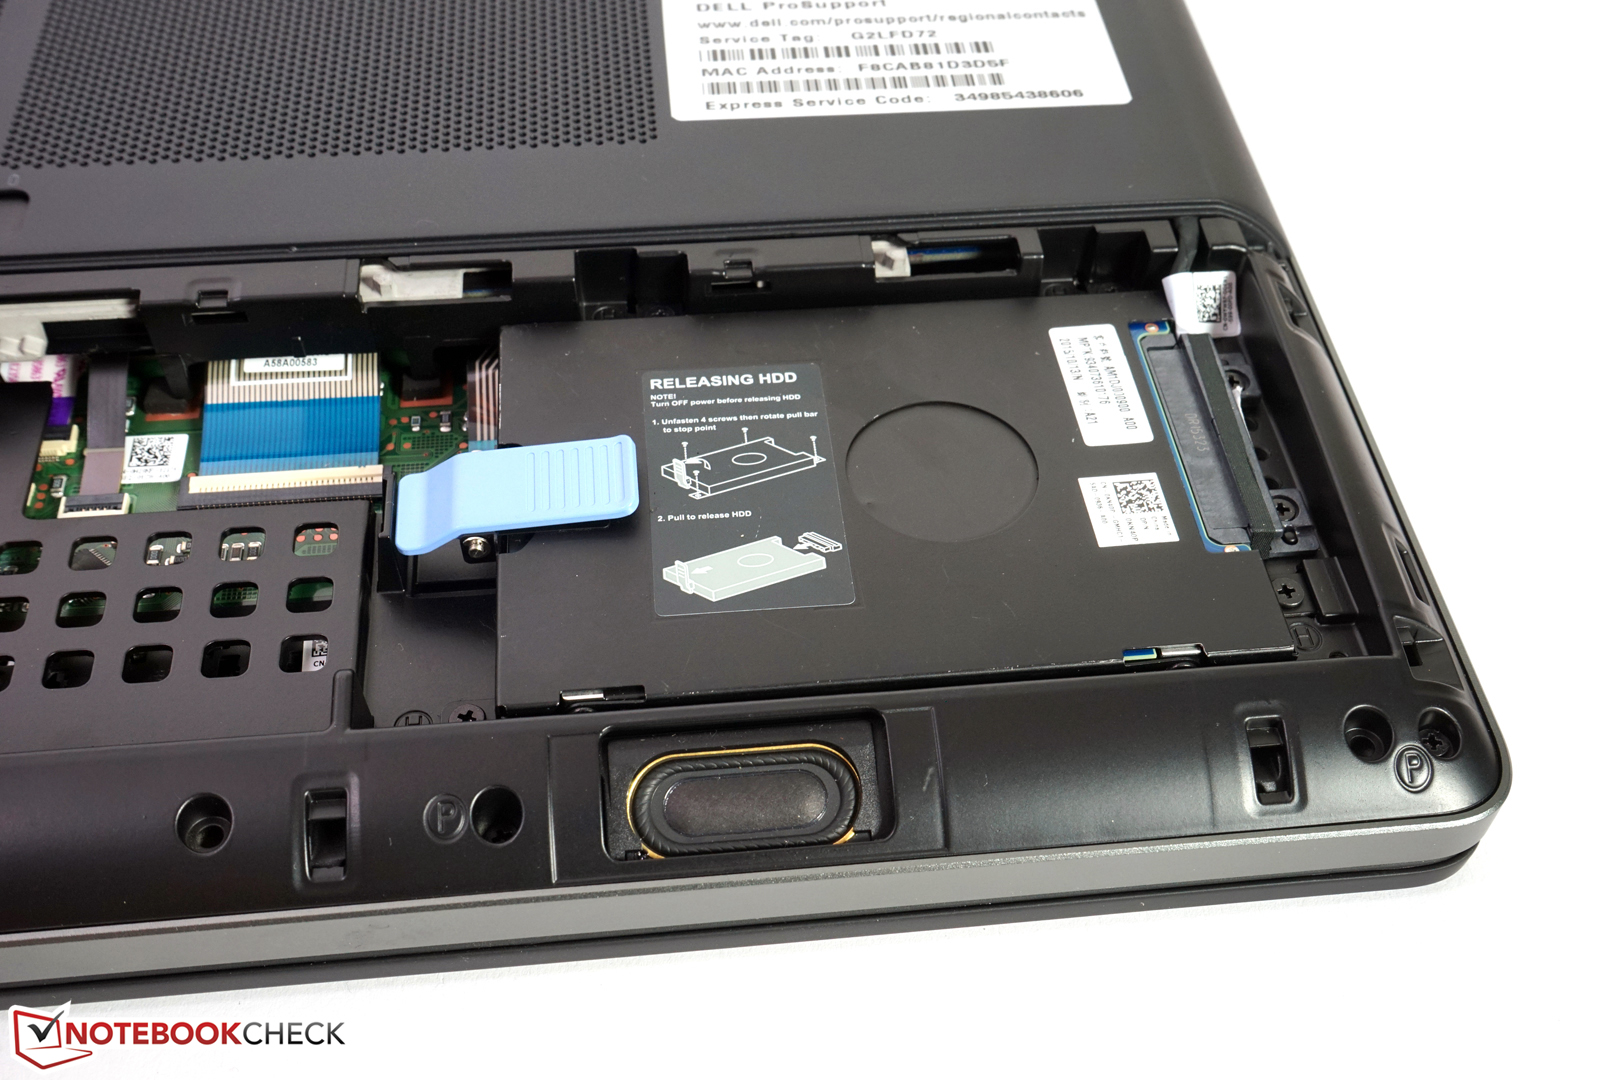
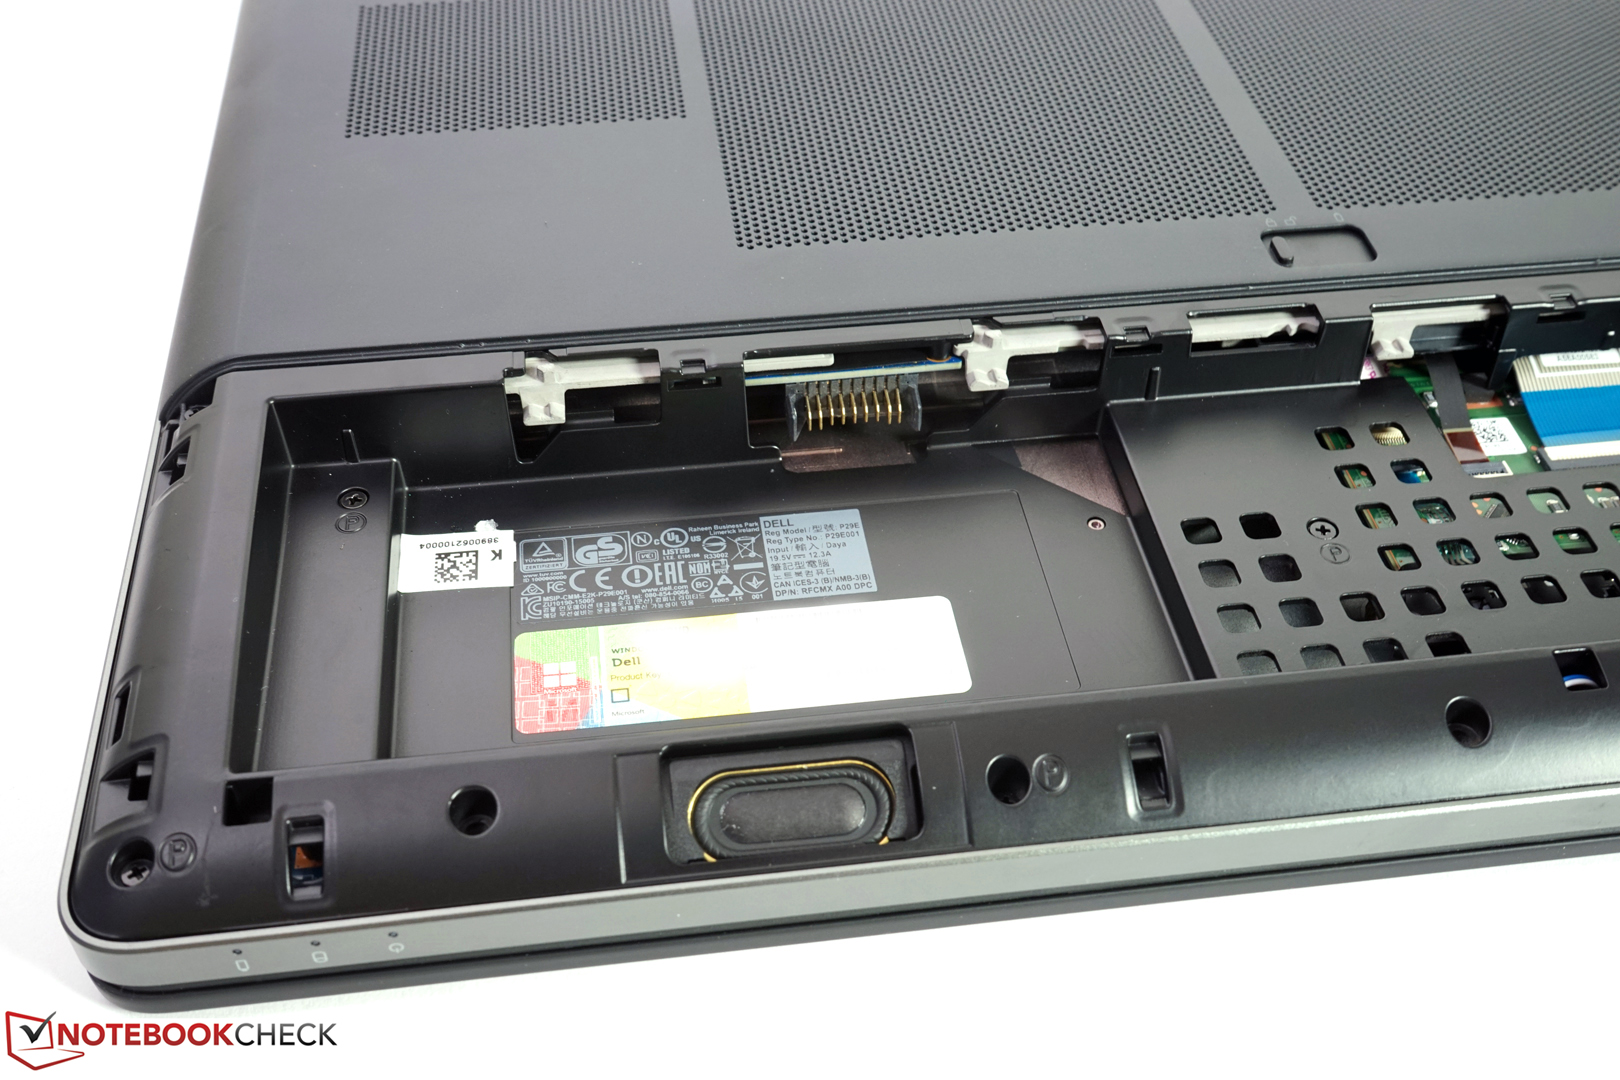
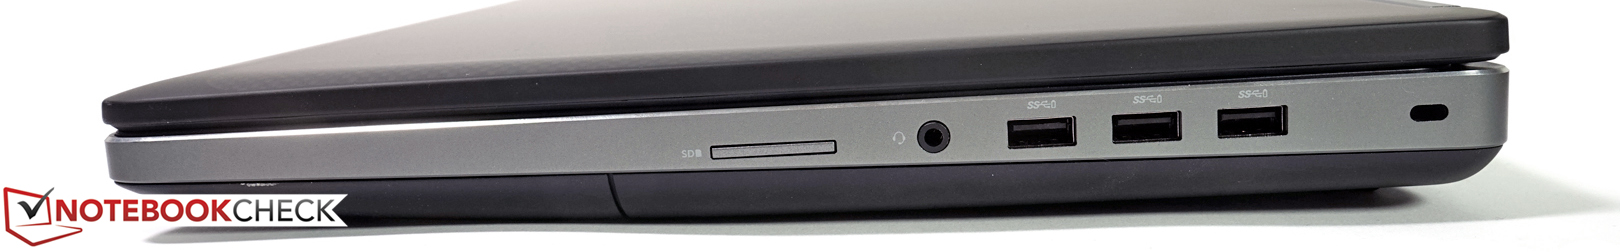
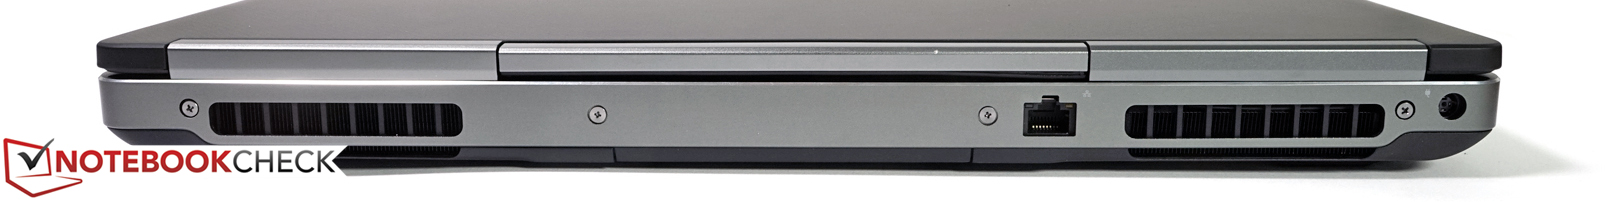
We zijn echter niet tevreden over de verbindingsmogelijkheden, die een stuk beter hadden kunnen zijn in een 17 inch werkstation. Oudere aansluitingen zijn verwijderd, maar de nieuwste poorten zoals USB 3.1 Gen.2, Thunderbolt 3.0 of HDMI ontbreken nog steeds. Daarnaast krijg je geen optische drive of tweede 2.5 inch slot voor opslagapparaten. Daarnaast is het niet acceptabel dat de GPU niet optimaal presteert wanneer de CPU zwaar belast wordt of wanneer de laptop op accustroom werkt. Aangezien mobiele werkstations bedoeld zijn voor zware taken, nemen we dit probleem uiterst serieus.
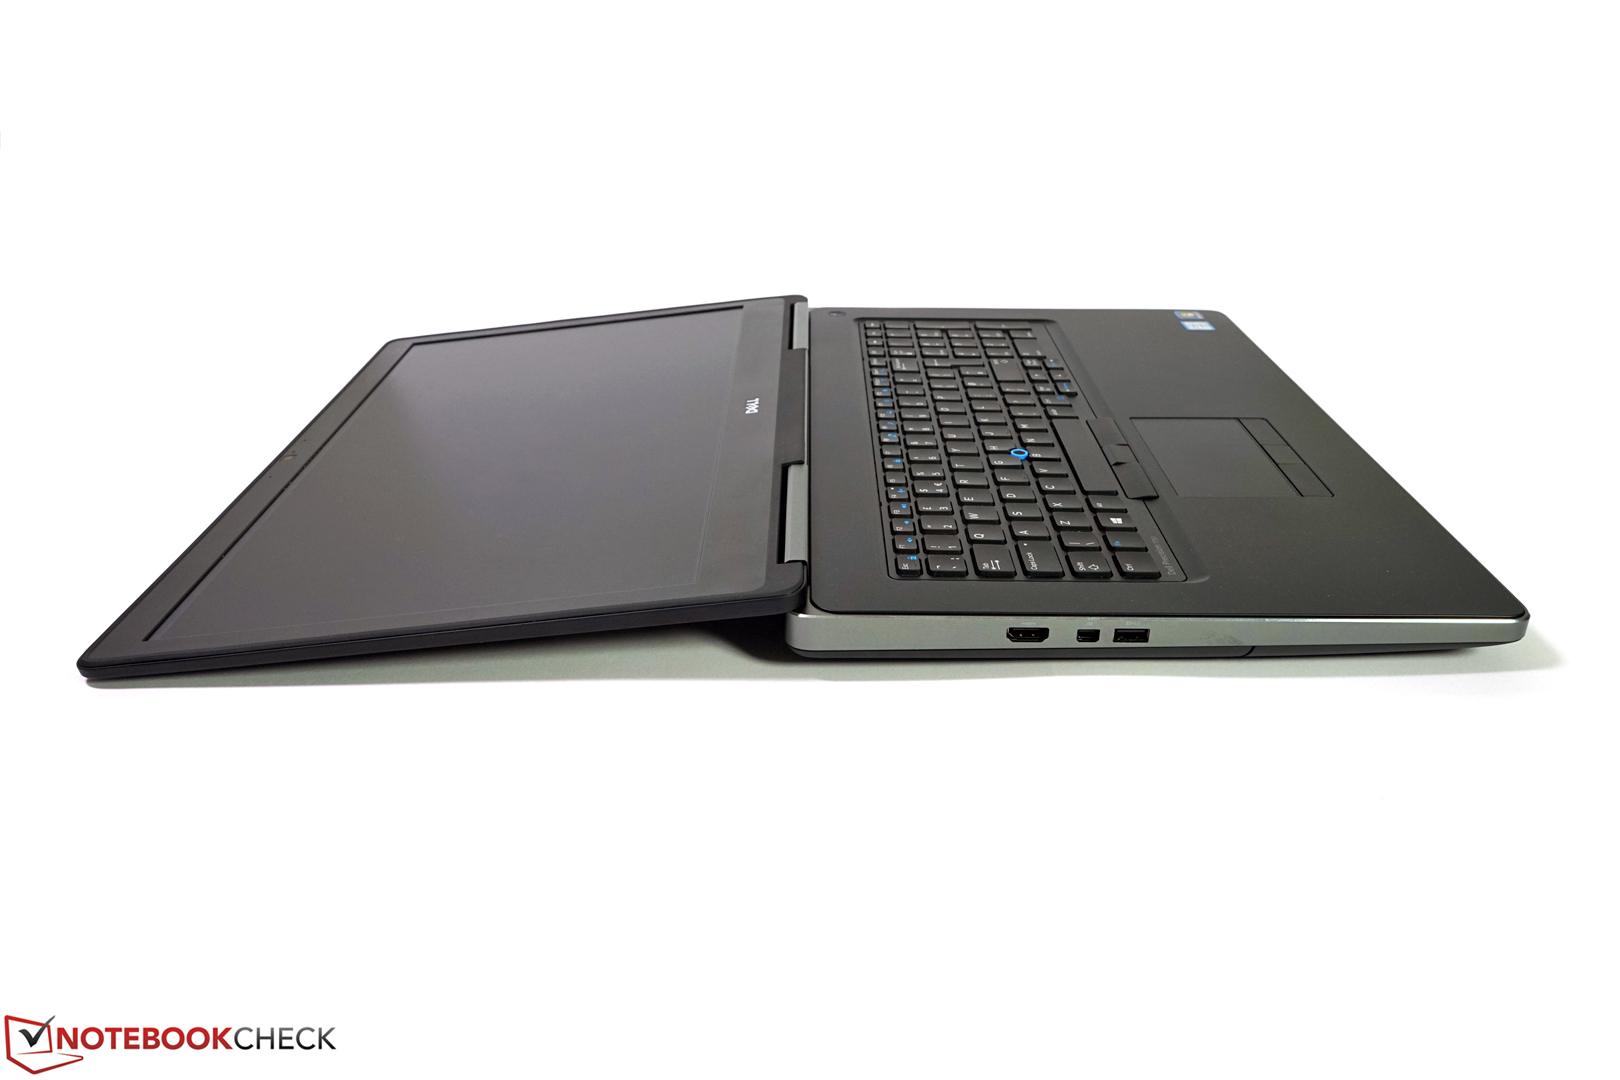
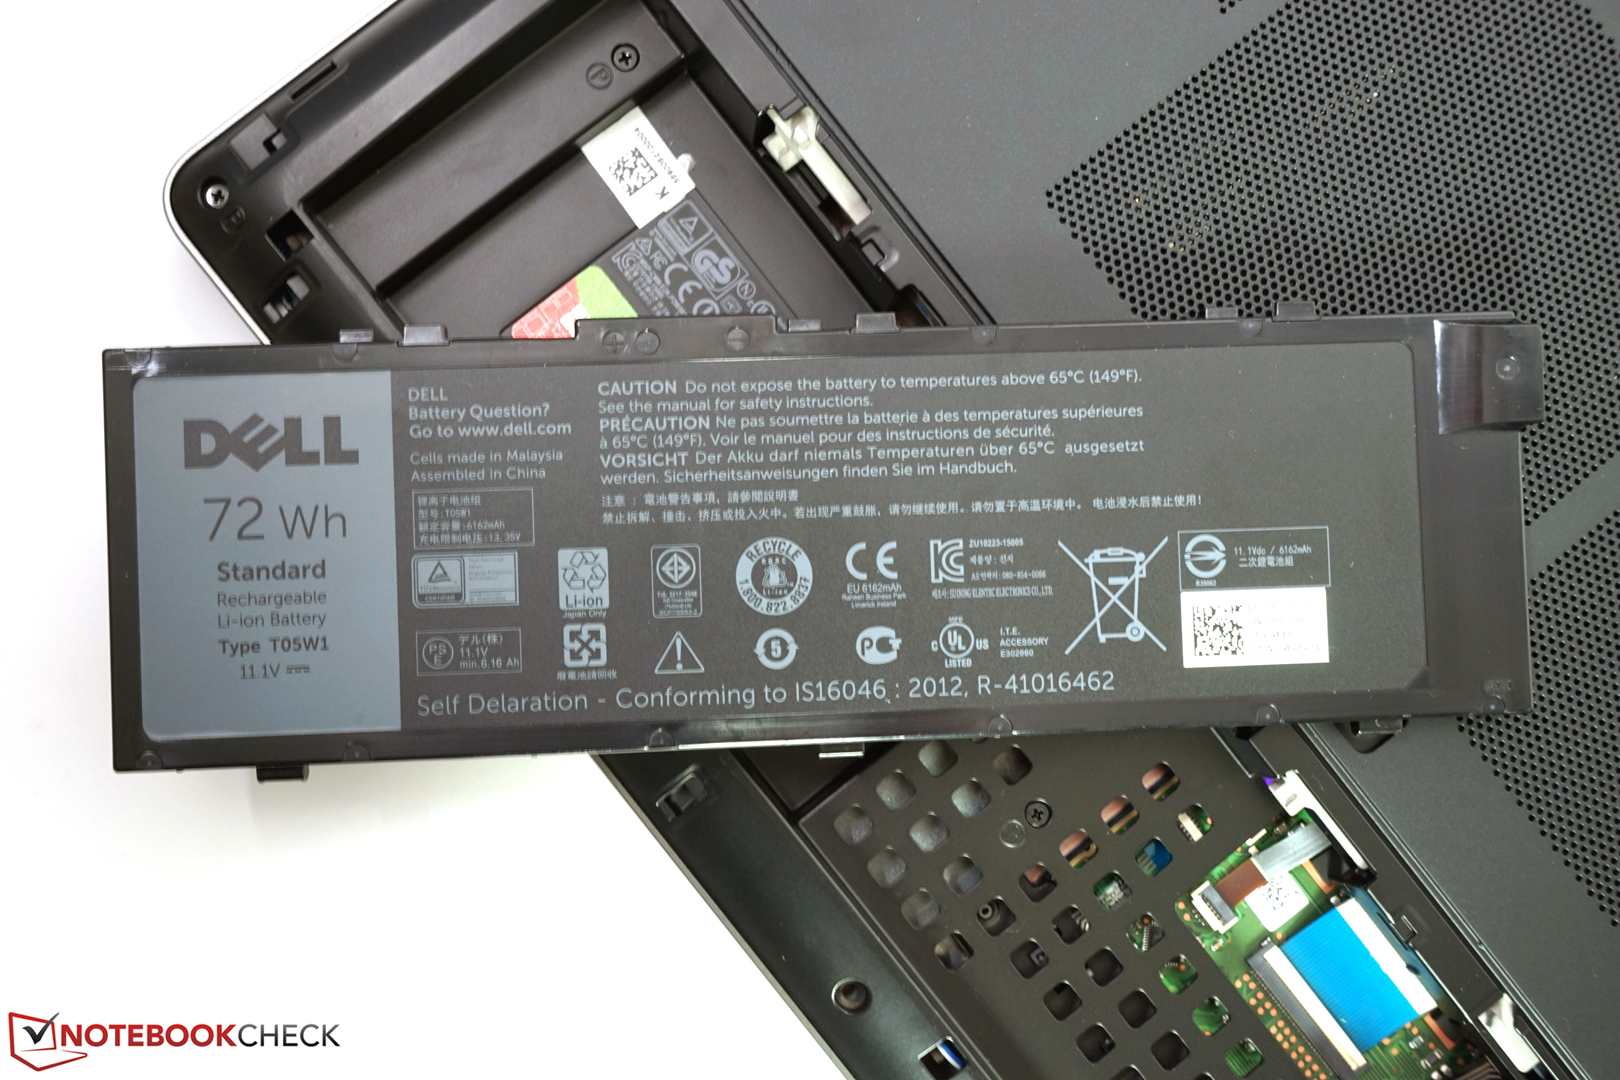
Dell maakt veel goed met het lage systeemgeluid onder belasting en de lage warmteontwikkeling. De looptijden zijn ondanks de kleinere 72 Wh batterij uitstekend, waardoor de notebook langdurig zonder stopcontact kan.
Alles bij elkaar krijg je een degelijk mobiel werkstation voor ongeveer €3730, inclusief 36 maanden ProSupport on-site-service. Het is echter aan de gebruiker om enkele gebreken te accepteren.
Dell Precision 7710
- 17-03-2016 v5 (old)
Tobias Winkler