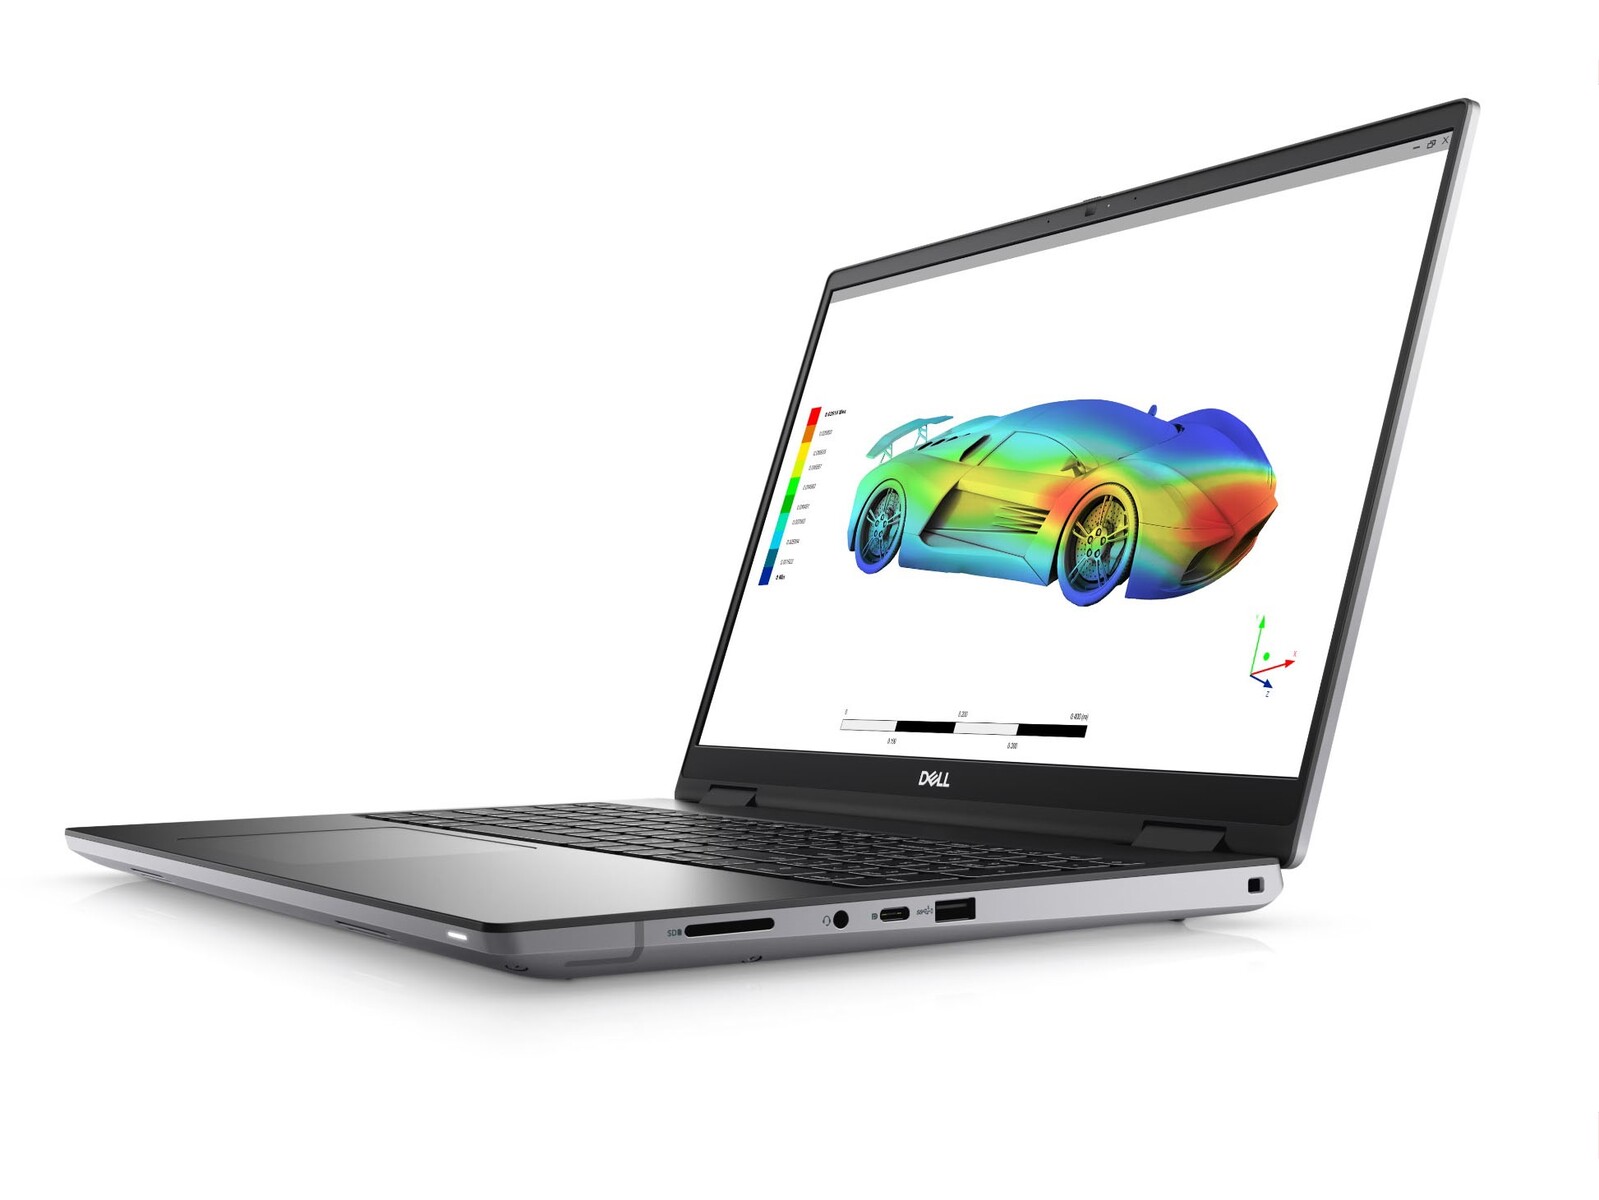
Nvidia RTX A5500 debuut: Dell Precision 7670 Performance workstation review
Dell neemt veel risico's met zijn nieuwe Precision 7670 serie. Niet alleen is het de eerste productielaptop die gebruik maakt van CAMM, maar de serie zelf bestaat uit een dunner model en een krachtiger dikker model (genaamd het "Performance" of "Ultimate" model) afhankelijk van de configuratie. Het dunnere model hebben we vorige maand besproken en nu kijken we dus naar het dikkere model.
Afgezien van hun kleine verschillen in Z-hoogte, delen de twee modellen exact hetzelfde chassisontwerp en dezelfde kenmerken. We raden u aan onze bestaande review van de dunnere Precision 7670 om meer te weten te komen over de fysieke kenmerken van de serie.
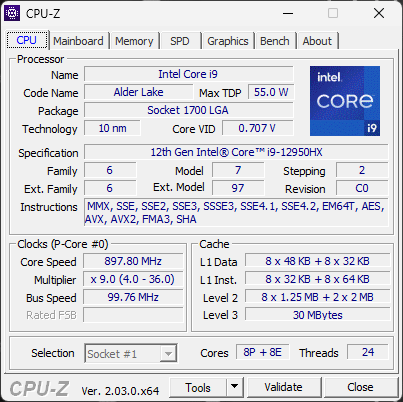
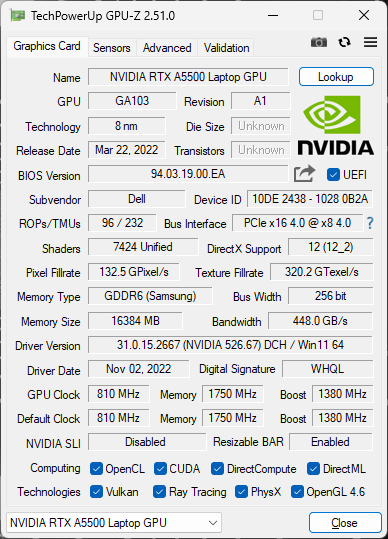
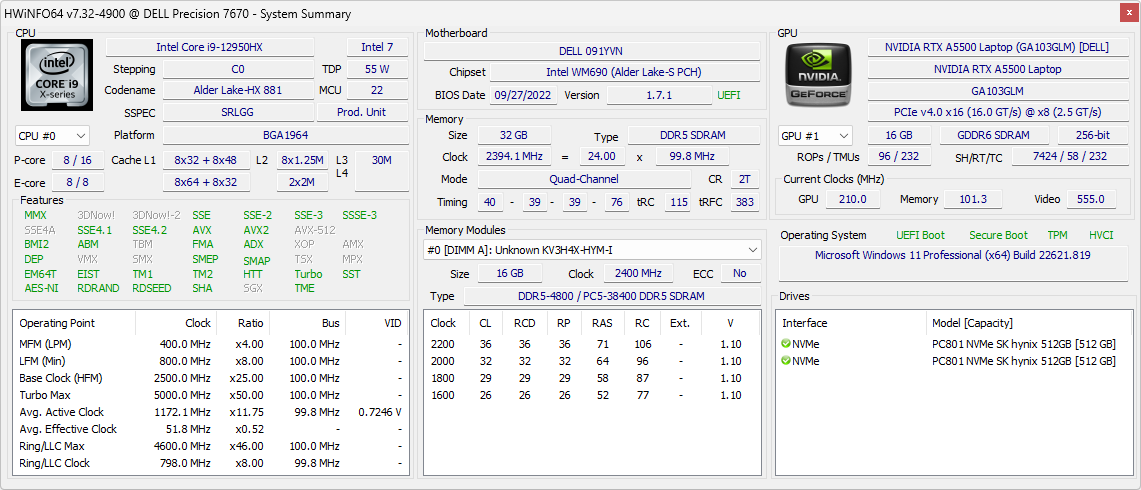
Onze specifieke review unit is de hoogste configuratie met de Core i9-12950HX CPU, RTX A5500 GPU, en 2400p 16:10 OLED touchscreen voor ongeveer $7000 USD. Kleinere SKU's gaan omlaag naar de Core i7-12850HX of RTX A4500, maar alle opties komen met hetzelfde 2400p IPS-aanraakscherm. De dunnere Precision 7670 kan daarentegen slechts tot de RTX A2000 GPU gaan.
Concurrenten in deze ruimte zijn andere 16-inch mobiele werkstations zoals deMSI CreatorPro Z16P,HP ZBook Studio 16ofLenovo ThinkPad P1 G4.
Meer Dell beoordelingen:
Potentiële concurrenten in vergelijking
Evaluatie | Datum | Model | Gewicht | Hoogte | Formaat | Resolutie | Beste prijs |
|---|---|---|---|---|---|---|---|
| 89.1 % v7 (old) | 12-2022 | Dell Precision 7000 7670 Performance i9-12950HX, RTX A5500 Laptop GPU | 2.8 kg | 25.95 mm | 16.00" | 3840x2400 | |
| 84.3 % v7 (old) | 11-2022 | MSI CreatorPro Z16P B12UKST i7-12700H, RTX A3000 Laptop GPU | 2.4 kg | 19 mm | 16.00" | 2560x1600 | |
| 90.1 % v7 (old) | 11-2022 | HP ZBook Studio 16 G9 62U04EA i7-12800H, RTX A2000 Laptop GPU | 1.8 kg | 19 mm | 16.00" | 3840x2400 | |
| 82.9 % v7 (old) | 10-2022 | HP ZBook Firefly 16 G9-6B897EA i7-1265U, T550 Laptop GPU | 2 kg | 19.2 mm | 16.00" | 1920x1200 | |
| 89.3 % v7 (old) | Lenovo ThinkPad P1 G4-20Y4Z9DVUS i7-11800H, T1200 Laptop GPU | 1.8 kg | 17.7 mm | 16.00" | 2560x1600 | ||
| 88.4 % v7 (old) | 10-2022 | Dell Precision 7670 i7-12850HX, RTX A2000 Laptop GPU | 2.7 kg | 24.7 mm | 16.00" | 3840x2400 |
Zaak
Lengte en breedte zijn identiek aan de gewone slankere Precision 7670, terwijl dikte en gewicht met respectievelijk ongeveer 1,3 mm en 100 g zijn opgeschroefd. Het is moeilijk om de verschillen in de praktijk op te merken, aangezien de gewone Precision 7670 al een van de dikkere en zwaardere mobiele werkstations is.
SD-kaartlezer
| SD Card Reader | |
| average JPG Copy Test (av. of 3 runs) | |
| Lenovo ThinkPad P1 G4-20Y4Z9DVUS (Angelbird AV Pro V60) | |
| Dell Precision 7670 (Toshiba Exceria Pro SDXC 64 GB UHS-II) | |
| Dell Precision 7000 7670 Performance (Toshiba Exceria Pro SDXC 64 GB UHS-II) | |
| MSI CreatorPro Z16P B12UKST (AV Pro V60) | |
| HP ZBook Studio 16 G9 62U04EA (Angelbird AV PRO V60) | |
| maximum AS SSD Seq Read Test (1GB) | |
| Dell Precision 7670 (Toshiba Exceria Pro SDXC 64 GB UHS-II) | |
| Dell Precision 7000 7670 Performance (Toshiba Exceria Pro SDXC 64 GB UHS-II) | |
| Lenovo ThinkPad P1 G4-20Y4Z9DVUS (Angelbird AV Pro V60) | |
| MSI CreatorPro Z16P B12UKST (AV Pro V60) | |
| HP ZBook Studio 16 G9 62U04EA (Angelbird AV PRO V60) | |
Communicatie
Hoewel de Intel AX211 aanwezig is op alle Precision 7670 SKU's, zijn de prestaties langzamer dan verwacht op onze specifieke testunit. De gemiddelde overdrachtssnelheid is slechts 891 Mbps wanneer gekoppeld aan ons 6 Ghz netwerk, vergeleken met bijna het dubbele van dat op de MSI CreatorPro Z16P of HP ZBook Firefly 16 G9 elk met dezelfde AX211 module. We hebben deze test voor de zekerheid zes keer herhaald op twee verschillende dagen, maar de resultaten werden niet beter.
| Networking | |
| iperf3 transmit AX12 | |
| Lenovo ThinkPad P1 G4-20Y4Z9DVUS | |
| iperf3 receive AX12 | |
| Lenovo ThinkPad P1 G4-20Y4Z9DVUS | |
| iperf3 receive AXE11000 6GHz | |
| MSI CreatorPro Z16P B12UKST | |
| HP ZBook Studio 16 G9 62U04EA | |
| HP ZBook Firefly 16 G9-6B897EA | |
| Dell Precision 7000 7670 Performance | |
| Dell Precision 7670 | |
| iperf3 receive AXE11000 | |
| Dell Precision 7000 7670 Performance | |
| iperf3 transmit AXE11000 | |
| Dell Precision 7000 7670 Performance | |
| iperf3 transmit AXE11000 6GHz | |
| MSI CreatorPro Z16P B12UKST | |
| HP ZBook Firefly 16 G9-6B897EA | |
| HP ZBook Studio 16 G9 62U04EA | |
| Dell Precision 7670 | |
| Dell Precision 7000 7670 Performance | |
Webcam


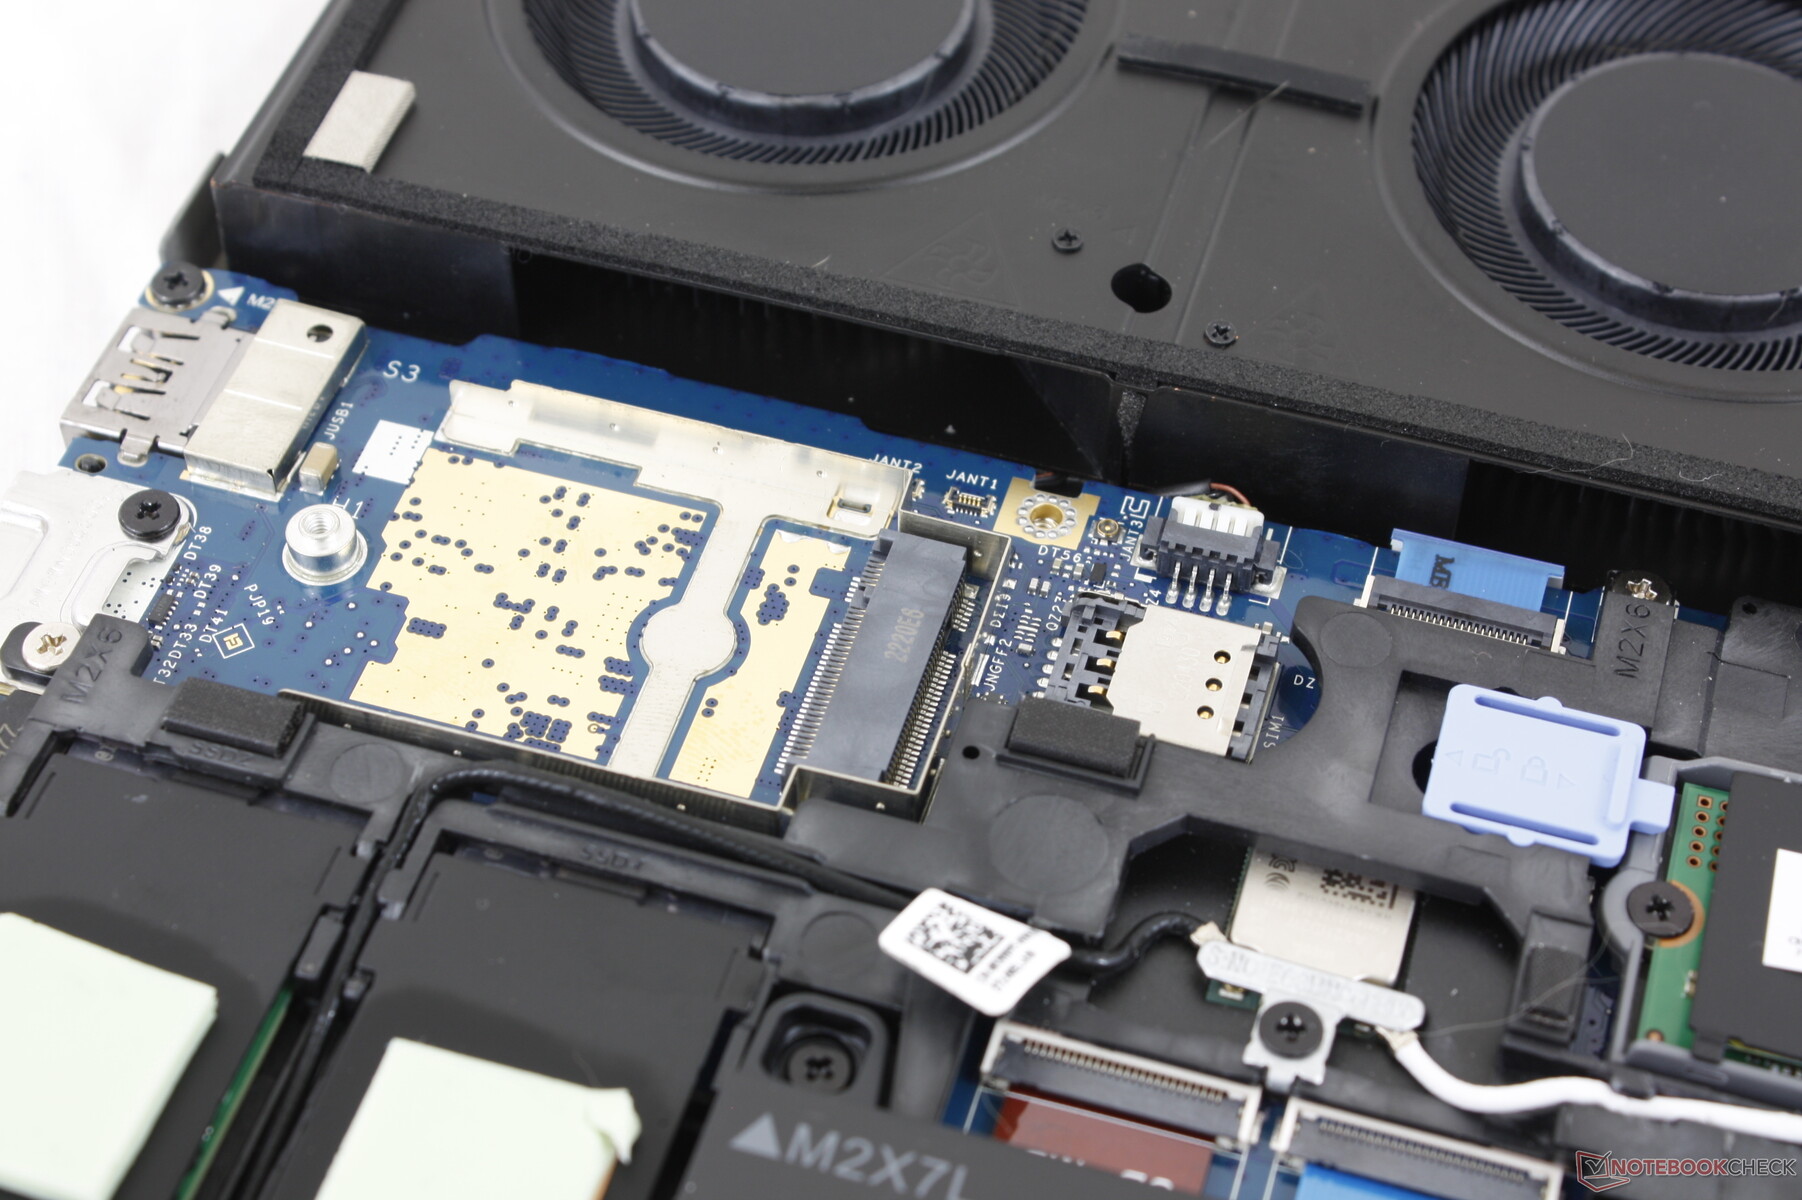
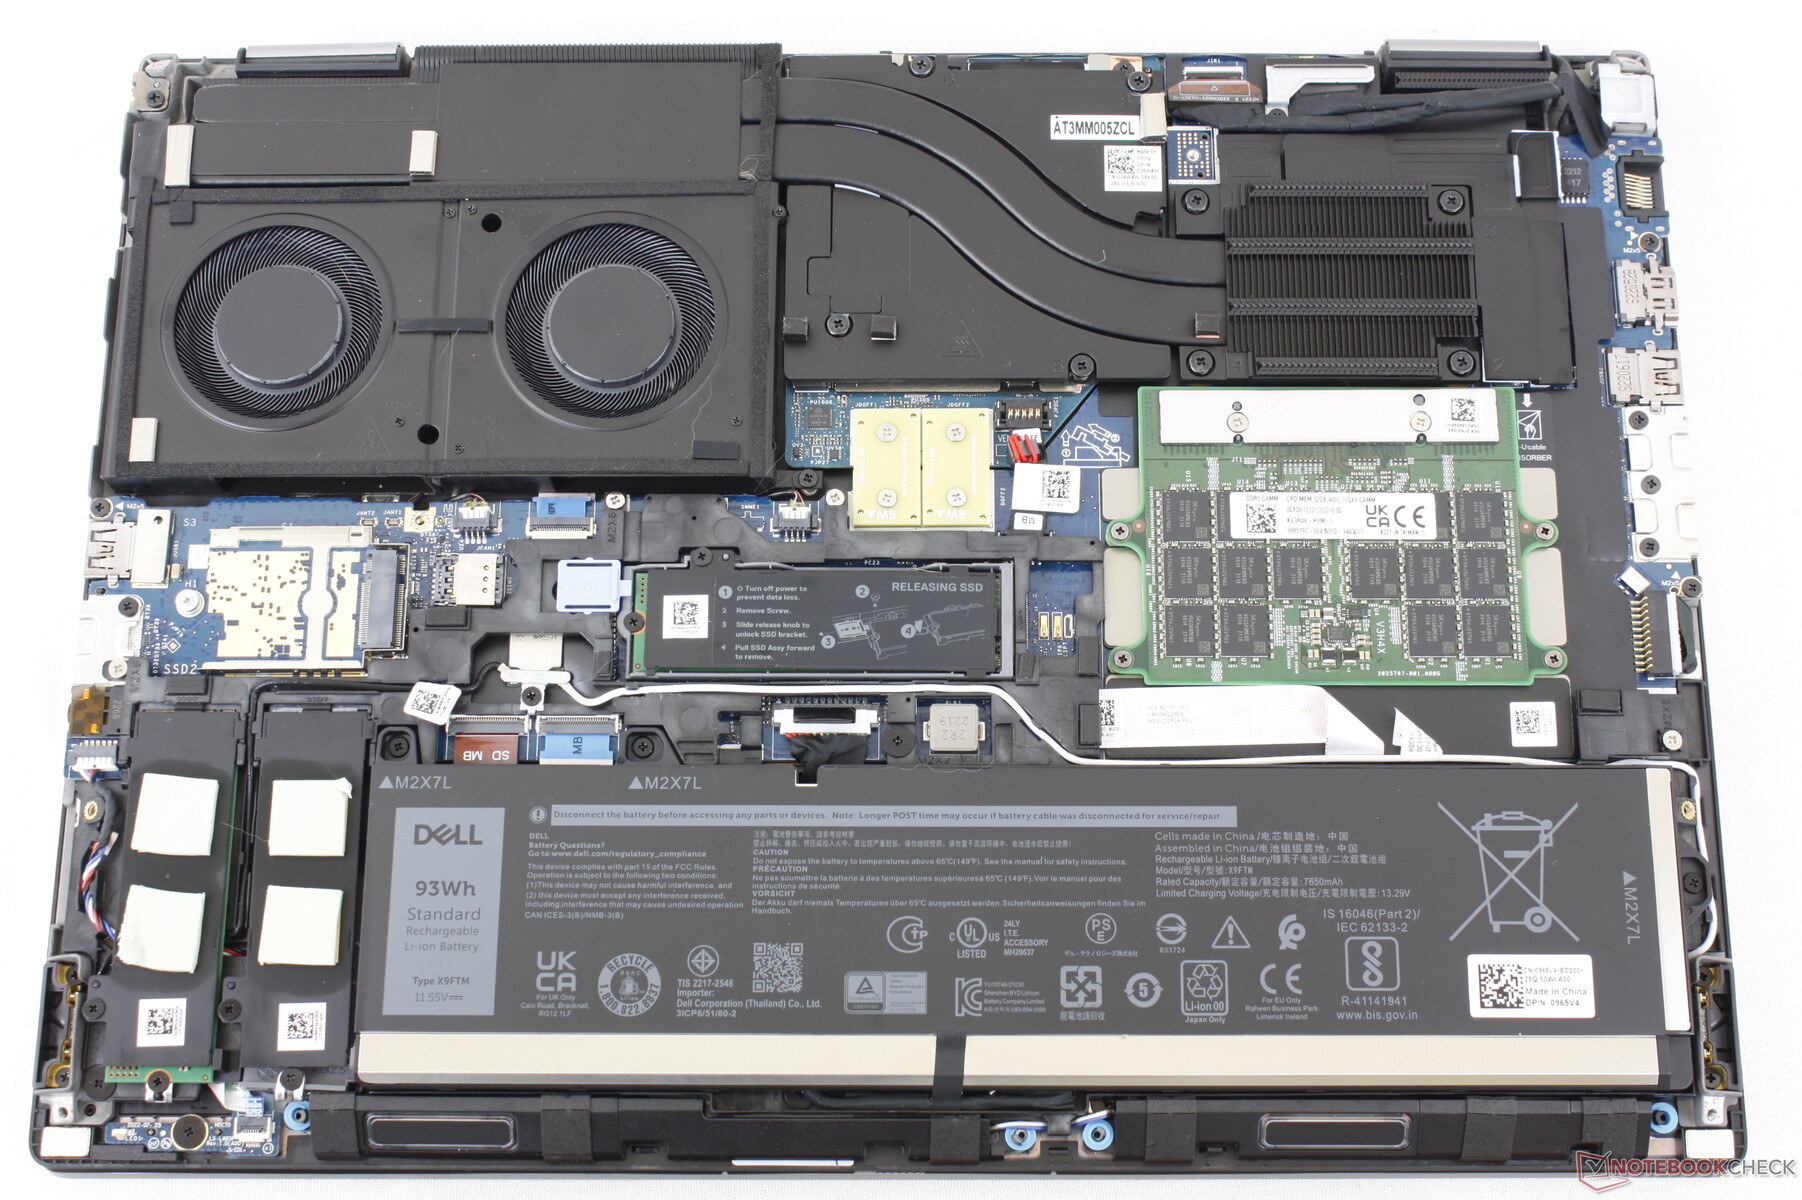
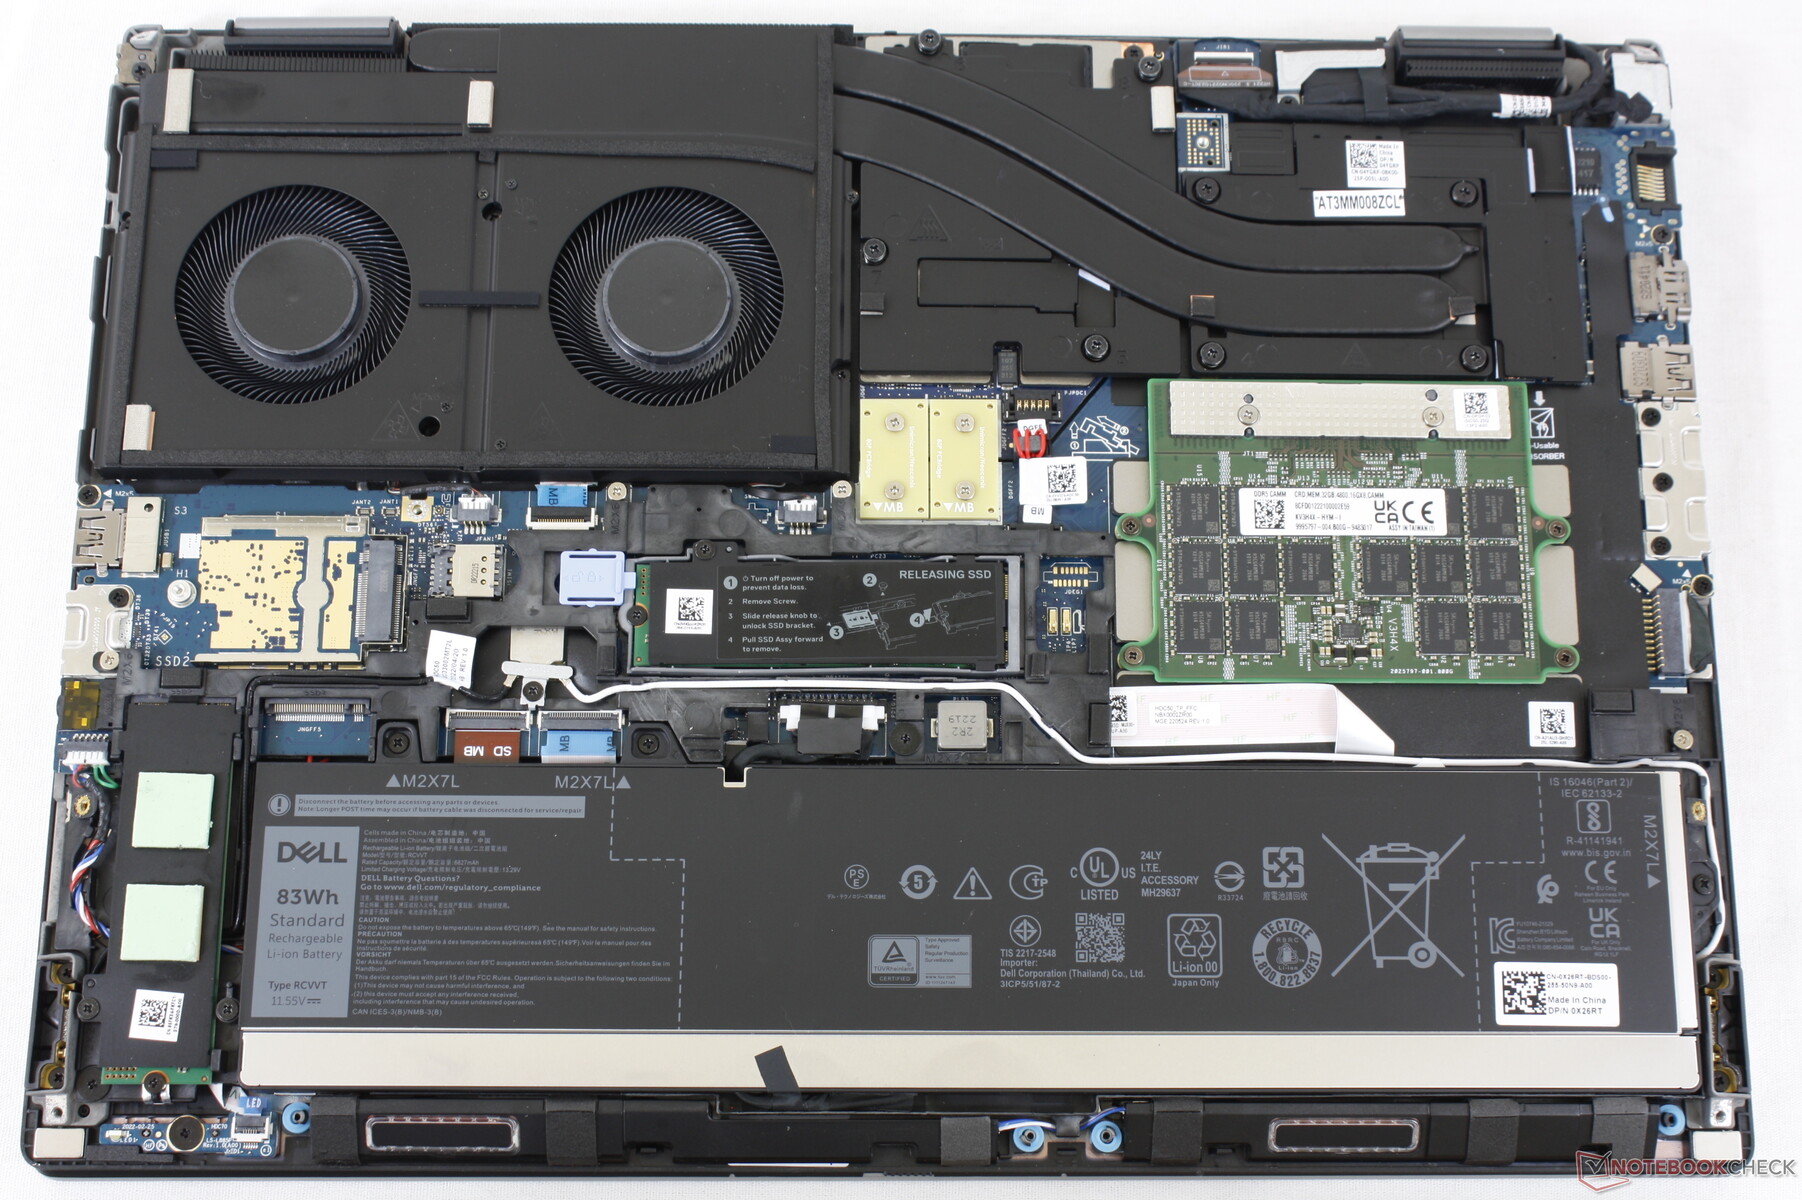
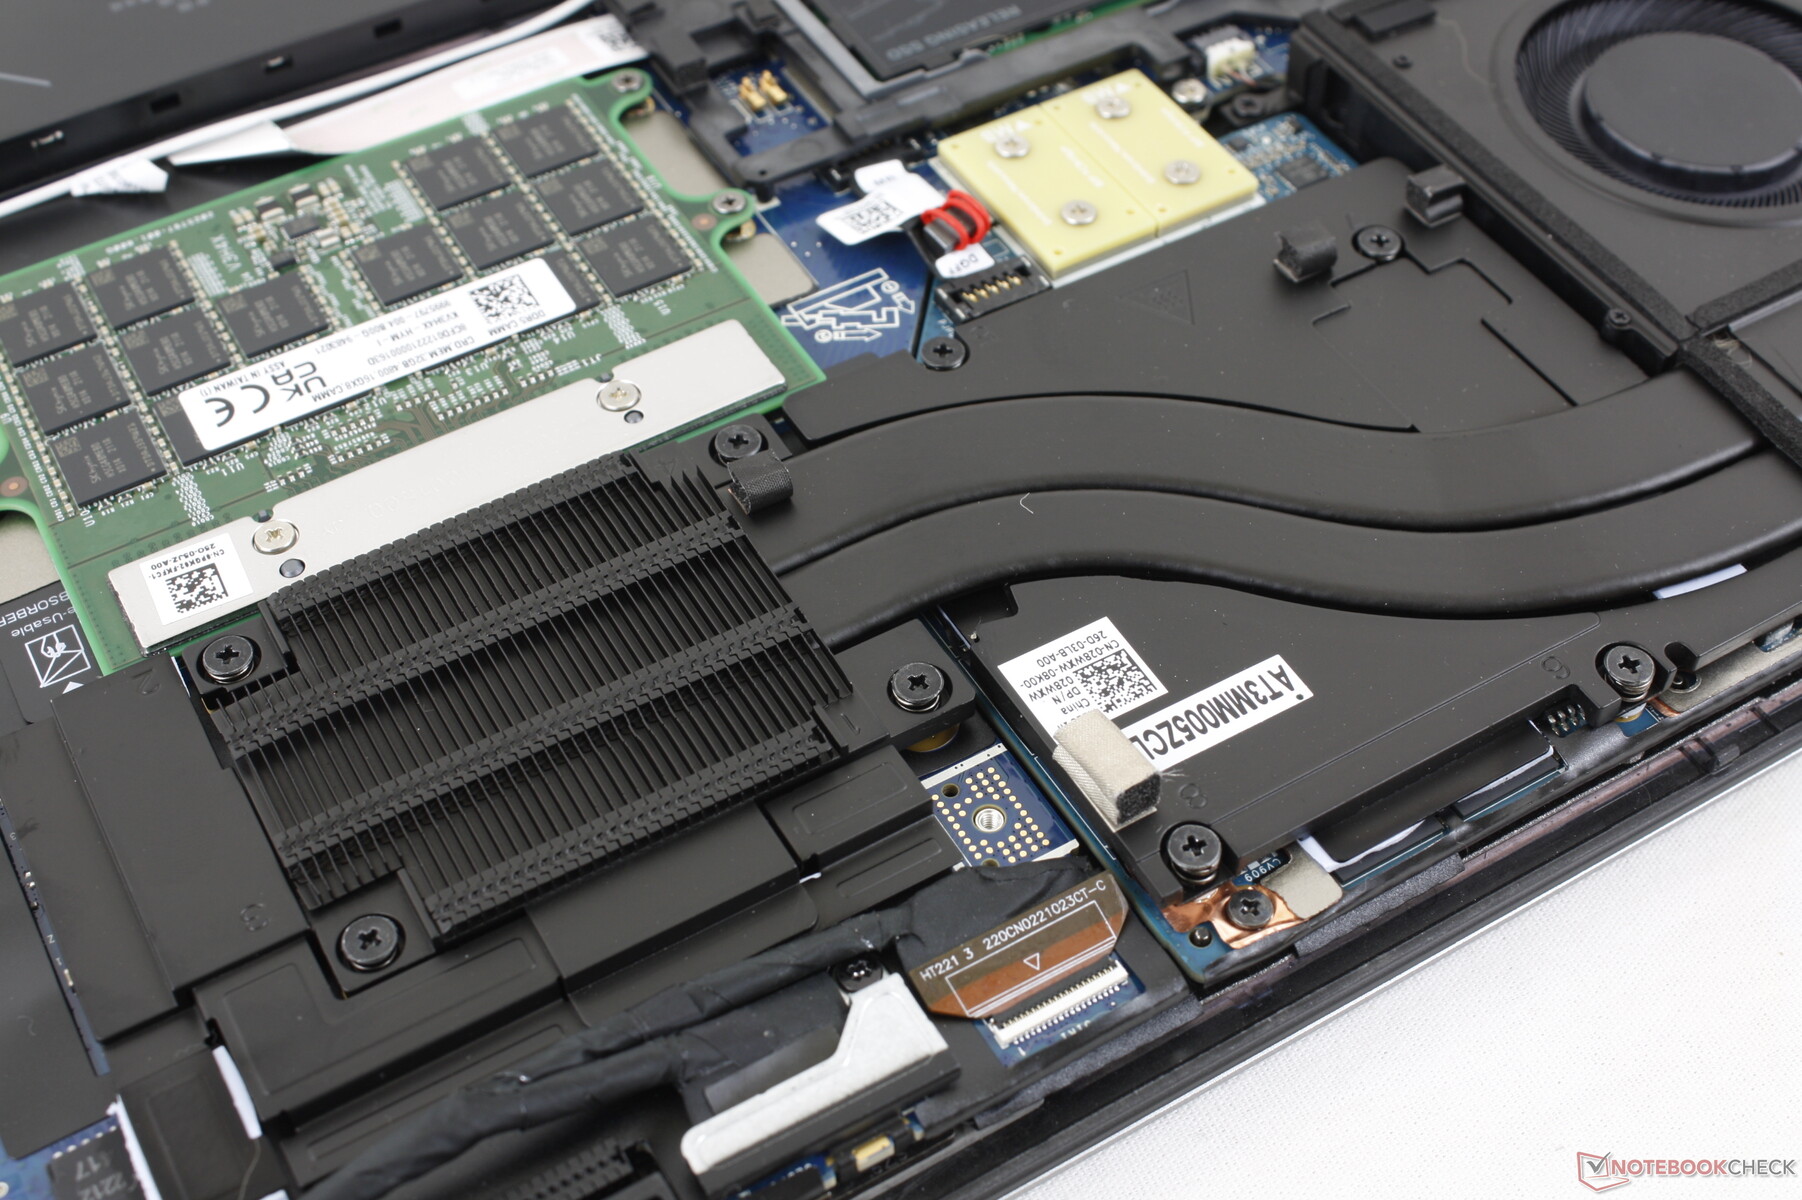
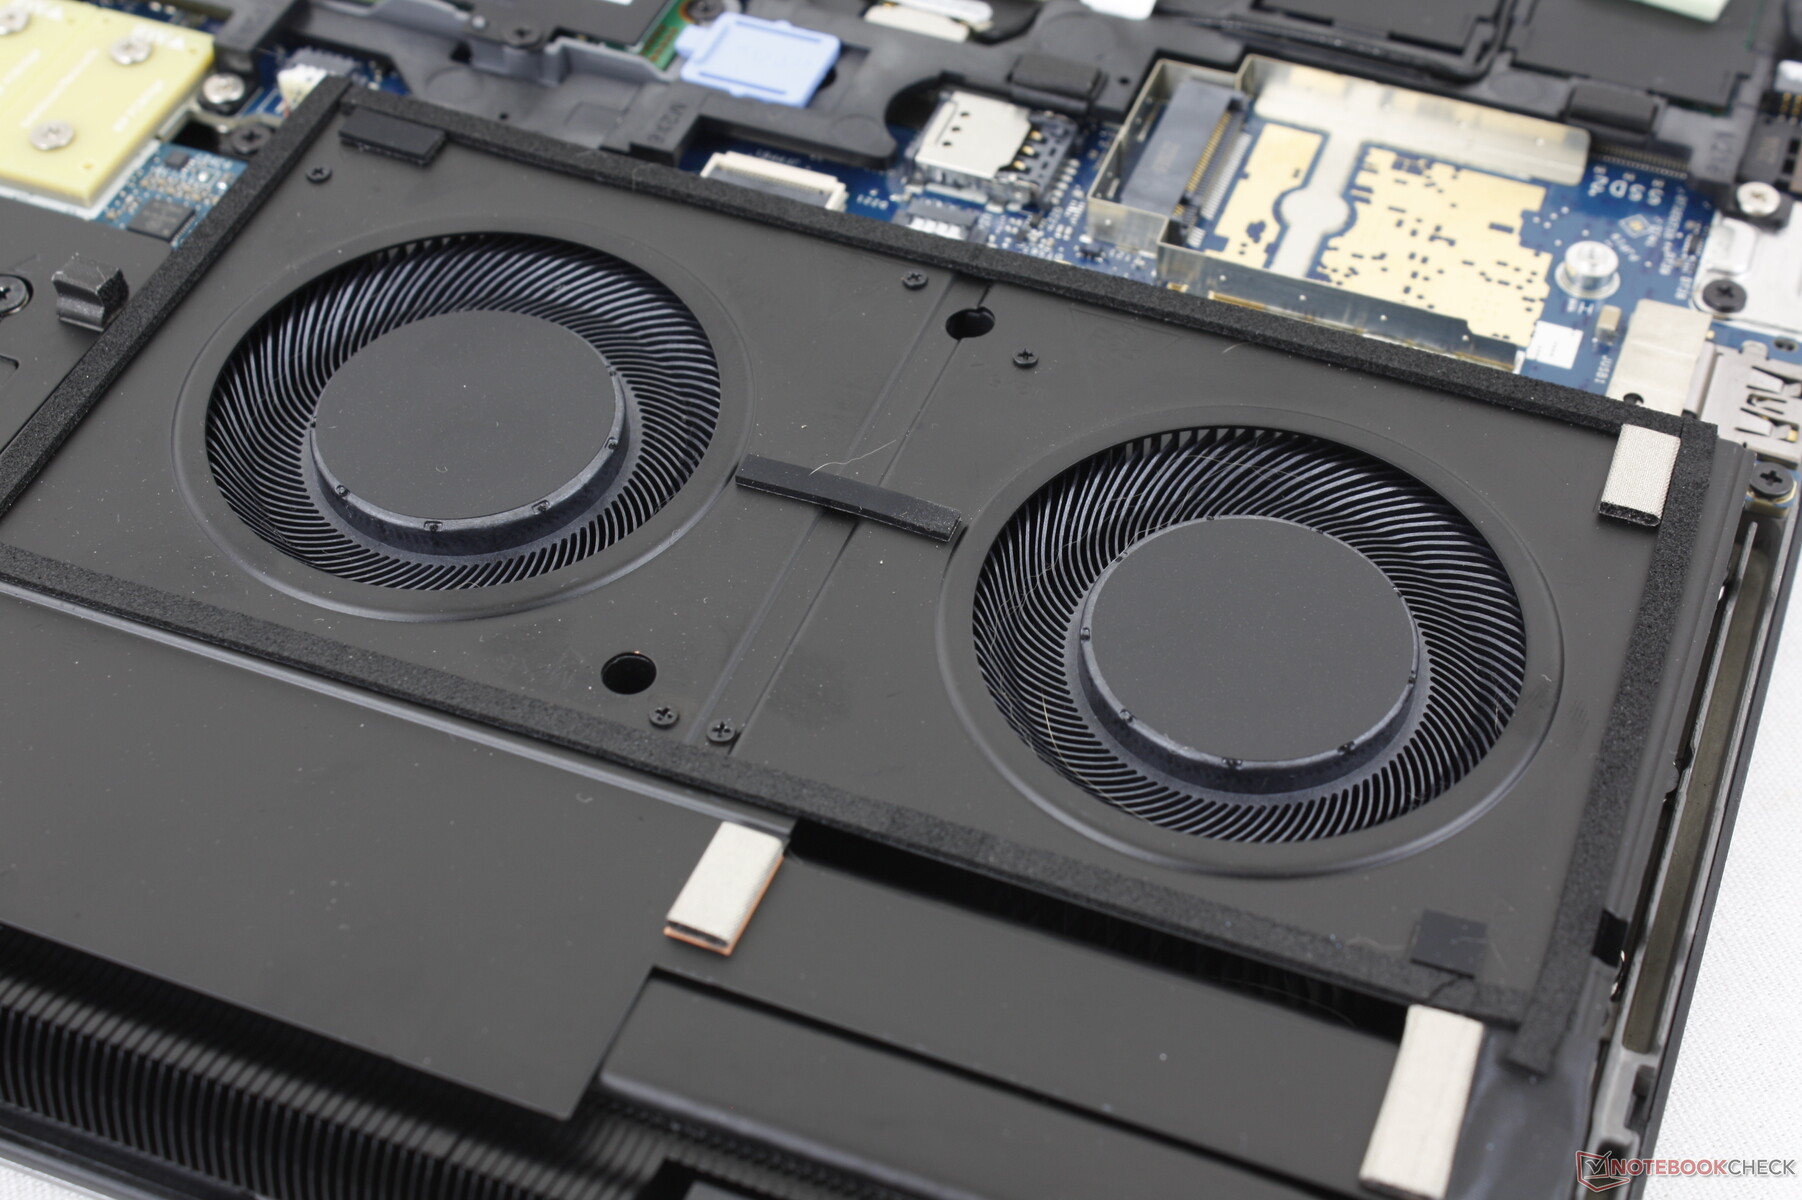
Onderhoud
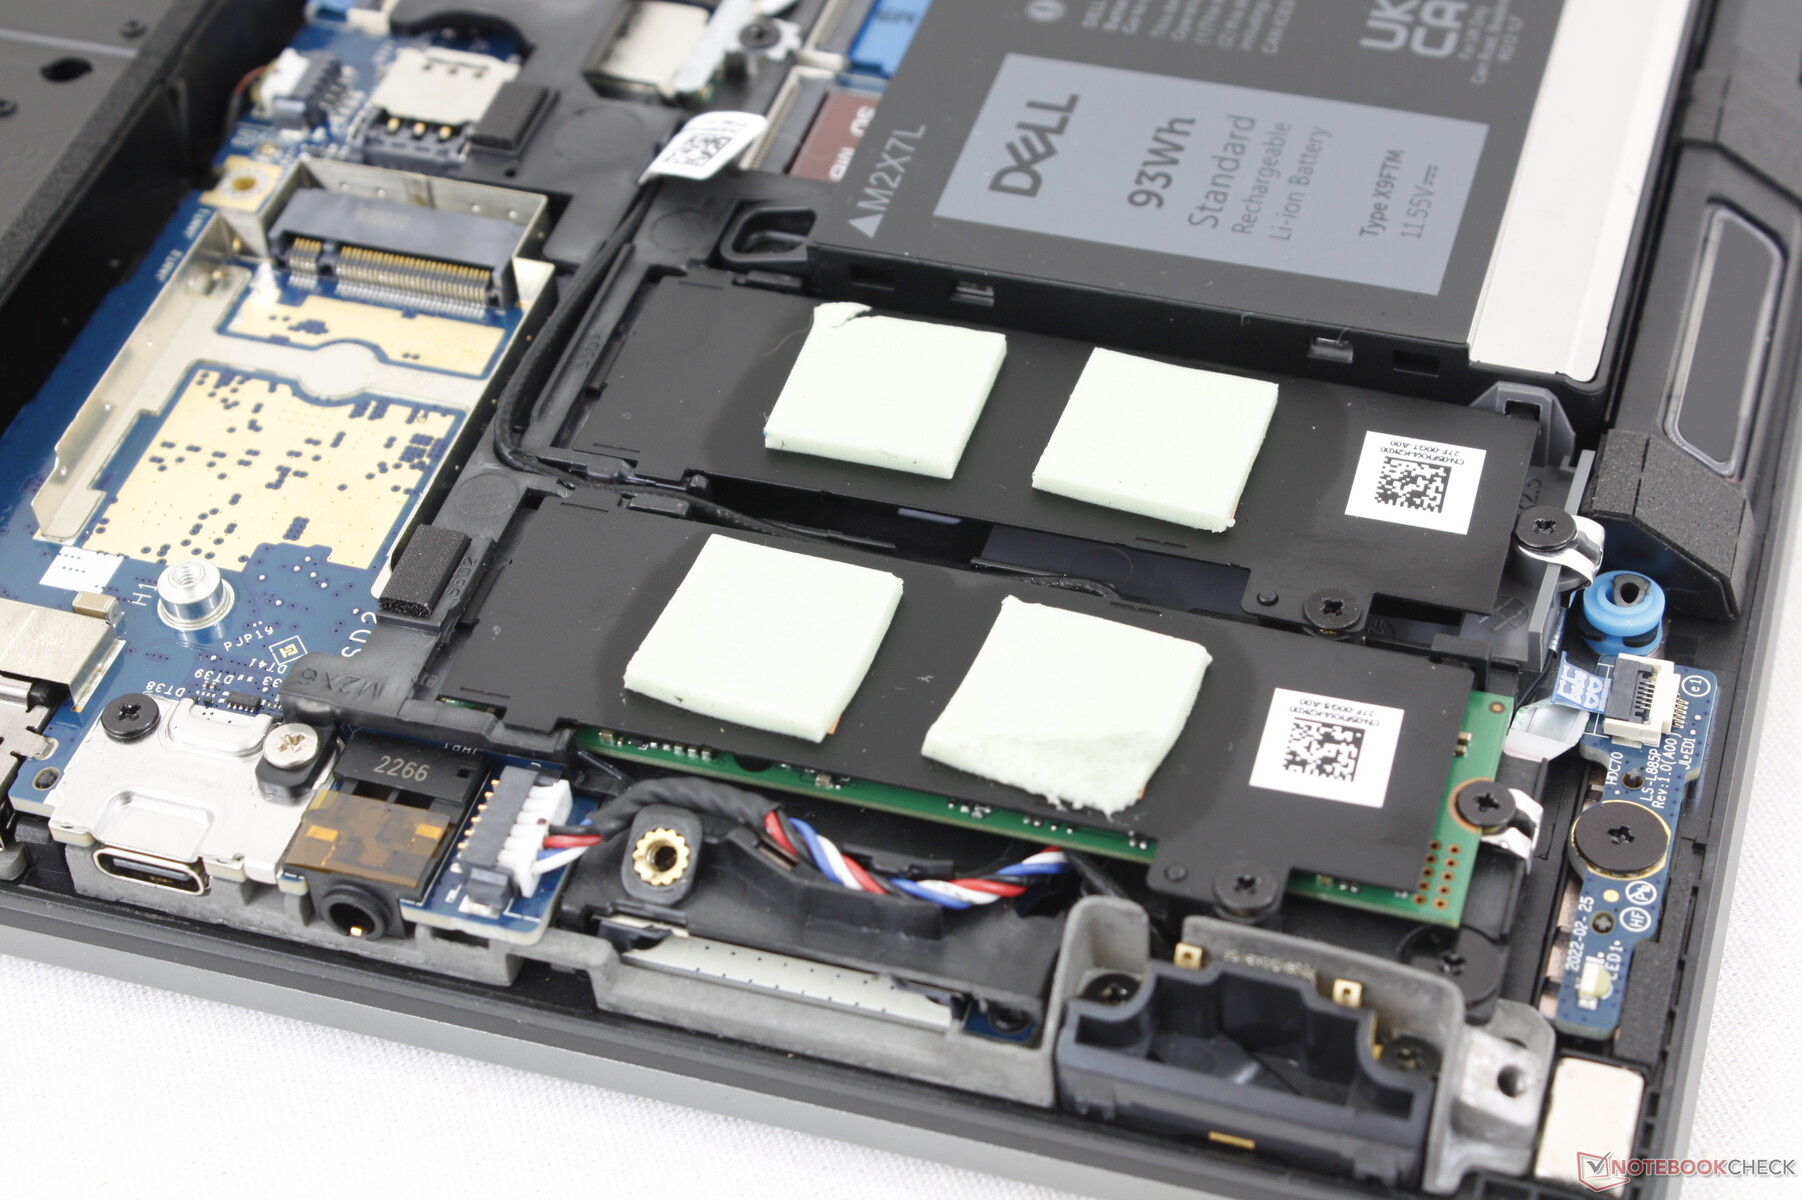
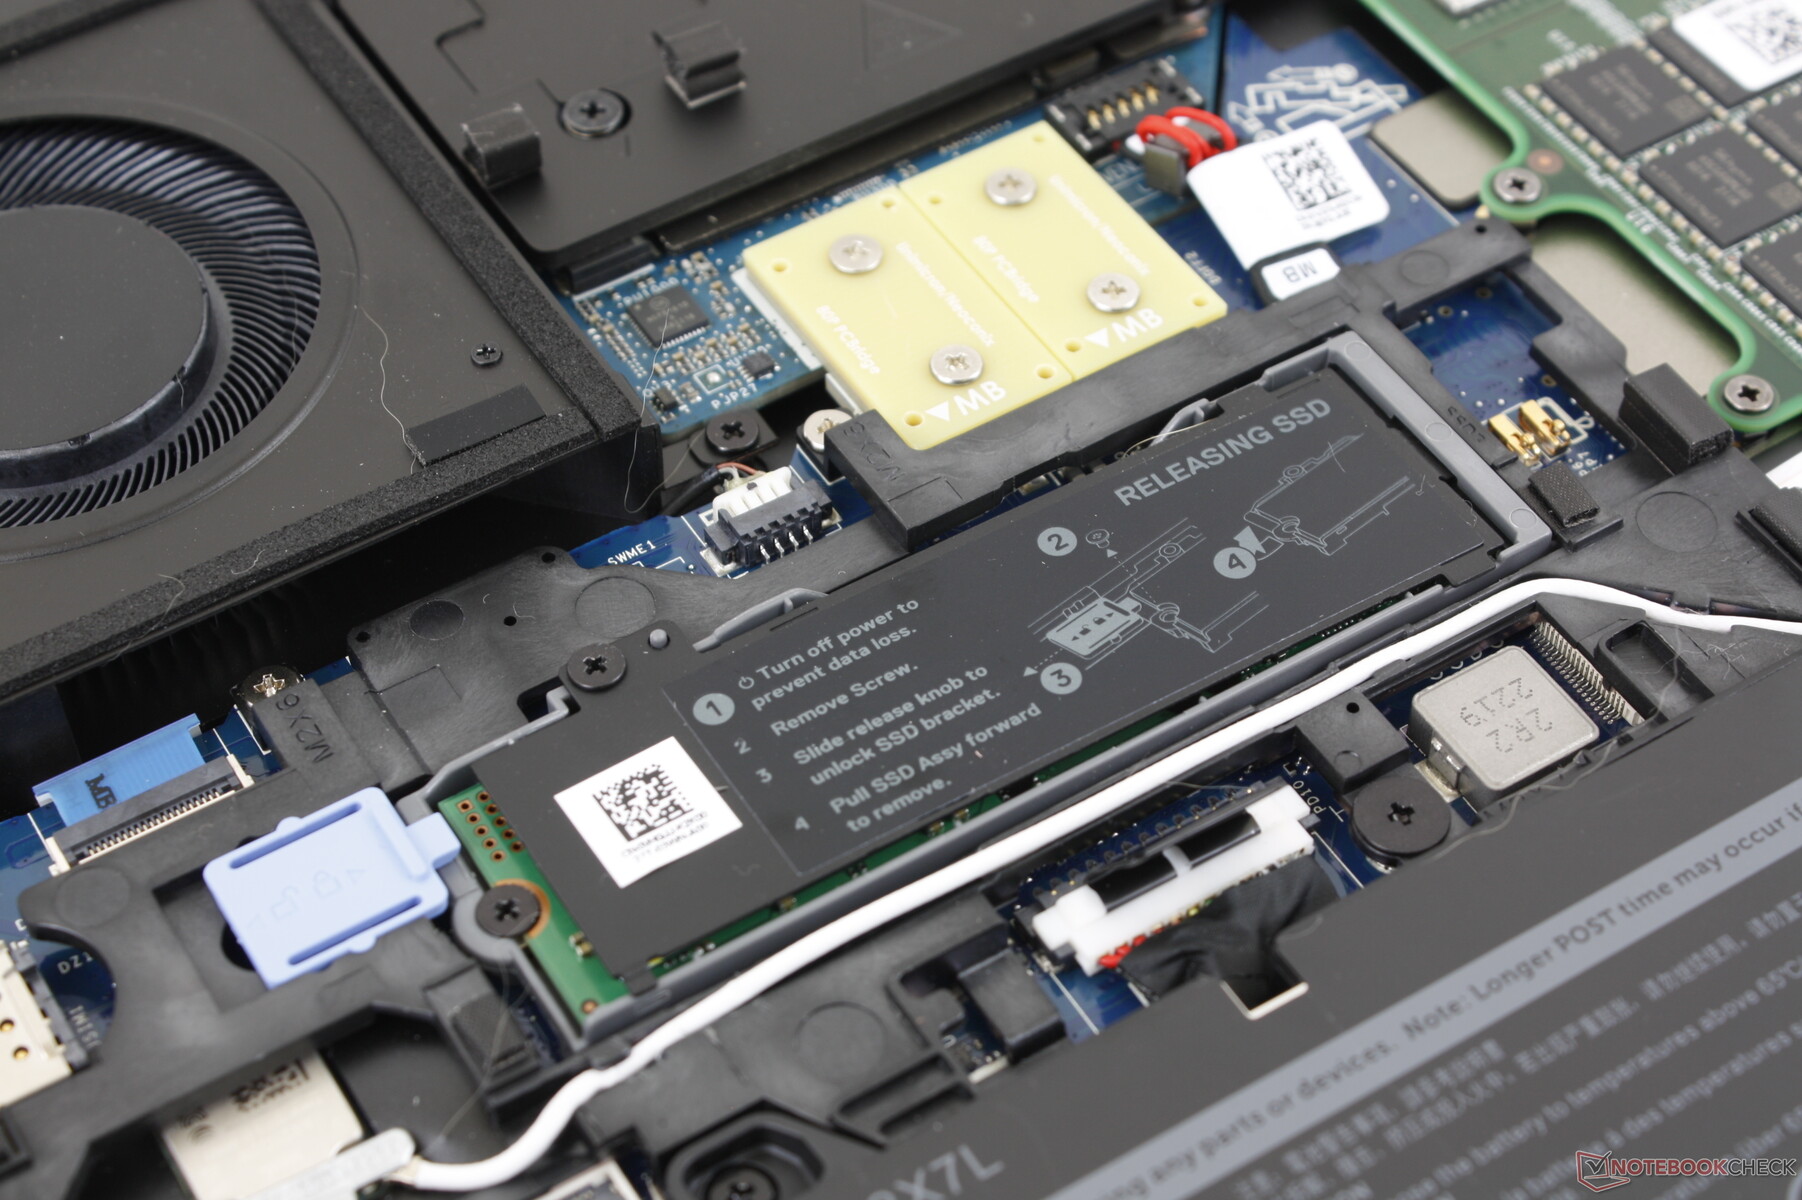
Het onderpaneel wordt vastgezet met zes Philips-schroeven voor eenvoudig onderhoud. De interne onderdelen zijn vergelijkbaar met de slankere Precision 7670, met uitzondering van de verschillen in batterijcapaciteit, het aantal beschikbare opslagplaatsen en de aanwezigheid van een klein koellichaam.
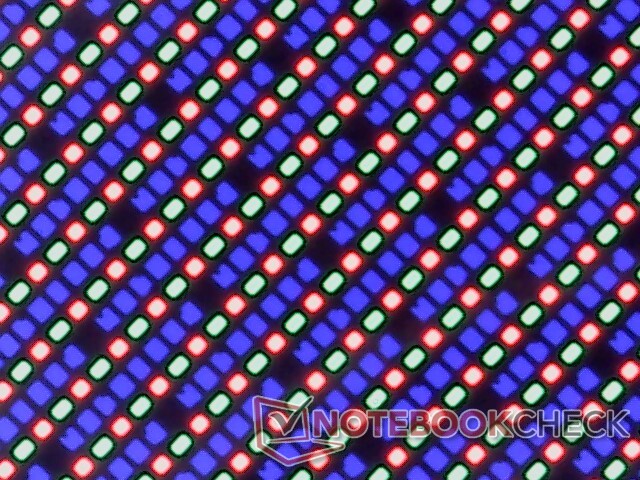
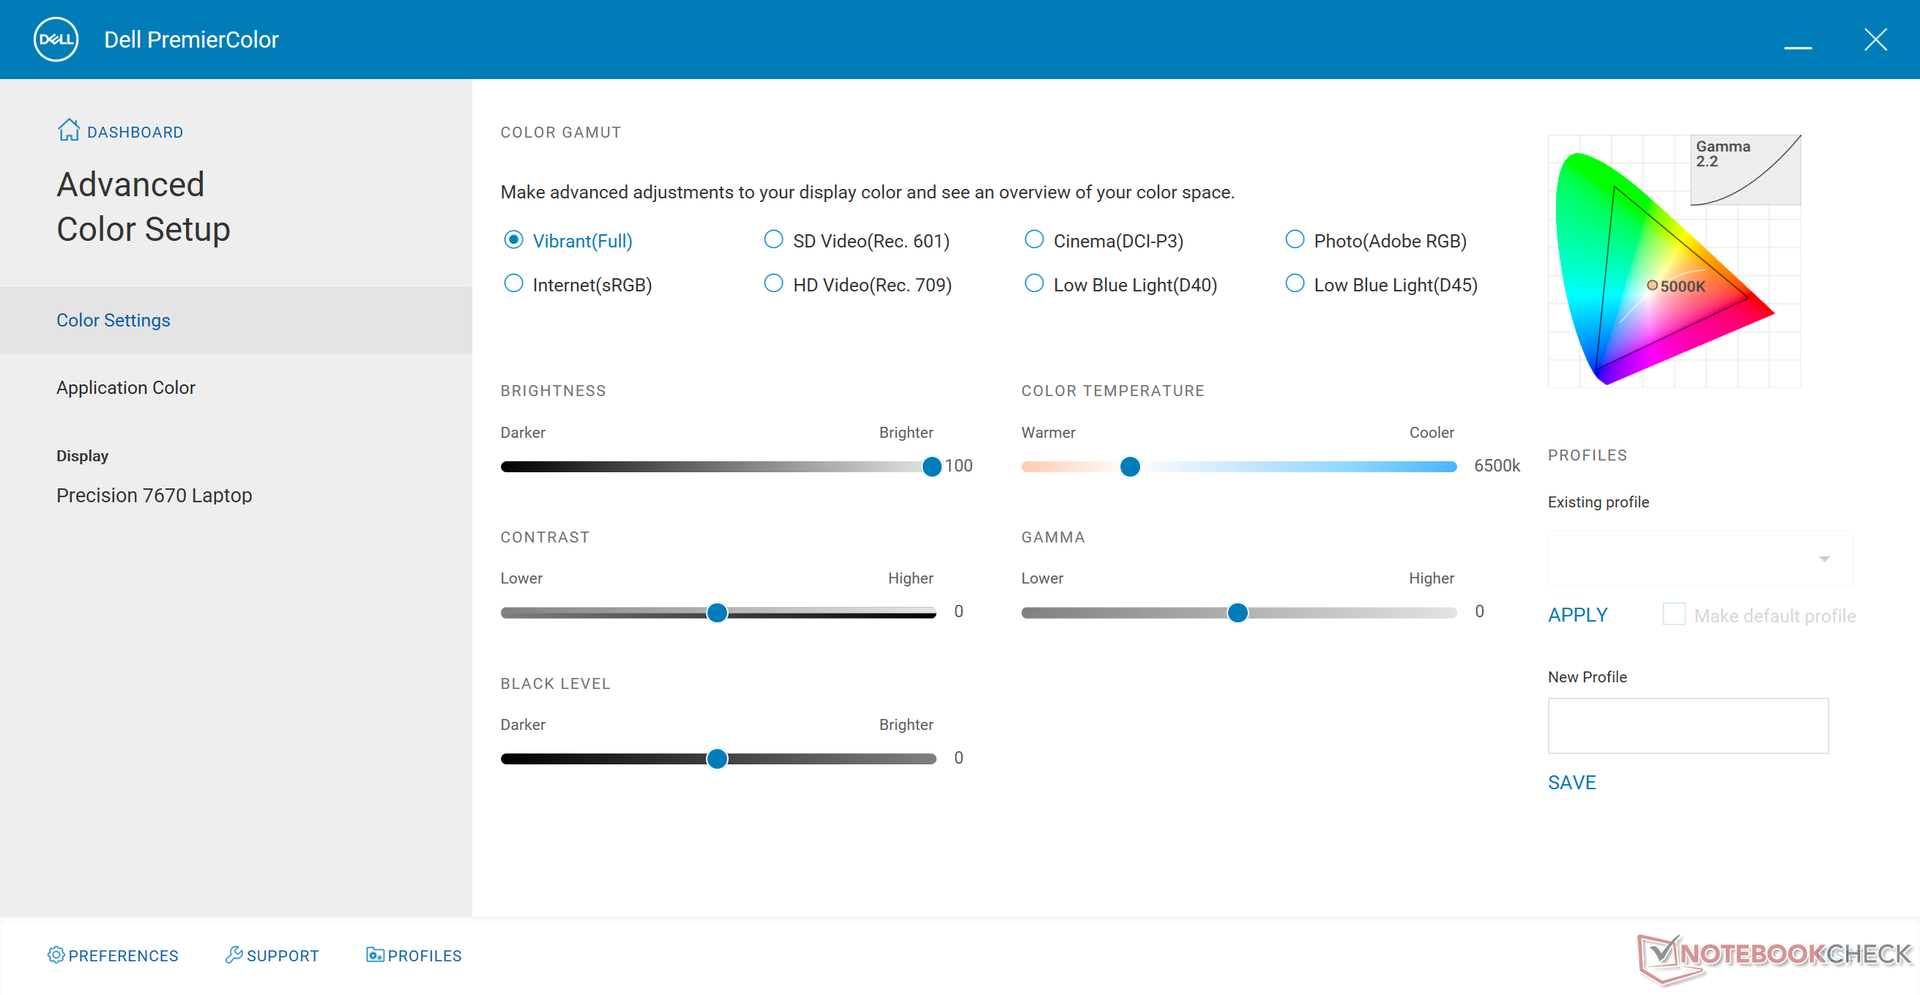
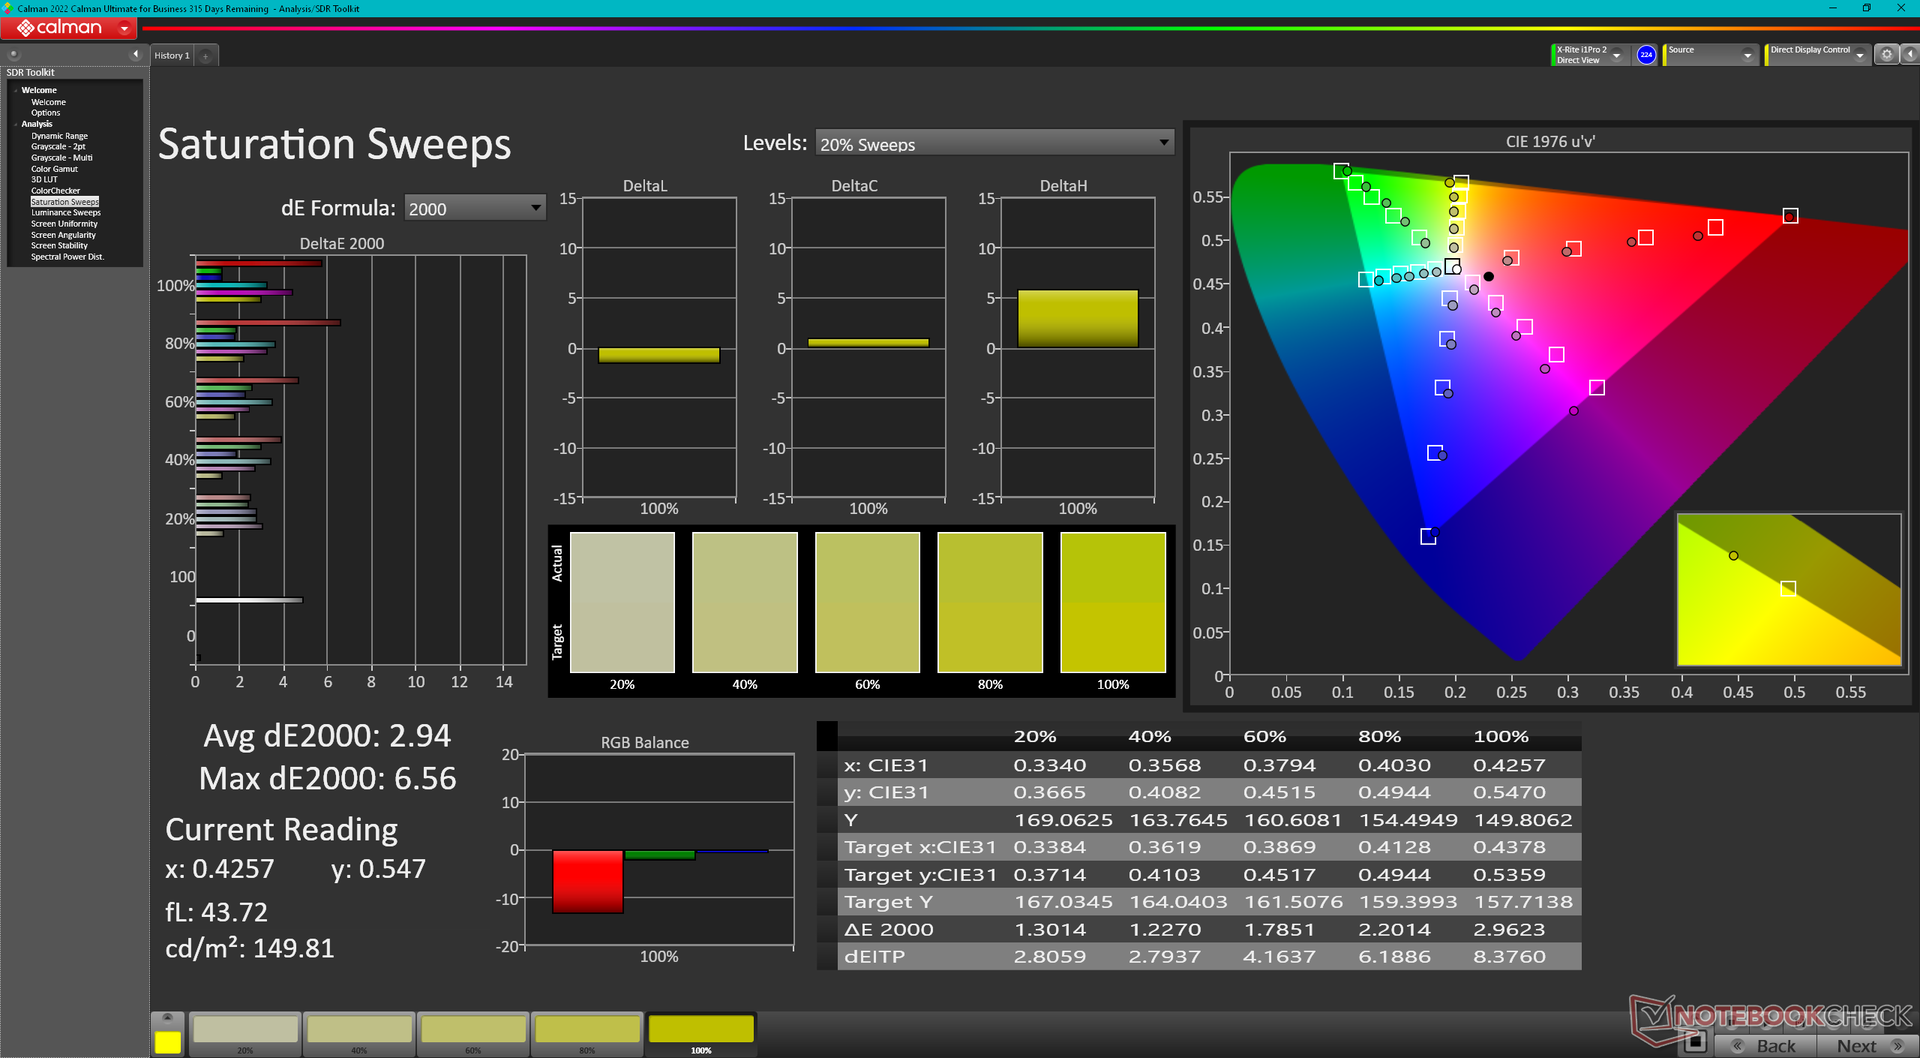
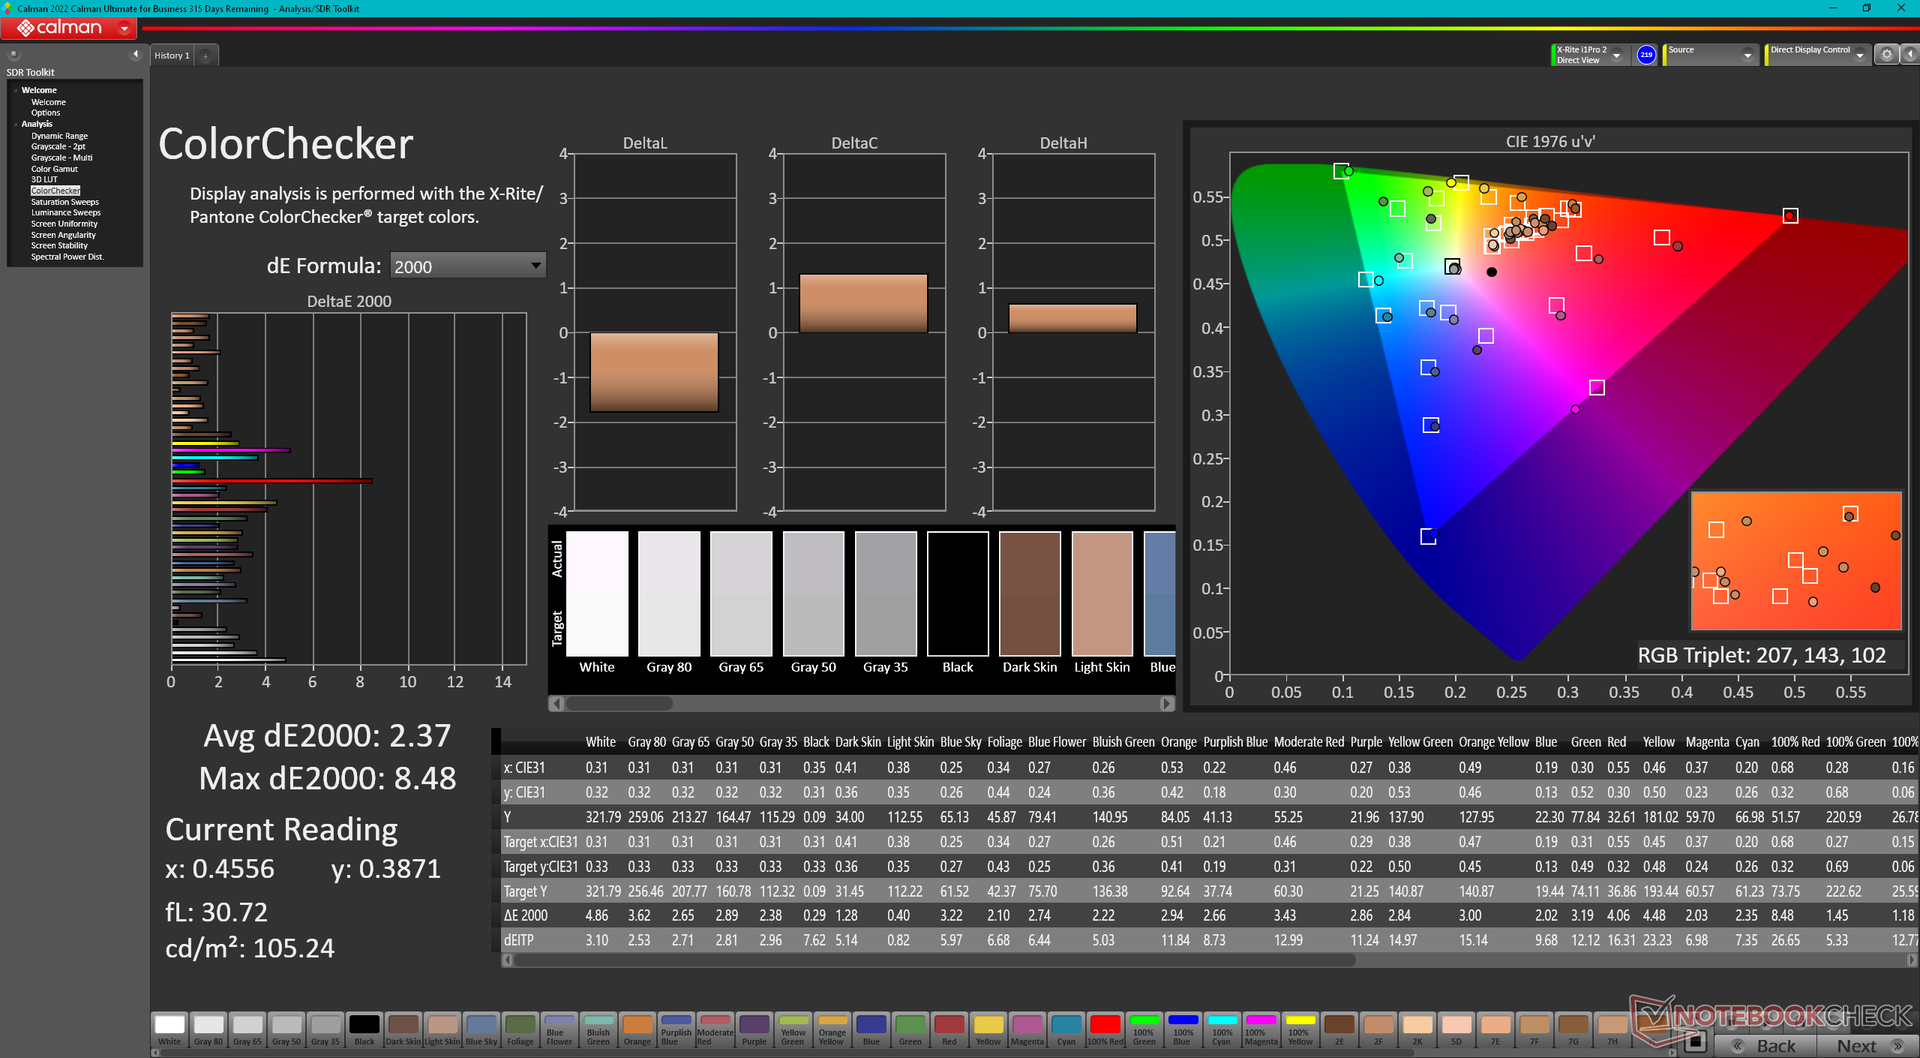
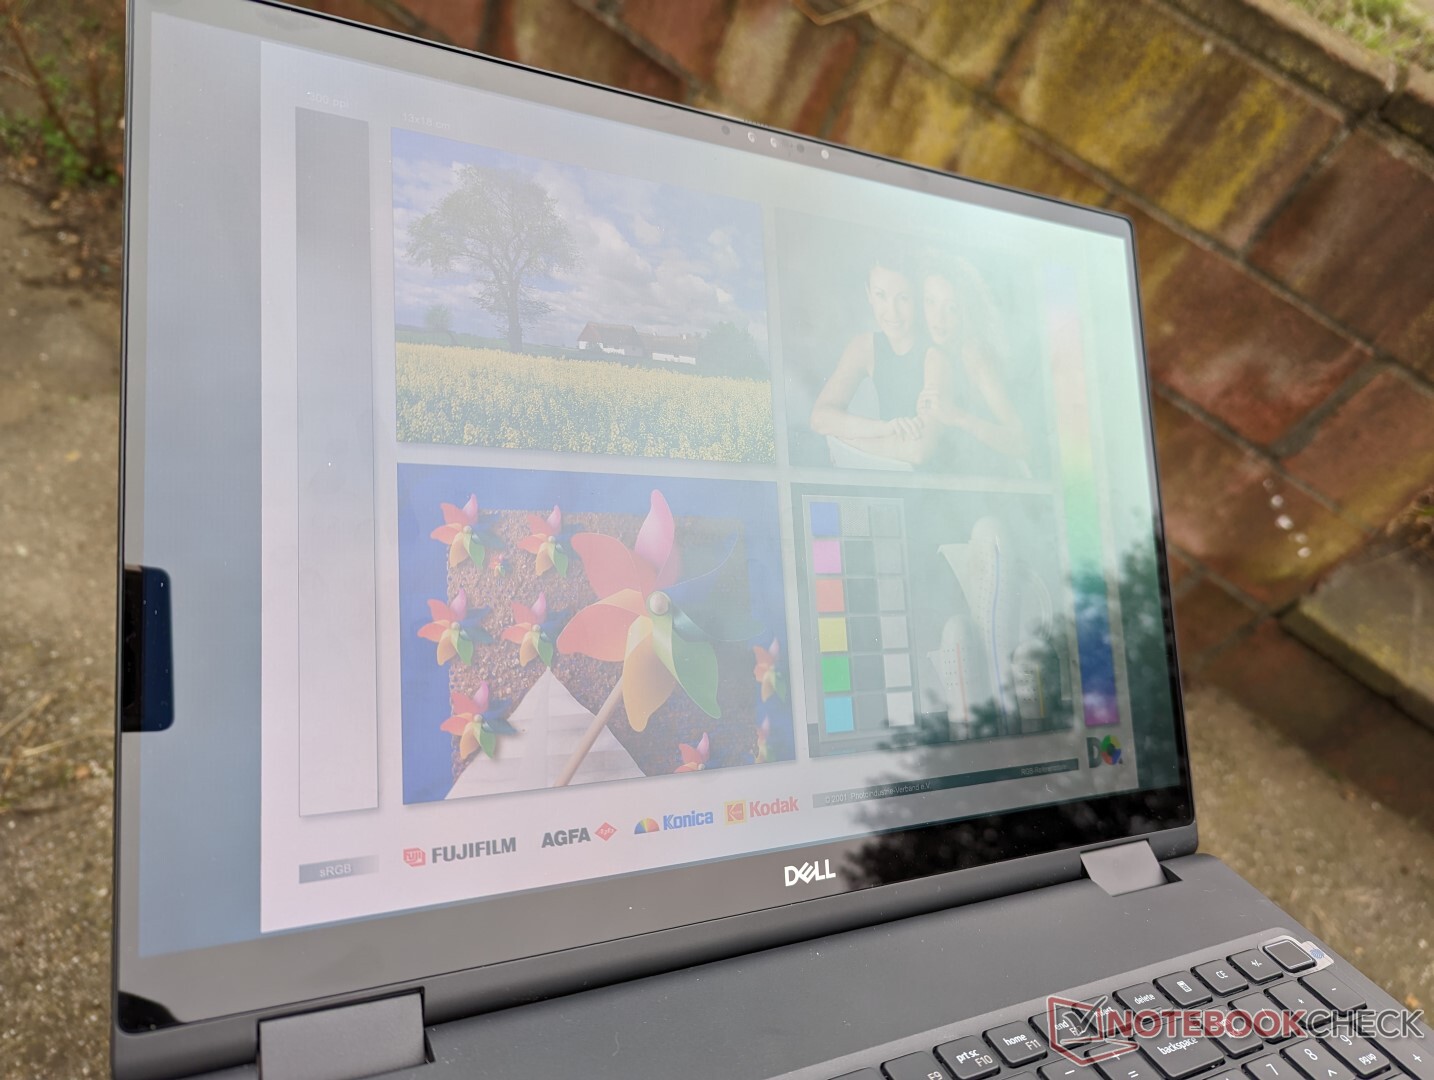
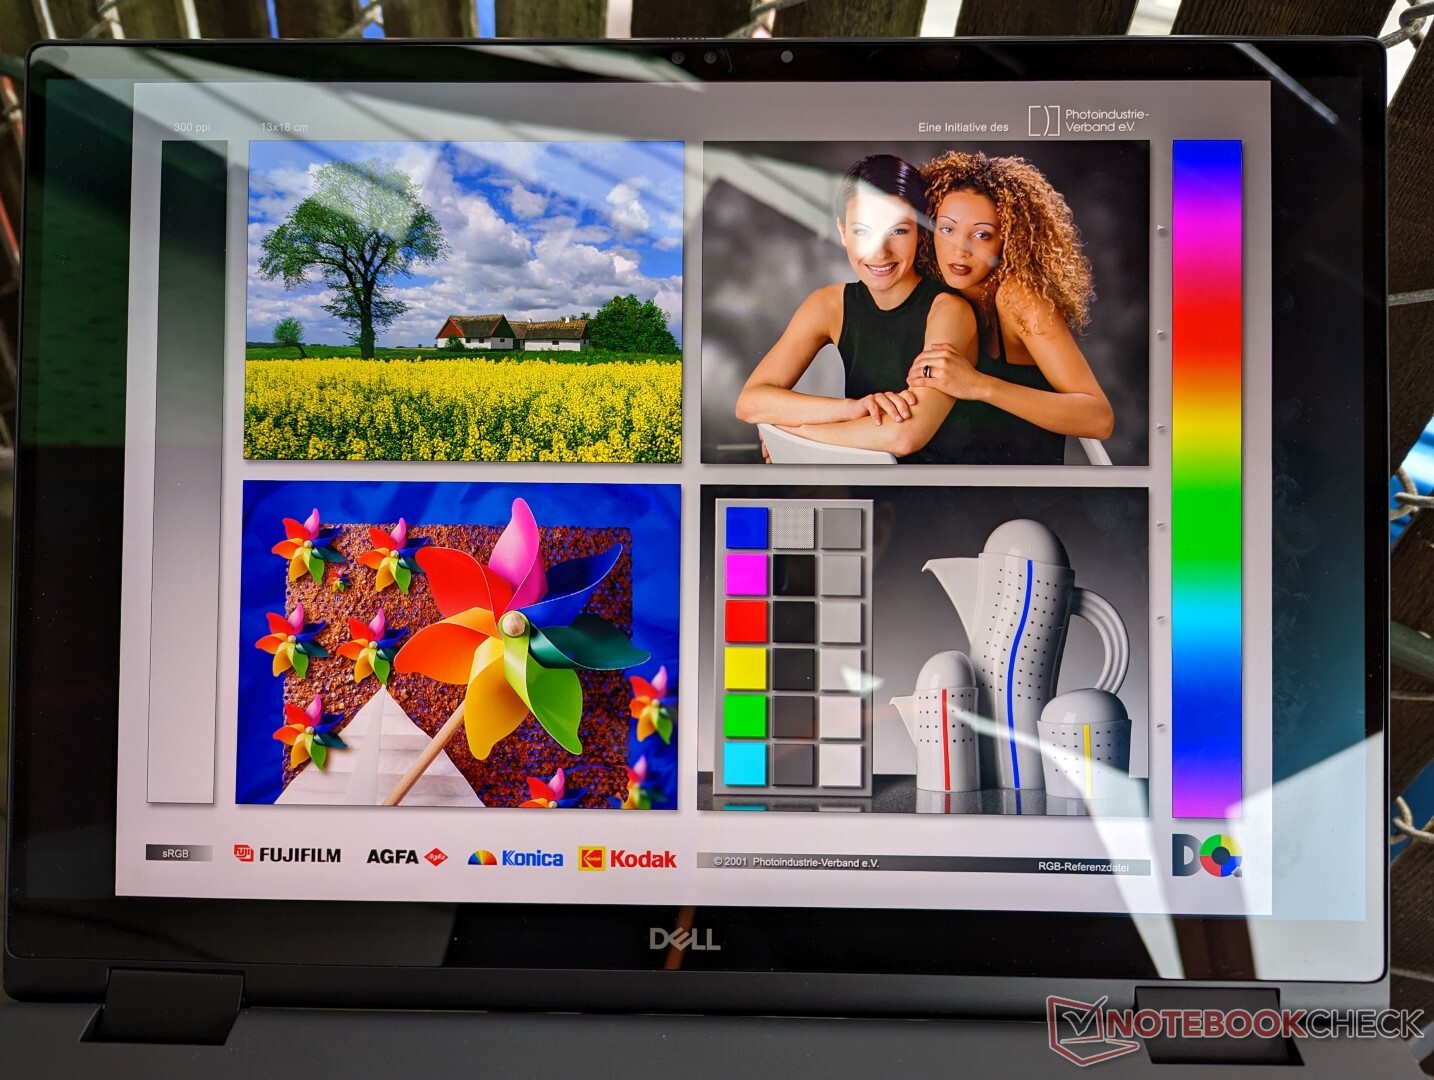
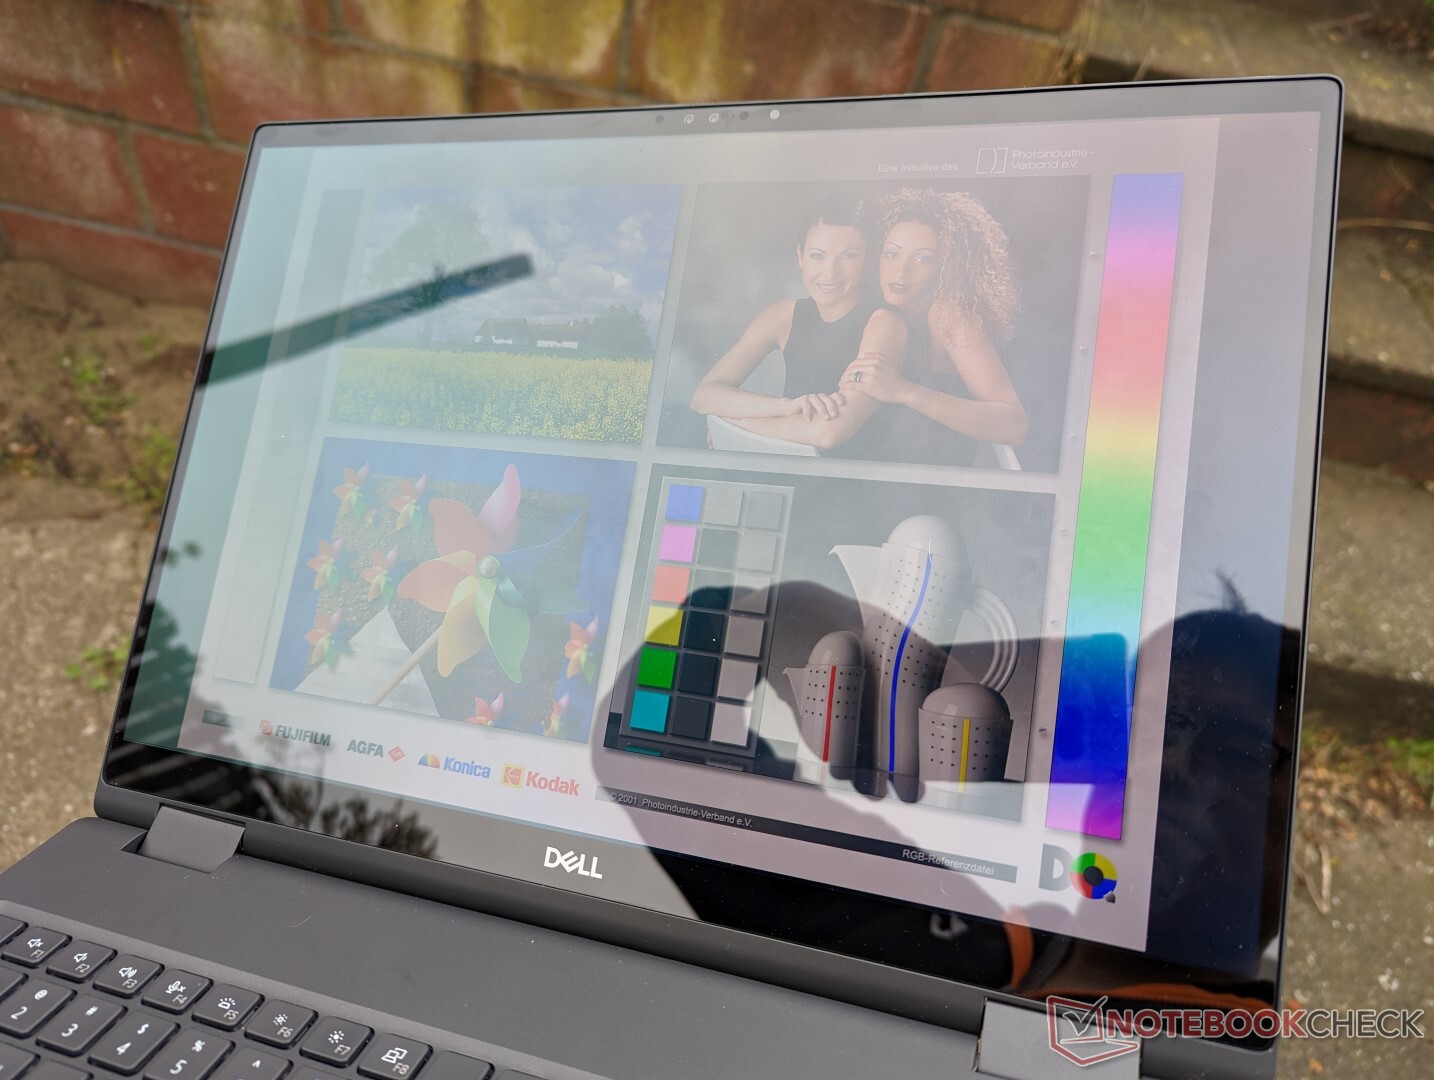
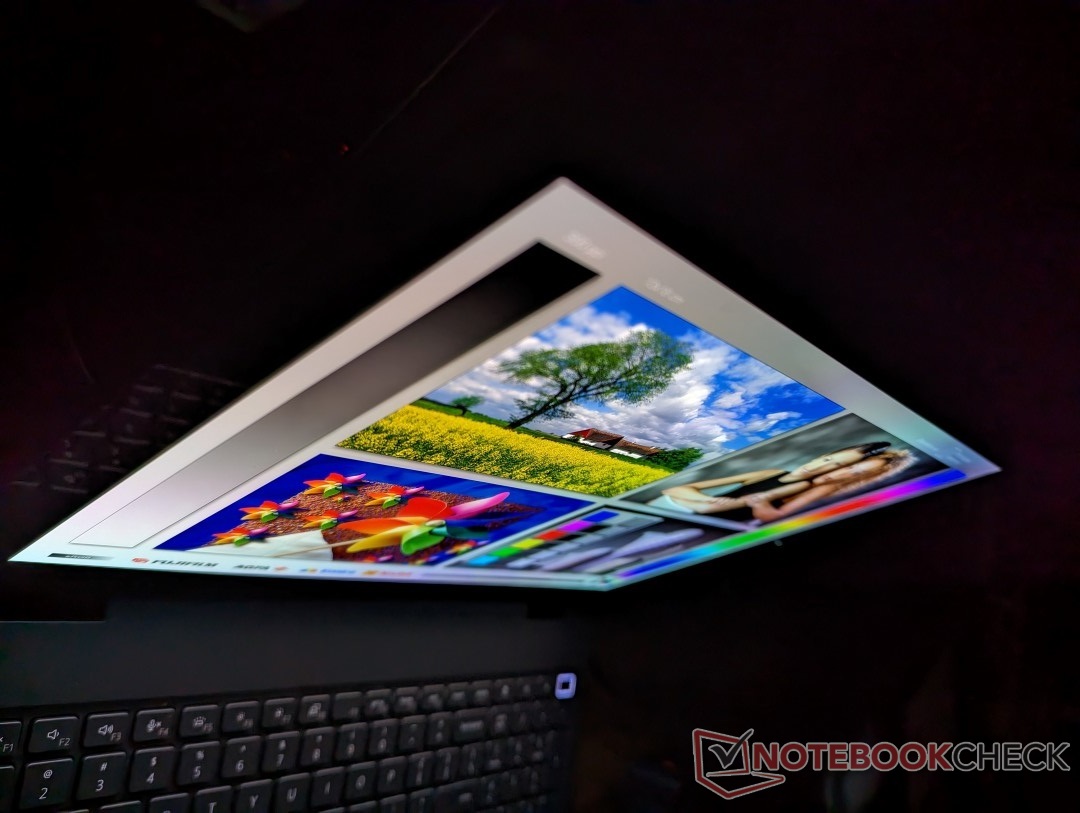
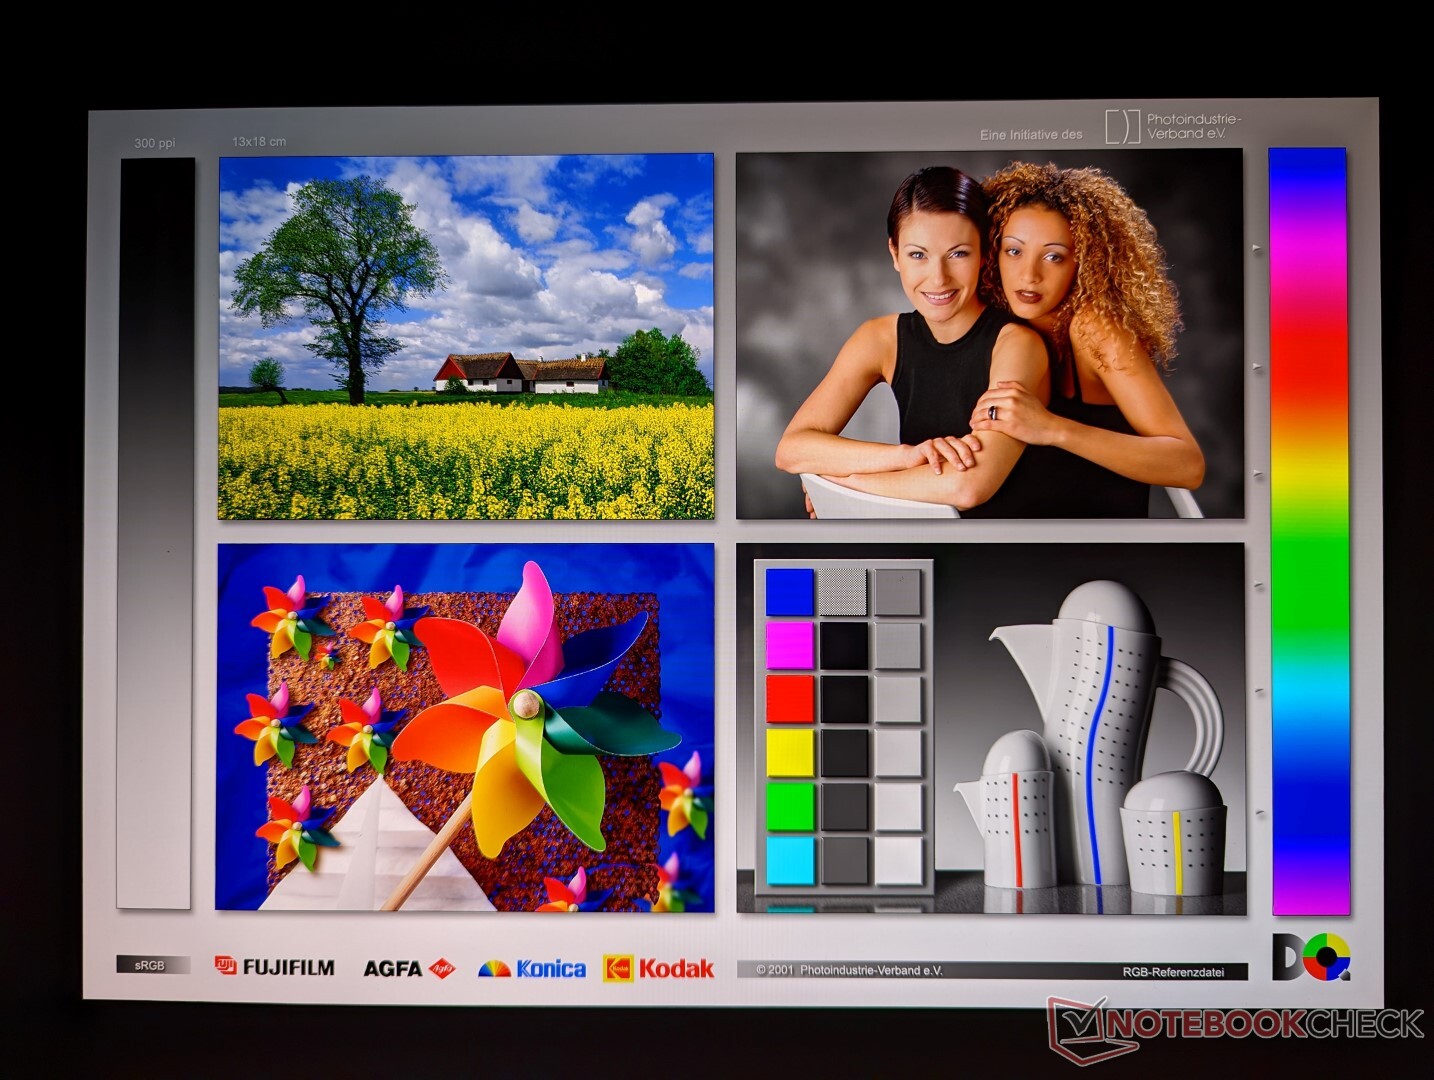
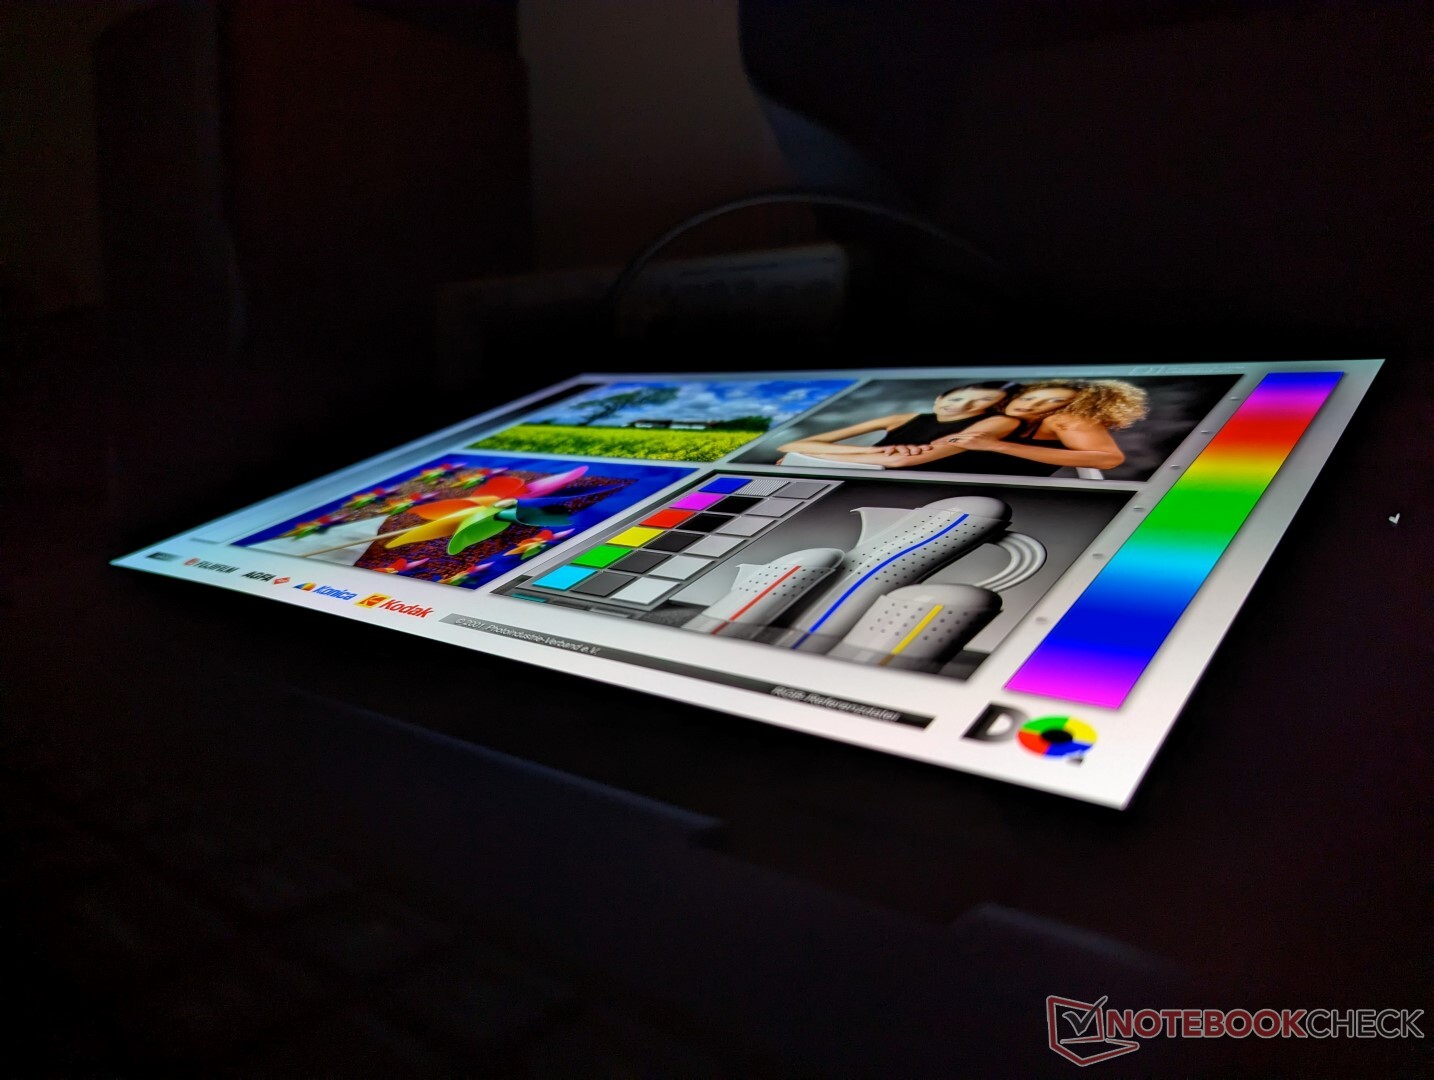
Display
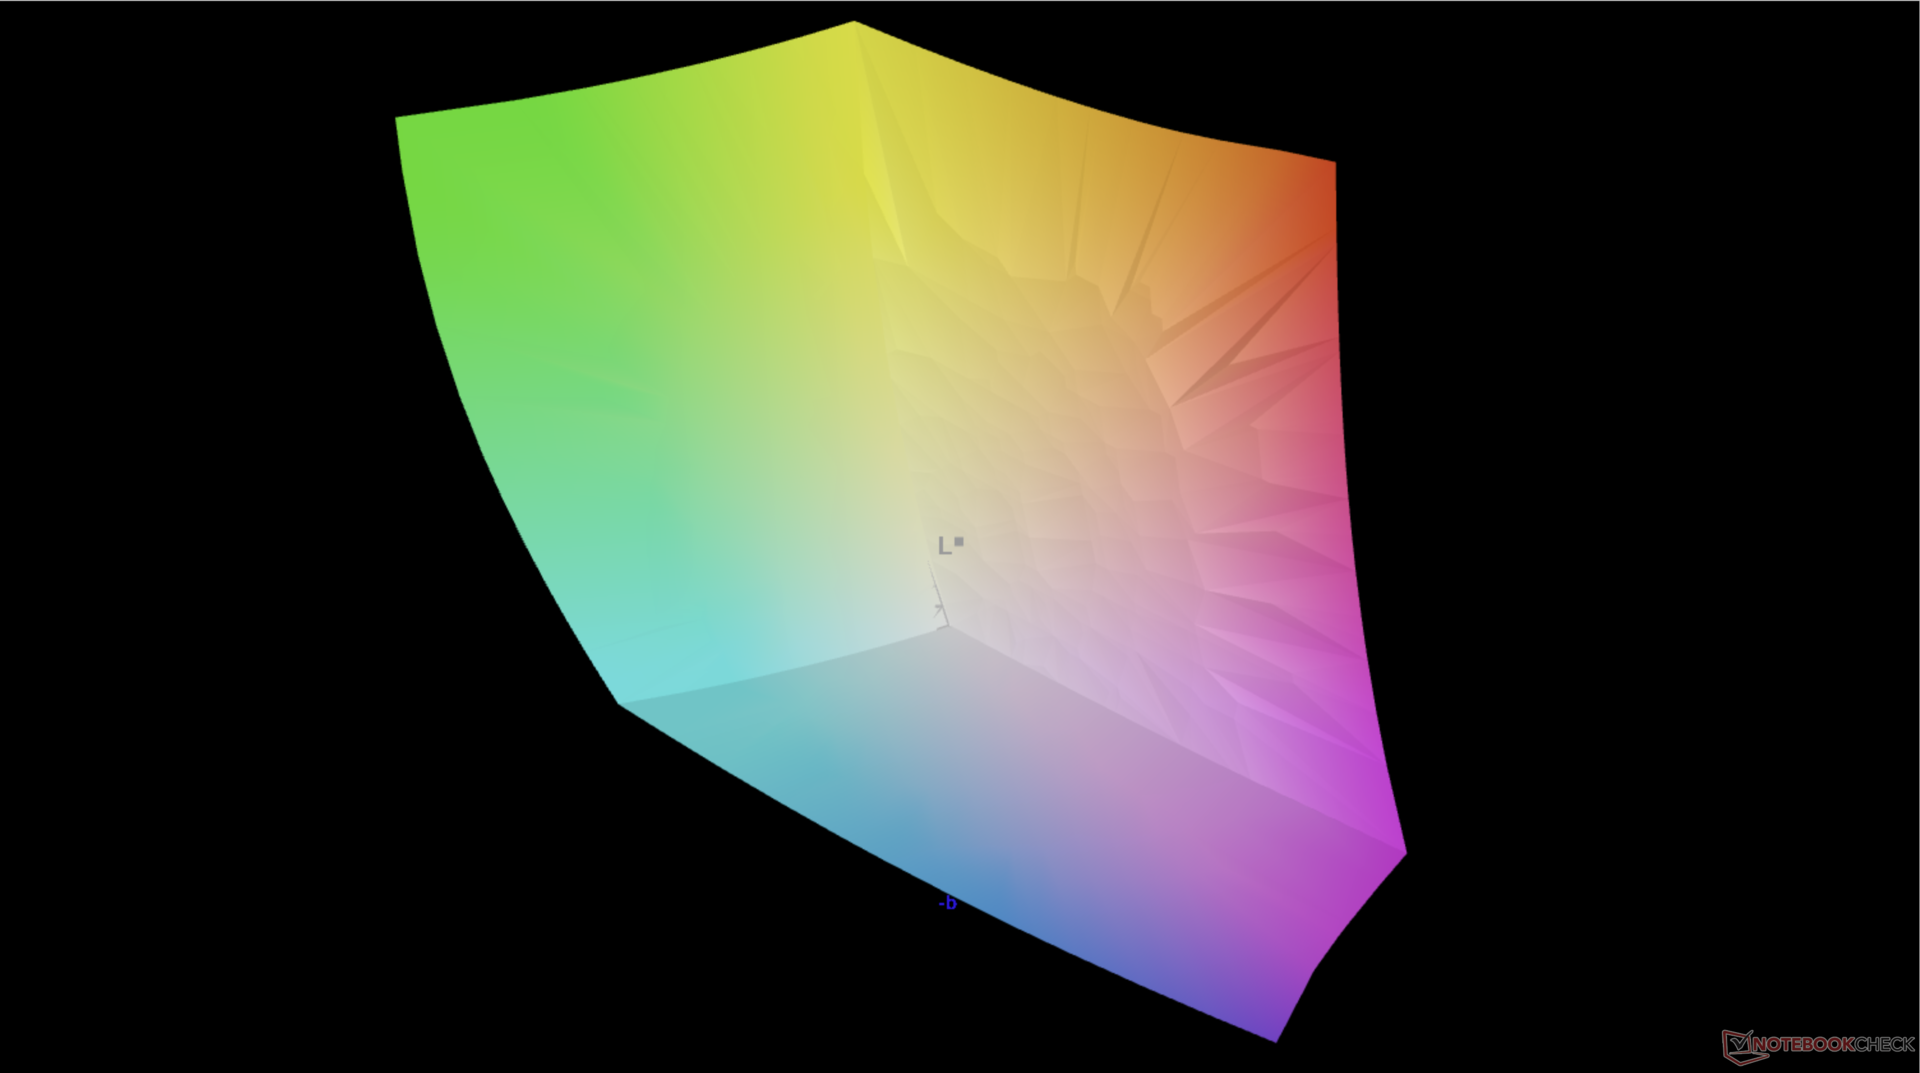
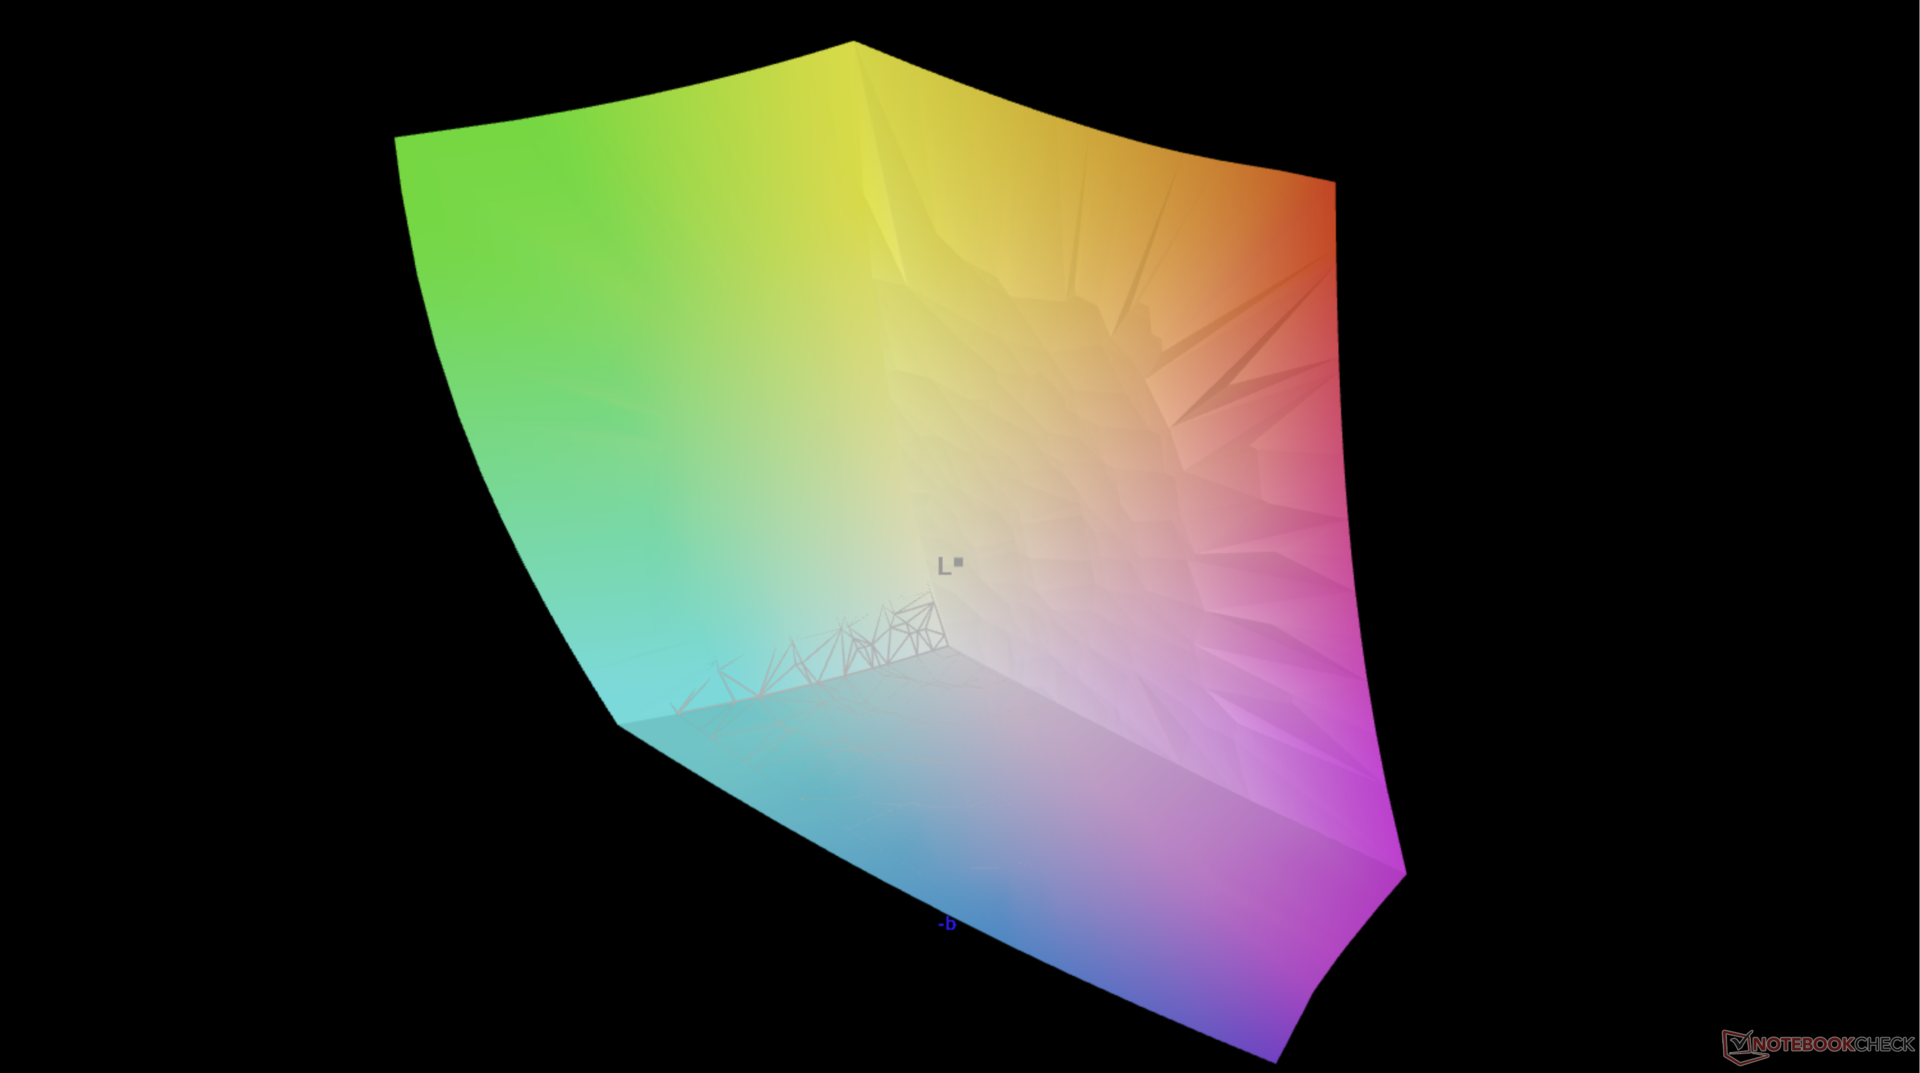
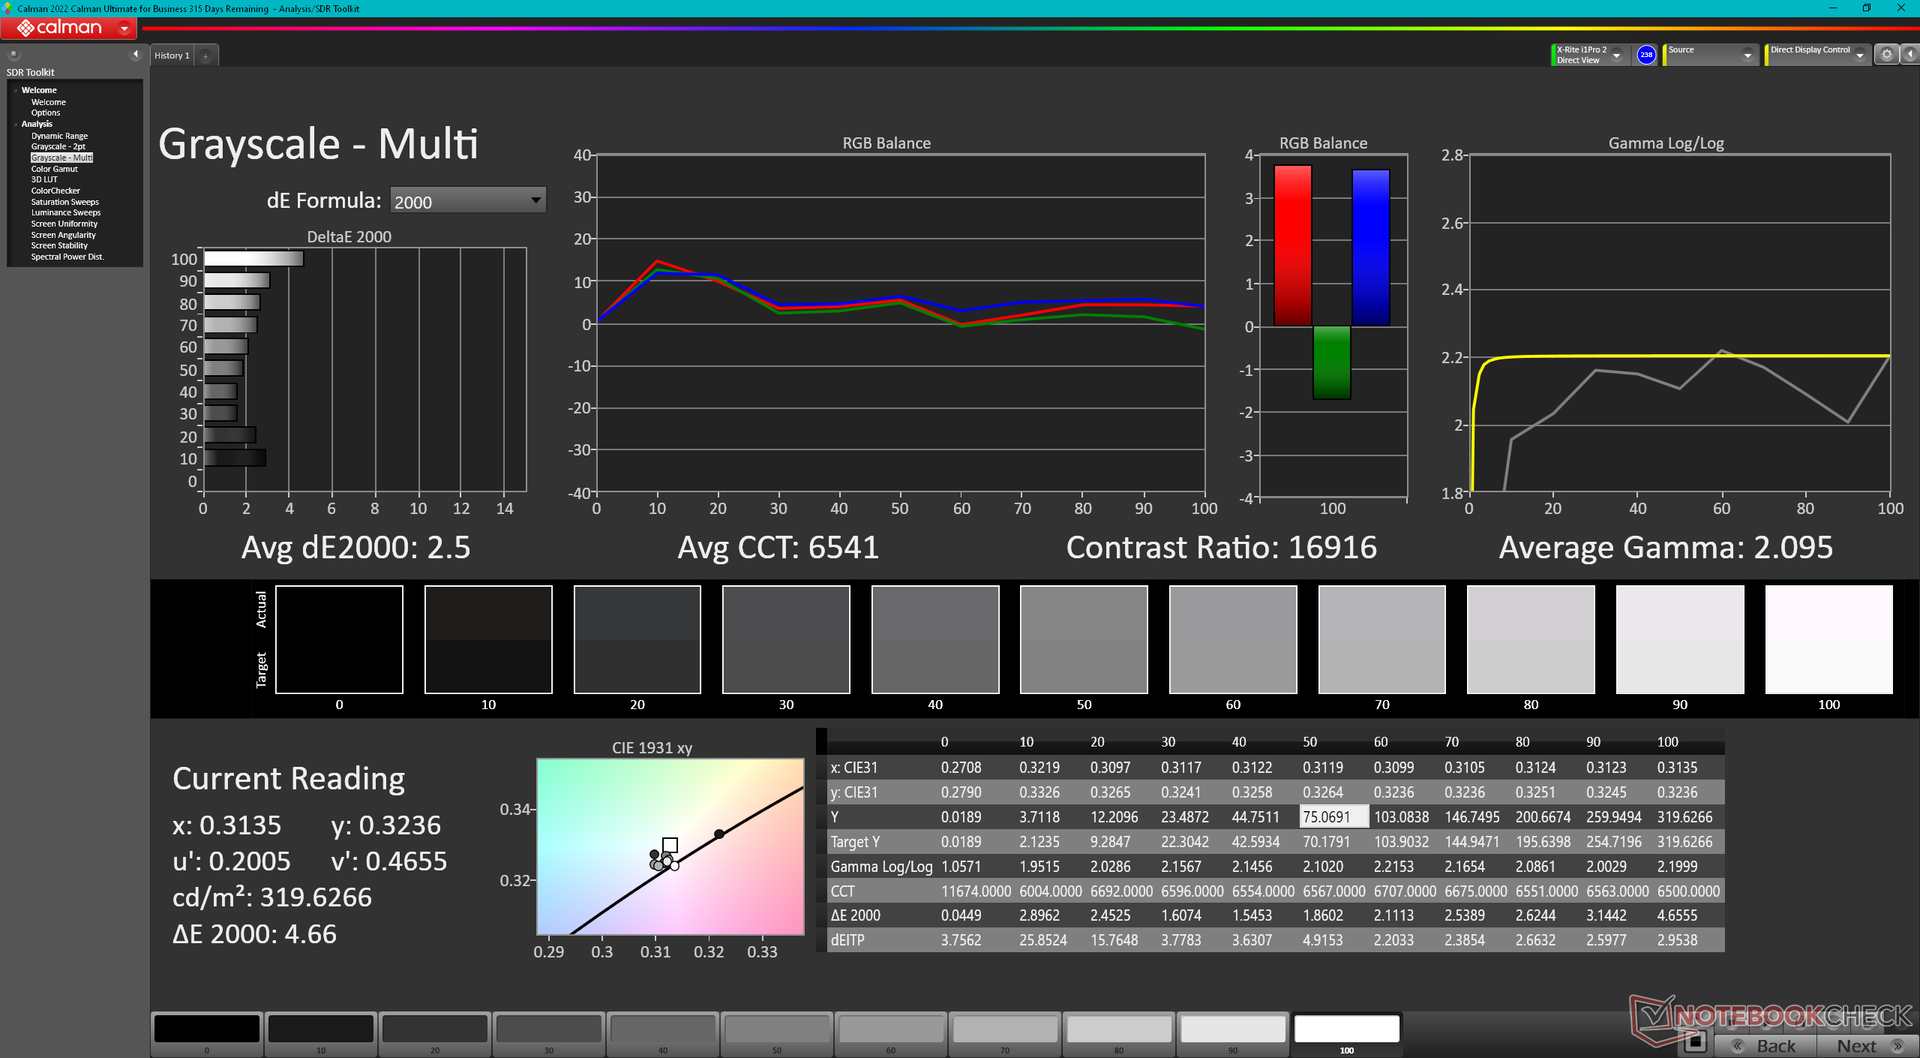
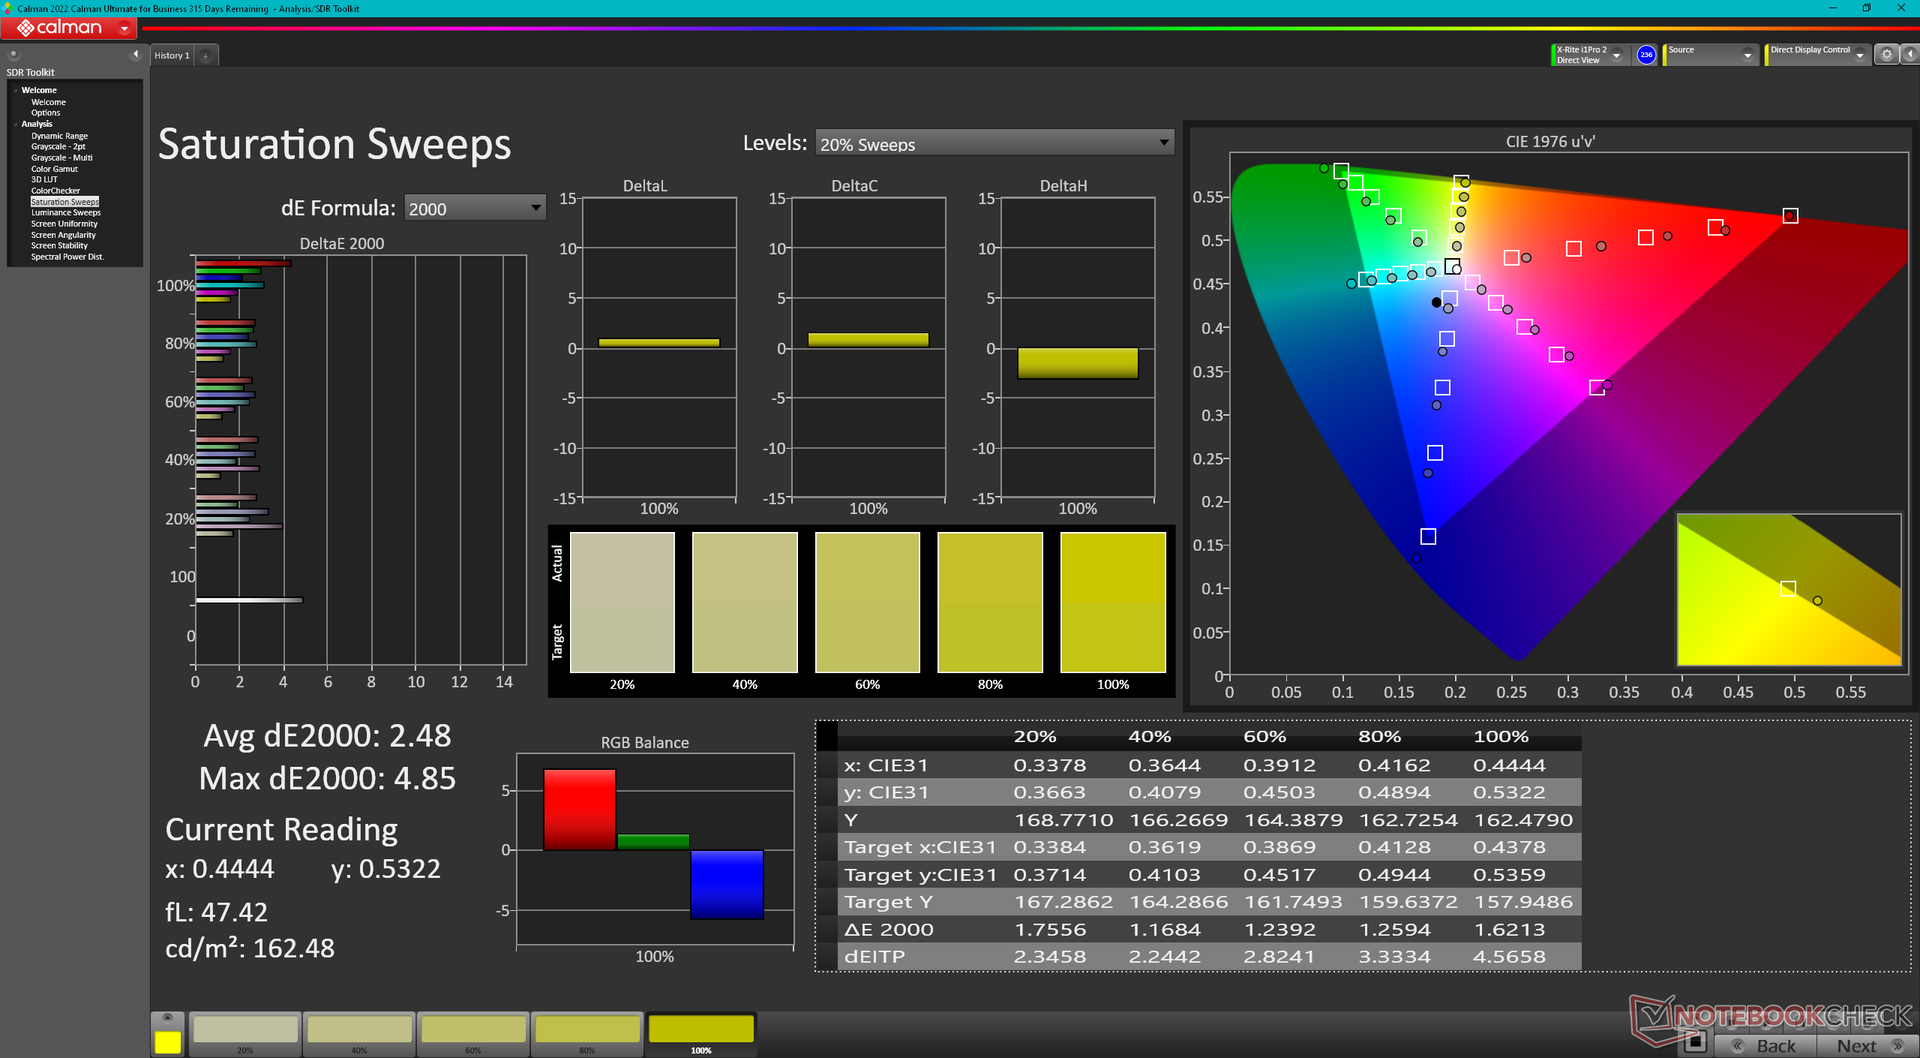
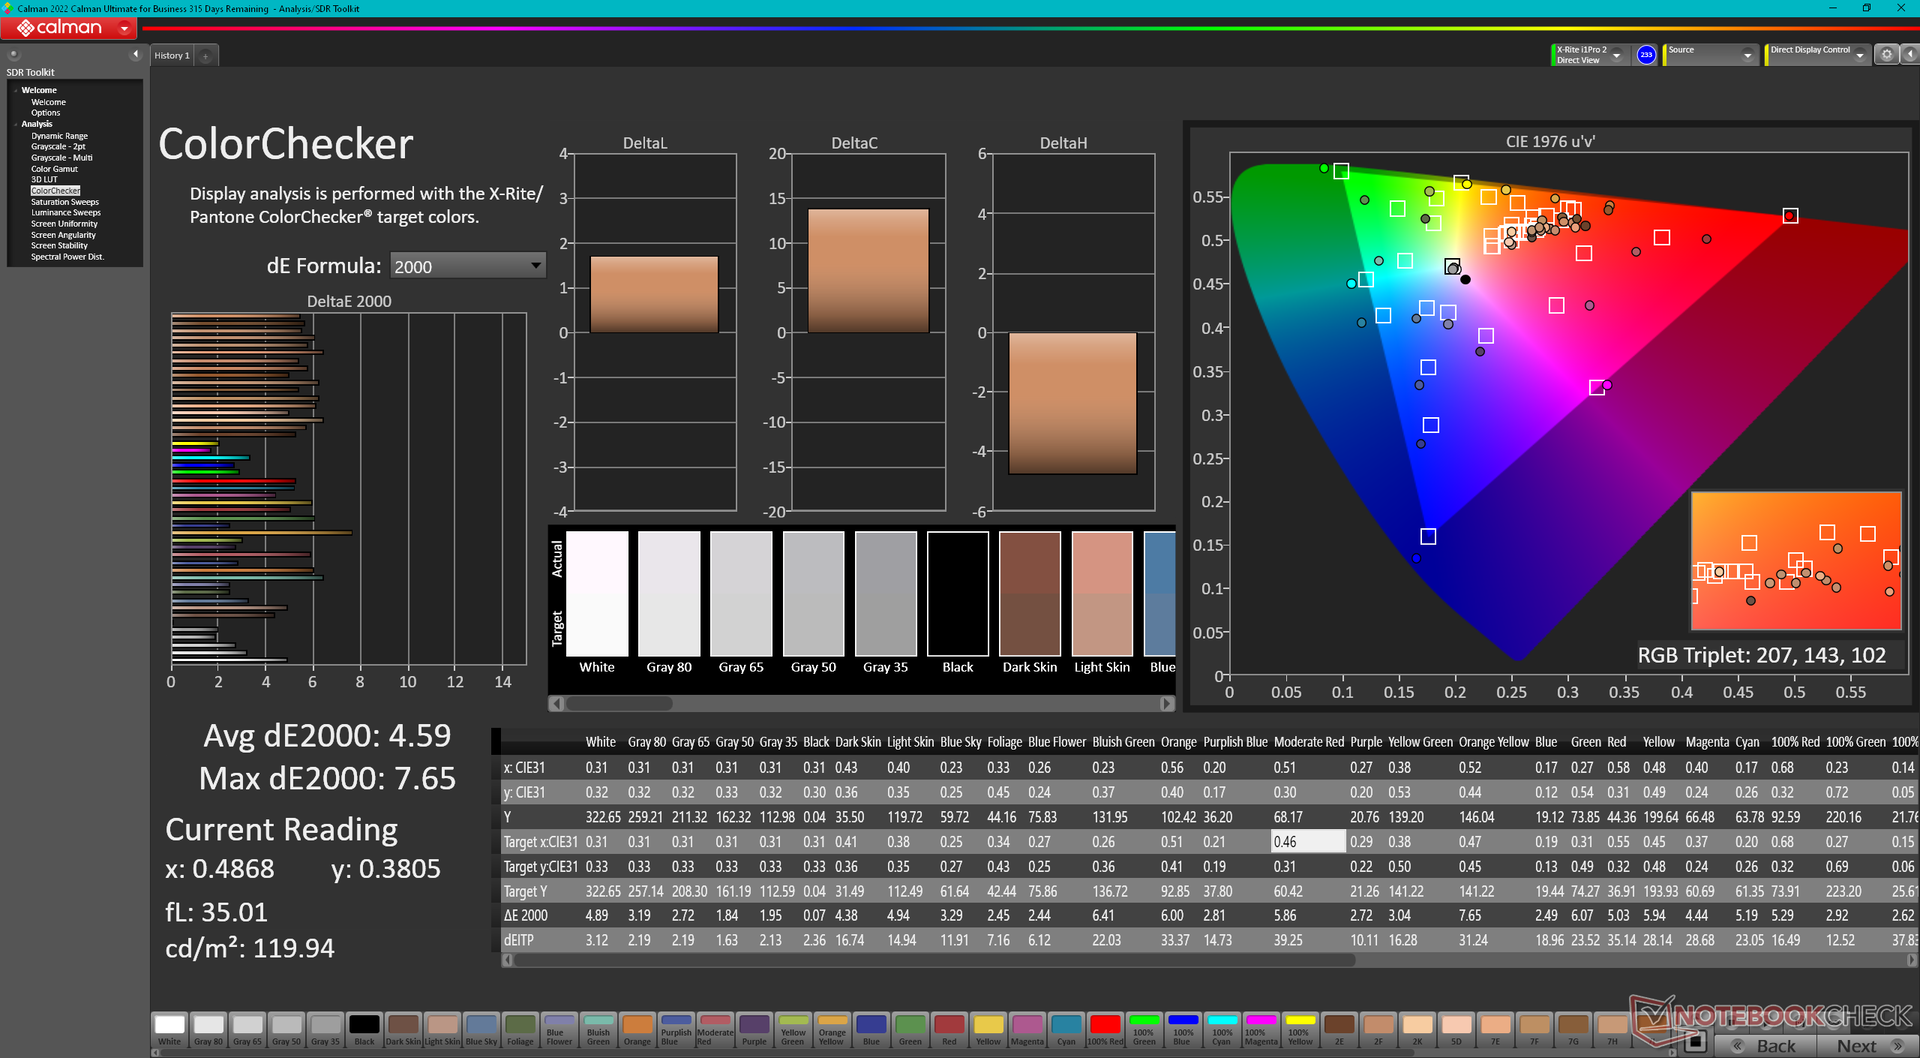
De schermopties zijn identiek aan die van de dunnere Precision 7670. Ons testtoestel gebruikt hetzelfde Samsung 160YV03 OLED-paneel dat volledige P3-kleuren belooft.
| |||||||||||||||||||||||||
Helderheidsverdeling: 97 %
Helderheid in Batterij-modus: 325.2 cd/m²
Contrast: ∞:1 (Zwart: 0 cd/m²)
ΔE ColorChecker Calman: 4.59 | ∀{0.5-29.43 Ø4.71}
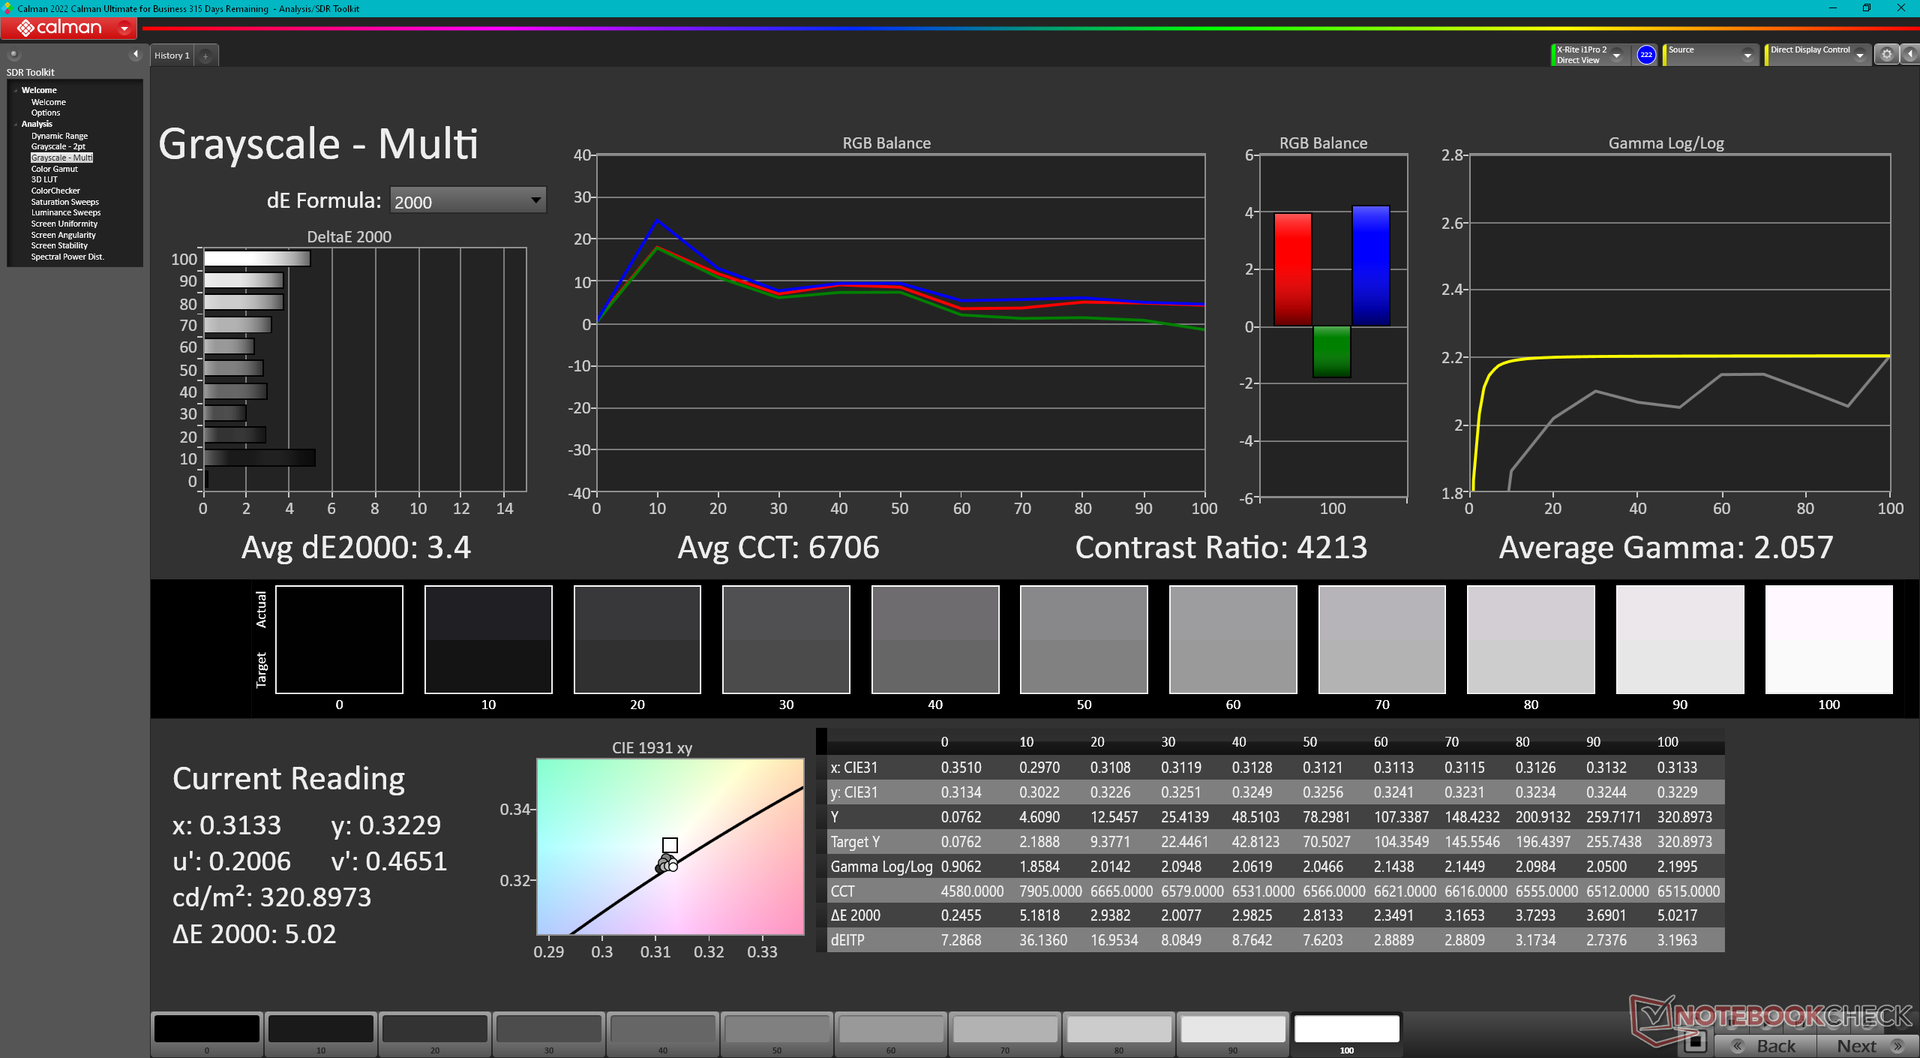
ΔE Greyscale Calman: 2.5 | ∀{0.09-98 Ø4.96}
98.1% AdobeRGB 1998 (Argyll 3D)
100% sRGB (Argyll 3D)
99.9% Display P3 (Argyll 3D)
Gamma: 2.1
CCT: 6541 K
| Dell Precision 7000 7670 Performance Samsung 160YV03, OLED, 3840x2400, 16" | MSI CreatorPro Z16P B12UKST B160QAN02.N, IPS, 2560x1600, 16" | HP ZBook Studio 16 G9 62U04EA BOE0A52, IPS, 3840x2400, 16" | HP ZBook Firefly 16 G9-6B897EA BOE0A02, IPS, 1920x1200, 16" | Lenovo ThinkPad P1 G4-20Y4Z9DVUS NE160QDM-N63, IPS, 2560x1600, 16" | Dell Precision 7670 Samsung 160YV03, OLED, 3840x2400, 16" | |
|---|---|---|---|---|---|---|
| Display | -4% | -5% | -22% | -17% | -0% | |
| Display P3 Coverage (%) | 99.9 | 97.6 -2% | 97.5 -2% | 68.1 -32% | 72.7 -27% | 99.9 0% |
| sRGB Coverage (%) | 100 | 99.9 0% | 99.9 0% | 96.1 -4% | 99.3 -1% | 100 0% |
| AdobeRGB 1998 Coverage (%) | 98.1 | 87.4 -11% | 86.3 -12% | 70 -29% | 74.7 -24% | 97.5 -1% |
| Response Times | -441% | -475% | -1843% | -1550% | -4% | |
| Response Time Grey 50% / Grey 80% * (ms) | 1.84 ? | 12.8 ? -596% | 15.3 ? -732% | 52.8 ? -2770% | 40.8 -2117% | 1.9 ? -3% |
| Response Time Black / White * (ms) | 1.92 ? | 7.4 ? -285% | 6.1 ? -218% | 19.5 ? -916% | 20.8 -983% | 2 ? -4% |
| PWM Frequency (Hz) | 59.52 ? | 59.5 ? | ||||
| Screen | 32% | 50% | 4% | 7% | 2% | |
| Brightness middle (cd/m²) | 325.2 | 407 25% | 554 70% | 526 62% | 441 36% | 340.1 5% |
| Brightness (cd/m²) | 328 | 388 18% | 516 57% | 499 52% | 420 28% | 342 4% |
| Brightness Distribution (%) | 97 | 88 -9% | 84 -13% | 93 -4% | 90 -7% | 98 1% |
| Black Level * (cd/m²) | 0.36 | 0.47 | 0.31 | 0.27 | ||
| Colorchecker dE 2000 * | 4.59 | 1.3 72% | 1 78% | 3.6 22% | 2.6 43% | 2.5 46% |
| Colorchecker dE 2000 max. * | 7.65 | 2.5 67% | 2.4 69% | 6.6 14% | 6 22% | 8.19 -7% |
| Greyscale dE 2000 * | 2.5 | 2.1 16% | 1.6 36% | 5.5 -120% | 4.5 -80% | 3.5 -40% |
| Gamma | 2.1 105% | 2.26 97% | 2.29 96% | 2.02 109% | 2.18 101% | 2.12 104% |
| CCT | 6541 99% | 6437 101% | 6458 101% | 6527 100% | 6623 98% | 6704 97% |
| Contrast (:1) | 1131 | 1179 | 1697 | 1633 | ||
| Colorchecker dE 2000 calibrated * | 0.7 | 0.6 | 2.6 | 1.2 | ||
| Totaal Gemiddelde (Programma / Instellingen) | -138% /
-64% | -143% /
-61% | -620% /
-339% | -520% /
-283% | -1% /
0% |
* ... kleiner is beter
Responstijd Scherm
| ↔ Responstijd Zwart naar Wit | ||
|---|---|---|
| 1.92 ms ... stijging ↗ en daling ↘ gecombineerd | ↗ 0.92 ms stijging | 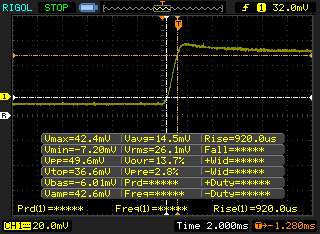 |
| ↘ 1 ms daling | ||
| Het scherm vertoonde erg snelle responstijden in onze tests en zou zeer geschikt moeten zijn voor snelle games. Ter vergelijking: alle testtoestellen variëren van 0.1 (minimum) tot 240 (maximum) ms. » 11 % van alle toestellen zijn beter. Dit betekent dat de gemeten responstijd beter is dan het gemiddelde (19.8 ms) van alle geteste toestellen. | ||
| ↔ Responstijd 50% Grijs naar 80% Grijs | ||
| 1.84 ms ... stijging ↗ en daling ↘ gecombineerd | ↗ 0.92 ms stijging | 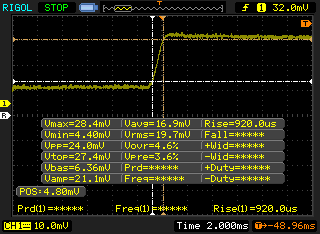 |
| ↘ 0.92 ms daling | ||
| Het scherm vertoonde erg snelle responstijden in onze tests en zou zeer geschikt moeten zijn voor snelle games. Ter vergelijking: alle testtoestellen variëren van 0.165 (minimum) tot 636 (maximum) ms. » 9 % van alle toestellen zijn beter. Dit betekent dat de gemeten responstijd beter is dan het gemiddelde (31 ms) van alle geteste toestellen. | ||
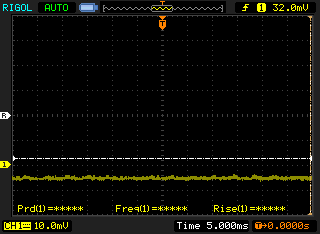
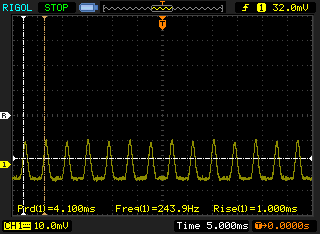
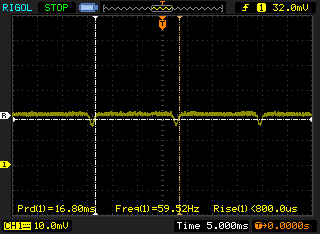
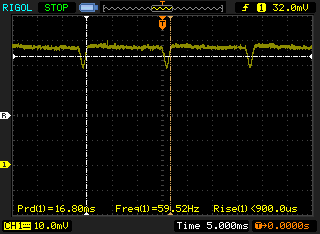
Screen Flickering / PWM (Pulse-Width Modulation)
| Screen flickering / PWM waargenomen | 59.52 Hz | ≤ 100 % helderheid instelling | 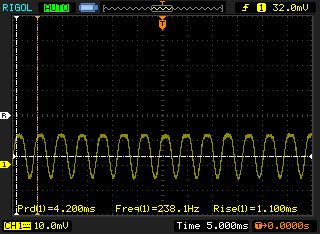 |
De achtergrondverlichting van het scherm flikkert op 59.52 Hz (in het slechtste geval, bijvoorbeeld bij gebruik van PWM) aan een helderheid van 100 % en lager. Boven deze helderheid zou er geen flickering / PWM mogen optreden. De frequentie van 59.52 Hz is erg laag en kan dus aanleiding geven tot geïrriteerde ogen en hoofdpijn bij langer gebruik. Ter vergelijking: 52 % van alle geteste toestellen maakten geen gebruik van PWM om de schermhelderheid te verlagen. Als het wel werd gebruikt, werd een gemiddelde van 7754 (minimum: 5 - maximum: 343500) Hz waargenomen. | |||
Flikkering is aanwezig bij alle helderheidsinstellingen, zoals bij de meeste OLED-panelen. We registreren een frequentie van 238,1 Hz van 0 tot 57 procent helderheid en 59,5 Hz van 58 procent tot maximaal.

Prestaties
Testomstandigheden
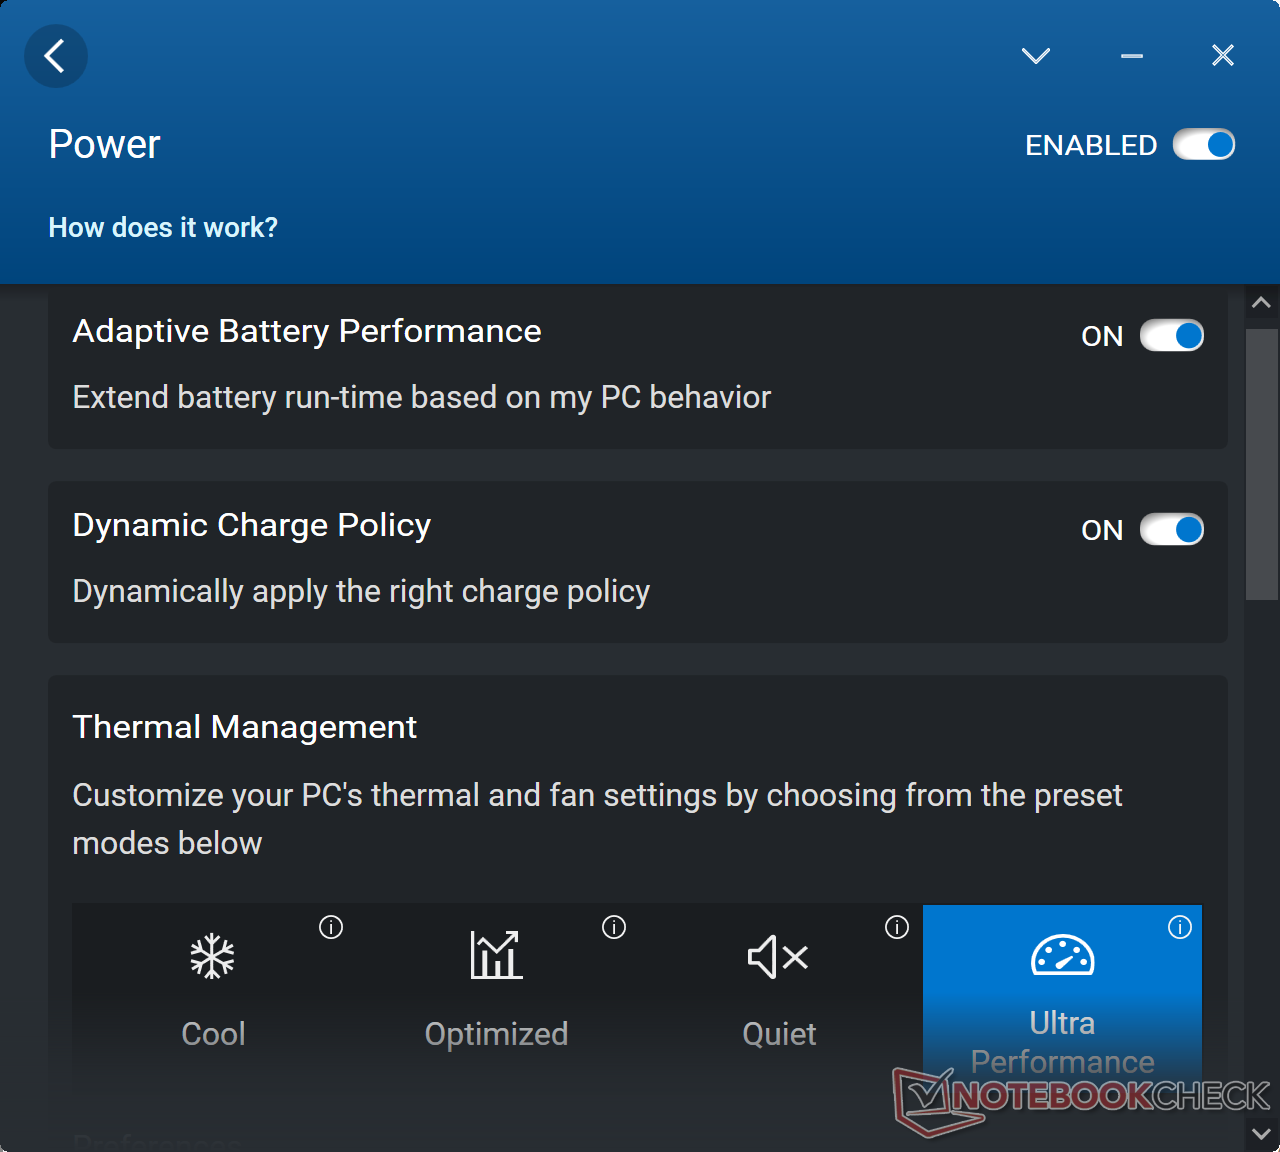
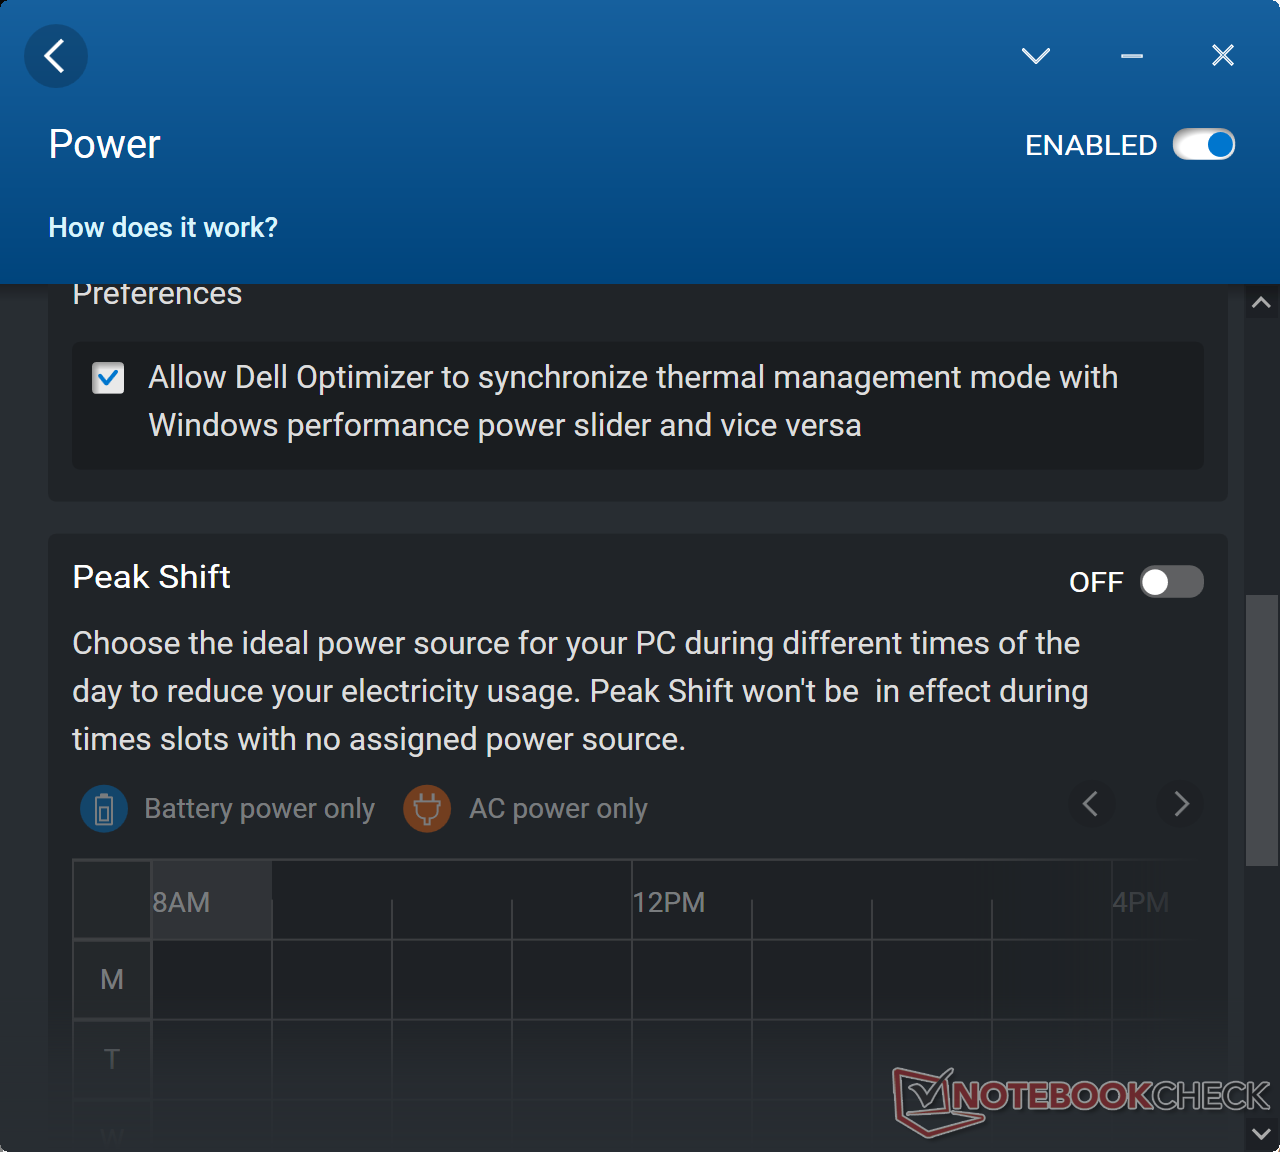
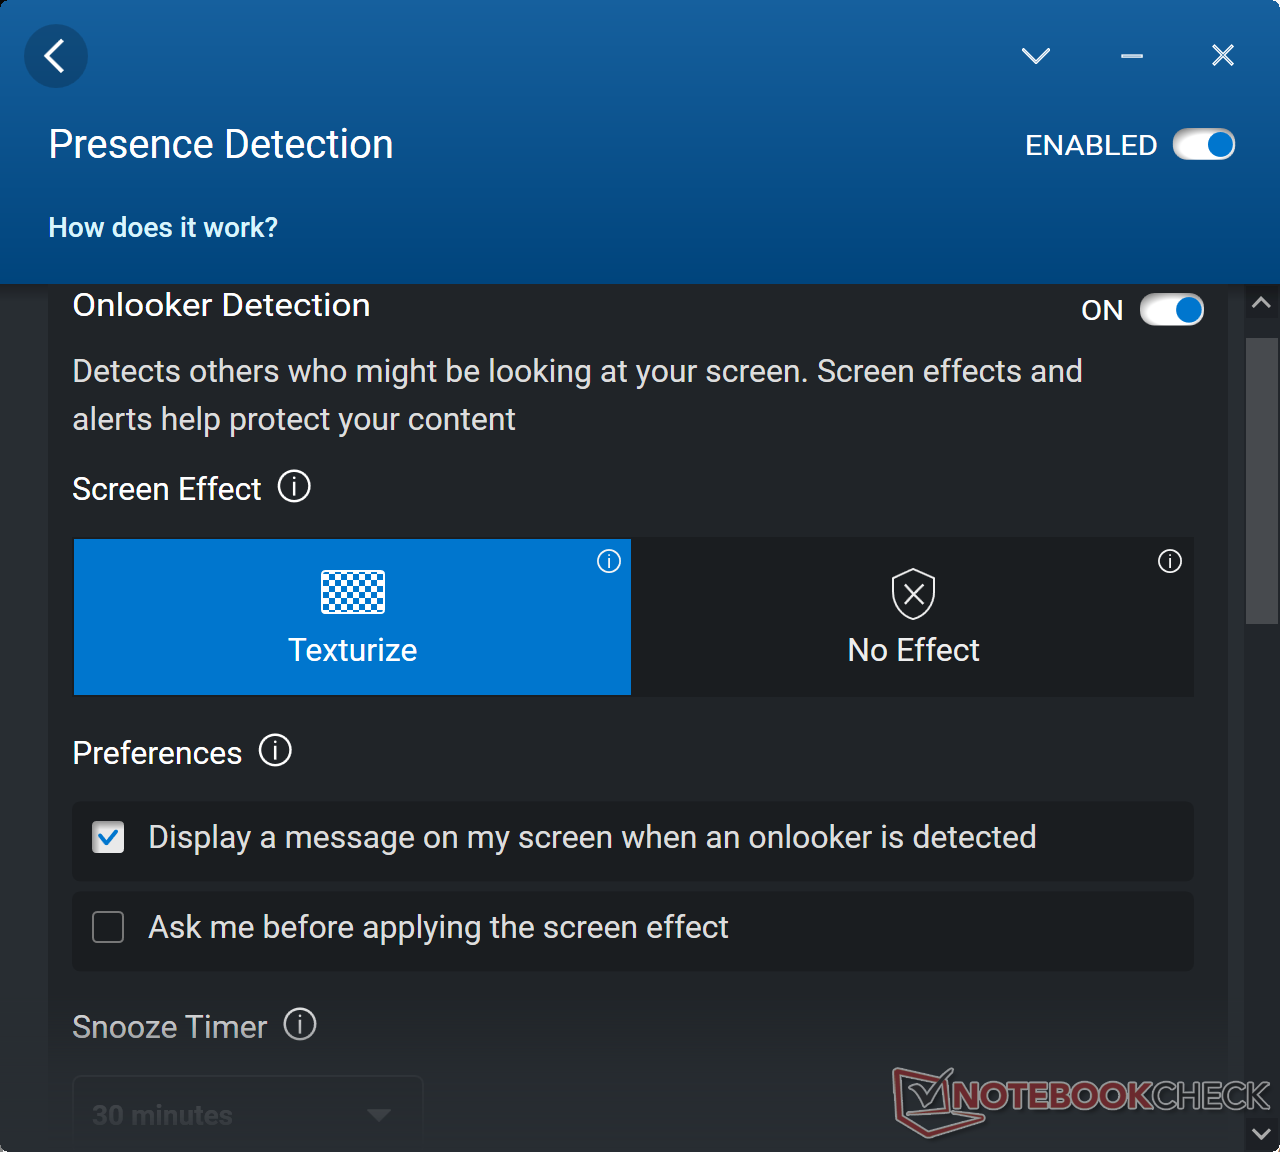
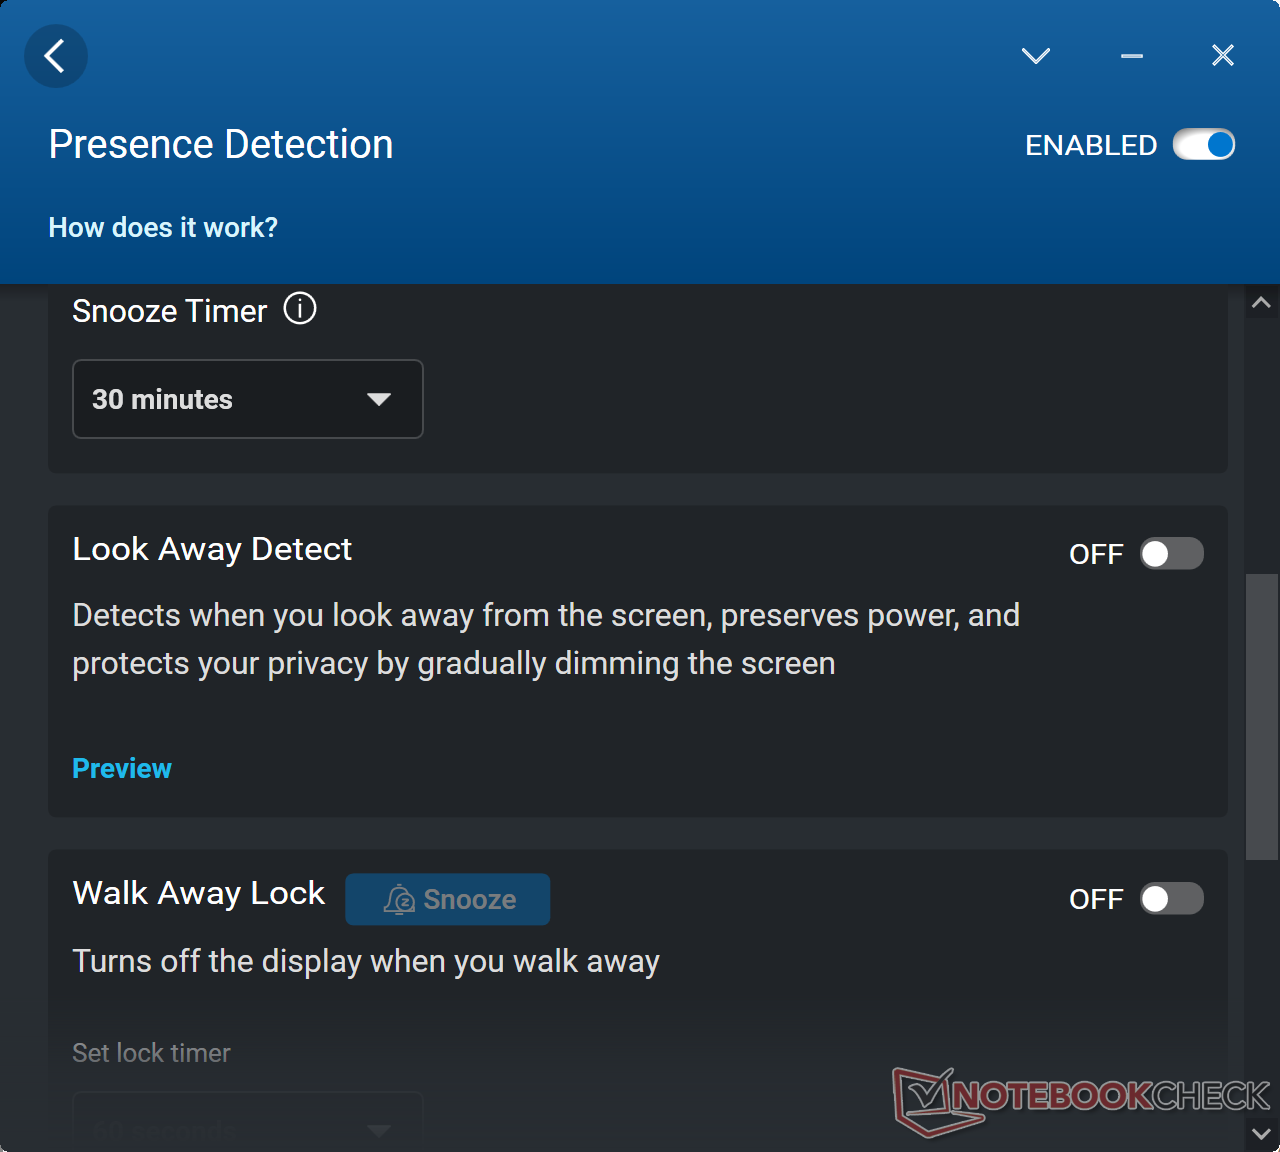
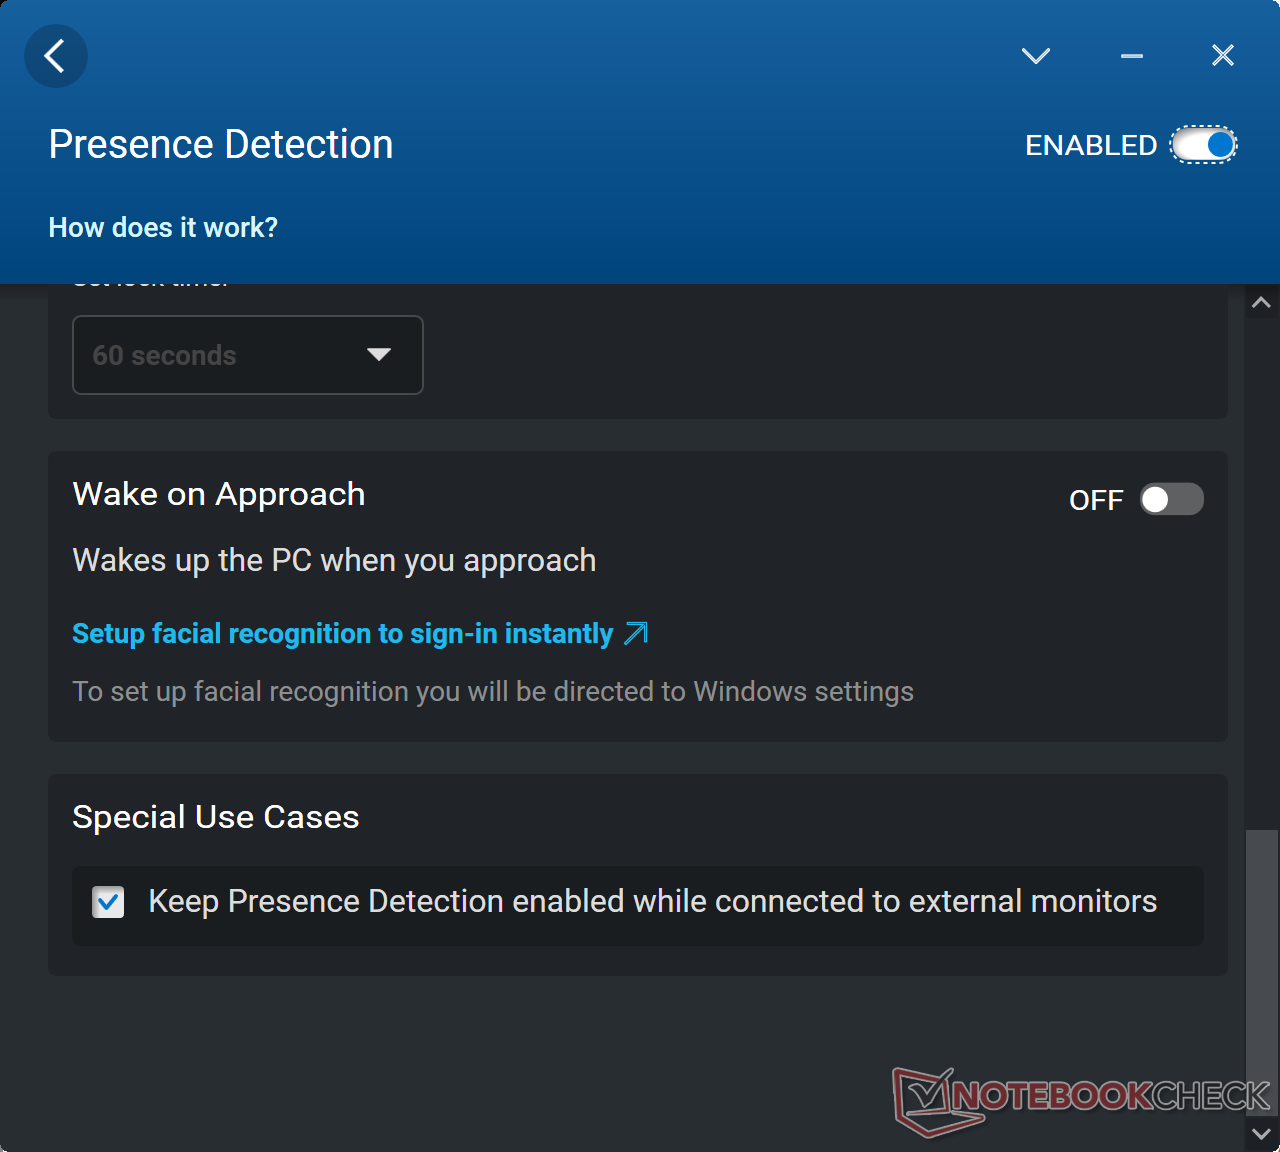
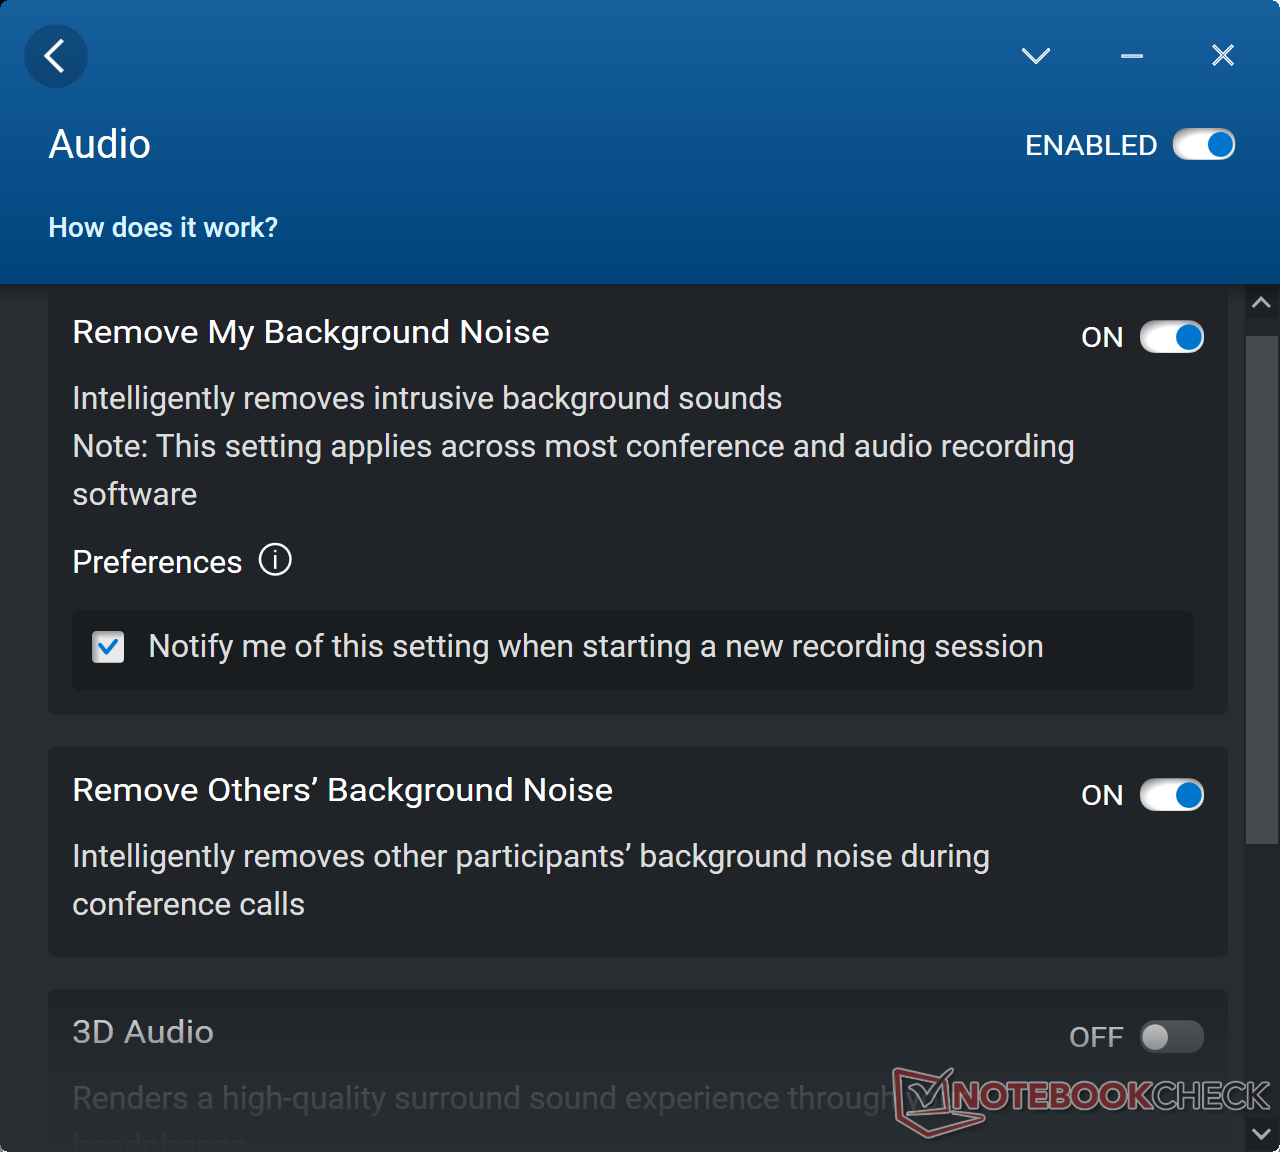
We hebben ons apparaat ingesteld op Ultra Performance modus via de Dell Optimizer software en de GPU op discrete graphics voordat we onderstaande prestatiebenchmarks uitvoerden. Het is sterk aanbevolen dat eigenaren vertrouwd raken met Optimizer, omdat het de hub is voor het regelen van veel specifieke functies van de laptop, waaronder aanwezigheidsdetectie en laadgedrag
We kunnen nergens in de software of het BIOS een MUX schakelaar vinden.
Processor
Multi-thread prestaties zijn slechts ongeveer 8 tot 14 procent sneller dan deCore i7-12850HX in onze slankere Precision 7670. De kleine marge is niet onverwacht, maar het meer verrassende aspect is de ietwat slechte Turbo Boost-duurzaamheid van onzeCore i9-12950HX. Bij het draaien van CineBench R15 xT in een loop, daalden de prestaties met ongeveer 17 procent na verloop van tijd in plaats van constant te blijven. Het prestatietekort is vergelijkbaar met wat we waarnamen op de gewone Precision 7670, ondanks het dikkere profiel van ons Performance-model.
Cinebench R15 Multi Loop
Cinebench R23: Multi Core | Single Core
Cinebench R15: CPU Multi 64Bit | CPU Single 64Bit
Blender: v2.79 BMW27 CPU
7-Zip 18.03: 7z b 4 | 7z b 4 -mmt1
Geekbench 5.5: Multi-Core | Single-Core
HWBOT x265 Benchmark v2.2: 4k Preset
LibreOffice : 20 Documents To PDF
R Benchmark 2.5: Overall mean
| Cinebench R20 / CPU (Multi Core) | |
| Gemiddeld Intel Core i9-12950HX (6625 - 8777, n=7) | |
| MSI CreatorPro Z16P B12UKST | |
| Dell Precision 7000 7670 Performance | |
| HP ZBook Studio 16 G9 62U04EA | |
| Dell Precision 7670 | |
| Lenovo ThinkPad P1 G4-20Y4Z9DVUS | |
| HP ZBook Firefly 16 G9-6B897EA | |
| Cinebench R20 / CPU (Single Core) | |
| Gemiddeld Intel Core i9-12950HX (703 - 741, n=7) | |
| HP ZBook Studio 16 G9 62U04EA | |
| Dell Precision 7000 7670 Performance | |
| Dell Precision 7670 | |
| MSI CreatorPro Z16P B12UKST | |
| Lenovo ThinkPad P1 G4-20Y4Z9DVUS | |
| HP ZBook Firefly 16 G9-6B897EA | |
| Cinebench R23 / Multi Core | |
| Gemiddeld Intel Core i9-12950HX (16277 - 23113, n=7) | |
| MSI CreatorPro Z16P B12UKST | |
| HP ZBook Studio 16 G9 62U04EA | |
| Dell Precision 7000 7670 Performance | |
| Dell Precision 7670 | |
| Lenovo ThinkPad P1 G4-20Y4Z9DVUS | |
| HP ZBook Firefly 16 G9-6B897EA | |
| Cinebench R23 / Single Core | |
| HP ZBook Studio 16 G9 62U04EA | |
| Gemiddeld Intel Core i9-12950HX (1465 - 1922, n=7) | |
| MSI CreatorPro Z16P B12UKST | |
| Dell Precision 7670 | |
| Lenovo ThinkPad P1 G4-20Y4Z9DVUS | |
| Dell Precision 7000 7670 Performance | |
| HP ZBook Firefly 16 G9-6B897EA | |
| Cinebench R15 / CPU Multi 64Bit | |
| Gemiddeld Intel Core i9-12950HX (2464 - 3530, n=7) | |
| Dell Precision 7000 7670 Performance | |
| HP ZBook Studio 16 G9 62U04EA | |
| Dell Precision 7670 | |
| MSI CreatorPro Z16P B12UKST | |
| Lenovo ThinkPad P1 G4-20Y4Z9DVUS | |
| HP ZBook Firefly 16 G9-6B897EA | |
| Cinebench R15 / CPU Single 64Bit | |
| HP ZBook Studio 16 G9 62U04EA | |
| Dell Precision 7000 7670 Performance | |
| Gemiddeld Intel Core i9-12950HX (167 - 276, n=7) | |
| Dell Precision 7670 | |
| MSI CreatorPro Z16P B12UKST | |
| Lenovo ThinkPad P1 G4-20Y4Z9DVUS | |
| HP ZBook Firefly 16 G9-6B897EA | |
| Blender / v2.79 BMW27 CPU | |
| HP ZBook Firefly 16 G9-6B897EA | |
| Lenovo ThinkPad P1 G4-20Y4Z9DVUS | |
| Dell Precision 7670 | |
| MSI CreatorPro Z16P B12UKST | |
| Dell Precision 7000 7670 Performance | |
| HP ZBook Studio 16 G9 62U04EA | |
| Gemiddeld Intel Core i9-12950HX (138 - 193, n=7) | |
| 7-Zip 18.03 / 7z b 4 | |
| Gemiddeld Intel Core i9-12950HX (65637 - 85019, n=7) | |
| HP ZBook Studio 16 G9 62U04EA | |
| MSI CreatorPro Z16P B12UKST | |
| Dell Precision 7000 7670 Performance | |
| Dell Precision 7670 | |
| Lenovo ThinkPad P1 G4-20Y4Z9DVUS | |
| HP ZBook Firefly 16 G9-6B897EA | |
| 7-Zip 18.03 / 7z b 4 -mmt1 | |
| Gemiddeld Intel Core i9-12950HX (6022 - 6318, n=7) | |
| Dell Precision 7000 7670 Performance | |
| HP ZBook Studio 16 G9 62U04EA | |
| MSI CreatorPro Z16P B12UKST | |
| Dell Precision 7670 | |
| Lenovo ThinkPad P1 G4-20Y4Z9DVUS | |
| HP ZBook Firefly 16 G9-6B897EA | |
| Geekbench 5.5 / Multi-Core | |
| Gemiddeld Intel Core i9-12950HX (14028 - 16009, n=7) | |
| Dell Precision 7000 7670 Performance | |
| HP ZBook Studio 16 G9 62U04EA | |
| MSI CreatorPro Z16P B12UKST | |
| Dell Precision 7670 | |
| Lenovo ThinkPad P1 G4-20Y4Z9DVUS | |
| HP ZBook Firefly 16 G9-6B897EA | |
| Geekbench 5.5 / Single-Core | |
| Dell Precision 7000 7670 Performance | |
| Gemiddeld Intel Core i9-12950HX (1847 - 1945, n=7) | |
| HP ZBook Studio 16 G9 62U04EA | |
| HP ZBook Firefly 16 G9-6B897EA | |
| MSI CreatorPro Z16P B12UKST | |
| Dell Precision 7670 | |
| Lenovo ThinkPad P1 G4-20Y4Z9DVUS | |
| HWBOT x265 Benchmark v2.2 / 4k Preset | |
| Gemiddeld Intel Core i9-12950HX (18.6 - 26.5, n=7) | |
| HP ZBook Studio 16 G9 62U04EA | |
| MSI CreatorPro Z16P B12UKST | |
| Dell Precision 7000 7670 Performance | |
| Dell Precision 7670 | |
| Lenovo ThinkPad P1 G4-20Y4Z9DVUS | |
| HP ZBook Firefly 16 G9-6B897EA | |
| LibreOffice / 20 Documents To PDF | |
| HP ZBook Firefly 16 G9-6B897EA | |
| Lenovo ThinkPad P1 G4-20Y4Z9DVUS | |
| Dell Precision 7670 | |
| Dell Precision 7000 7670 Performance | |
| HP ZBook Studio 16 G9 62U04EA | |
| Gemiddeld Intel Core i9-12950HX (34.7 - 45.4, n=7) | |
| MSI CreatorPro Z16P B12UKST | |
| R Benchmark 2.5 / Overall mean | |
| Lenovo ThinkPad P1 G4-20Y4Z9DVUS | |
| HP ZBook Firefly 16 G9-6B897EA | |
| Dell Precision 7670 | |
| MSI CreatorPro Z16P B12UKST | |
| Dell Precision 7000 7670 Performance | |
| HP ZBook Studio 16 G9 62U04EA | |
| Gemiddeld Intel Core i9-12950HX (0.4251 - 0.4515, n=7) | |
* ... kleiner is beter
AIDA64: FP32 Ray-Trace | FPU Julia | CPU SHA3 | CPU Queen | FPU SinJulia | FPU Mandel | CPU AES | CPU ZLib | FP64 Ray-Trace | CPU PhotoWorxx
| Performance rating | |
| Gemiddeld Intel Core i9-12950HX | |
| MSI CreatorPro Z16P B12UKST | |
| HP ZBook Studio 16 G9 62U04EA | |
| Dell Precision 7000 7670 Performance | |
| Lenovo ThinkPad P1 G4-20Y4Z9DVUS | |
| Dell Precision 7670 | |
| HP ZBook Firefly 16 G9-6B897EA | |
| AIDA64 / FP32 Ray-Trace | |
| Gemiddeld Intel Core i9-12950HX (15499 - 22868, n=7) | |
| Dell Precision 7000 7670 Performance | |
| Lenovo ThinkPad P1 G4-20Y4Z9DVUS | |
| HP ZBook Studio 16 G9 62U04EA | |
| MSI CreatorPro Z16P B12UKST | |
| Dell Precision 7670 | |
| HP ZBook Firefly 16 G9-6B897EA | |
| AIDA64 / FPU Julia | |
| Gemiddeld Intel Core i9-12950HX (77846 - 115907, n=7) | |
| HP ZBook Studio 16 G9 62U04EA | |
| Dell Precision 7000 7670 Performance | |
| MSI CreatorPro Z16P B12UKST | |
| Dell Precision 7670 | |
| Lenovo ThinkPad P1 G4-20Y4Z9DVUS | |
| HP ZBook Firefly 16 G9-6B897EA | |
| AIDA64 / CPU SHA3 | |
| Lenovo ThinkPad P1 G4-20Y4Z9DVUS | |
| Gemiddeld Intel Core i9-12950HX (3426 - 5069, n=7) | |
| HP ZBook Studio 16 G9 62U04EA | |
| MSI CreatorPro Z16P B12UKST | |
| Dell Precision 7000 7670 Performance | |
| Dell Precision 7670 | |
| HP ZBook Firefly 16 G9-6B897EA | |
| AIDA64 / CPU Queen | |
| HP ZBook Studio 16 G9 62U04EA | |
| Gemiddeld Intel Core i9-12950HX (102752 - 104726, n=7) | |
| Dell Precision 7000 7670 Performance | |
| MSI CreatorPro Z16P B12UKST | |
| Lenovo ThinkPad P1 G4-20Y4Z9DVUS | |
| HP ZBook Firefly 16 G9-6B897EA | |
| Dell Precision 7670 | |
| AIDA64 / FPU SinJulia | |
| Gemiddeld Intel Core i9-12950HX (10134 - 12823, n=7) | |
| Dell Precision 7000 7670 Performance | |
| Dell Precision 7670 | |
| Lenovo ThinkPad P1 G4-20Y4Z9DVUS | |
| HP ZBook Studio 16 G9 62U04EA | |
| MSI CreatorPro Z16P B12UKST | |
| HP ZBook Firefly 16 G9-6B897EA | |
| AIDA64 / FPU Mandel | |
| Gemiddeld Intel Core i9-12950HX (37146 - 57340, n=7) | |
| HP ZBook Studio 16 G9 62U04EA | |
| Lenovo ThinkPad P1 G4-20Y4Z9DVUS | |
| Dell Precision 7000 7670 Performance | |
| MSI CreatorPro Z16P B12UKST | |
| Dell Precision 7670 | |
| HP ZBook Firefly 16 G9-6B897EA | |
| AIDA64 / CPU AES | |
| MSI CreatorPro Z16P B12UKST | |
| Gemiddeld Intel Core i9-12950HX (72599 - 181128, n=7) | |
| Lenovo ThinkPad P1 G4-20Y4Z9DVUS | |
| HP ZBook Studio 16 G9 62U04EA | |
| Dell Precision 7000 7670 Performance | |
| Dell Precision 7670 | |
| HP ZBook Firefly 16 G9-6B897EA | |
| AIDA64 / CPU ZLib | |
| Gemiddeld Intel Core i9-12950HX (996 - 1417, n=7) | |
| HP ZBook Studio 16 G9 62U04EA | |
| MSI CreatorPro Z16P B12UKST | |
| Dell Precision 7000 7670 Performance | |
| Dell Precision 7670 | |
| Lenovo ThinkPad P1 G4-20Y4Z9DVUS | |
| HP ZBook Firefly 16 G9-6B897EA | |
| AIDA64 / FP64 Ray-Trace | |
| Gemiddeld Intel Core i9-12950HX (8455 - 12432, n=7) | |
| HP ZBook Studio 16 G9 62U04EA | |
| Dell Precision 7000 7670 Performance | |
| Lenovo ThinkPad P1 G4-20Y4Z9DVUS | |
| MSI CreatorPro Z16P B12UKST | |
| Dell Precision 7670 | |
| HP ZBook Firefly 16 G9-6B897EA | |
| AIDA64 / CPU PhotoWorxx | |
| MSI CreatorPro Z16P B12UKST | |
| Dell Precision 7000 7670 Performance | |
| Dell Precision 7670 | |
| Gemiddeld Intel Core i9-12950HX (35479 - 42655, n=7) | |
| HP ZBook Studio 16 G9 62U04EA | |
| HP ZBook Firefly 16 G9-6B897EA | |
| Lenovo ThinkPad P1 G4-20Y4Z9DVUS | |
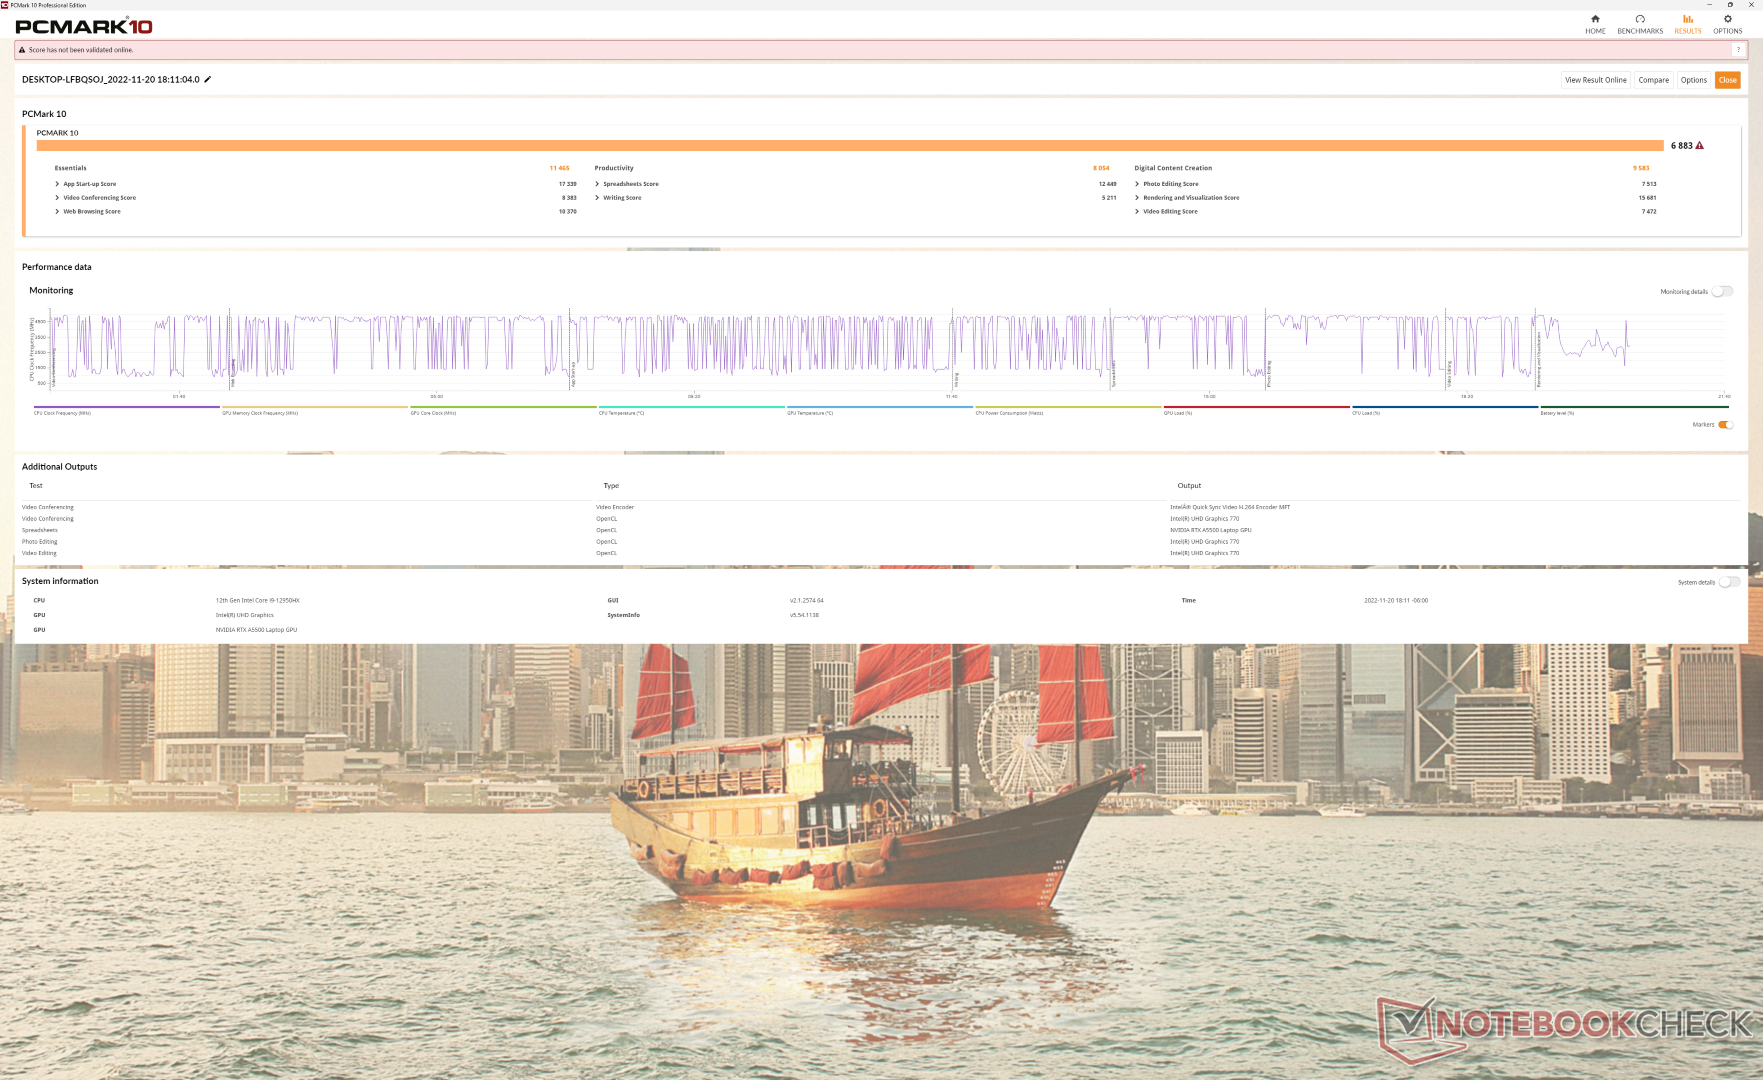
Systeemprestaties
PCMark-resultaten zijn vergelijkbaar met mobiele werkstations uit het hogere segment die momenteel verkrijgbaar zijn, waaronder deHP ZBook Fury 15 G8.
CrossMark: Overall | Productivity | Creativity | Responsiveness
| PCMark 10 / Score | |
| MSI CreatorPro Z16P B12UKST | |
| MSI WE76 11UM-456 | |
| Gemiddeld Intel Core i9-12950HX, NVIDIA RTX A5500 Laptop GPU (6883 - 7236, n=3) | |
| Dell Precision 7000 7670 Performance | |
| Dell Precision 7670 | |
| HP ZBook Studio 16 G9 62U04EA | |
| Lenovo ThinkPad P1 G4-20Y4Z9DVUS | |
| HP ZBook Firefly 16 G9-6B897EA | |
| PCMark 10 / Essentials | |
| Dell Precision 7000 7670 Performance | |
| Gemiddeld Intel Core i9-12950HX, NVIDIA RTX A5500 Laptop GPU (10898 - 11465, n=3) | |
| MSI CreatorPro Z16P B12UKST | |
| Dell Precision 7670 | |
| HP ZBook Firefly 16 G9-6B897EA | |
| Lenovo ThinkPad P1 G4-20Y4Z9DVUS | |
| MSI WE76 11UM-456 | |
| HP ZBook Studio 16 G9 62U04EA | |
| PCMark 10 / Productivity | |
| MSI WE76 11UM-456 | |
| MSI CreatorPro Z16P B12UKST | |
| Dell Precision 7670 | |
| Gemiddeld Intel Core i9-12950HX, NVIDIA RTX A5500 Laptop GPU (8054 - 9489, n=3) | |
| HP ZBook Firefly 16 G9-6B897EA | |
| Lenovo ThinkPad P1 G4-20Y4Z9DVUS | |
| Dell Precision 7000 7670 Performance | |
| HP ZBook Studio 16 G9 62U04EA | |
| PCMark 10 / Digital Content Creation | |
| MSI WE76 11UM-456 | |
| MSI CreatorPro Z16P B12UKST | |
| Dell Precision 7000 7670 Performance | |
| Gemiddeld Intel Core i9-12950HX, NVIDIA RTX A5500 Laptop GPU (9155 - 9944, n=3) | |
| HP ZBook Studio 16 G9 62U04EA | |
| Dell Precision 7670 | |
| Lenovo ThinkPad P1 G4-20Y4Z9DVUS | |
| HP ZBook Firefly 16 G9-6B897EA | |
| CrossMark / Overall | |
| MSI CreatorPro Z16P B12UKST | |
| Gemiddeld Intel Core i9-12950HX, NVIDIA RTX A5500 Laptop GPU (1801 - 1889, n=3) | |
| HP ZBook Studio 16 G9 62U04EA | |
| Dell Precision 7000 7670 Performance | |
| MSI WE76 11UM-456 | |
| HP ZBook Firefly 16 G9-6B897EA | |
| Lenovo ThinkPad P1 G4-20Y4Z9DVUS | |
| Dell Precision 7670 | |
| CrossMark / Productivity | |
| MSI CreatorPro Z16P B12UKST | |
| Gemiddeld Intel Core i9-12950HX, NVIDIA RTX A5500 Laptop GPU (1684 - 1785, n=3) | |
| HP ZBook Studio 16 G9 62U04EA | |
| Dell Precision 7000 7670 Performance | |
| MSI WE76 11UM-456 | |
| HP ZBook Firefly 16 G9-6B897EA | |
| Lenovo ThinkPad P1 G4-20Y4Z9DVUS | |
| Dell Precision 7670 | |
| CrossMark / Creativity | |
| Gemiddeld Intel Core i9-12950HX, NVIDIA RTX A5500 Laptop GPU (2042 - 2192, n=3) | |
| HP ZBook Studio 16 G9 62U04EA | |
| MSI CreatorPro Z16P B12UKST | |
| Dell Precision 7000 7670 Performance | |
| MSI WE76 11UM-456 | |
| HP ZBook Firefly 16 G9-6B897EA | |
| Dell Precision 7670 | |
| Lenovo ThinkPad P1 G4-20Y4Z9DVUS | |
| CrossMark / Responsiveness | |
| MSI CreatorPro Z16P B12UKST | |
| HP ZBook Studio 16 G9 62U04EA | |
| Gemiddeld Intel Core i9-12950HX, NVIDIA RTX A5500 Laptop GPU (1501 - 1585, n=3) | |
| Dell Precision 7000 7670 Performance | |
| MSI WE76 11UM-456 | |
| HP ZBook Firefly 16 G9-6B897EA | |
| Lenovo ThinkPad P1 G4-20Y4Z9DVUS | |
| Dell Precision 7670 | |
| PCMark 10 Score | 6883 punten | |
Help | ||
| AIDA64 / Memory Copy | |
| Dell Precision 7000 7670 Performance | |
| Gemiddeld Intel Core i9-12950HX (59731 - 64732, n=7) | |
| Dell Precision 7670 | |
| MSI CreatorPro Z16P B12UKST | |
| HP ZBook Studio 16 G9 62U04EA | |
| HP ZBook Firefly 16 G9-6B897EA | |
| Lenovo ThinkPad P1 G4-20Y4Z9DVUS | |
| AIDA64 / Memory Read | |
| Dell Precision 7670 | |
| Dell Precision 7000 7670 Performance | |
| Gemiddeld Intel Core i9-12950HX (59744 - 70359, n=7) | |
| MSI CreatorPro Z16P B12UKST | |
| HP ZBook Studio 16 G9 62U04EA | |
| HP ZBook Firefly 16 G9-6B897EA | |
| Lenovo ThinkPad P1 G4-20Y4Z9DVUS | |
| AIDA64 / Memory Write | |
| MSI CreatorPro Z16P B12UKST | |
| Dell Precision 7000 7670 Performance | |
| HP ZBook Studio 16 G9 62U04EA | |
| Dell Precision 7670 | |
| Gemiddeld Intel Core i9-12950HX (57750 - 67899, n=7) | |
| HP ZBook Firefly 16 G9-6B897EA | |
| Lenovo ThinkPad P1 G4-20Y4Z9DVUS | |
| AIDA64 / Memory Latency | |
| MSI CreatorPro Z16P B12UKST | |
| HP ZBook Firefly 16 G9-6B897EA | |
| HP ZBook Studio 16 G9 62U04EA | |
| Dell Precision 7670 | |
| Gemiddeld Intel Core i9-12950HX (84.5 - 92.2, n=7) | |
| Dell Precision 7000 7670 Performance | |
| Lenovo ThinkPad P1 G4-20Y4Z9DVUS | |
* ... kleiner is beter
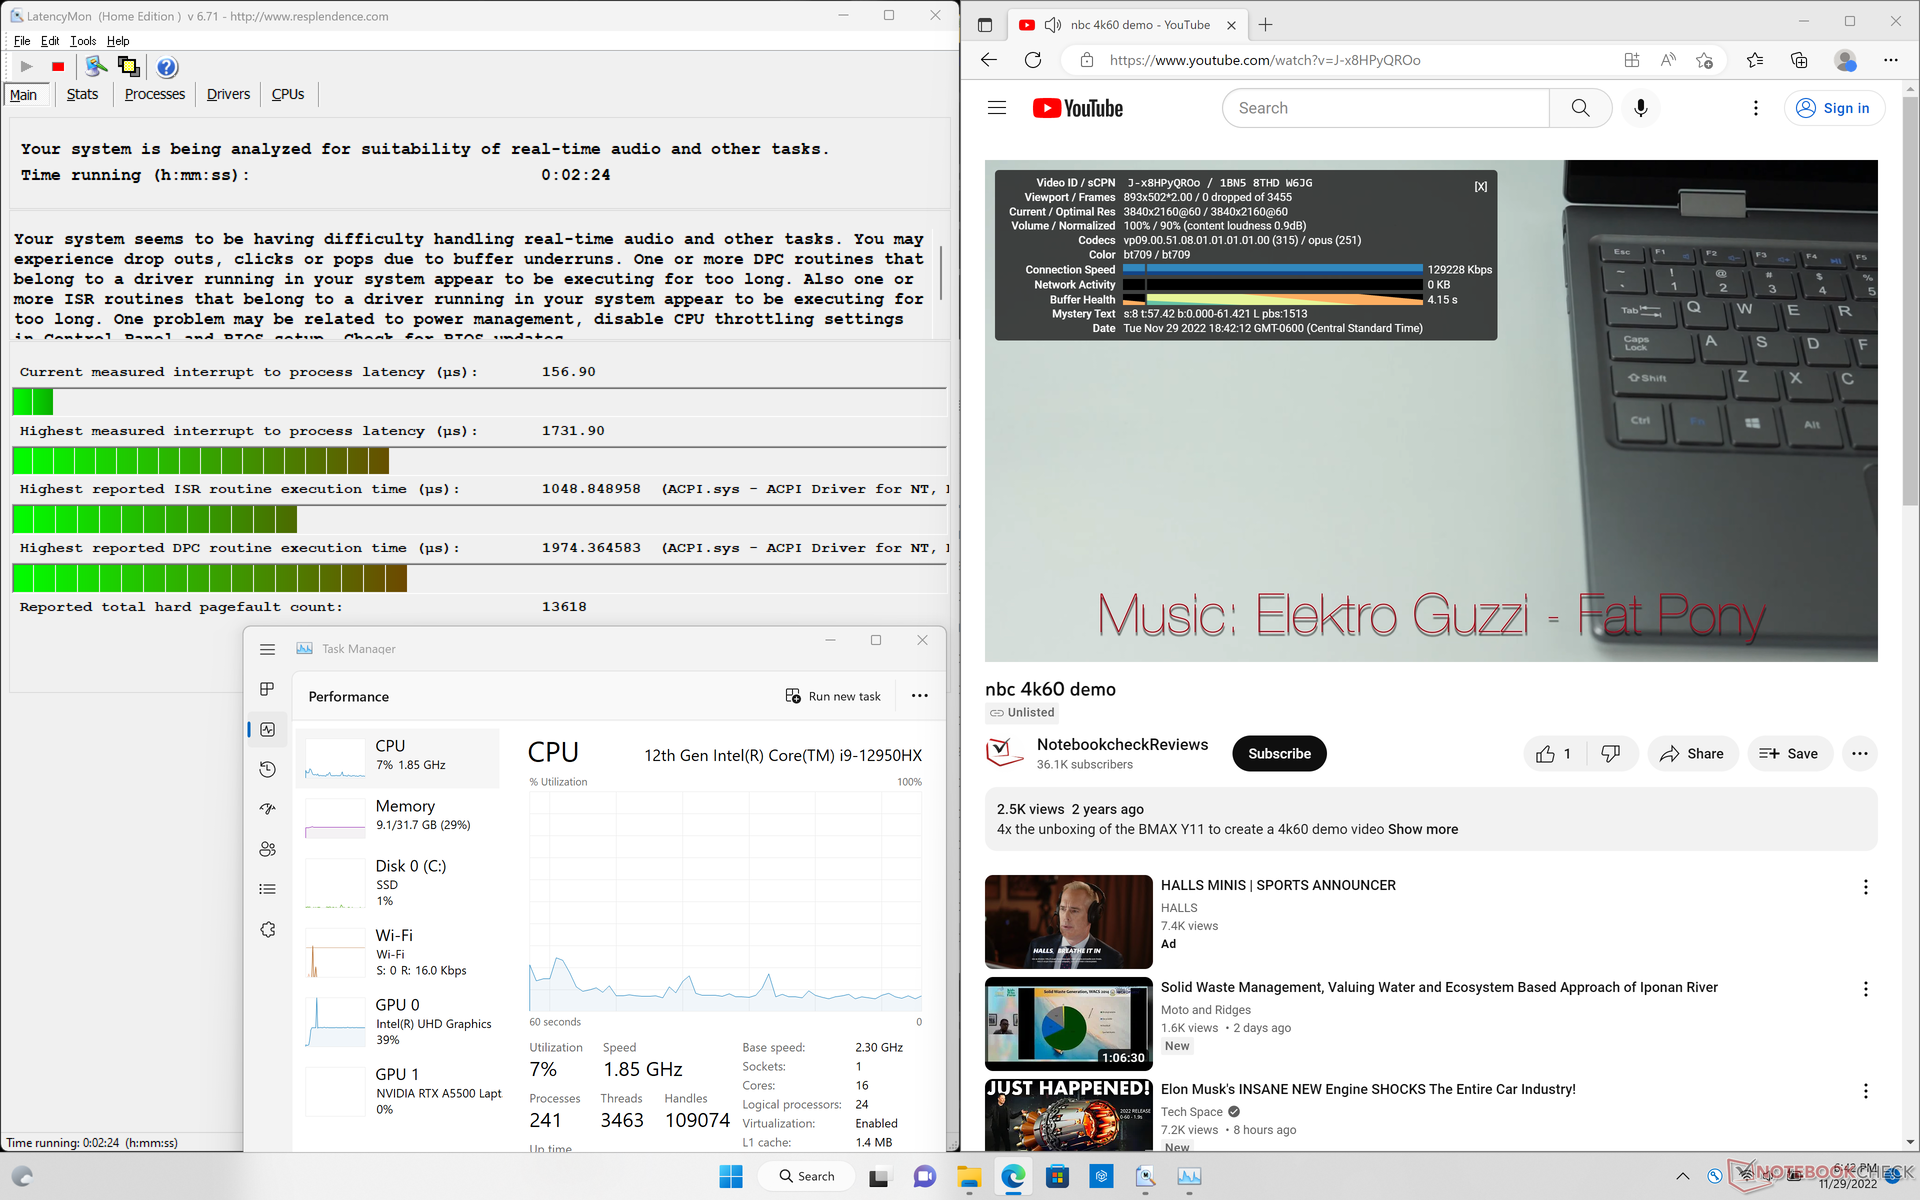
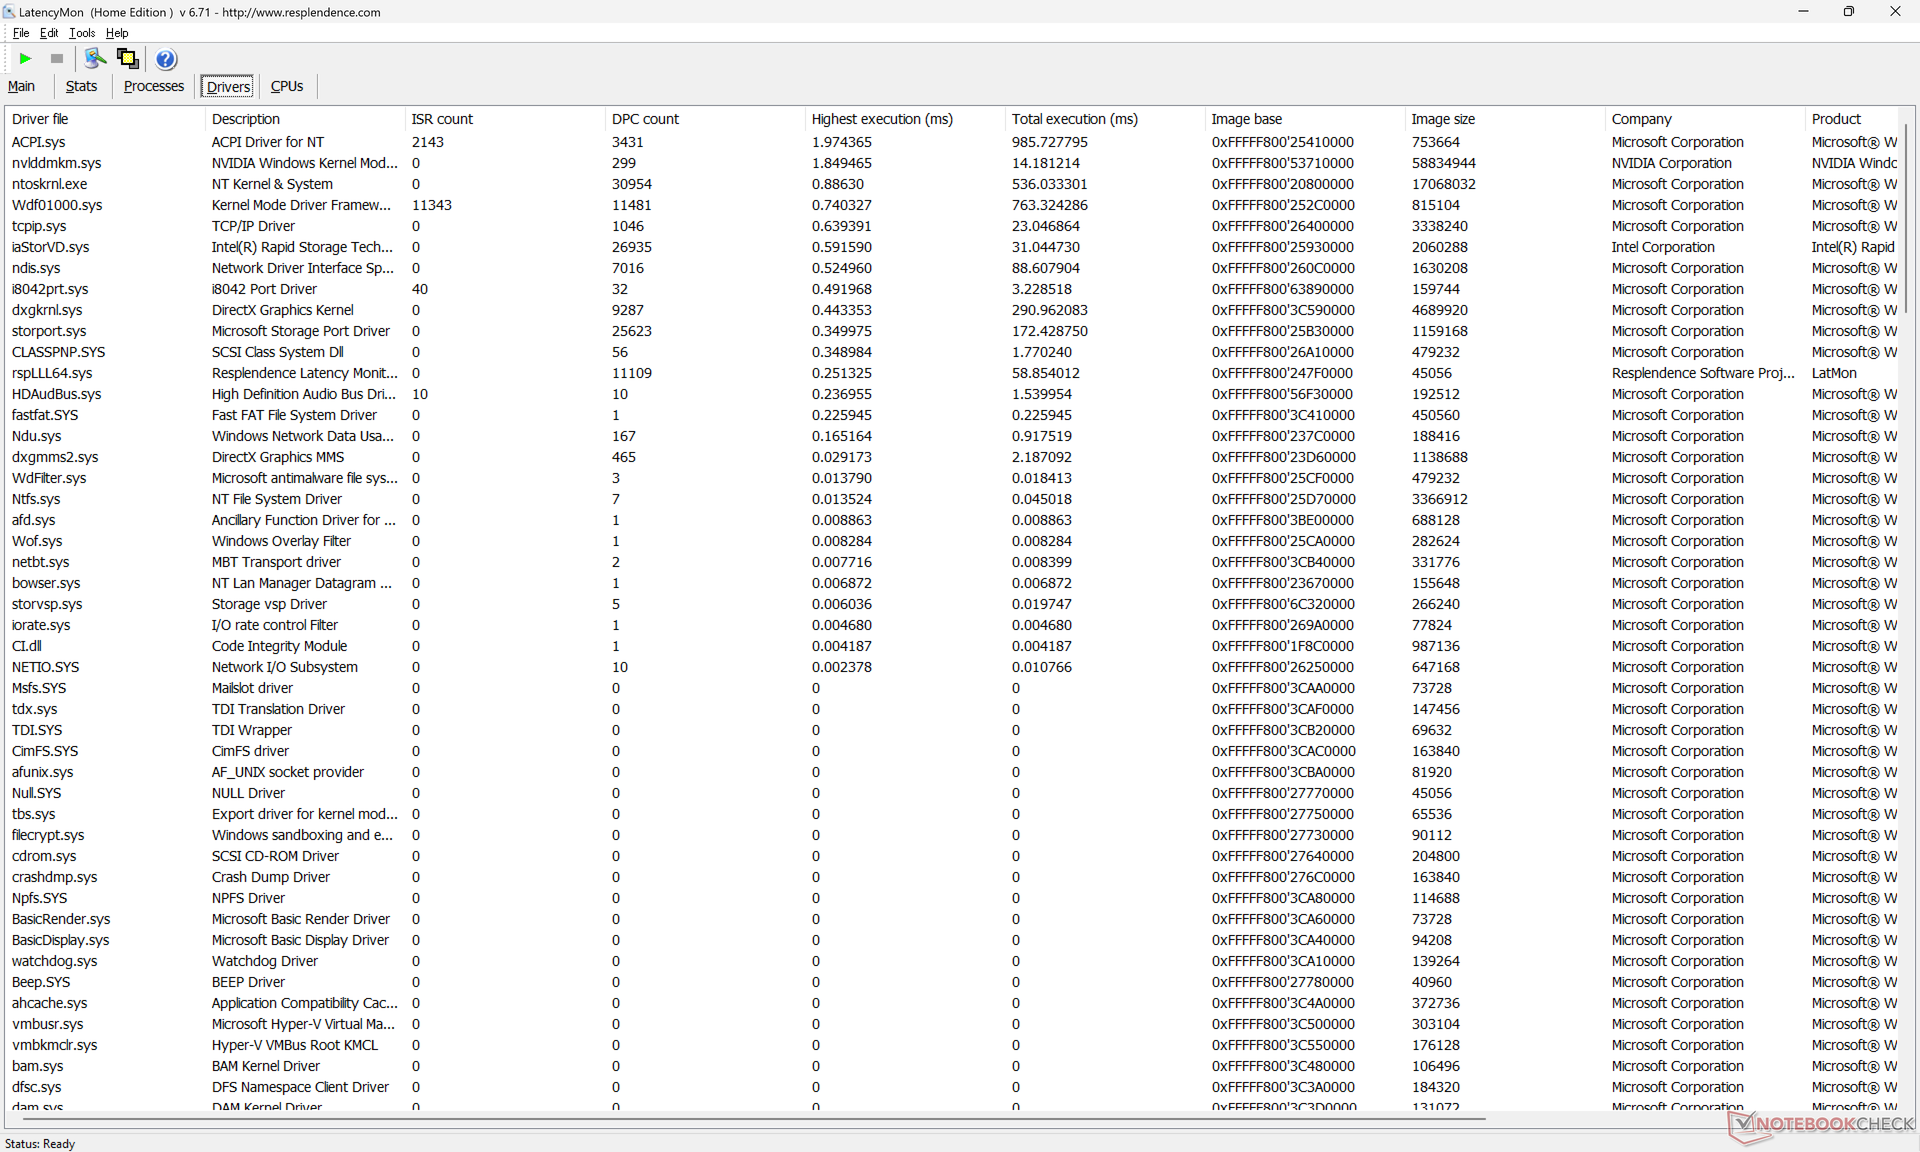
DPC latentie
LatencyMon onthult DPC-problemen bij het openen van meerdere browsertabbladen op onze homepage, zelfs na verschillende hertests. het afspelen van 4K-video's met 60 FPS verloopt verder soepel en zonder dropped frames.
| DPC Latencies / LatencyMon - interrupt to process latency (max), Web, Youtube, Prime95 | |
| Dell Precision 7000 7670 Performance | |
| Lenovo ThinkPad P1 G4-20Y4Z9DVUS | |
| Dell Precision 7670 | |
| HP ZBook Studio 16 G9 62U04EA | |
| HP ZBook Firefly 16 G9-6B897EA | |
| MSI CreatorPro Z16P B12UKST | |
* ... kleiner is beter
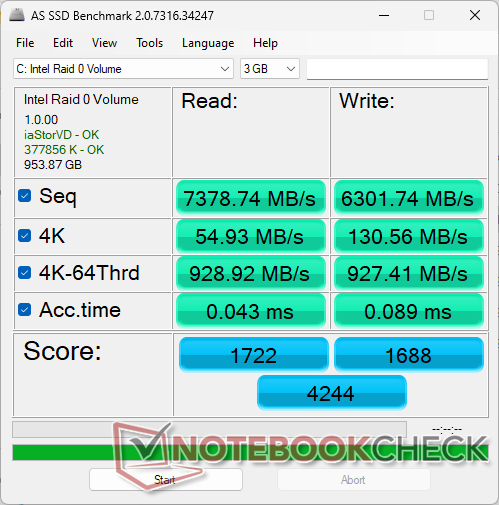
Opslagapparaten
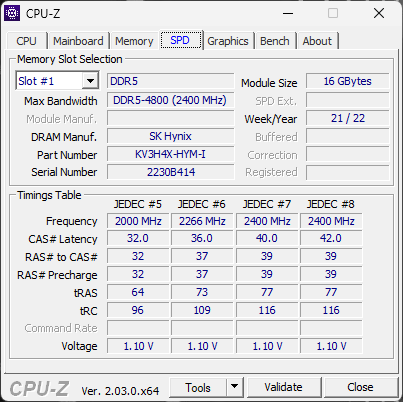
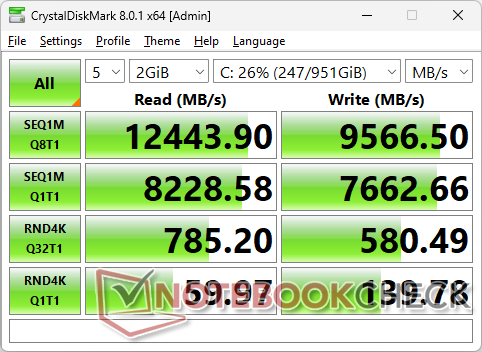
Gebruikers kunnen tot drie PCIe4 x4 NVMe M.2 2280 SSD's installeren in plaats van slechts twee op het slankere gewone model. De twee SK Hynix PC801 drives in onze unit zijn geïnstalleerd in RAID 0 configuratie voor waanzinnig hoge real-world sequentiële lees- en schrijfsnelheden van respectievelijk ongeveer 13000 MB/s en 10000 MB/s. Elk SSD slot heeft zijn eigen warmte verspreider en thermische pad voor warmte afvoer.

| Drive Performance rating - Percent | |
| MSI CreatorPro Z16P B12UKST -8! | |
| Dell Precision 7670 | |
| Dell Precision 7000 7670 Performance | |
| HP ZBook Studio 16 G9 62U04EA | |
| Lenovo ThinkPad P1 G4-20Y4Z9DVUS | |
| HP ZBook Firefly 16 G9-6B897EA | |
| Global Average -3 | |
* ... kleiner is beter
Disk Throttling: DiskSpd Read Loop, Queue Depth 8
GPU-prestaties
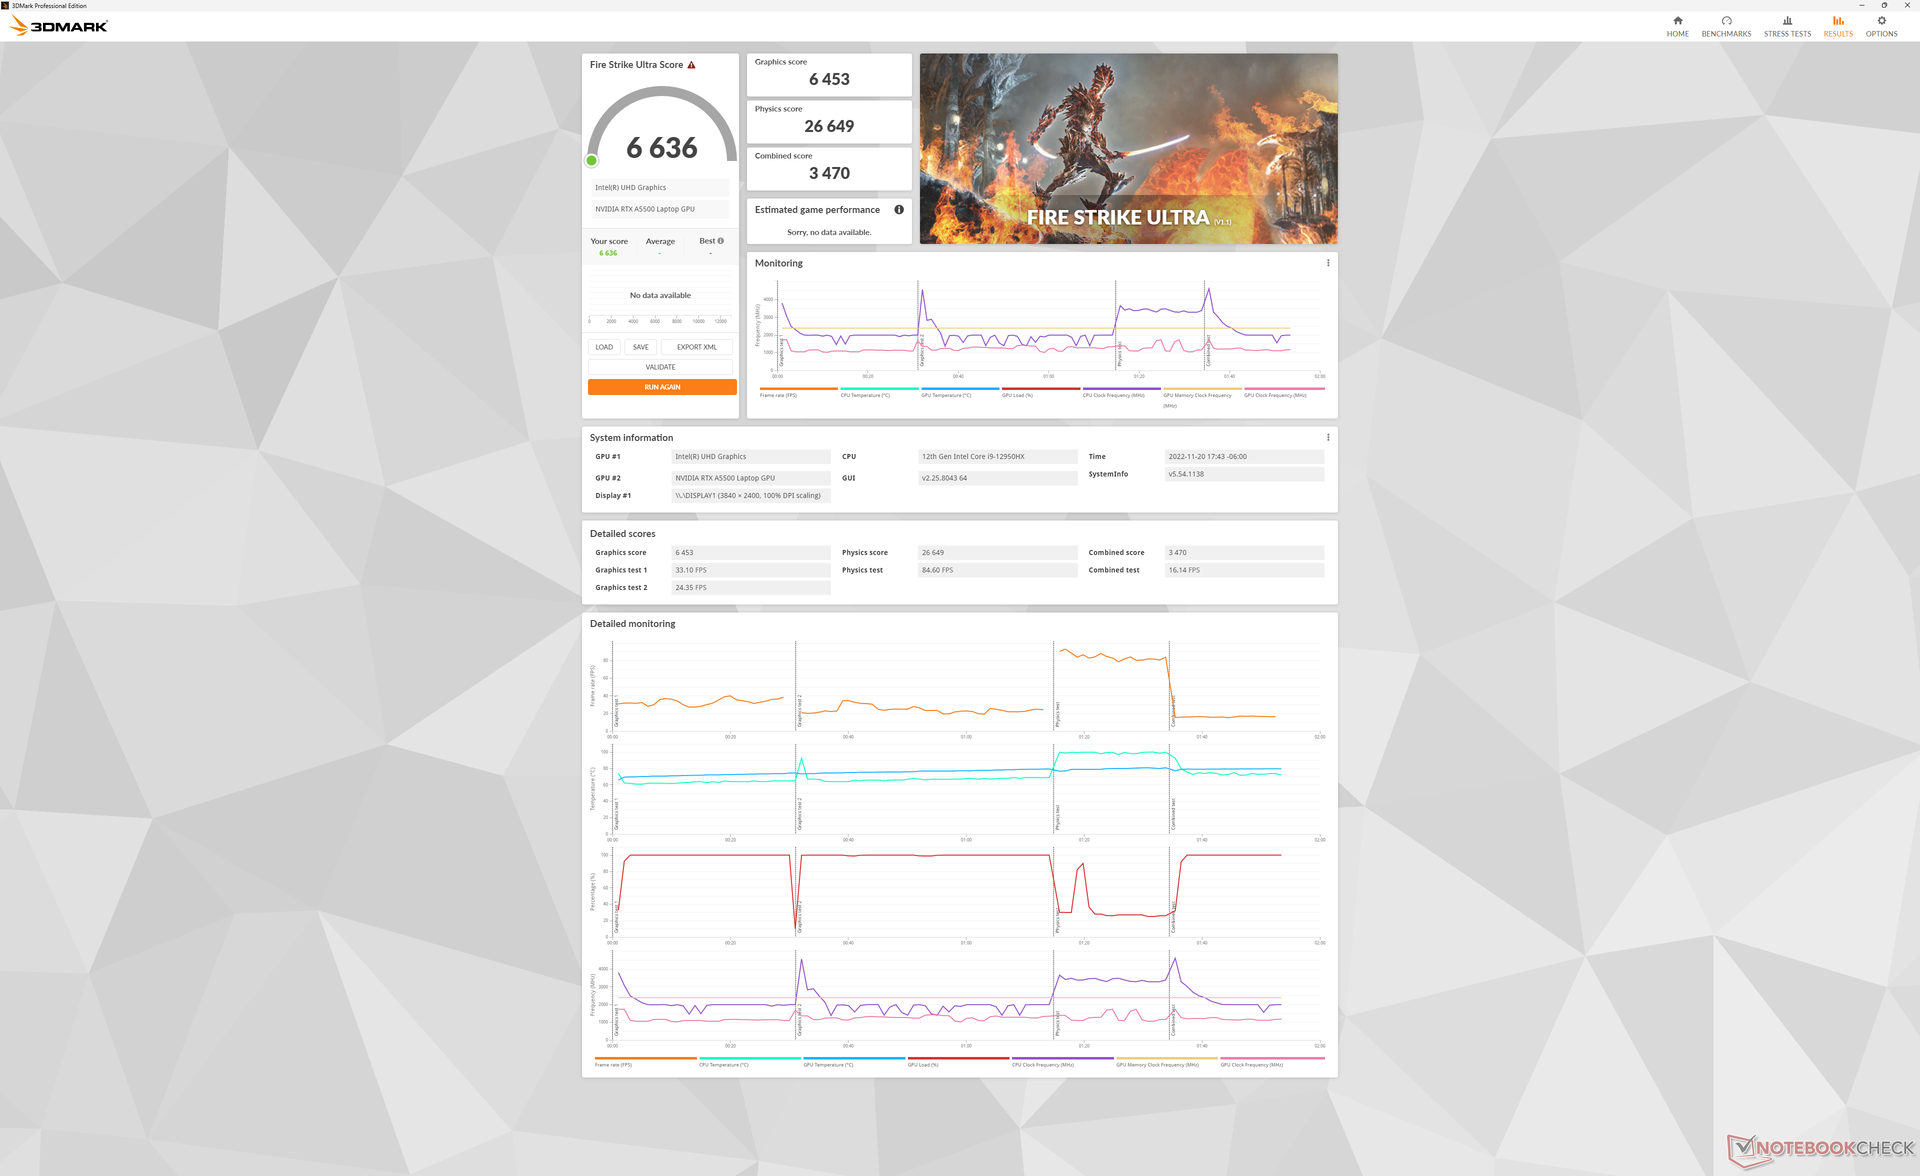
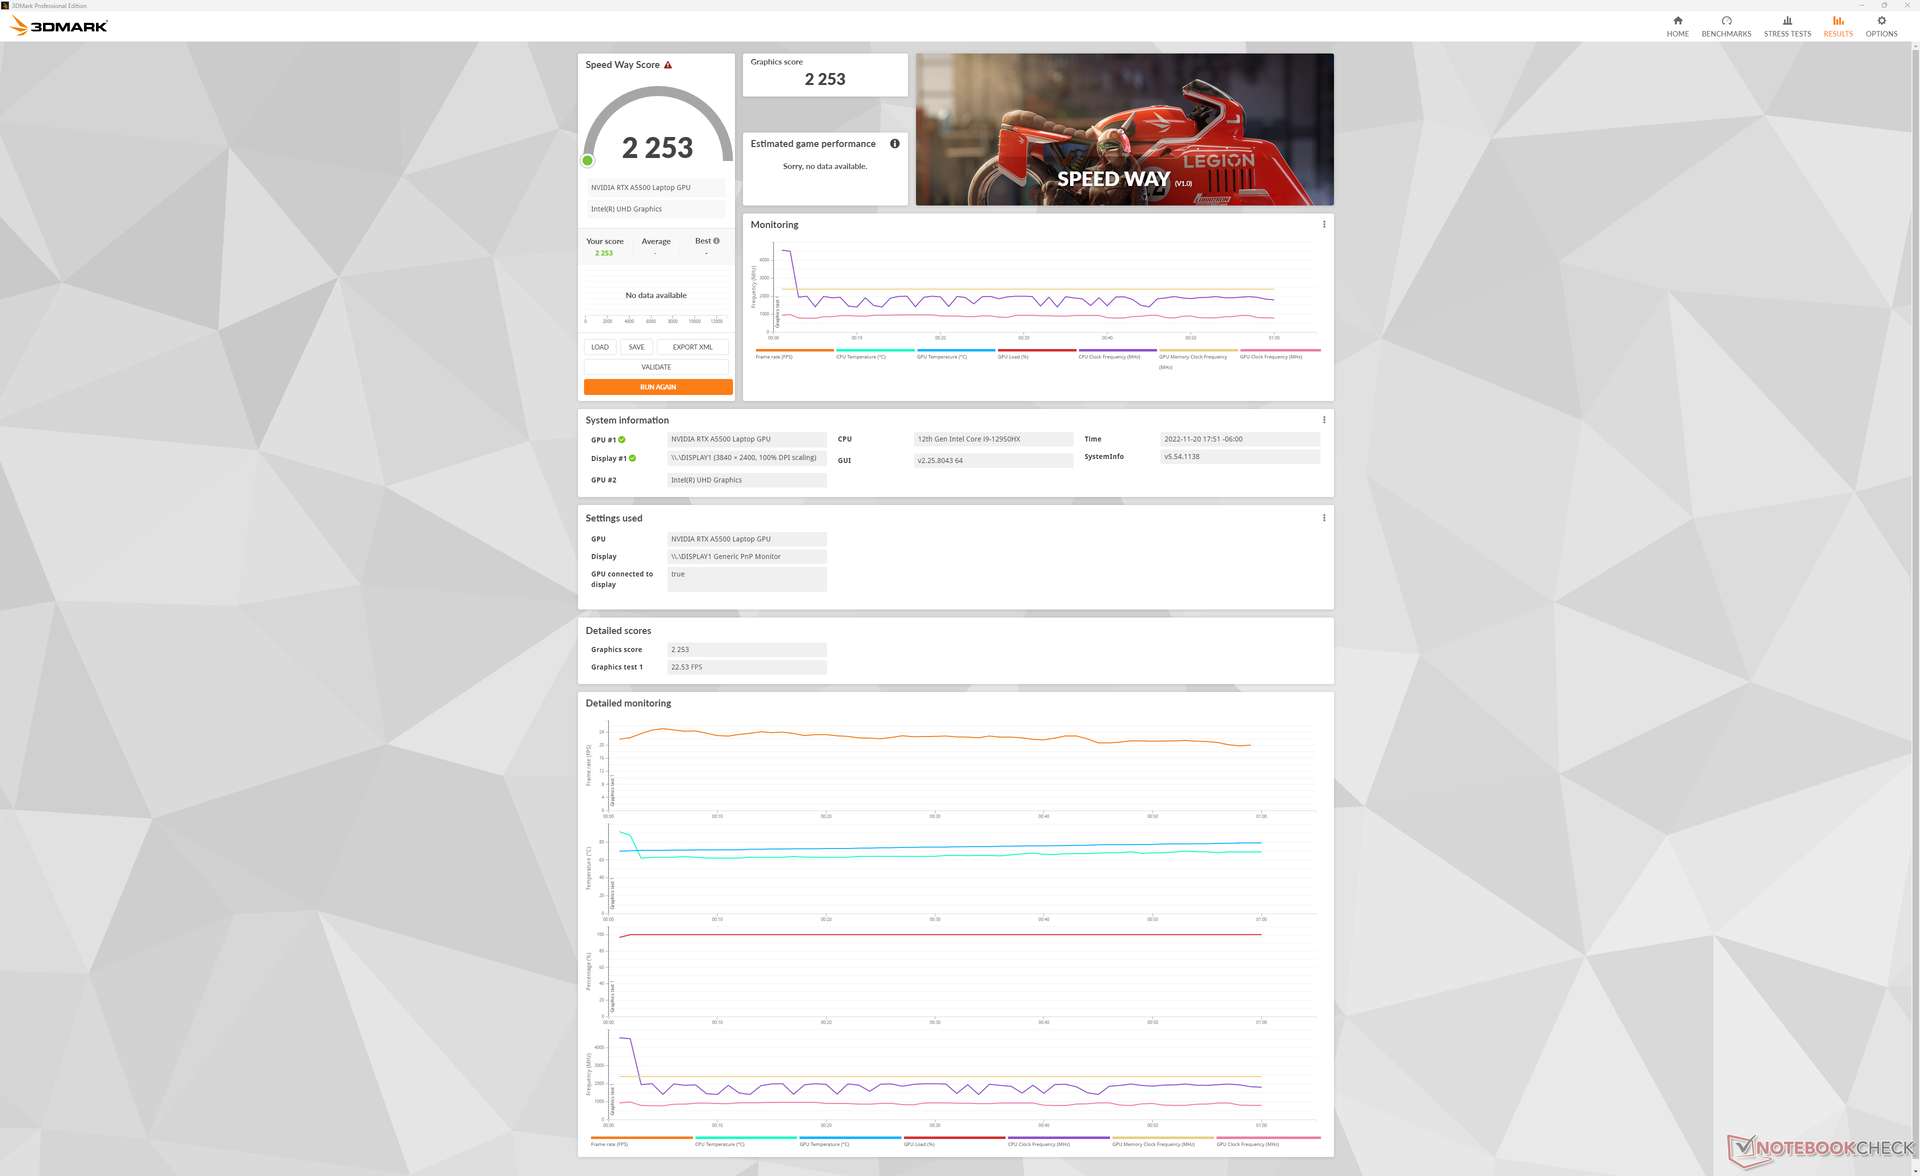
De RTX A5500 is ruwweg 60 tot 80 procent sneller dan de RTX A2000 in de slankere Precision 7670 om een van de snelste mobiele werkstations te zijn die momenteel op de markt zijn. Het is niet veel beter dan de twee jaar oude Quadro RTX 5000 in de Acer ConceptD 9 Pro of Asus ProArt StudioBook Pro X, echter, zelfs in termen van ray-tracing prestaties. De RTX A5000 in de grotere 17,3-inch MSI WE76 presteert beter dan onze RTX A5500 in de meeste benchmarks.
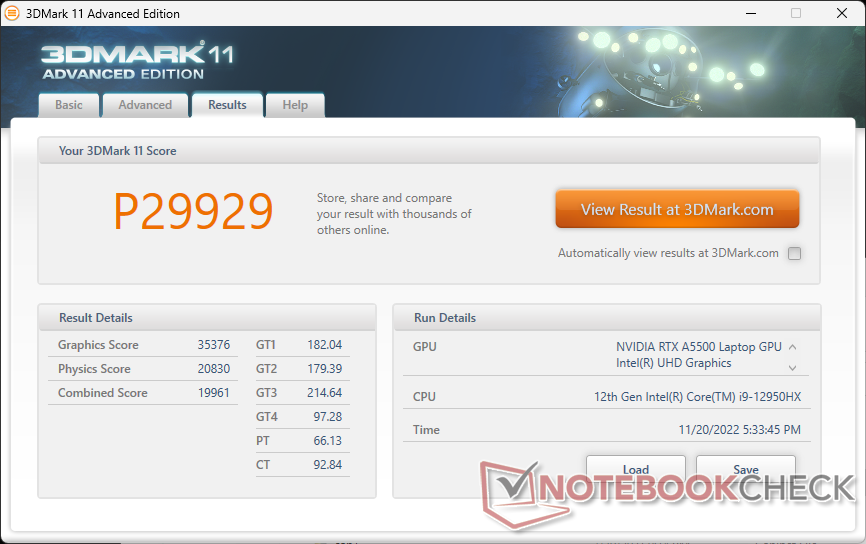
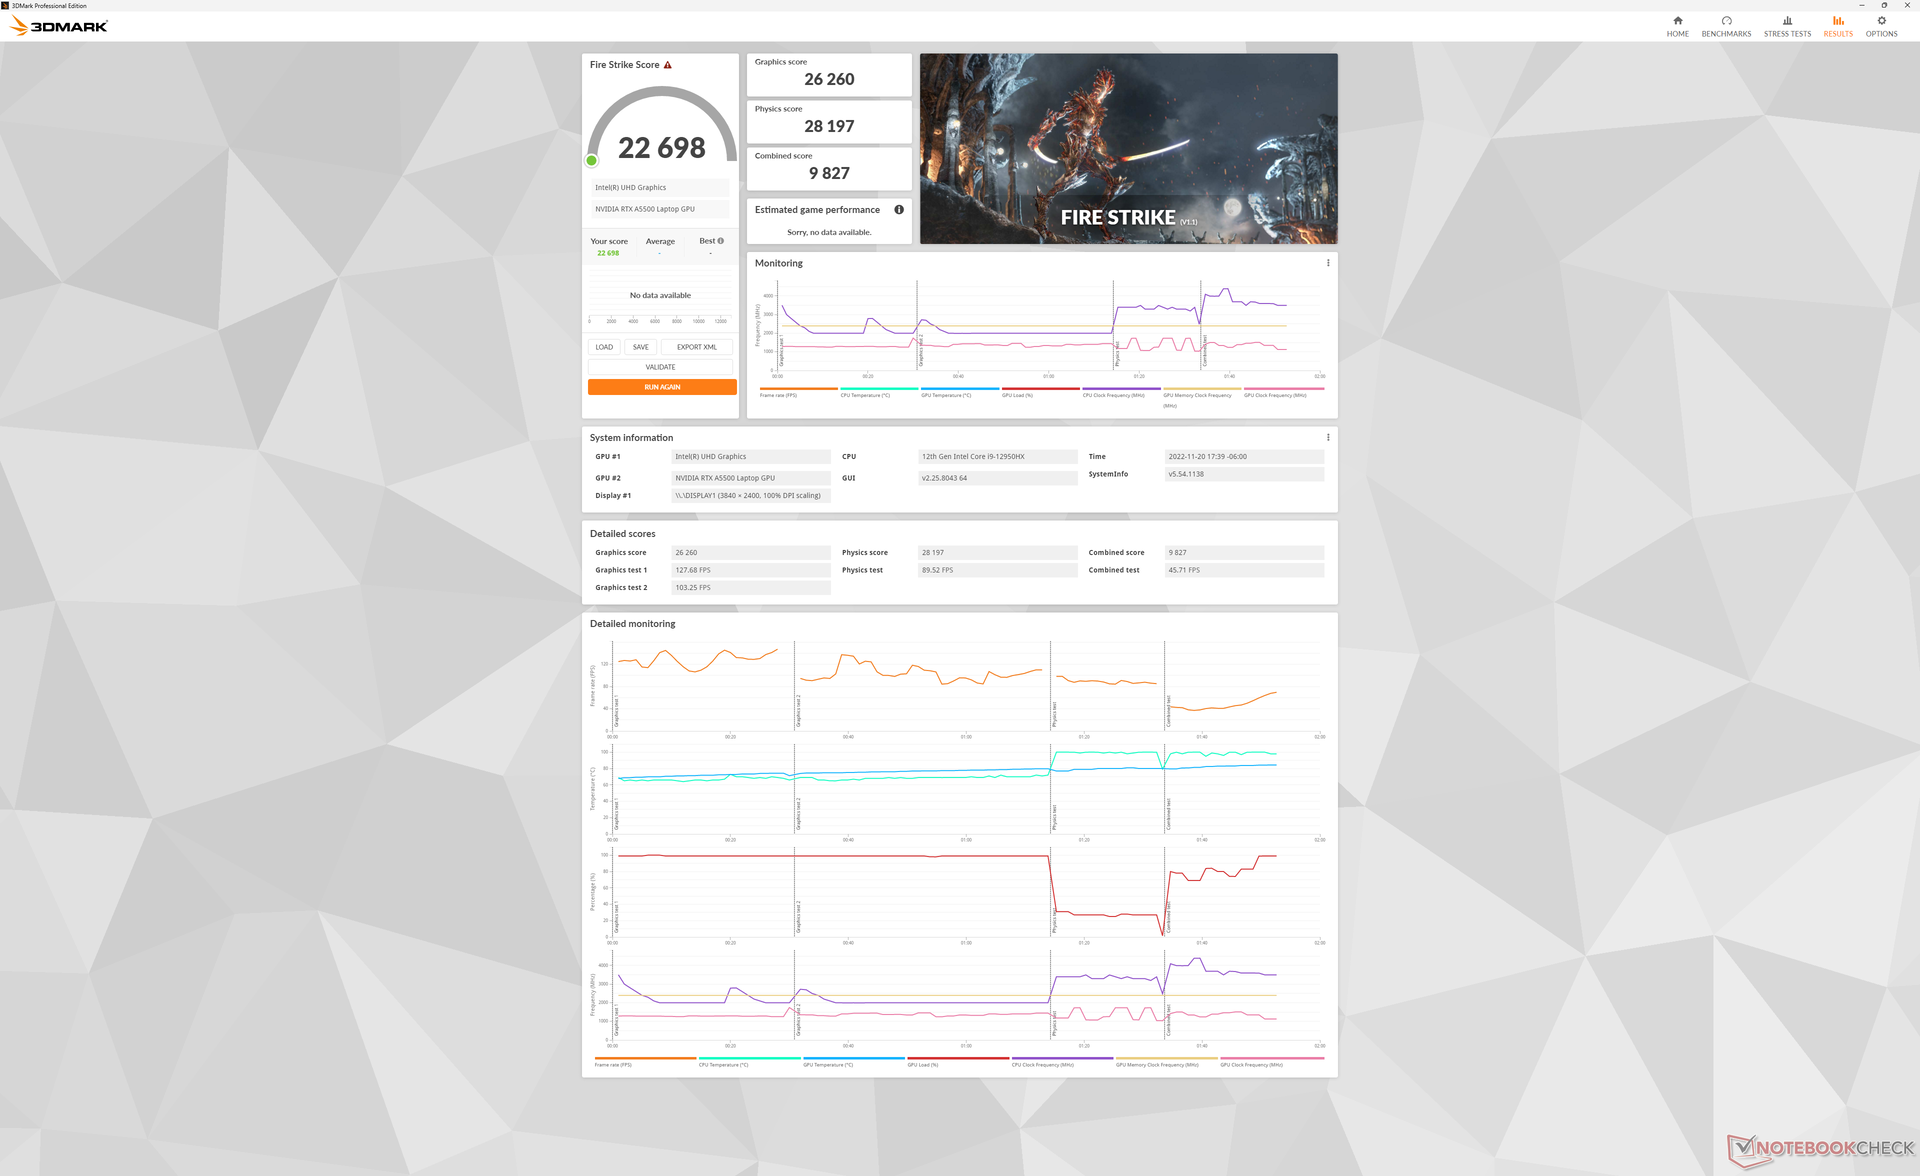
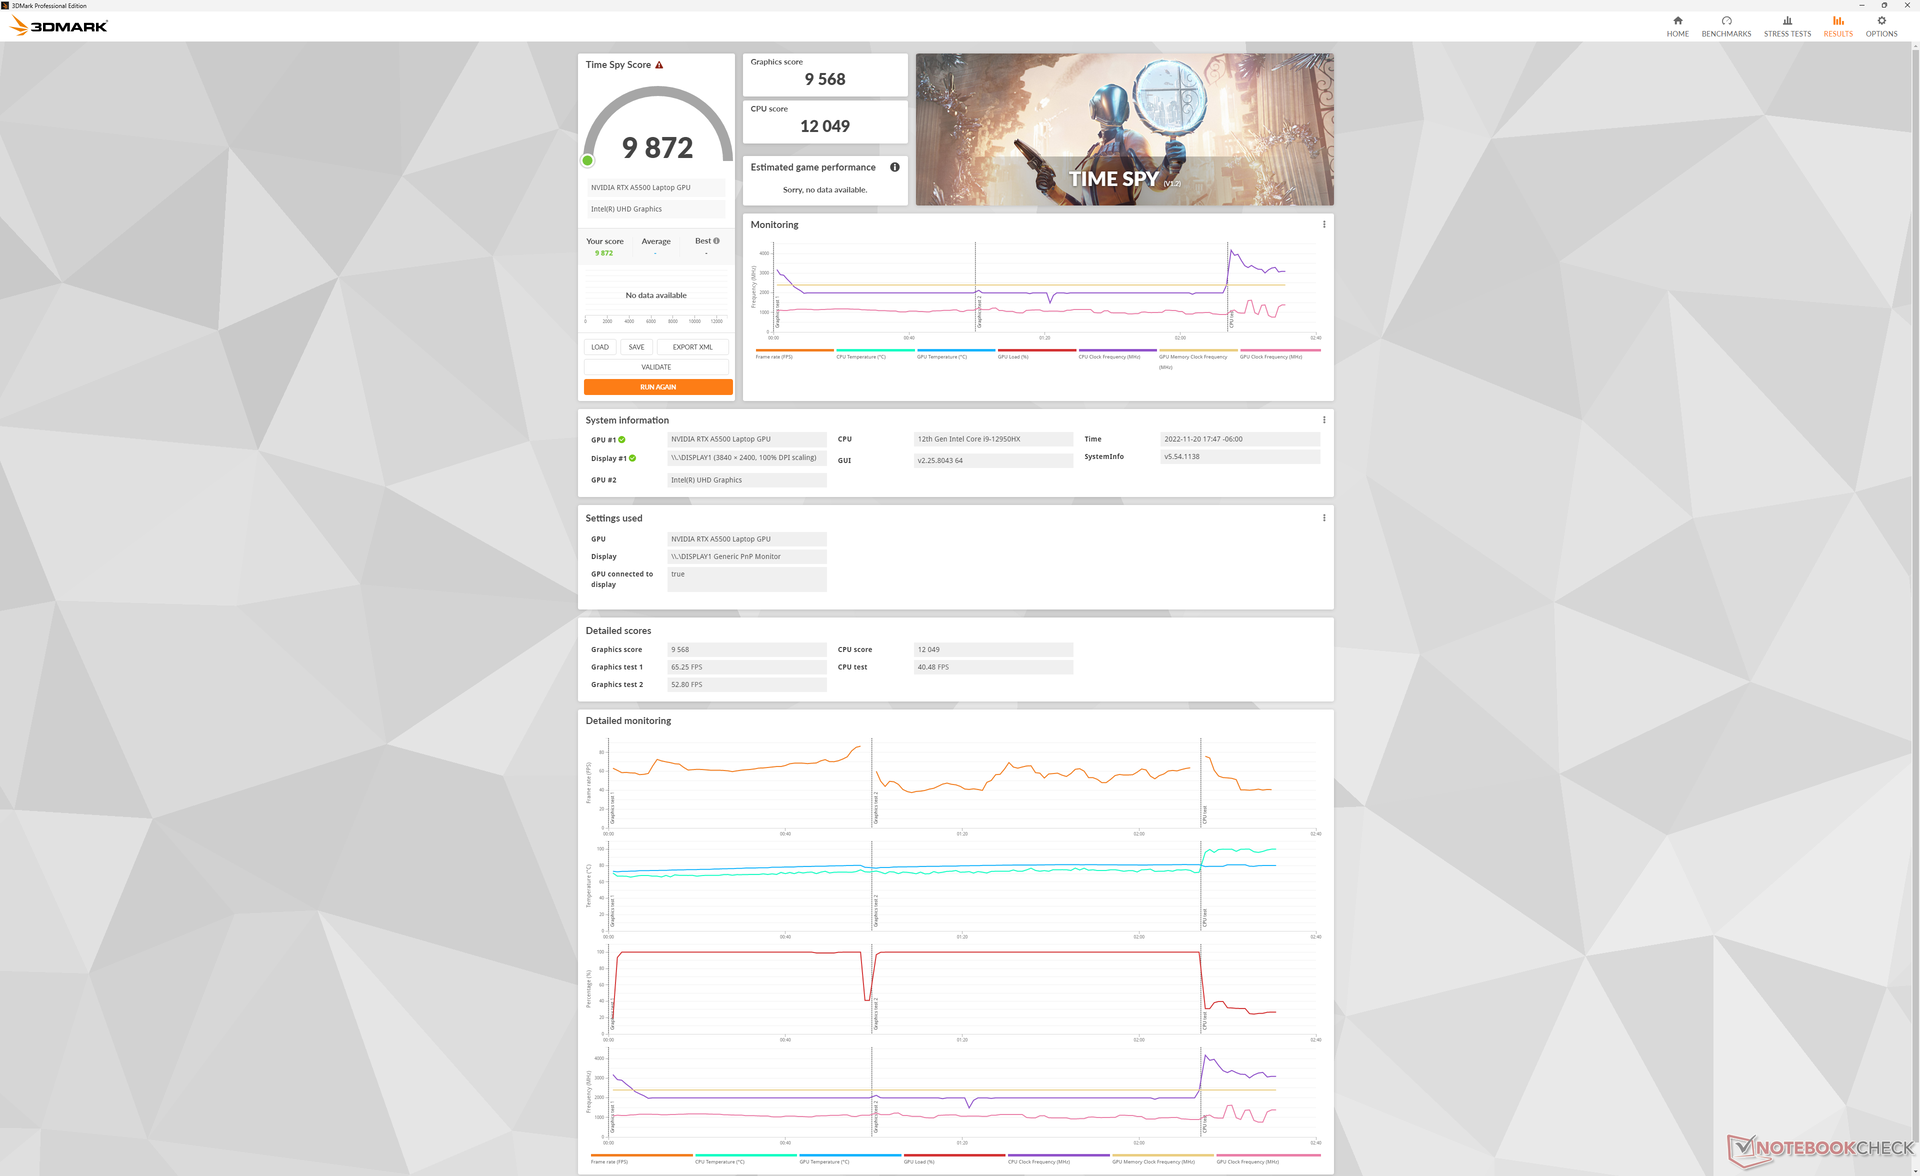
| 3DMark 11 Performance | 29929 punten | |
| 3DMark Fire Strike Score | 22698 punten | |
| 3DMark Time Spy Score | 9872 punten | |
Help | ||
* ... kleiner is beter
| Performance rating - Percent | |
| Dell Precision 7000 7670 Performance | |
| MSI CreatorPro Z16P B12UKST | |
| Dell Precision 7670 | |
| HP ZBook Studio 16 G9 62U04EA | |
| Lenovo ThinkPad P1 G4-20Y4Z9DVUS -2! | |
| HP ZBook Firefly 16 G9-6B897EA | |
| The Witcher 3 - 1920x1080 Ultra Graphics & Postprocessing (HBAO+) | |
| Dell Precision 7000 7670 Performance | |
| MSI CreatorPro Z16P B12UKST | |
| Dell Precision 7670 | |
| HP ZBook Studio 16 G9 62U04EA | |
| Lenovo ThinkPad P1 G4-20Y4Z9DVUS | |
| HP ZBook Firefly 16 G9-6B897EA | |
| GTA V - 1920x1080 Highest AA:4xMSAA + FX AF:16x | |
| Dell Precision 7000 7670 Performance | |
| MSI CreatorPro Z16P B12UKST | |
| Dell Precision 7670 | |
| HP ZBook Studio 16 G9 62U04EA | |
| HP ZBook Firefly 16 G9-6B897EA | |
| Final Fantasy XV Benchmark - 1920x1080 High Quality | |
| Dell Precision 7000 7670 Performance | |
| MSI CreatorPro Z16P B12UKST | |
| Dell Precision 7670 | |
| HP ZBook Studio 16 G9 62U04EA | |
| Lenovo ThinkPad P1 G4-20Y4Z9DVUS | |
| HP ZBook Firefly 16 G9-6B897EA | |
| Strange Brigade - 1920x1080 ultra AA:ultra AF:16 | |
| Dell Precision 7000 7670 Performance | |
| MSI CreatorPro Z16P B12UKST | |
| Dell Precision 7670 | |
| HP ZBook Studio 16 G9 62U04EA | |
| HP ZBook Firefly 16 G9-6B897EA | |
| Dota 2 Reborn - 1920x1080 ultra (3/3) best looking | |
| Dell Precision 7000 7670 Performance | |
| HP ZBook Studio 16 G9 62U04EA | |
| MSI CreatorPro Z16P B12UKST | |
| Dell Precision 7670 | |
| Lenovo ThinkPad P1 G4-20Y4Z9DVUS | |
| HP ZBook Firefly 16 G9-6B897EA | |
| X-Plane 11.11 - 1920x1080 high (fps_test=3) | |
| Dell Precision 7000 7670 Performance | |
| MSI CreatorPro Z16P B12UKST | |
| HP ZBook Studio 16 G9 62U04EA | |
| Dell Precision 7670 | |
| Lenovo ThinkPad P1 G4-20Y4Z9DVUS | |
| HP ZBook Firefly 16 G9-6B897EA | |
| Cyberpunk 2077 1.6 | |
| 1920x1080 Low Preset | |
| Dell Precision 7000 7670 Performance | |
| Dell Precision 7670 | |
| MSI CreatorPro Z16P B12UKST | |
| HP ZBook Studio 16 G9 62U04EA | |
| 1920x1080 Medium Preset | |
| Dell Precision 7000 7670 Performance | |
| MSI CreatorPro Z16P B12UKST | |
| Dell Precision 7670 | |
| HP ZBook Studio 16 G9 62U04EA | |
| 1920x1080 High Preset | |
| Dell Precision 7000 7670 Performance | |
| Dell Precision 7670 | |
| MSI CreatorPro Z16P B12UKST | |
| HP ZBook Studio 16 G9 62U04EA | |
| 1920x1080 Ultra Preset | |
| Dell Precision 7000 7670 Performance | |
| Dell Precision 7670 | |
| MSI CreatorPro Z16P B12UKST | |
| HP ZBook Studio 16 G9 62U04EA | |
| 2560x1440 Ultra Preset | |
| Dell Precision 7000 7670 Performance | |
| Dell Precision 7670 | |
| MSI CreatorPro Z16P B12UKST | |
| HP ZBook Studio 16 G9 62U04EA | |
| 3840x2160 Ultra Preset | |
| Dell Precision 7000 7670 Performance | |
Bij een uur stationair draaien Witcher 3 gedurende een uur, konden we na ongeveer 10 minuten in de test enorme dips in framerates registreren, zoals blijkt uit onderstaande grafiek. Dit wijst op slechte programmaprioritering of onderbrekende achtergrondactiviteiten die de prestaties van het hoofdprogramma kunnen verstoren.
Witcher 3 FPS Chart
| lage | gem. | hoge | ultra | QHD | 4K | |
|---|---|---|---|---|---|---|
| GTA V (2015) | 183.4 | 178.1 | 166.2 | 102.6 | 99.2 | |
| The Witcher 3 (2015) | 421.2 | 306.8 | 205.4 | 101.5 | 62.5 | |
| Dota 2 Reborn (2015) | 193.3 | 171.3 | 161.8 | 152.9 | 131.4 | |
| Final Fantasy XV Benchmark (2018) | 170.1 | 138.9 | 107.8 | 78.9 | 43.5 | |
| X-Plane 11.11 (2018) | 146.2 | 134.3 | 107.8 | 92.7 | ||
| Strange Brigade (2018) | 377 | 244 | 200 | 177.9 | 129.3 | |
| Metro Exodus (2019) | 171 | 125.8 | 95.3 | 75.7 | 58.5 | 31.3 |
| Borderlands 3 (2019) | 162.9 | 135.4 | 110.4 | 89.3 | 62.7 | 30.2 |
| Gears Tactics (2020) | 314.1 | 189.7 | 139.2 | 110.1 | 77.1 | 34.9 |
| Horizon Zero Dawn (2020) | 139 | 130 | 111 | 101 | 89 | 42 |
| Watch Dogs Legion (2020) | 119 | 98 | 93 | 77 | 58 | 30 |
| Dirt 5 (2020) | 167.6 | 130 | 114.8 | 92.2 | 71.9 | 39.8 |
| Hitman 3 (2021) | 229 | 186.6 | 179.9 | 161.4 | 104.6 | 43.8 |
| Far Cry 6 (2021) | 132 | 115 | 104 | 95 | 79 | 42 |
| Guardians of the Galaxy (2021) | 142 | 124 | 137 | 134 | 104 | 49 |
| God of War (2022) | 128.9 | 119.6 | 105.6 | 79 | 62.2 | 35.6 |
| Cyberpunk 2077 1.6 (2022) | 93.9 | 80.2 | 79.3 | 75.7 | 45.3 | 17.8 |
| F1 22 (2022) | 190.8 | 188.2 | 163.1 | 66.4 | 40.8 | 18.8 |
Emissies
Systeemgeluid
De ventilatoren in de Precision 7670 Performance hebben de neiging om vaker te pulseren dan de ventilatoren in de slankere Precision 7670, waarschijnlijk als gevolg van het hogere Turbo Boost plafond van de Core i9-12950HX versus de Core i7-12850HX. Dit zou echter geen probleem moeten zijn wanneer het energieprofiel is ingesteld op Balanced of Quiet mode
Het algemene ventilatorgeluid is over het algemeen stiller dan wat we registreerden op de slankere Precision 7670. Gaming belastingen stabiliseren zich in het 42 tot 47 dB(A) bereik vergeleken met het 45 tot 49 dB(A) bereik van het kleinere model. We bereiken een maximum van 48 dB(A) wanneer zowel de CPU als de GPU op 100 procent gebruik zitten.
Geluidsniveau
| Onbelast |
| 24 / 24 / 38 dB (A) |
| Belasting |
| 46.3 / 47.9 dB (A) |
 | ||
30 dB stil 40 dB(A) hoorbaar 50 dB(A) luid |
||
min: | ||
| Dell Precision 7000 7670 Performance RTX A5500 Laptop GPU, i9-12950HX | MSI CreatorPro Z16P B12UKST RTX A3000 Laptop GPU, i7-12700H, Samsung PM9A1 MZVL21T0HCLR | HP ZBook Studio 16 G9 62U04EA RTX A2000 Laptop GPU, i7-12800H, Micron 3400 1TB MTFDKBA1T0TFH | HP ZBook Firefly 16 G9-6B897EA T550 Laptop GPU, i7-1265U, Samsung PM9A1 MZVL21T0HCLR | Lenovo ThinkPad P1 G4-20Y4Z9DVUS T1200 Laptop GPU, i7-11800H, Samsung PM9A1 MZVL2512HCJQ | Dell Precision 7670 RTX A2000 Laptop GPU, i7-12850HX, SK Hynix HFS001TEJ9X115N | |
|---|---|---|---|---|---|---|
| Noise | 1% | 3% | 10% | 2% | 4% | |
| uit / omgeving * (dB) | 23.9 | 24.1 -1% | 24 -0% | 23.8 -0% | 24.3 -2% | 22.7 5% |
| Idle Minimum * (dB) | 24 | 27.1 -13% | 24 -0% | 23.8 1% | 24.3 -1% | 22.9 5% |
| Idle Average * (dB) | 24 | 27.1 -13% | 27.7 -15% | 23.8 1% | 24.3 -1% | 22.9 5% |
| Idle Maximum * (dB) | 38 | 27.1 29% | 27.7 27% | 23.8 37% | 26.6 30% | 24.5 36% |
| Load Average * (dB) | 46.3 | 42.9 7% | 39.8 14% | 39.4 15% | 46.8 -1% | 48.7 -5% |
| Witcher 3 ultra * (dB) | 41.9 | 44 -5% | 44.3 -6% | 40.5 3% | 46.8 -12% | 45.2 -8% |
| Load Maximum * (dB) | 47.9 | 47 2% | 47.7 -0% | 41.4 14% | 46.8 2% | 52.1 -9% |
* ... kleiner is beter
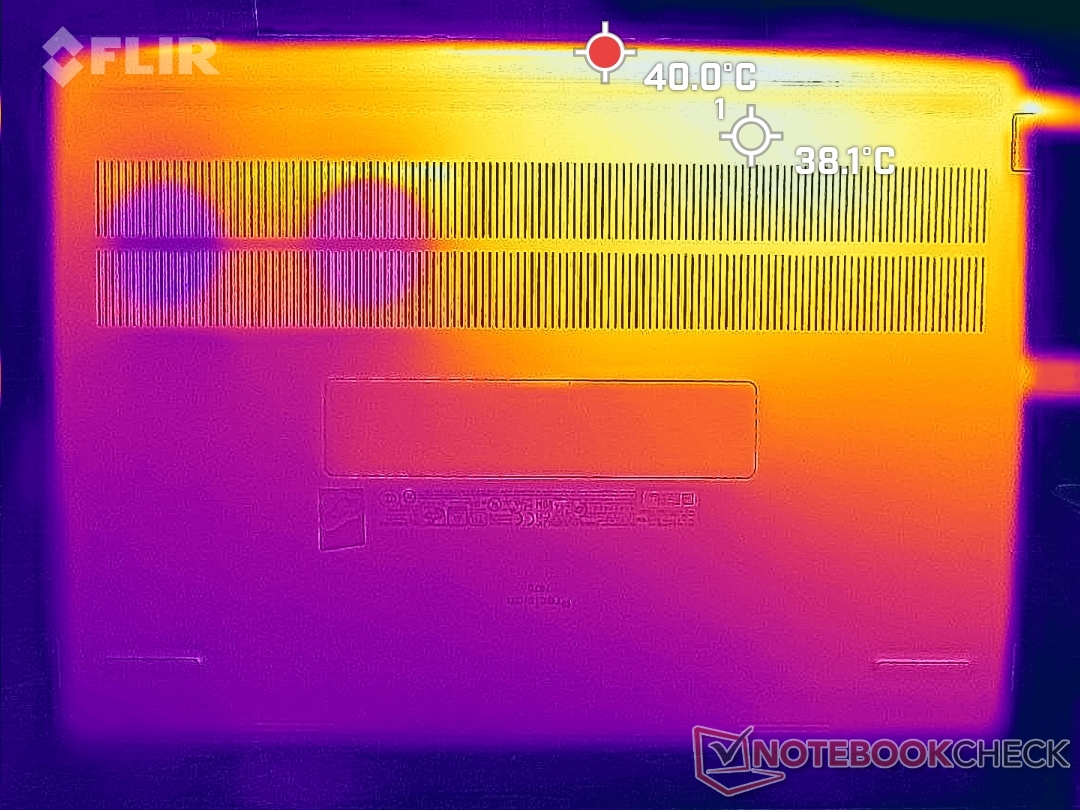
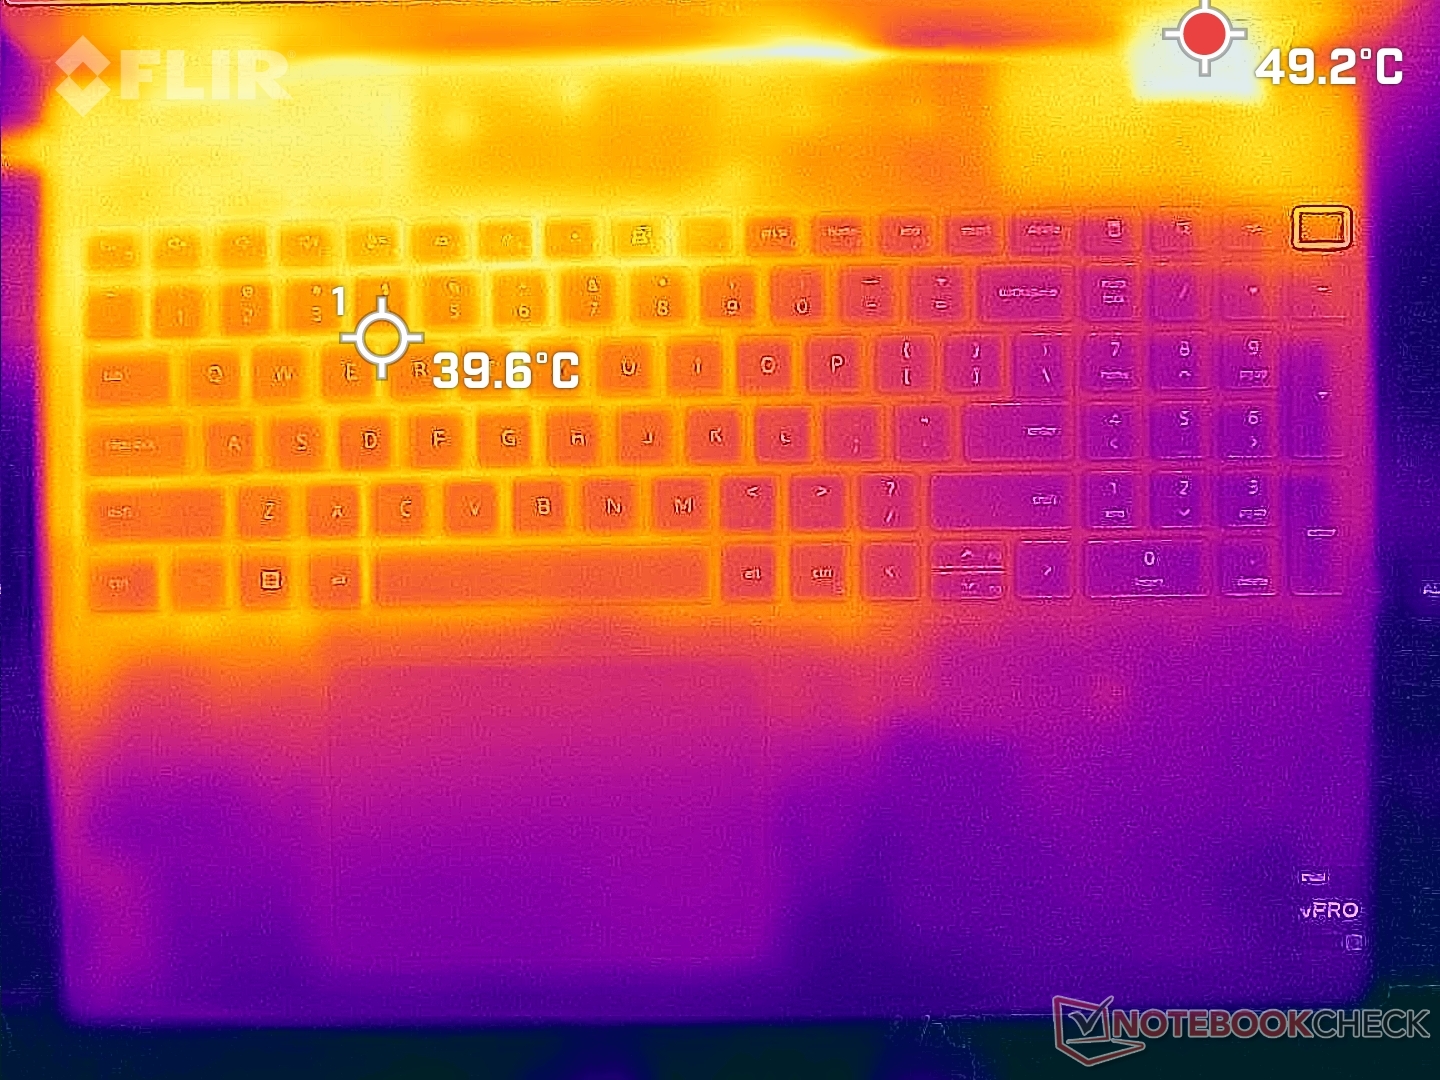
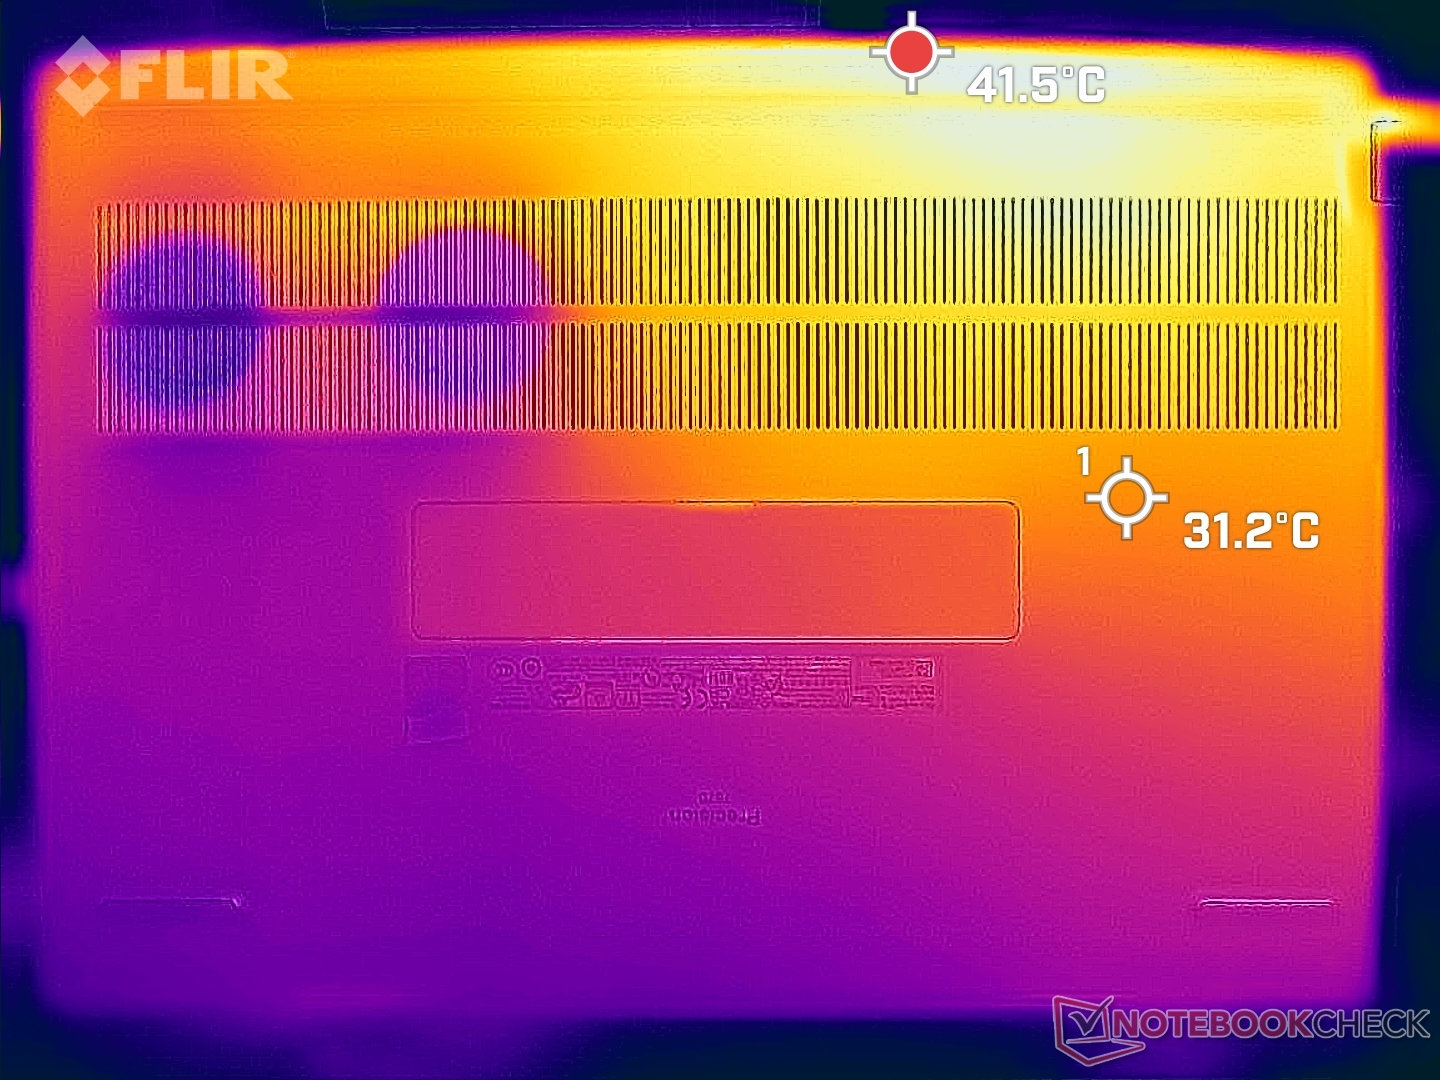
Temperatuur
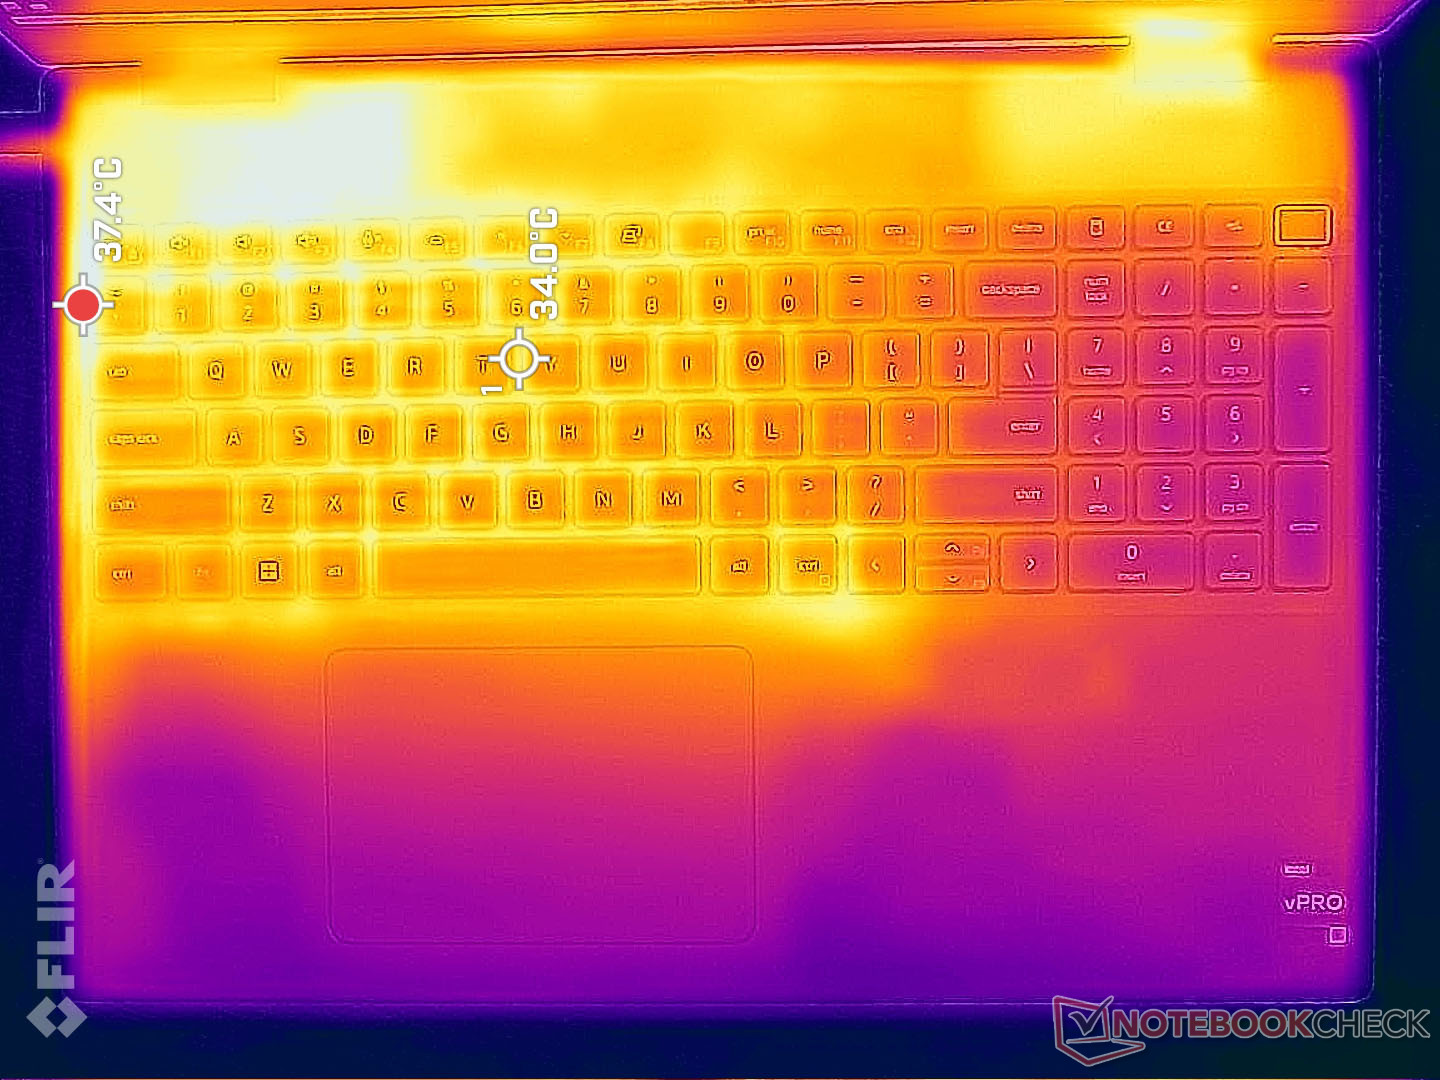
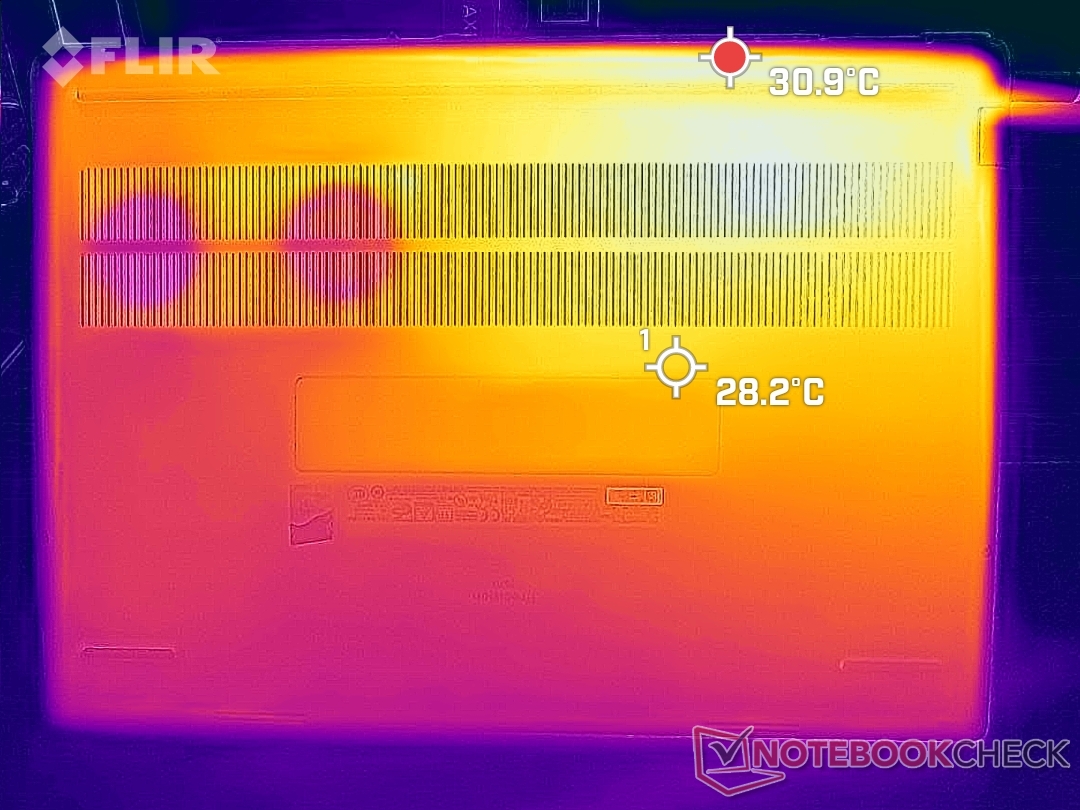
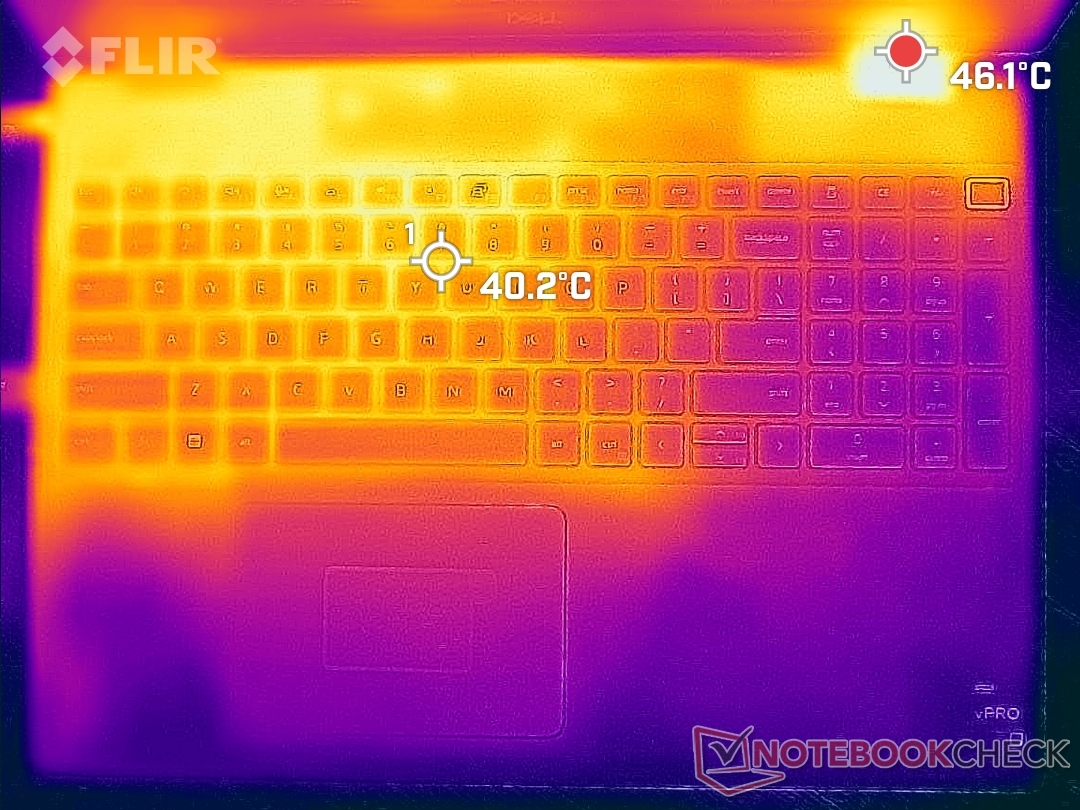
De oppervlaktetemperaturen zijn inderdaad wat warmer dan wat we op de gewone Precision 7670 vaststelden. Hete plekken op het toetsenbord en de achterkant bij veeleisende belastingen zoals games voor langere tijd kunnen elk ongeveer 40 C bereiken, vergeleken met 35 C op het dunnere reguliere model. Deze resultaten komen overeen met onze kerntemperatuurmetingen in de volgende sectie hieronder, waar onze CPU en GPU zich zouden stabiliseren bij warmere temperaturen.
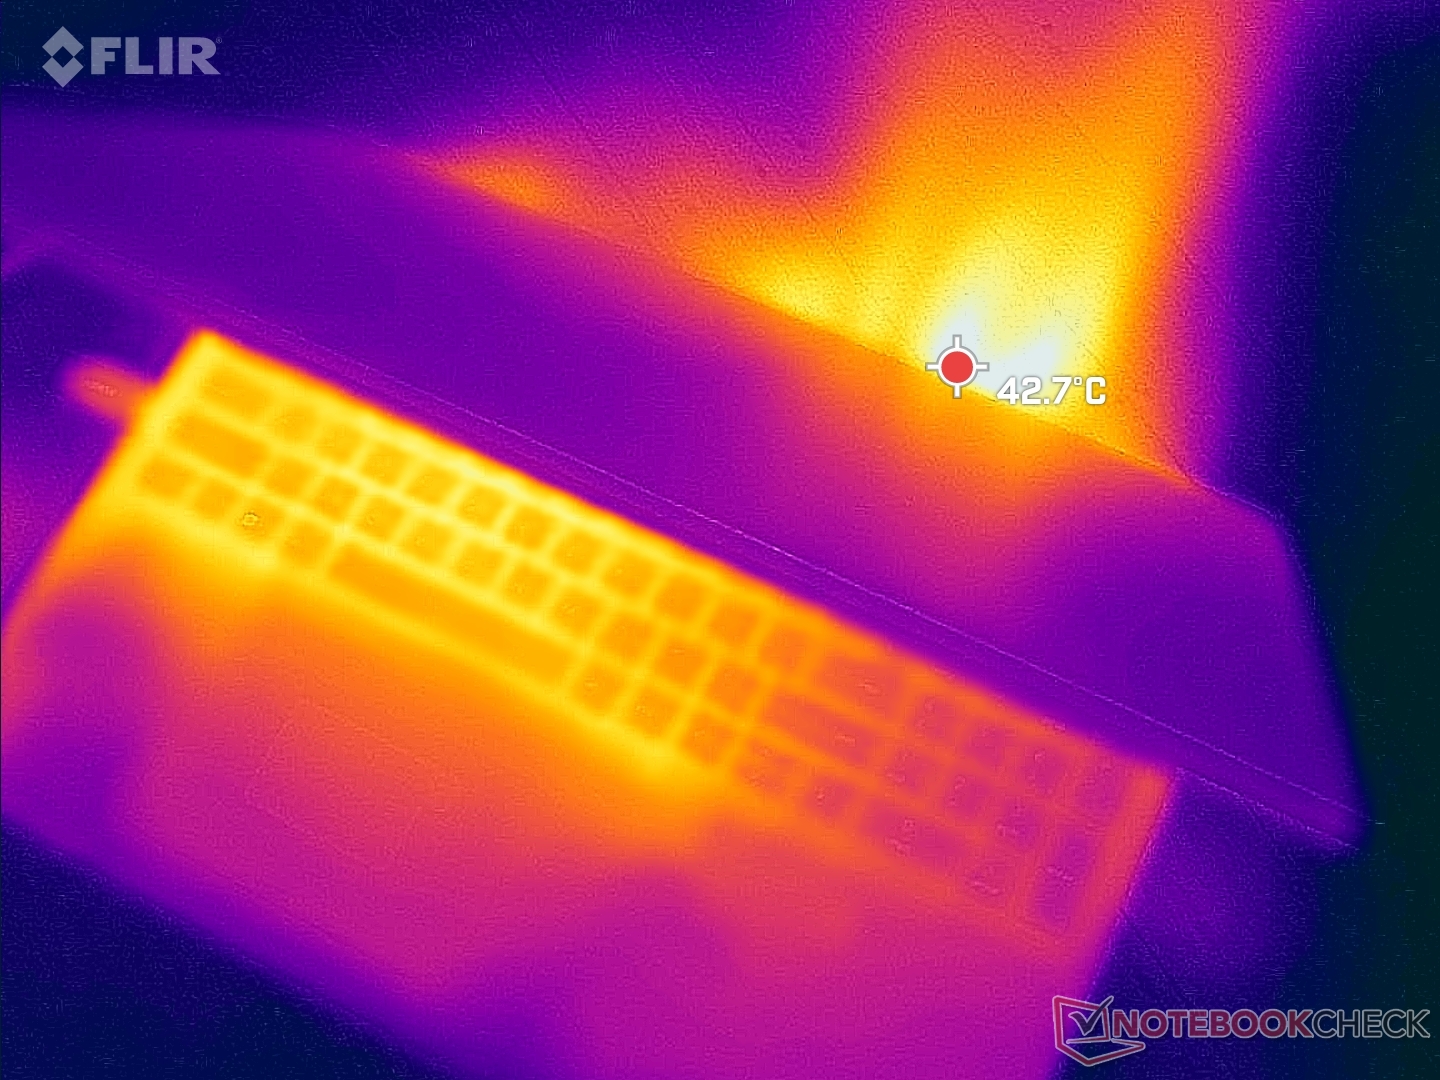
(-) De maximumtemperatuur aan de bovenzijde bedraagt 53 °C / 127 F, vergeleken met het gemiddelde van 38.2 °C / 101 F, variërend van 22.2 tot 69.8 °C voor de klasse Workstation.
(±) De bodem warmt op tot een maximum van 43.2 °C / 110 F, vergeleken met een gemiddelde van 41.1 °C / 106 F
(+) Bij onbelast gebruik bedraagt de gemiddelde temperatuur voor de bovenzijde 31.8 °C / 89 F, vergeleken met het apparaatgemiddelde van 32 °C / 90 F.
(±) Bij het spelen van The Witcher 3 is de gemiddelde temperatuur voor de bovenzijde 37 °C / 99 F, vergeleken met het apparaatgemiddelde van 32 °C / 90 F.
(+) De palmsteunen en het touchpad zijn met een maximum van ###max## °C / 87.1 F koeler dan de huidtemperatuur en voelen daarom koel aan.
(-) De gemiddelde temperatuur van de handpalmsteun van soortgelijke toestellen bedroeg 27.8 °C / 82 F (-2.8 °C / -5.1 F).
| Dell Precision 7000 7670 Performance Intel Core i9-12950HX, NVIDIA RTX A5500 Laptop GPU | MSI CreatorPro Z16P B12UKST Intel Core i7-12700H, NVIDIA RTX A3000 Laptop GPU | HP ZBook Studio 16 G9 62U04EA Intel Core i7-12800H, NVIDIA RTX A2000 Laptop GPU | HP ZBook Firefly 16 G9-6B897EA Intel Core i7-1265U, NVIDIA T550 Laptop GPU | Lenovo ThinkPad P1 G4-20Y4Z9DVUS Intel Core i7-11800H, NVIDIA T1200 Laptop GPU | Dell Precision 7670 Intel Core i7-12850HX, NVIDIA RTX A2000 Laptop GPU | |
|---|---|---|---|---|---|---|
| Heat | -2% | 9% | 8% | 7% | 4% | |
| Maximum Upper Side * (°C) | 53 | 56.3 -6% | 38.7 27% | 42.1 21% | 49.9 6% | 51 4% |
| Maximum Bottom * (°C) | 43.2 | 68.3 -58% | 53.4 -24% | 48 -11% | 56.7 -31% | 45.8 -6% |
| Idle Upper Side * (°C) | 36.8 | 25.2 32% | 27.3 26% | 29.9 19% | 25.5 31% | 31.8 14% |
| Idle Bottom * (°C) | 33.8 | 25.9 23% | 31.6 7% | 32.9 3% | 26.2 22% | 32.6 4% |
* ... kleiner is beter
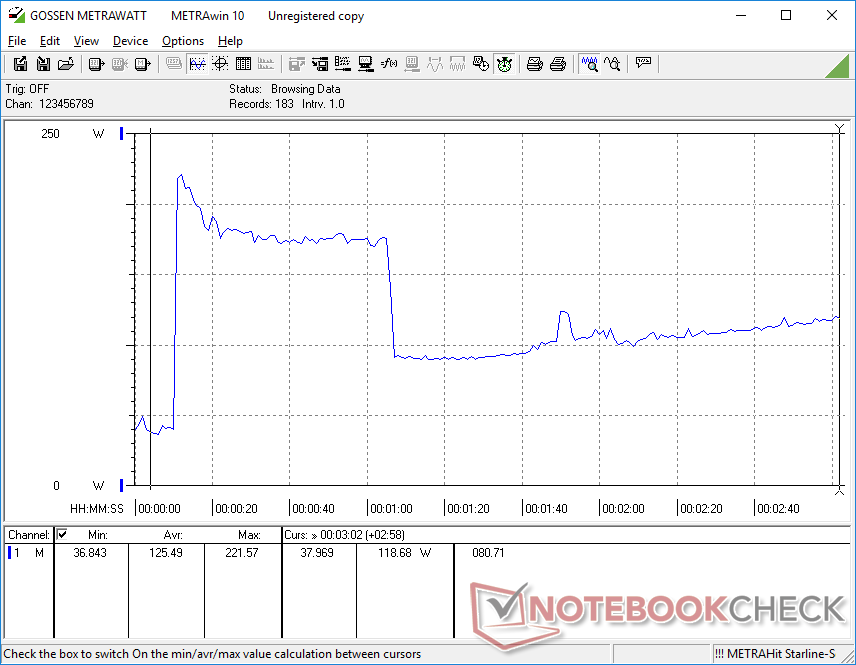
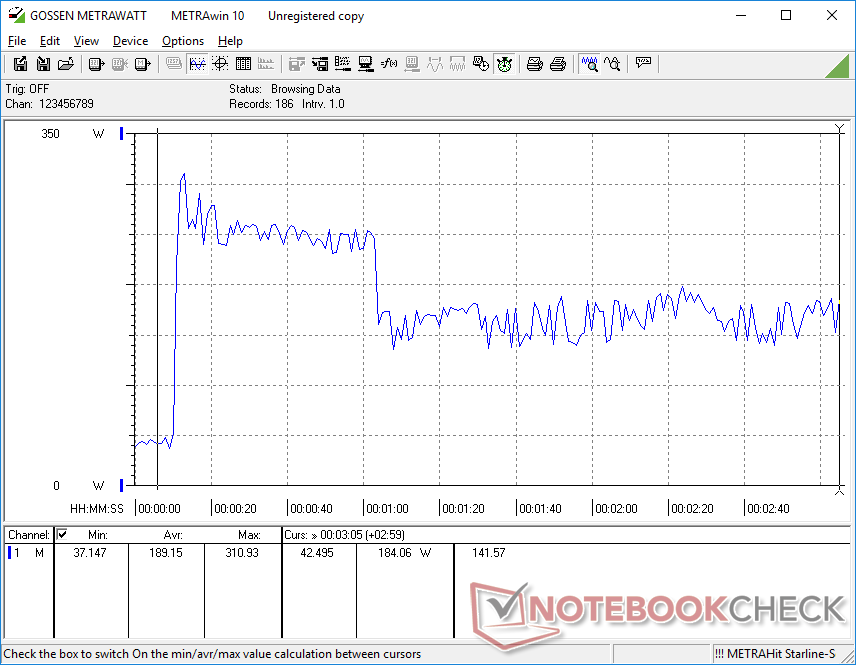
Stresstest
Wanneer Prime95 wordt uitgevoerd om de CPU te belasten, springen de kloksnelheden en de temperatuur bijna onmiddellijk naar respectievelijk 3,4 GHz en 99 C, en bij een hoog processorvermogen van 147 W. Een dergelijke hoge temperatuur is niet houdbaar, en dus dalen de kloksnelheden en de temperatuur snel naar een stabielere 2,3 GHz en 78 C, respectievelijk, en bij een uiteindelijk processorvermogen van 76 W. De gestage, aanzienlijke daling van het Turbo Boost-potentieel komt overeen met onze CineBench R15 xT loop-testresultaten hierboven, waar de scores langzaam dalen voordat ze zich na verloop van tijd stabiliseren.
CPU en GPU temperaturen tijdens het draaien Witcher 3 zouden stabiliseren op 77 C en 82 C, respectievelijk, vergeleken met 70 C en 80 C op de gewone dunnere Precision 7670.
De prestaties zijn beperkt als er op batterijvoeding wordt gewerkt. Fire Strike op batterijen zou Physics en Graphics scores van respectievelijk 18901 en 9254 punten opleveren, vergeleken met 28197 en 26260 punten als er op netstroom wordt gewerkt.
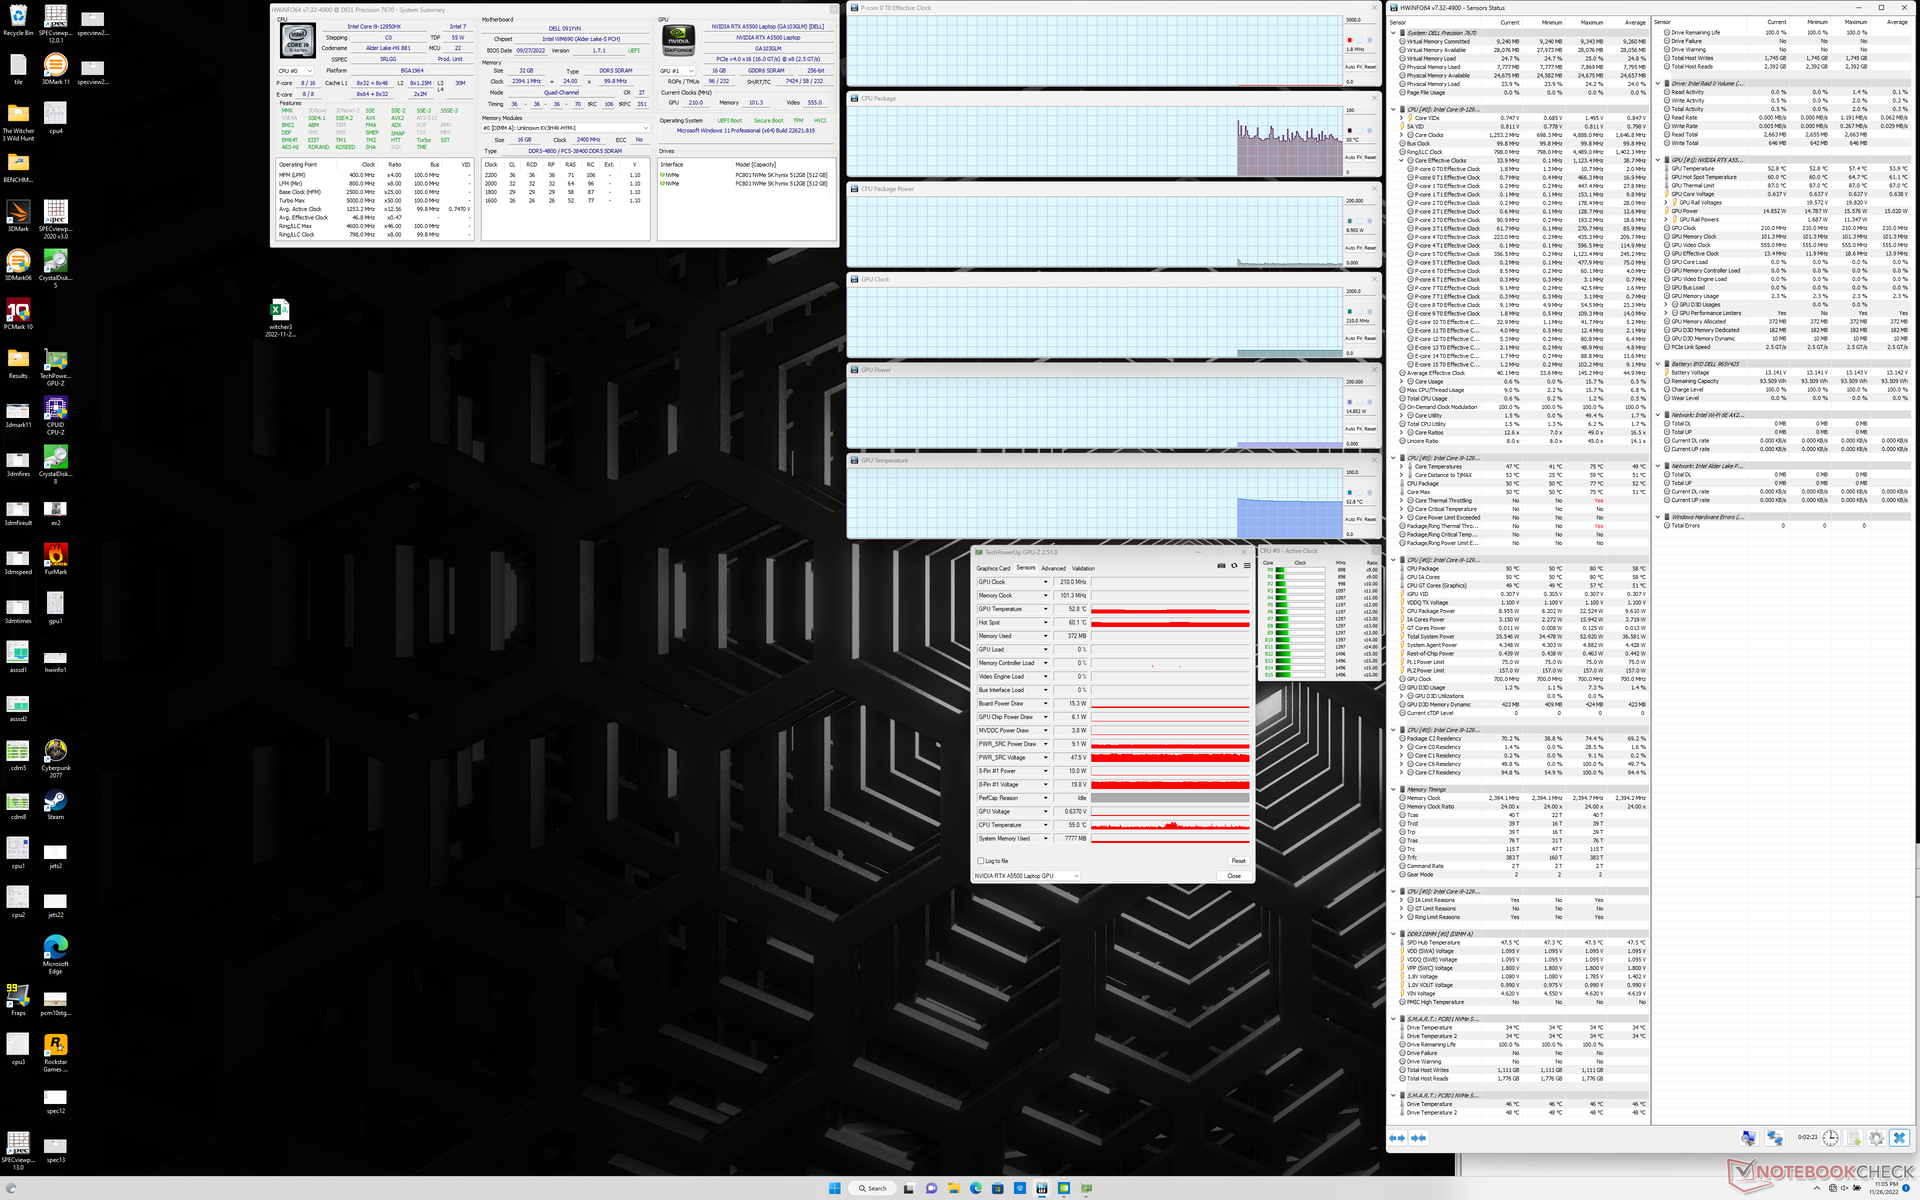
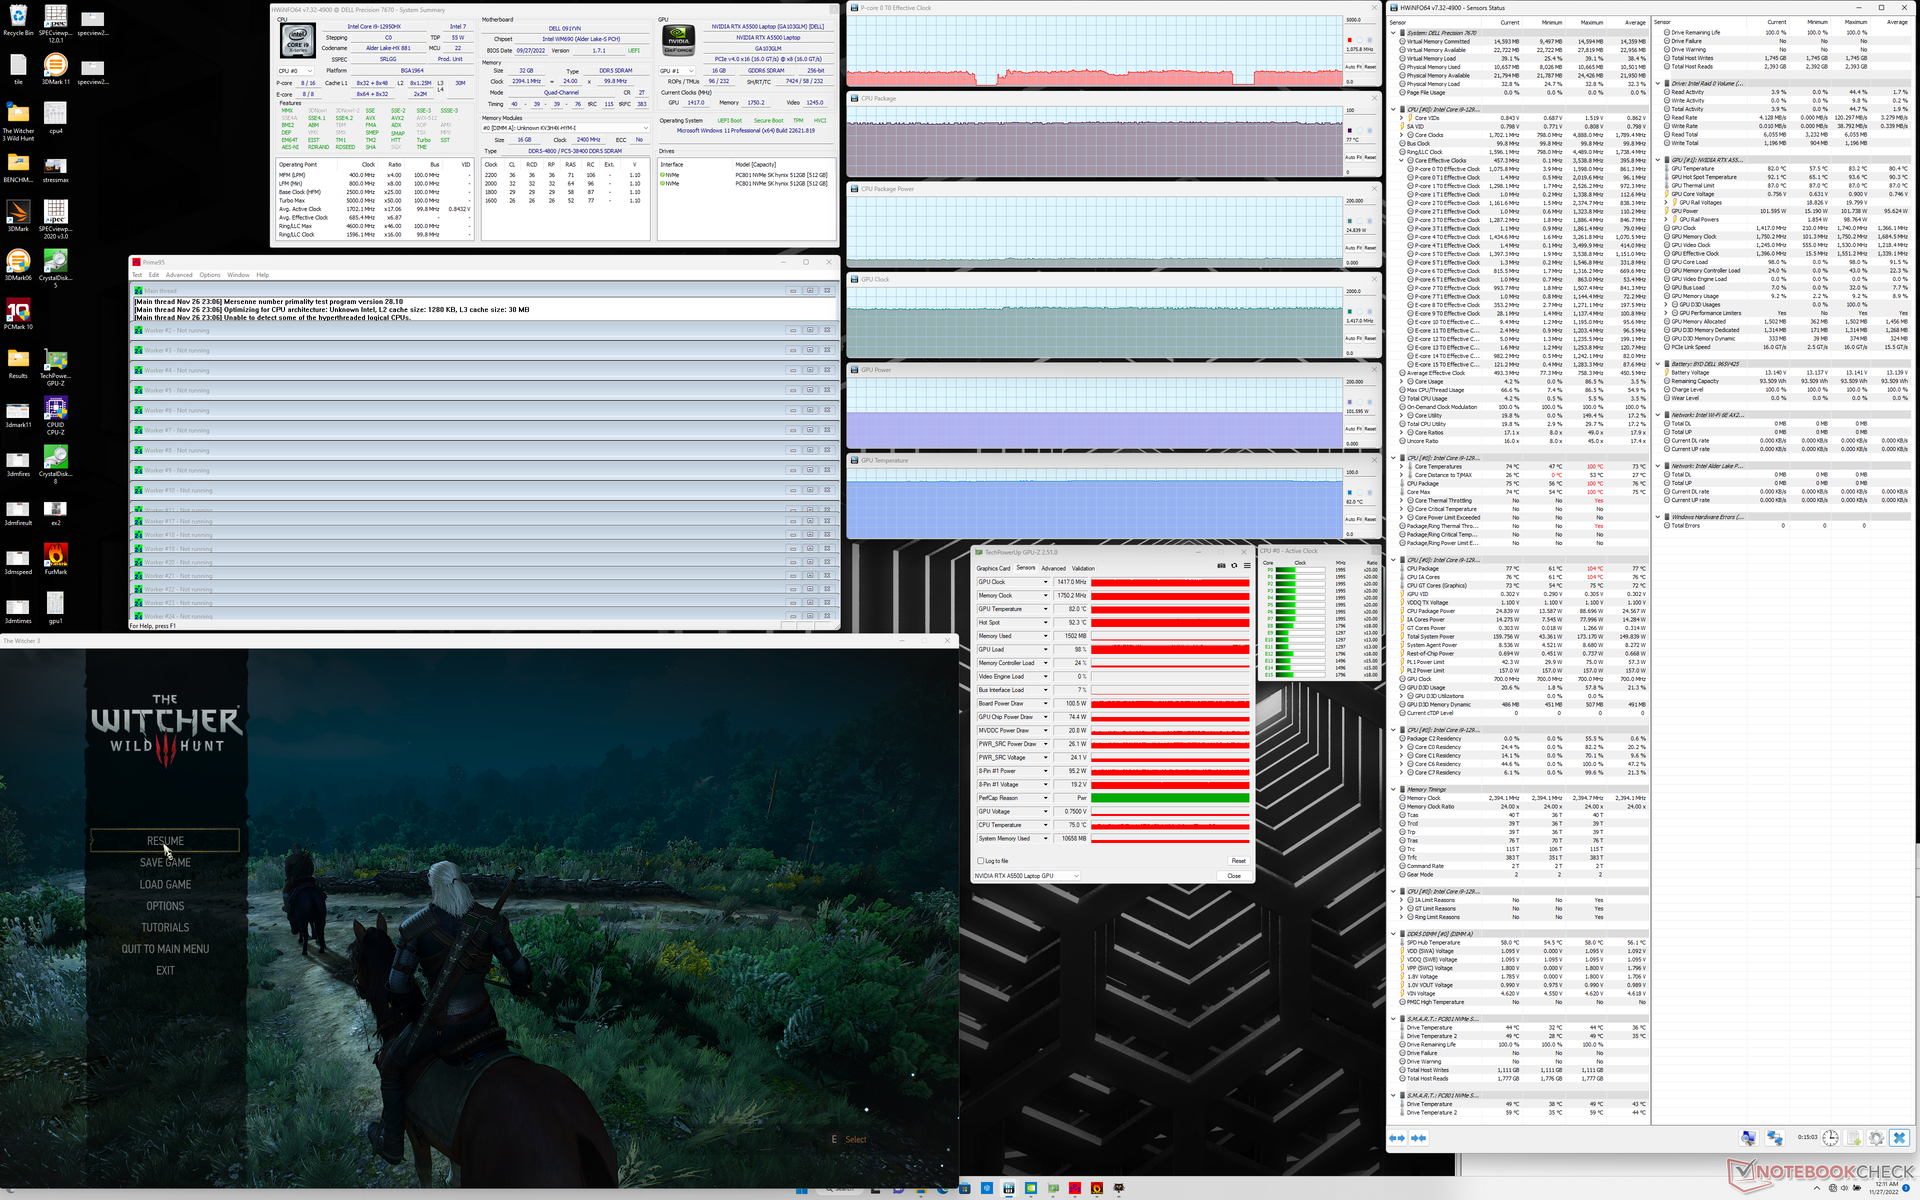
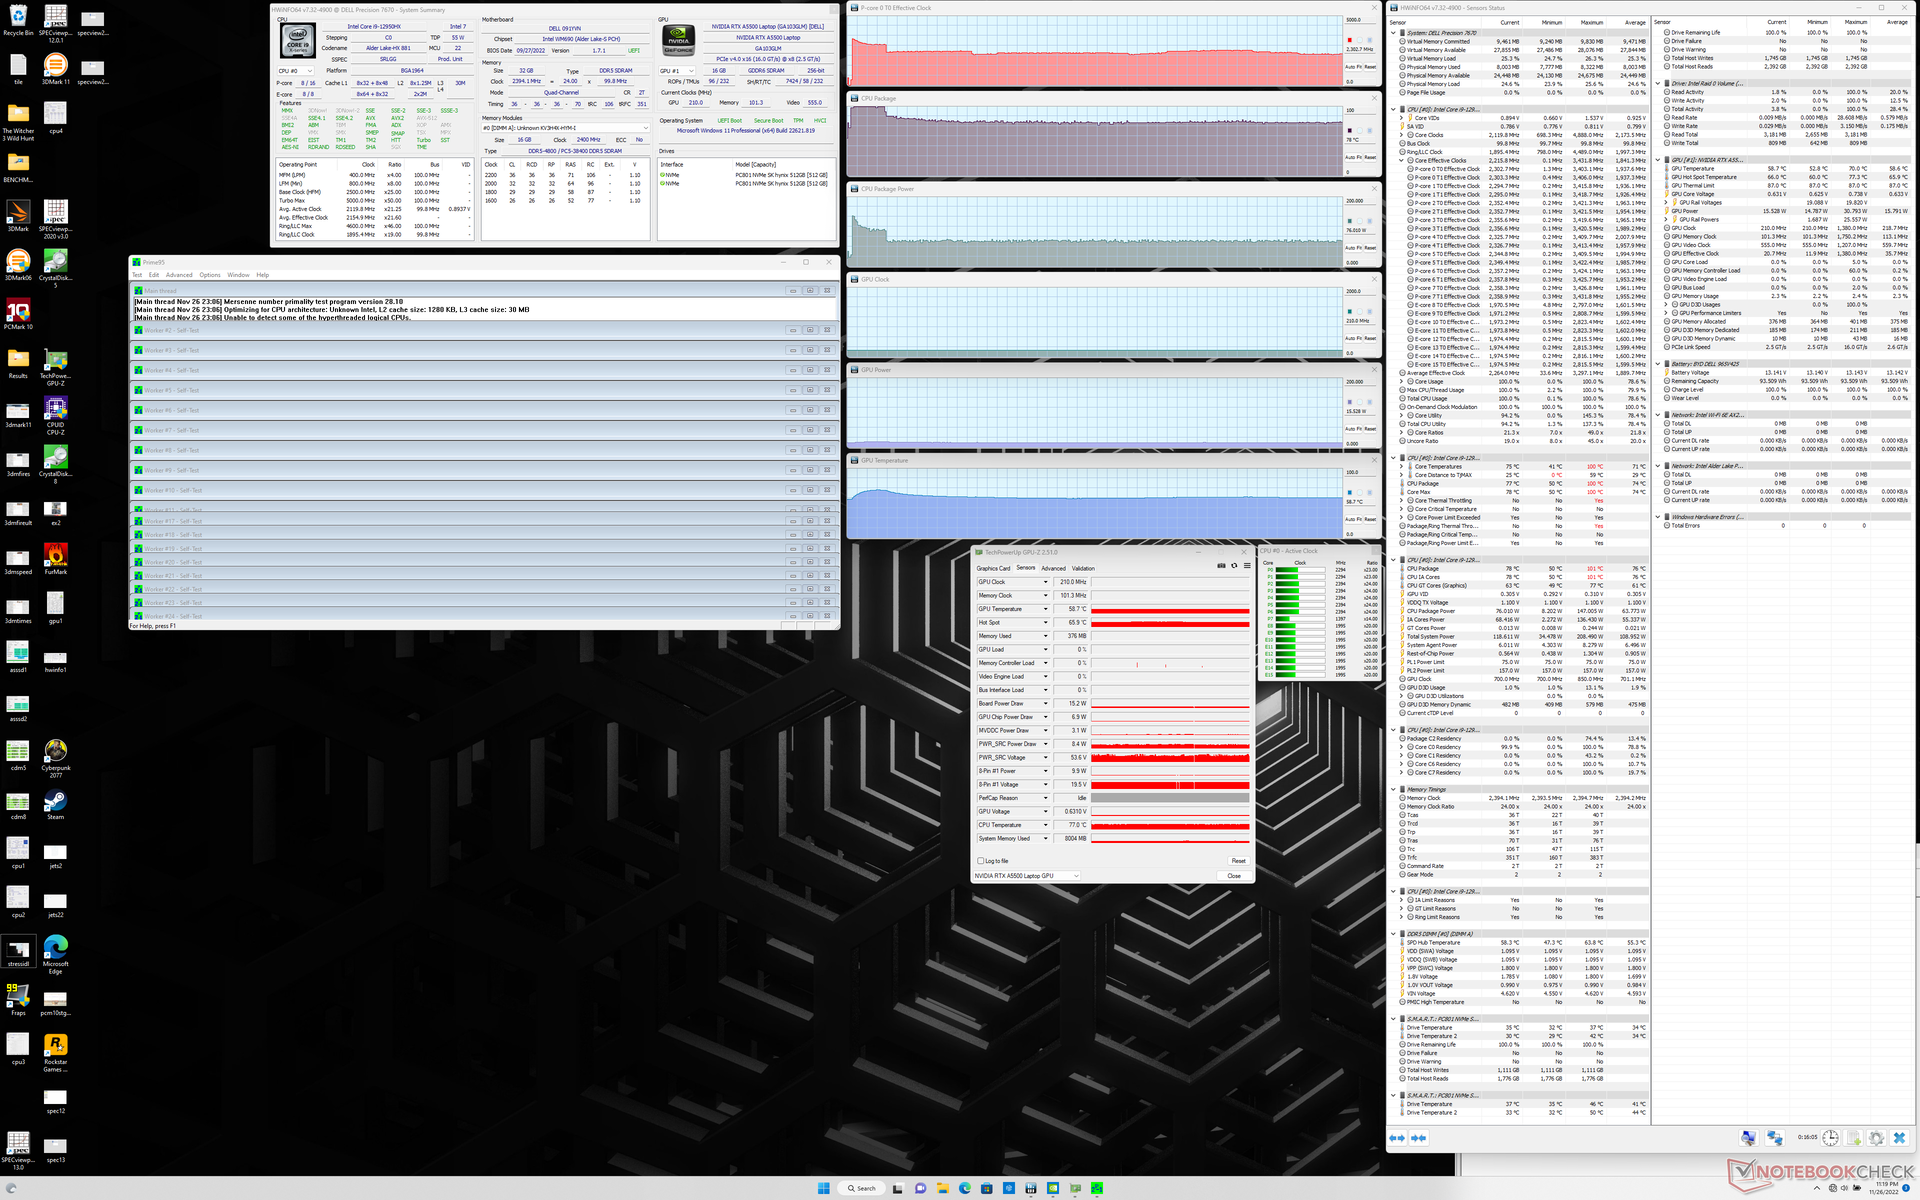
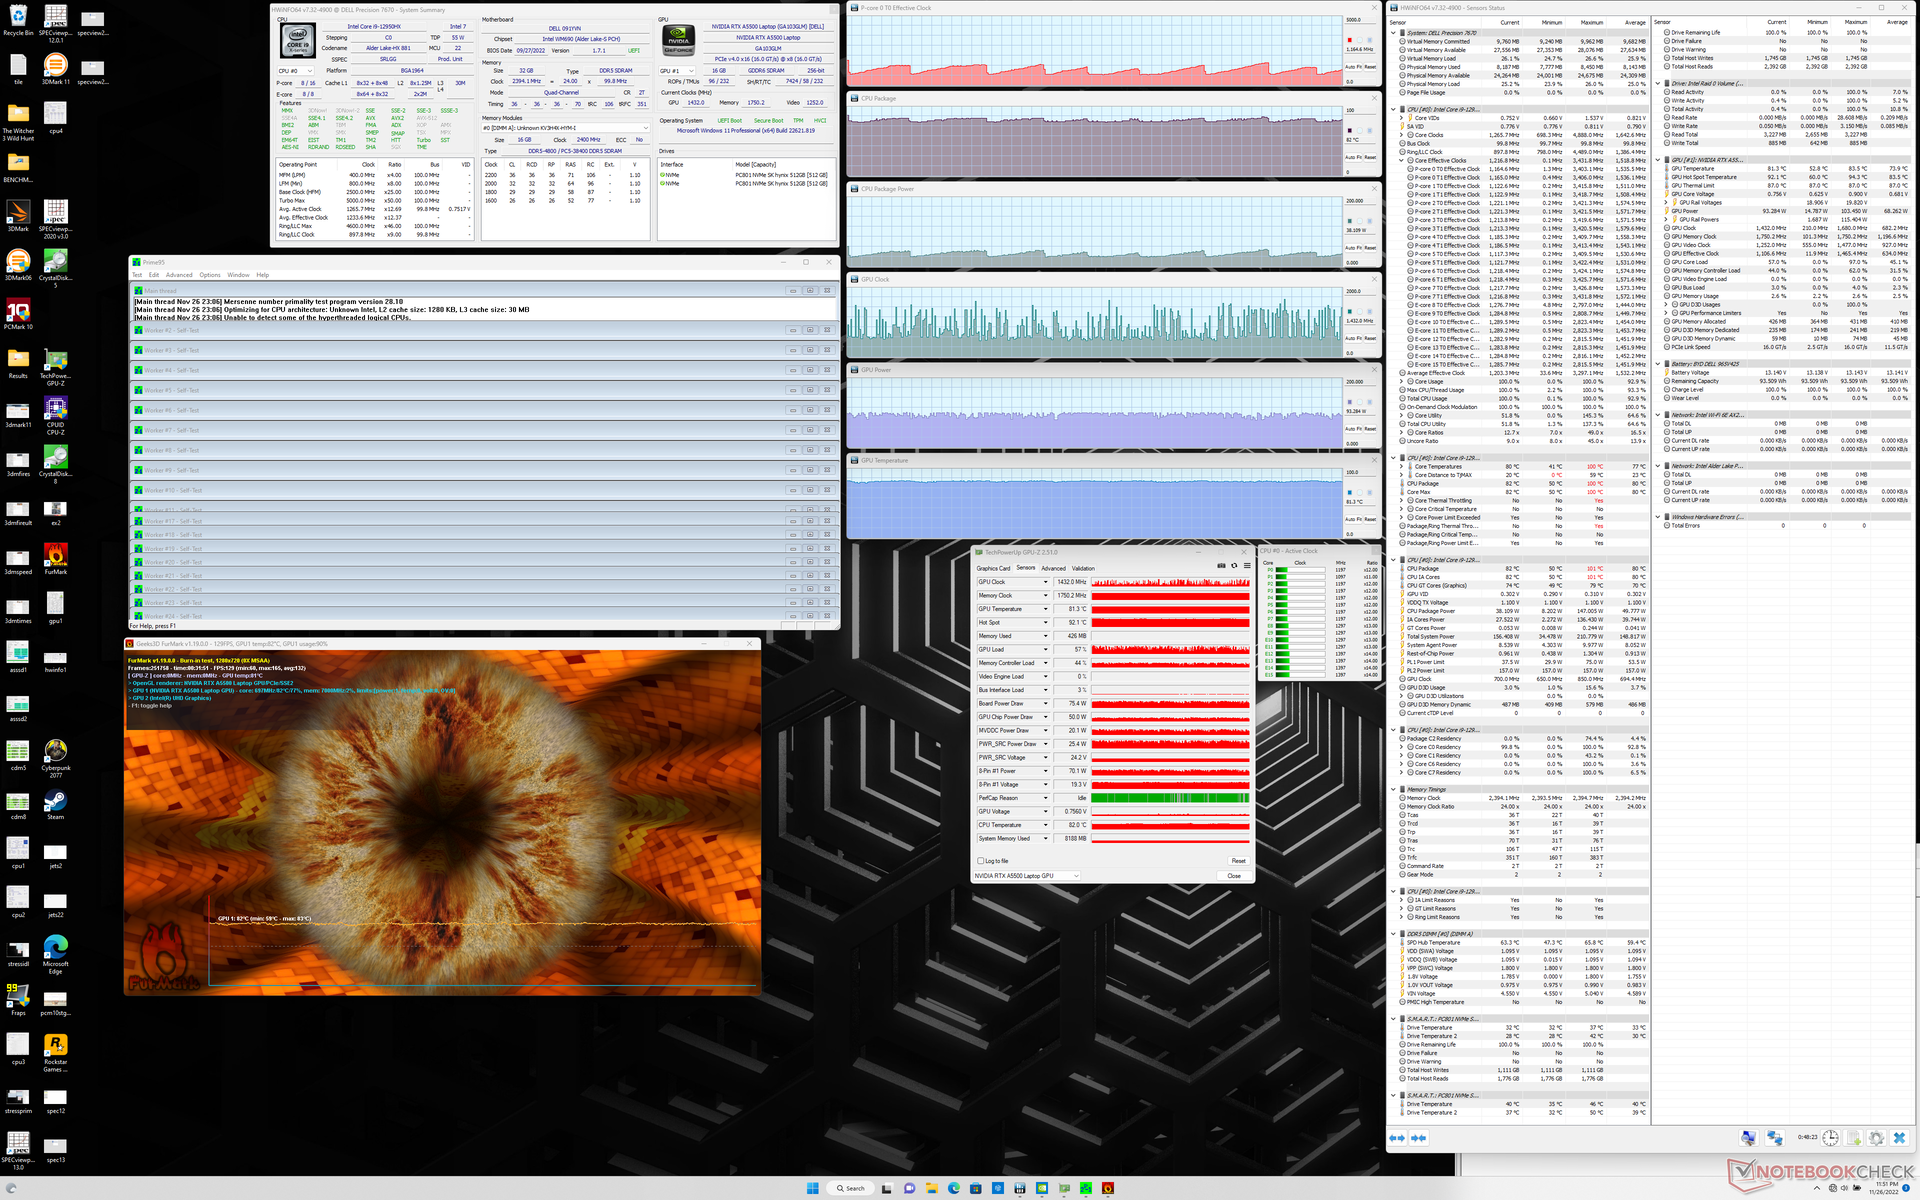
| CPU-klok (GHz) | GPU-klok (MHz) | Gemiddelde CPU-temperatuur (°C) | Gemiddelde GPU-temperatuur (°C) | |
| Systeem Idle | -- | -- | 50 | 53 |
| Prime95 Stress | 2.3 | -- | 78 | 59 |
| Prime95 + FurMark Stress | 0.8 - 1.4 | 500 - 1555 | 79 - 83 | 81 |
| Witcher 3 Stress | 1.1 | 1417 | 77 | 82 |
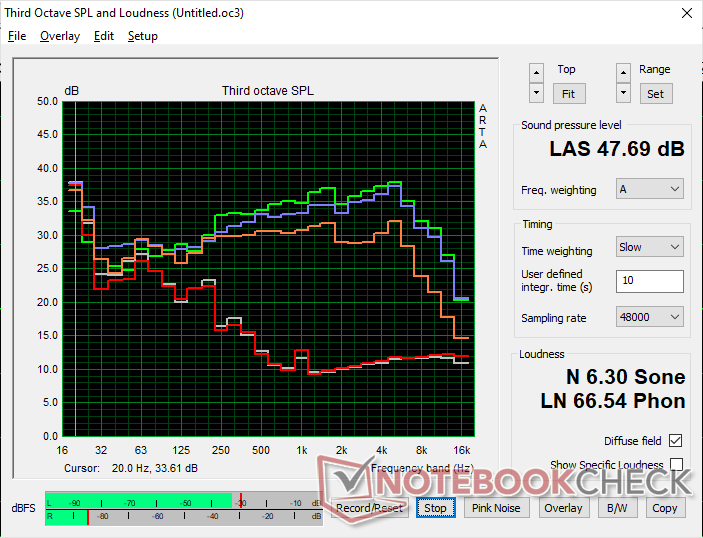
Luidsprekers
Controleer het geluid van de ingebouwde luidsprekers (geluid, ruis, bas, maximaal volume,...) in verschillende muziekgenres / telefonie, vergelijk binnen de apparaatcategorie, speciale functies (software),... Hoe kunnen externe audioapparaten worden aangesloten? Test de geluidsinterfaces waar nodig. Analyseer de roze ruis grafiek.
Korte beoordeling:Analyse luidspreker. ongeveer 250 tekens
Dell Precision 7000 7670 Performance audioanalyse
(+) | luidsprekers kunnen relatief luid spelen (91.1 dB)
Bas 100 - 315 Hz
(-) | bijna geen lage tonen - gemiddeld 15.1% lager dan de mediaan
(±) | lineariteit van de lage tonen is gemiddeld (7.1% delta ten opzichte van de vorige frequentie)
Midden 400 - 2000 Hz
(+) | evenwichtige middens - slechts 2.9% verwijderd van de mediaan
(+) | de middentonen zijn lineair (3.7% delta ten opzichte van de vorige frequentie)
Hoog 2 - 16 kHz
(+) | evenwichtige hoogtepunten - slechts 3.5% verwijderd van de mediaan
(+) | de hoge tonen zijn lineair (1.6% delta naar de vorige frequentie)
Algemeen 100 - 16.000 Hz
(+) | het totale geluid is lineair (10.4% verschil met de mediaan)
Vergeleken met dezelfde klasse
» 6% van alle geteste apparaten in deze klasse waren beter, 6% vergelijkbaar, 88% slechter
» De beste had een delta van 7%, het gemiddelde was 17%, de slechtste was 35%
Vergeleken met alle geteste toestellen
» 5% van alle geteste apparaten waren beter, 1% gelijk, 93% slechter
» De beste had een delta van 4%, het gemiddelde was 23%, de slechtste was 134%
Apple MacBook Pro 16 2021 M1 Pro audioanalyse
(+) | luidsprekers kunnen relatief luid spelen (84.7 dB)
Bas 100 - 315 Hz
(+) | goede baars - slechts 3.8% verwijderd van de mediaan
(+) | de lage tonen zijn lineair (5.2% delta naar de vorige frequentie)
Midden 400 - 2000 Hz
(+) | evenwichtige middens - slechts 1.3% verwijderd van de mediaan
(+) | de middentonen zijn lineair (2.1% delta ten opzichte van de vorige frequentie)
Hoog 2 - 16 kHz
(+) | evenwichtige hoogtepunten - slechts 1.9% verwijderd van de mediaan
(+) | de hoge tonen zijn lineair (2.7% delta naar de vorige frequentie)
Algemeen 100 - 16.000 Hz
(+) | het totale geluid is lineair (4.6% verschil met de mediaan)
Vergeleken met dezelfde klasse
» 0% van alle geteste apparaten in deze klasse waren beter, 0% vergelijkbaar, 100% slechter
» De beste had een delta van 5%, het gemiddelde was 17%, de slechtste was 45%
Vergeleken met alle geteste toestellen
» 0% van alle geteste apparaten waren beter, 0% gelijk, 100% slechter
» De beste had een delta van 4%, het gemiddelde was 23%, de slechtste was 134%
Energiebeheer
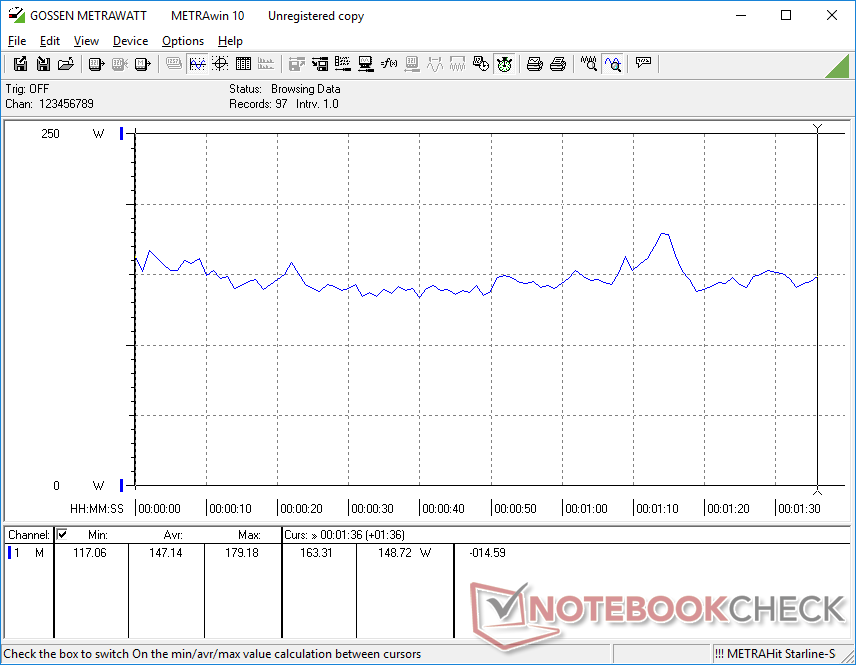
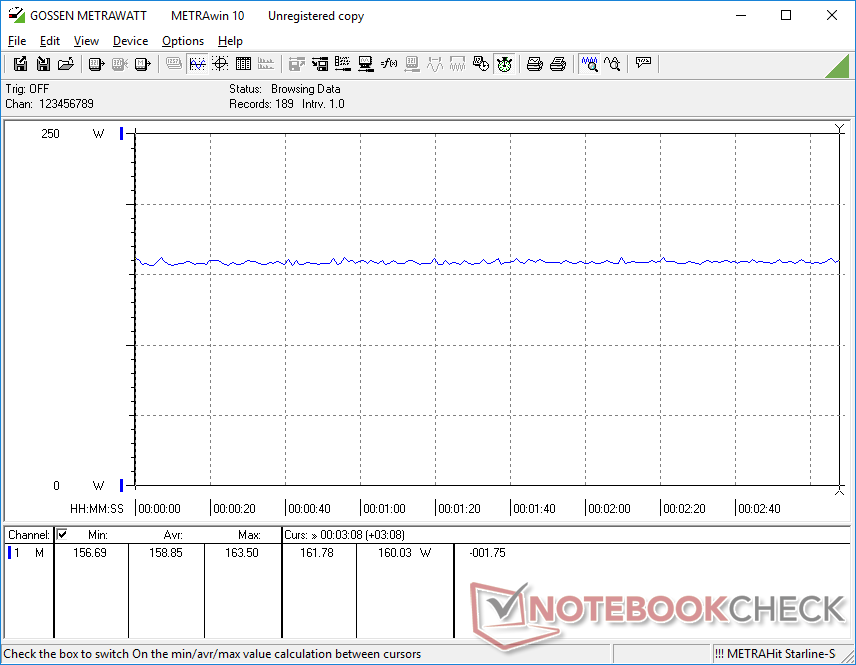
Stroomverbruik
De gewone Precision 7670 is al een energievretende machine en de Precision 7670 Performance is dat nog meer. Gewoon stationair draaien op het bureau vraagt tussen de 16 W en 47 W, afhankelijk van het helderheidsniveau, het energieprofiel en de OLED-kleuren op het scherm. De meeste andere werkstations schommelen in vergelijking rond de 15 W
Bij het uitvoeren van veeleisende belastingen zoals games, zou ons apparaat ongeveer 159 W trekken, vergeleken met 134 W op de gewone Precision 7670. De 19 procent toename in stroomverbruik is relatief klein gezien de 70 tot 80 procent toename in grafisch potentieel ten opzichte van de Quadro A2000
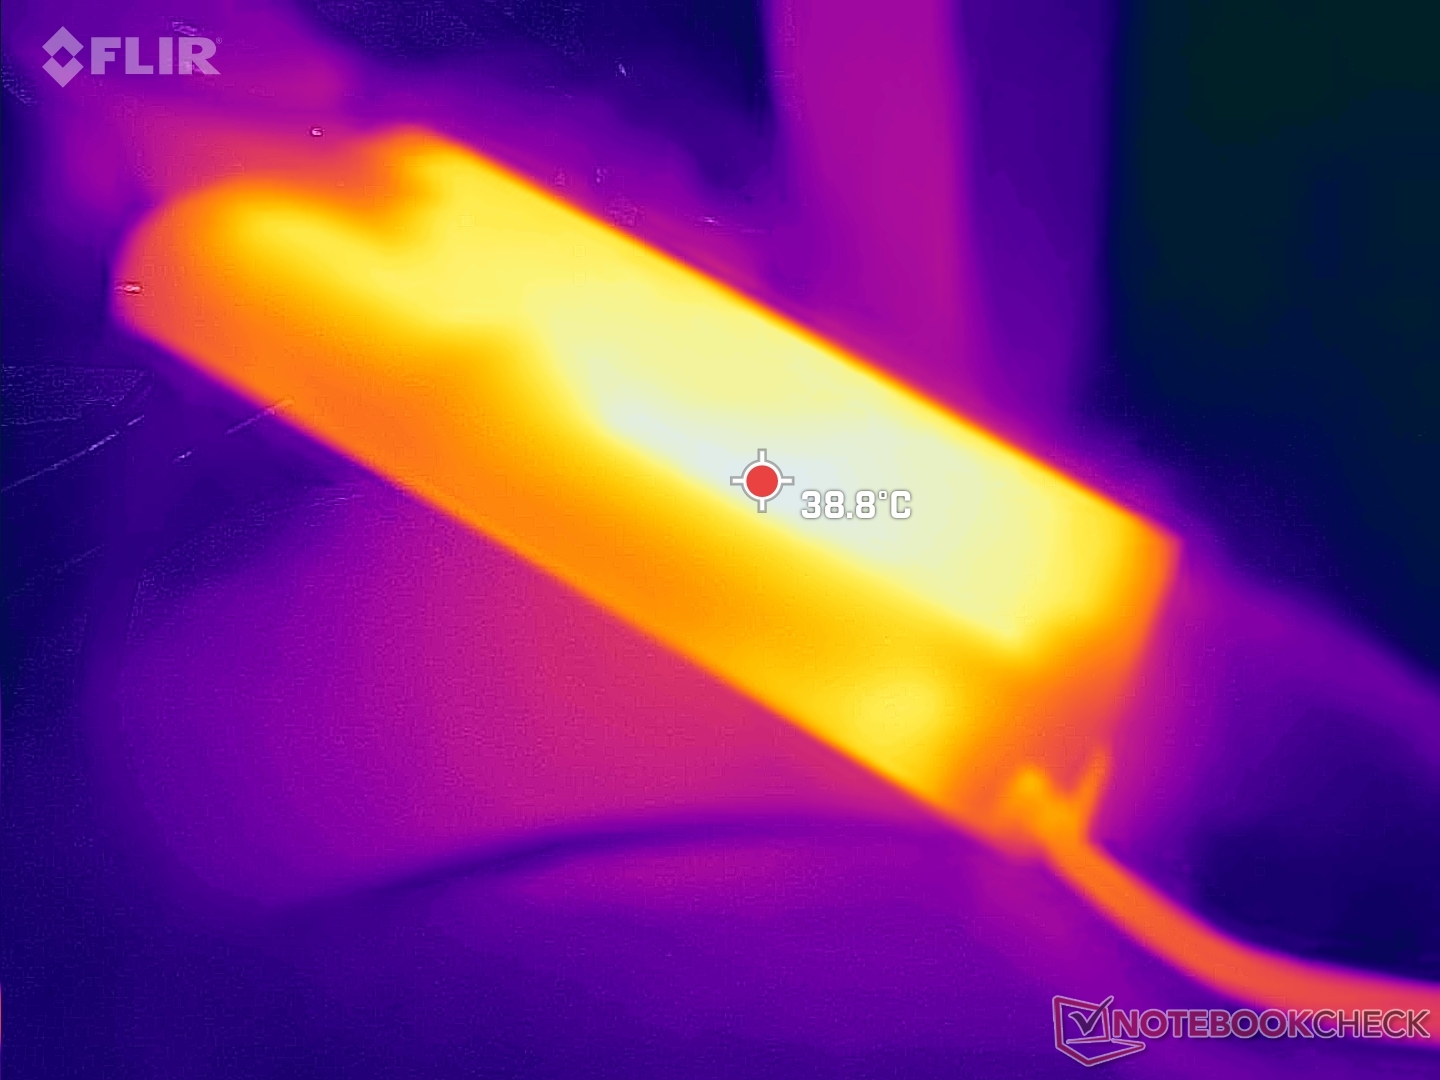
Er wordt een middelgrote (~15,2 x 7,8 x 2,3 cm) 240 W AC-adapter meegeleverd, terwijl de gewone Precision 7670 wordt geleverd met een kleinere 180 W AC-adapter. We zijn in staat om een tijdelijke maximale opname van 311 W van de adapter te registreren wanneer zowel de CPU als de GPU op 100 procent gebruik staan, zoals de screenshots hieronder laten zien. Dit suggereert zowel beperkte Turbo Boost prestaties als een mogelijk te weinig krachtige adapter, gezien de hoge eisen die de internals kunnen stellen.
| Uit / Standby | |
| Inactief | |
| Belasting |
|
Key:
min: | |
| Dell Precision 7000 7670 Performance i9-12950HX, RTX A5500 Laptop GPU, , OLED, 3840x2400, 16" | MSI CreatorPro Z16P B12UKST i7-12700H, RTX A3000 Laptop GPU, Samsung PM9A1 MZVL21T0HCLR, IPS, 2560x1600, 16" | HP ZBook Studio 16 G9 62U04EA i7-12800H, RTX A2000 Laptop GPU, Micron 3400 1TB MTFDKBA1T0TFH, IPS, 3840x2400, 16" | HP ZBook Firefly 16 G9-6B897EA i7-1265U, T550 Laptop GPU, Samsung PM9A1 MZVL21T0HCLR, IPS, 1920x1200, 16" | Lenovo ThinkPad P1 G4-20Y4Z9DVUS i7-11800H, T1200 Laptop GPU, Samsung PM9A1 MZVL2512HCJQ, IPS, 2560x1600, 16" | Dell Precision 7670 i7-12850HX, RTX A2000 Laptop GPU, SK Hynix HFS001TEJ9X115N, OLED, 3840x2400, 16" | MSI WE76 11UM-456 i9-11980HK, RTX A5000 Laptop GPU, Samsung PM9A1 MZVL22T0HBLB, IPS, 3840x2160, 17.3" | |
|---|---|---|---|---|---|---|---|
| Power Consumption | 37% | 44% | 73% | 48% | 36% | 19% | |
| Idle Minimum * (Watt) | 16.4 | 10.8 34% | 7.2 56% | 4.5 73% | 9.9 40% | 7.5 54% | 10.5 36% |
| Idle Average * (Watt) | 35.9 | 16.3 55% | 18.1 50% | 8 78% | 13.9 61% | 9.5 74% | 18.6 48% |
| Idle Maximum * (Watt) | 47 | 16.9 64% | 18.5 61% | 8.7 81% | 14.6 69% | 28.4 40% | 20 57% |
| Load Average * (Watt) | 147.1 | 111.7 24% | 112.8 23% | 48.3 67% | 95 35% | 139.1 5% | 132.4 10% |
| Witcher 3 ultra * (Watt) | 158.8 | 152.1 4% | 106.7 33% | 45.3 71% | 98.9 38% | 134 16% | 232 -46% |
| Load Maximum * (Watt) | 311 | 177.4 43% | 186 40% | 94.7 70% | 170.8 45% | 220.8 29% | 281.6 9% |
* ... kleiner is beter
Power Consumption Witcher 3 / Stresstest
Power Consumption external Monitor
Levensduur van de batterij
De batterijcapaciteit is deze keer iets groter met 93 Wh vergeleken met 83 Wh op de slankere Precision 7670. Desondanks is de WLAN-looptijd bijna een uur korter op ons Performance-model als gevolg van de krachtigere internals.
Opladen van leeg naar vol blijft traag met ongeveer 2,5 uur.
| Dell Precision 7000 7670 Performance i9-12950HX, RTX A5500 Laptop GPU, 93 Wh | MSI CreatorPro Z16P B12UKST i7-12700H, RTX A3000 Laptop GPU, 90 Wh | HP ZBook Studio 16 G9 62U04EA i7-12800H, RTX A2000 Laptop GPU, 86 Wh | HP ZBook Firefly 16 G9-6B897EA i7-1265U, T550 Laptop GPU, 76 Wh | Lenovo ThinkPad P1 G4-20Y4Z9DVUS i7-11800H, T1200 Laptop GPU, 90 Wh | Dell Precision 7670 i7-12850HX, RTX A2000 Laptop GPU, 83 Wh | |
|---|---|---|---|---|---|---|
| Batterijduur | 23% | 34% | 177% | 87% | 26% | |
| WiFi v1.3 (h) | 4.7 | 5.8 23% | 6.3 34% | 13 177% | 8.8 87% | 5.9 26% |
| H.264 (h) | 8.5 | 18.4 | ||||
| Load (h) | 1.1 | 2 | 1.3 | |||
| Reader / Idle (h) | 7.9 |
Pro
Contra
Verdict
De Precision 7670 Performance is net iets dikker en zwaarder dan de standaard Precision 7670, maar het biedt ruwweg 10 procent en 80 procent snellere CPU en GPU prestaties, respectievelijk, dan het standaard model indien geconfigureerd met de hoogste processor opties. Als u niet van plan bent vooral de GPU-voordelen te benutten, dan is er weinig reden om het Performance-model te bezitten boven het standaardmodel, aangezien de andere voordelen relatief klein zijn.
De Precision 7670 Performance levert als het gaat om high-end processoropties en functies. Toch zijn de beperkte Turbo Boost mogelijkheden, hoge kerntemperaturen en DPC latentie problemen enigszins teleurstellend om te zien.
Er is veel ruimte voor verbetering wat betreft de algemene prestaties. Ondanks dat dit het dikkere Performance model is, zijn de kerntemperaturen niet beter dan op het standaard model. Bijgevolg duurt CPU Turbo Boost veel korter dan verwacht, wat het enthousiaste doelpubliek misschien niet op prijs zal stellen. De hoge DPC-latenties, ongelijke WiFi-prestaties, hoog stationair stroomverbruik en te kleine AC-adapter zijn andere problemen die helemaal niet zouden mogen voorkomen op een professioneel werkstation als dit.
Prijs en beschikbaarheid
Dell levert nu de Precision 7670 Performance vanaf $5300 USD voor de basisconfiguratie tot meer dan $7000 USD wanneer geconfigureerd met dezelfde CPU en GPU als onze testunit.
Dell Precision 7000 7670 Performance
- 03-12-2022 v7 (old)
Allen Ngo
Price comparison

