Kort testrapport Acer ConceptD 9 Pro: werkstation convertible voor creatieve professionals
Evaluatie | Datum | Model | Gewicht | Hoogte | Formaat | Resolutie | Beste prijs |
|---|---|---|---|---|---|---|---|
| 86.2 % v7 (old) | 03-2020 | Acer ConceptD 9 Pro i9-9980HK, Quadro RTX 5000 (Laptop) | 4.5 kg | 26.5 mm | 17.30" | 3840x2160 | |
| 86.6 % v7 (old) | Lenovo ThinkPad P73-20QR002DGE i7-9850H, Quadro RTX 3000 (Laptop) | 3.5 kg | 31 mm | 17.30" | 1920x1080 | ||
| 84.8 % v7 (old) | 12-2019 | MSI WE75 9TK i7-9750H, Quadro RTX 3000 (Laptop) | 2.6 kg | 27.5 mm | 17.30" | 1920x1080 | |
| 85.7 % v7 (old) | Dell Precision 7730 i7-8850H, Quadro P3200 | 3.3 kg | 30 mm | 17.30" | 1920x1080 | ||
| 86.3 % v6 (old) | 12-2018 | Eurocom Tornado F7W i9-9900K, Quadro P5200 | 4.2 kg | 51 mm | 17.30" | 3840x2160 | |
| 84.6 % v7 (old) | 02-2019 | Fujitsu Celsius H980 i7-8750H, Quadro P3200 | 3.5 kg | 30 mm | 17.30" | 1920x1080 |


| Networking | |
| iperf3 transmit AX12 | |
| Acer ConceptD 9 Pro | |
| Dell Precision 7730 | |
| Lenovo ThinkPad P73-20QR002DGE | |
| Fujitsu Celsius H980 | |
| Eurocom Tornado F7W | |
| iperf3 receive AX12 | |
| Acer ConceptD 9 Pro | |
| Fujitsu Celsius H980 | |
| Eurocom Tornado F7W | |
| Dell Precision 7730 | |
| Lenovo ThinkPad P73-20QR002DGE | |

, i9-9980HK, WDC PC SN720 SDAQNTW-1T00")
, i9-9980HK, WDC PC SN720 SDAQNTW-1T00")
| |||||||||||||||||||||||||
Helderheidsverdeling: 83 %
Helderheid in Batterij-modus: 381 cd/m²
Contrast: 1019:1 (Zwart: 0.37 cd/m²)
ΔE ColorChecker Calman: 2.52 | ∀{0.5-29.43 Ø4.73}
calibrated: 1.08
ΔE Greyscale Calman: 3.83 | ∀{0.09-98 Ø4.97}
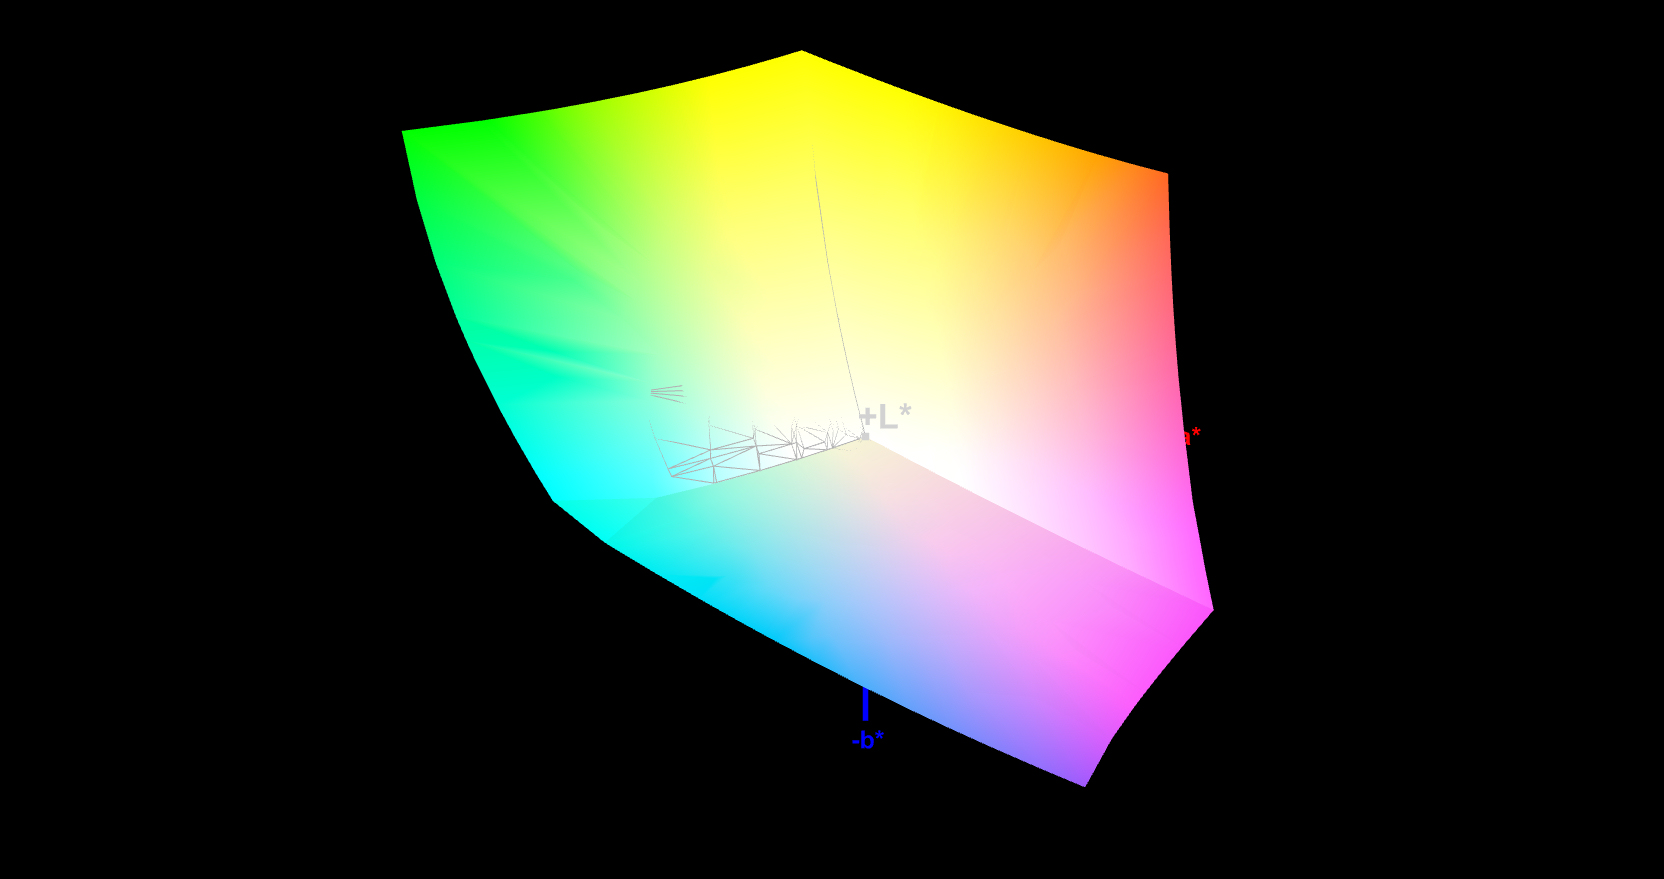
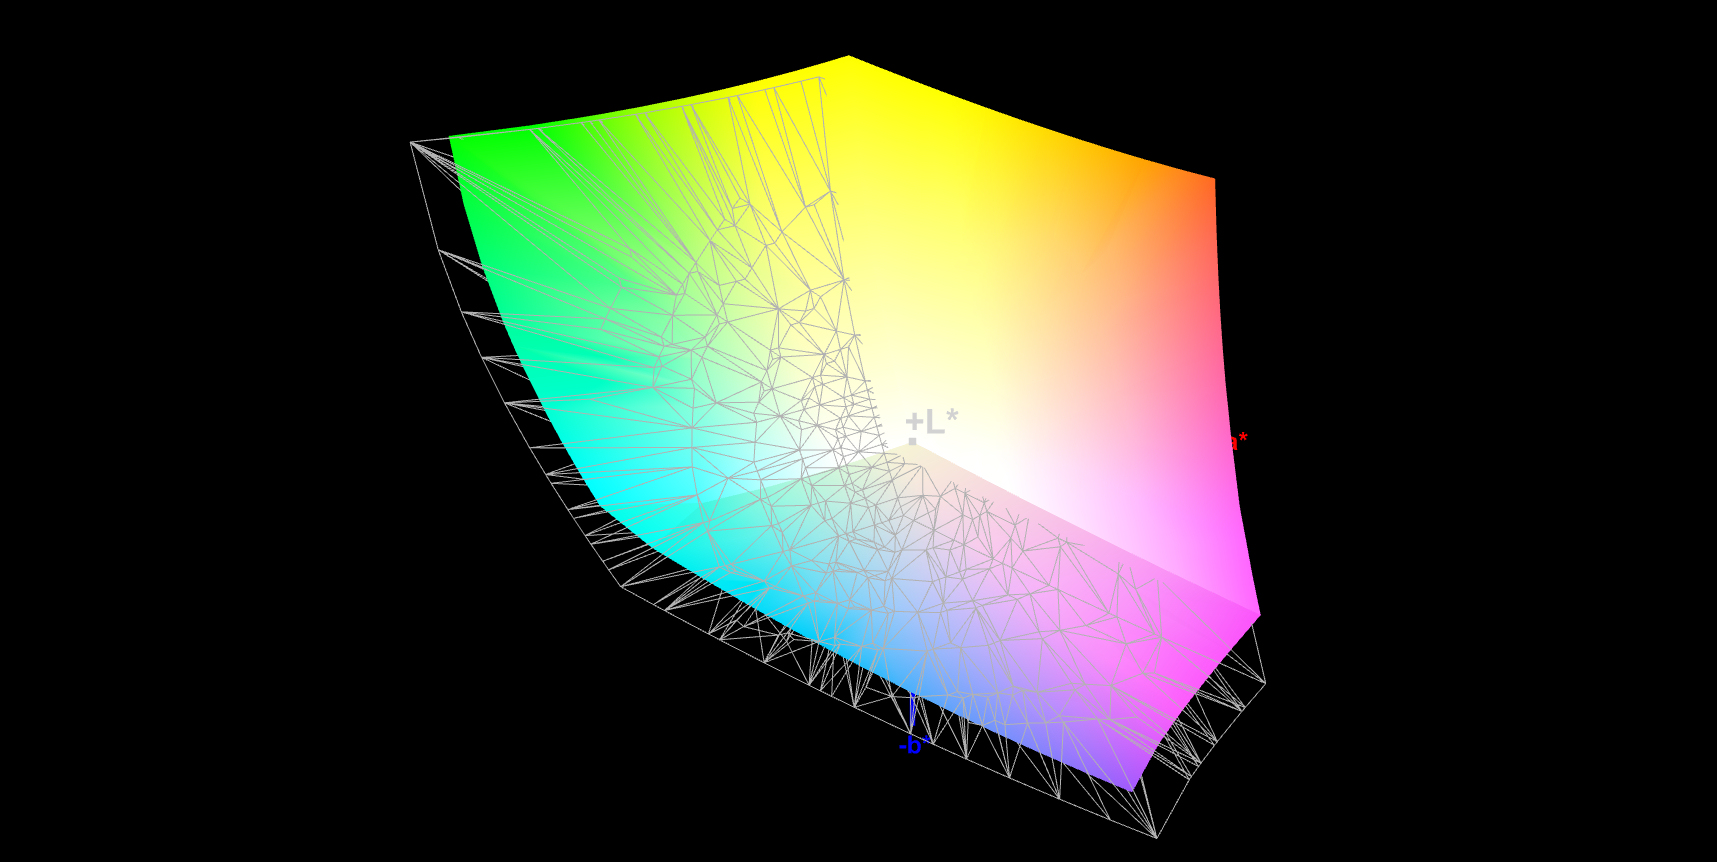
98% sRGB (Argyll 1.6.3 3D)
84% AdobeRGB 1998 (Argyll 1.6.3 3D)
95.1% AdobeRGB 1998 (Argyll 3D)
97.9% sRGB (Argyll 3D)
80.9% Display P3 (Argyll 3D)
Gamma: 2.19
CCT: 6323 K
| Acer ConceptD 9 Pro IPS, 3840x2160, 17.3" | Lenovo ThinkPad P73-20QR002DGE IPS LED, 1920x1080, 17.3" | MSI WE75 9TK IPS, 1920x1080, 17.3" | Dell Precision 7730 IPS LED, 1920x1080, 17.3" | Eurocom Tornado F7W IPS, 3840x2160, 17.3" | Fujitsu Celsius H980 IPS, 1920x1080, 17.3" | |
|---|---|---|---|---|---|---|
| Display | -17% | -21% | -18% | 4% | -22% | |
| Display P3 Coverage (%) | 80.9 | 67.5 -17% | 63.2 -22% | 65 -20% | 85.9 6% | 67.3 -17% |
| sRGB Coverage (%) | 97.9 | 94.2 -4% | 89.9 -8% | 93.4 -5% | 100 2% | 85 -13% |
| AdobeRGB 1998 Coverage (%) | 95.1 | 67.8 -29% | 64.3 -32% | 66.3 -30% | 98.3 3% | 62.2 -35% |
| Response Times | 25% | 29% | 10% | 20% | 33% | |
| Response Time Grey 50% / Grey 80% * (ms) | 53 ? | 40 ? 25% | 30.8 ? 42% | 48.8 ? 8% | 40 ? 25% | 38 ? 28% |
| Response Time Black / White * (ms) | 37 ? | 28 ? 24% | 31.2 ? 16% | 32.8 ? 11% | 31.6 ? 15% | 23.2 ? 37% |
| PWM Frequency (Hz) | 25000 ? | 120500 ? | ||||
| Screen | -28% | -19% | 2% | -54% | -51% | |
| Brightness middle (cd/m²) | 377 | 333 -12% | 287.3 -24% | 322 -15% | 328.2 -13% | 400 6% |
| Brightness (cd/m²) | 368 | 310 -16% | 280 -24% | 316 -14% | 310 -16% | 394 7% |
| Brightness Distribution (%) | 83 | 83 0% | 89 7% | 84 1% | 92 11% | 92 11% |
| Black Level * (cd/m²) | 0.37 | 0.39 -5% | 0.26 30% | 0.24 35% | 0.37 -0% | 0.51 -38% |
| Contrast (:1) | 1019 | 854 -16% | 1105 8% | 1342 32% | 887 -13% | 784 -23% |
| Colorchecker dE 2000 * | 2.52 | 4.4 -75% | 2.98 -18% | 2.2 13% | 6.62 -163% | 5.3 -110% |
| Colorchecker dE 2000 max. * | 5.55 | 7.5 -35% | 5.08 8% | 4.6 17% | 9.49 -71% | 9.3 -68% |
| Colorchecker dE 2000 calibrated * | 1.08 | 2 -85% | 3.06 -183% | 1.9 -76% | 3.93 -264% | 3.8 -252% |
| Greyscale dE 2000 * | 3.83 | 5.1 -33% | 3 22% | 1.6 58% | 6.7 -75% | 5.5 -44% |
| Gamma | 2.19 100% | 2.39 92% | 2.28 96% | 2.19 100% | 2.44 90% | 2.17 101% |
| CCT | 6323 103% | 7061 92% | 6993 93% | 6621 98% | 6462 101% | 6686 97% |
| Color Space (Percent of AdobeRGB 1998) (%) | 84 | 61.1 -27% | 58.1 -31% | 60.4 -28% | 87.9 5% | 55.8 -34% |
| Color Space (Percent of sRGB) (%) | 98 | 94 -4% | 89.5 -9% | 93.3 -5% | 100 2% | 84.9 -13% |
| Totaal Gemiddelde (Programma / Instellingen) | -7% /
-19% | -4% /
-14% | -2% /
-1% | -10% /
-34% | -13% /
-35% |
* ... kleiner is beter
Responstijd Scherm
| ↔ Responstijd Zwart naar Wit | ||
|---|---|---|
| 37 ms ... stijging ↗ en daling ↘ gecombineerd | ↗ 21 ms stijging | 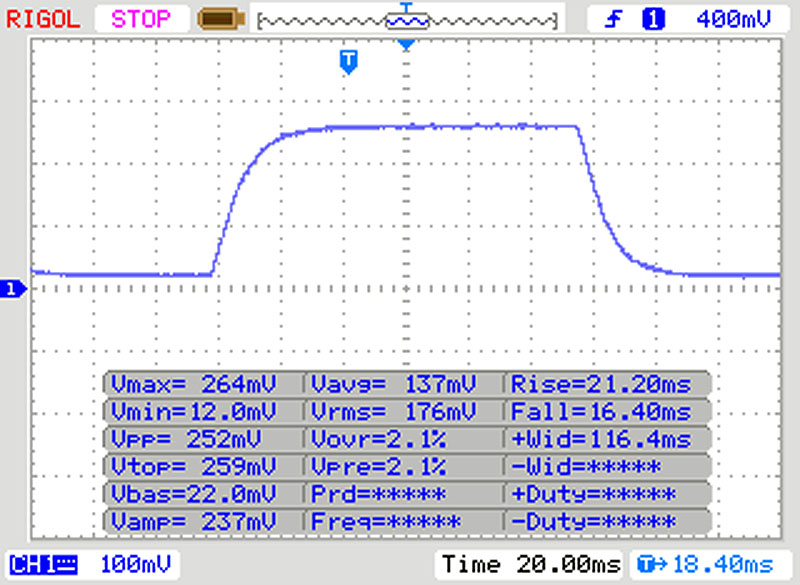 |
| ↘ 16 ms daling | ||
| Het scherm vertoonde trage responstijden in onze tests en is misschien te traag voor games. Ter vergelijking: alle testtoestellen variëren van 0.1 (minimum) tot 240 (maximum) ms. » 95 % van alle toestellen zijn beter. Dit betekent dat de gemeten responstijd slechter is dan het gemiddelde (19.9 ms) van alle geteste toestellen. | ||
| ↔ Responstijd 50% Grijs naar 80% Grijs | ||
| 53 ms ... stijging ↗ en daling ↘ gecombineerd | ↗ 27 ms stijging | 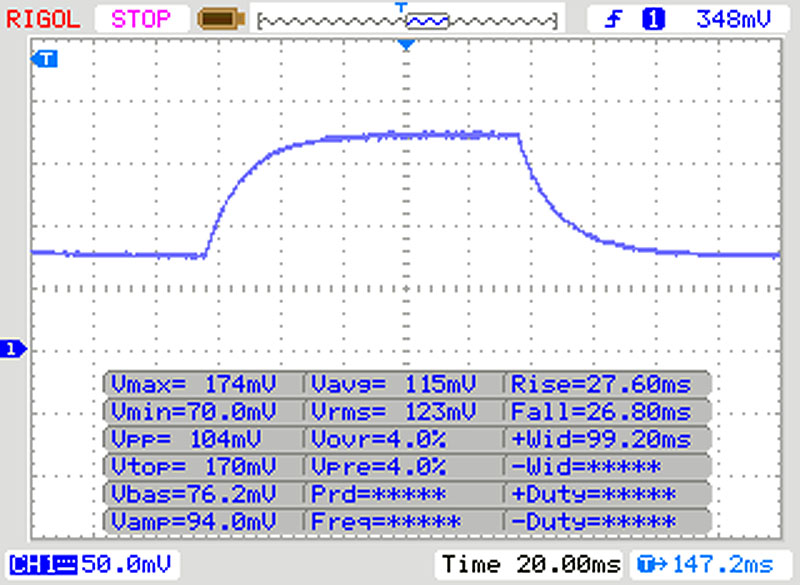 |
| ↘ 26 ms daling | ||
| Het scherm vertoonde trage responstijden in onze tests en is misschien te traag voor games. Ter vergelijking: alle testtoestellen variëren van 0.165 (minimum) tot 636 (maximum) ms. » 90 % van alle toestellen zijn beter. Dit betekent dat de gemeten responstijd slechter is dan het gemiddelde (31.1 ms) van alle geteste toestellen. | ||
Screen Flickering / PWM (Pulse-Width Modulation)
| Screen flickering / PWM niet waargenomen |  | ||
Ter vergelijking: 52 % van alle geteste toestellen maakten geen gebruik van PWM om de schermhelderheid te verlagen. Als het wel werd gebruikt, werd een gemiddelde van 7791 (minimum: 5 - maximum: 343500) Hz waargenomen. | |||
| Cinebench R15 | |
| CPU Single 64Bit | |
| Gemiddelde van klas Workstation (191.4 - 328, n=25, laatste 2 jaar) | |
| Eurocom Tornado F7W | |
| Acer ConceptD 9 Pro | |
| Gemiddeld Intel Core i9-9980HK (181 - 215, n=13) | |
| Lenovo ThinkPad P73-20QR002DGE | |
| MSI WE75 9TK | |
| Dell Precision 7730 | |
| Fujitsu Celsius H980 | |
| CPU Multi 64Bit | |
| Gemiddelde van klas Workstation (2489 - 5810, n=25, laatste 2 jaar) | |
| Gemiddeld Intel Core i9-9980HK (1327 - 1930, n=14) | |
| Eurocom Tornado F7W | |
| Acer ConceptD 9 Pro | |
| Dell Precision 7730 | |
| Lenovo ThinkPad P73-20QR002DGE | |
| MSI WE75 9TK | |
| Fujitsu Celsius H980 | |
| Cinebench R10 | |
| Rendering Single 32Bit | |
| Gemiddelde van klas Workstation (n=1laatste 2 jaar) | |
| Gemiddeld Intel Core i9-9980HK (7709 - 9734, n=4) | |
| Eurocom Tornado F7W | |
| Acer ConceptD 9 Pro | |
| Fujitsu Celsius H980 | |
| Rendering Multiple CPUs 32Bit | |
| Gemiddelde van klas Workstation (n=1laatste 2 jaar) | |
| Gemiddeld Intel Core i9-9980HK (39440 - 50439, n=4) | |
| Acer ConceptD 9 Pro | |
| Eurocom Tornado F7W | |
| Fujitsu Celsius H980 | |
| Cinebench R20 | |
| CPU (Single Core) | |
| Gemiddelde van klas Workstation (671 - 857, n=25, laatste 2 jaar) | |
| Acer ConceptD 9 Pro | |
| Gemiddeld Intel Core i9-9980HK (431 - 505, n=10) | |
| MSI WE75 9TK | |
| Lenovo ThinkPad P73-20QR002DGE | |
| Dell Precision 7730 | |
| CPU (Multi Core) | |
| Gemiddelde van klas Workstation (5471 - 15043, n=25, laatste 2 jaar) | |
| Gemiddeld Intel Core i9-9980HK (2974 - 4150, n=10) | |
| Acer ConceptD 9 Pro | |
| Dell Precision 7730 | |
| MSI WE75 9TK | |
| Lenovo ThinkPad P73-20QR002DGE | |
| Geekbench 3 | |
| 32 Bit Multi-Core Score | |
| Acer ConceptD 9 Pro | |
| Gemiddeld Intel Core i9-9980HK (n=1) | |
| 32 Bit Single-Core Score | |
| Acer ConceptD 9 Pro | |
| Gemiddeld Intel Core i9-9980HK (n=1) | |
| Geekbench 4.4 | |
| 64 Bit Multi-Core Score | |
| Gemiddelde van klas Workstation (n=1laatste 2 jaar) | |
| Acer ConceptD 9 Pro | |
| Gemiddeld Intel Core i9-9980HK (28625 - 30849, n=3) | |
| Eurocom Tornado F7W | |
| Lenovo ThinkPad P73-20QR002DGE | |
| Dell Precision 7730 | |
| 64 Bit Single-Core Score | |
| Gemiddelde van klas Workstation (n=1laatste 2 jaar) | |
| Eurocom Tornado F7W | |
| Acer ConceptD 9 Pro | |
| Gemiddeld Intel Core i9-9980HK (5617 - 5972, n=3) | |
| Lenovo ThinkPad P73-20QR002DGE | |
| Dell Precision 7730 | |
| Geekbench 5.0 | |
| 5.0 Multi-Core | |
| Gemiddelde van klas Workstation (n=1laatste 2 jaar) | |
| Acer ConceptD 9 Pro | |
| Gemiddeld Intel Core i9-9980HK (7072 - 7805, n=4) | |
| Lenovo ThinkPad P73-20QR002DGE | |
| 5.0 Single-Core | |
| Gemiddelde van klas Workstation (n=1laatste 2 jaar) | |
| Acer ConceptD 9 Pro | |
| Gemiddeld Intel Core i9-9980HK (1171 - 1355, n=4) | |
| Lenovo ThinkPad P73-20QR002DGE | |
| Mozilla Kraken 1.1 - Total | |
| Fujitsu Celsius H980 (EDGE: 42.17134.1.0) | |
| Dell Precision 7730 (Edge) | |
| MSI WE75 9TK (Edge 44.17763.831.0) | |
| MSI WE75 9TK | |
| Lenovo ThinkPad P73-20QR002DGE (Edge) | |
| Acer ConceptD 9 Pro (Edge 44) | |
| Gemiddeld Intel Core i9-9980HK (705 - 999, n=9) | |
| Gemiddelde van klas Workstation (411 - 538, n=25, laatste 2 jaar) | |
| Octane V2 - Total Score | |
| Gemiddelde van klas Workstation (92715 - 129420, n=4, laatste 2 jaar) | |
| Gemiddeld Intel Core i9-9980HK (40364 - 46473, n=8) | |
| Acer ConceptD 9 Pro (Edge 44) | |
| Lenovo ThinkPad P73-20QR002DGE (Edge) | |
| MSI WE75 9TK (Edge 44.17763.831.0) | |
| Dell Precision 7730 (Edge) | |
| Fujitsu Celsius H980 (EDGE: 42.17134.1.0) | |
| JetStream 1.1 - 1.1 Total | |
| Eurocom Tornado F7W (Edge 42.17134.1.0) | |
| Acer ConceptD 9 Pro (Edge 44) | |
| Gemiddeld Intel Core i9-9980HK (257 - 318, n=8) | |
| MSI WE75 9TK (Edge 44.17763.831.0) | |
| Fujitsu Celsius H980 (EDGE: 42.17134.1.0) | |
* ... kleiner is beter
| PCMark 8 Home Score Accelerated v2 | 4487 punten | |
| PCMark 8 Creative Score Accelerated v2 | 6412 punten | |
| PCMark 8 Work Score Accelerated v2 | 4884 punten | |
| PCMark 10 Score | 6939 punten | |
Help | ||
| PCMark 8 | |
| Home Score Accelerated v2 | |
| Eurocom Tornado F7W | |
| Dell Precision 7730 | |
| Acer ConceptD 9 Pro | |
| Gemiddeld Intel Core i9-9980HK, NVIDIA Quadro RTX 5000 (Laptop) (n=1) | |
| Fujitsu Celsius H980 | |
| MSI WE75 9TK | |
| Lenovo ThinkPad P73-20QR002DGE | |
| Work Score Accelerated v2 | |
| MSI WE75 9TK | |
| Dell Precision 7730 | |
| Lenovo ThinkPad P73-20QR002DGE | |
| Fujitsu Celsius H980 | |
| Acer ConceptD 9 Pro | |
| Gemiddeld Intel Core i9-9980HK, NVIDIA Quadro RTX 5000 (Laptop) (n=1) | |

| Acer ConceptD 9 Pro WDC PC SN720 SDAQNTW-1T00 | Lenovo ThinkPad P73-20QR002DGE Intel SSD Pro 7600p SSDPEKKF512G8L | MSI WE75 9TK Samsung SSD PM981 MZVLB512HAJQ | Dell Precision 7730 Samsung SSD PM981 MZVLB512HAJQ | Eurocom Tornado F7W 3x Samsung SSD 970 Pro 512GB (RAID 0) | Fujitsu Celsius H980 Samsung SSD PM981 MZVLB512HAJQ | Gemiddeld WDC PC SN720 SDAQNTW-1T00 | |
|---|---|---|---|---|---|---|---|
| CrystalDiskMark 5.2 / 6 | -6% | -3% | -24% | 2% | -30% | -3% | |
| Write 4K (MB/s) | 176 | 154.3 -12% | 135.4 -23% | 103.2 -41% | 116.3 -34% | 111.8 -36% | 168.6 ? -4% |
| Read 4K (MB/s) | 48.06 | 66.4 38% | 56.6 18% | 41.39 -14% | 52.7 10% | 32.02 -33% | 47.6 ? -1% |
| Write Seq (MB/s) | 2736 | 1561 -43% | 1972 -28% | 1880 -31% | 2539 -7% | 1539 -44% | 2602 ? -5% |
| Read Seq (MB/s) | 2381 | 2460 3% | 2101 -12% | 2350 -1% | 2972 25% | 1252 -47% | 2084 ? -12% |
| Write 4K Q32T1 (MB/s) | 418.6 | 438 5% | 527 26% | 282.3 -33% | 454.6 9% | 355.4 -15% | 391 ? -7% |
| Read 4K Q32T1 (MB/s) | 460.8 | 568 23% | 578 25% | 314.3 -32% | 515 12% | 408.7 -11% | 481 ? 4% |
| Write Seq Q32T1 (MB/s) | 2791 | 1581 -43% | 1985 -29% | 1881 -33% | 3101 11% | 1913 -31% | 2792 ? 0% |
| Read Seq Q32T1 (MB/s) | 3430 | 2724 -21% | 3358 -2% | 3216 -6% | 3078 -10% | 2530 -26% | 3377 ? -2% |
| 3DMark 06 Standard Score | 45180 punten | |
| 3DMark 11 Performance | 26416 punten | |
| 3DMark Ice Storm Standard Score | 184872 punten | |
| 3DMark Cloud Gate Standard Score | 44296 punten | |
| 3DMark Fire Strike Score | 20374 punten | |
| 3DMark Time Spy Score | 9779 punten | |
Help | ||
| 3DMark 11 - 1280x720 Performance GPU | |
| Gemiddelde van klas Workstation (10888 - 69594, n=25, laatste 2 jaar) | |
| Acer ConceptD 9 Pro | |
| Razer Blade 15 Studio Edition | |
| Gemiddeld NVIDIA Quadro RTX 5000 (Laptop) (18233 - 32999, n=5) | |
| Eurocom Tornado F7W | |
| Lenovo ThinkPad P53-20QN000YGE | |
| MSI WE75 9TK | |
| Lenovo ThinkPad P73-20QR002DGE | |
| Fujitsu Celsius H980 | |
| Dell Precision 7730 | |
| GFXBench (DX / GLBenchmark) 2.7 | |
| 1920x1080 T-Rex Offscreen | |
| Acer ConceptD 9 Pro | |
| Gemiddeld NVIDIA Quadro RTX 5000 (Laptop) (n=1) | |
| Razer Blade 15 Studio Edition | |
| Lenovo ThinkPad P53-20QN000YGE | |
| Gemiddelde van klas Workstation (497 - 2251, n=6, laatste 2 jaar) | |
| Lenovo ThinkPad P73-20QR002DGE | |
| T-Rex Onscreen | |
| Acer ConceptD 9 Pro | |
| Gemiddeld NVIDIA Quadro RTX 5000 (Laptop) (n=1) | |
| Razer Blade 15 Studio Edition | |
| Gemiddelde van klas Workstation (59 - 1303, n=6, laatste 2 jaar) | |
| Lenovo ThinkPad P53-20QN000YGE | |
| Lenovo ThinkPad P73-20QR002DGE | |
| GFXBench 3.0 | |
| 1920x1080 1080p Manhattan Offscreen | |
| Acer ConceptD 9 Pro | |
| Gemiddeld NVIDIA Quadro RTX 5000 (Laptop) (n=1) | |
| Razer Blade 15 Studio Edition | |
| Gemiddelde van klas Workstation (309 - 756, n=6, laatste 2 jaar) | |
| Lenovo ThinkPad P53-20QN000YGE | |
| Lenovo ThinkPad P73-20QR002DGE | |
| on screen Manhattan Onscreen OGL | |
| Razer Blade 15 Studio Edition | |
| Acer ConceptD 9 Pro | |
| Gemiddeld NVIDIA Quadro RTX 5000 (Laptop) (n=1) | |
| Gemiddelde van klas Workstation (59 - 703, n=6, laatste 2 jaar) | |
| Lenovo ThinkPad P53-20QN000YGE | |
| Lenovo ThinkPad P73-20QR002DGE | |
| GFXBench 3.1 | |
| 1920x1080 Manhattan ES 3.1 Offscreen | |
| Acer ConceptD 9 Pro | |
| Gemiddeld NVIDIA Quadro RTX 5000 (Laptop) (n=1) | |
| Razer Blade 15 Studio Edition | |
| Lenovo ThinkPad P53-20QN000YGE | |
| Lenovo ThinkPad P73-20QR002DGE | |
| Gemiddelde van klas Workstation (225 - 595, n=6, laatste 2 jaar) | |
| on screen Manhattan ES 3.1 Onscreen | |
| Razer Blade 15 Studio Edition | |
| Gemiddelde van klas Workstation (59 - 563, n=6, laatste 2 jaar) | |
| Acer ConceptD 9 Pro | |
| Gemiddeld NVIDIA Quadro RTX 5000 (Laptop) (n=1) | |
| Lenovo ThinkPad P53-20QN000YGE | |
| Lenovo ThinkPad P73-20QR002DGE | |
| LuxMark v2.0 64Bit | |
| Room GPUs-only | |
| Gemiddelde van klas Workstation (1760 - 6990, n=4, laatste 2 jaar) | |
| Acer ConceptD 9 Pro | |
| Gemiddeld NVIDIA Quadro RTX 5000 (Laptop) (n=1) | |
| Lenovo ThinkPad P73-20QR002DGE | |
| Eurocom Tornado F7W | |
| Dell Precision 7730 | |
| Fujitsu Celsius H980 | |
| Razer Blade 15 Studio Edition | |
| Lenovo ThinkPad P53-20QN000YGE | |
| Sala GPUs-only | |
| Gemiddelde van klas Workstation (5177 - 13967, n=4, laatste 2 jaar) | |
| Acer ConceptD 9 Pro | |
| Gemiddeld NVIDIA Quadro RTX 5000 (Laptop) (n=1) | |
| Lenovo ThinkPad P73-20QR002DGE | |
| Eurocom Tornado F7W | |
| Razer Blade 15 Studio Edition | |
| Lenovo ThinkPad P53-20QN000YGE | |
| Fujitsu Celsius H980 | |
| Dell Precision 7730 | |
| Geekbench 4.4 - Compute OpenCL Score | |
| Acer ConceptD 9 Pro | |
| Gemiddeld NVIDIA Quadro RTX 5000 (Laptop) (n=1) | |
| Gemiddelde van klas Workstation (n=1laatste 2 jaar) | |
| Razer Blade 15 Studio Edition | |
| Lenovo ThinkPad P53-20QN000YGE | |
| Eurocom Tornado F7W | |
| Lenovo ThinkPad P73-20QR002DGE | |
| Dell Precision 7730 | |
| Geekbench 5.0 | |
| Vulkan Score 5.0 | |
| Acer ConceptD 9 Pro | |
| Gemiddeld NVIDIA Quadro RTX 5000 (Laptop) (n=1) | |
| Razer Blade 15 Studio Edition | |
| OpenCL Score 5.0 | |
| Acer ConceptD 9 Pro | |
| Gemiddeld NVIDIA Quadro RTX 5000 (Laptop) (n=1) | |
| Gemiddelde van klas Workstation (n=1laatste 2 jaar) | |
| Lenovo ThinkPad P53-20QN000YGE | |
| Razer Blade 15 Studio Edition | |
| Lenovo ThinkPad P73-20QR002DGE | |
| Geekbench 5.5 | |
| Vulkan Score 5.1 | |
| Acer ConceptD 9 Pro | |
| Gemiddeld NVIDIA Quadro RTX 5000 (Laptop) (n=1) | |
| OpenCL Score 5.1 | |
| Acer ConceptD 9 Pro | |
| Gemiddeld NVIDIA Quadro RTX 5000 (Laptop) (n=1) | |
| Basemark GPU 1.2 | |
| 1920x1080 OpenGL Medium Offscreen | |
| Acer ConceptD 9 Pro | |
| Gemiddeld NVIDIA Quadro RTX 5000 (Laptop) (n=1) | |
| 3840x2160 Vulkan High Offscreen | |
| Acer ConceptD 9 Pro | |
| Gemiddeld NVIDIA Quadro RTX 5000 (Laptop) (n=1) | |
| Gemiddelde van klas Workstation (3.64 - 3.64, n=11, laatste 2 jaar) | |
| 1920x1080 Vulkan Medium Offscreen | |
| Acer ConceptD 9 Pro | |
| Gemiddeld NVIDIA Quadro RTX 5000 (Laptop) (n=1) | |
| Gemiddelde van klas Workstation (104.6 - 2585, n=23, laatste 2 jaar) | |
| The Witcher 3 - 1920x1080 Ultra Graphics & Postprocessing (HBAO+) | |
| Acer ConceptD 9 Pro | |
| Gemiddeld NVIDIA Quadro RTX 5000 (Laptop) (90.4 - 109.9, n=2) | |
| Razer Blade 15 Studio Edition | |
| Lenovo ThinkPad P53-20QN000YGE | |
| Eurocom Tornado F7W | |
| MSI WE75 9TK | |
| Gemiddelde van klas Workstation (26.3 - 91.7, n=3, laatste 2 jaar) | |
| Lenovo ThinkPad P73-20QR002DGE | |
| Dell Precision 7730 | |
| BioShock Infinite - 1920x1080 Ultra Preset, DX11 (DDOF) | |
| Acer ConceptD 9 Pro | |
| Gemiddeld NVIDIA Quadro RTX 5000 (Laptop) (n=1) | |
| Razer Blade 15 Studio Edition | |
| MSI WE75 9TK | |
| Lenovo ThinkPad P73-20QR002DGE | |
| Dell Precision 7730 | |
| Fujitsu Celsius H980 | |
| Far Cry 5 - 1920x1080 Ultra Preset AA:T | |
| Acer ConceptD 9 Pro | |
| Gemiddeld NVIDIA Quadro RTX 5000 (Laptop) (n=1) | |
| Gemiddelde van klas Workstation (37 - 128, n=11, laatste 2 jaar) | |
| Fujitsu Celsius H980 | |
| Shadow of the Tomb Raider - 1920x1080 Highest Preset AA:T | |
| Acer ConceptD 9 Pro | |
| Gemiddeld NVIDIA Quadro RTX 5000 (Laptop) (73.1 - 118, n=2) | |
| Lenovo ThinkPad P53-20QN000YGE | |
| MSI WE75 9TK | |
| Eurocom Tornado F7W | |
| Borderlands 3 - 1920x1080 Badass Overall Quality (DX11) | |
| Acer ConceptD 9 Pro | |
| Gemiddeld NVIDIA Quadro RTX 5000 (Laptop) (n=1) | |
| Razer Blade 15 Studio Edition | |
| lage | gem. | hoge | ultra | QHD | 4K | |
|---|---|---|---|---|---|---|
| Tomb Raider (2013) | 757 | 681 | 625 | 319.6 | ||
| BioShock Infinite (2013) | 458 | 396.9 | 367.9 | 216.3 | ||
| The Witcher 3 (2015) | 375.3 | 308.5 | 198.6 | 109.9 | 71 | |
| Rainbow Six Siege (2015) | 350.2 | 296.1 | 279.6 | 266.2 | 138 | |
| For Honor (2017) | 329.3 | 216.9 | 206.8 | 160.4 | 68.4 | |
| Far Cry 5 (2018) | 150 | 128 | 123 | 115 | 102 | 56 |
| Shadow of the Tomb Raider (2018) | 147 | 130 | 126 | 118 | 87 | 47 |
| Assassin´s Creed Odyssey (2018) | 113 | 104 | 94 | 73 | 63 | 40 |
| Battlefield V (2018) | 187 | 164.6 | 161.7 | 151.9 | 123.9 | 72.7 |
| Apex Legends (2019) | 144 | 144 | 144 | 143.9 | 135 | 76.3 |
| Metro Exodus (2019) | 161 | 124.4 | 95.2 | 77 | 59.3 | 36.7 |
| Dirt Rally 2.0 (2019) | 289.3 | 208.4 | 200.1 | 115.5 | 84.3 | 51.2 |
| The Division 2 (2019) | 178 | 156 | 131 | 55 | 55 | 38 |
| Anno 1800 (2019) | 119.2 | 118.8 | 93.1 | 51.1 | 46.9 | 30.3 |
| Rage 2 (2019) | 303.8 | 160.4 | 137.1 | 133.8 | 85.8 | 42.2 |
| Total War: Three Kingdoms (2019) | 271.6 | 154.6 | 113.7 | 83.6 | 53.3 | 25.9 |
| F1 2019 (2019) | 243 | 210 | 182 | 144 | 146 | 78 |
| Control (2019) | 239 | 123.7 | 93.3 | 60.5 | 30.1 | |
| Borderlands 3 (2019) | 153.8 | 130.2 | 104.5 | 85.5 | 59.8 | 31.5 |
| Ghost Recon Breakpoint (2019) | 152 | 125 | 118 | 88 | 66 | 38 |
| GRID 2019 (2019) | 186.6 | 144.5 | 142.5 | 100.7 | 80.7 | 54.9 |
| Call of Duty Modern Warfare 2019 (2019) | 232.6 | 156.2 | 144.9 | 119.3 | 86.6 | 48.8 |
| Need for Speed Heat (2019) | 109.9 | 104.9 | 98.7 | 95.9 | 89 | 52.7 |
| Star Wars Jedi Fallen Order (2019) | 112.8 | 112.1 | 107.5 | 89.6 | 50.2 | |
| Red Dead Redemption 2 (2019) | 145.6 | 125.9 | 87.4 | 54.1 | 43.7 | 28.1 |
| Escape from Tarkov (2020) | 121 | 121 | 120.3 | 110.6 | 106.6 | 53.8 |
| Hunt Showdown (2020) | 231.1 | 163.8 | 130.4 | 87.8 | 77.1 | |
| Doom Eternal (2020) | 234.5 | 200.2 | 183.7 | 180.8 | 128.5 | 68.6 |
Geluidsniveau
| Onbelast |
| 31.6 / 31.6 / 31.9 dB (A) |
| Belasting |
| 41.2 / 44.1 dB (A) |
 | ||
30 dB stil 40 dB(A) hoorbaar 50 dB(A) luid |
||
min: | ||
| Acer ConceptD 9 Pro i9-9980HK, Quadro RTX 5000 (Laptop) | Lenovo ThinkPad P73-20QR002DGE i7-9850H, Quadro RTX 3000 (Laptop) | MSI WE75 9TK i7-9750H, Quadro RTX 3000 (Laptop) | Dell Precision 7730 i7-8850H, Quadro P3200 | Eurocom Tornado F7W i9-9900K, Quadro P5200 | Fujitsu Celsius H980 i7-8750H, Quadro P3200 | Gemiddeld NVIDIA Quadro RTX 5000 (Laptop) | Gemiddelde van klas Workstation | |
|---|---|---|---|---|---|---|---|---|
| Noise | 16% | 3% | 9% | -12% | 2% | 4% | 12% | |
| uit / omgeving * (dB) | 30.8 | 29.3 5% | 28.5 7% | 29.7 4% | 28.2 8% | 29.6 4% | 30.1 ? 2% | 24.1 ? 22% |
| Idle Minimum * (dB) | 31.6 | 29.3 7% | 29 8% | 29.7 6% | 33.2 -5% | 29.6 6% | 30.5 ? 3% | 24.8 ? 22% |
| Idle Average * (dB) | 31.6 | 29.3 7% | 29 8% | 29.7 6% | 33.2 -5% | 32.5 -3% | 30.5 ? 3% | 25.4 ? 20% |
| Idle Maximum * (dB) | 31.9 | 29.3 8% | 31.5 1% | 29.7 7% | 33.2 -4% | 32.5 -2% | 31.2 ? 2% | 26.7 ? 16% |
| Load Average * (dB) | 41.2 | 30.2 27% | 32 22% | 31.4 24% | 47 -14% | 34.9 15% | 36.9 ? 10% | 39.2 ? 5% |
| Witcher 3 ultra * (dB) | 44.6 | 30.7 31% | 44.7 -0% | 37.9 15% | 52.2 -17% | |||
| Load Maximum * (dB) | 44.1 | 33.1 25% | 56.5 -28% | 44.2 -0% | 64 -45% | 49.1 -11% | 41.6 ? 6% | 50.4 ? -14% |
* ... kleiner is beter
(±) De maximumtemperatuur aan de bovenzijde bedraagt 43 °C / 109 F, vergeleken met het gemiddelde van 38.2 °C / 101 F, variërend van 22.2 tot 69.8 °C voor de klasse Workstation.
(-) De bodem warmt op tot een maximum van 53 °C / 127 F, vergeleken met een gemiddelde van 41.1 °C / 106 F
(+) Bij onbelast gebruik bedraagt de gemiddelde temperatuur voor de bovenzijde 23.9 °C / 75 F, vergeleken met het apparaatgemiddelde van 32 °C / 90 F.
(±) Bij het spelen van The Witcher 3 is de gemiddelde temperatuur voor de bovenzijde 34.8 °C / 95 F, vergeleken met het apparaatgemiddelde van 32 °C / 90 F.
(+) De handpalmsteunen en het touchpad bereiken maximaal de huidtemperatuur (32.2 °C / 90 F) en zijn dus niet heet.
(-) De gemiddelde temperatuur van de handpalmsteun van soortgelijke toestellen bedroeg 27.8 °C / 82 F (-4.4 °C / -8 F).
| Acer ConceptD 9 Pro i9-9980HK, Quadro RTX 5000 (Laptop) | Lenovo ThinkPad P73-20QR002DGE i7-9850H, Quadro RTX 3000 (Laptop) | MSI WE75 9TK i7-9750H, Quadro RTX 3000 (Laptop) | Dell Precision 7730 i7-8850H, Quadro P3200 | Eurocom Tornado F7W i9-9900K, Quadro P5200 | Fujitsu Celsius H980 i7-8750H, Quadro P3200 | Gemiddeld NVIDIA Quadro RTX 5000 (Laptop) | Gemiddelde van klas Workstation | |
|---|---|---|---|---|---|---|---|---|
| Heat | -7% | -7% | -16% | 12% | 2% | -1% | -8% | |
| Maximum Upper Side * (°C) | 43 | 52.2 -21% | 40.6 6% | 50 -16% | 34 21% | 41.8 3% | 43.5 ? -1% | 43.8 ? -2% |
| Maximum Bottom * (°C) | 53 | 47.8 10% | 46 13% | 59.8 -13% | 47.6 10% | 46.2 13% | 54.3 ? -2% | 45 ? 15% |
| Idle Upper Side * (°C) | 24.8 | 26.9 -8% | 29.2 -18% | 27.9 -13% | 23 7% | 25.6 -3% | 25.1 ? -1% | 30.6 ? -23% |
| Idle Bottom * (°C) | 25.6 | 28 -9% | 32.4 -27% | 31.4 -23% | 23.4 9% | 26.6 -4% | 25.8 ? -1% | 31.6 ? -23% |
* ... kleiner is beter
Acer ConceptD 9 Pro audioanalyse
(-) | niet erg luide luidsprekers (69.9 dB)
Bas 100 - 315 Hz
(-) | bijna geen lage tonen - gemiddeld 22.1% lager dan de mediaan
(±) | lineariteit van de lage tonen is gemiddeld (11.8% delta ten opzichte van de vorige frequentie)
Midden 400 - 2000 Hz
(+) | evenwichtige middens - slechts 3.4% verwijderd van de mediaan
(±) | lineariteit van de middentonen is gemiddeld (7.2% delta ten opzichte van de vorige frequentie)
Hoog 2 - 16 kHz
(+) | evenwichtige hoogtepunten - slechts 3.3% verwijderd van de mediaan
(±) | lineariteit van de hoogtepunten is gemiddeld (10.1% delta ten opzichte van de vorige frequentie)
Algemeen 100 - 16.000 Hz
(±) | lineariteit van het totale geluid is gemiddeld (20.8% verschil met de mediaan)
Vergeleken met dezelfde klasse
» 75% van alle geteste apparaten in deze klasse waren beter, 6% vergelijkbaar, 18% slechter
» De beste had een delta van 7%, het gemiddelde was 17%, de slechtste was 35%
Vergeleken met alle geteste toestellen
» 56% van alle geteste apparaten waren beter, 8% gelijk, 36% slechter
» De beste had een delta van 4%, het gemiddelde was 24%, de slechtste was 134%
| Uit / Standby | |
| Inactief | |
| Belasting |
|
Key:
min: | |
| Acer ConceptD 9 Pro i9-9980HK, Quadro RTX 5000 (Laptop) | Lenovo ThinkPad P73-20QR002DGE i7-9850H, Quadro RTX 3000 (Laptop) | MSI WE75 9TK i7-9750H, Quadro RTX 3000 (Laptop) | Dell Precision 7730 i7-8850H, Quadro P3200 | Eurocom Tornado F7W i9-9900K, Quadro P5200 | Fujitsu Celsius H980 i7-8750H, Quadro P3200 | Gemiddeld NVIDIA Quadro RTX 5000 (Laptop) | Gemiddelde van klas Workstation | |
|---|---|---|---|---|---|---|---|---|
| Power Consumption | 36% | 29% | 31% | -31% | 19% | 6% | 37% | |
| Idle Minimum * (Watt) | 18.8 | 8.9 53% | 12.1 36% | 10.1 46% | 28.5 -52% | 14.8 21% | 16.6 ? 12% | 8.94 ? 52% |
| Idle Average * (Watt) | 25 | 12.8 49% | 18.4 26% | 18 28% | 36.7 -47% | 20.4 18% | 22.1 ? 12% | 13.8 ? 45% |
| Idle Maximum * (Watt) | 30 | 16.4 45% | 18.8 37% | 19.7 34% | 37.8 -26% | 21.5 28% | 27.3 ? 9% | 17.5 ? 42% |
| Load Average * (Watt) | 116 | 108.4 7% | 95.1 18% | 89.6 23% | 144.6 -25% | 98.4 15% | 124.5 ? -7% | 95 ? 18% |
| Witcher 3 ultra * (Watt) | 221 | 153 31% | 135.5 39% | 134 39% | 218.9 1% | |||
| Load Maximum * (Watt) | 241 | 166 31% | 203.7 15% | 204 15% | 336 -39% | 213.5 11% | 232 ? 4% | 175.2 ? 27% |
* ... kleiner is beter
| Acer ConceptD 9 Pro i9-9980HK, Quadro RTX 5000 (Laptop), 71.9 Wh | Lenovo ThinkPad P73-20QR002DGE i7-9850H, Quadro RTX 3000 (Laptop), 99 Wh | MSI WE75 9TK i7-9750H, Quadro RTX 3000 (Laptop), 65 Wh | Dell Precision 7730 i7-8850H, Quadro P3200, 92 Wh | Eurocom Tornado F7W i9-9900K, Quadro P5200, 90 Wh | Fujitsu Celsius H980 i7-8750H, Quadro P3200, 96 Wh | Gemiddelde van klas Workstation | |
|---|---|---|---|---|---|---|---|
| Batterijduur | 148% | 53% | 63% | -17% | 104% | 193% | |
| Reader / Idle (h) | 5.2 | 11 112% | 13.5 160% | 26.1 ? 402% | |||
| H.264 (h) | 3.5 | 9.8 180% | 5.8 66% | 5.9 69% | 9.51 ? 172% | ||
| WiFi v1.3 (h) | 3.6 | 11.1 208% | 4.9 36% | 5.6 56% | 3 -17% | 8.3 131% | 8.53 ? 137% |
| Load (h) | 0.9 | 1.4 56% | 1 11% | 1.5 67% | 1.4 56% | 1.429 ? 59% |
Pro
Contra
Dit is de verkorte versie van het originele artikel. Het volledige, Engelse testrapport vind je hier.
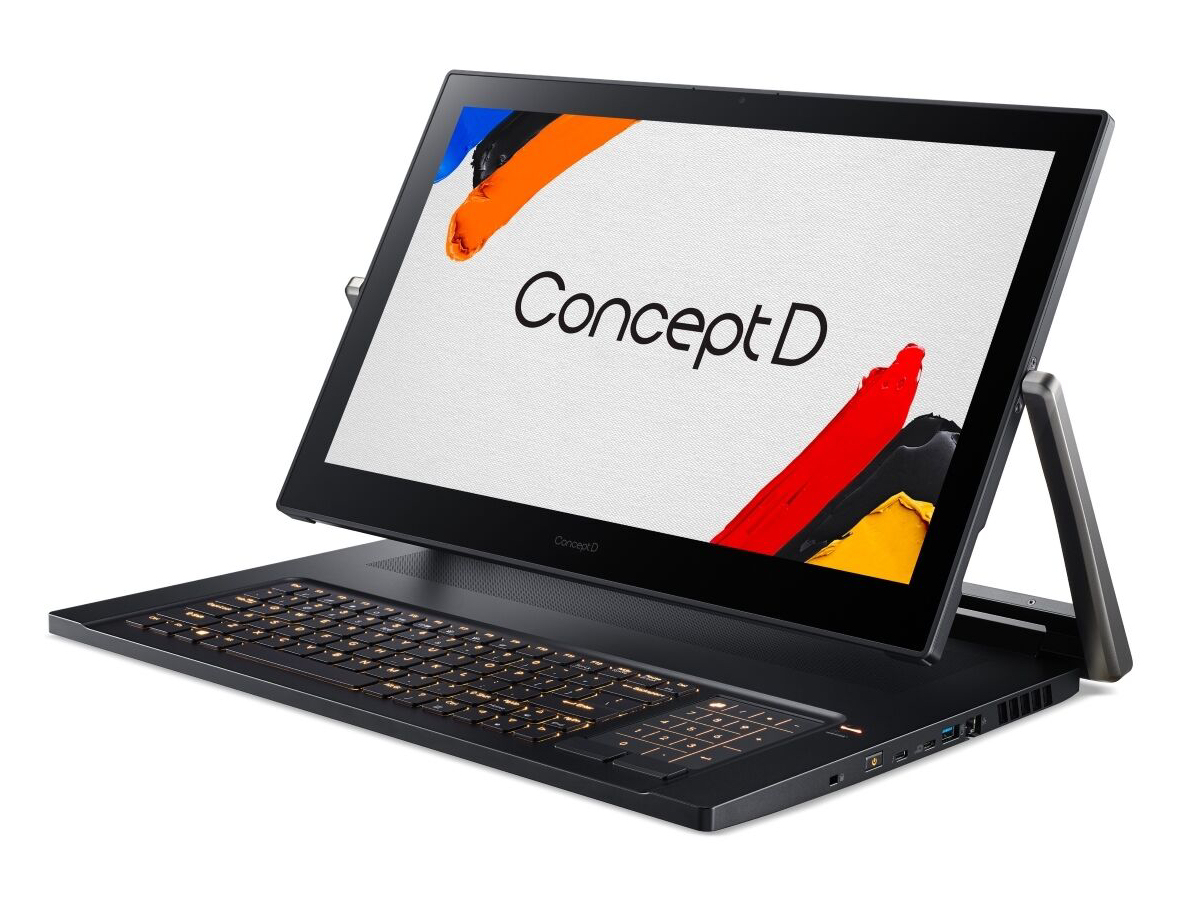
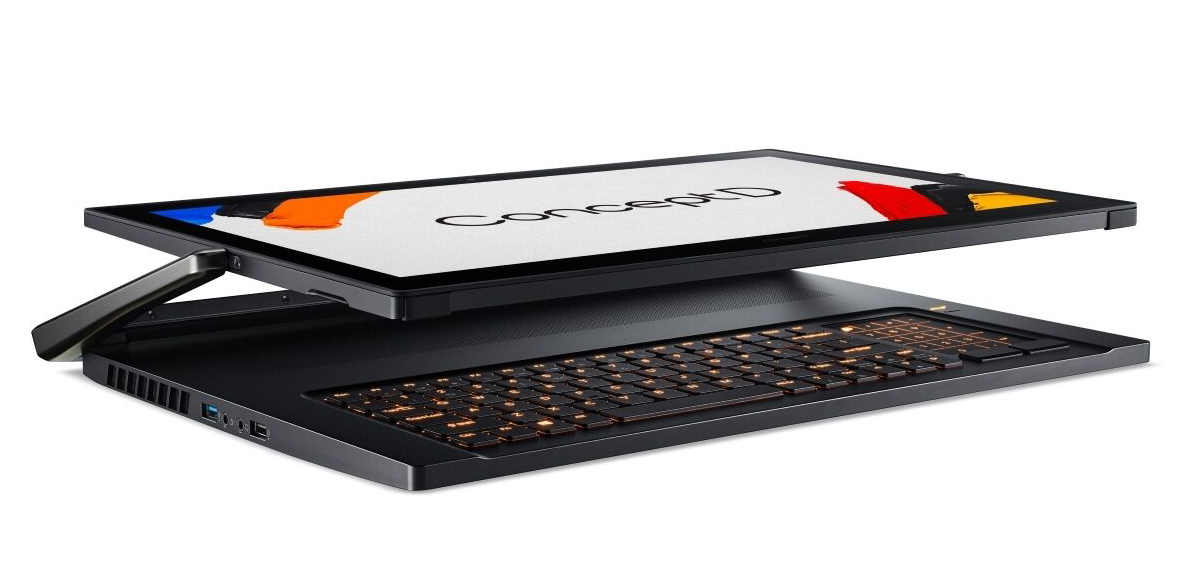
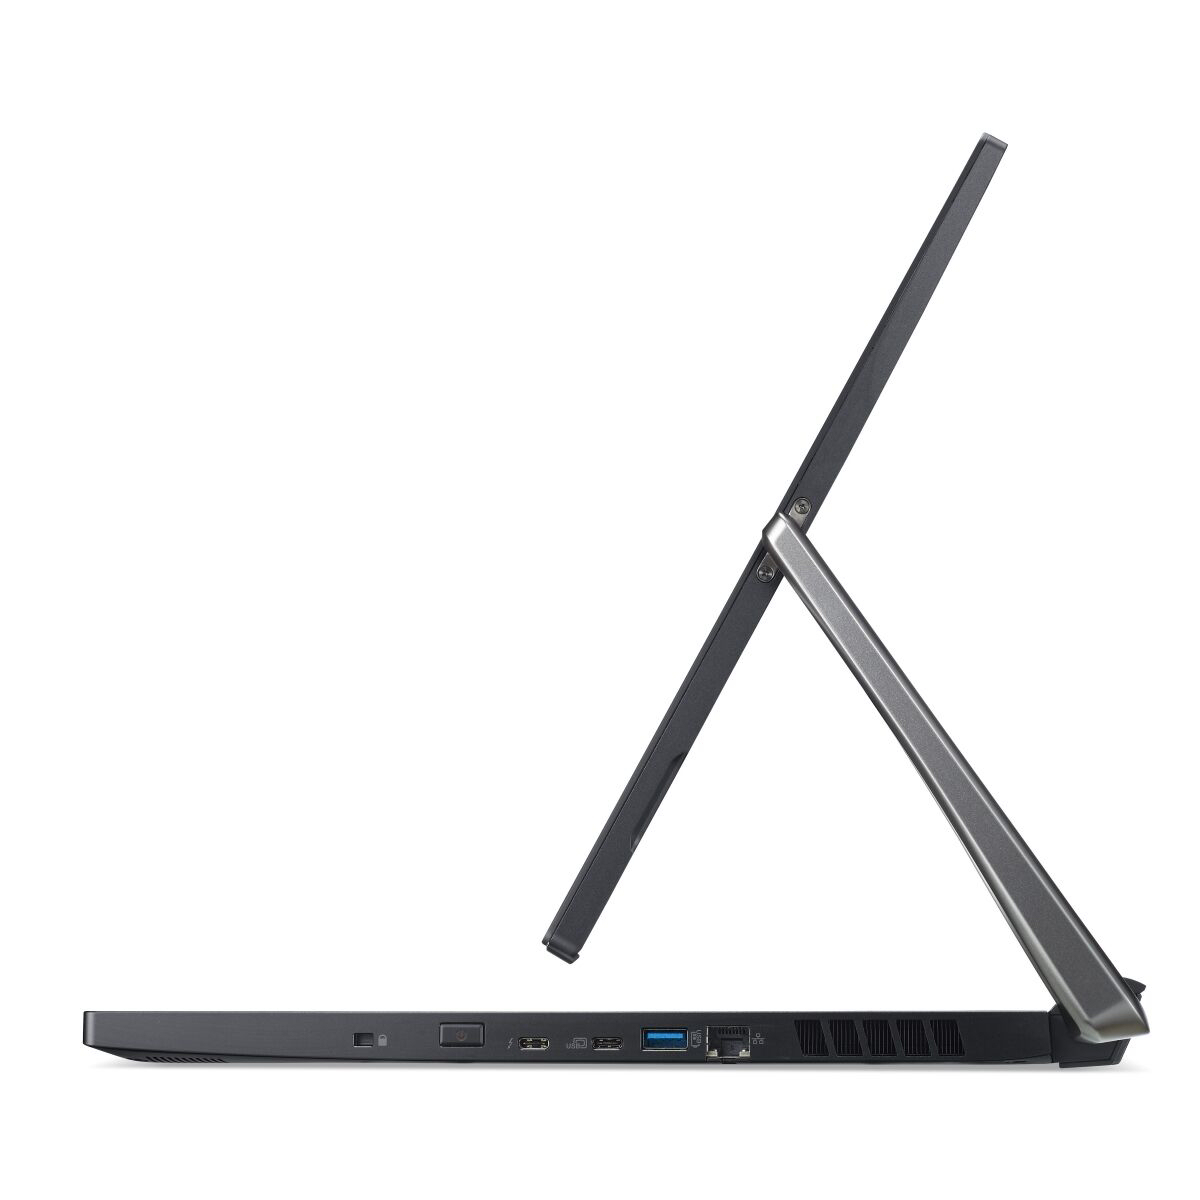
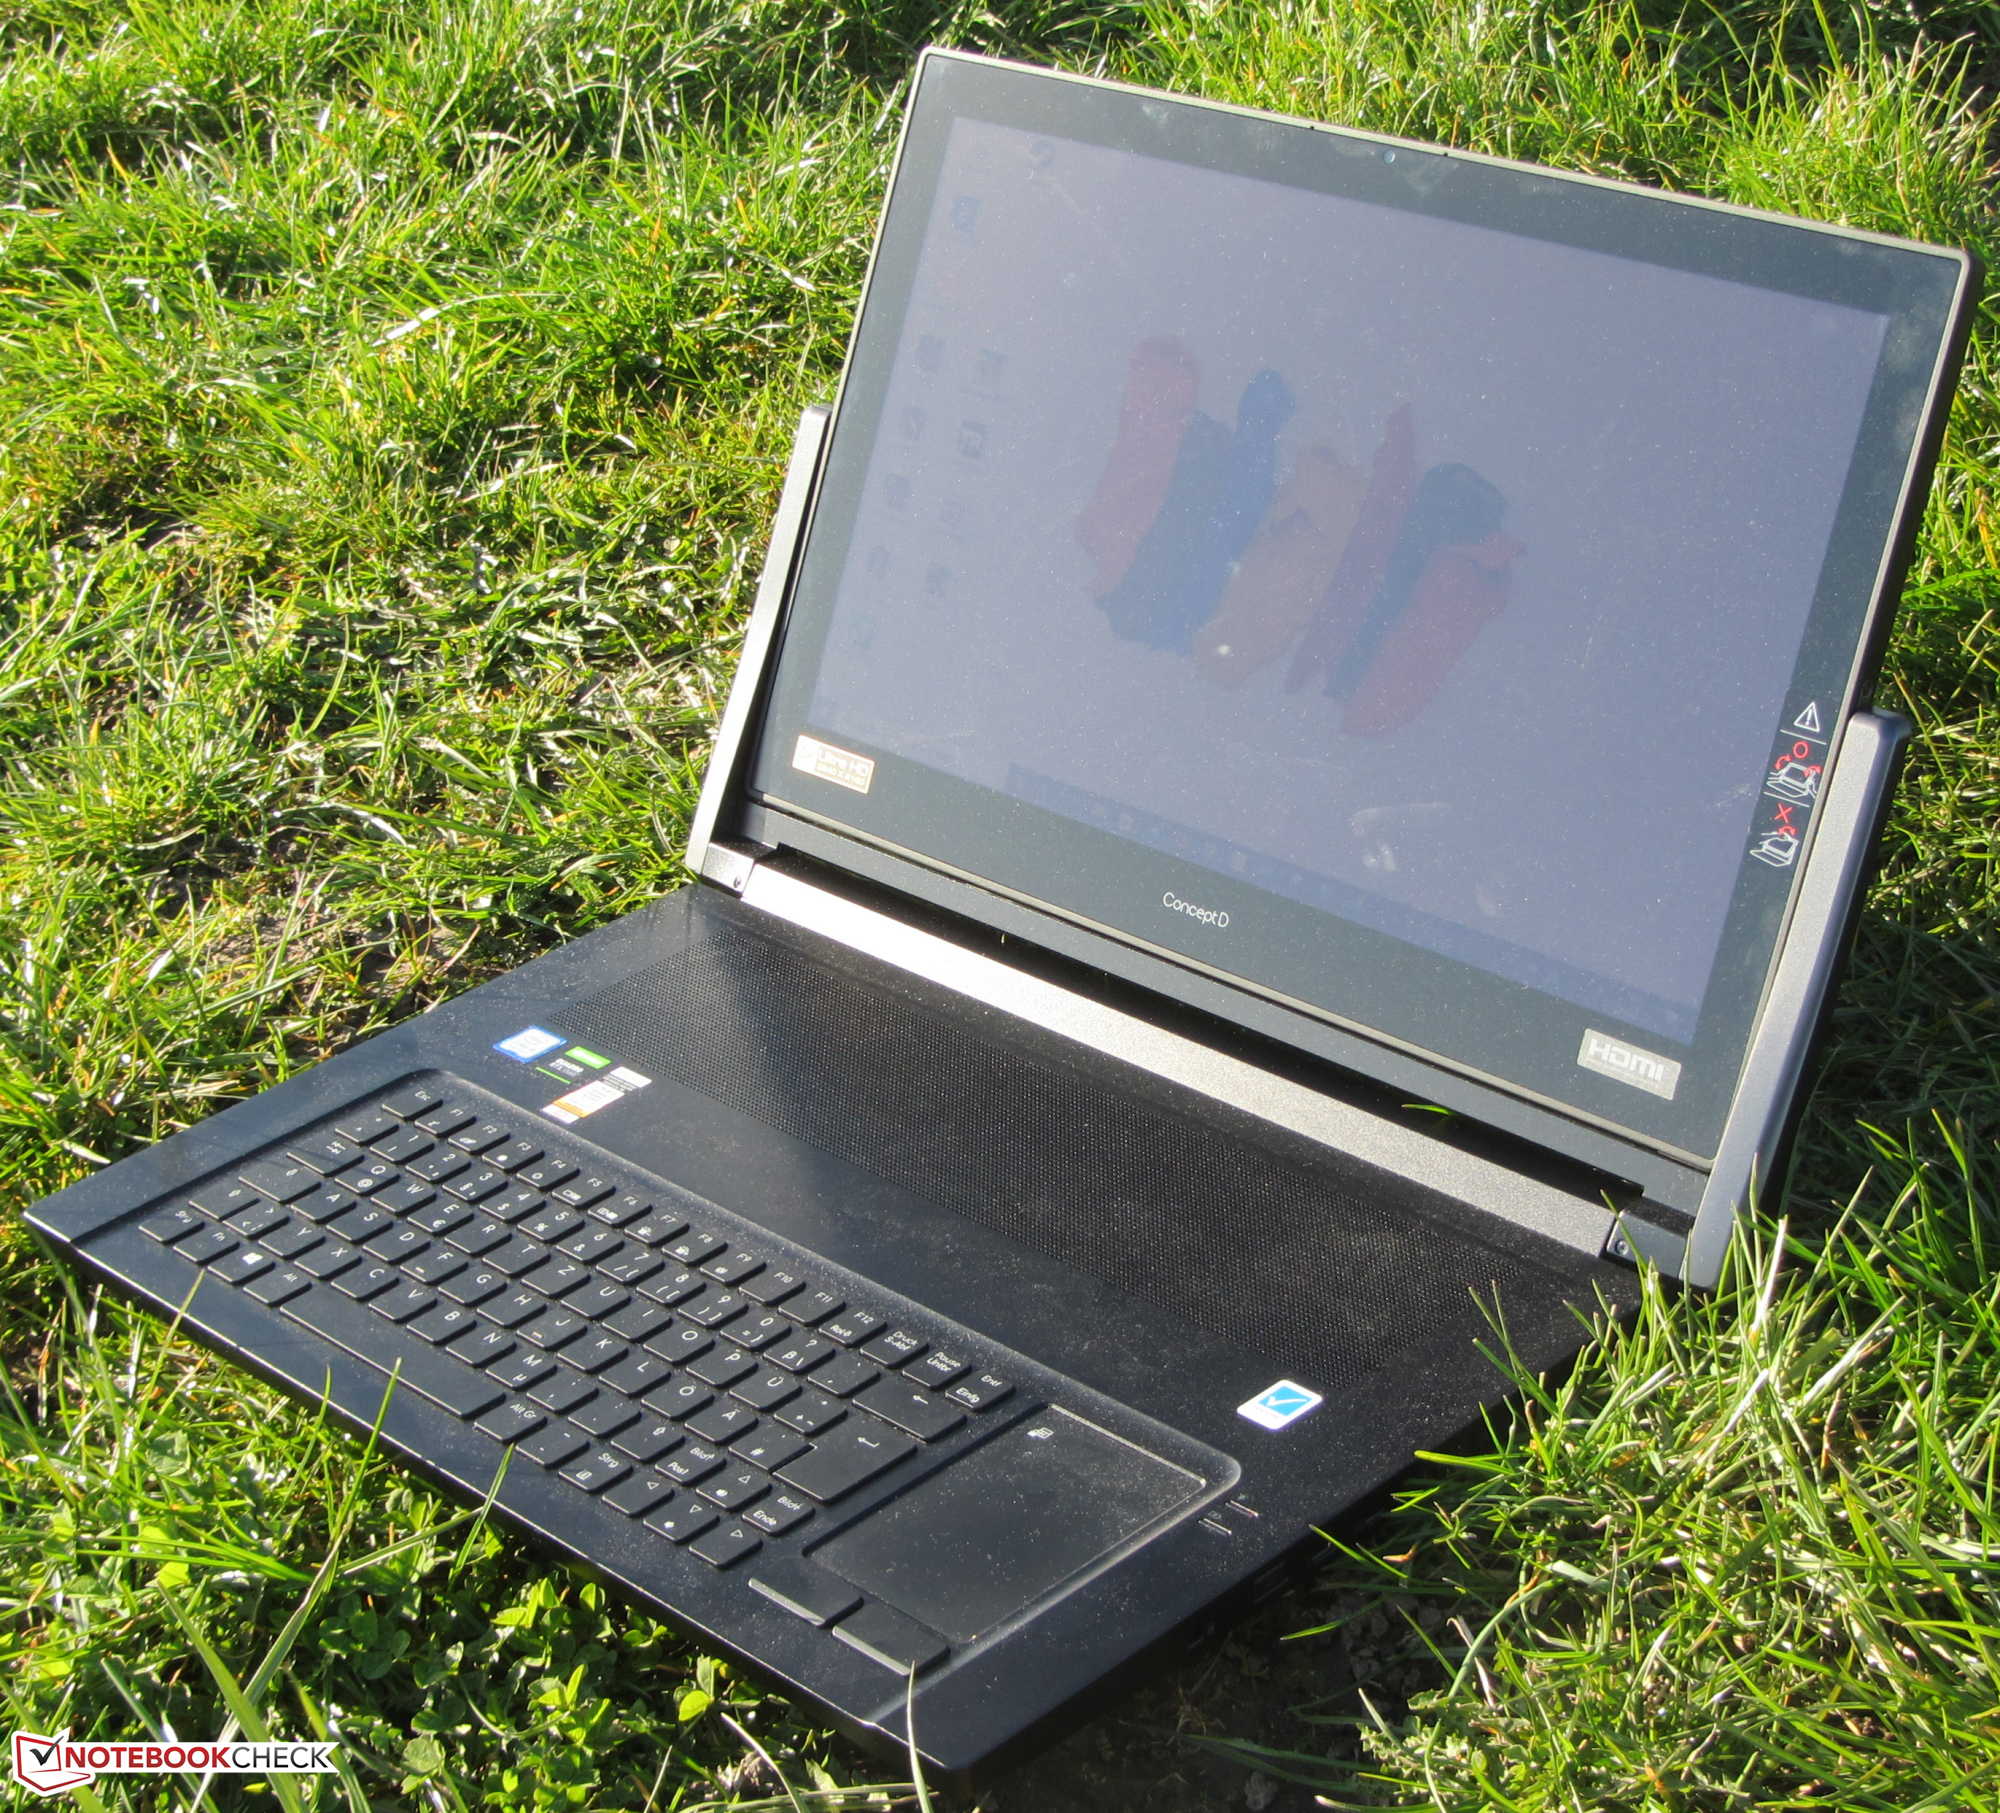
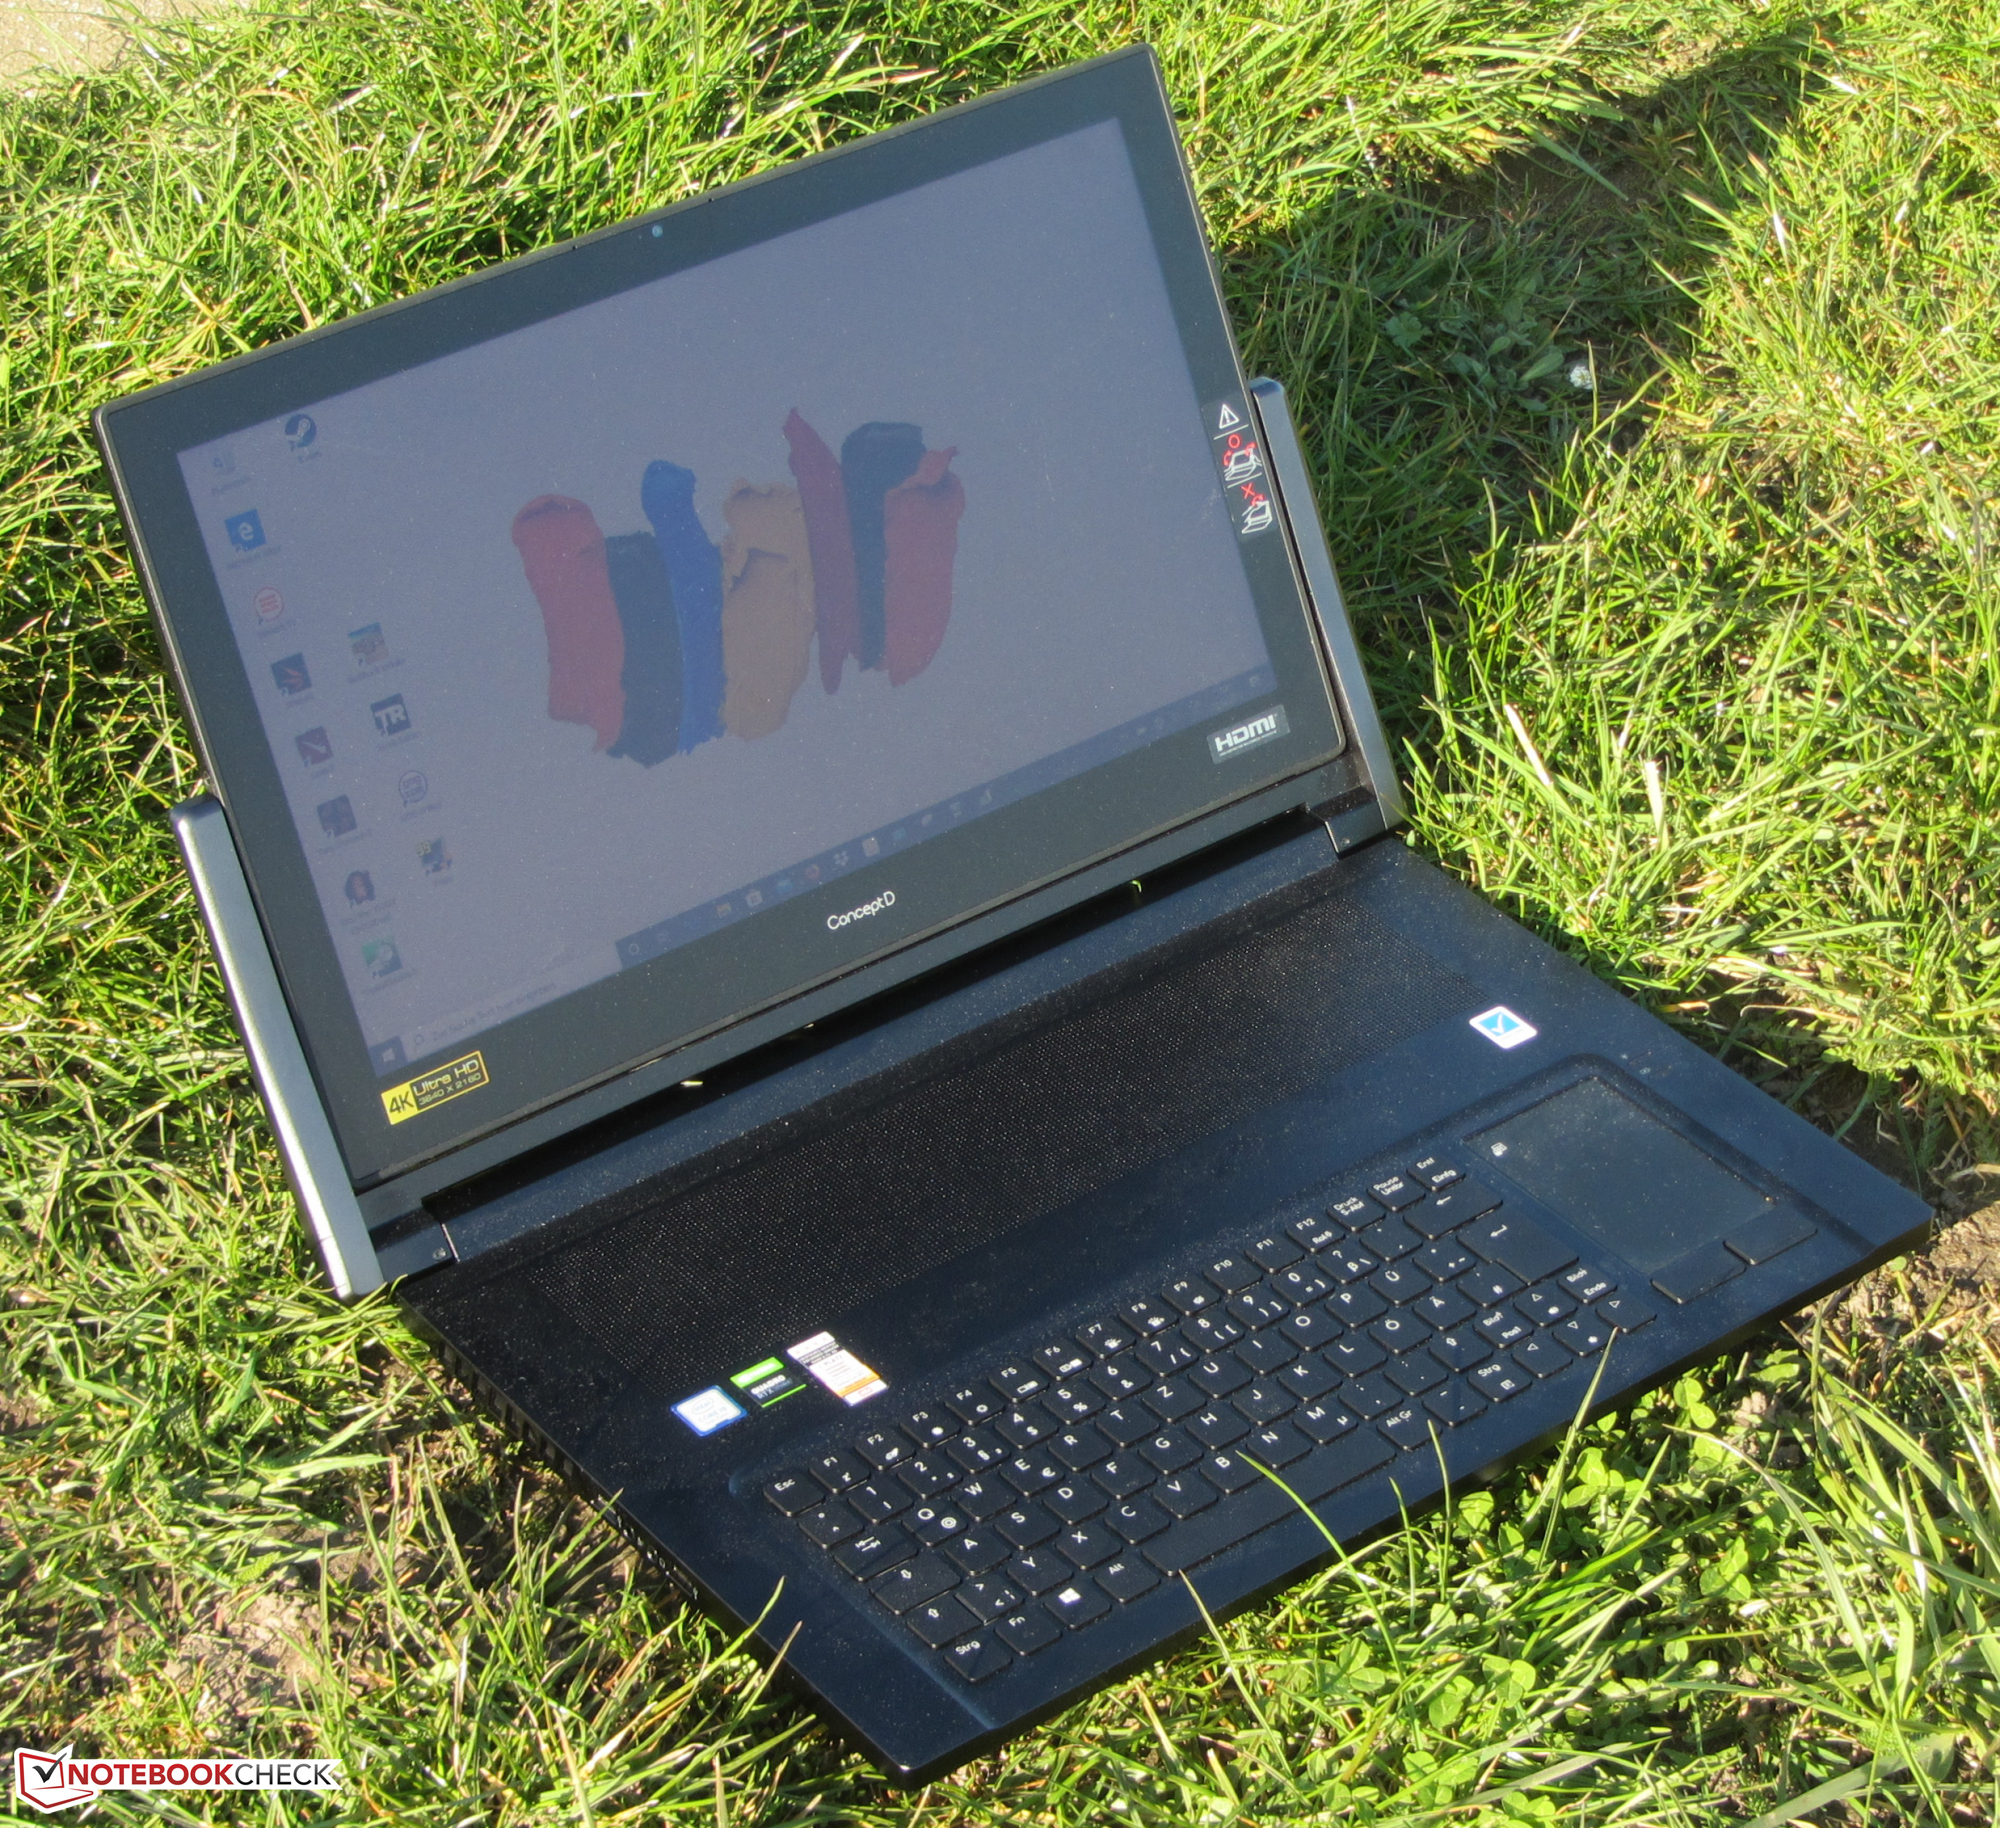
Met de ConceptD 9 Pro CN917-71P heeft Acer een mobiele, convertible werkstation geleverd met een 17.3-inch formaat. Echter moet de term 'mobiel' met een korrel zout genomen worden aangezien het toestel bijna 4.5 kg weegt en een korte batterijduur heeft. Dat gezegd hebbende, is het geen probleem om de convertible van werkplek naar werkplek te dragen.
De ConceptD 9 Pro is een convertible voor creatieve gebruikers, die over het algemeen een goede indruk maakt.
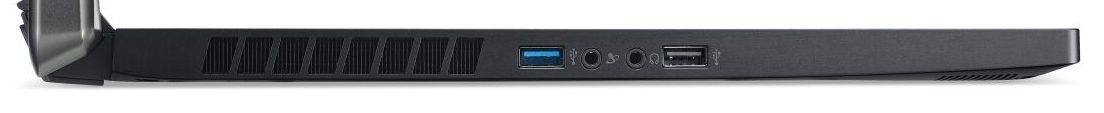
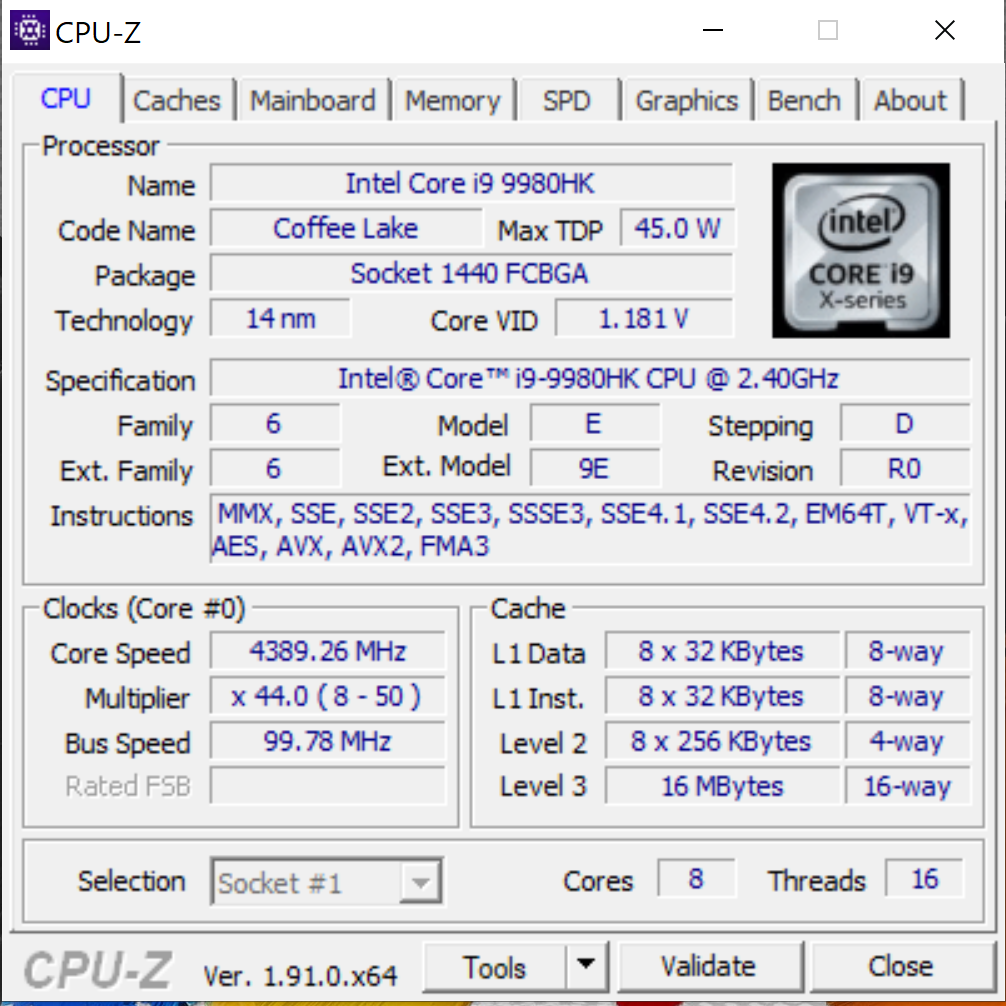
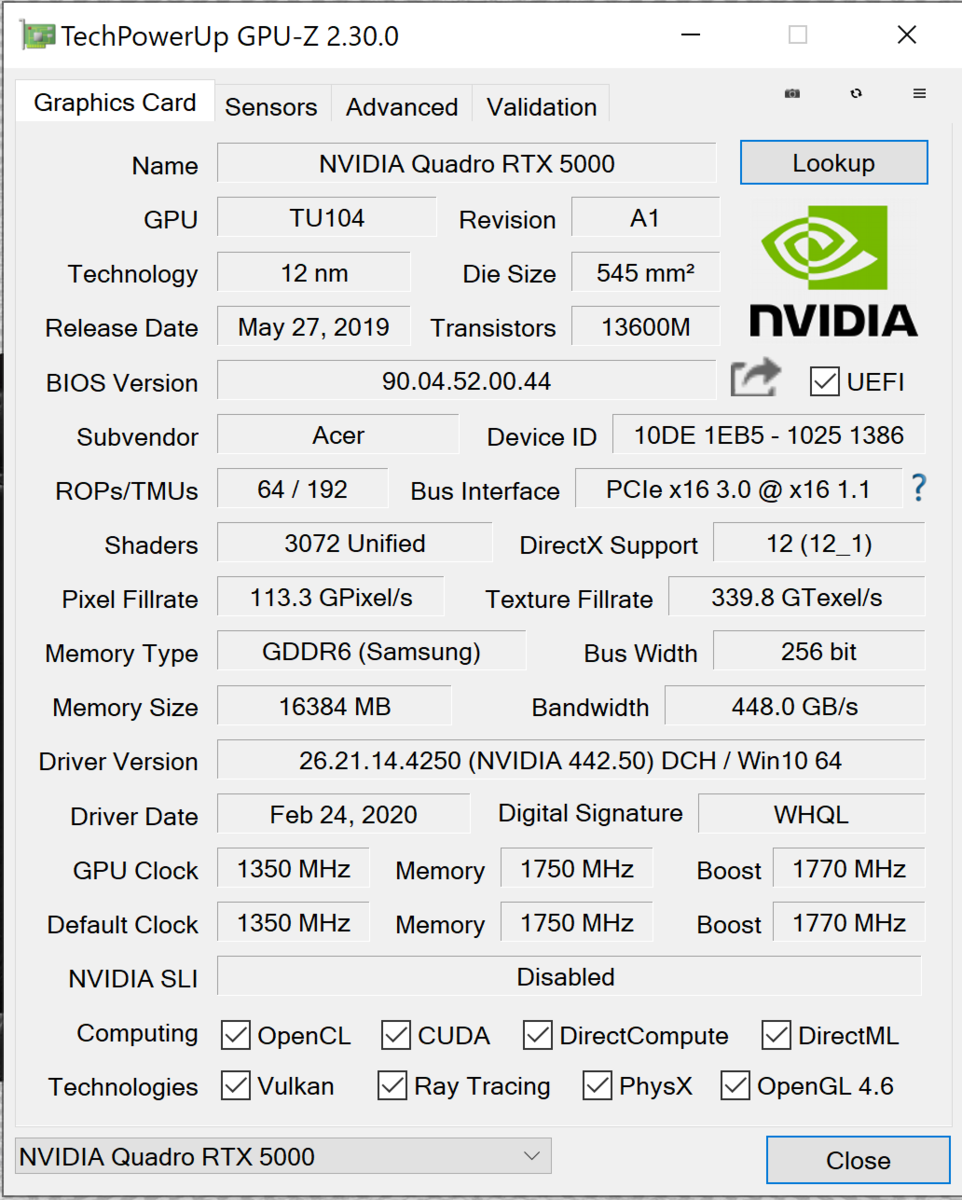
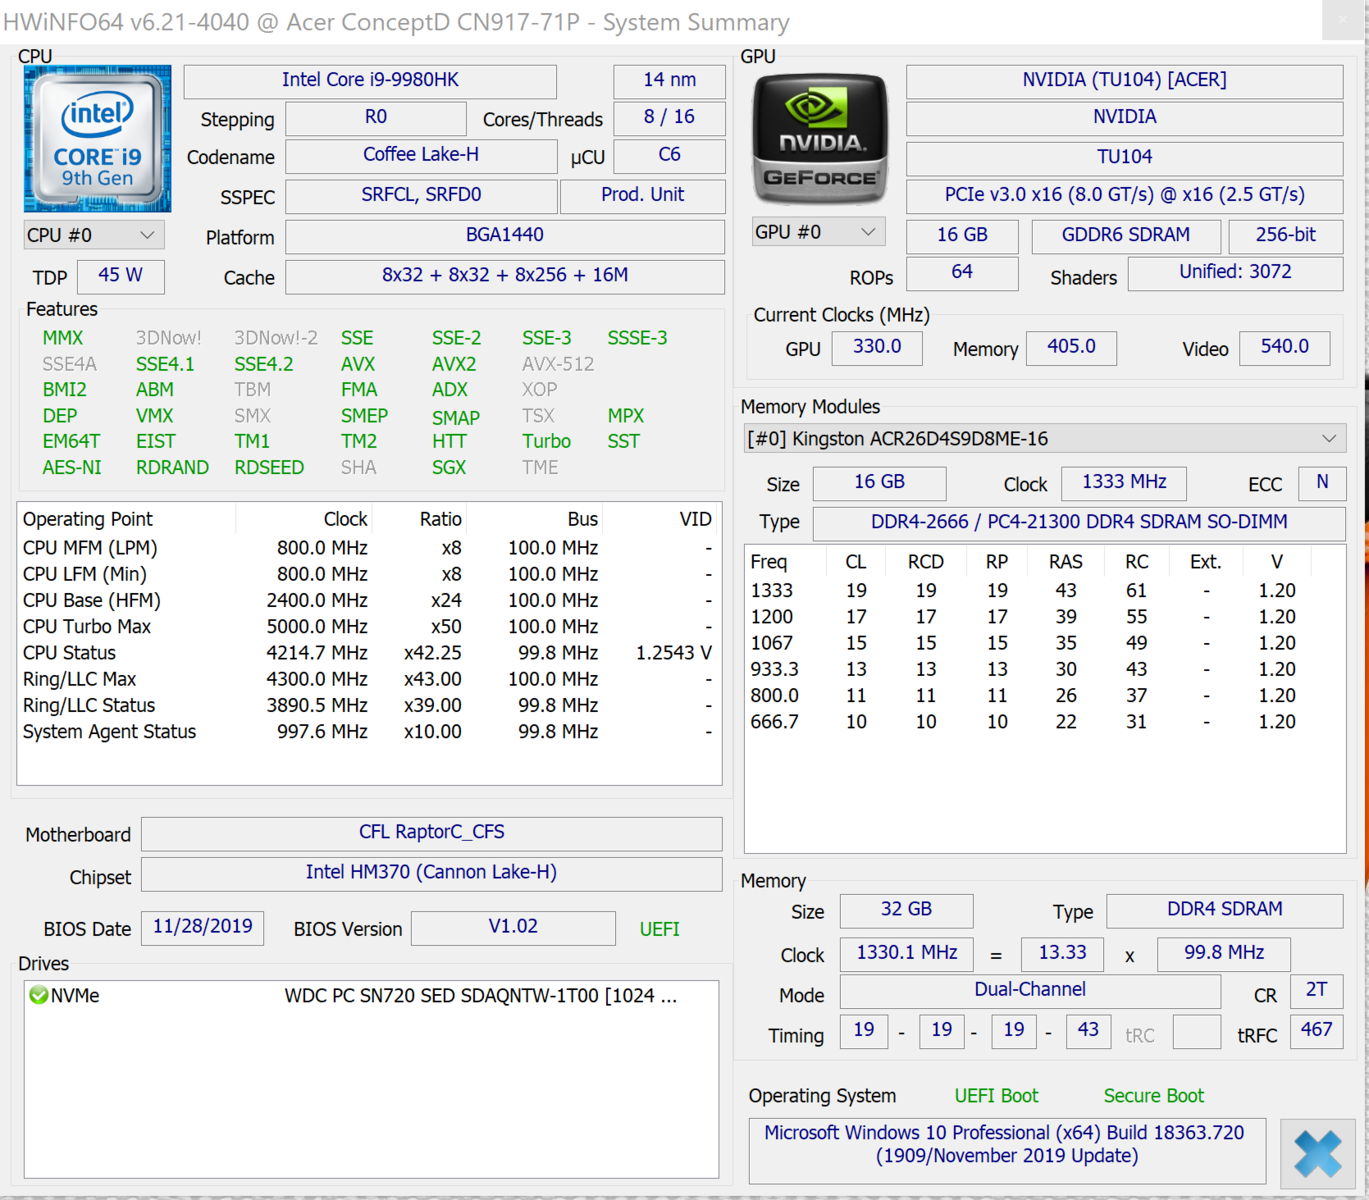
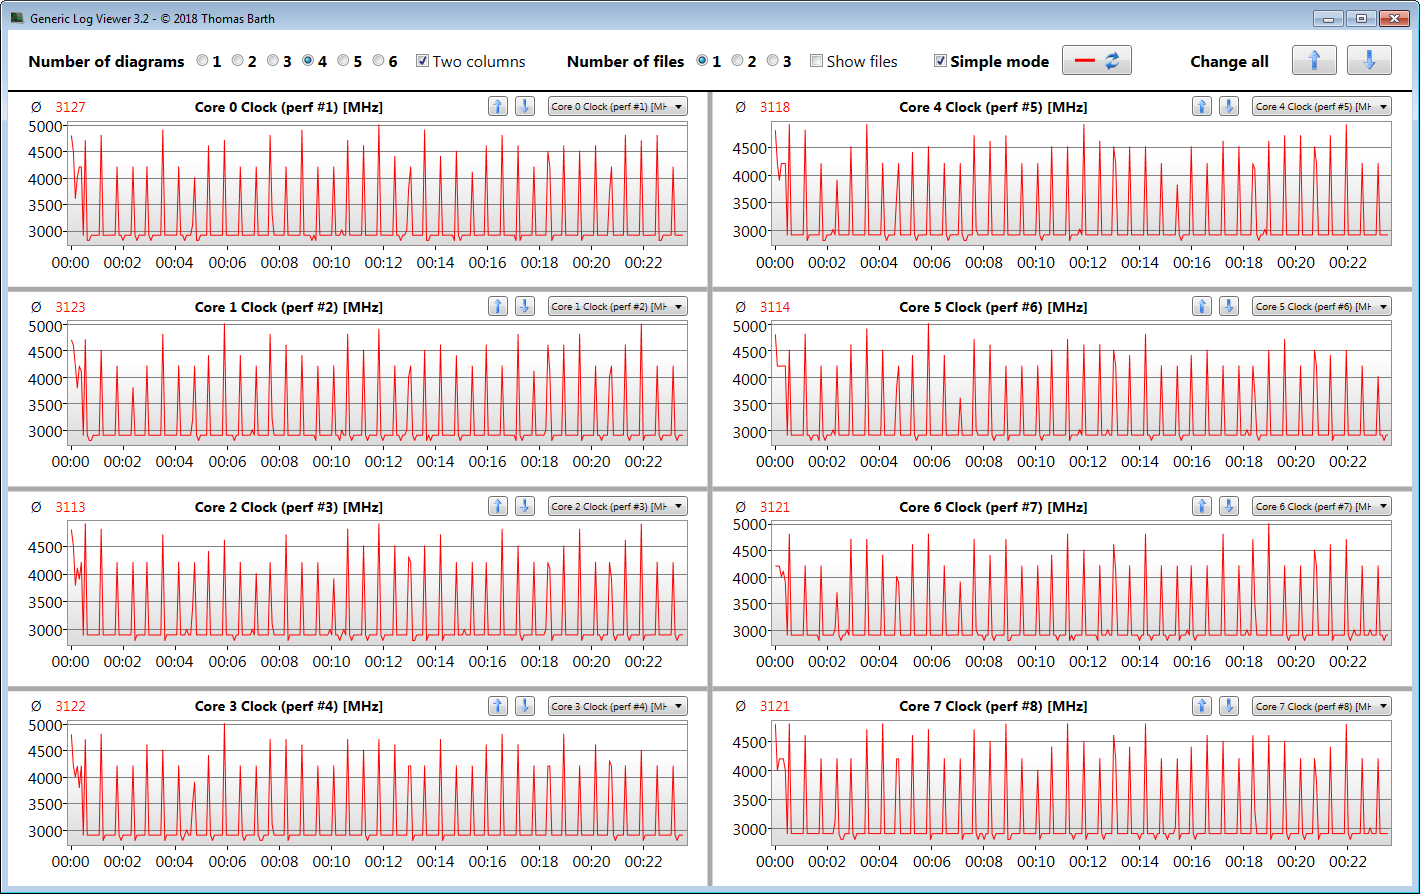
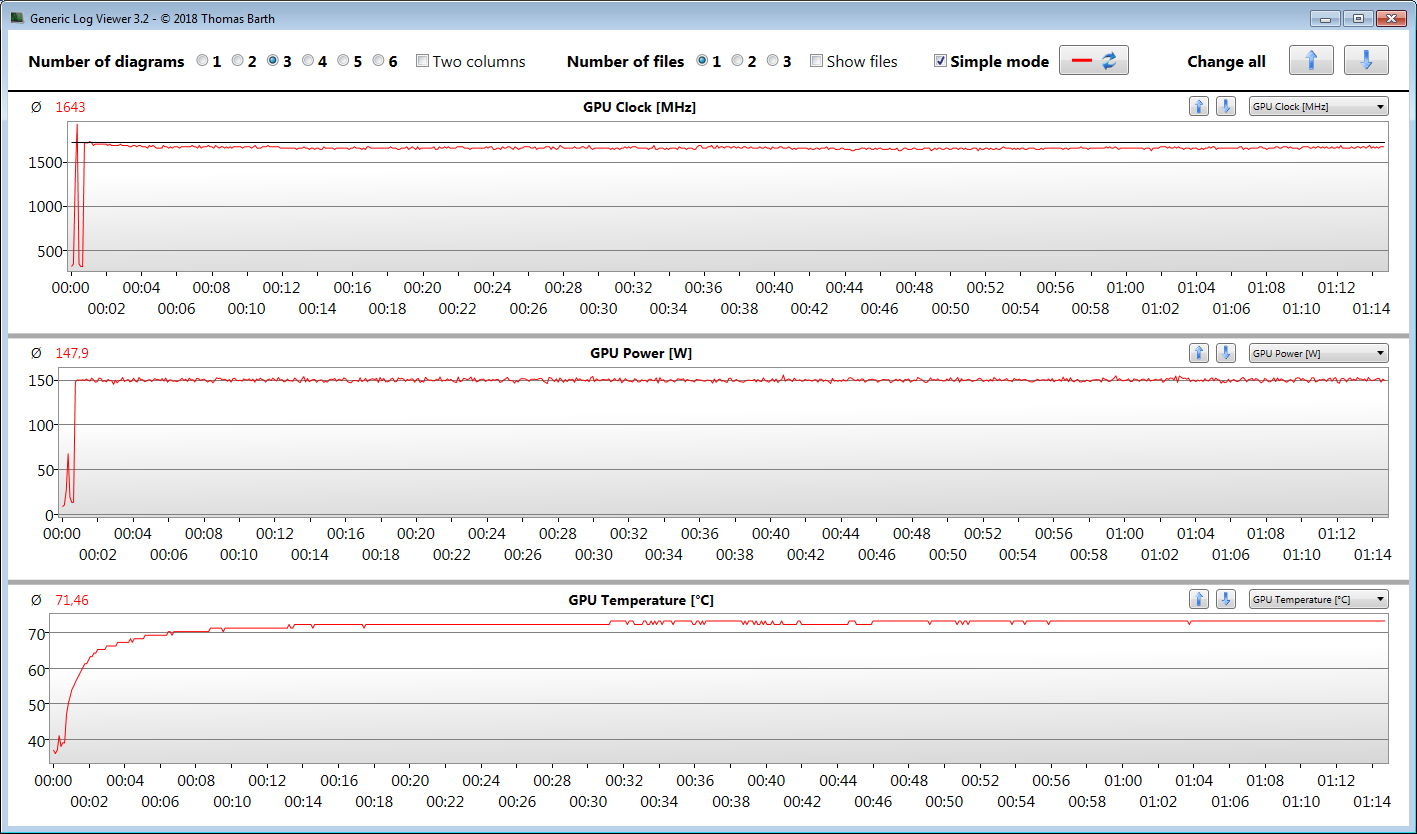
De Core i9-9980HK processor en de Quadro RTX 5000 GPU in de laptop zijn beide hypermoderne componenten. Alhoewel de CPU zijn kloksnelheid al verminderd na een korte stressperiode, kan de videokaart consistent op hoge turbo snelheden draaien. Daarbij kan via de Thunderbolt 3 poort extern een nog krachtiger GPU aangesloten worden.
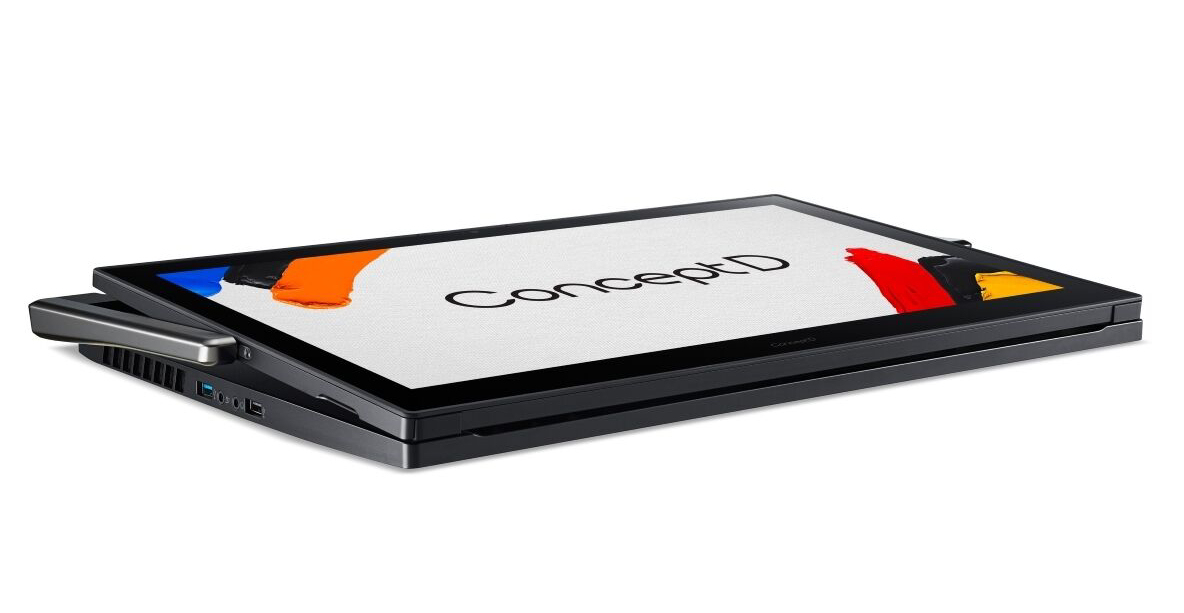
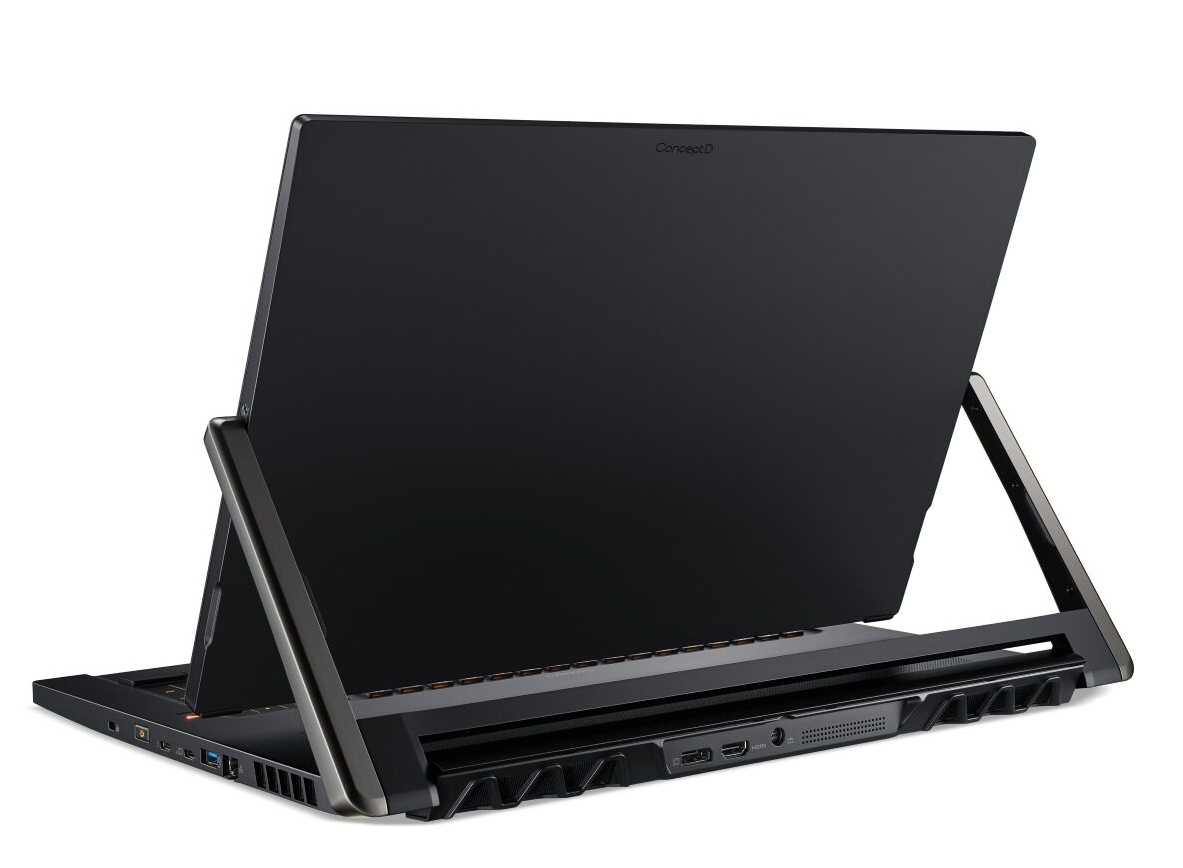
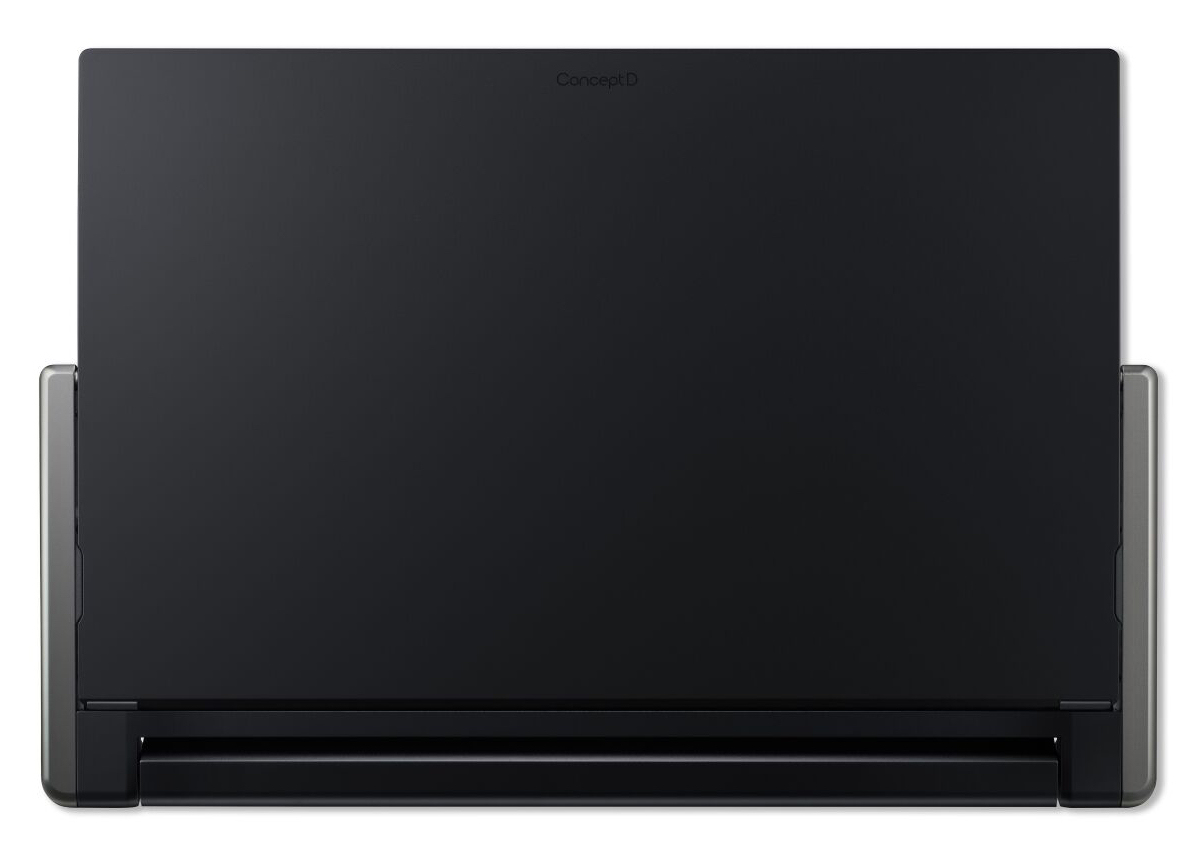
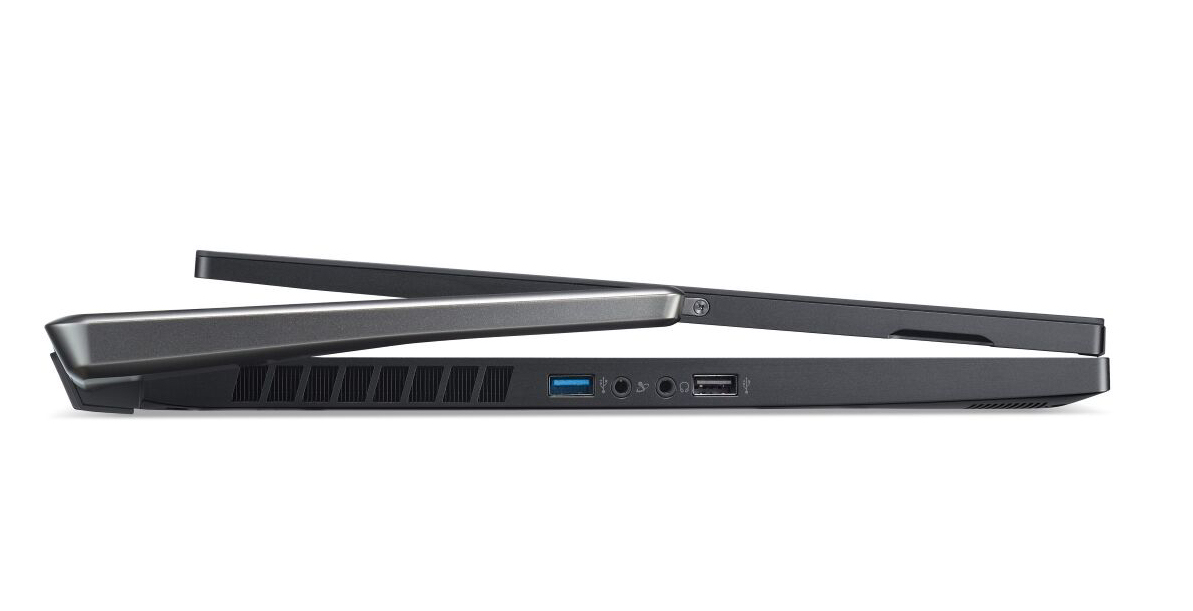
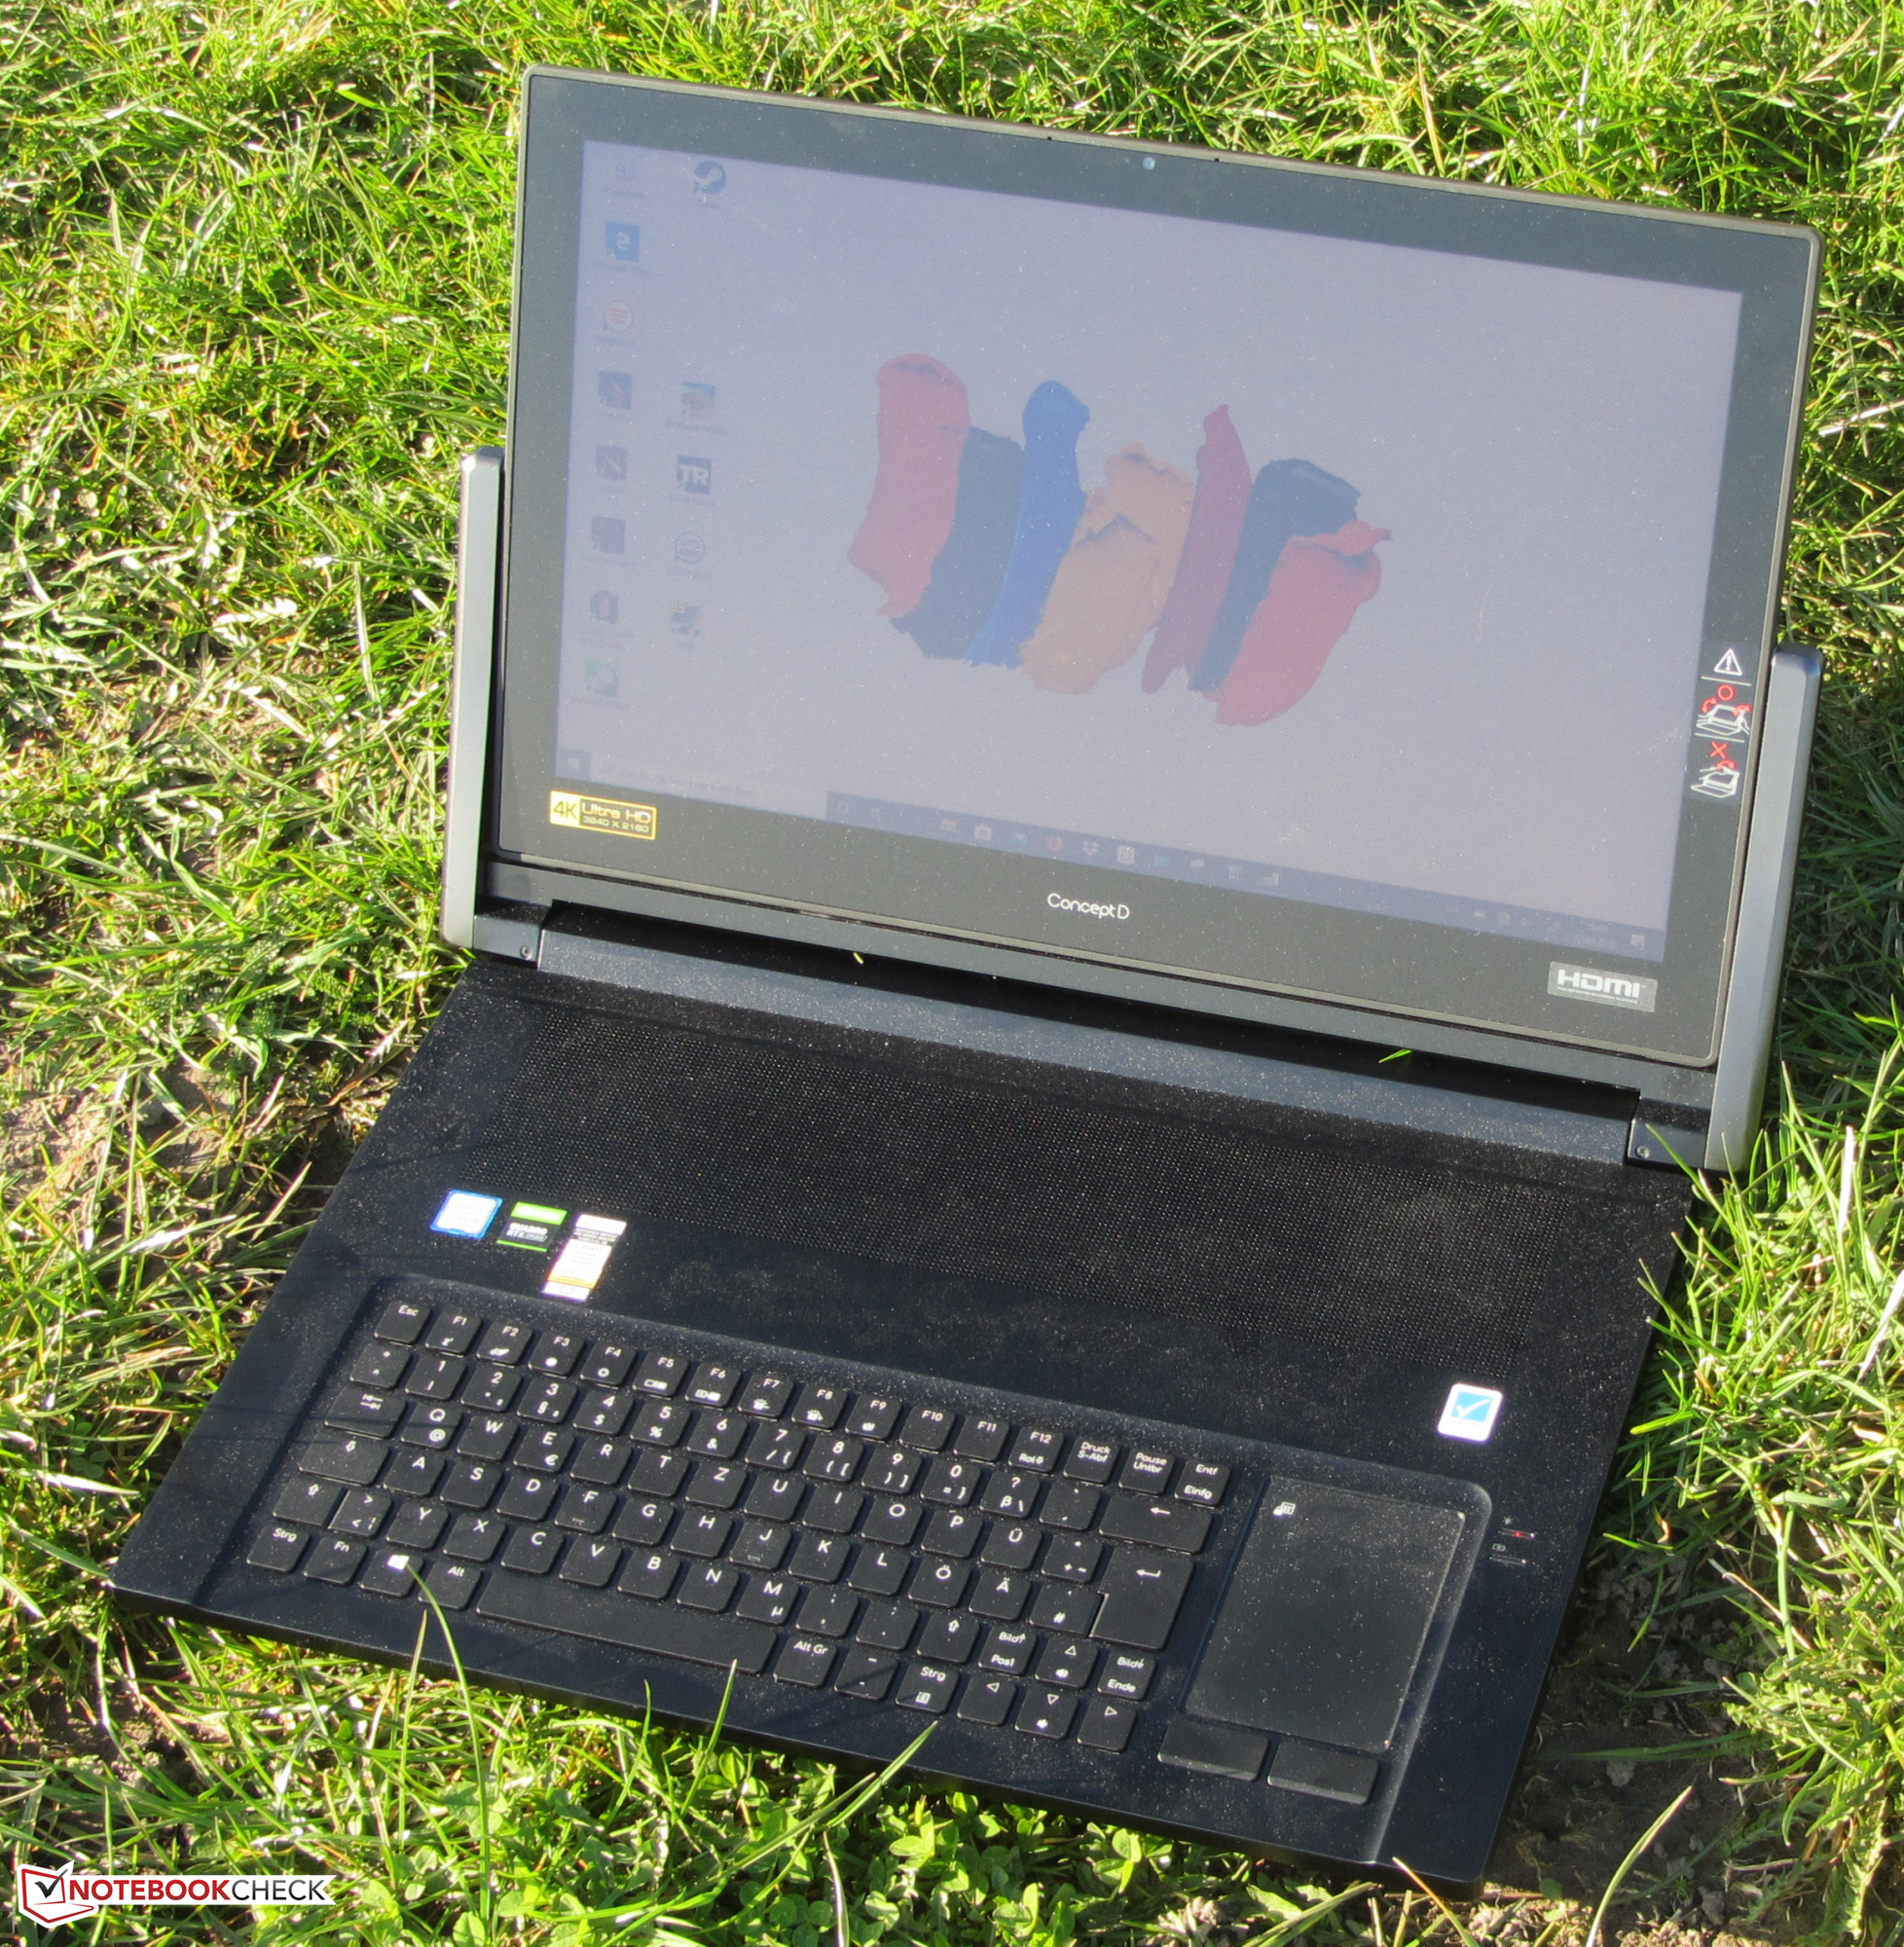
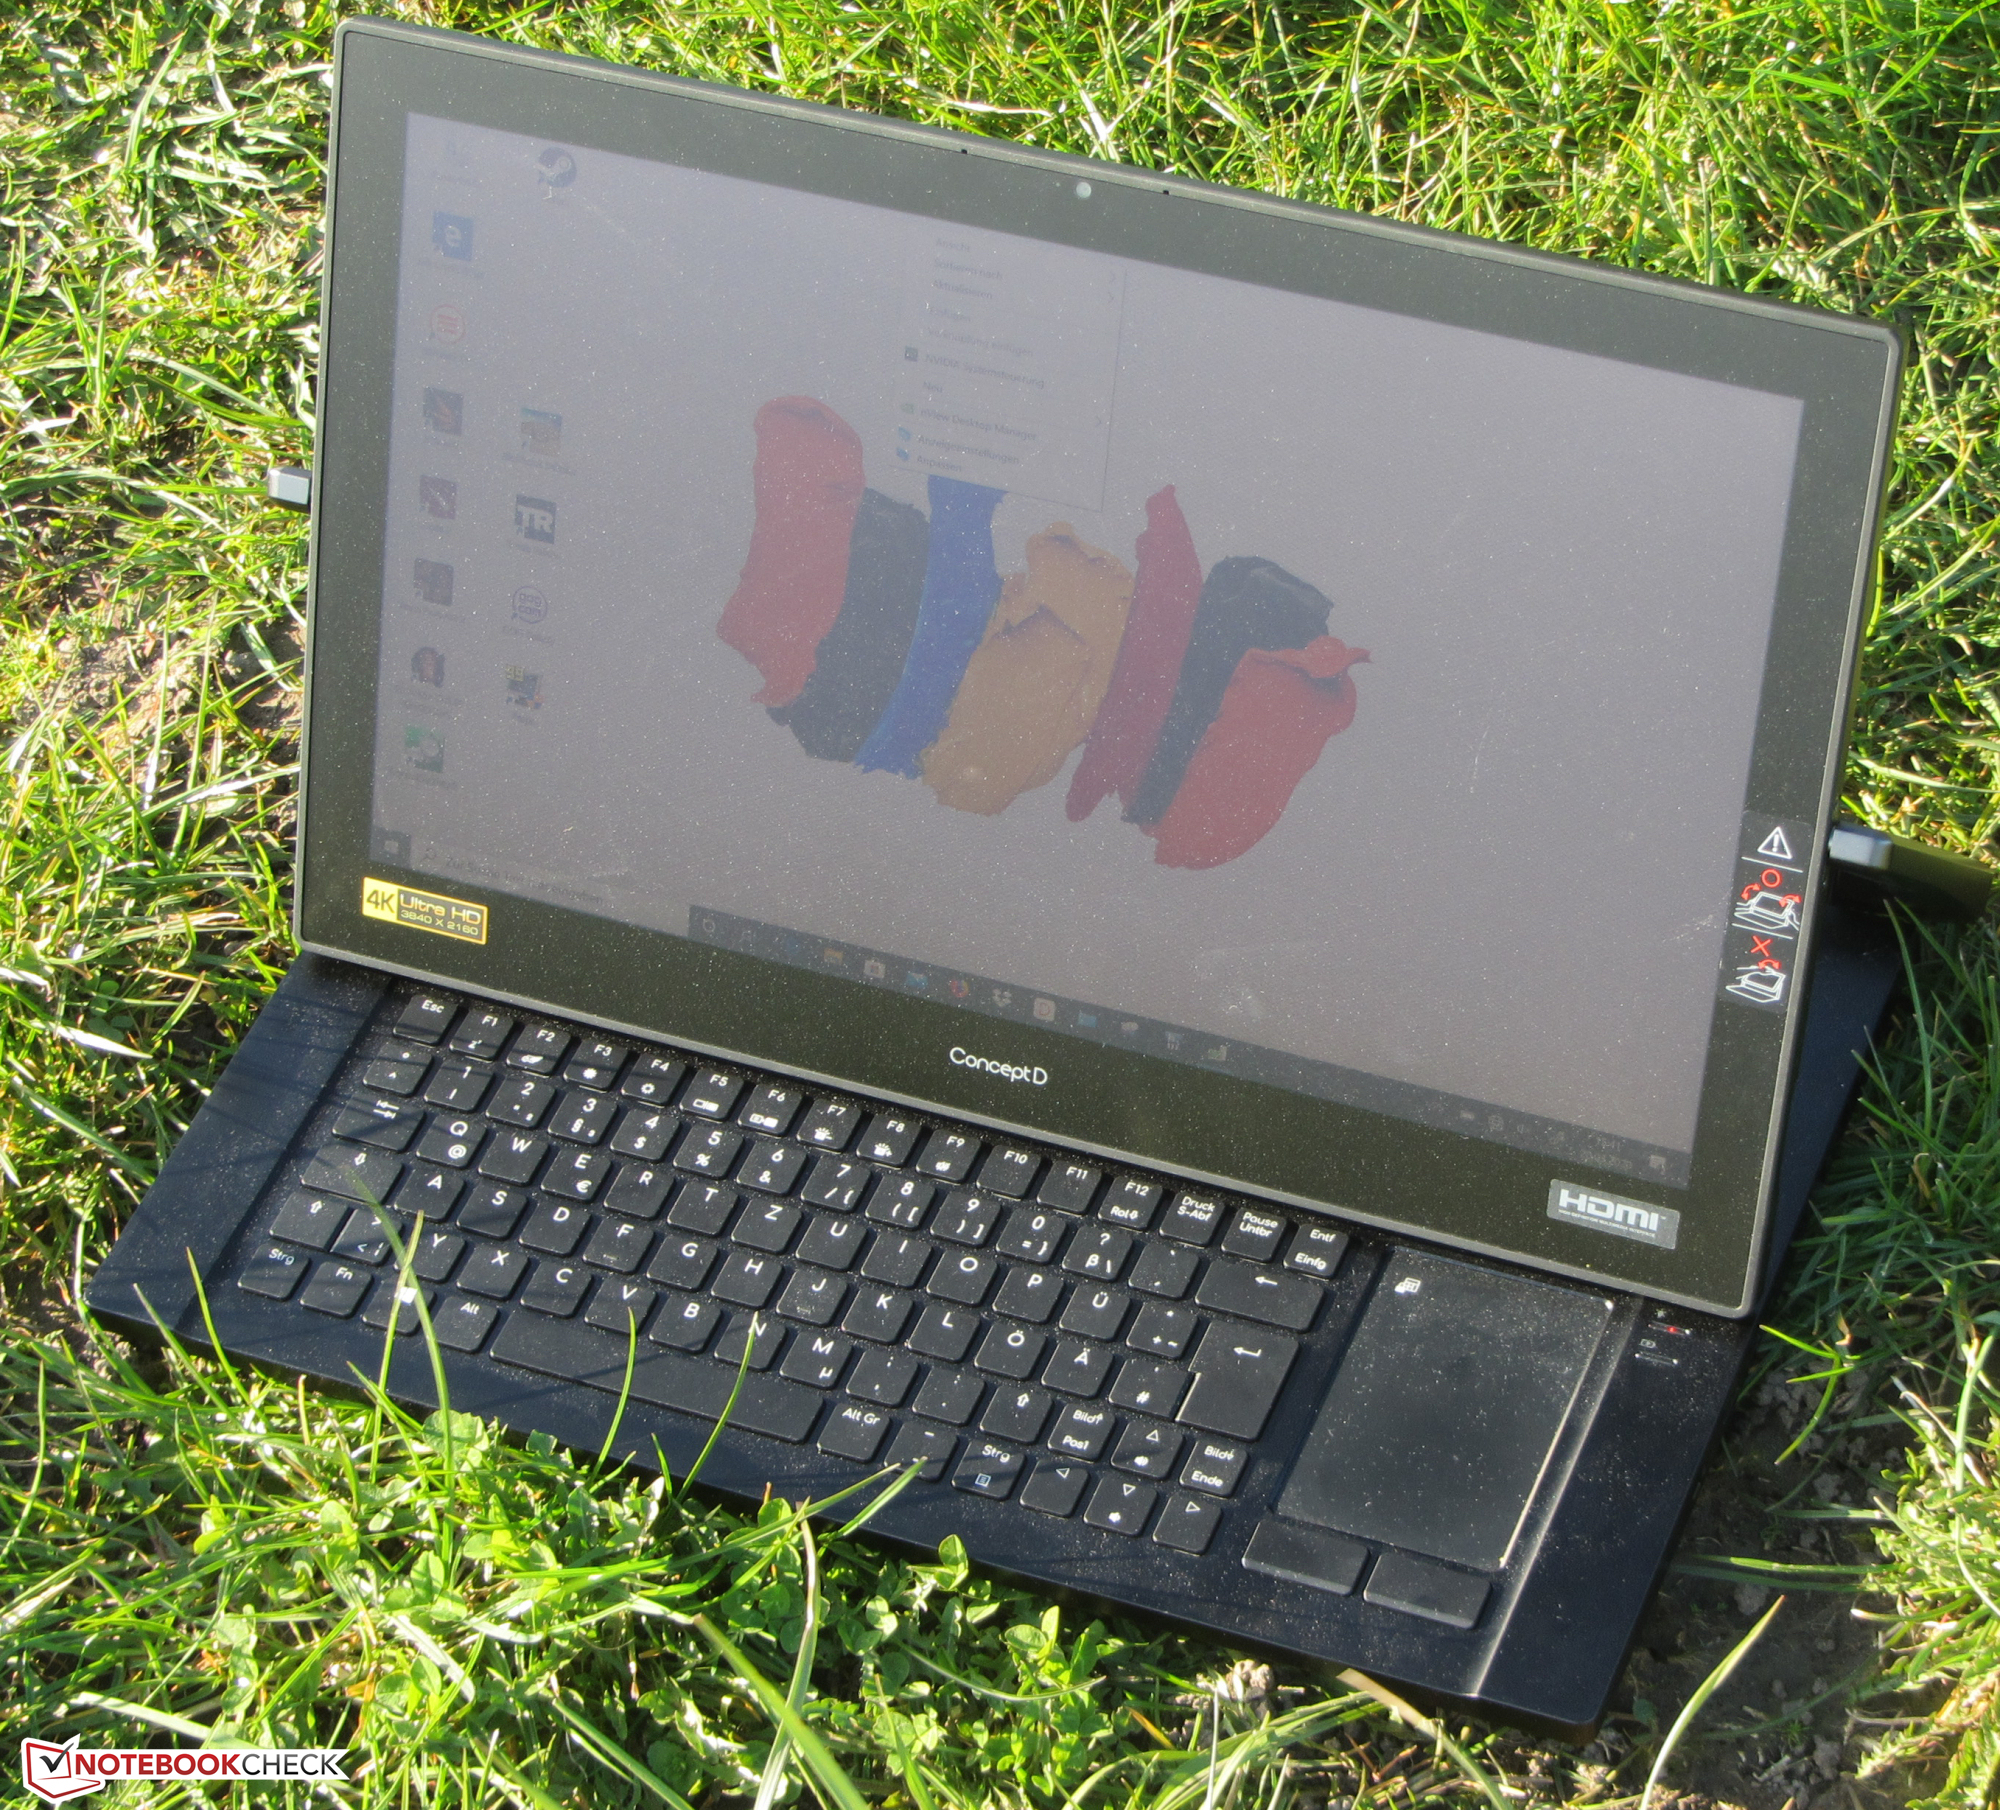
De ConceptD plaatst zijn hardware in een slanke, goed geconstrueerde metalen behuizing. De kolossale scharnieren van de convertible zijn een opvallend kenmerk. Deze houden het scherm stevig op zijn plaats ongeacht op welke hoek je het scherm verstelt voor het invoeren met de comfortabele digitale pen.
Het indrukwekkende 4K IPS touchscherm heeft een goede contrastverhouding, goede kijkhoeken, prima helderheid en dankzij Pantone-certificering - fantastische kleuren. Echter slaagden wij er niet in om de door de fabrikant geadverteerde volledige AdobeRGB-kleurbereik te halen op dit notebook. Volgens onze metingen wordt dit maar 84% procent gedekt (98% sRGB).
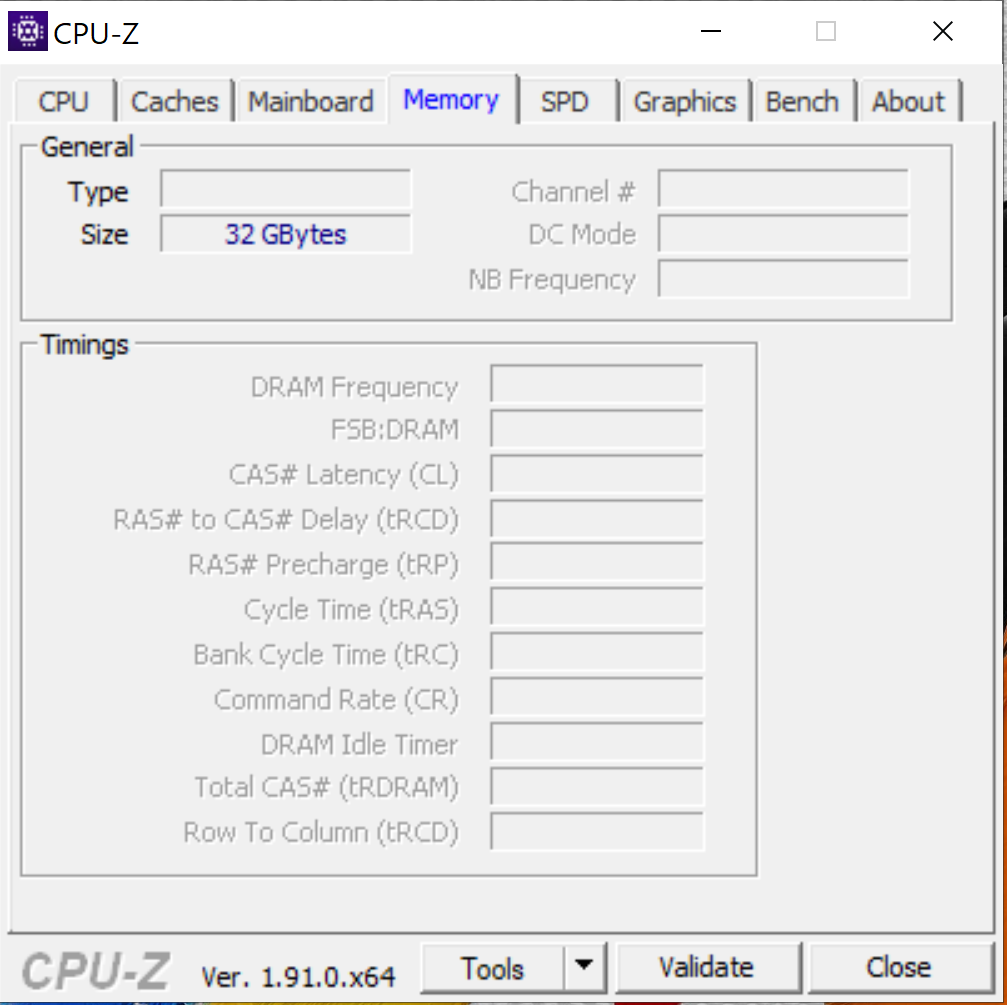
Verder biedt de ingebouwde NVMe SSD niet alleen goede overdrachtssnelheden maar ook veel opslagruimte (1 TB). Er is ook een extra slot voor een tweede M.2 2280 SSD. Als beide SSD's geïnstalleerd zijn kunnen deze gebruikt worden in RAID 0.
Acer ConceptD 9 Pro
- 30-03-2020 v7 (old)
Sascha Mölck
Price comparison
