Dell Precision 5470 werkstation review: Nvidia RTX A1000 debuut
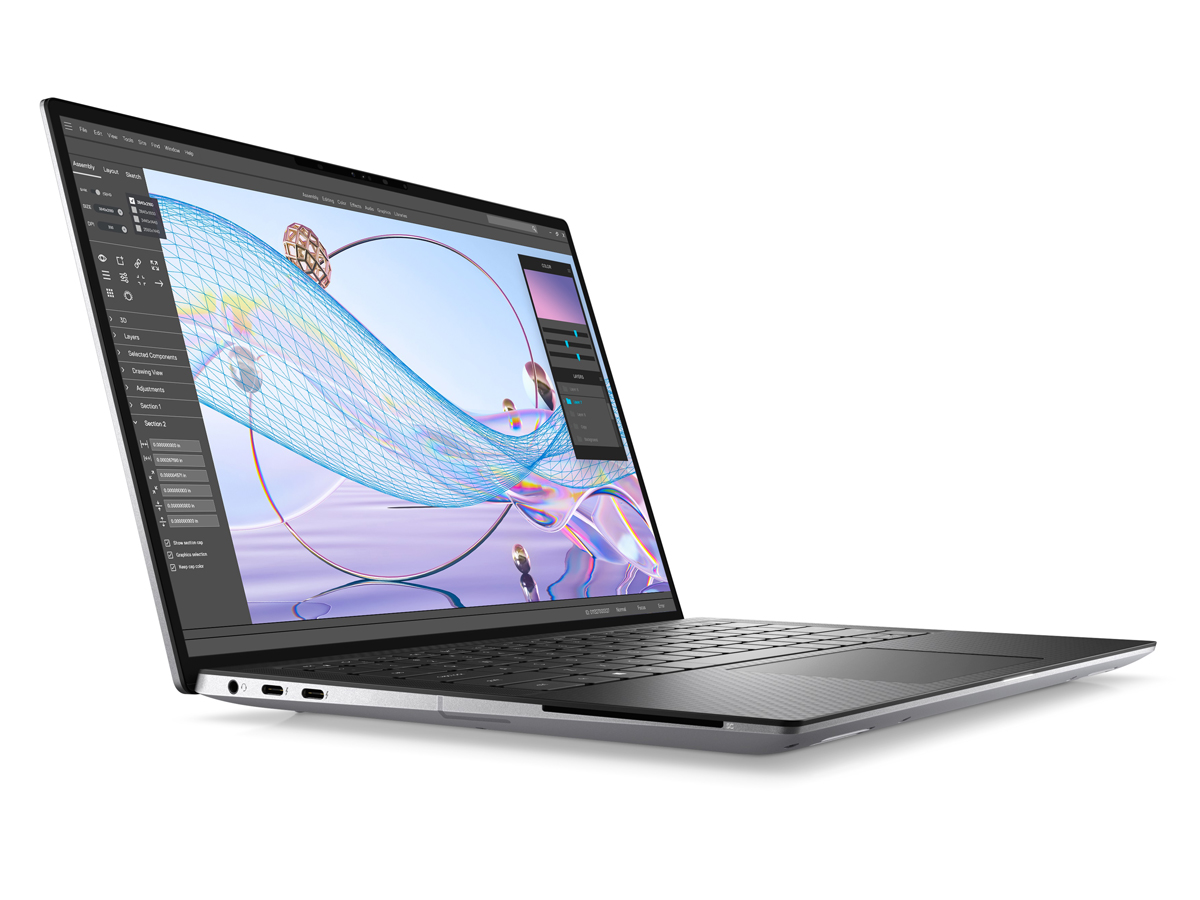
De Precision 5470 is Dell's kleinste mobiele werkstation tot nu toe. Net als de op de XPS 17 geïnspireerde Precision 5750 en XPS 15-geïnspireerde Precision 5560is de 14-inch Precision 5470 qua uiterlijk en ontwerp geïnspireerd op de XPS 13 9300/9310. Als je in het verleden met een XPS-systeem hebt gespeeld, dan zou de Precision 5470 er heel vertrouwd uit moeten zien en aan moeten voelen.
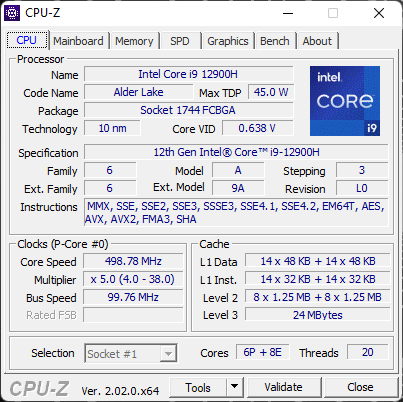
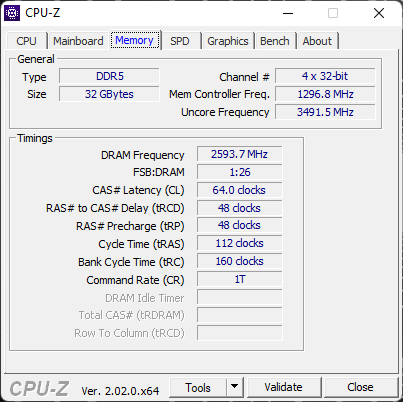
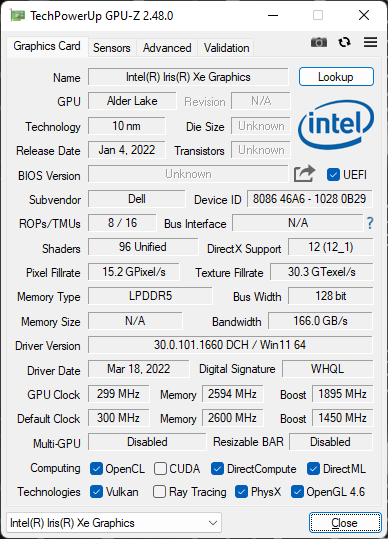
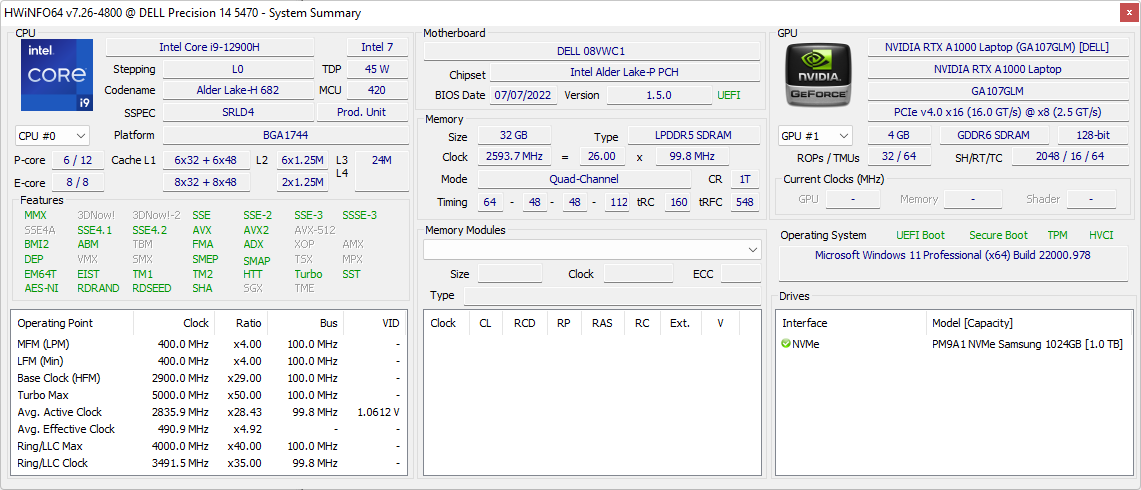
De twee onderscheidende factoren van de Precision 5470 hebben betrekking op zijn 12e generatie Core H-serie CPU en optionele Nvidia RTX A1000 GPU voor een immense hoeveelheid rekenkracht gezien de 14-inch vormfactor. Onze specifieke recensie-eenheid wordt geleverd met de Core i9-12900H CPU, A1000 GPU, en 1600p glanzend touchscreen voor ongeveer $ 3000 USD retail. Andere SKU's met de i5-12500H tot i7-12800H, alleen geïntegreerde Iris Xe graphics, en mat 1200p scherm zijn ook beschikbaar voor lagere startprijzen.
Directe concurrenten zijn andere high-end 14-inch mobiele werkstations zoals de HP ZBook Firefly 14 of Lenovo ThinkPad P14's. Deze groottecategorie is nog nieuw als het gaat om werkstations en daarom zullen we de Precision 5470 ook vergelijken met een paar grotere modellen zoals de ThinkPad P15 G2 of Dell's eigen Precision 5560.
Meer Dell beoordelingen:
Potentiële concurrenten in vergelijking
Evaluatie | Datum | Model | Gewicht | Hoogte | Formaat | Resolutie | Beste prijs |
|---|---|---|---|---|---|---|---|
| 87.6 % v7 (old) | 09-2022 | Dell Precision 5000 5470 i9-12900H, RTX A1000 Laptop GPU | 1.6 kg | 18.95 mm | 14.00" | 2560x1600 | |
| 86.2 % v7 (old) | 06-2022 | Lenovo ThinkPad P15v G2 21A9000XGE i7-11800H, T1200 Laptop GPU | 2.3 kg | 22.7 mm | 15.60" | 1920x1080 | |
| 88.3 % v7 (old) | 10-2021 | Dell Precision 5000 5560 i7-11850H, RTX A2000 Laptop GPU | 2 kg | 18 mm | 15.60" | 3840x2400 | |
| 85.2 % v7 (old) | 09-2021 | Lenovo ThinkPad P14s G2 AMD R7 PRO 5850U, Vega 8 | 1.5 kg | 17.9 mm | 14.00" | 3840x2160 | |
| 85.2 % v7 (old) | 04-2021 | HP ZBook Firefly 14 G8 2C9Q2EA i7-1165G7, T500 Laptop GPU | 1.4 kg | 17.9 mm | 14.00" | 1920x1080 | |
| 82.4 % v7 (old) | 01-2021 | HP ZBook Firefly 14 G7 i7-10610U, Quadro P520 | 1.4 kg | 17.9 mm | 14.00" | 1920x1080 |
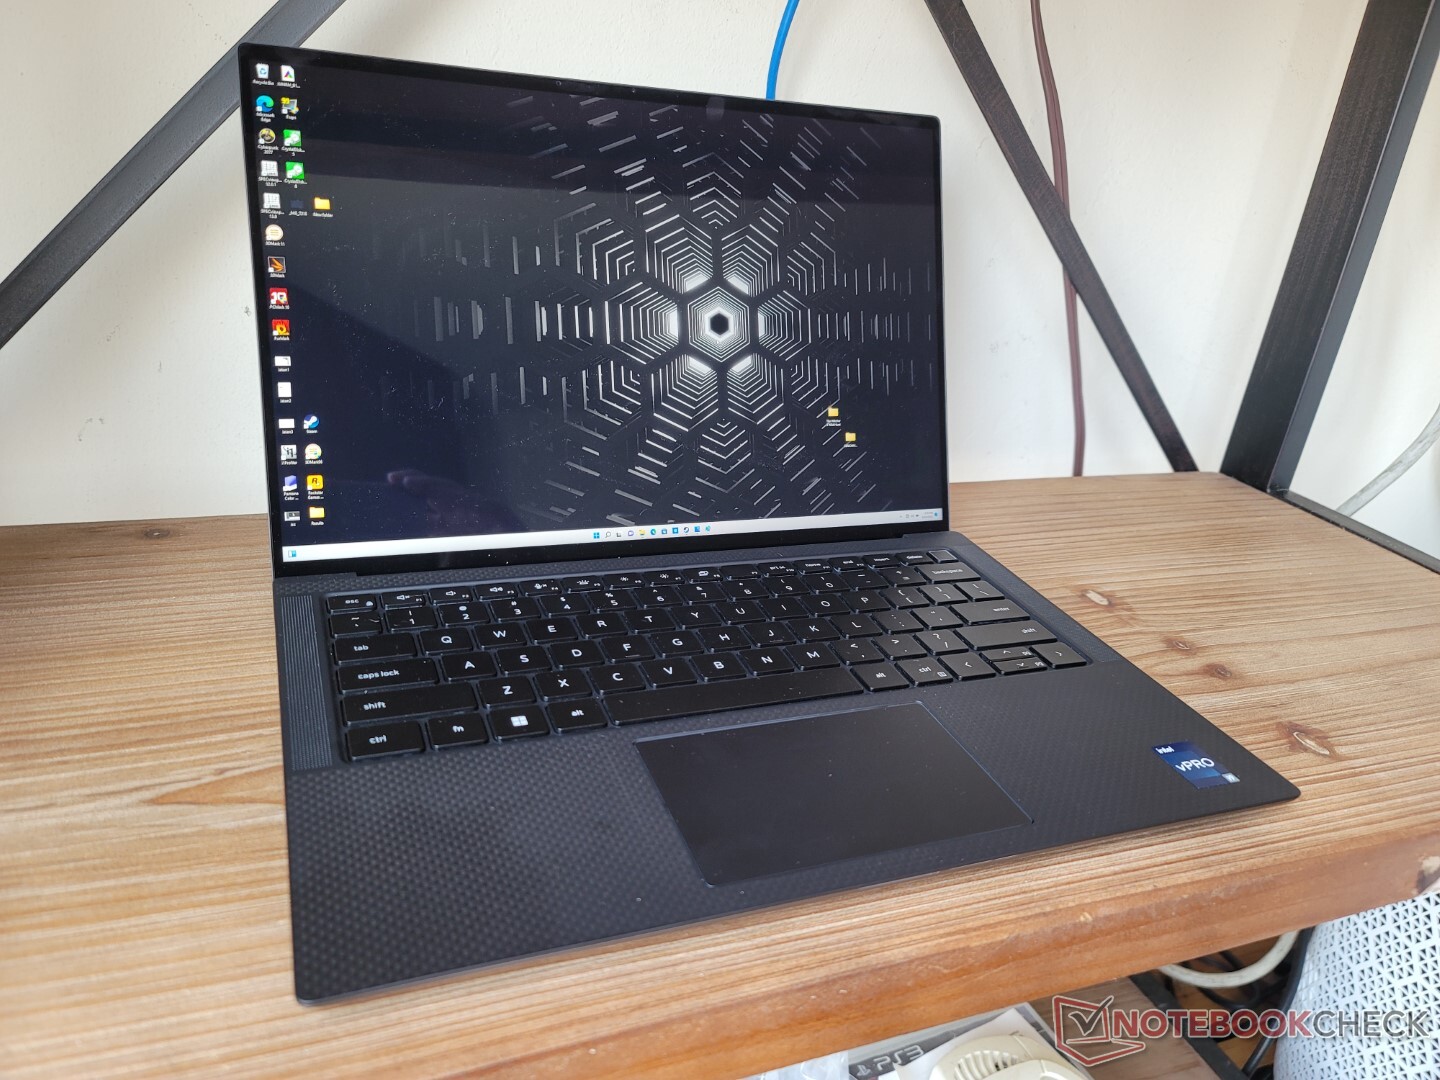
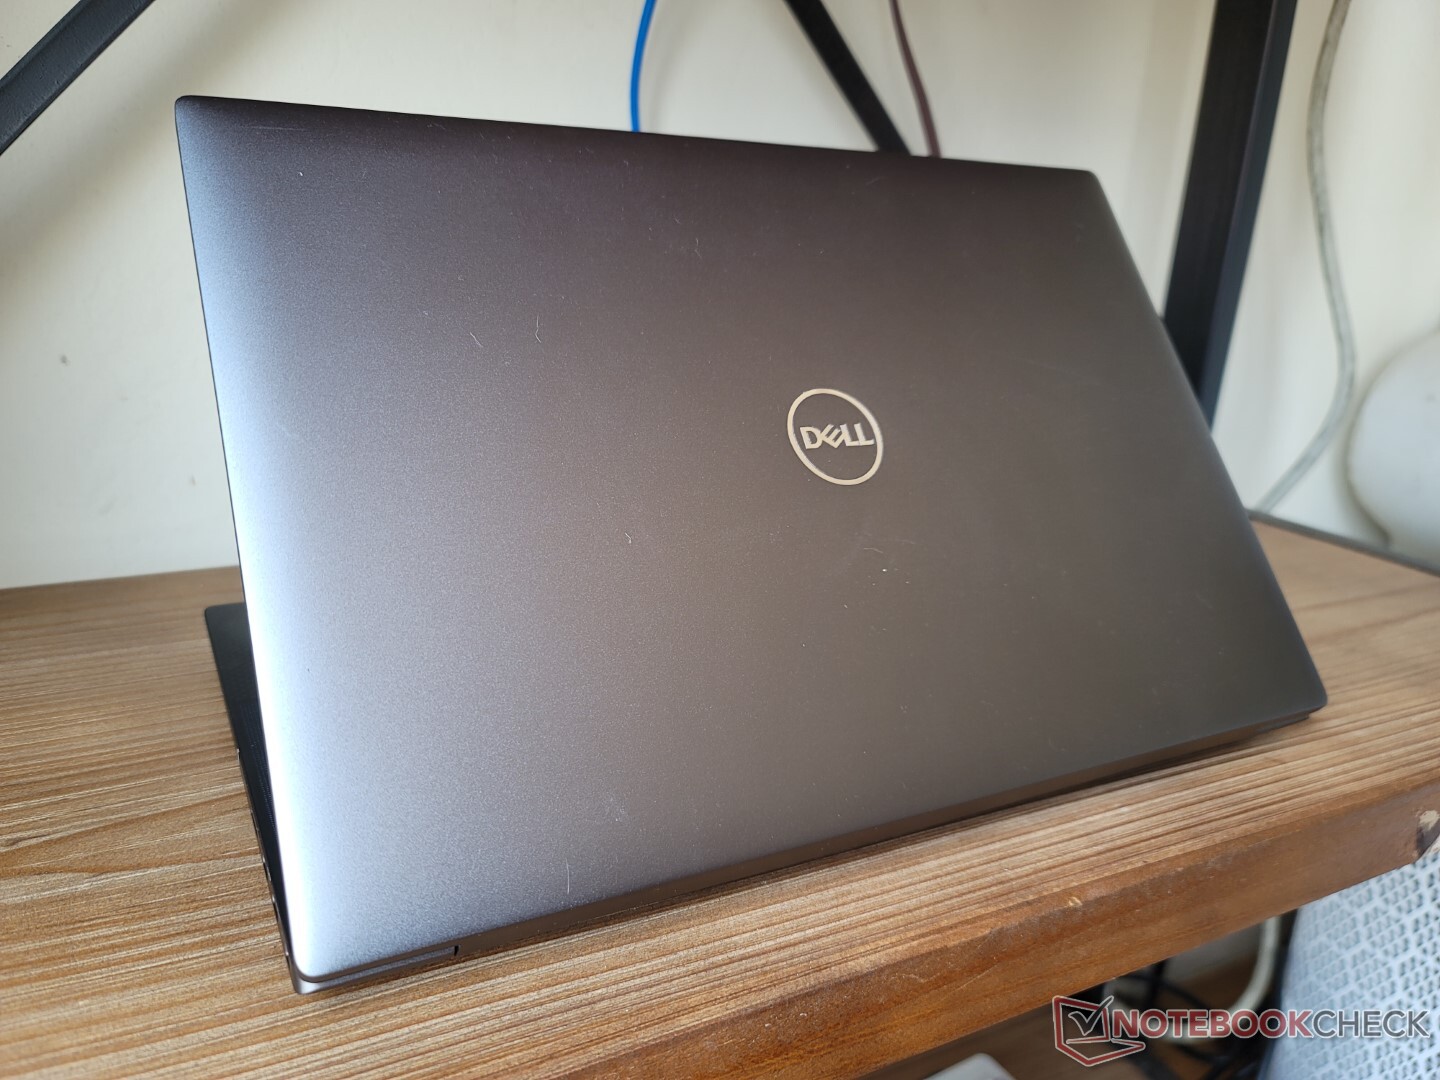
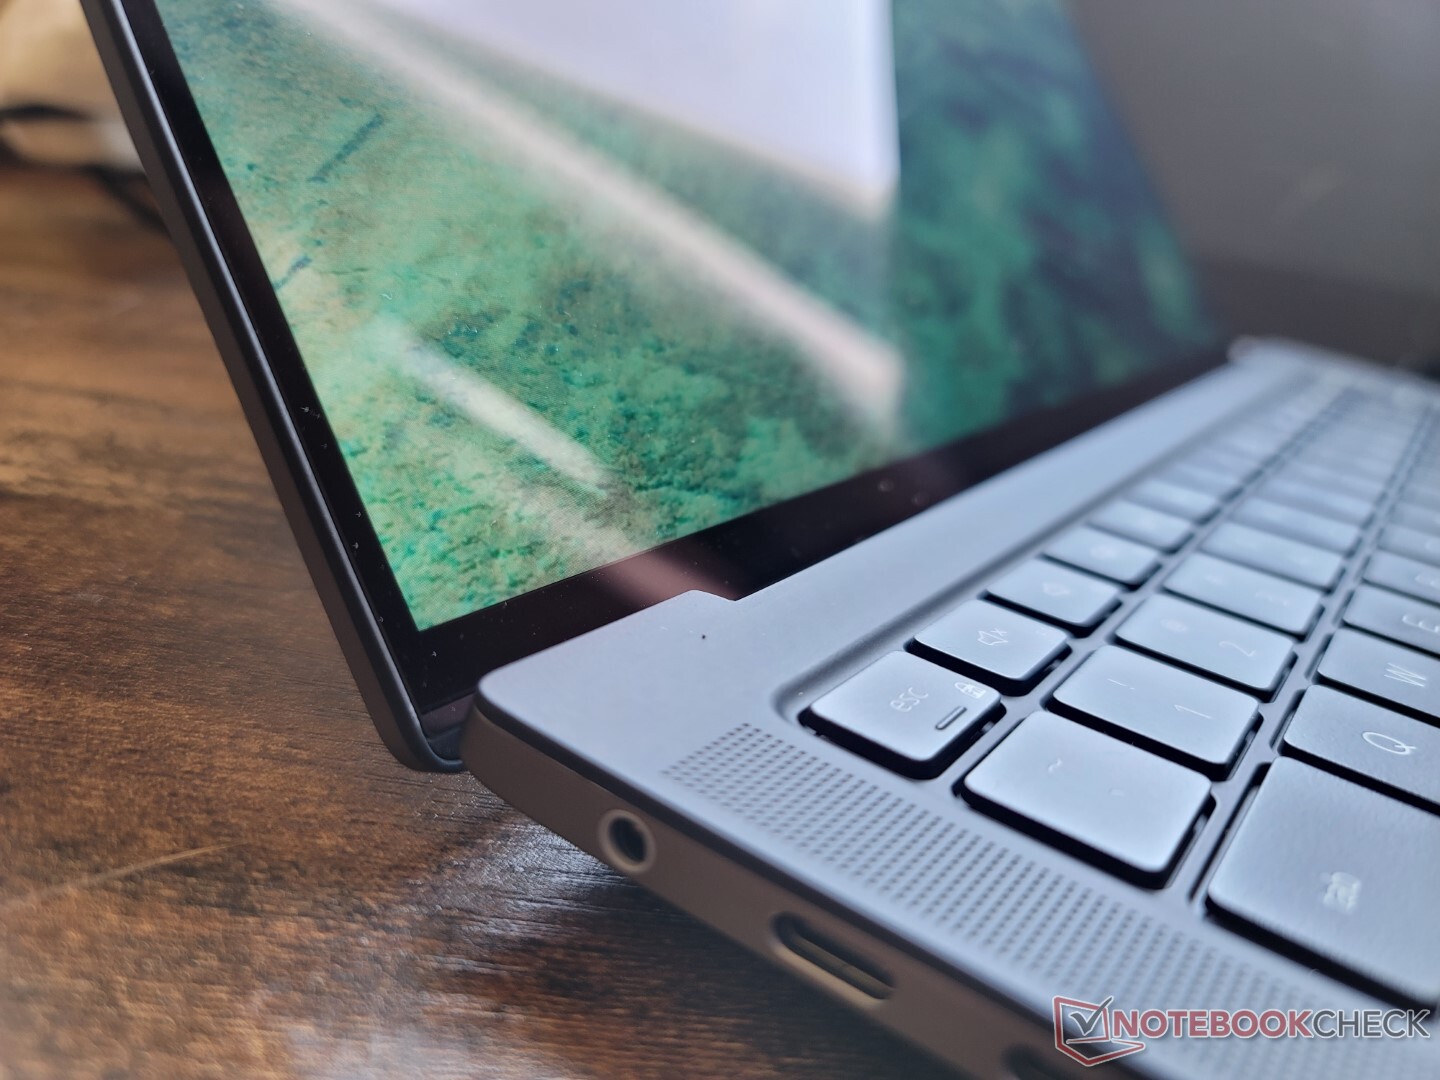
Case - XPS Look And Feel
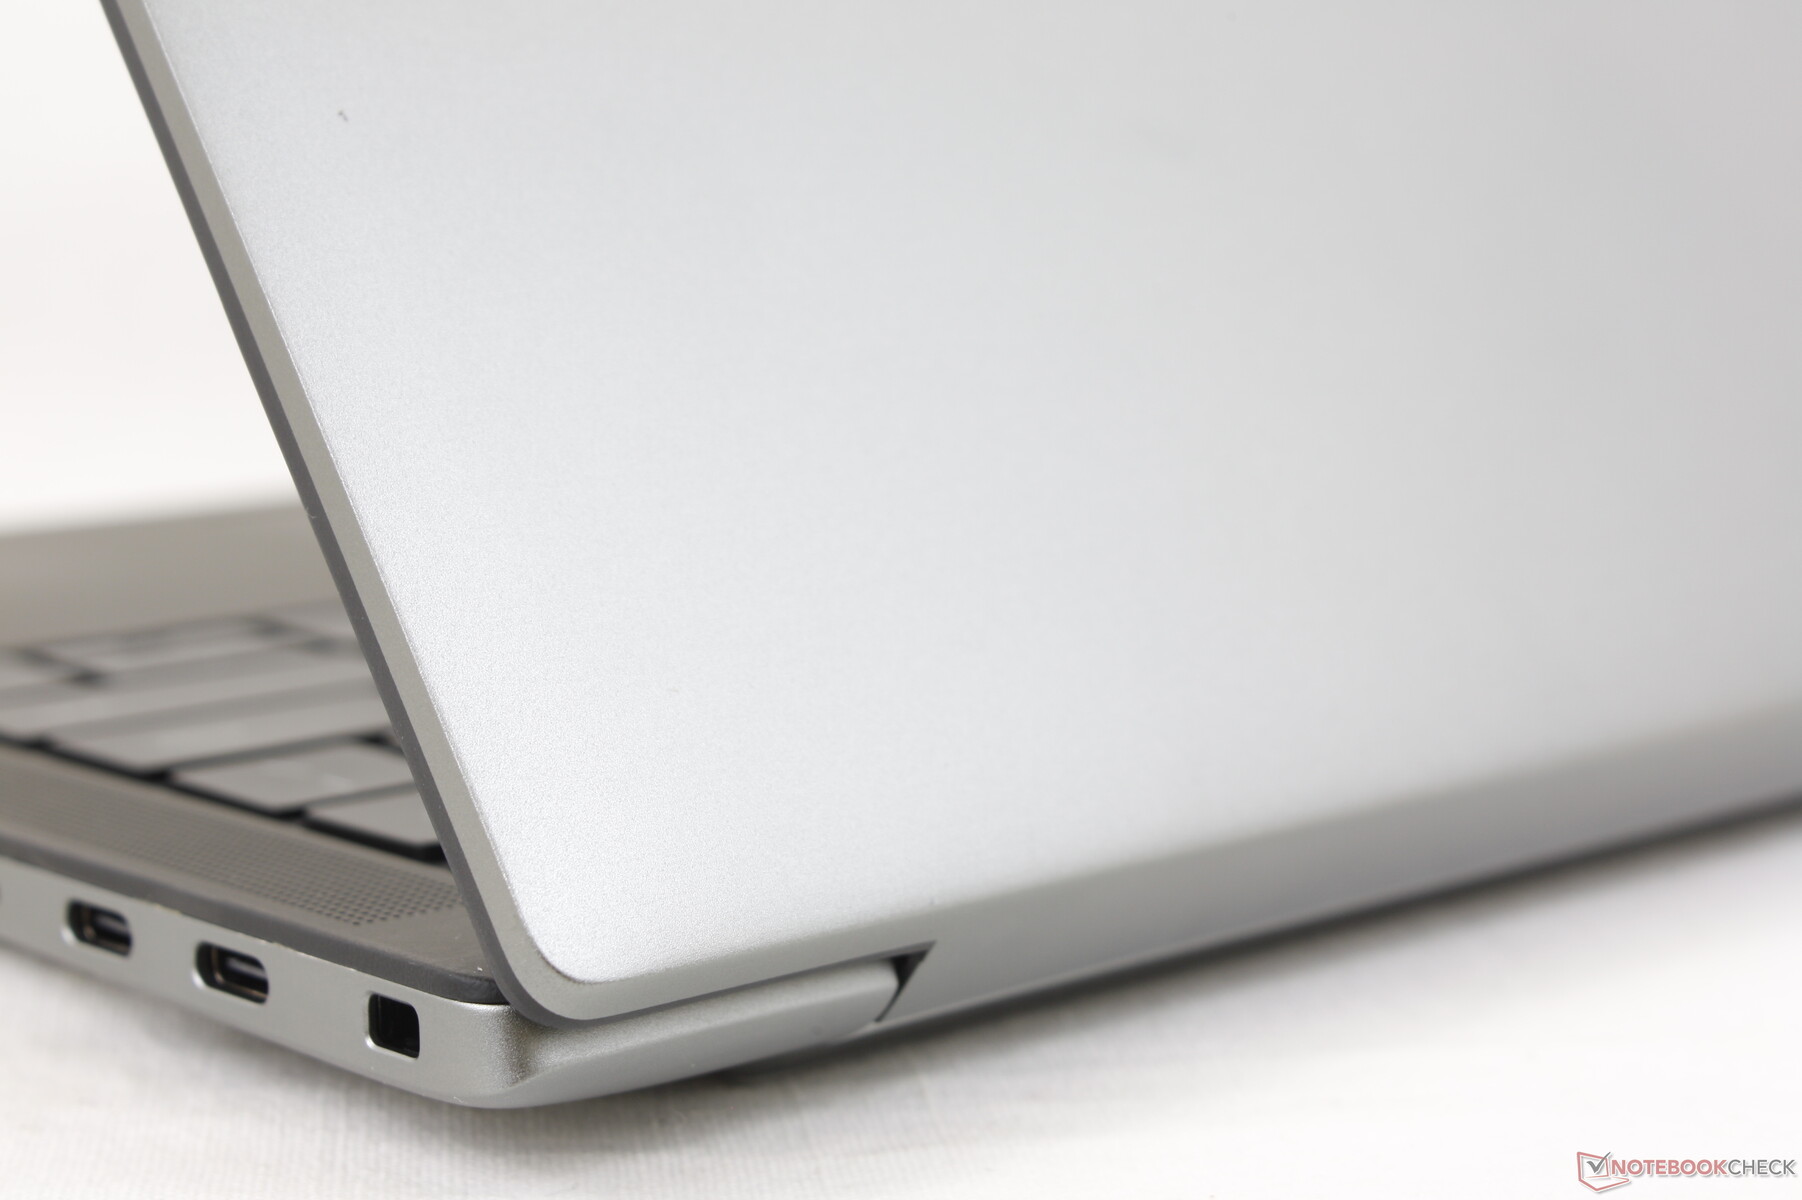
Er is geen XPS 14 op het moment van schrijven, maar de Precision 5470 is in wezen de voorloper ervan. Hij zit comfortabel tussen de klassieke 13-inch XPS 13 en 15-inch XPS 15 terwijl hij dezelfde grijze magnesiumlegering behuizing en koolstofvezel dek gebruikt die standaard zijn geworden op XPS modellen.
De kwaliteit van het chassis is uitstekend, met slechts kleine kraken of kromtrekken wanneer je probeert te draaien of te buigen. Het voelt zeker sterker en professioneler aan dan de nieuwe XPS 13 9320 ontwerp. Toch hadden de scharnieren stijver of stijver kunnen zijn voor een beter gevoel van duurzaamheid.
De 14-inch Precision 5470 is aanzienlijk groter en zwaarder dan de 13-inch XPS 13 9300. Hij is zelfs een beetje dikker dan de XPS 15, terwijl hij qua gewicht dichter bij de XPS 15 dan bij de XPS 13 ligt. Toch is hij nog steeds erg compact voor zijn klasse, vooral in vergelijking met de HP Firefly 14 G8 of ThinkPad P14's.
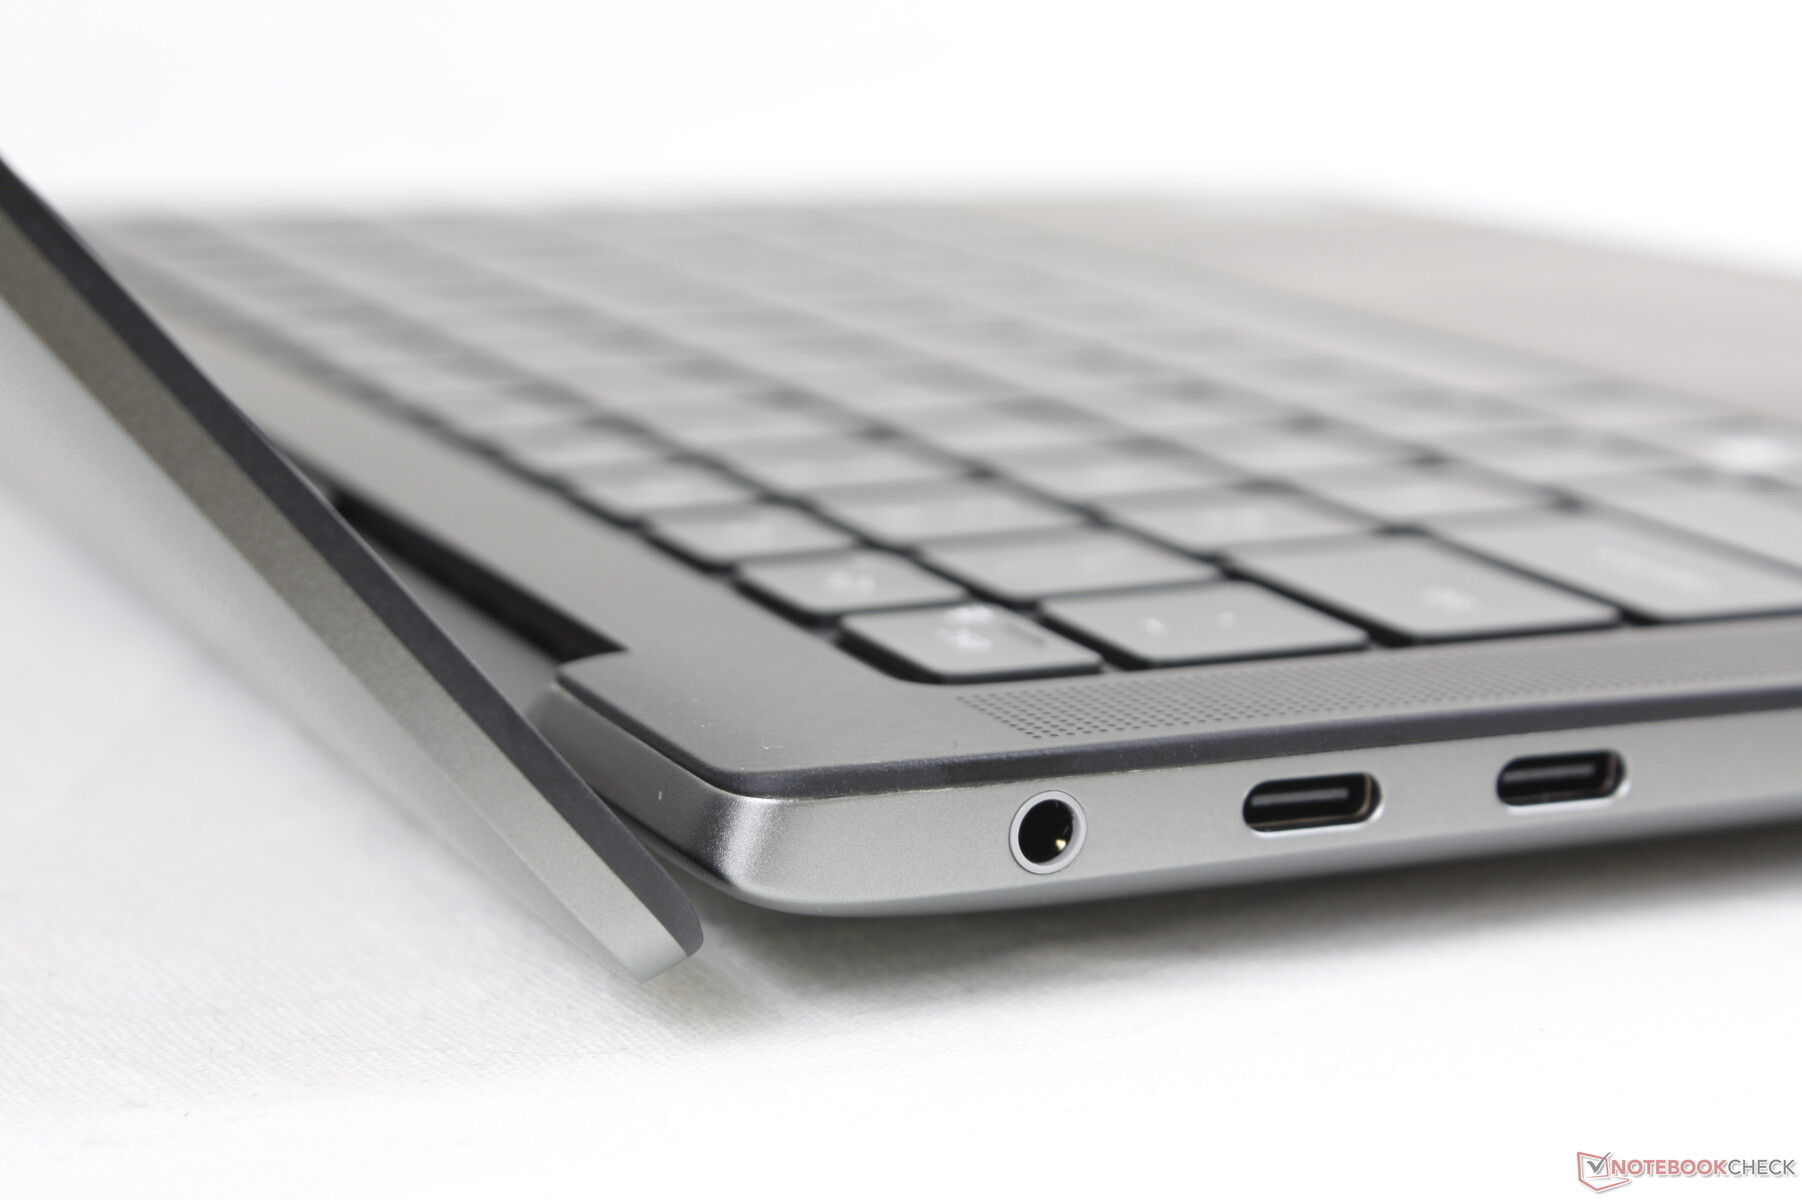
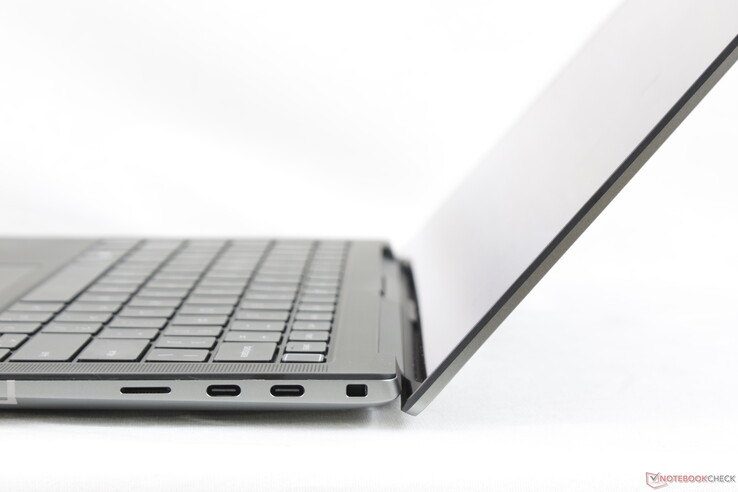
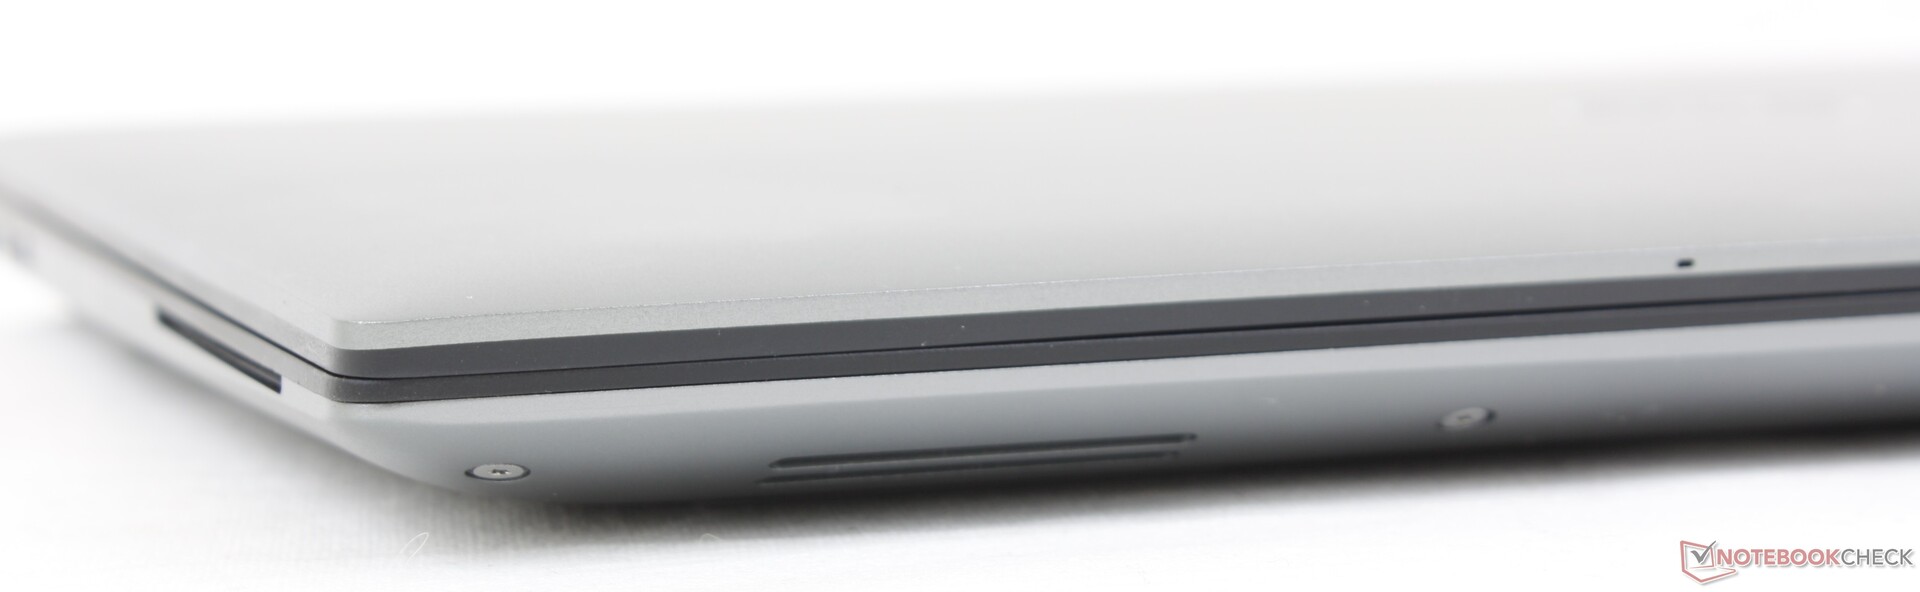
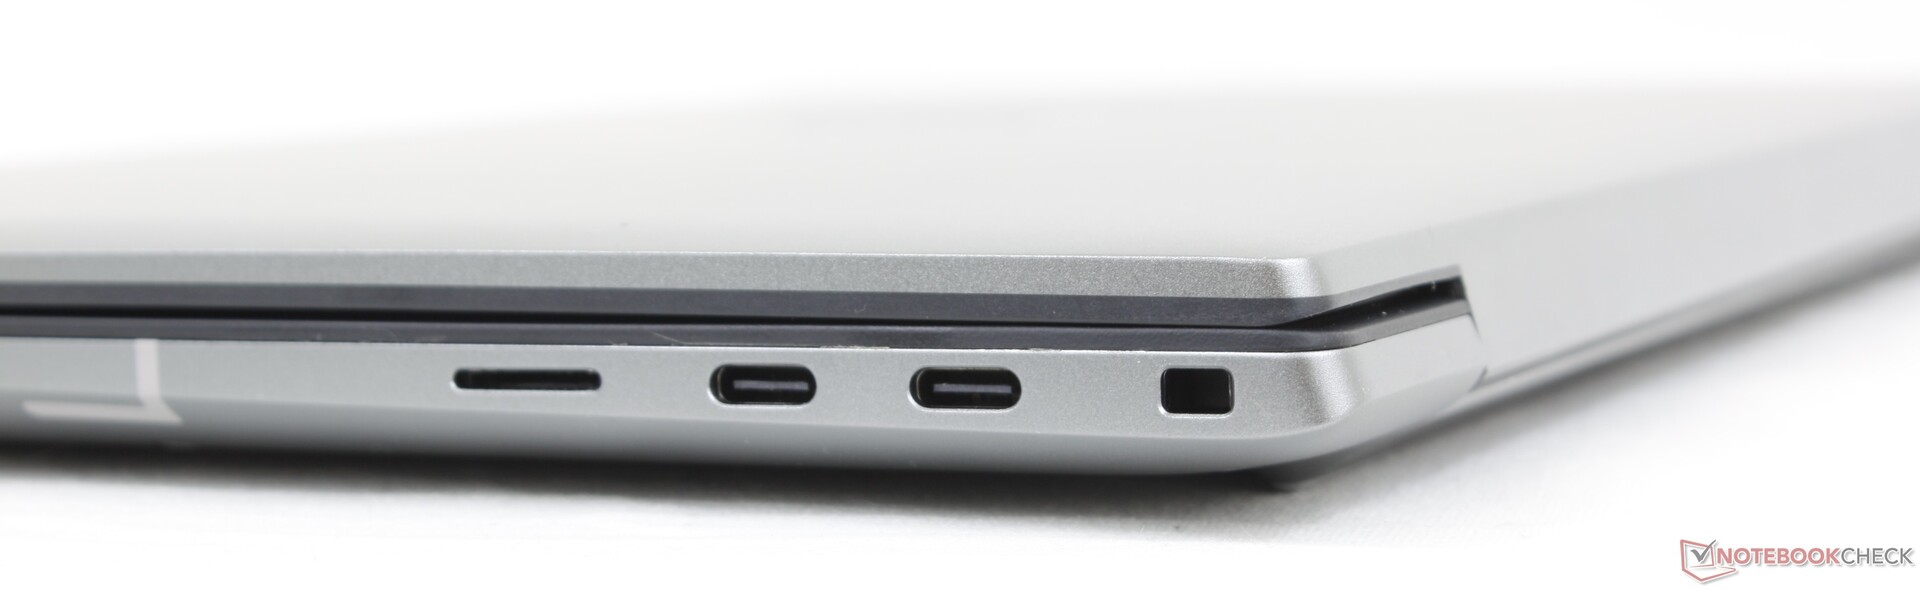
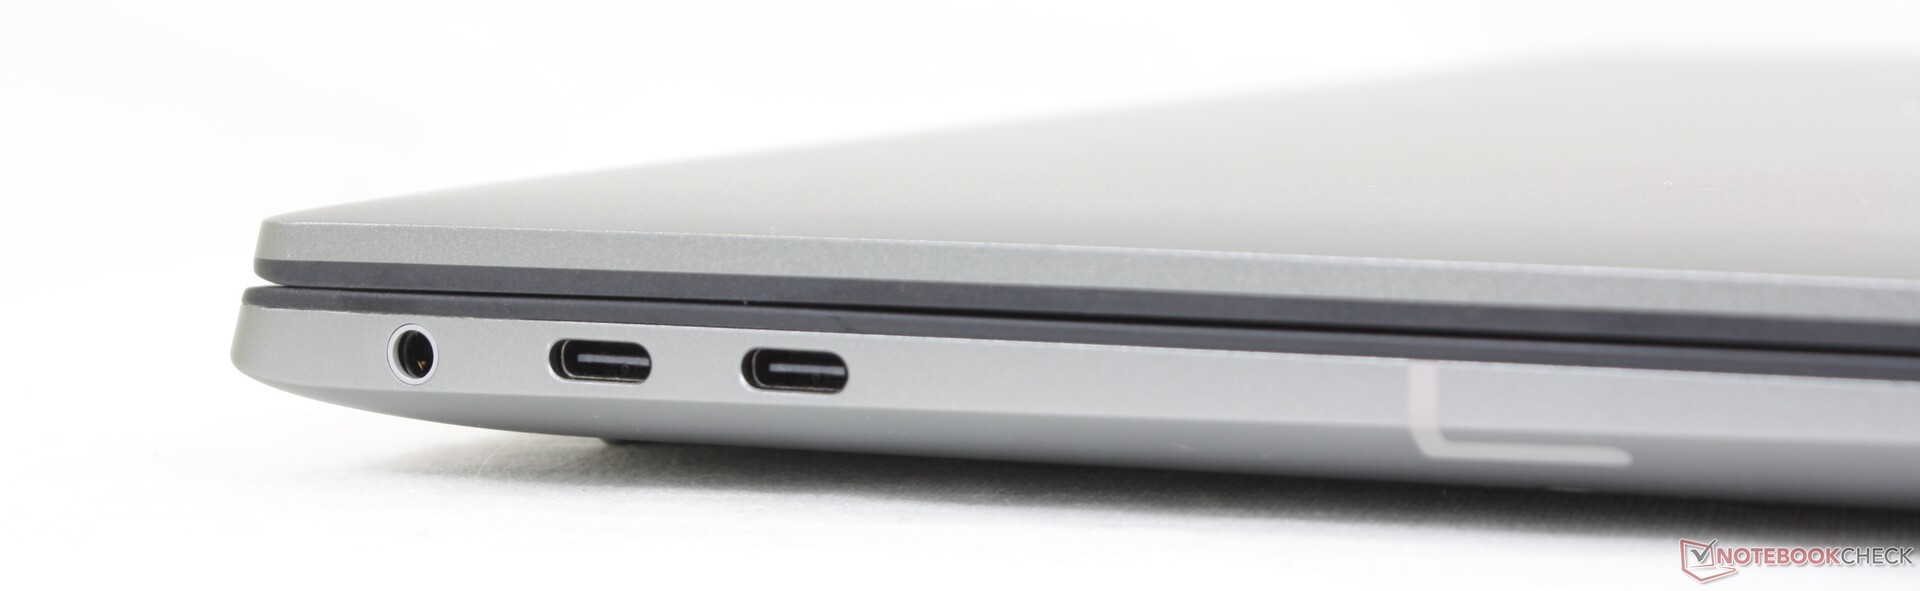
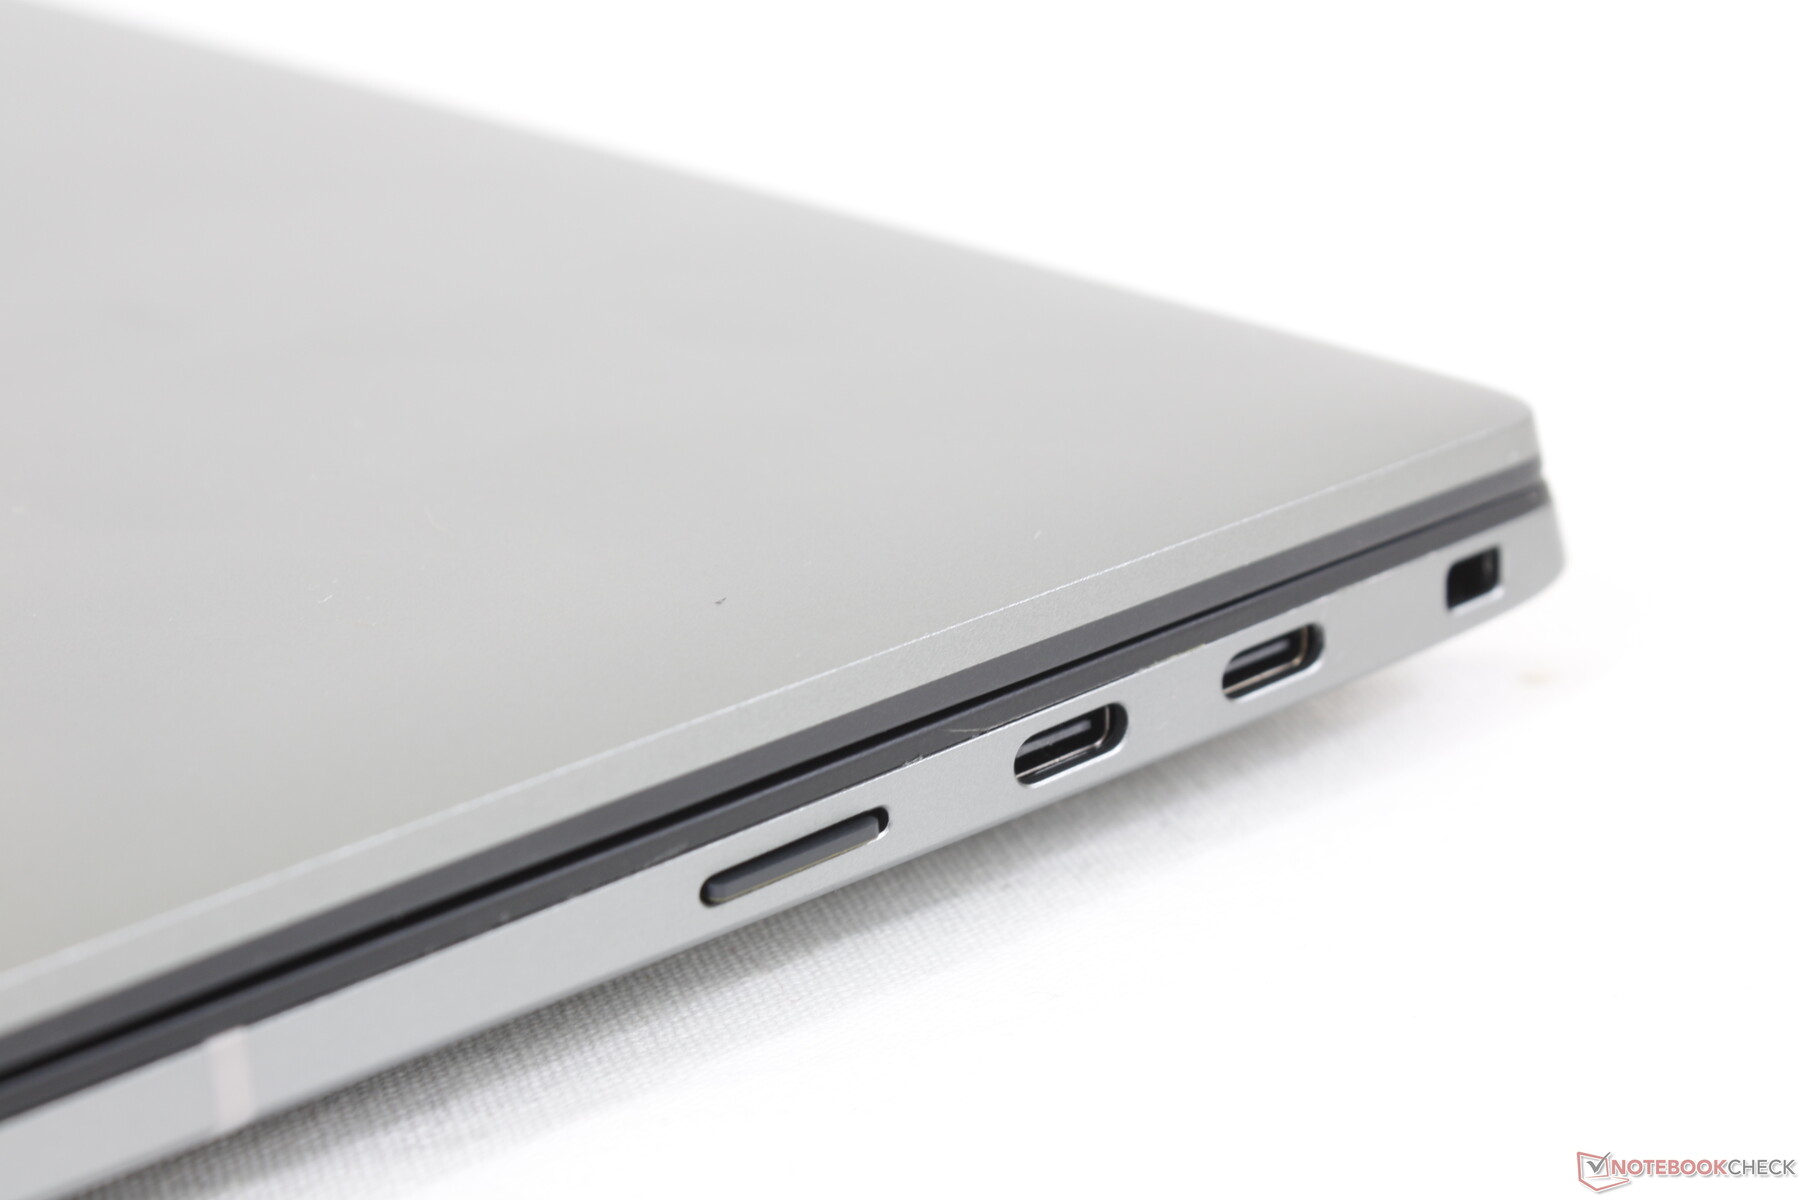
Connectiviteit - alleen USB-C
De poortopties zijn beperkt tot alleen USB-C, terwijl de meeste werkstations een veel grotere verscheidenheid hebben. Precision 5470-bezitters zijn daarom naar verwachting aangewezen op adapters of dockingstations voor het aansluiten van de meeste apparaten.
SD-kaartlezer
De overdrachtsnelheden van de geïntegreerde kaartlezer zijn zeer snel met bijna 230 MB/s van onze UHS-II testkaart. Afhankelijk van de bestandsgrootte kunnen de werkelijke overdrachtsnelheden echter lager uitvallen. Het verplaatsen van 1 GB aan foto's (~4 MB elk) gaat langzamer en duurt ongeveer 13 seconden.
| SD Card Reader | |
| average JPG Copy Test (av. of 3 runs) | |
| Dell Precision 5000 5560 (AV Pro V60) | |
| Lenovo ThinkPad P15v G2 21A9000XGE | |
| Dell Precision 5000 5470 (AV Pro V60) | |
| Lenovo ThinkPad P14s G2 AMD (AV PRO V60) | |
| maximum AS SSD Seq Read Test (1GB) | |
| Lenovo ThinkPad P15v G2 21A9000XGE | |
| Dell Precision 5000 5470 (AV Pro V60) | |
| Dell Precision 5000 5560 (AV Pro V60) | |
| Lenovo ThinkPad P14s G2 AMD (AV PRO V60) | |
Communicatie
Een Intel AX211 wordt standaard geleverd voor Wi-Fi 6E en Bluetooth 5.2 connectiviteit. Hoewel we geen merkbare problemen ondervonden, waren de overdrachtssnelheden trager en variabeler dan verwacht.
| Networking | |
| iperf3 transmit AX12 | |
| Lenovo ThinkPad P15v G2 21A9000XGE | |
| HP ZBook Firefly 14 G8 2C9Q2EA | |
| HP ZBook Firefly 14 G7 | |
| Dell Precision 5000 5560 | |
| Lenovo ThinkPad P14s G2 AMD | |
| iperf3 receive AX12 | |
| HP ZBook Firefly 14 G8 2C9Q2EA | |
| Lenovo ThinkPad P15v G2 21A9000XGE | |
| Dell Precision 5000 5560 | |
| HP ZBook Firefly 14 G7 | |
| Lenovo ThinkPad P14s G2 AMD | |
| iperf3 receive AXE11000 6GHz | |
| Dell Precision 5000 5470 | |
| iperf3 transmit AXE11000 6GHz | |
| Dell Precision 5000 5470 | |
Webcam
De webcam is beperkt tot slechts 1 MP of 720p terwijl de meeste andere laptops al zijn overgegaan op 2 MP of zelfs 5 MP zoals het geval is bij veel high-end HP laptops. De beeldkwaliteit is troebel net als bij de webcam van de XPS 13 serie
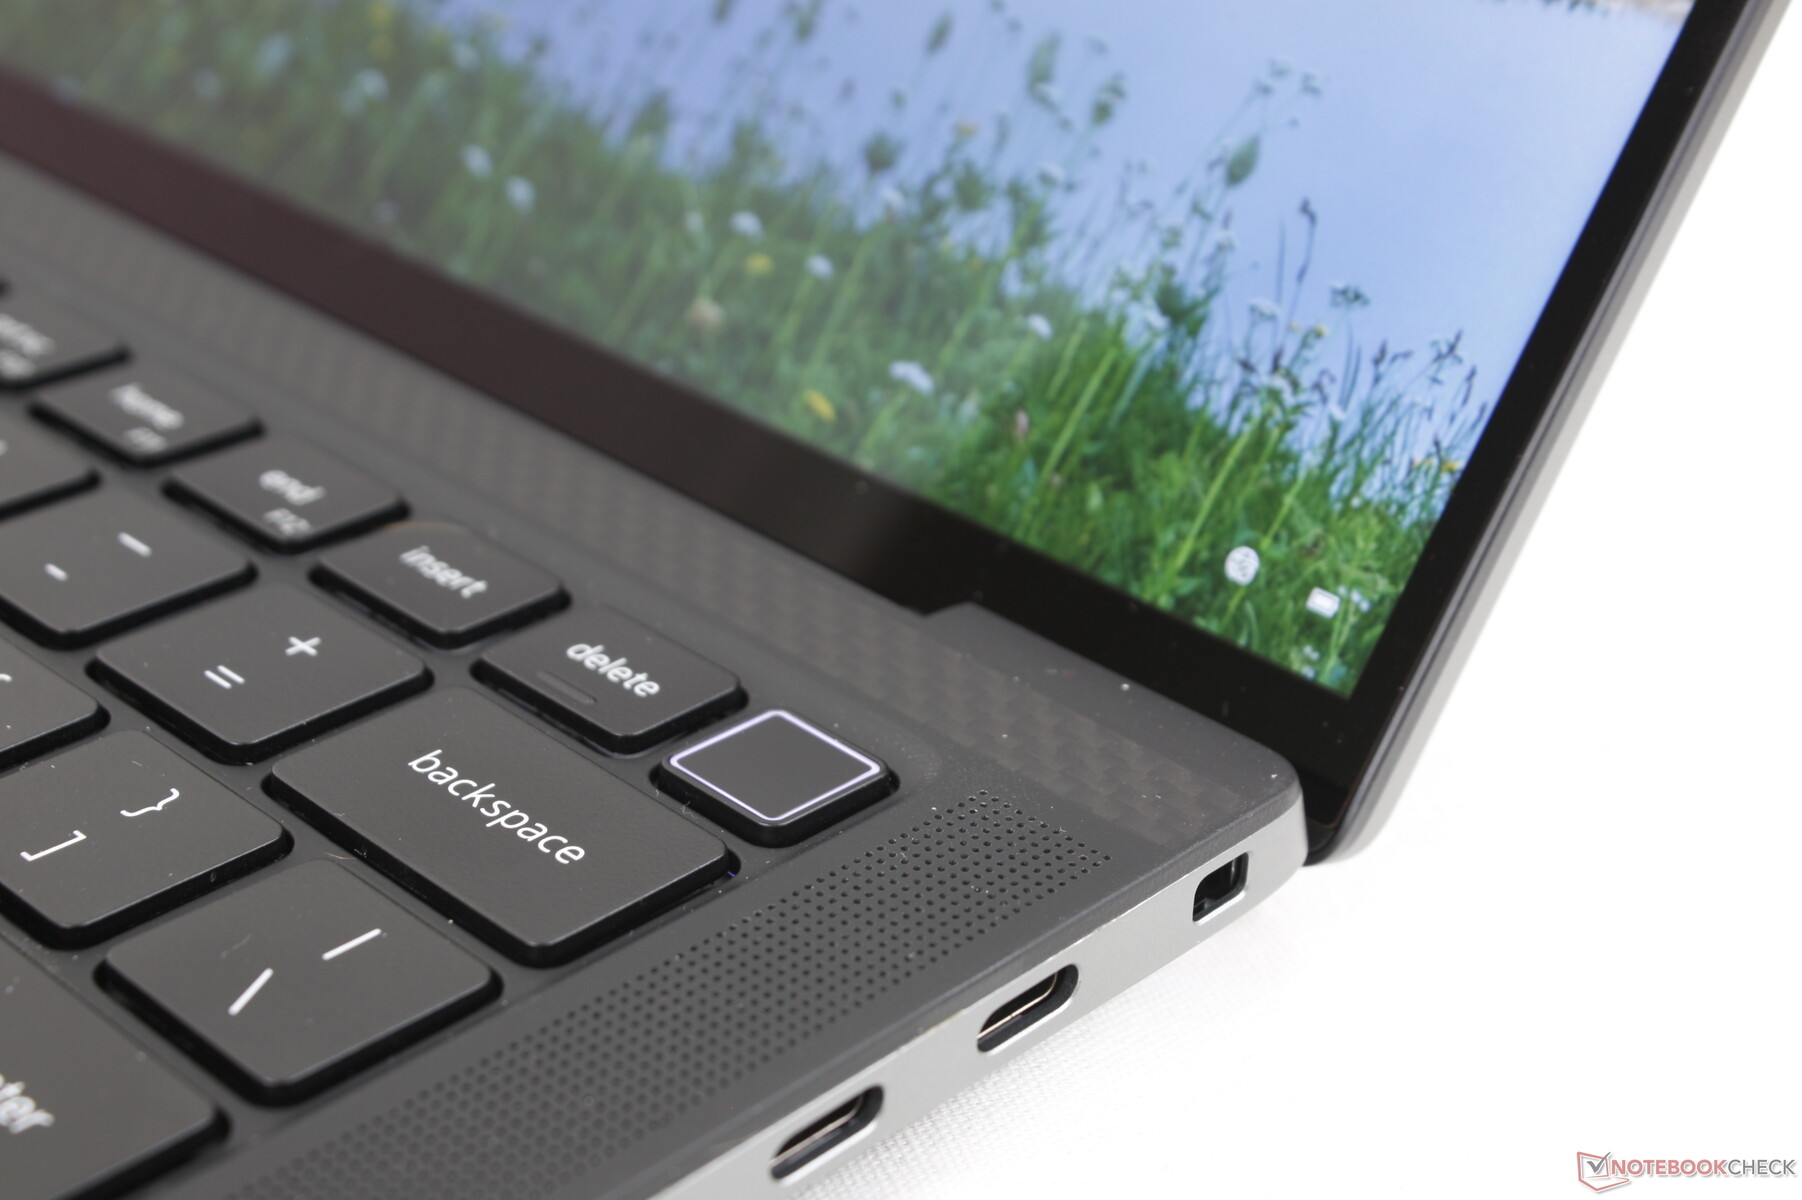
IR is aanwezig voor Hello ondersteuning, maar er is geen webcam shutter voor privacy.


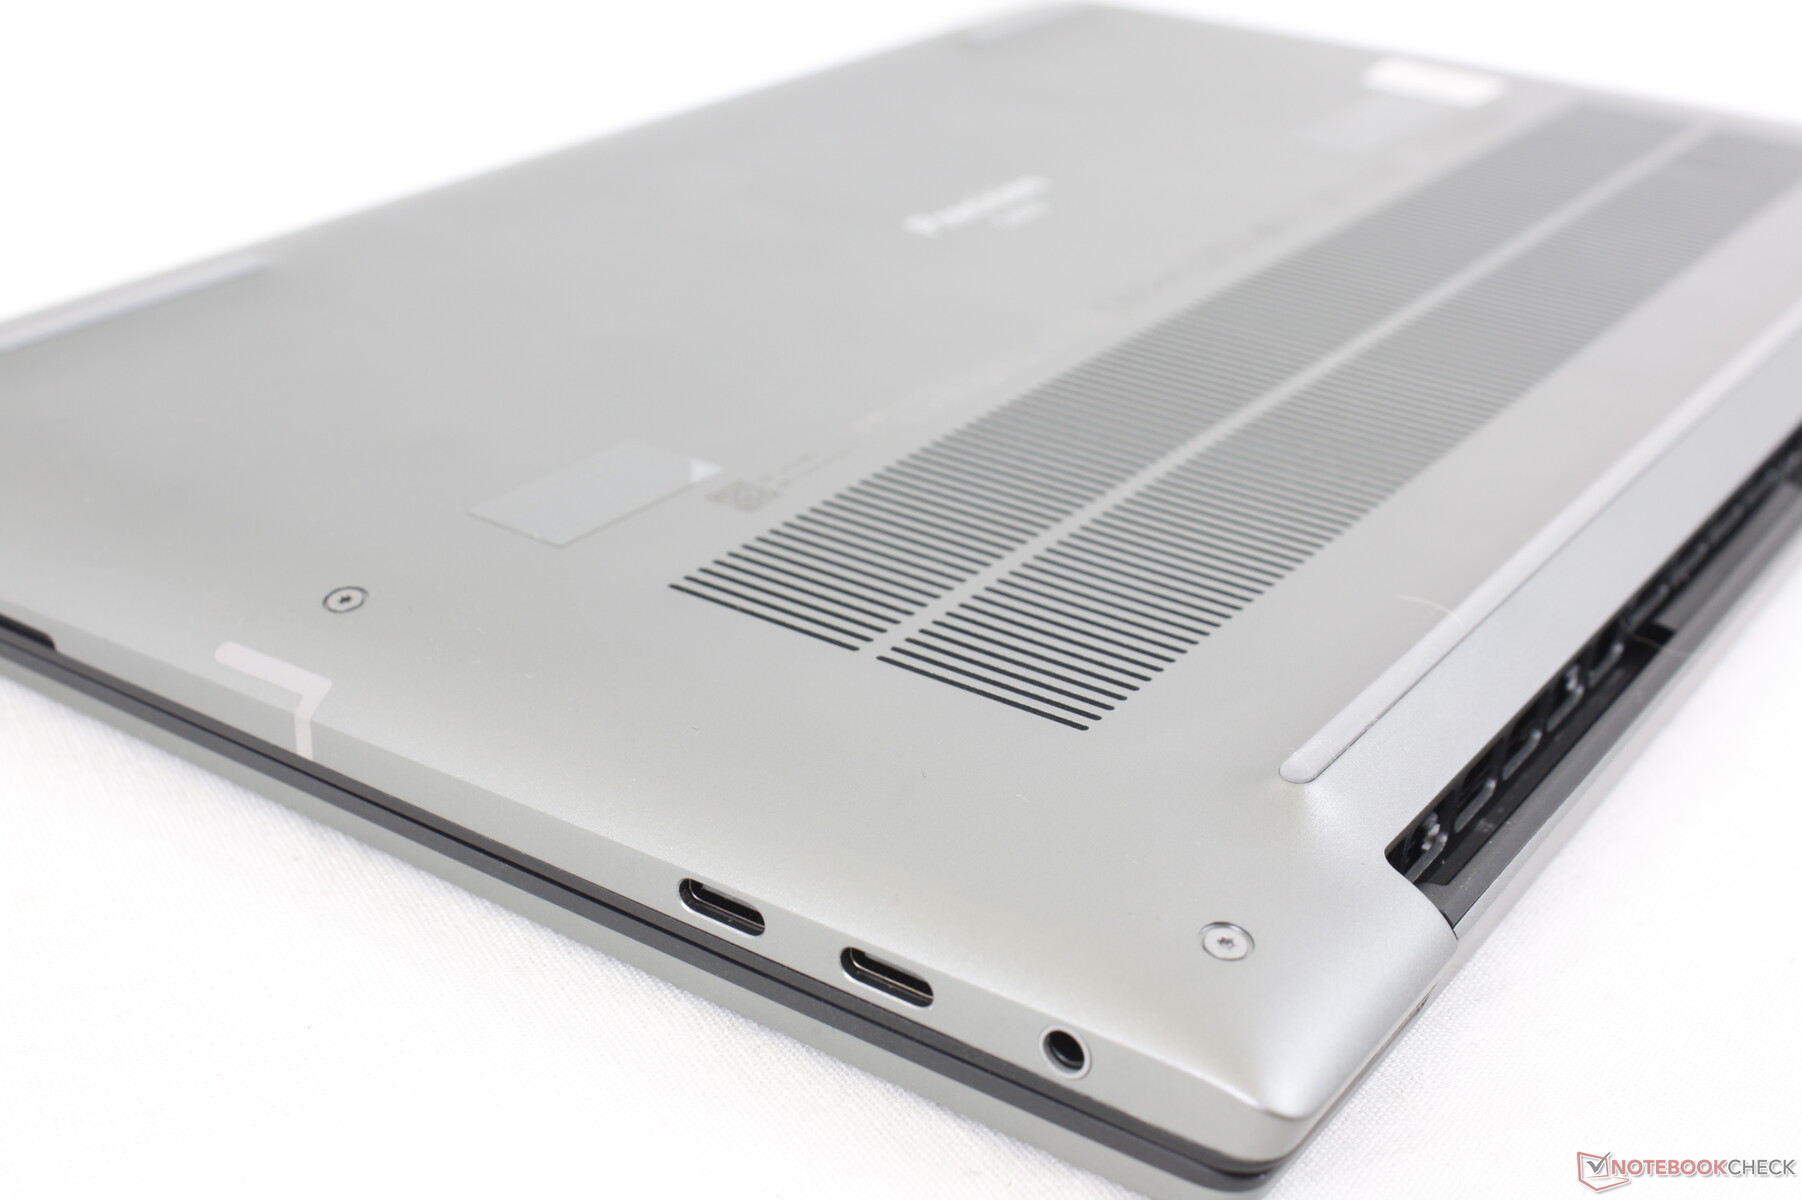
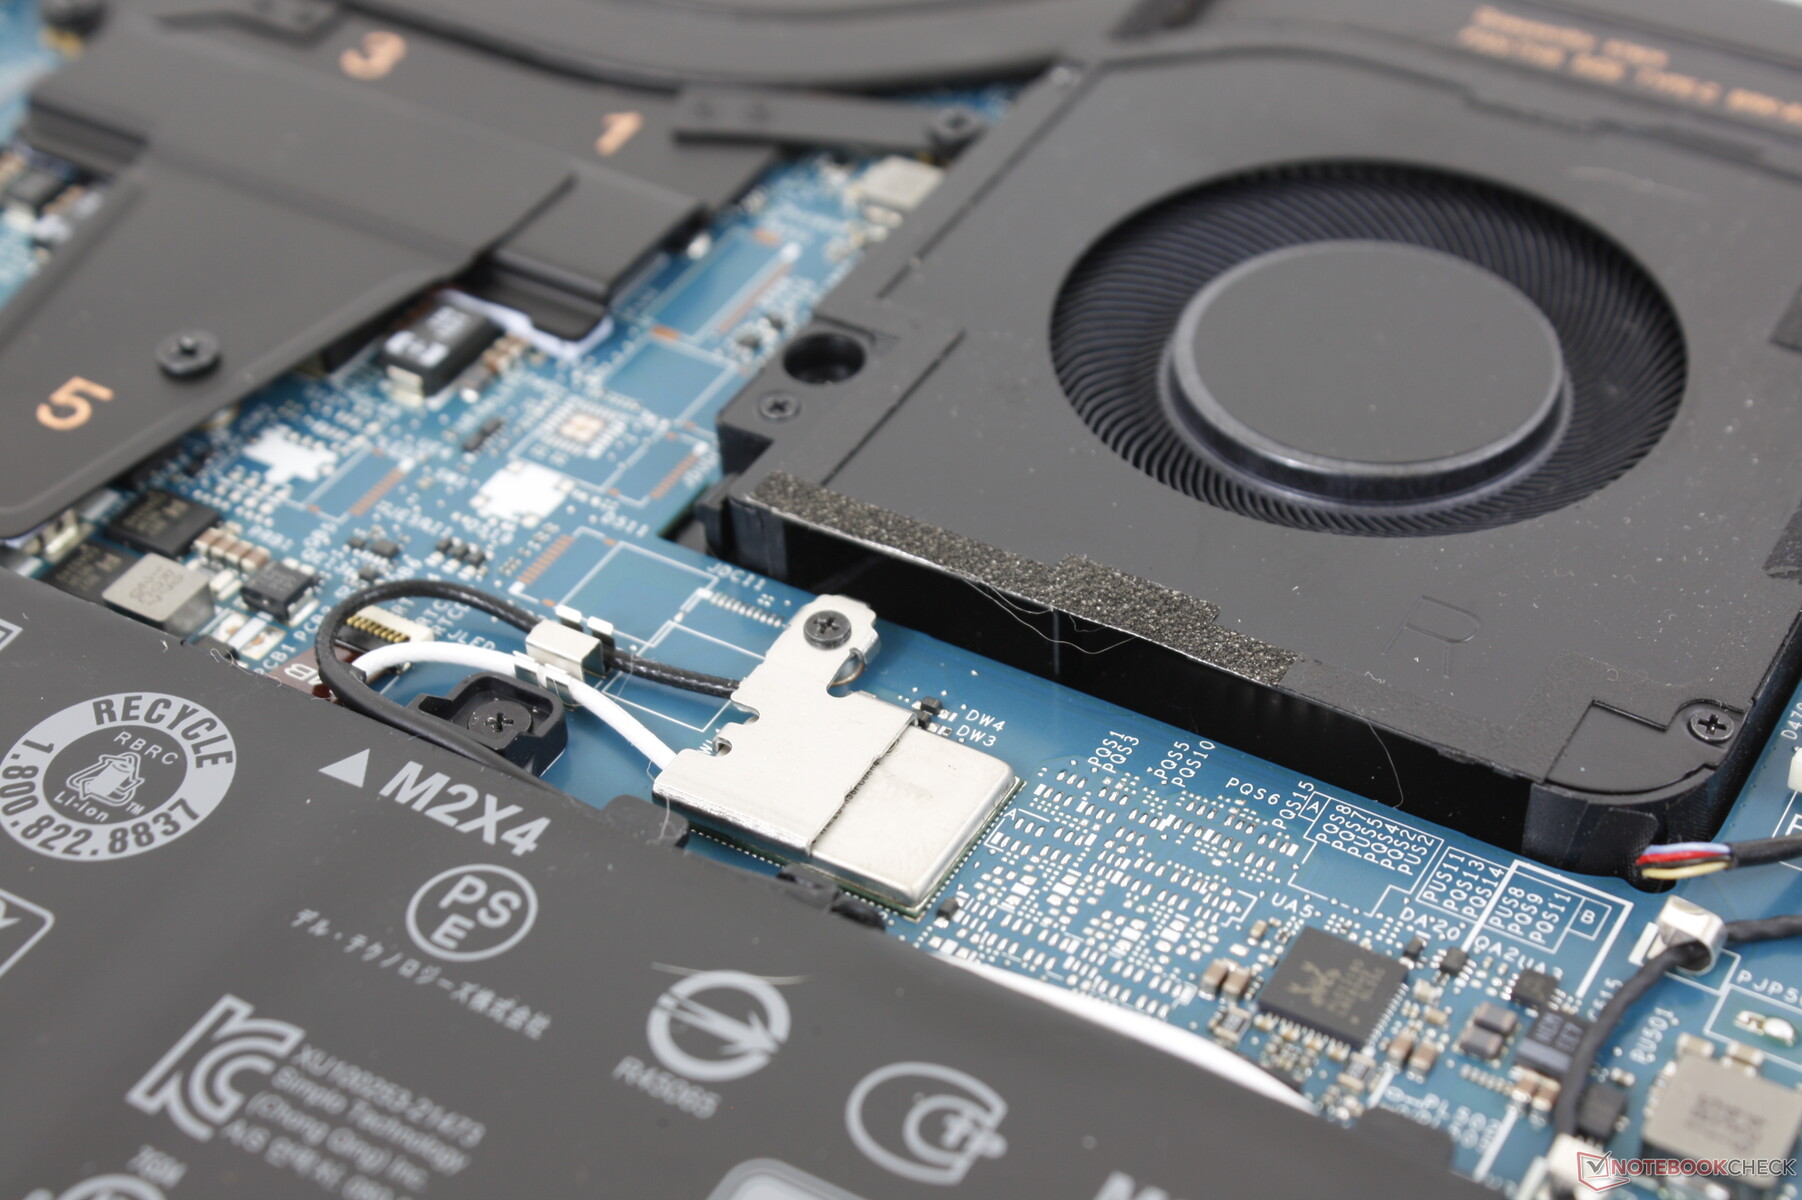
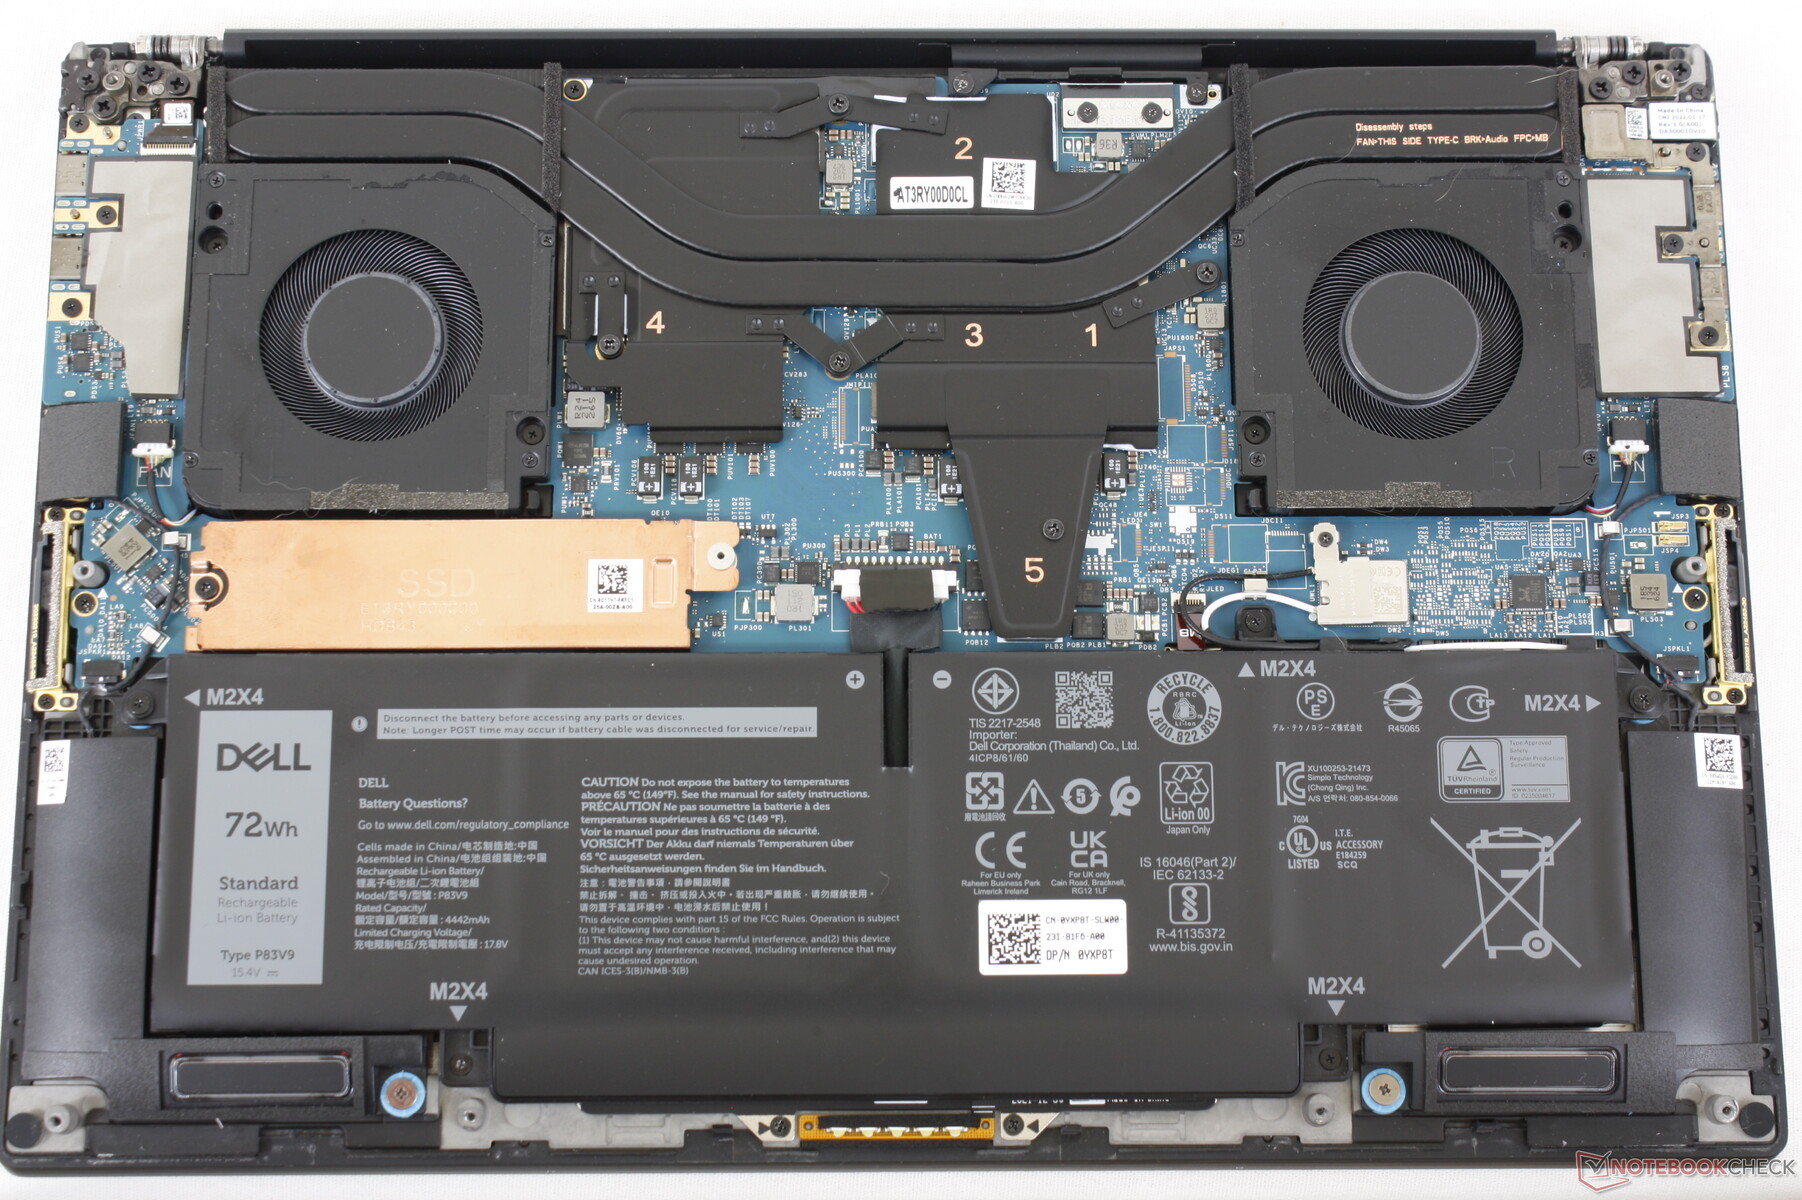
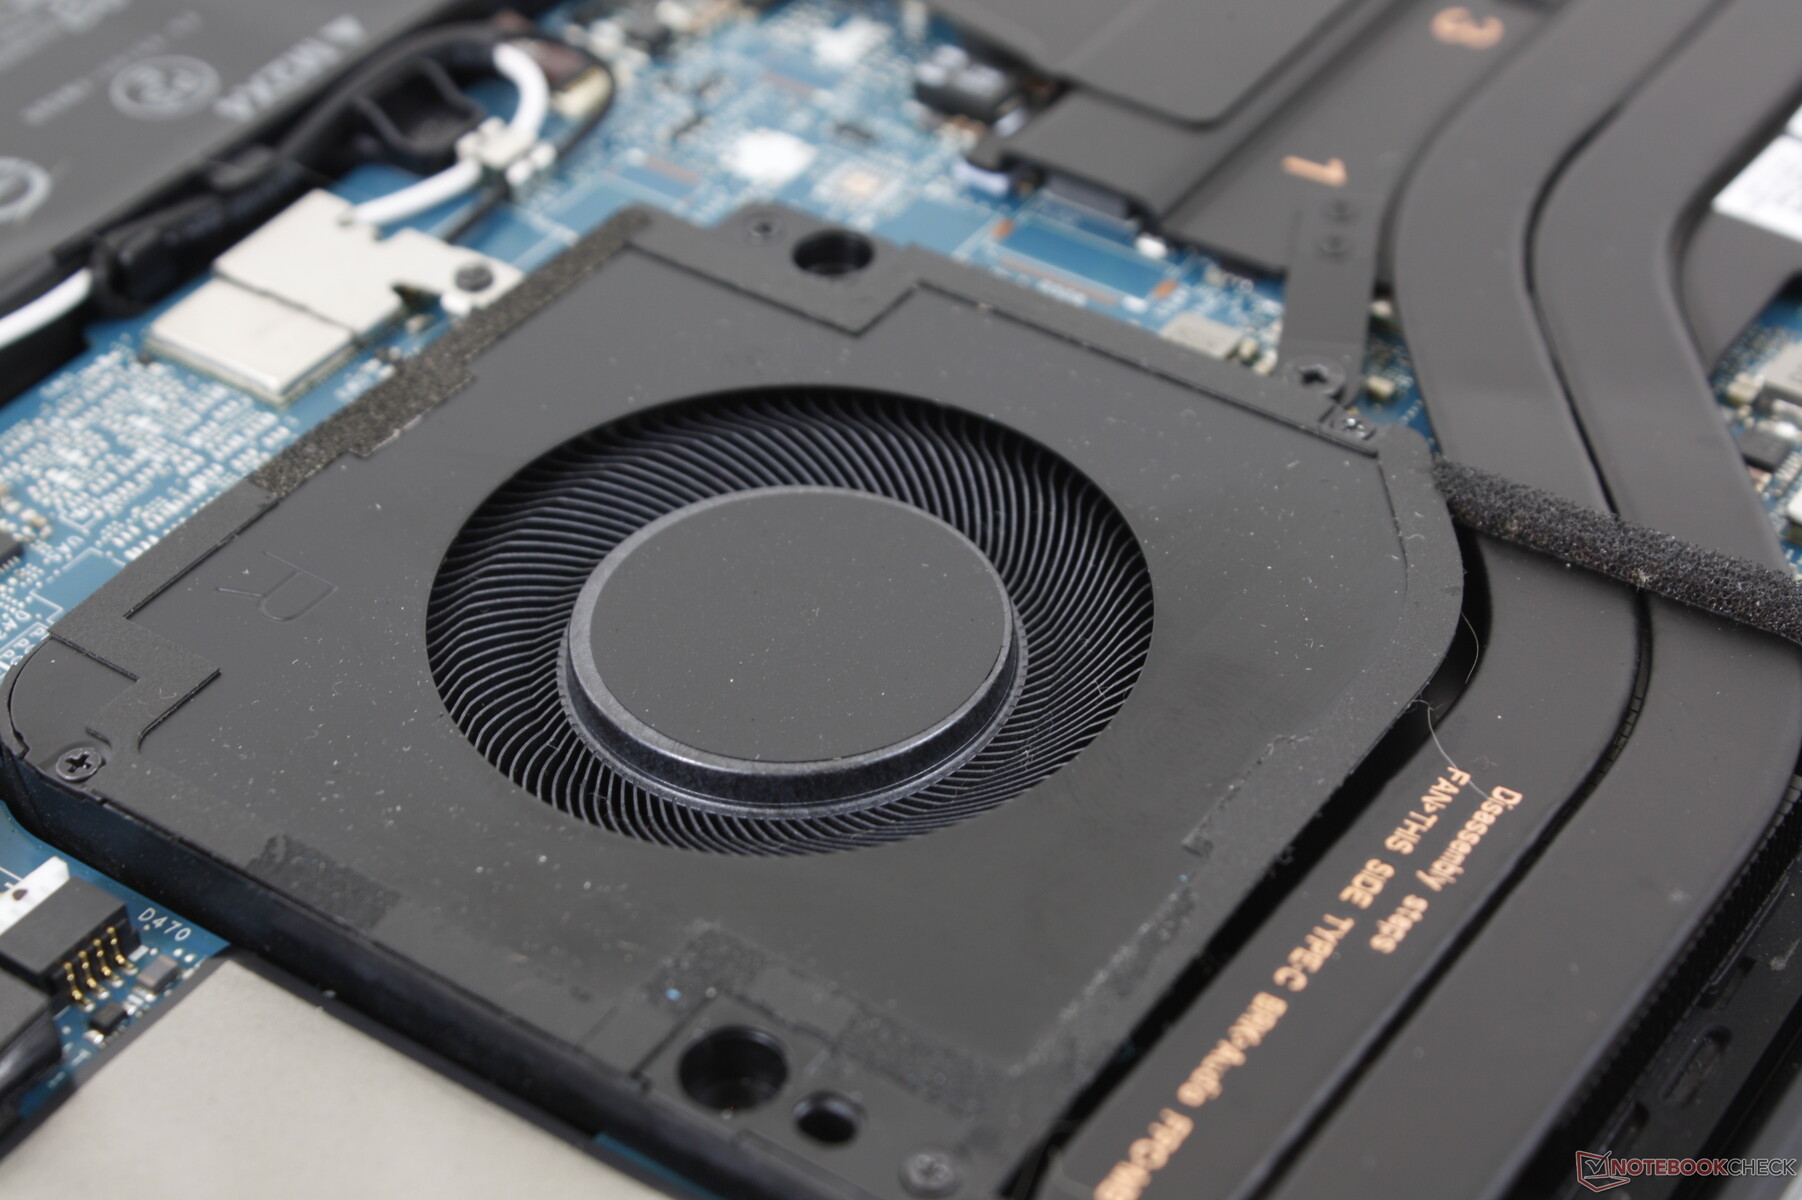
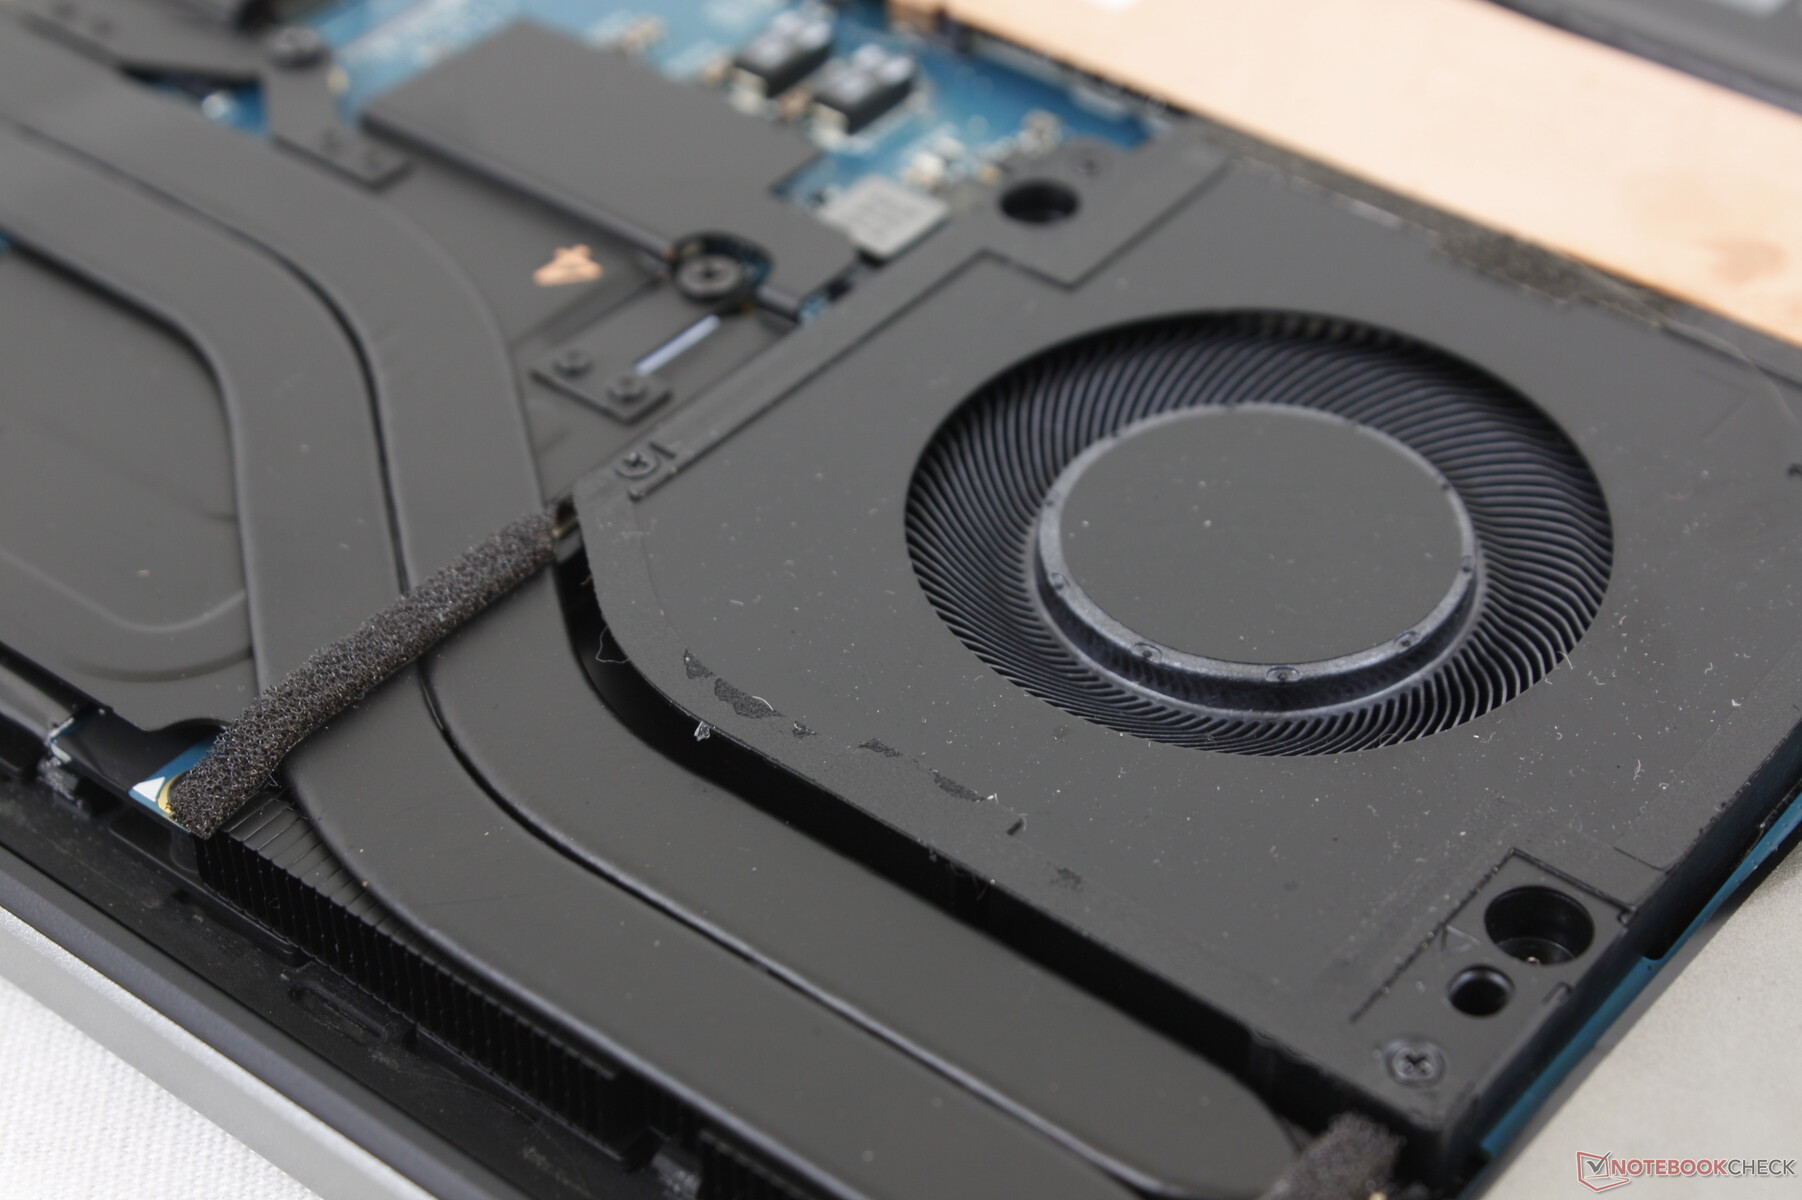
Onderhoud
Het bodempaneel wordt vastgezet met acht T5 Torx schroeven, zodat het gemakkelijk kan worden verwijderd. Er valt echter niet veel te upgraden, aangezien de RAM en WLAN modules gesoldeerd zijn.
Garantie
De basisgarantie is slechts 12 maanden in de VS in plaats van de 36 maanden die we gewend zijn van de meeste mobiele werkstations en high-end professionele laptops.
Invoerapparaten
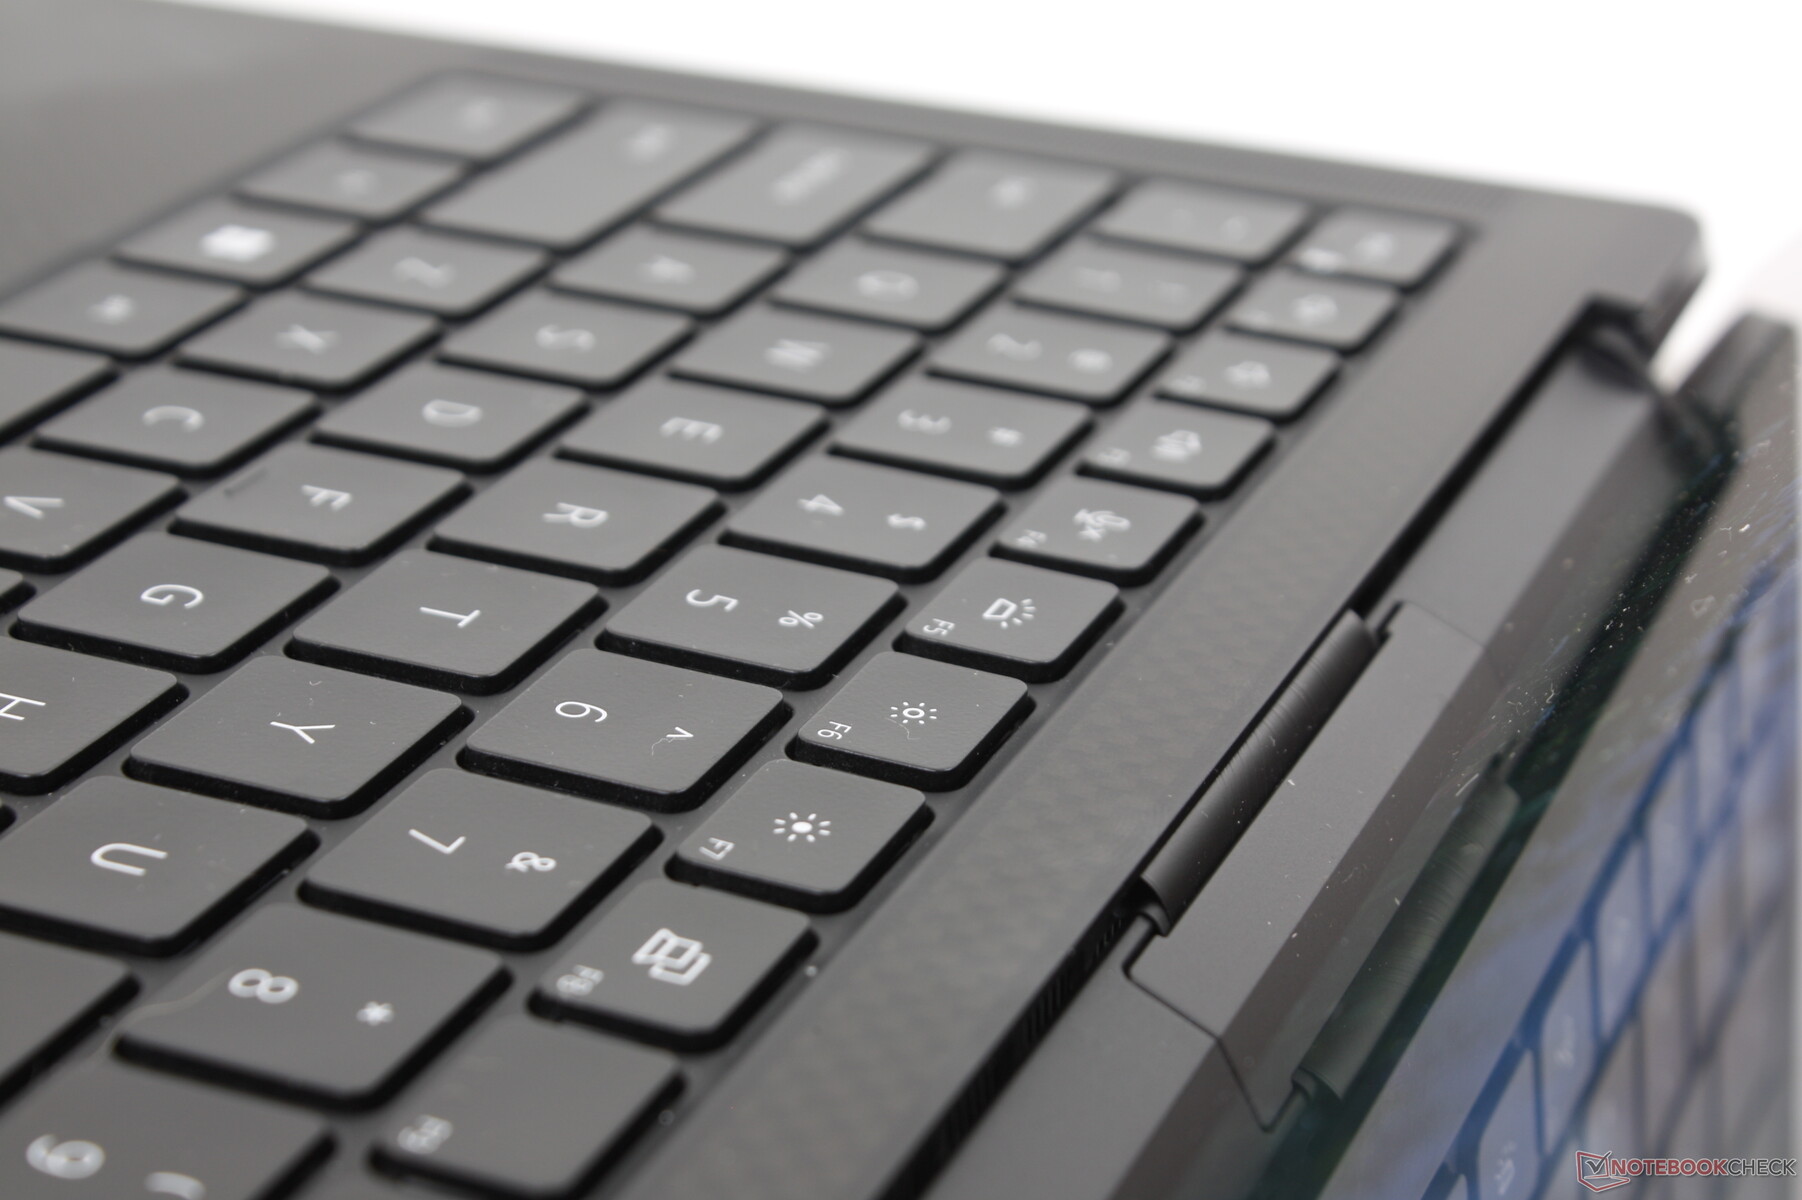
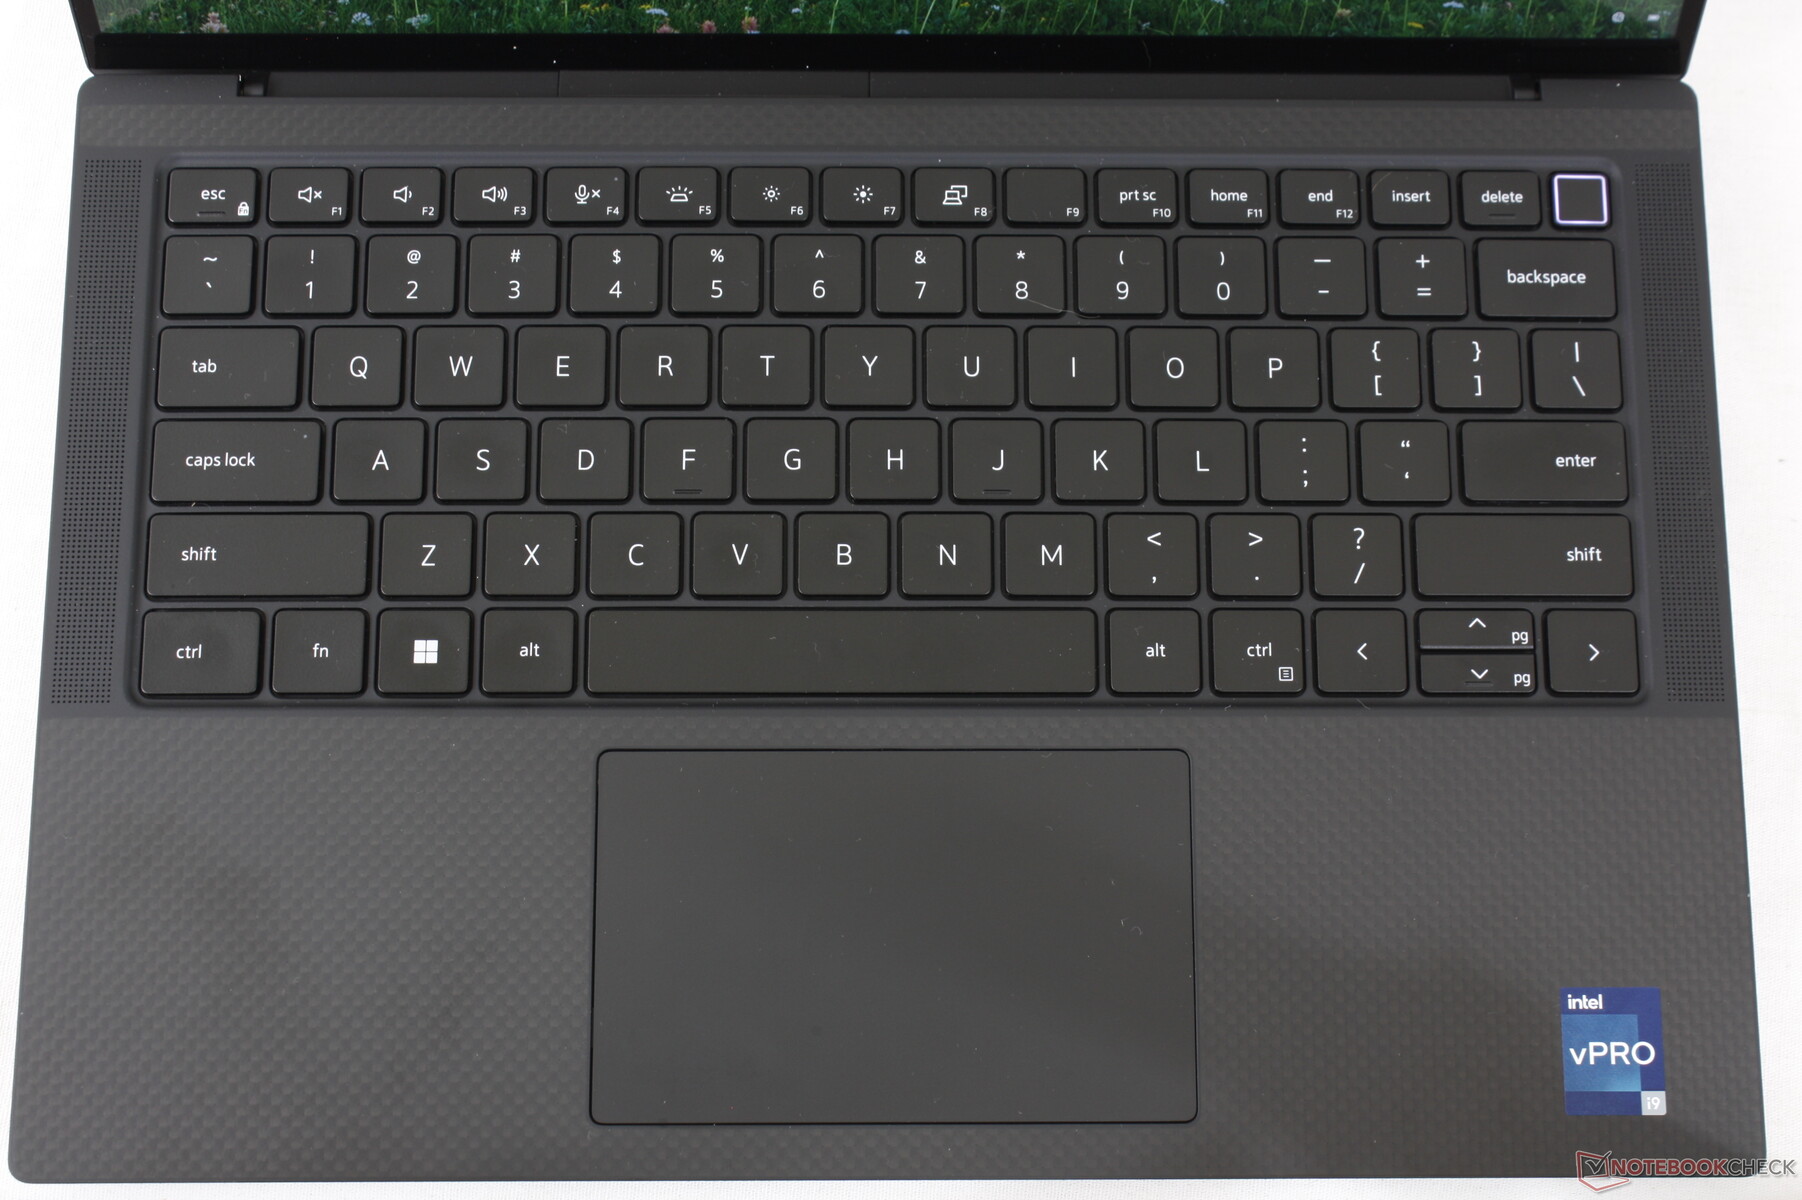
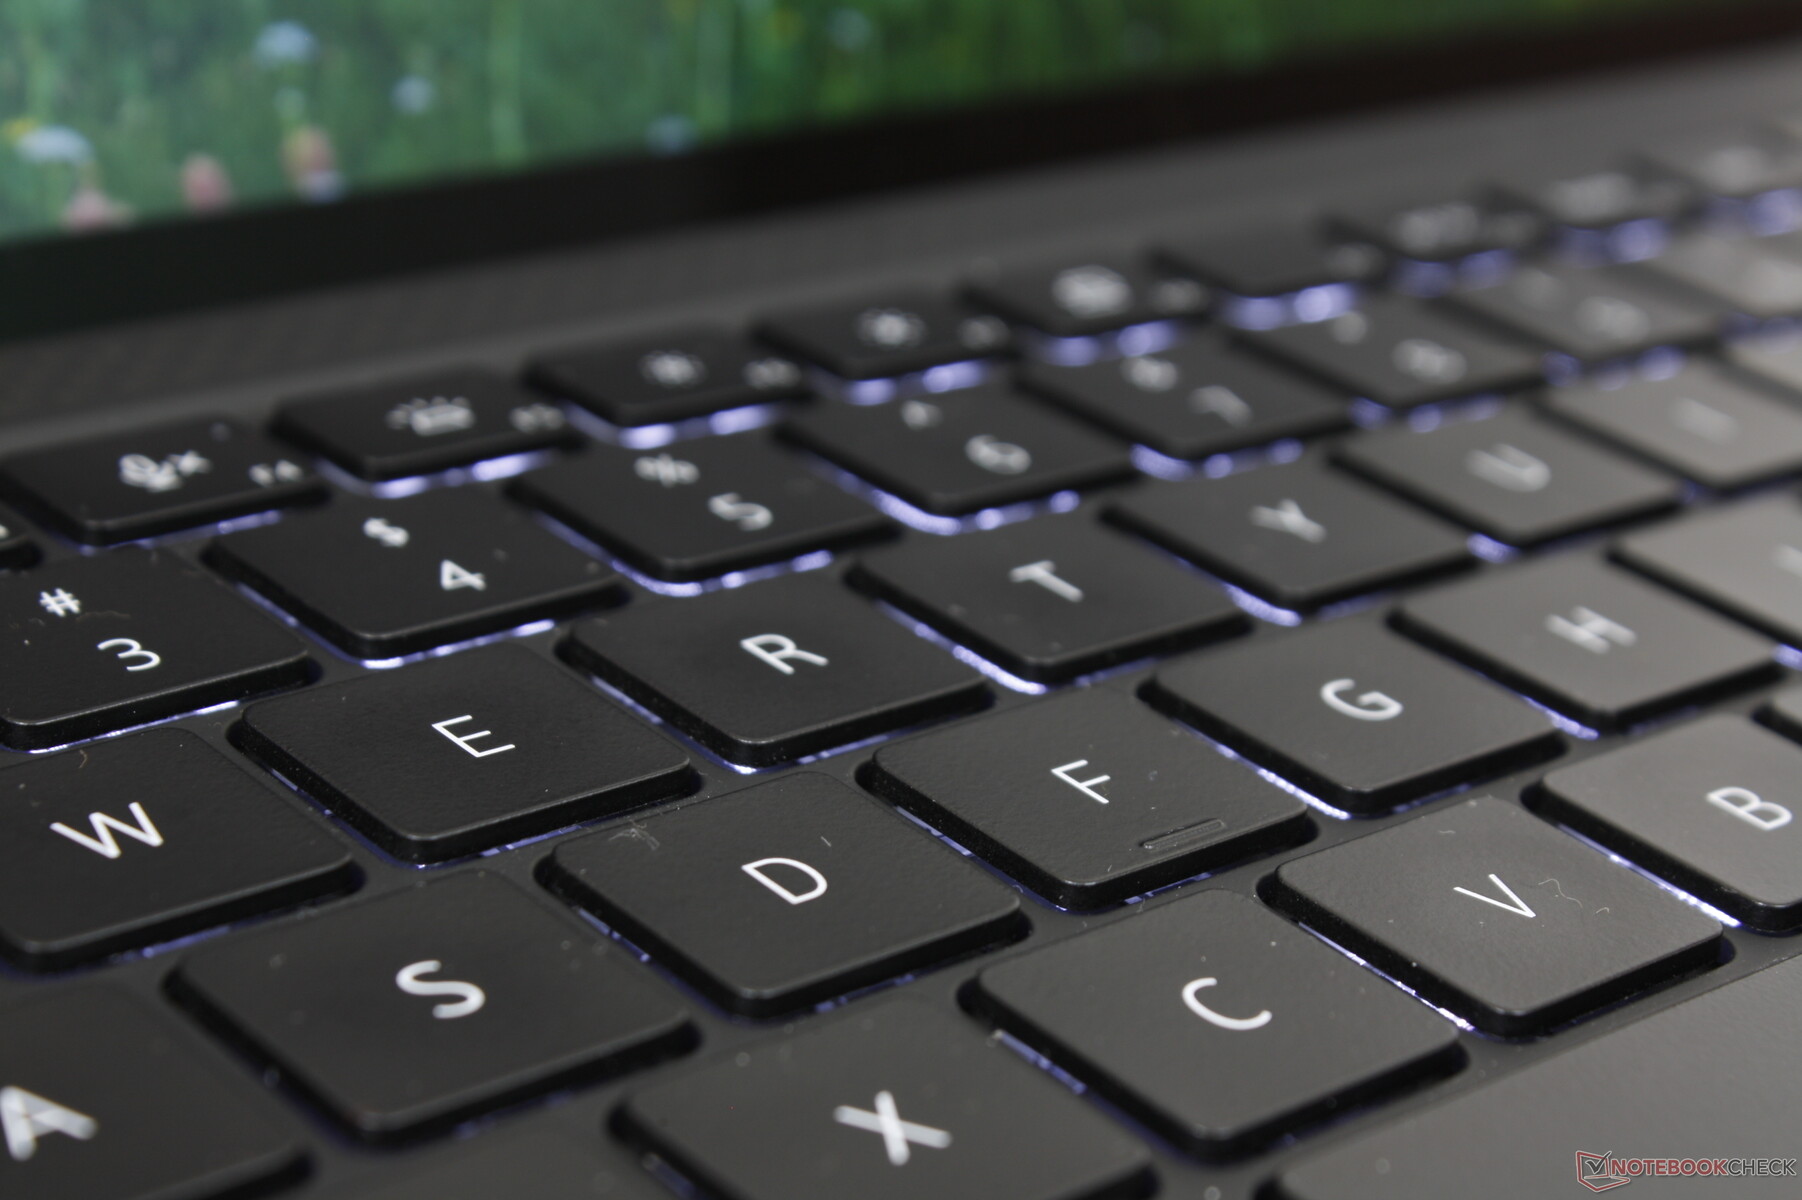
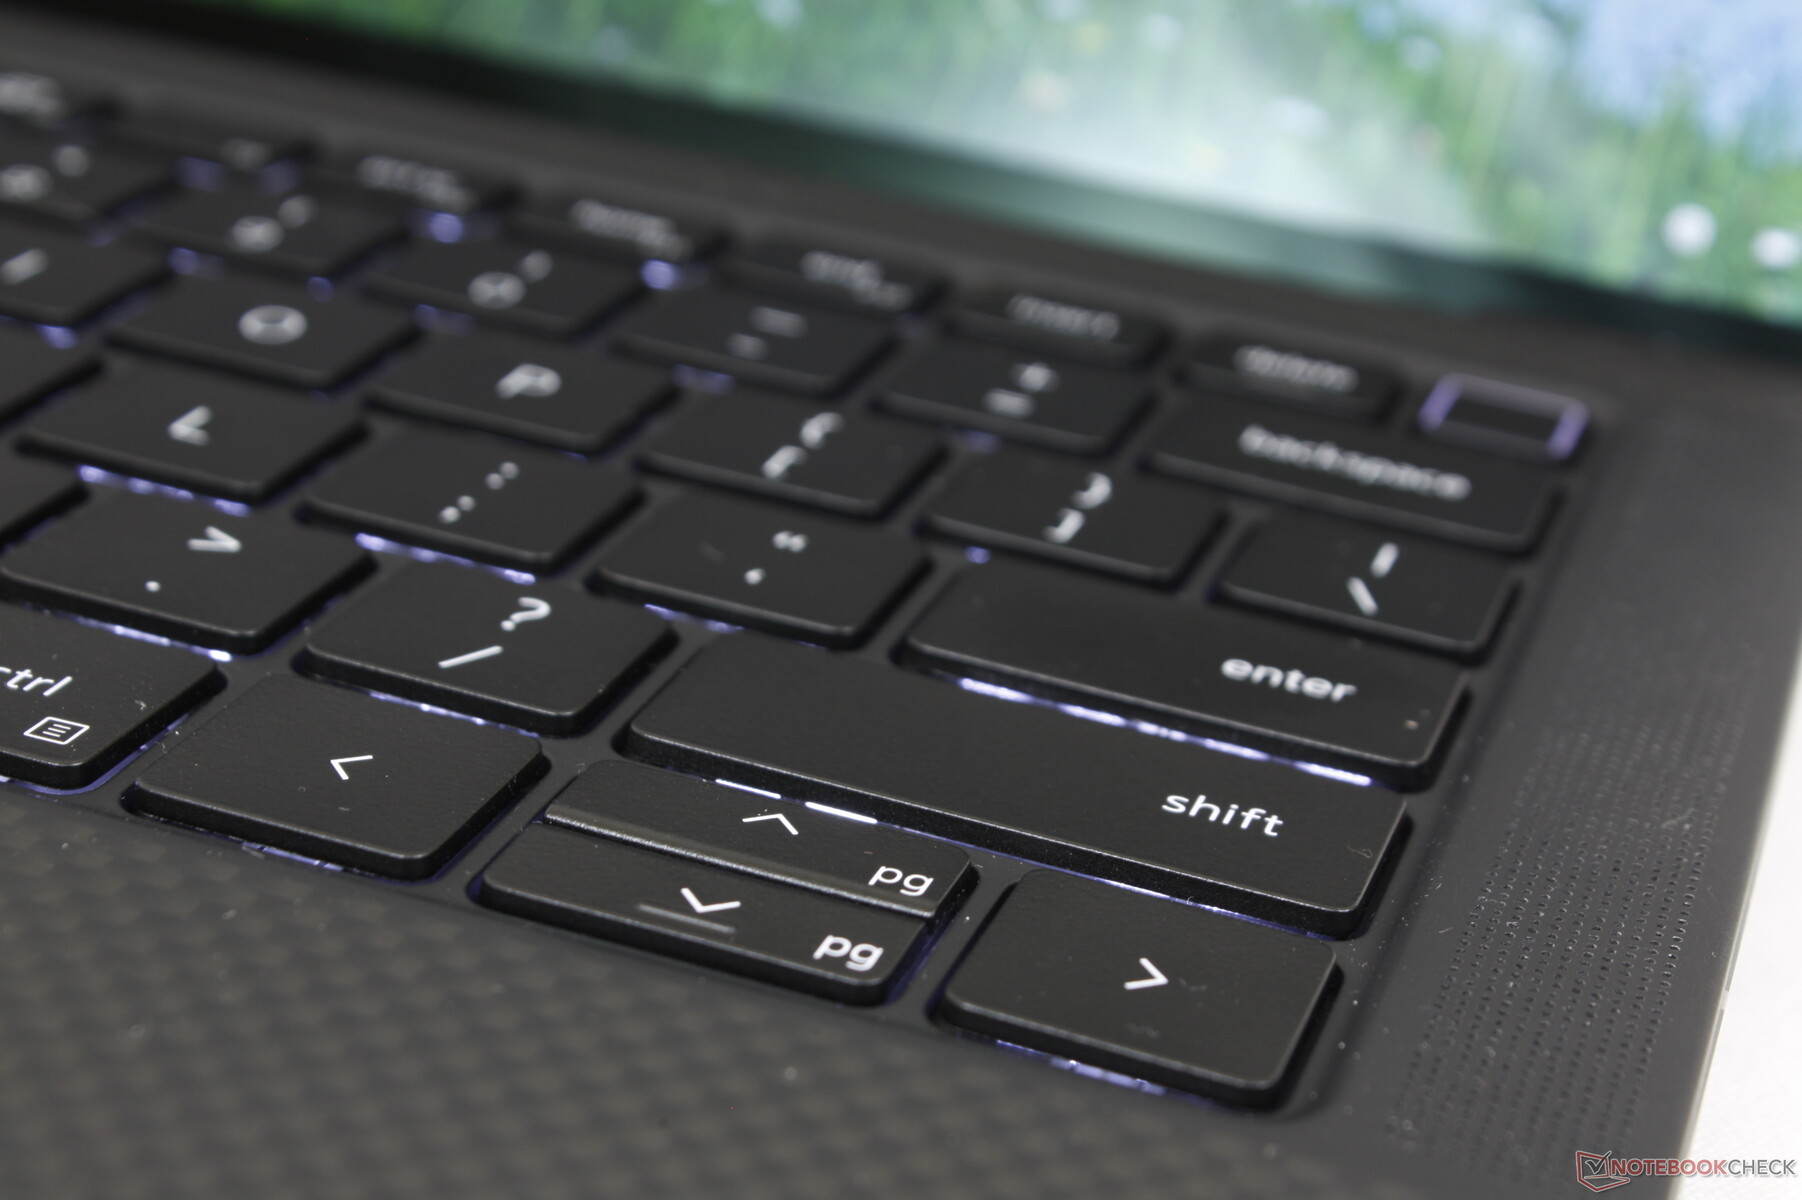
Toetsenbord
Het model erft het toetsenbord van de oudere XPS 13 9300 of 9310 ontwerp. Als je al eerder op een XPS 13 hebt getypt, dan weet je wat je kunt verwachten op de Precision 5470. Key feedback is uniform met matige travel, maar de toetsen op de HP EliteBook of Firefly serie hebben de neiging om scherper of scherper wanneer ingedrukt.
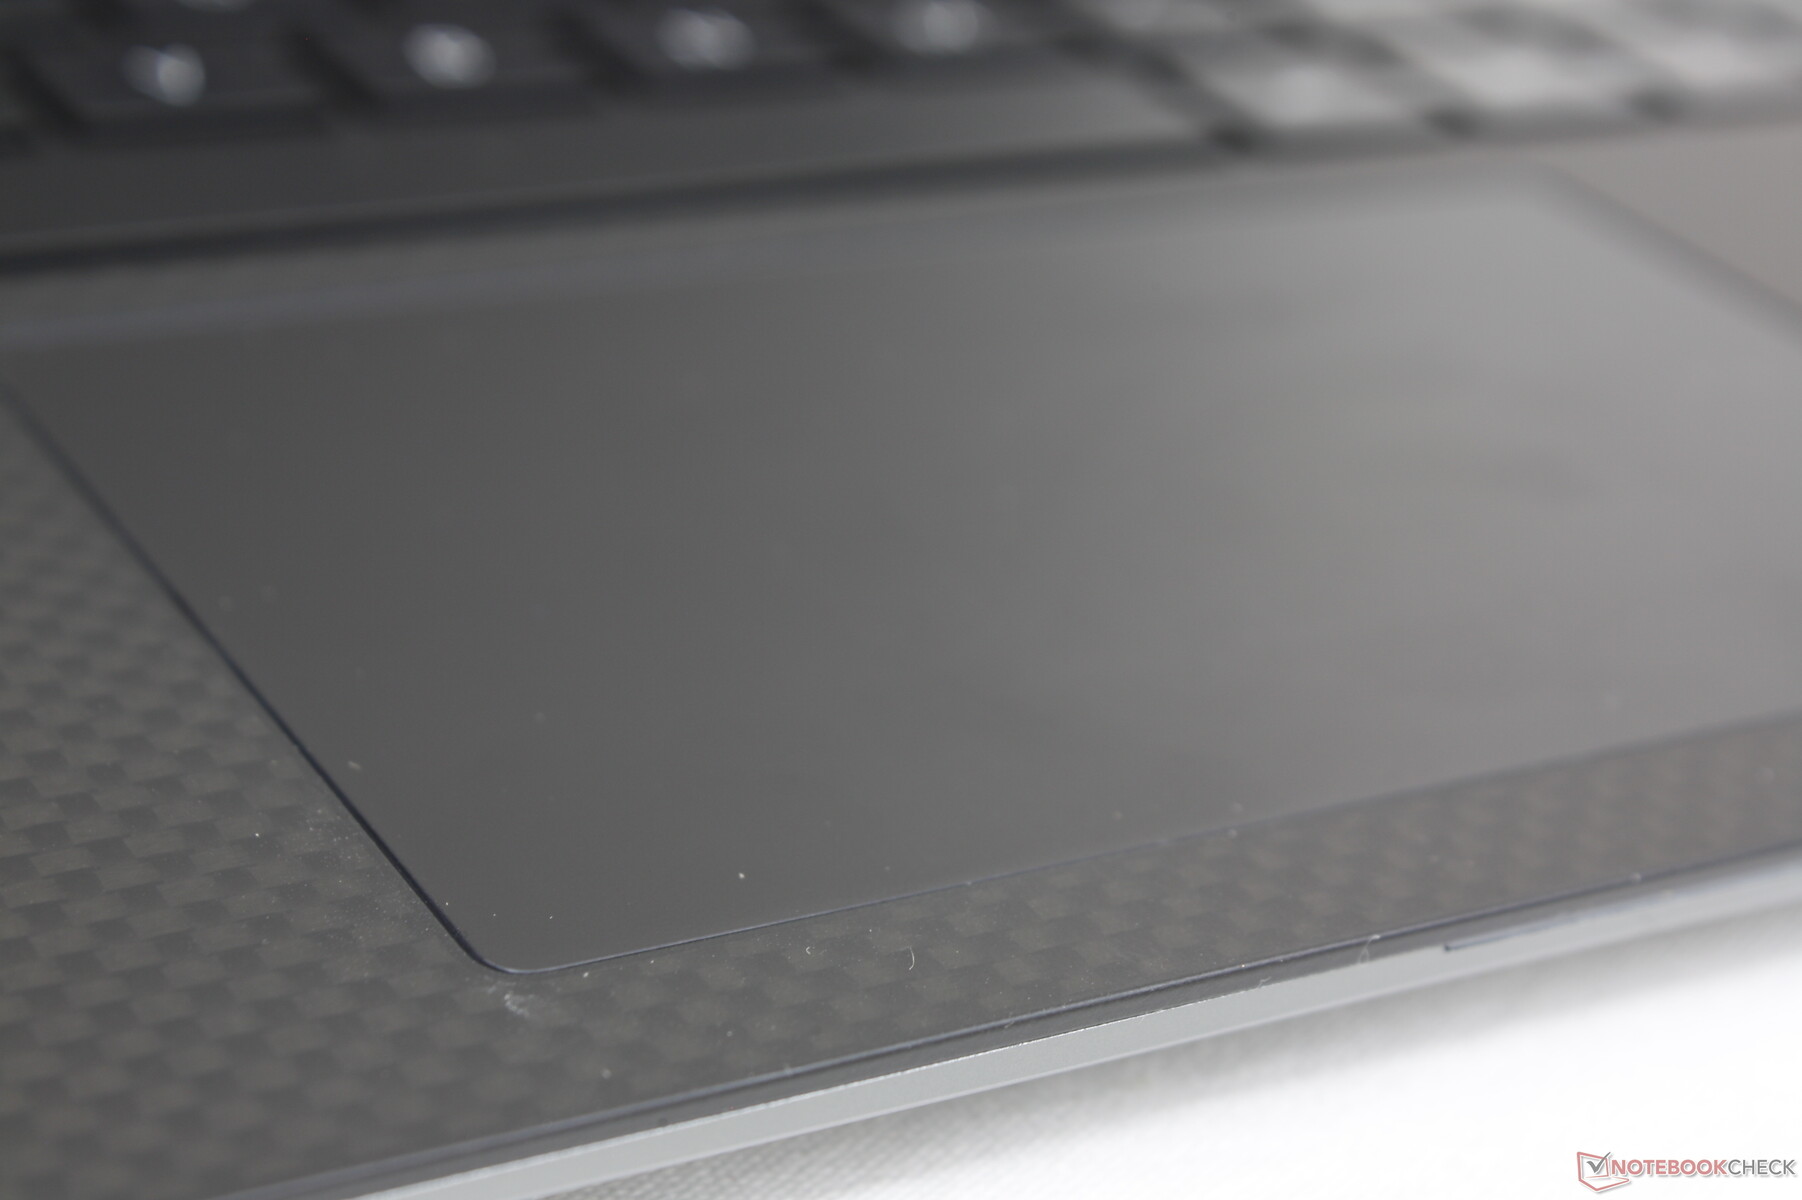
Touchpad
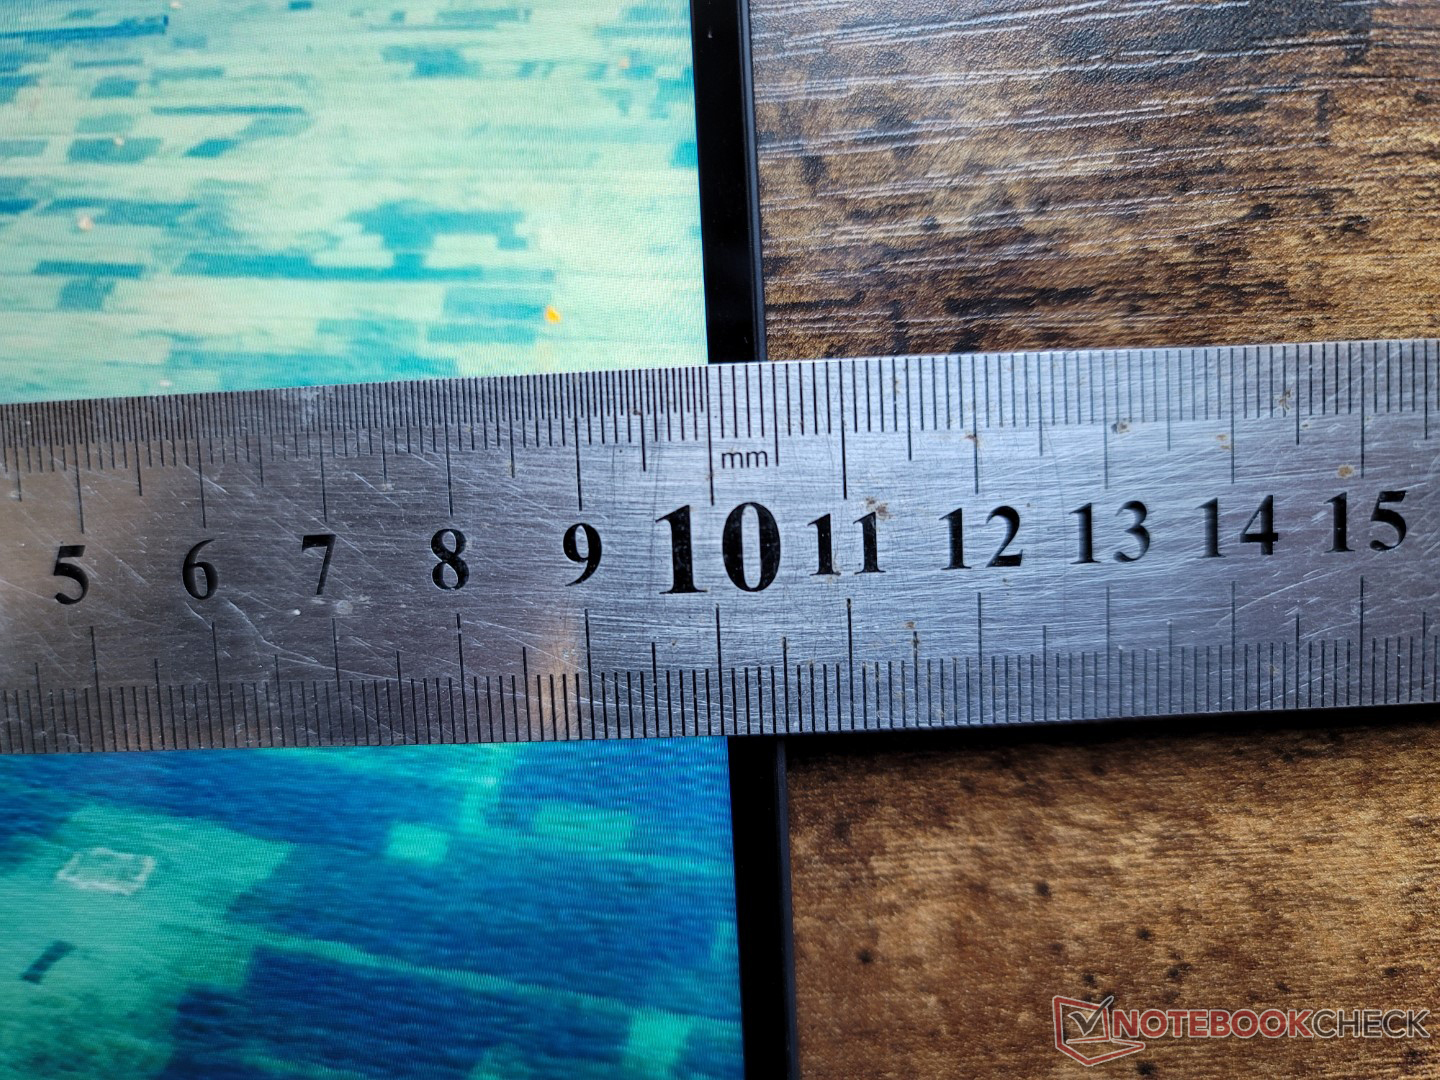
Het oppervlak van het clickpad is ongeveer even groot als dat van de XPS 13 9300 (10,8 x 6,7 cm tegen 11,2 x 6,5 cm). De grip is soepel en slechts licht plakkerig bij lagere snelheden voor meer precisie wanneer dat nodig is. Feedback bij het klikken op het clickpad is relatief zacht en oppervlakkig, maar met een veel stiller gekletter dan op de meeste andere laptops.
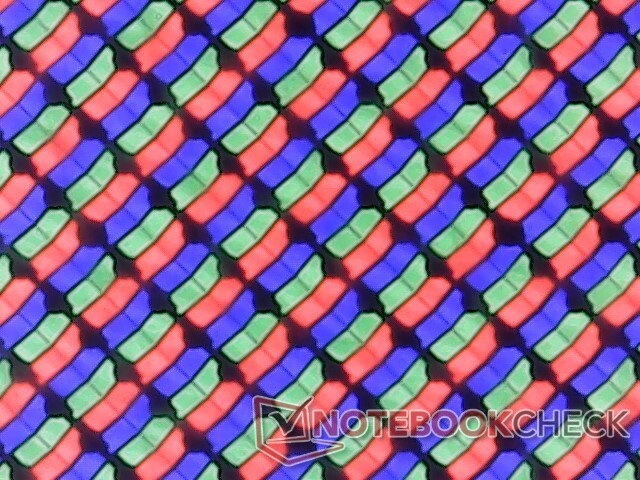
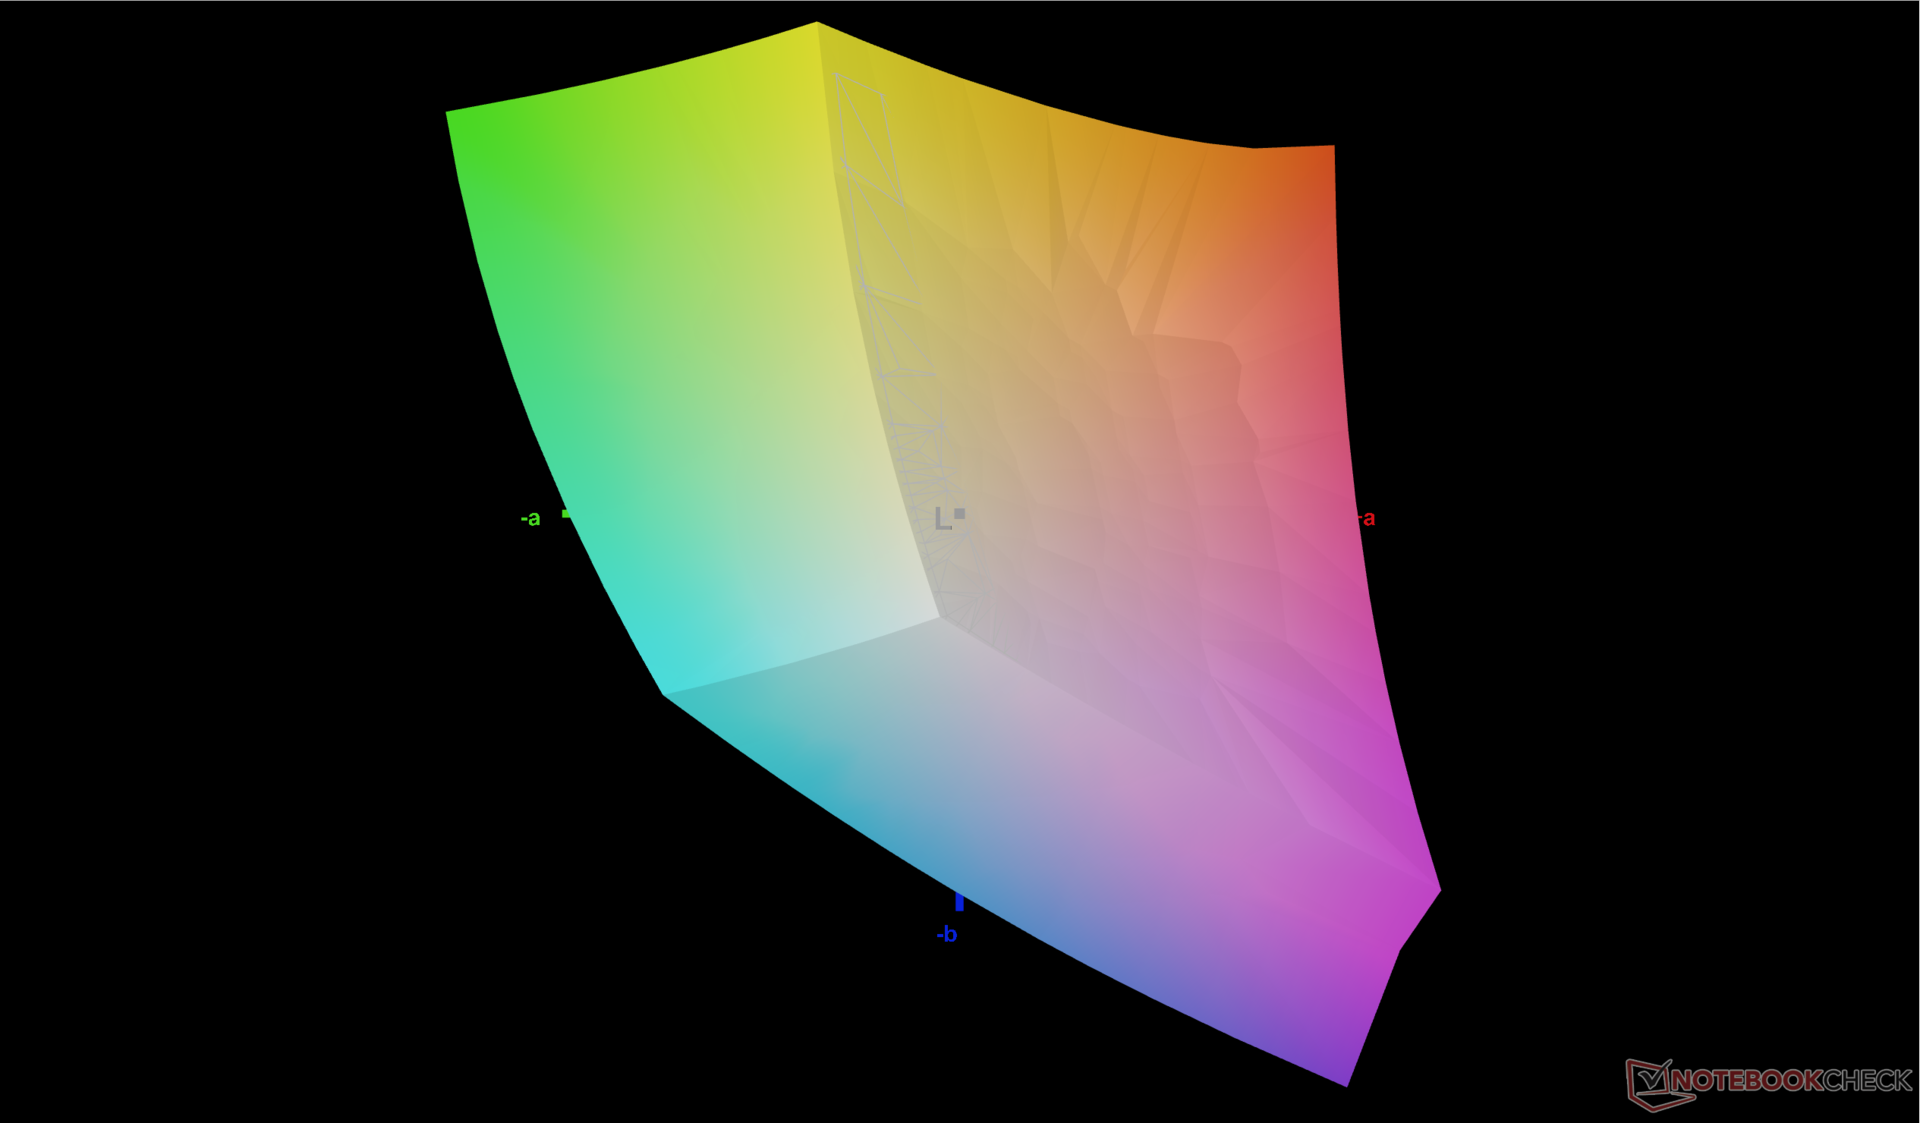
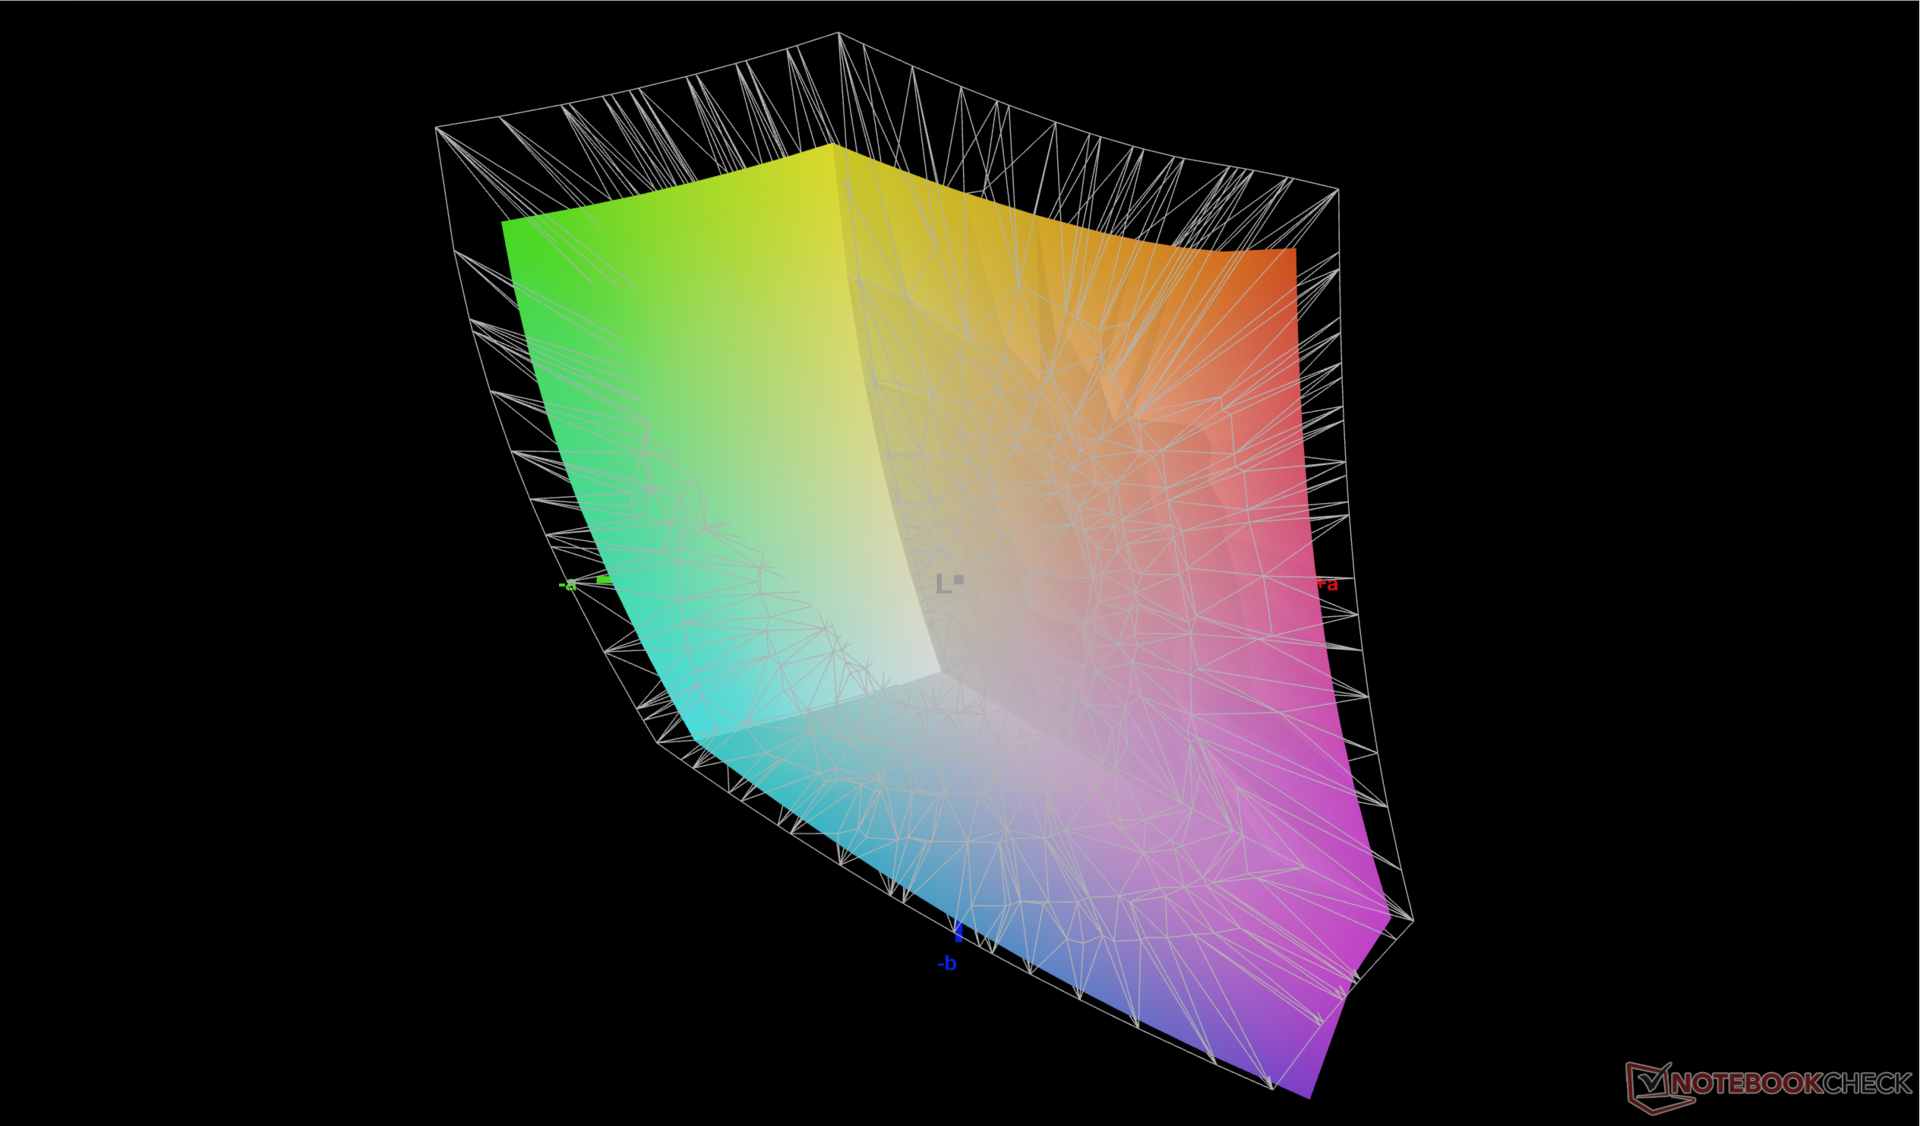
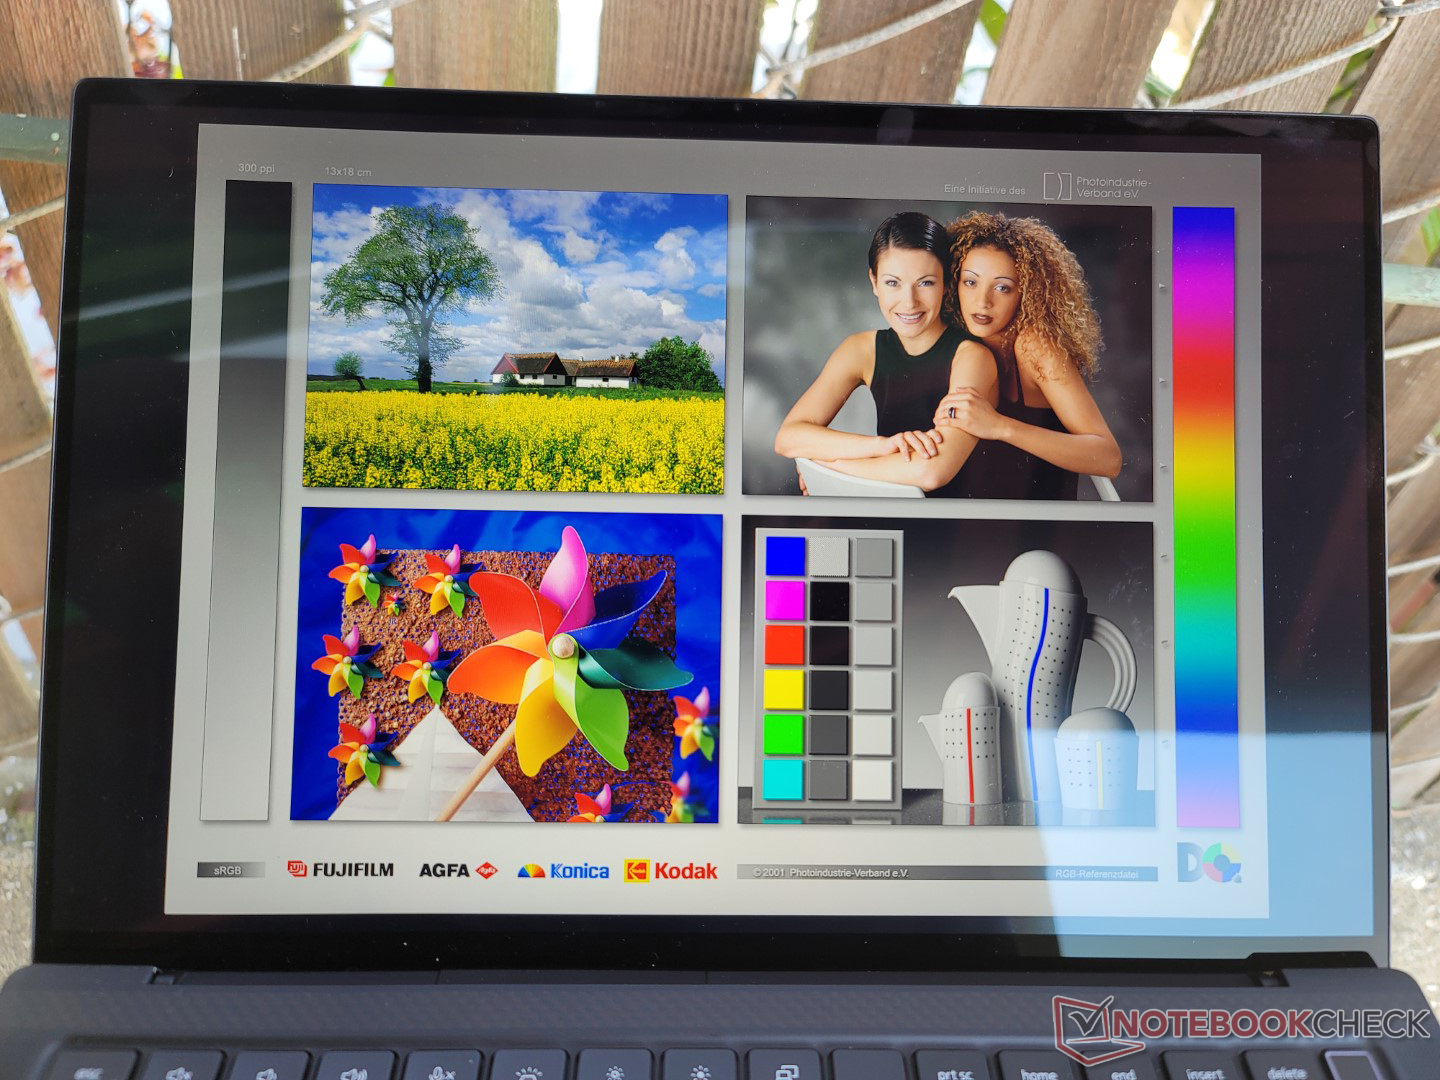
Beeldscherm - Identiek aan Latitude 9430 2-in-1
De Precision 5470 heeft hetzelfde hoogwaardige AU Optronics B140QAN IPS-touchscreen als de Latitude 9430 2-in-1. Beide modellen hebben dus vergelijkbare zwart-wit reactietijden, gamut, contrast ratio en zelfs algemene helderheid. Dit scherm is uitstekend voor gebruikers die volledige sRGB dekking en relatief diepe zwartniveaus wensen, maar het lijdt helaas aan merkbare ghosting, wat een probleem kan zijn bij toepassingen met snel bewegende graphics of video.
Er zijn geen OLED, AdobeRGB of P3 kleuren, of hogere vernieuwingsfrequentie opties om uit te kiezen, wat betekent dat gebruikers beperkt zijn tot IPS en 60 Hz op alle huidige configuraties.
| |||||||||||||||||||||||||
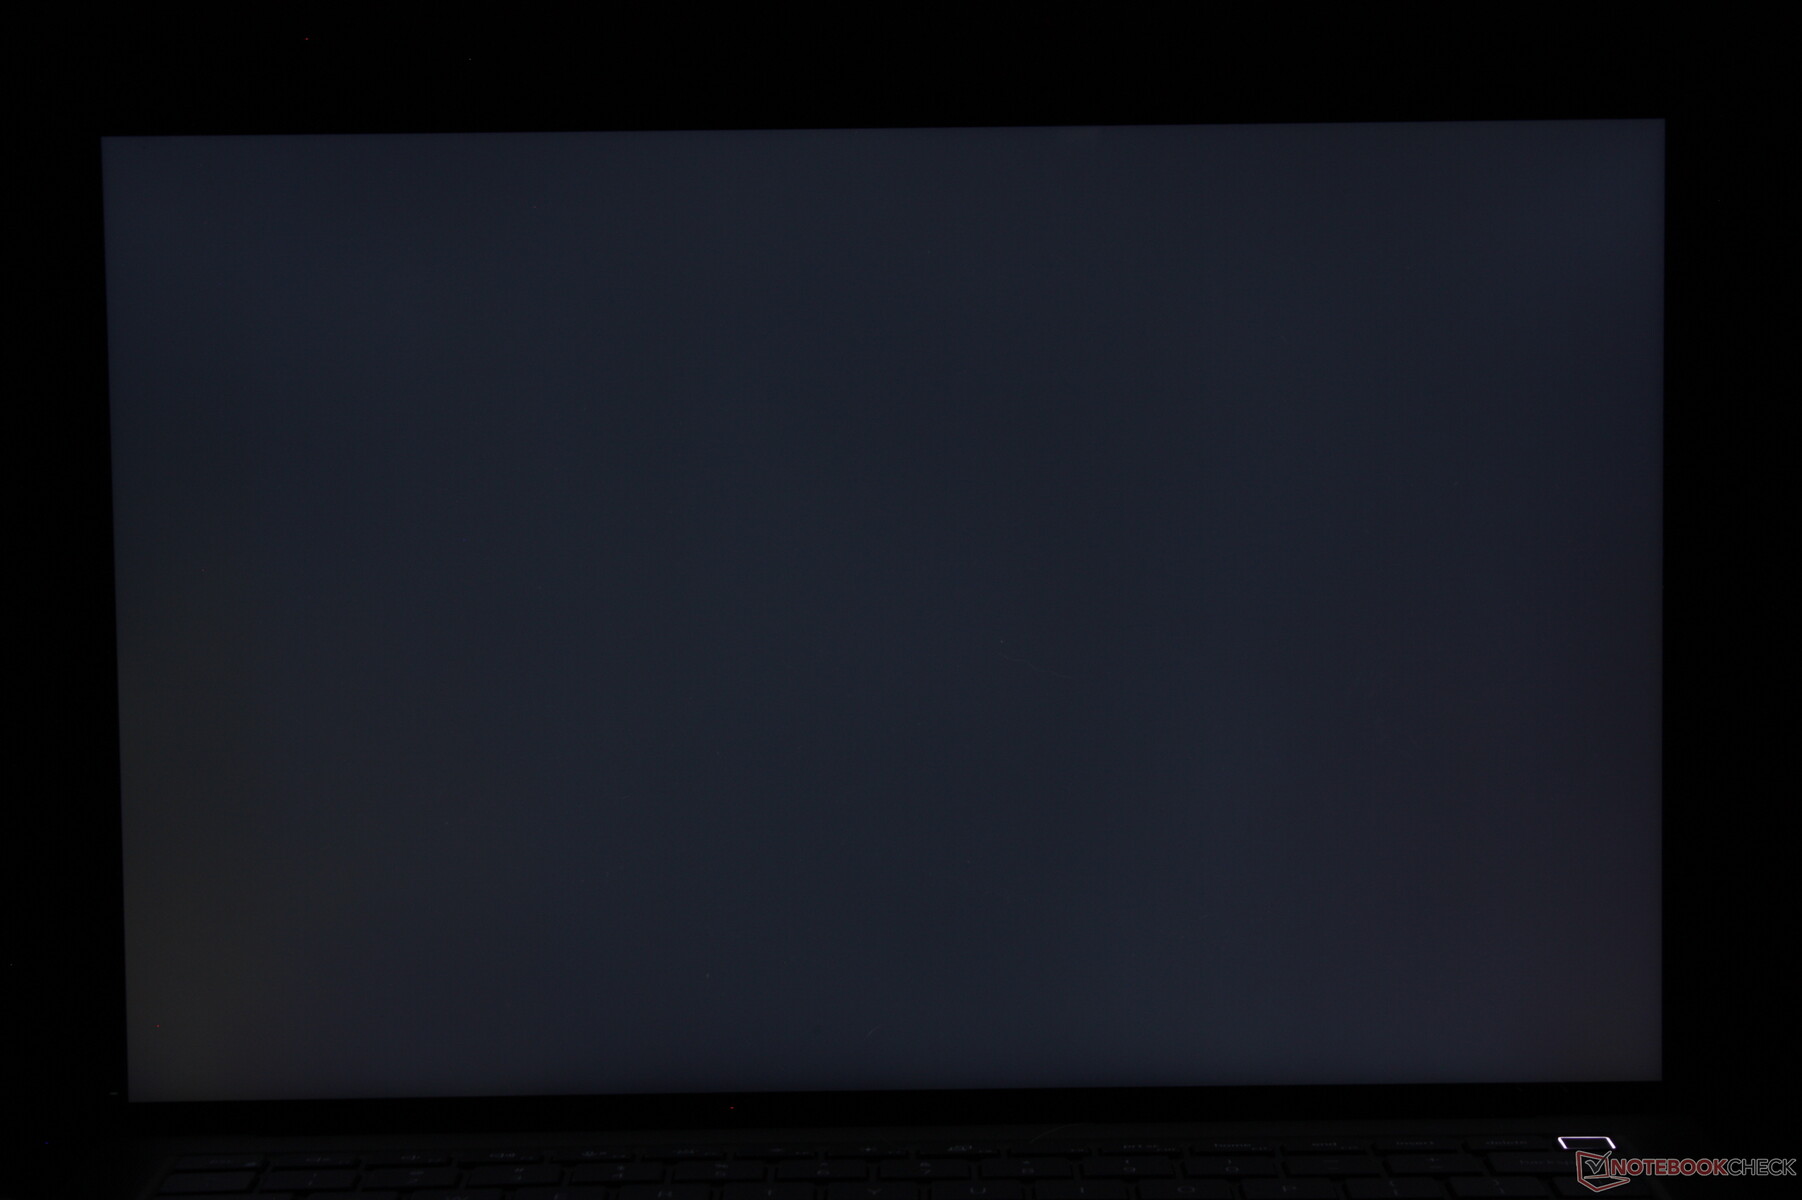
Helderheidsverdeling: 94 %
Helderheid in Batterij-modus: 537 cd/m²
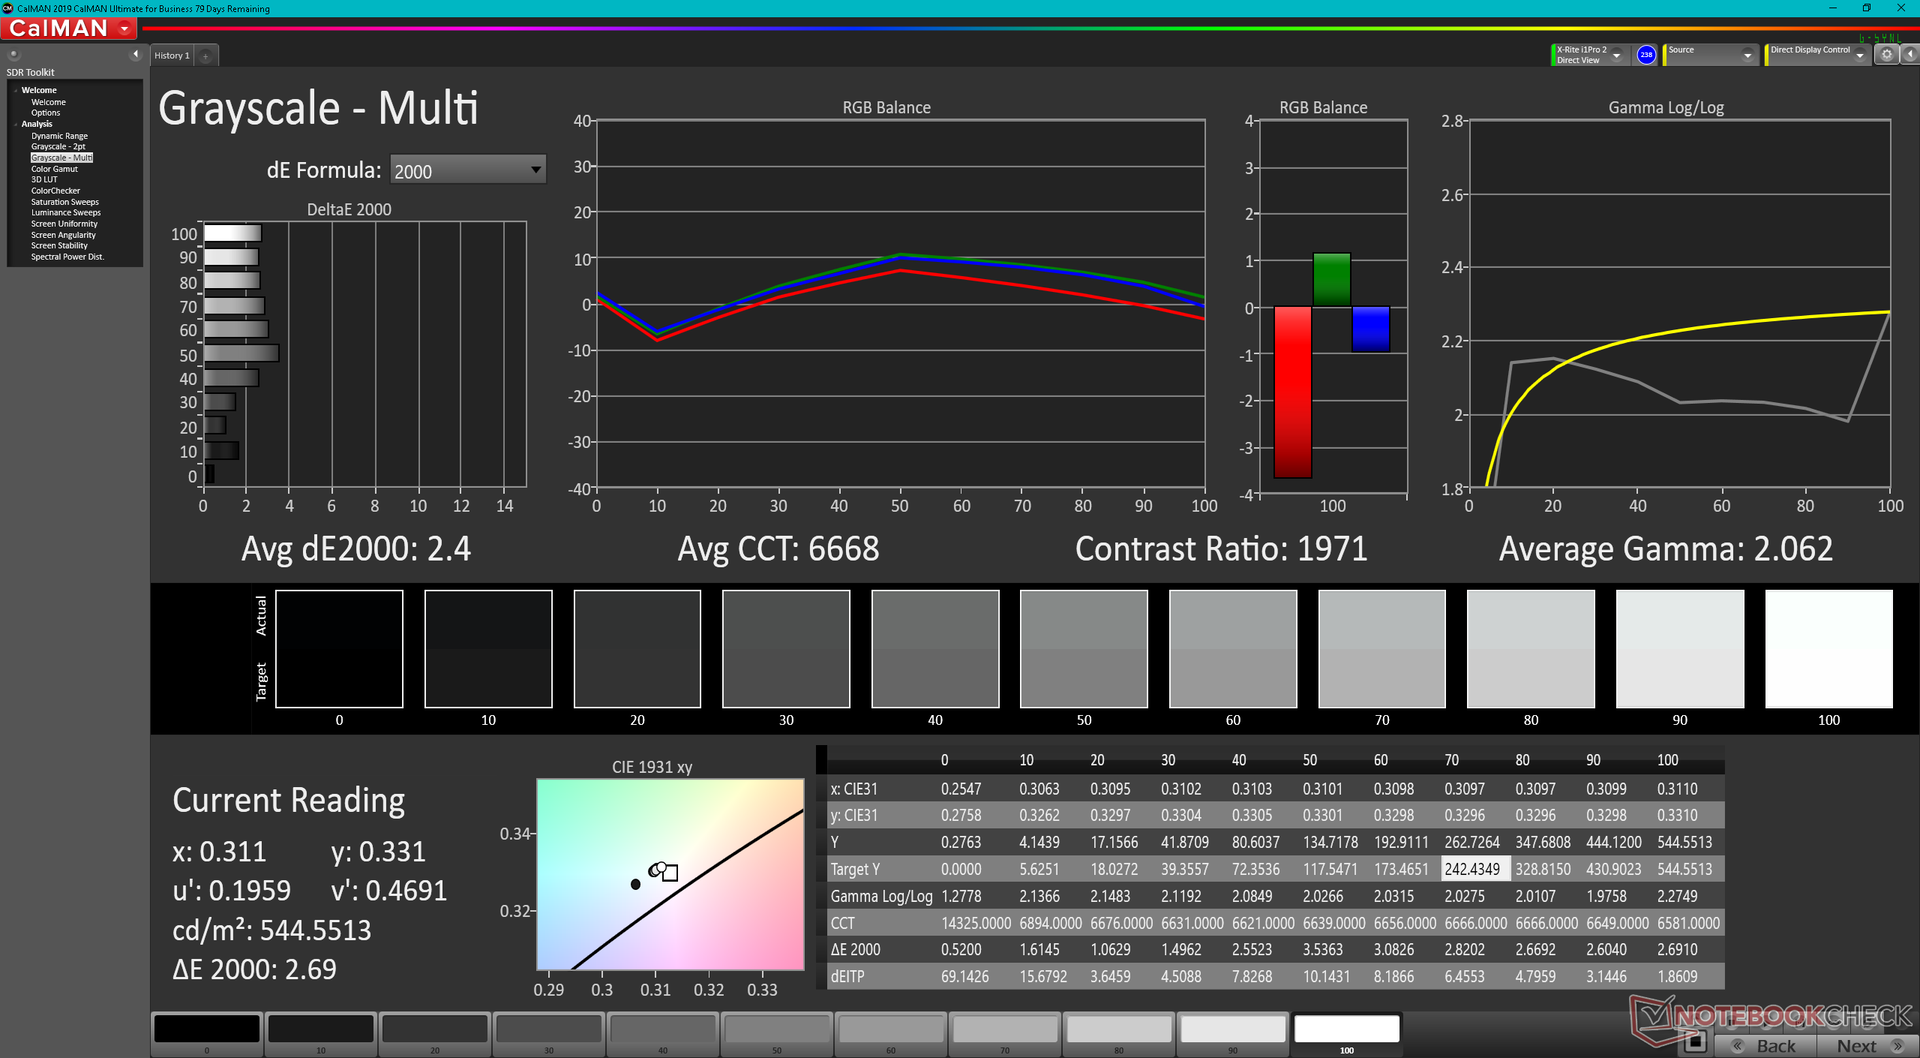
Contrast: 1627:1 (Zwart: 0.33 cd/m²)
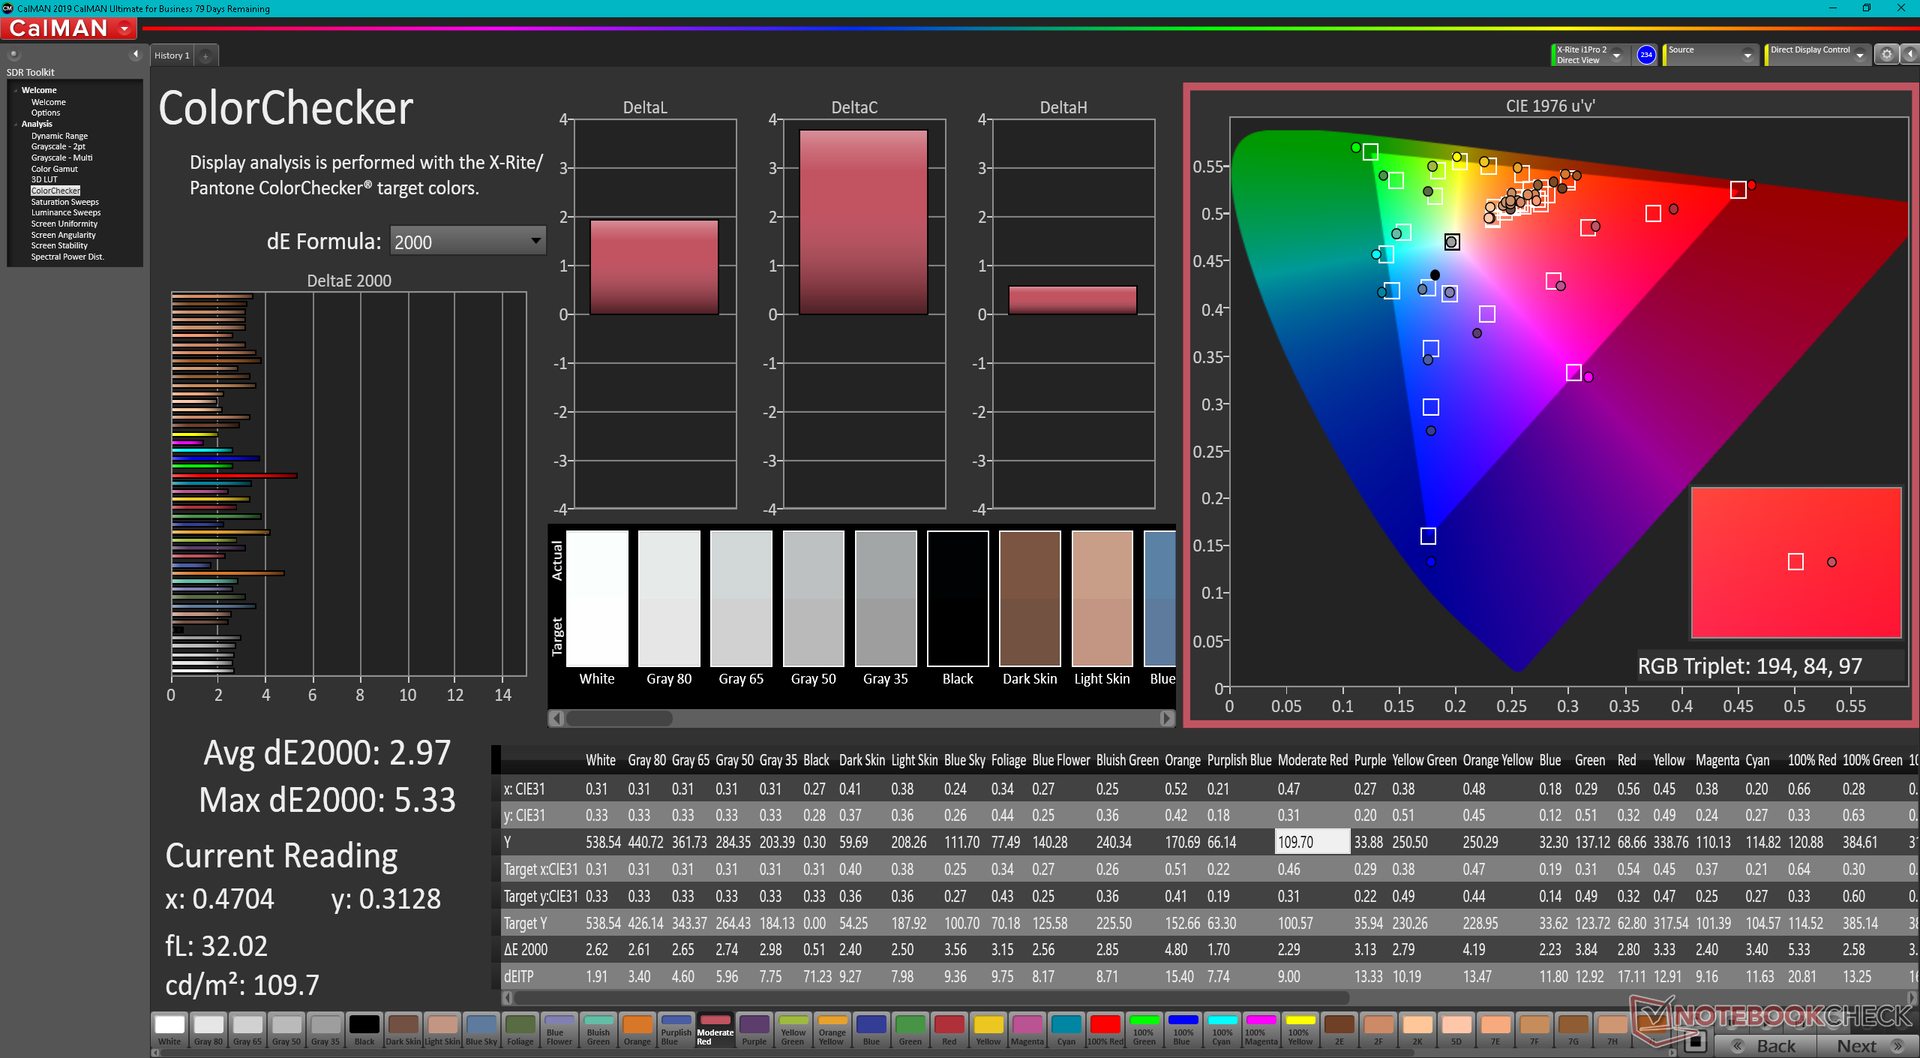
ΔE ColorChecker Calman: 2.97 | ∀{0.5-29.43 Ø4.71}
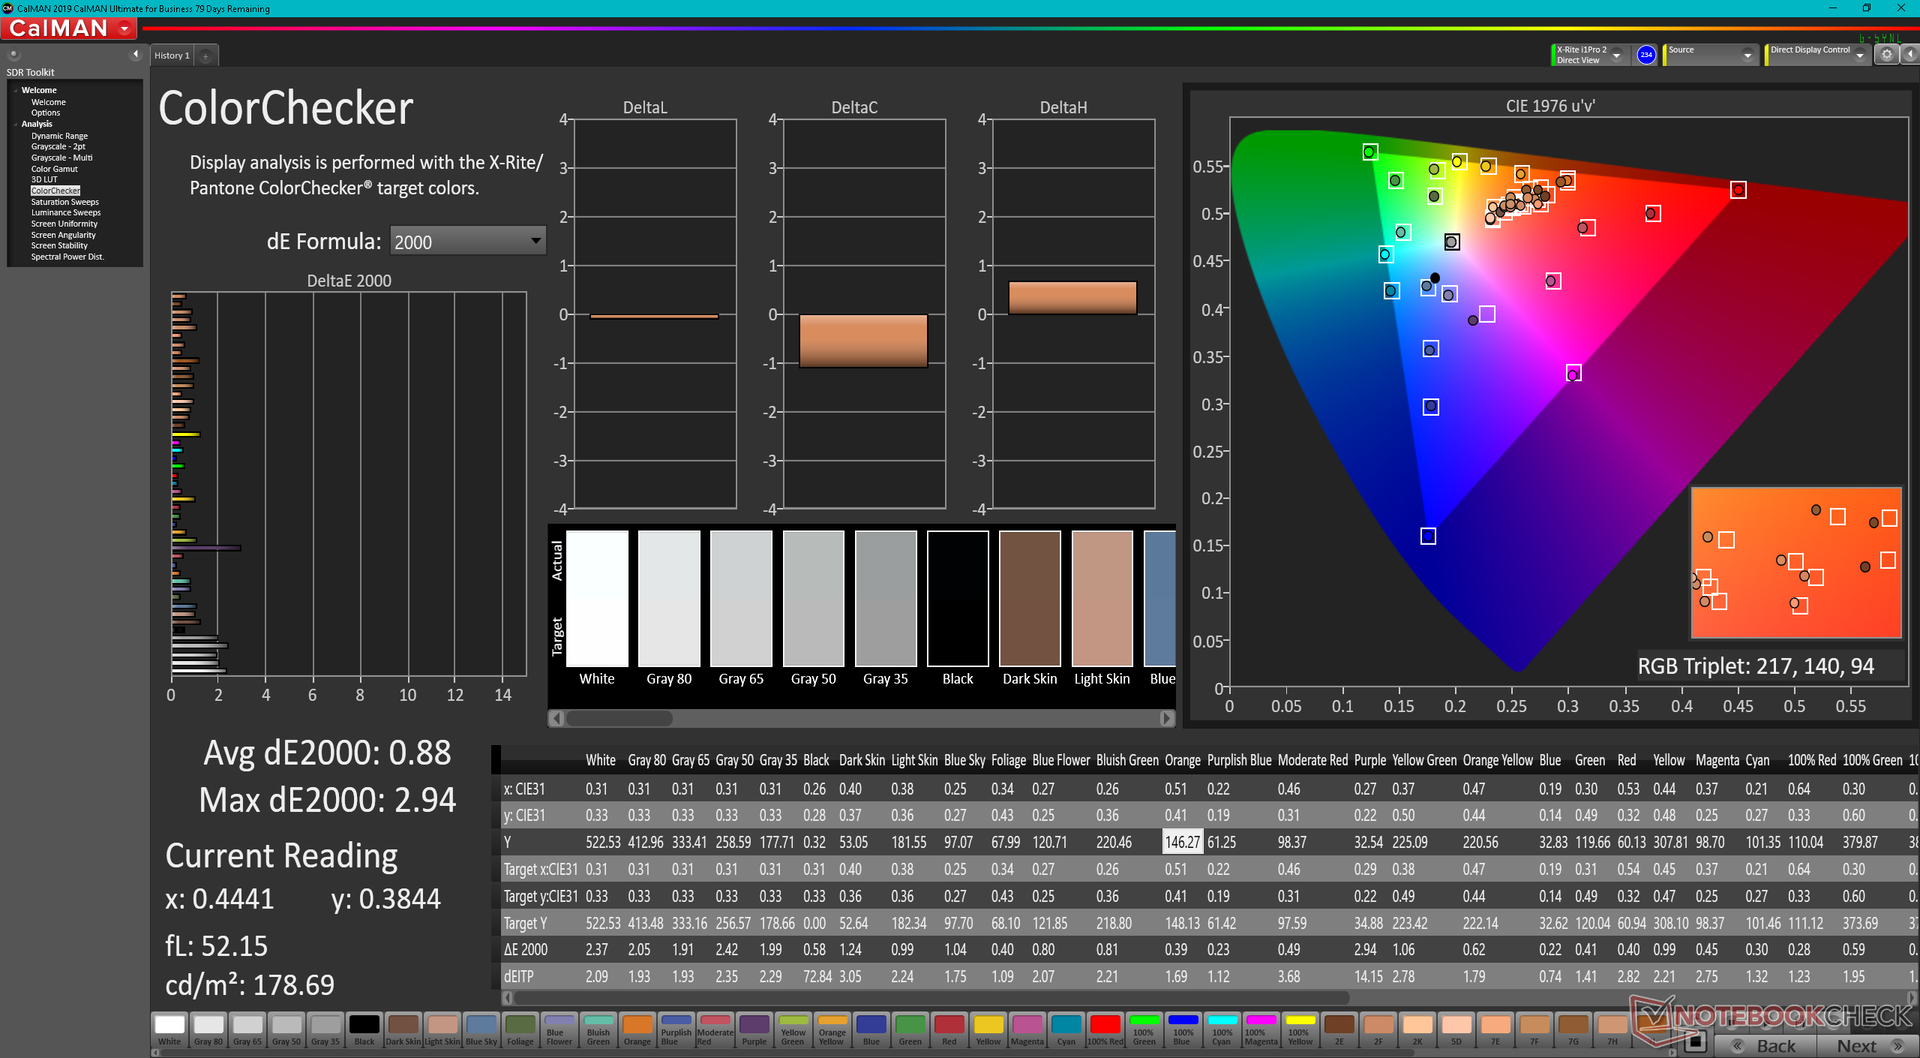
calibrated: 0.88
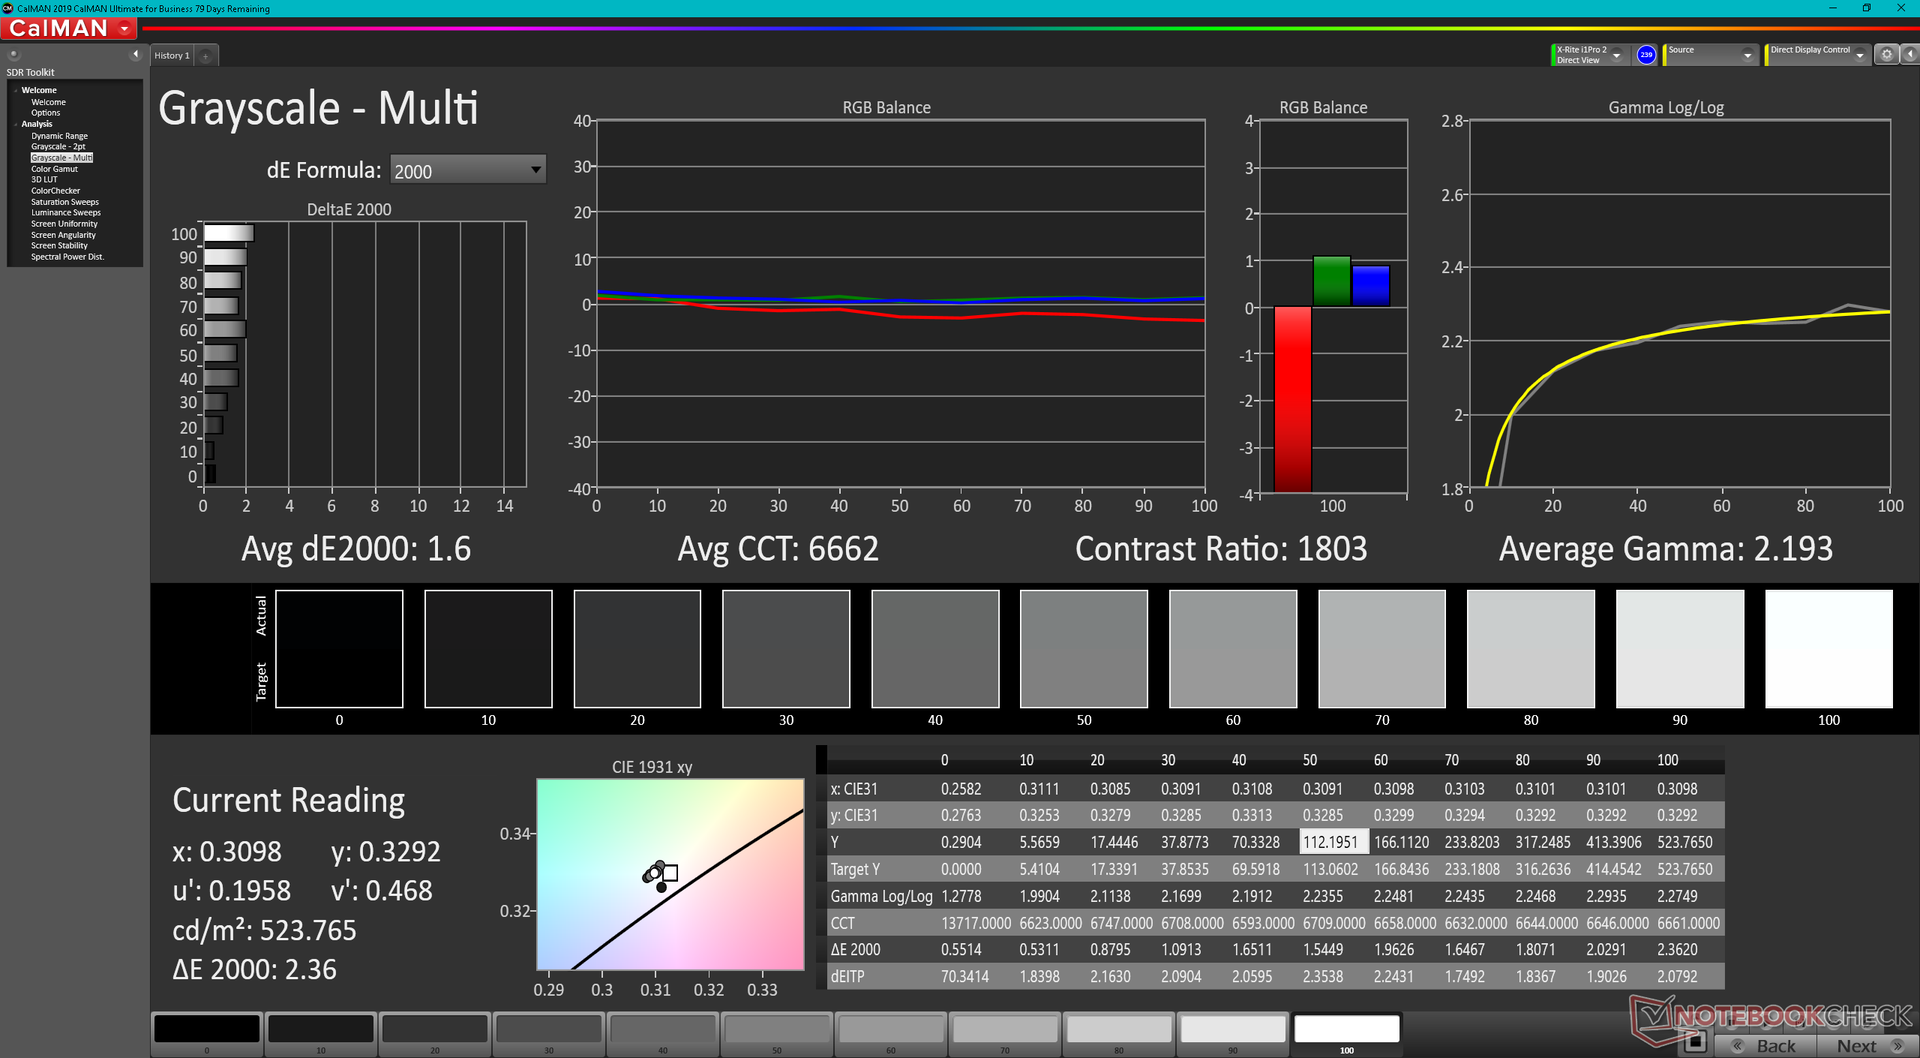
ΔE Greyscale Calman: 2.4 | ∀{0.09-98 Ø4.96}
78.7% AdobeRGB 1998 (Argyll 3D)
100% sRGB (Argyll 3D)
79.3% Display P3 (Argyll 3D)
Gamma: 2.06
CCT: 6668 K
| Dell Precision 5000 5470 AU Optronics B140QAN, IPS, 2560x1600, 14" | Lenovo ThinkPad P15v G2 21A9000XGE N156HCA-EAC, IPS LED, 1920x1080, 15.6" | Dell Precision 5000 5560 Sharp LQ156R1, IPS, 3840x2400, 15.6" | Lenovo ThinkPad P14s G2 AMD MNE001EA1-5, IPS LED, 3840x2160, 14" | HP ZBook Firefly 14 G8 2C9Q2EA AU Optronics AUO068B, IPS, 1920x1080, 14" | HP ZBook Firefly 14 G7 InfoVision IVO8C78 (X140NVFC R0), IPS, 1920x1080, 14" | |
|---|---|---|---|---|---|---|
| Display | -41% | 16% | 10% | -7% | -4% | |
| Display P3 Coverage (%) | 79.3 | 43.7 -45% | 94.9 20% | 96.8 22% | 70 -12% | 73.8 -7% |
| sRGB Coverage (%) | 100 | 65.1 -35% | 100 0% | 99.9 0% | 99.5 0% | 99 -1% |
| AdobeRGB 1998 Coverage (%) | 78.7 | 45.3 -42% | 100 27% | 85.8 9% | 71.4 -9% | 75.5 -4% |
| Response Times | 11% | 8% | 8% | -7% | -19% | |
| Response Time Grey 50% / Grey 80% * (ms) | 52.4 ? | 48 ? 8% | 47.2 ? 10% | 52 ? 1% | 64.4 ? -23% | 54.8 ? -5% |
| Response Time Black / White * (ms) | 32.4 ? | 28 ? 14% | 30.4 ? 6% | 28 ? 14% | 29.2 ? 10% | 43.2 ? -33% |
| PWM Frequency (Hz) | 284.1 ? | |||||
| Screen | -116% | -24% | -19% | -10% | -27% | |
| Brightness middle (cd/m²) | 537 | 305 -43% | 501.5 -7% | 512 -5% | 461 -14% | 934 74% |
| Brightness (cd/m²) | 518 | 281 -46% | 467 -10% | 487 -6% | 439 -15% | 937 81% |
| Brightness Distribution (%) | 94 | 88 -6% | 83 -12% | 90 -4% | 89 -5% | 87 -7% |
| Black Level * (cd/m²) | 0.33 | 0.32 3% | 0.44 -33% | 0.35 -6% | 0.24 27% | 0.37 -12% |
| Contrast (:1) | 1627 | 953 -41% | 1140 -30% | 1463 -10% | 1921 18% | 2524 55% |
| Colorchecker dE 2000 * | 2.97 | 5.9 -99% | 4.73 -59% | 3.1 -4% | 2.6 12% | 4.7 -58% |
| Colorchecker dE 2000 max. * | 5.33 | 20.1 -277% | 8.45 -59% | 8.4 -58% | 5.8 -9% | 10.5 -97% |
| Colorchecker dE 2000 calibrated * | 0.88 | 4.5 -411% | 0.51 42% | 0.4 55% | 1.1 -25% | 1.6 -82% |
| Greyscale dE 2000 * | 2.4 | 5.3 -121% | 3.6 -50% | 5.5 -129% | 4.4 -83% | 7.1 -196% |
| Gamma | 2.06 107% | 2.1 105% | 2.08 106% | 2.22 99% | 2.29 96% | 2.31 95% |
| CCT | 6668 97% | 6307 103% | 6447 101% | 6373 102% | 6478 100% | 6348 102% |
| Color Space (Percent of AdobeRGB 1998) (%) | 65.2 | 68.5 | ||||
| Color Space (Percent of sRGB) (%) | 99.4 | 98.9 | ||||
| Totaal Gemiddelde (Programma / Instellingen) | -49% /
-82% | 0% /
-11% | -0% /
-9% | -8% /
-9% | -17% /
-21% |
* ... kleiner is beter
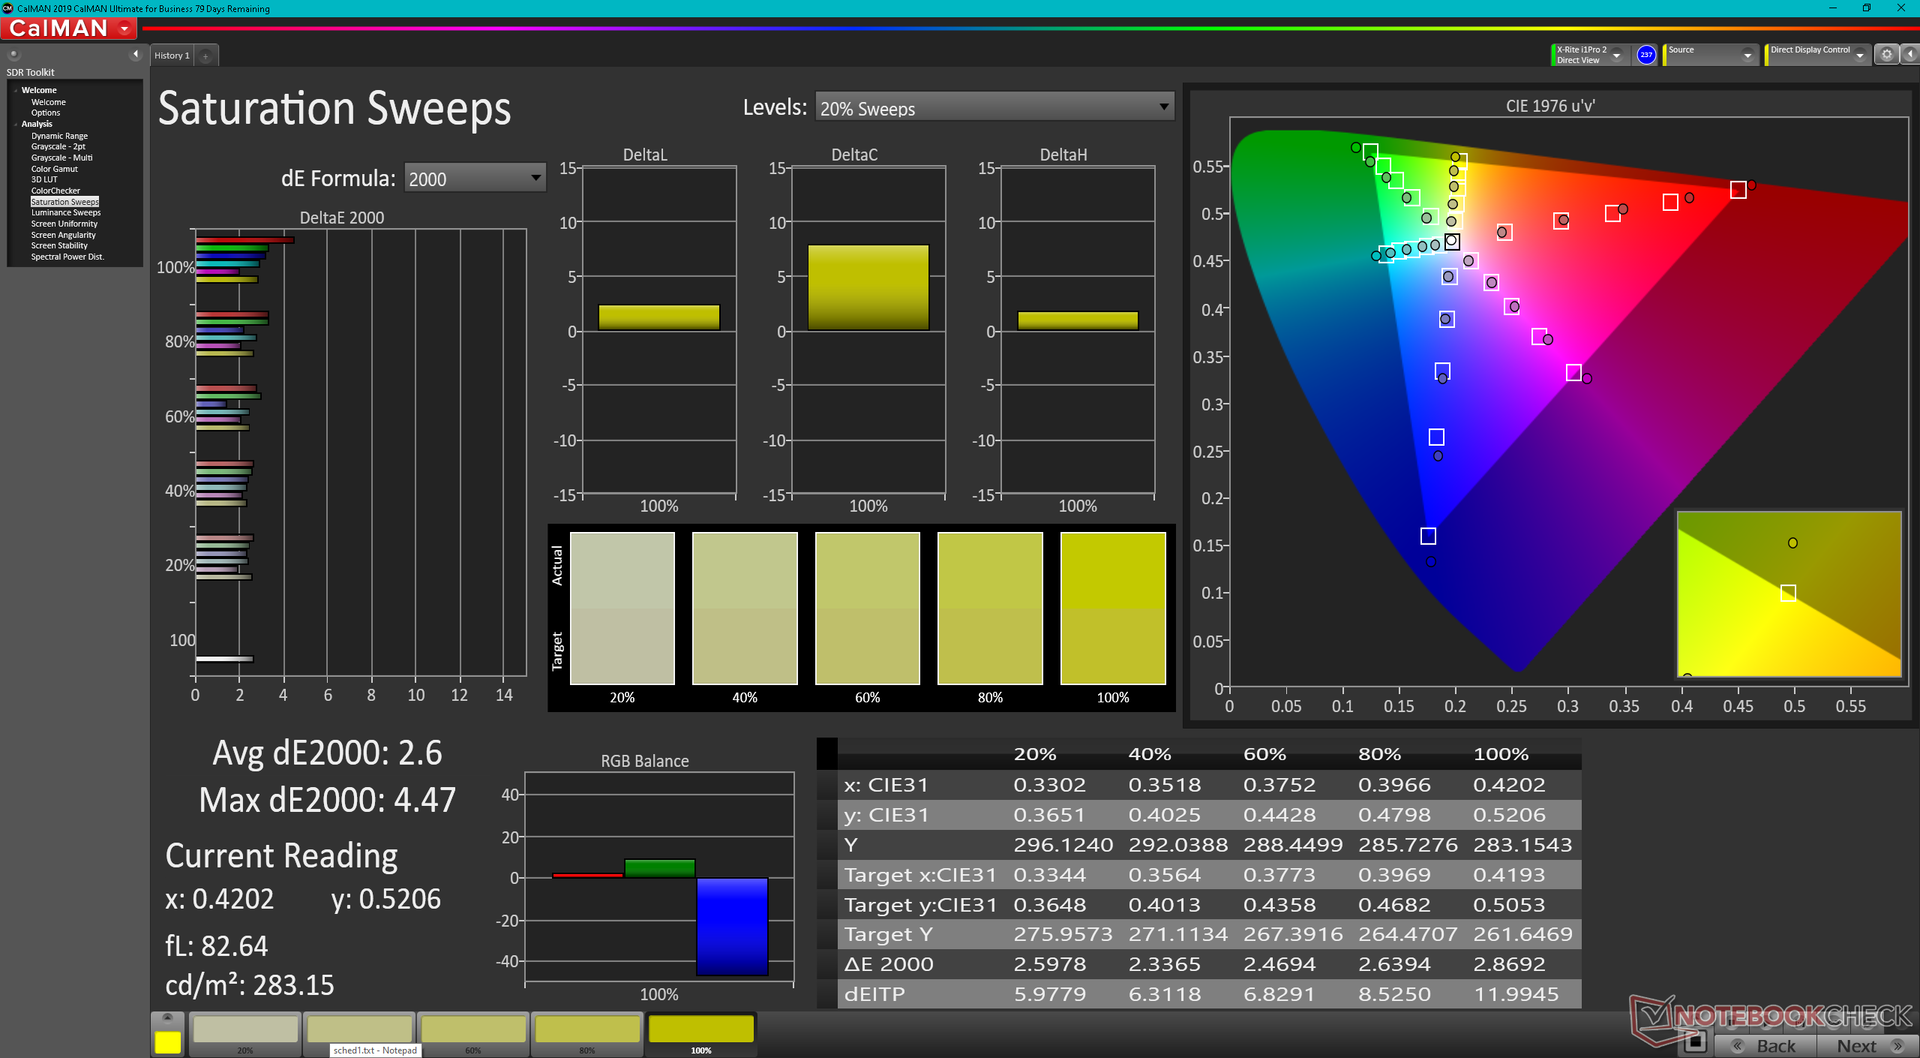
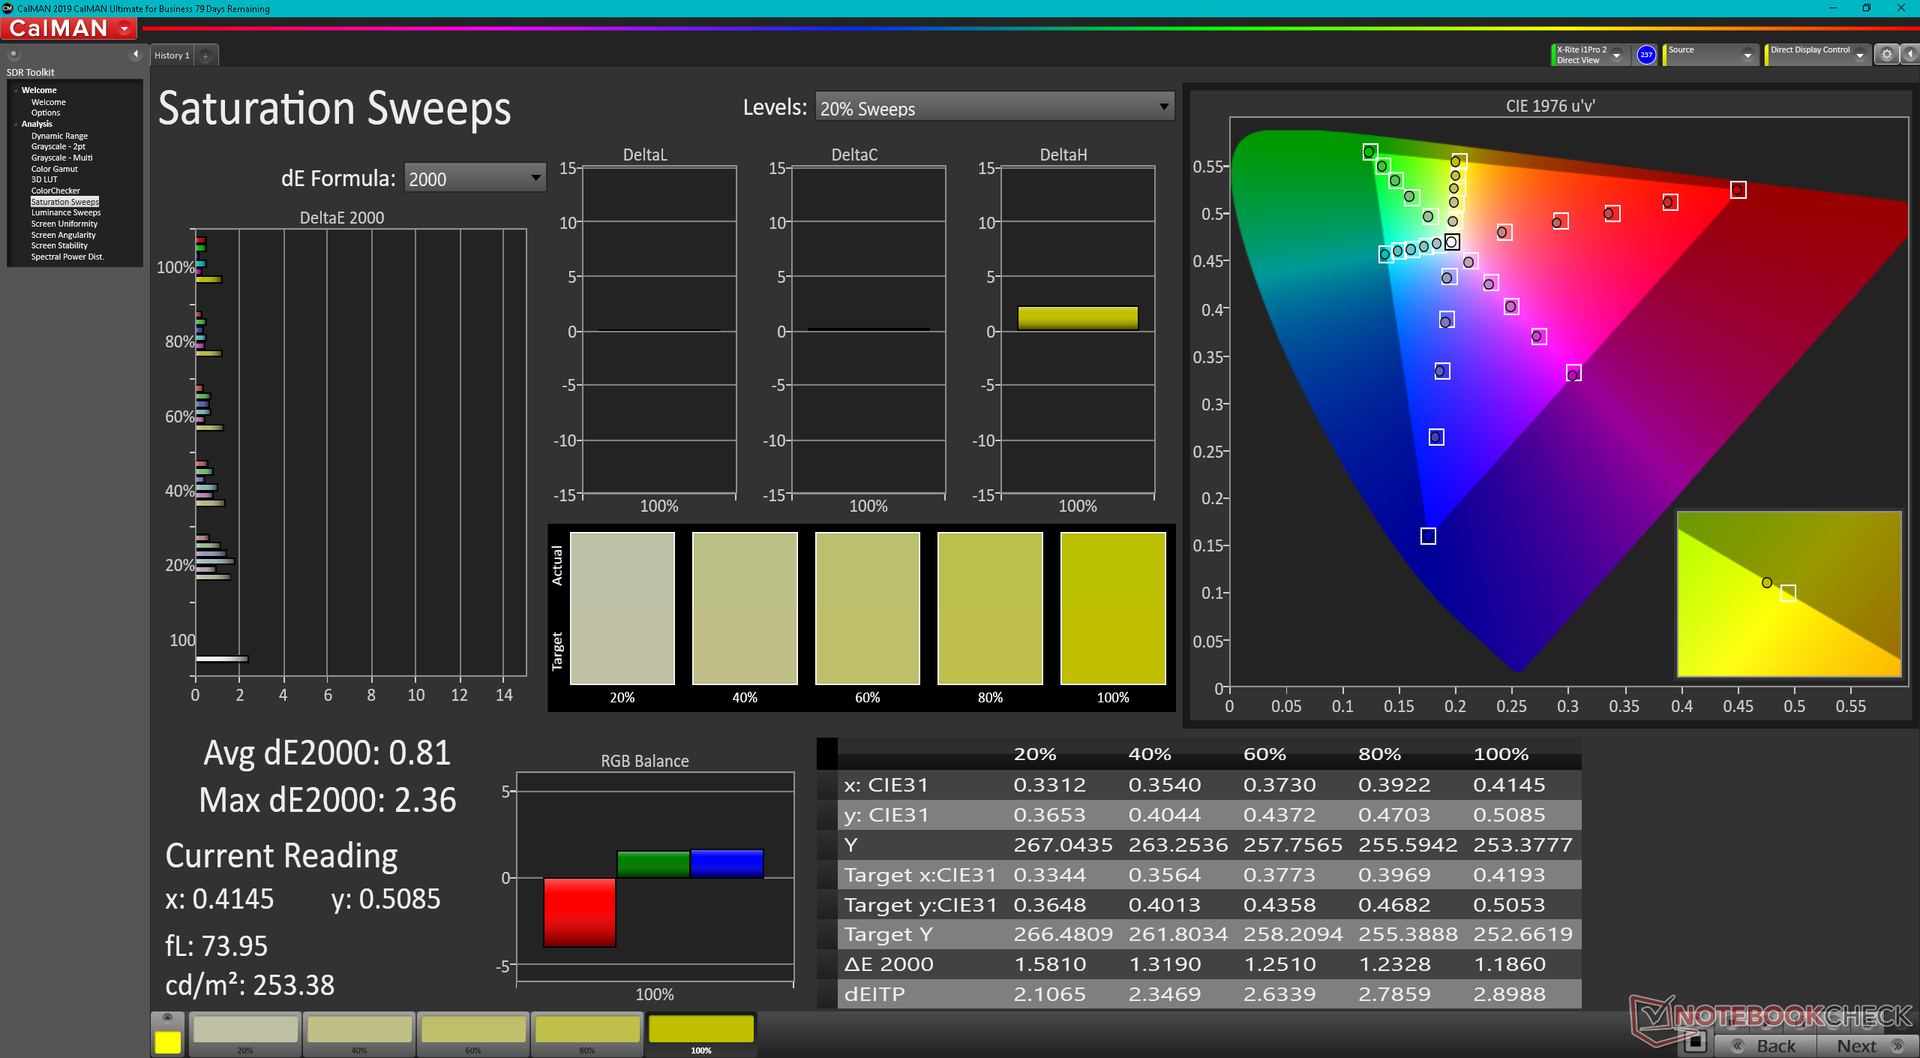
Het scherm is goed gekalibreerd uit de doos tegen de sRGB standaard met gemiddelde grijswaarden en kleur DeltaE waarden van slechts 2,4 en 2,97, respectievelijk. We kunnen deze waarden nog verder verbeteren met onze X-Rite colorimeter tot <2 elk, zoals blijkt uit onze CalMan resultaten hieronder.
Responstijd Scherm
| ↔ Responstijd Zwart naar Wit | ||
|---|---|---|
| 32.4 ms ... stijging ↗ en daling ↘ gecombineerd | ↗ 15.6 ms stijging | 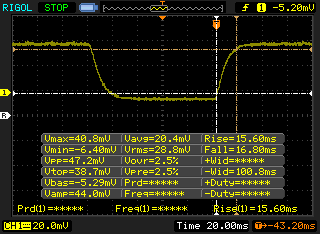 |
| ↘ 16.8 ms daling | ||
| Het scherm vertoonde trage responstijden in onze tests en is misschien te traag voor games. Ter vergelijking: alle testtoestellen variëren van 0.1 (minimum) tot 240 (maximum) ms. » 88 % van alle toestellen zijn beter. Dit betekent dat de gemeten responstijd slechter is dan het gemiddelde (19.8 ms) van alle geteste toestellen. | ||
| ↔ Responstijd 50% Grijs naar 80% Grijs | ||
| 52.4 ms ... stijging ↗ en daling ↘ gecombineerd | ↗ 24.4 ms stijging | 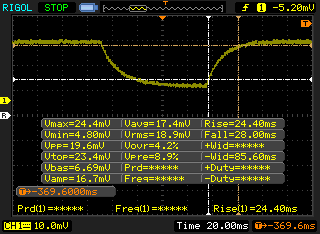 |
| ↘ 28 ms daling | ||
| Het scherm vertoonde trage responstijden in onze tests en is misschien te traag voor games. Ter vergelijking: alle testtoestellen variëren van 0.165 (minimum) tot 636 (maximum) ms. » 89 % van alle toestellen zijn beter. Dit betekent dat de gemeten responstijd slechter is dan het gemiddelde (31 ms) van alle geteste toestellen. | ||
Screen Flickering / PWM (Pulse-Width Modulation)
| Screen flickering / PWM niet waargenomen | 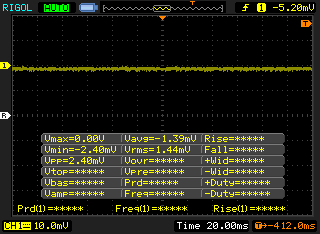 | ||
Ter vergelijking: 52 % van alle geteste toestellen maakten geen gebruik van PWM om de schermhelderheid te verlagen. Als het wel werd gebruikt, werd een gemiddelde van 7754 (minimum: 5 - maximum: 343500) Hz waargenomen. | |||
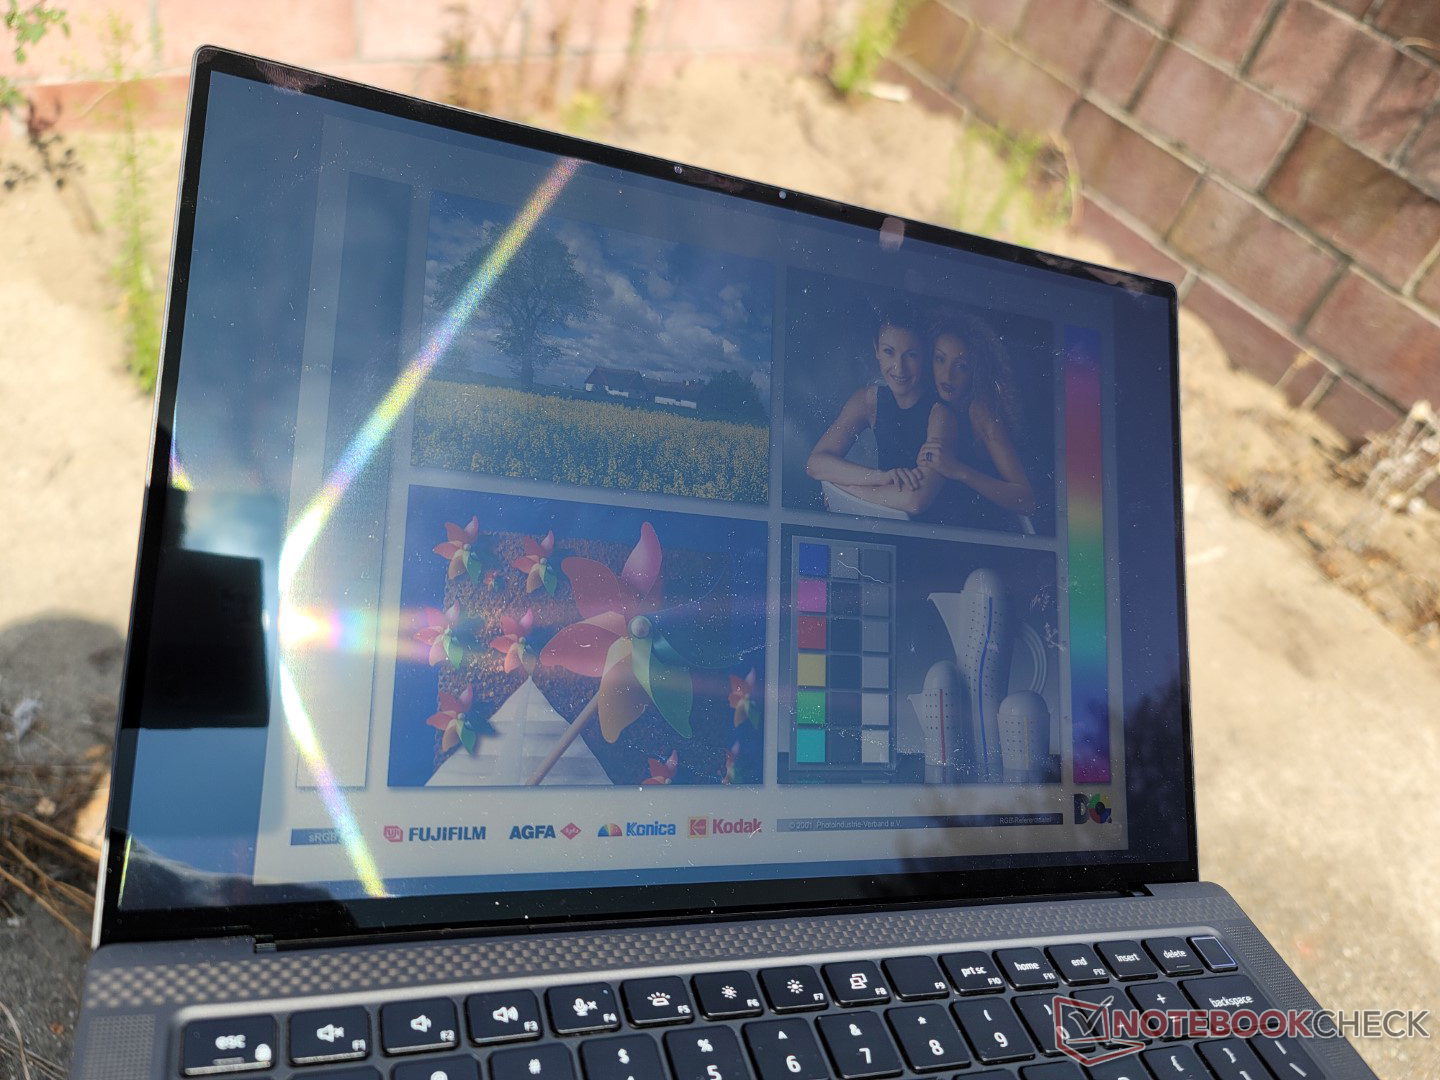
Het scherm is helderder dan op de meeste consumenten Ultrabooks voor een betere zichtbaarheid buitenshuis. Toch zijn veel HP EliteBook of ZBook modellen bieden 1000-nit paneel opties voor een aanzienlijk gemakkelijker buiten. Dell moet nog soortgelijke helderheidsopties bieden voor zijn Precision serie.

Prestaties - Core i9 H-serie CPU en discrete GPU
Testomstandigheden
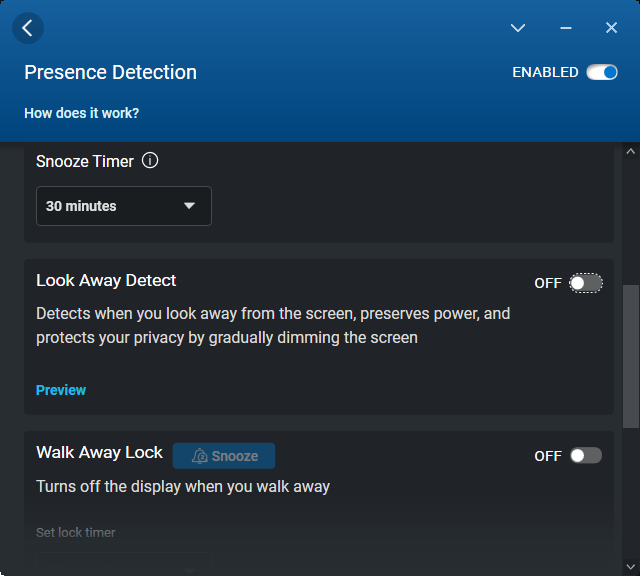
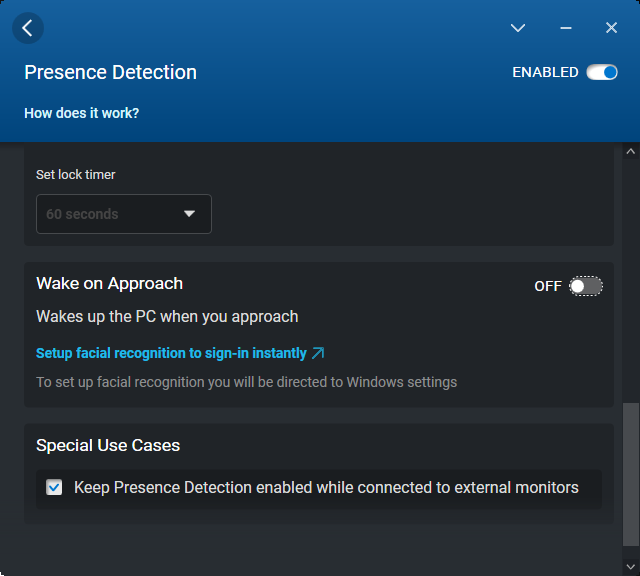
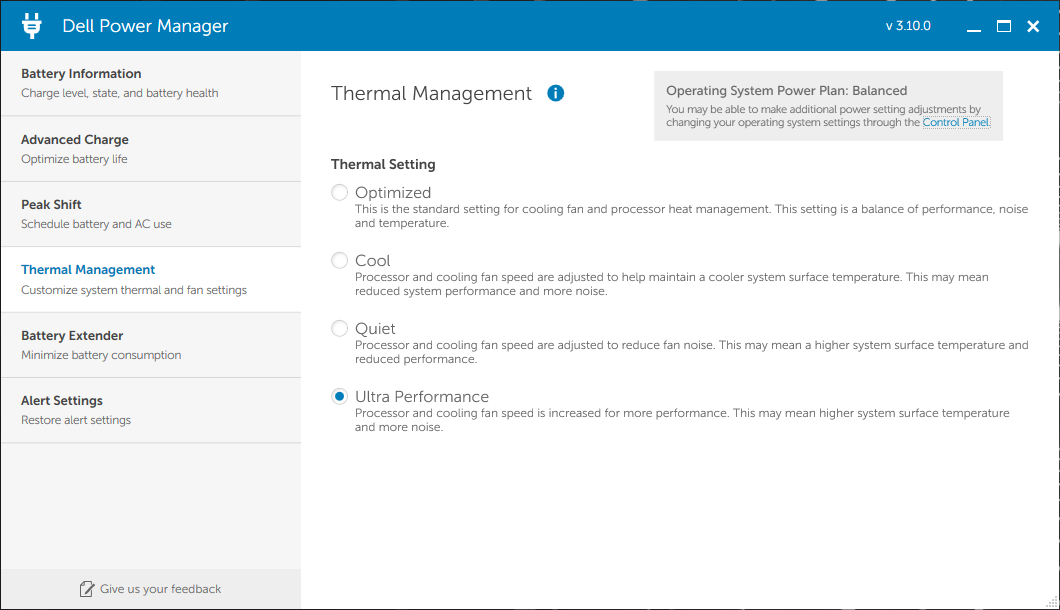
We hebben ons toestel via de Dell Optimizer software in Ultra Performance modus gezet voordat we onderstaande benchmarks uitvoerden. We hebben ook de discrete Nvidia GPU ingeschakeld via het Nvidia Control Panel. Merk op dat dezelfde energie-instellingen kunnen worden geconfigureerd via Dell Power Manager of Dell Optimizer. Gelukkig zullen wijzigingen aan het energieprofiel in het ene programma automatisch de instellingen in het andere programma wijzigen.

Processor
De CPU-prestaties zijn een gemengd geheel. In vergelijking met andere 14-inch zakelijke laptops of werkstations, biedt de Precision 5470 aanzienlijk snellere prestaties om op gelijke hoogte te komen met zelfs grotere werkstations zoals de MSI WE76 of HP ZBook Fury 17 G8. Dit is in wezen een CPU ontworpen voor dikkere laptops geperst in een 14-inch vormfactor. In vergelijking met andere laptops met dezelfde Core i9-12900H CPU, is de processor in onze Precision gemiddeld 15 tot 20 procent langzamer.
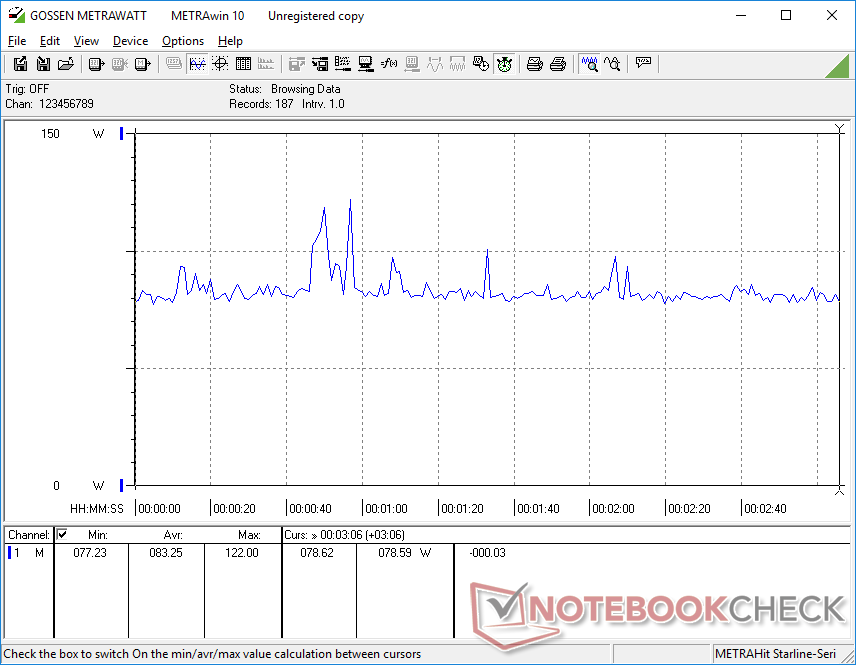
Een ander nadeel van de CPU is de onstabiele kloksnelheid. Bij het uitvoeren van CineBench R15 xT in een loop, bijvoorbeeld, zouden scores schommelen tussen 1500 en 2100 punten, zoals blijkt uit onze onderstaande grafiek om fluctuerende kloksnelheden te suggereren. Ter vergelijking: bij het uitvoeren van dezelfde test op de HP ZBook Fury 17 G8 of MSI Creator Z17, elk met Core i9-klasse CPU's, zou een dergelijke fluctuatie niet optreden.
Cinebench R15 Multi Loop
Cinebench R23: Multi Core | Single Core
Cinebench R15: CPU Multi 64Bit | CPU Single 64Bit
Blender: v2.79 BMW27 CPU
7-Zip 18.03: 7z b 4 | 7z b 4 -mmt1
Geekbench 5.5: Multi-Core | Single-Core
HWBOT x265 Benchmark v2.2: 4k Preset
LibreOffice : 20 Documents To PDF
R Benchmark 2.5: Overall mean
Cinebench R23: Multi Core | Single Core
Cinebench R15: CPU Multi 64Bit | CPU Single 64Bit
Blender: v2.79 BMW27 CPU
7-Zip 18.03: 7z b 4 | 7z b 4 -mmt1
Geekbench 5.5: Multi-Core | Single-Core
HWBOT x265 Benchmark v2.2: 4k Preset
LibreOffice : 20 Documents To PDF
R Benchmark 2.5: Overall mean
* ... kleiner is beter
AIDA64: FP32 Ray-Trace | FPU Julia | CPU SHA3 | CPU Queen | FPU SinJulia | FPU Mandel | CPU AES | CPU ZLib | FP64 Ray-Trace | CPU PhotoWorxx
| Performance rating | |
| Gemiddeld Intel Core i9-12900H | |
| Dell Precision 5000 5470 | |
| Lenovo ThinkPad P14s G2 AMD | |
| Lenovo ThinkPad P15v G2 21A9000XGE | |
| HP ZBook Firefly 14 G8 2C9Q2EA | |
| HP ZBook Firefly 14 G7 | |
| AIDA64 / FP32 Ray-Trace | |
| Dell Precision 5000 5470 | |
| Lenovo ThinkPad P15v G2 21A9000XGE | |
| Gemiddeld Intel Core i9-12900H (4074 - 18289, n=29) | |
| Lenovo ThinkPad P14s G2 AMD | |
| HP ZBook Firefly 14 G8 2C9Q2EA | |
| HP ZBook Firefly 14 G7 | |
| AIDA64 / FPU Julia | |
| Lenovo ThinkPad P14s G2 AMD | |
| Dell Precision 5000 5470 | |
| Gemiddeld Intel Core i9-12900H (22307 - 93236, n=29) | |
| Lenovo ThinkPad P15v G2 21A9000XGE | |
| HP ZBook Firefly 14 G8 2C9Q2EA | |
| HP ZBook Firefly 14 G7 | |
| AIDA64 / CPU SHA3 | |
| Lenovo ThinkPad P15v G2 21A9000XGE | |
| Gemiddeld Intel Core i9-12900H (1378 - 4215, n=29) | |
| Dell Precision 5000 5470 | |
| Lenovo ThinkPad P14s G2 AMD | |
| HP ZBook Firefly 14 G8 2C9Q2EA | |
| HP ZBook Firefly 14 G7 | |
| AIDA64 / CPU Queen | |
| Dell Precision 5000 5470 | |
| Gemiddeld Intel Core i9-12900H (78172 - 111241, n=28) | |
| Lenovo ThinkPad P15v G2 21A9000XGE | |
| Lenovo ThinkPad P14s G2 AMD | |
| HP ZBook Firefly 14 G7 | |
| HP ZBook Firefly 14 G8 2C9Q2EA | |
| AIDA64 / FPU SinJulia | |
| Lenovo ThinkPad P14s G2 AMD | |
| Gemiddeld Intel Core i9-12900H (5709 - 10410, n=29) | |
| Lenovo ThinkPad P15v G2 21A9000XGE | |
| Dell Precision 5000 5470 | |
| HP ZBook Firefly 14 G8 2C9Q2EA | |
| HP ZBook Firefly 14 G7 | |
| AIDA64 / FPU Mandel | |
| Lenovo ThinkPad P14s G2 AMD | |
| Dell Precision 5000 5470 | |
| Lenovo ThinkPad P15v G2 21A9000XGE | |
| Gemiddeld Intel Core i9-12900H (11257 - 45581, n=29) | |
| HP ZBook Firefly 14 G8 2C9Q2EA | |
| HP ZBook Firefly 14 G7 | |
| AIDA64 / CPU AES | |
| Lenovo ThinkPad P14s G2 AMD | |
| Gemiddeld Intel Core i9-12900H (31935 - 151546, n=29) | |
| Lenovo ThinkPad P15v G2 21A9000XGE | |
| HP ZBook Firefly 14 G8 2C9Q2EA | |
| Dell Precision 5000 5470 | |
| HP ZBook Firefly 14 G7 | |
| AIDA64 / CPU ZLib | |
| Gemiddeld Intel Core i9-12900H (449 - 1193, n=29) | |
| Lenovo ThinkPad P15v G2 21A9000XGE | |
| Lenovo ThinkPad P14s G2 AMD | |
| Dell Precision 5000 5470 | |
| HP ZBook Firefly 14 G8 2C9Q2EA | |
| HP ZBook Firefly 14 G7 | |
| AIDA64 / FP64 Ray-Trace | |
| Dell Precision 5000 5470 | |
| Lenovo ThinkPad P15v G2 21A9000XGE | |
| Gemiddeld Intel Core i9-12900H (2235 - 10511, n=29) | |
| Lenovo ThinkPad P14s G2 AMD | |
| HP ZBook Firefly 14 G8 2C9Q2EA | |
| HP ZBook Firefly 14 G7 | |
| AIDA64 / CPU PhotoWorxx | |
| Dell Precision 5000 5470 | |
| Gemiddeld Intel Core i9-12900H (20960 - 48269, n=30) | |
| HP ZBook Firefly 14 G8 2C9Q2EA | |
| HP ZBook Firefly 14 G7 | |
| Lenovo ThinkPad P14s G2 AMD | |
| Lenovo ThinkPad P15v G2 21A9000XGE | |
Systeemprestaties
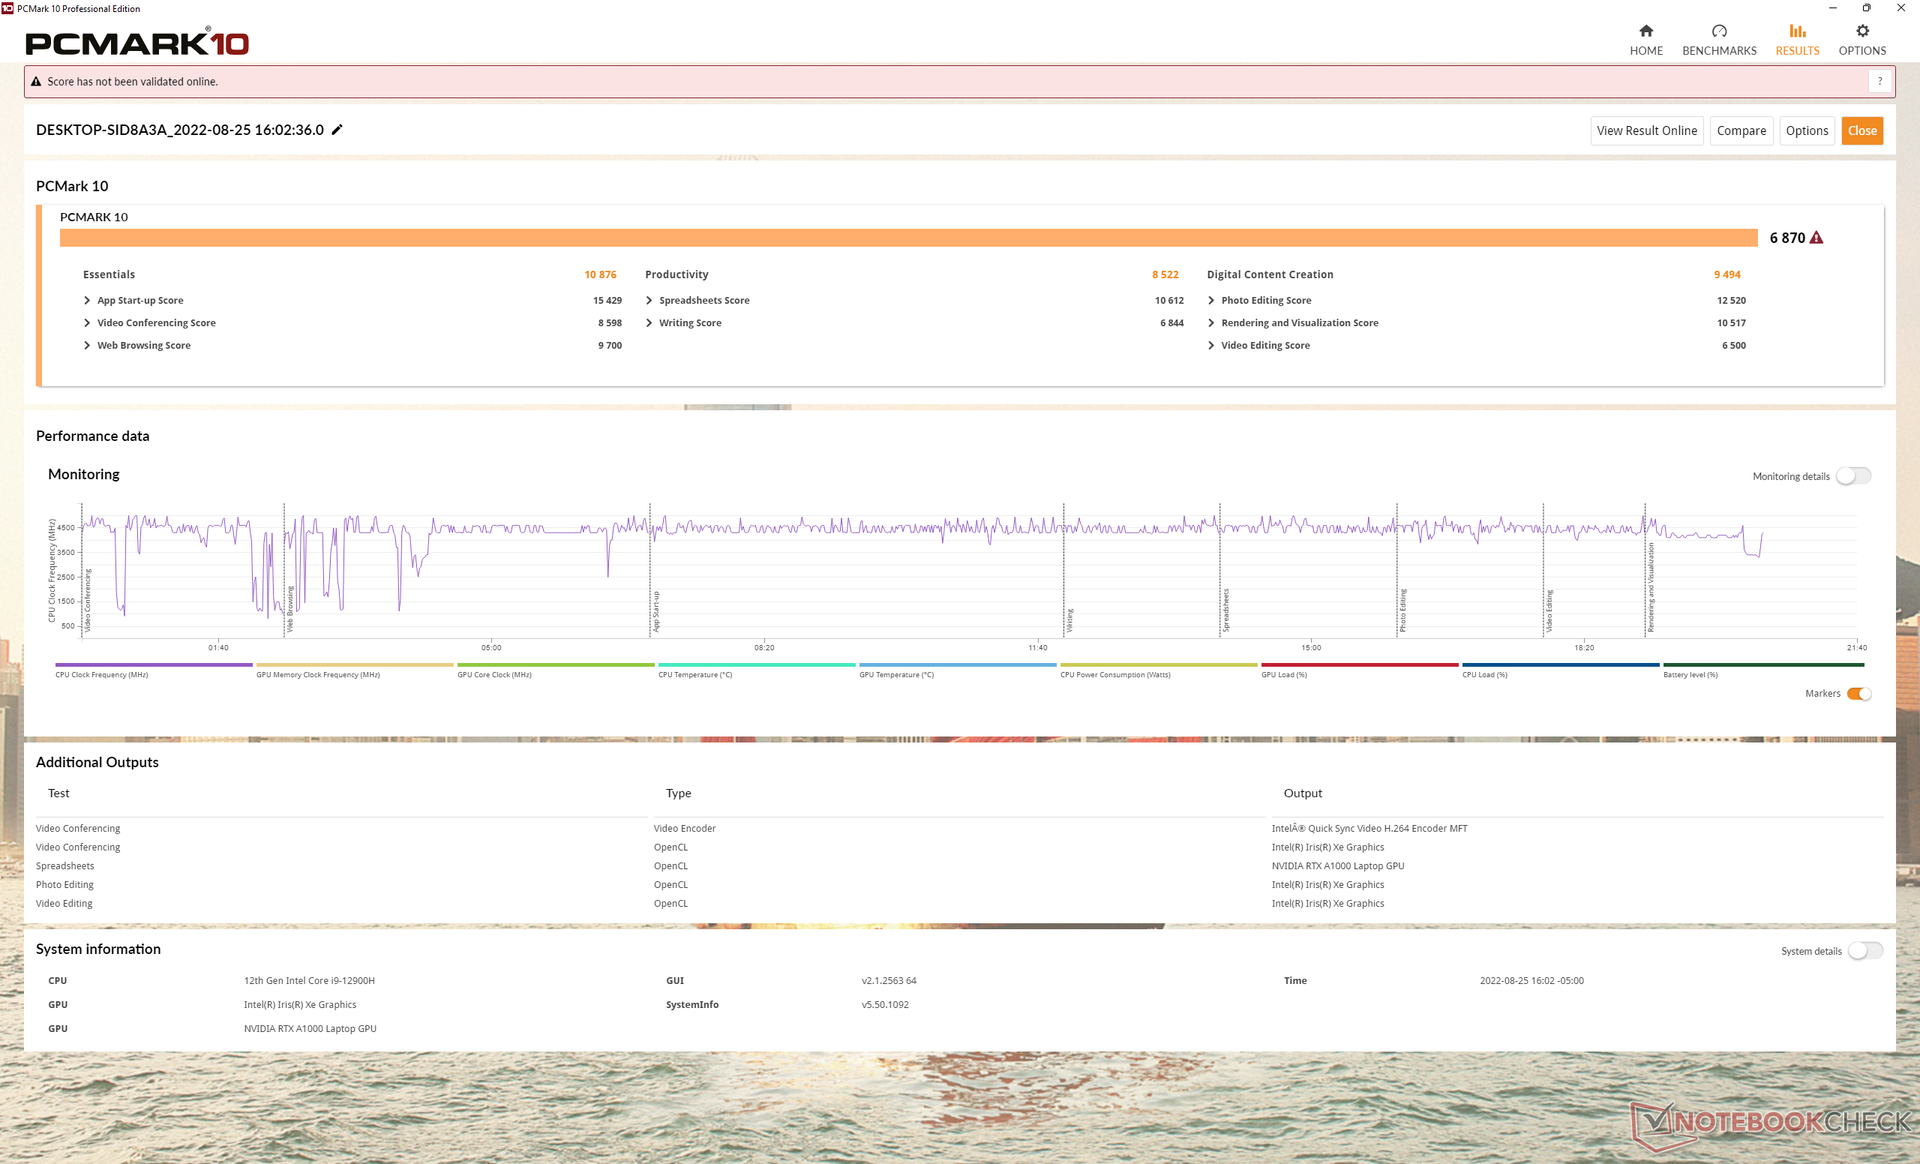
PCMark 10 resultaten zijn hoger dan verwacht in vergelijking met andere mobiele werkstations. We schrijven dit toe aan de 12e gen Core i9 H-serie CPU en PCIe4 x4 SSD, wat relatief ongewone opties zijn voor een 14-inch workstation.
CrossMark: Overall | Productivity | Creativity | Responsiveness
| PCMark 10 / Score | |
| Dell Precision 5000 5470 | |
| Gemiddeld Intel Core i9-12900H, NVIDIA RTX A1000 Laptop GPU (n=1) | |
| Dell Precision 5000 5560 | |
| Lenovo ThinkPad P15v G2 21A9000XGE | |
| Lenovo ThinkPad P14s G2 AMD | |
| HP ZBook Firefly 14 G8 2C9Q2EA | |
| HP ZBook Firefly 14 G7 | |
| PCMark 10 / Essentials | |
| Dell Precision 5000 5470 | |
| Gemiddeld Intel Core i9-12900H, NVIDIA RTX A1000 Laptop GPU (n=1) | |
| Dell Precision 5000 5560 | |
| Lenovo ThinkPad P15v G2 21A9000XGE | |
| Lenovo ThinkPad P14s G2 AMD | |
| HP ZBook Firefly 14 G8 2C9Q2EA | |
| HP ZBook Firefly 14 G7 | |
| PCMark 10 / Productivity | |
| Dell Precision 5000 5560 | |
| Lenovo ThinkPad P14s G2 AMD | |
| Dell Precision 5000 5470 | |
| Gemiddeld Intel Core i9-12900H, NVIDIA RTX A1000 Laptop GPU (n=1) | |
| HP ZBook Firefly 14 G8 2C9Q2EA | |
| Lenovo ThinkPad P15v G2 21A9000XGE | |
| HP ZBook Firefly 14 G7 | |
| PCMark 10 / Digital Content Creation | |
| Dell Precision 5000 5470 | |
| Gemiddeld Intel Core i9-12900H, NVIDIA RTX A1000 Laptop GPU (n=1) | |
| Dell Precision 5000 5560 | |
| Lenovo ThinkPad P15v G2 21A9000XGE | |
| Lenovo ThinkPad P14s G2 AMD | |
| HP ZBook Firefly 14 G8 2C9Q2EA | |
| HP ZBook Firefly 14 G7 | |
| CrossMark / Overall | |
| Dell Precision 5000 5470 | |
| Gemiddeld Intel Core i9-12900H, NVIDIA RTX A1000 Laptop GPU (n=1) | |
| Lenovo ThinkPad P15v G2 21A9000XGE | |
| CrossMark / Productivity | |
| Dell Precision 5000 5470 | |
| Gemiddeld Intel Core i9-12900H, NVIDIA RTX A1000 Laptop GPU (n=1) | |
| Lenovo ThinkPad P15v G2 21A9000XGE | |
| CrossMark / Creativity | |
| Dell Precision 5000 5470 | |
| Gemiddeld Intel Core i9-12900H, NVIDIA RTX A1000 Laptop GPU (n=1) | |
| Lenovo ThinkPad P15v G2 21A9000XGE | |
| CrossMark / Responsiveness | |
| Dell Precision 5000 5470 | |
| Gemiddeld Intel Core i9-12900H, NVIDIA RTX A1000 Laptop GPU (n=1) | |
| Lenovo ThinkPad P15v G2 21A9000XGE | |
| PCMark 10 Score | 6870 punten | |
Help | ||
| AIDA64 / Memory Copy | |
| Dell Precision 5000 5470 | |
| Gemiddeld Intel Core i9-12900H (34438 - 74264, n=29) | |
| Lenovo ThinkPad P14s G2 AMD | |
| HP ZBook Firefly 14 G8 2C9Q2EA | |
| HP ZBook Firefly 14 G7 | |
| Lenovo ThinkPad P15v G2 21A9000XGE | |
| AIDA64 / Memory Read | |
| Dell Precision 5000 5470 | |
| Gemiddeld Intel Core i9-12900H (36365 - 74642, n=29) | |
| Lenovo ThinkPad P14s G2 AMD | |
| HP ZBook Firefly 14 G8 2C9Q2EA | |
| HP ZBook Firefly 14 G7 | |
| Lenovo ThinkPad P15v G2 21A9000XGE | |
| AIDA64 / Memory Write | |
| Dell Precision 5000 5470 | |
| Gemiddeld Intel Core i9-12900H (32276 - 67858, n=29) | |
| HP ZBook Firefly 14 G8 2C9Q2EA | |
| Lenovo ThinkPad P14s G2 AMD | |
| HP ZBook Firefly 14 G7 | |
| Lenovo ThinkPad P15v G2 21A9000XGE | |
| AIDA64 / Memory Latency | |
| Dell Precision 5000 5470 | |
| Lenovo ThinkPad P14s G2 AMD | |
| Lenovo ThinkPad P15v G2 21A9000XGE | |
| Gemiddeld Intel Core i9-12900H (74.7 - 118.1, n=28) | |
| HP ZBook Firefly 14 G7 | |
| HP ZBook Firefly 14 G8 2C9Q2EA | |
* ... kleiner is beter
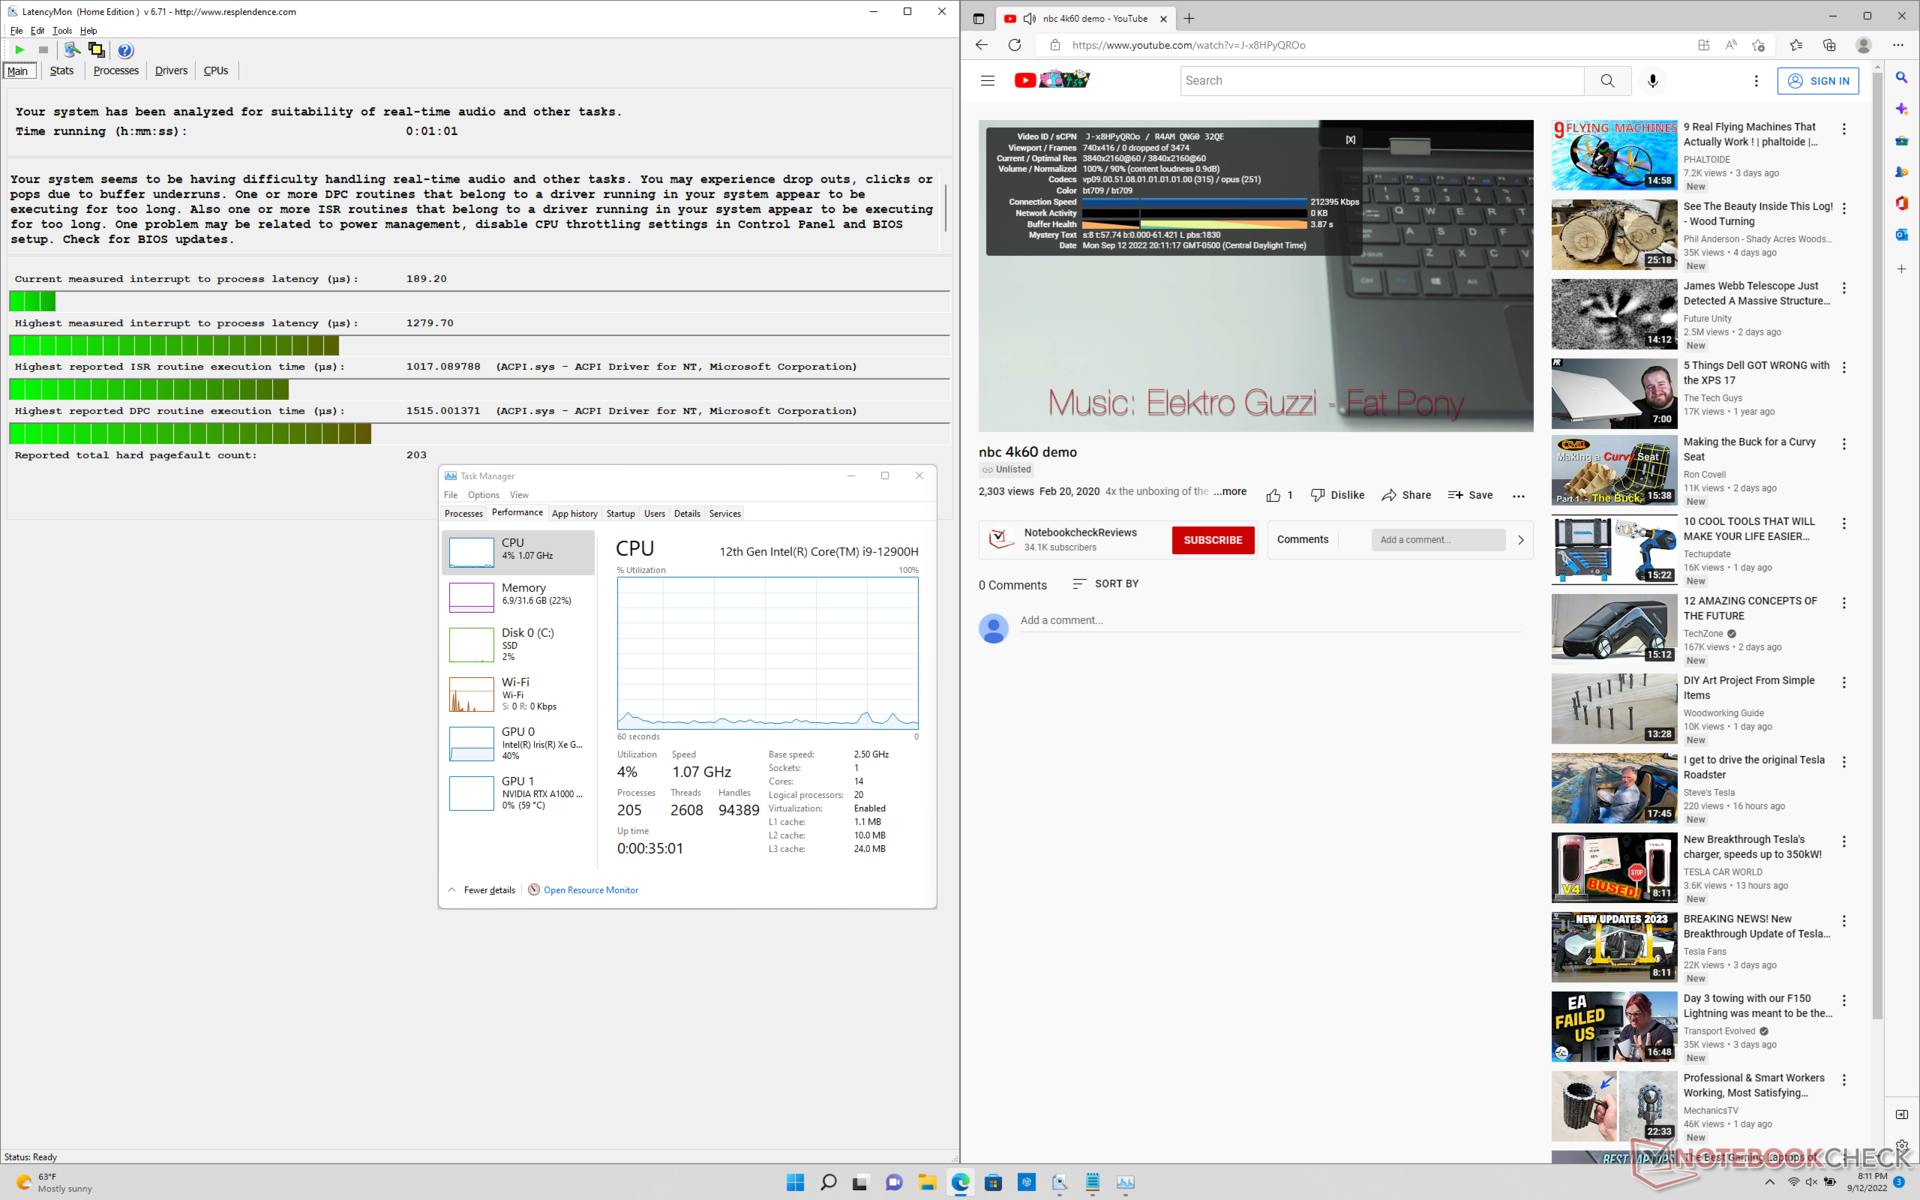
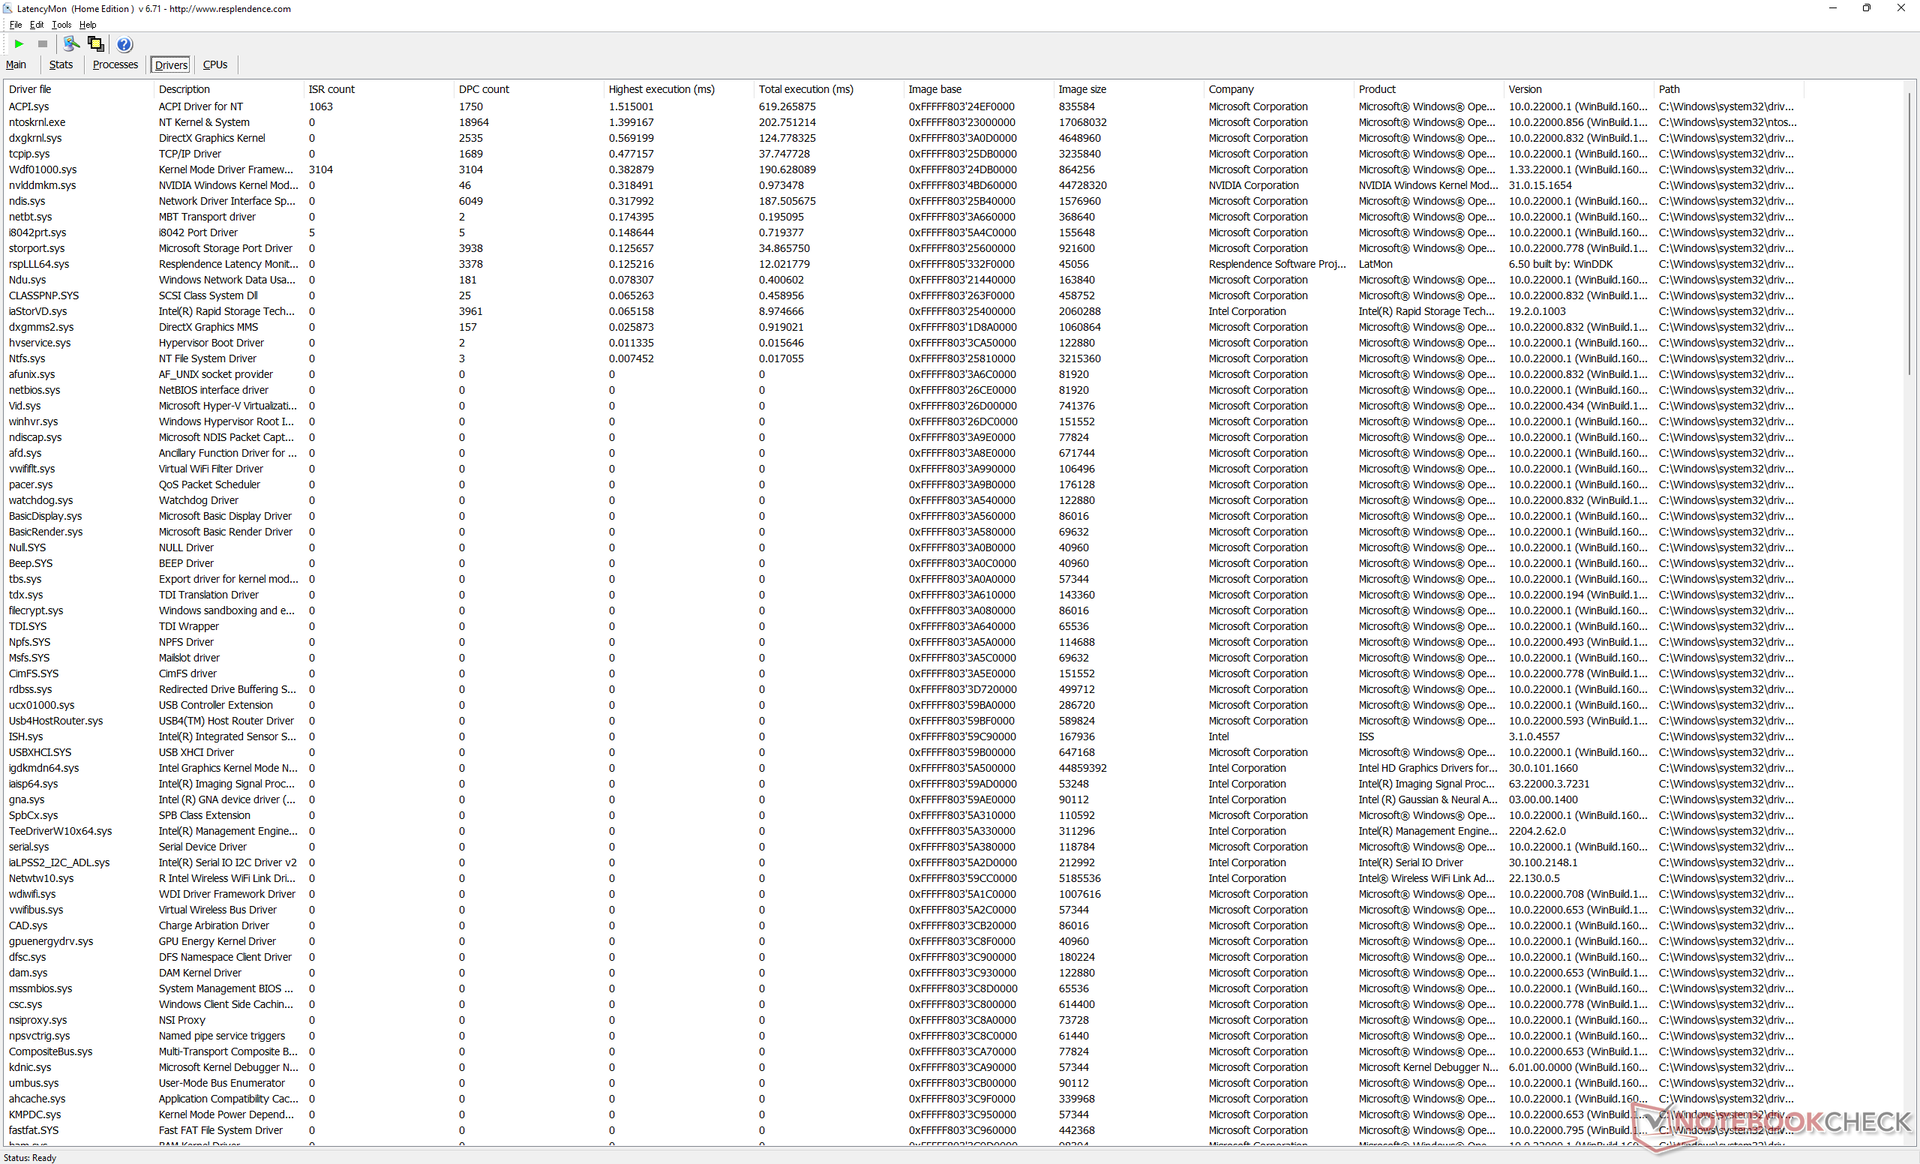
DPC latentie
LatencyMon onthult lichte DPC-problemen bij het openen van meerdere browsertabbladen op onze homepage, wat een beetje teleurstellend is om te zien op een werkstation. 4K-weergave bij 60 FPS is verder perfect met geen dropped frames tijdens onze minutenlange videotest.
| DPC Latencies / LatencyMon - interrupt to process latency (max), Web, Youtube, Prime95 | |
| Lenovo ThinkPad P15v G2 21A9000XGE | |
| HP ZBook Firefly 14 G8 2C9Q2EA | |
| Lenovo ThinkPad P14s G2 AMD | |
| HP ZBook Firefly 14 G7 | |
| Dell Precision 5000 5470 | |
| Dell Precision 5000 5560 | |
* ... kleiner is beter
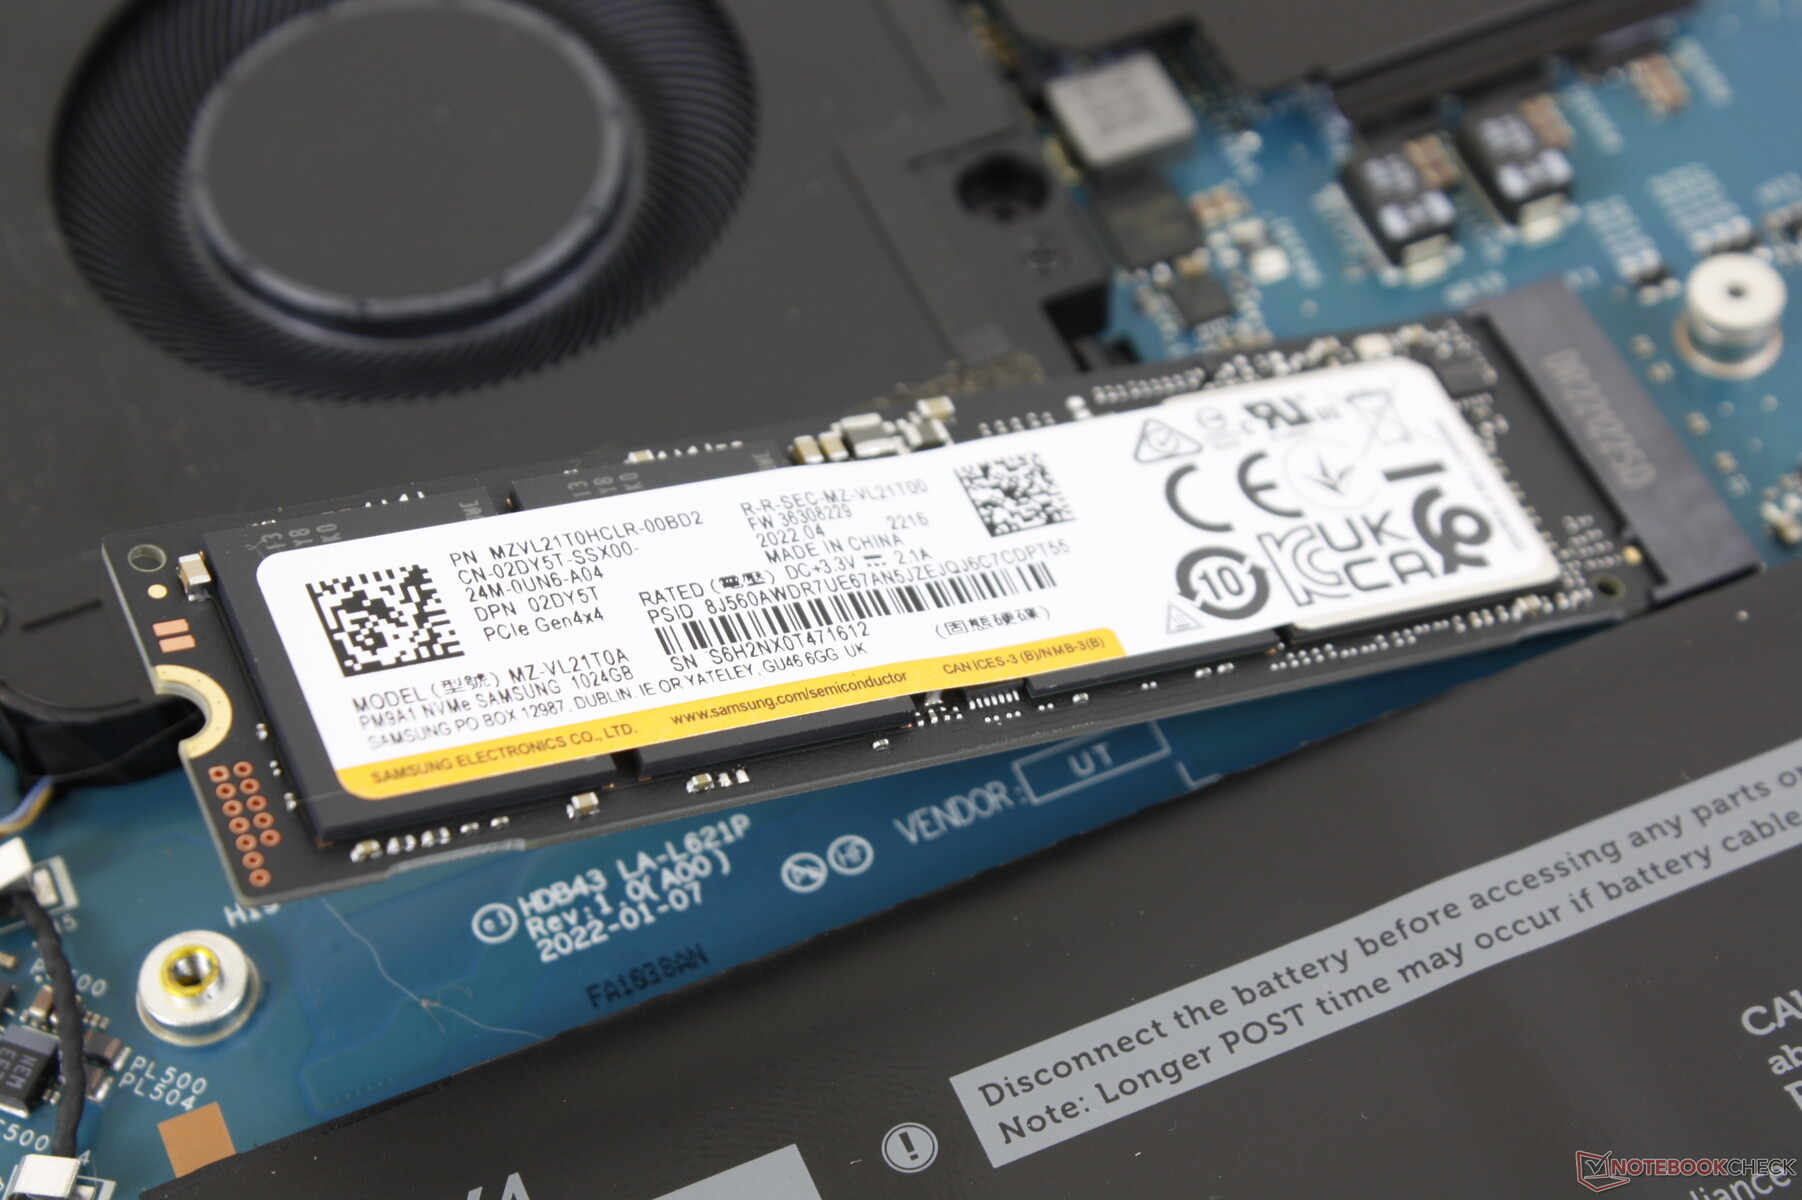
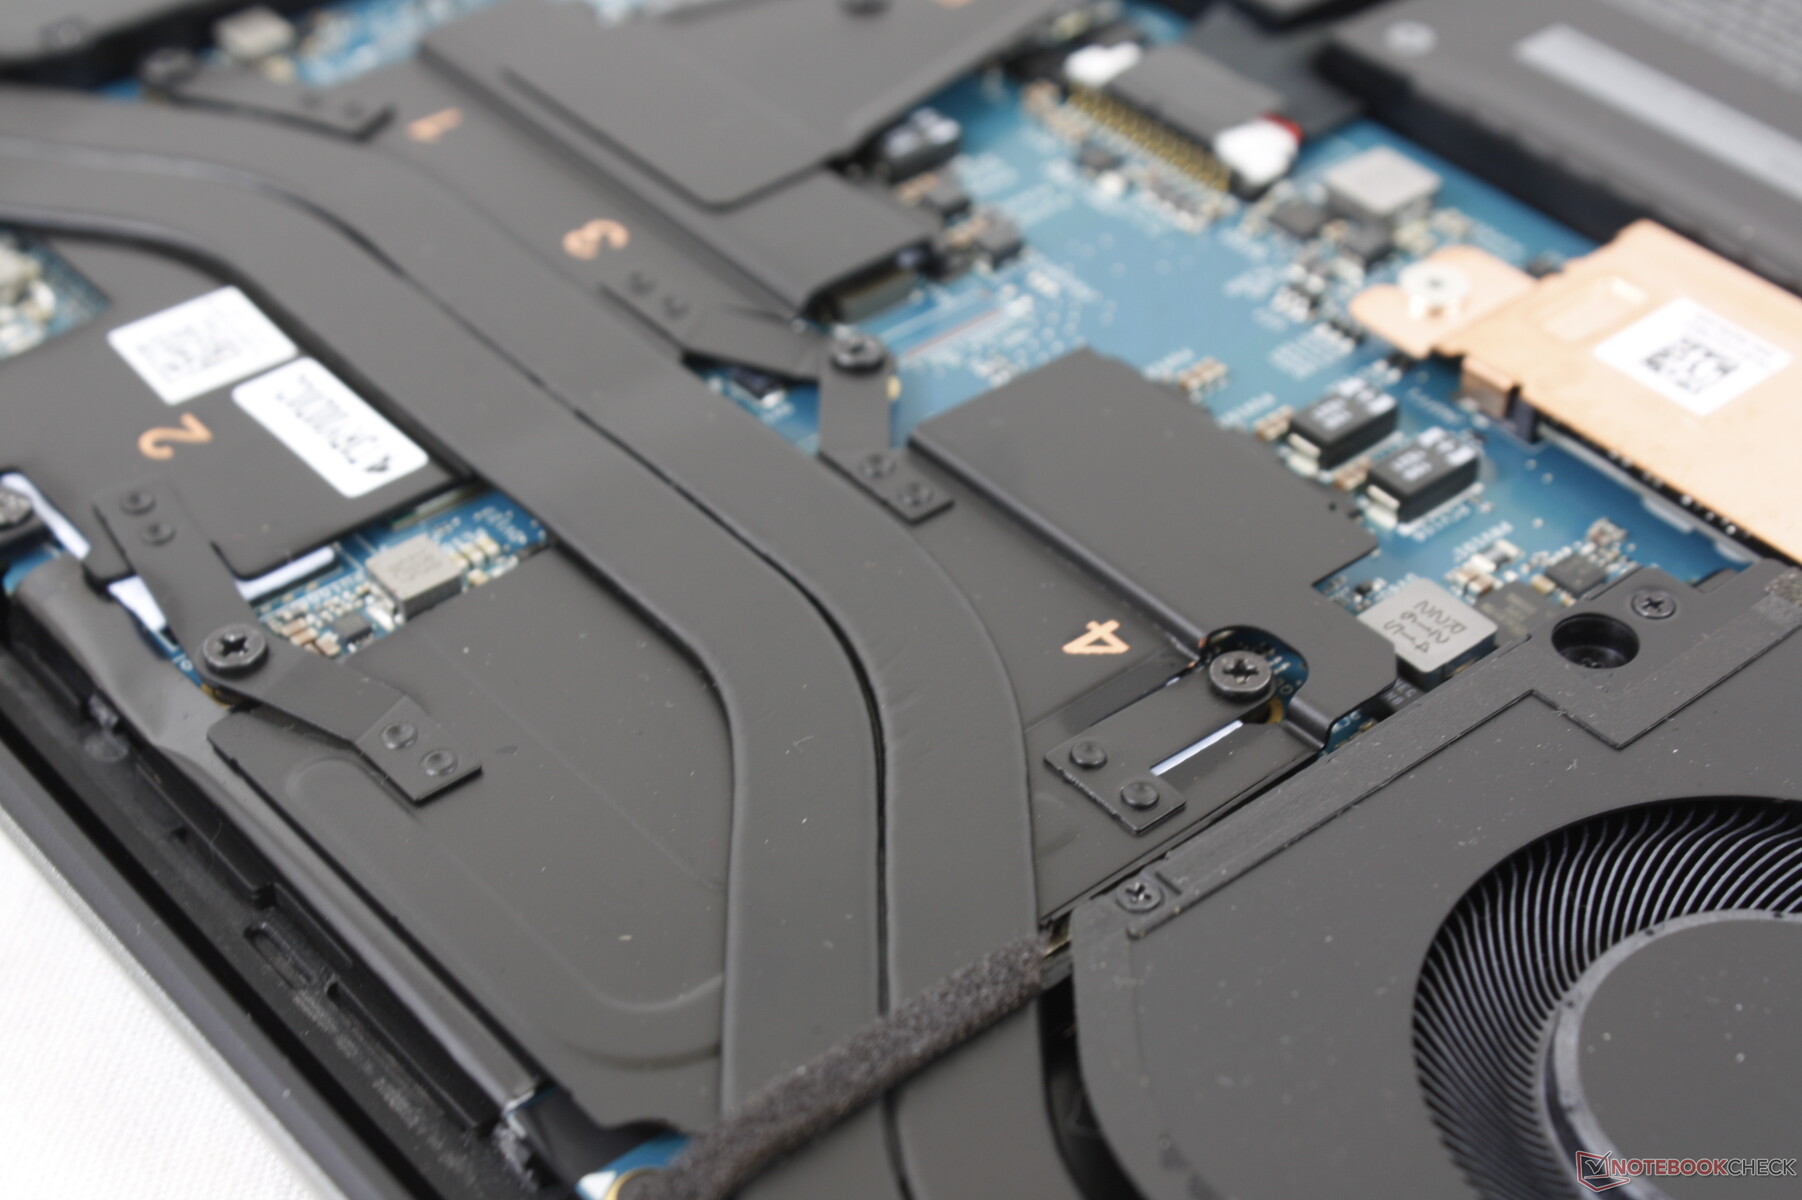
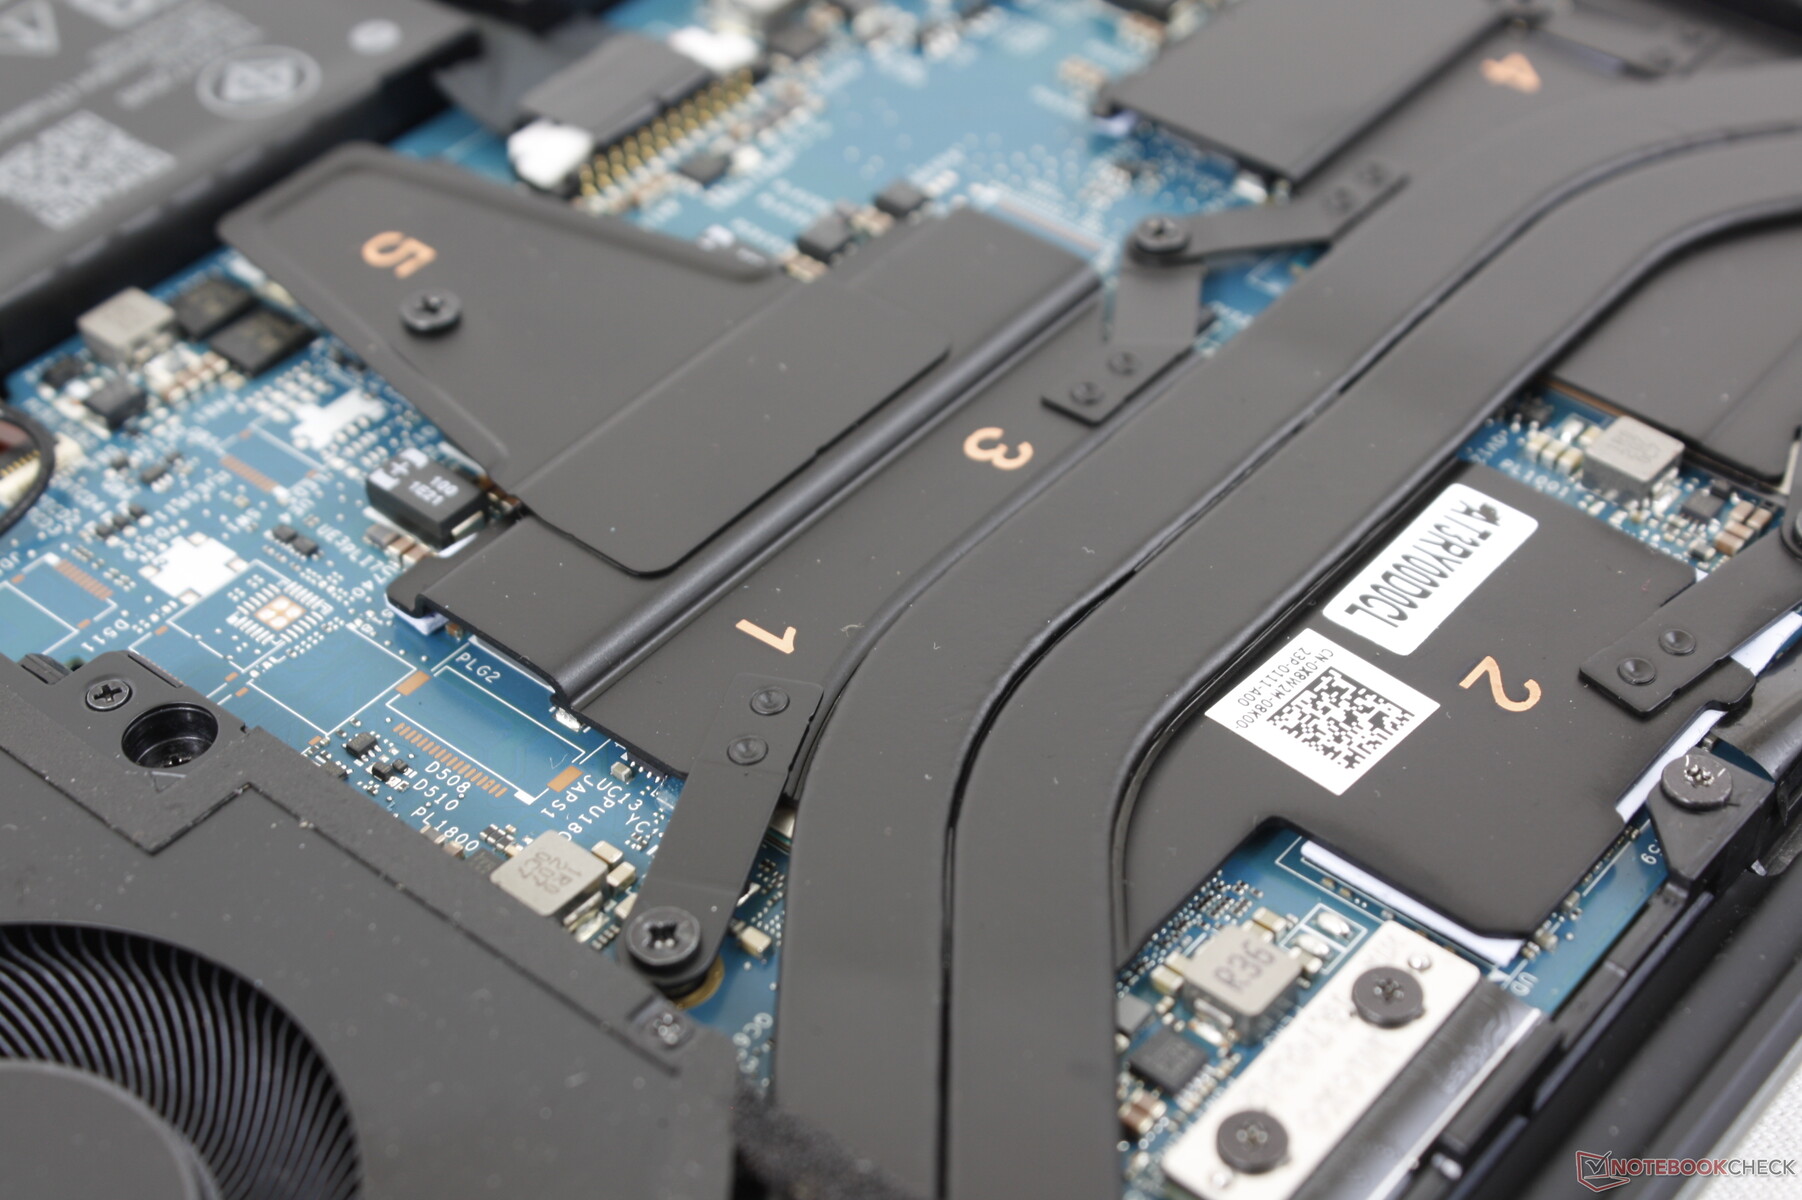
Opslagapparaten
Dell biedt 256 GB tot 4 TB PCIe3- of PCIe4-opslagopties met optionele zelfversleuteling. De PCIe4 Samsung PM9A1 schijf in onze testunit bevat zijn eigen koperen hittespreider voor betere duurzame prestaties dan op laptops zonder SSD-hittespreider zoals de Latitude 7330.

| Drive Performance rating - Percent | |
| Dell Precision 5000 5560 | |
| Dell Precision 5000 5470 | |
| Lenovo ThinkPad P14s G2 AMD | |
| HP ZBook Firefly 14 G8 2C9Q2EA | |
| HP ZBook Firefly 14 G7 | |
| Lenovo ThinkPad P15v G2 21A9000XGE | |
* ... kleiner is beter
Disk Throttling: DiskSpd Read Loop, Queue Depth 8
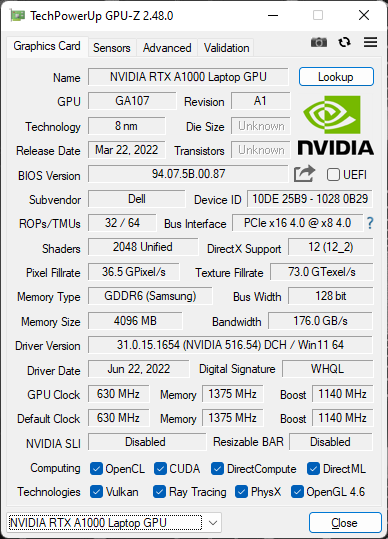
GPU-prestaties - 40 W RTX A1000 Graphics
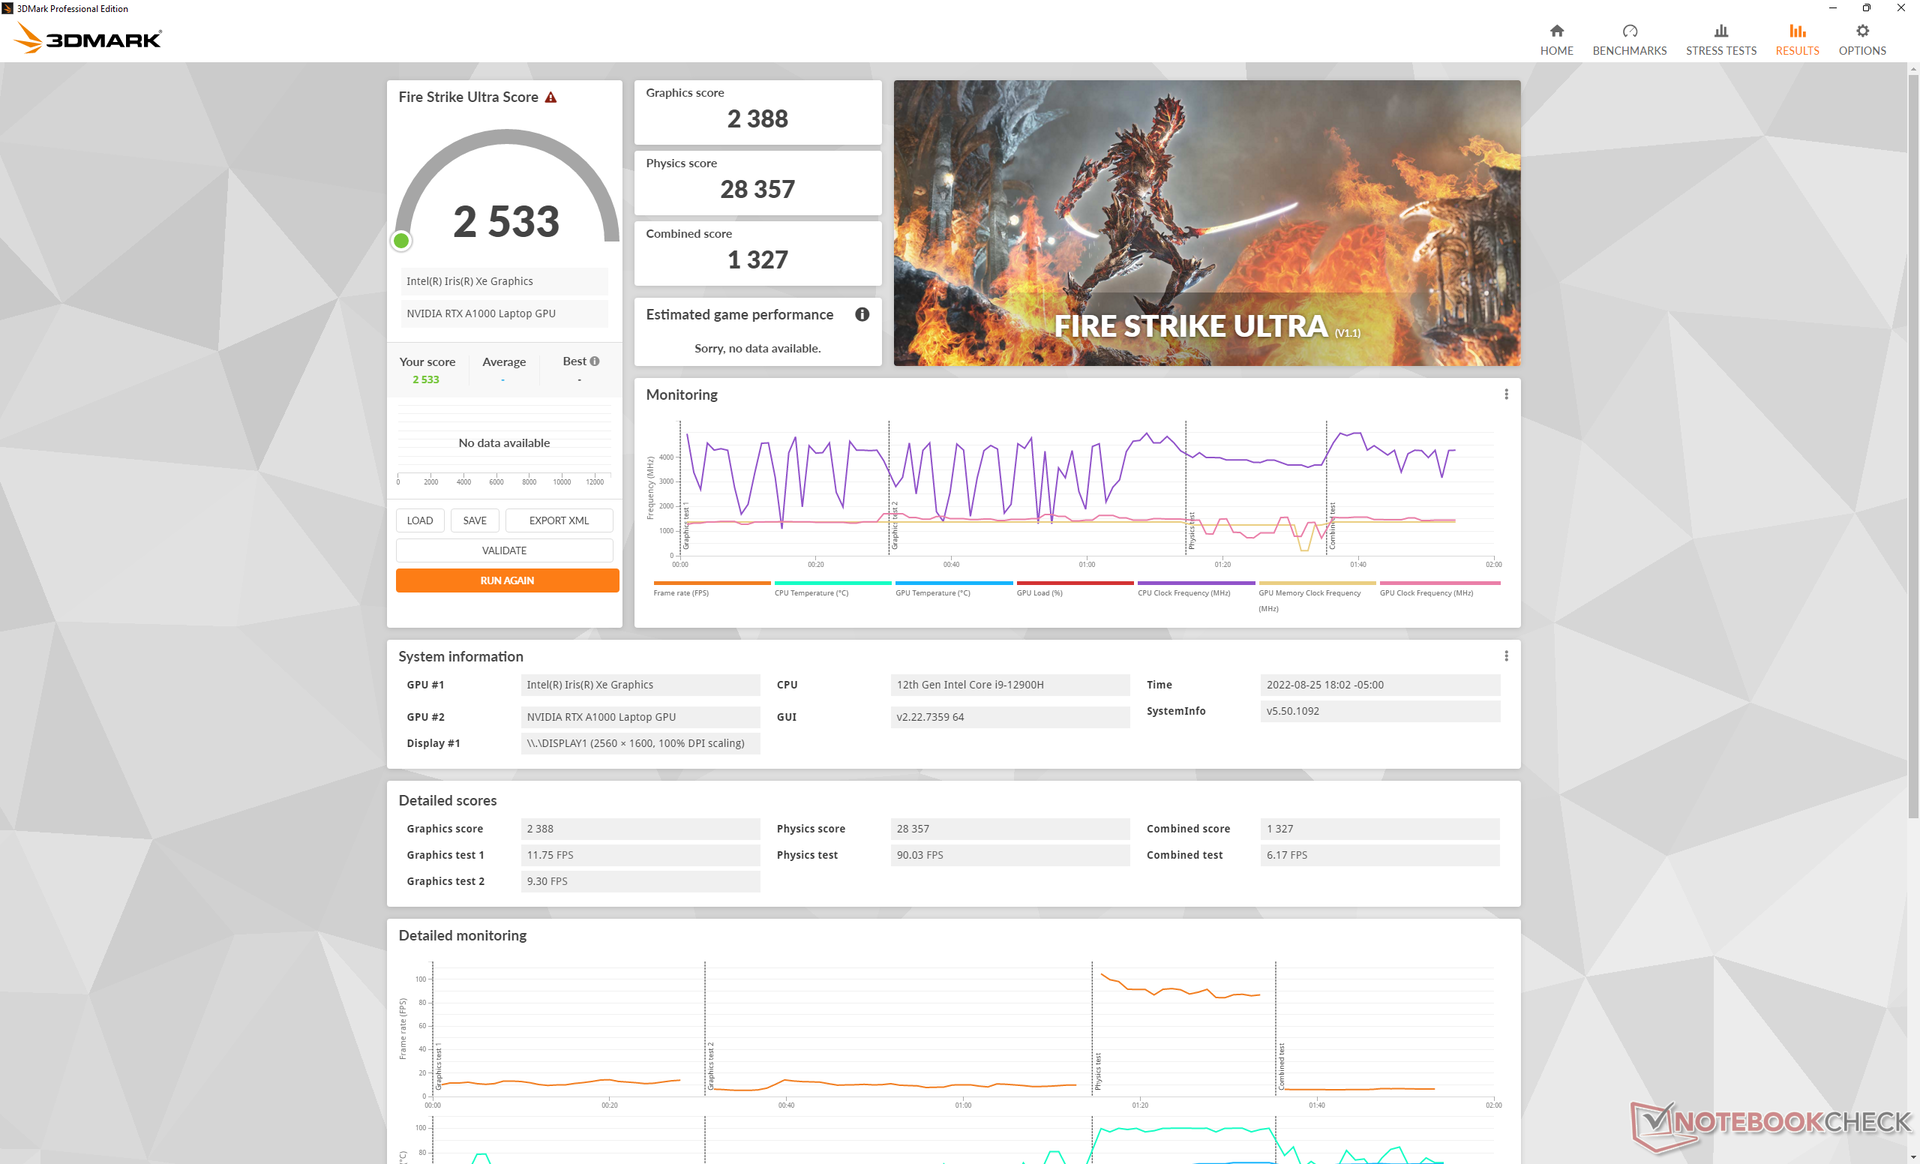
De algemene grafische prestaties zijn ongeveer 10 tot 20 procent sneller dan deNVIDIA T1200. Het meest opvallend is echter de RTX A1000 is slechts ongeveer 10 tot 15 procent langzamer dan de RTX A2000 in de Precision 5560, behalve als het gaat om ray-tracing toepassingen, waar de A2000 meer dan 2x sneller kan zijn. Als uw workloads ray-tracing effecten bevatten, dan is de RTX A1000 degene die u moet vermijden.
Het draaien op Balanced mode in plaats van Ultra Performance mode vermindert de CPU prestaties met ongeveer 33 procent, terwijl de GPU prestaties minder beïnvloed worden.
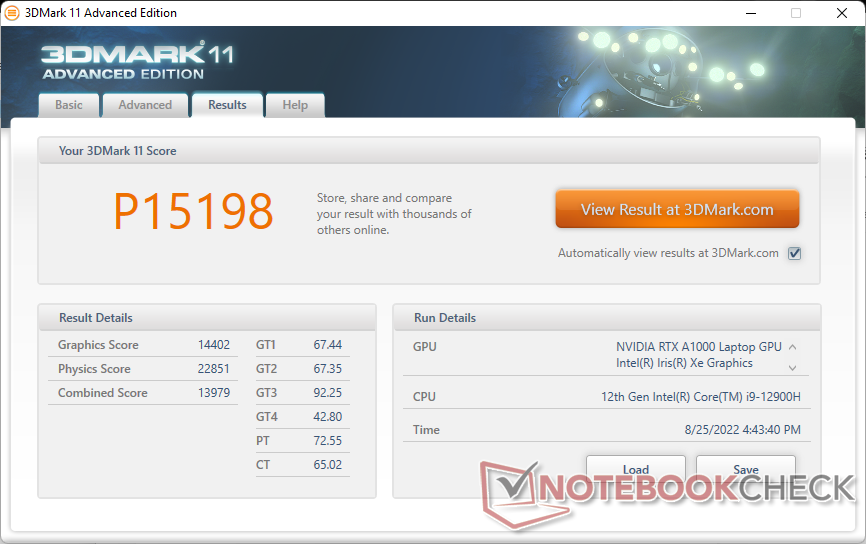
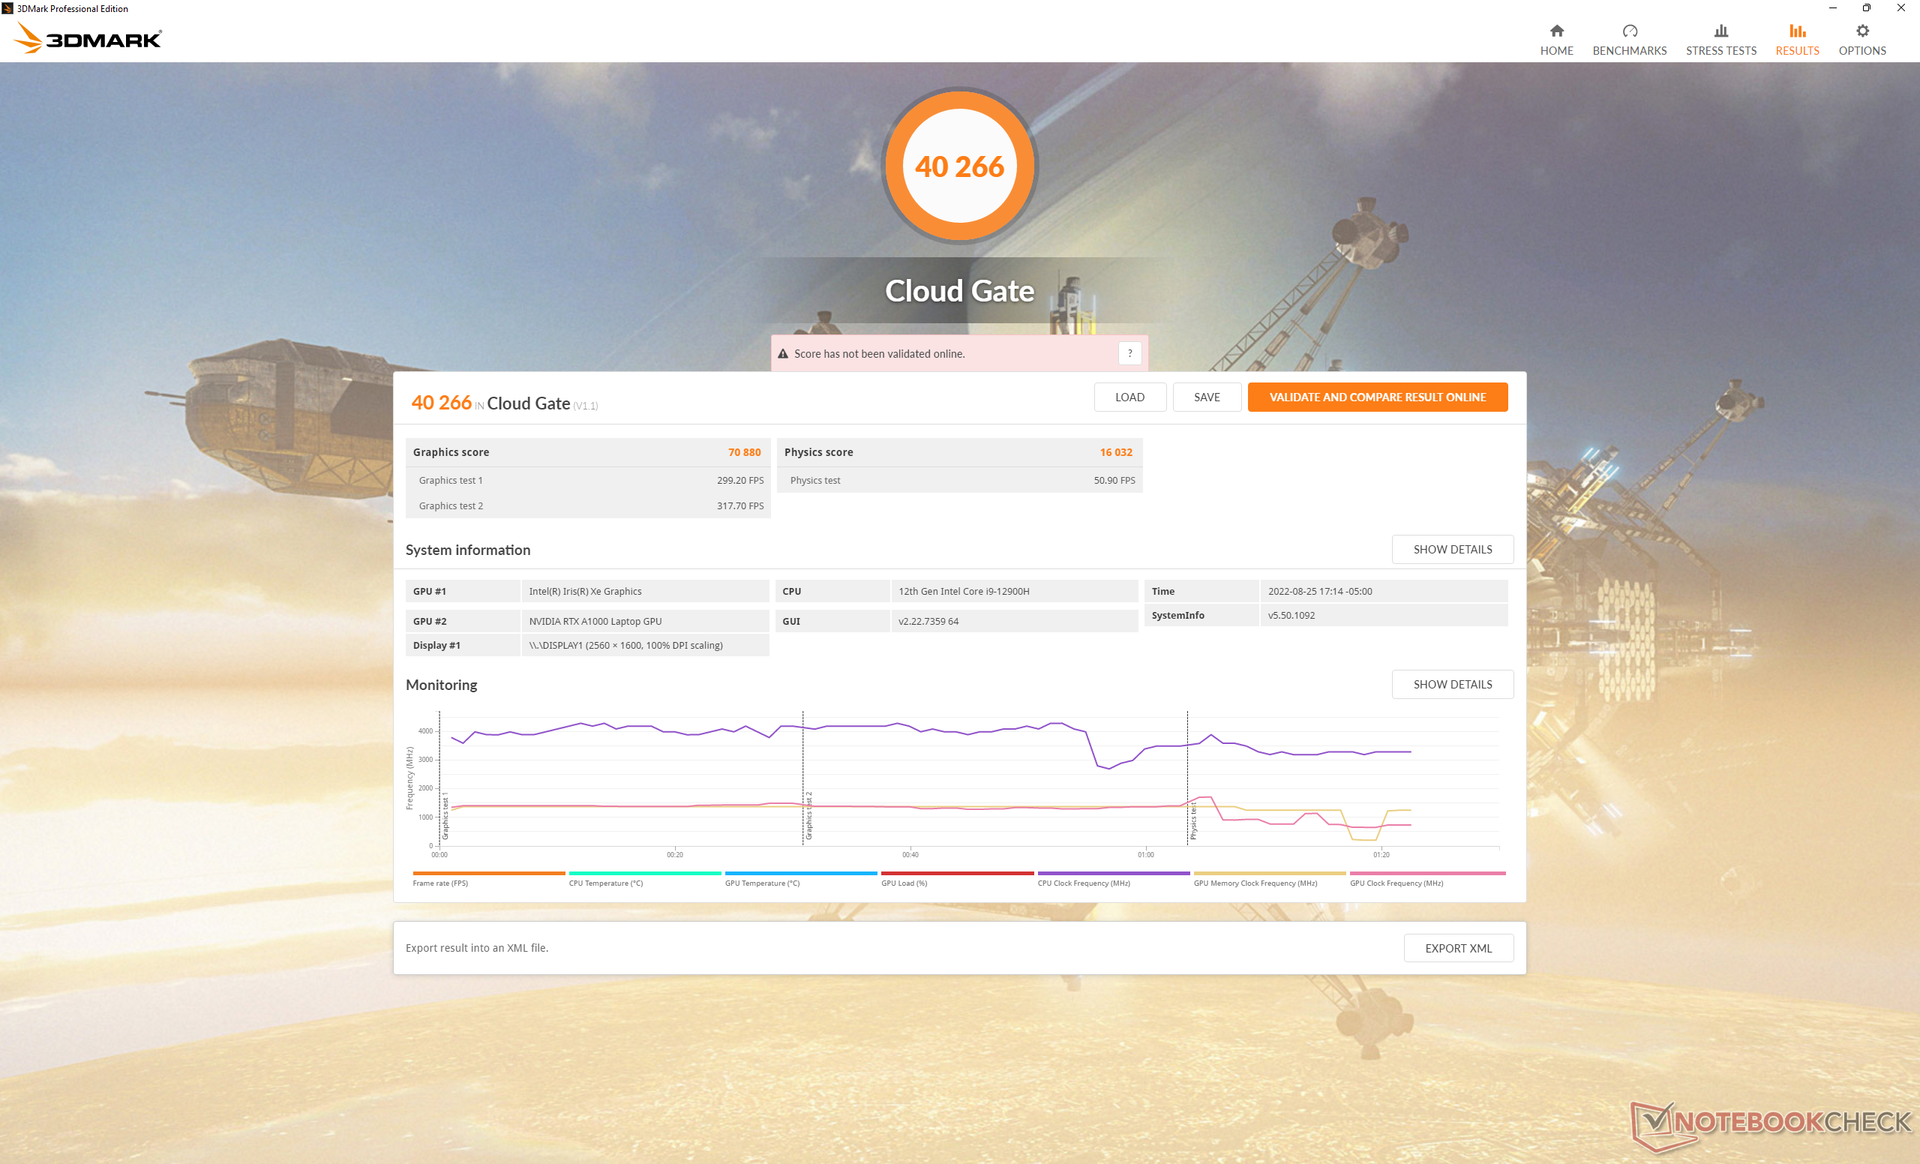

| 3DMark 11 Performance | 15198 punten | |
| 3DMark Cloud Gate Standard Score | 40266 punten | |
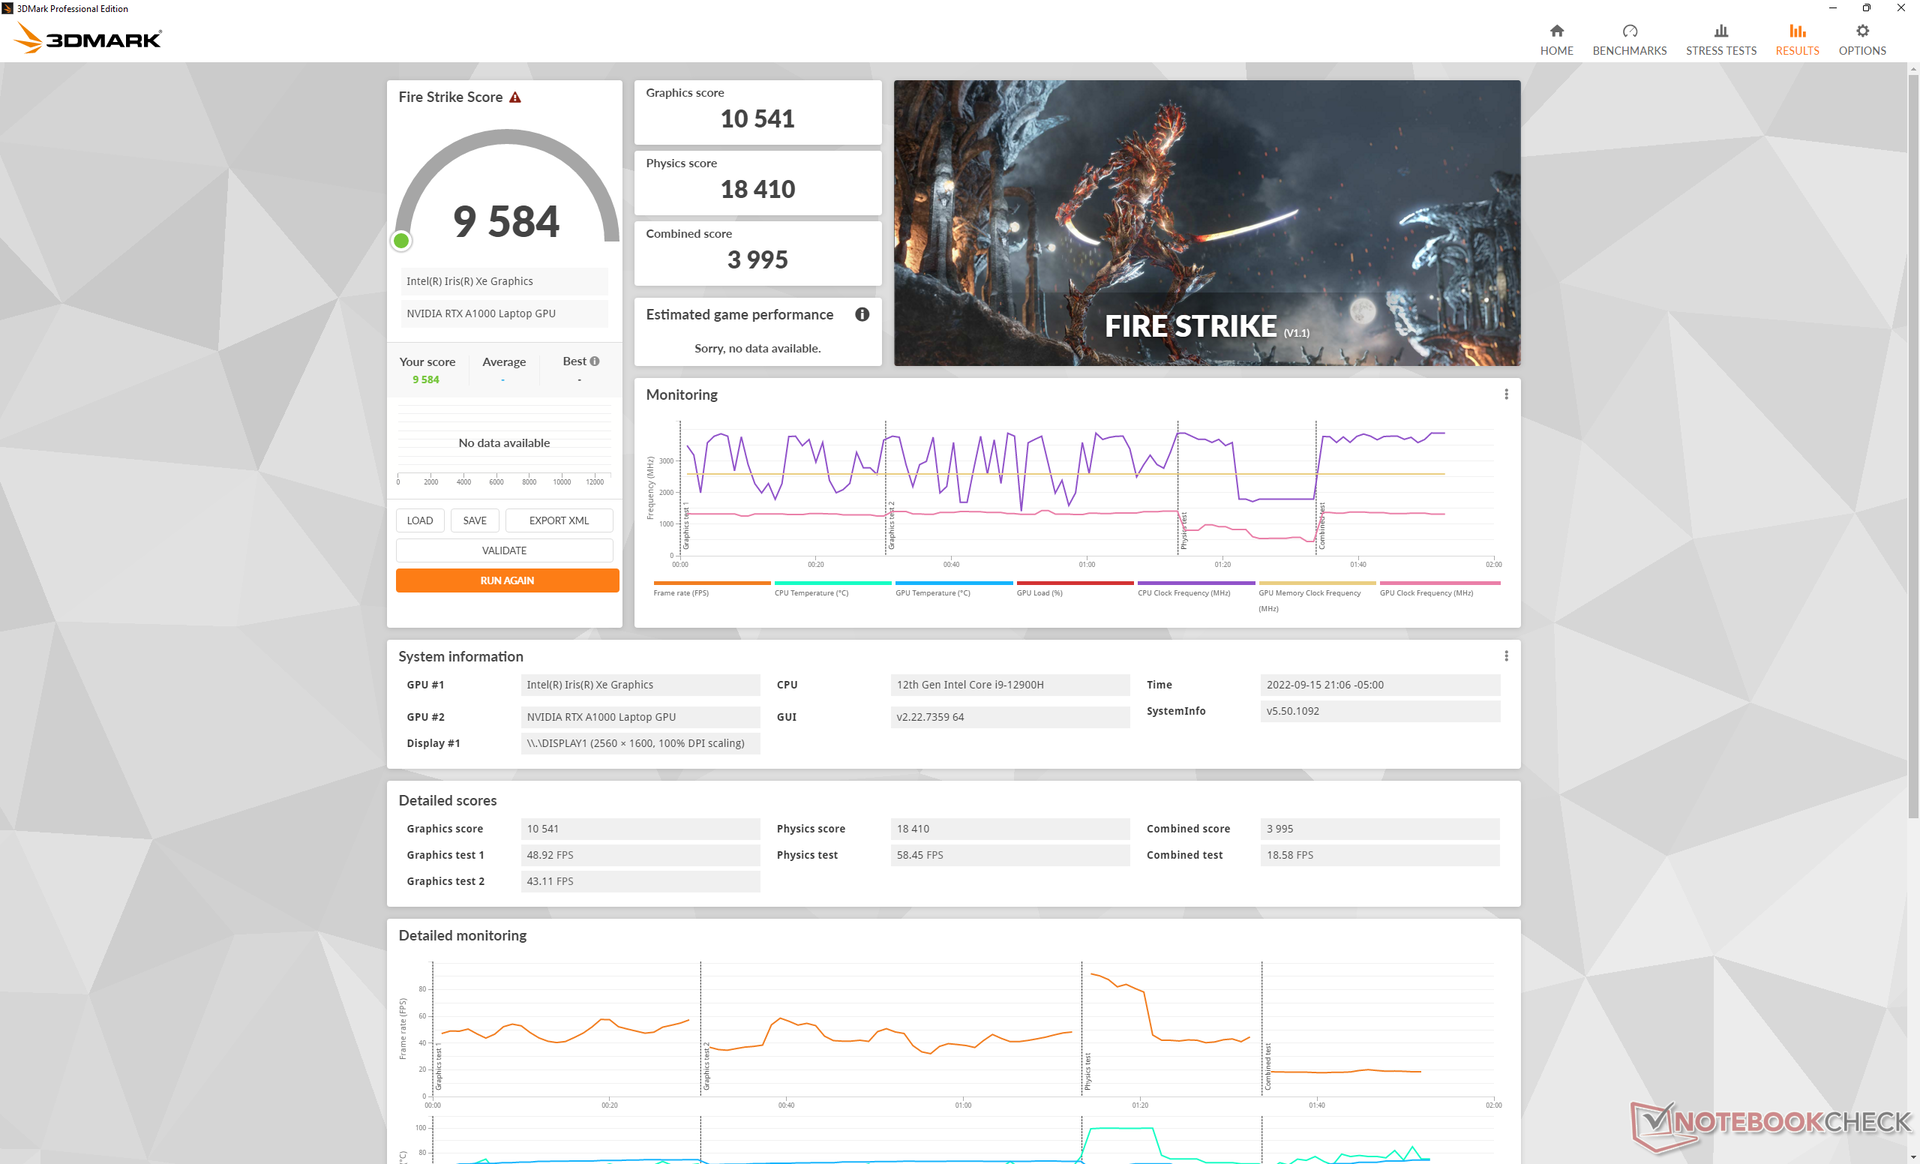
| 3DMark Fire Strike Score | 10123 punten | |
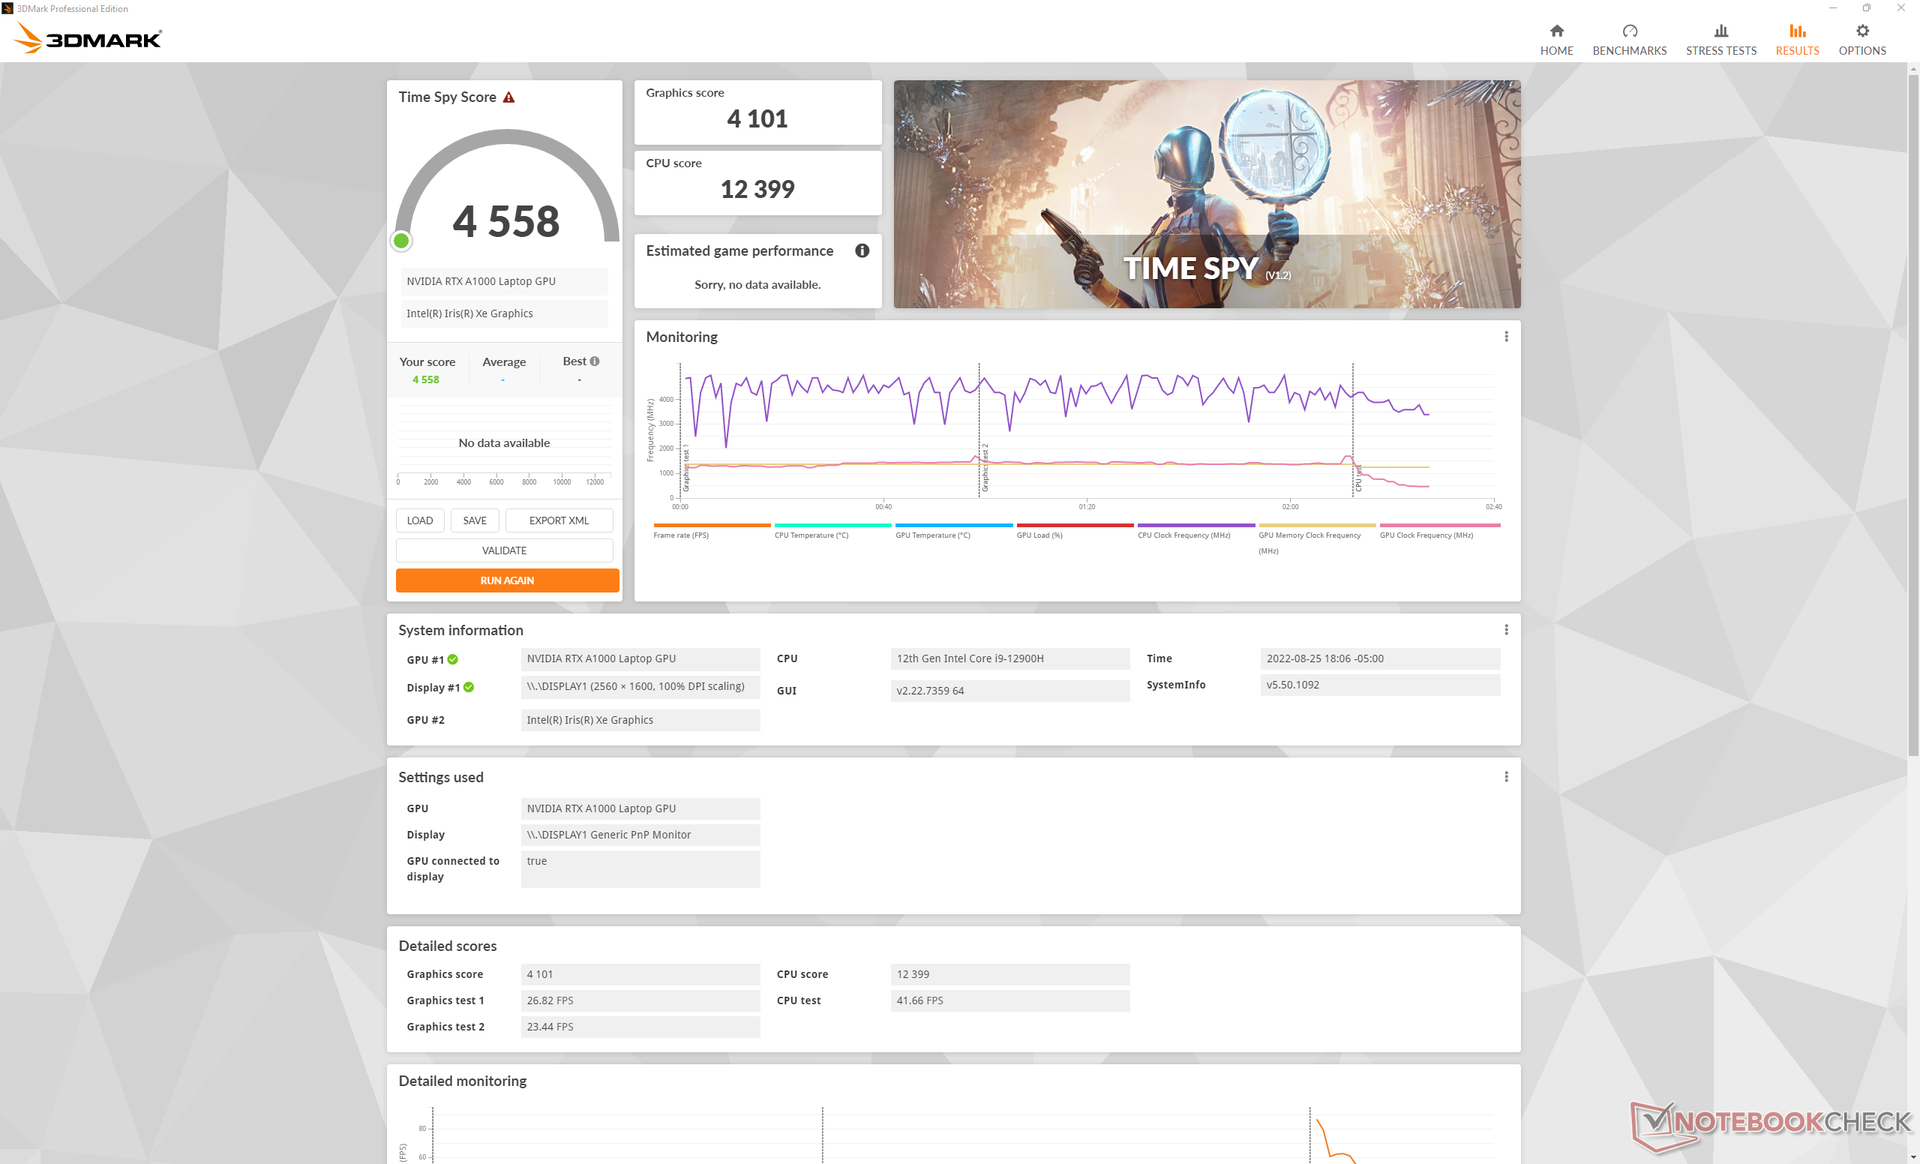
| 3DMark Time Spy Score | 4558 punten | |
Help | ||
| Final Fantasy XV Benchmark | |
| 1280x720 Lite Quality | |
| HP ZBook Fury 17 G8-4A6A9EA | |
| HP ZBook Fury 17 G7 119W5EA | |
| Gemiddeld NVIDIA RTX A1000 Laptop GPU (105.3 - 129.2, n=2) | |
| Dell Precision 5000 5470 | |
| Lenovo ThinkPad P1 G4-20Y4Z9DVUS | |
| Lenovo ThinkPad P15v G2 21A9000XGE | |
| Dell Precision 5000 5560 | |
| HP ZBook Power 15 G8 313S5EA | |
| Dell Precision 3000 3551 | |
| 1920x1080 Standard Quality | |
| HP ZBook Fury 17 G8-4A6A9EA | |
| HP ZBook Fury 17 G7 119W5EA | |
| Gemiddeld NVIDIA RTX A1000 Laptop GPU (59.1 - 67.9, n=2) | |
| Dell Precision 5000 5560 | |
| Dell Precision 5000 5470 | |
| Lenovo ThinkPad P1 G4-20Y4Z9DVUS | |
| Lenovo ThinkPad P15v G2 21A9000XGE | |
| HP ZBook Power 15 G8 313S5EA | |
| Dell Precision 3000 3551 | |
| 1920x1080 High Quality | |
| HP ZBook Fury 17 G7 119W5EA | |
| HP ZBook Fury 17 G8-4A6A9EA | |
| Dell Precision 5000 5560 | |
| Gemiddeld NVIDIA RTX A1000 Laptop GPU (43 - 48.3, n=2) | |
| Dell Precision 5000 5470 | |
| Lenovo ThinkPad P1 G4-20Y4Z9DVUS | |
| Lenovo ThinkPad P15v G2 21A9000XGE | |
| HP ZBook Power 15 G8 313S5EA | |
| Dell Precision 3000 3551 | |
| Cyberpunk 2077 1.6 | |
| 1920x1080 Low Preset | |
| Dell Precision 5000 5470 | |
| Gemiddeld NVIDIA RTX A1000 Laptop GPU (n=1) | |
| 1920x1080 Medium Preset | |
| Dell Precision 5000 5470 | |
| Gemiddeld NVIDIA RTX A1000 Laptop GPU (n=1) | |
| 1920x1080 High Preset | |
| Dell Precision 5000 5470 | |
| Gemiddeld NVIDIA RTX A1000 Laptop GPU (n=1) | |
| 1920x1080 Ultra Preset | |
| Dell Precision 5000 5470 | |
| Gemiddeld NVIDIA RTX A1000 Laptop GPU (n=1) | |
Witcher 3 FPS Chart
| lage | gem. | hoge | ultra | QHD | |
|---|---|---|---|---|---|
| GTA V (2015) | 168 | 159.8 | 113.7 | 58.9 | |
| The Witcher 3 (2015) | 244.1 | 147.5 | 82.1 | 42.7 | |
| Dota 2 Reborn (2015) | 160.8 | 147.9 | 112.3 | 132.1 | |
| Final Fantasy XV Benchmark (2018) | 105.3 | 59.1 | 43 | ||
| X-Plane 11.11 (2018) | 118.7 | 94.8 | 76.3 | ||
| Strange Brigade (2018) | 242 | 106.2 | 84.7 | 72.8 | |
| Metro Exodus (2019) | 111 | 53.3 | 39.3 | 31.2 | 23.6 |
| Borderlands 3 (2019) | 110.4 | 68.4 | 42.6 | 31.3 | 18.8 |
| Gears Tactics (2020) | 161.5 | 106.5 | 63.9 | 46.8 | 31.1 |
| Horizon Zero Dawn (2020) | 82 | 68 | 58 | 48 | 38 |
| Watch Dogs Legion (2020) | 75 | 62 | 54 | 26 | 17 |
| Dirt 5 (2020) | 135 | 62.4 | 48.5 | 37.2 | 25.8 |
| Assassin´s Creed Valhalla (2020) | 103 | 50 | 33 | 25 | 22 |
| Hitman 3 (2021) | 171.9 | 83.7 | 71.3 | 66.1 | 41 |
| F1 2021 (2021) | 195 | 127 | 103 | 54 | 34 |
| Far Cry 6 (2021) | 103 | 64 | 54 | ||
| Guardians of the Galaxy (2021) | 92 | 64 | 64 | 61 | 37 |
| God of War (2022) | 60.2 | 49.1 | 40.9 | 25.8 | 20.5 |
| Cyberpunk 2077 1.6 (2022) | 61.3 | 50.4 | 36.7 | 29 | |
| F1 22 (2022) | 112 | 107 | 76 | 22 | 13 |
Emissies
Systeemgeluid - luid onder belasting
De Precision 5470 loopt luider dan de grotere Precision 5560 onder belasting. Bij gebruik van Witcher 3 op Ultra Performance mode, bijvoorbeeld, resulteert in een ventilator geluid van iets minder dan 49 dB(A) in vergelijking met slechts 40 dB(A) op de 15,6-inch Precision. In feite is de Precision 5470 gemakkelijk een van de luidste werkstations in zijn kleine 14-inch categorie.
Het systeem wordt stiller met 40,3 dB(A) wanneer zware belastingen worden uitgevoerd op Balanced mode in plaats van Ultra Performance mode. Je verliest wat CPU prestaties zoals hierboven vermeld, maar de stillere ventilatoren kunnen het waard zijn, afhankelijk van de omgeving.
De interne ventilatoren zullen periodiek pulseren zonder dat daar een reden voor lijkt te zijn als ze in de Ultra Performance mode staan, zelfs als ze gewoon stationair draaien op het bureaublad. Gebalanceerde modus of Stille modus worden aanbevolen bij het draaien van niet veeleisende toepassingen.
Geluidsniveau
| Onbelast |
| 23.3 / 23.3 / 23.3 dB (A) |
| Belasting |
| 48.5 / 50.4 dB (A) |
 | ||
30 dB stil 40 dB(A) hoorbaar 50 dB(A) luid |
||
min: | ||
| Dell Precision 5000 5470 RTX A1000 Laptop GPU, i9-12900H, Samsung PM9A1 MZVL21T0HCLR | Lenovo ThinkPad P15v G2 21A9000XGE T1200 Laptop GPU, i7-11800H, Toshiba XG6 KXG6AZNV512G | Dell Precision 5000 5560 RTX A2000 Laptop GPU, i7-11850H, Samsung PM9A1 MZVL22T0HBLB | Lenovo ThinkPad P14s G2 AMD Vega 8, R7 PRO 5850U, SK Hynix PC711 1TB HFS001TDE9X081N | HP ZBook Firefly 14 G8 2C9Q2EA T500 Laptop GPU, i7-1165G7, Toshiba XG6 KXG60ZNV1T02 | HP ZBook Firefly 14 G7 Quadro P520, i7-10610U, Toshiba XG6 KXG60ZNV512G | |
|---|---|---|---|---|---|---|
| Noise | 3% | 11% | 8% | -4% | -4% | |
| uit / omgeving * (dB) | 23 | 25.21 -10% | 23.4 -2% | 24.04 -5% | 28.7 -25% | 29.7 -29% |
| Idle Minimum * (dB) | 23.3 | 25.21 -8% | 23.6 -1% | 24.04 -3% | 28.7 -23% | 29.7 -27% |
| Idle Average * (dB) | 23.3 | 25.21 -8% | 23.6 -1% | 24.04 -3% | 28.7 -23% | 29.7 -27% |
| Idle Maximum * (dB) | 23.3 | 25.21 -8% | 23.6 -1% | 24.04 -3% | 28.7 -23% | 30.4 -30% |
| Load Average * (dB) | 48.5 | 39.09 19% | 25.8 47% | 28.19 42% | 34 30% | 33.1 32% |
| Witcher 3 ultra * (dB) | 48.6 | 36.6 25% | 40.1 17% | 40.1 17% | 35.3 27% | |
| Load Maximum * (dB) | 50.4 | 43.53 14% | 41.4 18% | 40.77 19% | 40.1 20% | 37.9 25% |
* ... kleiner is beter
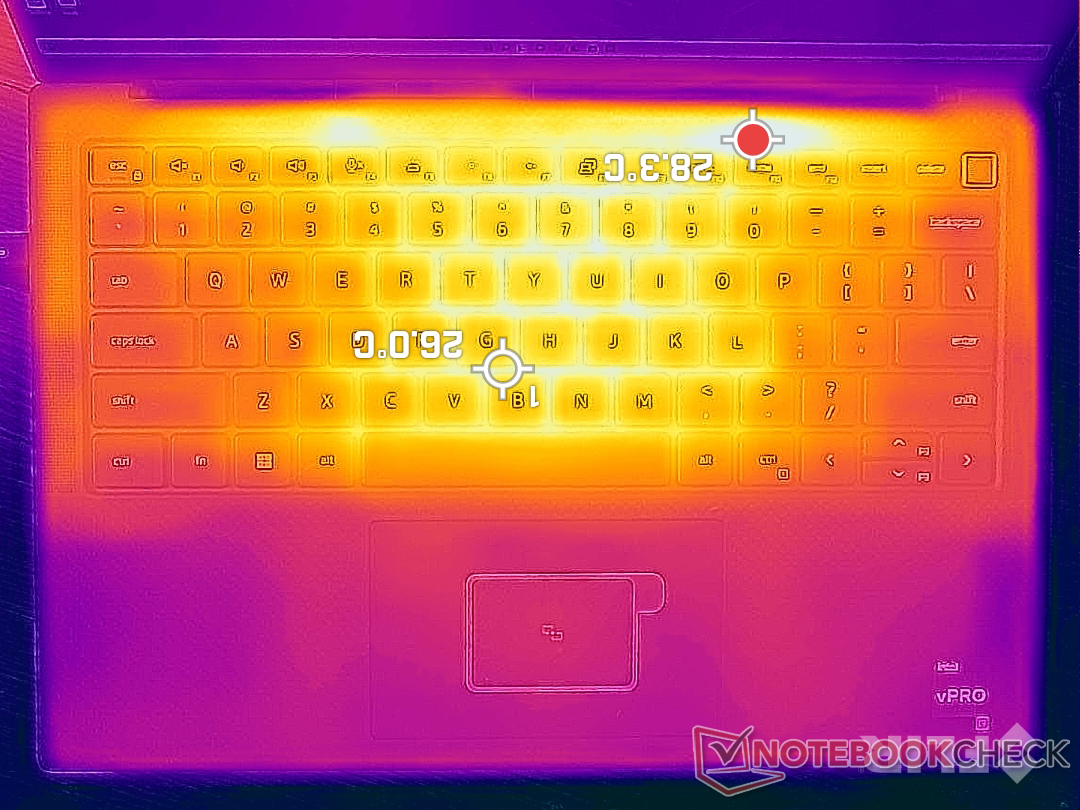
Temperatuur
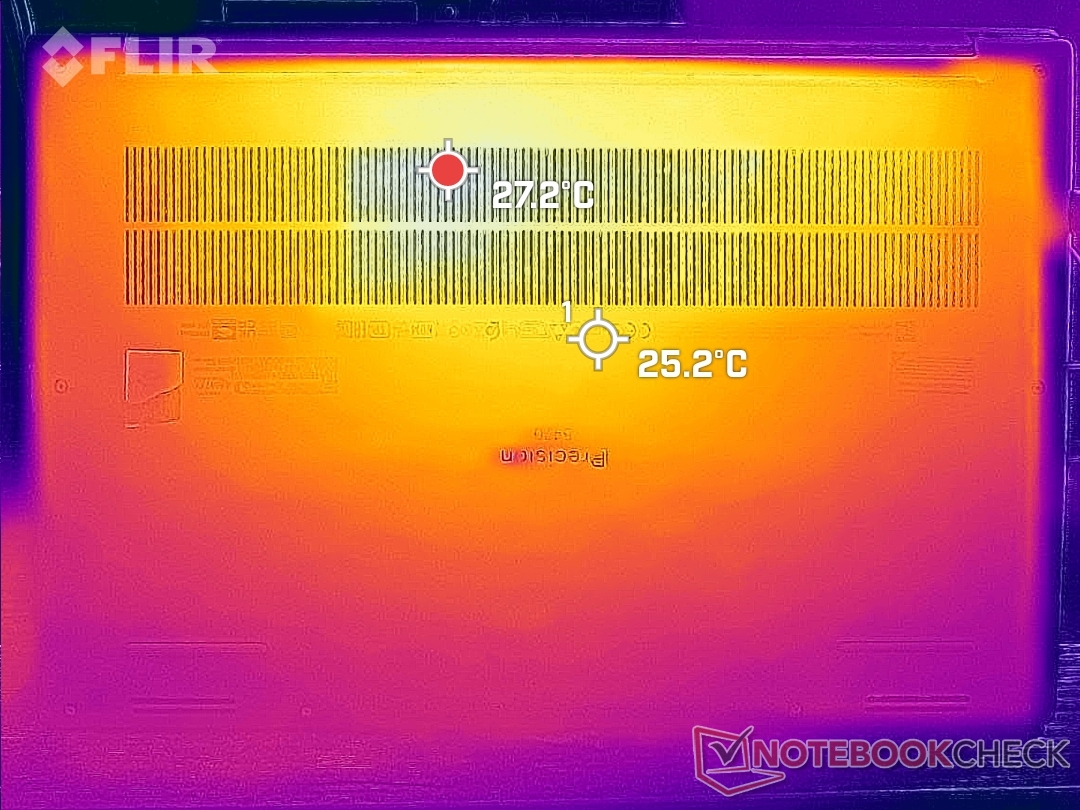
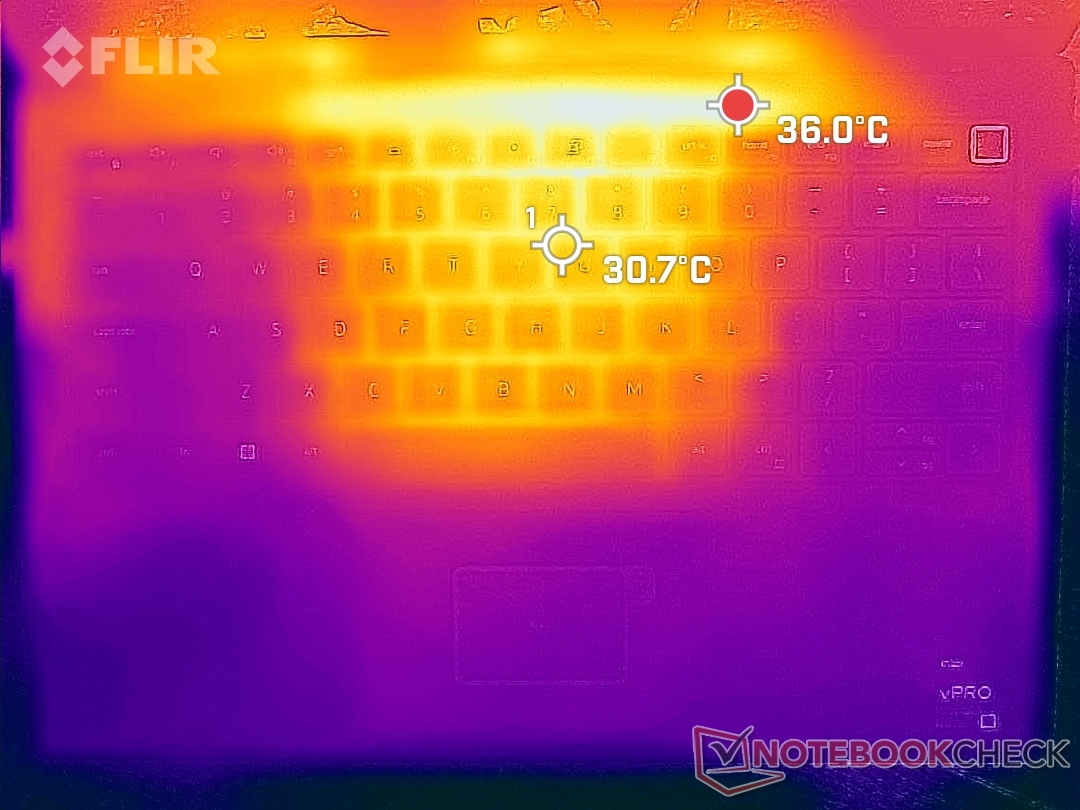
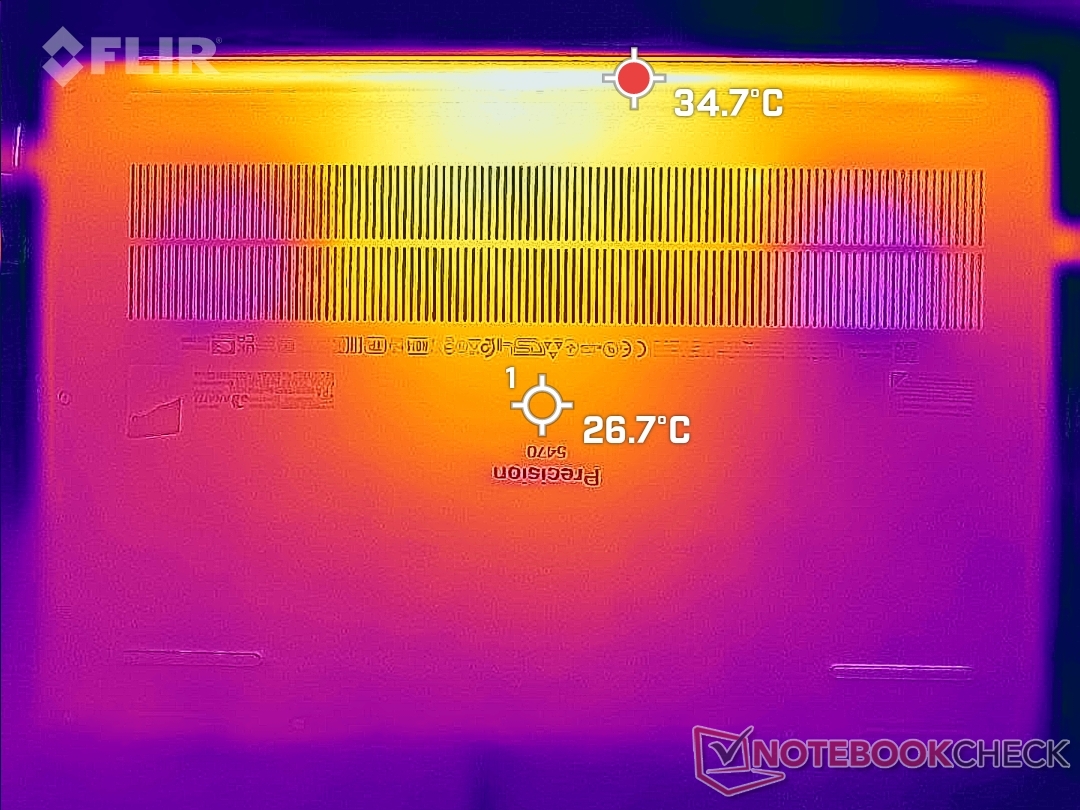
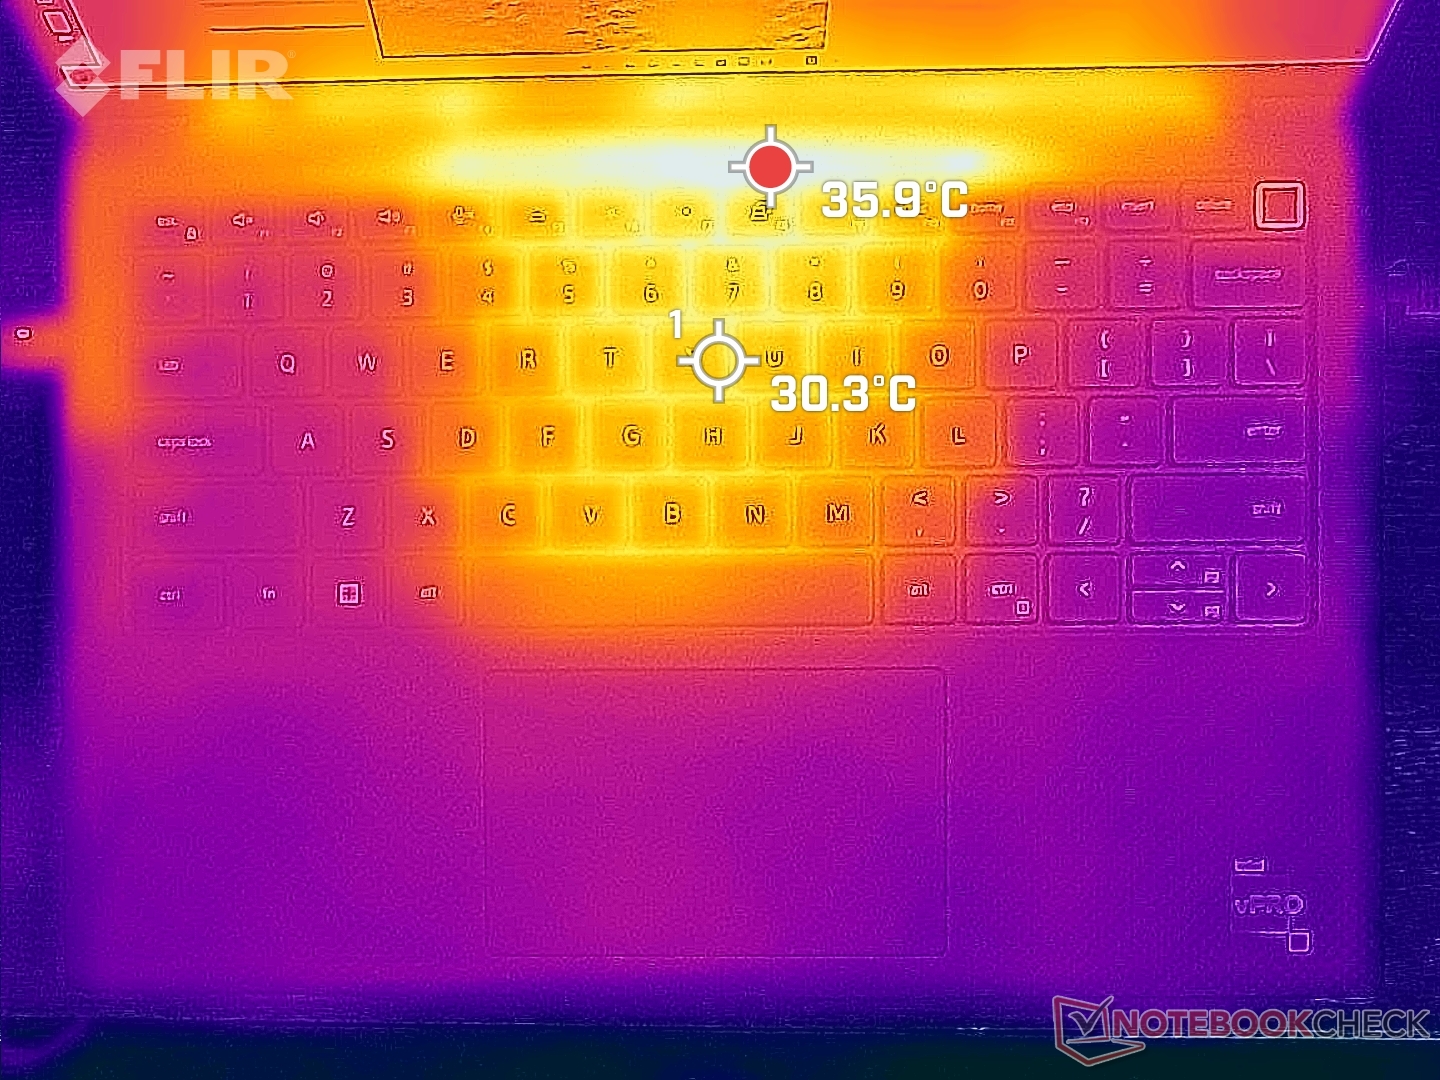
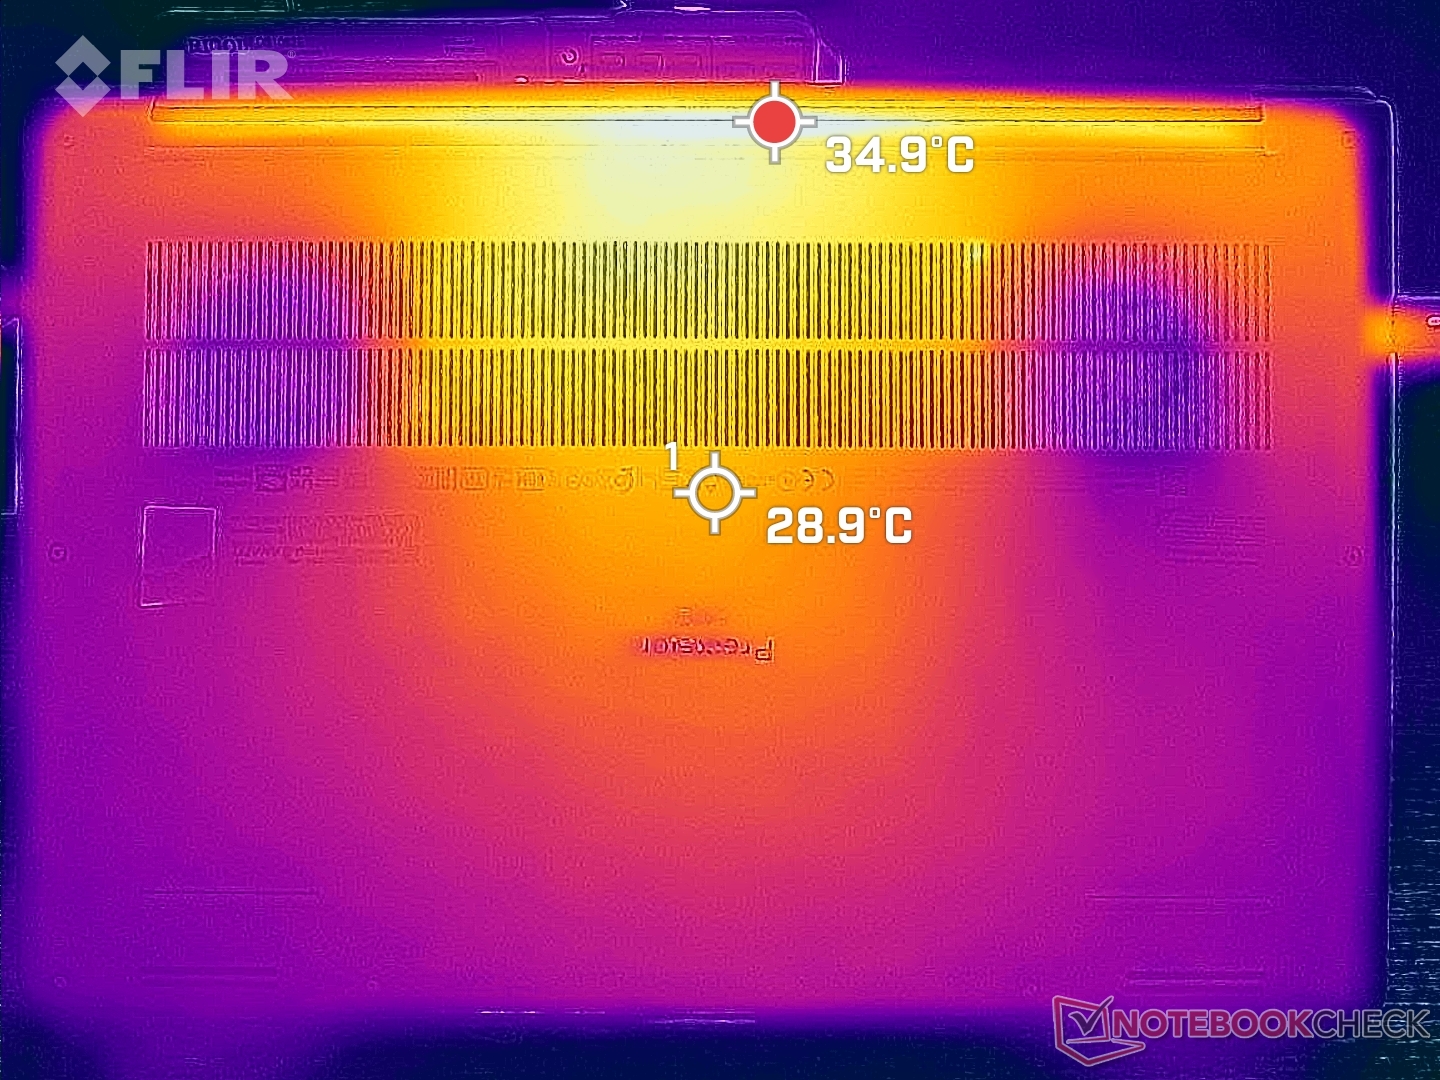
De oppervlaktetemperaturen zijn koeler dan verwacht gezien de Core H-klasse CPU, discrete Nvidia GPU en het kleine formaat van de behuizing. Alternatieve 14-inch werkstations zoals de ZBook Firefly 14 G8 of ThinkPad P14s G2 hebben allemaal tragere CPU's en toch kunnen ze veel warmer worden met hot spots die 49 C bereiken, vergeleken met slechts 42 C op onze Precision. Niettemin kan het midden van het toetsenbord nog steeds behoorlijk warm worden bij 42 C.
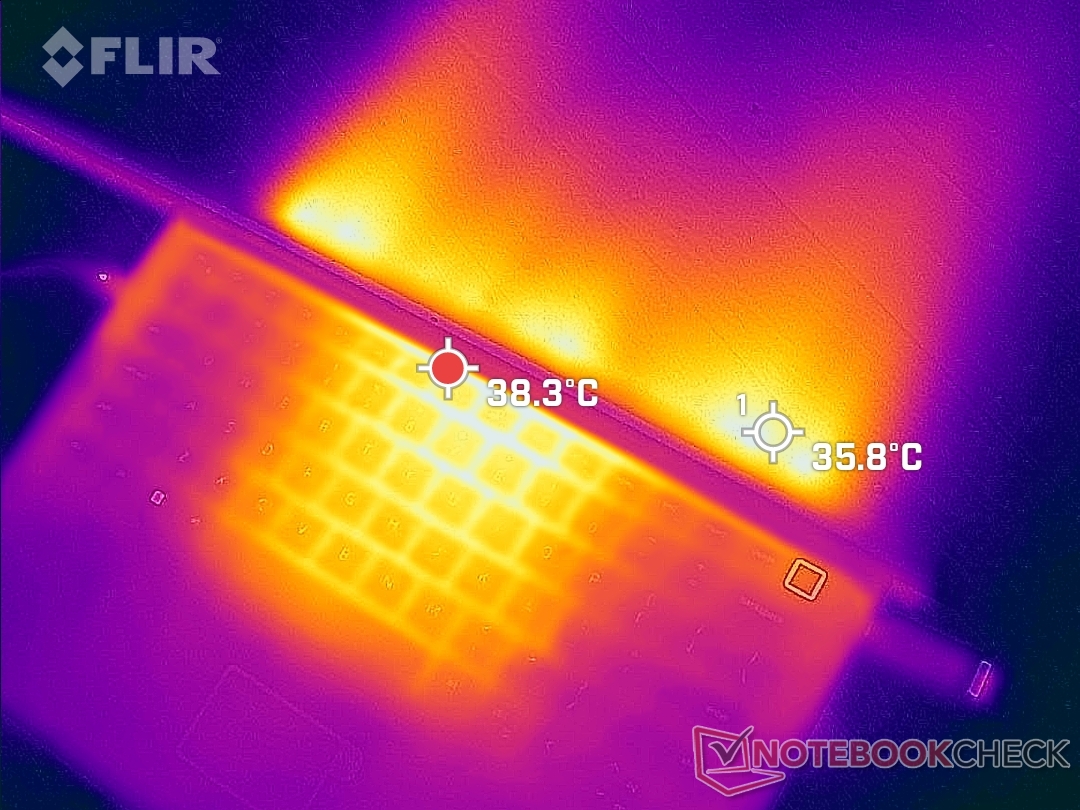
(±) De maximumtemperatuur aan de bovenzijde bedraagt 41.8 °C / 107 F, vergeleken met het gemiddelde van 38.2 °C / 101 F, variërend van 22.2 tot 69.8 °C voor de klasse Workstation.
(+) De bodem warmt op tot een maximum van 36 °C / 97 F, vergeleken met een gemiddelde van 41.1 °C / 106 F
(+) Bij onbelast gebruik bedraagt de gemiddelde temperatuur voor de bovenzijde 31 °C / 88 F, vergeleken met het apparaatgemiddelde van 32 °C / 90 F.
(±) Bij het spelen van The Witcher 3 is de gemiddelde temperatuur voor de bovenzijde 32.2 °C / 90 F, vergeleken met het apparaatgemiddelde van 32 °C / 90 F.
(+) De palmsteunen en het touchpad zijn met een maximum van ###max## °C / 81.7 F koeler dan de huidtemperatuur en voelen daarom koel aan.
(±) De gemiddelde temperatuur van de handpalmsteun van soortgelijke toestellen bedroeg 27.8 °C / 82 F (+0.2 °C / 0.3 F).
| Dell Precision 5000 5470 Intel Core i9-12900H, NVIDIA RTX A1000 Laptop GPU | Lenovo ThinkPad P15v G2 21A9000XGE Intel Core i7-11800H, NVIDIA T1200 Laptop GPU | Dell Precision 5000 5560 Intel Core i7-11850H, NVIDIA RTX A2000 Laptop GPU | Lenovo ThinkPad P14s G2 AMD AMD Ryzen 7 PRO 5850U, AMD Radeon RX Vega 8 (Ryzen 4000/5000) | HP ZBook Firefly 14 G8 2C9Q2EA Intel Core i7-1165G7, NVIDIA T500 Laptop GPU | HP ZBook Firefly 14 G7 Intel Core i7-10610U, NVIDIA Quadro P520 | |
|---|---|---|---|---|---|---|
| Heat | -9% | -10% | 1% | 5% | -7% | |
| Maximum Upper Side * (°C) | 41.8 | 53.8 -29% | 48.2 -15% | 42.8 -2% | 42.6 -2% | 52.3 -25% |
| Maximum Bottom * (°C) | 36 | 52.1 -45% | 42.6 -18% | 47.5 -32% | 49.4 -37% | 60.9 -69% |
| Idle Upper Side * (°C) | 34.6 | 27.6 20% | 34.8 -1% | 27 22% | 24.2 30% | 23.1 33% |
| Idle Bottom * (°C) | 33.6 | 27.7 18% | 35.2 -5% | 28.3 16% | 24.6 27% | 23 32% |
* ... kleiner is beter
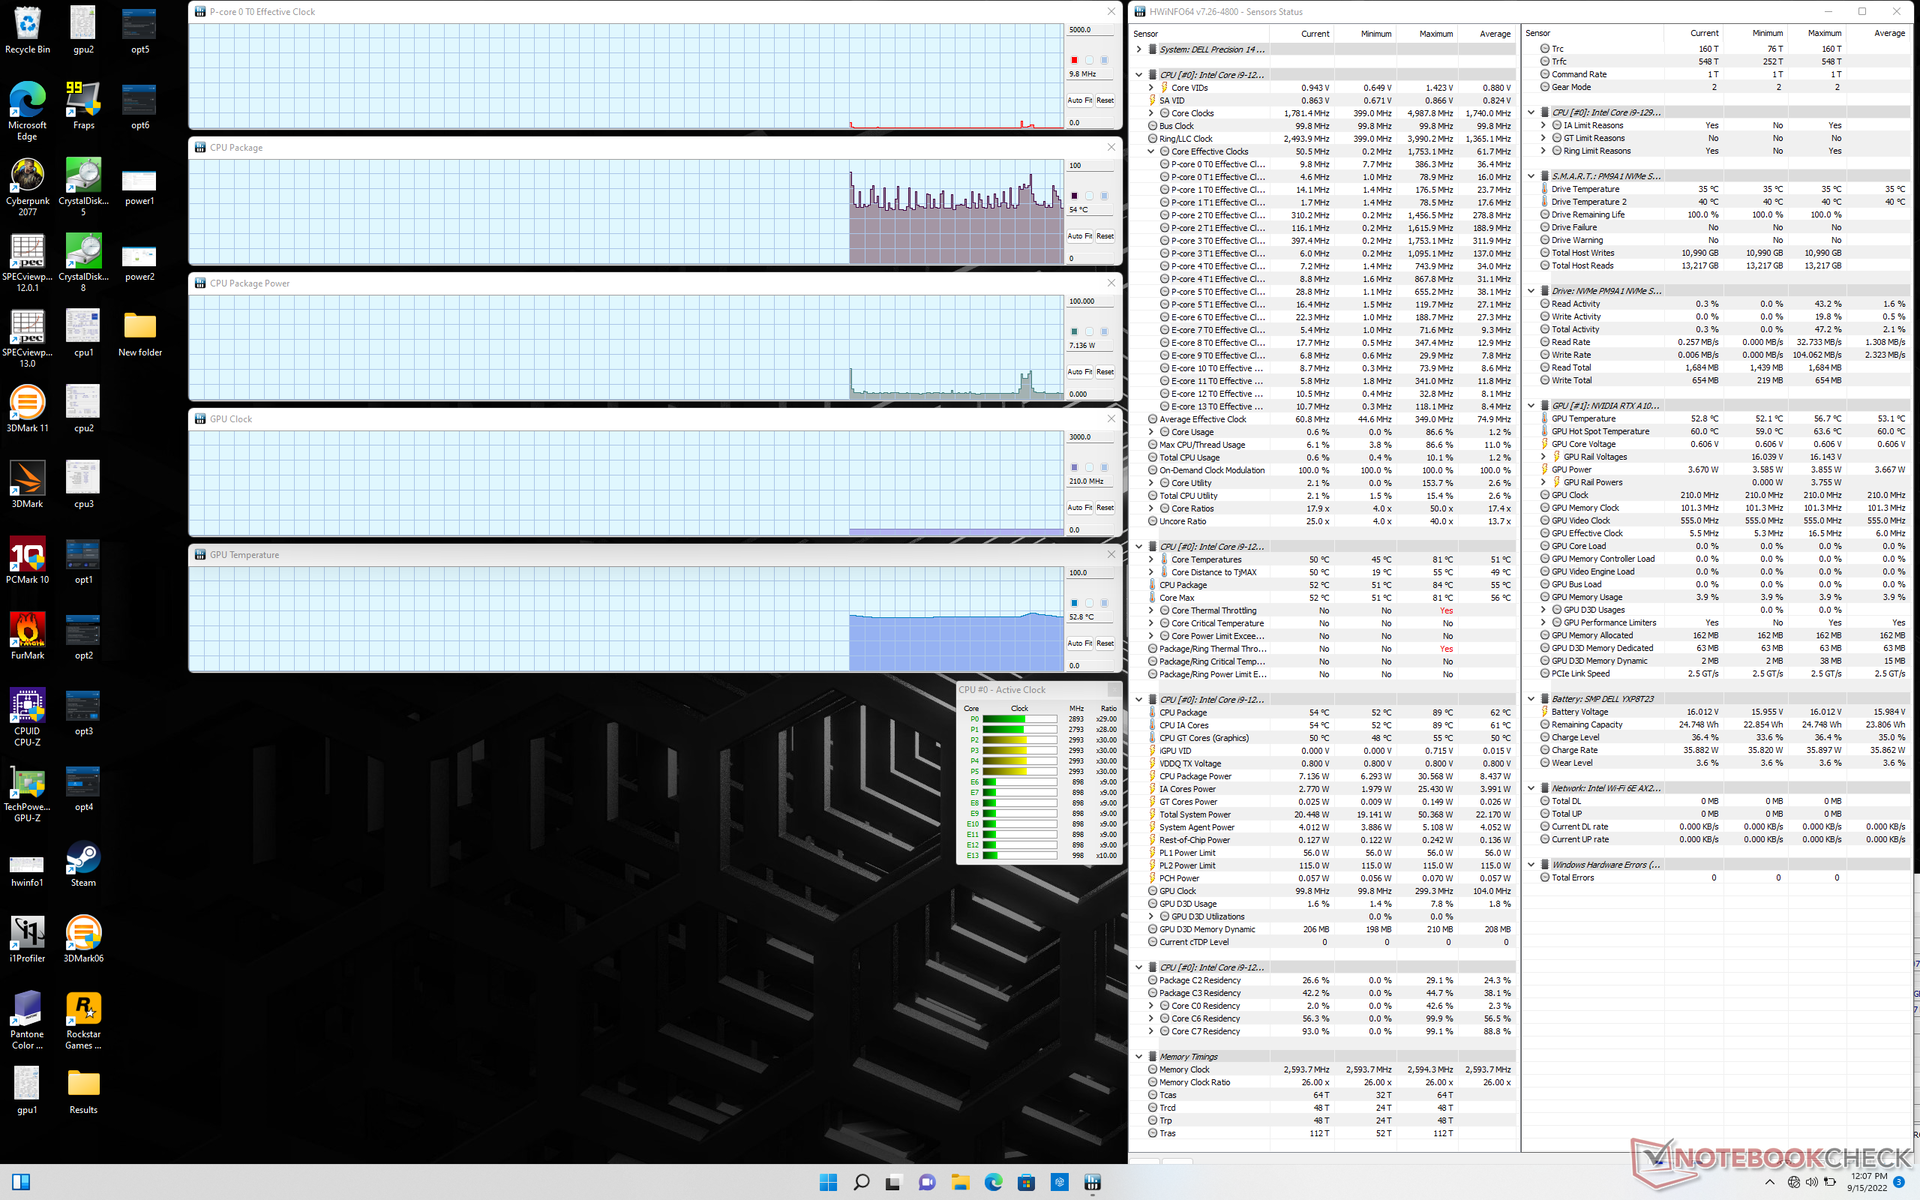
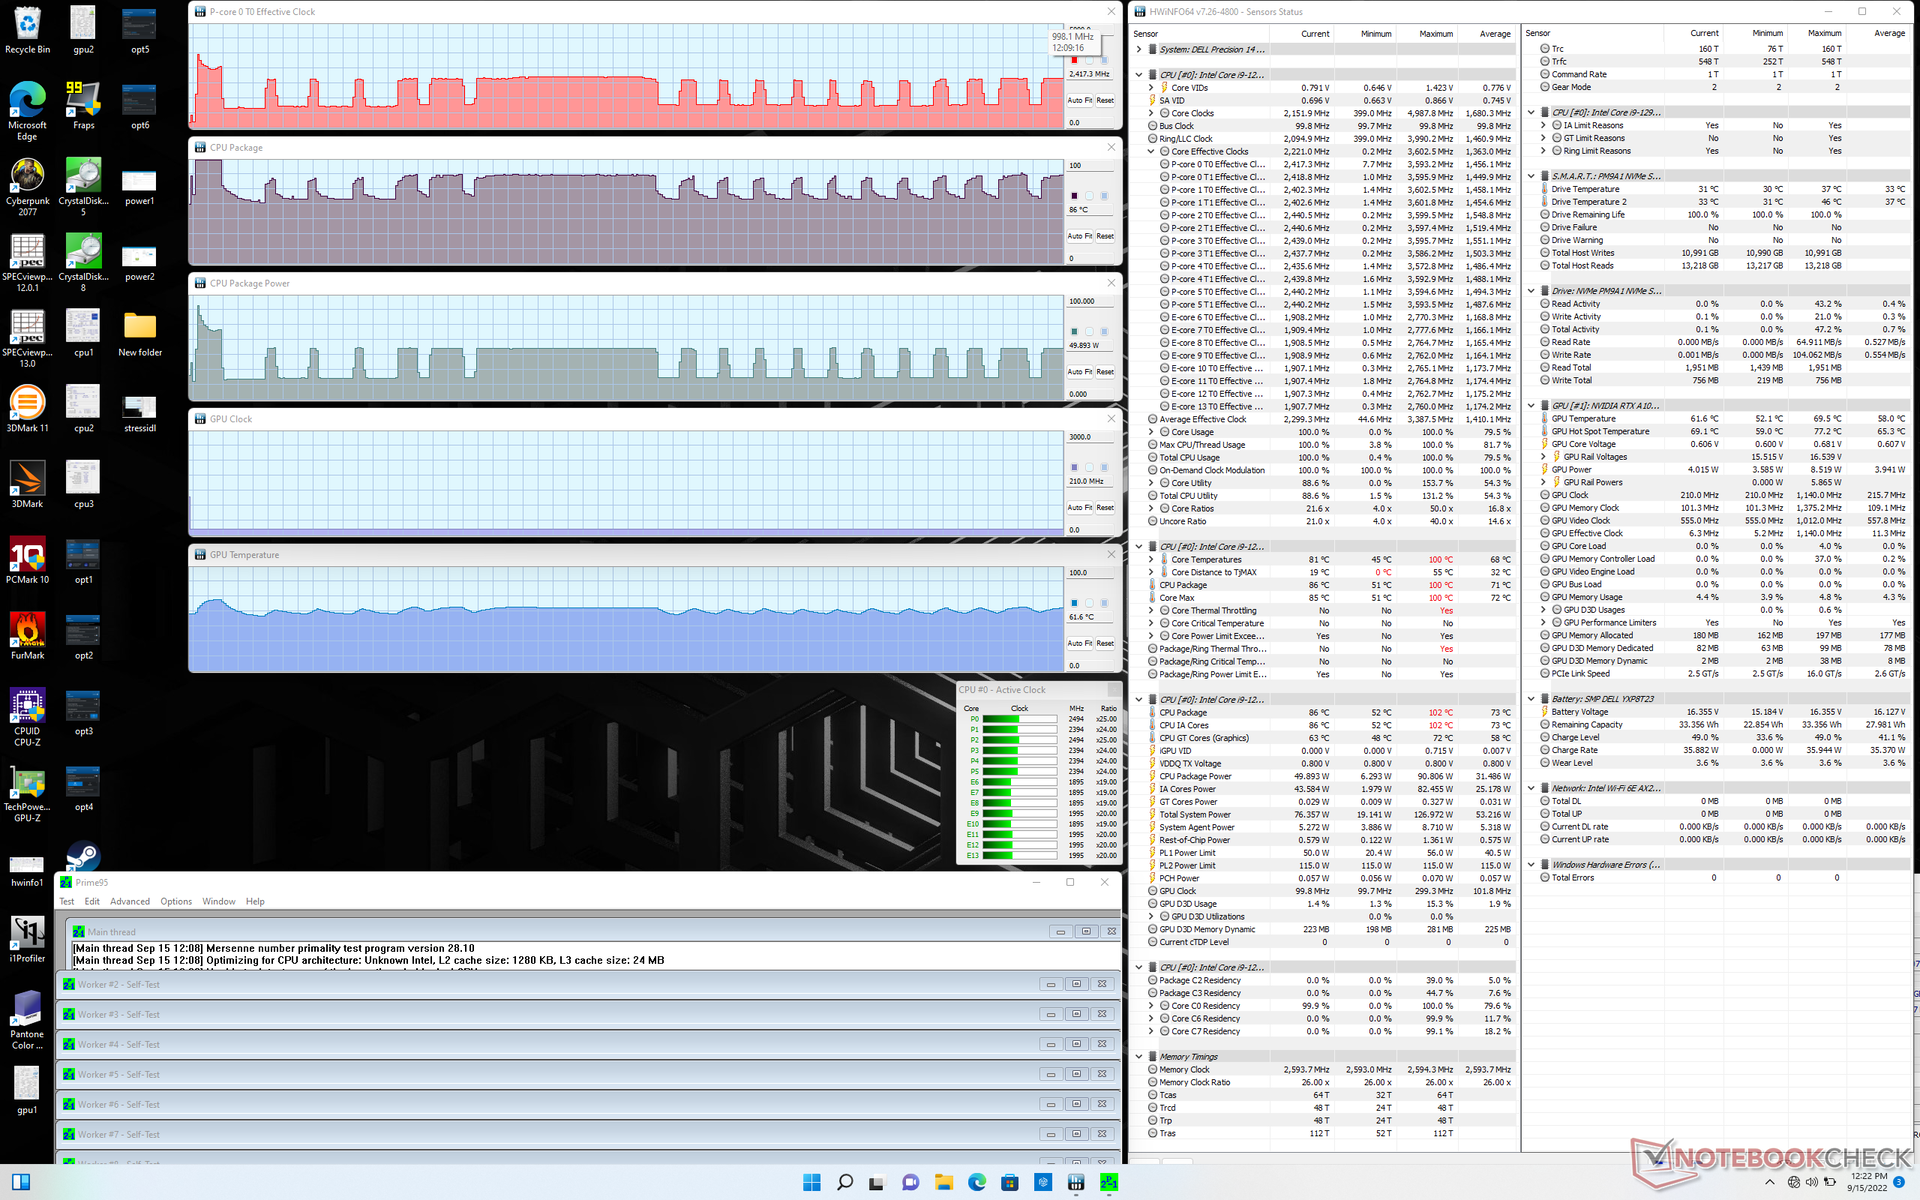
Stresstest - Cirkelende CPU-kloksnelheden
Het starten van Prime95 veroorzaakt een piek in CPU-kloksnelheid, stroomverbruik en kerntemperatuur tot respectievelijk 3,6 GHz, 91 W en 101 °C. Na slechts een paar seconden beginnen kloksnelheid, stroomverbruik en temperatuur echter te schommelen tussen 1,0 en 2,4 GHz, 20 tot 50 W en 61 tot 82 C, respectievelijk. Dit cyclische gedrag komt overeen met onze cyclische CineBency R15 xT loop test resultaten hierboven om aan te tonen dat de Precision 5470 niet in staat is om stabiele Turbo Boost kloksnelheden te handhaven voor langere periodes. Een Core i9-12900H CPU ten volle laten presteren in een chassis van deze omvang blijft een utopie.
Bij het uitvoeren van Witcher 3 om hoge verwerkingsbelastingen weer te geven, zouden de CPU en GPU stabiliseren op respectievelijk 82 C en 71 C, vergeleken met 69 C en 75 C op de Precision 5560.
Werken op batterijen beperkt de CPU prestaties. Een Fire Strike test op batterijen zou Physics en Graphics scores opleveren van respectievelijk 21067 en 10542 punten, vergeleken met 27514 en 10914 punten op netstroom.
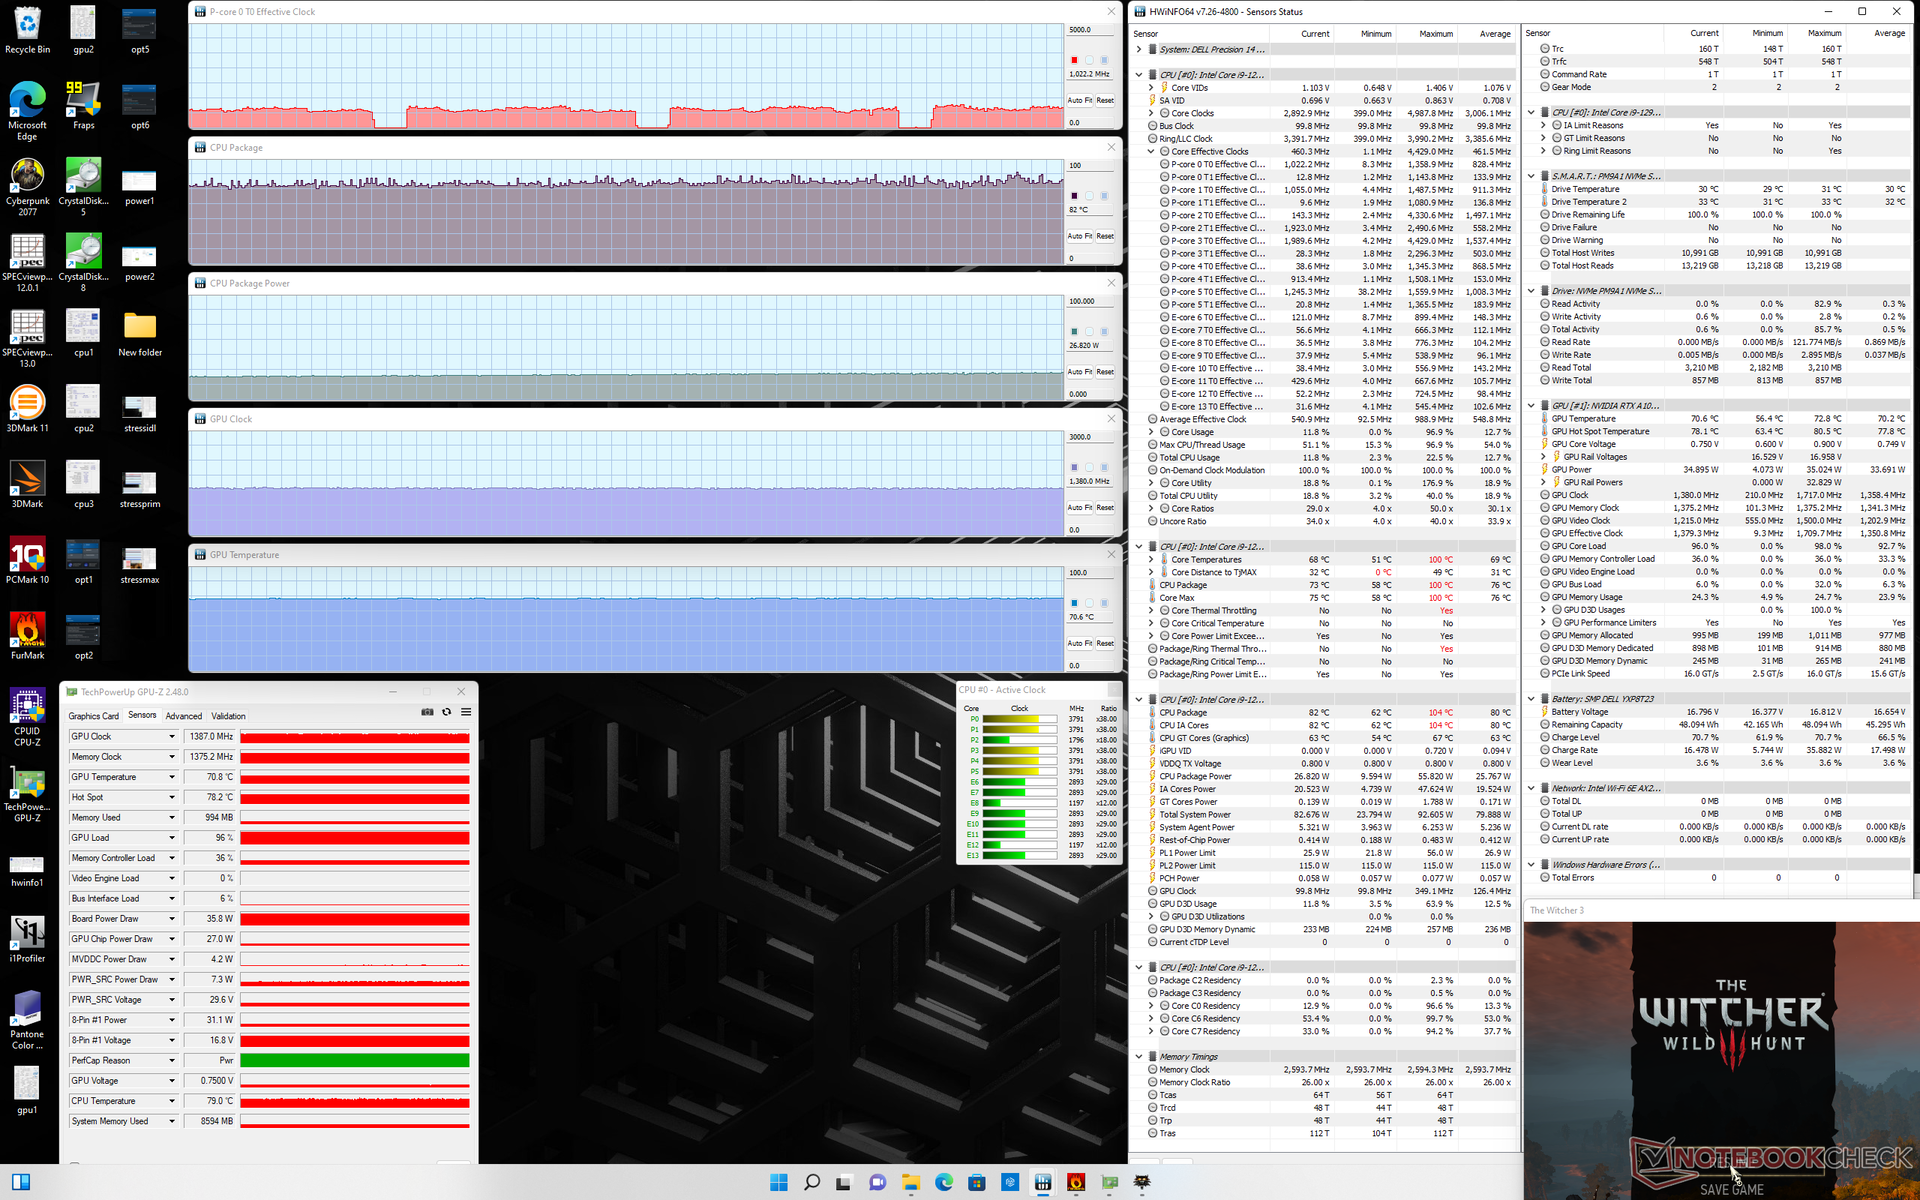
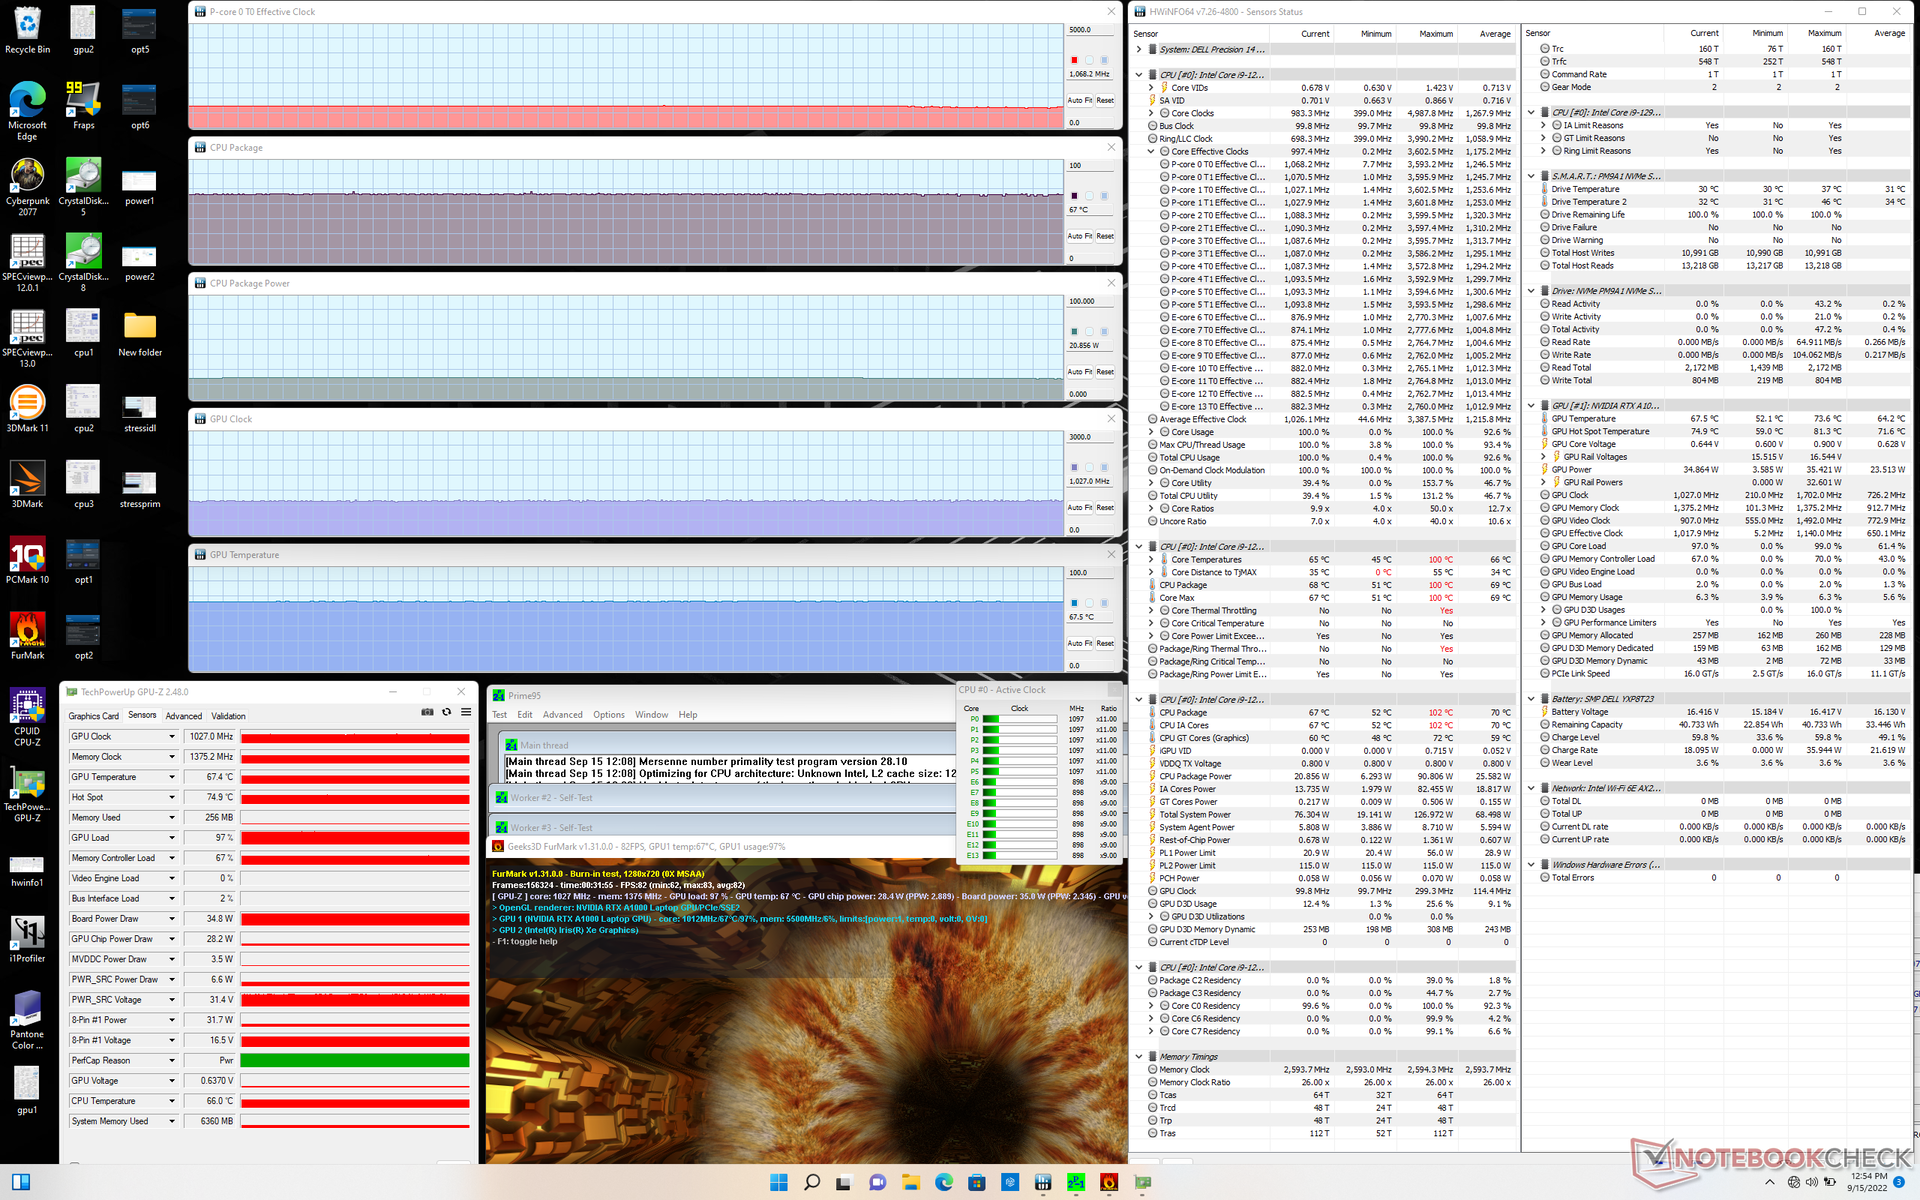
| CPU-klok (GHz) | GPU-klok (MHz) | Gemiddelde CPU-temperatuur (°C) | Gemiddelde GPU-temperatuur (°C) | |
| Systeem Idle | -- | -- | 54 | 53 |
| Prime95 Stress | 1.0 - 2.4 | -- | 61 - 80 | ~61 |
| Prime95 + FurMark Stress | 1.1 | 1027 | 67 | 68 |
| Witcher 3 Stress | 1.0 | 1387 | 82 | 71 |
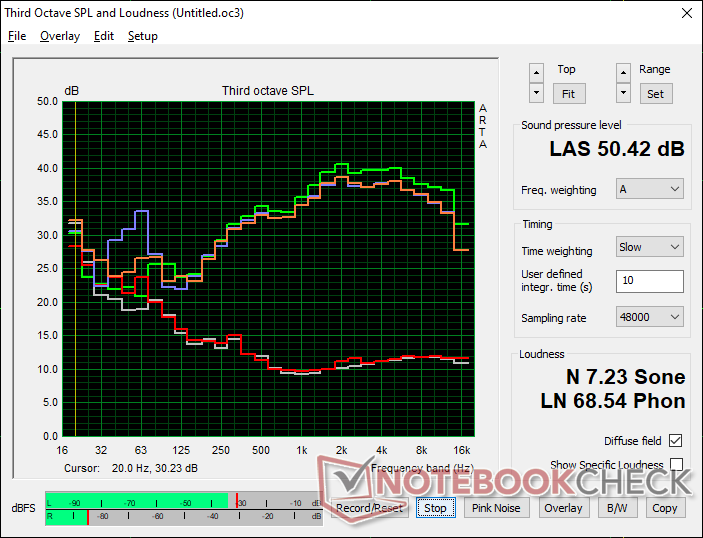
Luidsprekers
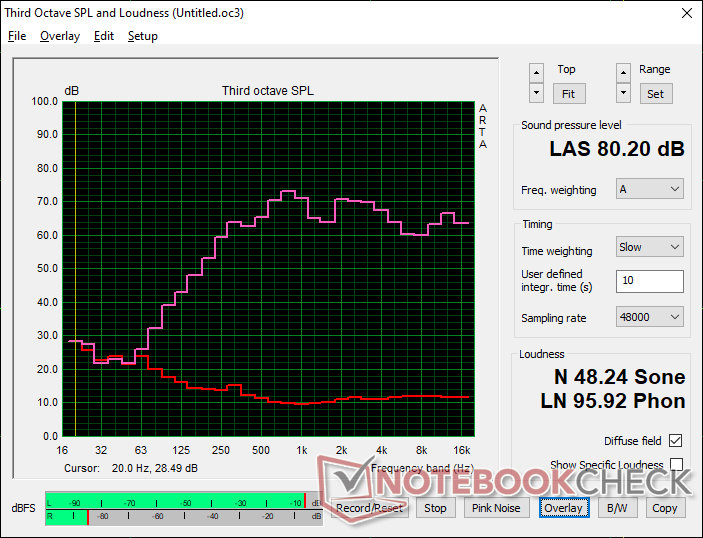
Dell Precision 5000 5470 audioanalyse
(±) | luidspreker luidheid is gemiddeld maar goed (80.2 dB)
Bas 100 - 315 Hz
(±) | verminderde zeebaars - gemiddeld 12.9% lager dan de mediaan
(±) | lineariteit van de lage tonen is gemiddeld (10.1% delta ten opzichte van de vorige frequentie)
Midden 400 - 2000 Hz
(+) | evenwichtige middens - slechts 4.2% verwijderd van de mediaan
(+) | de middentonen zijn lineair (6.5% delta ten opzichte van de vorige frequentie)
Hoog 2 - 16 kHz
(+) | evenwichtige hoogtepunten - slechts 3.4% verwijderd van de mediaan
(+) | de hoge tonen zijn lineair (3.9% delta naar de vorige frequentie)
Algemeen 100 - 16.000 Hz
(+) | het totale geluid is lineair (12.9% verschil met de mediaan)
Vergeleken met dezelfde klasse
» 21% van alle geteste apparaten in deze klasse waren beter, 6% vergelijkbaar, 72% slechter
» De beste had een delta van 7%, het gemiddelde was 17%, de slechtste was 35%
Vergeleken met alle geteste toestellen
» 12% van alle geteste apparaten waren beter, 3% gelijk, 85% slechter
» De beste had een delta van 4%, het gemiddelde was 23%, de slechtste was 134%
Apple MacBook Pro 16 2021 M1 Pro audioanalyse
(+) | luidsprekers kunnen relatief luid spelen (84.7 dB)
Bas 100 - 315 Hz
(+) | goede baars - slechts 3.8% verwijderd van de mediaan
(+) | de lage tonen zijn lineair (5.2% delta naar de vorige frequentie)
Midden 400 - 2000 Hz
(+) | evenwichtige middens - slechts 1.3% verwijderd van de mediaan
(+) | de middentonen zijn lineair (2.1% delta ten opzichte van de vorige frequentie)
Hoog 2 - 16 kHz
(+) | evenwichtige hoogtepunten - slechts 1.9% verwijderd van de mediaan
(+) | de hoge tonen zijn lineair (2.7% delta naar de vorige frequentie)
Algemeen 100 - 16.000 Hz
(+) | het totale geluid is lineair (4.6% verschil met de mediaan)
Vergeleken met dezelfde klasse
» 0% van alle geteste apparaten in deze klasse waren beter, 0% vergelijkbaar, 100% slechter
» De beste had een delta van 5%, het gemiddelde was 17%, de slechtste was 45%
Vergeleken met alle geteste toestellen
» 0% van alle geteste apparaten waren beter, 0% gelijk, 100% slechter
» De beste had een delta van 4%, het gemiddelde was 23%, de slechtste was 134%
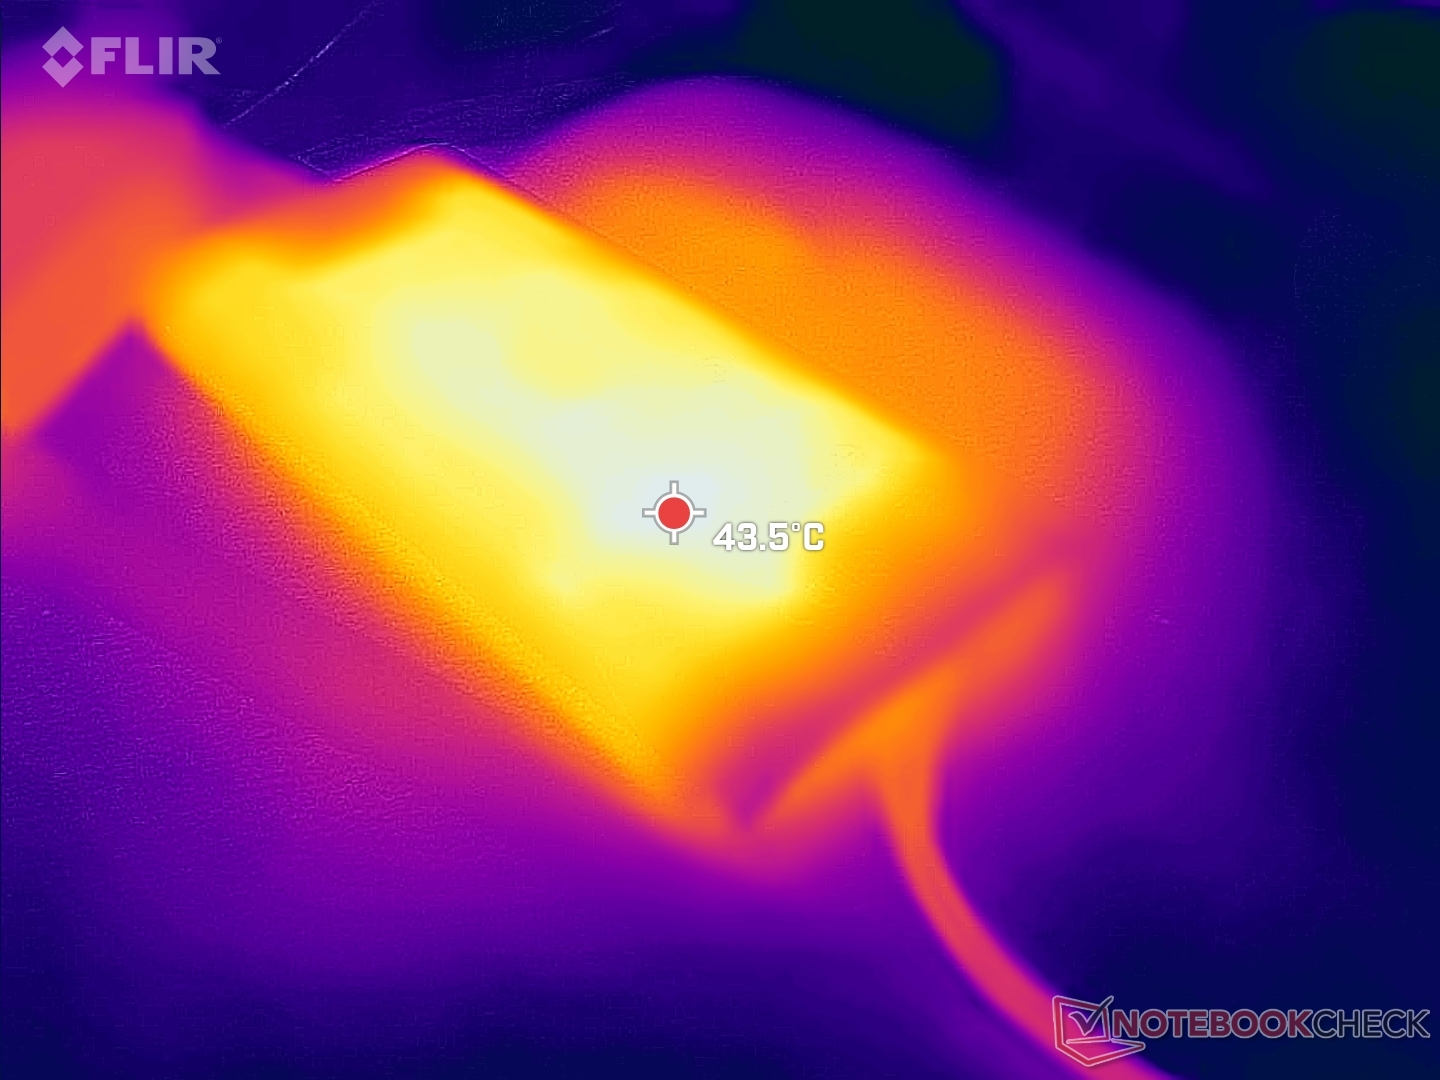
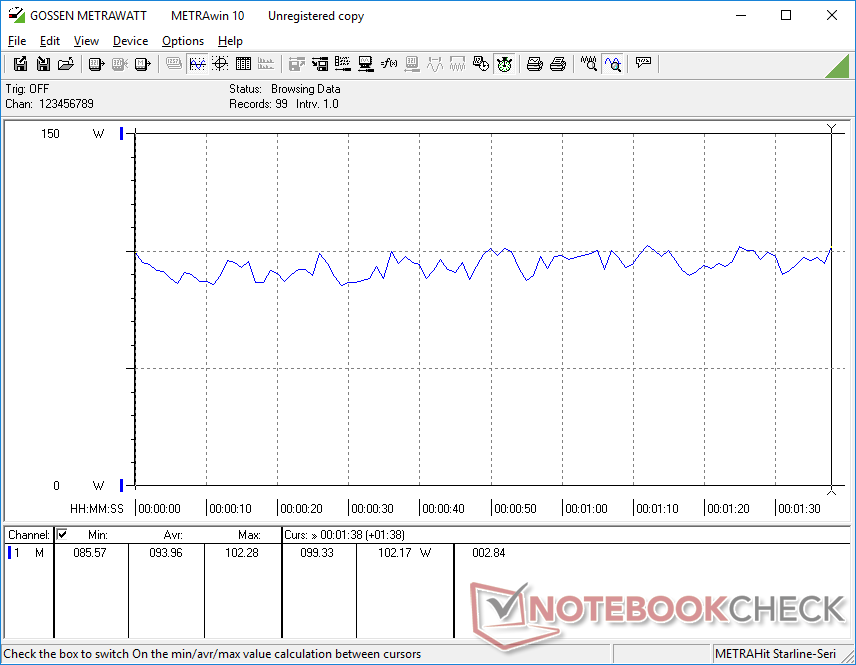
Energiebeheer
Stroomverbruik - Een veeleisende kleine machine
Stationair draaien op de desktop bij de laagste helderheidsinstelling en het laagste energieprofiel vergt slechts 4,3 W, terwijl de maximale helderheidsinstelling en het maximale energieprofiel met de dGPU actief bijna 19 W vergt. Bij het uitvoeren van zwaardere belastingen, zoals games, wordt het systeem echter net zo veeleisend als de grotere Precision 5560 met de snellere RTX A2000 GPU maar langzamere i7-11850H CPU. Het systeem is over het algemeen veeleisender dan andere 14-inch werkstations, zoals te verwachten is van zijn snellere interne hardware
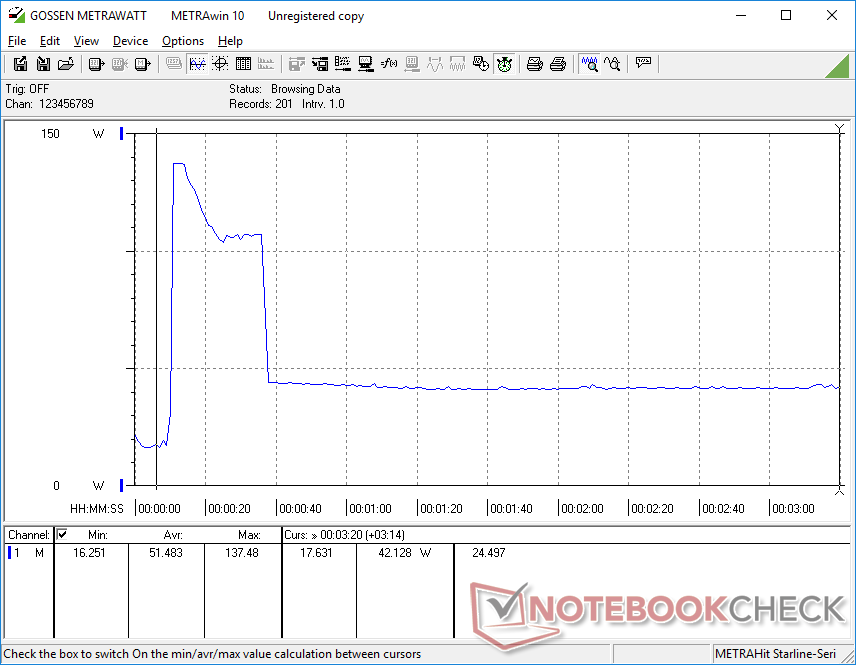
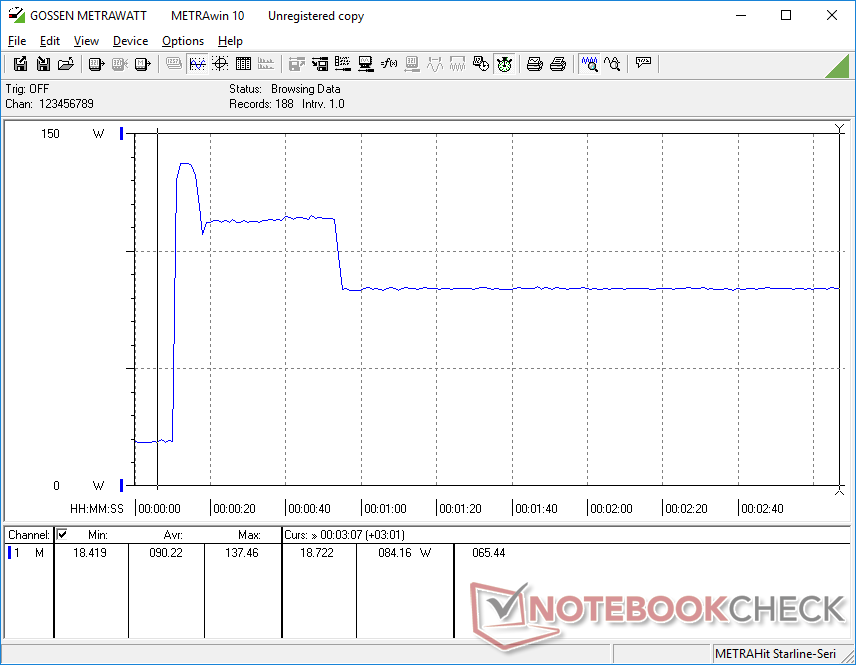
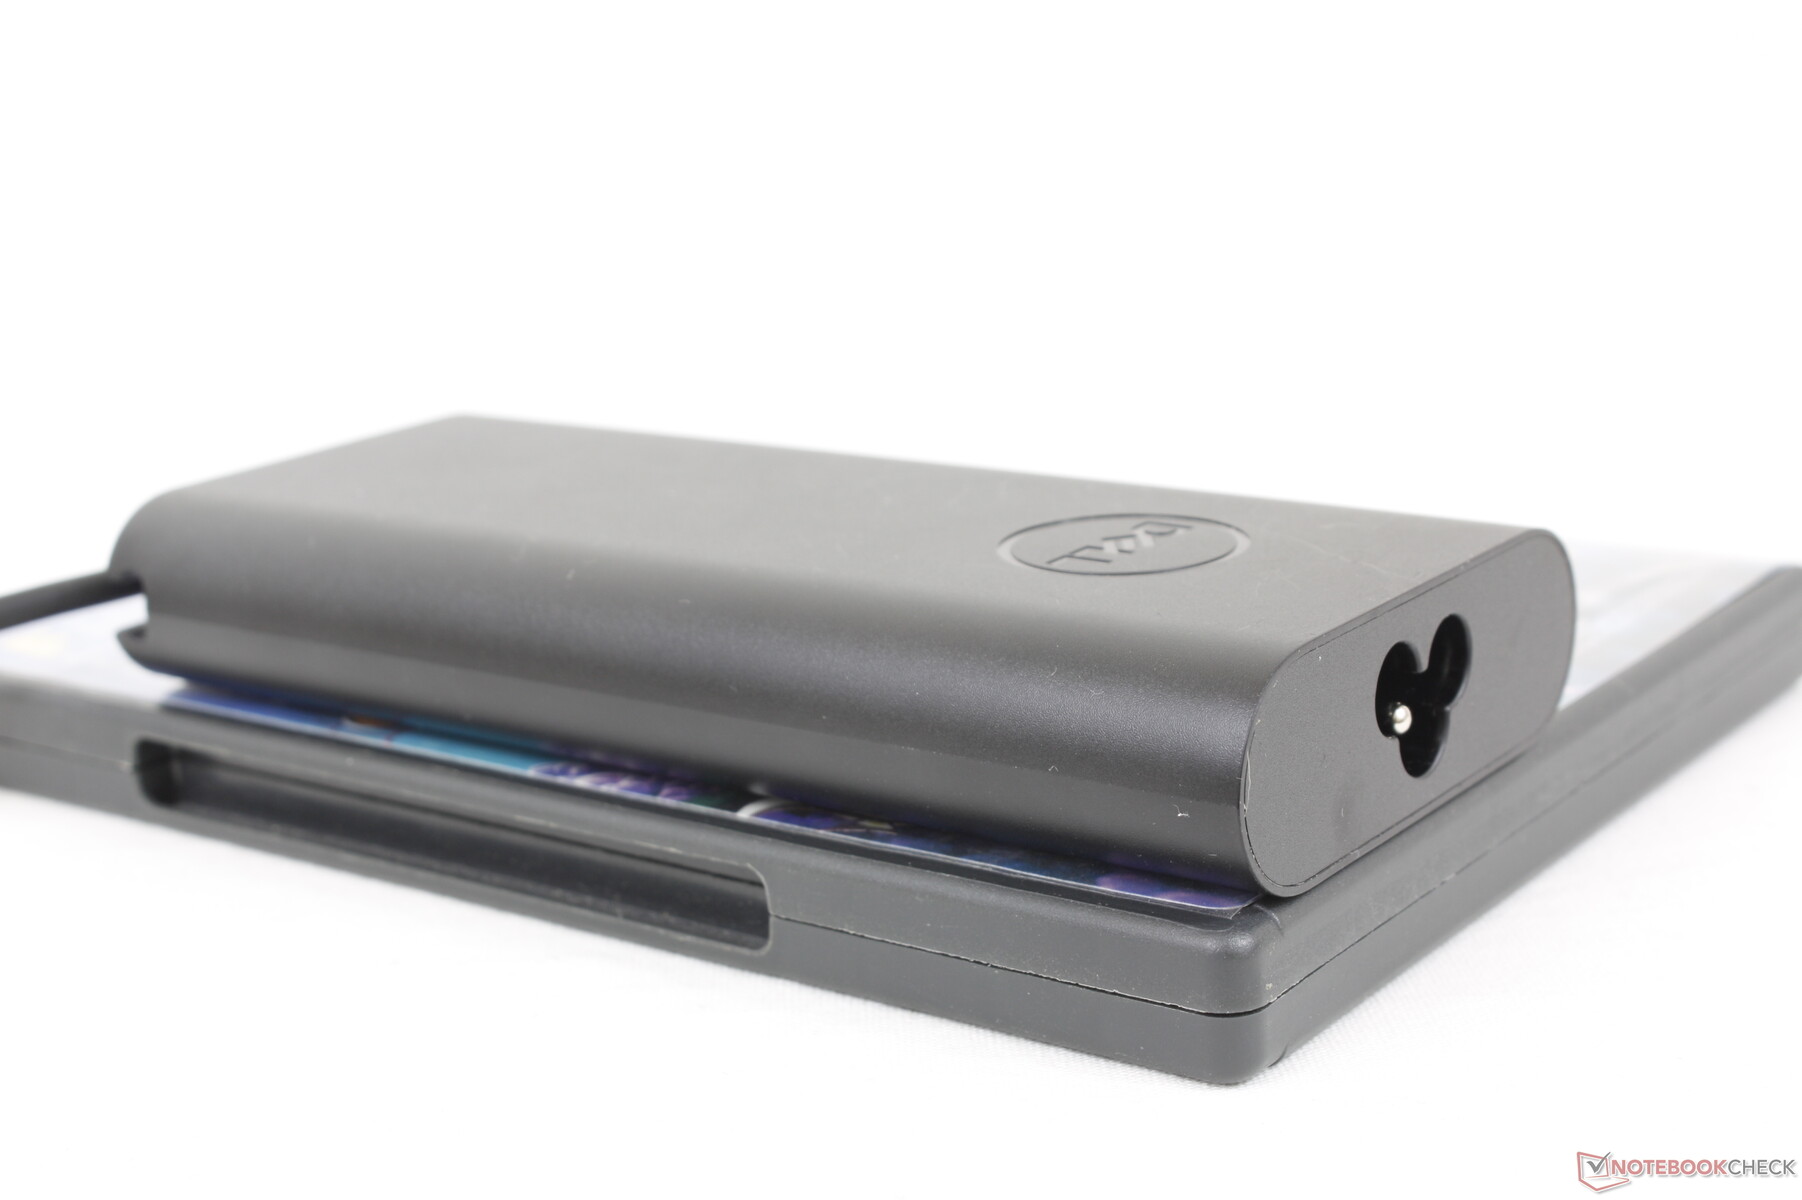
We zijn in staat om een maximale draw van bijna 138 W te registreren van de klein-medium (~14,3 x 6,5 x 2,2 cm) 130 W USB-C AC adapter bij het draaien van Prim95. Dit tempo is slechts tijdelijk zoals blijkt uit de onderstaande screenshots als gevolg van de thermische beperkingen van de koeloplossing. De vorm van de stroomverbruikscurve komt nauw overeen met onze waarnemingen over de kloksnelheid en het stroomverbruik op de kaart.
Merk op dat SKU's zonder de discrete RTX A1000 GPU worden geleverd met een kleinere 90 W USB-C AC adapter in plaats van een grotere 130 W adapter.
| Uit / Standby | |
| Inactief | |
| Belasting |
|
Key:
min: | |
| Dell Precision 5000 5470 i9-12900H, RTX A1000 Laptop GPU, Samsung PM9A1 MZVL21T0HCLR, IPS, 2560x1600, 14" | Lenovo ThinkPad P15v G2 21A9000XGE i7-11800H, T1200 Laptop GPU, Toshiba XG6 KXG6AZNV512G, IPS LED, 1920x1080, 15.6" | Dell Precision 5000 5560 i7-11850H, RTX A2000 Laptop GPU, Samsung PM9A1 MZVL22T0HBLB, IPS, 3840x2400, 15.6" | Lenovo ThinkPad P14s G2 AMD R7 PRO 5850U, Vega 8, SK Hynix PC711 1TB HFS001TDE9X081N, IPS LED, 3840x2160, 14" | HP ZBook Firefly 14 G8 2C9Q2EA i7-1165G7, T500 Laptop GPU, Toshiba XG6 KXG60ZNV1T02, IPS, 1920x1080, 14" | HP ZBook Firefly 14 G7 i7-10610U, Quadro P520, Toshiba XG6 KXG60ZNV512G, IPS, 1920x1080, 14" | |
|---|---|---|---|---|---|---|
| Power Consumption | 1% | -22% | 35% | 40% | 30% | |
| Idle Minimum * (Watt) | 4.3 | 5.96 -39% | 6.2 -44% | 4.49 -4% | 3.1 28% | 3.3 23% |
| Idle Average * (Watt) | 8.9 | 8.37 6% | 13.9 -56% | 9.62 -8% | 4.7 47% | 9.3 -4% |
| Idle Maximum * (Watt) | 18.9 | 9.05 52% | 23.8 -26% | 10.24 46% | 8.6 54% | 12.1 36% |
| Load Average * (Watt) | 94 | 91.82 2% | 95.7 -2% | 31.56 66% | 64.8 31% | 59.4 37% |
| Witcher 3 ultra * (Watt) | 83.2 | 102 -23% | 87 -5% | 43.7 47% | 59.6 28% | 52.7 37% |
| Load Maximum * (Watt) | 137.5 | 126.38 8% | 132.6 4% | 52.37 62% | 68.5 50% | 69.4 50% |
* ... kleiner is beter
Power Consumption Witcher 3 / Stresstest
Power Consumption external Monitor
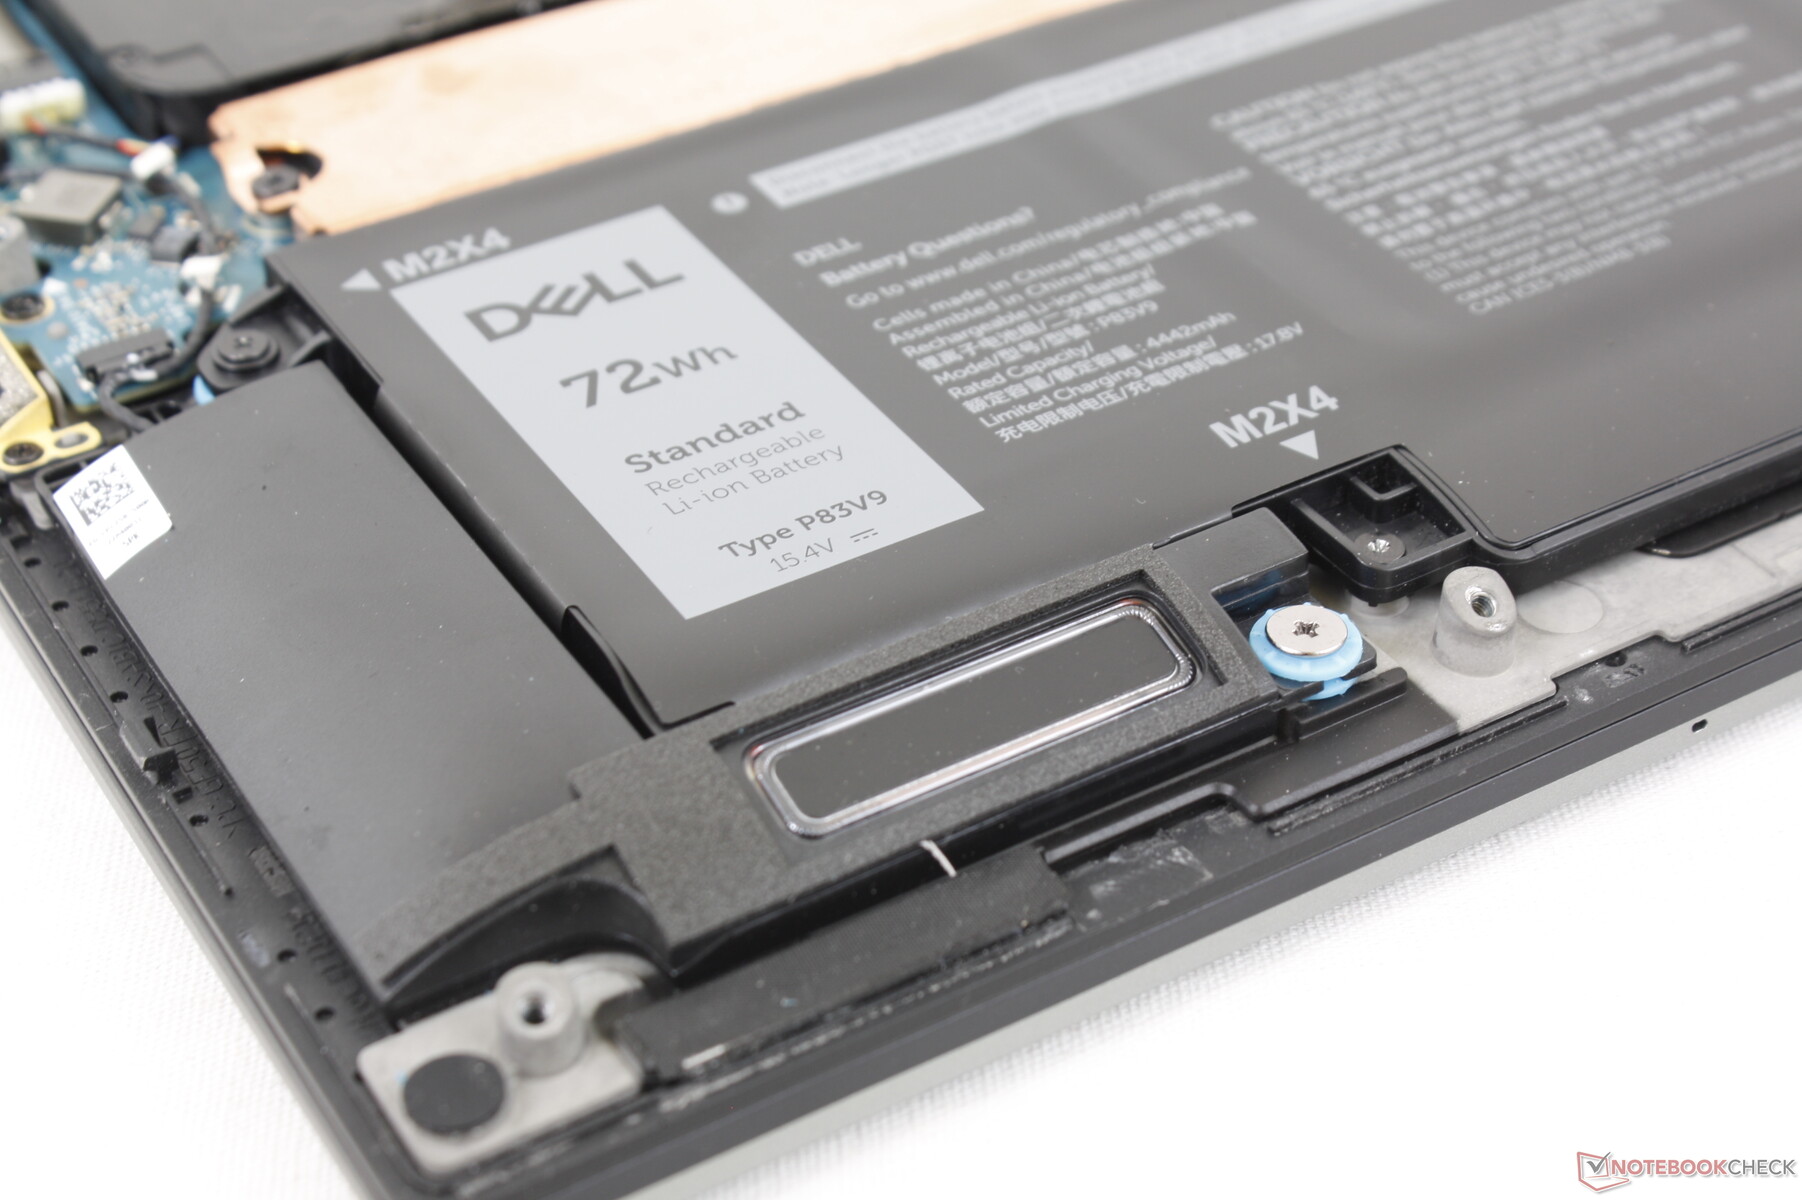
Levensduur van de batterij
De batterijcapaciteit is met 72 Wh relatief groot voor een ultradunne 14-inch laptop. WLAN runtime duurt iets meer dan 9,5 uur op een volledige lading, wat een paar uur korter is dan wat we registreerden op de langzamere Core U-serie aangedreven HP ZBook Firefly 14 G8.
Opladen van leeg naar vol duurt ongeveer 2 uur.
| Dell Precision 5000 5470 i9-12900H, RTX A1000 Laptop GPU, 72 Wh | Lenovo ThinkPad P15v G2 21A9000XGE i7-11800H, T1200 Laptop GPU, 68 Wh | Dell Precision 5000 5560 i7-11850H, RTX A2000 Laptop GPU, 86 Wh | Lenovo ThinkPad P14s G2 AMD R7 PRO 5850U, Vega 8, 50 Wh | HP ZBook Firefly 14 G8 2C9Q2EA i7-1165G7, T500 Laptop GPU, 53 Wh | HP ZBook Firefly 14 G7 i7-10610U, Quadro P520, 53 Wh | |
|---|---|---|---|---|---|---|
| Batterijduur | -8% | 4% | 7% | 162% | 21% | |
| Reader / Idle (h) | 14.7 | 17.2 17% | 12 -18% | |||
| WiFi v1.3 (h) | 9.6 | 7.5 -22% | 6.3 -34% | 8.3 -14% | 12.8 33% | 10.1 5% |
| Load (h) | 1.1 | 0.9 -18% | 1.8 64% | 1.4 27% | 4.3 291% | 1.5 36% |
| H.264 (h) | 8 | 10.6 | 12.5 |
Pro
Contra
Verdict - Uber krachtig zonder de Uber omvang
De Precision 5470 kan het best worden omschreven als een dun-en-licht workstation met de processor van een dik-en-zwaar gaming laptop. Je gaat geen ander 14-inch workstation zo compact vinden met dezelfde Core i9-12900H CPU en zelfs discrete Nvidia RTX GPU als deze Dell. Als je op zoek bent naar maximale prestaties terwijl je het gewicht en de grootte zo laag mogelijk houdt, dan is de Precision 5470 misschien het overwegen waard.
De Precision 5470 is sneller en krachtiger dan zijn kleine formaat anders doet vermoeden. Dit is het werkstationmodel dat je moet hebben als je de prestaties zo hoog mogelijk wilt houden op een kleine 14-inch vormfactor.
Helaas is het systeem een beetje te ambitieus als het gaat om prestaties. Zijn Core i9-12900H presteert ondermaats in vergelijking met andere laptops met dezelfde CPU. Het is nog steeds snel in vergelijking met andere 14-inch werkstations, maar het had zeker sneller kunnen zijn. We maken ons zorgen over hoeveel beter de Core i9-12900HK SKU daadwerkelijk kan presteren ten opzichte van onze Core i9-12900H, gezien de ongewenste kloksnelheidschommelingen tijdens onze review. Ondertussen vertoont de RTX A1000 slechte ray tracing mogelijkheden ondanks dat er RTX in de naam zit, net als onze observaties met de GeForce RTX 3050 waarop de A1000 is gebaseerd.
De veeleisende 12e generatie H-serie CPU is direct verantwoordelijk voor het relatief luide ventilatorgeluid en het hoge stroomverbruik van de Precision 5470. Het ziet er misschien uit en voelt aan als een 14-inch laptop, maar het klinkt soms zeker als een gaming laptop. Dit nadeel is gebruikelijk bij kleine krachtige laptops.
Prijs en beschikbaarheid
De Precision 5470 is nu op grote schaal beschikbaar via online resellers zoals Newegg of Amazon zij het alleen in beperkte FHD-configuraties van 2000 tot 2300 USD. Gebruikers kunnen in plaats daarvan rechtstreeks bij Dell kopen die meer configureerbare opties heeft om uit te kiezen.
Dell Precision 5000 5470
- 16-09-2022 v7 (old)
Allen Ngo
Price comparison

