Dell Precision 5680 beoordeling: Ada Lovelace domineert op werkstations

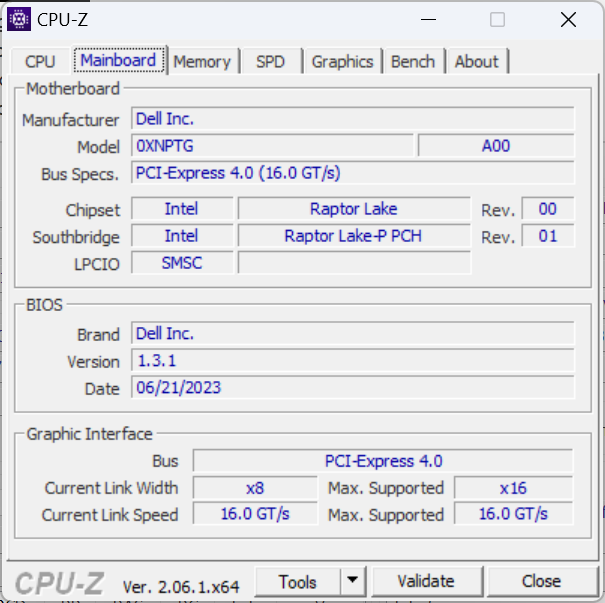
De Precision 5680 is het eerste 16-inch model in de Precision 5000-serie als aanvulling op de bestaande 14-inch Precision 5470en 15-inch Precision 5560en 17-inch Precision 5750. Het is een high-end mobiel werkstation dat dunner en lichter is dan een Precision 7000-model maar met minder geïntegreerde extra functies.
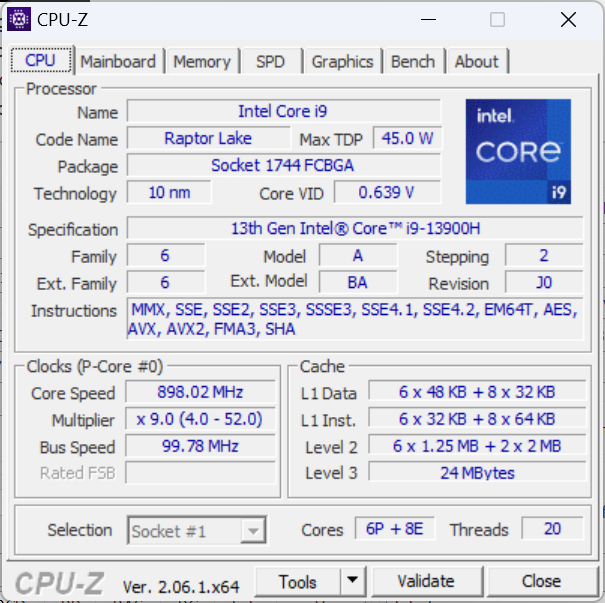
Onze testunit is een high-end configuratie met de 13e gen Raptor Lake-H Core i9-13900H CPU, 75 W Nvidia RTX 5000 GPU en 2400p OLED touchscreen voor ongeveer 6500 USD. Kleinere SKU's zijn beschikbaar met de Core i5-13600H, geen discrete GPU en 1200p IPS-scherm voor een lagere startprijs van ongeveer 2490 dollar.
Dit is toevallig ook een van de eerste werkstations die wordt geleverd met de RTX 5000 Ada Lovelace mobiele GPU, die niet moet worden verward met de Turing-gebaseerde Quadro RTX 5000 of Ampere-gebaseerde RTX A5000.
Concurrenten in deze ruimte zijn onder andere 16-inch werkstations zoals deHP ZBook Fury 16 G9,Lenovo ThinkPad P16 G1,MSI CreatorPro Z16Pof de Asus ProArt StudioBook 16 serie.
Meer Dell beoordelingen:
Potentiële concurrenten in vergelijking
Evaluatie | Datum | Model | Gewicht | Hoogte | Formaat | Resolutie | Beste prijs |
|---|---|---|---|---|---|---|---|
| 89 % v7 (old) | 08-2023 | Dell Precision 5000 5680 i9-13900H, RTX 5000 Ada Generation Laptop | 2.3 kg | 22.17 mm | 16.00" | 3840x2400 | |
| 89.1 % v7 (old) | 12-2022 | Dell Precision 7000 7670 Performance i9-12950HX, RTX A5500 Laptop GPU | 2.8 kg | 25.95 mm | 16.00" | 3840x2400 | |
| 91 % v7 (old) | 06-2023 | HP ZBook Fury 16 G9 i9-12950HX, RTX A5500 Laptop GPU | 2.6 kg | 28.5 mm | 16.00" | 3840x2400 | |
| 91 % v7 (old) | 02-2023 | Lenovo ThinkPad P16 G1 RTX A5500 i9-12950HX, RTX A5500 Laptop GPU | 3 kg | 30.23 mm | 16.00" | 3840x2400 | |
| 84.3 % v7 (old) | 11-2022 | MSI CreatorPro Z16P B12UKST i7-12700H, RTX A3000 Laptop GPU | 2.4 kg | 19 mm | 16.00" | 2560x1600 | |
| 89.6 % v7 (old) | 01-2023 | Asus ExpertBook B6 Flip B6602FC2 i9-12950HX, RTX A2000 Laptop GPU | 2.8 kg | 27.2 mm | 16.00" | 2560x1600 |
Hoes - XPS Roots
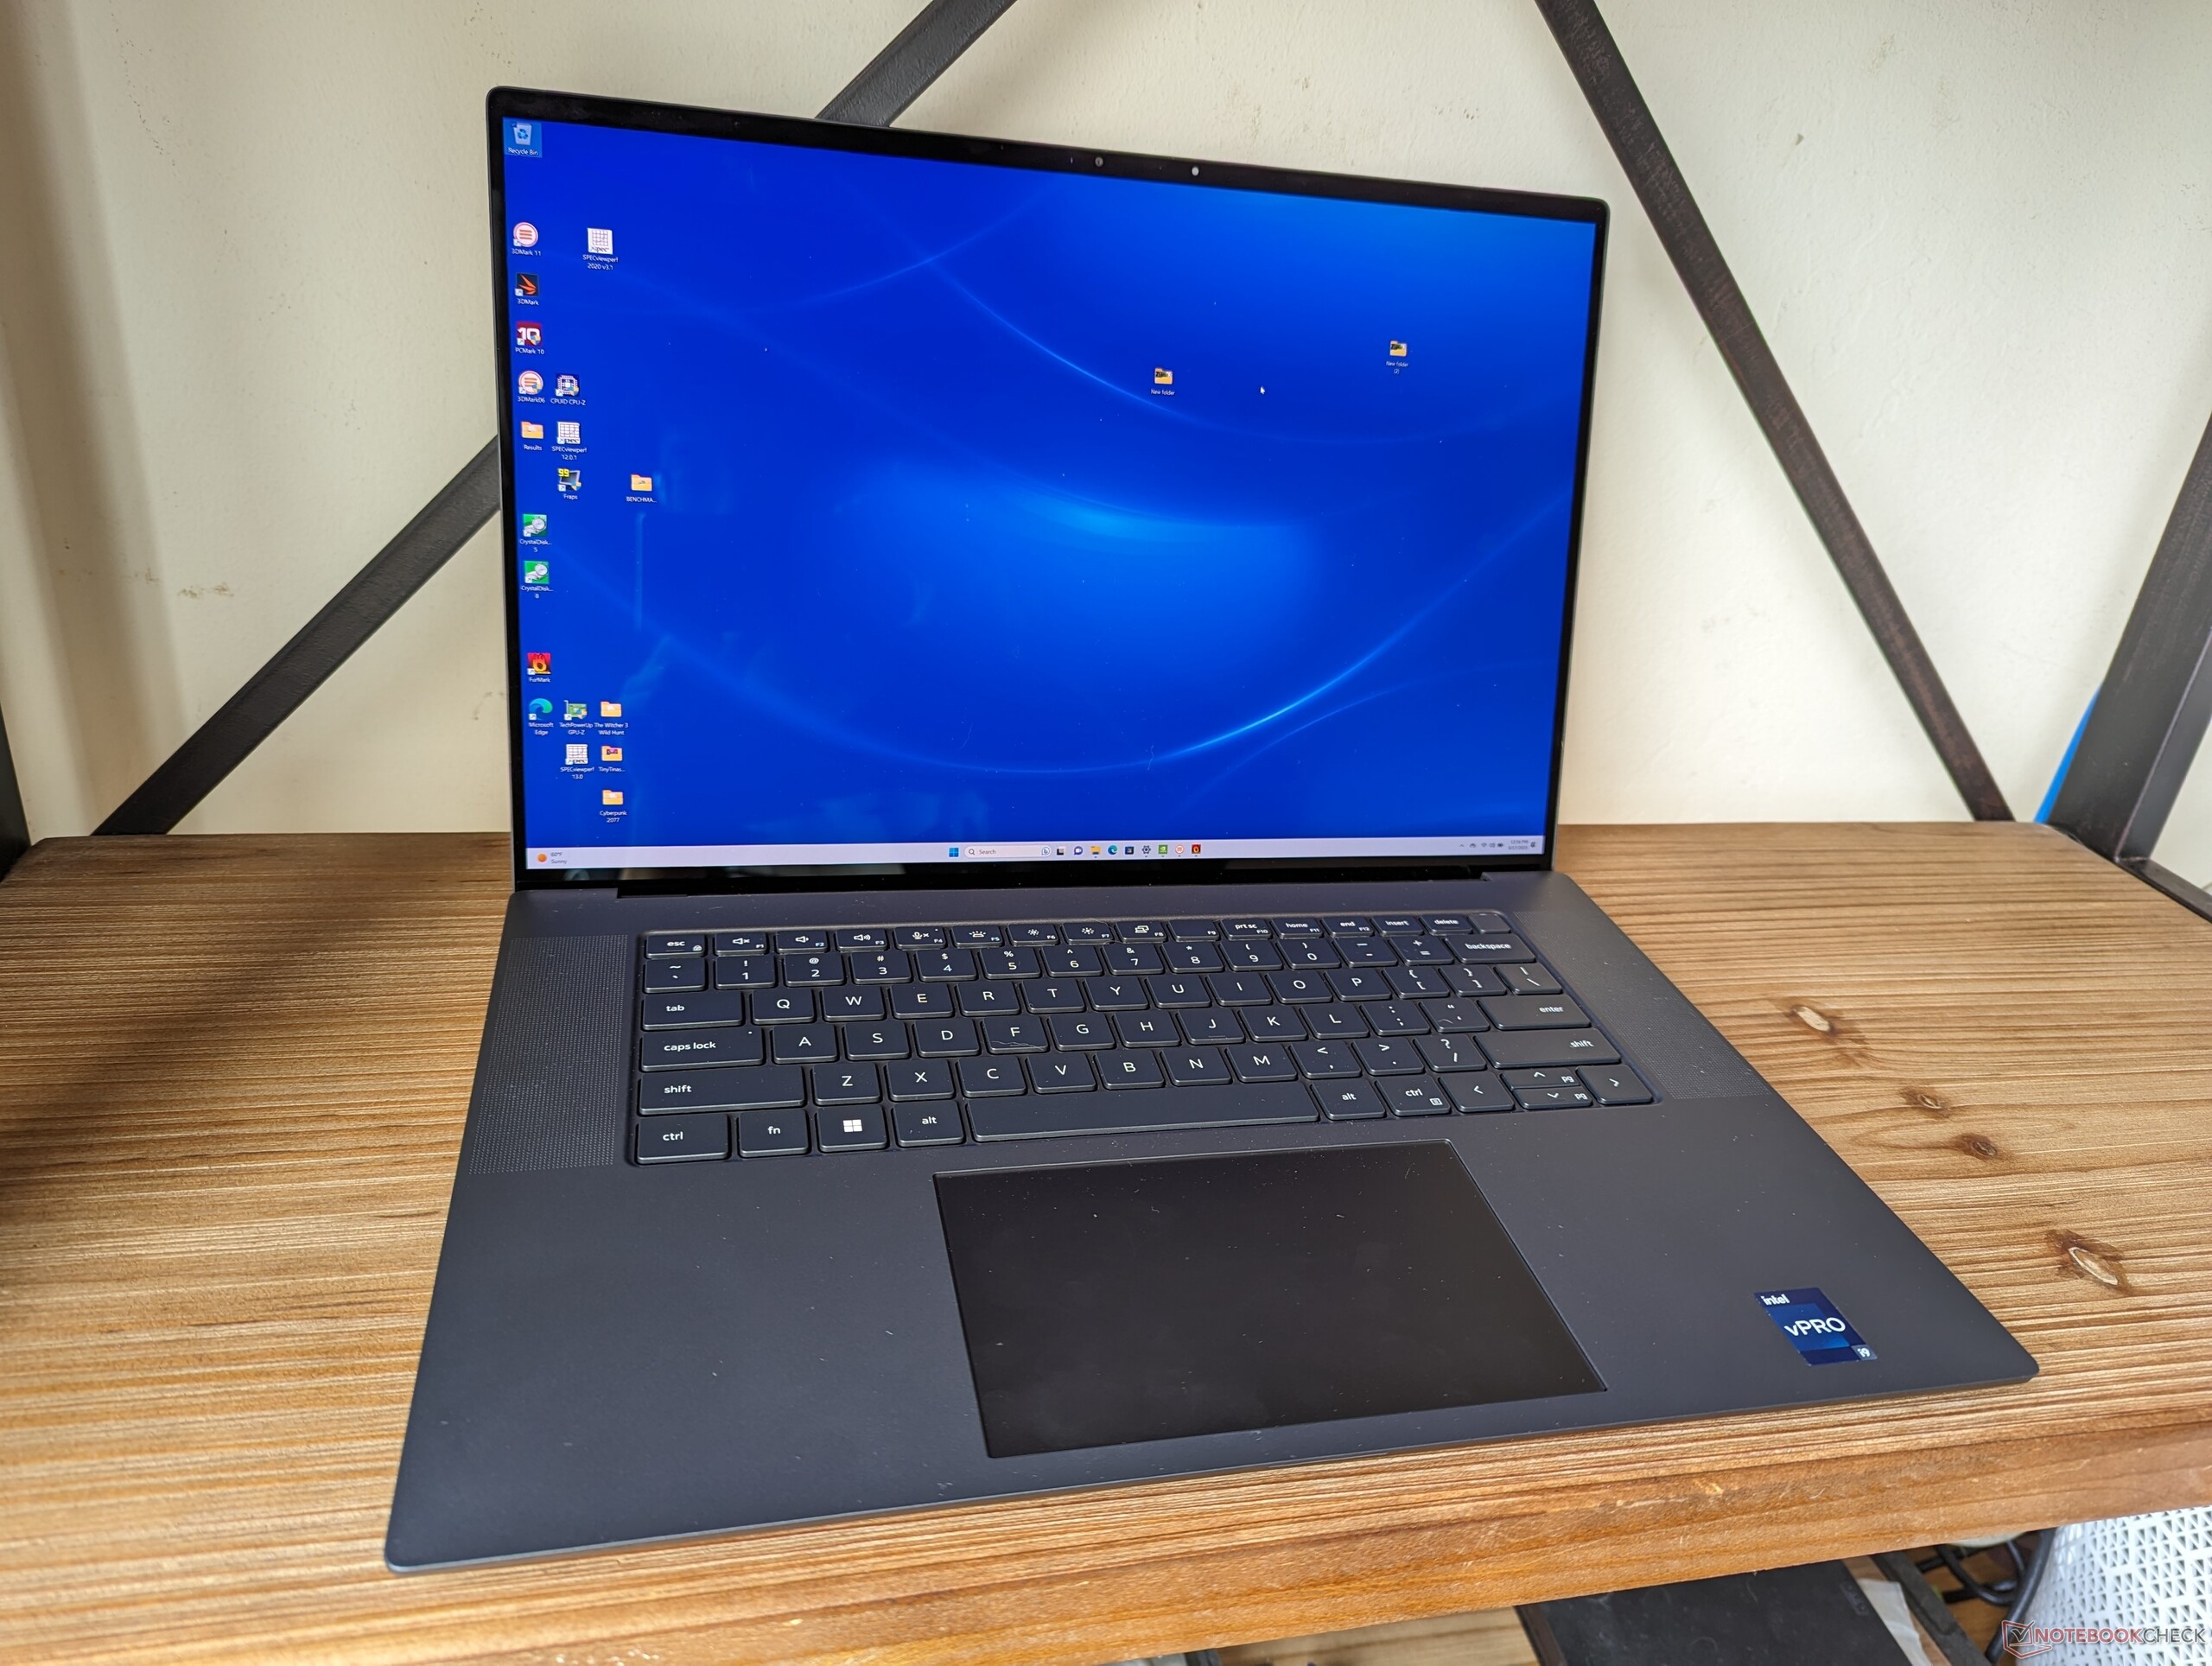
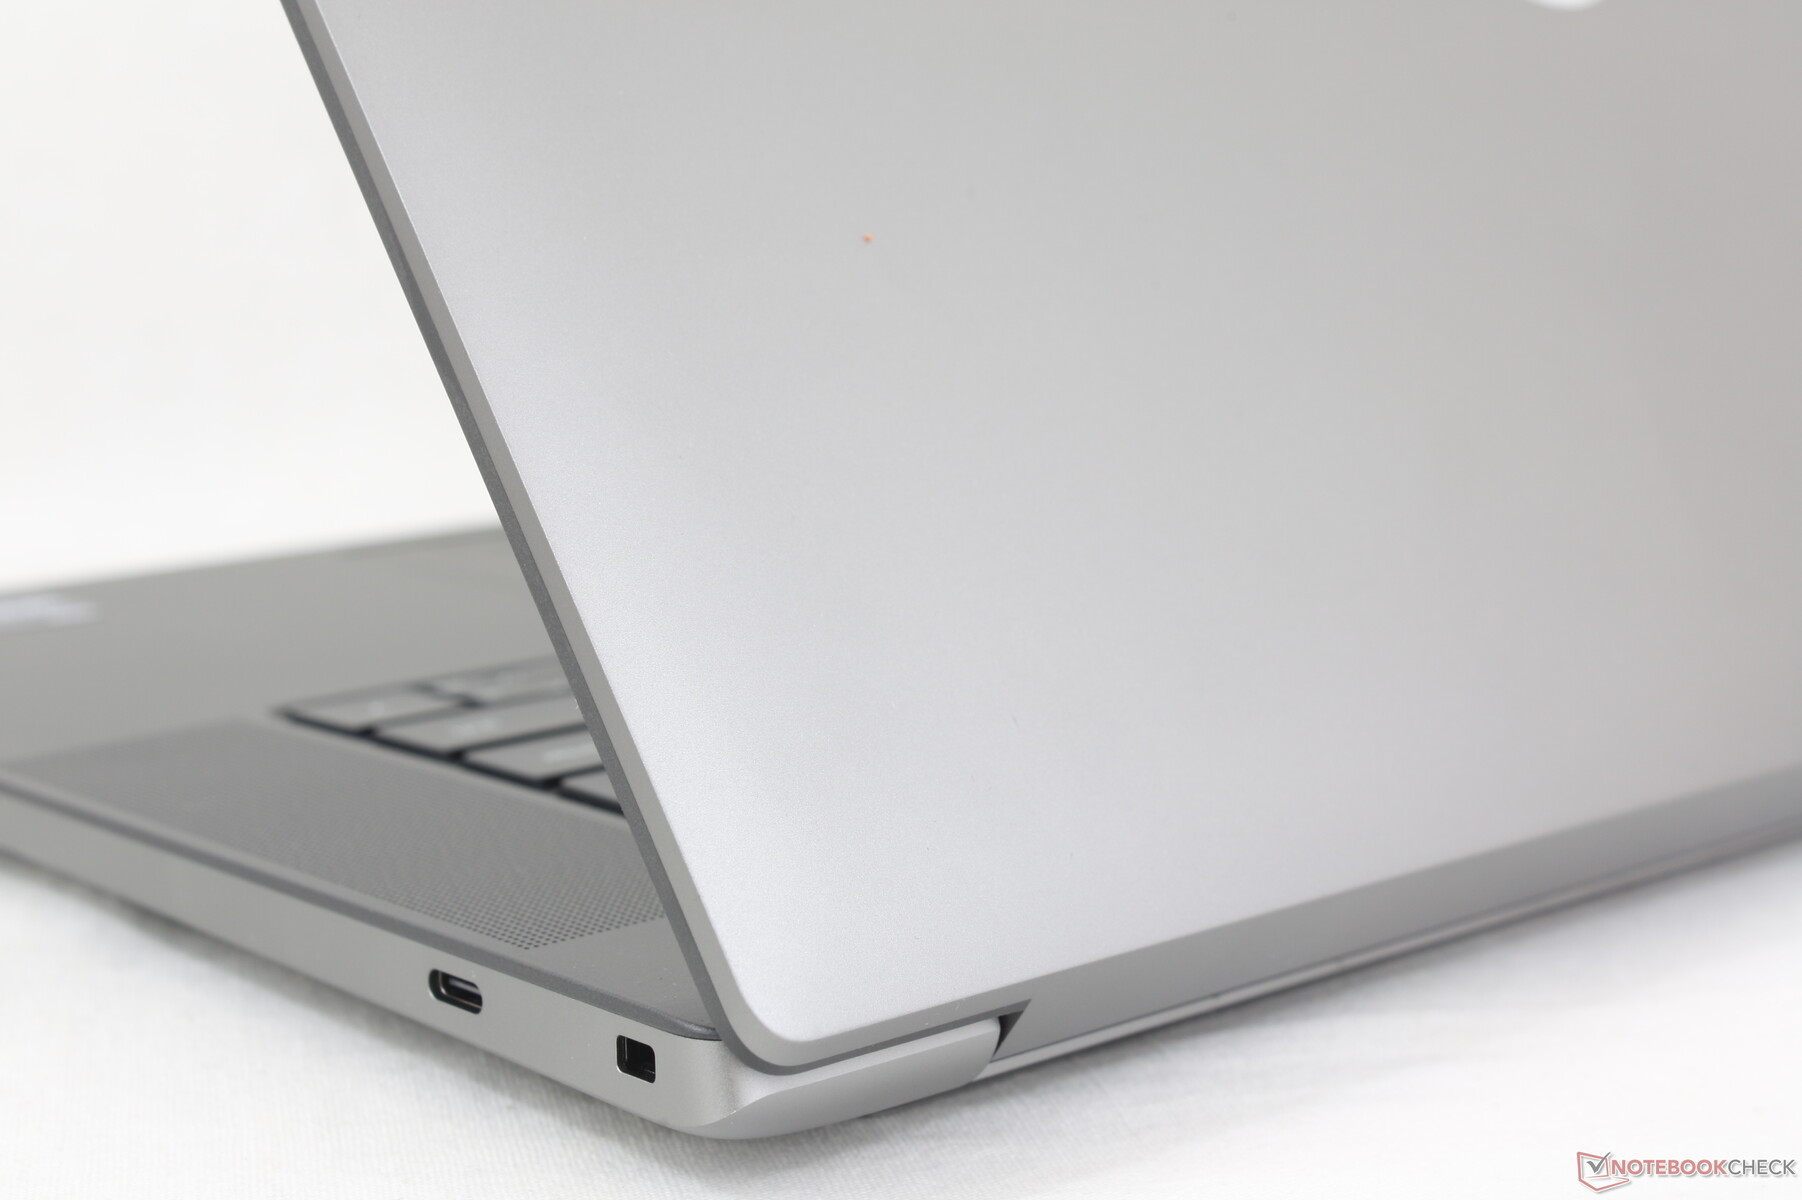
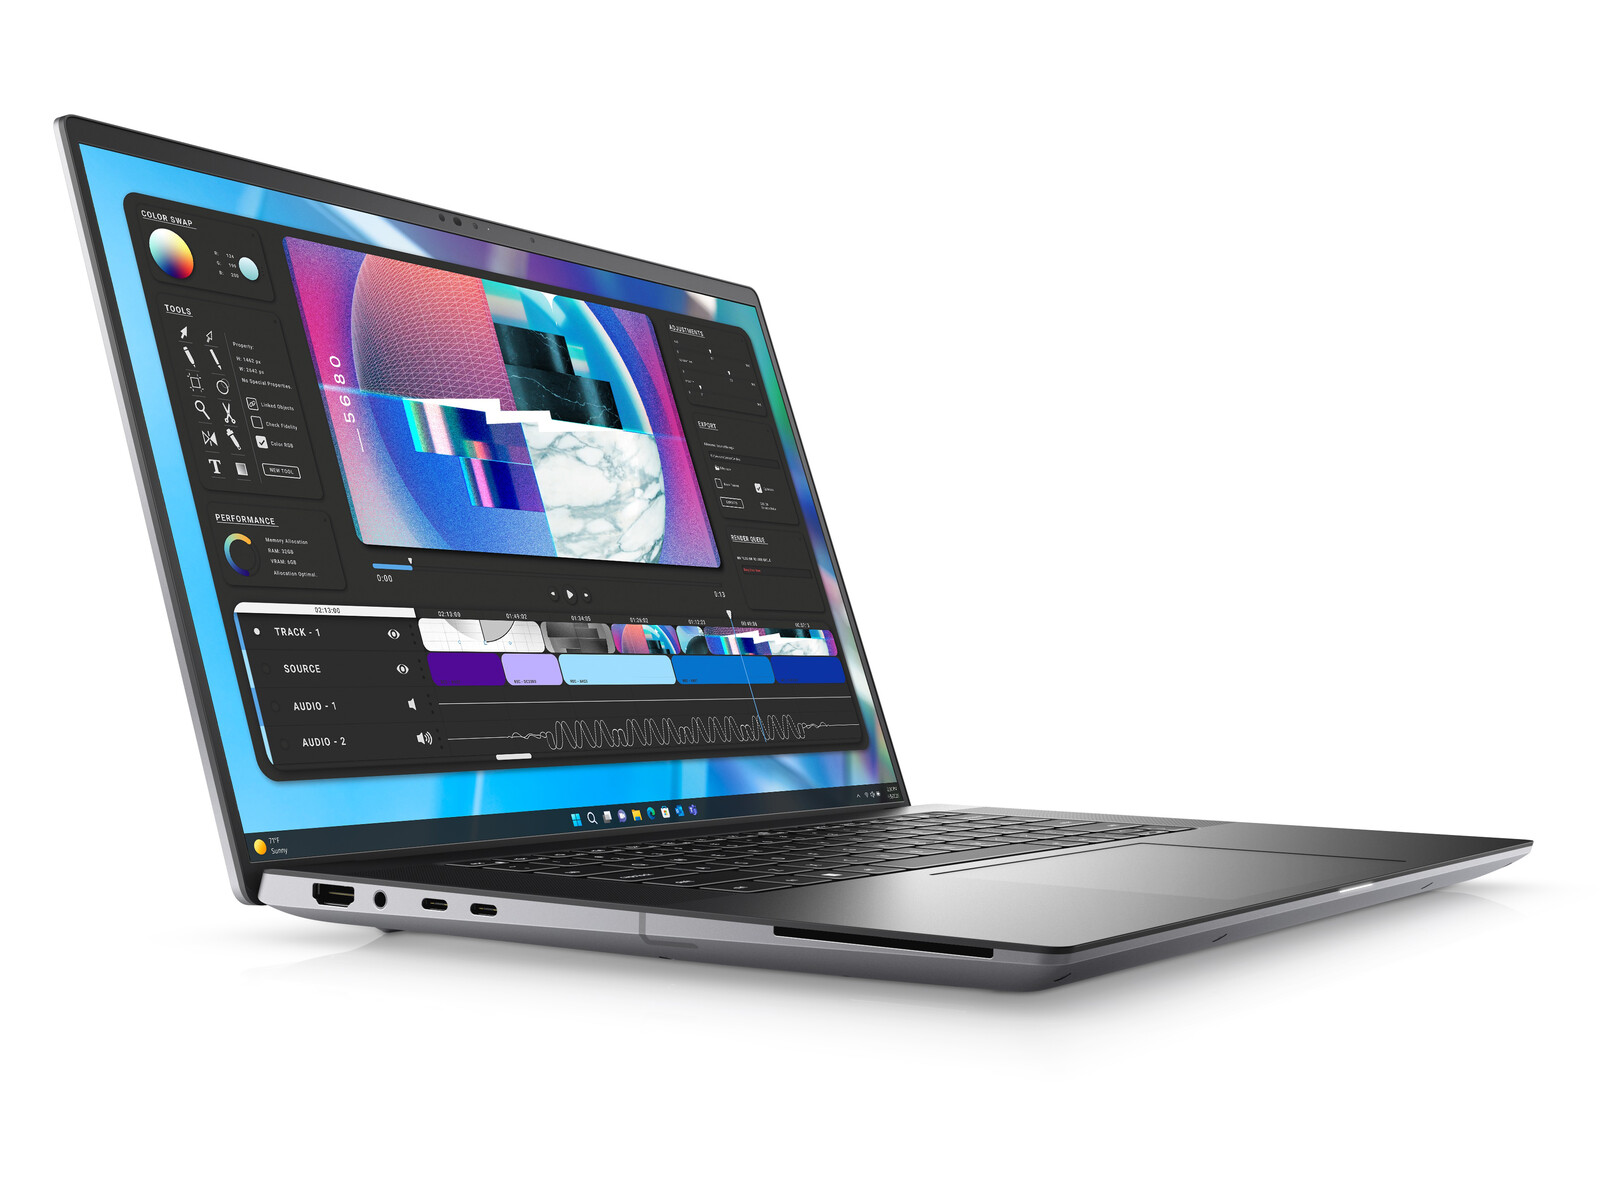
De inspiratie voor het ontwerp van de Precision 5680 ligt voor de hand, want het is in wezen de 16-inch versie van de 15-inch XPS 15 en 17-inch XPS 17. Als je al eerder ervaring hebt gehad met een XPS-model, dan zou de Precision 5680 direct vertrouwd moeten aanvoelen. Het lijkt een voorloper van een hypothetische "XPS 16" en het zou ons niet verbazen als we in de nabije toekomst een dergelijk model zien met een chassis dat is gebaseerd op de Precision 5680.
De bouwkwaliteit steekt gunstig af bij alternatieven zoals de ZBook Fury 16 G9 ofCreatorPro Z16P die ook grotendeels bestaan uit metaallegeringen voor een sterke eerste indruk.
Met een gewicht van slechts 2,3 kg is de Precision 5680 een van de lichtste 16-inch werkstations op de markt. De CreatorPro Z16P enHP ZBook Fury 16 G9zijn bijvoorbeeld respectievelijk ongeveer 100 g en 300 g zwaarder, terwijl ze ook meer ruimte innemen dan onze Dell. De Precision 5680 is verrassend draagbaar gezien zijn prestaties.
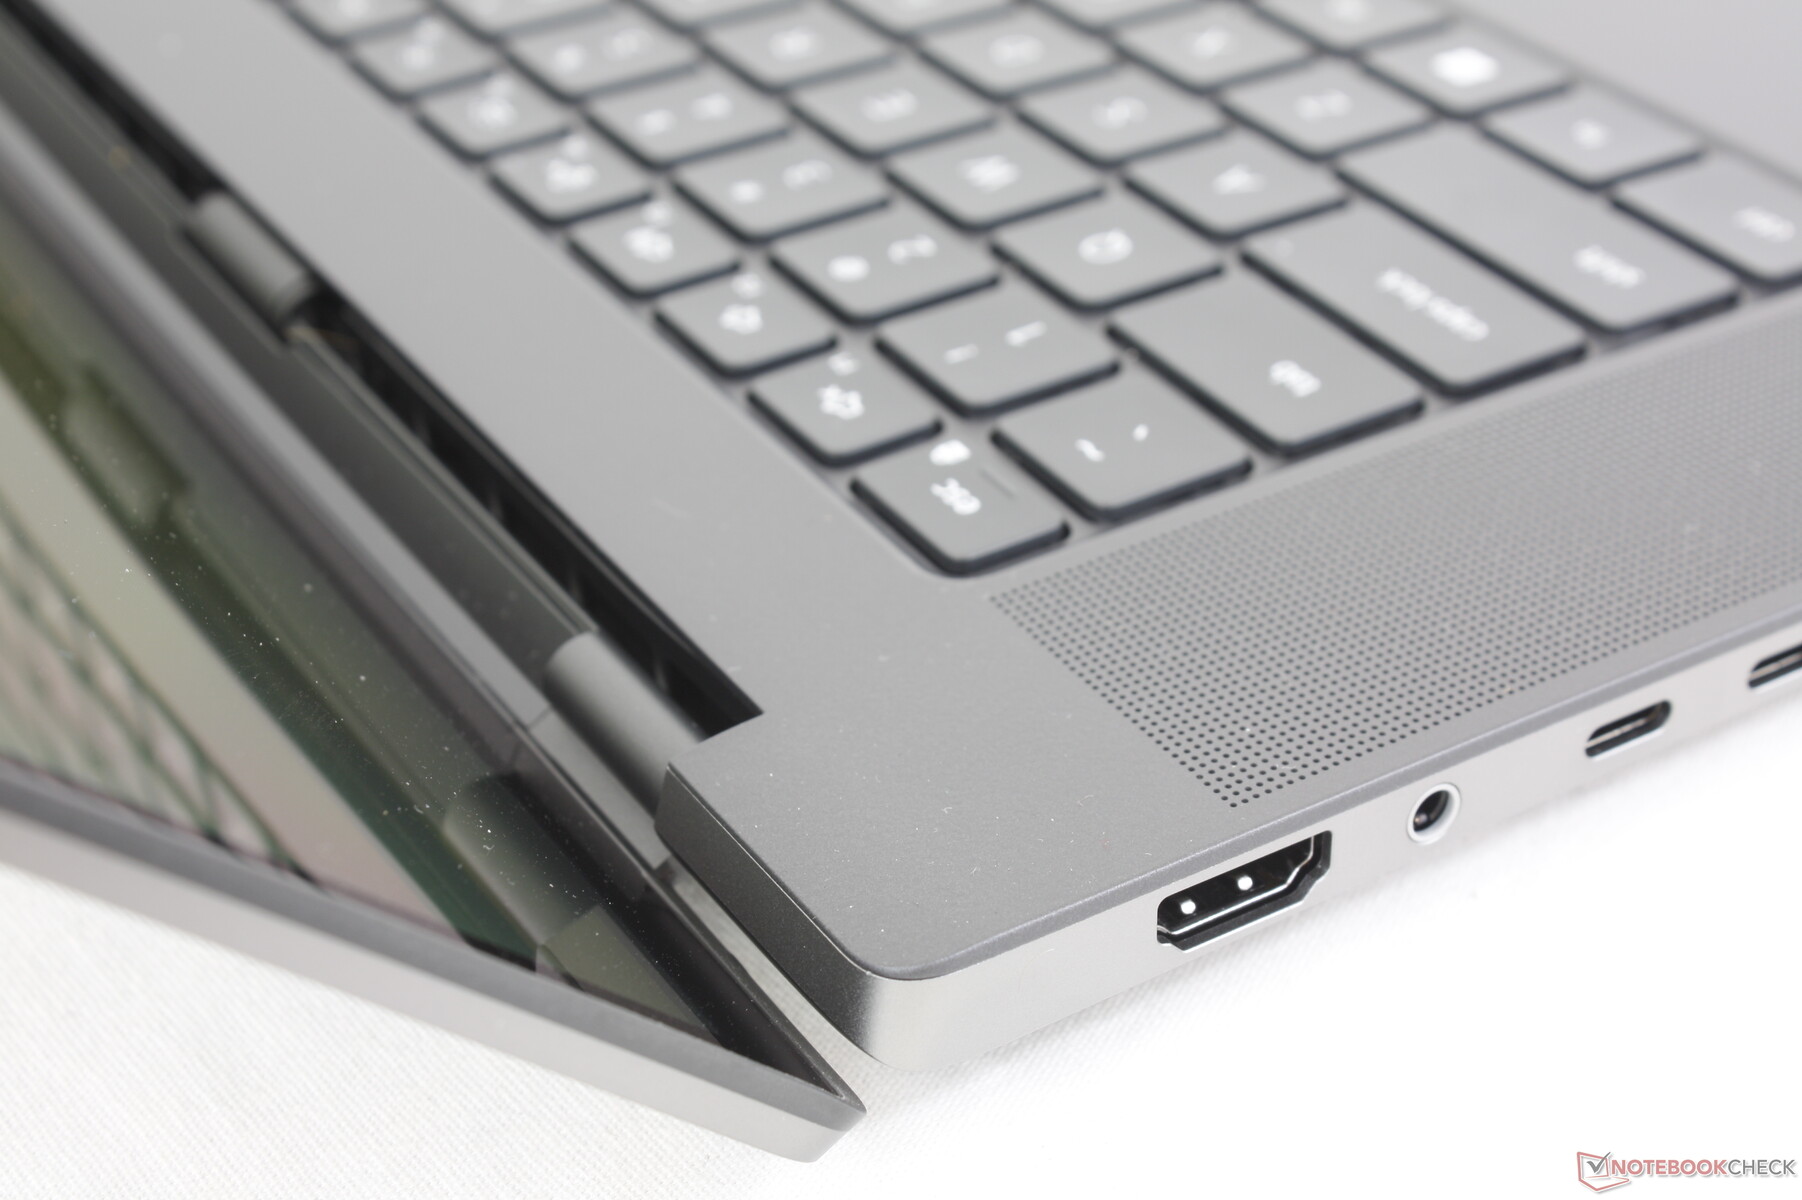
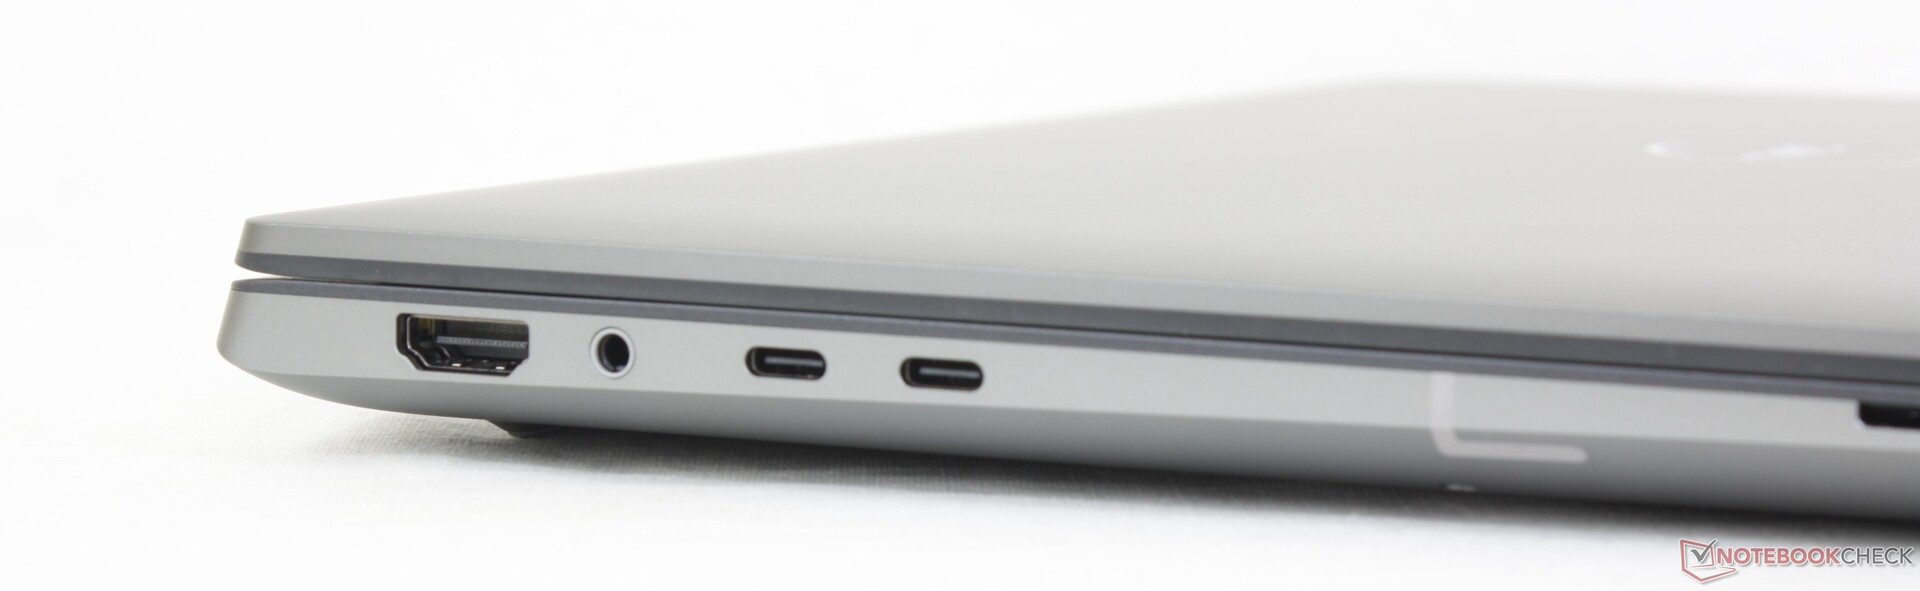
Connectiviteit - Niet veel voor een werkstation
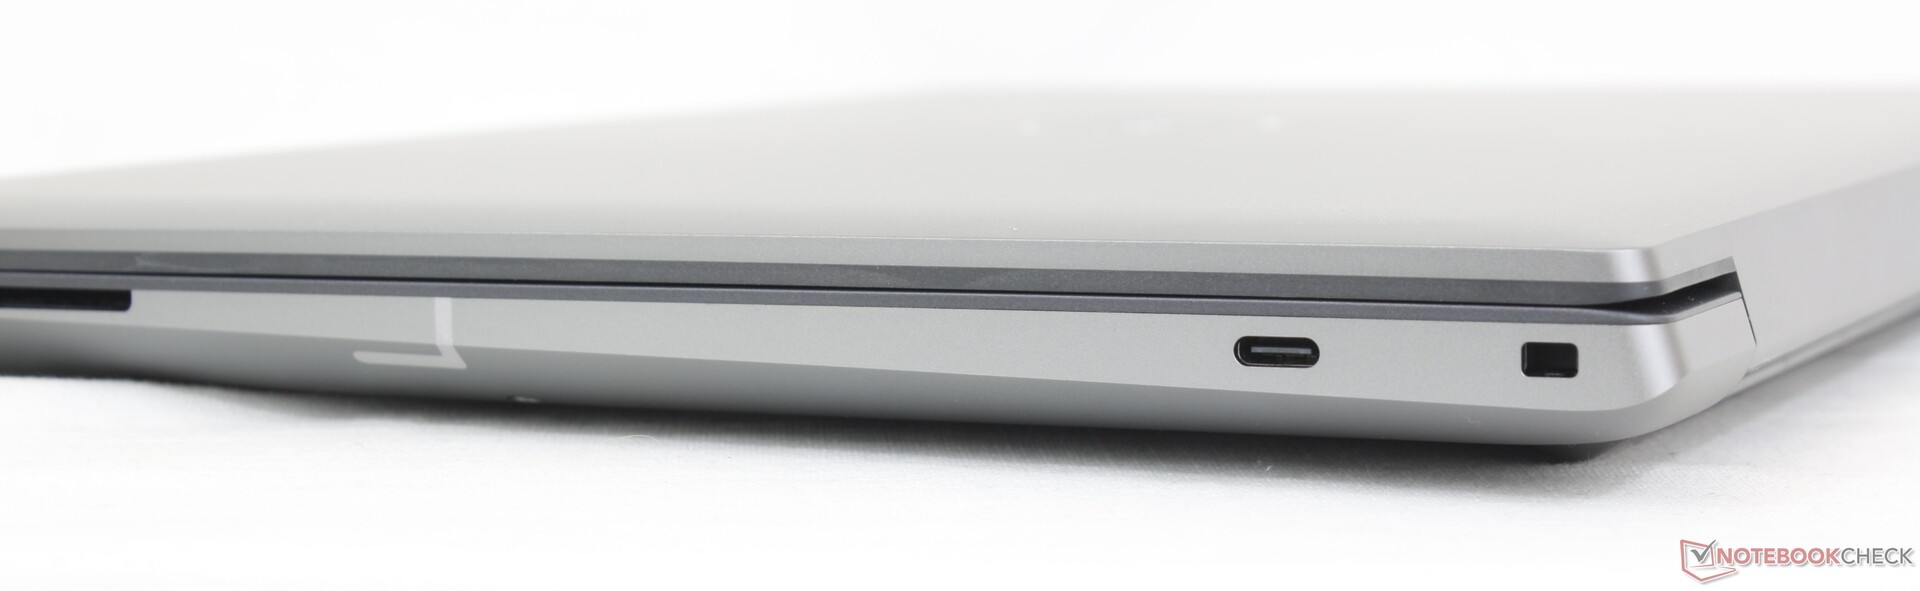
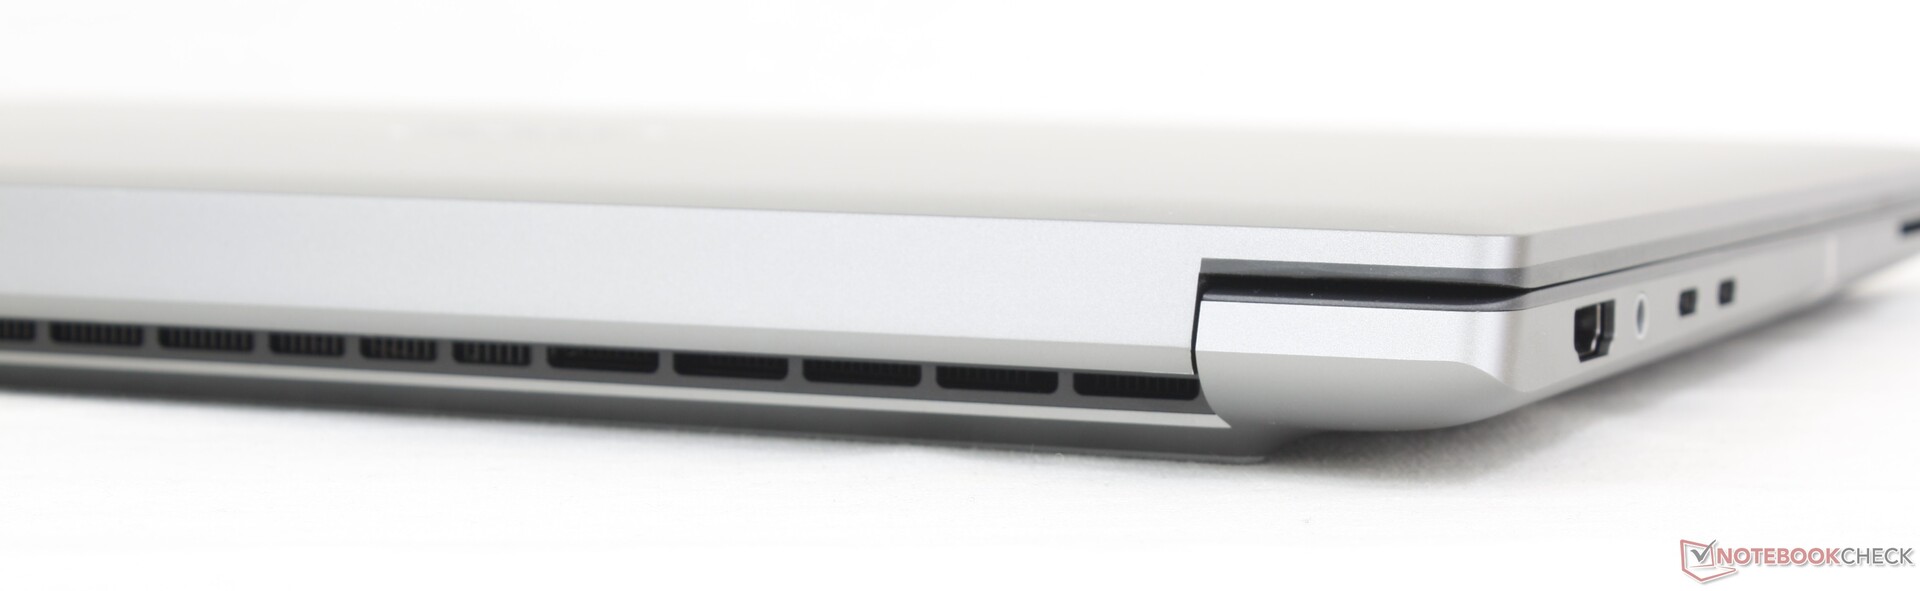
De poortopties zijn vooruitstrevend, ten goede of ten kwade. Het is beter in de zin dat elke poort zeer veelzijdig is als het aankomt op adapters en randapparatuur, maar het is ook slechter in de zin dat er geen standaardpoorten zijn zoals USB of RJ-45 op ware grootte. Alternatieven zoals de ThinkPad P1 G4 of ExpertBook B6 Flip bieden elk een grotere verscheidenheid aan poorten dan onze Dell. Bereid je voor op adapters of docking stations als je de Precision 5680 gebruikt.
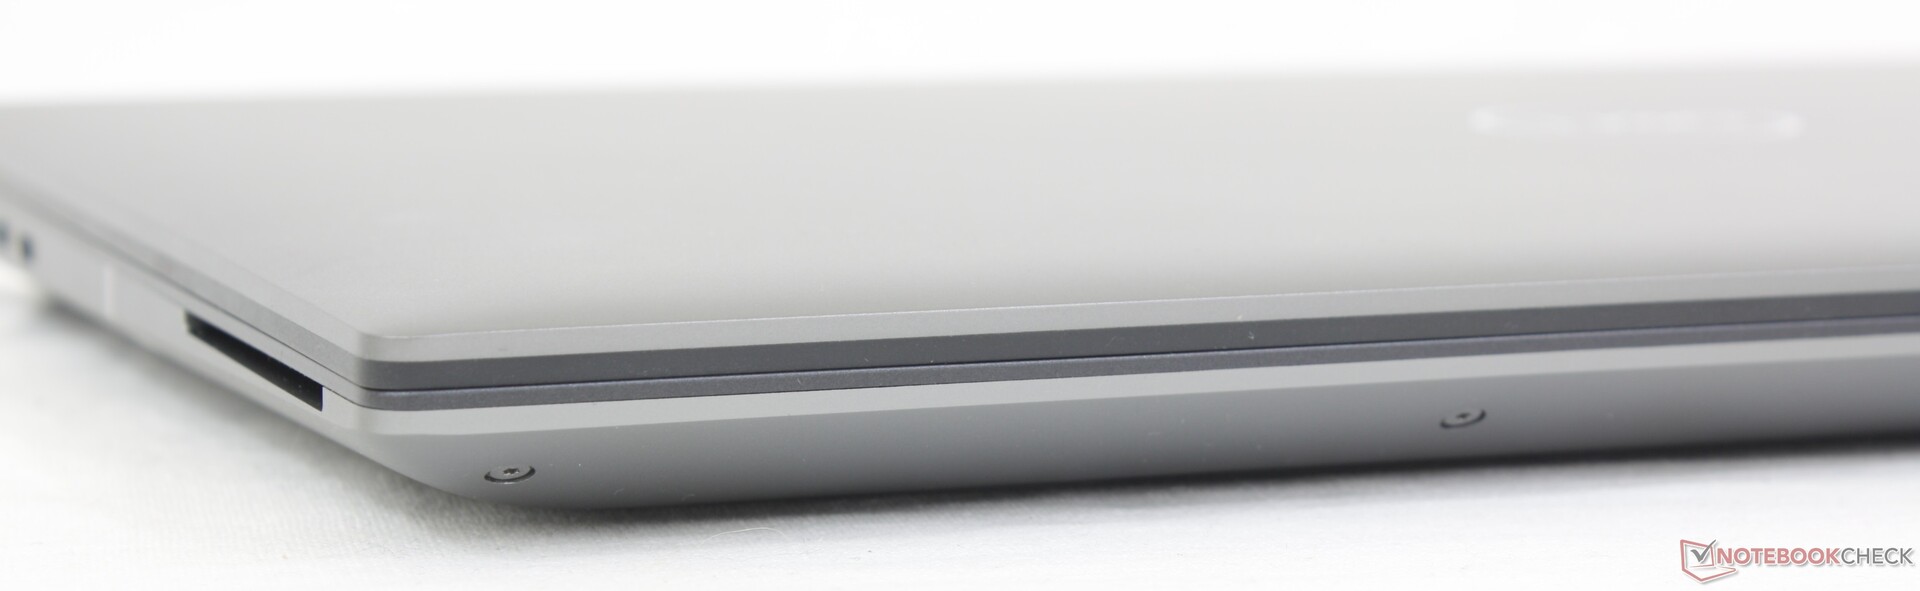
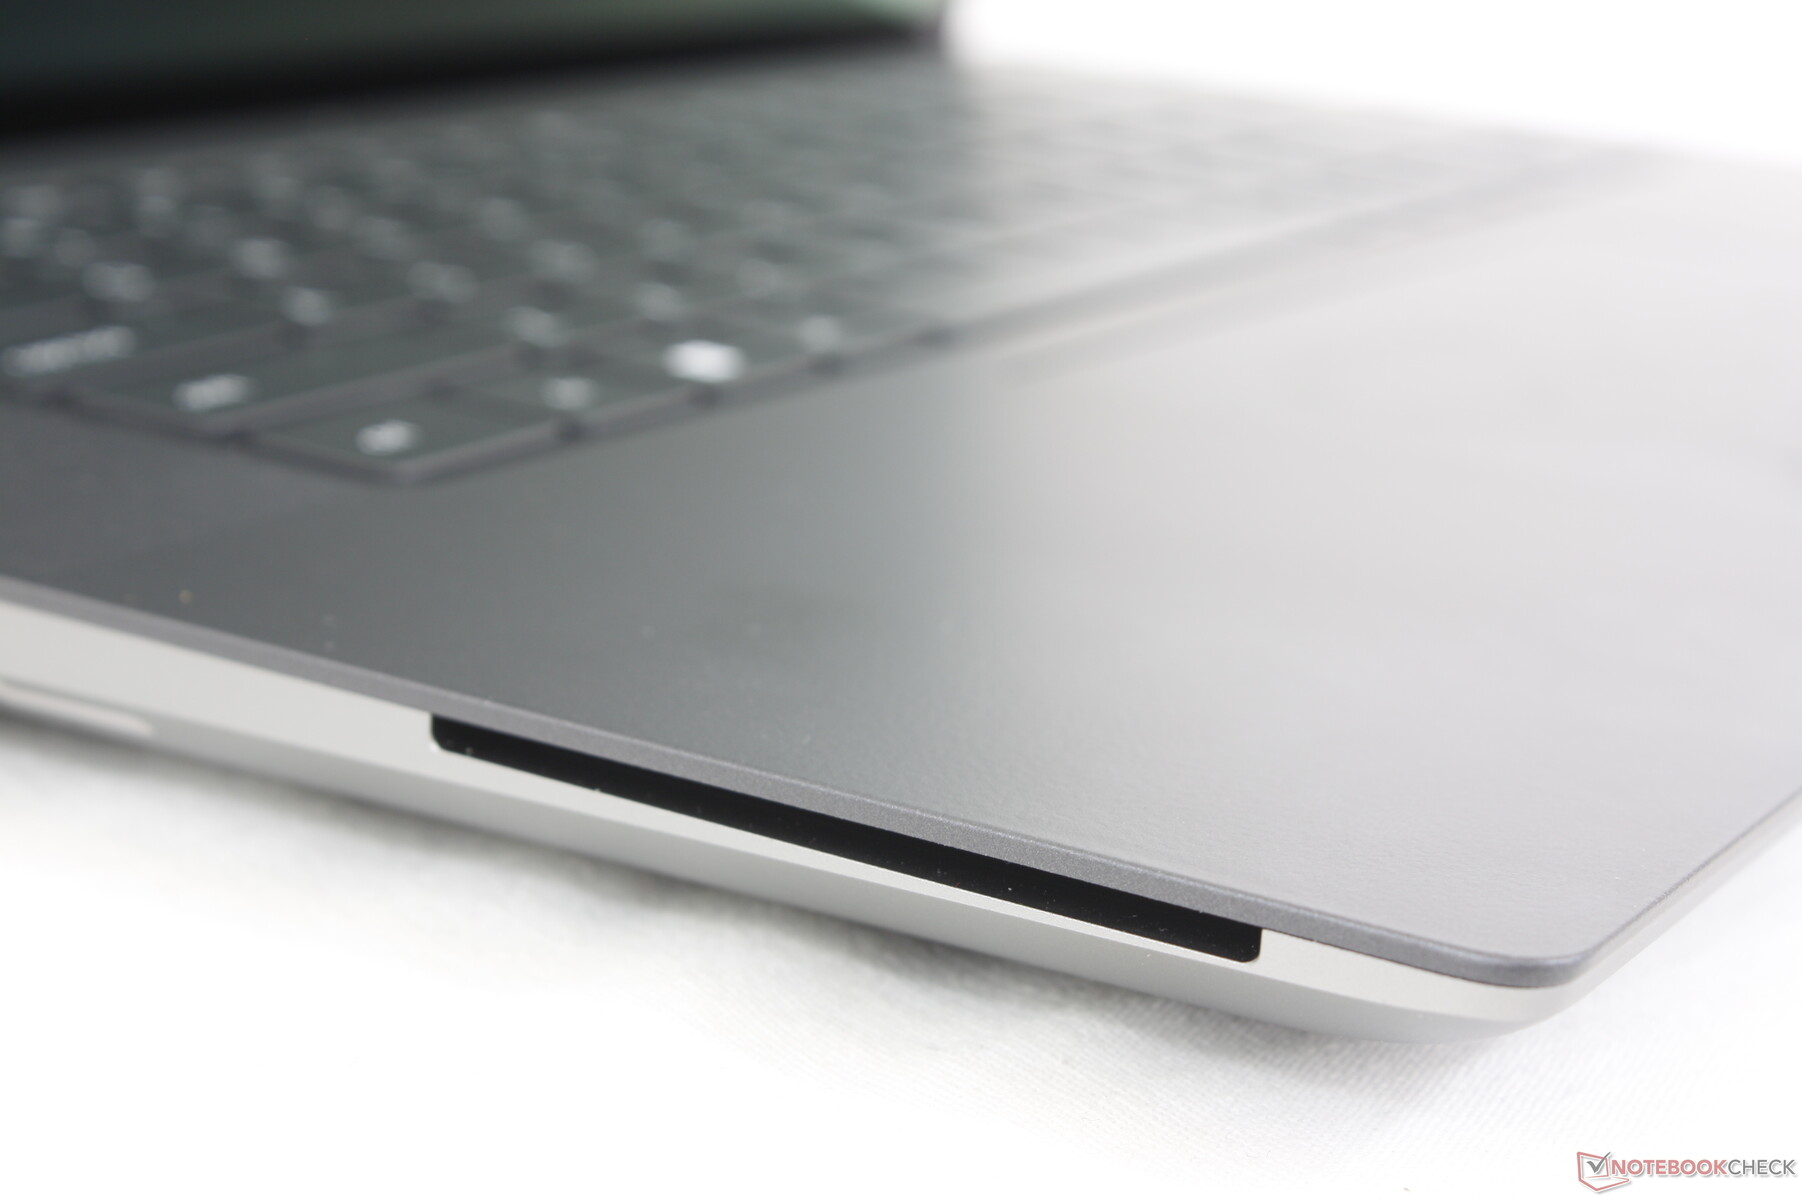
SD-kaartlezer
XPS- en Precision -modellen hebben enkele van de snelste geïntegreerde SD-kaartlezers en dit geldt nog steeds voor onze Precision 5680. De leessnelheden zijn meer dan 2x zo hoog als op de ZBook Fury 16 G9 of ThinkPad P16 G1 en dus duurt het slechts 5 tot 6 seconden om 1 GB aan gegevens over te zetten van onze UHS-II testkaart naar de desktop.
| SD Card Reader | |
| average JPG Copy Test (av. of 3 runs) | |
| Dell Precision 5000 5680 (Toshiba Exceria Pro SDXC 64 GB UHS-II) | |
| Dell Precision 7000 7670 Performance (Toshiba Exceria Pro SDXC 64 GB UHS-II) | |
| MSI CreatorPro Z16P B12UKST (AV Pro V60) | |
| HP ZBook Fury 16 G9 (PNY EliteX-PRO60) | |
| Lenovo ThinkPad P16 G1 RTX A5500 (Toshiba Exceria Pro SDXC 64 GB UHS-II) | |
| maximum AS SSD Seq Read Test (1GB) | |
| Dell Precision 7000 7670 Performance (Toshiba Exceria Pro SDXC 64 GB UHS-II) | |
| Dell Precision 5000 5680 (Toshiba Exceria Pro SDXC 64 GB UHS-II) | |
| HP ZBook Fury 16 G9 (PNY EliteX-PRO60) | |
| MSI CreatorPro Z16P B12UKST (AV Pro V60) | |
| Lenovo ThinkPad P16 G1 RTX A5500 (Toshiba Exceria Pro SDXC 64 GB UHS-II) | |
Communicatie
Een Intel AX211 wordt standaard geleverd voor Wi-Fi 6E en Bluetooth 5.3 connectiviteit. De overdrachtsnelheden waren stabiel wanneer deze gekoppeld werden aan ons Asus AXE11000 6GHz netwerk.
WAN-opties worden helaas niet ondersteund, in tegenstelling tot de concurrerende ZBook Fury 16 G9.
Webcam
Dell heeft de webcam verhoogd van 1 MP op de Precision 5550 naar 2 MP op onze Precision 5680. Toch is er nog steeds geen geïntegreerde privacy shutter.


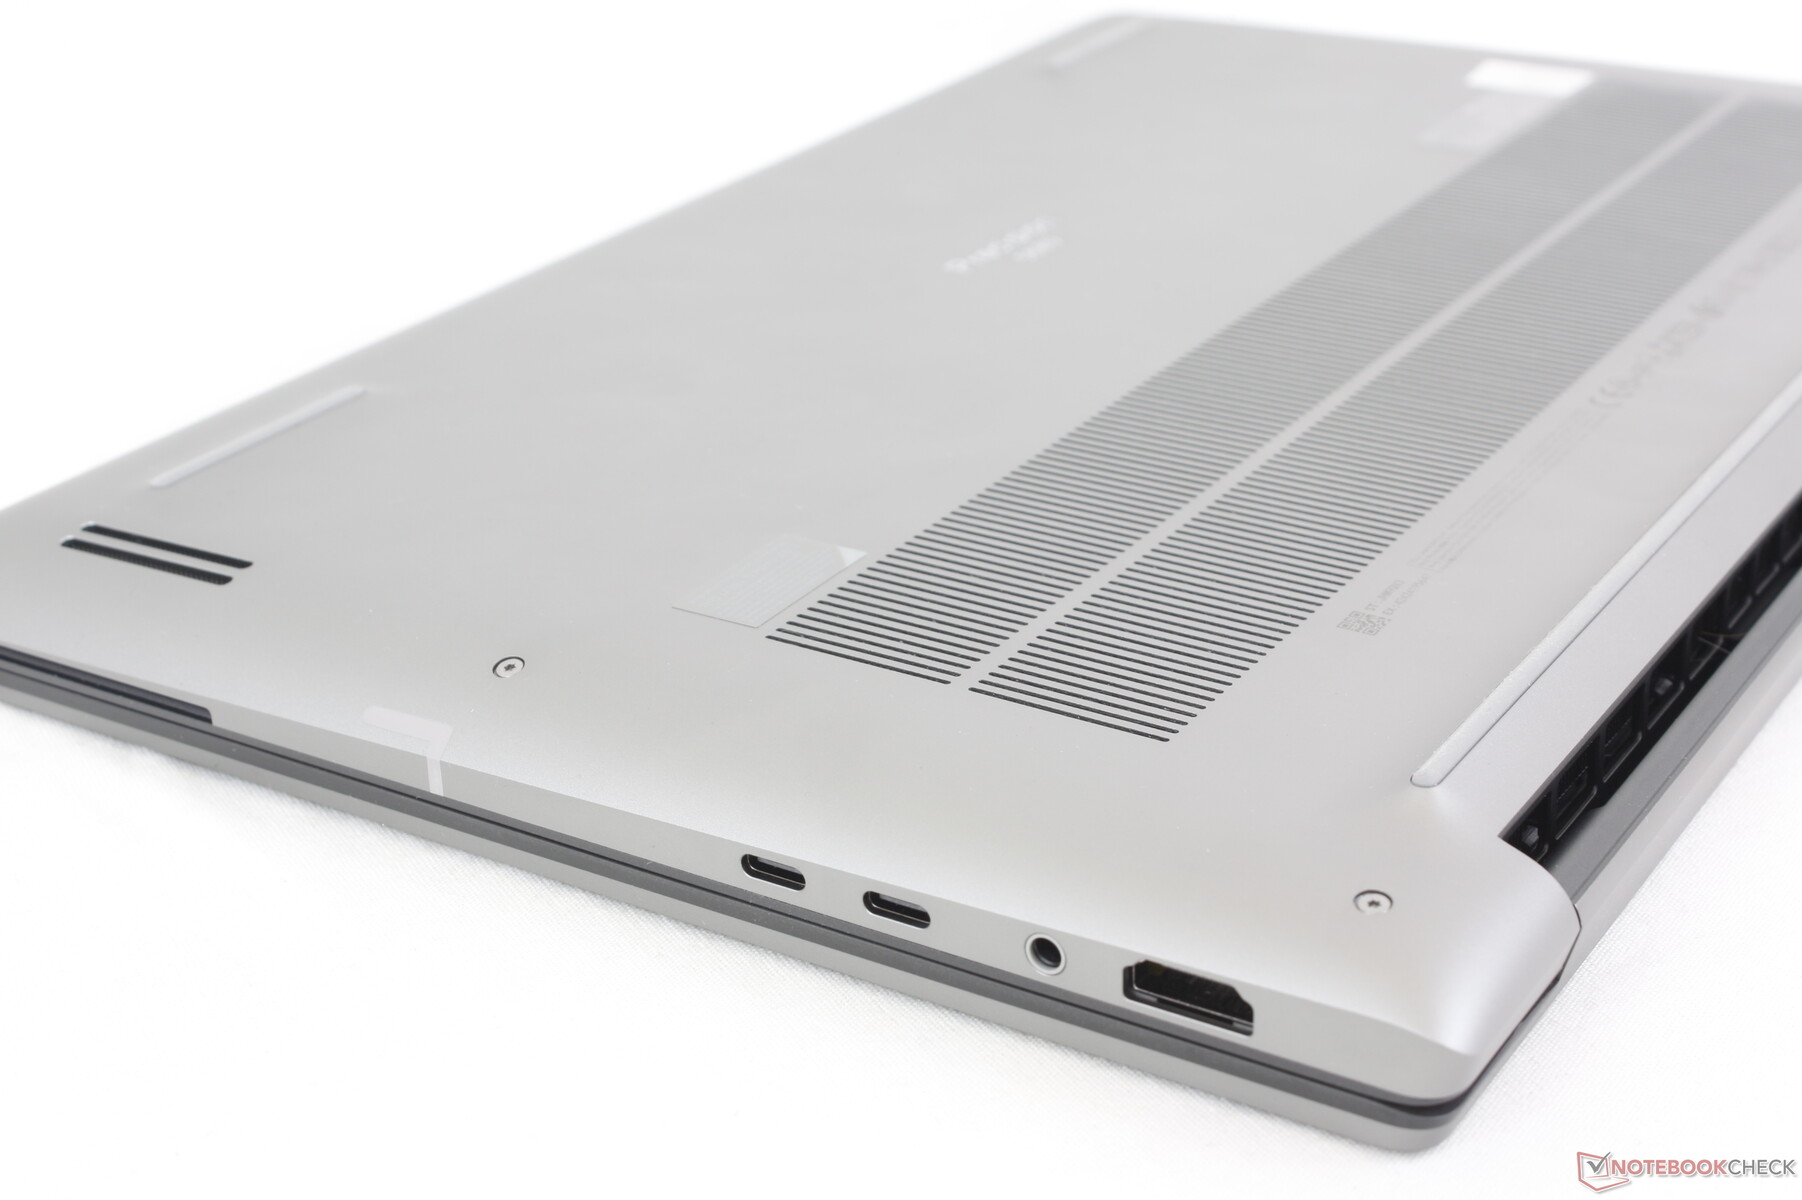
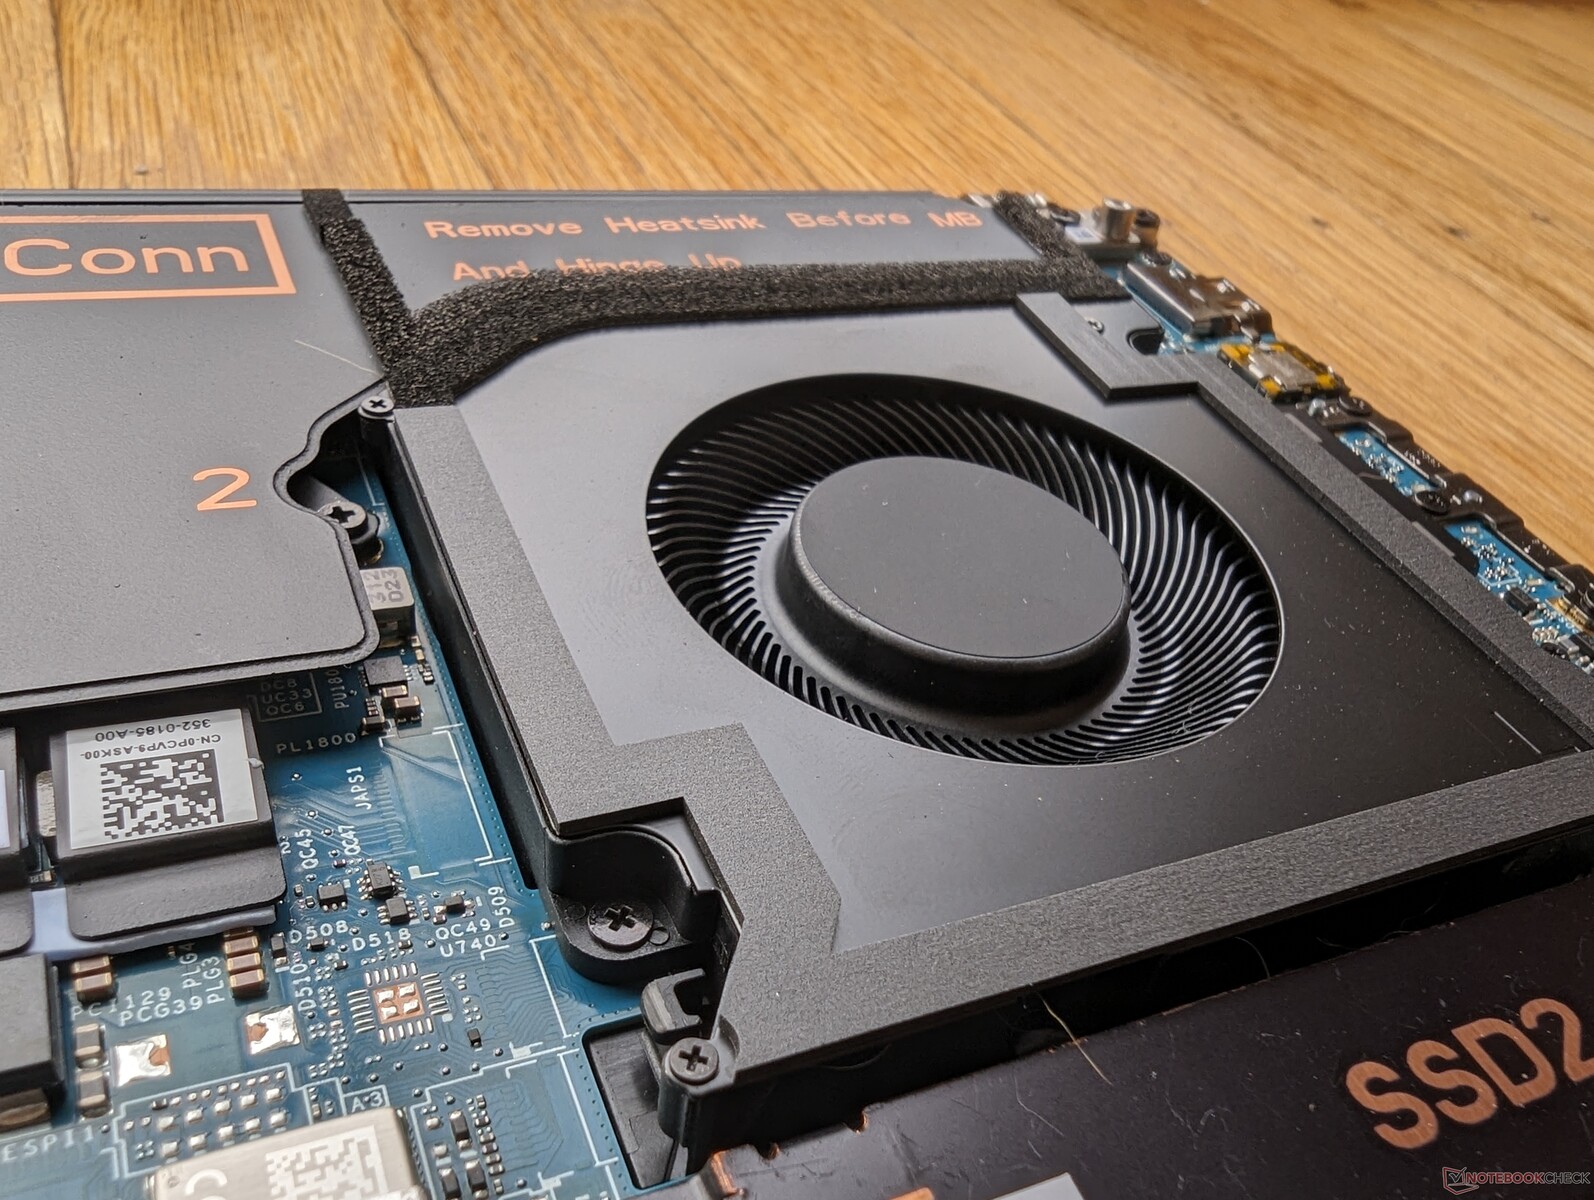
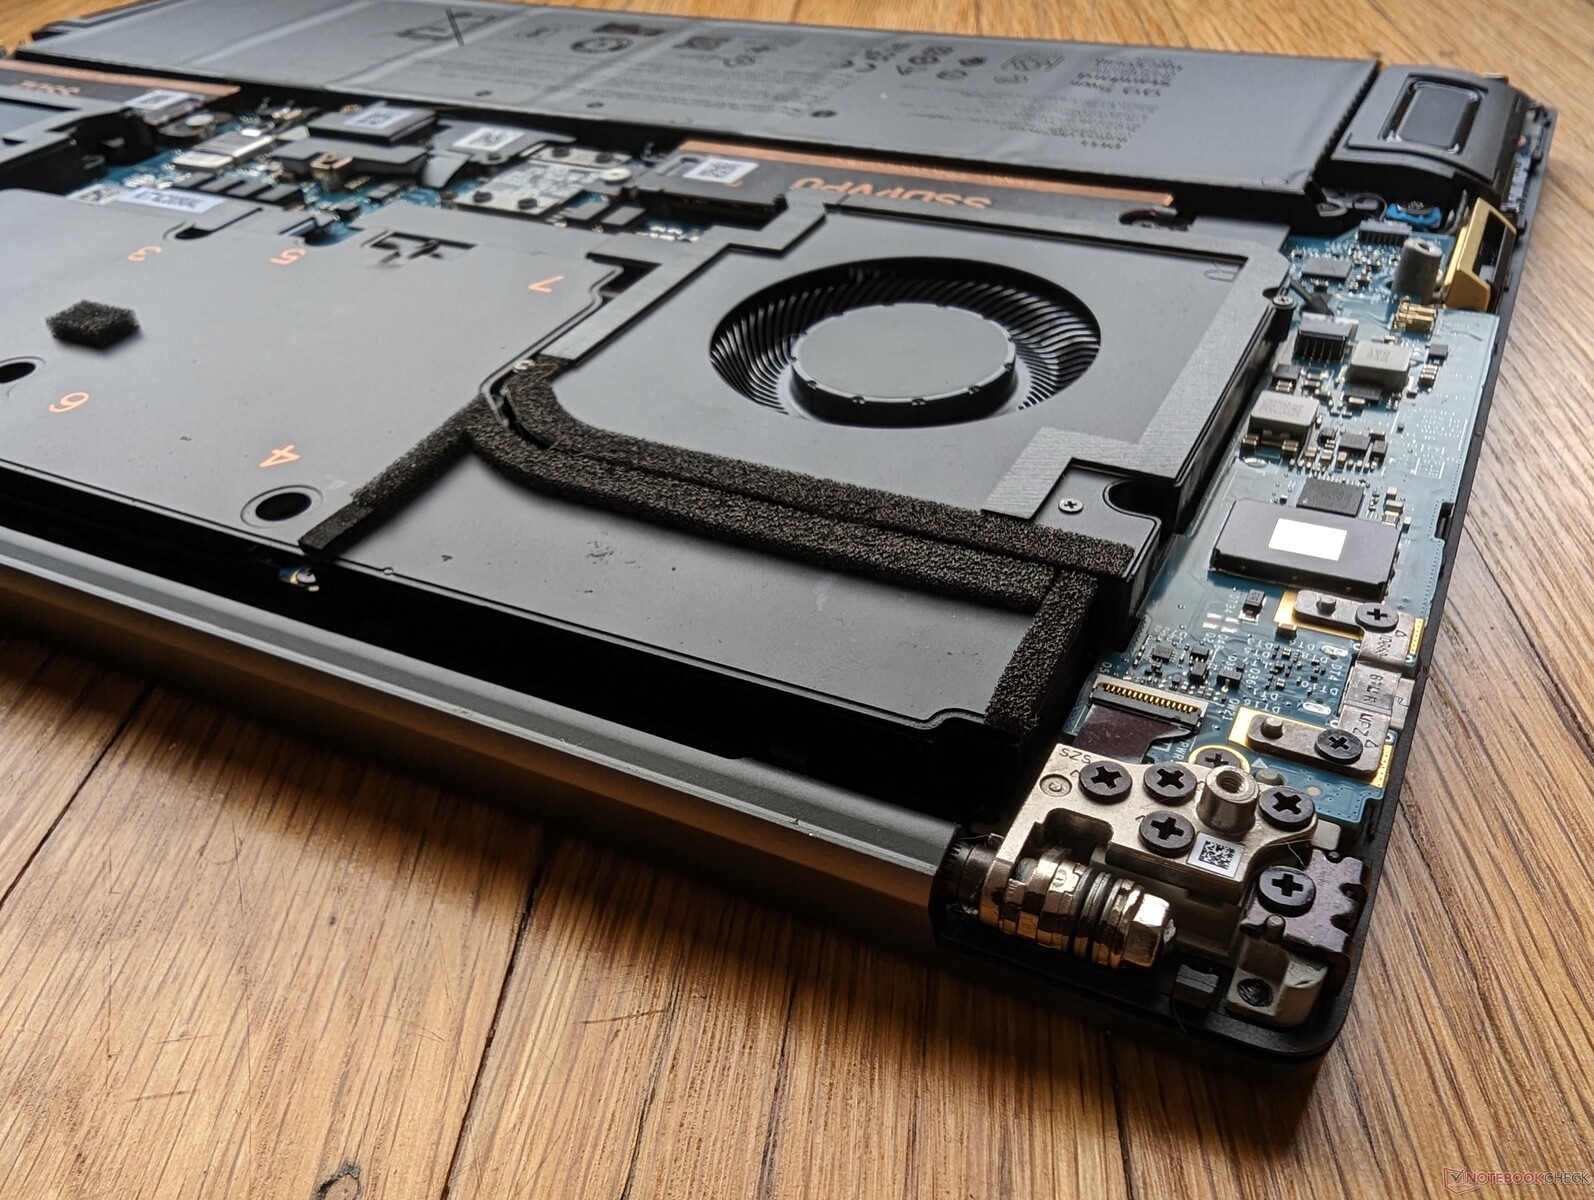
Onderhoud
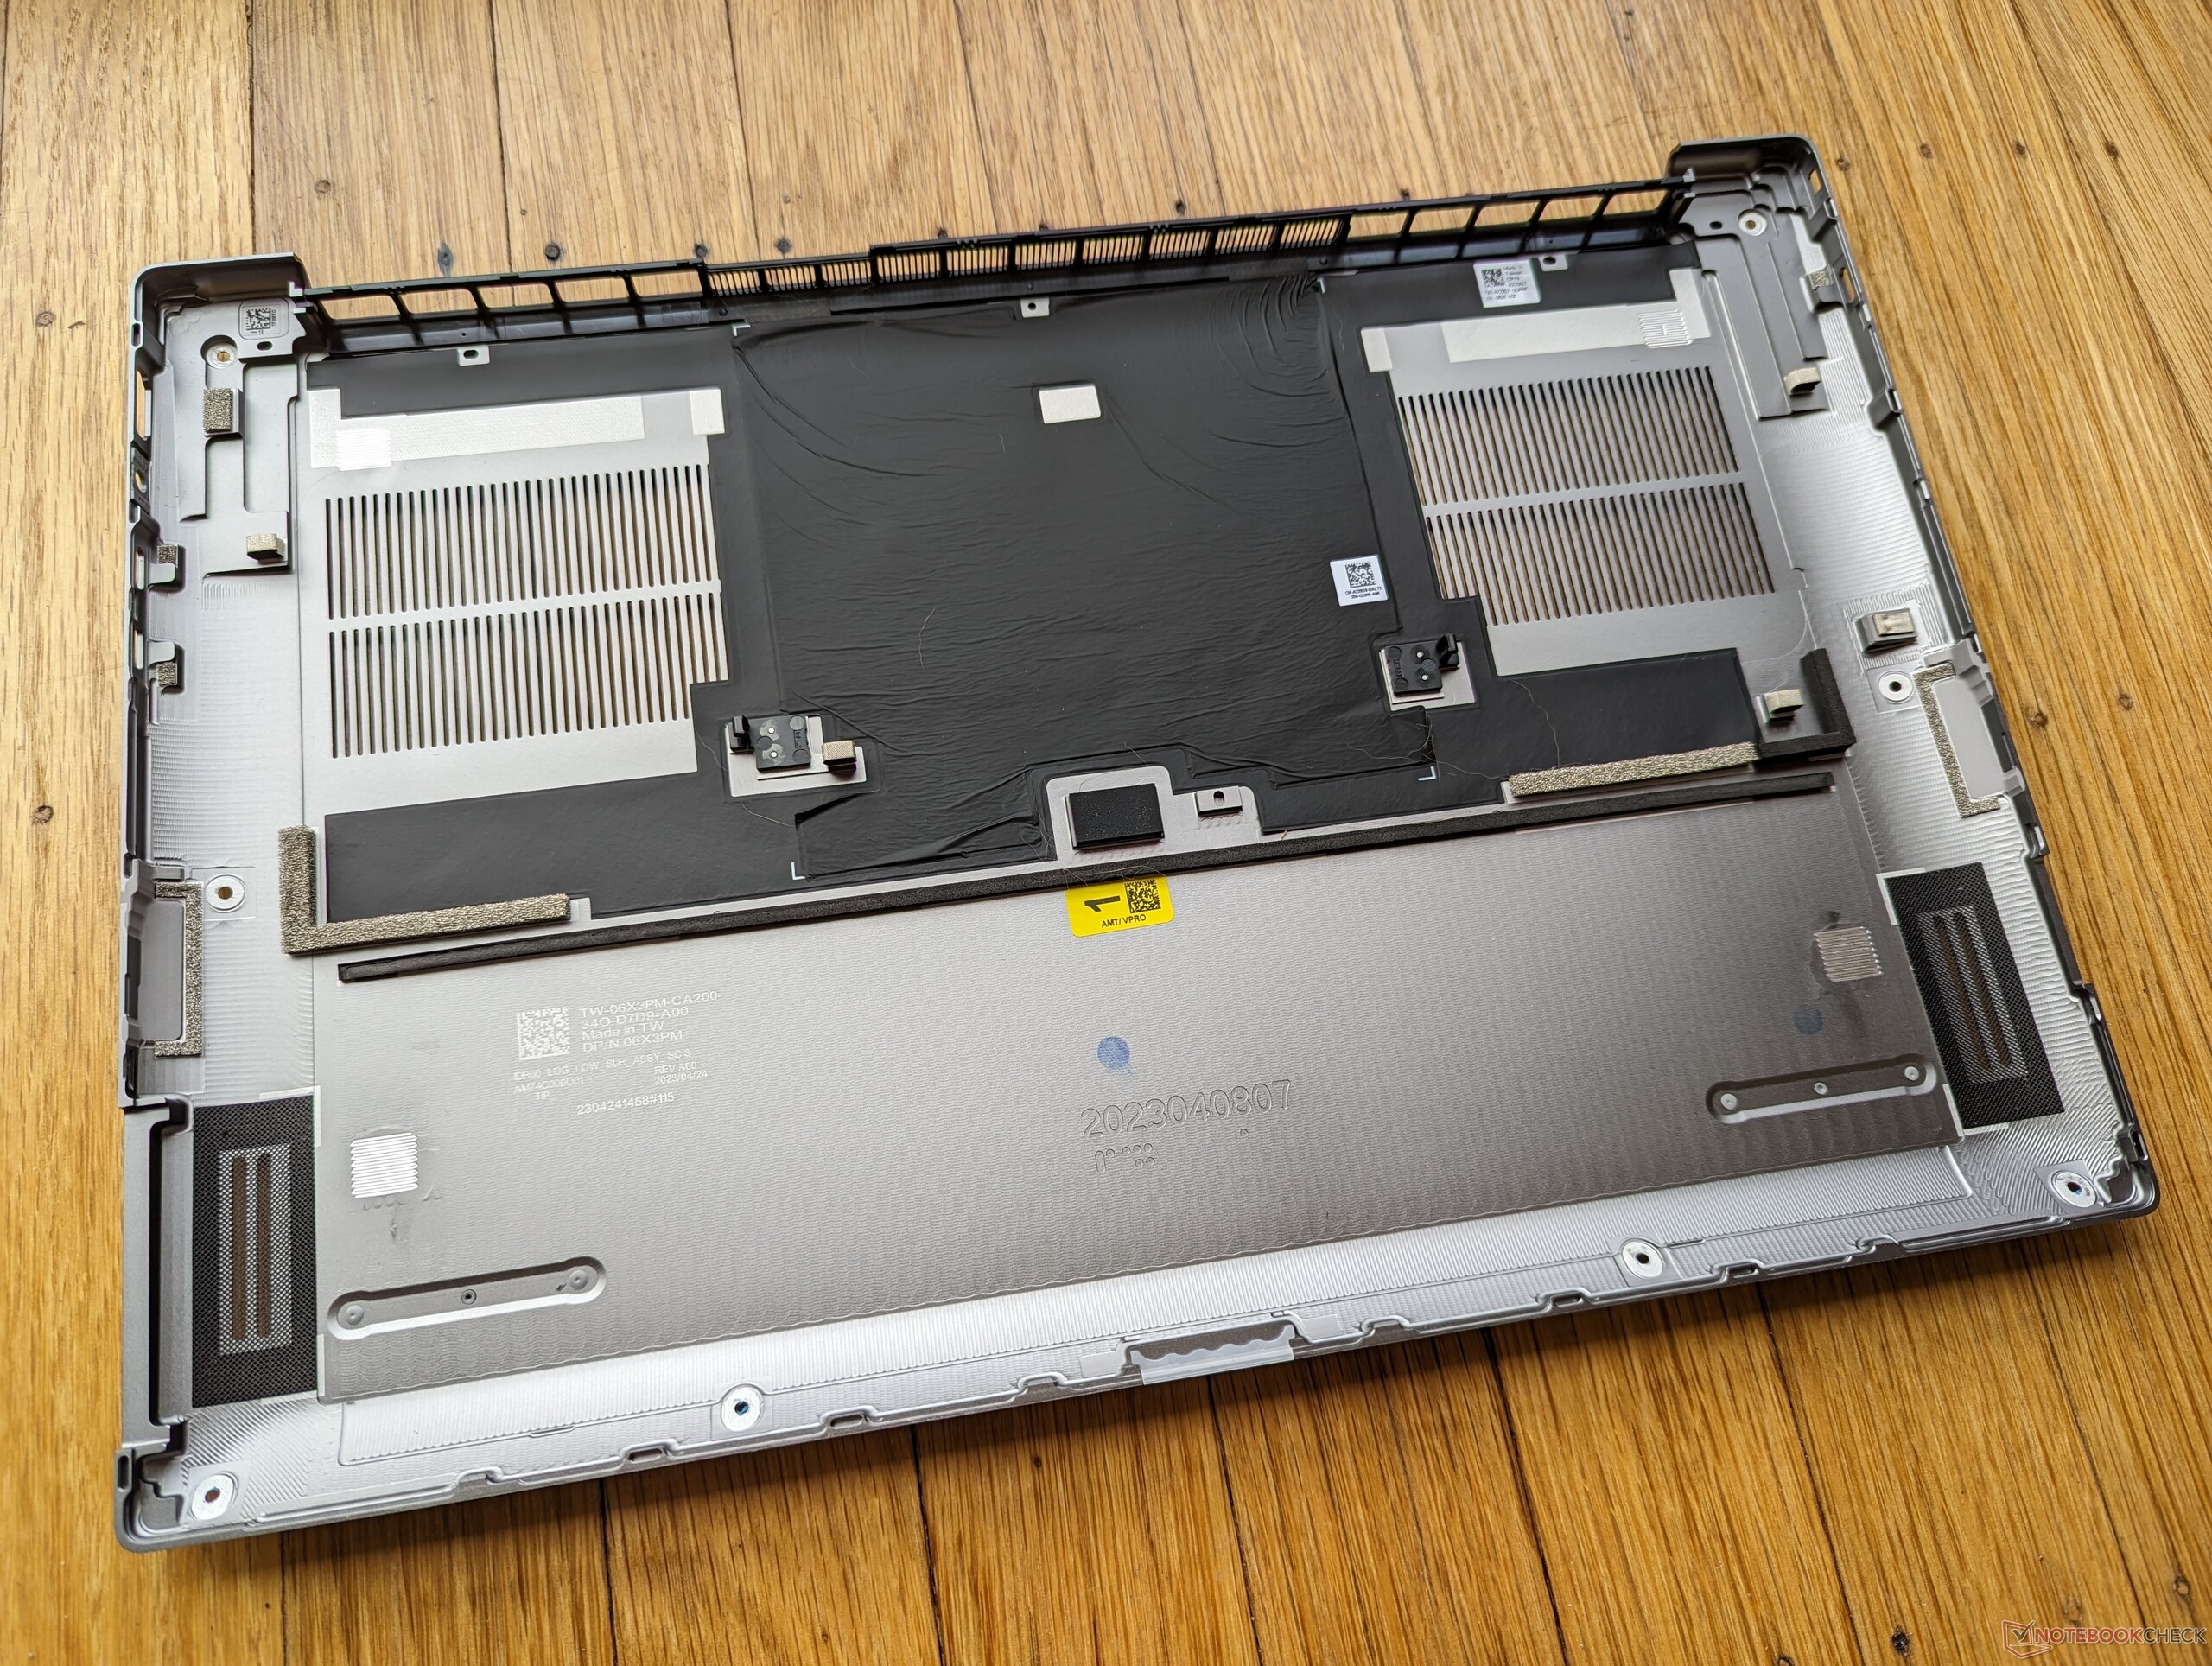
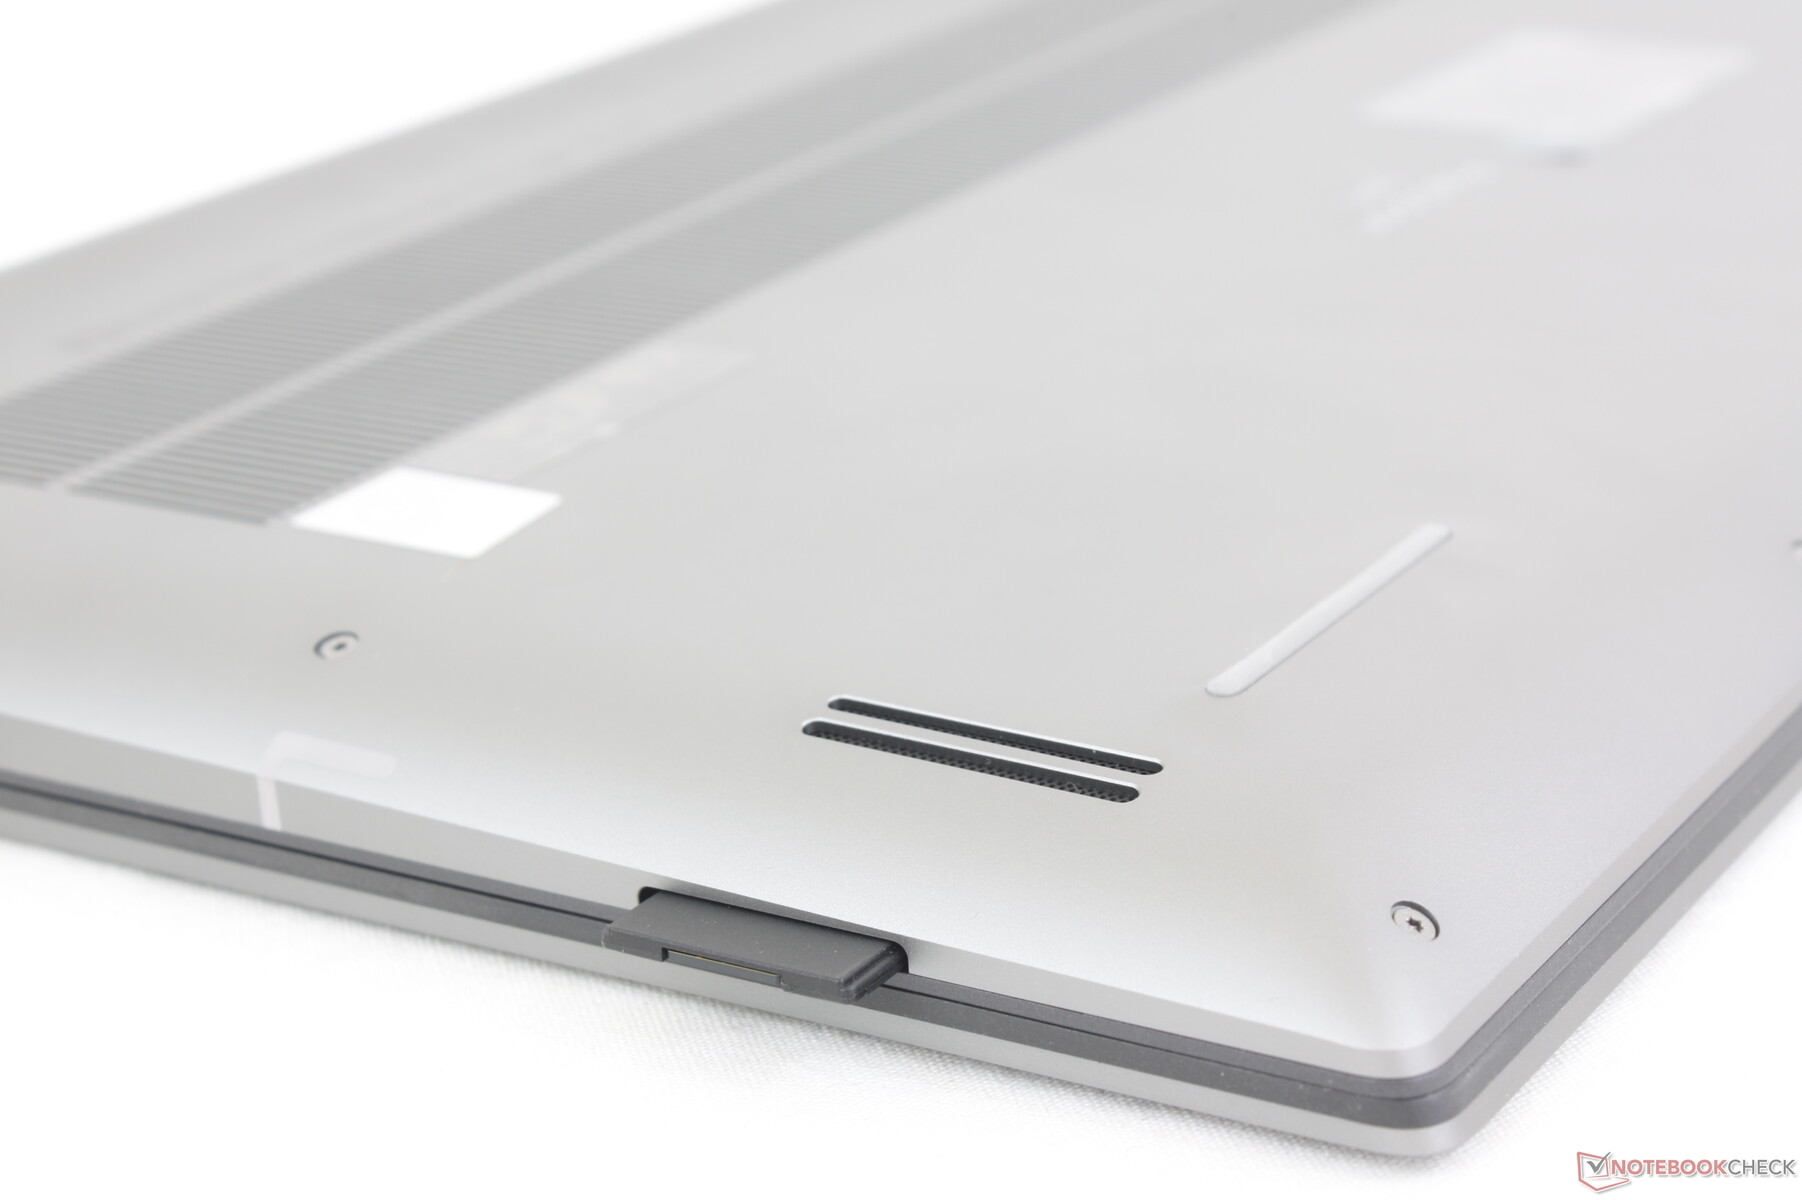
Het onderste paneel is iets moeilijker te verwijderen dan verwacht omdat de randen van de metalen plaat zowel scherp zijn als stevig vastzitten, net als op de XPS 15 of XPS 17. Een Torx-schroef en platte rand worden aanbevolen bij onderhoud aan het systeem.
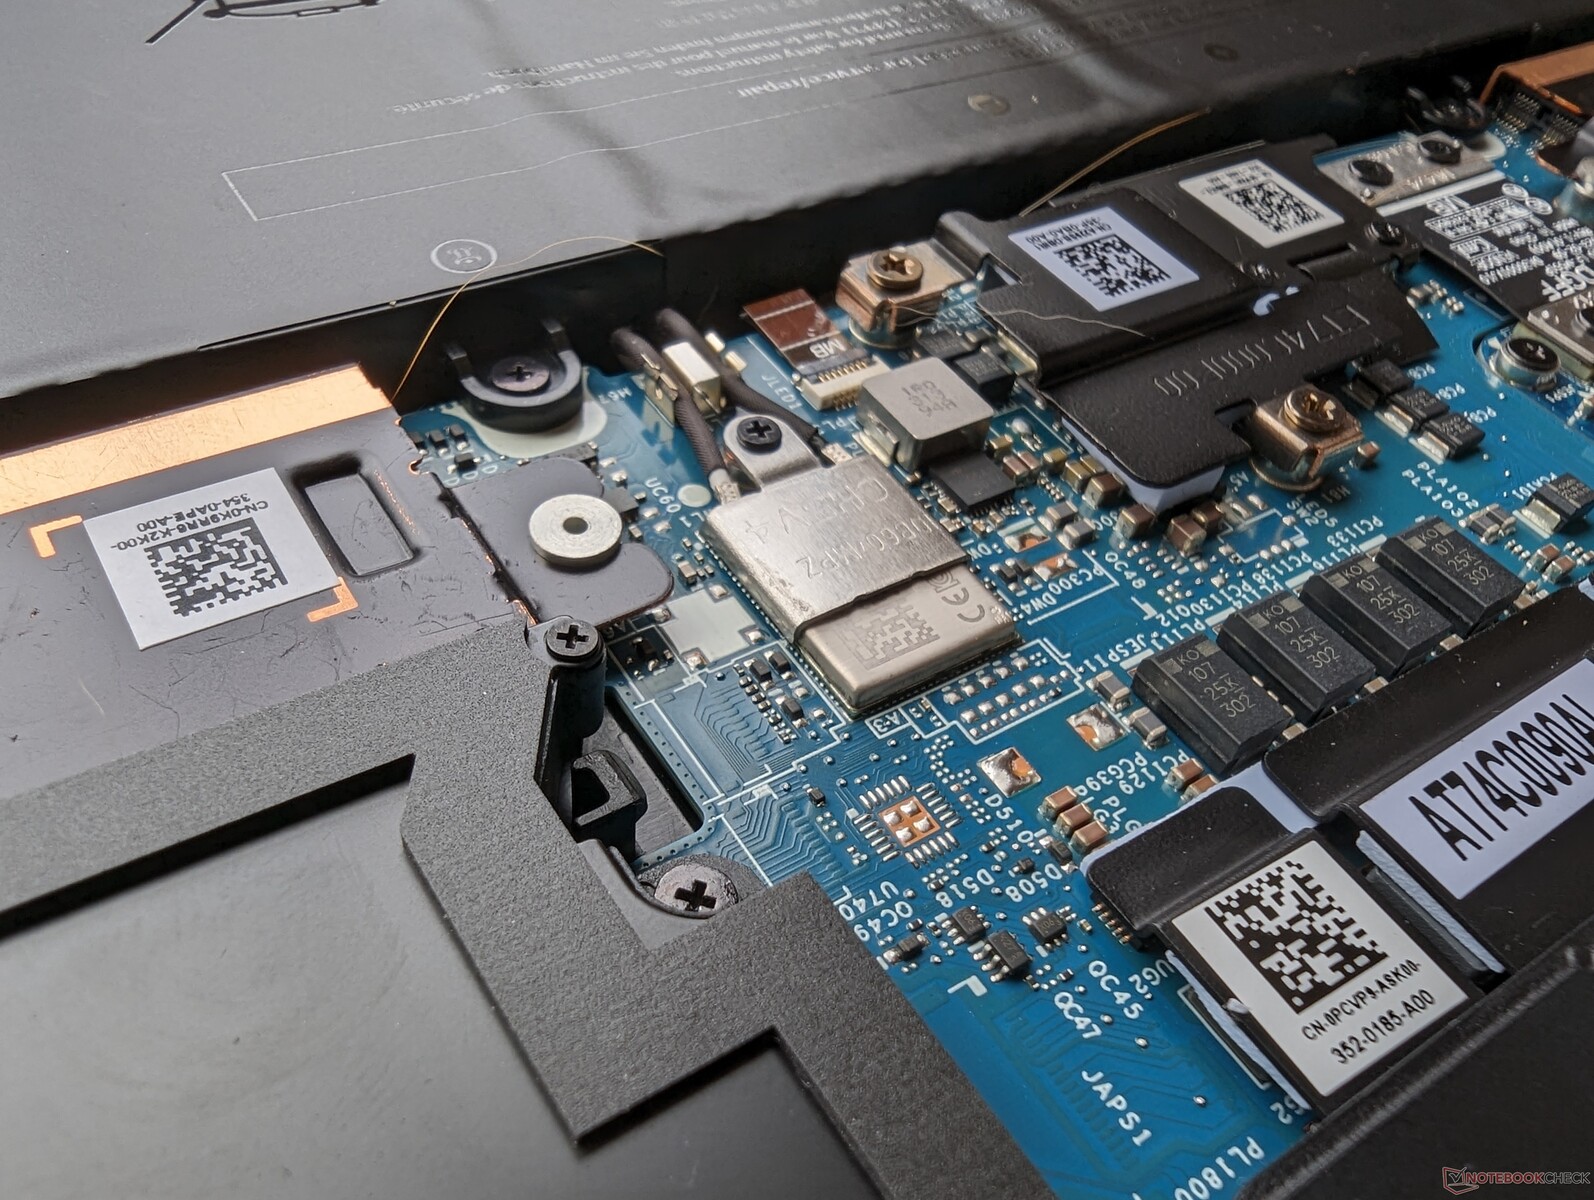
Zowel de WLAN- als RAM-modules zijn gesoldeerd, in tegenstelling tot de meeste andere werkstations met dit schermformaat. Zowel de sterk geïntegreerde modules als de beperkte poortopties zijn waarschijnlijk nadelen voor het verder slanke ontwerp en het relatief lage gewicht.

Accessoires en garantie
De verkoopverpakking bevat een kleine USB-C naar USB-A adapter om te compenseren voor het feit dat er geen full-size USB-poorten op het systeem zitten.
Bij aankoop in de VS geldt een beperkte fabrieksgarantie van drie jaar met reparatie ter plaatse.
Invoerapparaten - iets anders dan XPS
Toetsenbord
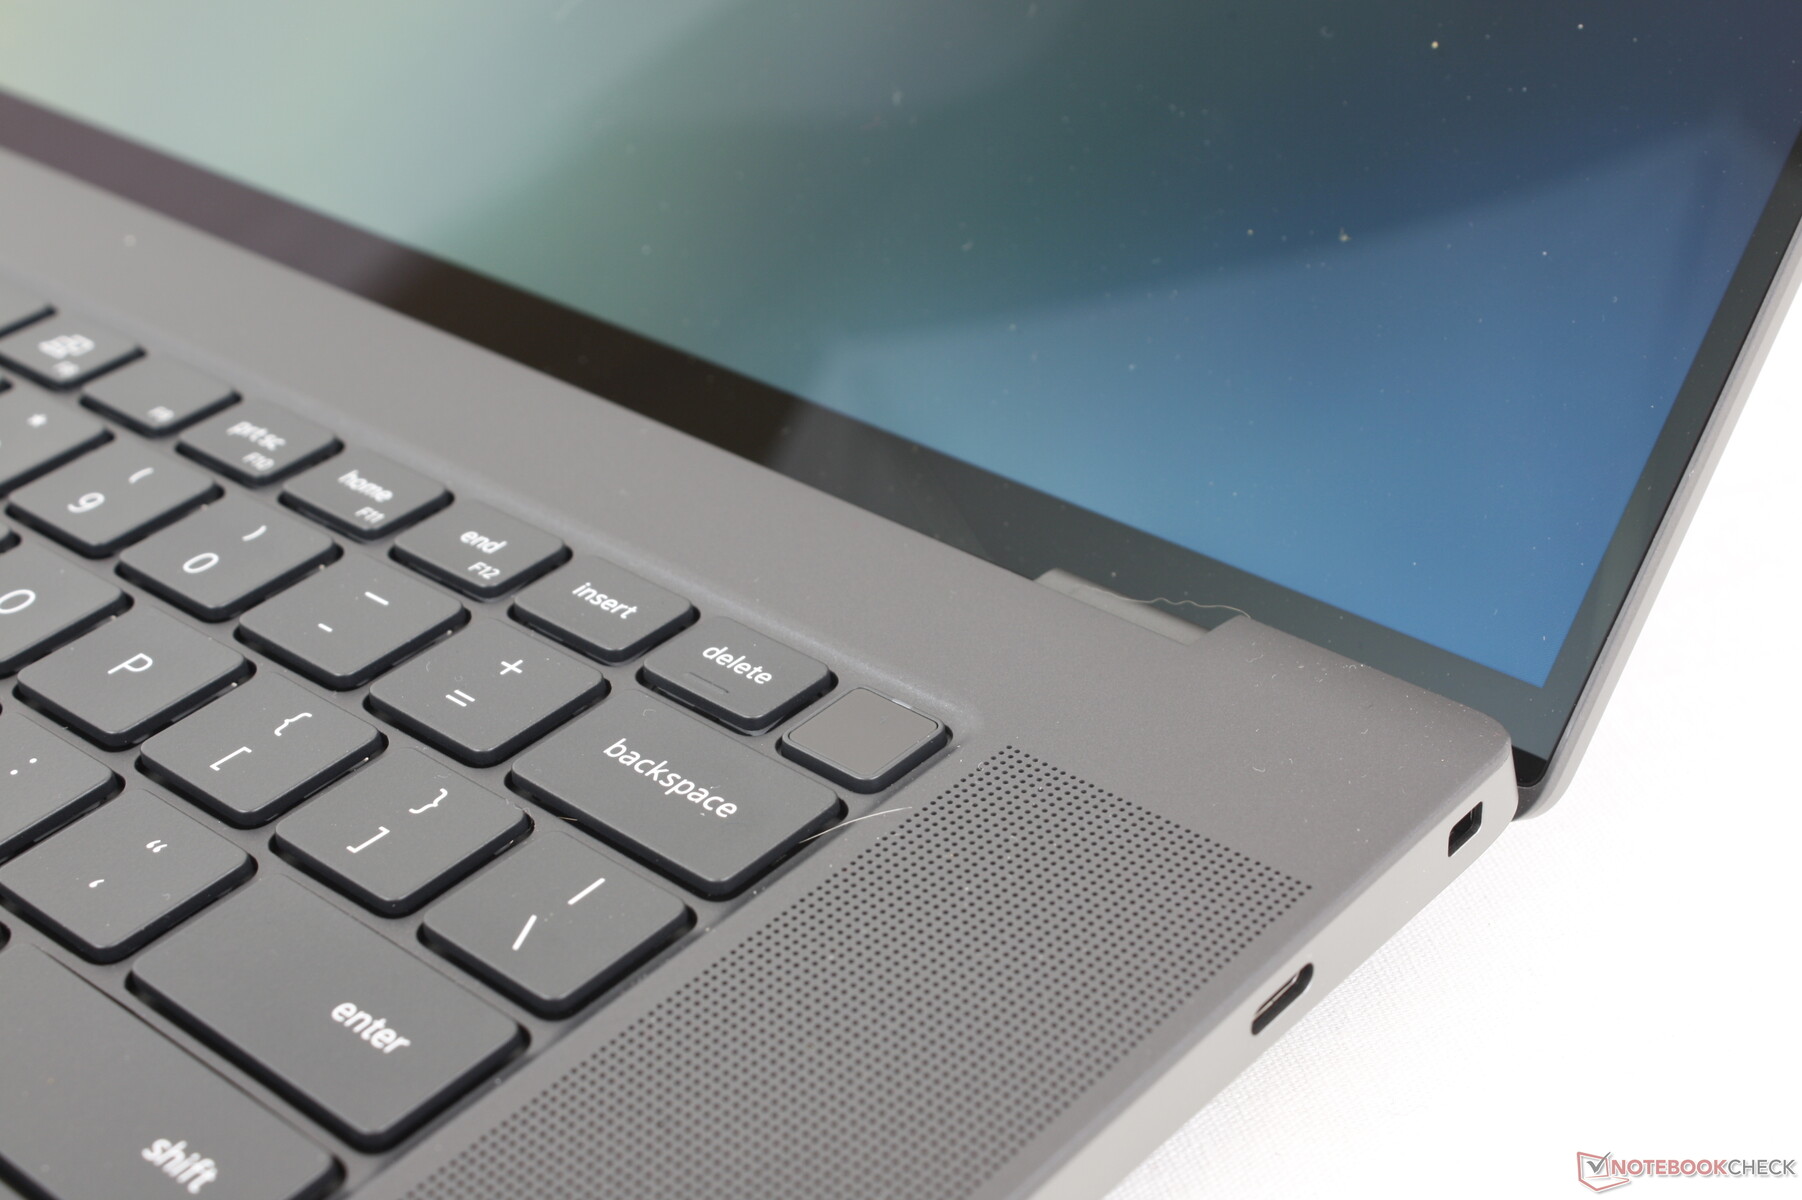
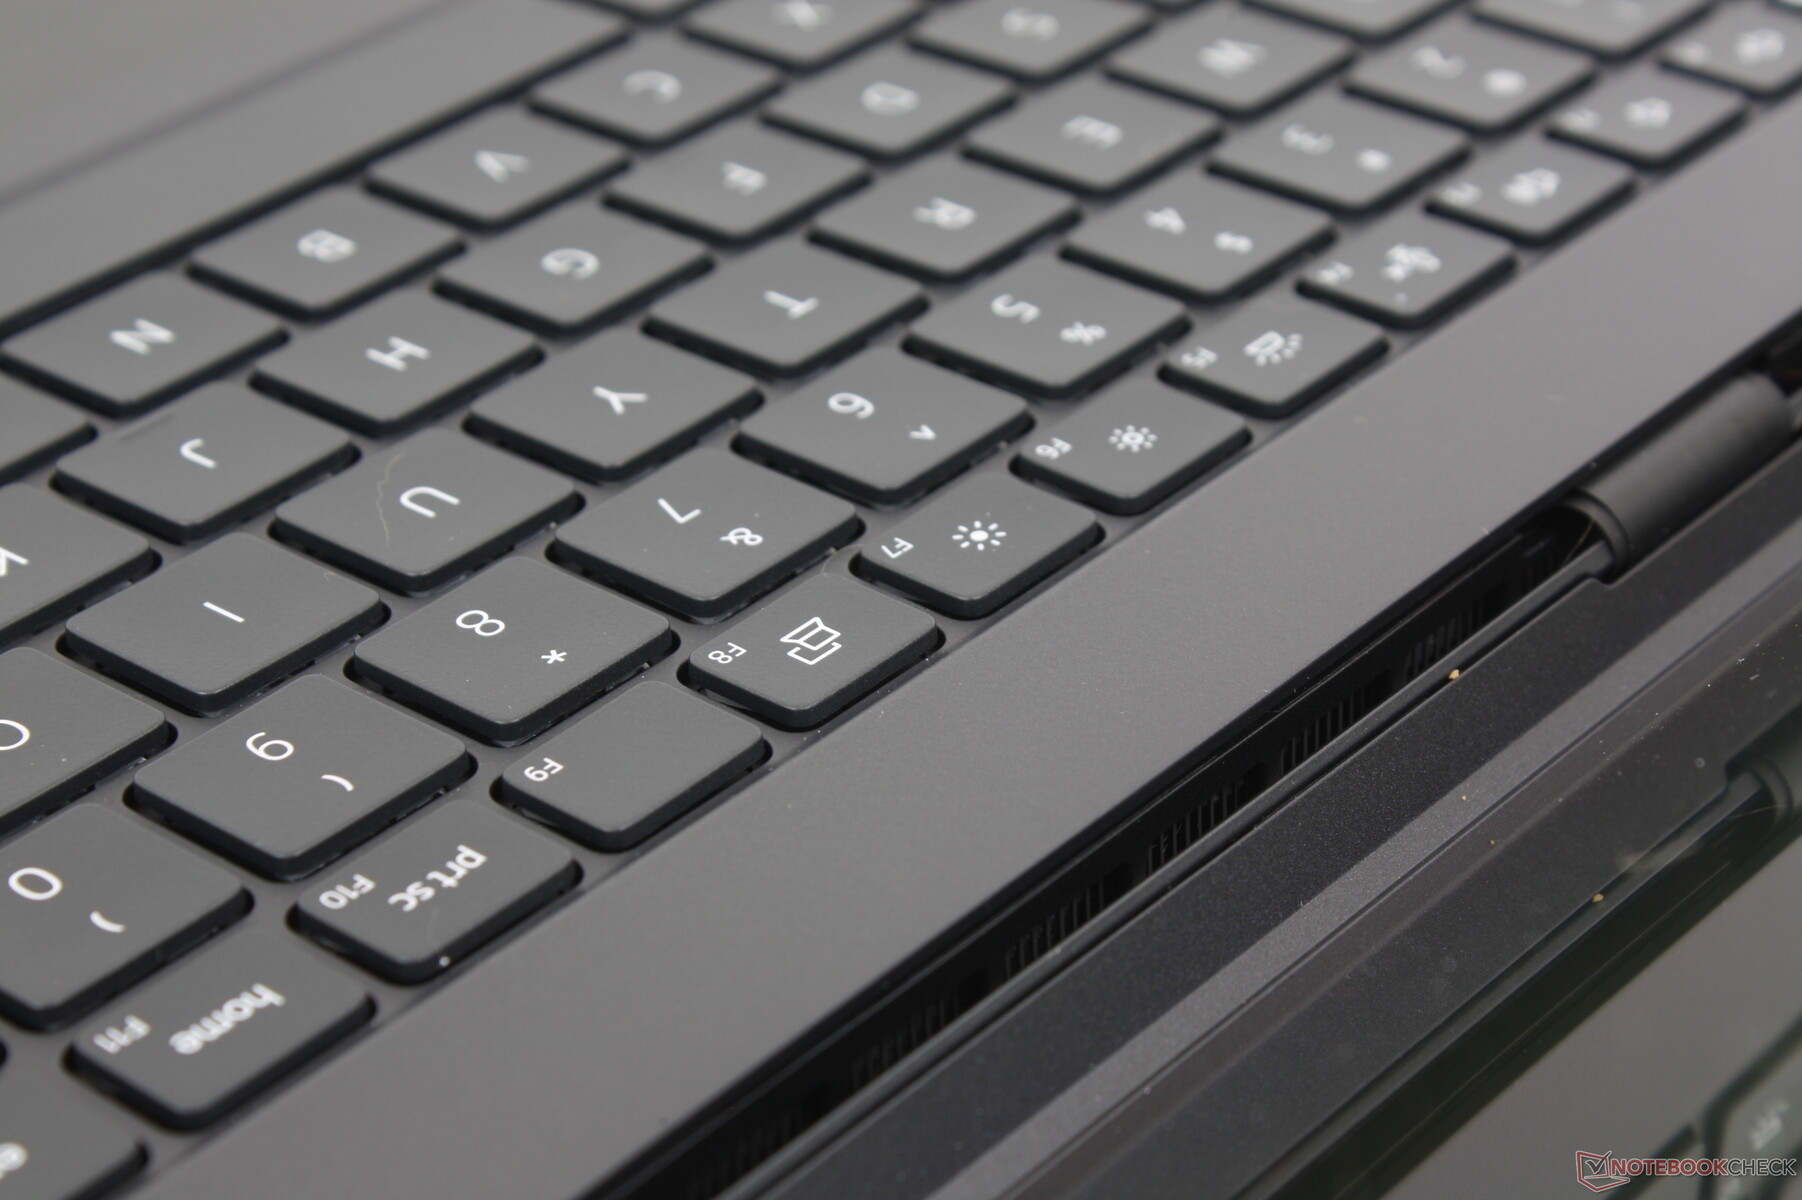
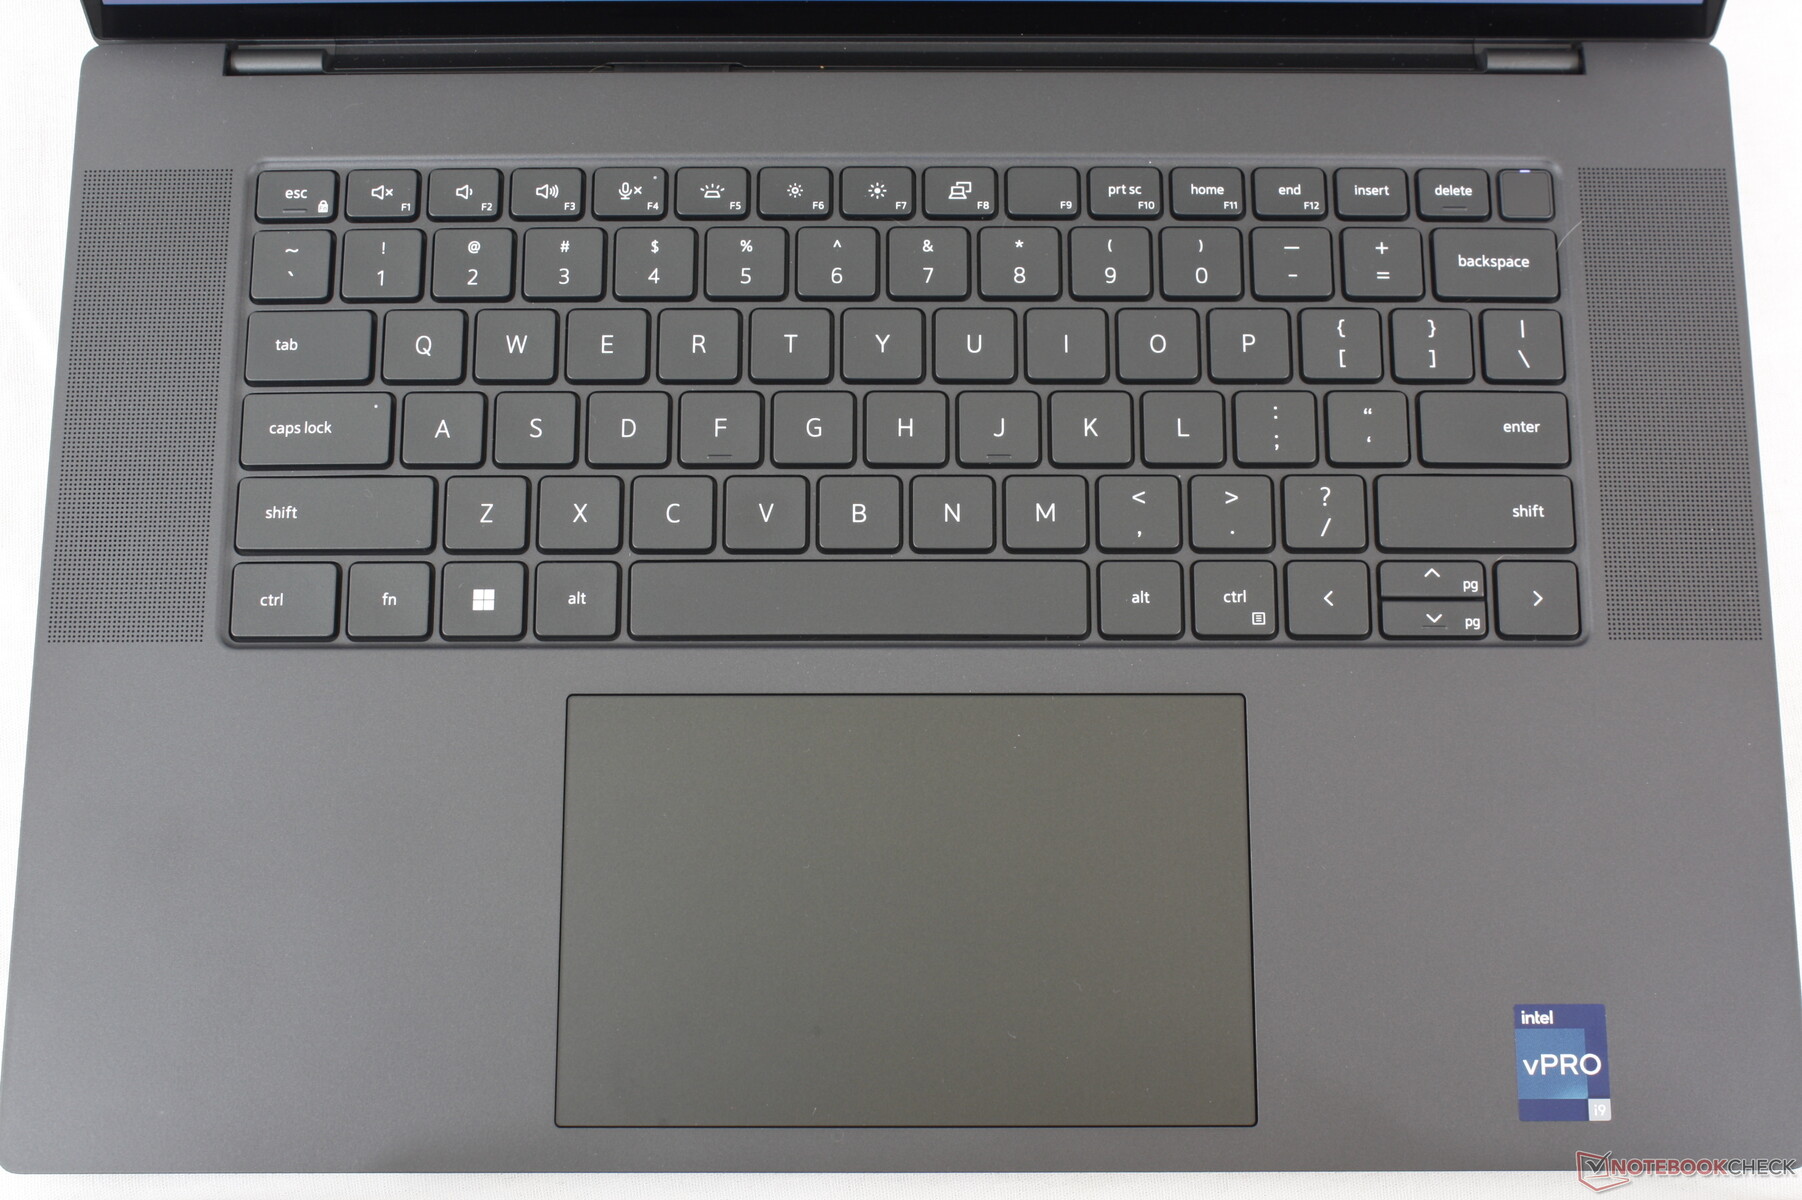
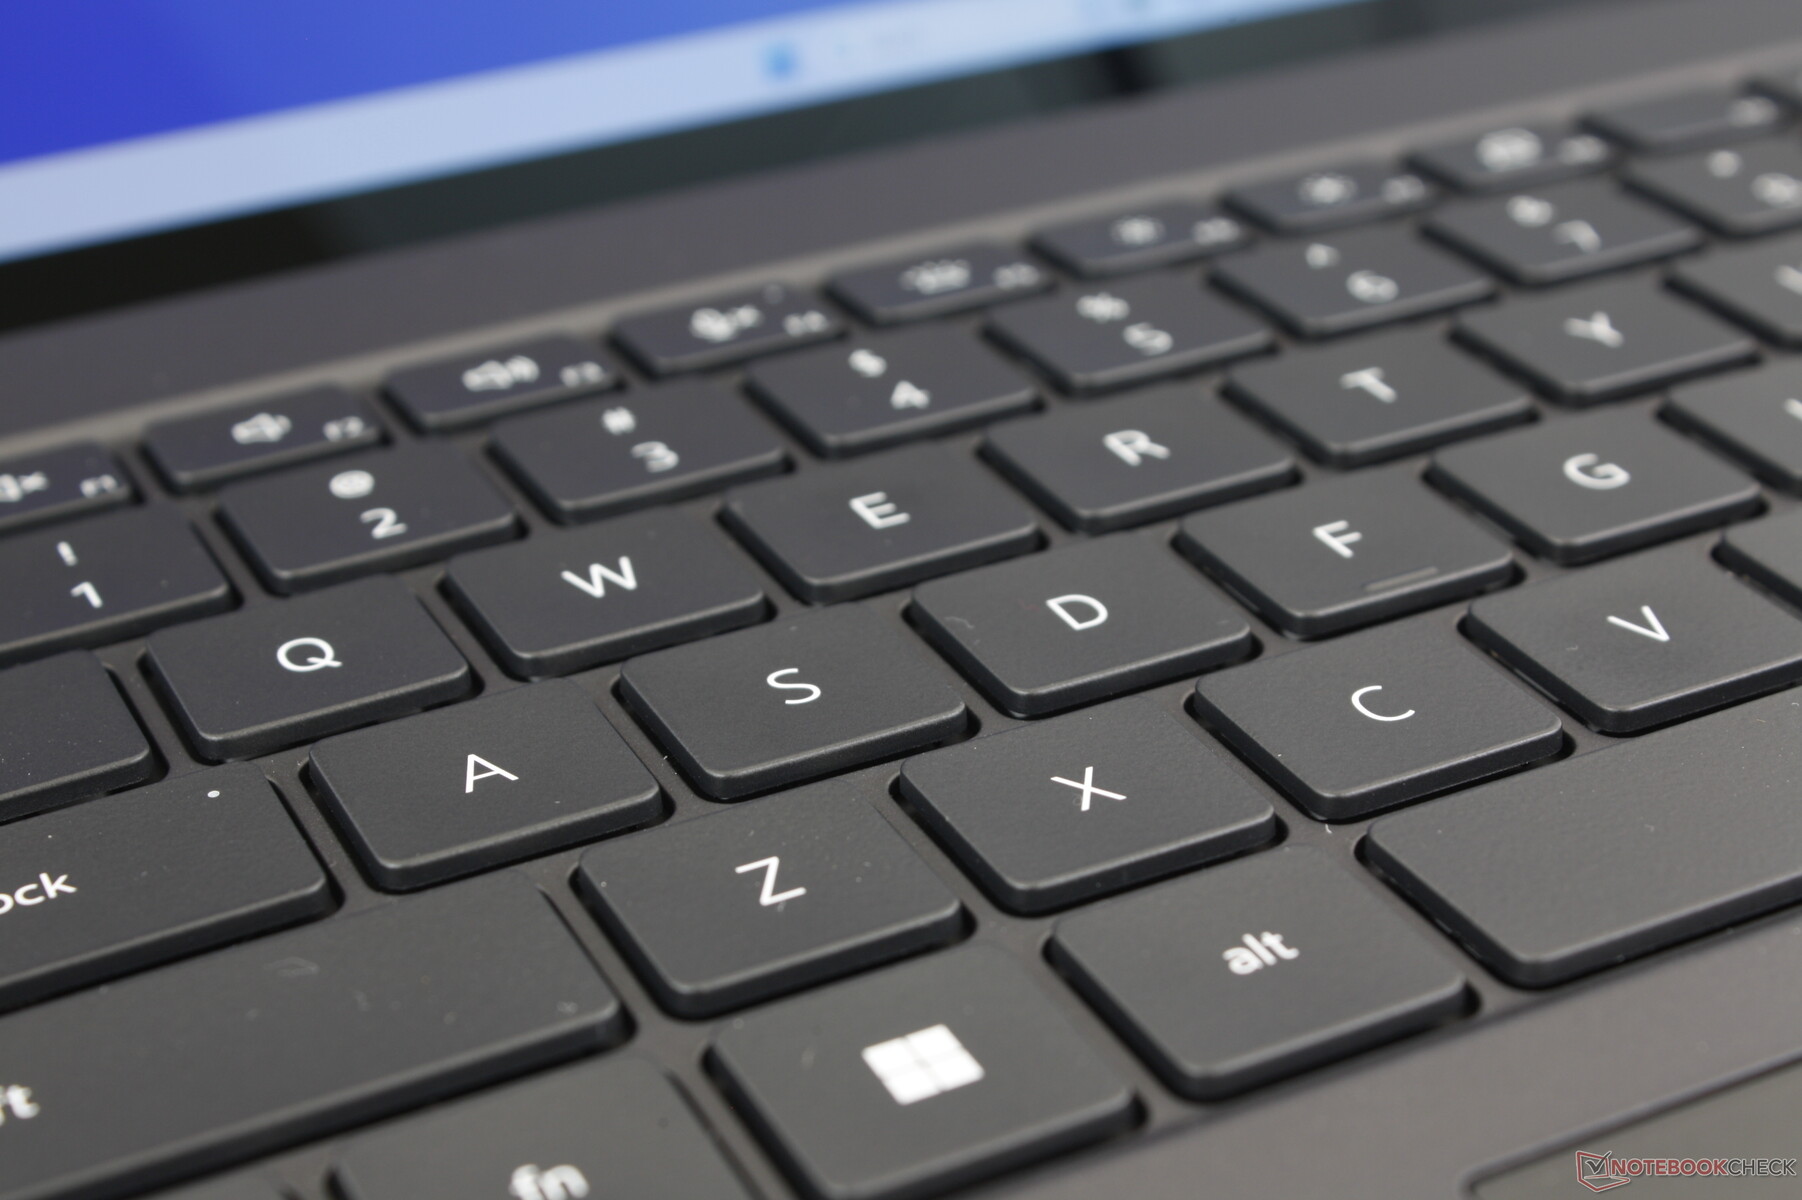
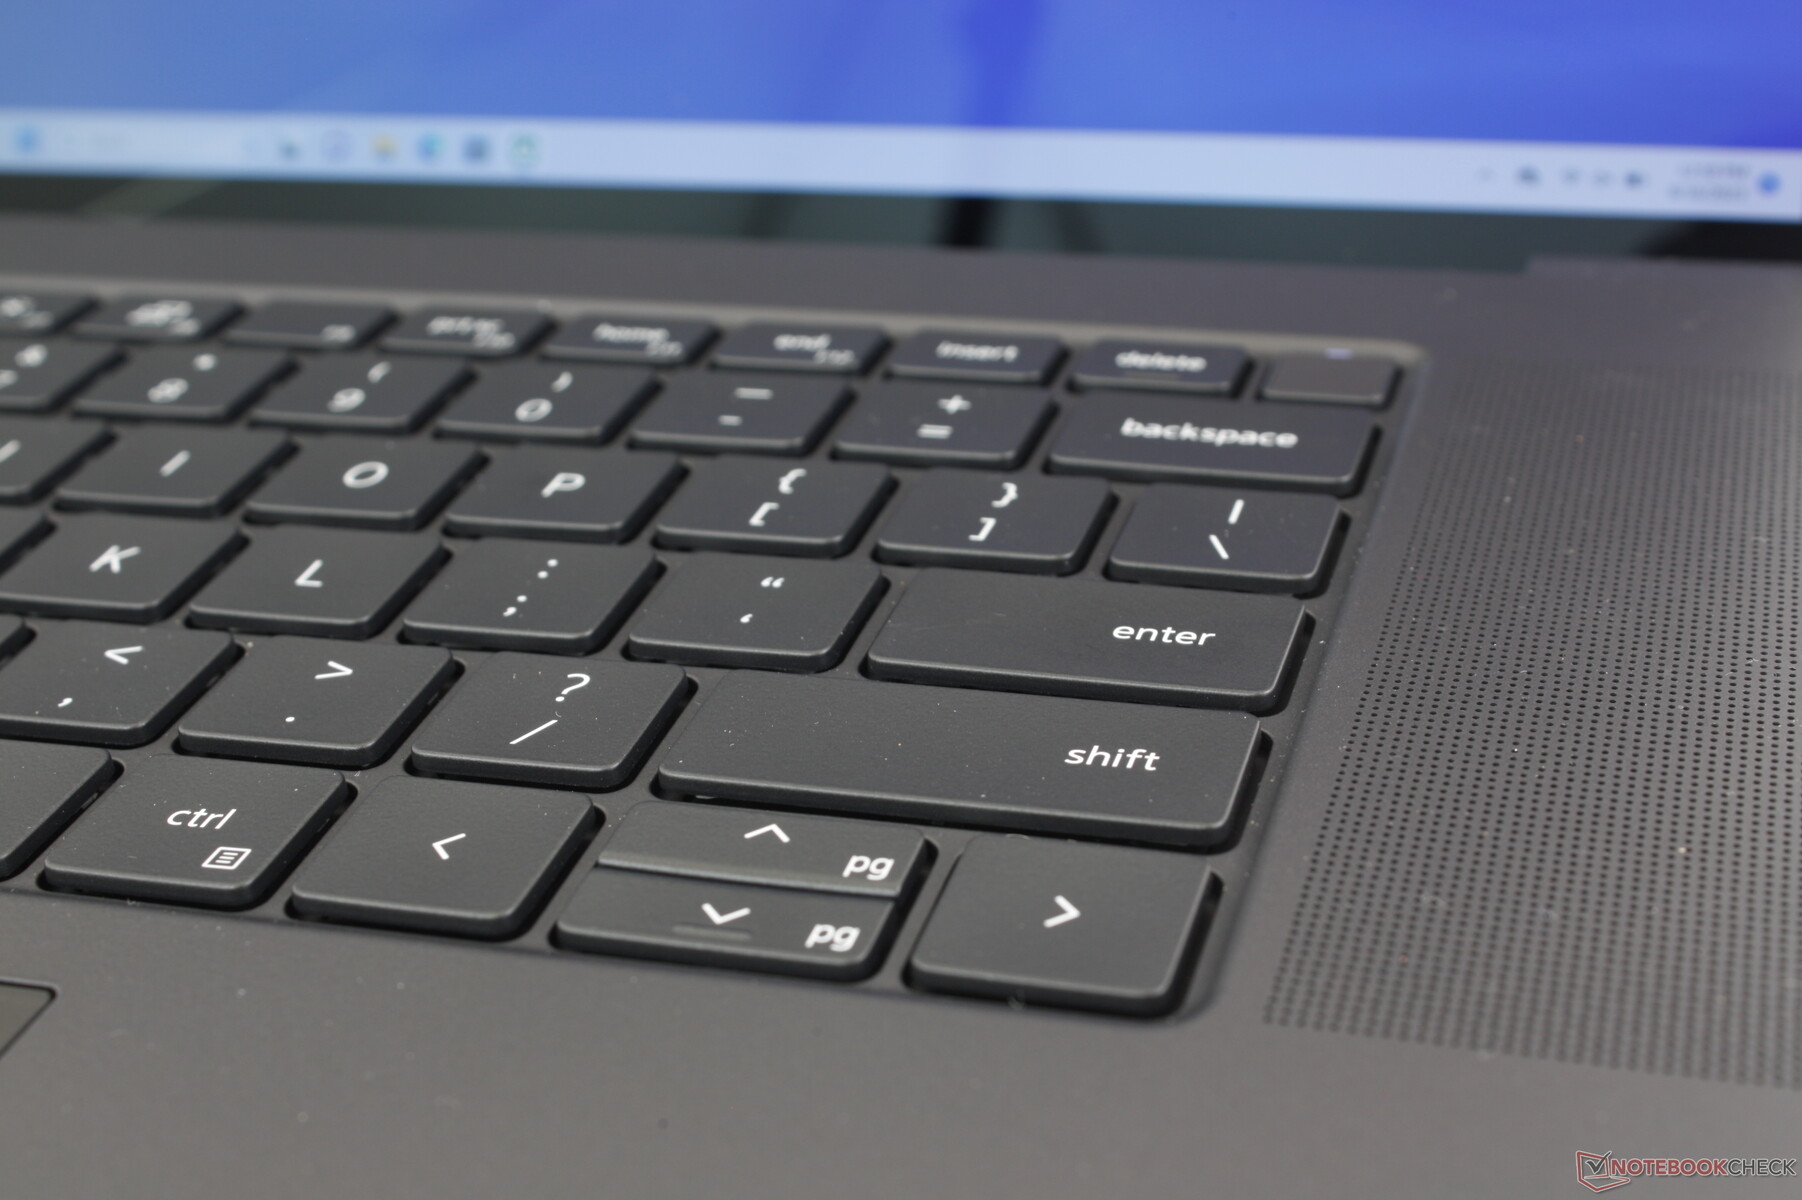
Het toetsenbord lijkt op het eerste gezicht misschien identiek aan de toetsenborden van de XPS 15 of Precision 5550, maar er zijn een paar belangrijke veranderingen. Ten eerste is de bovenste rij functietoetsen nu groter omdat sommige XPS 15-bezitters hebben geklaagd dat ze te smal zijn. En ten tweede zijn een paar toetsen langs de randen nu iets korter, waaronder de Backspace-, Enter-, Shift-, Tab-, Ctrl- en Shift-toetsen. De type-ervaring blijft verder hetzelfde voor een vertrouwd XPS-gevoel.
Touchpad
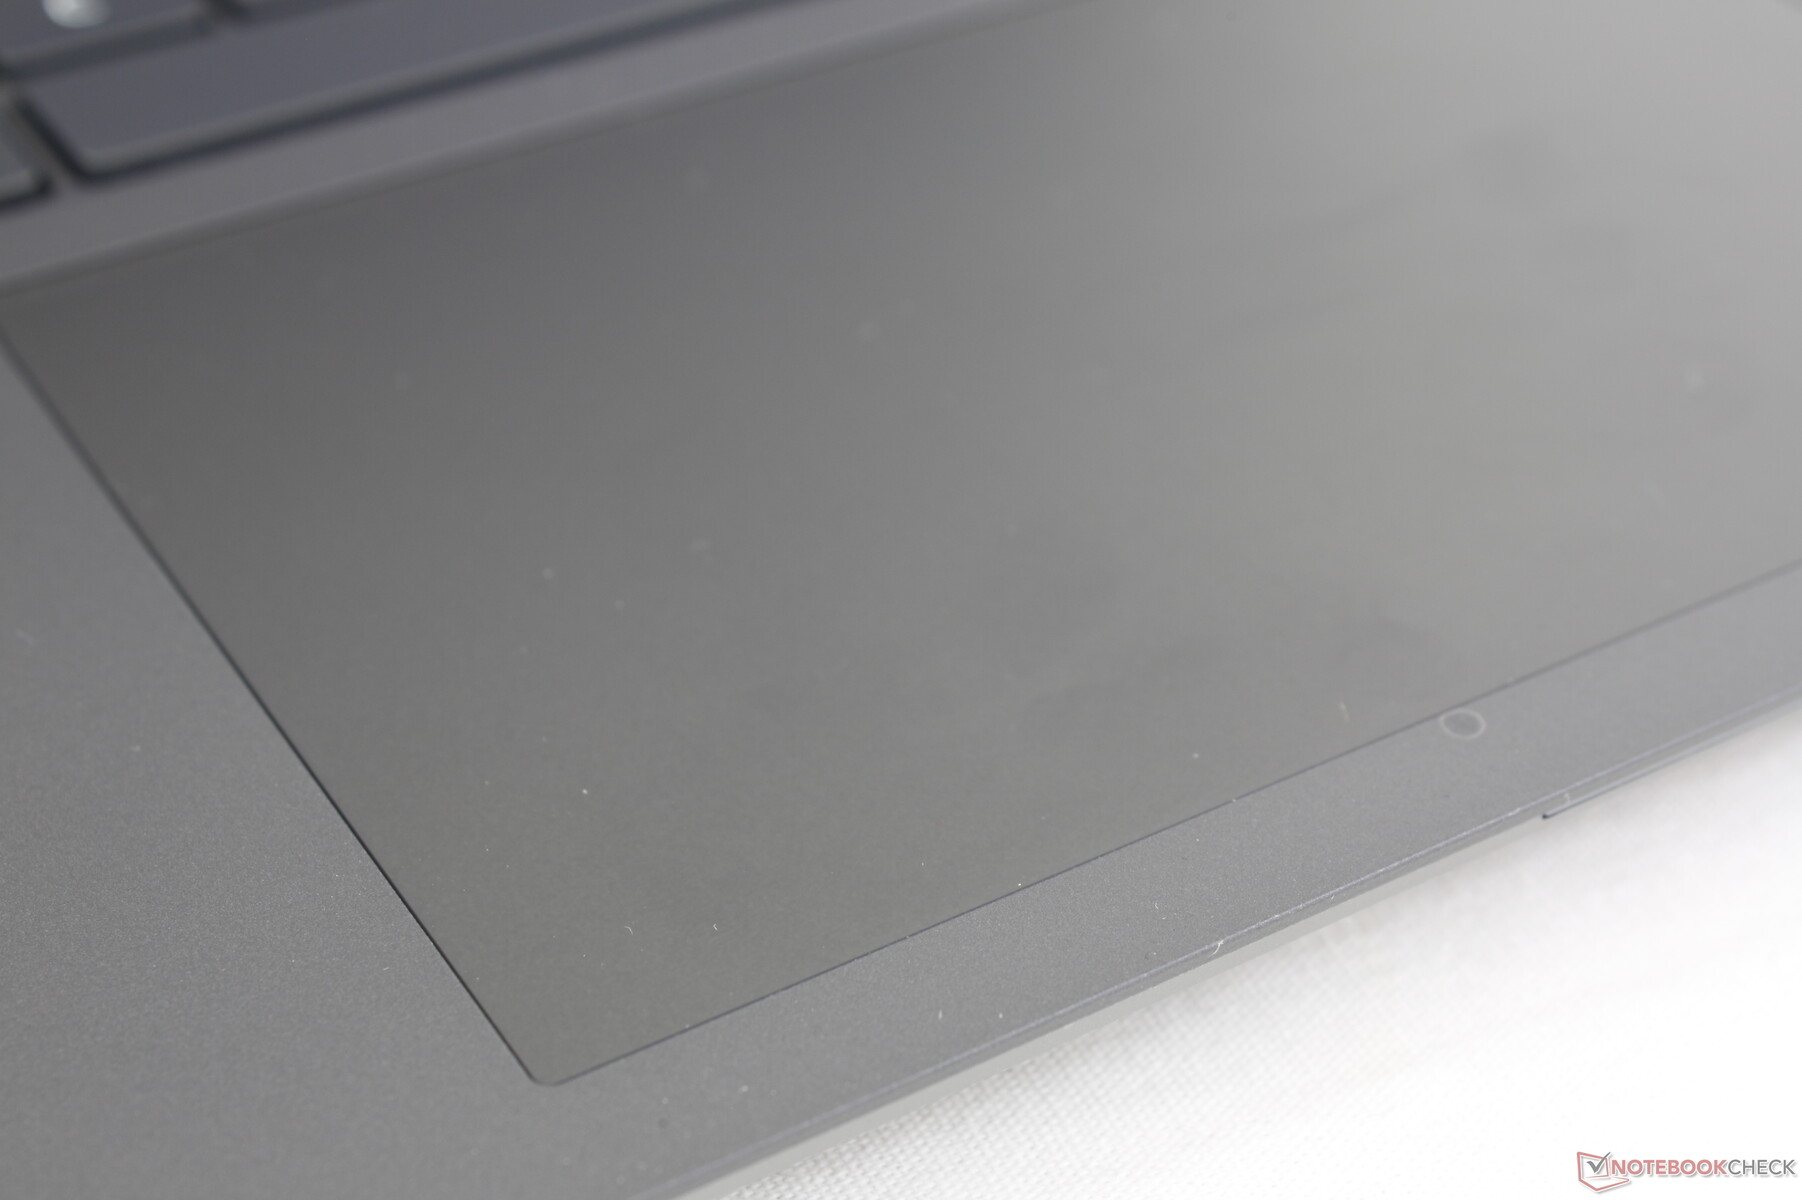
Het clickpad is eigenlijk kleiner dan het clickpad op de 15-inch Precision 5550 (13,7 x 8,5 cm vs. 15,1 x 9 cm), ondanks ons grotere schermformaat. Desondanks voelt het nog steeds ruim aan met soepele en betrouwbare glijeigenschappen, net als op een XPS 15.
Helaas is de feedback bij het klikken op het haptische clickpad bijna onbestaande. In feite is er bijna geen verplaatsing of hoorbare feedback. Een muis wordt sterk aangeraden voor nauwkeurigere sleep-en neerzet acties.
Weergave
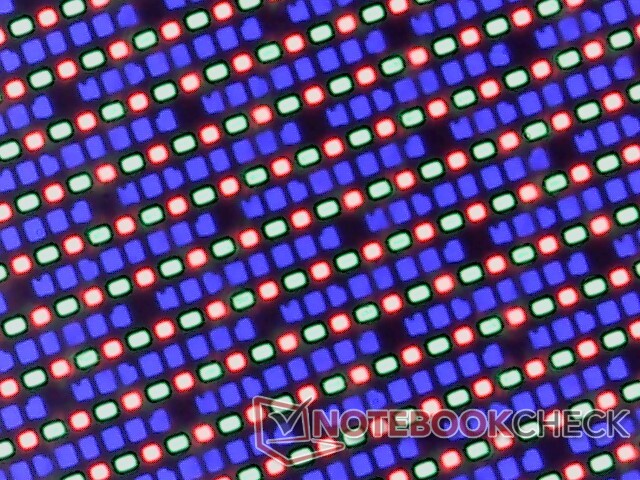
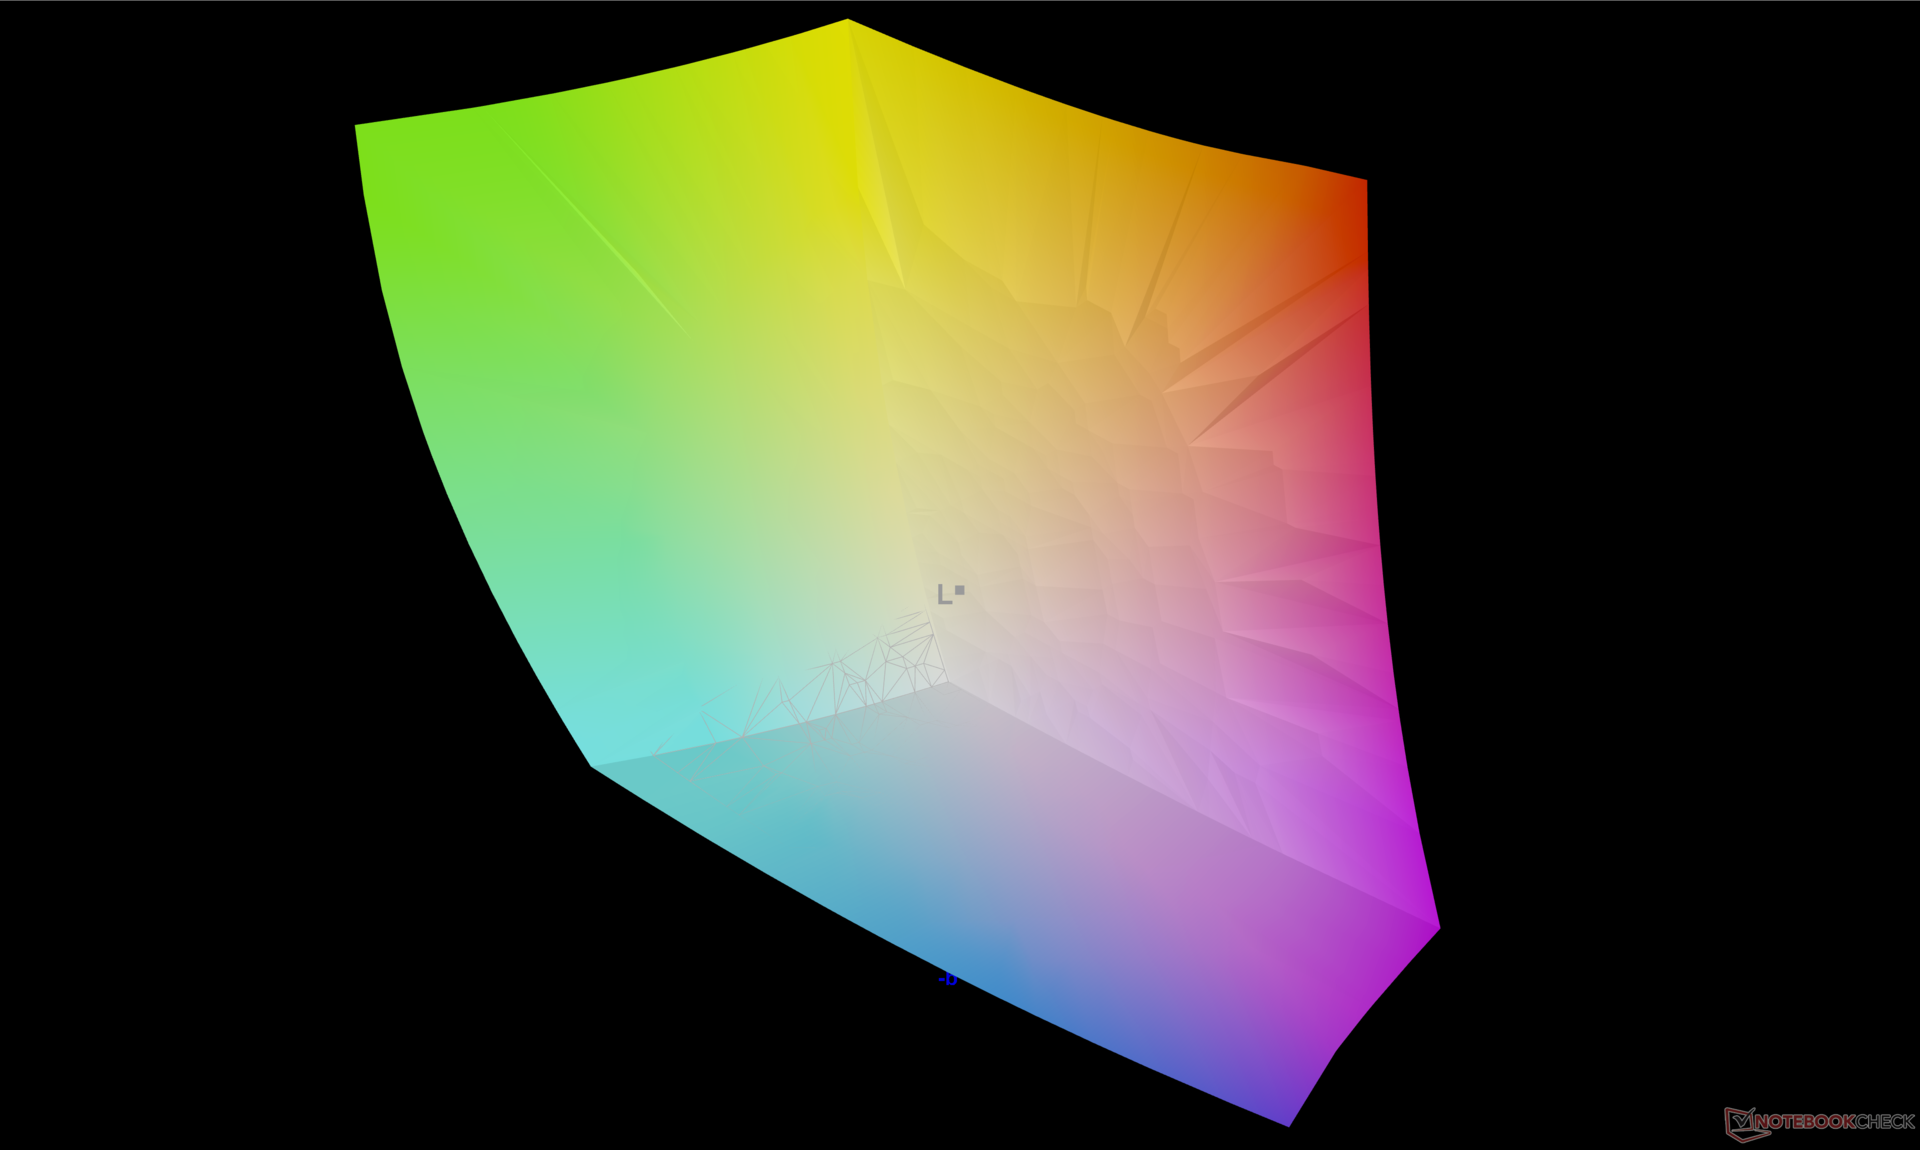
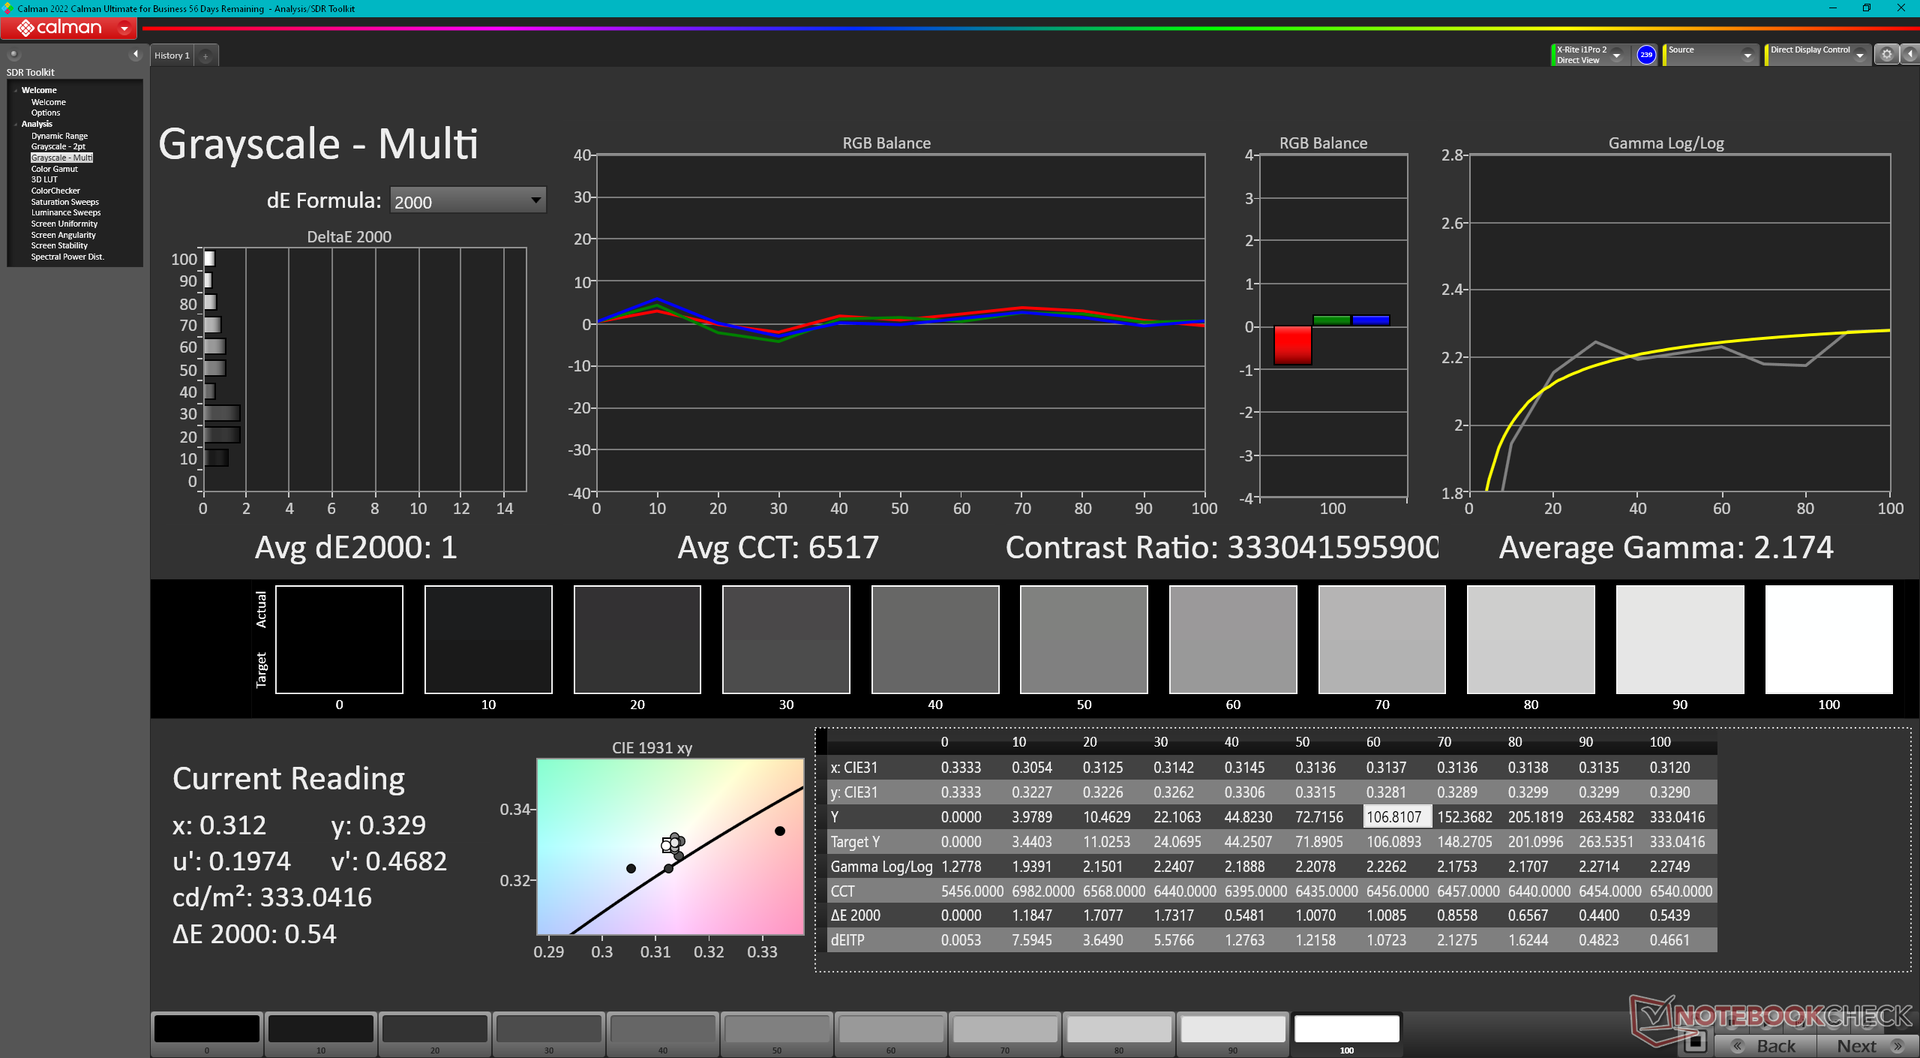
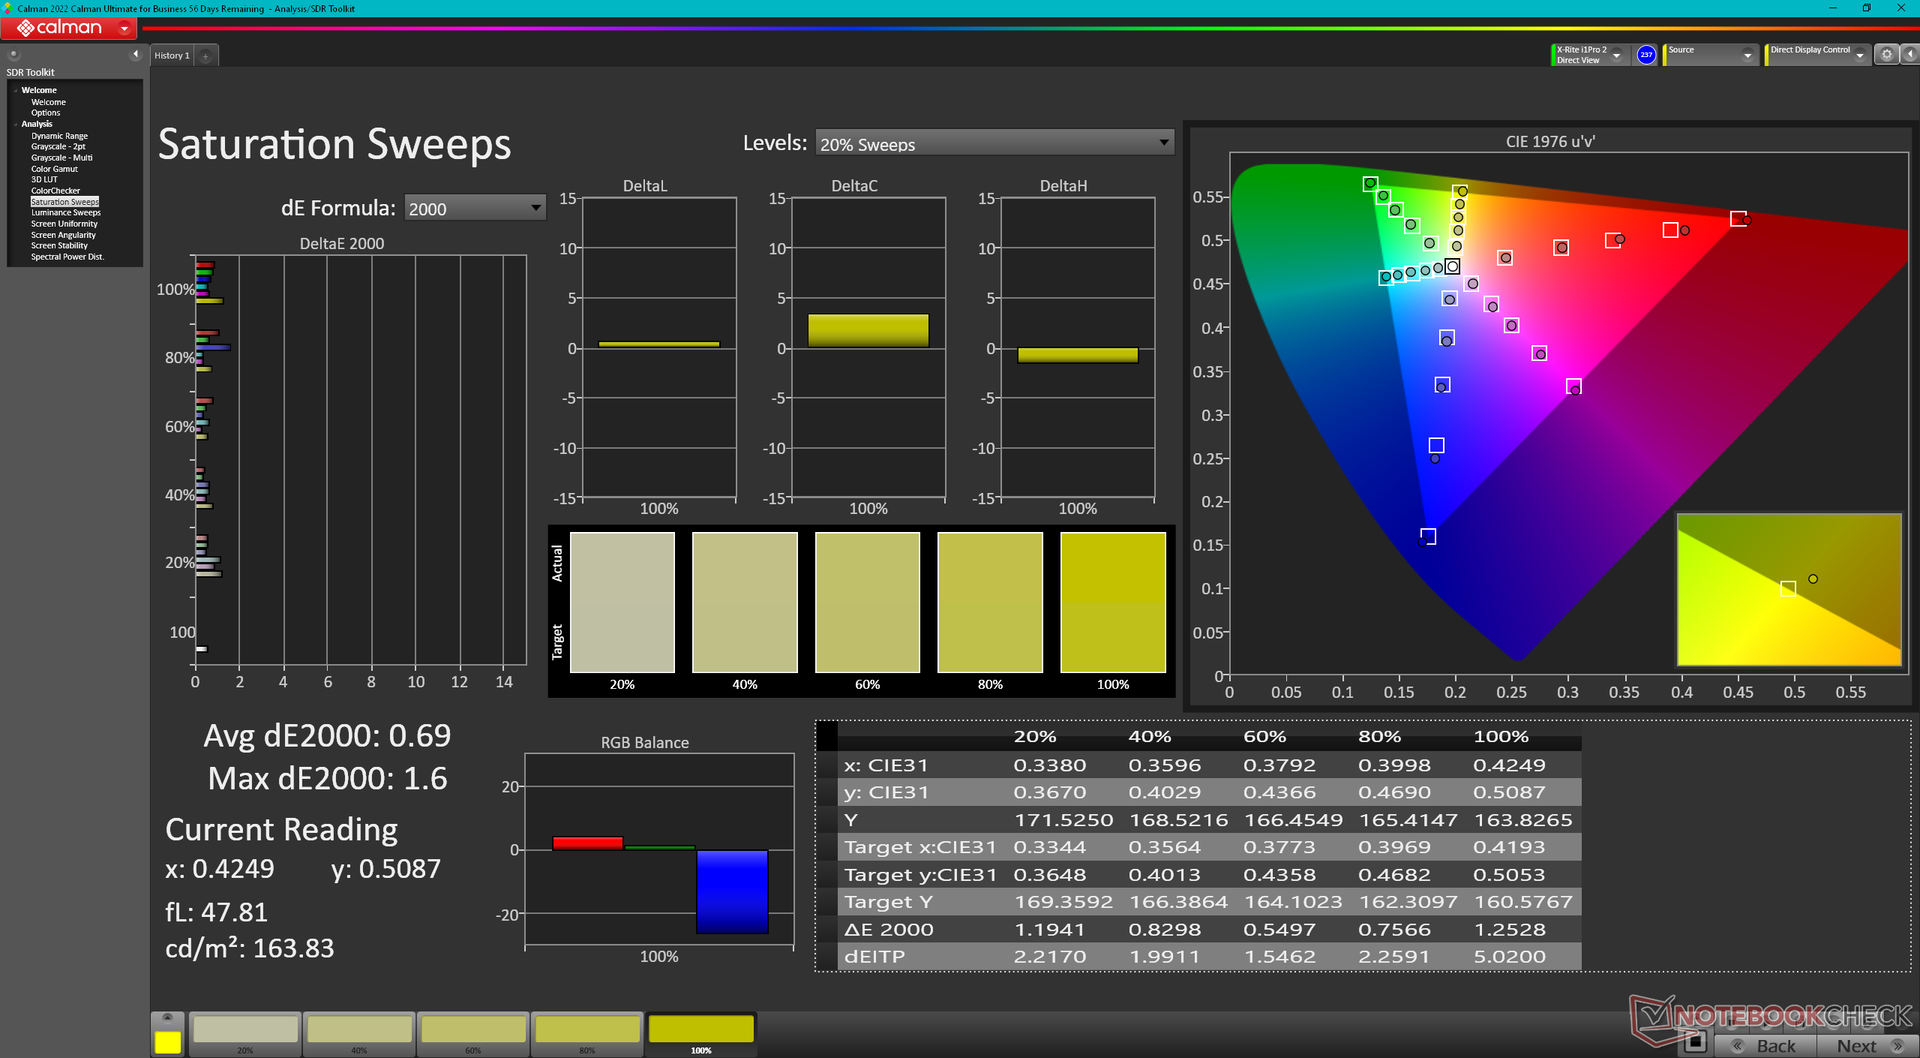
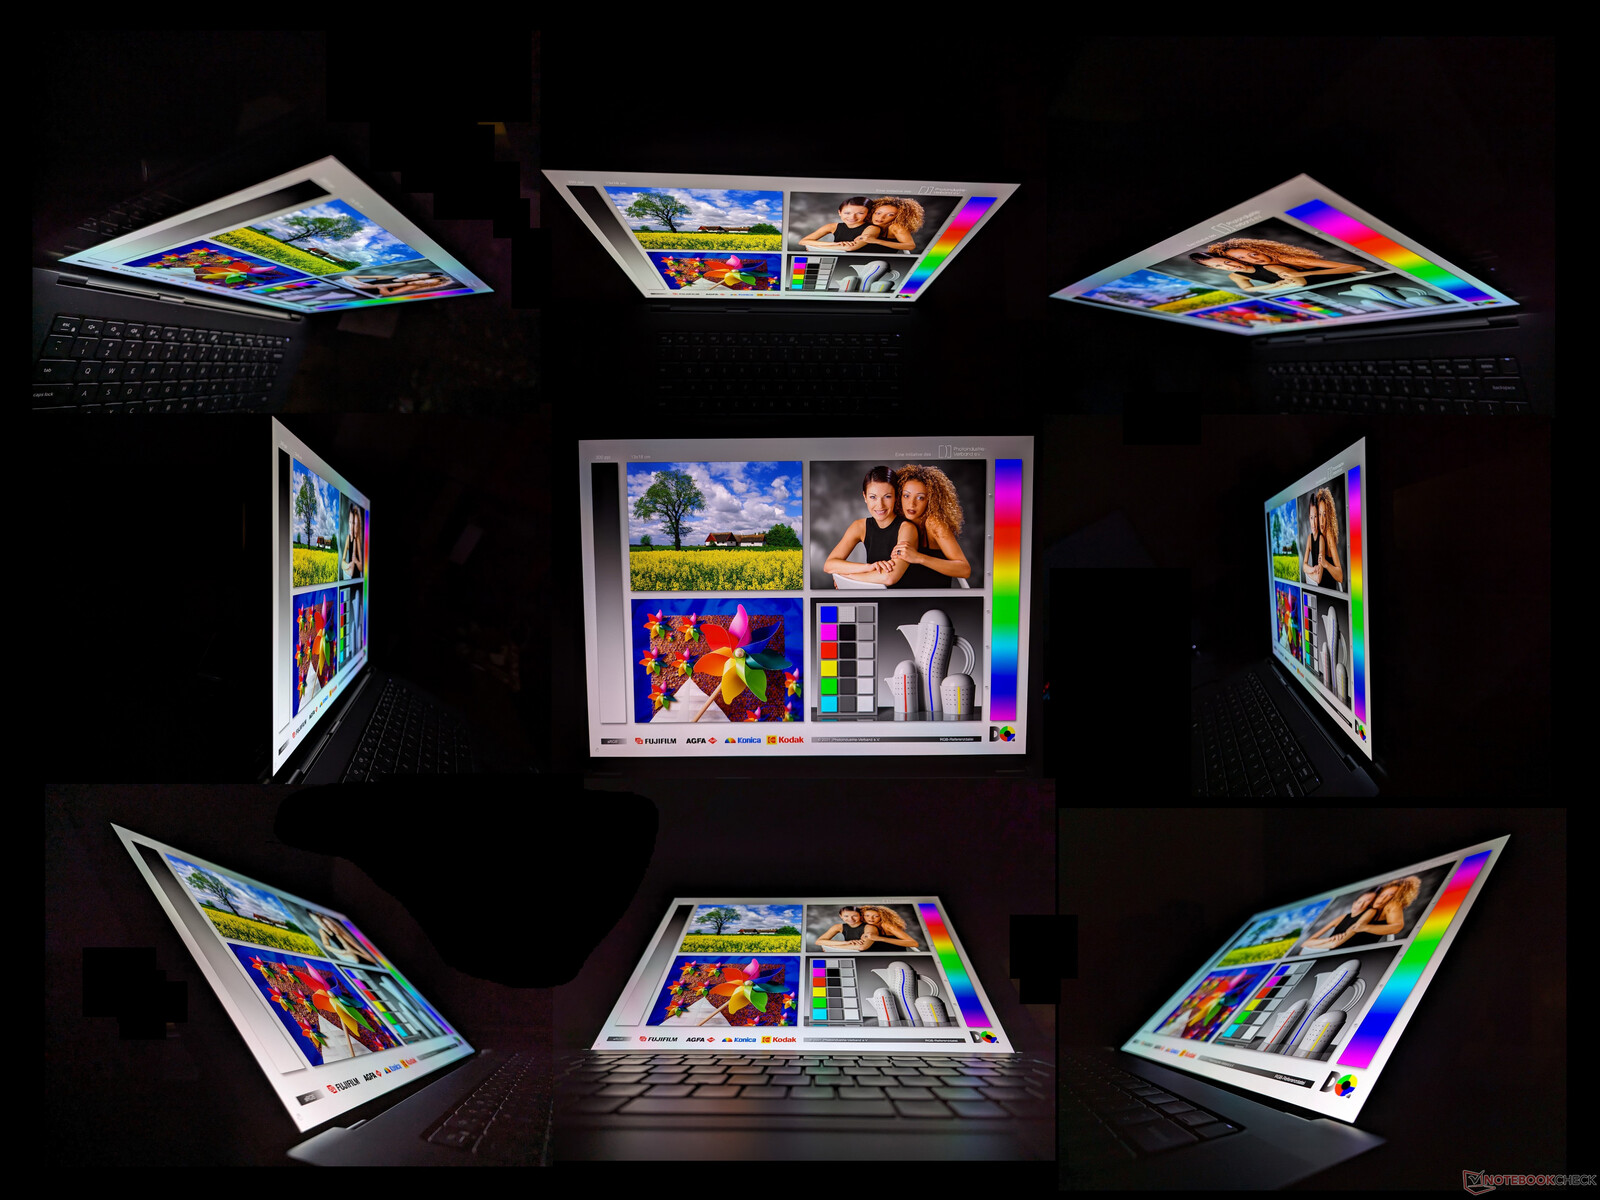
Dell gebruikt hetzelfde Samsung 160YV03 OLED-paneel voor zowel de 16-inch Precision 5680 als de 16-inch Precision 7670. Beide modellen bieden dus dezelfde visuele ervaring met vergelijkbare responstijden, volledige DCI-P3-kleuren en zelfs helderheidsniveaus, zoals de onderstaande vergelijkingstabel laat zien. Hopelijk zien we in de nabije toekomst opties met een hogere verversingssnelheid.
| |||||||||||||||||||||||||
Helderheidsverdeling: 98 %
Helderheid in Batterij-modus: 345.7 cd/m²
Contrast: ∞:1 (Zwart: 0 cd/m²)
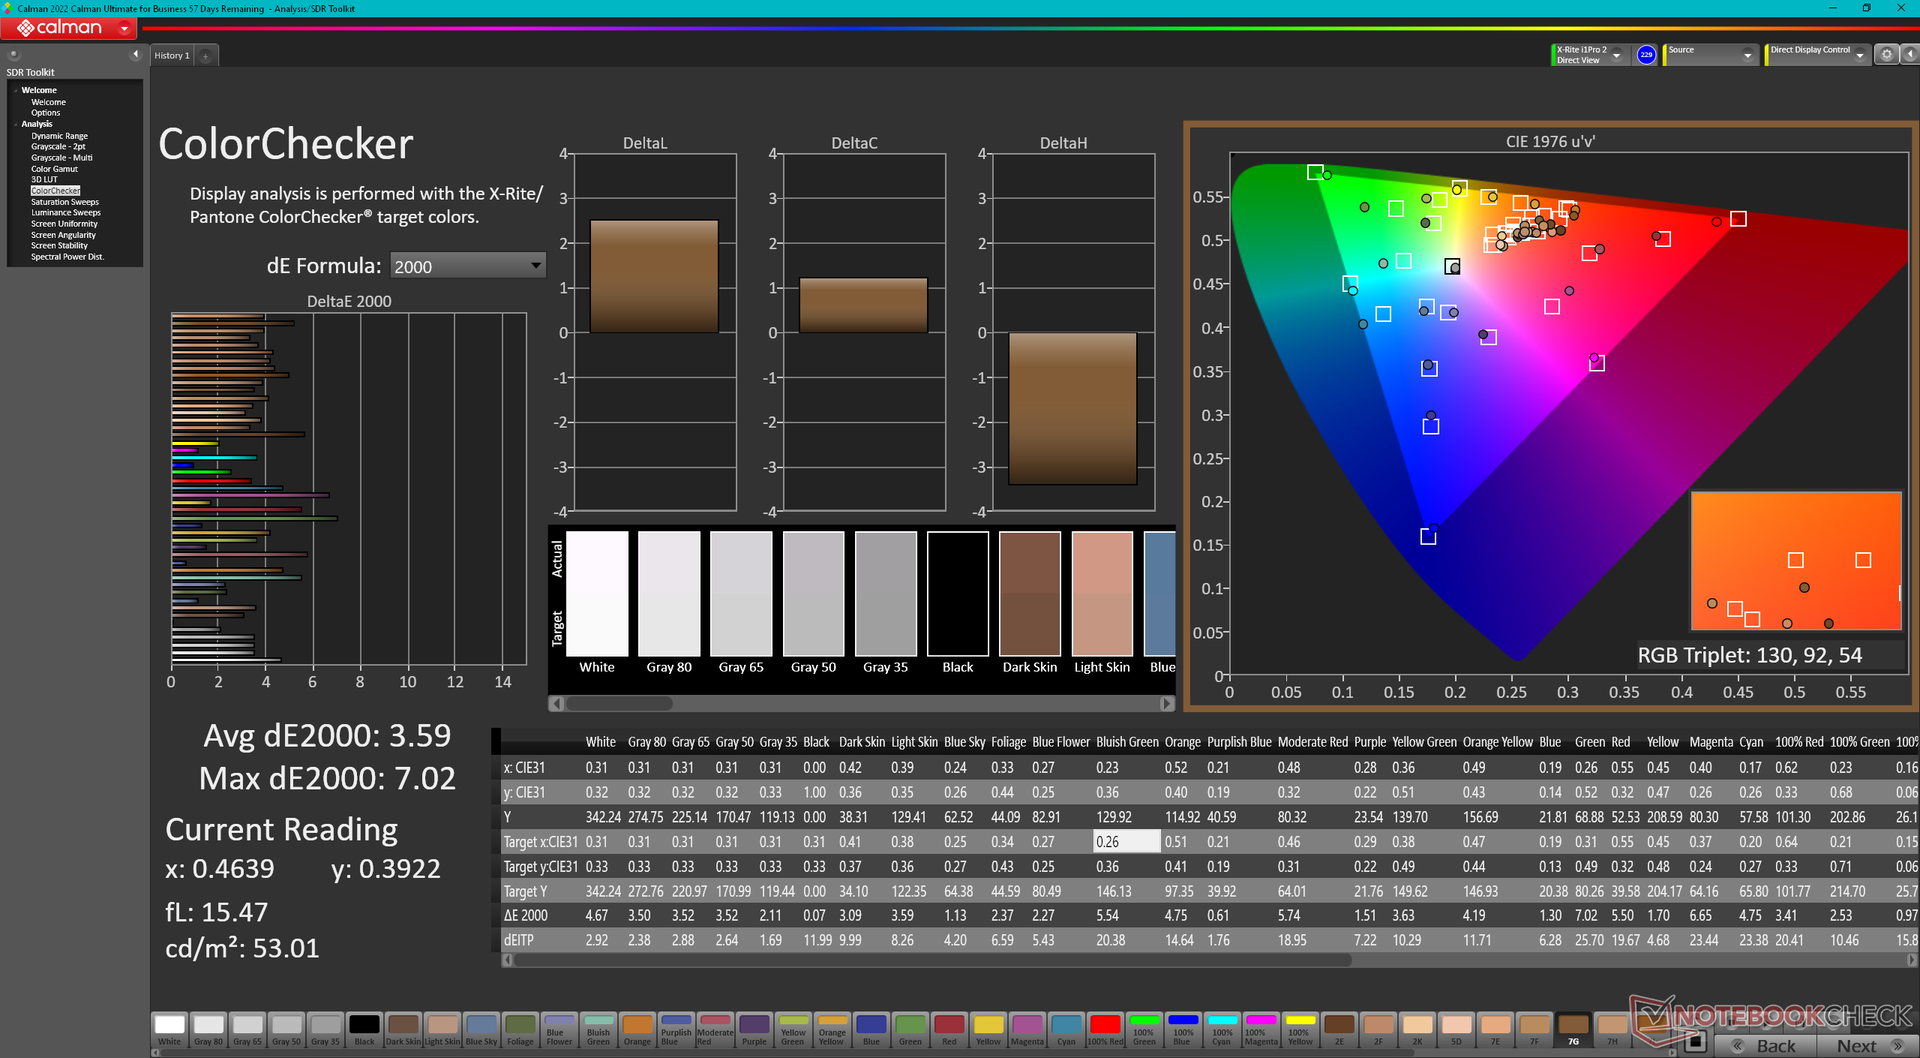
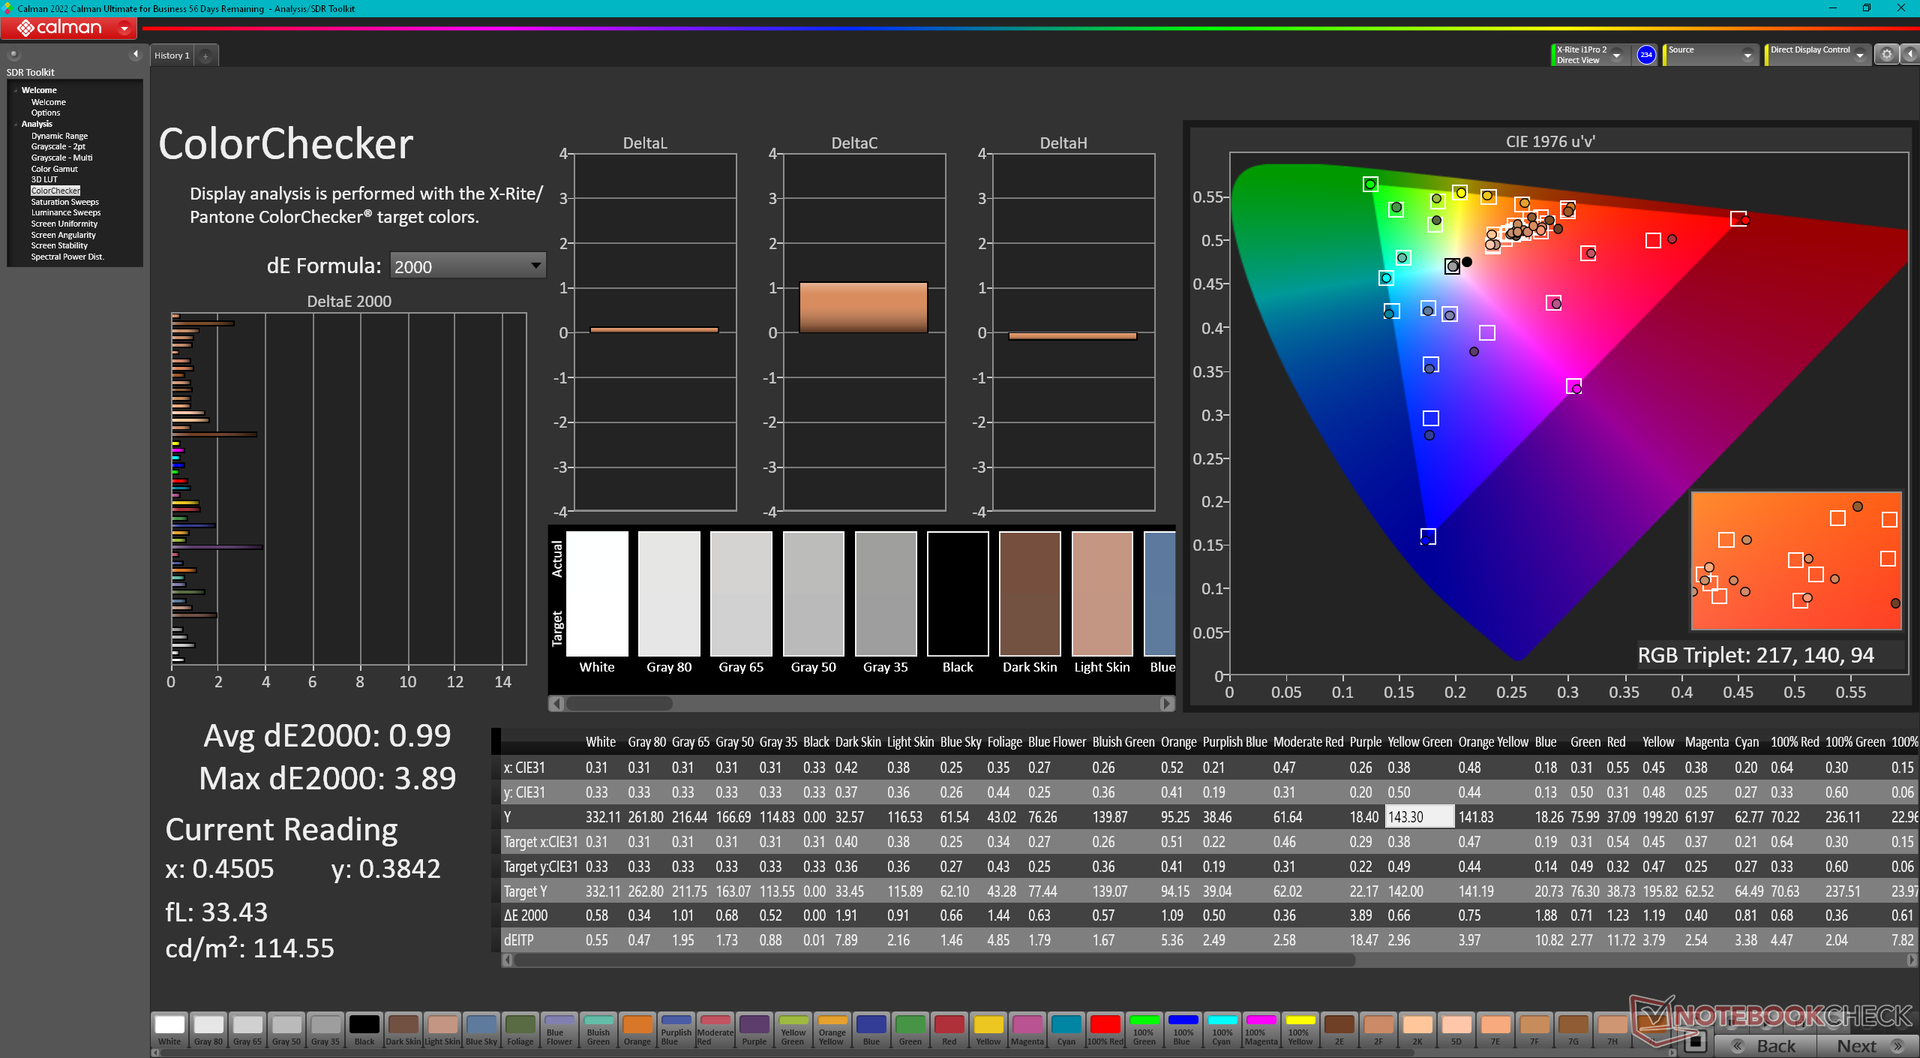
ΔE ColorChecker Calman: 3.59 | ∀{0.5-29.43 Ø4.71}
calibrated: 0.99
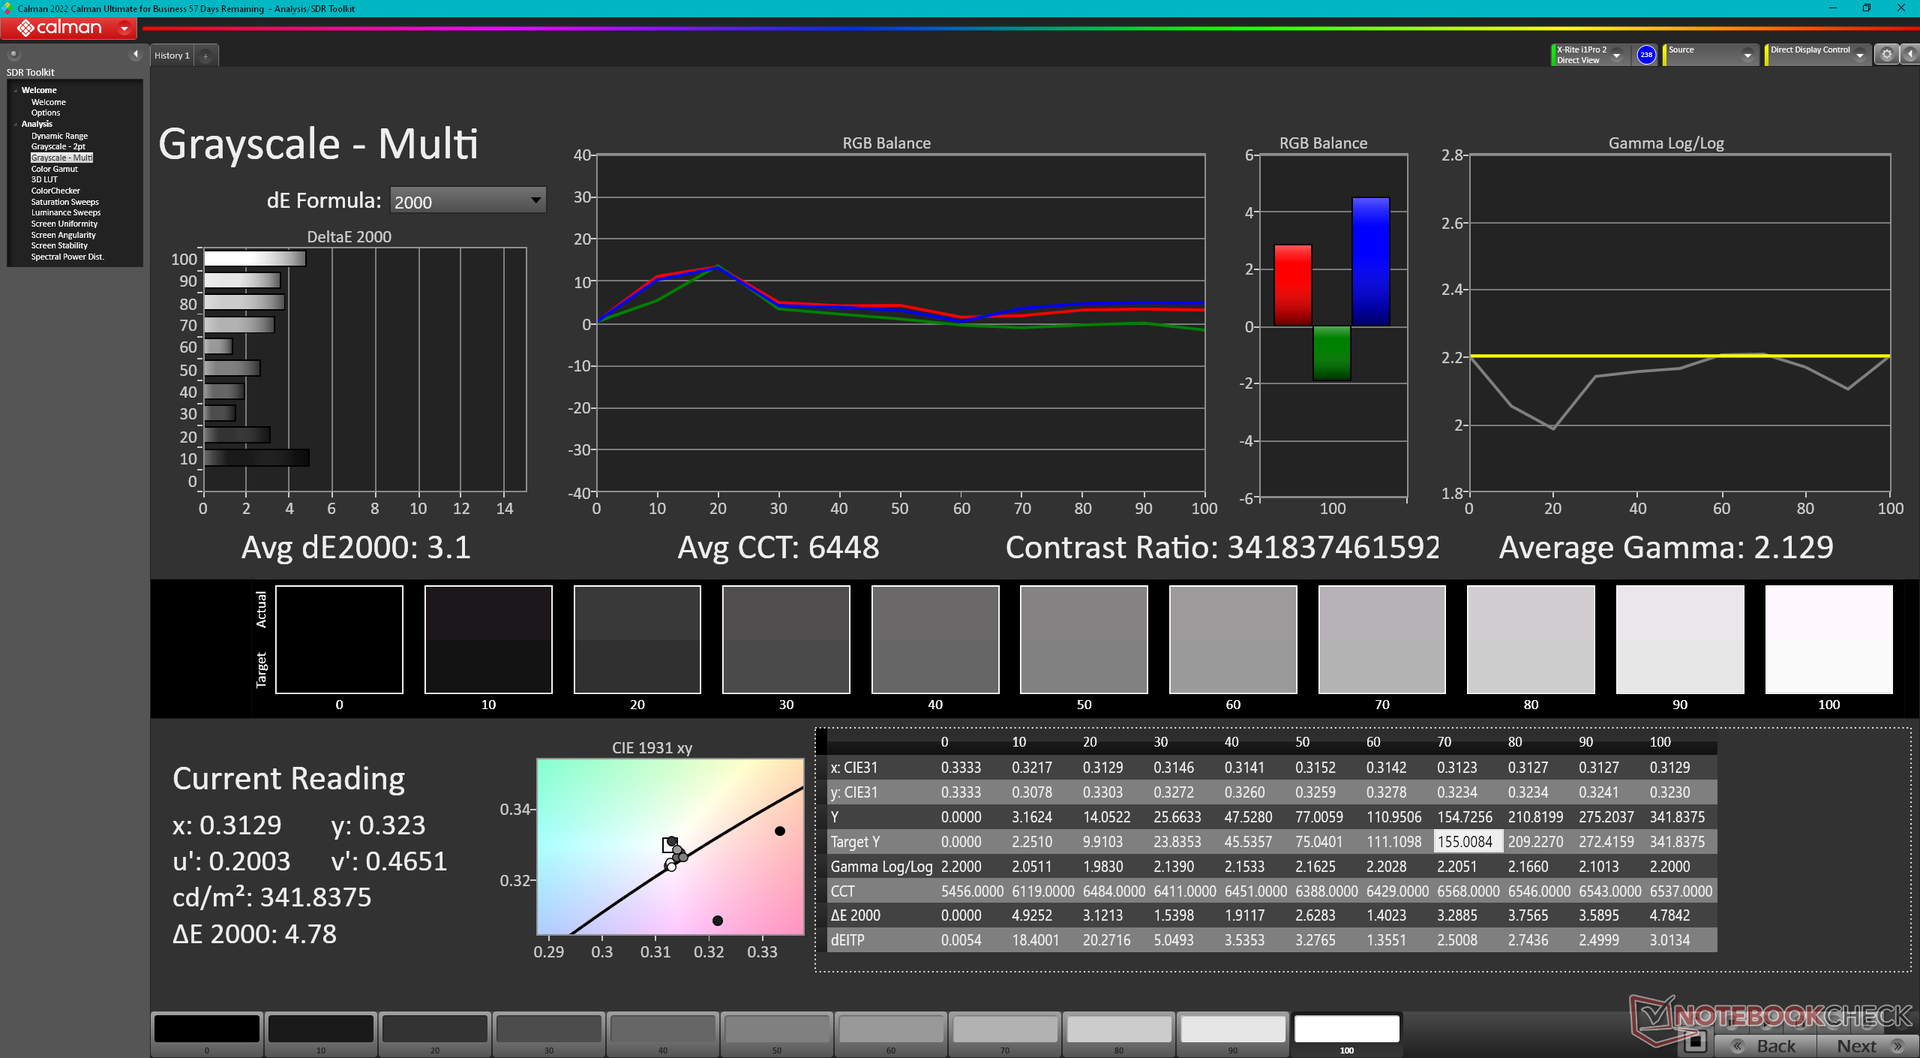
ΔE Greyscale Calman: 3.1 | ∀{0.09-98 Ø4.96}
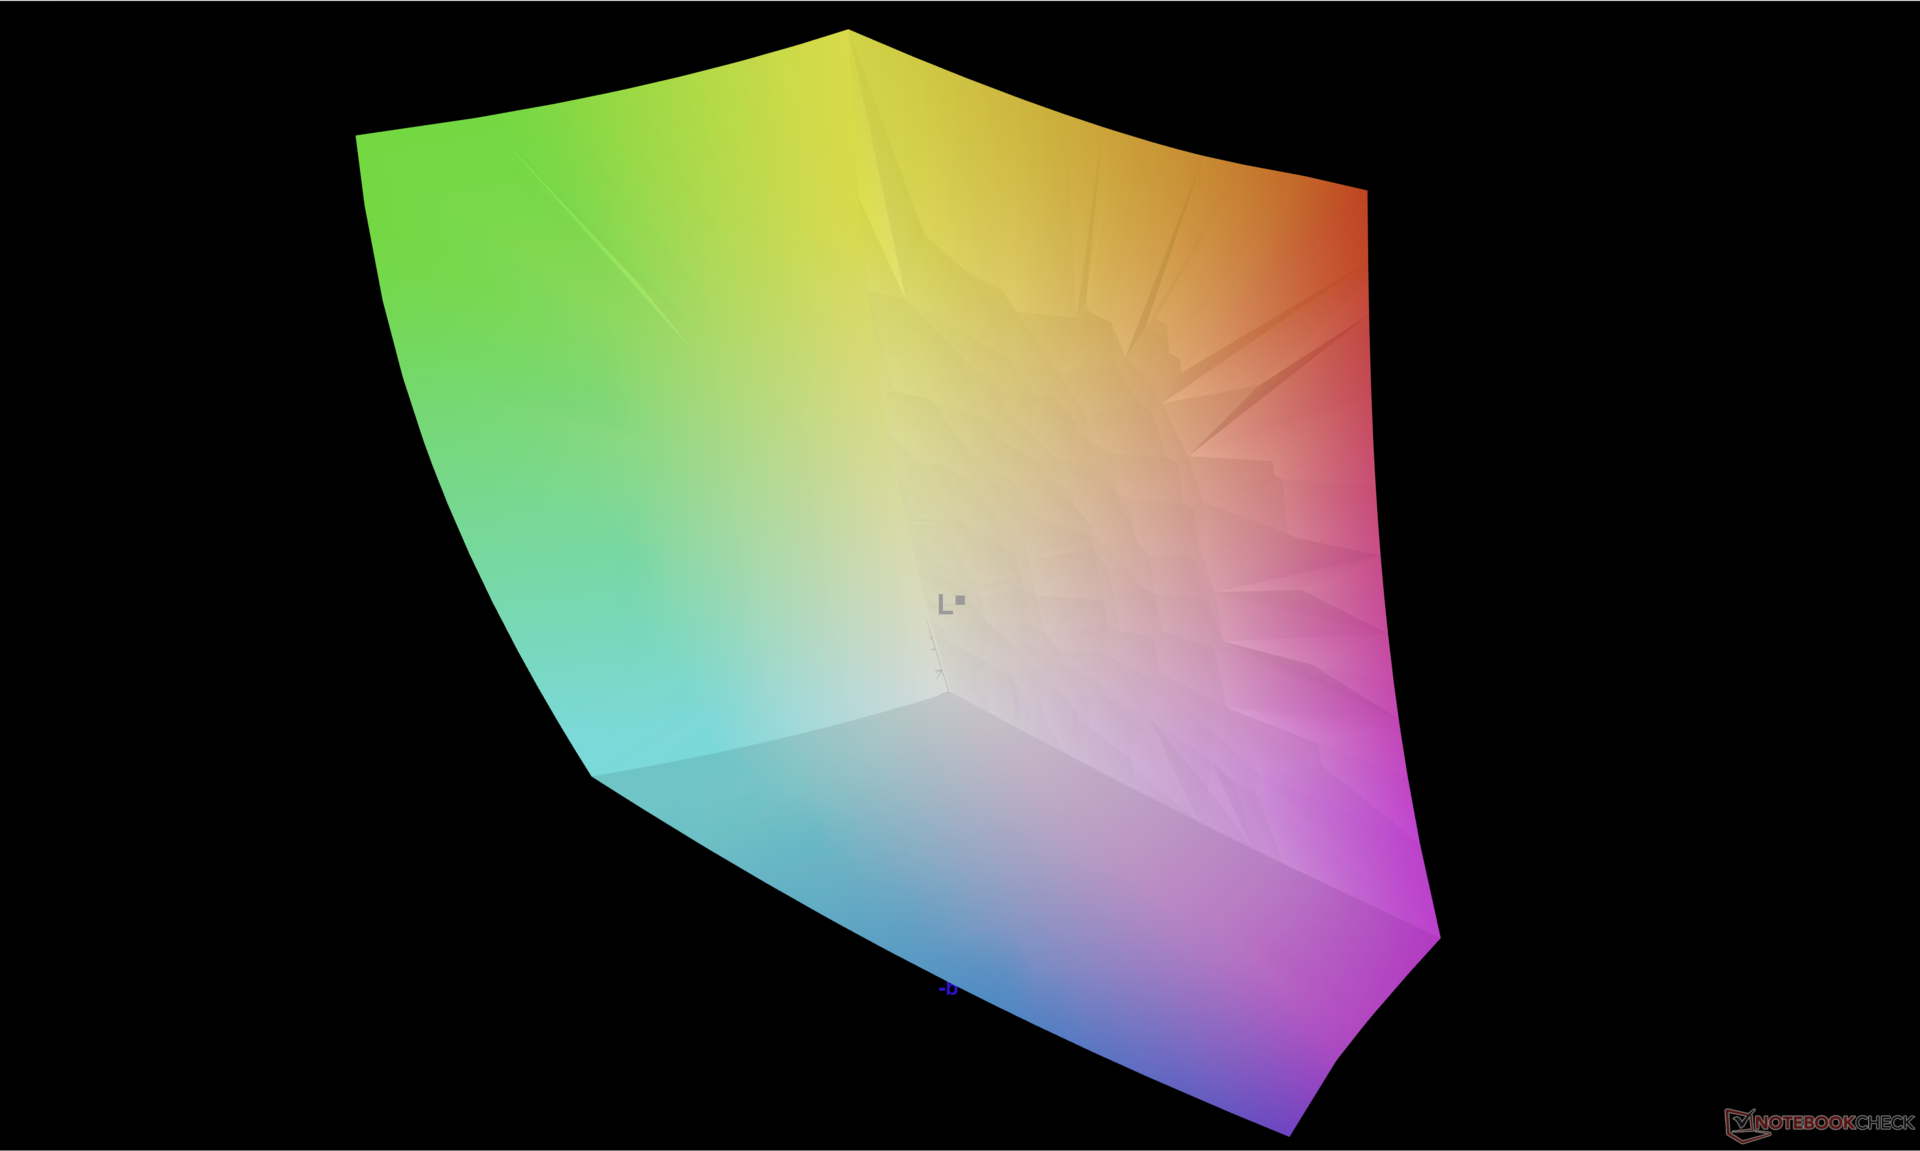
97.5% AdobeRGB 1998 (Argyll 3D)
100% sRGB (Argyll 3D)
99.9% Display P3 (Argyll 3D)
Gamma: 2.13
CCT: 6448 K
| Dell Precision 5000 5680 Samsung 160YV03, OLED, 3840x2400, 16" | Dell Precision 7000 7670 Performance Samsung 160YV03, OLED, 3840x2400, 16" | HP ZBook Fury 16 G9 BOE0A52, IPS, 3840x2400, 16" | Lenovo ThinkPad P16 G1 RTX A5500 LP160UQ1-SPB1, IPS, 3840x2400, 16" | MSI CreatorPro Z16P B12UKST B160QAN02.N, IPS, 2560x1600, 16" | Asus ExpertBook B6 Flip B6602FC2 AU Optronics Model: AUOE495, IPS, 2560x1600, 16" | |
|---|---|---|---|---|---|---|
| Display | 0% | -5% | -7% | -4% | -5% | |
| Display P3 Coverage (%) | 99.9 | 99.9 0% | 97.4 -3% | 82.9 -17% | 97.6 -2% | 97.9 -2% |
| sRGB Coverage (%) | 100 | 100 0% | 99.9 0% | 98.9 -1% | 99.9 0% | 99.89 0% |
| AdobeRGB 1998 Coverage (%) | 97.5 | 98.1 1% | 86.3 -11% | 95.9 -2% | 87.4 -10% | 85.52 -12% |
| Response Times | -9% | -551% | -2297% | -490% | -1452% | |
| Response Time Grey 50% / Grey 80% * (ms) | 1.68 ? | 1.84 ? -10% | 13.7 ? -715% | 45.6 ? -2614% | 12.8 ? -662% | 36 ? -2043% |
| Response Time Black / White * (ms) | 1.77 ? | 1.92 ? -8% | 8.6 ? -386% | 36.8 ? -1979% | 7.4 ? -318% | 17 ? -860% |
| PWM Frequency (Hz) | 60 ? | 59.52 ? | ||||
| Screen | -5% | -33% | 33% | 30% | -6% | |
| Brightness middle (cd/m²) | 345.7 | 325.2 -6% | 530.5 53% | 601.9 74% | 407 18% | 440 27% |
| Brightness (cd/m²) | 349 | 328 -6% | 476 36% | 569 63% | 388 11% | 418 20% |
| Brightness Distribution (%) | 98 | 97 -1% | 83 -15% | 77 -21% | 88 -10% | 82 -16% |
| Black Level * (cd/m²) | 0.57 | 0.47 | 0.36 | 0.3 | ||
| Colorchecker dE 2000 * | 3.59 | 4.59 -28% | 2.26 37% | 2.45 32% | 1.3 64% | 2.81 22% |
| Colorchecker dE 2000 max. * | 7.02 | 7.65 -9% | 4.46 36% | 2.5 64% | 4.62 34% | |
| Colorchecker dE 2000 calibrated * | 0.99 | 4.73 -378% | 0.7 29% | 2.99 -202% | ||
| Greyscale dE 2000 * | 3.1 | 2.5 19% | 1 68% | 2.6 16% | 2.1 32% | 0.91 71% |
| Gamma | 2.13 103% | 2.1 105% | 2.28 96% | 2.3 96% | 2.26 97% | 2.2 100% |
| CCT | 6448 101% | 6541 99% | 6543 99% | 6805 96% | 6437 101% | 6600 98% |
| Contrast (:1) | 931 | 1281 | 1131 | 1467 | ||
| Totaal Gemiddelde (Programma / Instellingen) | -5% /
-4% | -196% /
-119% | -757% /
-401% | -155% /
-65% | -488% /
-247% |
* ... kleiner is beter
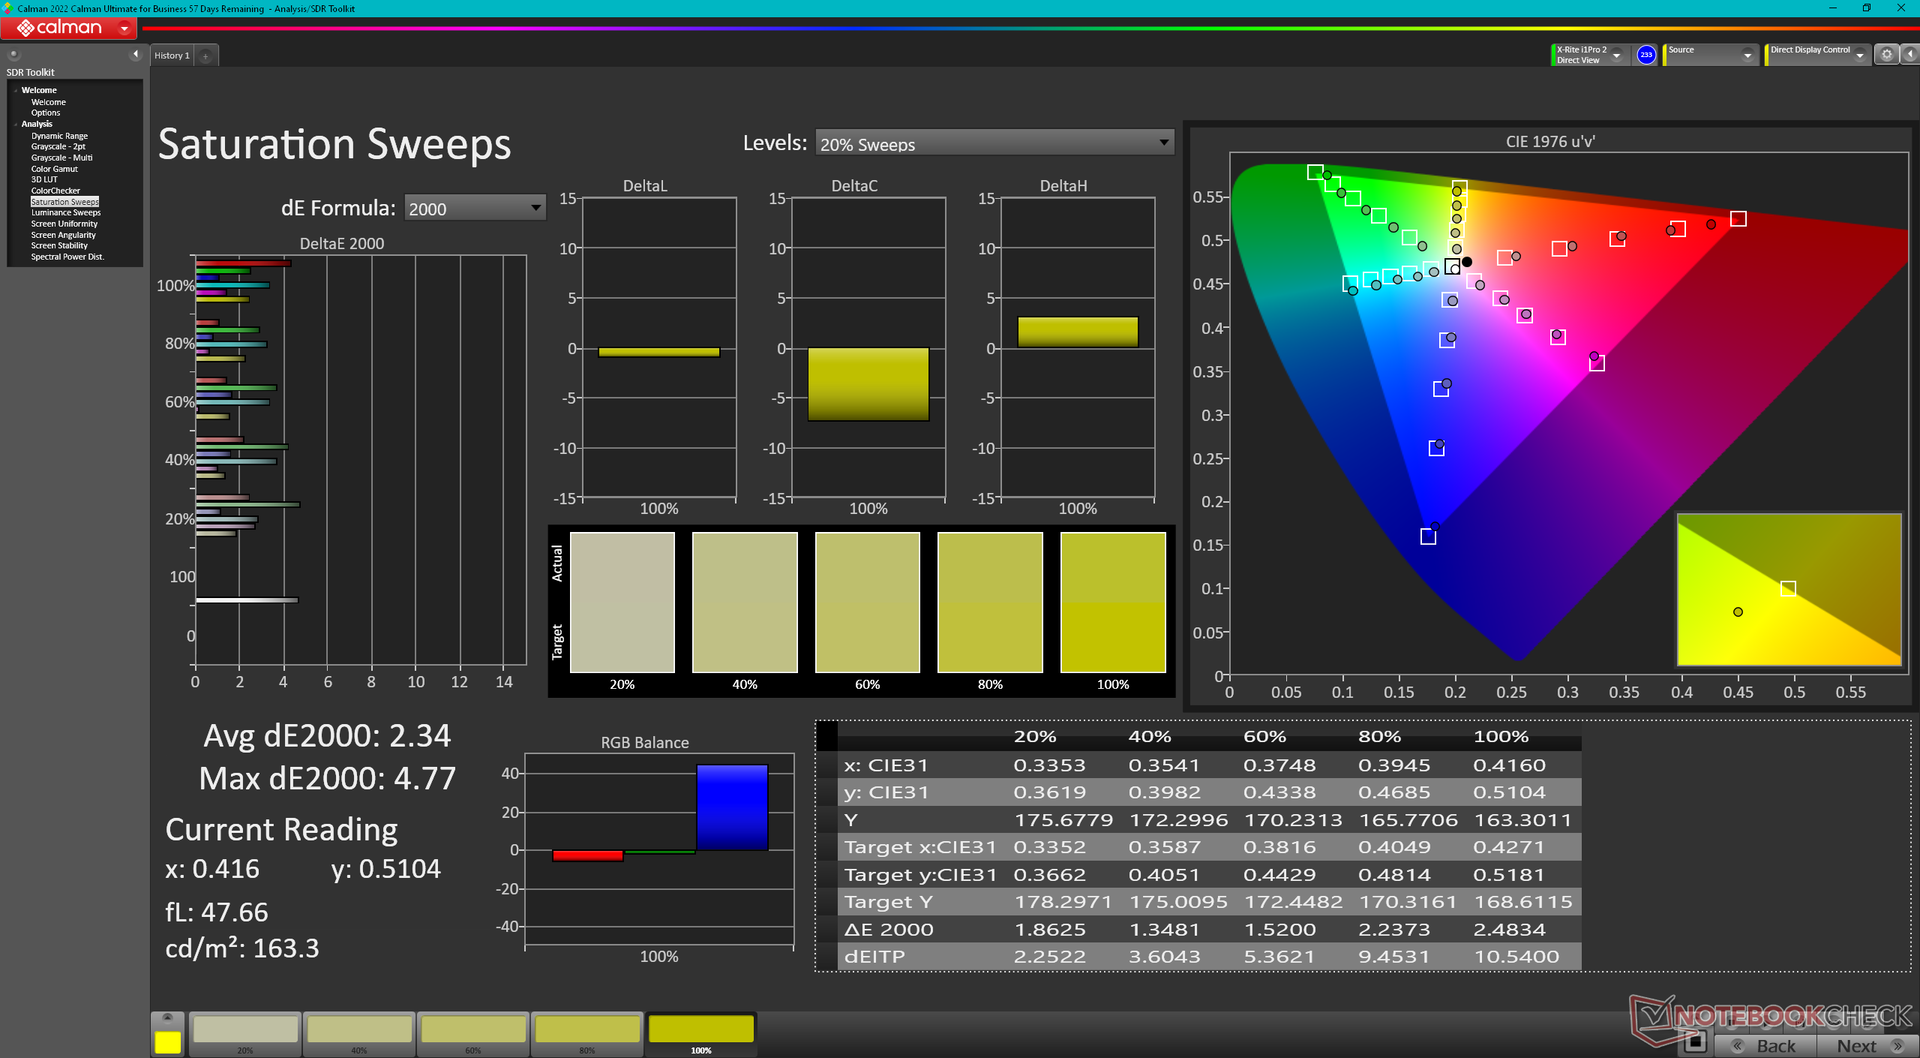
Het scherm is behoorlijk gekalibreerd uit de doos met gemiddelde deltaE-waarden tussen 3 en 4. Ons gekalibreerde ICM-profiel is hierboven gratis te downloaden.
Responstijd Scherm
| ↔ Responstijd Zwart naar Wit | ||
|---|---|---|
| 1.77 ms ... stijging ↗ en daling ↘ gecombineerd | ↗ 0.8 ms stijging | 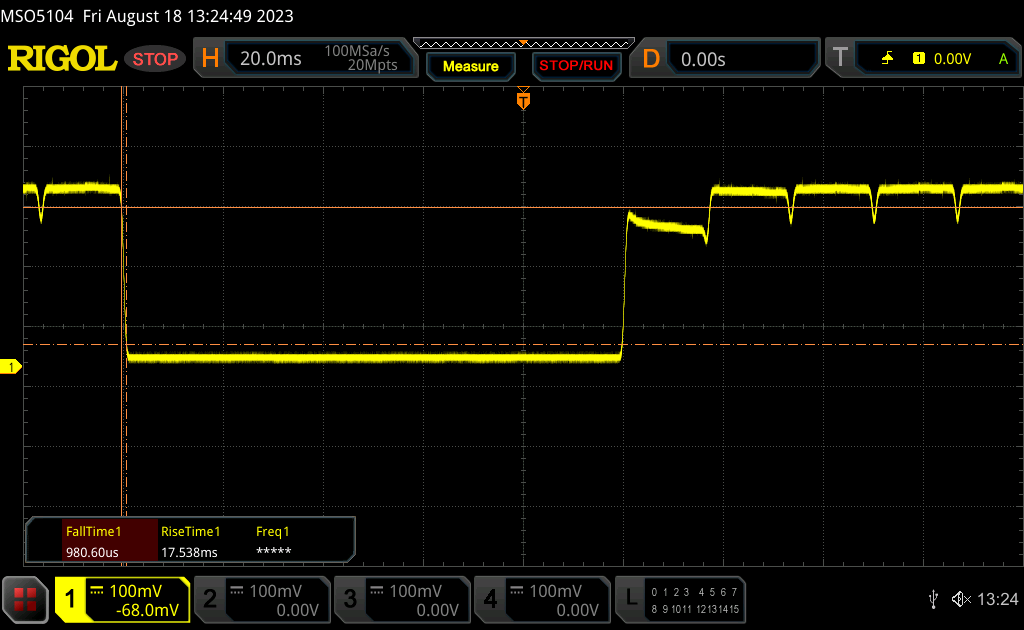 |
| ↘ 0.97 ms daling | ||
| Het scherm vertoonde erg snelle responstijden in onze tests en zou zeer geschikt moeten zijn voor snelle games. Ter vergelijking: alle testtoestellen variëren van 0.1 (minimum) tot 240 (maximum) ms. » 10 % van alle toestellen zijn beter. Dit betekent dat de gemeten responstijd beter is dan het gemiddelde (19.8 ms) van alle geteste toestellen. | ||
| ↔ Responstijd 50% Grijs naar 80% Grijs | ||
| 1.68 ms ... stijging ↗ en daling ↘ gecombineerd | ↗ 0.97 ms stijging | 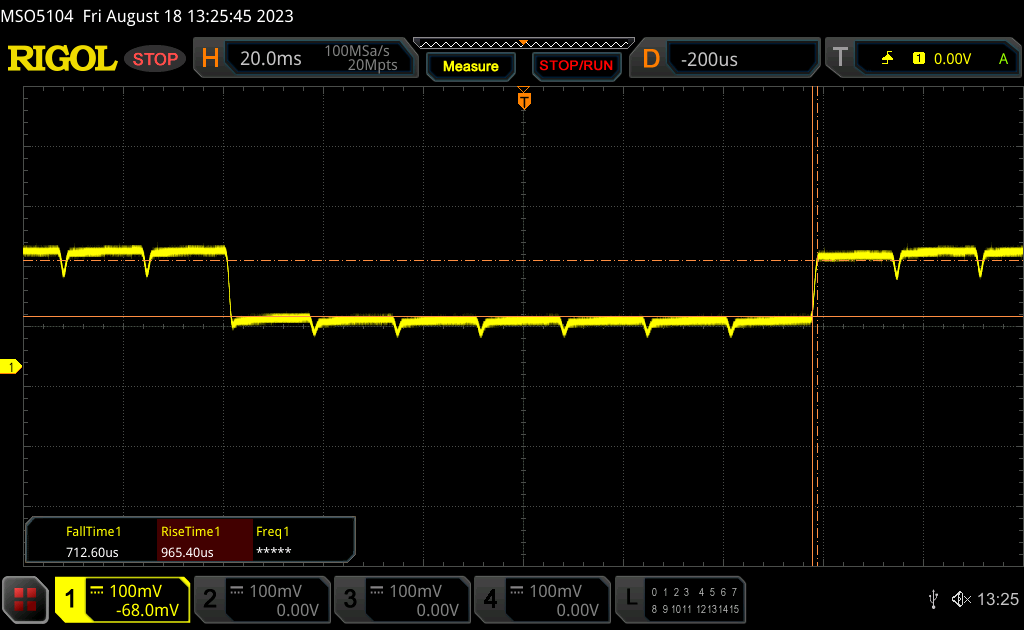 |
| ↘ 0.71 ms daling | ||
| Het scherm vertoonde erg snelle responstijden in onze tests en zou zeer geschikt moeten zijn voor snelle games. Ter vergelijking: alle testtoestellen variëren van 0.165 (minimum) tot 636 (maximum) ms. » 9 % van alle toestellen zijn beter. Dit betekent dat de gemeten responstijd beter is dan het gemiddelde (31 ms) van alle geteste toestellen. | ||
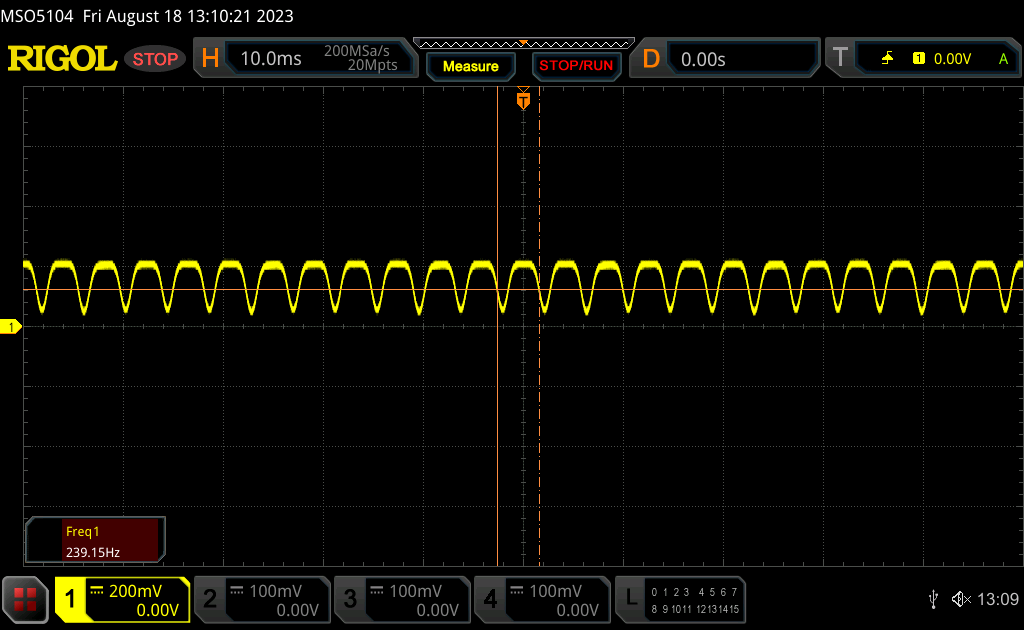
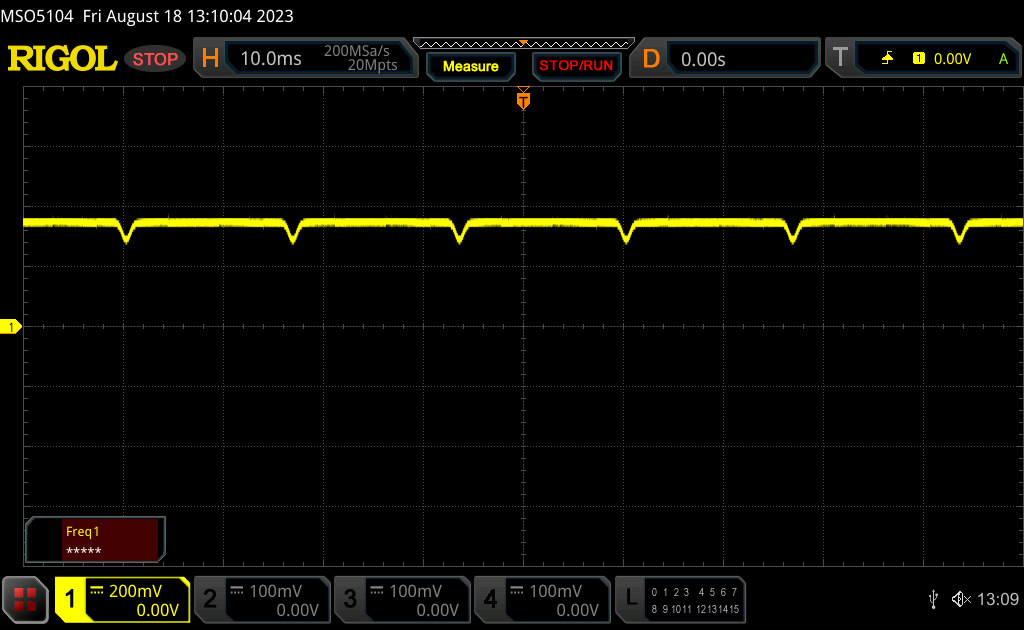
Screen Flickering / PWM (Pulse-Width Modulation)
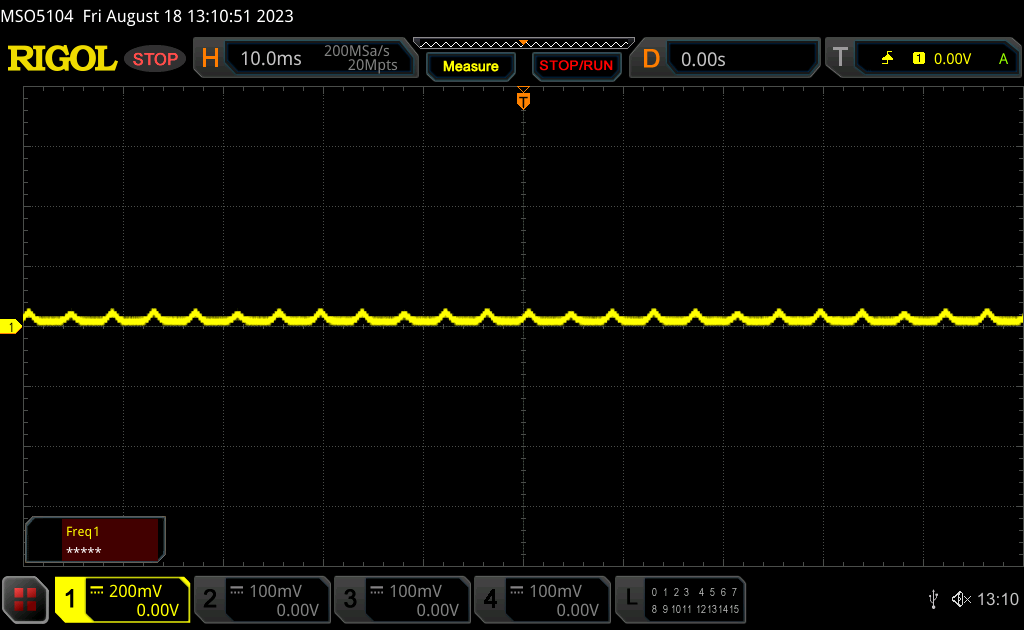
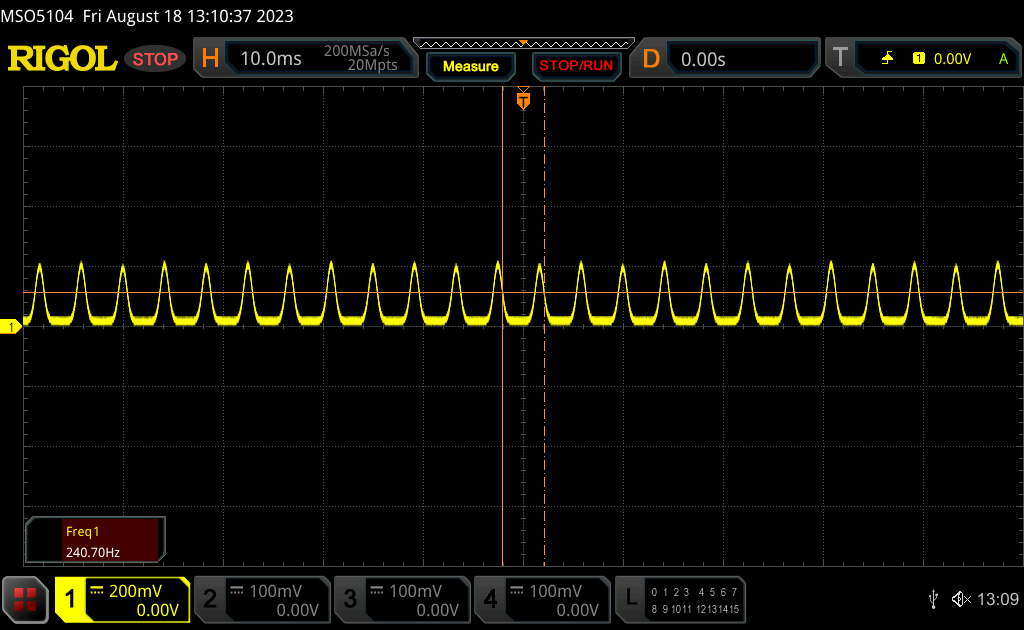
| Screen flickering / PWM waargenomen | 60 Hz | ≤ 100 % helderheid instelling | 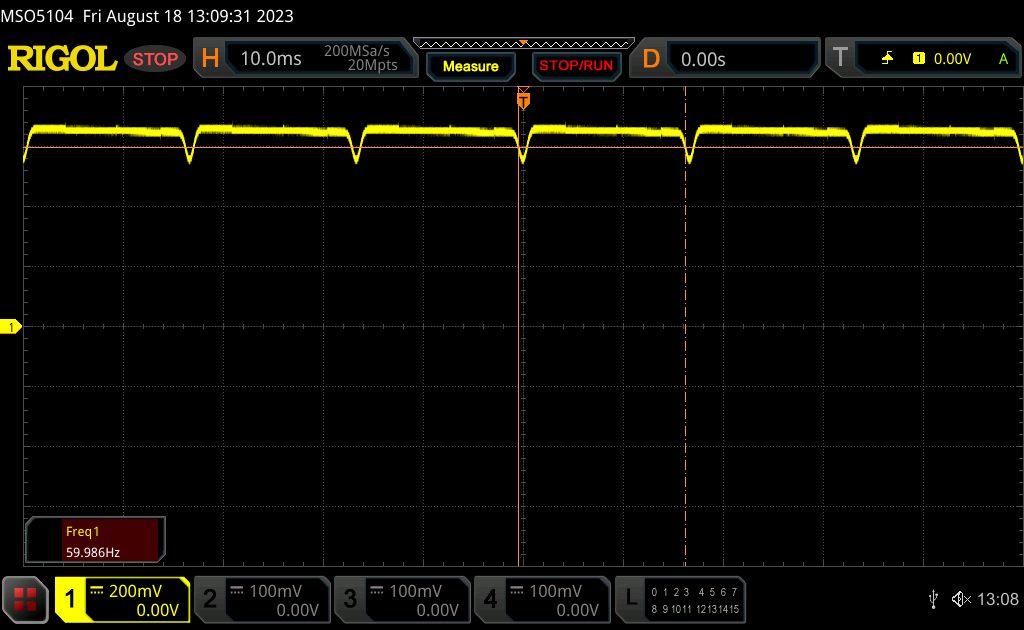 |
De achtergrondverlichting van het scherm flikkert op 60 Hz (in het slechtste geval, bijvoorbeeld bij gebruik van PWM) aan een helderheid van 100 % en lager. Boven deze helderheid zou er geen flickering / PWM mogen optreden. De frequentie van 60 Hz is erg laag en kan dus aanleiding geven tot geïrriteerde ogen en hoofdpijn bij langer gebruik. Ter vergelijking: 52 % van alle geteste toestellen maakten geen gebruik van PWM om de schermhelderheid te verlagen. Als het wel werd gebruikt, werd een gemiddelde van 7754 (minimum: 5 - maximum: 343500) Hz waargenomen. | |||
Flikkering is aanwezig op alle helderheidsniveaus, vergelijkbaar met smartphones en andere laptops die zijn uitgerust met OLED-panelen. De frequentie zou stabiel zijn op 239 Hz van 0 tot 54 procent helderheid en 60 Hz van 55 tot 100 procent helderheid.
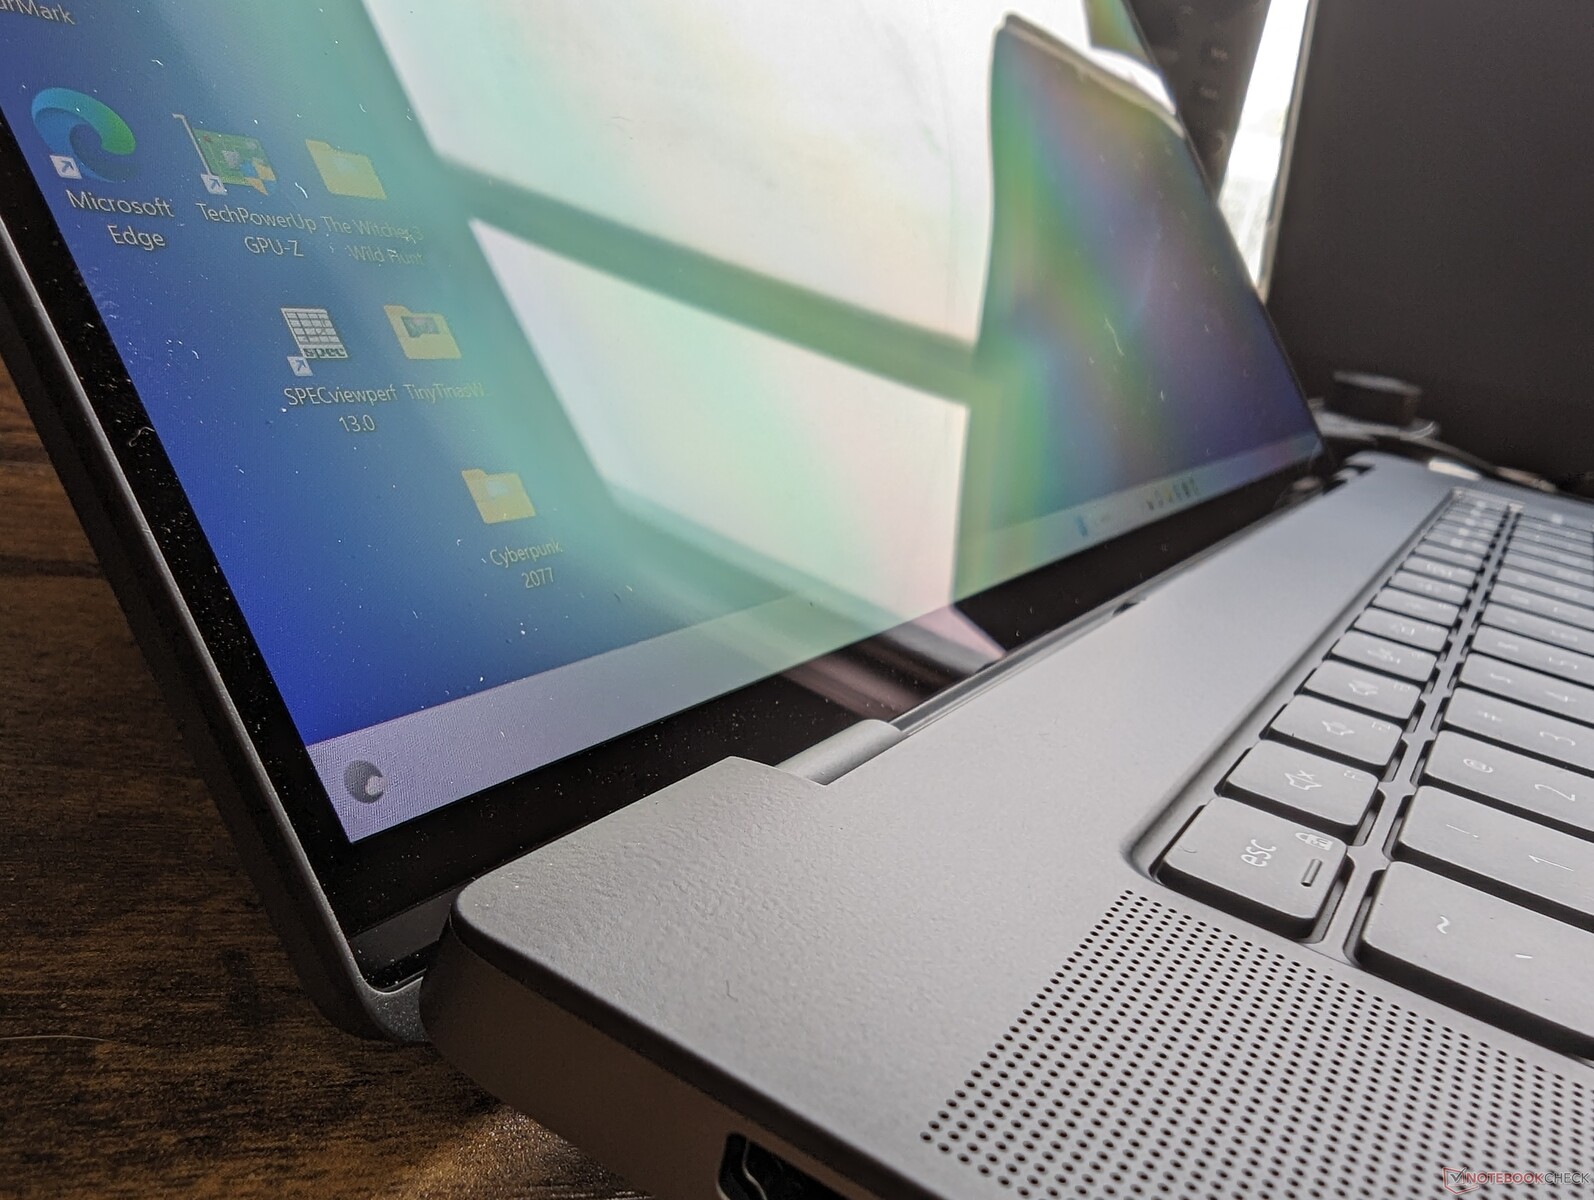
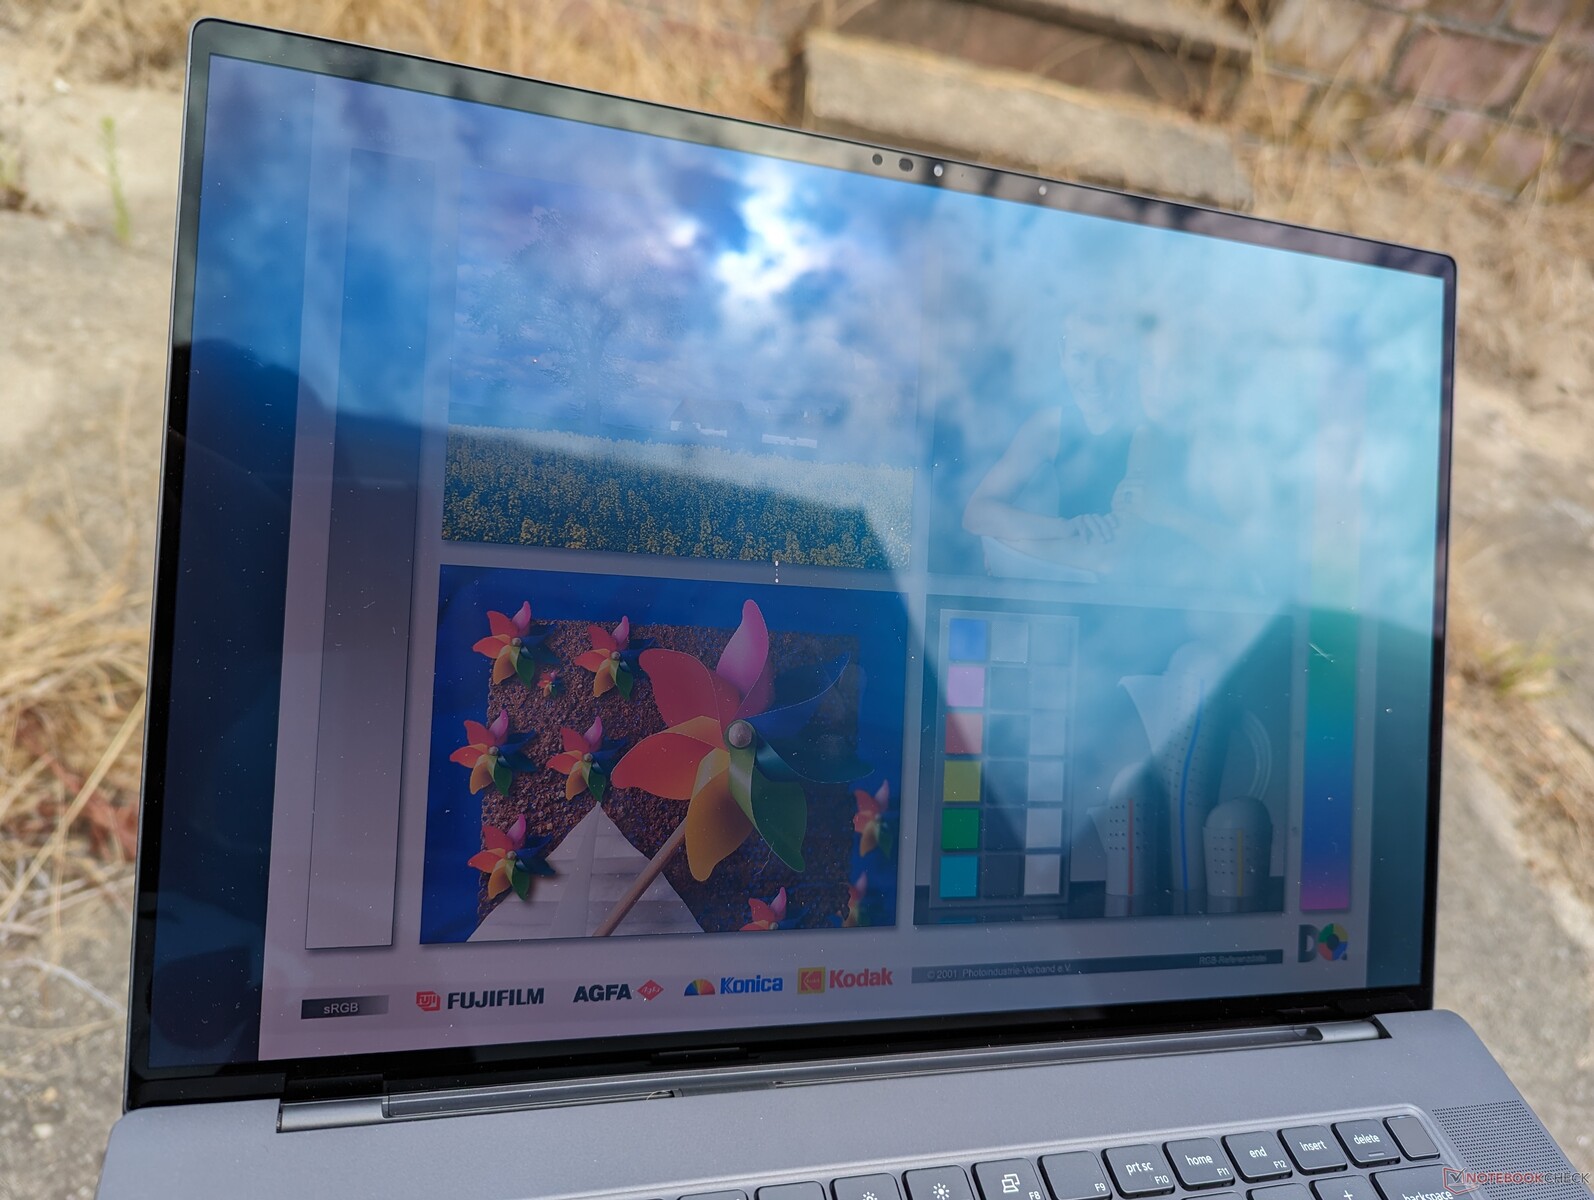
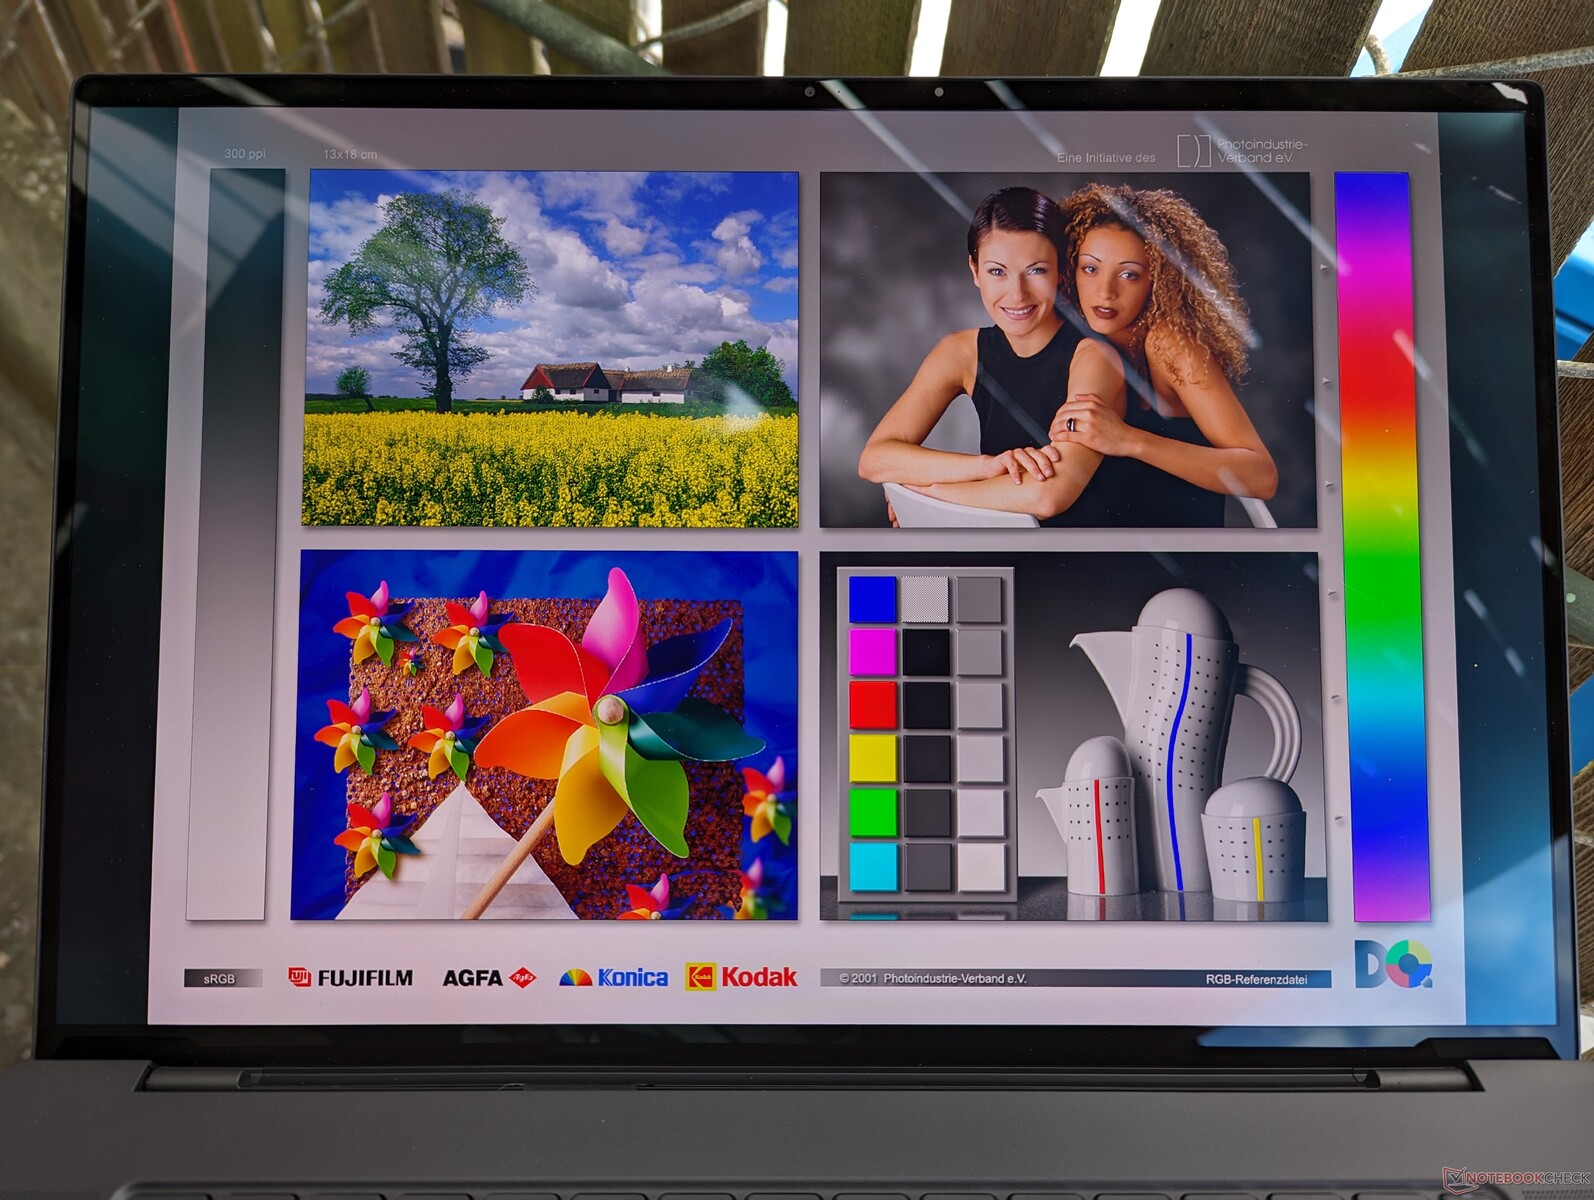
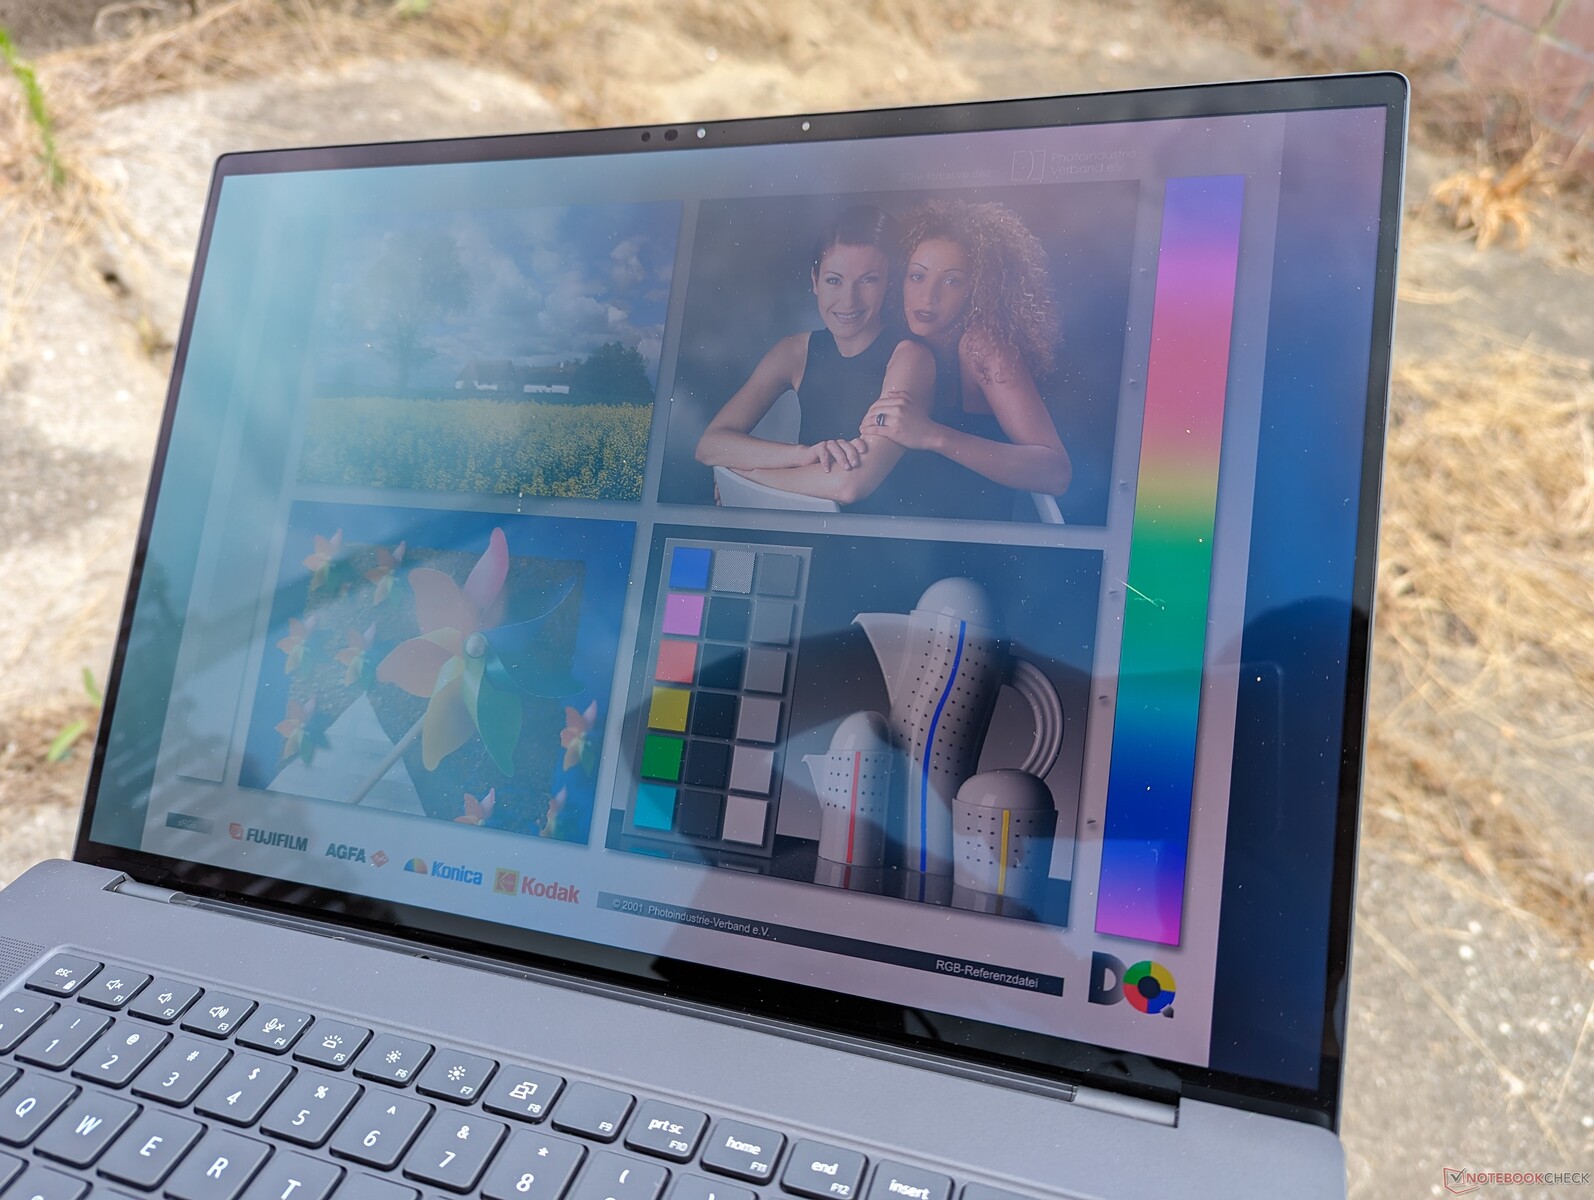
De zichtbaarheid buiten is op zijn best gemiddeld, omdat het 350-nit glanzende OLED-touchscreen lang niet zo helder is als de IPS-schermen op de ZBook Fury 16 G9 of ThinkPad P16 G1 die 500 tot 600 nits kunnen benaderen.
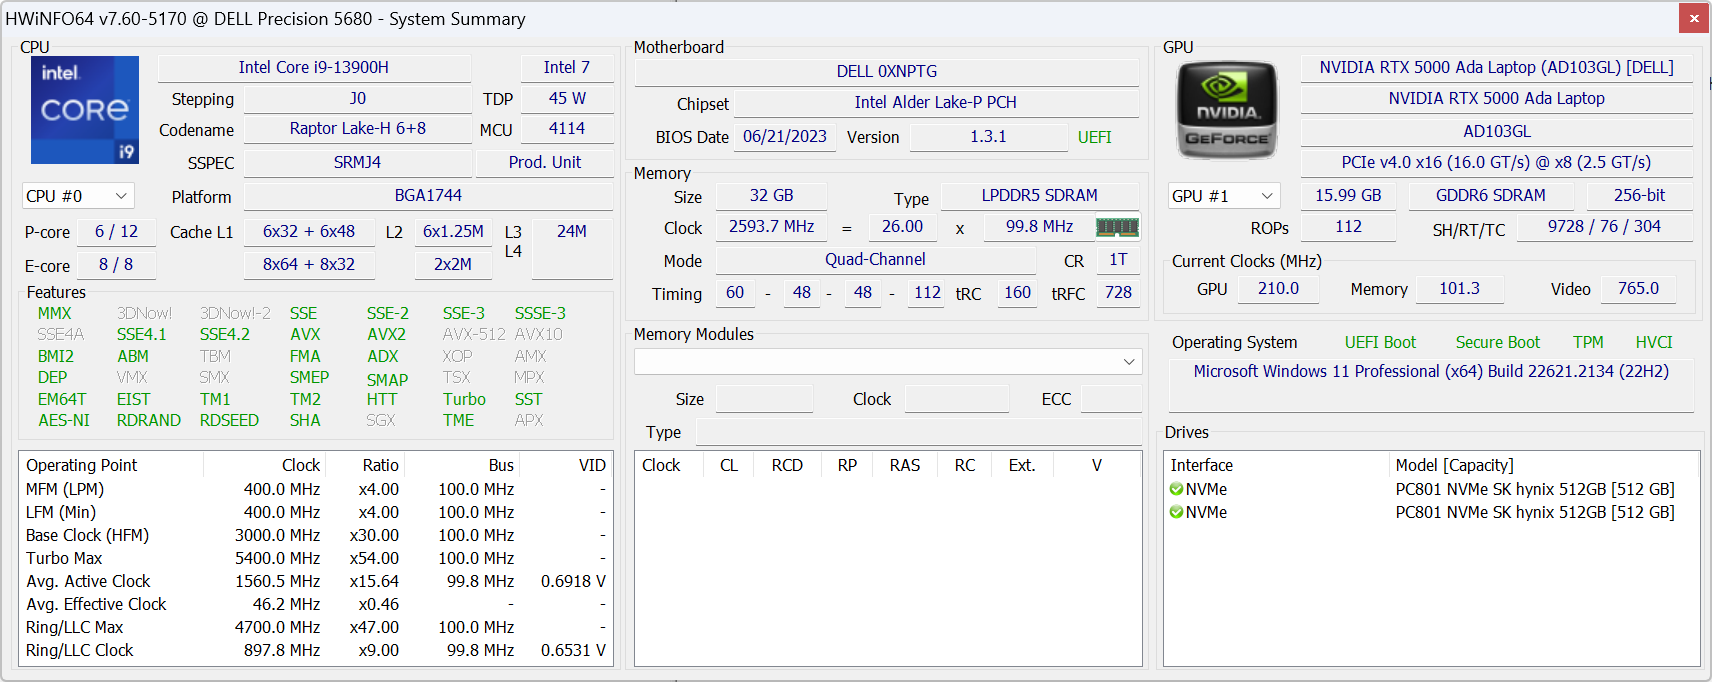
Prestaties - Intel 13e generatie Raptor Lake-H
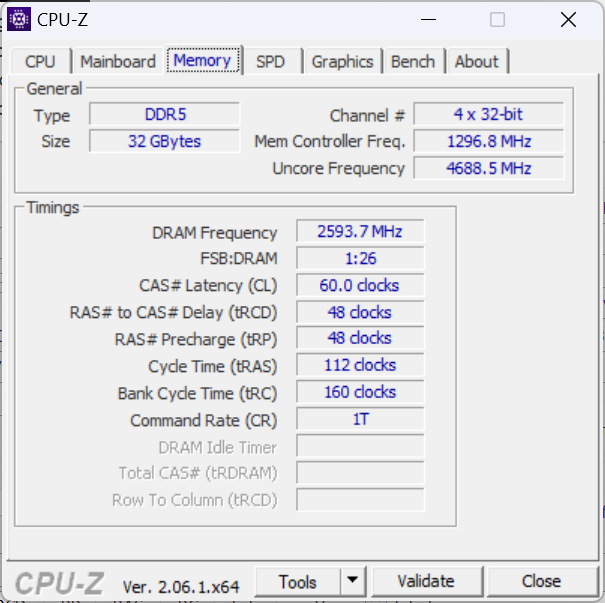
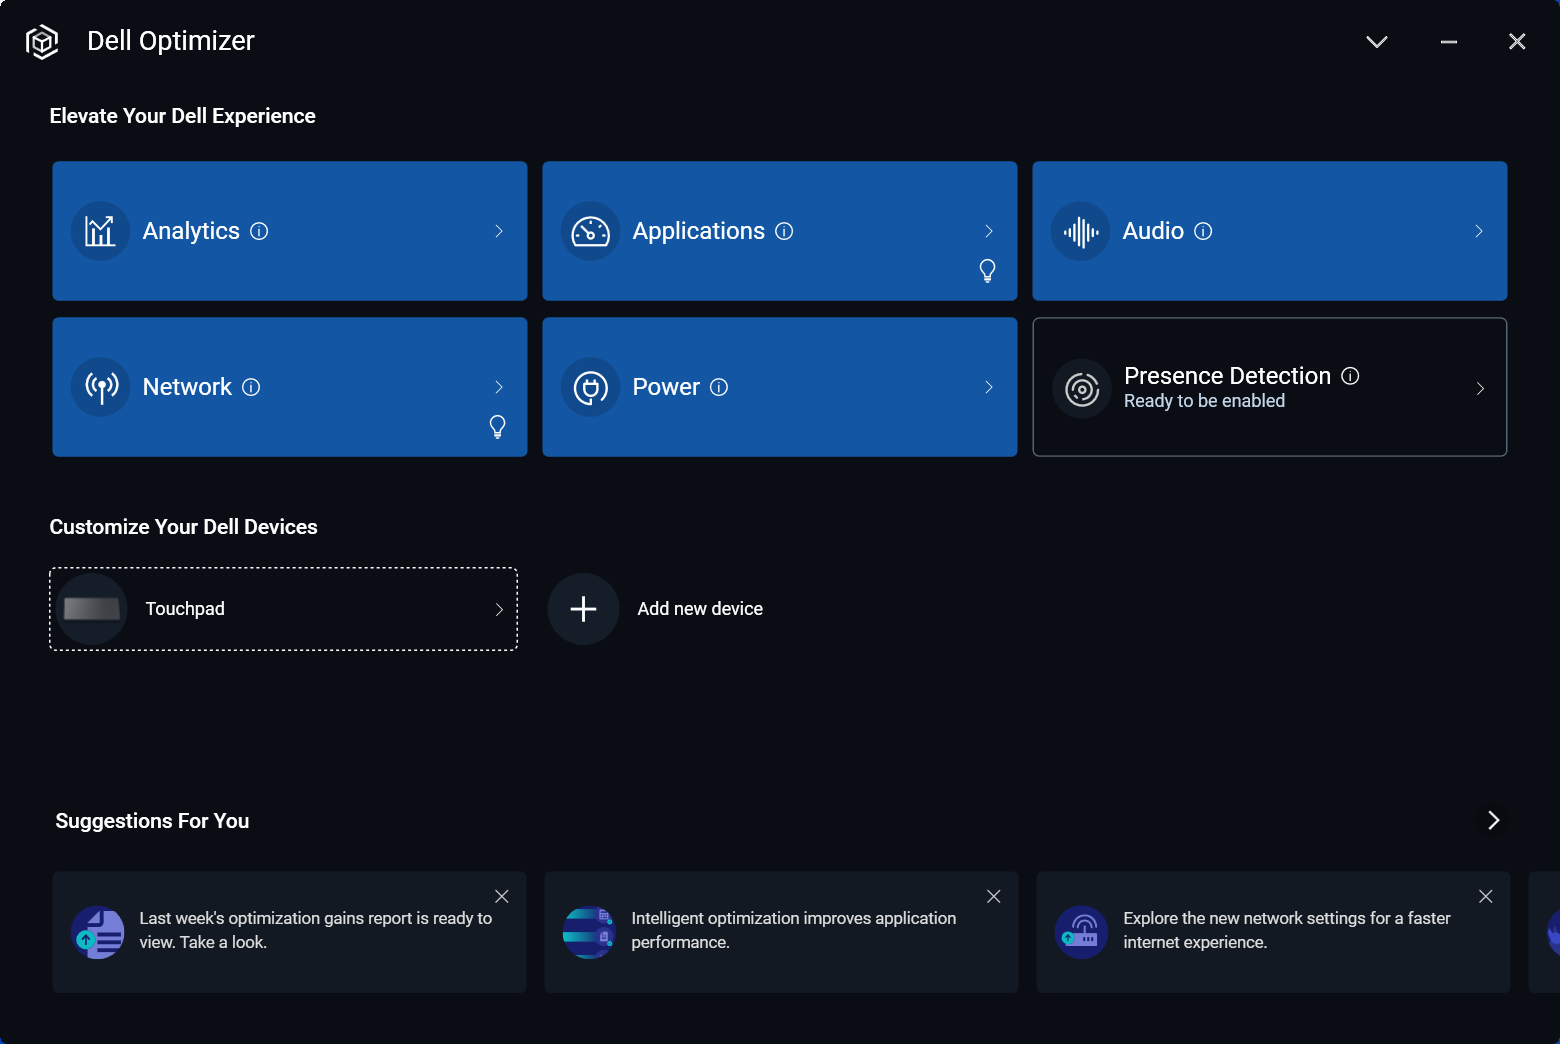
Testomstandigheden
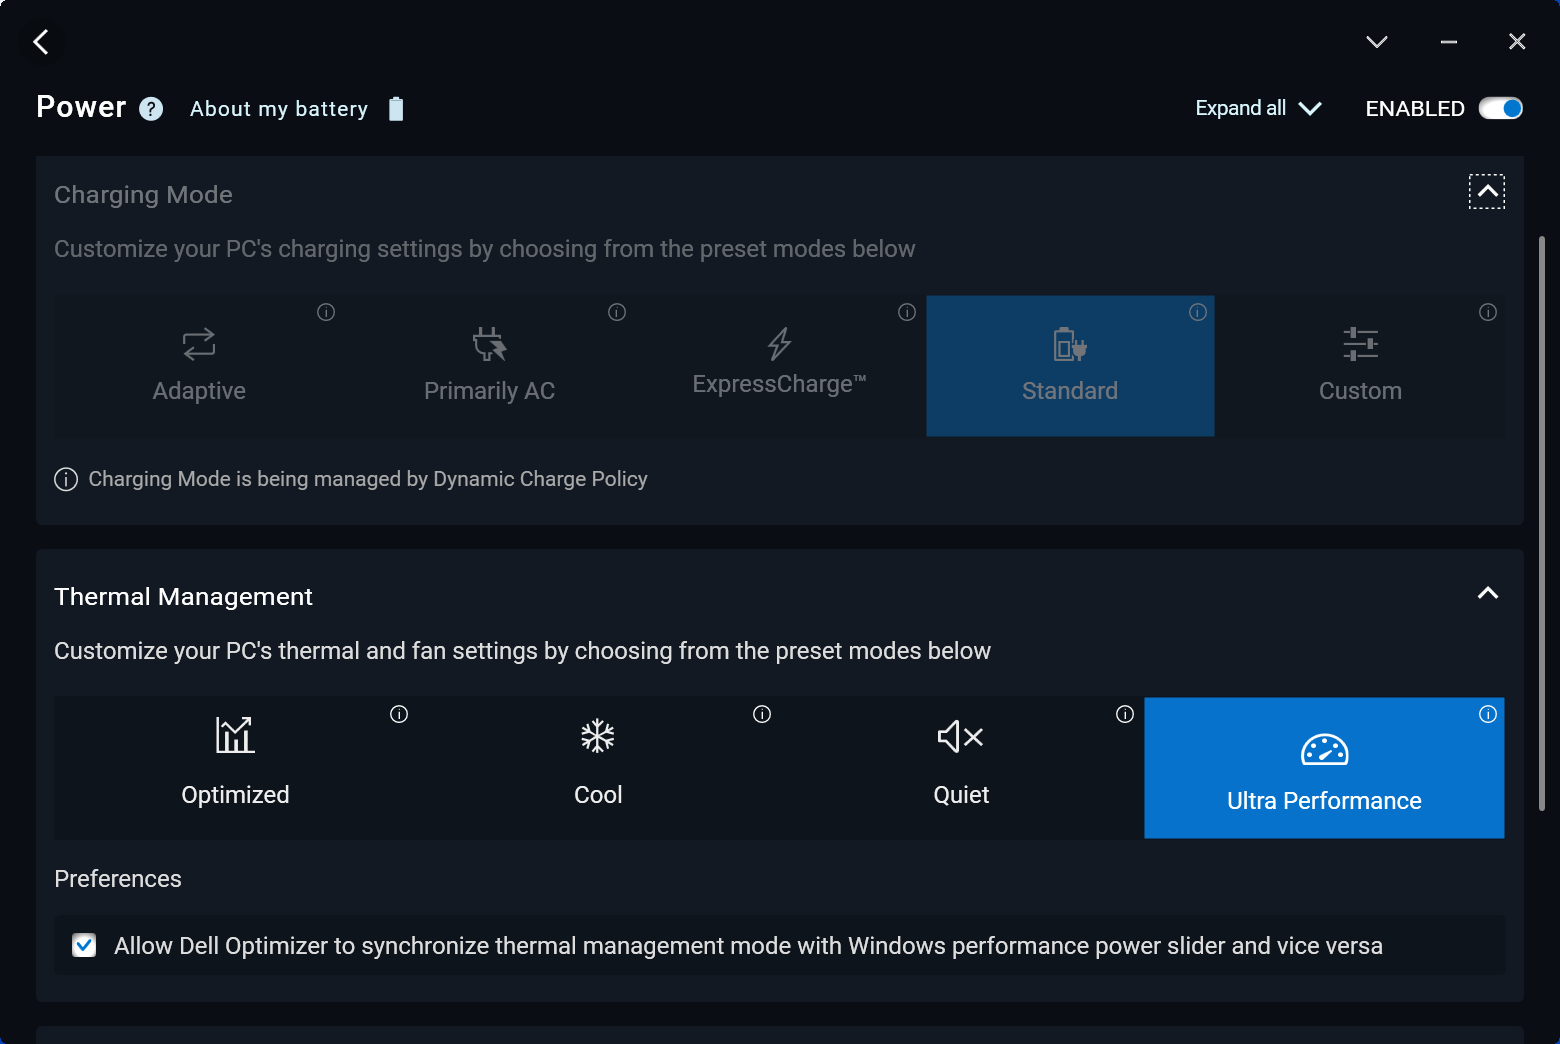
We hebben ons apparaat via de Dell Optimizer-software ingesteld op de Ultra Performance-modus voordat we de onderstaande benchmarks uitvoerden. De Optimizer energieprofielen kunnen eenvoudig worden gesynchroniseerd met de Windows energieprofielen, in tegenstelling tot de gespecialiseerde energieprofielen van de meeste andere fabrikanten.
Advanced Optimus of Optimus 2.0 wordt niet ondersteund. Nieuw voor de Ada Lovelace workstation GPU's is echter de ECC VRAM modus die aan- of uitgezet kan worden via het Nvidia configuratiescherm. Bij het inschakelen van deze functie is een herstart vereist.
Processor
De 13e generatie Core i9-13900H is teleurstellend in de zin dat het geen merkbare sprong voorwaarts is ten opzichte van de 12e generatie van vorig jaar Core i9-12900H. Prestaties, bijvoorbeeld, zou in wezen identiek aan deAsus ProArt StudioBook 16 die op de oudere Core i9-12900H draait, met uitzondering van slechts een kleine 5 tot 10 procent boost in single-threaded bewerkingen. Het is jammer dat de Precision 5680 geen Core i9-13900HX die een veel significantere prestatieboost zou hebben geleverd ten opzichte van elke andere Alder Lake-H mobiele processor.
Merk op dat er ook geen Xeon of W-klasse processoropties zijn, wat betekent dat er geen ondersteuning is voor ECC RAM op de Precision 5680 serie.
Downgraden naar de Core i7-13700H van onze i9-13900H zal naar verwachting de multi-thread prestaties met ongeveer 20 procent verminderen op basis van onze tijd met deSchenker Vision 16 Pro.
Cinebench R15 Multi Loop
Cinebench R23: Multi Core | Single Core
Cinebench R20: CPU (Multi Core) | CPU (Single Core)
Cinebench R15: CPU Multi 64Bit | CPU Single 64Bit
Blender: v2.79 BMW27 CPU
7-Zip 18.03: 7z b 4 | 7z b 4 -mmt1
Geekbench 5.5: Multi-Core | Single-Core
HWBOT x265 Benchmark v2.2: 4k Preset
LibreOffice : 20 Documents To PDF
R Benchmark 2.5: Overall mean
| HWBOT x265 Benchmark v2.2 / 4k Preset | |
| Lenovo Legion Pro 7 16IRX8H | |
| Lenovo ThinkPad P16 G1 RTX A5500 | |
| Asus ProArt StudioBook 16 H7600ZW | |
| Asus ExpertBook B6 Flip B6602FC2 | |
| Dell Precision 5000 5680 | |
| MSI CreatorPro Z16P B12UKST | |
| Dell Precision 7000 7670 Performance | |
| Gemiddeld Intel Core i9-13900H (14.1 - 22.3, n=25) | |
| Lenovo ThinkPad P16 G1 21D6001DMB | |
| Schenker VISION 16 Pro (M23) | |
| HP ZBook Studio 15 G8 | |
| Lenovo ThinkPad P1 G4-20Y4Z9DVUS | |
| Asus ProArt StudioBook 16 W7600H5A-2BL2 | |
| Lenovo ThinkPad P15v G3 21EM001AGE | |
| HP ZBook Studio G7 | |
Cinebench R23: Multi Core | Single Core
Cinebench R20: CPU (Multi Core) | CPU (Single Core)
Cinebench R15: CPU Multi 64Bit | CPU Single 64Bit
Blender: v2.79 BMW27 CPU
7-Zip 18.03: 7z b 4 | 7z b 4 -mmt1
Geekbench 5.5: Multi-Core | Single-Core
HWBOT x265 Benchmark v2.2: 4k Preset
LibreOffice : 20 Documents To PDF
R Benchmark 2.5: Overall mean
* ... kleiner is beter
AIDA64: FP32 Ray-Trace | FPU Julia | CPU SHA3 | CPU Queen | FPU SinJulia | FPU Mandel | CPU AES | CPU ZLib | FP64 Ray-Trace | CPU PhotoWorxx
| Performance rating | |
| Lenovo ThinkPad P16 G1 RTX A5500 | |
| HP ZBook Fury 16 G9 | |
| Dell Precision 5000 5680 | |
| MSI CreatorPro Z16P B12UKST | |
| Asus ExpertBook B6 Flip B6602FC2 | |
| Gemiddeld Intel Core i9-13900H | |
| Dell Precision 7000 7670 Performance | |
| AIDA64 / FP32 Ray-Trace | |
| Lenovo ThinkPad P16 G1 RTX A5500 | |
| HP ZBook Fury 16 G9 | |
| Asus ExpertBook B6 Flip B6602FC2 | |
| Dell Precision 5000 5680 | |
| Dell Precision 7000 7670 Performance | |
| Gemiddeld Intel Core i9-13900H (6788 - 19557, n=25) | |
| MSI CreatorPro Z16P B12UKST | |
| AIDA64 / FPU Julia | |
| HP ZBook Fury 16 G9 | |
| Lenovo ThinkPad P16 G1 RTX A5500 | |
| Asus ExpertBook B6 Flip B6602FC2 | |
| Dell Precision 5000 5680 | |
| Dell Precision 7000 7670 Performance | |
| Gemiddeld Intel Core i9-13900H (22551 - 95579, n=25) | |
| MSI CreatorPro Z16P B12UKST | |
| AIDA64 / CPU SHA3 | |
| Lenovo ThinkPad P16 G1 RTX A5500 | |
| HP ZBook Fury 16 G9 | |
| MSI CreatorPro Z16P B12UKST | |
| Gemiddeld Intel Core i9-13900H (2491 - 4270, n=25) | |
| Dell Precision 5000 5680 | |
| Asus ExpertBook B6 Flip B6602FC2 | |
| Dell Precision 7000 7670 Performance | |
| AIDA64 / CPU Queen | |
| Dell Precision 5000 5680 | |
| Gemiddeld Intel Core i9-13900H (65121 - 120936, n=25) | |
| Lenovo ThinkPad P16 G1 RTX A5500 | |
| Dell Precision 7000 7670 Performance | |
| Asus ExpertBook B6 Flip B6602FC2 | |
| HP ZBook Fury 16 G9 | |
| MSI CreatorPro Z16P B12UKST | |
| AIDA64 / FPU SinJulia | |
| Lenovo ThinkPad P16 G1 RTX A5500 | |
| HP ZBook Fury 16 G9 | |
| Asus ExpertBook B6 Flip B6602FC2 | |
| Dell Precision 7000 7670 Performance | |
| Dell Precision 5000 5680 | |
| Gemiddeld Intel Core i9-13900H (6108 - 11631, n=25) | |
| MSI CreatorPro Z16P B12UKST | |
| AIDA64 / FPU Mandel | |
| HP ZBook Fury 16 G9 | |
| Lenovo ThinkPad P16 G1 RTX A5500 | |
| Asus ExpertBook B6 Flip B6602FC2 | |
| Dell Precision 5000 5680 | |
| Gemiddeld Intel Core i9-13900H (11283 - 48474, n=25) | |
| Dell Precision 7000 7670 Performance | |
| MSI CreatorPro Z16P B12UKST | |
| AIDA64 / CPU AES | |
| MSI CreatorPro Z16P B12UKST | |
| HP ZBook Fury 16 G9 | |
| Lenovo ThinkPad P16 G1 RTX A5500 | |
| Gemiddeld Intel Core i9-13900H (3691 - 149377, n=25) | |
| Asus ExpertBook B6 Flip B6602FC2 | |
| Dell Precision 7000 7670 Performance | |
| Dell Precision 5000 5680 | |
| AIDA64 / CPU ZLib | |
| Lenovo ThinkPad P16 G1 RTX A5500 | |
| HP ZBook Fury 16 G9 | |
| Gemiddeld Intel Core i9-13900H (789 - 1254, n=25) | |
| Asus ExpertBook B6 Flip B6602FC2 | |
| MSI CreatorPro Z16P B12UKST | |
| Dell Precision 5000 5680 | |
| Dell Precision 7000 7670 Performance | |
| AIDA64 / FP64 Ray-Trace | |
| Lenovo ThinkPad P16 G1 RTX A5500 | |
| HP ZBook Fury 16 G9 | |
| Asus ExpertBook B6 Flip B6602FC2 | |
| Dell Precision 5000 5680 | |
| Dell Precision 7000 7670 Performance | |
| Gemiddeld Intel Core i9-13900H (3655 - 10716, n=25) | |
| MSI CreatorPro Z16P B12UKST | |
| AIDA64 / CPU PhotoWorxx | |
| Dell Precision 5000 5680 | |
| MSI CreatorPro Z16P B12UKST | |
| Dell Precision 7000 7670 Performance | |
| Lenovo ThinkPad P16 G1 RTX A5500 | |
| Gemiddeld Intel Core i9-13900H (10871 - 50488, n=25) | |
| HP ZBook Fury 16 G9 | |
| Asus ExpertBook B6 Flip B6602FC2 | |
Systeemprestaties
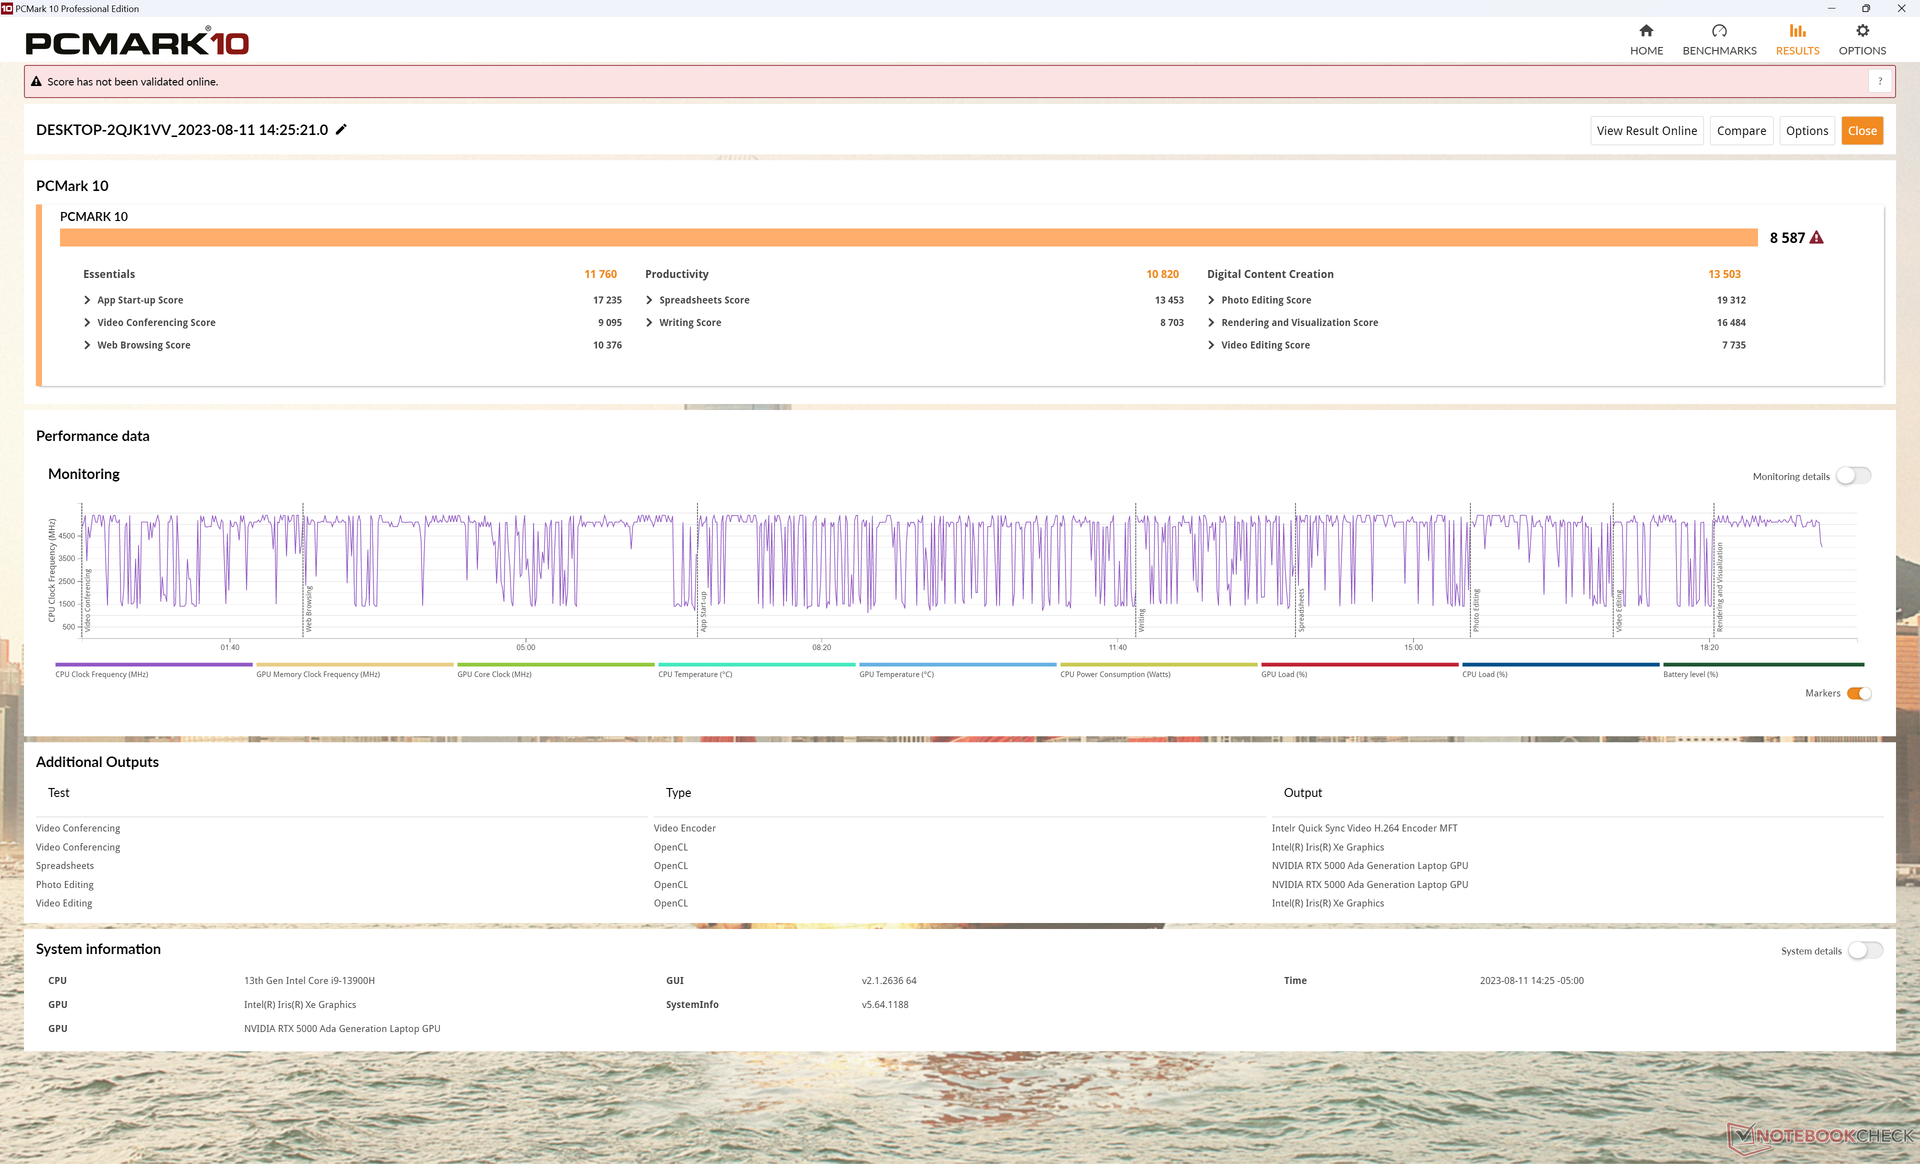
PCMark scores zijn hoger dan op de meeste andere werkstations met relatief grote marges, waaronder zelfs enkele krachtpatsers zoals de HP ZBook Fury 16 G9 ofPrecision 7670 Prestaties. Dit kan worden toegeschreven aan onze RAID 0 SSD configuratie en RTX 5000 GPU terwijl de meeste andere werkstations draaien op enkele SSD's en oudere generatie GPU's.
CrossMark: Overall | Productivity | Creativity | Responsiveness
| PCMark 10 / Score | |
| Dell Precision 5000 5680 | |
| Gemiddeld Intel Core i9-13900H, NVIDIA RTX 5000 Ada Generation Laptop (n=1) | |
| Asus ExpertBook B6 Flip B6602FC2 | |
| Lenovo ThinkPad P16 G1 RTX A5500 | |
| MSI CreatorPro Z16P B12UKST | |
| HP ZBook Fury 16 G9 | |
| Dell Precision 7000 7670 Performance | |
| PCMark 10 / Essentials | |
| Dell Precision 5000 5680 | |
| Gemiddeld Intel Core i9-13900H, NVIDIA RTX 5000 Ada Generation Laptop (n=1) | |
| Dell Precision 7000 7670 Performance | |
| HP ZBook Fury 16 G9 | |
| Lenovo ThinkPad P16 G1 RTX A5500 | |
| Asus ExpertBook B6 Flip B6602FC2 | |
| MSI CreatorPro Z16P B12UKST | |
| PCMark 10 / Productivity | |
| Dell Precision 5000 5680 | |
| Gemiddeld Intel Core i9-13900H, NVIDIA RTX 5000 Ada Generation Laptop (n=1) | |
| Asus ExpertBook B6 Flip B6602FC2 | |
| Lenovo ThinkPad P16 G1 RTX A5500 | |
| MSI CreatorPro Z16P B12UKST | |
| HP ZBook Fury 16 G9 | |
| Dell Precision 7000 7670 Performance | |
| PCMark 10 / Digital Content Creation | |
| Dell Precision 5000 5680 | |
| Gemiddeld Intel Core i9-13900H, NVIDIA RTX 5000 Ada Generation Laptop (n=1) | |
| Lenovo ThinkPad P16 G1 RTX A5500 | |
| MSI CreatorPro Z16P B12UKST | |
| Dell Precision 7000 7670 Performance | |
| HP ZBook Fury 16 G9 | |
| Asus ExpertBook B6 Flip B6602FC2 | |
| CrossMark / Overall | |
| Asus ExpertBook B6 Flip B6602FC2 | |
| MSI CreatorPro Z16P B12UKST | |
| Dell Precision 5000 5680 | |
| Gemiddeld Intel Core i9-13900H, NVIDIA RTX 5000 Ada Generation Laptop (n=1) | |
| HP ZBook Fury 16 G9 | |
| Lenovo ThinkPad P16 G1 RTX A5500 | |
| Dell Precision 7000 7670 Performance | |
| CrossMark / Productivity | |
| Asus ExpertBook B6 Flip B6602FC2 | |
| MSI CreatorPro Z16P B12UKST | |
| Dell Precision 5000 5680 | |
| Gemiddeld Intel Core i9-13900H, NVIDIA RTX 5000 Ada Generation Laptop (n=1) | |
| HP ZBook Fury 16 G9 | |
| Lenovo ThinkPad P16 G1 RTX A5500 | |
| Dell Precision 7000 7670 Performance | |
| CrossMark / Creativity | |
| Lenovo ThinkPad P16 G1 RTX A5500 | |
| Dell Precision 5000 5680 | |
| Gemiddeld Intel Core i9-13900H, NVIDIA RTX 5000 Ada Generation Laptop (n=1) | |
| Asus ExpertBook B6 Flip B6602FC2 | |
| HP ZBook Fury 16 G9 | |
| MSI CreatorPro Z16P B12UKST | |
| Dell Precision 7000 7670 Performance | |
| CrossMark / Responsiveness | |
| MSI CreatorPro Z16P B12UKST | |
| Asus ExpertBook B6 Flip B6602FC2 | |
| HP ZBook Fury 16 G9 | |
| Dell Precision 5000 5680 | |
| Gemiddeld Intel Core i9-13900H, NVIDIA RTX 5000 Ada Generation Laptop (n=1) | |
| Dell Precision 7000 7670 Performance | |
| Lenovo ThinkPad P16 G1 RTX A5500 | |
| PCMark 10 Score | 8587 punten | |
Help | ||
| AIDA64 / Memory Copy | |
| Dell Precision 5000 5680 | |
| Dell Precision 7000 7670 Performance | |
| Lenovo ThinkPad P16 G1 RTX A5500 | |
| MSI CreatorPro Z16P B12UKST | |
| Gemiddeld Intel Core i9-13900H (37448 - 74486, n=25) | |
| HP ZBook Fury 16 G9 | |
| Asus ExpertBook B6 Flip B6602FC2 | |
| AIDA64 / Memory Read | |
| Dell Precision 7000 7670 Performance | |
| Dell Precision 5000 5680 | |
| MSI CreatorPro Z16P B12UKST | |
| Lenovo ThinkPad P16 G1 RTX A5500 | |
| Gemiddeld Intel Core i9-13900H (41599 - 75433, n=25) | |
| Asus ExpertBook B6 Flip B6602FC2 | |
| HP ZBook Fury 16 G9 | |
| AIDA64 / Memory Write | |
| Dell Precision 5000 5680 | |
| MSI CreatorPro Z16P B12UKST | |
| Dell Precision 7000 7670 Performance | |
| Gemiddeld Intel Core i9-13900H (36152 - 88505, n=25) | |
| Lenovo ThinkPad P16 G1 RTX A5500 | |
| Asus ExpertBook B6 Flip B6602FC2 | |
| HP ZBook Fury 16 G9 | |
| AIDA64 / Memory Latency | |
| MSI CreatorPro Z16P B12UKST | |
| Asus ExpertBook B6 Flip B6602FC2 | |
| Dell Precision 5000 5680 | |
| HP ZBook Fury 16 G9 | |
| Lenovo ThinkPad P16 G1 RTX A5500 | |
| Gemiddeld Intel Core i9-13900H (75.8 - 102.3, n=25) | |
| Dell Precision 7000 7670 Performance | |
* ... kleiner is beter
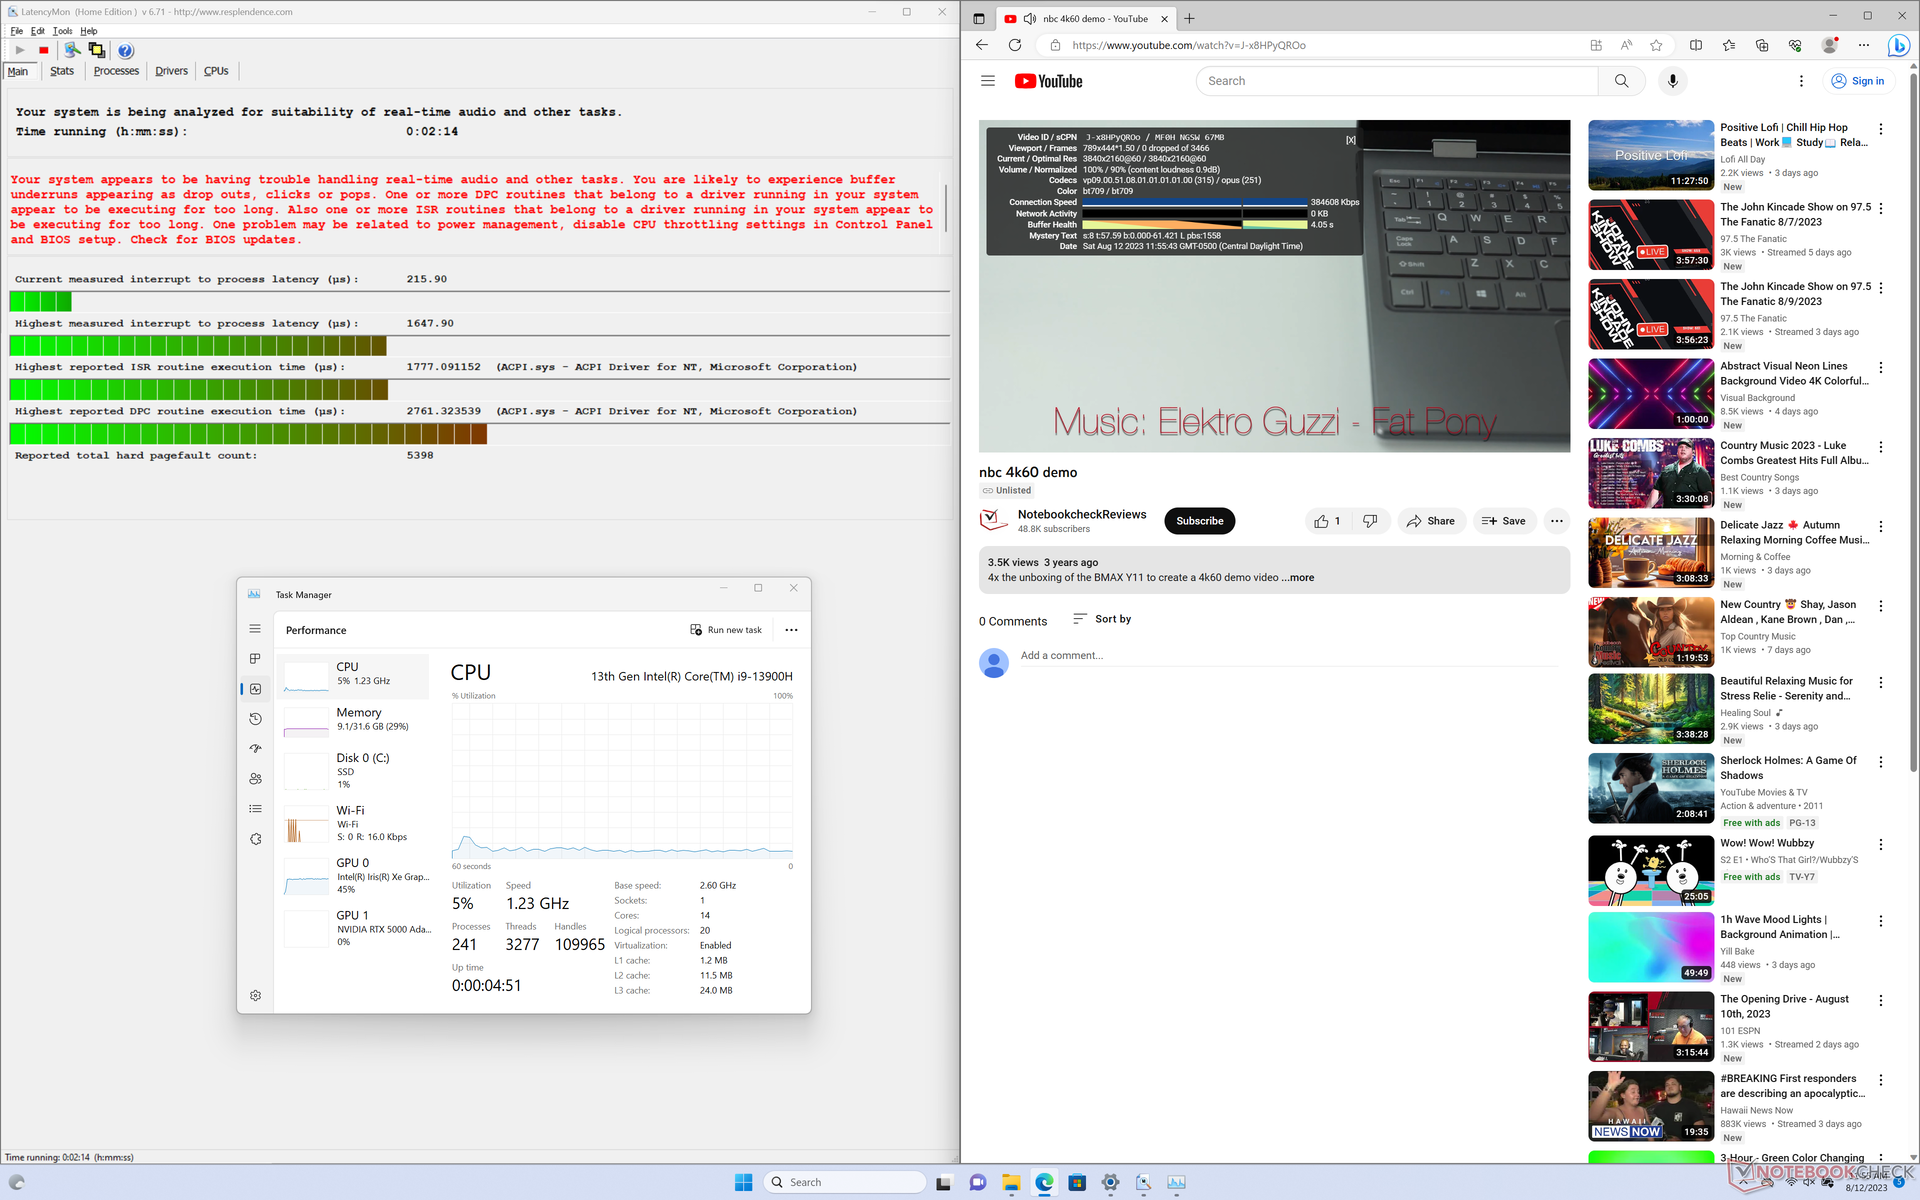
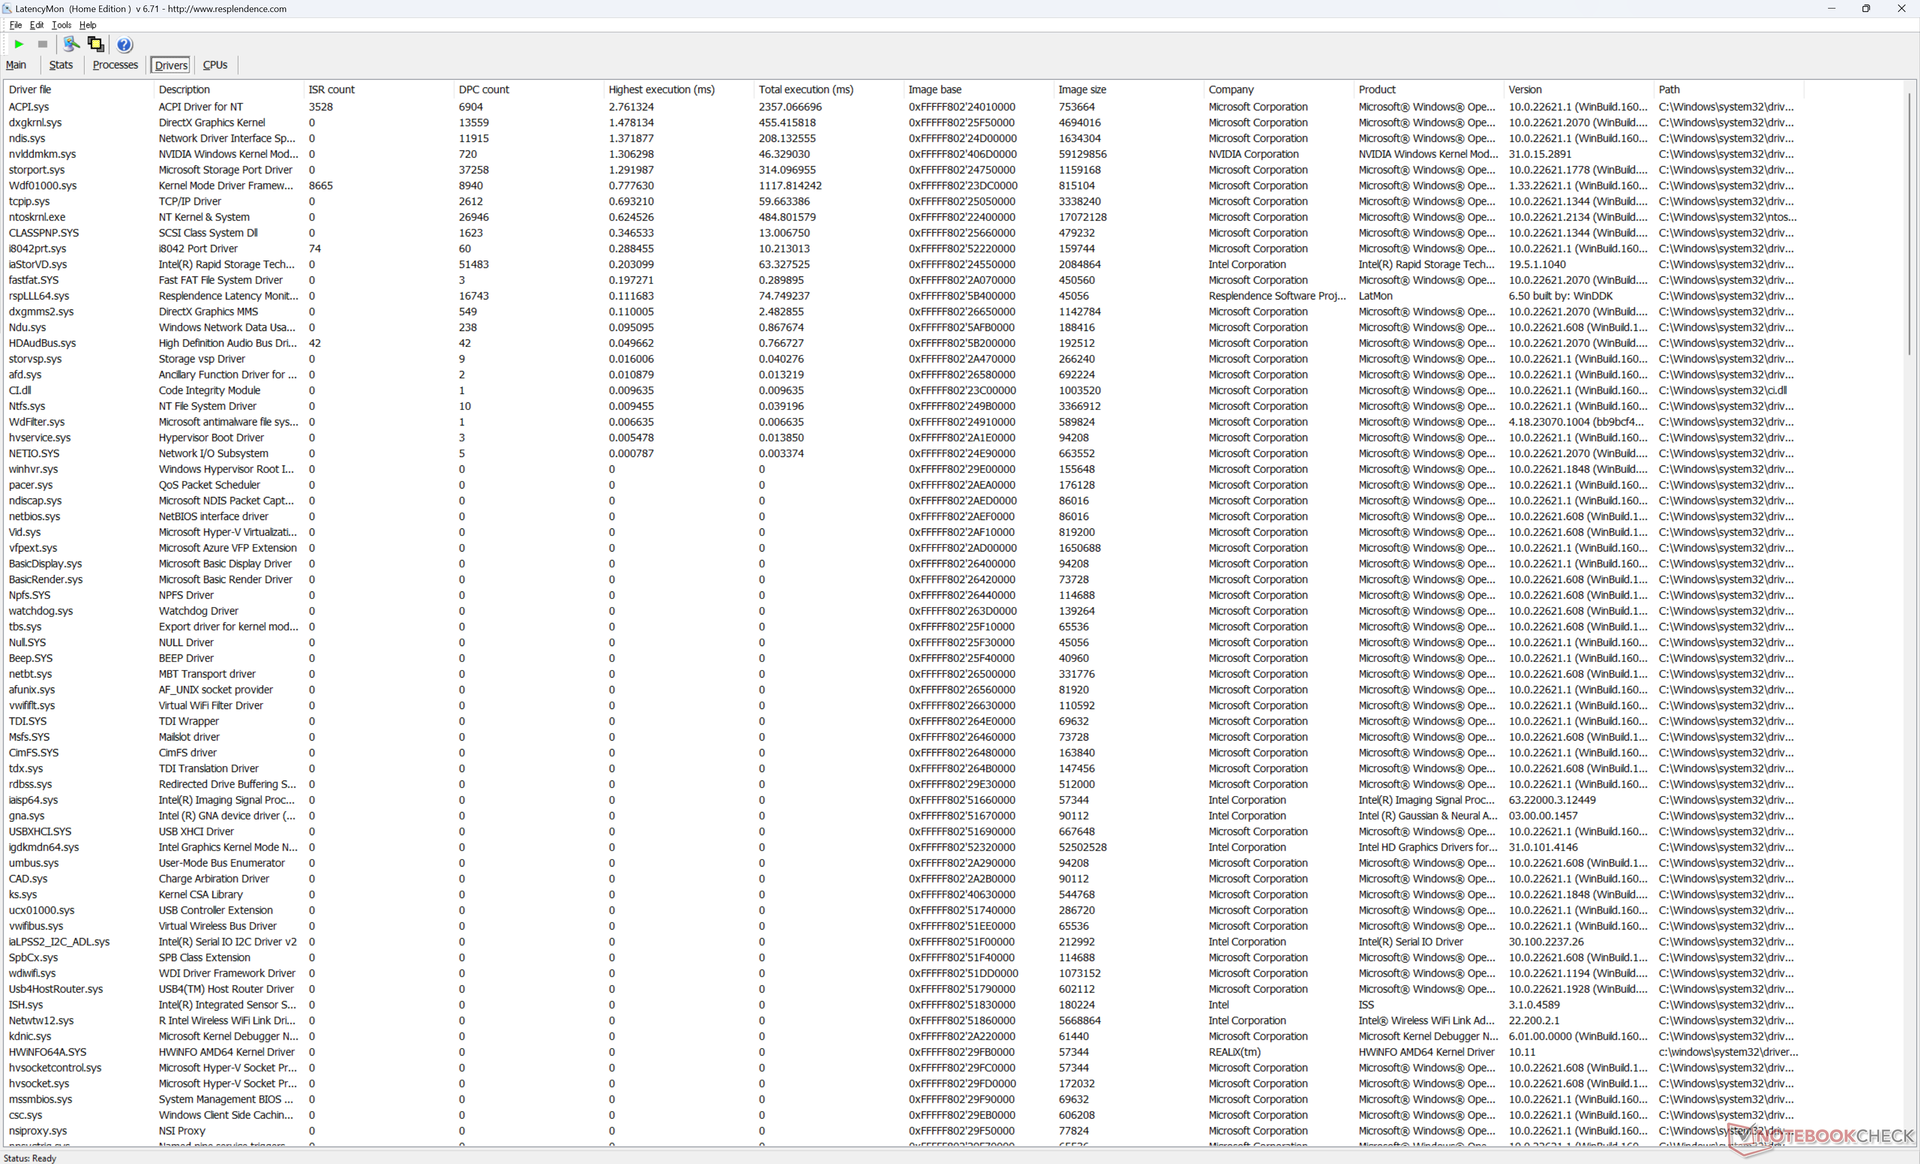
DPC latentie
LatencyMon onthult lichte DPC-problemen bij het openen van meerdere browsertabbladen van onze startpagina, vergelijkbaar met wat we hebben waargenomen op de Precision 7670. het afspelen van 4K-video met 60 FPS is verder perfect zonder dropped frames.
| DPC Latencies / LatencyMon - interrupt to process latency (max), Web, Youtube, Prime95 | |
| HP ZBook Fury 16 G9 | |
| Asus ExpertBook B6 Flip B6602FC2 | |
| Dell Precision 7000 7670 Performance | |
| Dell Precision 5000 5680 | |
| Lenovo ThinkPad P16 G1 RTX A5500 | |
| MSI CreatorPro Z16P B12UKST | |
* ... kleiner is beter
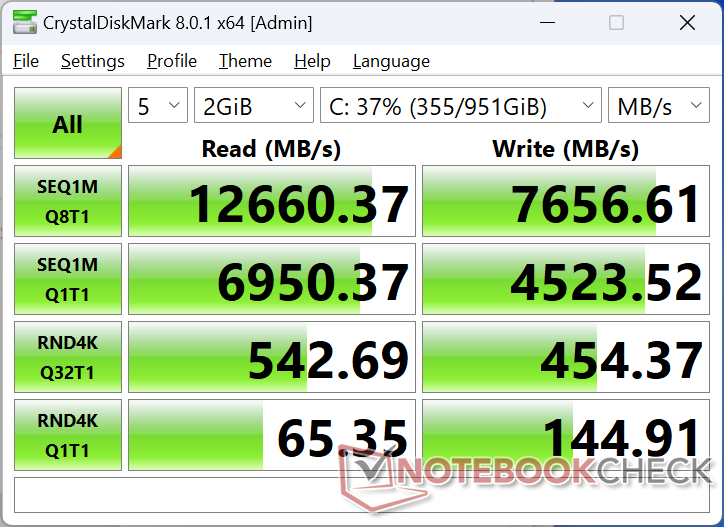
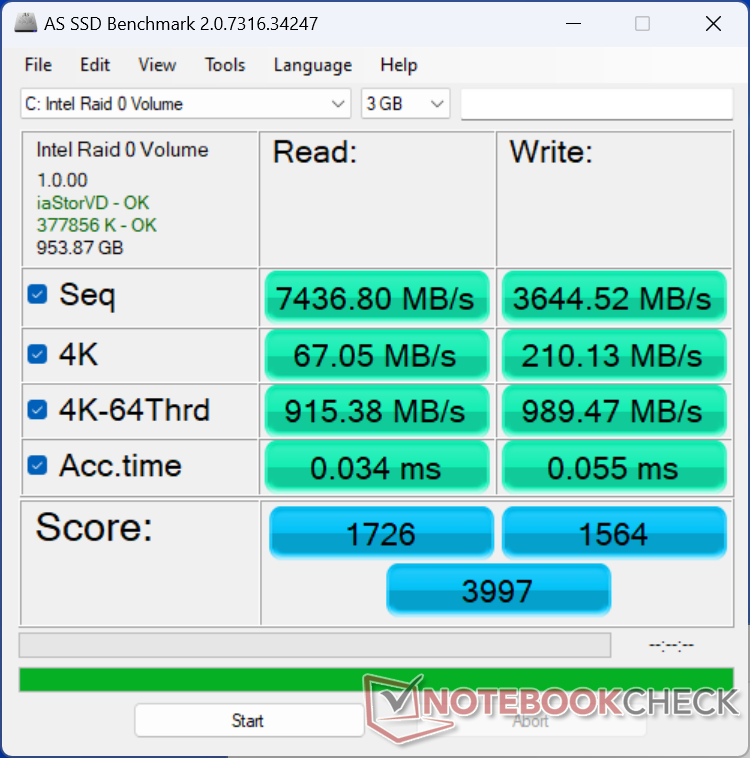
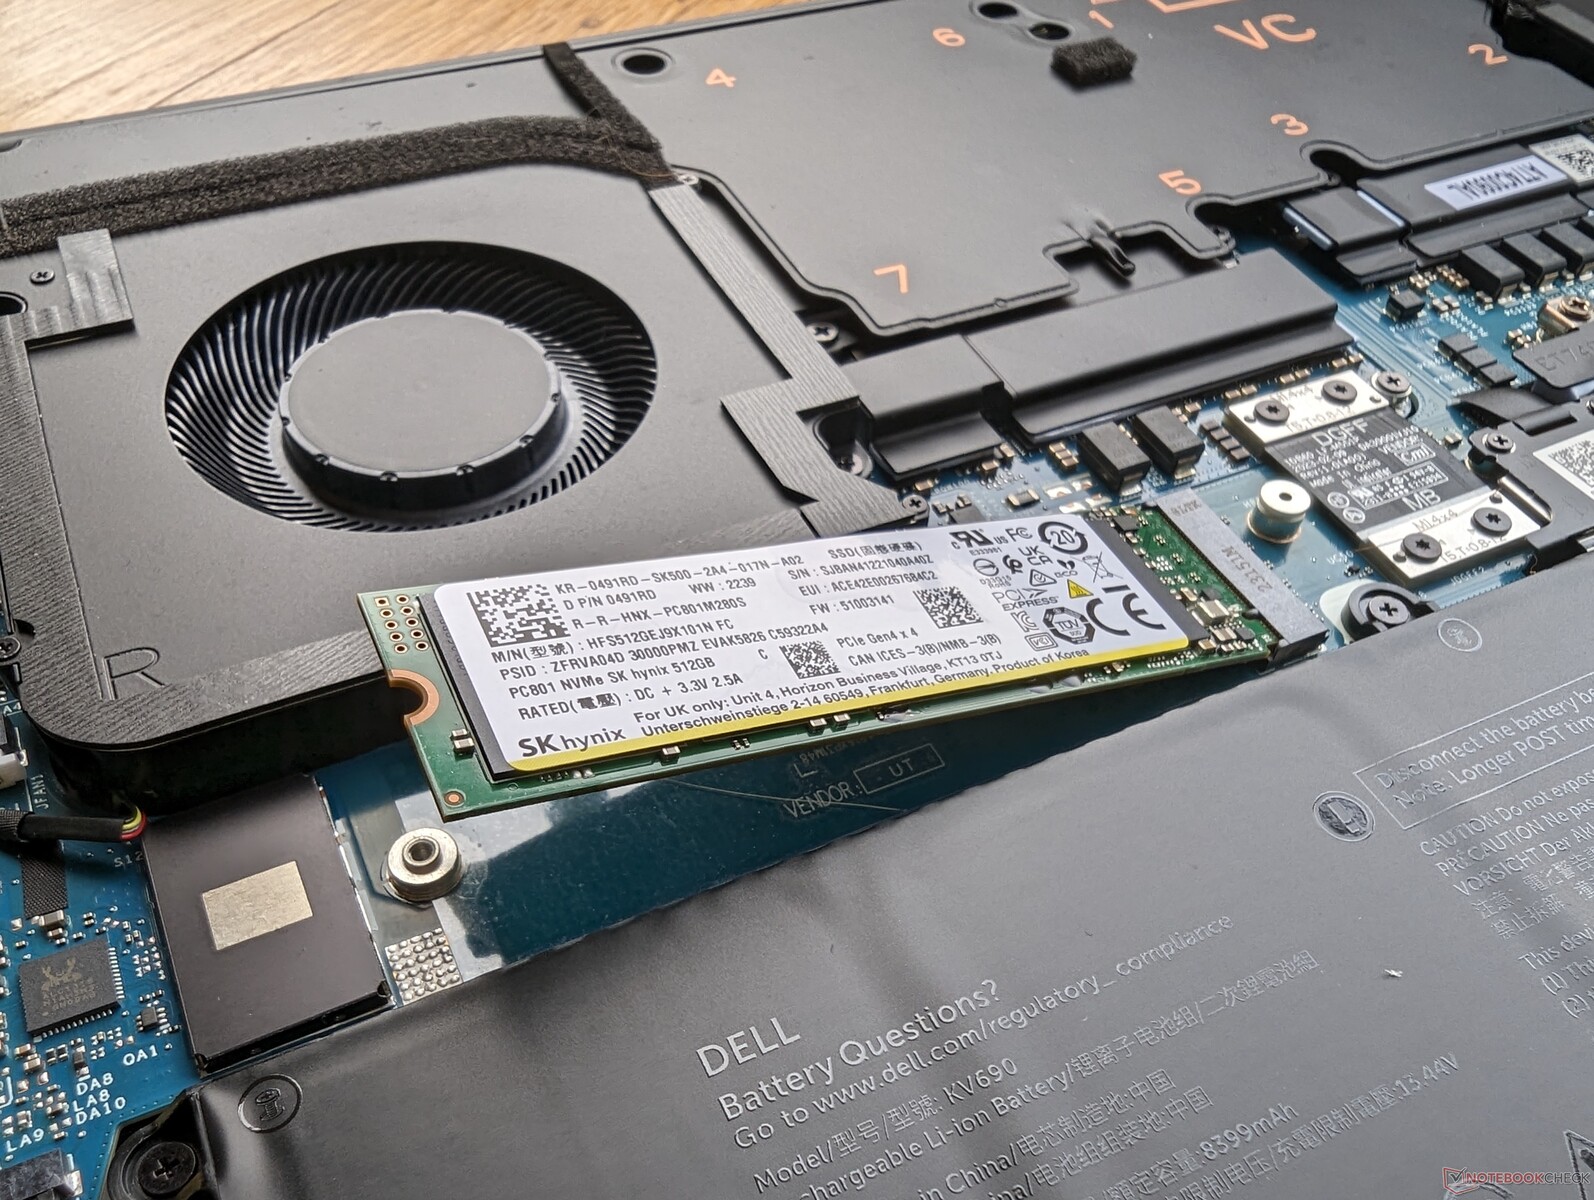
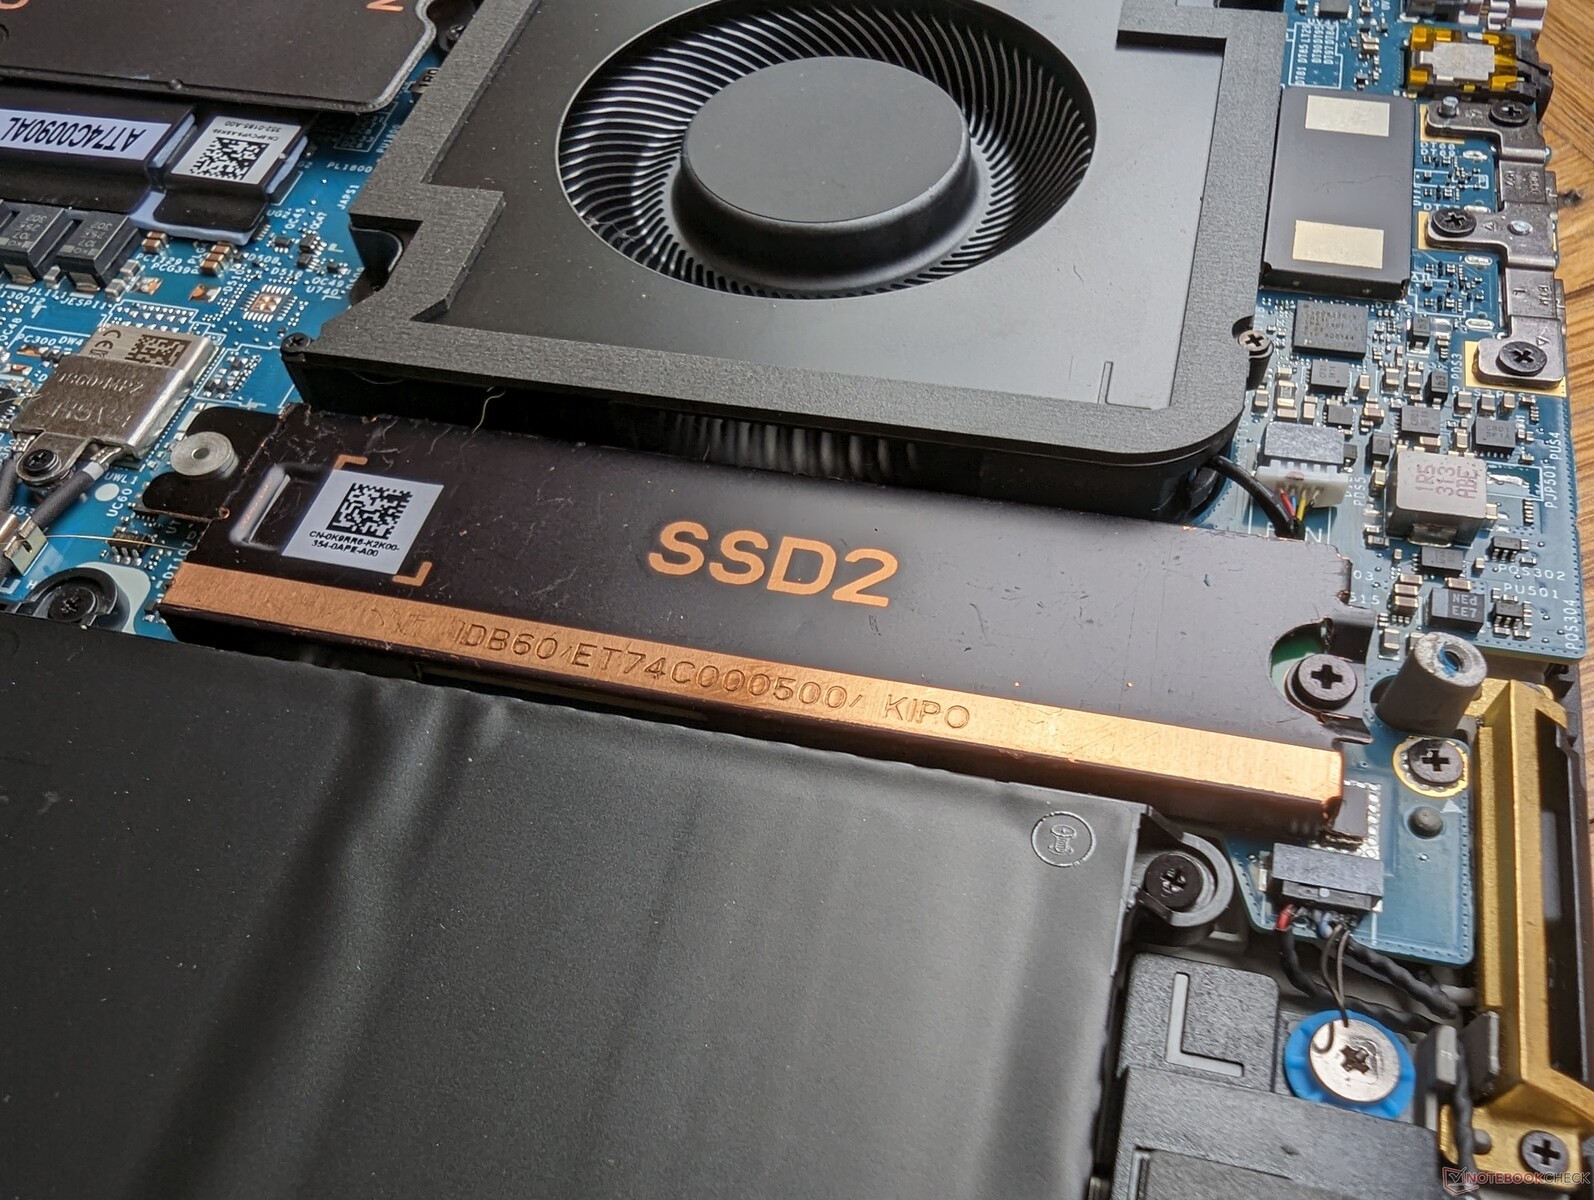
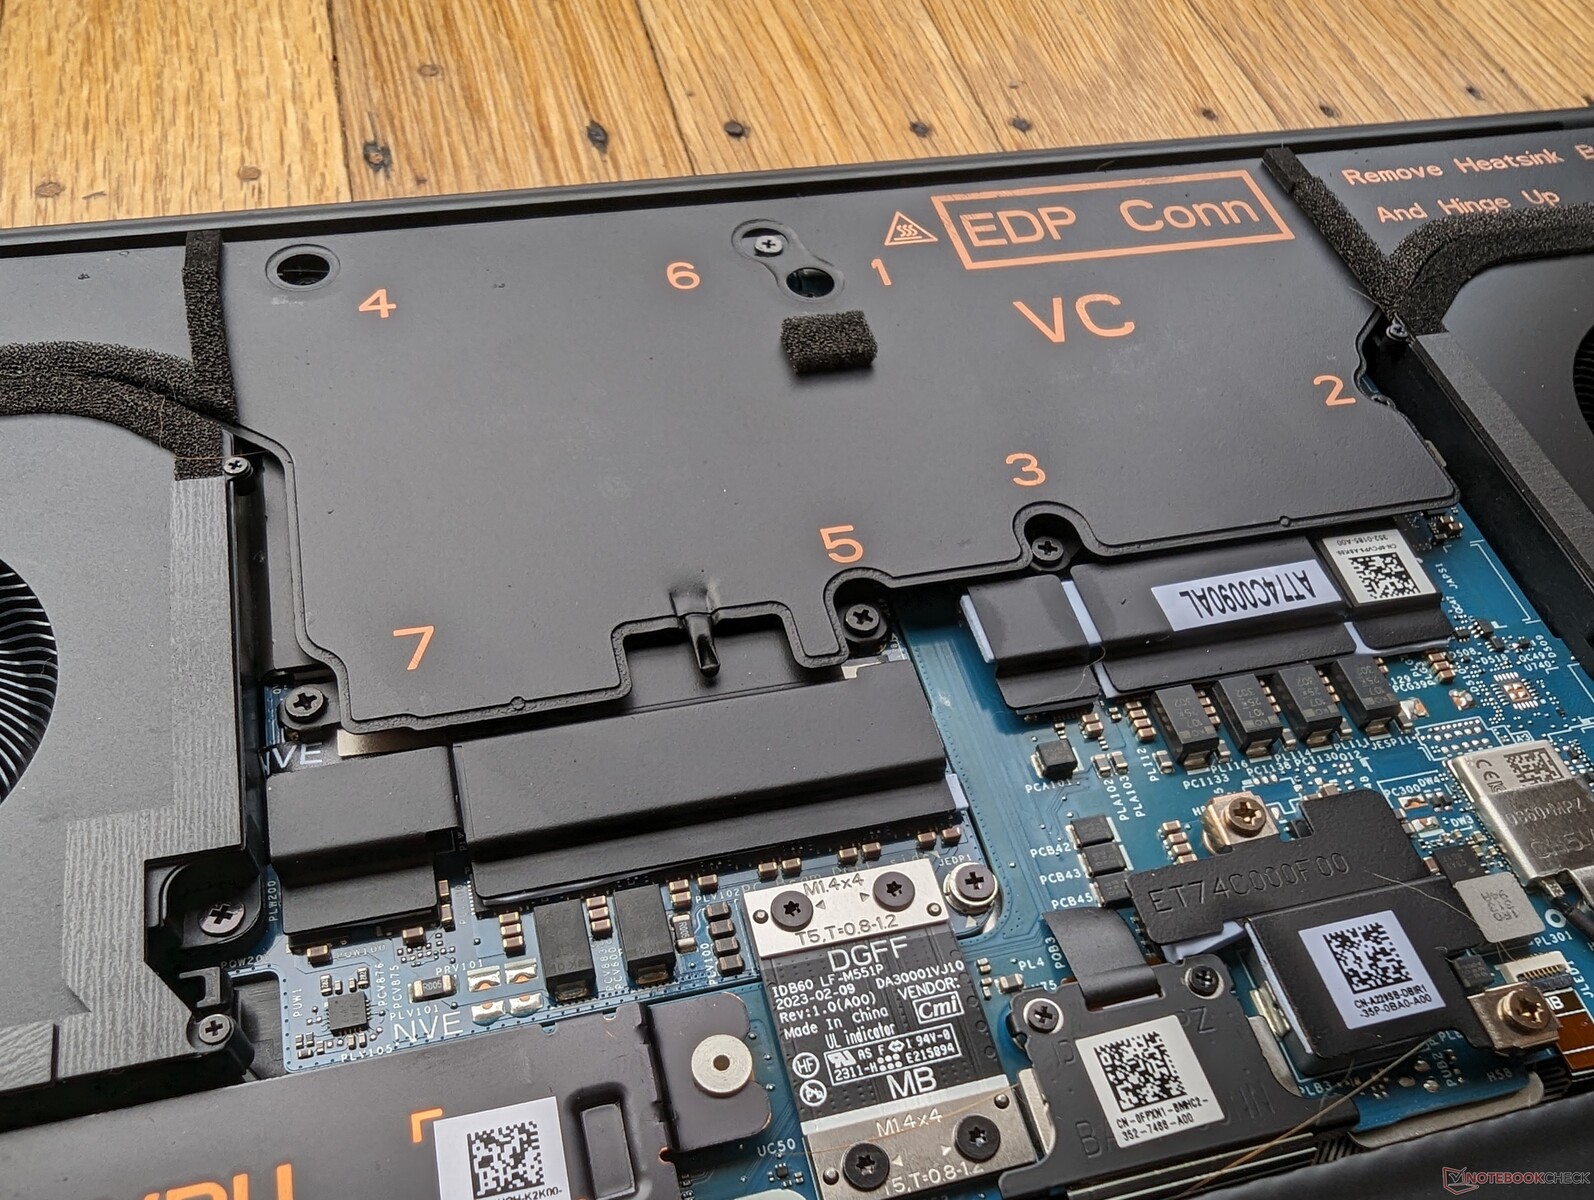
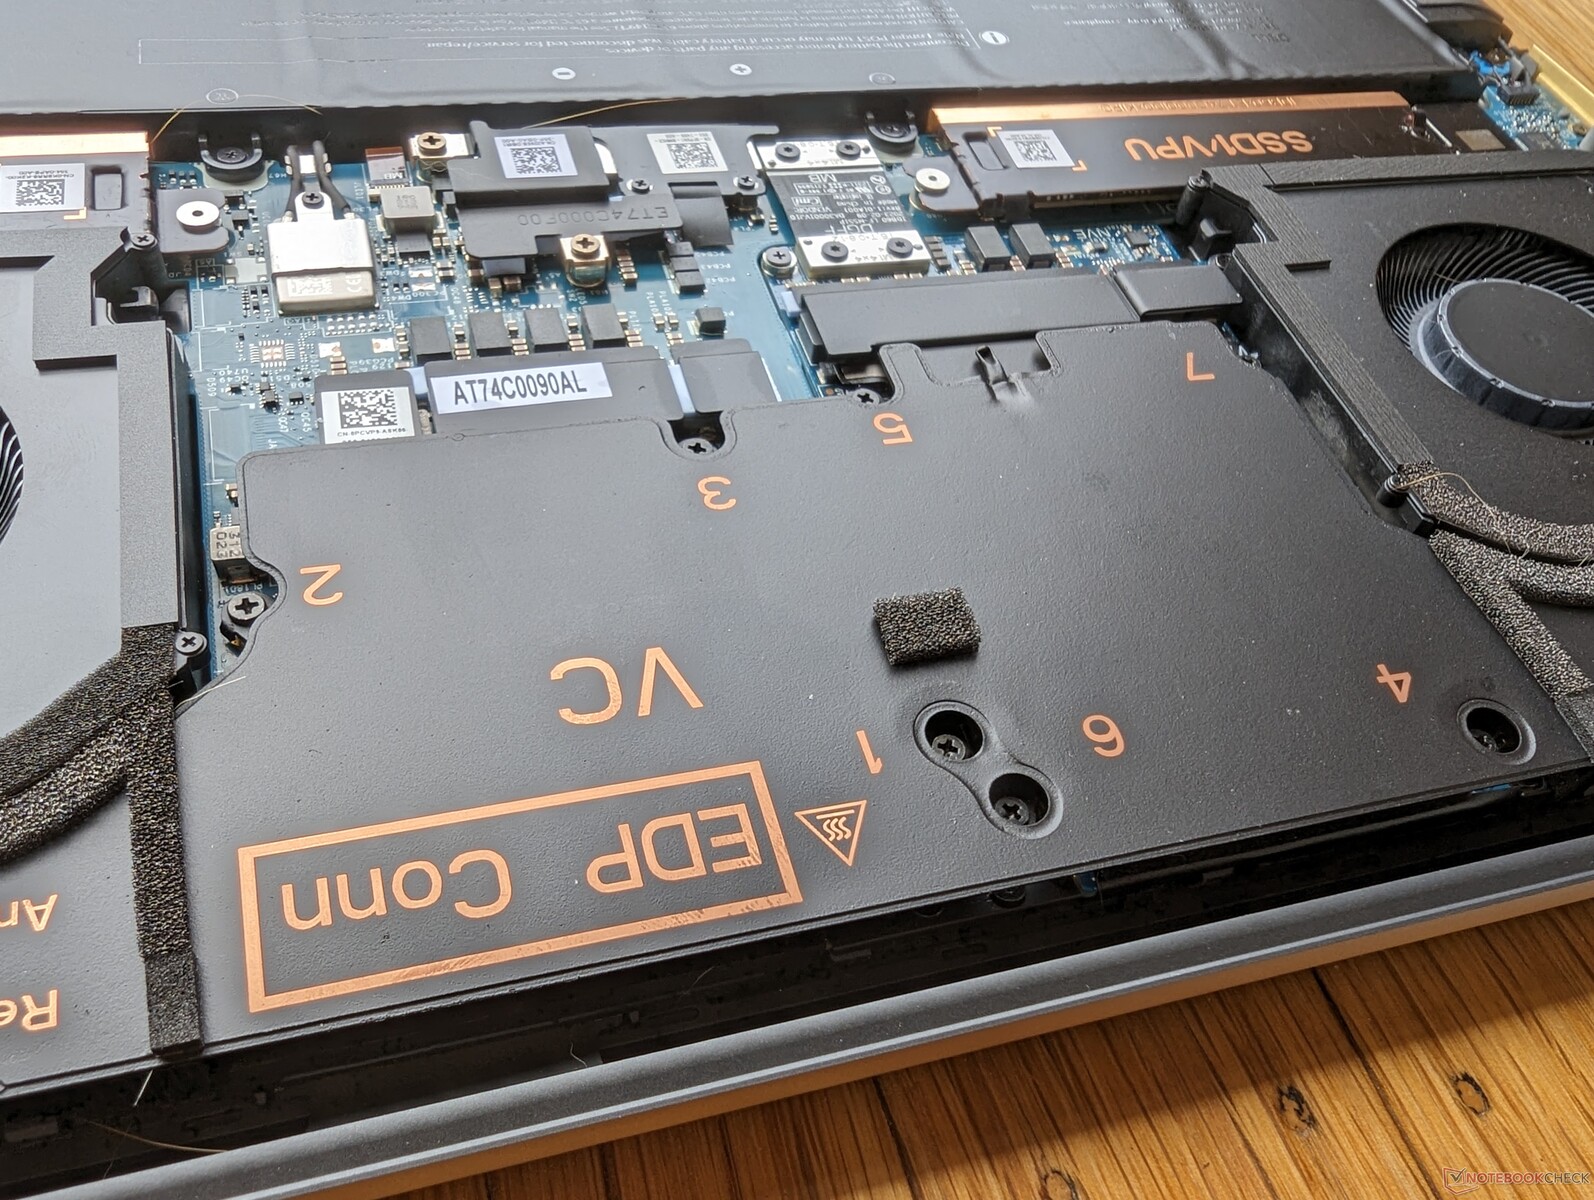
Opslagapparaten - Tot twee PCIe4 x4 NVMe SSD's
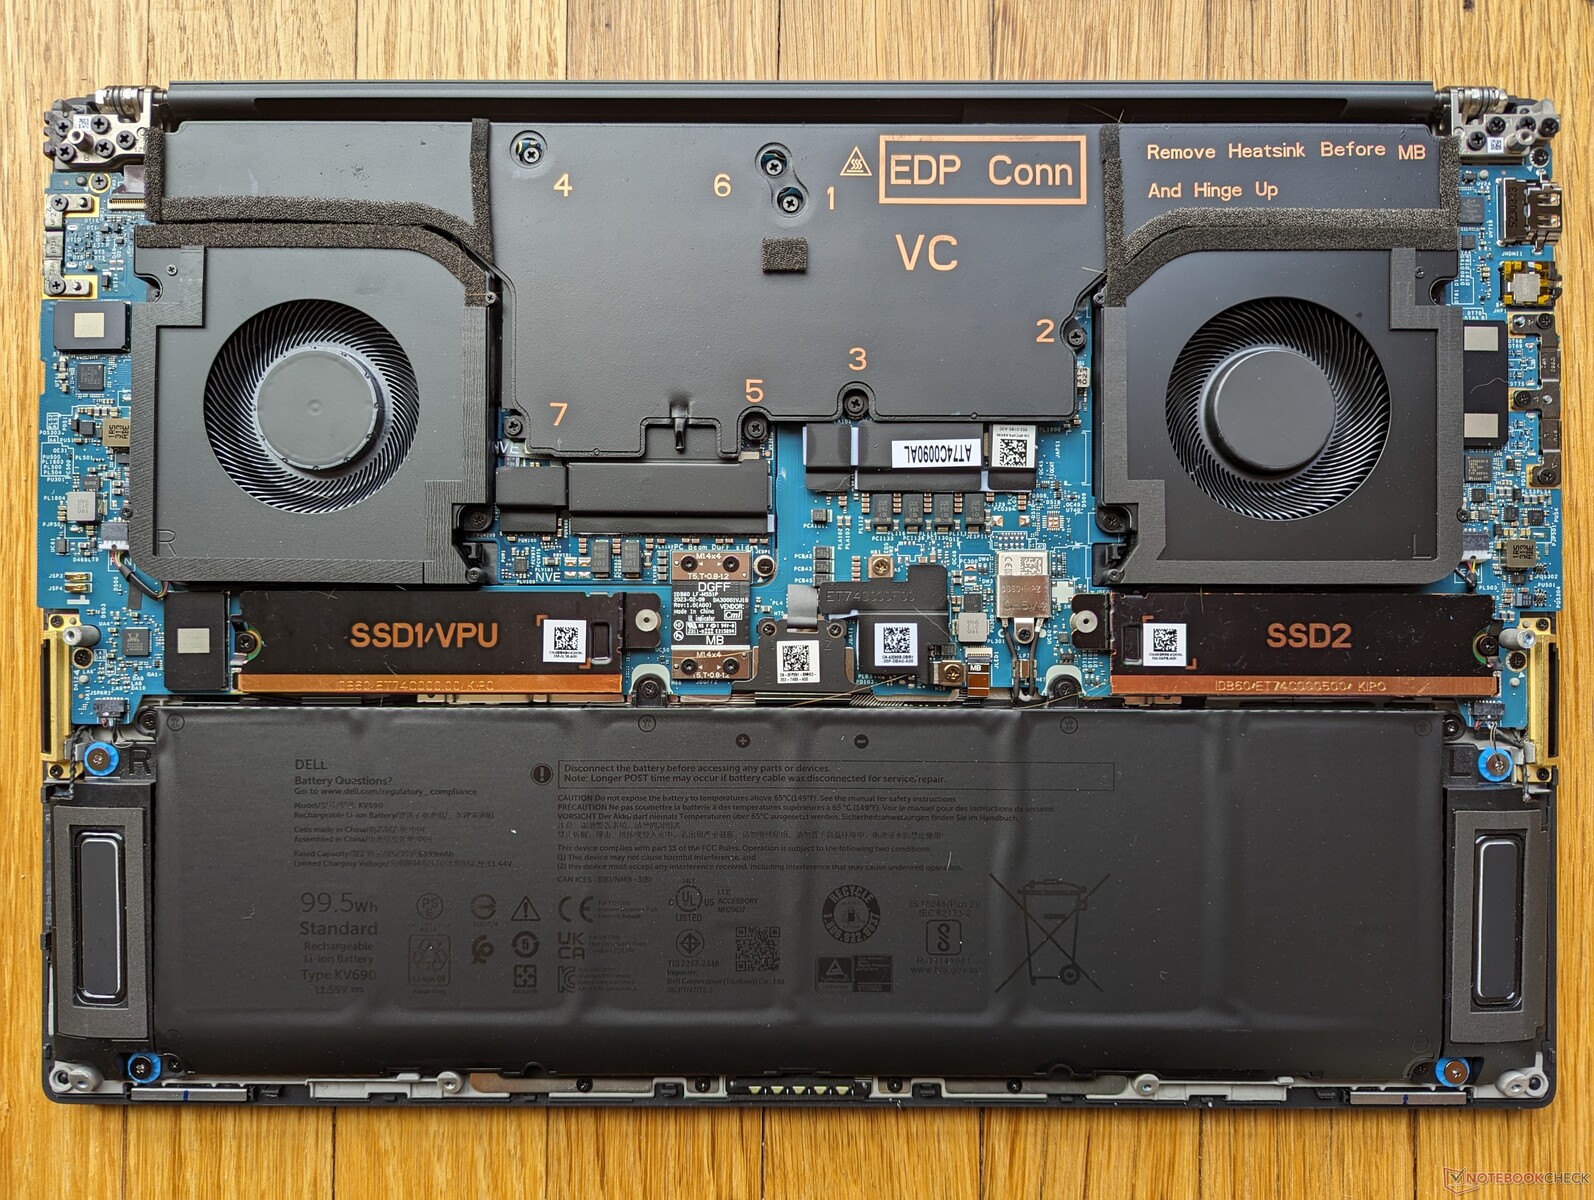
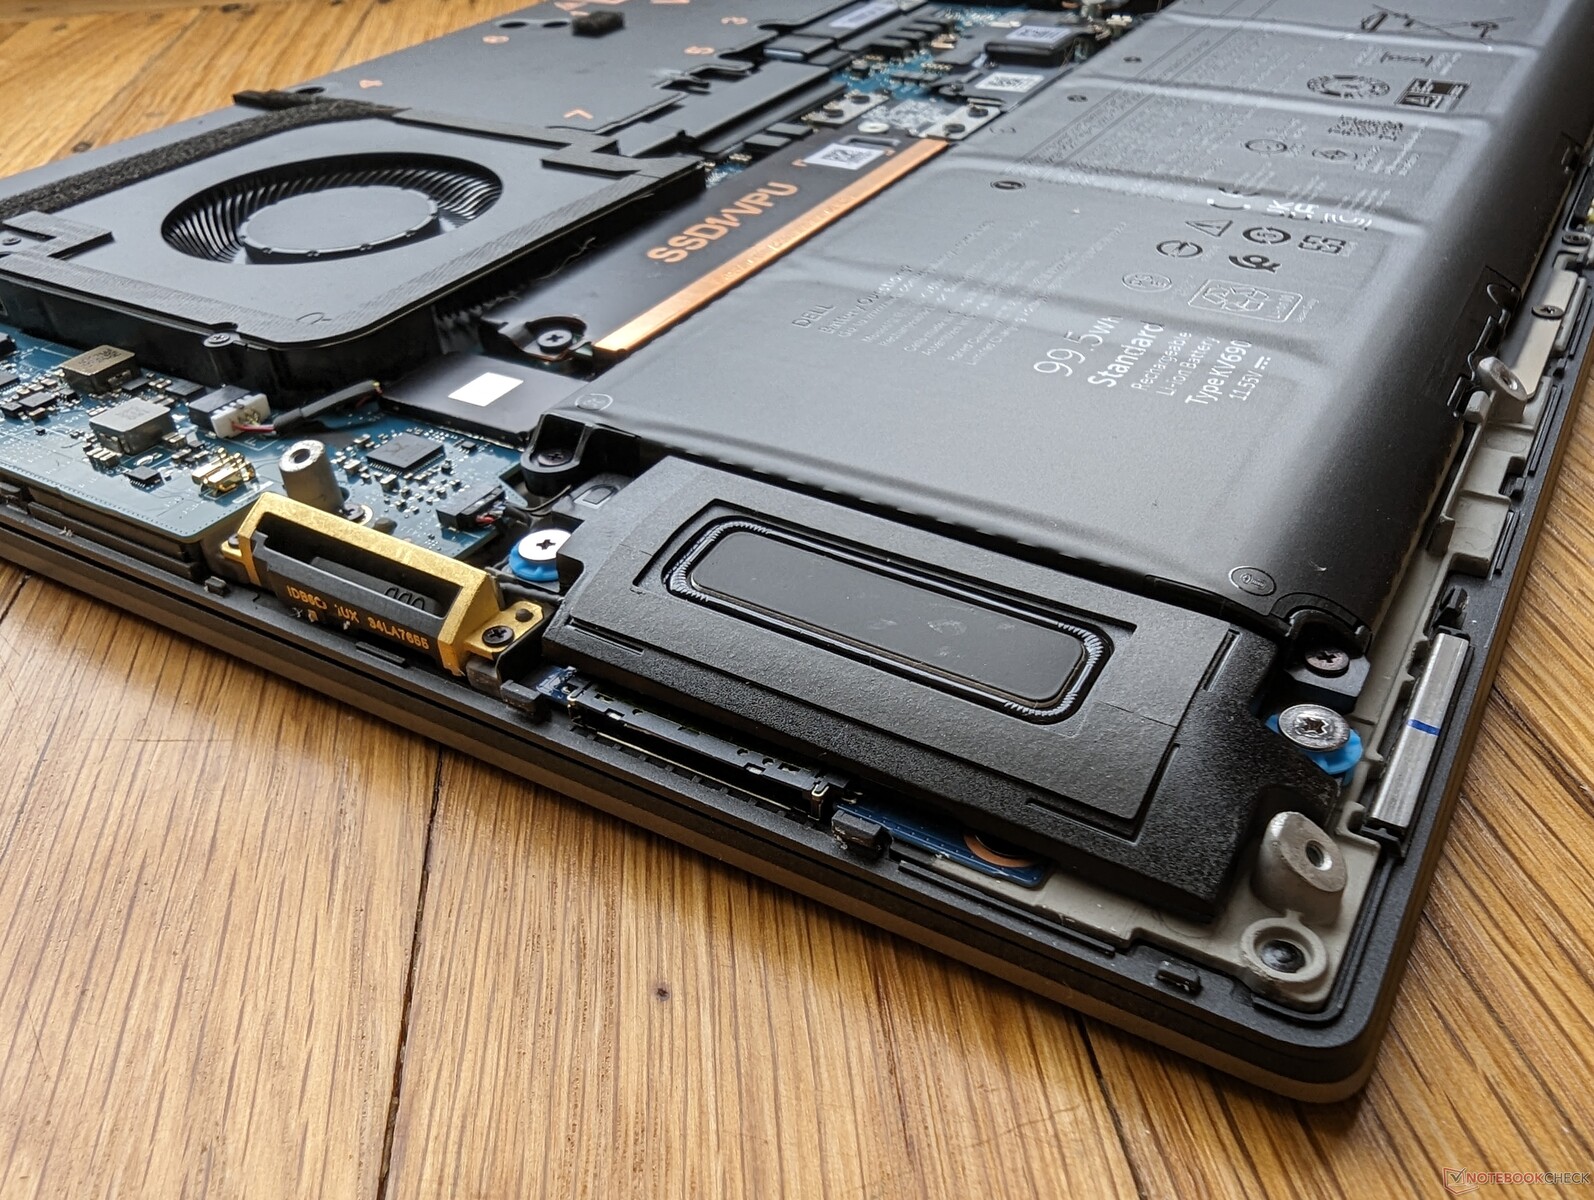
Onze testunit wordt geleverd met dezelfde SK hynix PC801 PCIe4 x4 NVMe SSD's in RAID 0 configuratie zoals te vinden op de Precision 7670 serie. Hoewel PCIe5 ondersteuning zoals in bepaalde gaming laptops leuk zou zijn geweest om te zien, is het op dit moment geen belangrijke functie gezien hoe zeldzaam PCIe5 SSD's nog steeds zijn. Dell biedt zelfversleutelende SSD-opties voor extra beveiliging.
Elk M.2 SSD slot wordt geleverd met een koperen hitte verspreider zoals hieronder te zien is om te helpen bij het koelen. Elke schijf in onze eenheid had geen problemen met het handhaven van hoge overdrachtsnelheden van ~5400 MB/s gedurende lange perioden en vertoonde geen grote throttling problemen.

* ... kleiner is beter
Disk Throttling: DiskSpd Read Loop, Queue Depth 8
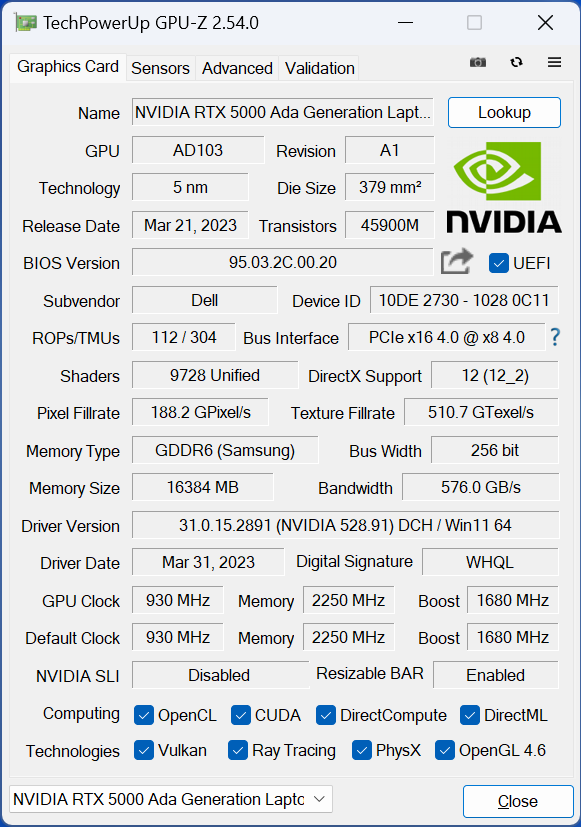
GPU-prestaties - 70 W Nvidia Ada Lovelace
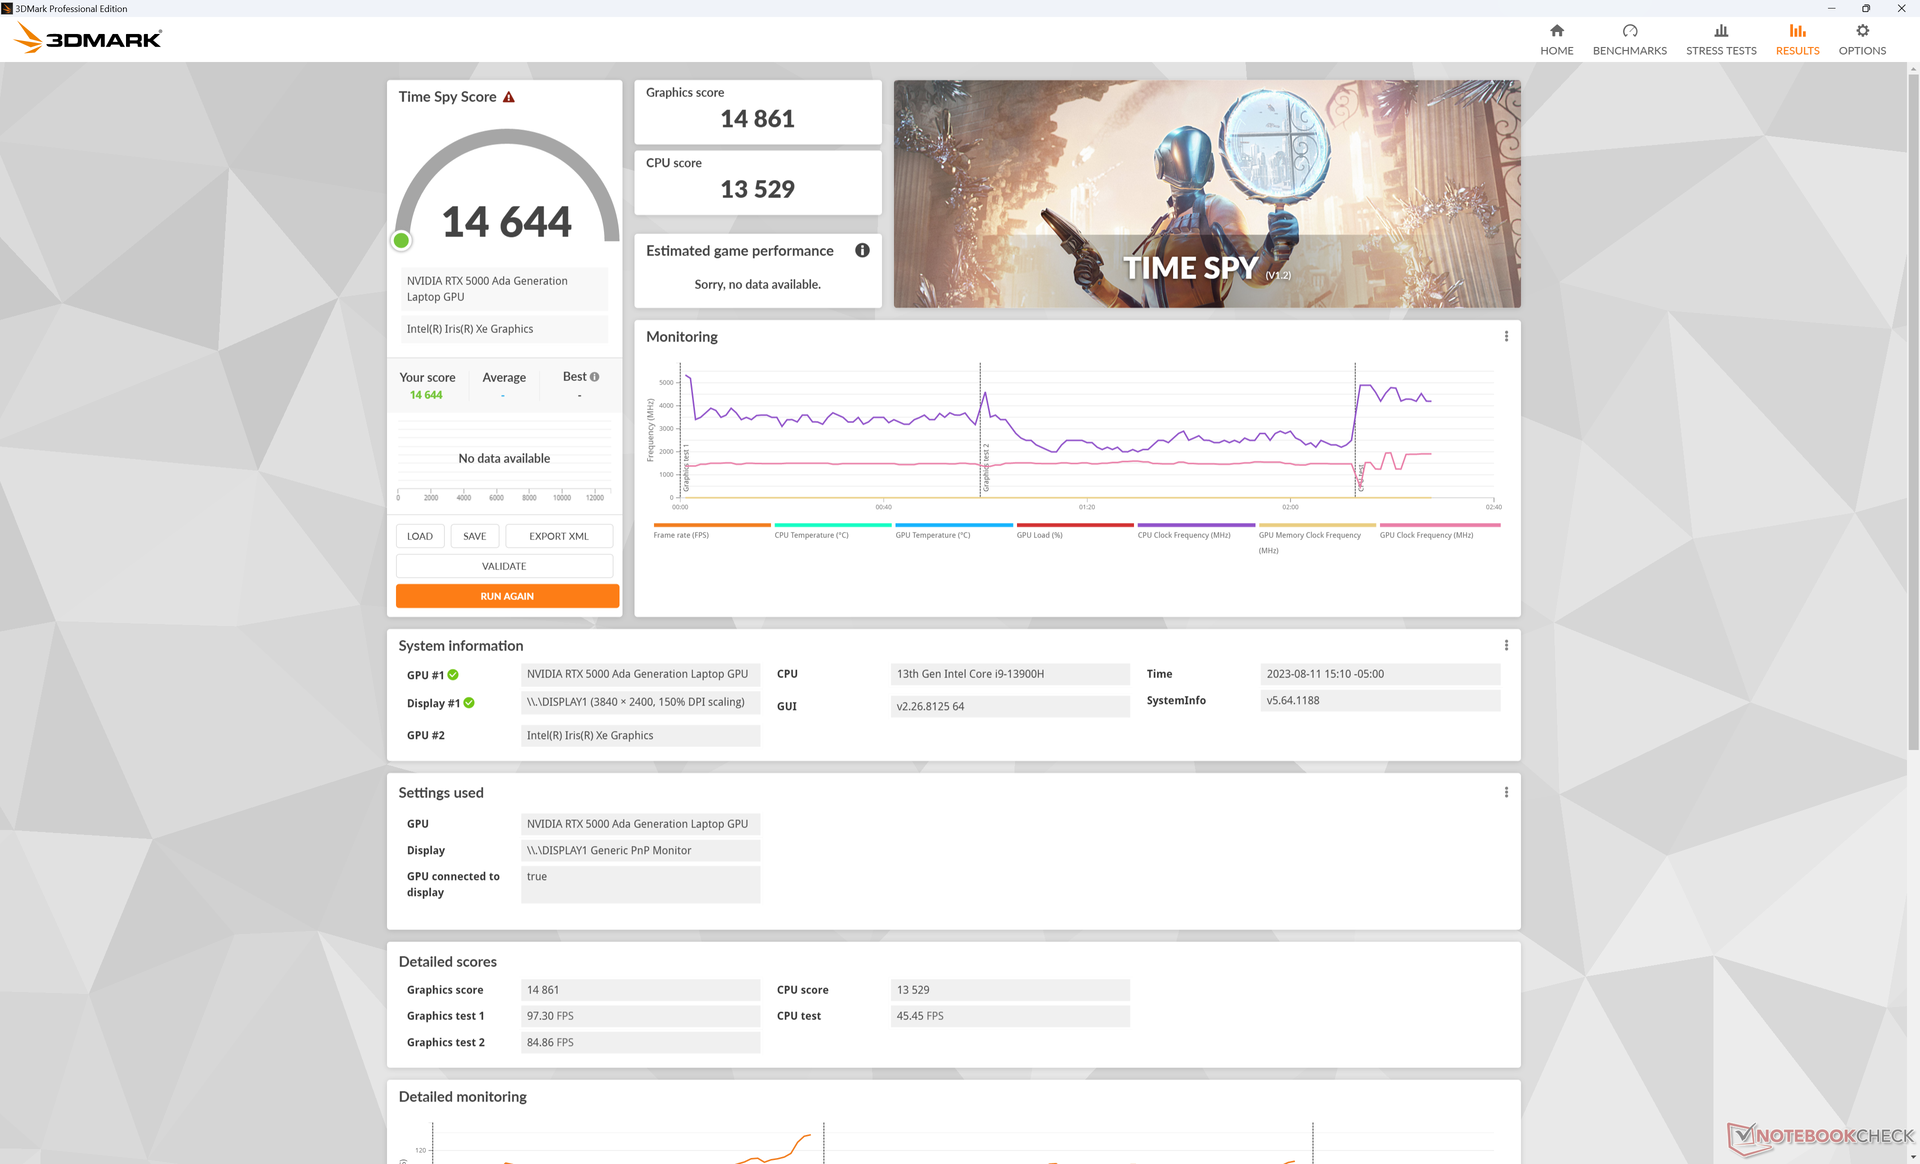
De nieuwe RTX 5000 biedt opmerkelijke prestatievoordelen ten opzichte van de RTX A5000 en A5500 vooral in DX12-toepassingen en Blender CUDA-versnelling. Time Spy zou bijvoorbeeld 30 tot 40 procent hoger scoren op onze Precision dan op deMSI WE76 of de Lenovo ThinkPad P16 G1 die elk op oudere Ampere GPU's draaien. De voordelen gelden ook voor de meeste subtests van Specviewperf.
Het inschakelen van de ECC VRAM-modus lijkt geen invloed te hebben op de kloksnelheden van het geheugen, maar het maximaal beschikbare VRAM zou volgens GPU-Z afnemen van 16384 MB tot 15360 MB.
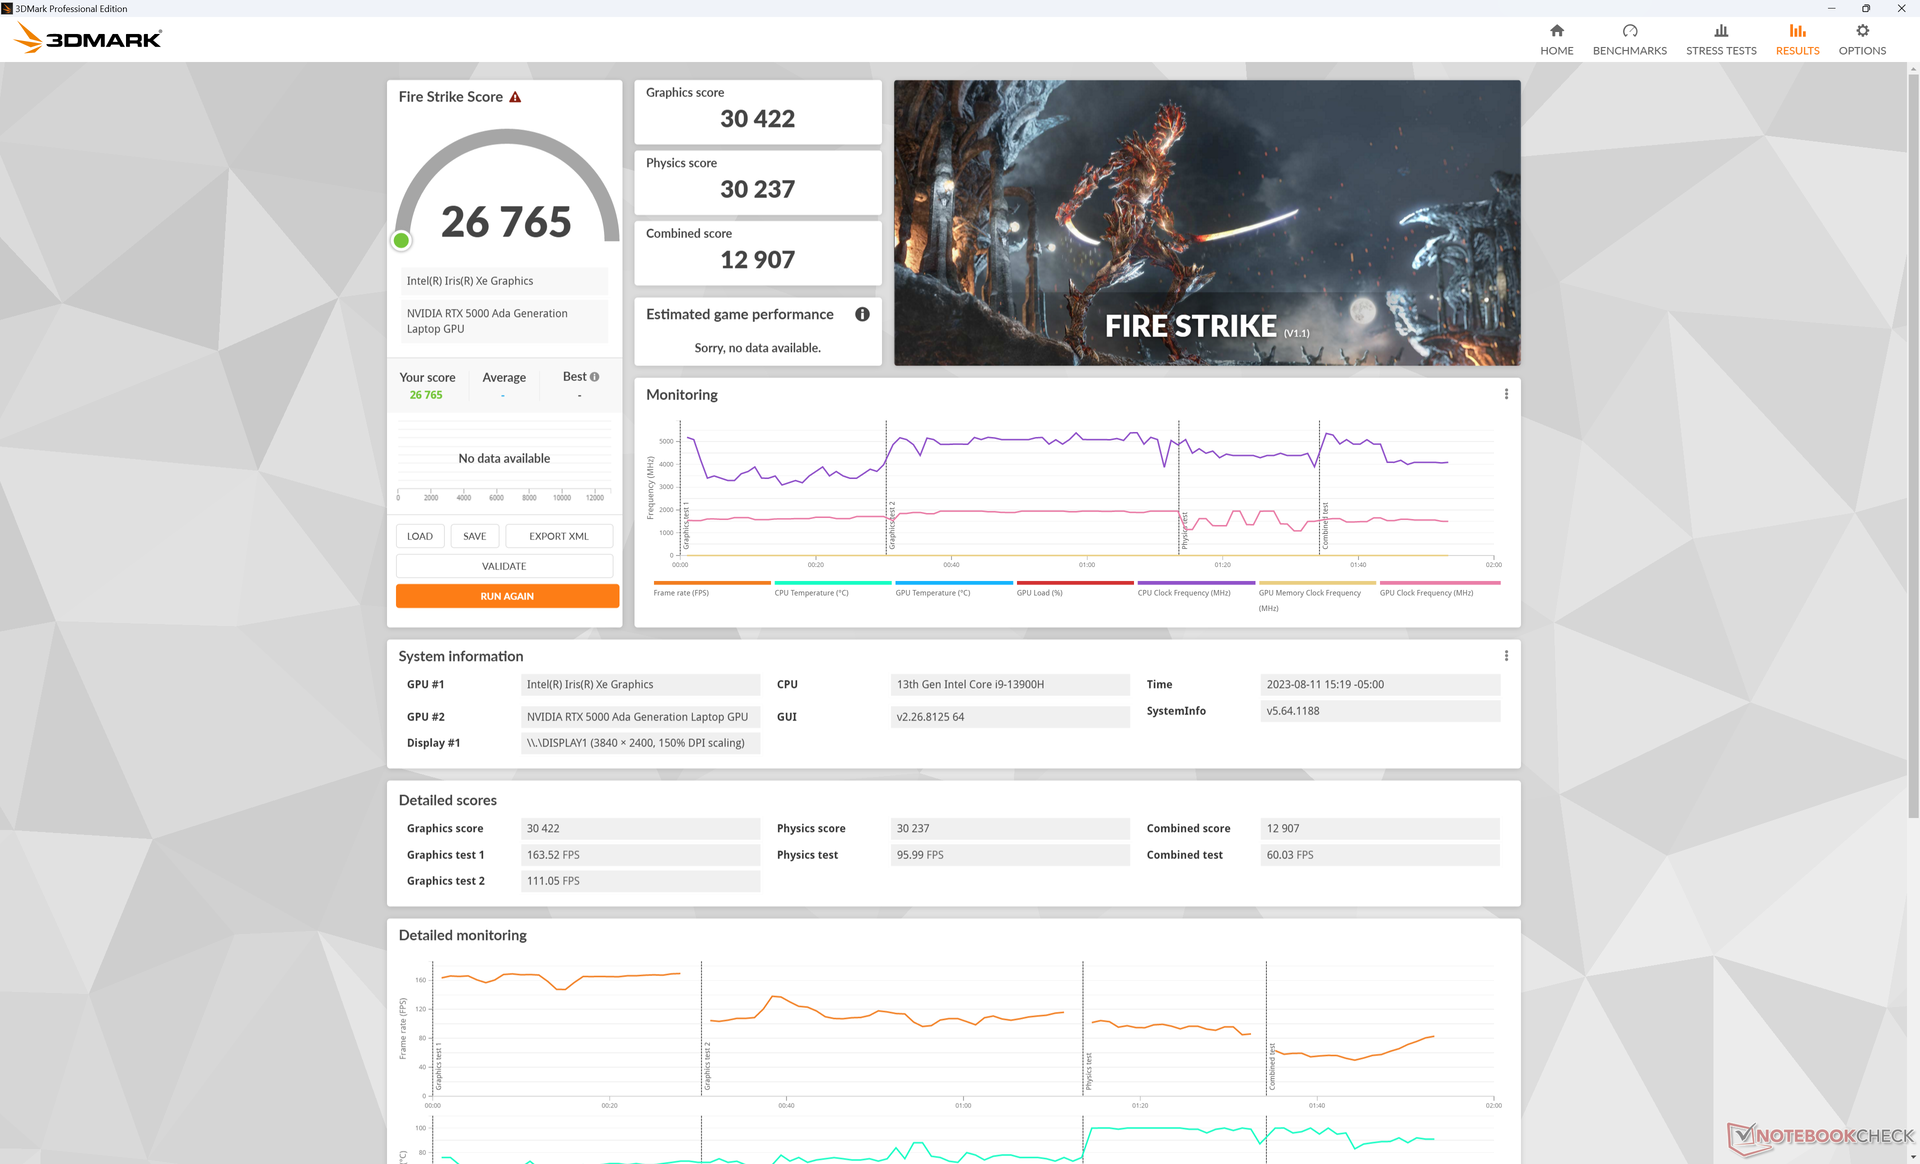
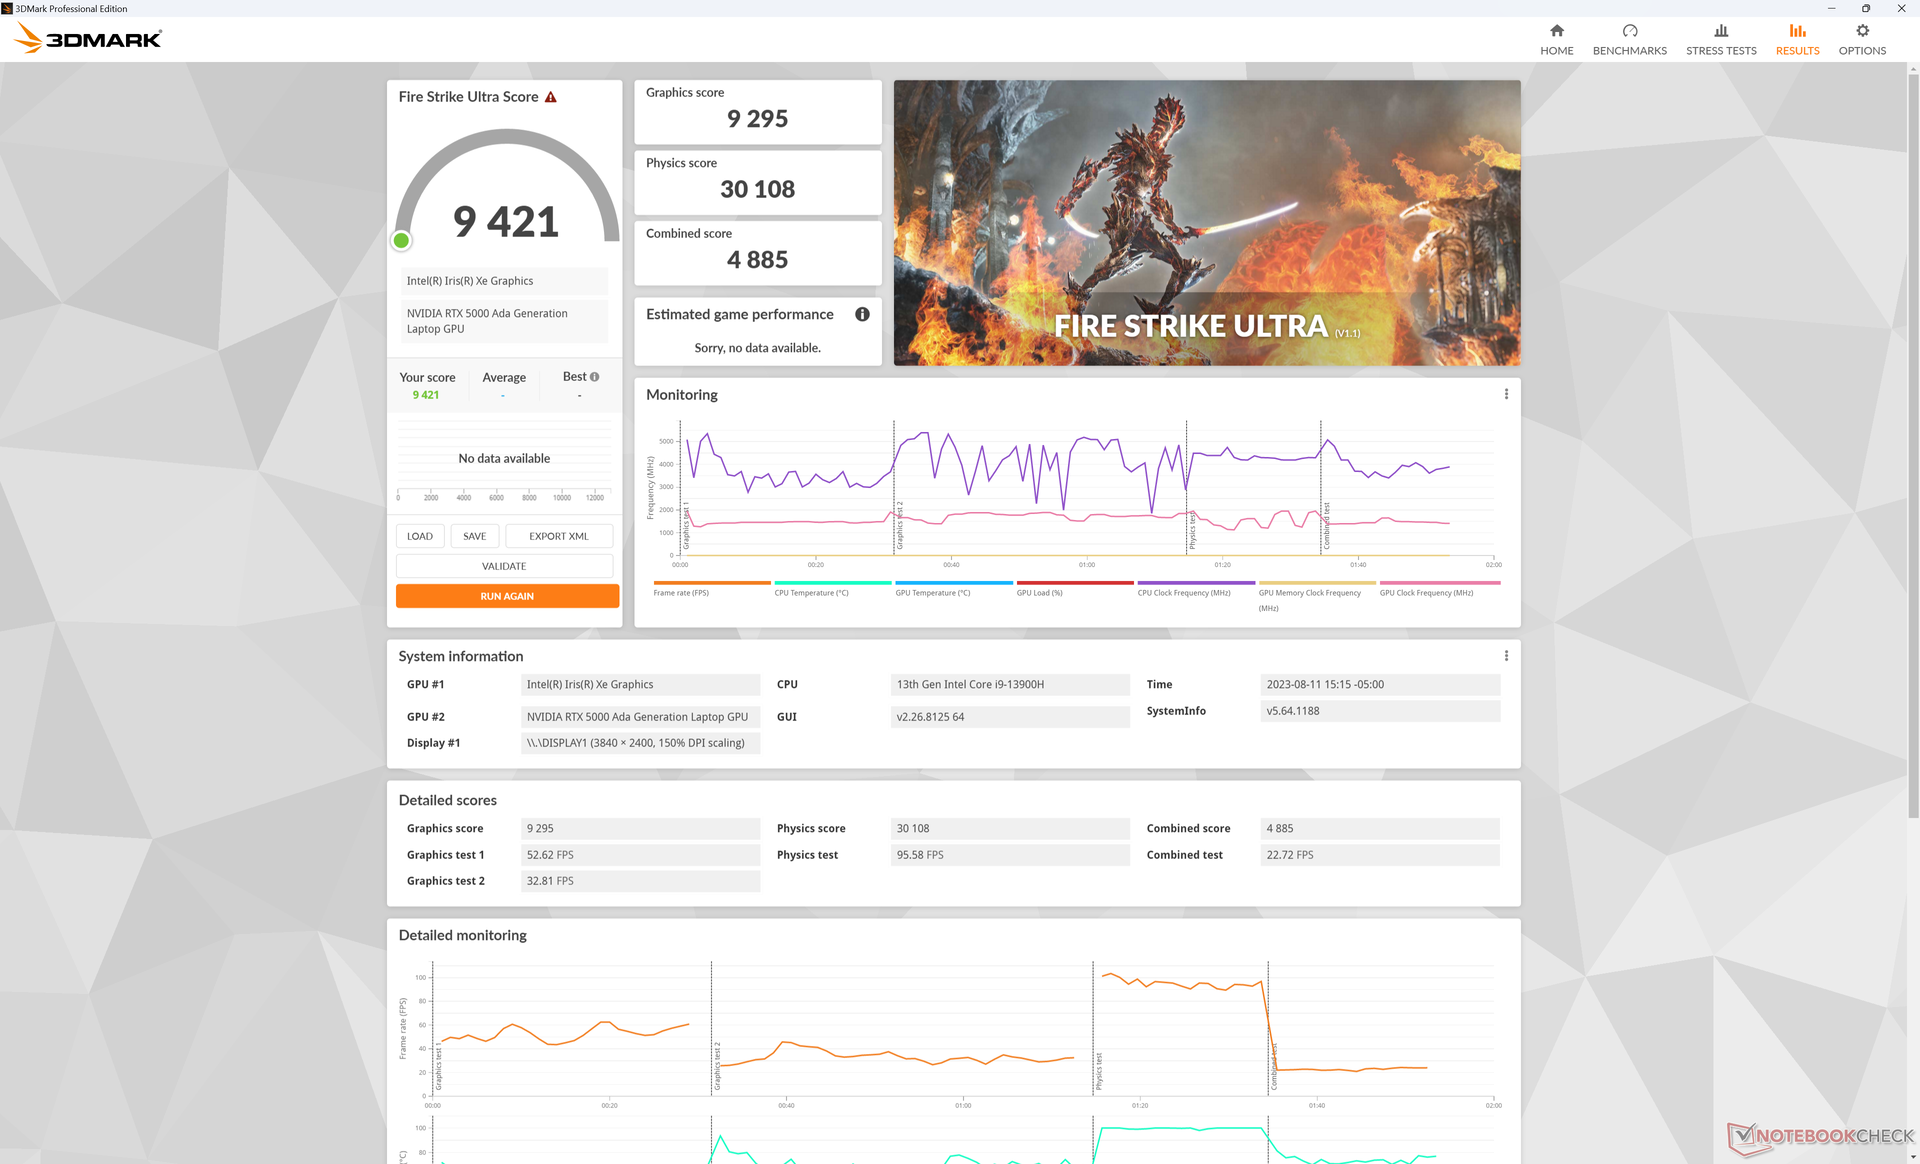
Merk op dat er geen grote invloed is op de GPU-prestaties bij het overschakelen van de Performance-modus naar de Balanced-modus, zoals blijkt uit de onderstaande Fire Strike resultaten. In plaats daarvan zouden de CPU-prestaties een merkbare klap krijgen.
| Vermogen Profiel | Fysieke Score | Grafische Score | Gecombineerde score |
| Batterijvermogen | 20938 (-31%) | 27514 (-10%) | 8910 (-31%) |
| Gebalanceerde modus | 24828 (-18%) | 30588 (-0%) | 11365 (-12%) |
| Prestatiemodus | 30237 | 30422 | 12907 |
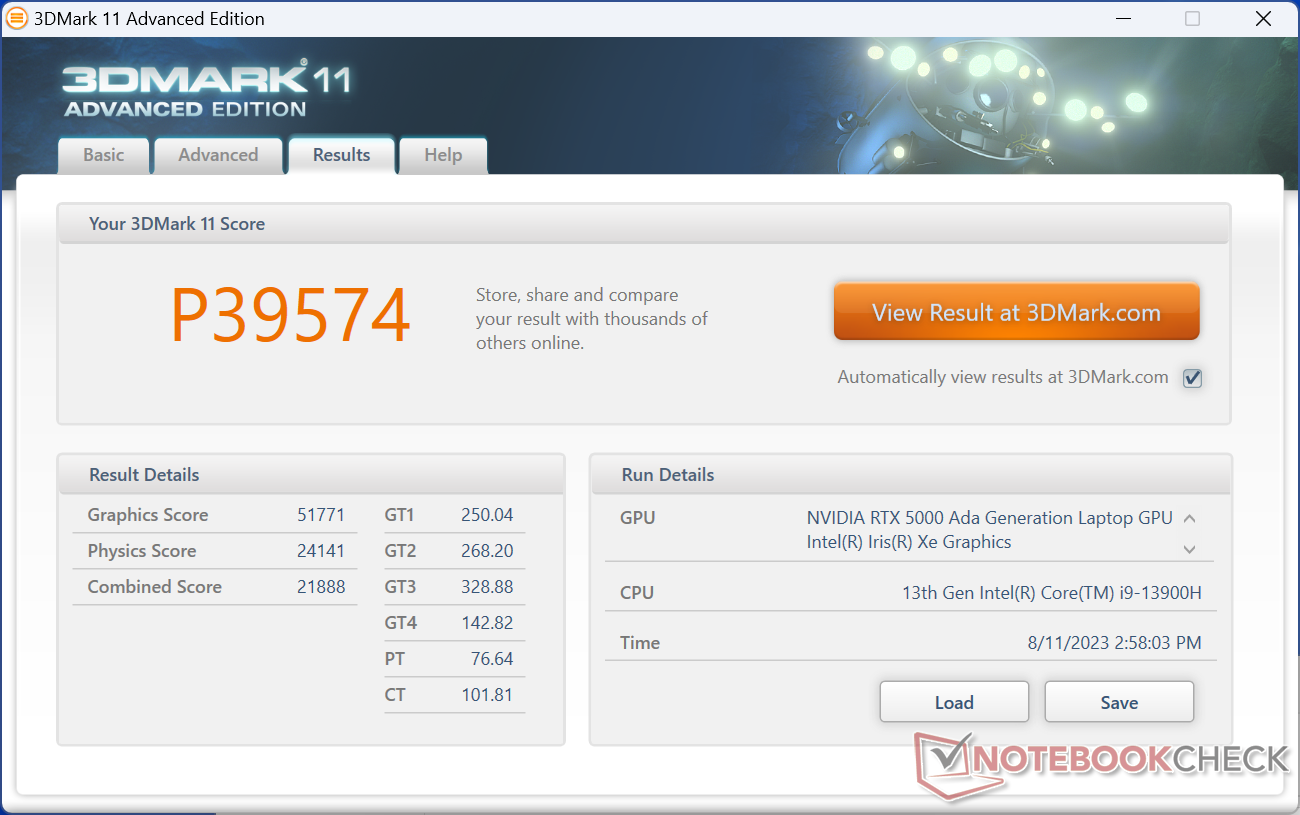
| 3DMark 11 Performance | 39574 punten | |
| 3DMark Fire Strike Score | 26765 punten | |
| 3DMark Time Spy Score | 14644 punten | |
Help | ||
* ... kleiner is beter
Spelprestaties
Hoewel het geen gaming laptop is, is de Precision 5680 nog steeds volledig in staat om de nieuwste veeleisende titels te spelen zonder compatibiliteitsproblemen tijdens het testen. De algemene gamingprestaties liggen tussen de mobiele GeForce RTX 4060 en mobiele RTX 4070 zoals te vinden op speciale gaming laptops zoals de HP Omen Transcend 16.
Witcher 3 FPS Chart
| lage | gem. | hoge | ultra | QHD | 4K | |
|---|---|---|---|---|---|---|
| GTA V (2015) | 185.4 | 179.7 | 175.3 | 117.1 | 106.6 | 108 |
| The Witcher 3 (2015) | 412.7 | 329.6 | 256 | 137 | 97 | |
| Dota 2 Reborn (2015) | 178 | 161.7 | 154 | 144 | 142.5 | |
| Final Fantasy XV Benchmark (2018) | 196.3 | 165.6 | 127.4 | 100.8 | 60.4 | |
| X-Plane 11.11 (2018) | 155.3 | 133 | 102.4 | 86.2 | ||
| Far Cry 5 (2018) | 145 | 132 | 129 | 132 | 114 | 70 |
| Cyberpunk 2077 1.6 (2022) | 124.9 | 122.7 | 107.7 | 100 | 66.2 | 32.2 |
| Tiny Tina's Wonderlands (2022) | 220 | 202.3 | 152.6 | 125 | 90.1 | 50.9 |
| F1 22 (2022) | 232 | 218 | 202 | 84.5 | 56.1 | 28.8 |
| Returnal (2023) | 98 | 94 | 90 | 81 | 60 | 34 |
Uitstoot - Meestal stil
Systeemgeluid
De geluidsniveaus komen het meest overeen met dePrecision 5550 ook al heeft onze Precision 5680 een aanzienlijk snellere GPU. De ventilatoren hebben de neiging om in het midden tot hoog 20 dB(A) te zweven wanneer er weinig veeleisende belastingen worden uitgevoerd, zoals webbrowsers, terwijl meer veeleisende belastingen een constant geluid van 51 dB(A) veroorzaken.
Interessant is dat het maximale geluidsniveau van de ventilator in de gebalanceerde modus hetzelfde is als in de prestatiemodus.
Geluidsniveau
| Onbelast |
| 23 / 23 / 23 dB (A) |
| Belasting |
| 37.2 / 51 dB (A) |
 | ||
30 dB stil 40 dB(A) hoorbaar 50 dB(A) luid |
||
min: | ||
| Dell Precision 5000 5680 RTX 5000 Ada Generation Laptop, i9-13900H, 2x SK hynix PC801 HFS512GEJ9X101N RAID 0 | Dell Precision 7000 7670 Performance RTX A5500 Laptop GPU, i9-12950HX | HP ZBook Fury 16 G9 RTX A5500 Laptop GPU, i9-12950HX, Micron 3400 1TB MTFDKBA1T0TFH | Lenovo ThinkPad P16 G1 RTX A5500 RTX A5500 Laptop GPU, i9-12950HX, WDC PC SN810 2TB | MSI CreatorPro Z16P B12UKST RTX A3000 Laptop GPU, i7-12700H, Samsung PM9A1 MZVL21T0HCLR | Asus ExpertBook B6 Flip B6602FC2 RTX A2000 Laptop GPU, i9-12950HX, Samsung PM9A1 MZVL21T0HCLR | |
|---|---|---|---|---|---|---|
| Noise | -11% | -2% | 3% | -8% | -30% | |
| uit / omgeving * (dB) | 22.8 | 23.9 -5% | 22.6 1% | 23.1 -1% | 24.1 -6% | 26 -14% |
| Idle Minimum * (dB) | 23 | 24 -4% | 22.7 1% | 23.1 -0% | 27.1 -18% | 32.4 -41% |
| Idle Average * (dB) | 23 | 24 -4% | 22.7 1% | 23.1 -0% | 27.1 -18% | 32.4 -41% |
| Idle Maximum * (dB) | 23 | 38 -65% | 28.8 -25% | 23.1 -0% | 27.1 -18% | 32.4 -41% |
| Load Average * (dB) | 37.2 | 46.3 -24% | 36.2 3% | 28.9 22% | 42.9 -15% | 51.9 -40% |
| Witcher 3 ultra * (dB) | 51 | 41.9 18% | 49.5 3% | 51.6 -1% | 44 14% | |
| Load Maximum * (dB) | 51 | 47.9 6% | 49.3 3% | 51.4 -1% | 47 8% | 52.1 -2% |
* ... kleiner is beter
Temperatuur
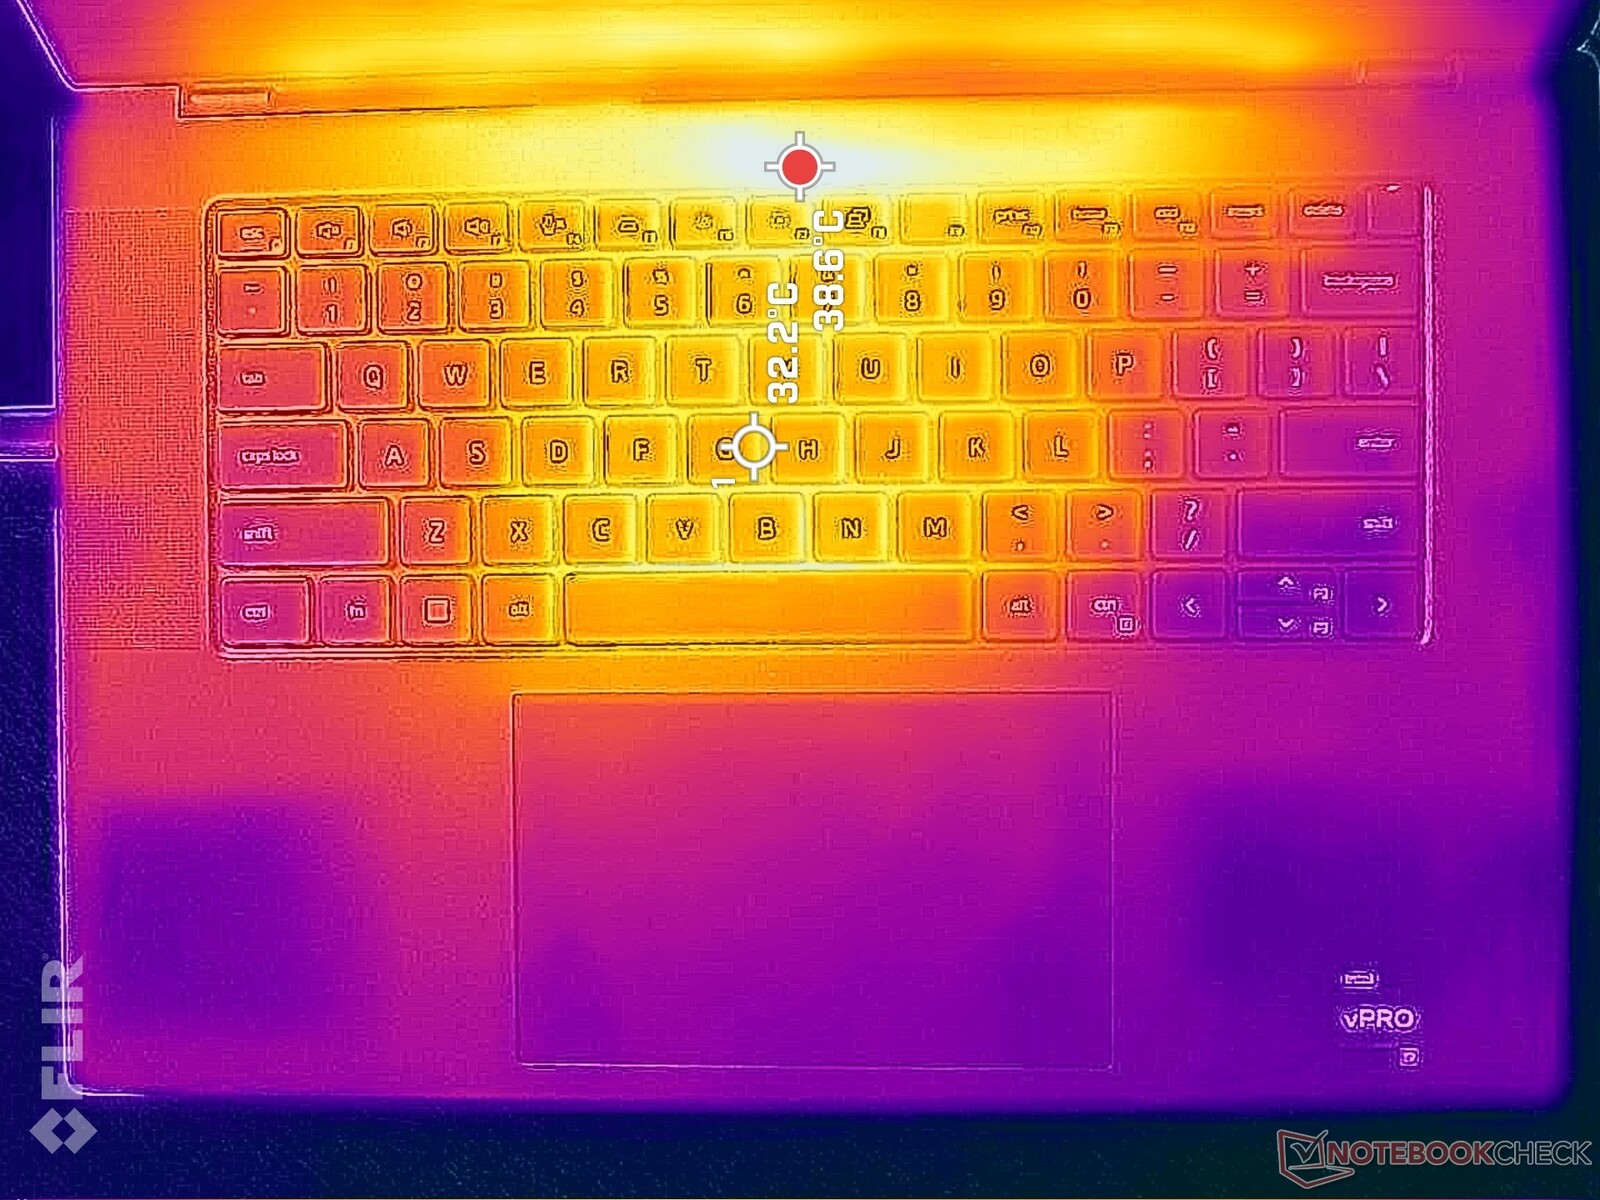
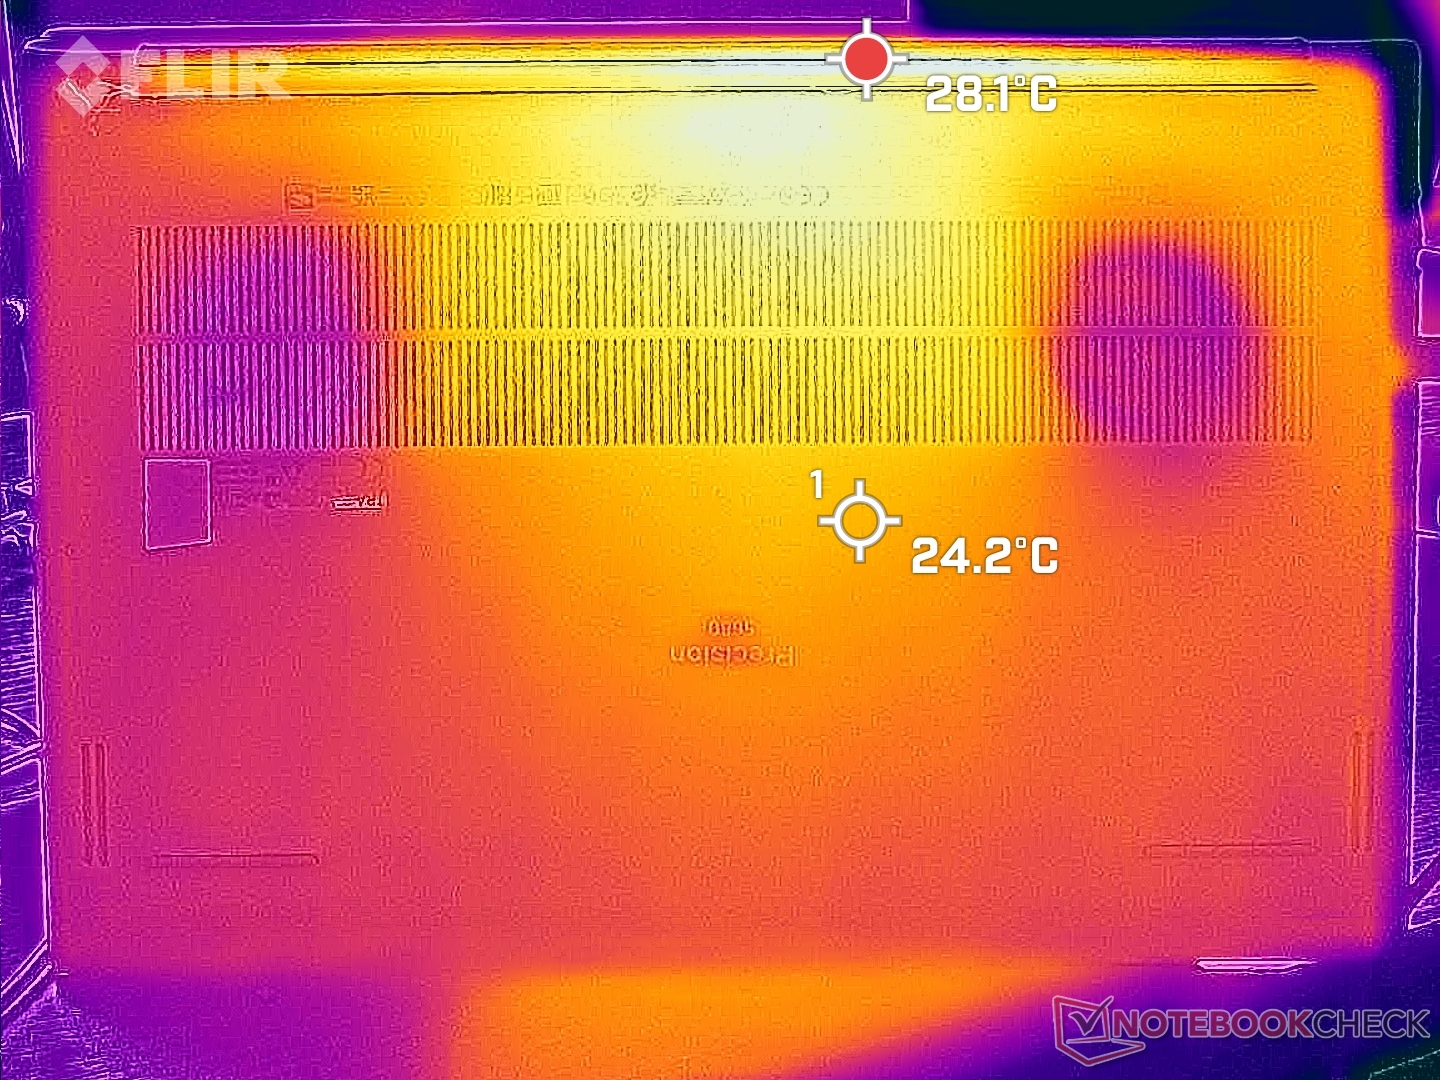
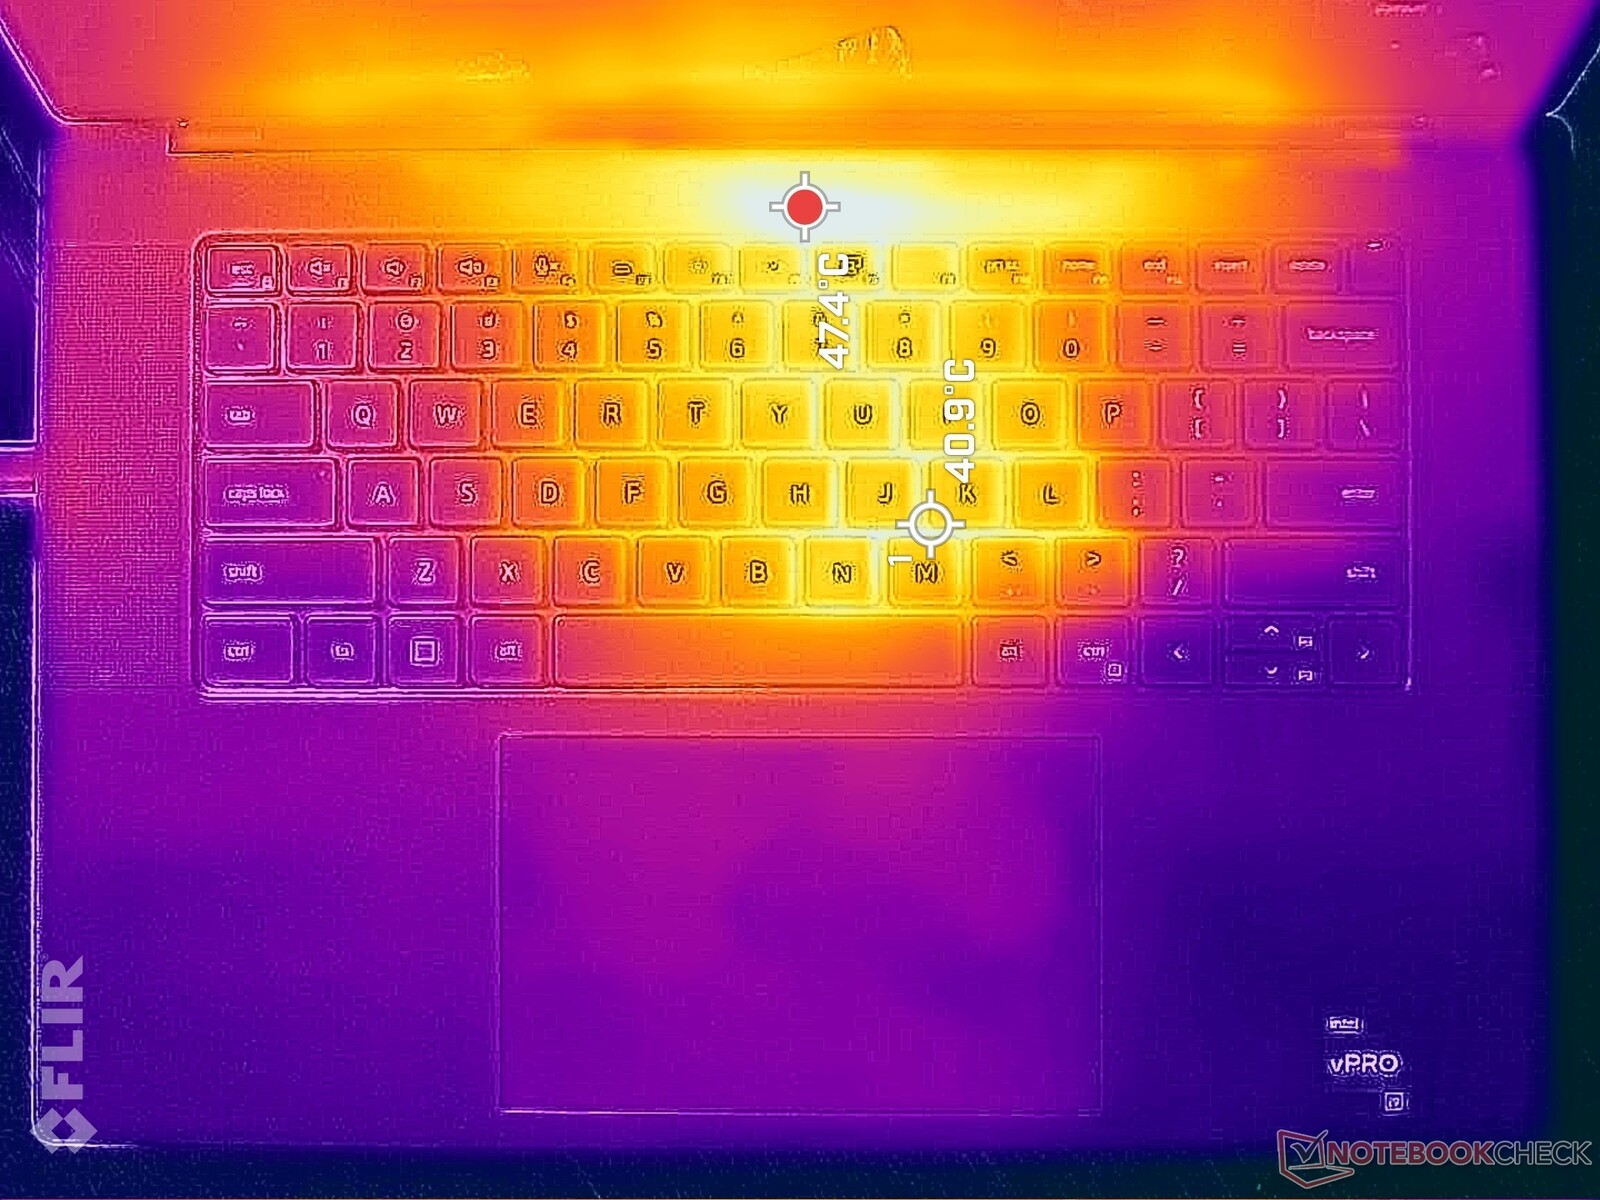
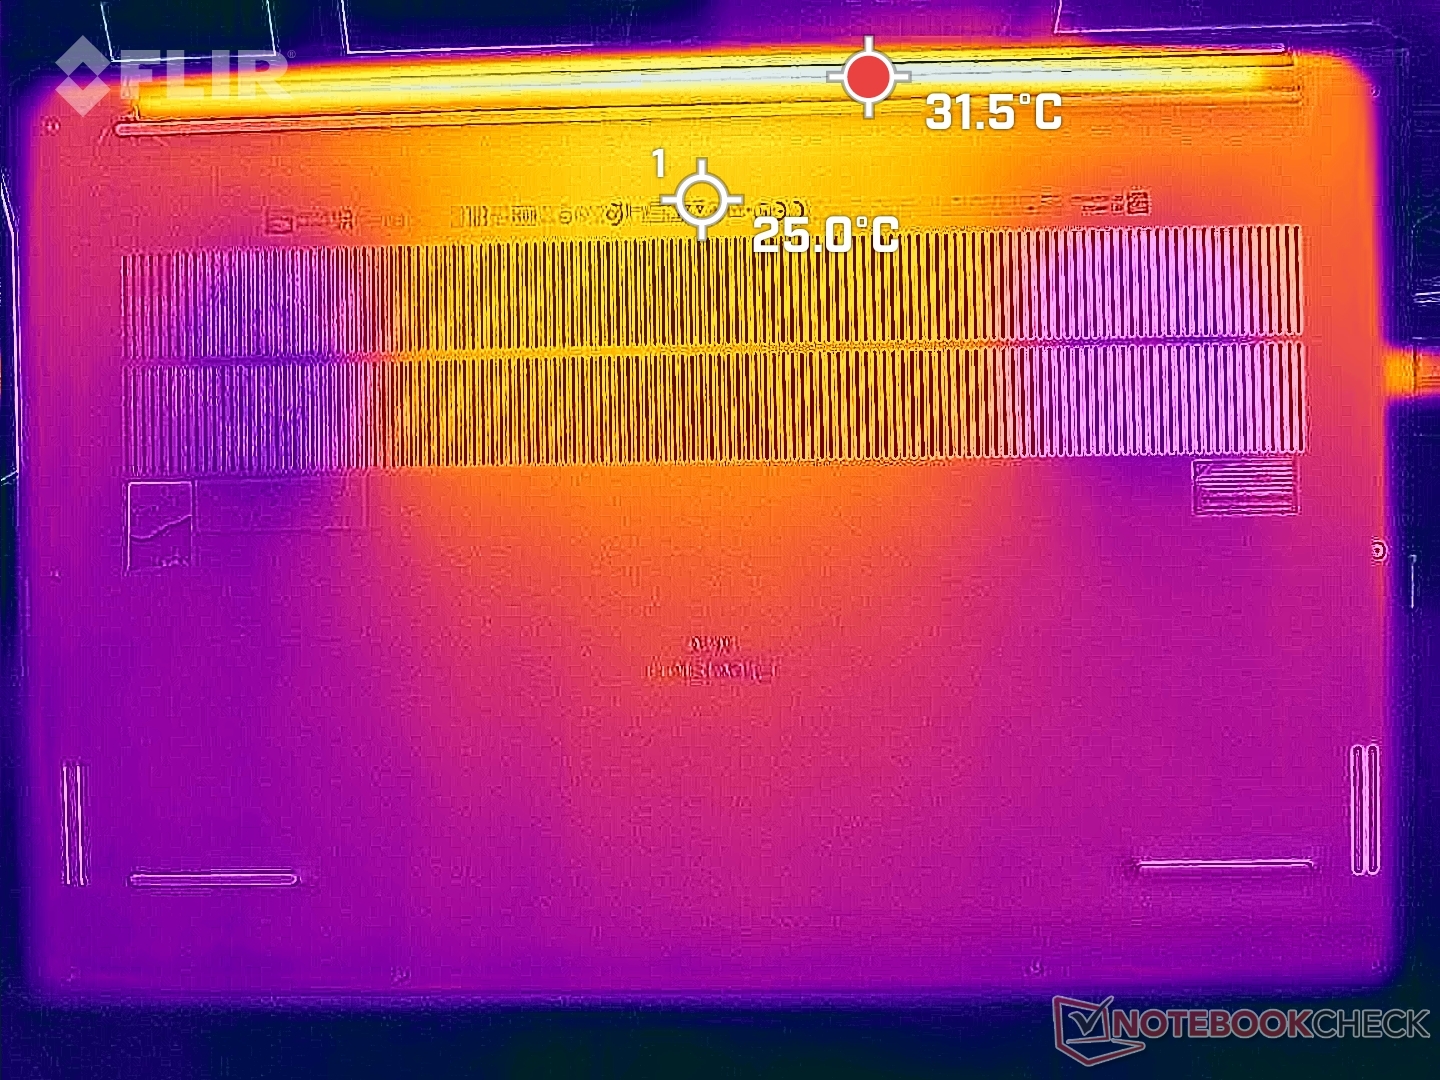
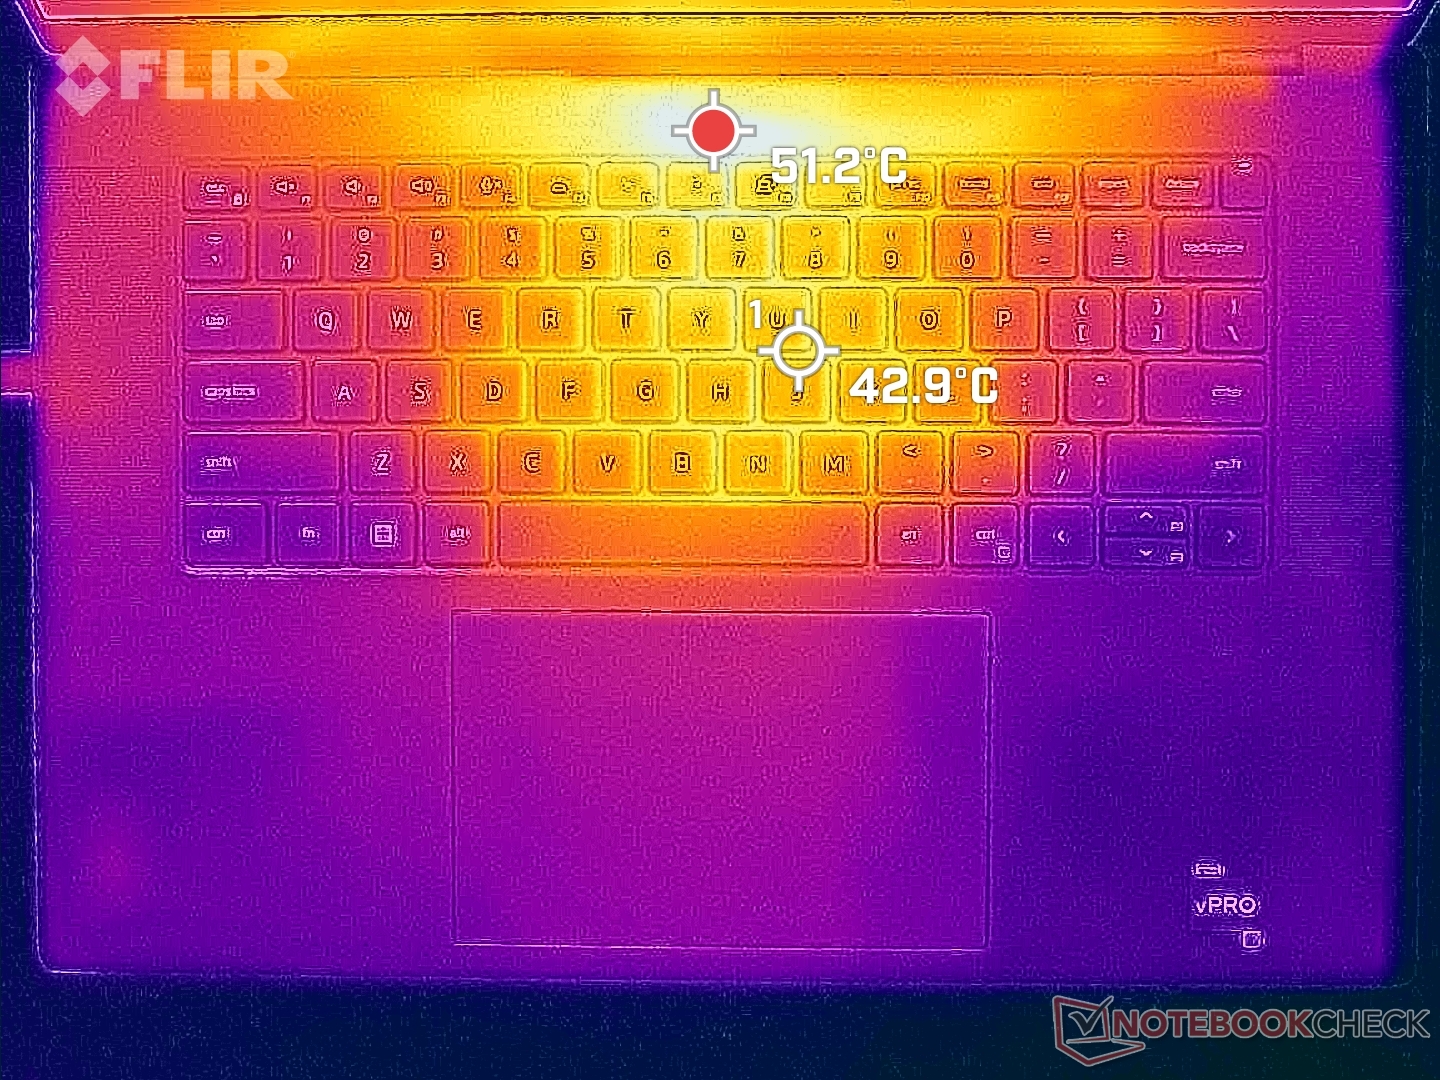
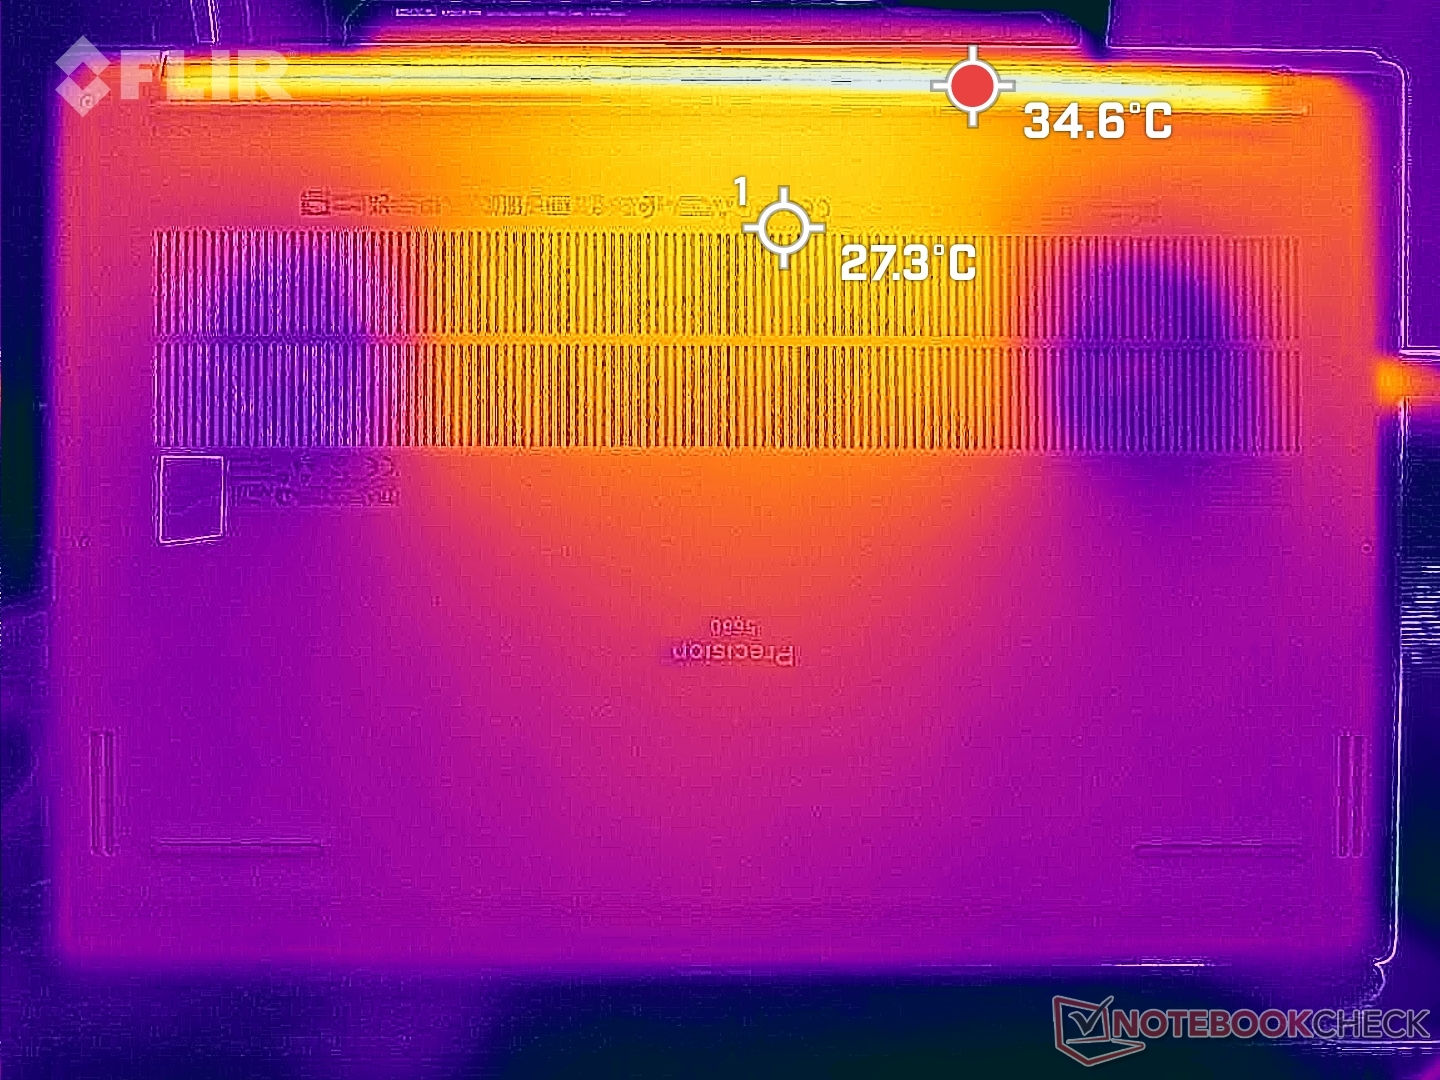
De oppervlaktetemperaturen bij stationair draaien zijn warmer dan verwacht omdat de ventilatoren de neiging hebben om stationair te draaien tot het nodig is. Hete plekken kunnen warmer worden dan 37 C en 32 C aan de boven- en onderkant, vergeleken met minder dan 30 C aan de bovenkant en onderkant van het scherm.ExpertBook B6 Flip.
Bij zwaardere belastingen kan het midden van het toetsenbord meer dan 50 C bereiken, terwijl de onderkant nauwelijks warm wordt, deels dankzij de Gore isolatoren. Vingers en handpalmen raken het midden van het toetsenbord slechts zelden aan, dus de warme plekken hebben over het algemeen geen invloed op het comfort.
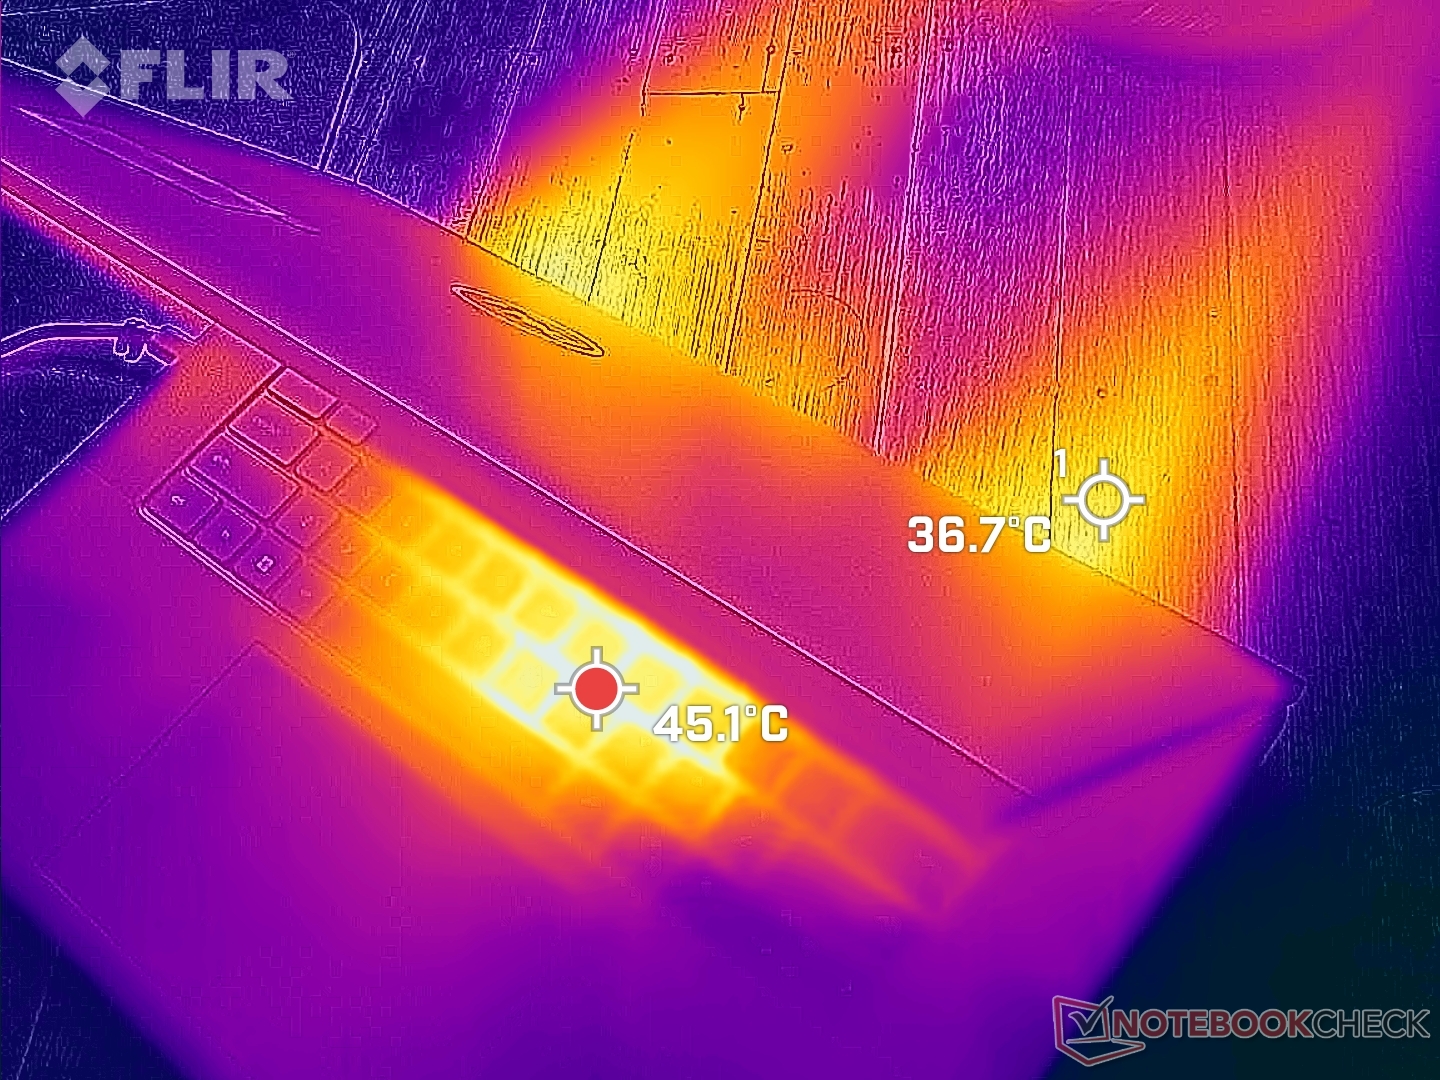
(-) De maximumtemperatuur aan de bovenzijde bedraagt 50.2 °C / 122 F, vergeleken met het gemiddelde van 38.2 °C / 101 F, variërend van 22.2 tot 69.8 °C voor de klasse Workstation.
(+) De bodem warmt op tot een maximum van 32 °C / 90 F, vergeleken met een gemiddelde van 41.1 °C / 106 F
(+) Bij onbelast gebruik bedraagt de gemiddelde temperatuur voor de bovenzijde 30.1 °C / 86 F, vergeleken met het apparaatgemiddelde van 32 °C / 90 F.
(±) Bij het spelen van The Witcher 3 is de gemiddelde temperatuur voor de bovenzijde 34.6 °C / 94 F, vergeleken met het apparaatgemiddelde van 32 °C / 90 F.
(+) De palmsteunen en het touchpad zijn met een maximum van ###max## °C / 81.7 F koeler dan de huidtemperatuur en voelen daarom koel aan.
(±) De gemiddelde temperatuur van de handpalmsteun van soortgelijke toestellen bedroeg 27.8 °C / 82 F (+0.2 °C / 0.3 F).
| Dell Precision 5000 5680 Intel Core i9-13900H, NVIDIA RTX 5000 Ada Generation Laptop | Dell Precision 7000 7670 Performance Intel Core i9-12950HX, NVIDIA RTX A5500 Laptop GPU | HP ZBook Fury 16 G9 Intel Core i9-12950HX, NVIDIA RTX A5500 Laptop GPU | Lenovo ThinkPad P16 G1 RTX A5500 Intel Core i9-12950HX, NVIDIA RTX A5500 Laptop GPU | MSI CreatorPro Z16P B12UKST Intel Core i7-12700H, NVIDIA RTX A3000 Laptop GPU | Asus ExpertBook B6 Flip B6602FC2 Intel Core i9-12950HX, NVIDIA RTX A2000 Laptop GPU | |
|---|---|---|---|---|---|---|
| Heat | -12% | -3% | -13% | -19% | -8% | |
| Maximum Upper Side * (°C) | 50.2 | 53 -6% | 43.2 14% | 44.8 11% | 56.3 -12% | 48.4 4% |
| Maximum Bottom * (°C) | 32 | 43.2 -35% | 50.4 -58% | 49.8 -56% | 68.3 -113% | 52.3 -63% |
| Idle Upper Side * (°C) | 37.4 | 36.8 2% | 28.6 24% | 30.6 18% | 25.2 33% | 27.8 26% |
| Idle Bottom * (°C) | 31.2 | 33.8 -8% | 28.2 10% | 38.6 -24% | 25.9 17% | 30.3 3% |
* ... kleiner is beter
Stresstest
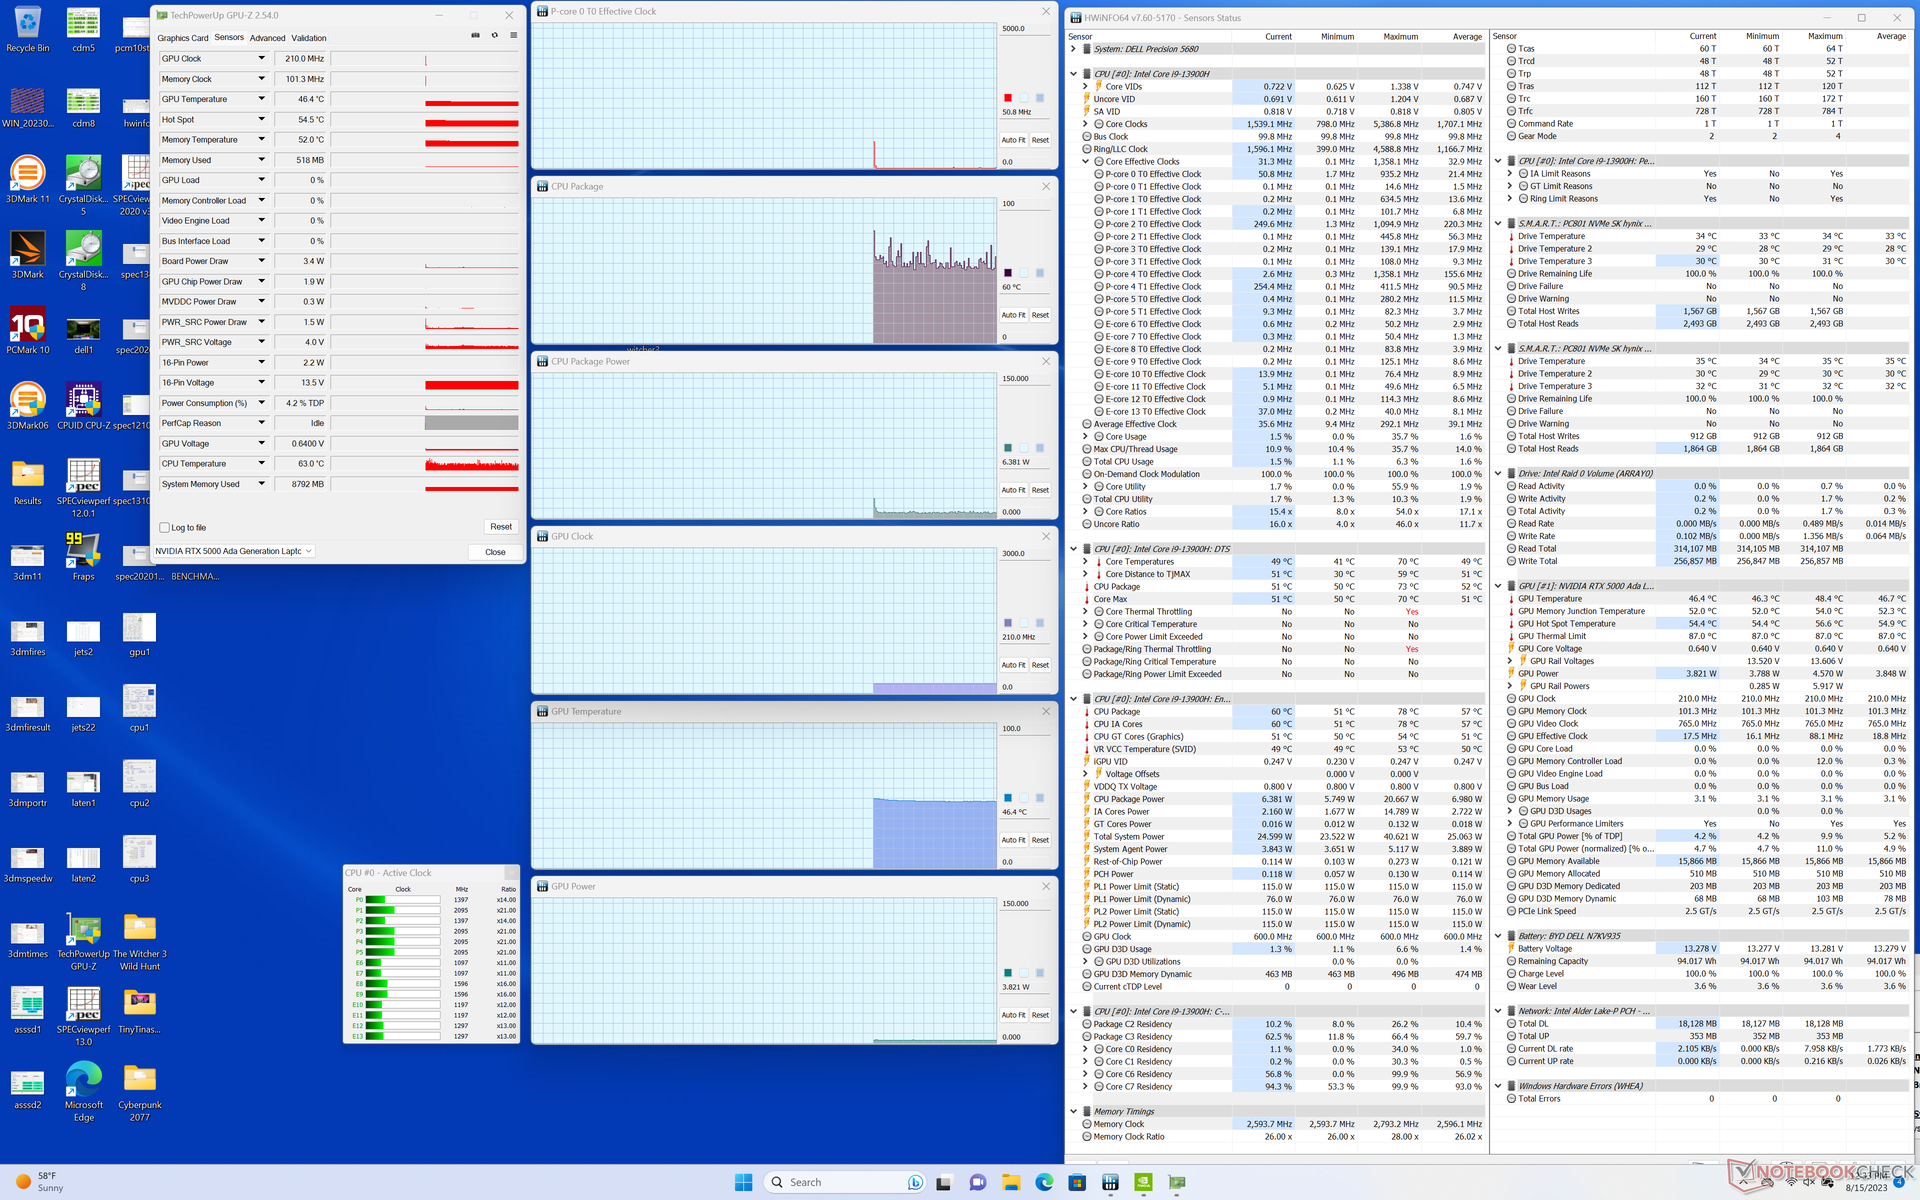
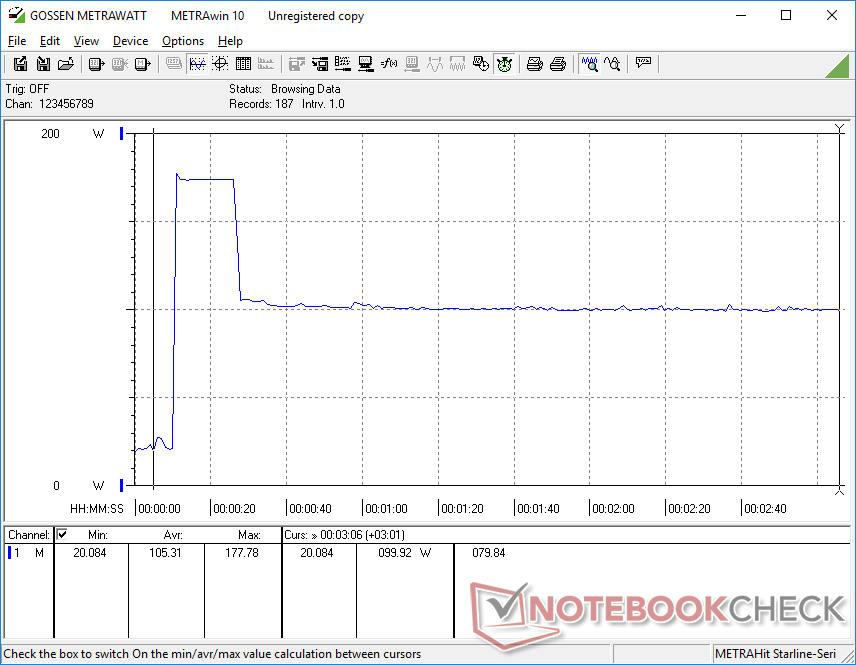
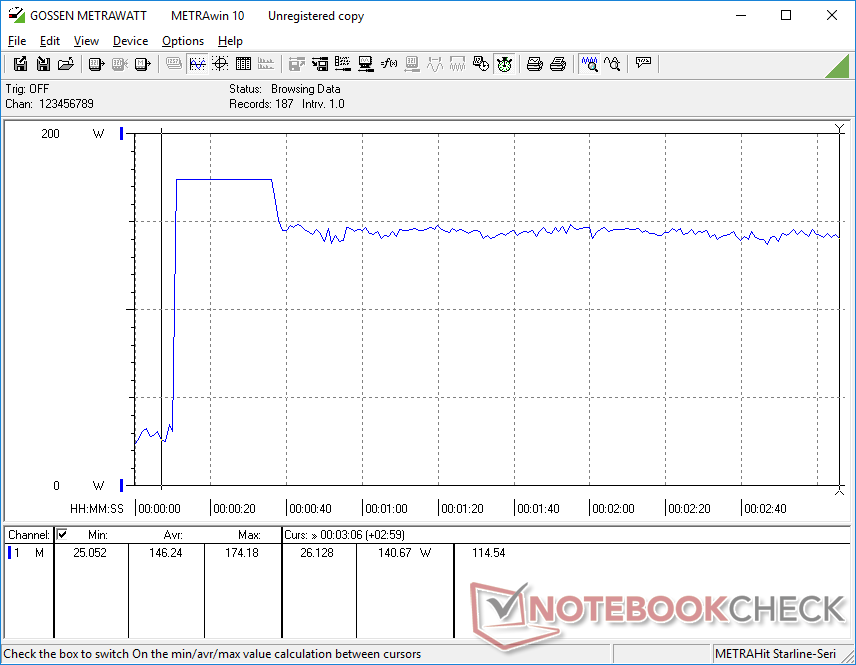
Bij het uitvoeren van Prime95 stress, zou de CPU opvoeren naar 3,9 GHz, 117 W en 100 C gedurende slechts ongeveer 15 seconden. Daarna daalde het Turbo Boost-potentieel en stabiliseerde zich rond 2,8 GHz en 56 W voor een redelijkere kerntemperatuur van 75 C. Maximale Turbo Boost is daarom niet duurzaam op de Precision 5680, zelfs niet wanneer deze is ingesteld op de modus Prestaties.
Het draaien in de Balanced-modus in plaats van de Performance-modus heeft geen negatieve invloed op de GPU-prestaties, zoals hierboven vermeld. GPU-klok, temperatuur en stroomverbruik wanneer deze in de Witcher 3 in de Prestatiemodus stabiliseren op respectievelijk 1560 MHz, 72 C en 63 W, vergeleken met 1665 MHz, 65 C en 69 W in de Gebalanceerde modus. Het grootste verschil tussen de gebalanceerde en de prestatiemodus lijkt de CPU-temperatuur te zijn, die wel 100+ C kan worden in de prestatiemodus voor een hoger Turbo Boost-potentieel, vergeleken met slechts ~80 C in de gebalanceerde modus.
Merk op dat we slechts een maximaal stroomverbruik van 75 W op de GPU-kaart kunnen bereiken, ook al is de TGP-target 95 W volgens het Nvidia Control Panel.
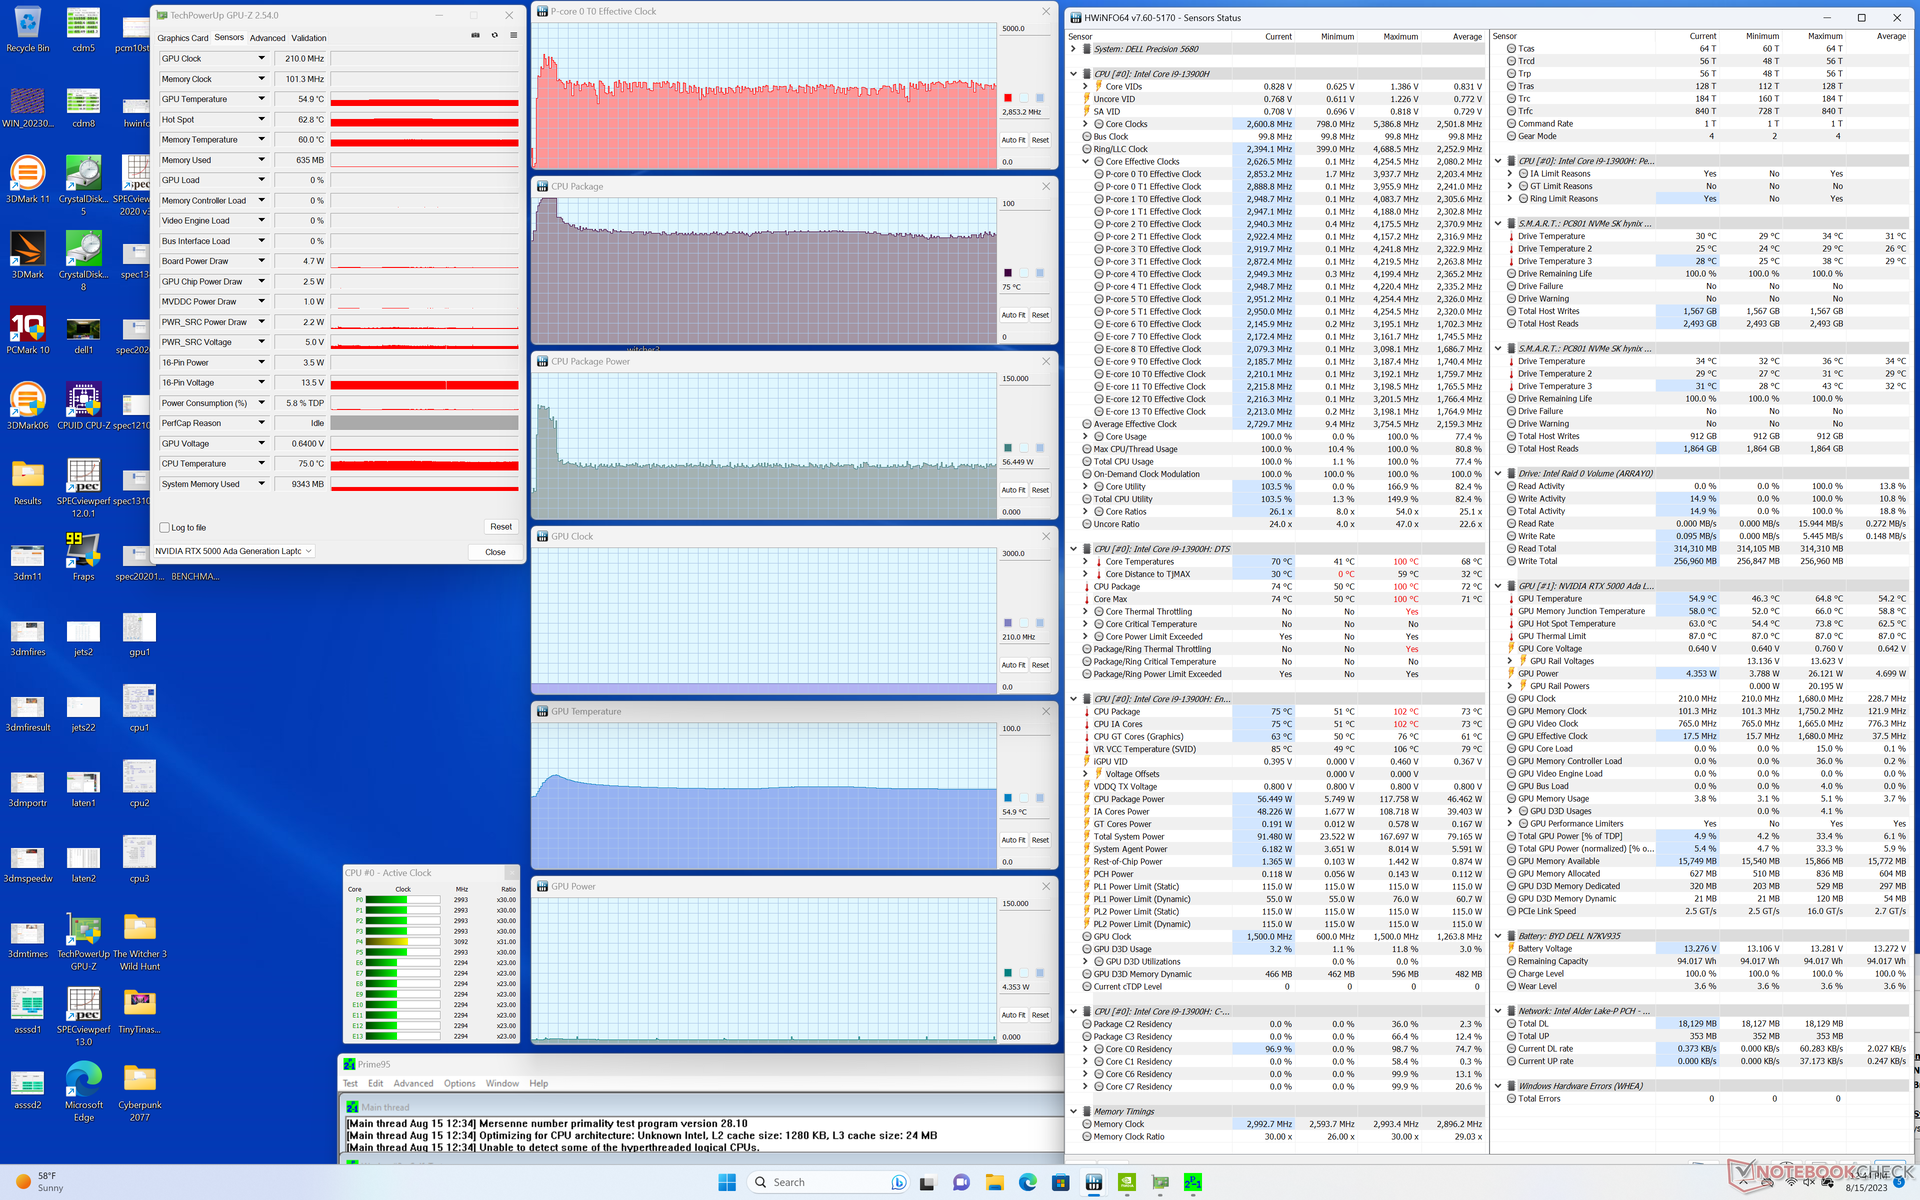
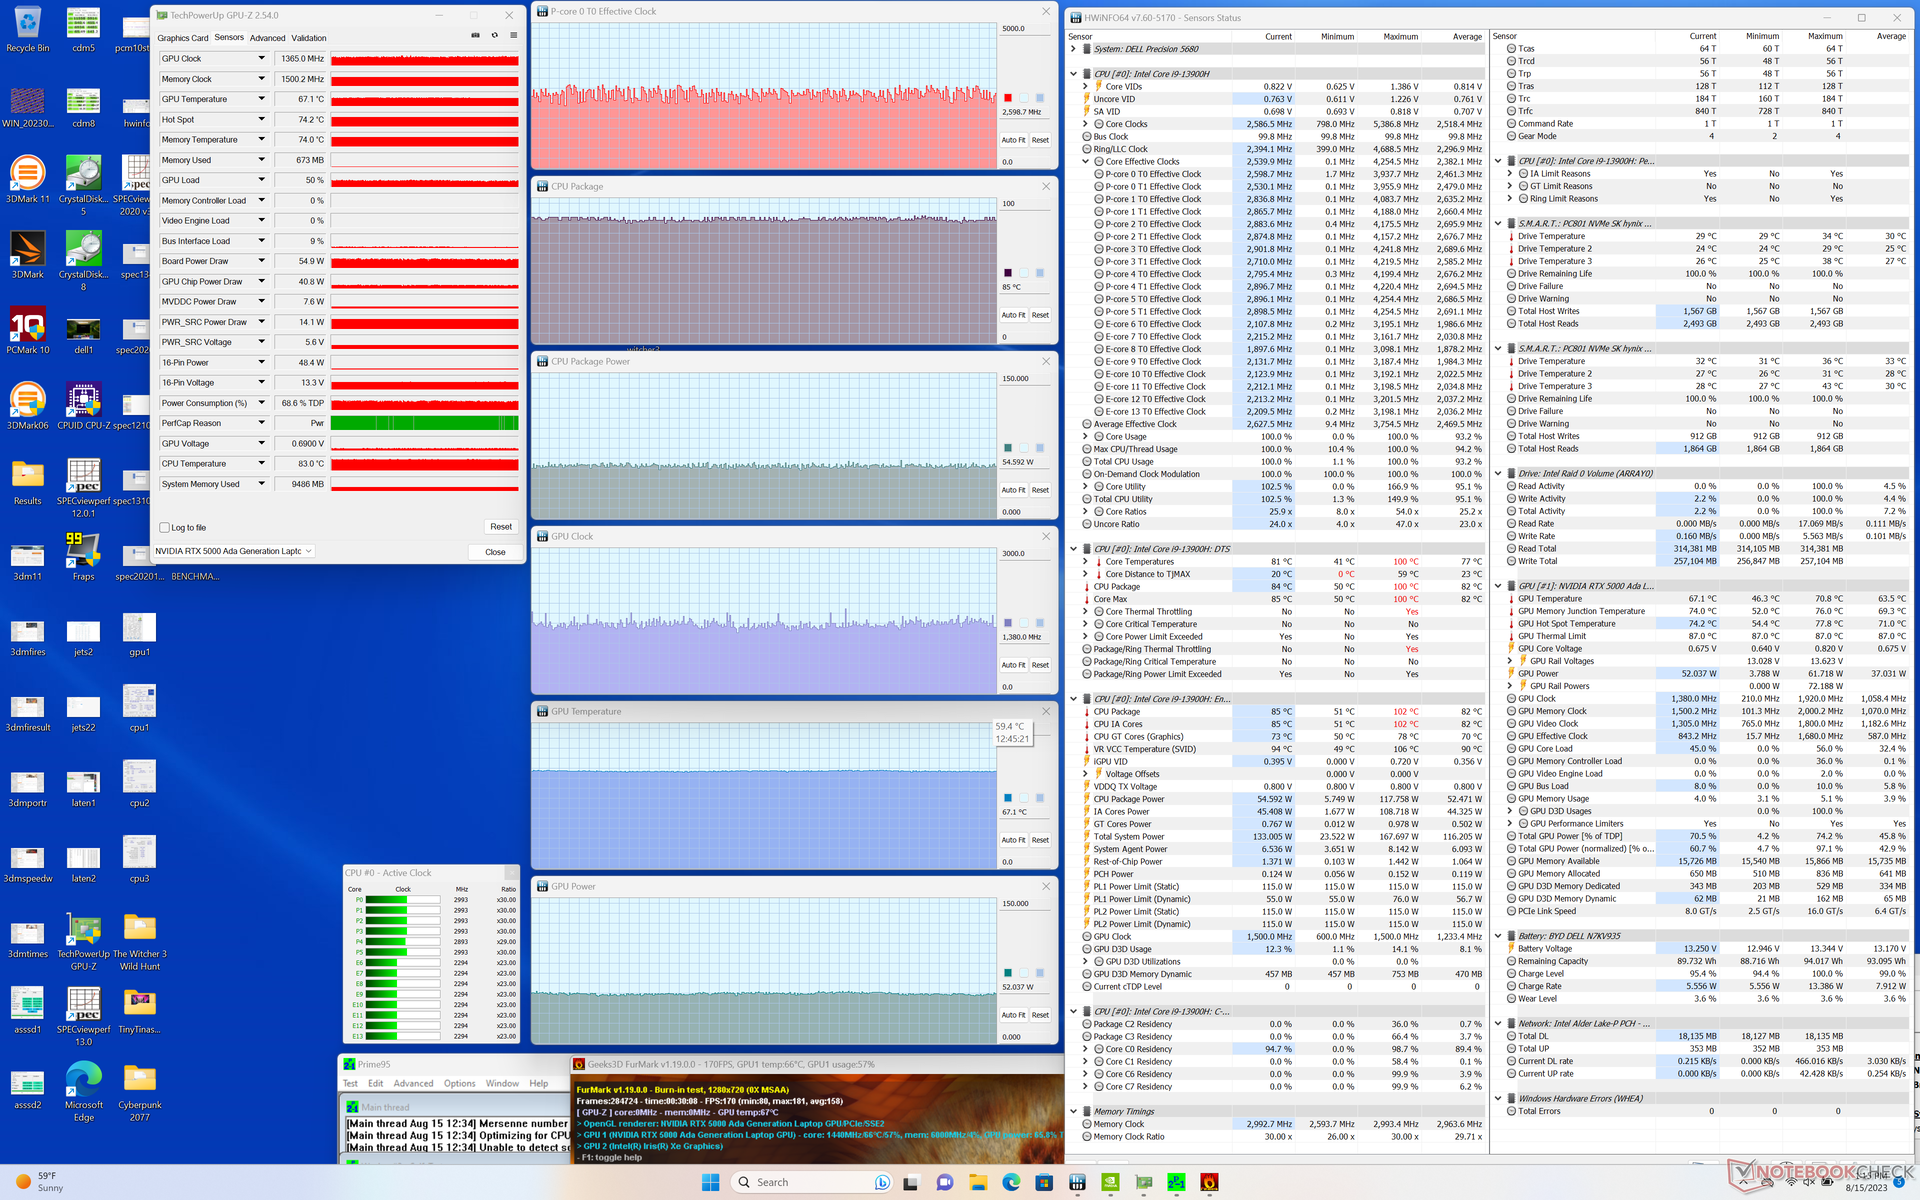
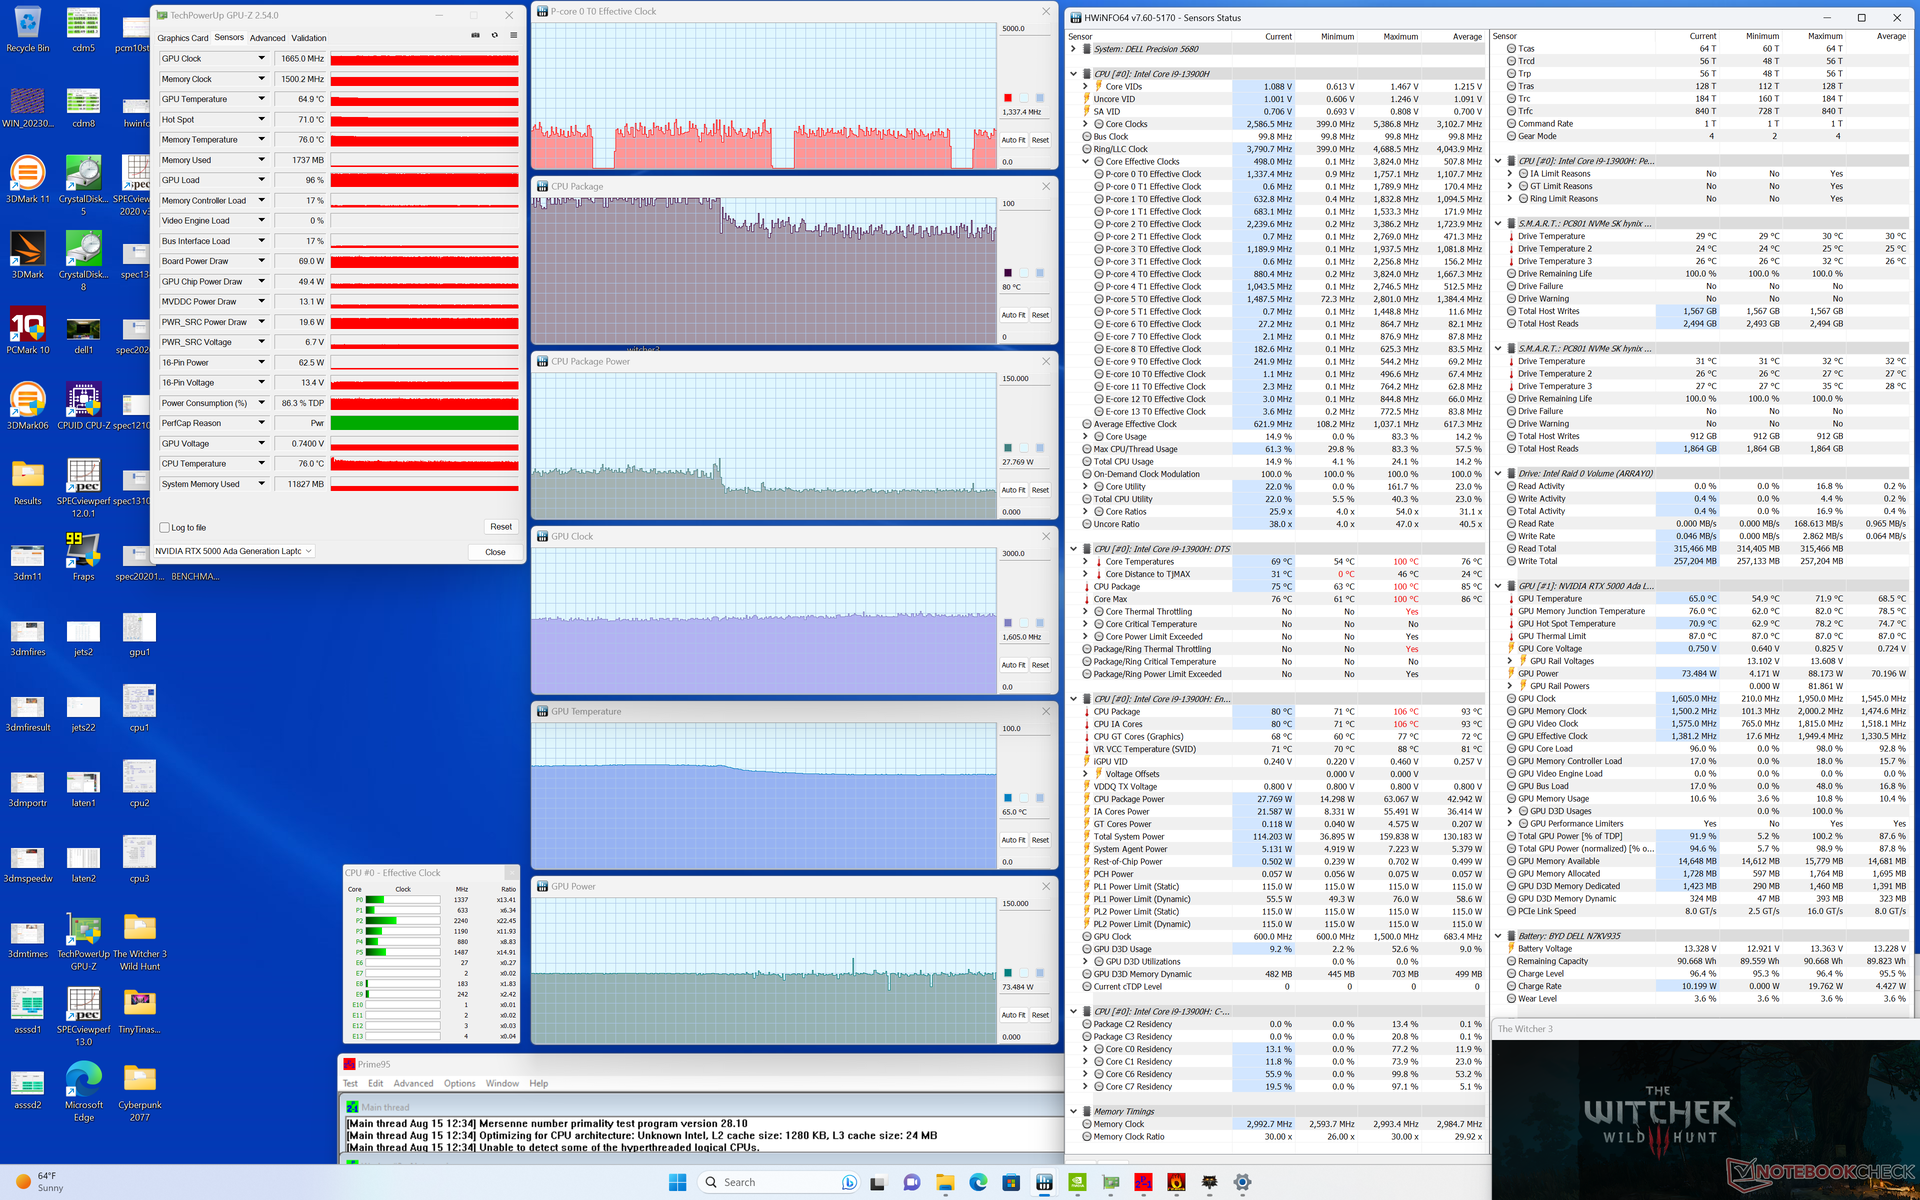
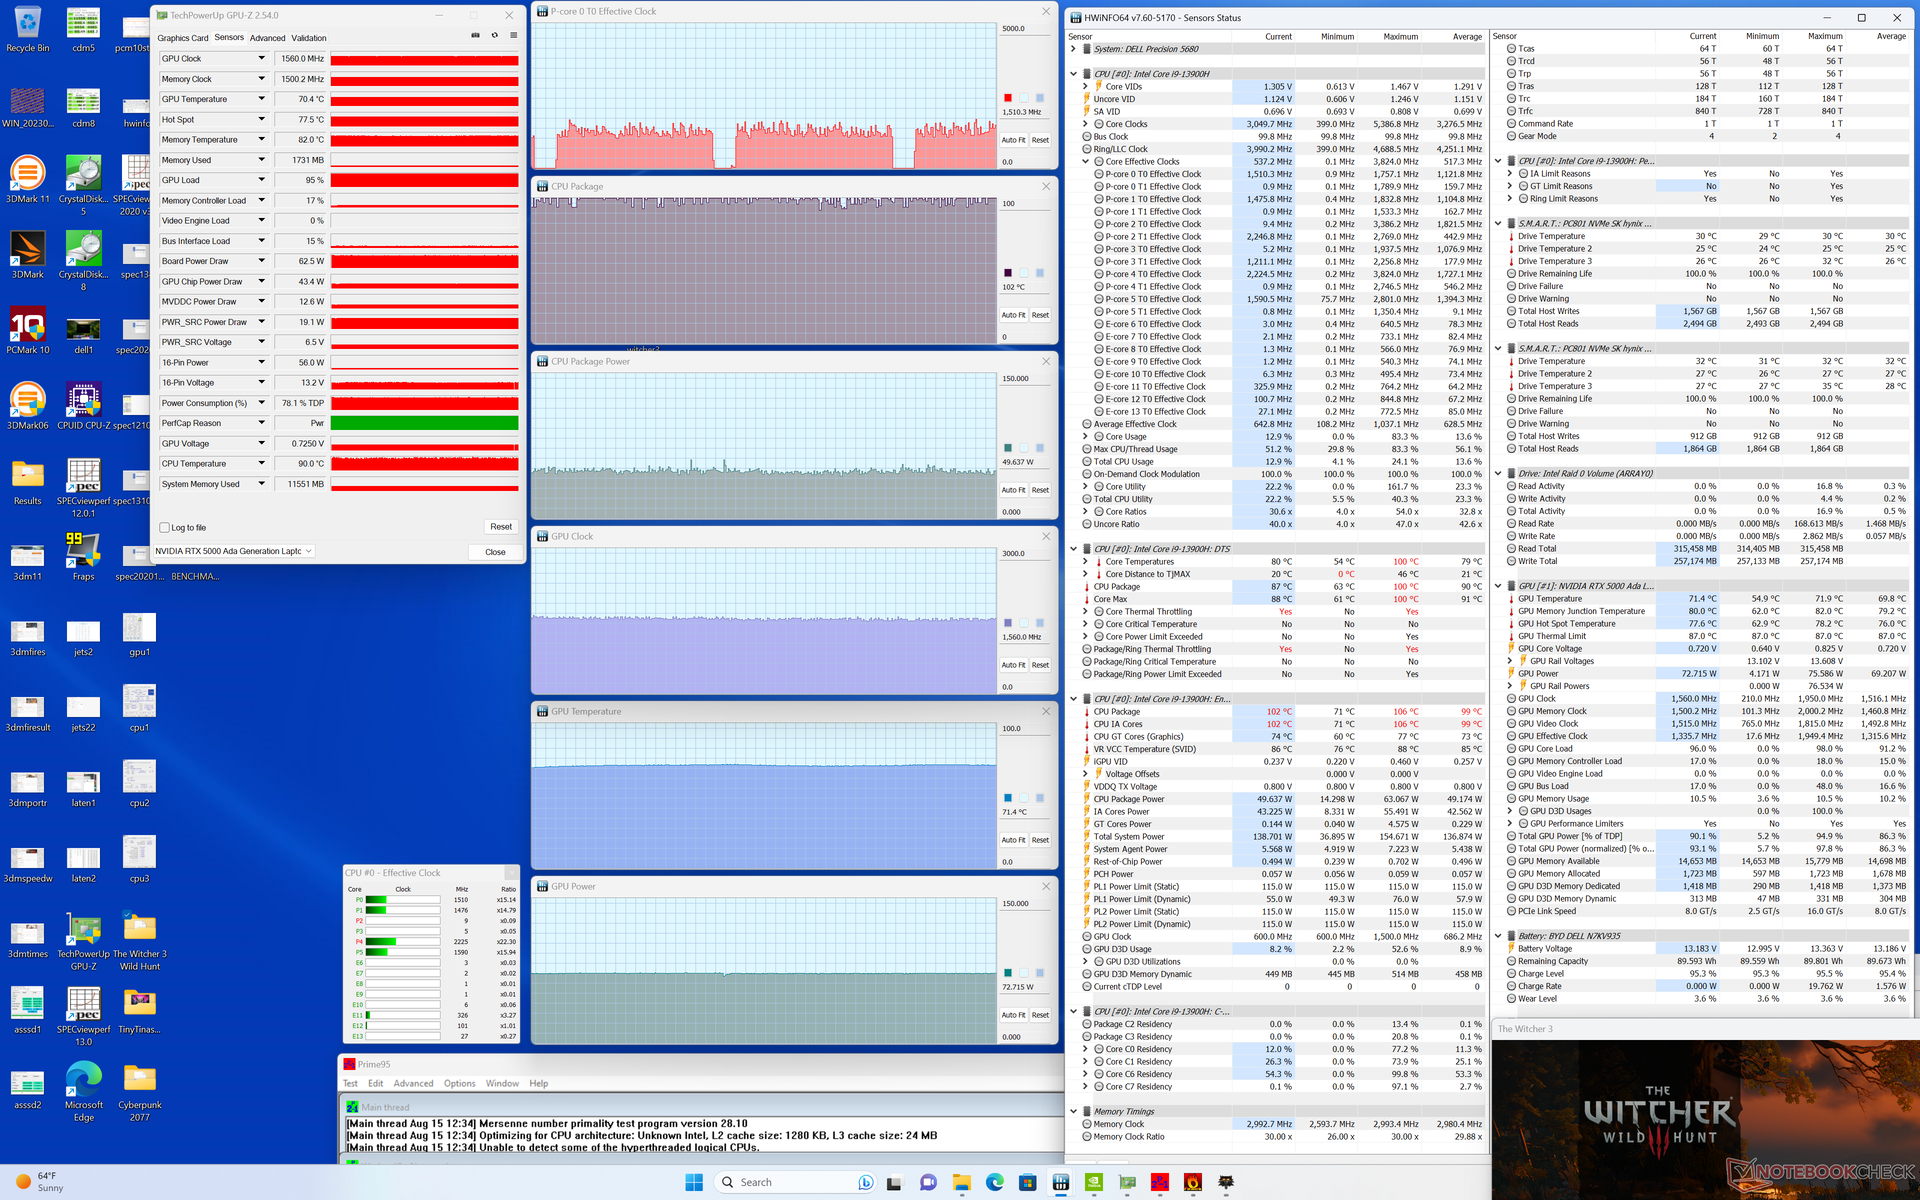
| CPU-klok (GHz) | GPU-klok (MHz) | Gemiddelde CPU-temperatuur (°C) | Gemiddelde GPU-temperatuur (°C) | |
| Systeem inactief | -- | -- | 60 | 46 |
| Prime95 Stress | ~2.8 | -- | 75 | 55 |
| Prime95 + FurMark Stress | ~2.6 | 1365 | 85 | 67 |
| Witcher 3 Stress (prestatiemodus) | ~1,5 | 1560 | 100 | 72 |
| Witcher 3 Spanning (evenwichtige modus) | ~1.3 | 1665 | 80 | 65 |
Luidsprekers
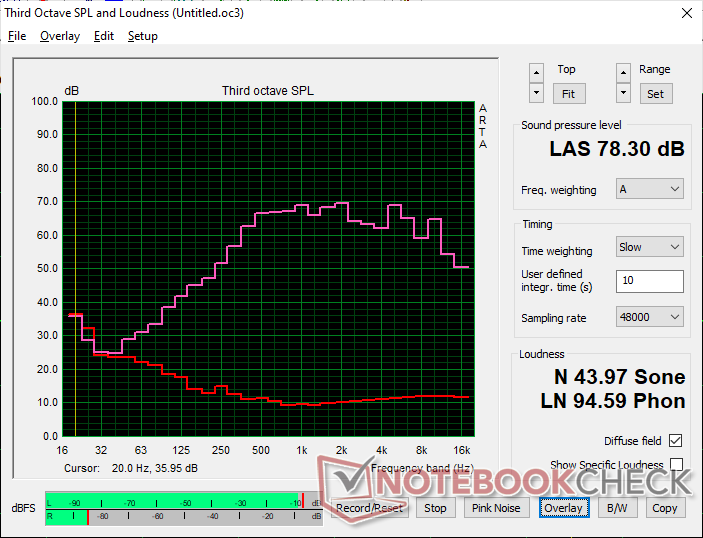
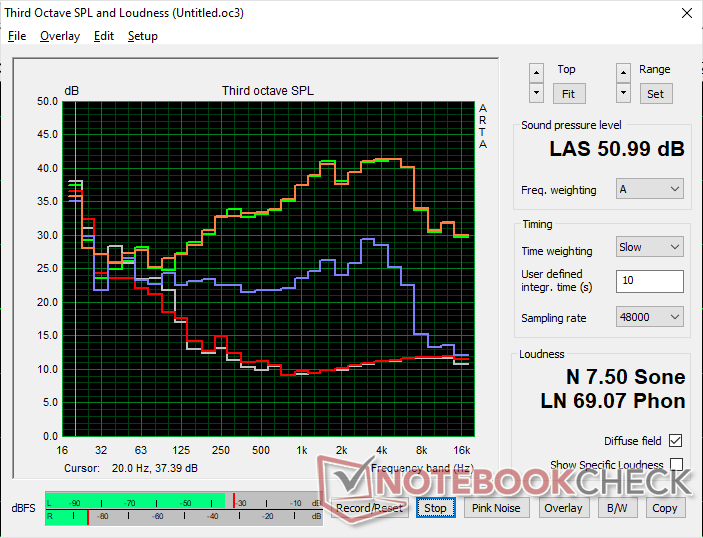
Dell Precision 5000 5680 audioanalyse
(±) | luidspreker luidheid is gemiddeld maar goed (78.3 dB)
Bas 100 - 315 Hz
(-) | bijna geen lage tonen - gemiddeld 16.4% lager dan de mediaan
(±) | lineariteit van de lage tonen is gemiddeld (7.5% delta ten opzichte van de vorige frequentie)
Midden 400 - 2000 Hz
(+) | evenwichtige middens - slechts 3.9% verwijderd van de mediaan
(+) | de middentonen zijn lineair (4.5% delta ten opzichte van de vorige frequentie)
Hoog 2 - 16 kHz
(+) | evenwichtige hoogtepunten - slechts 2.2% verwijderd van de mediaan
(±) | lineariteit van de hoogtepunten is gemiddeld (8.3% delta ten opzichte van de vorige frequentie)
Algemeen 100 - 16.000 Hz
(±) | lineariteit van het totale geluid is gemiddeld (15.5% verschil met de mediaan)
Vergeleken met dezelfde klasse
» 35% van alle geteste apparaten in deze klasse waren beter, 10% vergelijkbaar, 55% slechter
» De beste had een delta van 7%, het gemiddelde was 17%, de slechtste was 35%
Vergeleken met alle geteste toestellen
» 23% van alle geteste apparaten waren beter, 4% gelijk, 73% slechter
» De beste had een delta van 4%, het gemiddelde was 23%, de slechtste was 134%
Apple MacBook Pro 16 2021 M1 Pro audioanalyse
(+) | luidsprekers kunnen relatief luid spelen (84.7 dB)
Bas 100 - 315 Hz
(+) | goede baars - slechts 3.8% verwijderd van de mediaan
(+) | de lage tonen zijn lineair (5.2% delta naar de vorige frequentie)
Midden 400 - 2000 Hz
(+) | evenwichtige middens - slechts 1.3% verwijderd van de mediaan
(+) | de middentonen zijn lineair (2.1% delta ten opzichte van de vorige frequentie)
Hoog 2 - 16 kHz
(+) | evenwichtige hoogtepunten - slechts 1.9% verwijderd van de mediaan
(+) | de hoge tonen zijn lineair (2.7% delta naar de vorige frequentie)
Algemeen 100 - 16.000 Hz
(+) | het totale geluid is lineair (4.6% verschil met de mediaan)
Vergeleken met dezelfde klasse
» 0% van alle geteste apparaten in deze klasse waren beter, 0% vergelijkbaar, 100% slechter
» De beste had een delta van 5%, het gemiddelde was 17%, de slechtste was 45%
Vergeleken met alle geteste toestellen
» 0% van alle geteste apparaten waren beter, 0% gelijk, 100% slechter
» De beste had een delta van 4%, het gemiddelde was 23%, de slechtste was 134%
Energiebeheer - Ada Lovelace schittert
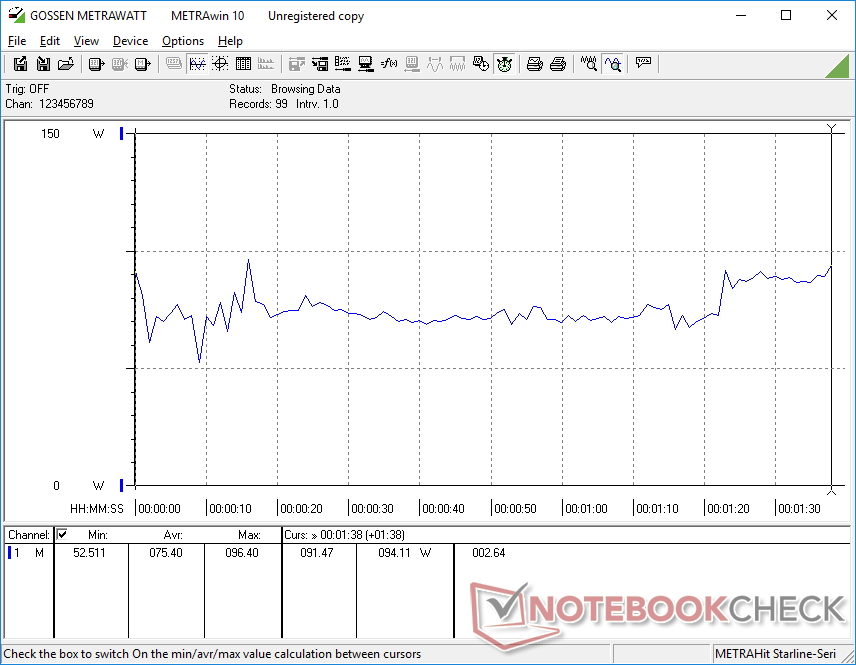
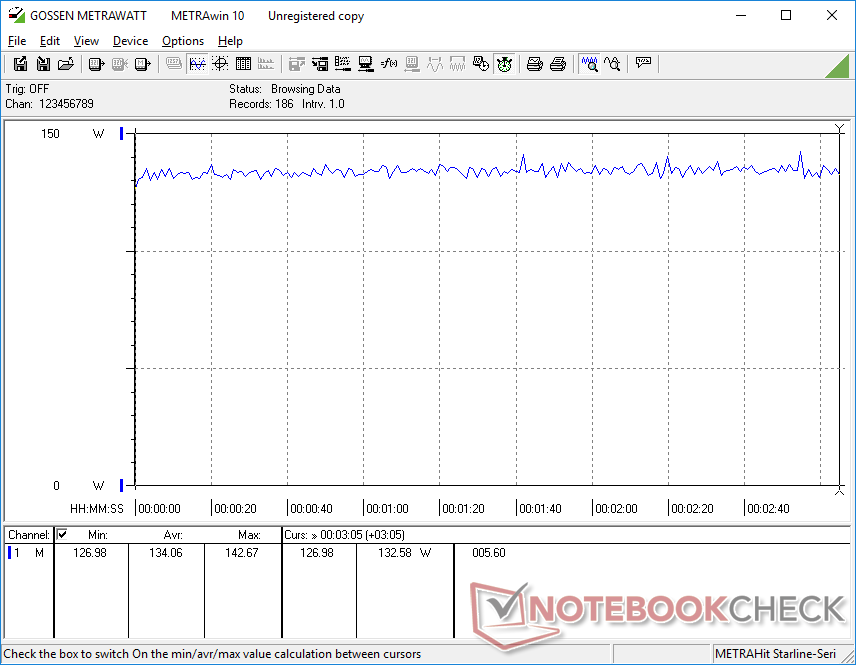
Stroomverbruik
De prestaties-per-watt liggen aanzienlijk hoger dan die van de meeste andere werkstations, omdat onze Precision een nieuwere generatie Ada Lovelace GPU gebruikt. Het uitvoeren van Witcher 3zou bijvoorbeeld slechts 134 W verbruiken op ons systeem vergeleken met 159 W en 189 W op de Precision 7670 Prestaties en HP ZBook Fury 16 G9, respectievelijk, hoewel onze RTX 5000 GPU beter zou presteren dan hun RTX A5500 GPU's, zoals hierboven vermeld.
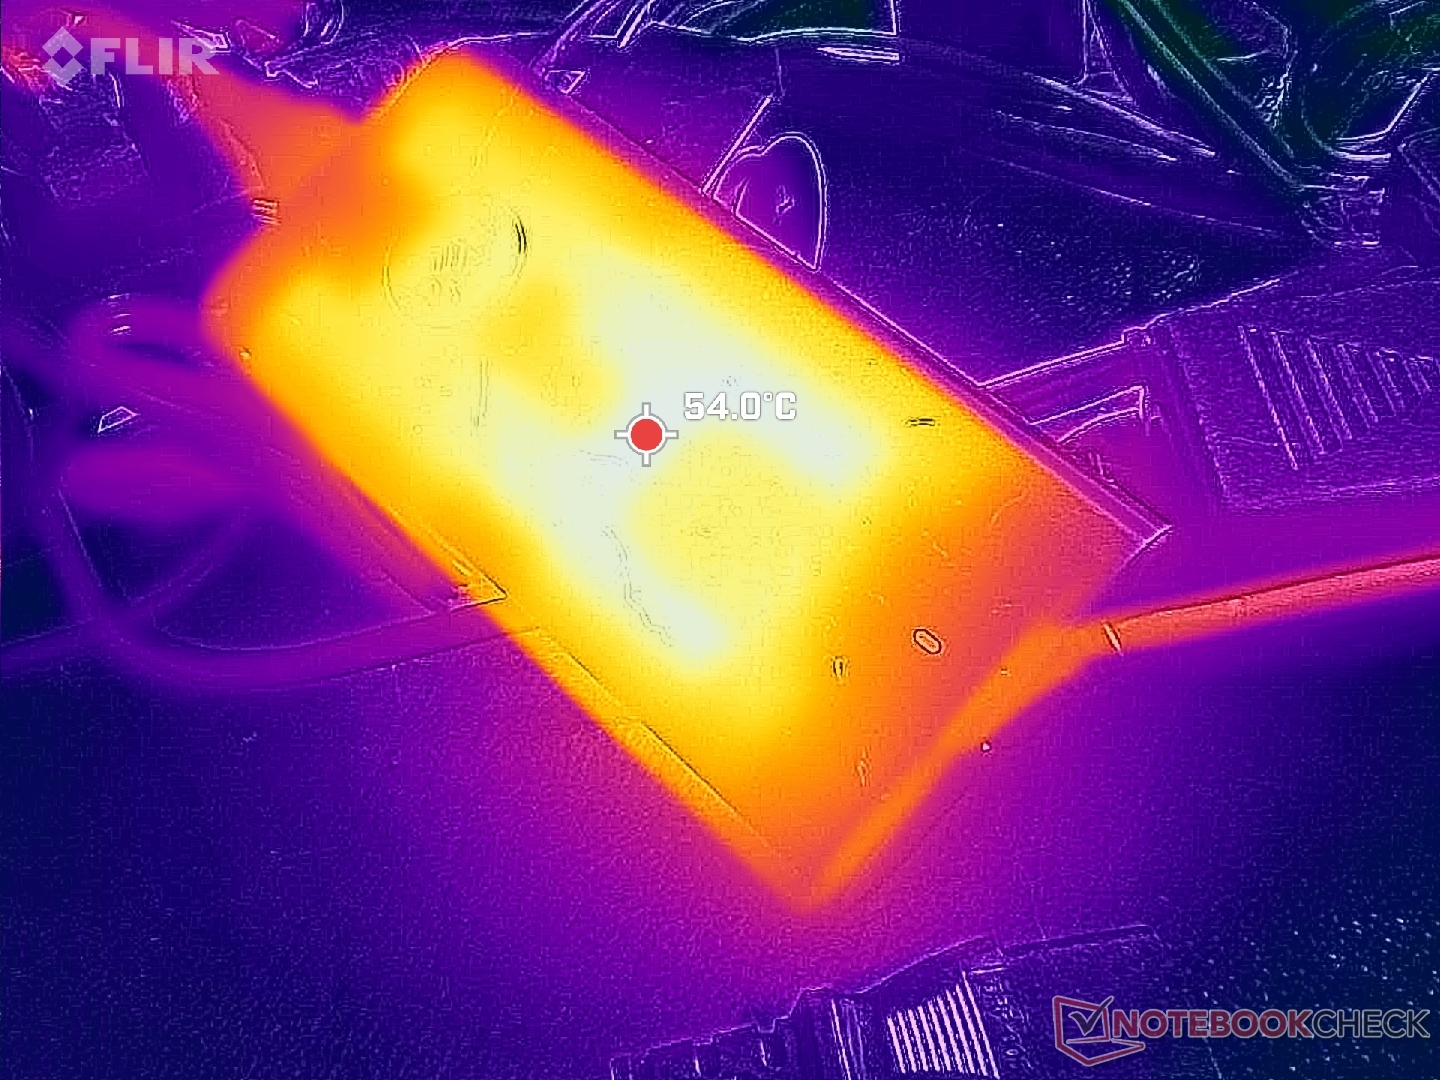
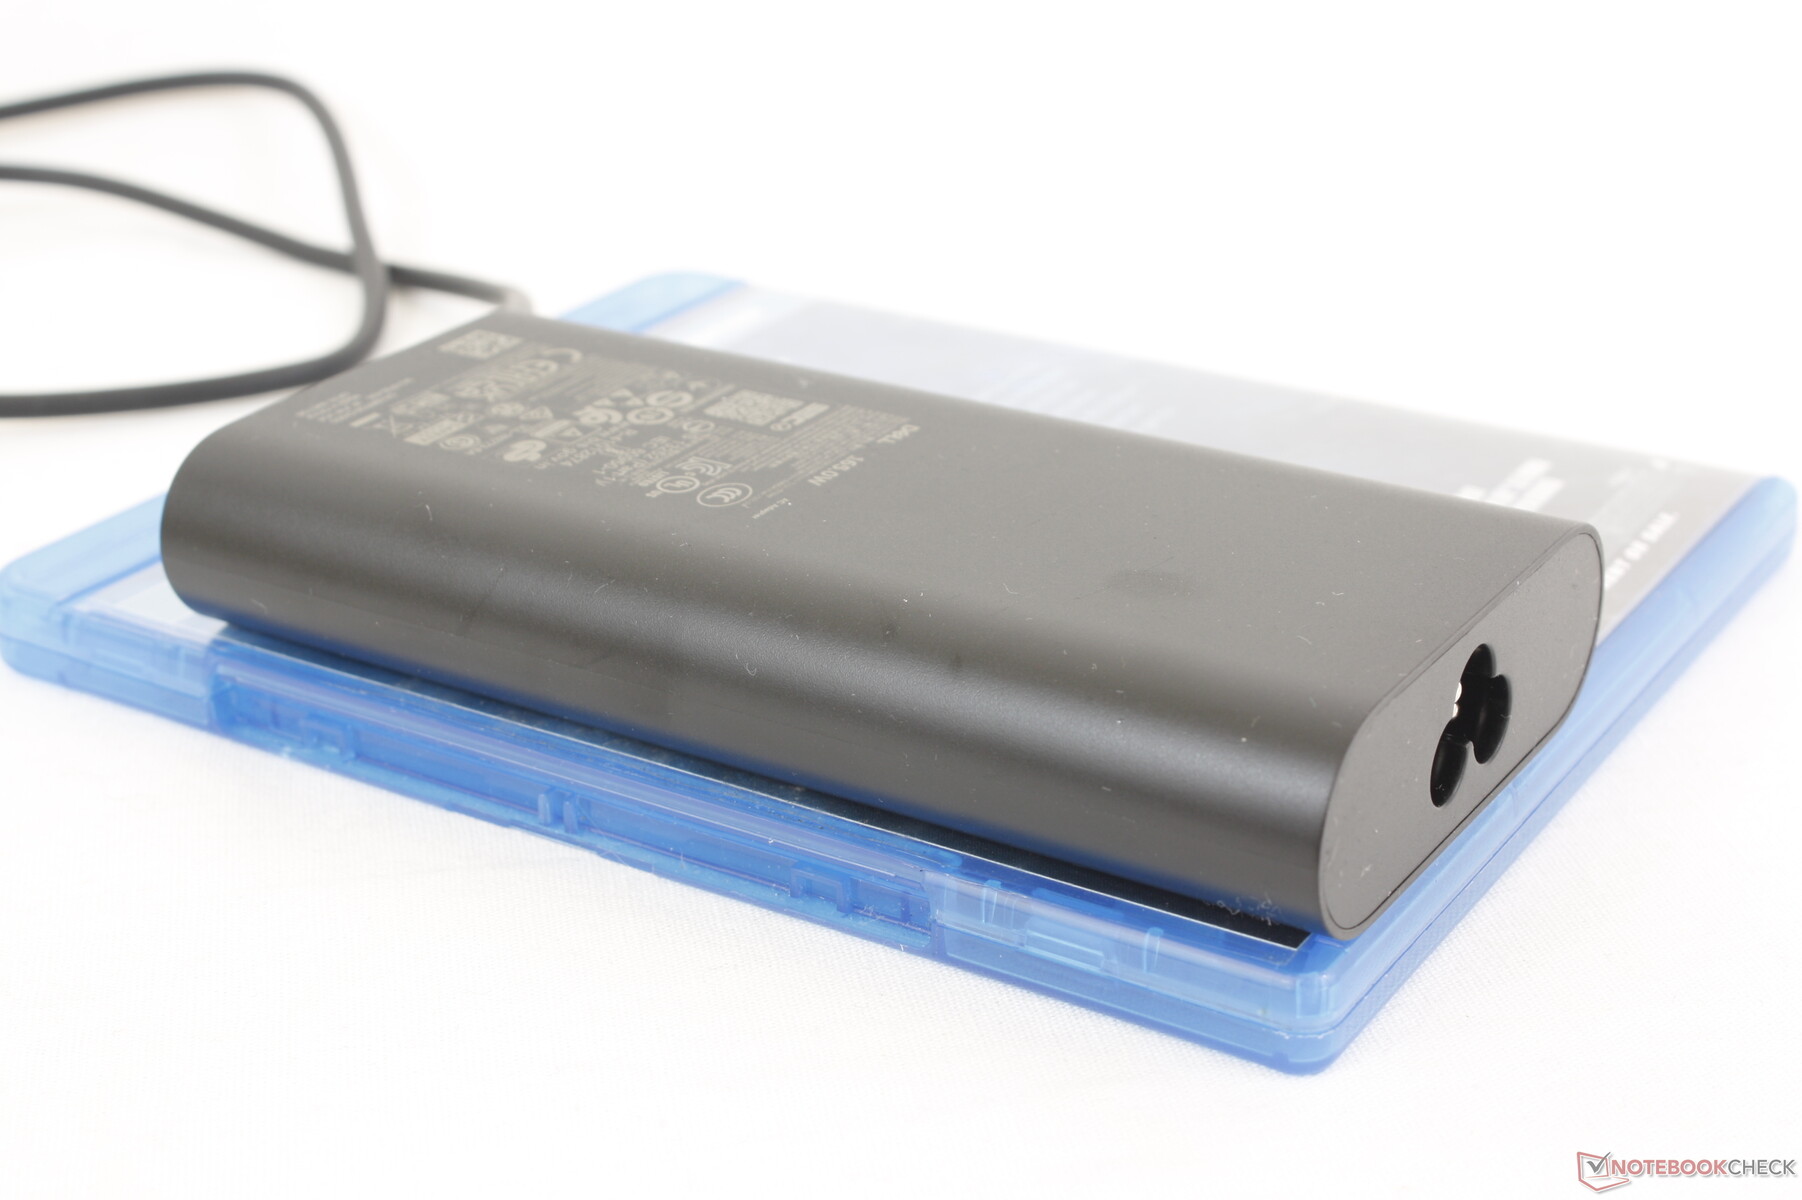
De relatief kleine (~13,5 x 6,5 x 2,2 cm) 165 W USB-C AC adapter verdient ook een vermelding voor zijn hoge vermogen. De meeste bestaande USB-C adapters zijn beperkt tot slechts 100 W tot maximaal 140 W, waardoor onze 165 W adapter een van de meest veelzijdige is. Deze nieuwe adapter lost de problemen met het opladen van de batterij die we ondervonden op het oudere Precision 7000 model, dat werd geleverd met een minder capabele 130 W USB-C adapter.
| Uit / Standby | |
| Inactief | |
| Belasting |
|
Key:
min: | |
| Dell Precision 5000 5680 i9-13900H, RTX 5000 Ada Generation Laptop, 2x SK hynix PC801 HFS512GEJ9X101N RAID 0, OLED, 3840x2400, 16" | Dell Precision 7000 7670 Performance i9-12950HX, RTX A5500 Laptop GPU, , OLED, 3840x2400, 16" | HP ZBook Fury 16 G9 i9-12950HX, RTX A5500 Laptop GPU, Micron 3400 1TB MTFDKBA1T0TFH, IPS, 3840x2400, 16" | Lenovo ThinkPad P16 G1 RTX A5500 i9-12950HX, RTX A5500 Laptop GPU, WDC PC SN810 2TB, IPS, 3840x2400, 16" | MSI CreatorPro Z16P B12UKST i7-12700H, RTX A3000 Laptop GPU, Samsung PM9A1 MZVL21T0HCLR, IPS, 2560x1600, 16" | Asus ExpertBook B6 Flip B6602FC2 i9-12950HX, RTX A2000 Laptop GPU, Samsung PM9A1 MZVL21T0HCLR, IPS, 2560x1600, 16" | |
|---|---|---|---|---|---|---|
| Power Consumption | -99% | -86% | -53% | -18% | -35% | |
| Idle Minimum * (Watt) | 8 | 16.4 -105% | 19.5 -144% | 7.5 6% | 10.8 -35% | 10.5 -31% |
| Idle Average * (Watt) | 10.4 | 35.9 -245% | 29 -179% | 20.1 -93% | 16.3 -57% | 11.9 -14% |
| Idle Maximum * (Watt) | 30.5 | 47 -54% | 40.7 -33% | 40 -31% | 16.9 45% | 18 41% |
| Load Average * (Watt) | 75.4 | 147.1 -95% | 142.1 -88% | 137 -82% | 111.7 -48% | 182 -141% |
| Witcher 3 ultra * (Watt) | 134 | 158.8 -19% | 188.6 -41% | 208 -55% | 152.1 -14% | 177.5 -32% |
| Load Maximum * (Watt) | 175 | 311 -78% | 224.4 -28% | 285.9 -63% | 177.4 -1% | 229 -31% |
* ... kleiner is beter
Power Consumption Witcher 3 / Stresstest
Power Consumption external Monitor
Levensduur batterij
De batterijduur is uitstekend gezien de hoge prestaties en het veeleisende 4K OLED-paneel. We zijn in staat om bijna 10 uur echt WLAN browsen op te nemen in het Balanced profiel met de iGPU actief, vergeleken met bijna de helft van dat op alternatieven zoals de Lenovo ThinkPad P16 G1 ofMSI CreatorPro Z16P.
Opladen van leeg naar vol duurt ongeveer 2 uur met de meegeleverde 165 W AC-adapter. Onze USB-C adapter van 65 W van derden kan het systeem ook opladen, zij het langzamer.
| Dell Precision 5000 5680 i9-13900H, RTX 5000 Ada Generation Laptop, 98 Wh | Dell Precision 7000 7670 Performance i9-12950HX, RTX A5500 Laptop GPU, 93 Wh | HP ZBook Fury 16 G9 i9-12950HX, RTX A5500 Laptop GPU, 95 Wh | Lenovo ThinkPad P16 G1 RTX A5500 i9-12950HX, RTX A5500 Laptop GPU, 94 Wh | MSI CreatorPro Z16P B12UKST i7-12700H, RTX A3000 Laptop GPU, 90 Wh | Asus ExpertBook B6 Flip B6602FC2 i9-12950HX, RTX A2000 Laptop GPU, 90 Wh | |
|---|---|---|---|---|---|---|
| Batterijduur | -53% | -46% | -41% | -41% | -14% | |
| Reader / Idle (h) | 17.9 | 5.3 -70% | 12.5 -30% | |||
| WiFi v1.3 (h) | 9.9 | 4.7 -53% | 6 -39% | 5.8 -41% | 5.8 -41% | 8.7 -12% |
| Load (h) | 1.7 | 1.2 -29% | 1.7 0% | |||
| H.264 (h) | 5.8 |
Pro
Contra
Verdict - Krachtiger dan het lijkt
De Precision 5680 is lowkey een van de slankste en snelste mobiele werkstations in de hele line-up van Dell. Het draagbare ontwerp, de 165 W USB-C adapter, het uitstekende 4K OLED beeldscherm en de krachtige RTX 5000 GPU zijn de sterkste punten van dit model. Vooral de laatste is verantwoordelijk voor een groot deel van de prestatieverbeteringen en de voordelen ten opzichte van de batterijlevensduur van de meeste andere werkstations, dankzij de Ada Lovelace-architectuur en zeer hoge prestaties-per-watt.
De Precision 5680 biedt een van de hoogste prestaties-per-watt in de groeiende categorie van dunne en lichte werkstations.
Hardcore werkstationgebruikers geven misschien nog steeds de voorkeur aan grotere en dikkere modellen zoals de HP ZBook Fury 16 of Precision 7670 omdat het slanke ontwerp van de Precision 5680 afziet van enkele belangrijke functies zoals uitbreidbaar RAM, WAN, ECC RAM en bredere poortopties. Het verschrikkelijke clickpad is lang niet zo nauwkeurig als de touchpads op de HP of Lenovo ThinkPad P16 die echte muisknoppen hebben voor betere controle.
Prijs en beschikbaarheid
Dell levert de Precision 5680 nu vanaf $2490 USD tot meer dan $6500 zoals beoordeeld.
Dell Precision 5000 5680
- 18-08-2023 v7 (old)
Allen Ngo
Transparantie
De selectie van te beoordelen apparaten wordt gemaakt door onze redactie. Het testexemplaar werd ten behoeve van deze beoordeling door de fabrikant of detailhandelaar in bruikleen aan de auteur verstrekt. De kredietverstrekker had geen invloed op deze recensie, noch ontving de fabrikant vóór publicatie een exemplaar van deze recensie. Er bestond geen verplichting om deze recensie te publiceren. Als onafhankelijk mediabedrijf is Notebookcheck niet onderworpen aan het gezag van fabrikanten, detailhandelaren of uitgevers.
[transparency_disclaimer]Dit is hoe Notebookcheck test
Elk jaar beoordeelt Notebookcheck onafhankelijk honderden laptops en smartphones met behulp van gestandaardiseerde procedures om ervoor te zorgen dat alle resultaten vergelijkbaar zijn. We hebben onze testmethoden al zo'n 20 jaar voortdurend ontwikkeld en daarbij de industriestandaard bepaald. In onze testlaboratoria wordt gebruik gemaakt van hoogwaardige meetapparatuur door ervaren technici en redacteuren. Deze tests omvatten een validatieproces in meerdere fasen. Ons complexe beoordelingssysteem is gebaseerd op honderden goed onderbouwde metingen en benchmarks, waardoor de objectiviteit behouden blijft. Meer informatie over onze testmethoden kunt u hier vinden.
Price comparison

