Lenovo ThinkPad P16 G1 RTX A5500 werkstation review: Sneller dan de Dell Precision 7670
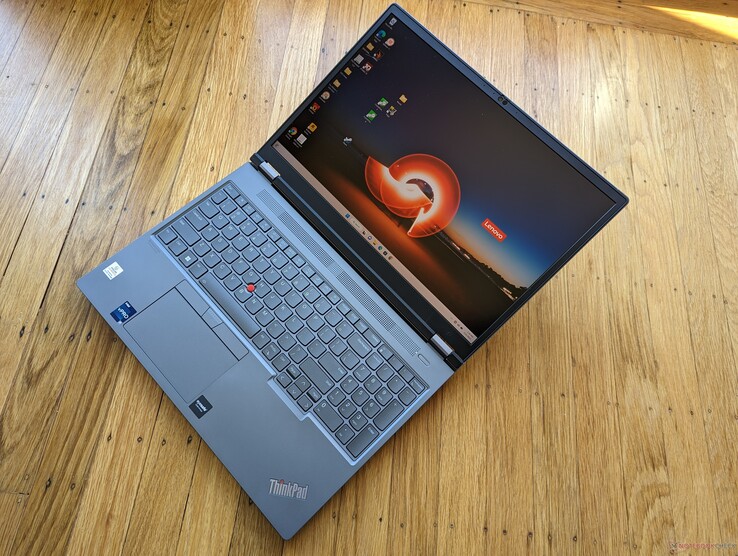
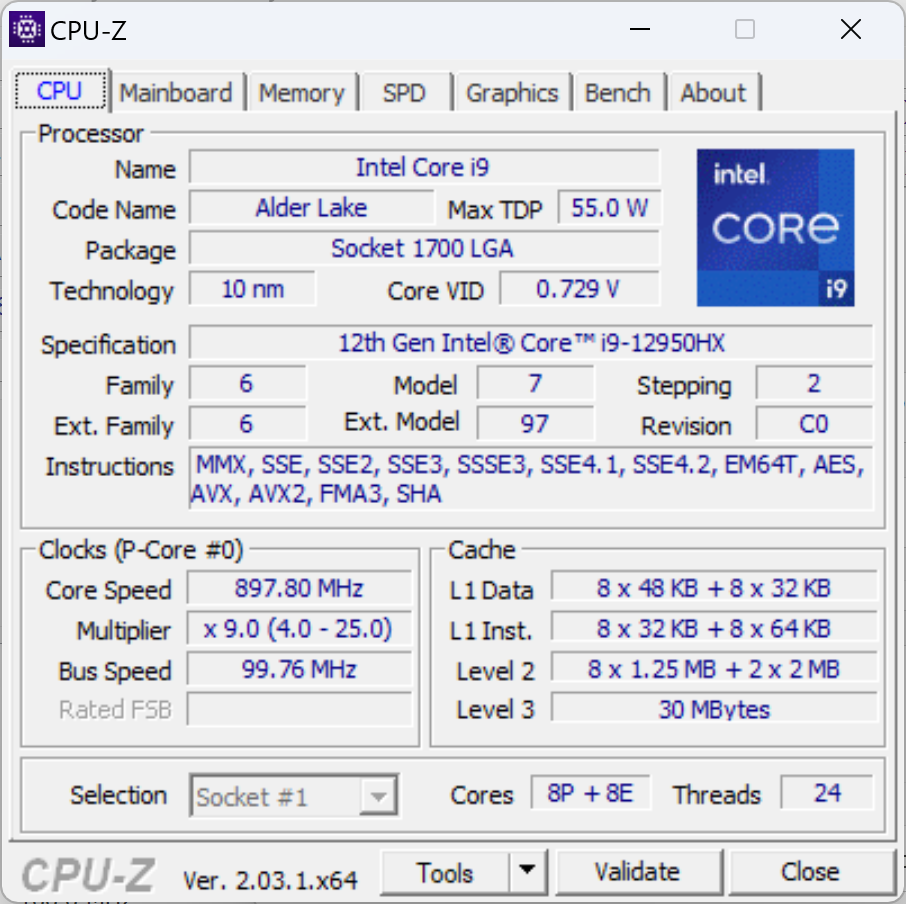
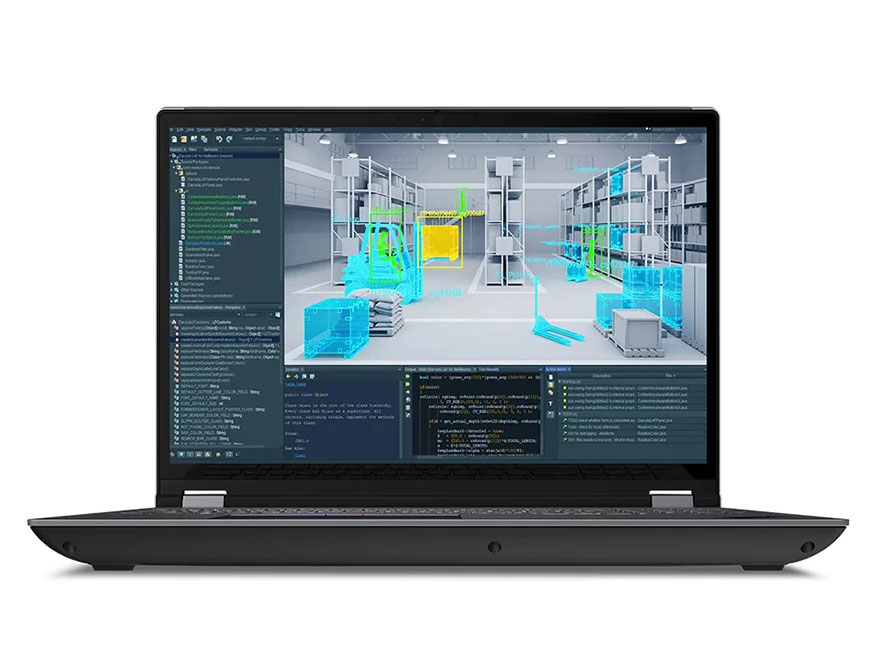
De ThinkPad P16 G1 is een nieuwe generatie 16-inch ThinkPad-werkstations die is ontworpen om de bestaande 16-inch ThinkPad P1-serie te overtreffen. Hij is voorzien van enkele van de snelste mobiele CPU's en workstation GPU's die momenteel beschikbaar zijn, respectievelijk de Core i9-12950HX en RTX A5500, om een van de snelste mobiele workstations op de markt te zijn. Onze unit zoals geconfigureerd wordt verkocht voor ongeveer $9000 USD. Natuurlijk zijn er ook goedkopere SKU's met tragere geïntegreerde UHD-graphics of de Intel ARC Pro A30M beschikbaar met startprijzen van 3400 dollar.
Het model concurreert rechtstreeks met andere high-end mobiele werkstations en sommige Nvidia Studio laptops zoals de Dell Precision 7670, Asus ProArt StudioBook Pro 16, MSI CreatorPro Z16P, of de HP ZBook Studio 16 G9. Zie onze volledige review over de ThinkPad P16 G1 RTX A2000 configuratie om meer te weten te komen over het chassis en andere fysieke kenmerken van het model. Deze review zal zich richten op wat gebruikers kunnen verwachten van de ThinkPad P16 G1 in termen van prestaties indien geconfigureerd met de high-end CPU en GPU opties.
Meer Lenovo reviews:
Potentiële concurrenten in vergelijking
Evaluatie | Datum | Model | Gewicht | Hoogte | Formaat | Resolutie | Beste prijs |
|---|---|---|---|---|---|---|---|
| 91 % v7 (old) | 02-2023 | Lenovo ThinkPad P16 G1 RTX A5500 i9-12950HX, RTX A5500 Laptop GPU | 3 kg | 30.23 mm | 16.00" | 3840x2400 | |
v (old) | 12-2021 | Asus ProArt StudioBook 16 W7600H5A-2BL2 W-11955M, RTX A5000 Laptop GPU | 2.4 kg | 21.4 mm | 16.00" | 3840x2400 | |
| 89.1 % v7 (old) | 12-2022 | Dell Precision 7000 7670 Performance i9-12950HX, RTX A5500 Laptop GPU | 2.8 kg | 25.95 mm | 16.00" | 3840x2400 | |
| 88.2 % v7 (old) | 02-2023 | Lenovo ThinkPad P16 G1 21D6001DMB i7-12850HX, RTX A2000 Laptop GPU | 3 kg | 30.23 mm | 16.00" | 2560x1600 | |
| 84.3 % v7 (old) | 11-2022 | MSI CreatorPro Z16P B12UKST i7-12700H, RTX A3000 Laptop GPU | 2.4 kg | 19 mm | 16.00" | 2560x1600 | |
| 90.1 % v7 (old) | 11-2022 | HP ZBook Studio 16 G9 62U04EA i7-12800H, RTX A2000 Laptop GPU | 1.8 kg | 19 mm | 16.00" | 3840x2400 |
Zaak
SD-kaartlezer
De geïntegreerde kaartlezer biedt slechts gemiddelde overdrachtssnelheden. Het verplaatsen van 1 GB aan foto's van onze UHS-II testkaart naar de desktop duurt ongeveer 14 seconden, vergeleken met minder dan de helft daarvan op de Precision 7670. Voor een high-end mobiel werkstation zoals onze ThinkPad P1 hadden we iets meer verwacht.
| SD Card Reader | |
| average JPG Copy Test (av. of 3 runs) | |
| Dell Precision 7000 7670 Performance (Toshiba Exceria Pro SDXC 64 GB UHS-II) | |
| MSI CreatorPro Z16P B12UKST (AV Pro V60) | |
| Lenovo ThinkPad P16 G1 RTX A5500 (Toshiba Exceria Pro SDXC 64 GB UHS-II) | |
| HP ZBook Studio 16 G9 62U04EA (Angelbird AV PRO V60) | |
| Asus ProArt StudioBook 16 W7600H5A-2BL2 (AV Pro SD microSD 128 GB V60) | |
| Lenovo ThinkPad P16 G1 21D6001DMB (AV Pro V60) | |
| maximum AS SSD Seq Read Test (1GB) | |
| Dell Precision 7000 7670 Performance (Toshiba Exceria Pro SDXC 64 GB UHS-II) | |
| Asus ProArt StudioBook 16 W7600H5A-2BL2 (AV Pro SD microSD 128 GB V60) | |
| MSI CreatorPro Z16P B12UKST (AV Pro V60) | |
| Lenovo ThinkPad P16 G1 RTX A5500 (Toshiba Exceria Pro SDXC 64 GB UHS-II) | |
| HP ZBook Studio 16 G9 62U04EA (Angelbird AV PRO V60) | |
| Lenovo ThinkPad P16 G1 21D6001DMB (AV Pro V60) | |
Communicatie
| Networking | |
| iperf3 transmit AX12 | |
| Asus ProArt StudioBook 16 W7600H5A-2BL2 | |
| iperf3 receive AX12 | |
| Asus ProArt StudioBook 16 W7600H5A-2BL2 | |
| iperf3 receive AXE11000 6GHz | |
| MSI CreatorPro Z16P B12UKST | |
| HP ZBook Studio 16 G9 62U04EA | |
| Dell Precision 7000 7670 Performance | |
| Lenovo ThinkPad P16 G1 RTX A5500 | |
| iperf3 receive AXE11000 | |
| Lenovo ThinkPad P16 G1 21D6001DMB | |
| Lenovo ThinkPad P16 G1 RTX A5500 | |
| Dell Precision 7000 7670 Performance | |
| iperf3 transmit AXE11000 | |
| Lenovo ThinkPad P16 G1 RTX A5500 | |
| Lenovo ThinkPad P16 G1 21D6001DMB | |
| Dell Precision 7000 7670 Performance | |
| iperf3 transmit AXE11000 6GHz | |
| MSI CreatorPro Z16P B12UKST | |
| HP ZBook Studio 16 G9 62U04EA | |
| Lenovo ThinkPad P16 G1 RTX A5500 | |
| Dell Precision 7000 7670 Performance | |
Webcam


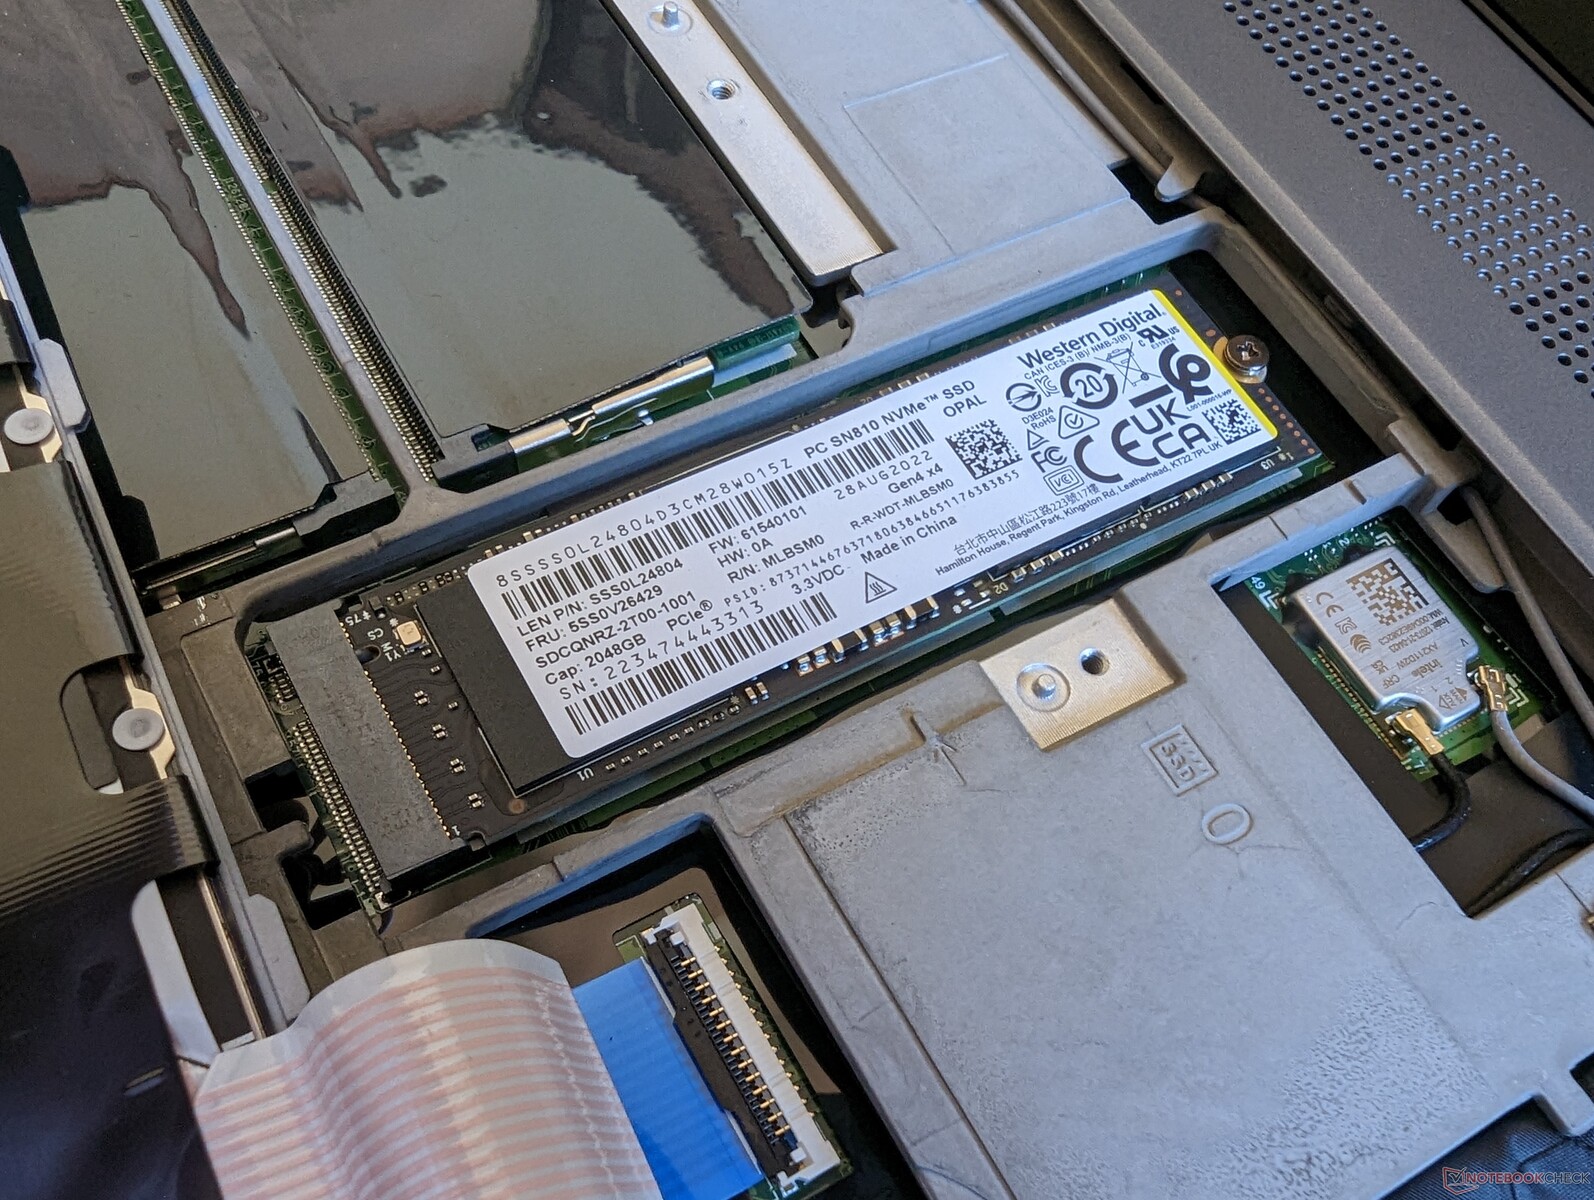
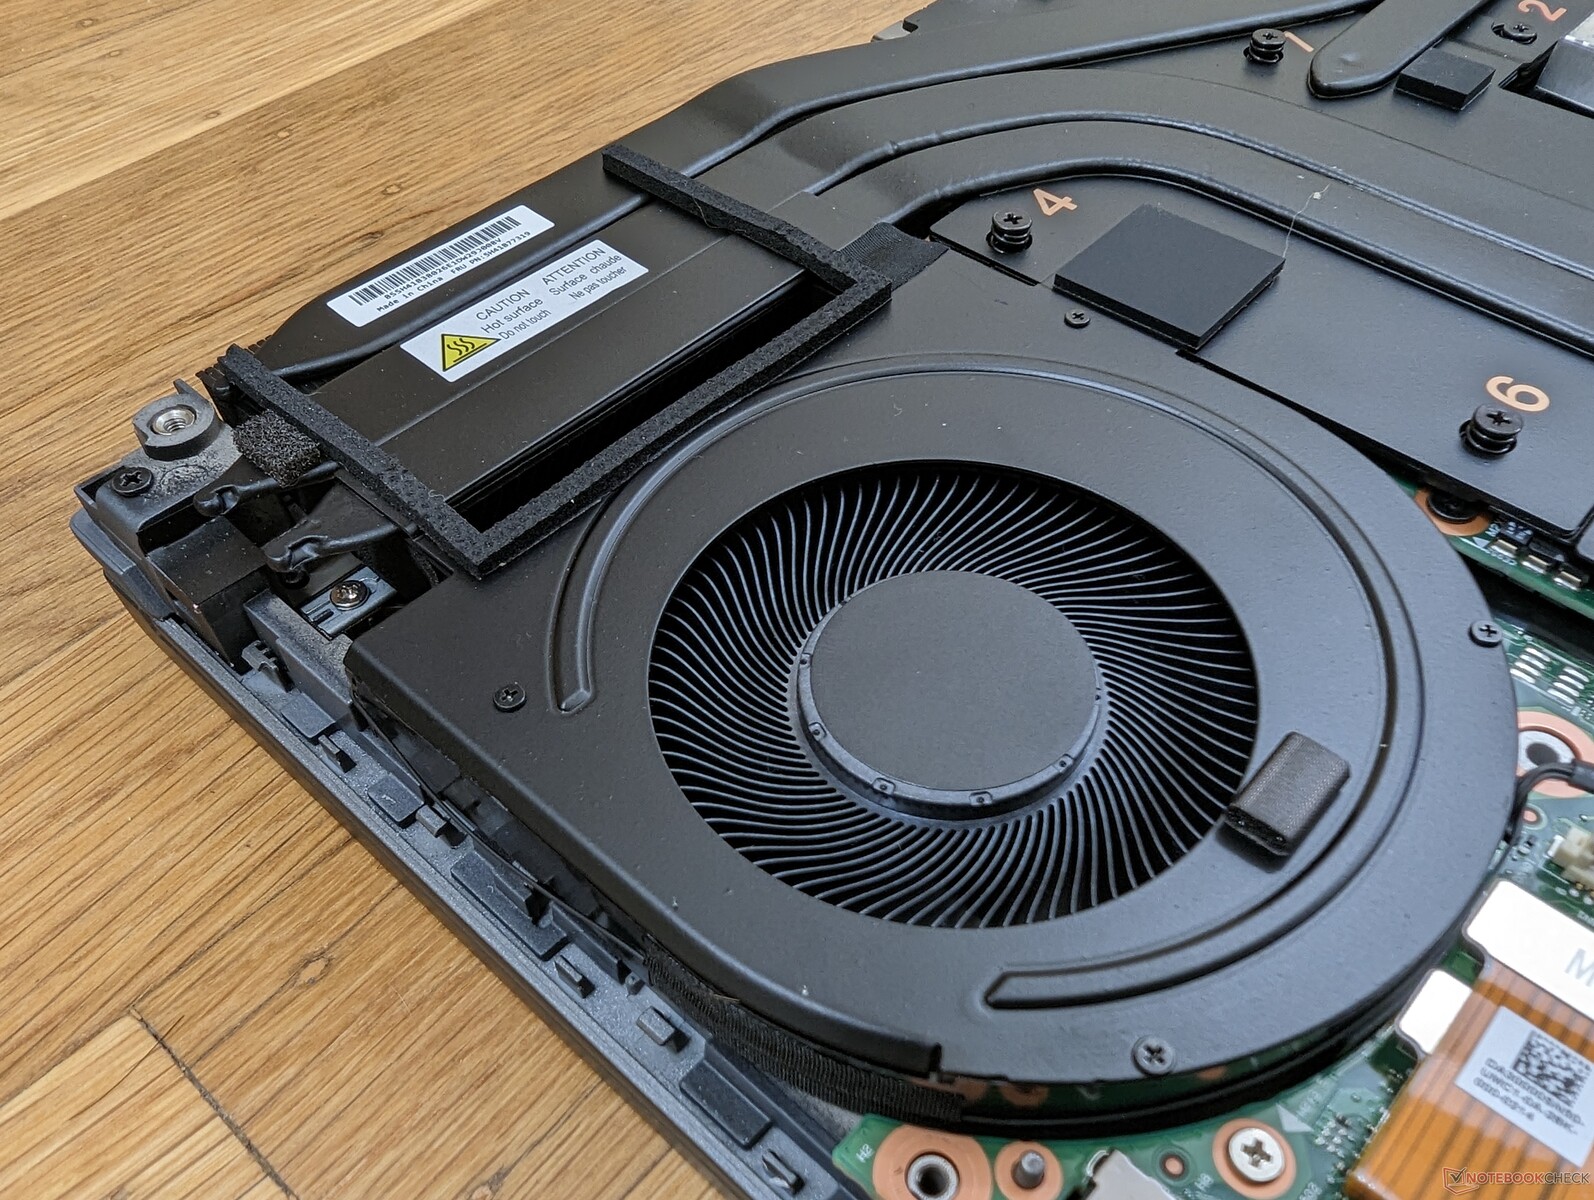
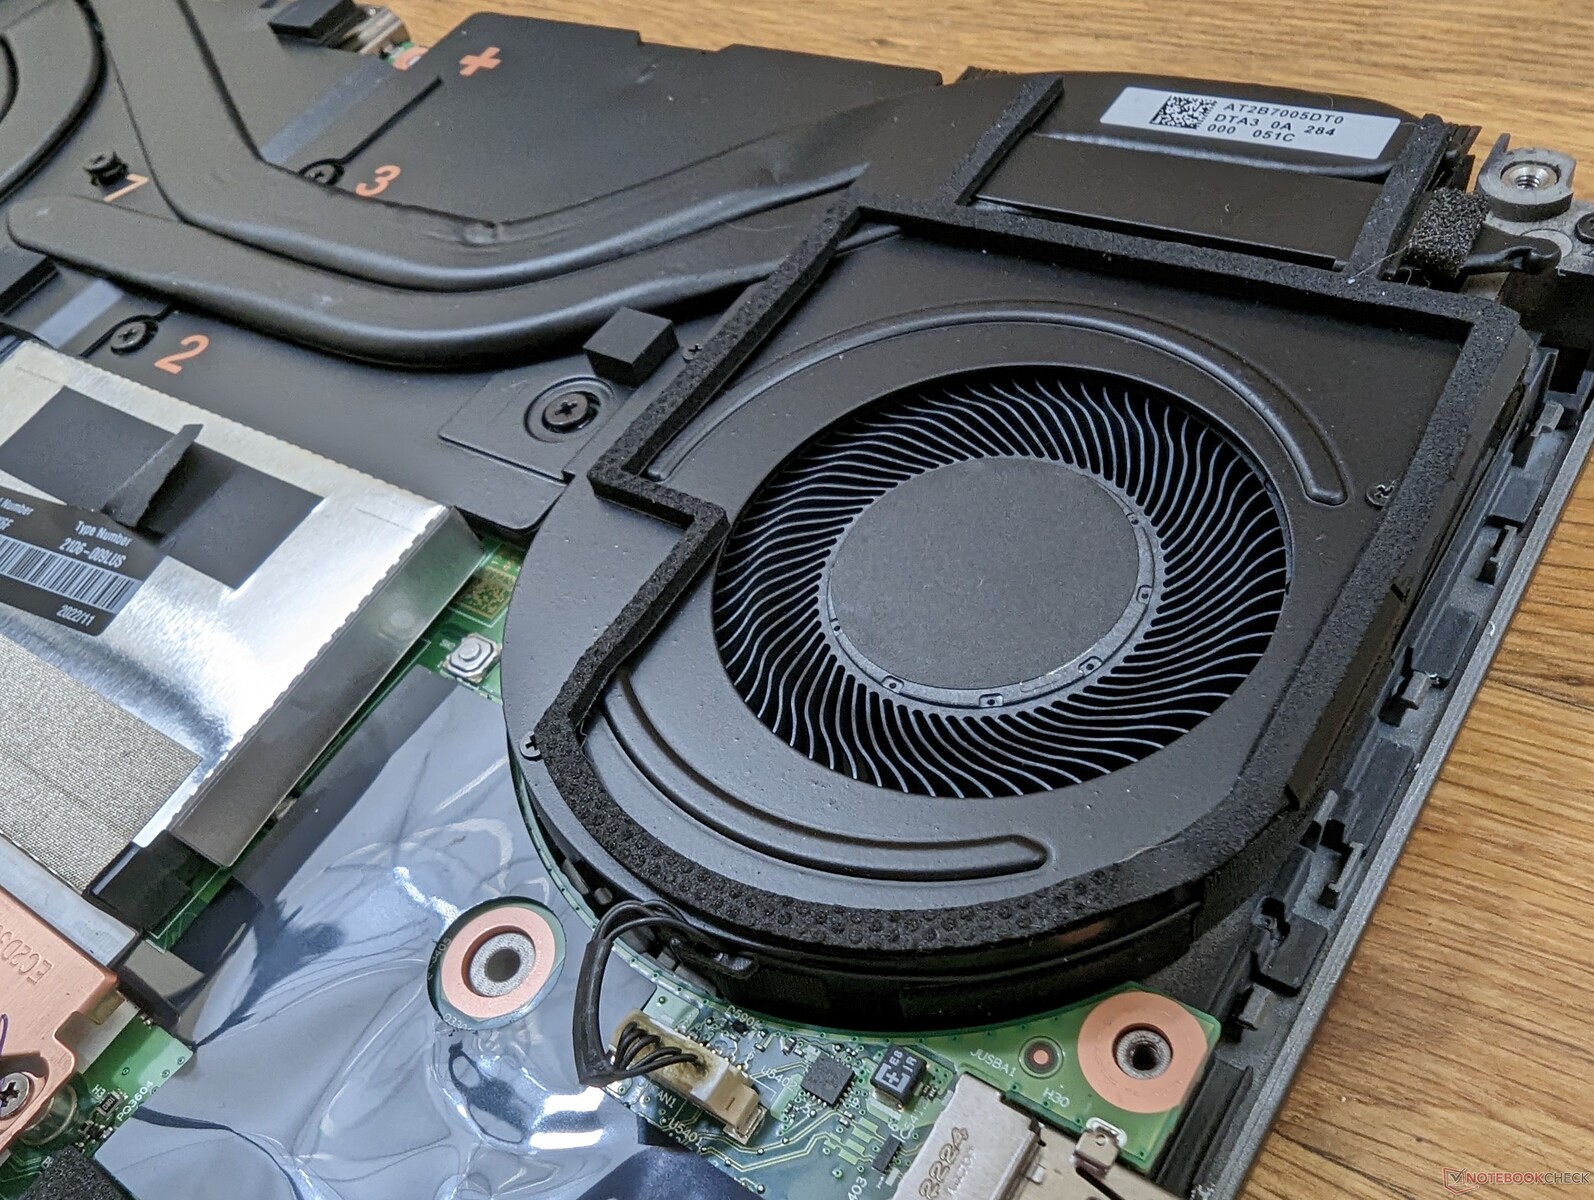
Onderhoud
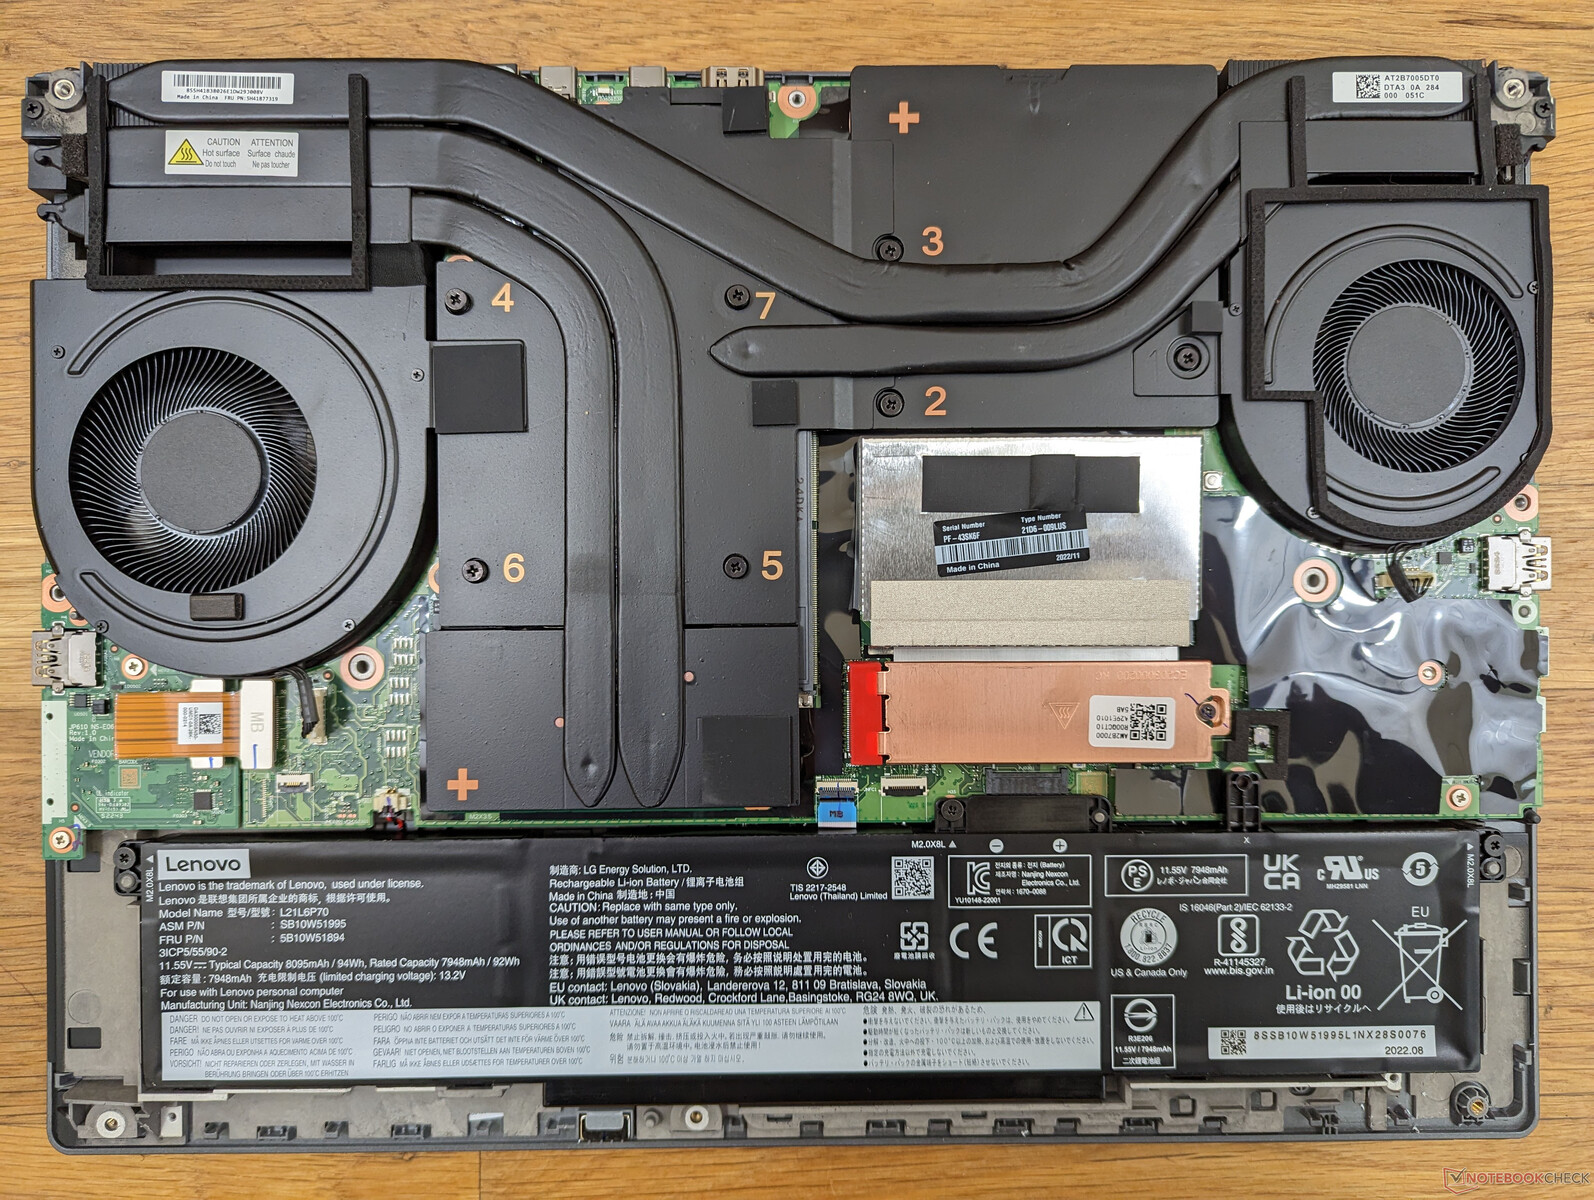
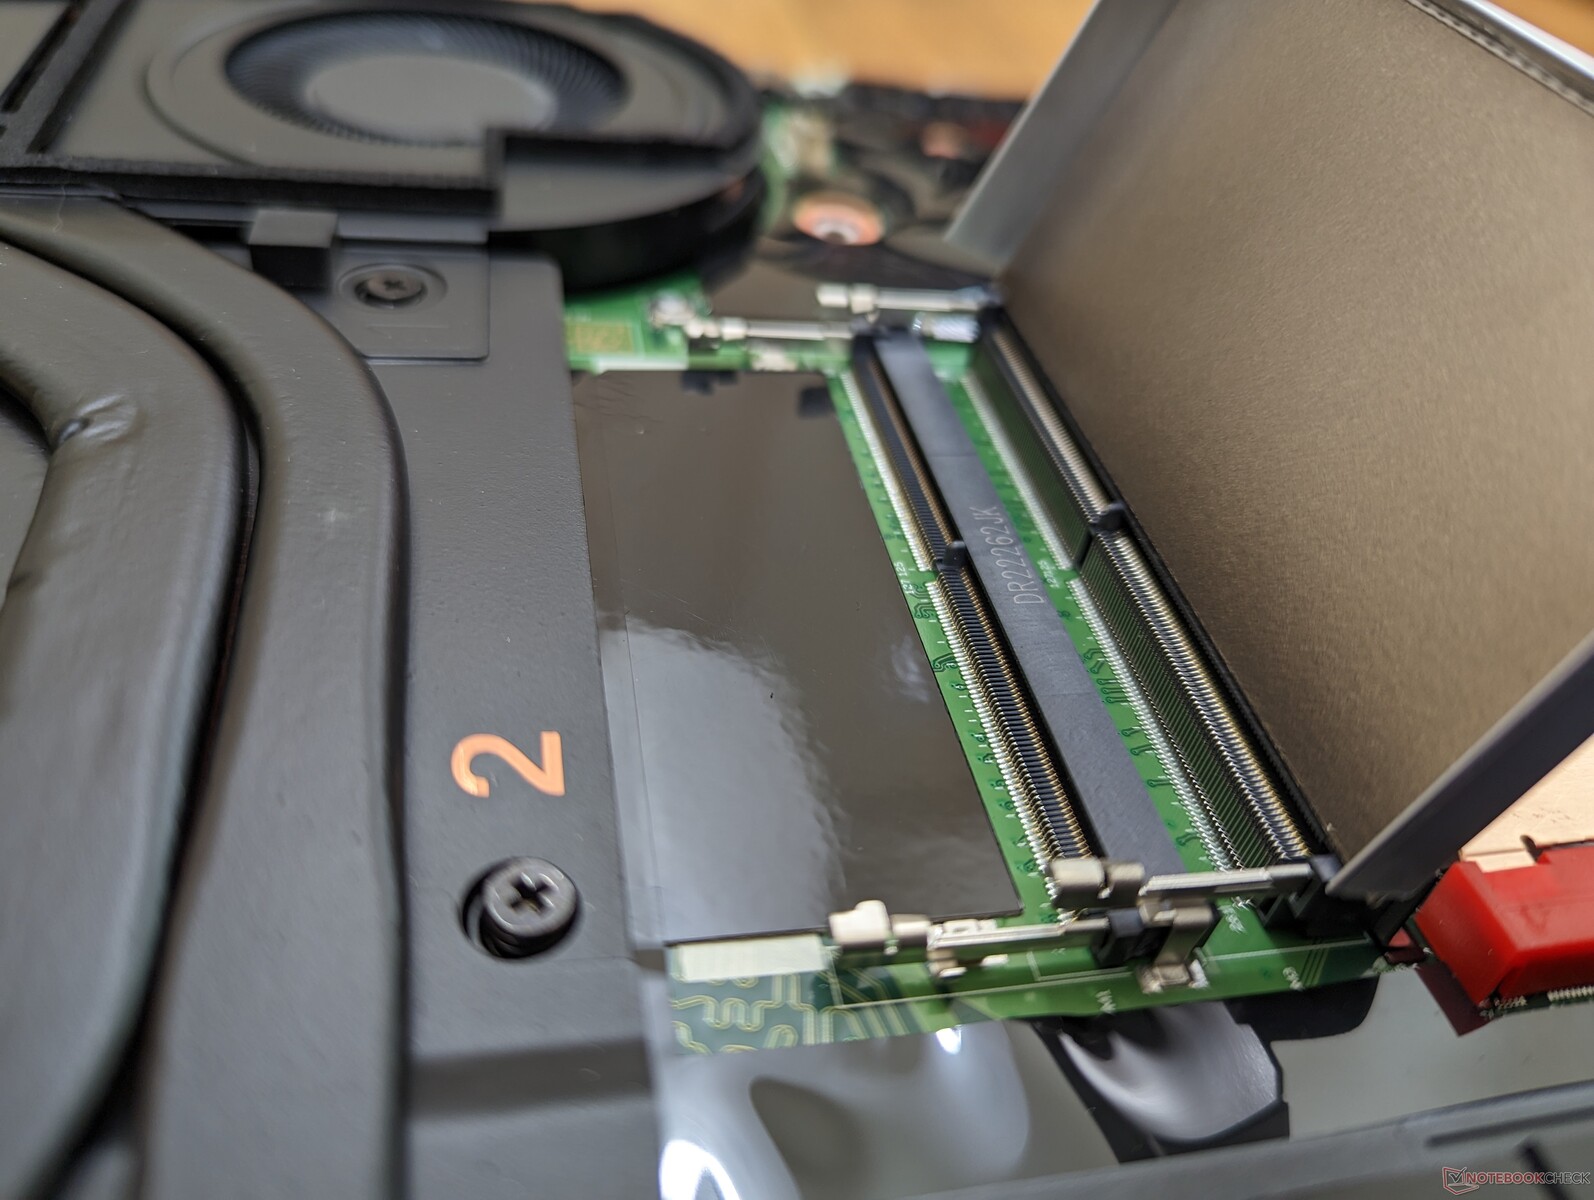
Het bodempaneel wordt vastgezet met 12 Philips schroeven. Het toetsenbord moet worden verwijderd om toegang te krijgen tot de WAN-module, het primaire M.2 SSD-slot en twee van de vier SODIMM-slots. Lenovo heeft een officiële onderhoudshandleiding voor eindgebruikers om te volgen.
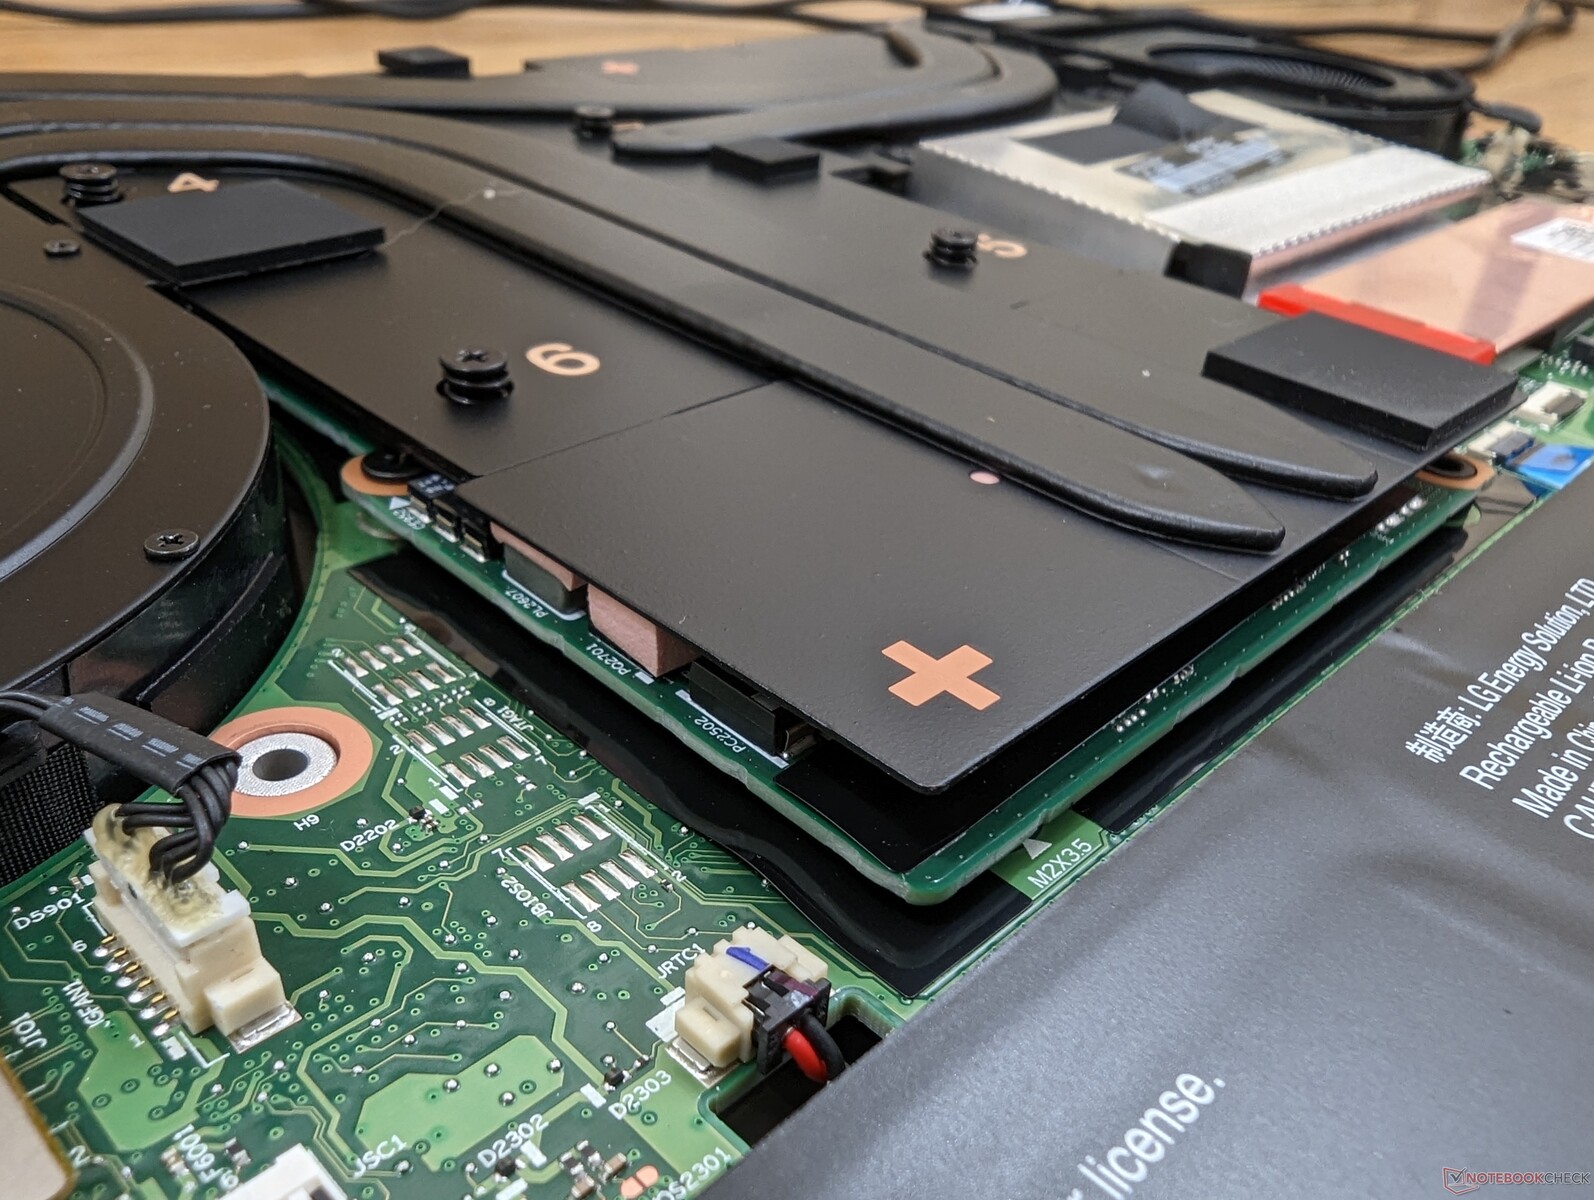
Interessant is dat de ThinkPad P16 G1 een van de weinige laptops is met een verwijderbare GPU. Het verwisselen van een grafische kaart wordt meestal niet aanbevolen, behalve voor onderhoud of vervanging.
Accessoires en garantie
Er zijn geen extra's in de doos behalve de AC-adapter en papierwerk.
De Dell Precision 7670 wordt standaard geleverd met drie jaar beperkte garantie. Lenovo biedt echter on-site service tijdens de duur van een jaar indien nodig.
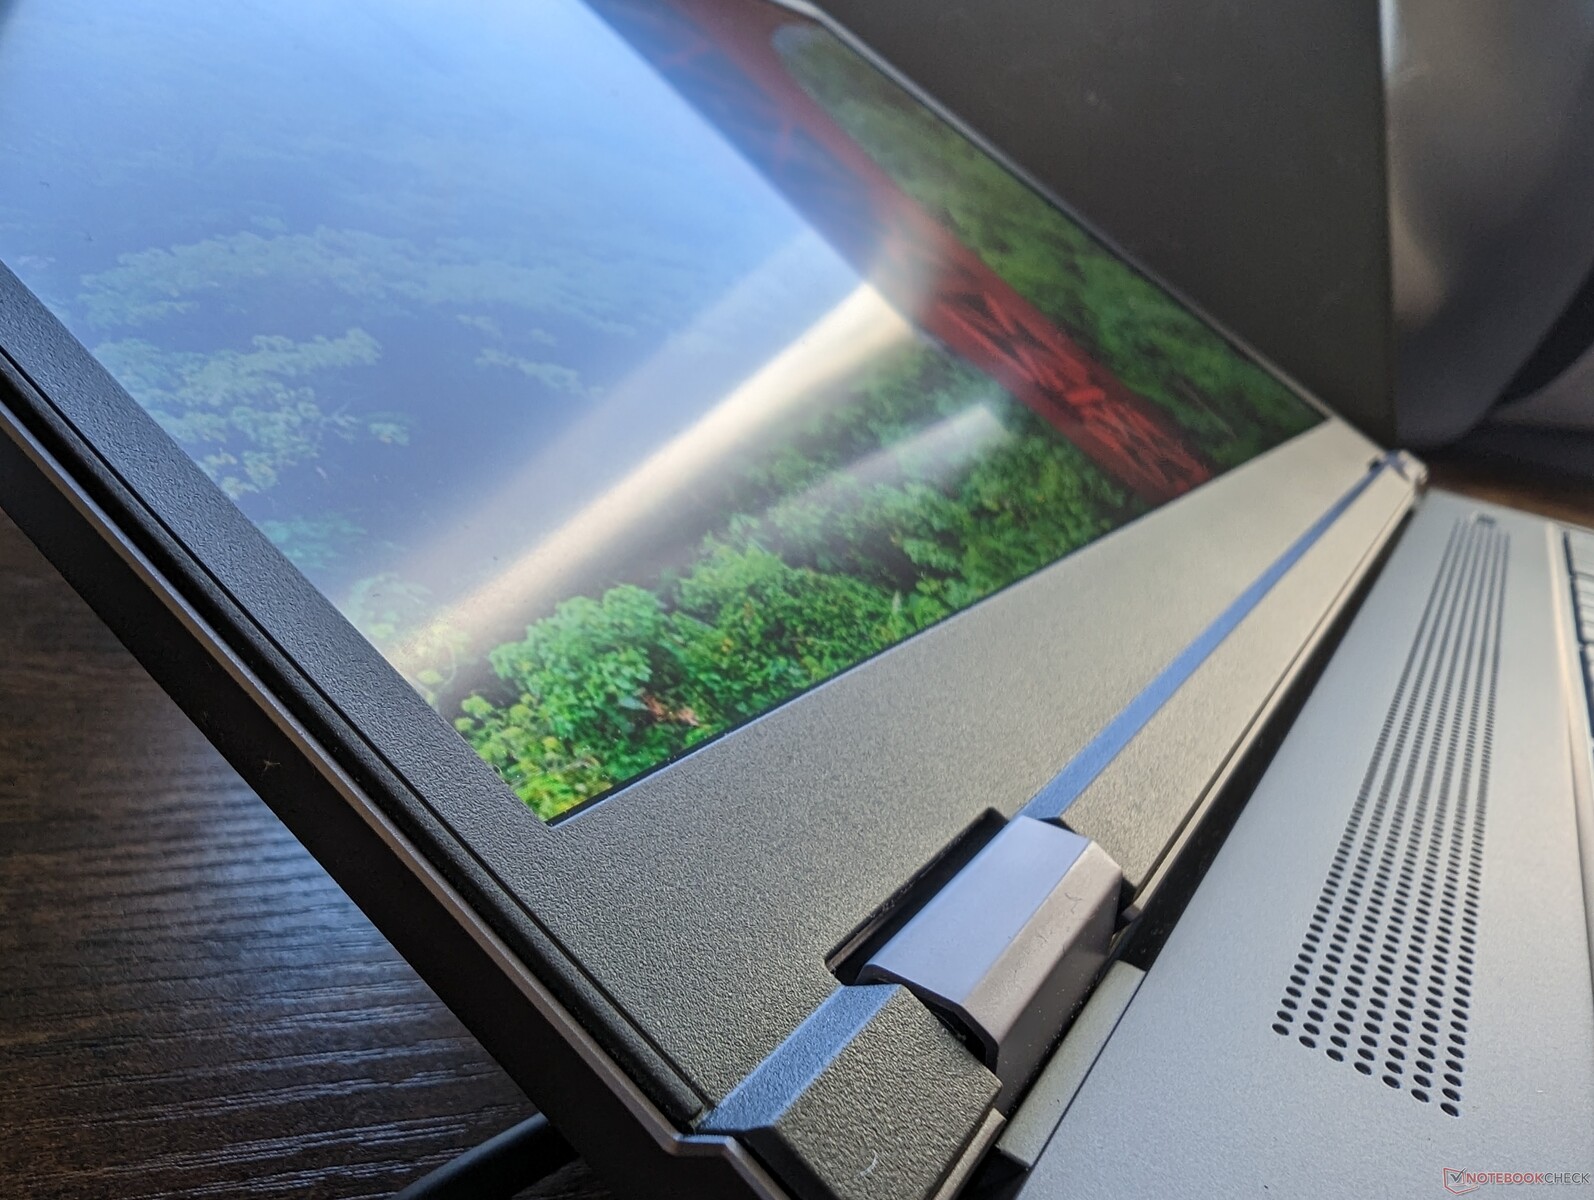
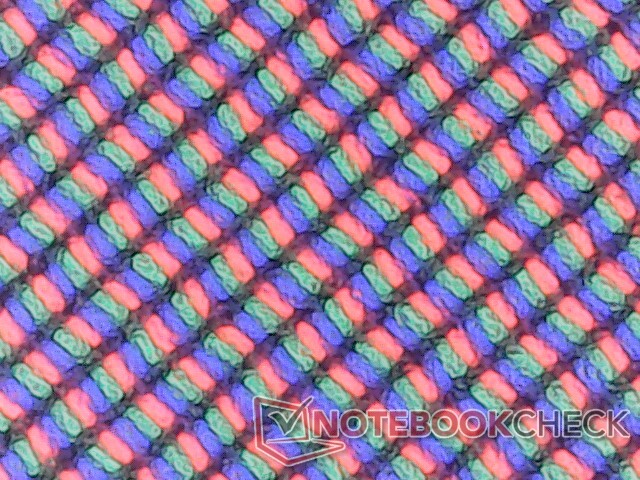
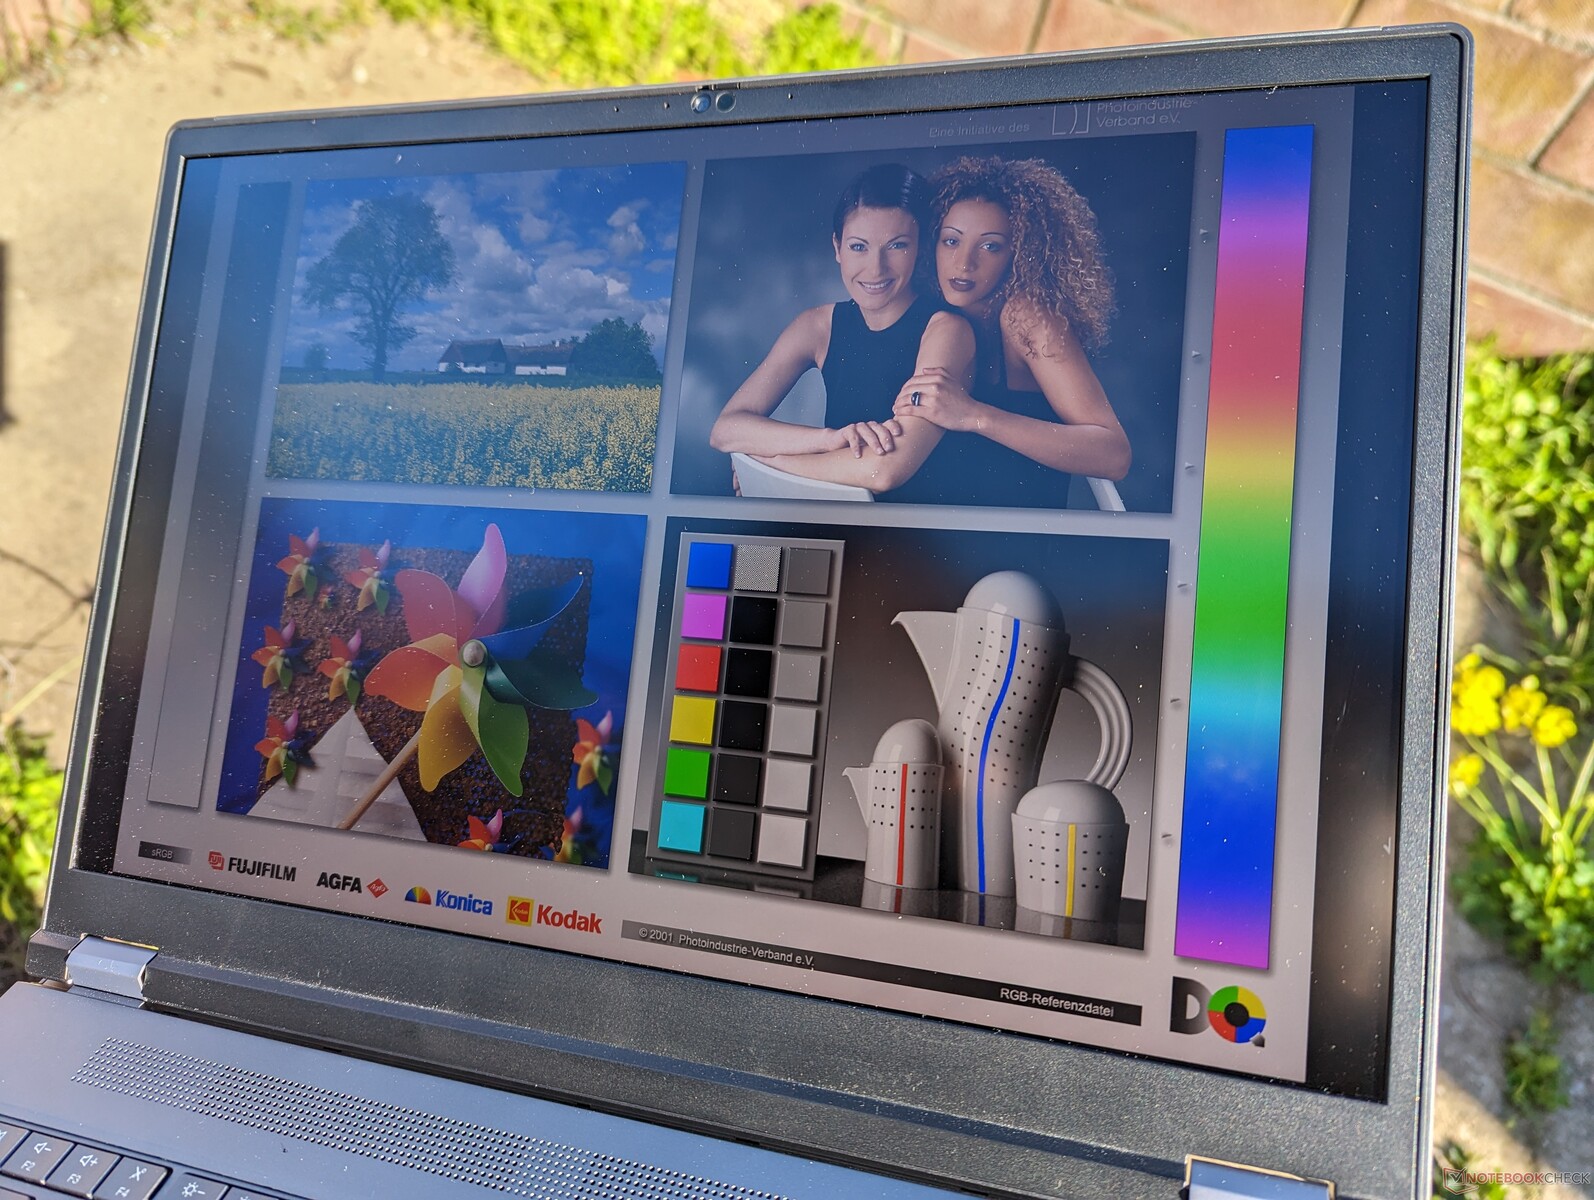
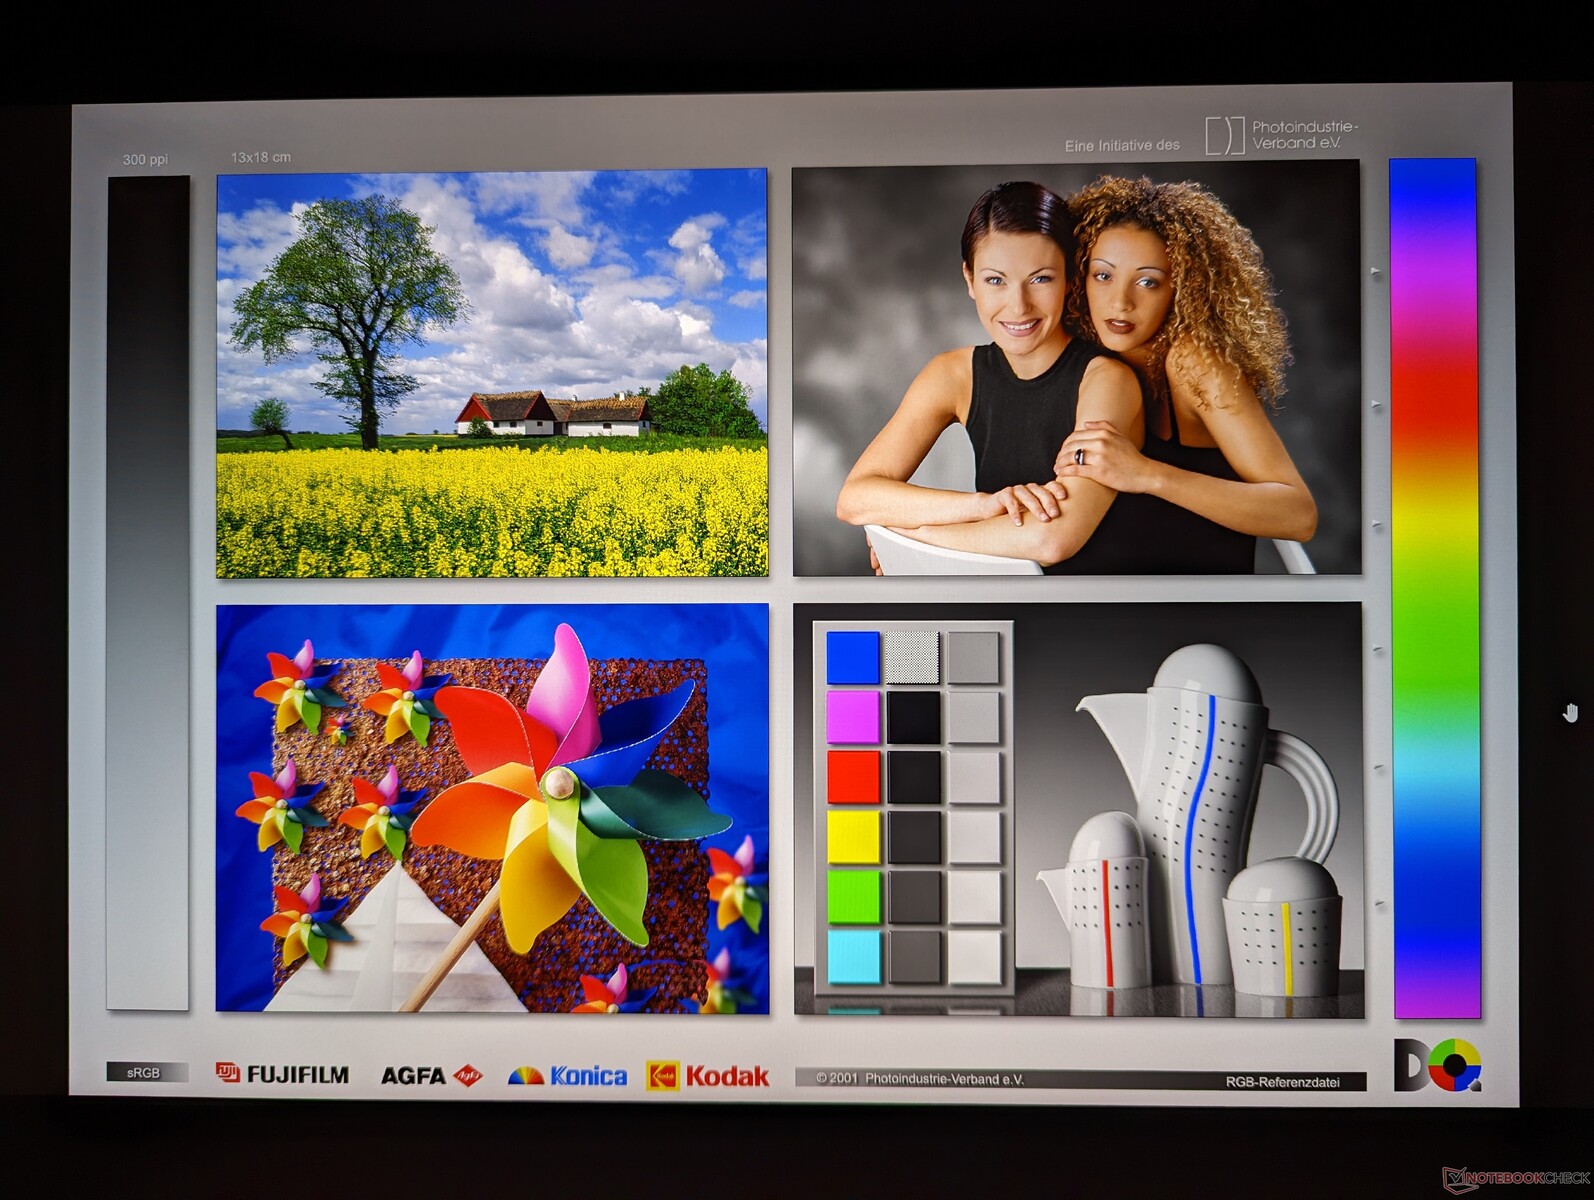
Display
Lenovo biedt vier verschillende 60 Hz schermopties die allemaal Pantone-fabrieksgekalibreerd zijn met DC-dimming. Onze metingen hieronder geven alleen de vetgedrukte optie weer, terwijl onze tweede unit met de RTX A2000 GPU is uitgerust met de 1600p optie.
- 1920 x 1200, non-touch, IPS, 300-nits, mat, 100% sRGB
- 2560 x 1600, non-touch, IPS, 400-nits, mat, 100% sRGB
- 3840 x 2400, non-touch, IPS, 600-nits, mat, 100% AdobeRGB
- 3840 x 2400, aanraakgevoelig, OLED, 400-nits, glanzend, 100% DCI-P3
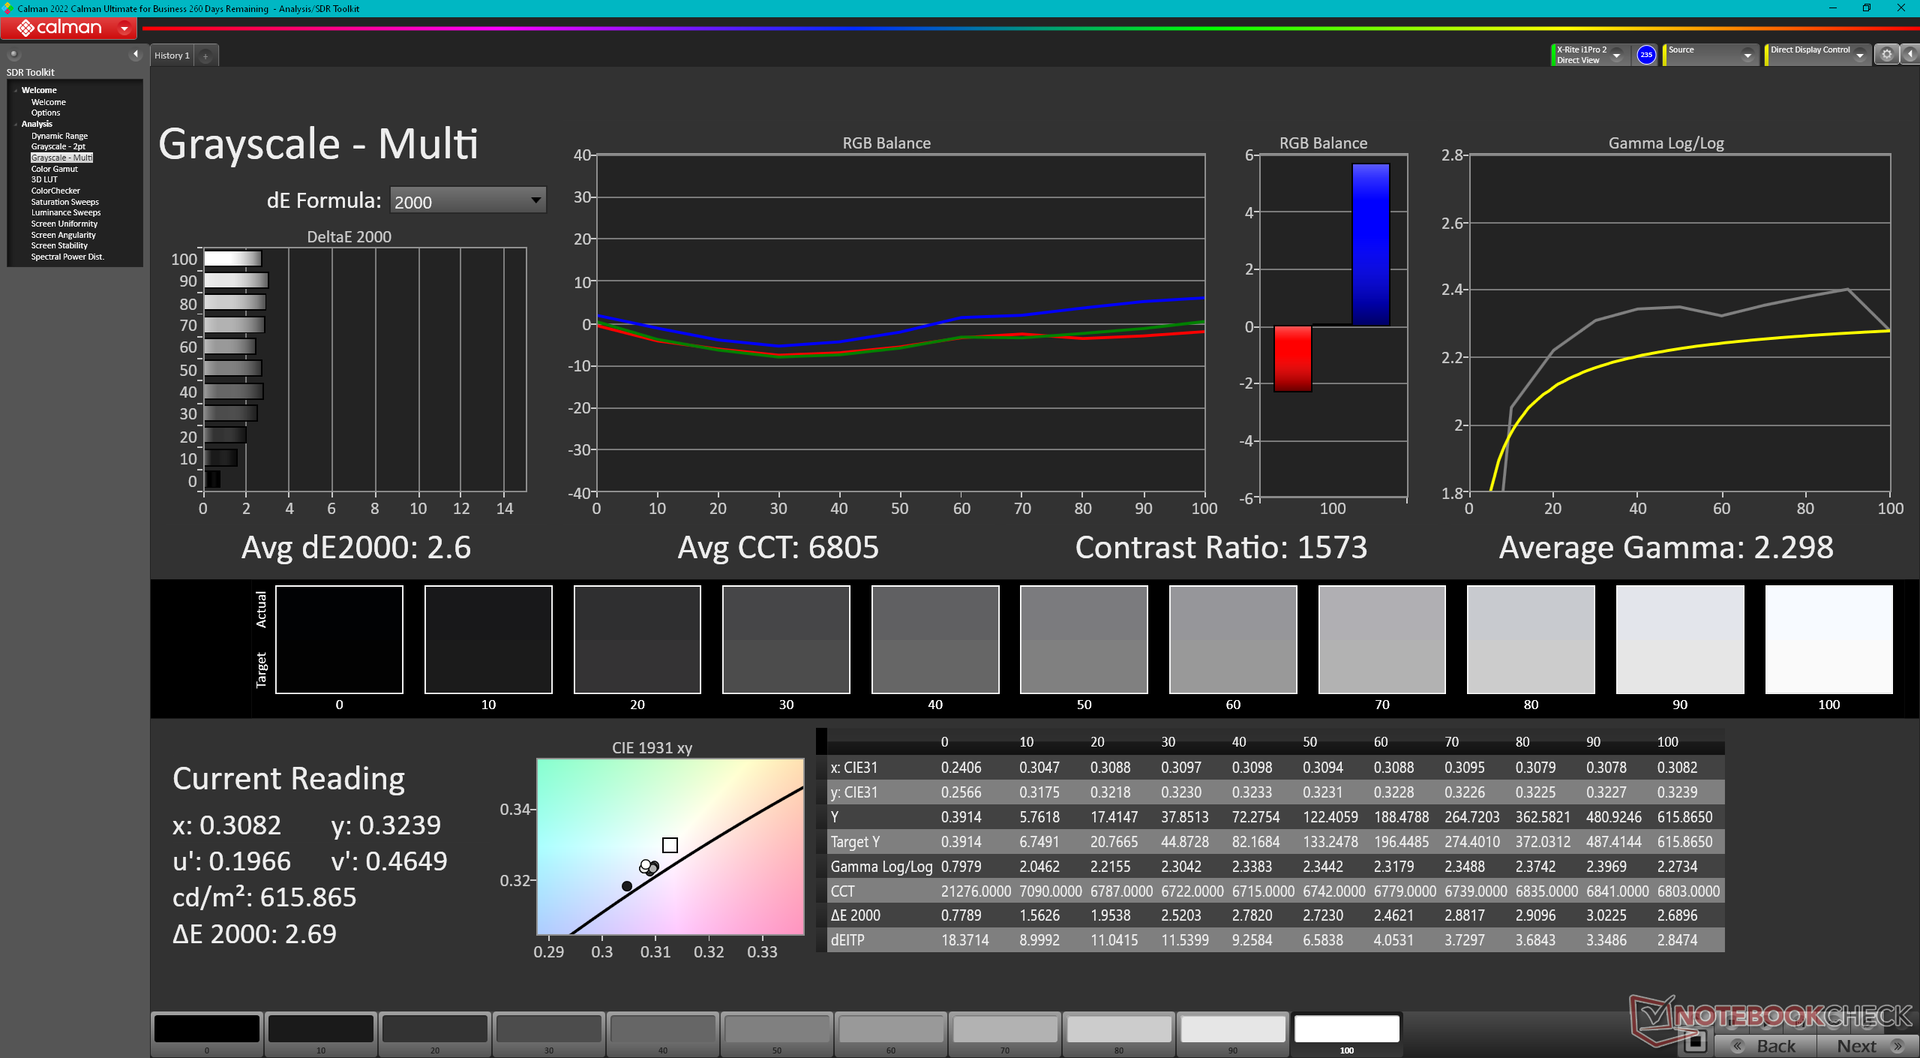
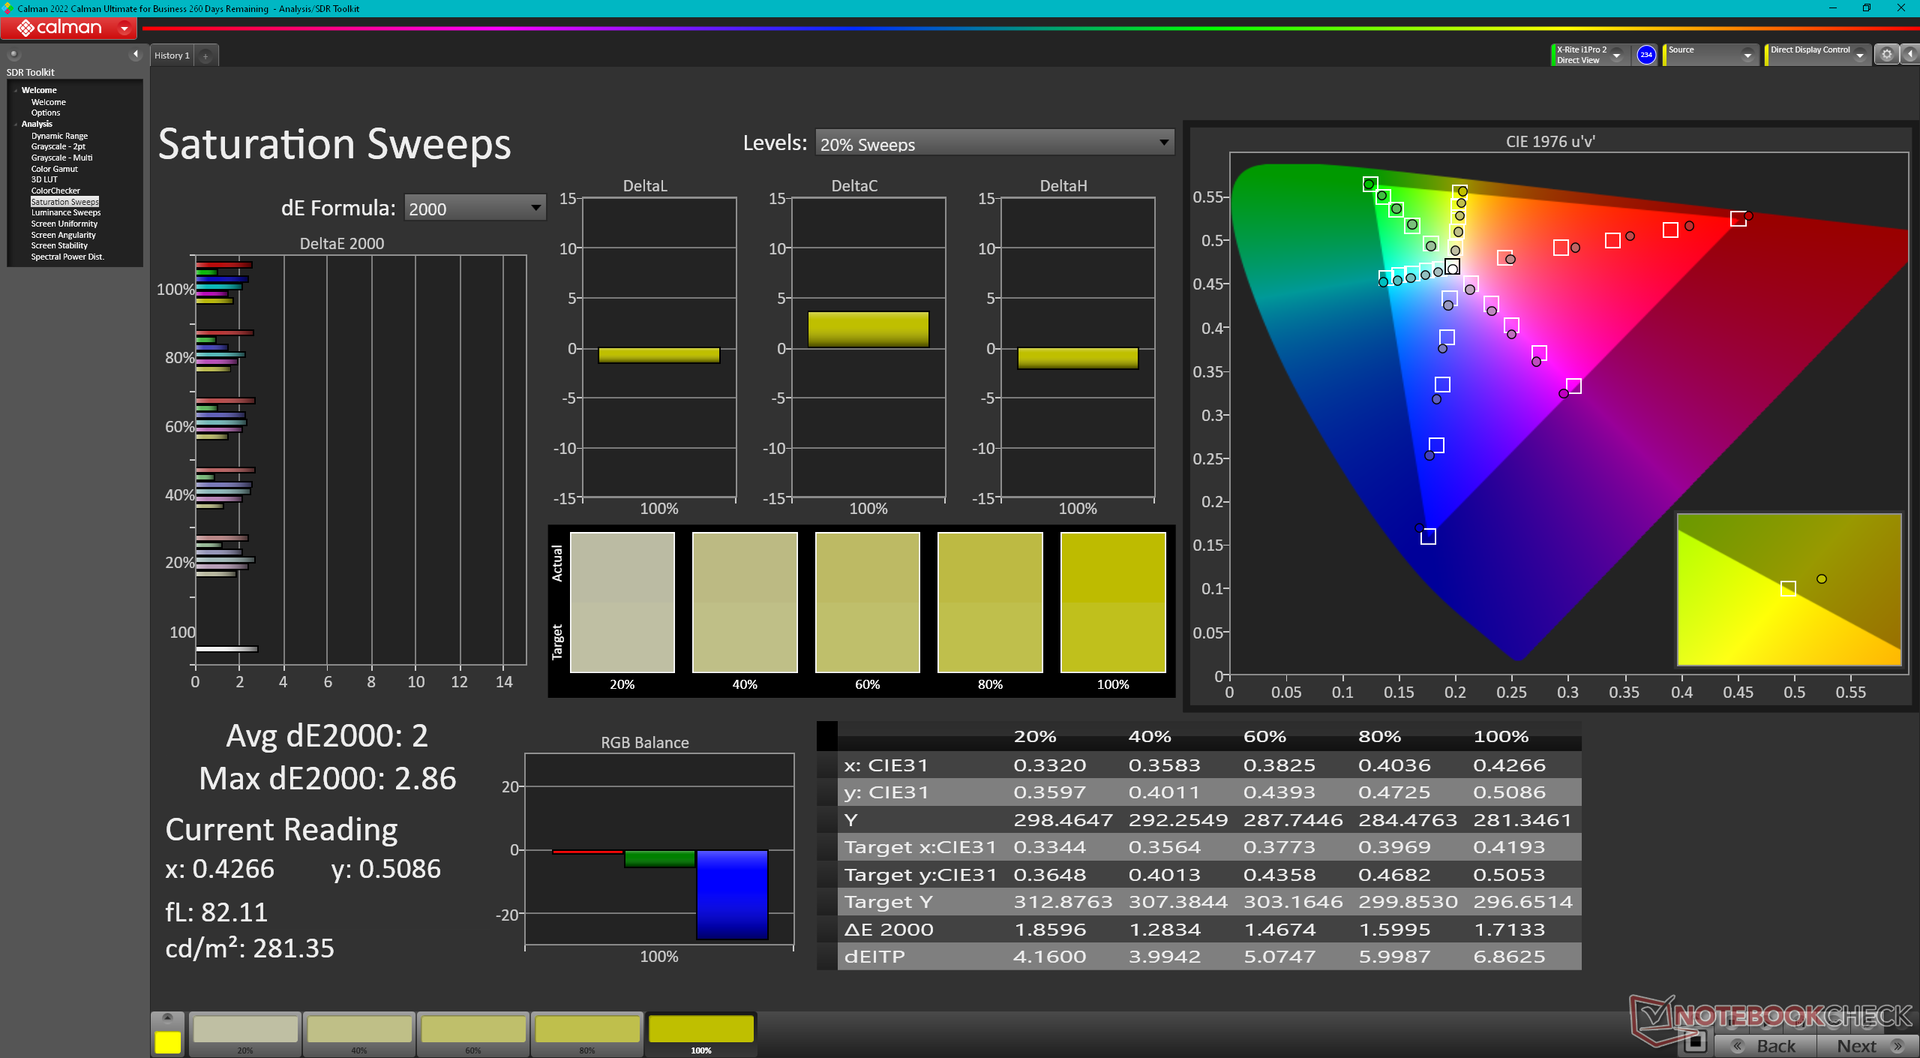
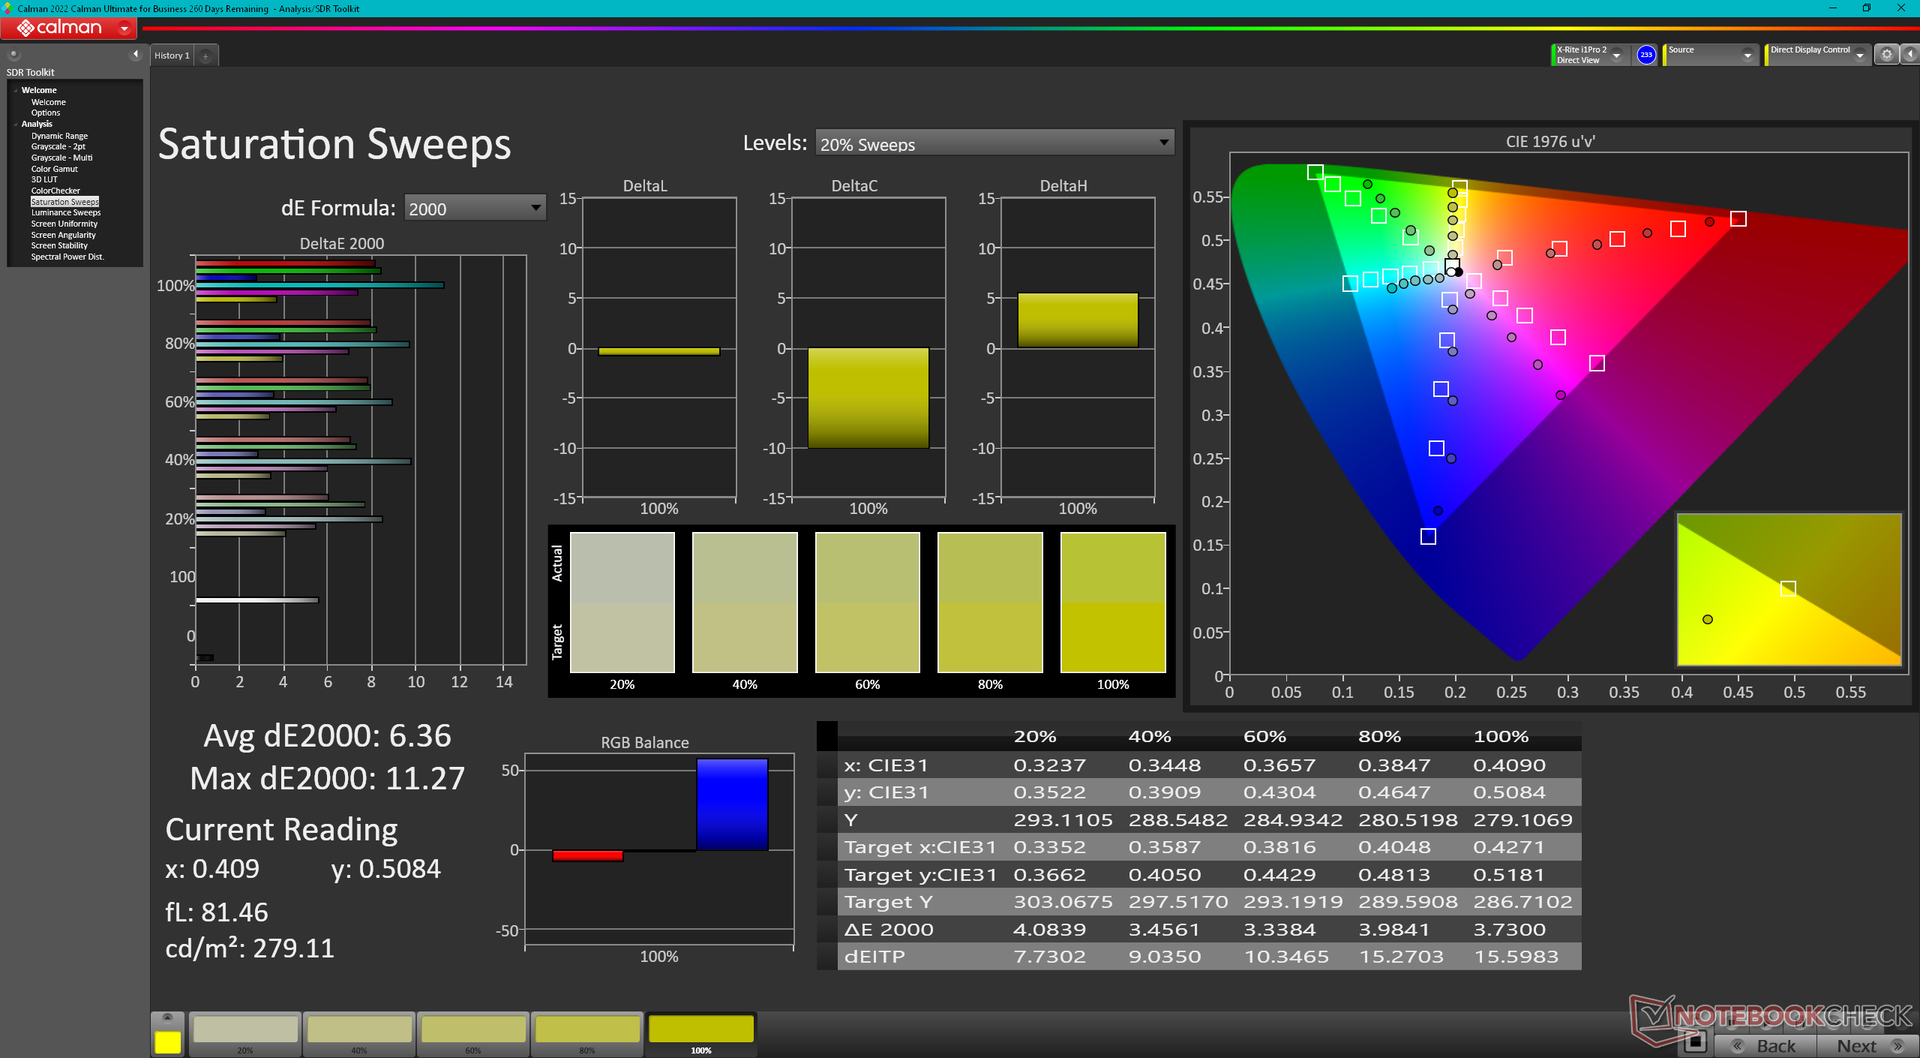
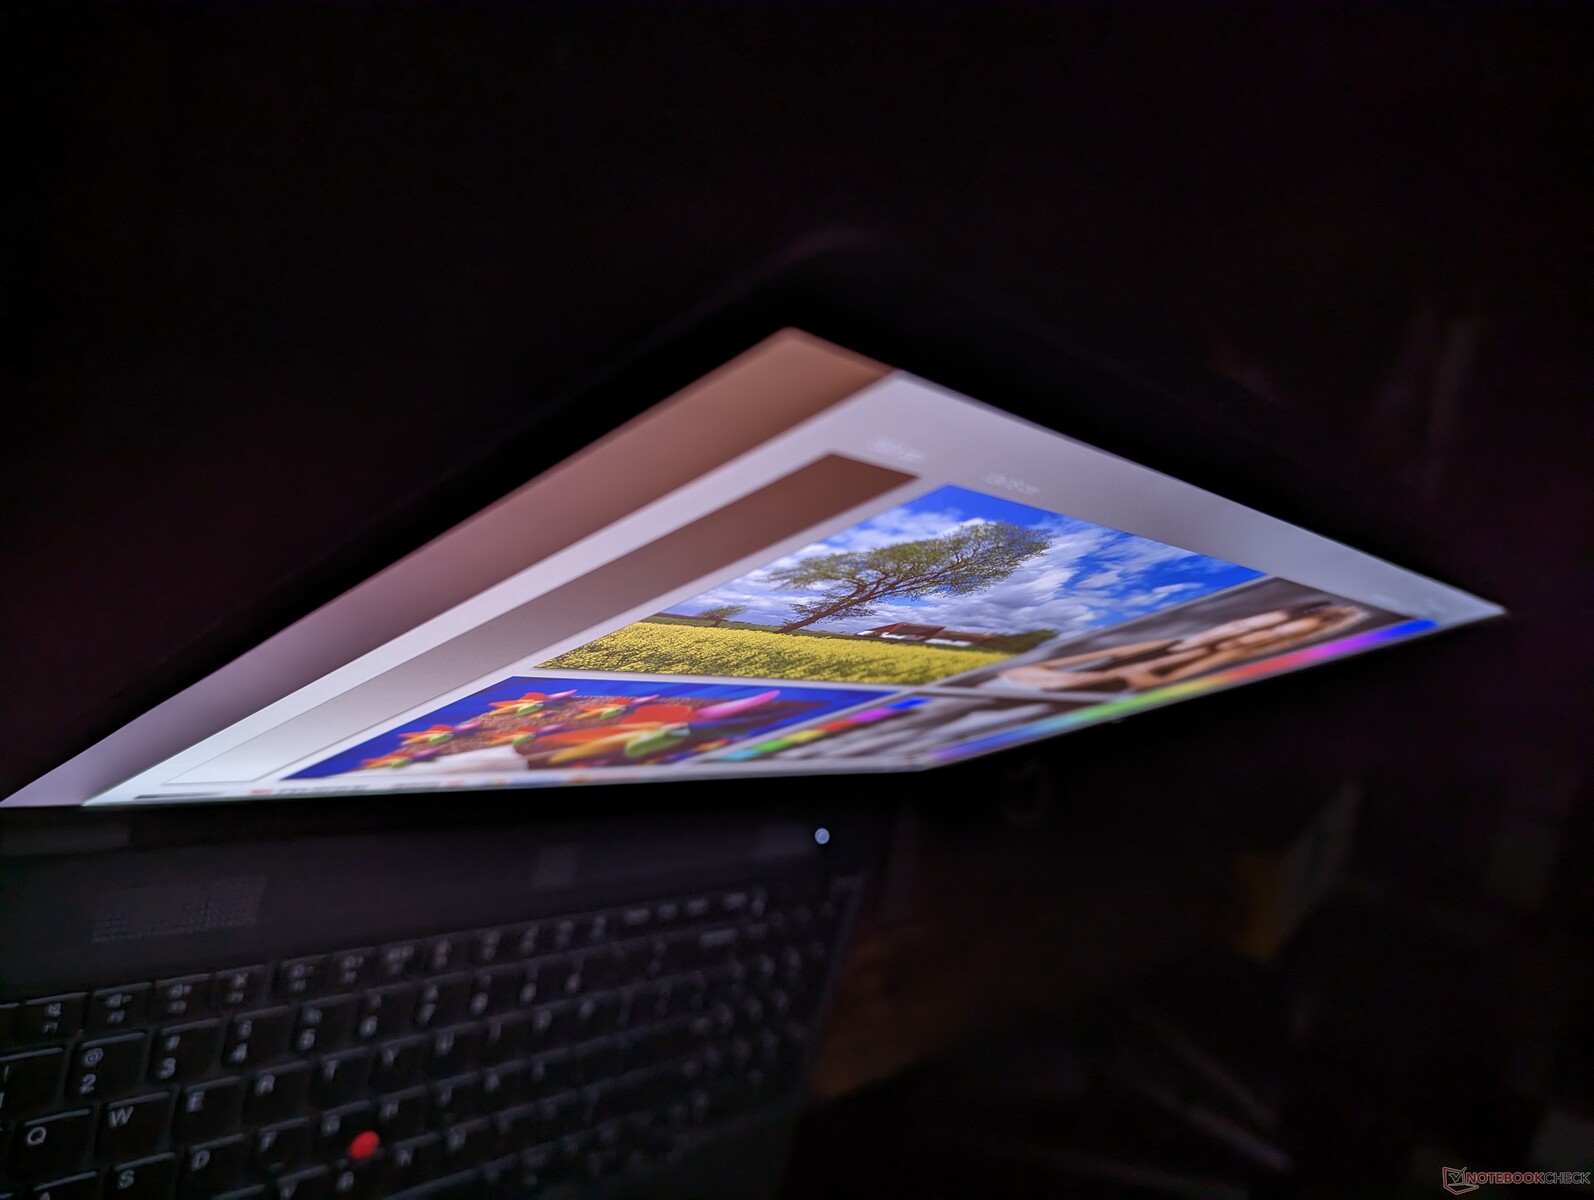
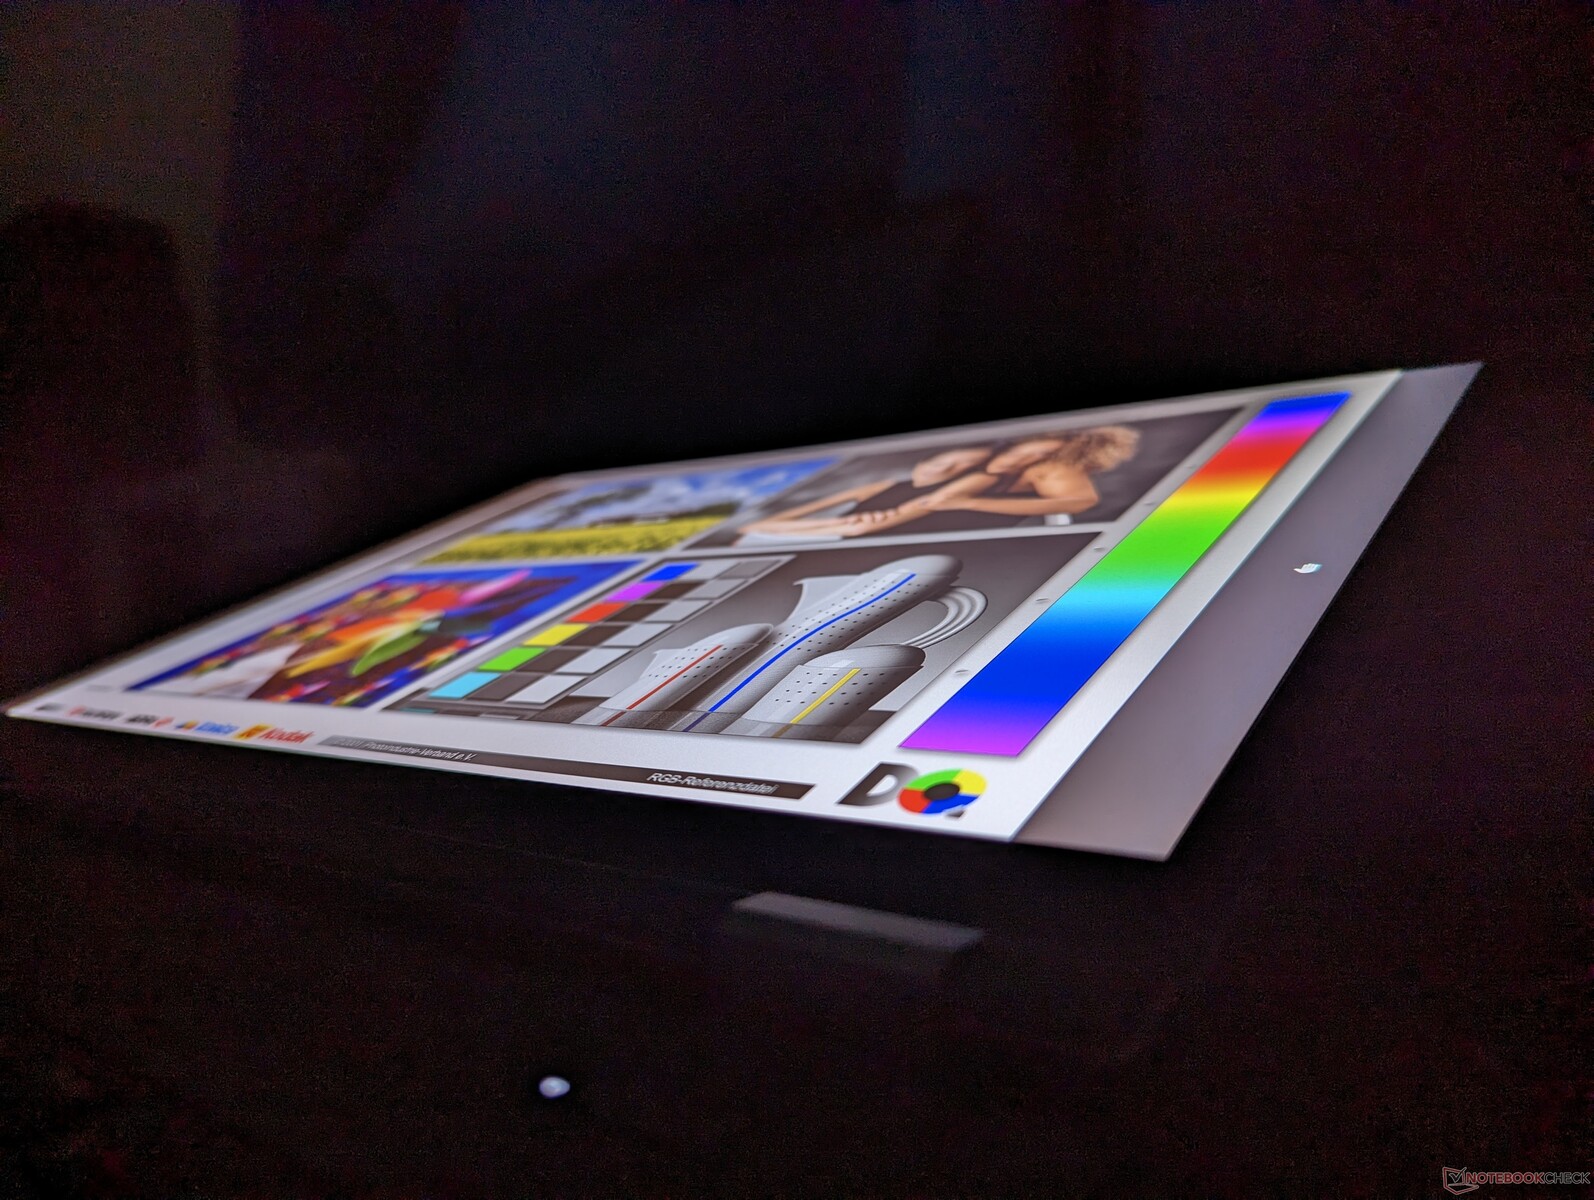
Onze onafhankelijke metingen kunnen de volledige AdobeRGB dekking en 600-nits helderheid bevestigen. De helderheidsverdeling is echter slechts gemiddeld, ondanks de doelstelling van 600-nit. Het kwadrant linksboven van ons scherm is bijvoorbeeld 29 procent helderder dan het kwadrant rechtsonder (642 nits tegen 497 nits). Kiezen voor het OLED-paneel zou de helderheidsverdeling verbeteren, maar we hadden beter verwacht van ons IPS-paneel gezien de vraagprijs van de ThinkPad P1 G1.
Het is vermeldenswaard dat Lenovo hetzelfde LP160UQ1-SPB1 IPS-paneel op de ThinkPad P1 G1 gebruikt voor zijn andere 16-inch ThinkPad-modellen, waaronder deThinkPad P1 G4 enThinkPad X1 Extreme G4.


| |||||||||||||||||||||||||
Helderheidsverdeling: 77 %
Helderheid in Batterij-modus: 601.9 cd/m²
Contrast: 1281:1 (Zwart: 0.47 cd/m²)
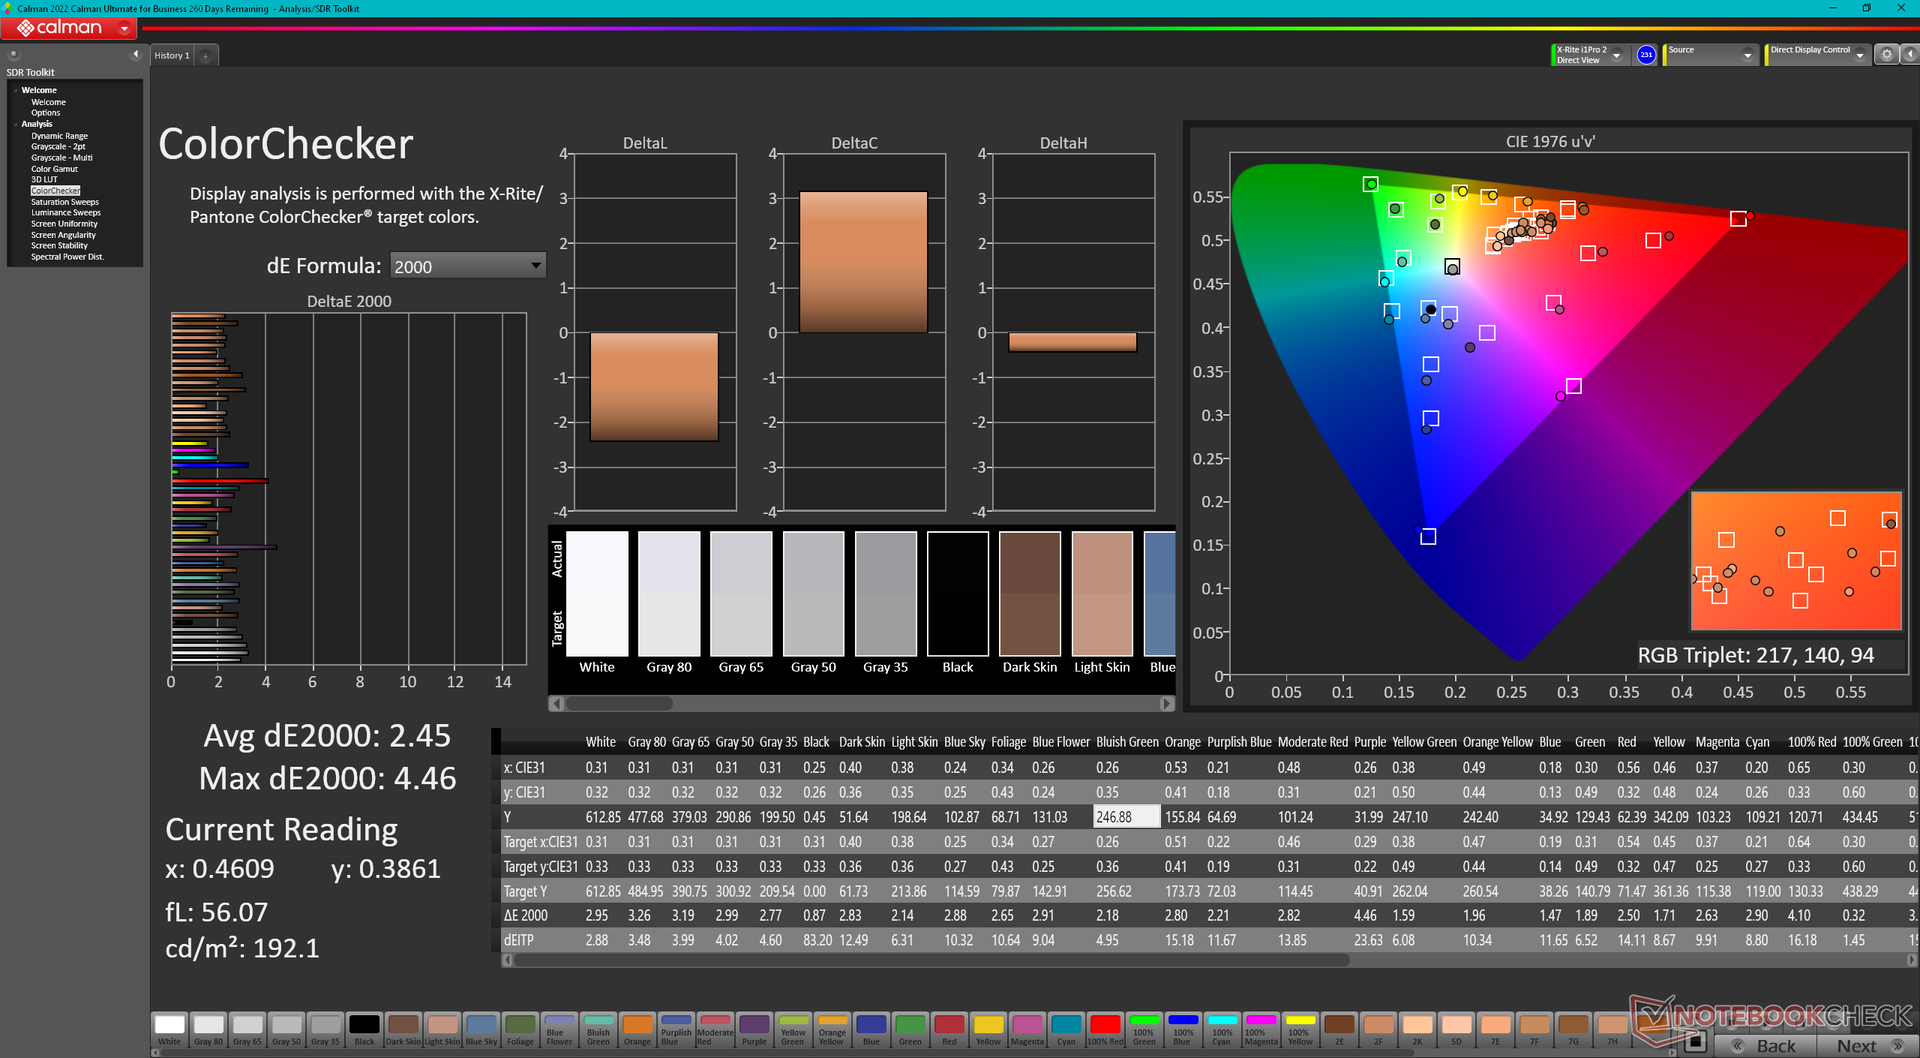
ΔE ColorChecker Calman: 2.45 | ∀{0.5-29.43 Ø4.71}
ΔE Greyscale Calman: 2.6 | ∀{0.09-98 Ø4.96}
95.9% AdobeRGB 1998 (Argyll 3D)
98.9% sRGB (Argyll 3D)
82.9% Display P3 (Argyll 3D)
Gamma: 2.3
CCT: 6805 K
| Lenovo ThinkPad P16 G1 RTX A5500 LP160UQ1-SPB1, IPS, 3840x2400, 16" | Asus ProArt StudioBook 16 W7600H5A-2BL2 ATNA60YV02-0, OLED, 3840x2400, 16" | Dell Precision 7000 7670 Performance Samsung 160YV03, OLED, 3840x2400, 16" | Lenovo ThinkPad P16 G1 21D6001DMB NE160QDM-N63 , IPS LED, 2560x1600, 16" | MSI CreatorPro Z16P B12UKST B160QAN02.N, IPS, 2560x1600, 16" | HP ZBook Studio 16 G9 62U04EA BOE0A52, IPS, 3840x2400, 16" | |
|---|---|---|---|---|---|---|
| Display | 8% | 8% | -12% | 3% | 3% | |
| Display P3 Coverage (%) | 82.9 | 99.9 21% | 99.9 21% | 71.5 -14% | 97.6 18% | 97.5 18% |
| sRGB Coverage (%) | 98.9 | 100 1% | 100 1% | 100 1% | 99.9 1% | 99.9 1% |
| AdobeRGB 1998 Coverage (%) | 95.9 | 98.6 3% | 98.1 2% | 73.3 -24% | 87.4 -9% | 86.3 -10% |
| Response Times | 96% | 96% | 23% | 76% | 75% | |
| Response Time Grey 50% / Grey 80% * (ms) | 45.6 ? | 2 ? 96% | 1.84 ? 96% | 37.7 ? 17% | 12.8 ? 72% | 15.3 ? 66% |
| Response Time Black / White * (ms) | 36.8 ? | 2 ? 95% | 1.92 ? 95% | 26.3 ? 29% | 7.4 ? 80% | 6.1 ? 83% |
| PWM Frequency (Hz) | 240 ? | 59.52 ? | ||||
| Screen | -2% | -36% | -4% | 9% | 16% | |
| Brightness middle (cd/m²) | 601.9 | 353 -41% | 325.2 -46% | 424 -30% | 407 -32% | 554 -8% |
| Brightness (cd/m²) | 569 | 360 -37% | 328 -42% | 398 -30% | 388 -32% | 516 -9% |
| Brightness Distribution (%) | 77 | 96 25% | 97 26% | 90 17% | 88 14% | 84 9% |
| Black Level * (cd/m²) | 0.47 | 0.24 49% | 0.36 23% | 0.47 -0% | ||
| Contrast (:1) | 1281 | 1767 38% | 1131 -12% | 1179 -8% | ||
| Colorchecker dE 2000 * | 2.45 | 2.45 -0% | 4.59 -87% | 2.6 -6% | 1.3 47% | 1 59% |
| Colorchecker dE 2000 max. * | 4.46 | 3.75 16% | 7.65 -72% | 4.9 -10% | 2.5 44% | 2.4 46% |
| Greyscale dE 2000 * | 2.6 | 1.88 28% | 2.5 4% | 4.1 -58% | 2.1 19% | 1.6 38% |
| Gamma | 2.3 96% | 2.31 95% | 2.1 105% | 2.13 103% | 2.26 97% | 2.29 96% |
| CCT | 6805 96% | 6441 101% | 6541 99% | 7252 90% | 6437 101% | 6458 101% |
| Colorchecker dE 2000 calibrated * | 2.77 | 0.8 | 0.7 | 0.6 | ||
| Totaal Gemiddelde (Programma / Instellingen) | 34% /
19% | 23% /
-0% | 2% /
-2% | 29% /
18% | 31% /
22% |
* ... kleiner is beter
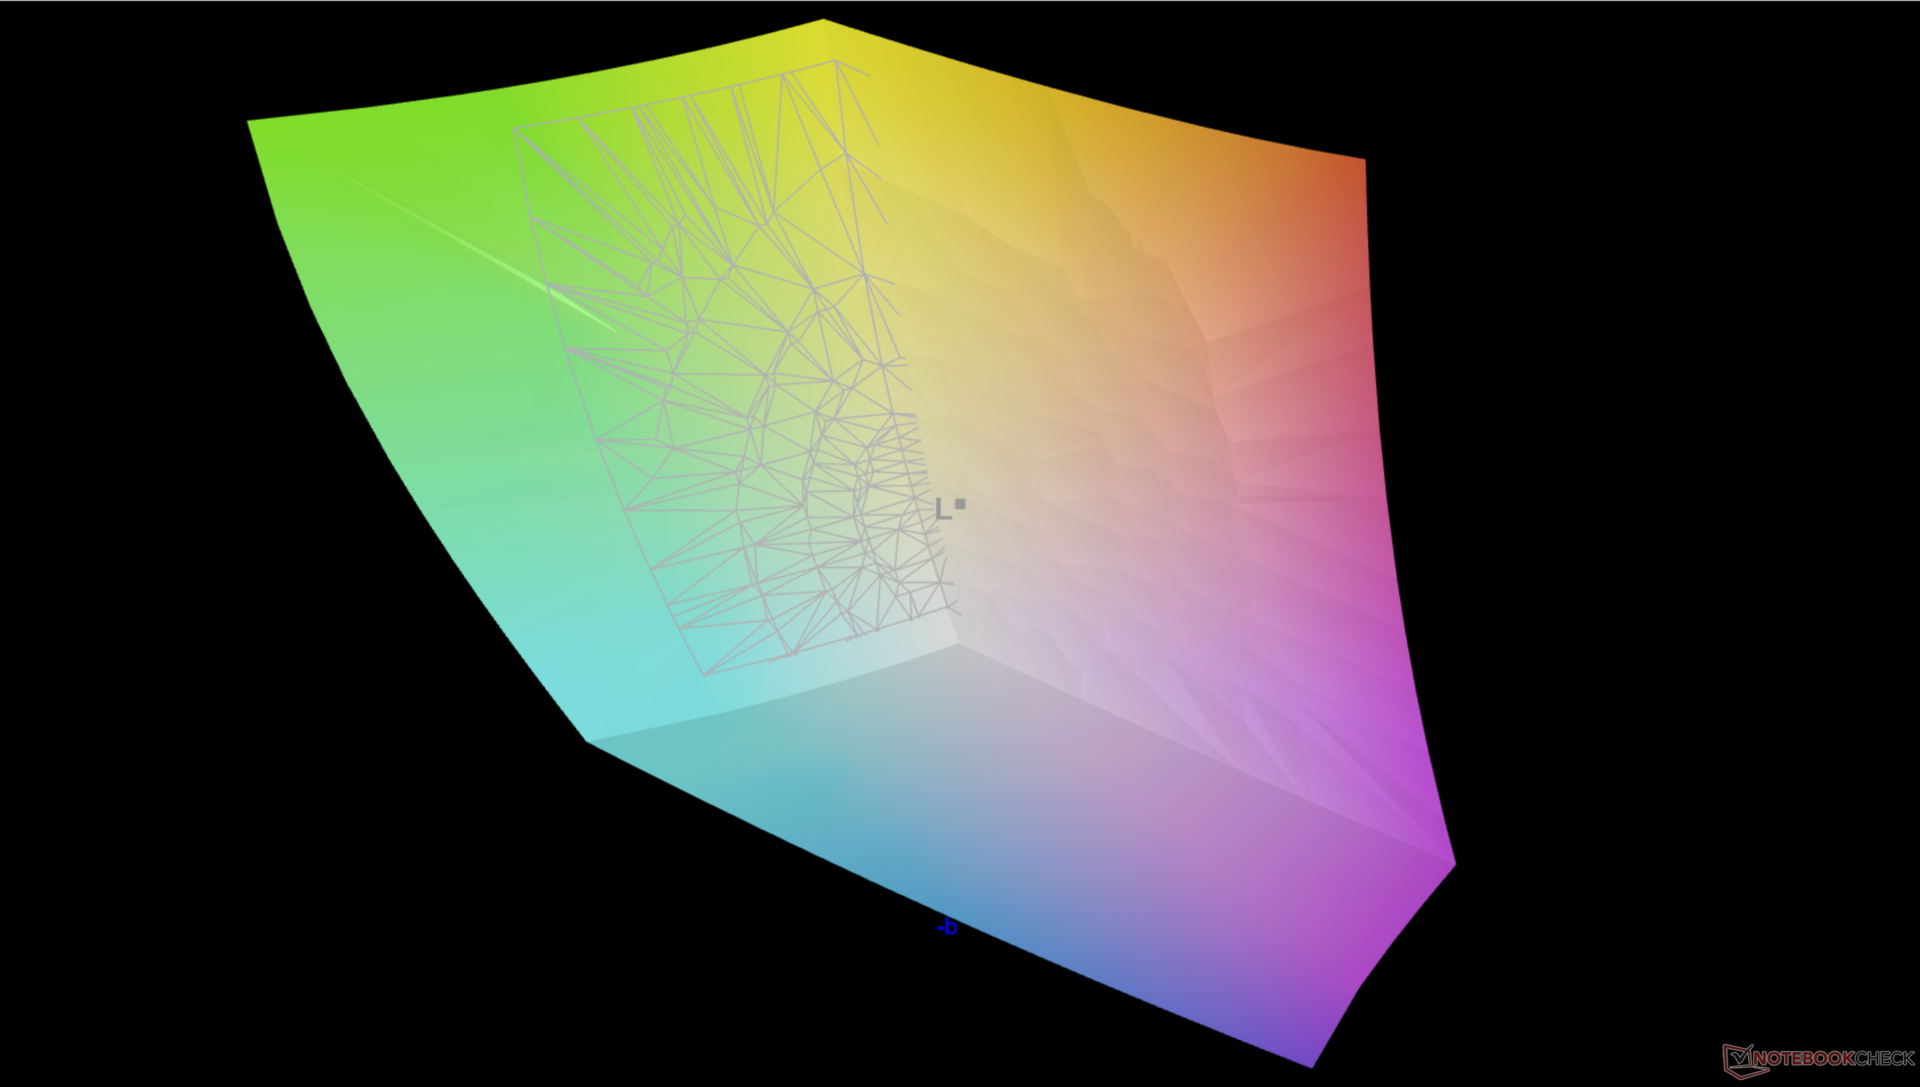
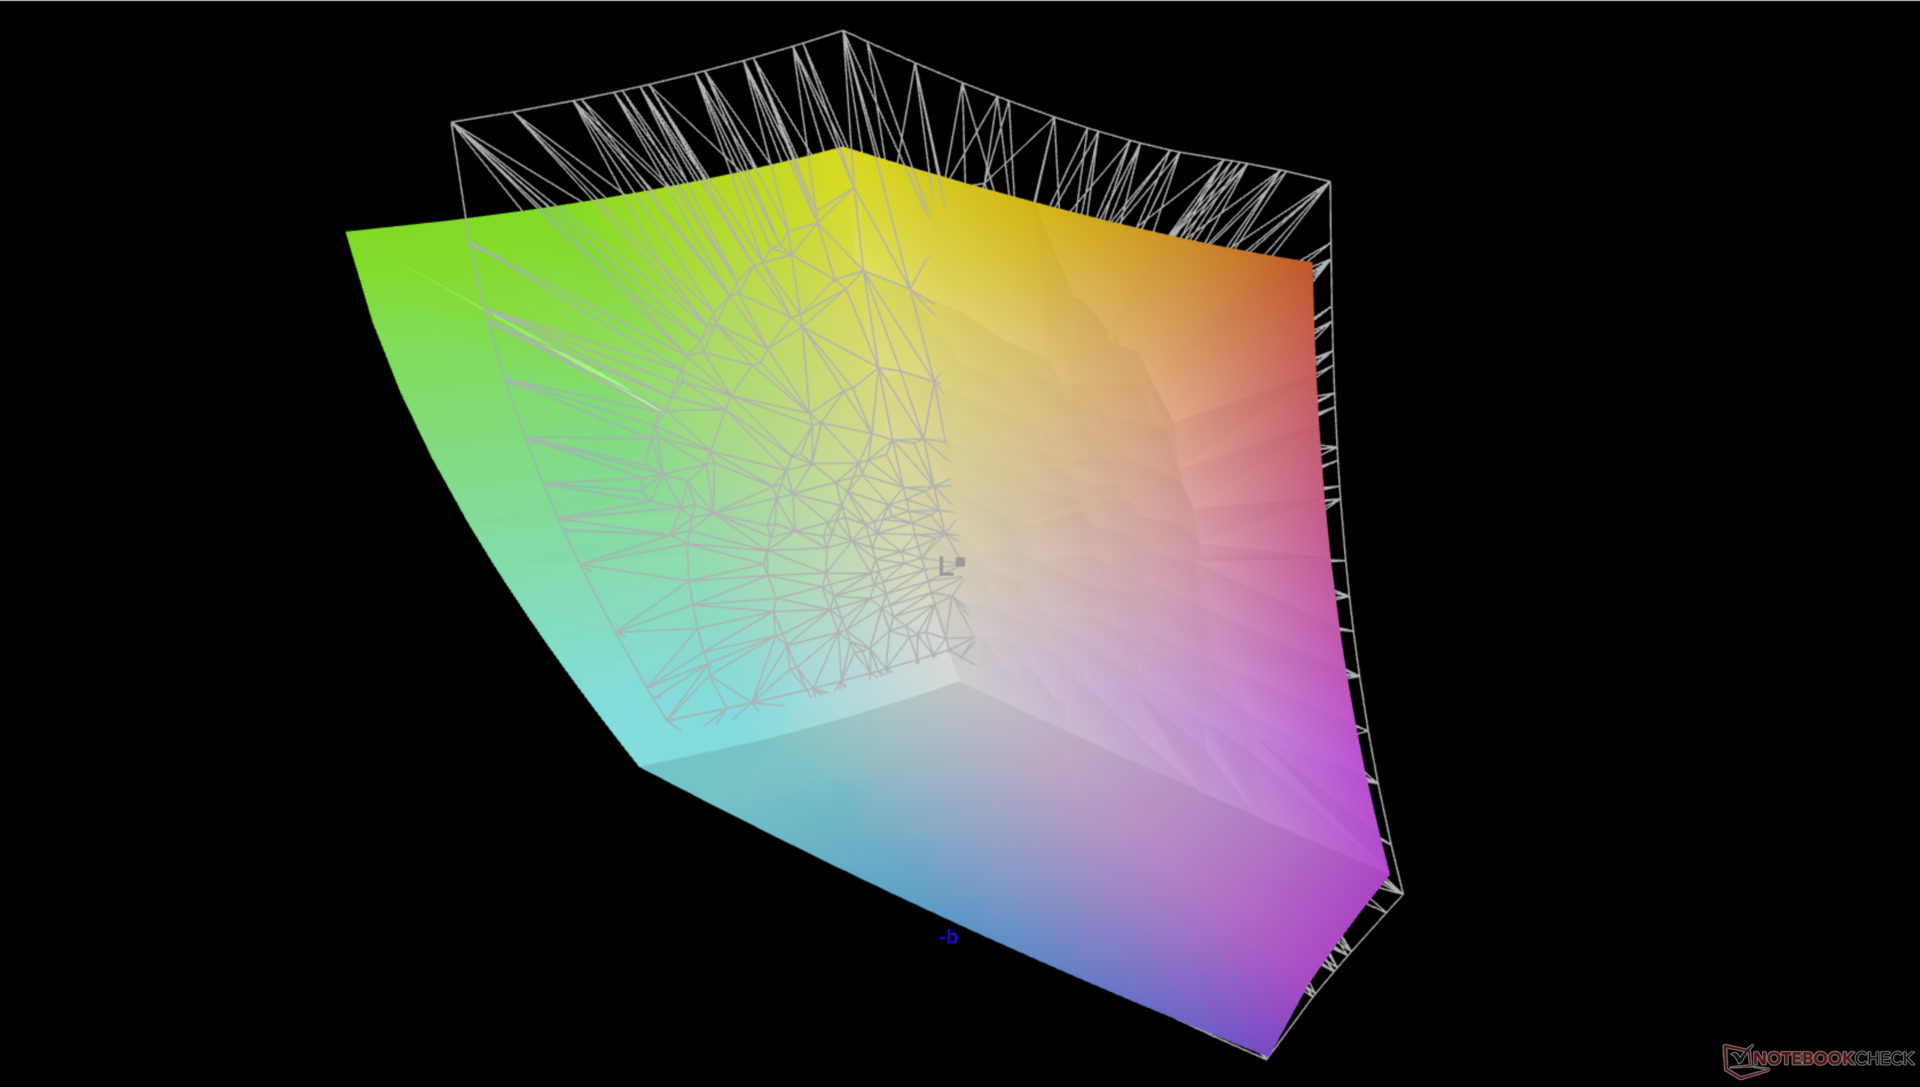
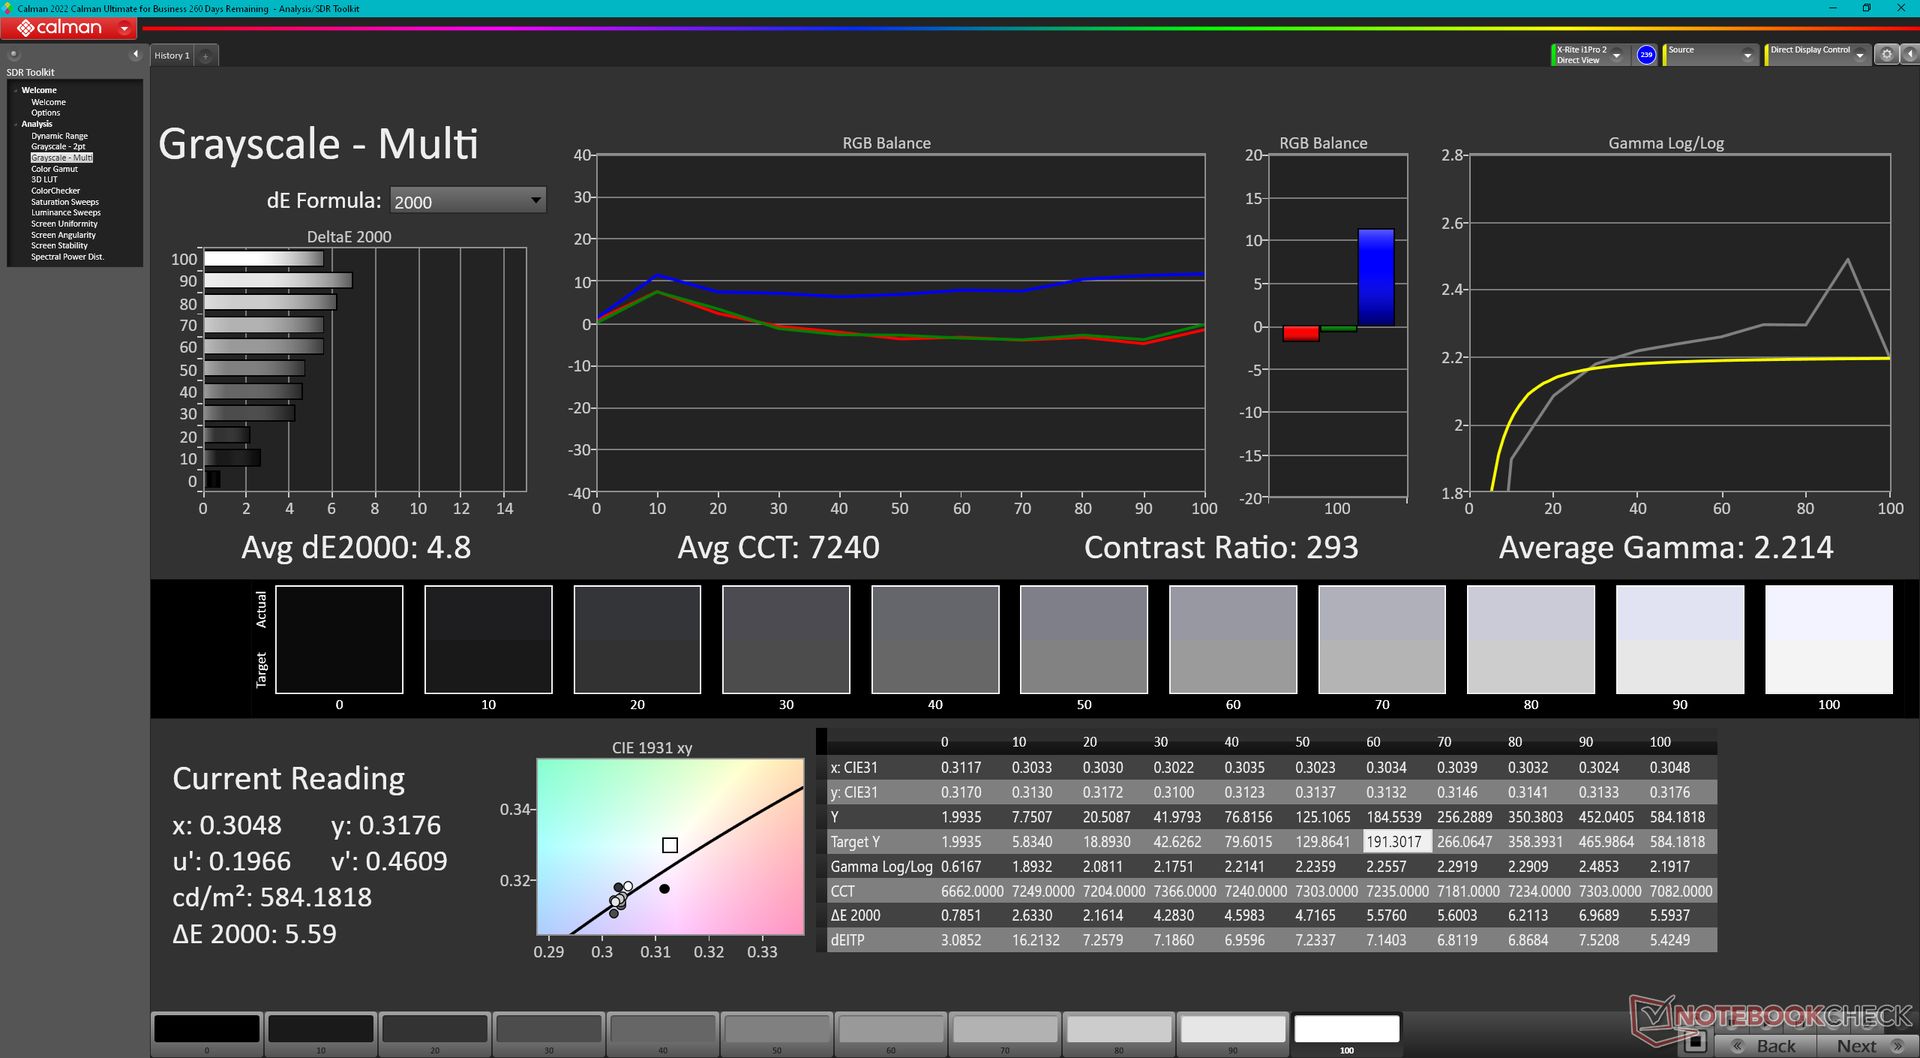
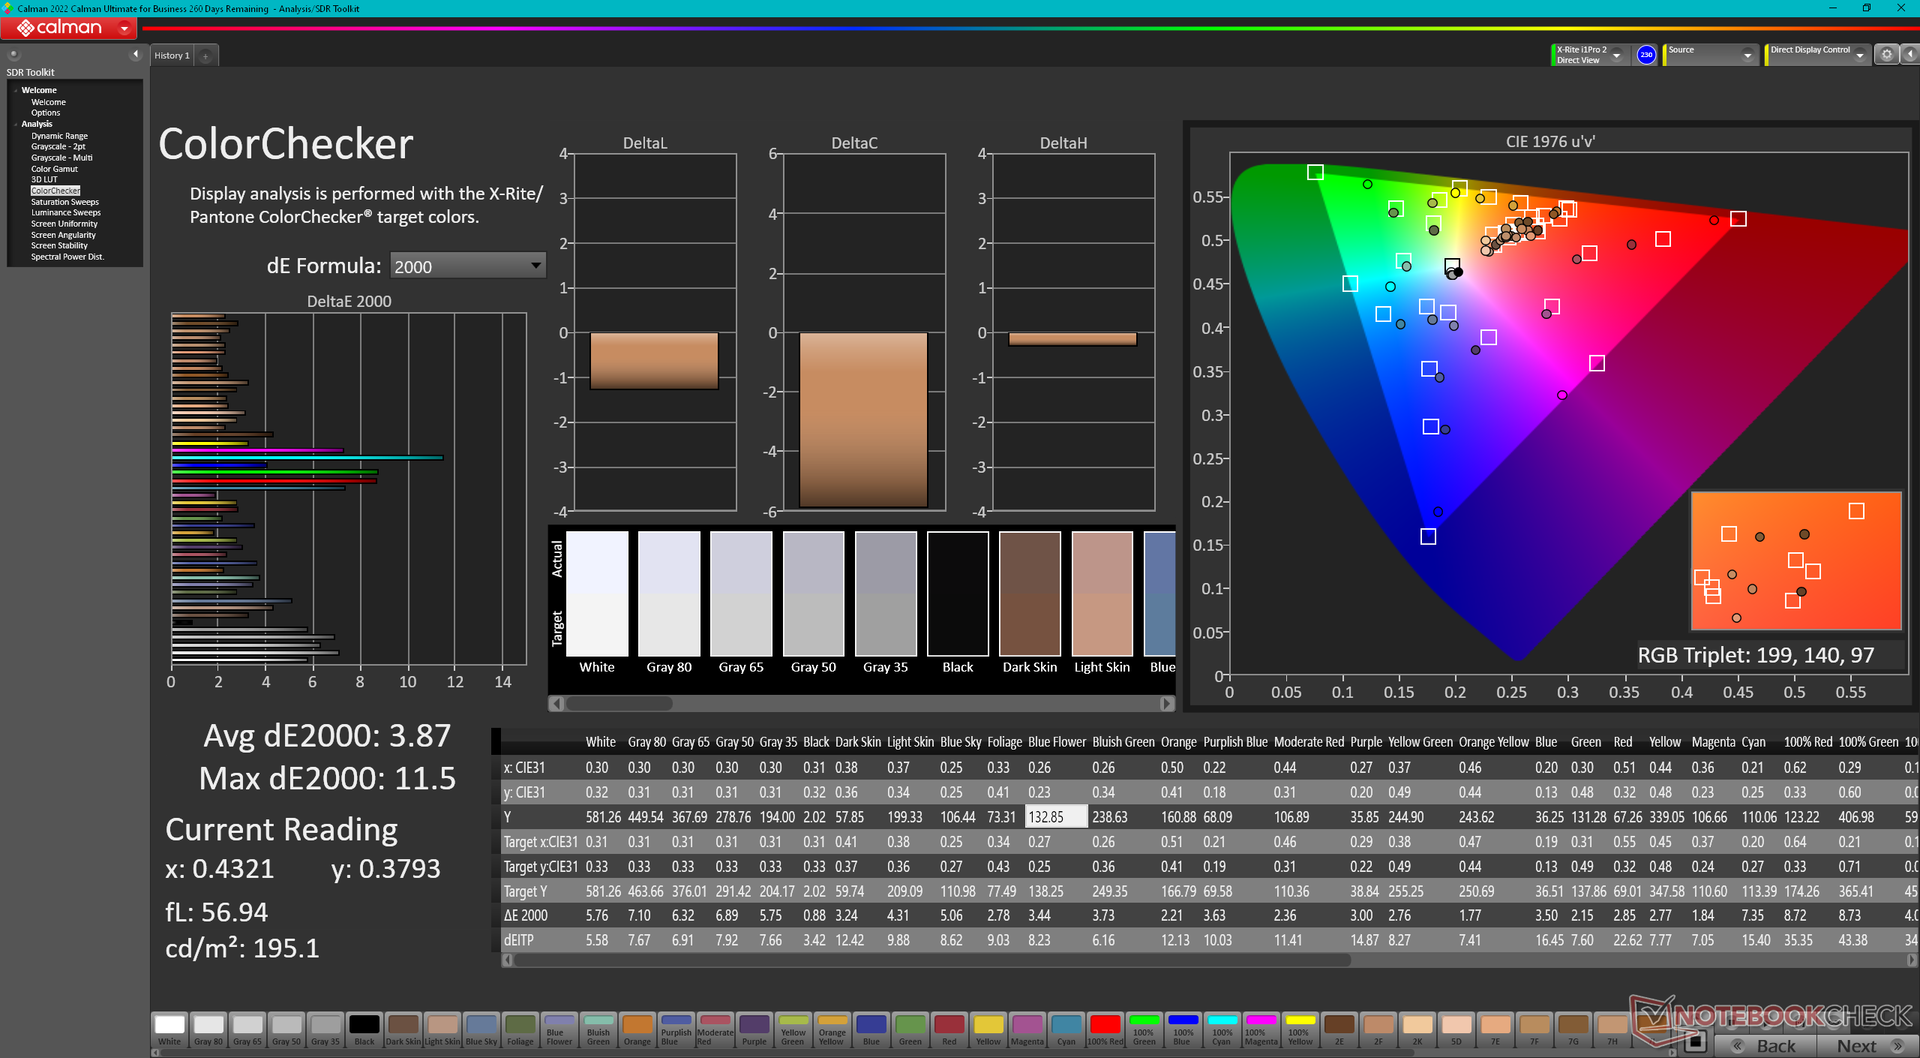
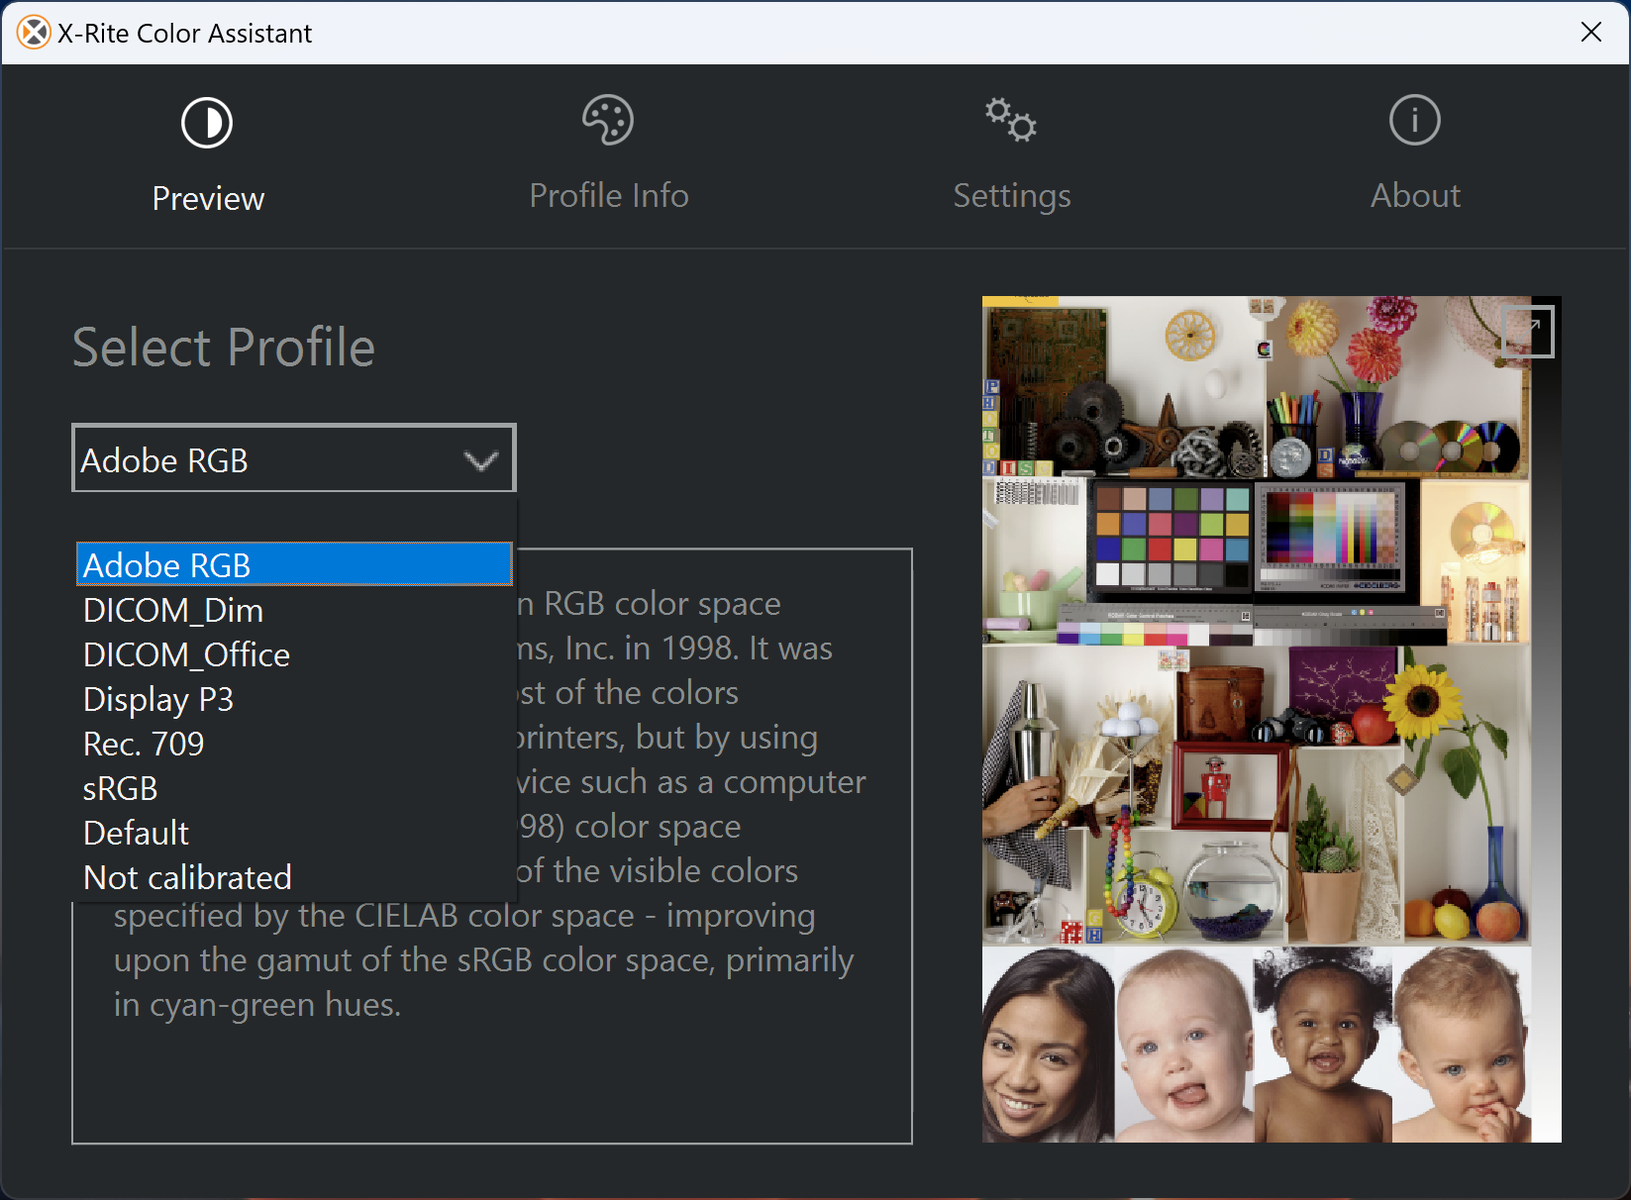
Het kleurprofiel kan worden gewijzigd via de vooraf geïnstalleerde X-Rite Color Assistant software. Het lijkt momenteel buggy te zijn, aangezien de kleuren niet zo nauwkeurig zijn als ze zouden moeten zijn, ondanks de volledige AdobeRGB dekking van ons paneel. In de sRGB modus, bijvoorbeeld, zijn de gemiddelde grijswaarden en kleur deltaE waarden slechts respectievelijk 2,6 en 2,45, tegenover 4,8 en 3,87 in de AdobeRGB modus.
Responstijd Scherm
| ↔ Responstijd Zwart naar Wit | ||
|---|---|---|
| 36.8 ms ... stijging ↗ en daling ↘ gecombineerd | ↗ 19.6 ms stijging | 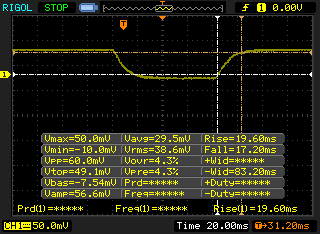 |
| ↘ 17.2 ms daling | ||
| Het scherm vertoonde trage responstijden in onze tests en is misschien te traag voor games. Ter vergelijking: alle testtoestellen variëren van 0.1 (minimum) tot 240 (maximum) ms. » 95 % van alle toestellen zijn beter. Dit betekent dat de gemeten responstijd slechter is dan het gemiddelde (19.8 ms) van alle geteste toestellen. | ||
| ↔ Responstijd 50% Grijs naar 80% Grijs | ||
| 45.6 ms ... stijging ↗ en daling ↘ gecombineerd | ↗ 21.2 ms stijging | 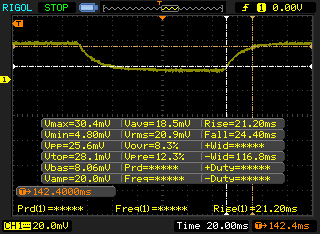 |
| ↘ 24.4 ms daling | ||
| Het scherm vertoonde trage responstijden in onze tests en is misschien te traag voor games. Ter vergelijking: alle testtoestellen variëren van 0.165 (minimum) tot 636 (maximum) ms. » 78 % van alle toestellen zijn beter. Dit betekent dat de gemeten responstijd slechter is dan het gemiddelde (30.9 ms) van alle geteste toestellen. | ||
Screen Flickering / PWM (Pulse-Width Modulation)
| Screen flickering / PWM niet waargenomen | 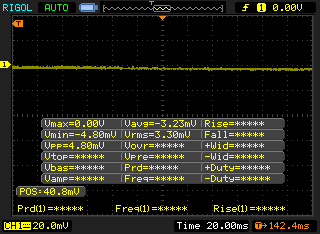 | ||
Ter vergelijking: 52 % van alle geteste toestellen maakten geen gebruik van PWM om de schermhelderheid te verlagen. Als het wel werd gebruikt, werd een gemiddelde van 7748 (minimum: 5 - maximum: 343500) Hz waargenomen. | |||
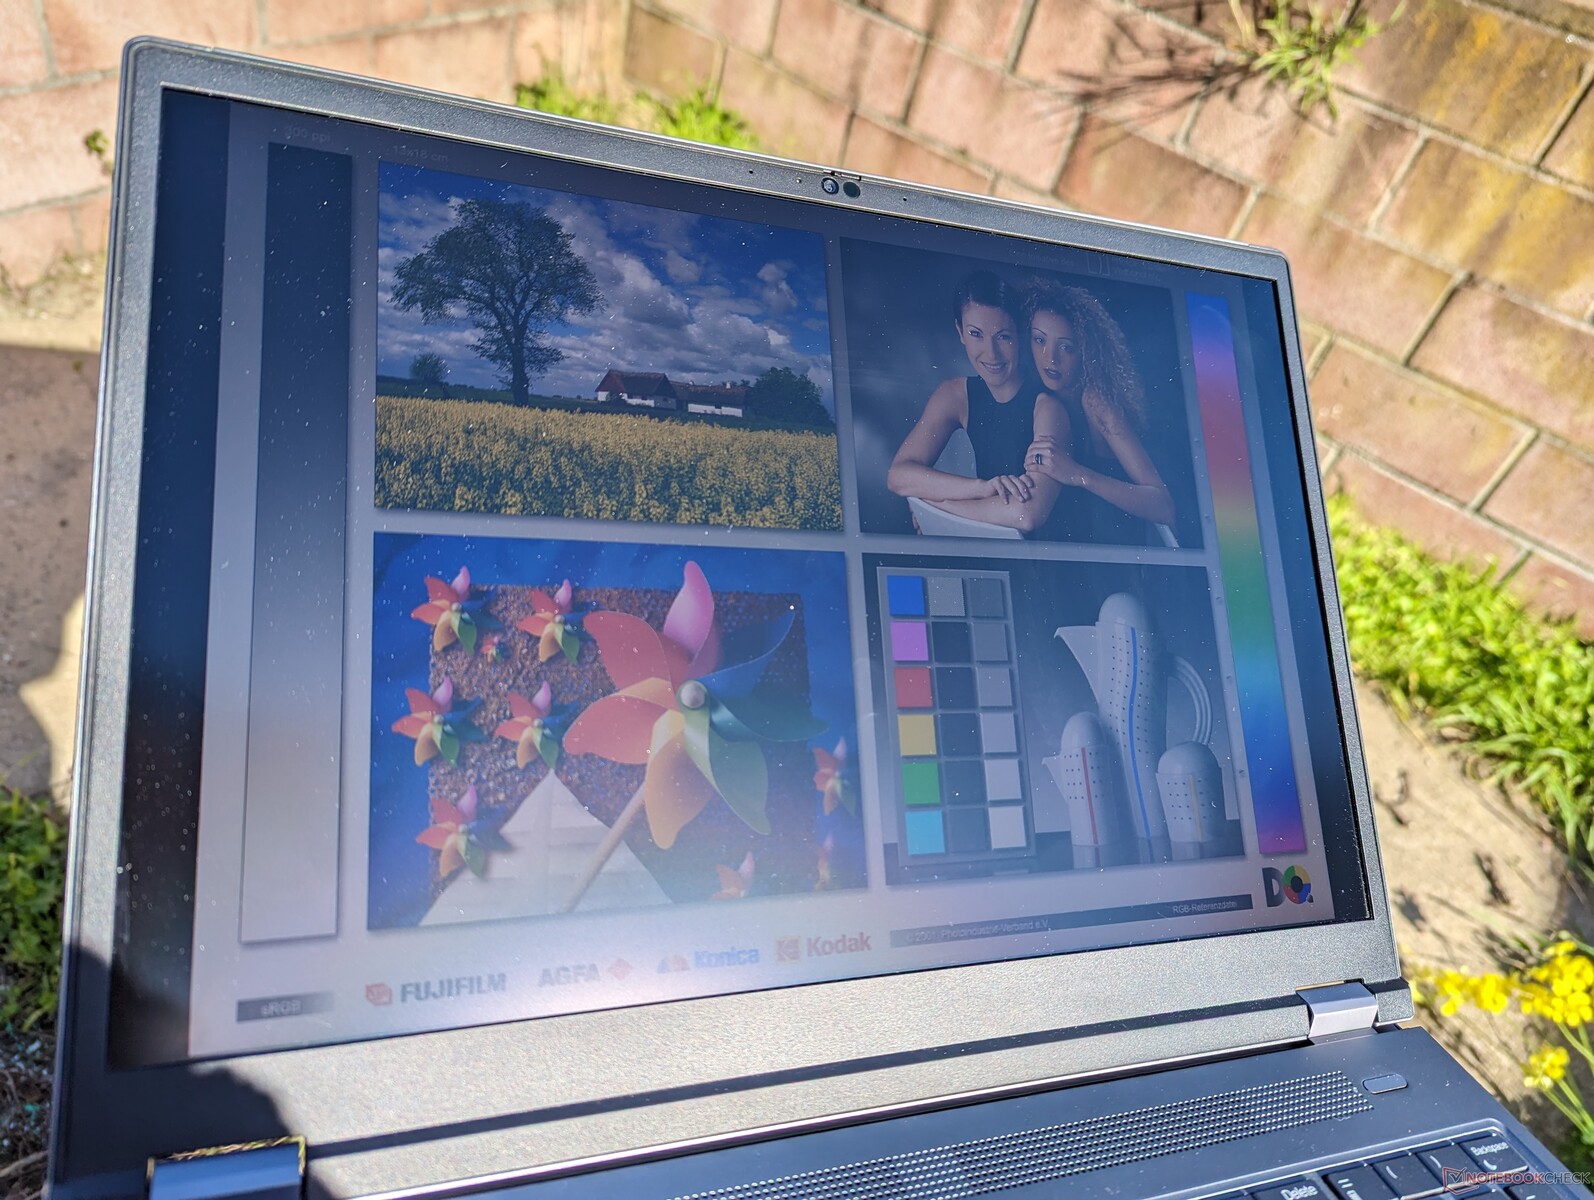
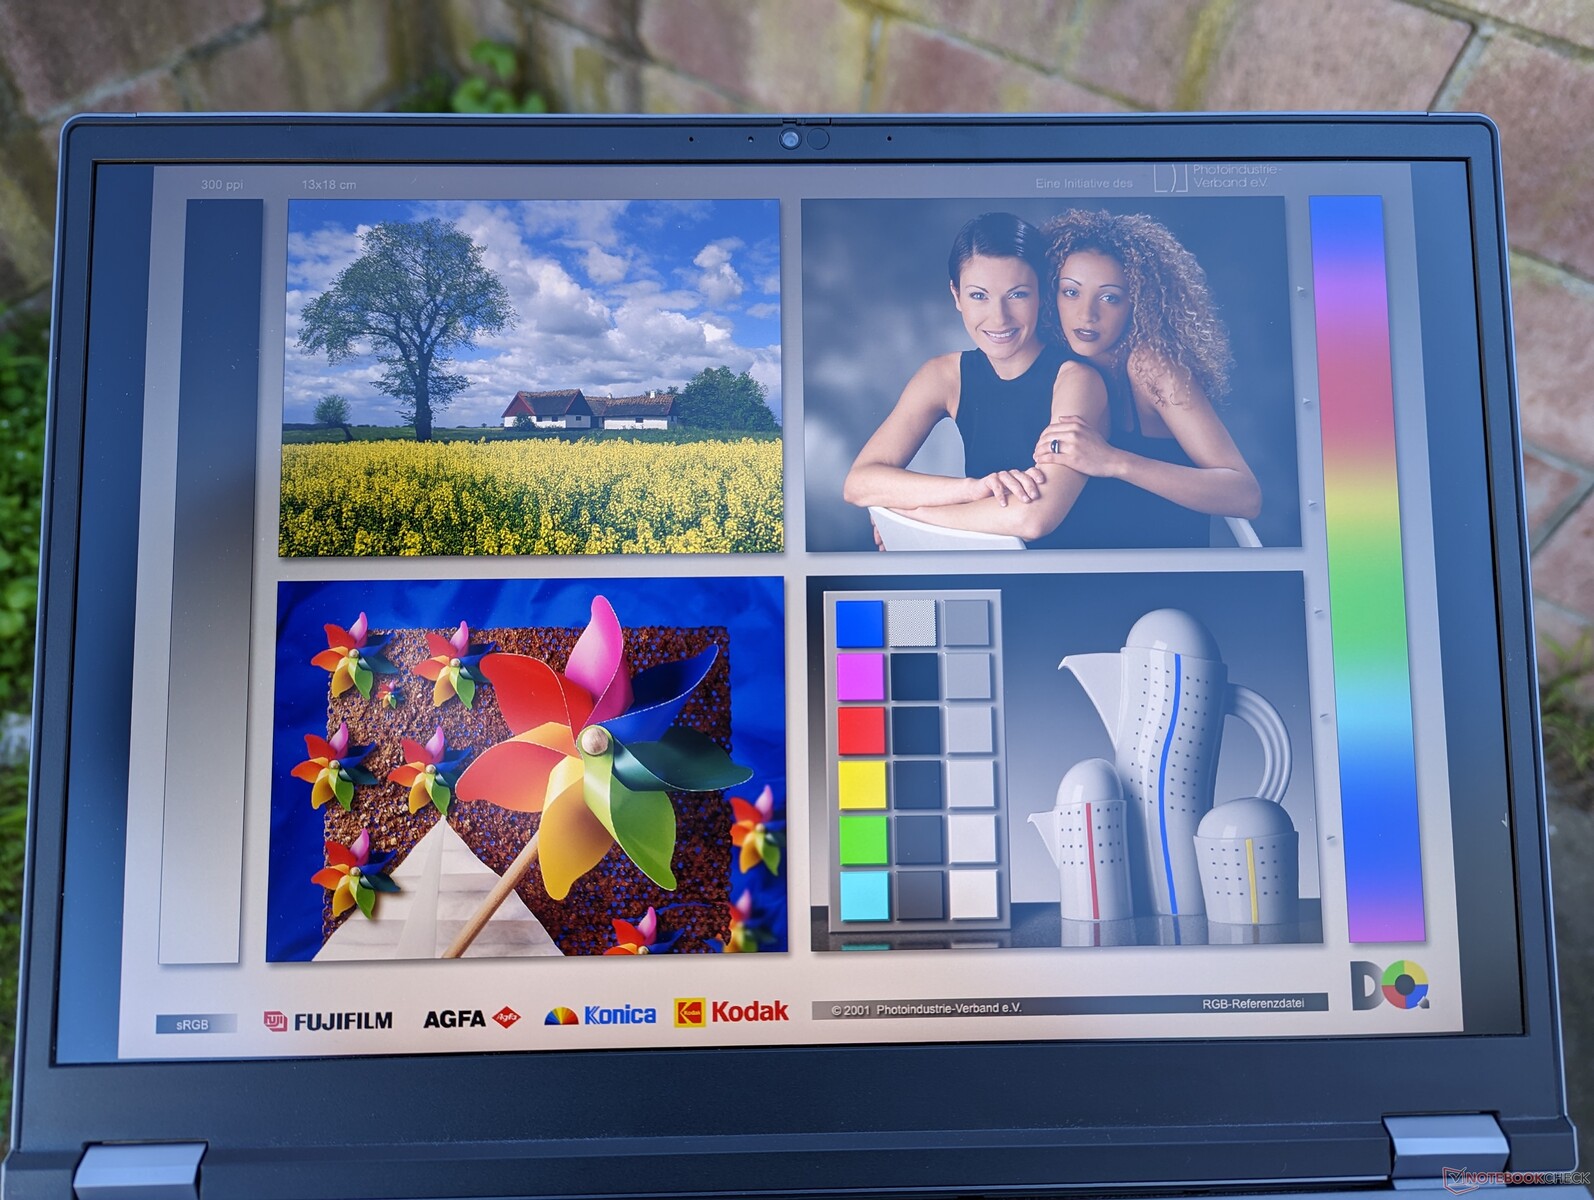
De zichtbaarheid buiten is behoorlijk, omdat het scherm helderder is dan op de meeste andere laptops, waar het bereik van 300 tot 400 nit gebruikelijker is. Het is echter wel aan te raden om zoveel mogelijk in de schaduw te werken, want direct zonlicht verslechtert de beeldkwaliteit en de kleuren.
Prestaties
Testomstandigheden
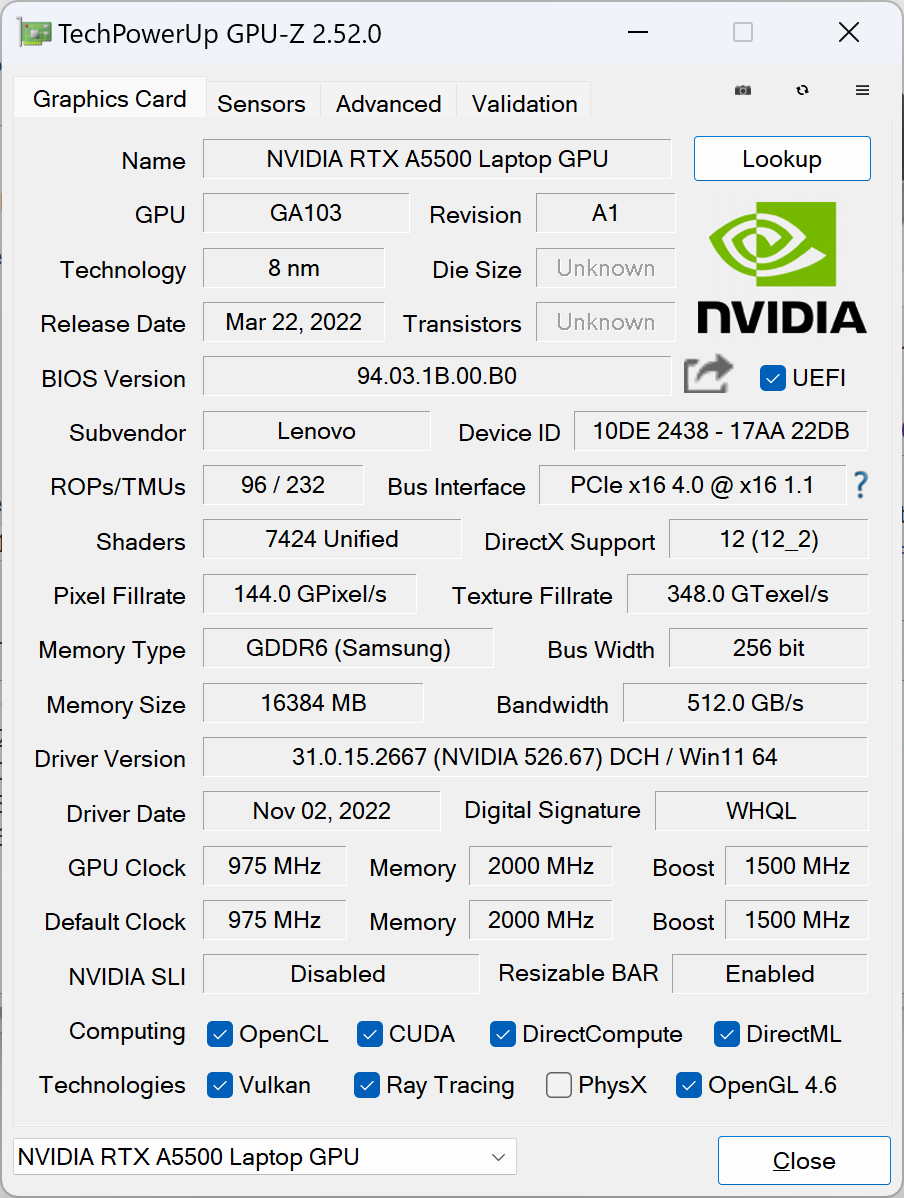
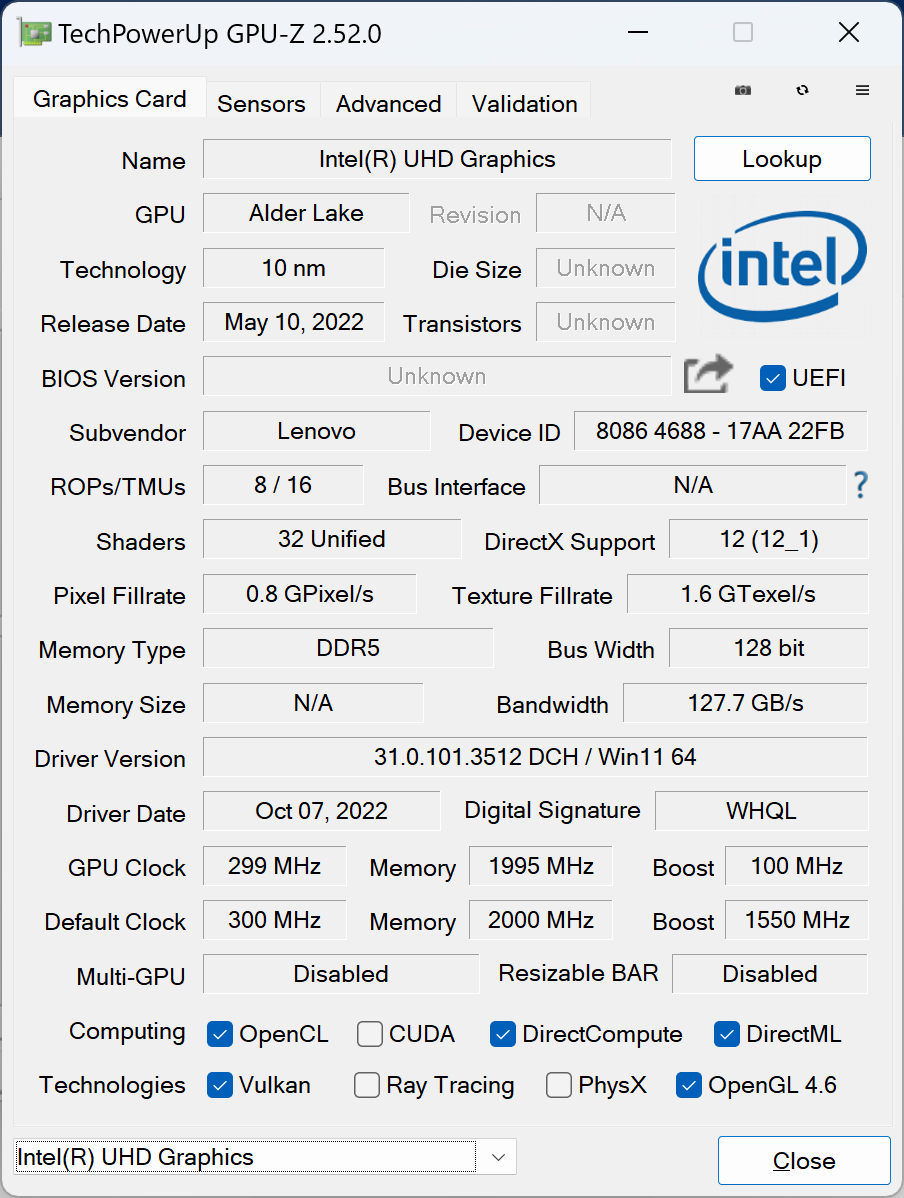
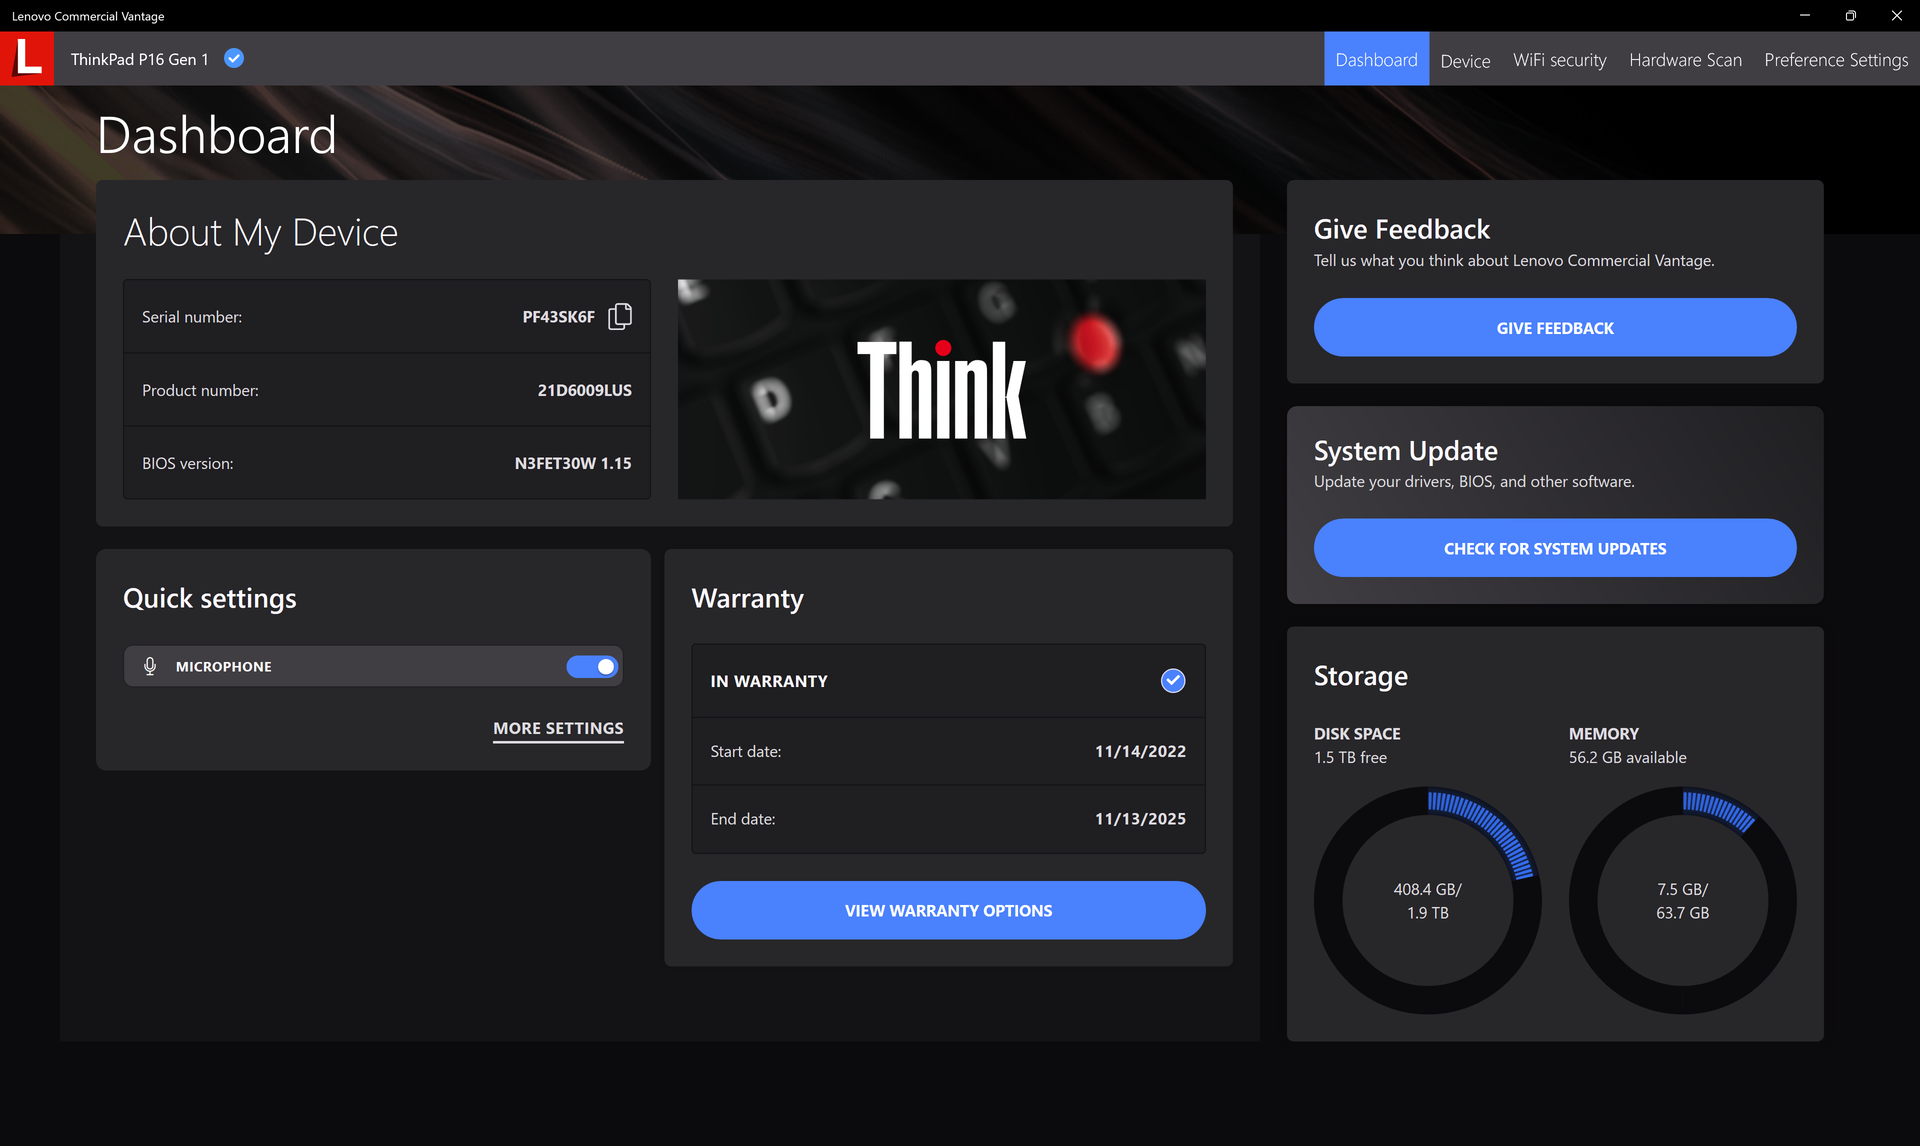
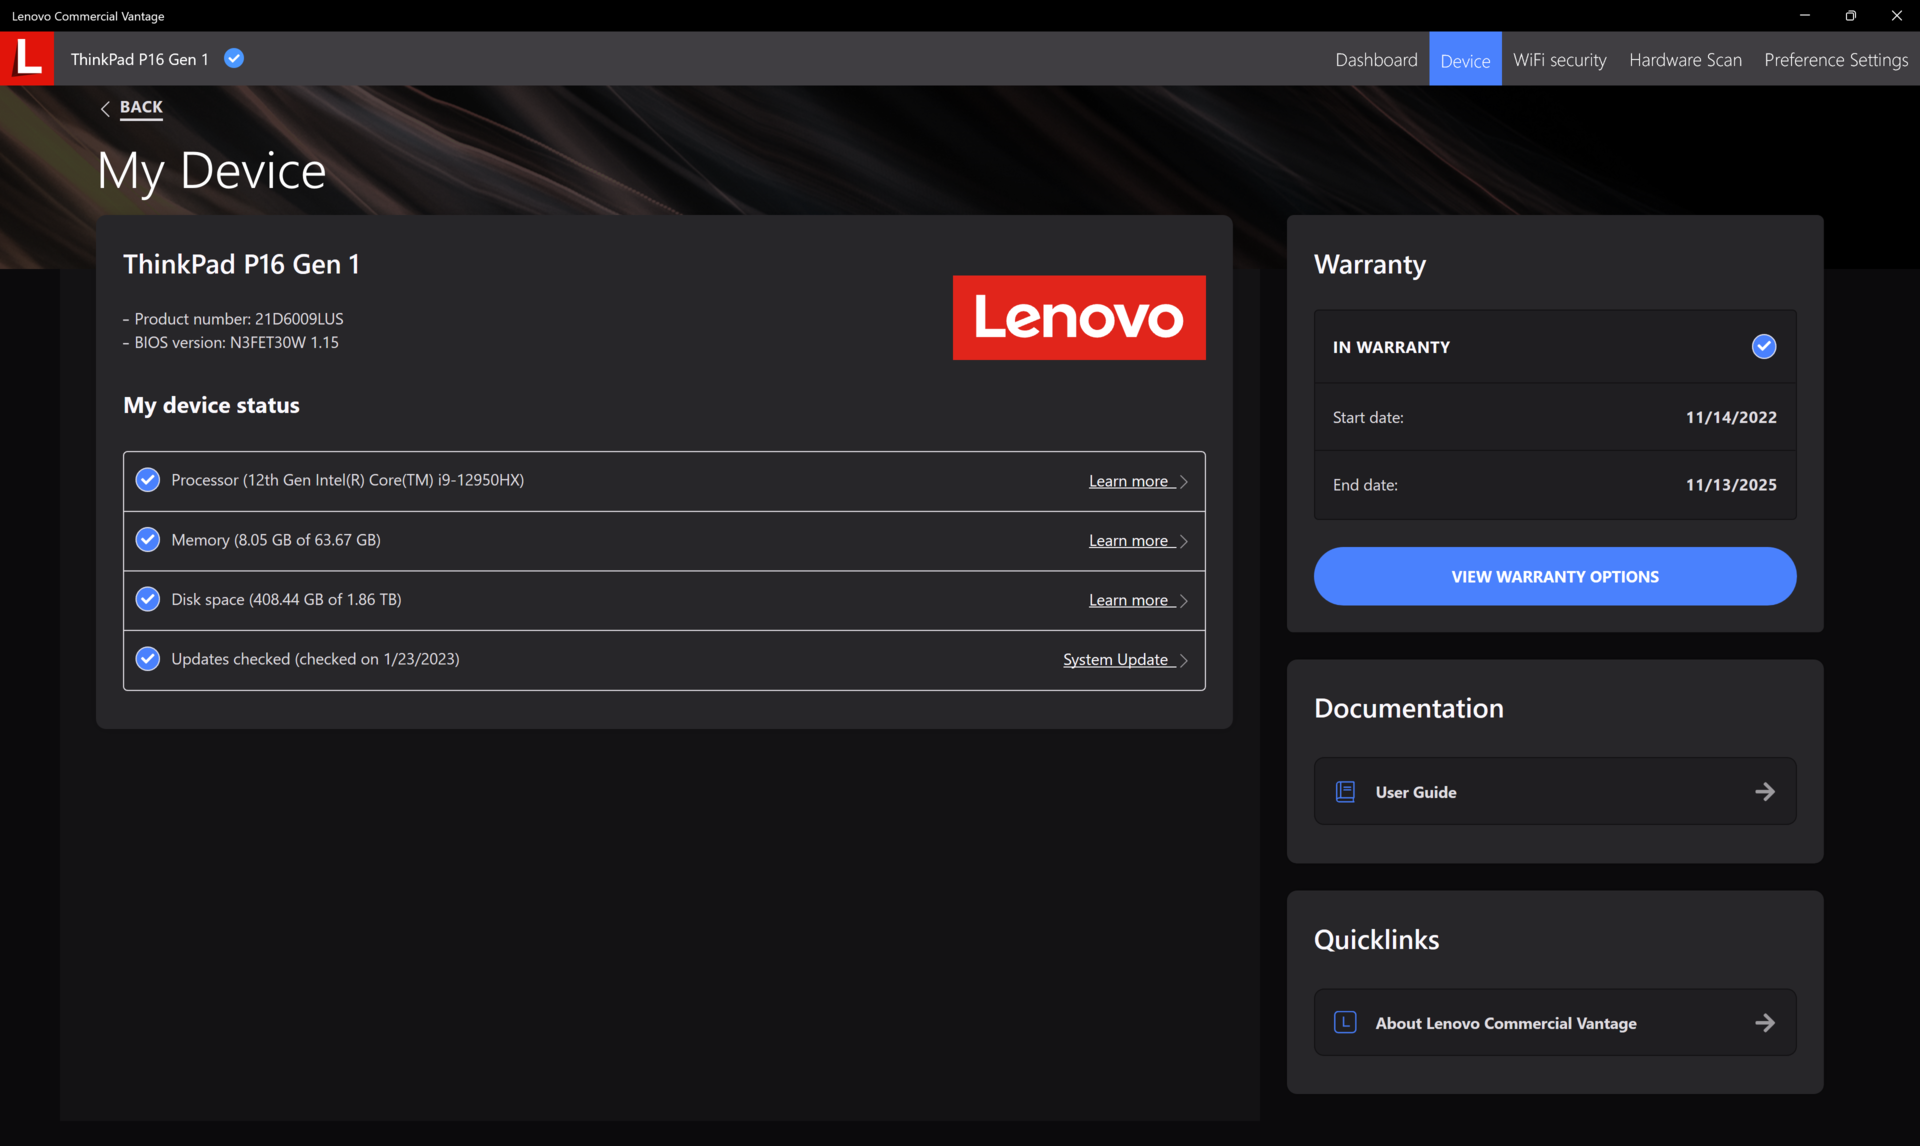
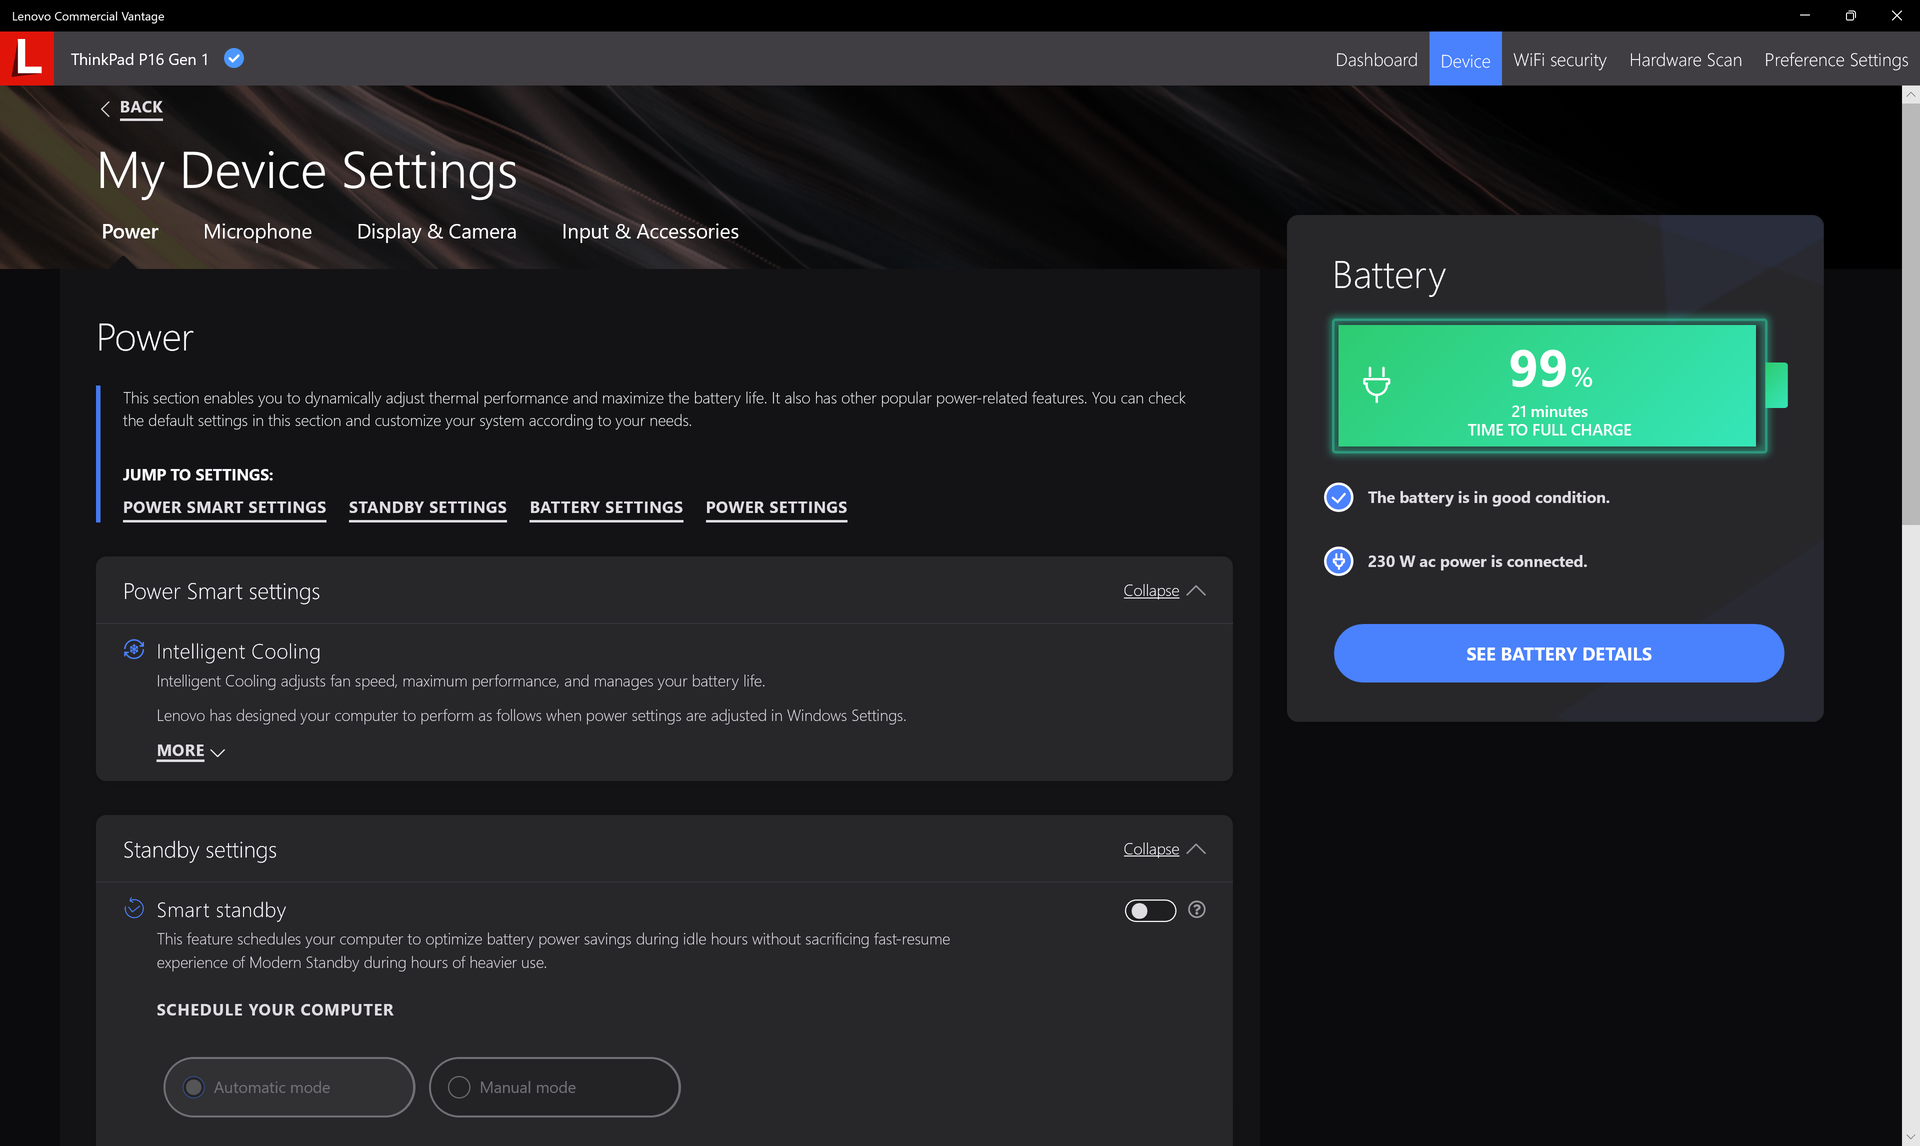
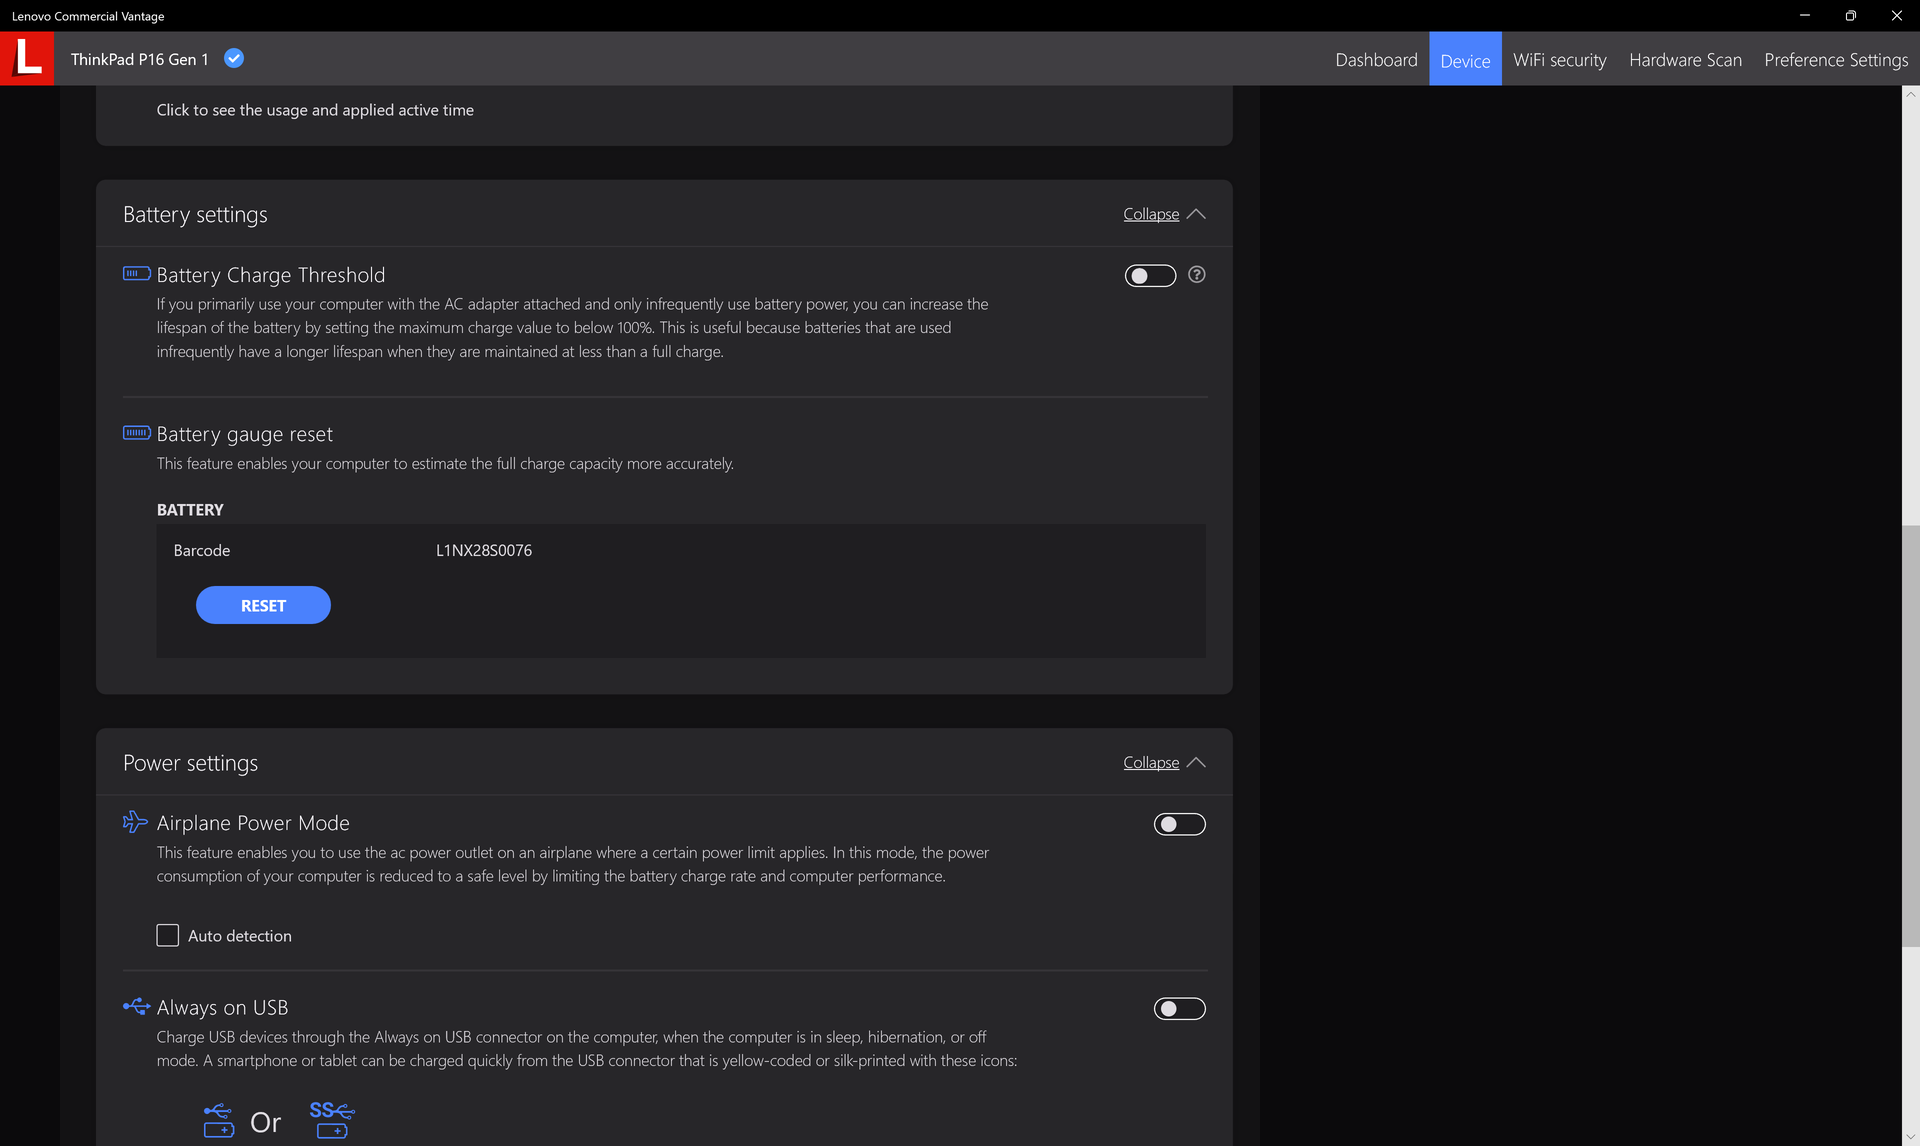
We hebben ons toestel via Windows en het Nvidia-bedieningspaneel respectievelijk in de modus Prestaties en dGPU-modus gezet voordat we onderstaande prestatiebenchmarks uitvoerden. Het is aanbevolen dat gebruikers vertrouwd raken met de vooraf geïnstalleerde Lenovo Vantage software, omdat het de centrale hub is voor Lenovo-specifieke BIOS updates, functies, garantiestatus en meer.
Er zijn geen Xeon CPU opties en dus wordt ECC RAM niet ondersteund. De ECC-status voor de GPU kan echter worden in- of uitgeschakeld via het Nvidia-controlepaneel.
Processor
De ruwe multi-thread prestaties zijn ongeveer 10 procent sneller dan de Core i9-12900H in de concurrerende MSI CreatorPro Z16P. Opwaarderen van deCore i7-12850HX configuratie naar onze Core i9-12950HX zal de prestaties met 15 procent verbeteren. De Precision 7670 is ongeveer 15 tot 20 procent langzamer, ook al wordt hij geleverd met dezelfde Core i9-12950HX CPU als onze Lenovo.
Turbo Boost duurzaamheid is goed maar niet perfect. Bij het draaien van CineBench R15 xT in een lus, bijvoorbeeld, zou de oorspronkelijke score van 3141 punten na verloop van tijd dalen tot ~2830 punten voor een prestatiedip van 10 procent.
Cinebench R15 Multi Loop
Cinebench R23: Multi Core | Single Core
Cinebench R20: CPU (Multi Core) | CPU (Single Core)
Cinebench R15: CPU Multi 64Bit | CPU Single 64Bit
Blender: v2.79 BMW27 CPU
7-Zip 18.03: 7z b 4 | 7z b 4 -mmt1
Geekbench 5.5: Multi-Core | Single-Core
HWBOT x265 Benchmark v2.2: 4k Preset
LibreOffice : 20 Documents To PDF
R Benchmark 2.5: Overall mean
* ... kleiner is beter
AIDA64: FP32 Ray-Trace | FPU Julia | CPU SHA3 | CPU Queen | FPU SinJulia | FPU Mandel | CPU AES | CPU ZLib | FP64 Ray-Trace | CPU PhotoWorxx
| Performance rating | |
| Gemiddeld Intel Core i9-12950HX | |
| Lenovo ThinkPad P16 G1 RTX A5500 | |
| Lenovo ThinkPad P16 G1 21D6001DMB | |
| MSI CreatorPro Z16P B12UKST | |
| HP ZBook Studio 16 G9 62U04EA | |
| Dell Precision 7000 7670 Performance | |
| Asus ProArt StudioBook 16 W7600H5A-2BL2 -9! | |
| AIDA64 / FP32 Ray-Trace | |
| Lenovo ThinkPad P16 G1 RTX A5500 | |
| Gemiddeld Intel Core i9-12950HX (15499 - 22868, n=7) | |
| Lenovo ThinkPad P16 G1 21D6001DMB | |
| Dell Precision 7000 7670 Performance | |
| HP ZBook Studio 16 G9 62U04EA | |
| MSI CreatorPro Z16P B12UKST | |
| AIDA64 / FPU Julia | |
| Lenovo ThinkPad P16 G1 RTX A5500 | |
| Gemiddeld Intel Core i9-12950HX (77846 - 115907, n=7) | |
| Lenovo ThinkPad P16 G1 21D6001DMB | |
| HP ZBook Studio 16 G9 62U04EA | |
| Dell Precision 7000 7670 Performance | |
| MSI CreatorPro Z16P B12UKST | |
| AIDA64 / CPU SHA3 | |
| Lenovo ThinkPad P16 G1 RTX A5500 | |
| Gemiddeld Intel Core i9-12950HX (3426 - 5069, n=7) | |
| Lenovo ThinkPad P16 G1 21D6001DMB | |
| HP ZBook Studio 16 G9 62U04EA | |
| MSI CreatorPro Z16P B12UKST | |
| Dell Precision 7000 7670 Performance | |
| AIDA64 / CPU Queen | |
| HP ZBook Studio 16 G9 62U04EA | |
| Gemiddeld Intel Core i9-12950HX (102752 - 104726, n=7) | |
| Lenovo ThinkPad P16 G1 RTX A5500 | |
| Dell Precision 7000 7670 Performance | |
| MSI CreatorPro Z16P B12UKST | |
| Lenovo ThinkPad P16 G1 21D6001DMB | |
| AIDA64 / FPU SinJulia | |
| Lenovo ThinkPad P16 G1 RTX A5500 | |
| Gemiddeld Intel Core i9-12950HX (10134 - 12823, n=7) | |
| Lenovo ThinkPad P16 G1 21D6001DMB | |
| Dell Precision 7000 7670 Performance | |
| HP ZBook Studio 16 G9 62U04EA | |
| MSI CreatorPro Z16P B12UKST | |
| AIDA64 / FPU Mandel | |
| Lenovo ThinkPad P16 G1 RTX A5500 | |
| Gemiddeld Intel Core i9-12950HX (37146 - 57340, n=7) | |
| Lenovo ThinkPad P16 G1 21D6001DMB | |
| HP ZBook Studio 16 G9 62U04EA | |
| Dell Precision 7000 7670 Performance | |
| MSI CreatorPro Z16P B12UKST | |
| AIDA64 / CPU AES | |
| MSI CreatorPro Z16P B12UKST | |
| Gemiddeld Intel Core i9-12950HX (72599 - 181128, n=7) | |
| Lenovo ThinkPad P16 G1 RTX A5500 | |
| Lenovo ThinkPad P16 G1 21D6001DMB | |
| HP ZBook Studio 16 G9 62U04EA | |
| Dell Precision 7000 7670 Performance | |
| AIDA64 / FP64 Ray-Trace | |
| Lenovo ThinkPad P16 G1 RTX A5500 | |
| Gemiddeld Intel Core i9-12950HX (8455 - 12432, n=7) | |
| Lenovo ThinkPad P16 G1 21D6001DMB | |
| HP ZBook Studio 16 G9 62U04EA | |
| Dell Precision 7000 7670 Performance | |
| MSI CreatorPro Z16P B12UKST | |
| AIDA64 / CPU PhotoWorxx | |
| MSI CreatorPro Z16P B12UKST | |
| Dell Precision 7000 7670 Performance | |
| Gemiddeld Intel Core i9-12950HX (35479 - 42655, n=7) | |
| Lenovo ThinkPad P16 G1 RTX A5500 | |
| HP ZBook Studio 16 G9 62U04EA | |
| Lenovo ThinkPad P16 G1 21D6001DMB | |
Systeemprestaties
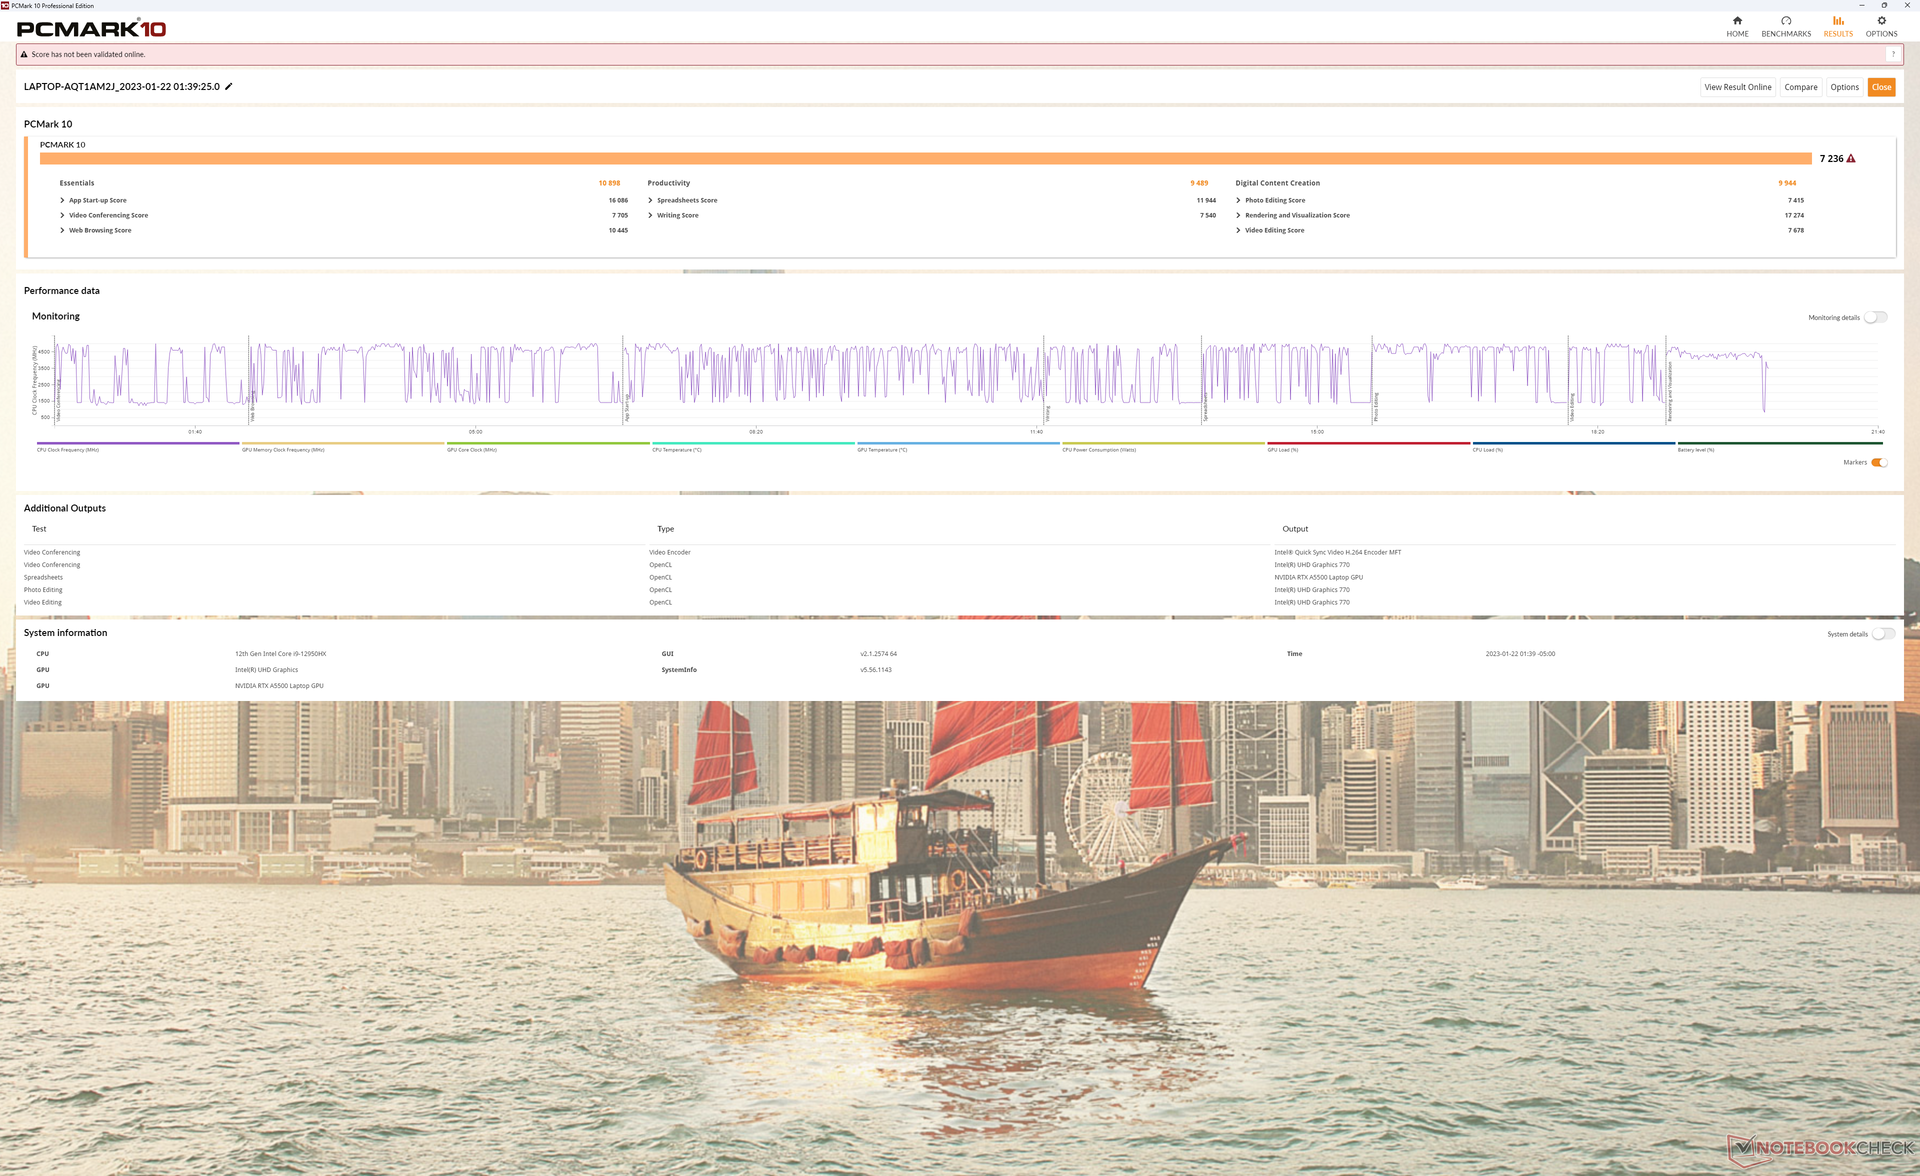
PCMark-scores behoren tot de hoogste die we ooit op een mobiel werkstation hebben gezien. Ons systeem laat zelfs de Dell Precision 7670 die wordt geleverd met dezelfde CPU en GPU opties als de ThinkPad P16 G1.
CrossMark: Overall | Productivity | Creativity | Responsiveness
| PCMark 10 / Score | |
| Lenovo ThinkPad P16 G1 RTX A5500 | |
| MSI CreatorPro Z16P B12UKST | |
| Gemiddeld Intel Core i9-12950HX, NVIDIA RTX A5500 Laptop GPU (6883 - 7236, n=3) | |
| Asus ProArt StudioBook 16 W7600H5A-2BL2 | |
| Dell Precision 7000 7670 Performance | |
| HP ZBook Studio 16 G9 62U04EA | |
| Lenovo ThinkPad P16 G1 21D6001DMB | |
| PCMark 10 / Essentials | |
| Dell Precision 7000 7670 Performance | |
| Gemiddeld Intel Core i9-12950HX, NVIDIA RTX A5500 Laptop GPU (10898 - 11465, n=3) | |
| Lenovo ThinkPad P16 G1 RTX A5500 | |
| MSI CreatorPro Z16P B12UKST | |
| Asus ProArt StudioBook 16 W7600H5A-2BL2 | |
| Lenovo ThinkPad P16 G1 21D6001DMB | |
| HP ZBook Studio 16 G9 62U04EA | |
| PCMark 10 / Productivity | |
| Lenovo ThinkPad P16 G1 RTX A5500 | |
| MSI CreatorPro Z16P B12UKST | |
| Lenovo ThinkPad P16 G1 21D6001DMB | |
| Asus ProArt StudioBook 16 W7600H5A-2BL2 | |
| Gemiddeld Intel Core i9-12950HX, NVIDIA RTX A5500 Laptop GPU (8054 - 9489, n=3) | |
| Dell Precision 7000 7670 Performance | |
| HP ZBook Studio 16 G9 62U04EA | |
| PCMark 10 / Digital Content Creation | |
| Asus ProArt StudioBook 16 W7600H5A-2BL2 | |
| Lenovo ThinkPad P16 G1 RTX A5500 | |
| MSI CreatorPro Z16P B12UKST | |
| Dell Precision 7000 7670 Performance | |
| Gemiddeld Intel Core i9-12950HX, NVIDIA RTX A5500 Laptop GPU (9155 - 9944, n=3) | |
| HP ZBook Studio 16 G9 62U04EA | |
| Lenovo ThinkPad P16 G1 21D6001DMB | |
| CrossMark / Overall | |
| MSI CreatorPro Z16P B12UKST | |
| Lenovo ThinkPad P16 G1 RTX A5500 | |
| Gemiddeld Intel Core i9-12950HX, NVIDIA RTX A5500 Laptop GPU (1801 - 1889, n=3) | |
| HP ZBook Studio 16 G9 62U04EA | |
| Dell Precision 7000 7670 Performance | |
| Lenovo ThinkPad P16 G1 21D6001DMB | |
| CrossMark / Productivity | |
| MSI CreatorPro Z16P B12UKST | |
| Lenovo ThinkPad P16 G1 RTX A5500 | |
| Gemiddeld Intel Core i9-12950HX, NVIDIA RTX A5500 Laptop GPU (1684 - 1785, n=3) | |
| HP ZBook Studio 16 G9 62U04EA | |
| Dell Precision 7000 7670 Performance | |
| Lenovo ThinkPad P16 G1 21D6001DMB | |
| CrossMark / Creativity | |
| Lenovo ThinkPad P16 G1 RTX A5500 | |
| Gemiddeld Intel Core i9-12950HX, NVIDIA RTX A5500 Laptop GPU (2042 - 2192, n=3) | |
| HP ZBook Studio 16 G9 62U04EA | |
| MSI CreatorPro Z16P B12UKST | |
| Dell Precision 7000 7670 Performance | |
| Lenovo ThinkPad P16 G1 21D6001DMB | |
| CrossMark / Responsiveness | |
| MSI CreatorPro Z16P B12UKST | |
| HP ZBook Studio 16 G9 62U04EA | |
| Gemiddeld Intel Core i9-12950HX, NVIDIA RTX A5500 Laptop GPU (1501 - 1585, n=3) | |
| Dell Precision 7000 7670 Performance | |
| Lenovo ThinkPad P16 G1 RTX A5500 | |
| Lenovo ThinkPad P16 G1 21D6001DMB | |
| PCMark 10 Score | 7236 punten | |
Help | ||
| AIDA64 / Memory Copy | |
| Dell Precision 7000 7670 Performance | |
| Gemiddeld Intel Core i9-12950HX (59731 - 64732, n=7) | |
| Lenovo ThinkPad P16 G1 RTX A5500 | |
| MSI CreatorPro Z16P B12UKST | |
| HP ZBook Studio 16 G9 62U04EA | |
| Lenovo ThinkPad P16 G1 21D6001DMB | |
| AIDA64 / Memory Read | |
| Dell Precision 7000 7670 Performance | |
| Gemiddeld Intel Core i9-12950HX (59744 - 70359, n=7) | |
| MSI CreatorPro Z16P B12UKST | |
| HP ZBook Studio 16 G9 62U04EA | |
| Lenovo ThinkPad P16 G1 RTX A5500 | |
| Lenovo ThinkPad P16 G1 21D6001DMB | |
| AIDA64 / Memory Write | |
| MSI CreatorPro Z16P B12UKST | |
| Dell Precision 7000 7670 Performance | |
| HP ZBook Studio 16 G9 62U04EA | |
| Gemiddeld Intel Core i9-12950HX (57750 - 67899, n=7) | |
| Lenovo ThinkPad P16 G1 RTX A5500 | |
| Lenovo ThinkPad P16 G1 21D6001DMB | |
* ... kleiner is beter
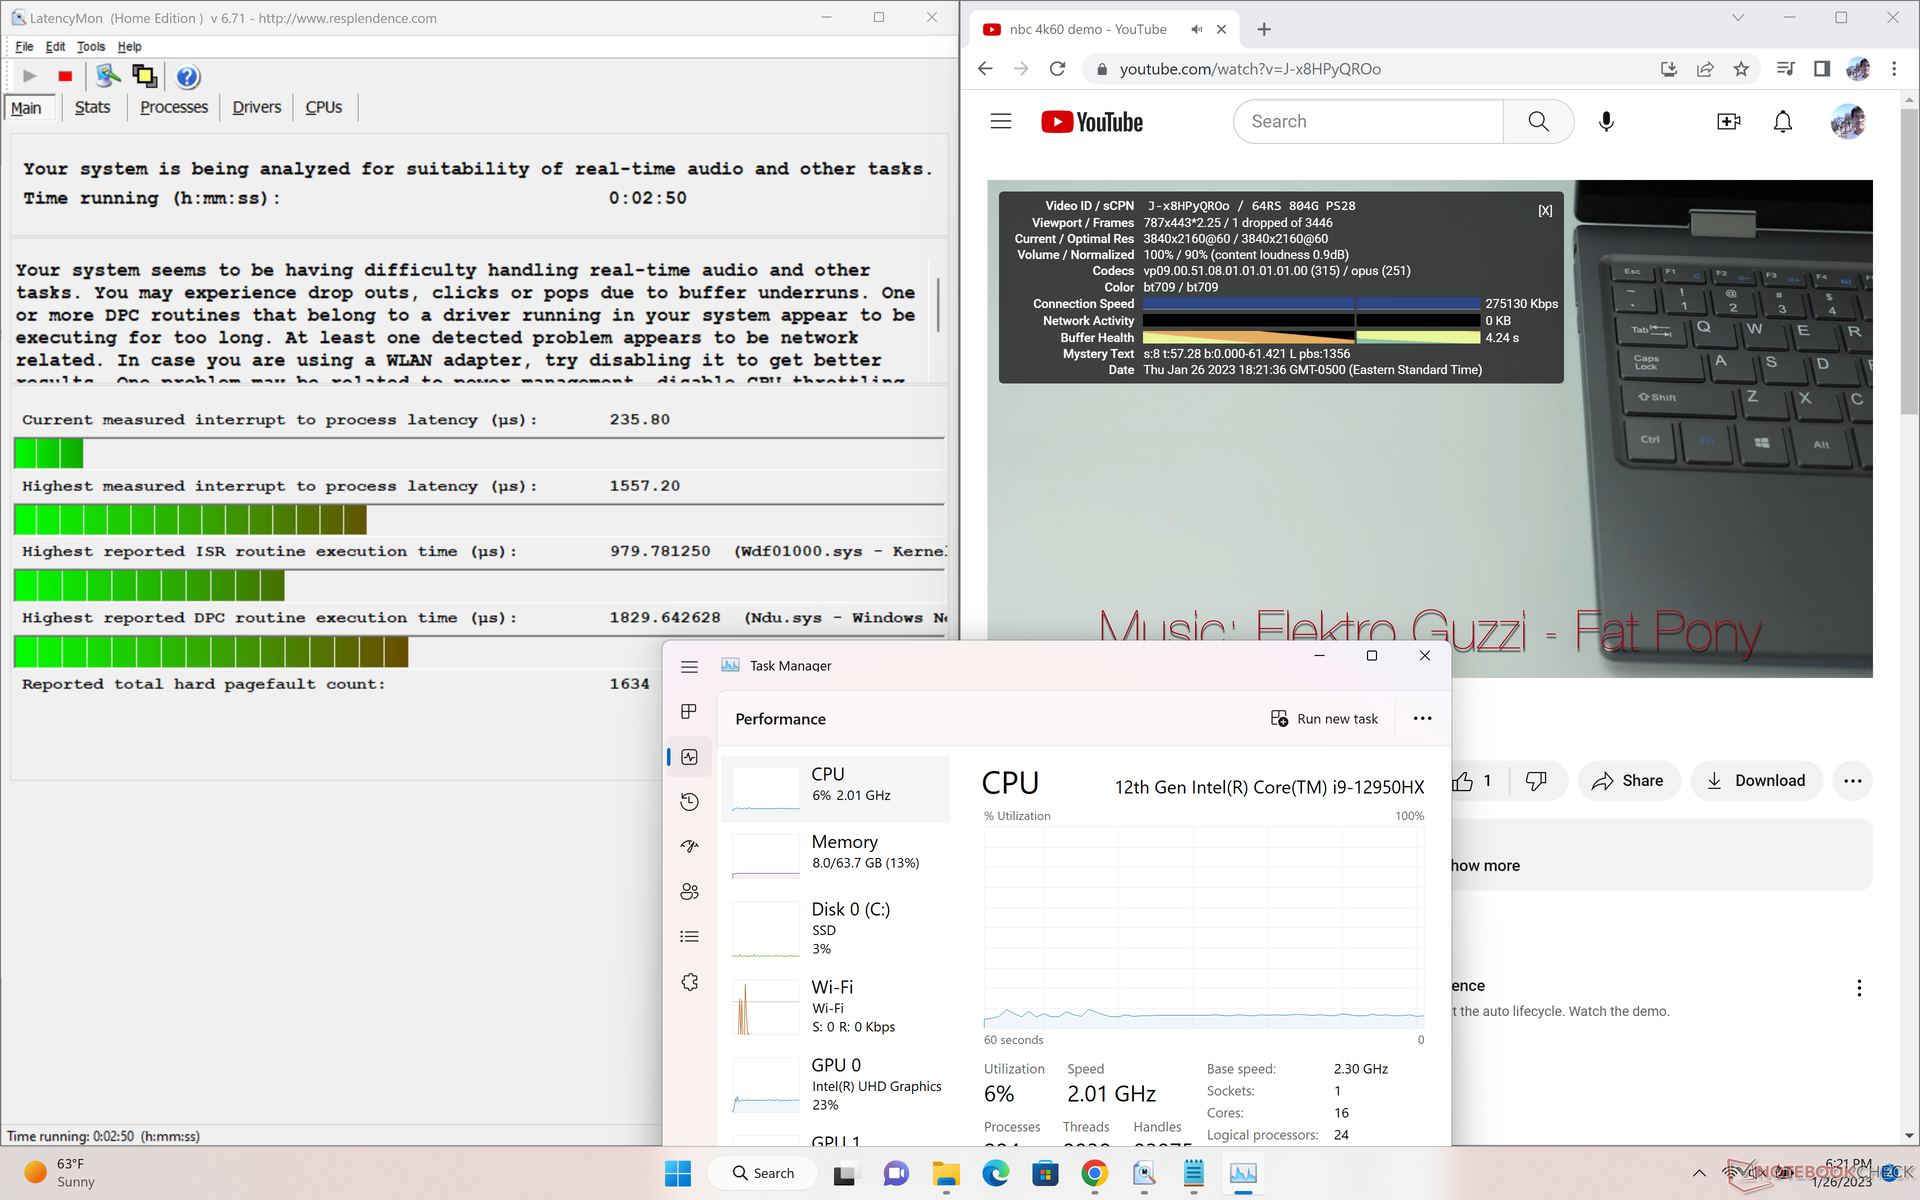
DPC latentie
LatencyMon onthult kleine DPC-problemen bij het openen van meerdere browsertabbladen van onze homepage, wat teleurstellend is voor een werkstation. 4K videoweergave bij 60 FPS is verder uitstekend met slechts een enkel dropped frame tijdens onze testvideo.

| DPC Latencies / LatencyMon - interrupt to process latency (max), Web, Youtube, Prime95 | |
| Dell Precision 7000 7670 Performance | |
| Lenovo ThinkPad P16 G1 RTX A5500 | |
| Asus ProArt StudioBook 16 W7600H5A-2BL2 | |
| Lenovo ThinkPad P16 G1 21D6001DMB | |
| HP ZBook Studio 16 G9 62U04EA | |
| MSI CreatorPro Z16P B12UKST | |
* ... kleiner is beter
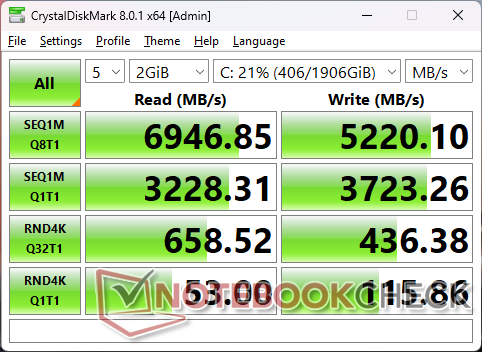
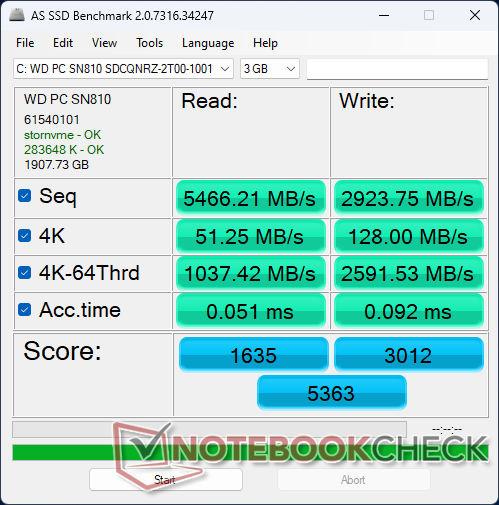
Opslagapparaten
Terwijl onze A2000-configuratie wordt geleverd met een Micron 3400 SSD, wordt onze A5500-configuratie geleverd met een WD SN810 OPAL SSD. Sequentiële lees- en schrijfsnelheden zijn vergelijkbaar tussen de twee, maar onze WD-schijf lijkt problemen te hebben om de maximale overdrachtsnelheden te handhaven na ongeveer 5 minuten van stress, zoals blijkt uit onze vergelijkingsgrafiek hieronder.

* ... kleiner is beter
Disk Throttling: DiskSpd Read Loop, Queue Depth 8
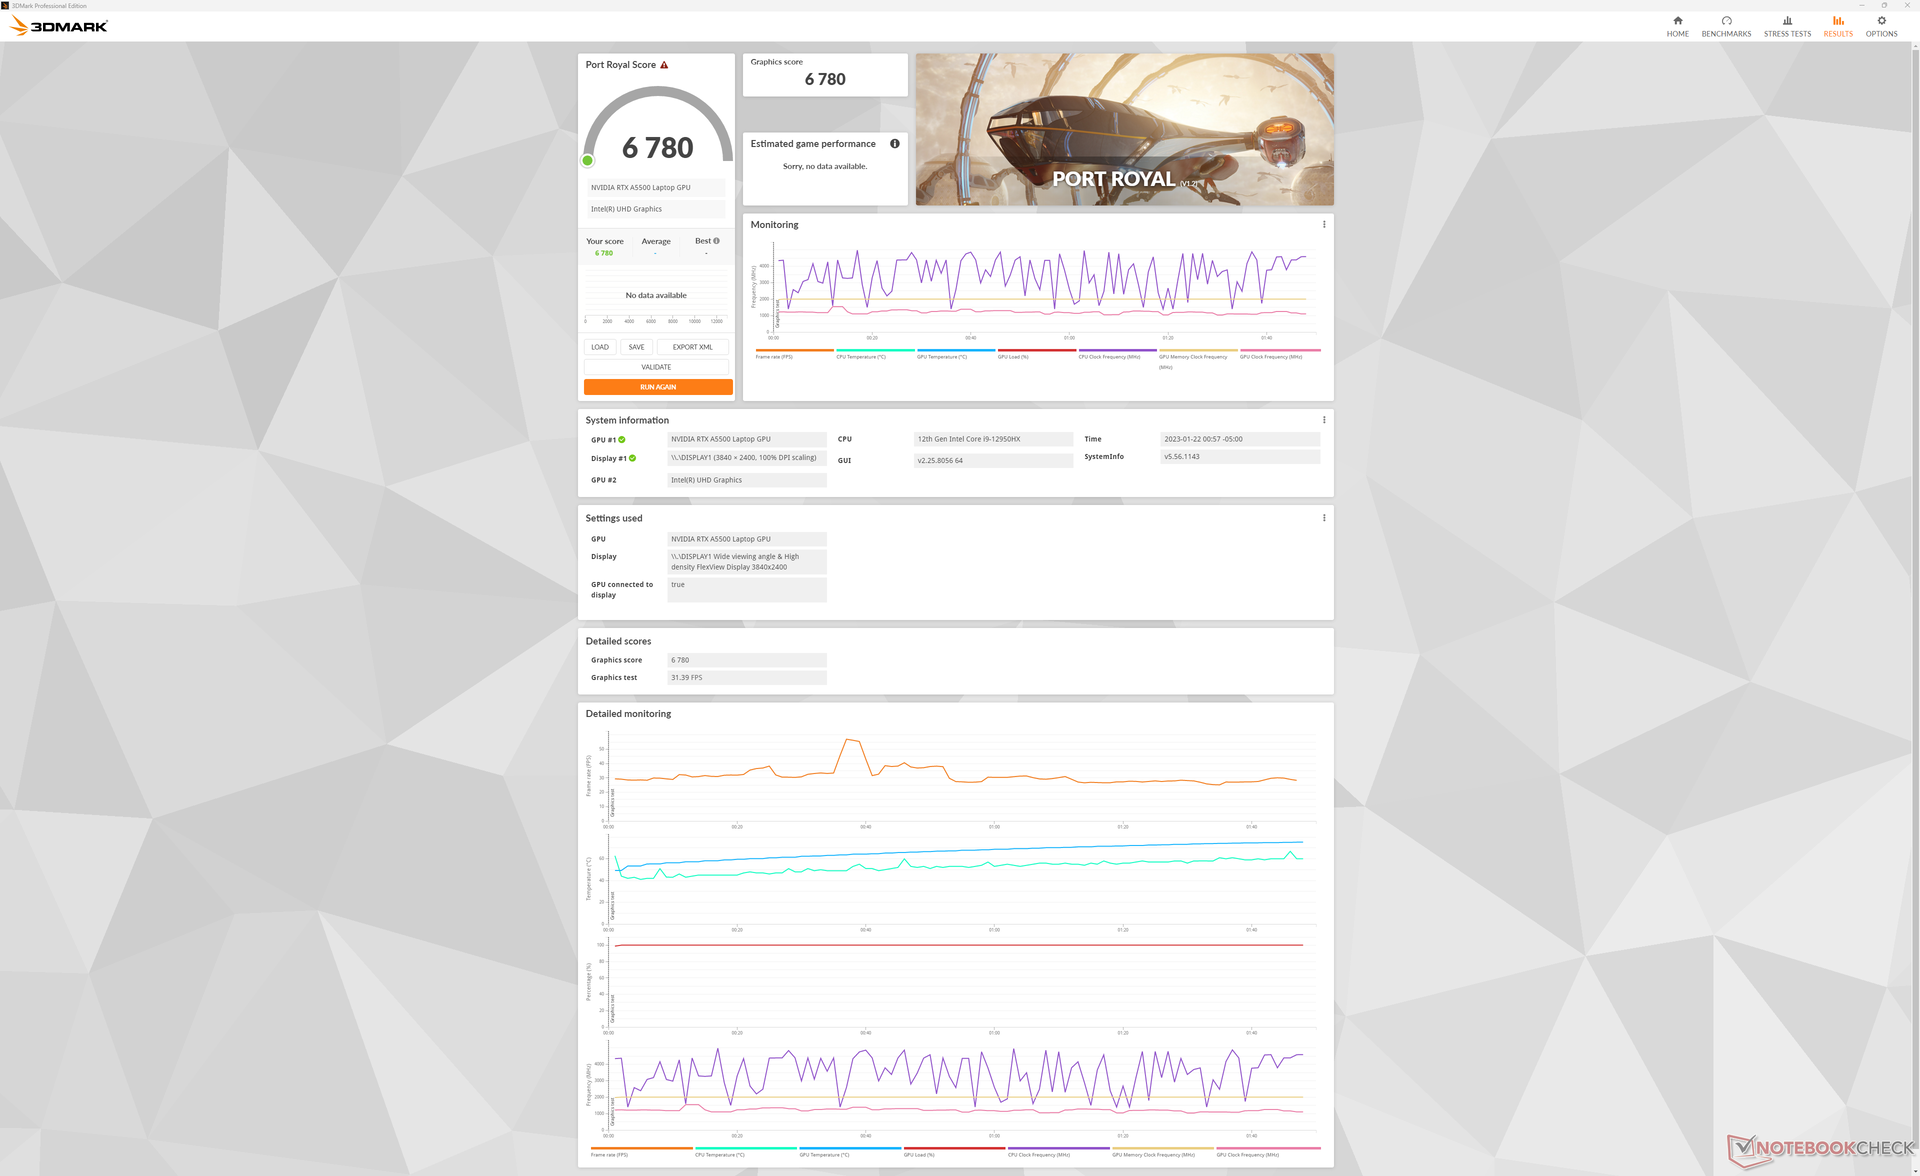
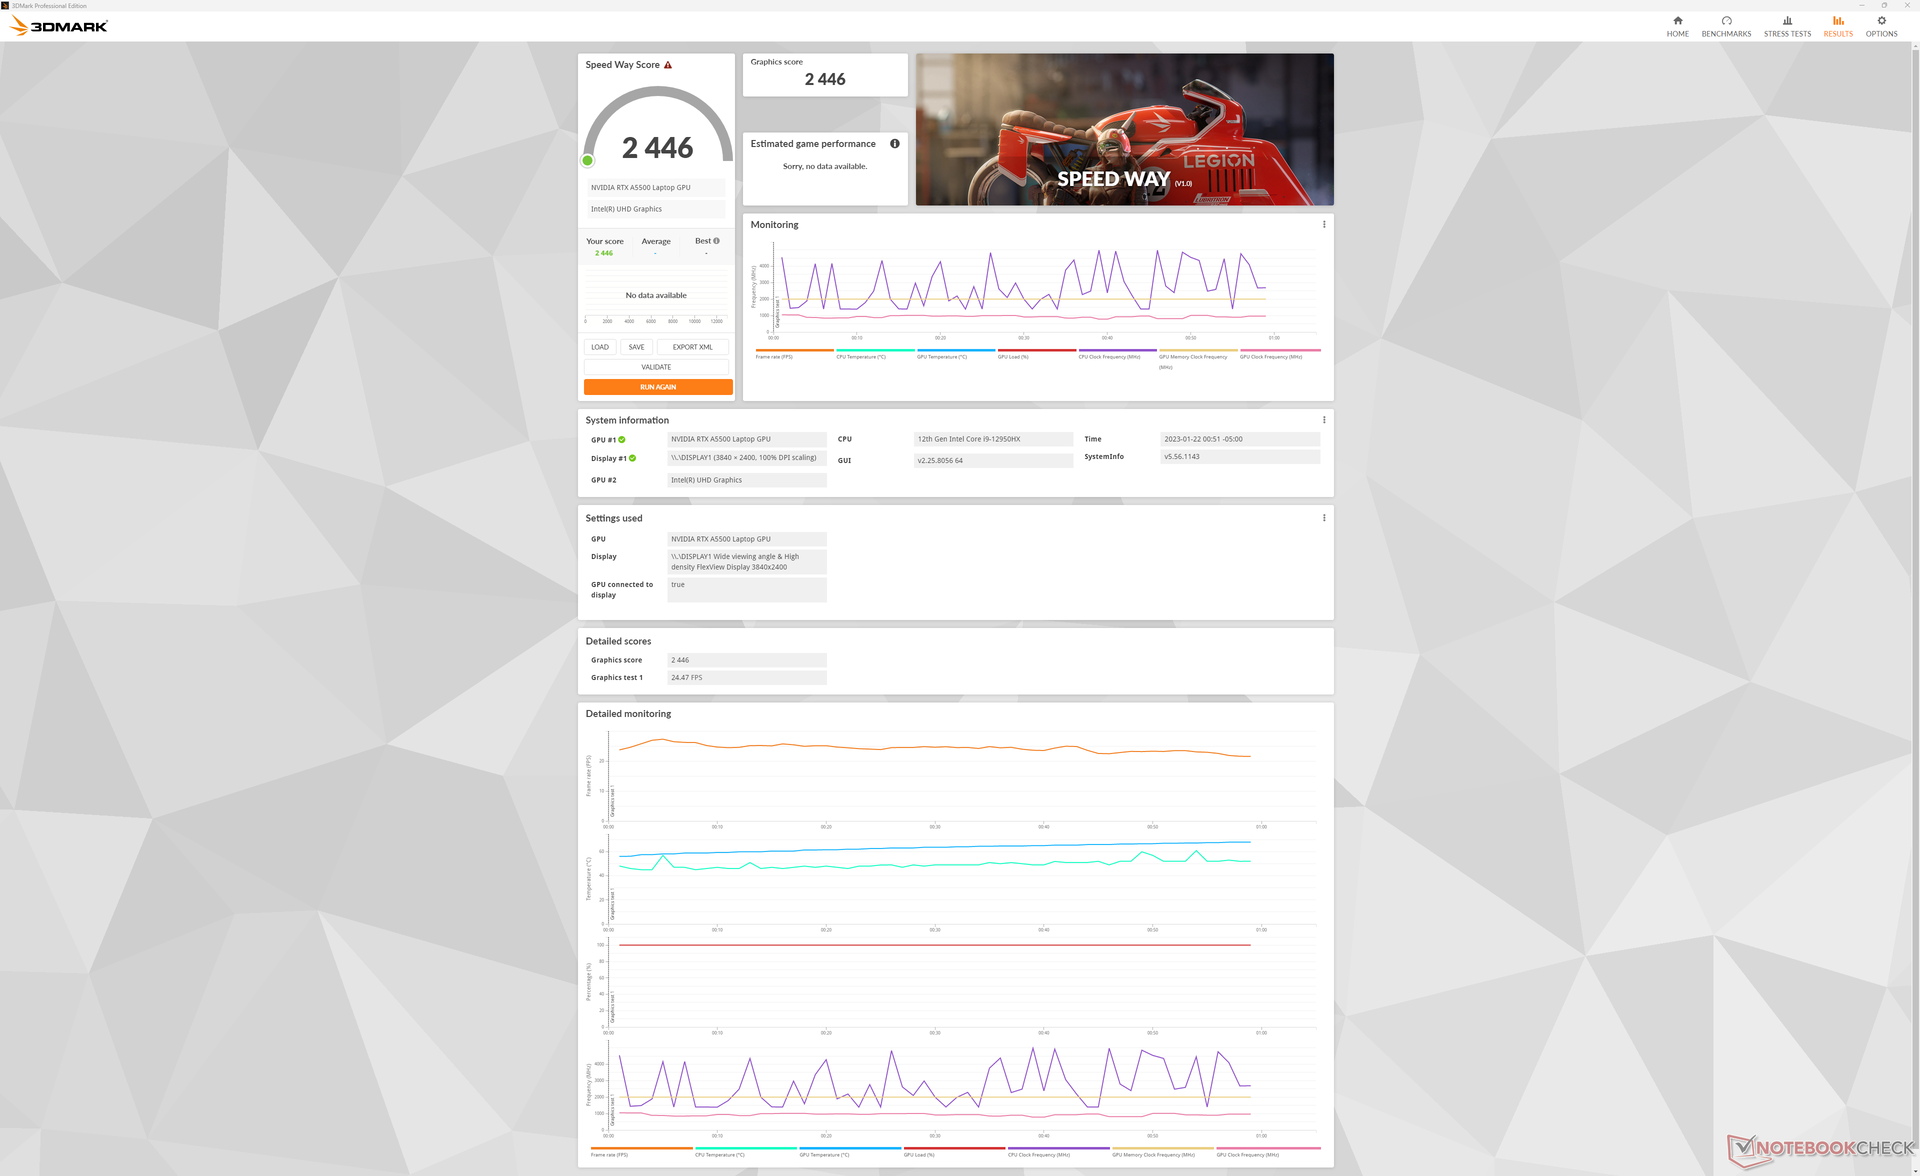
GPU-prestaties
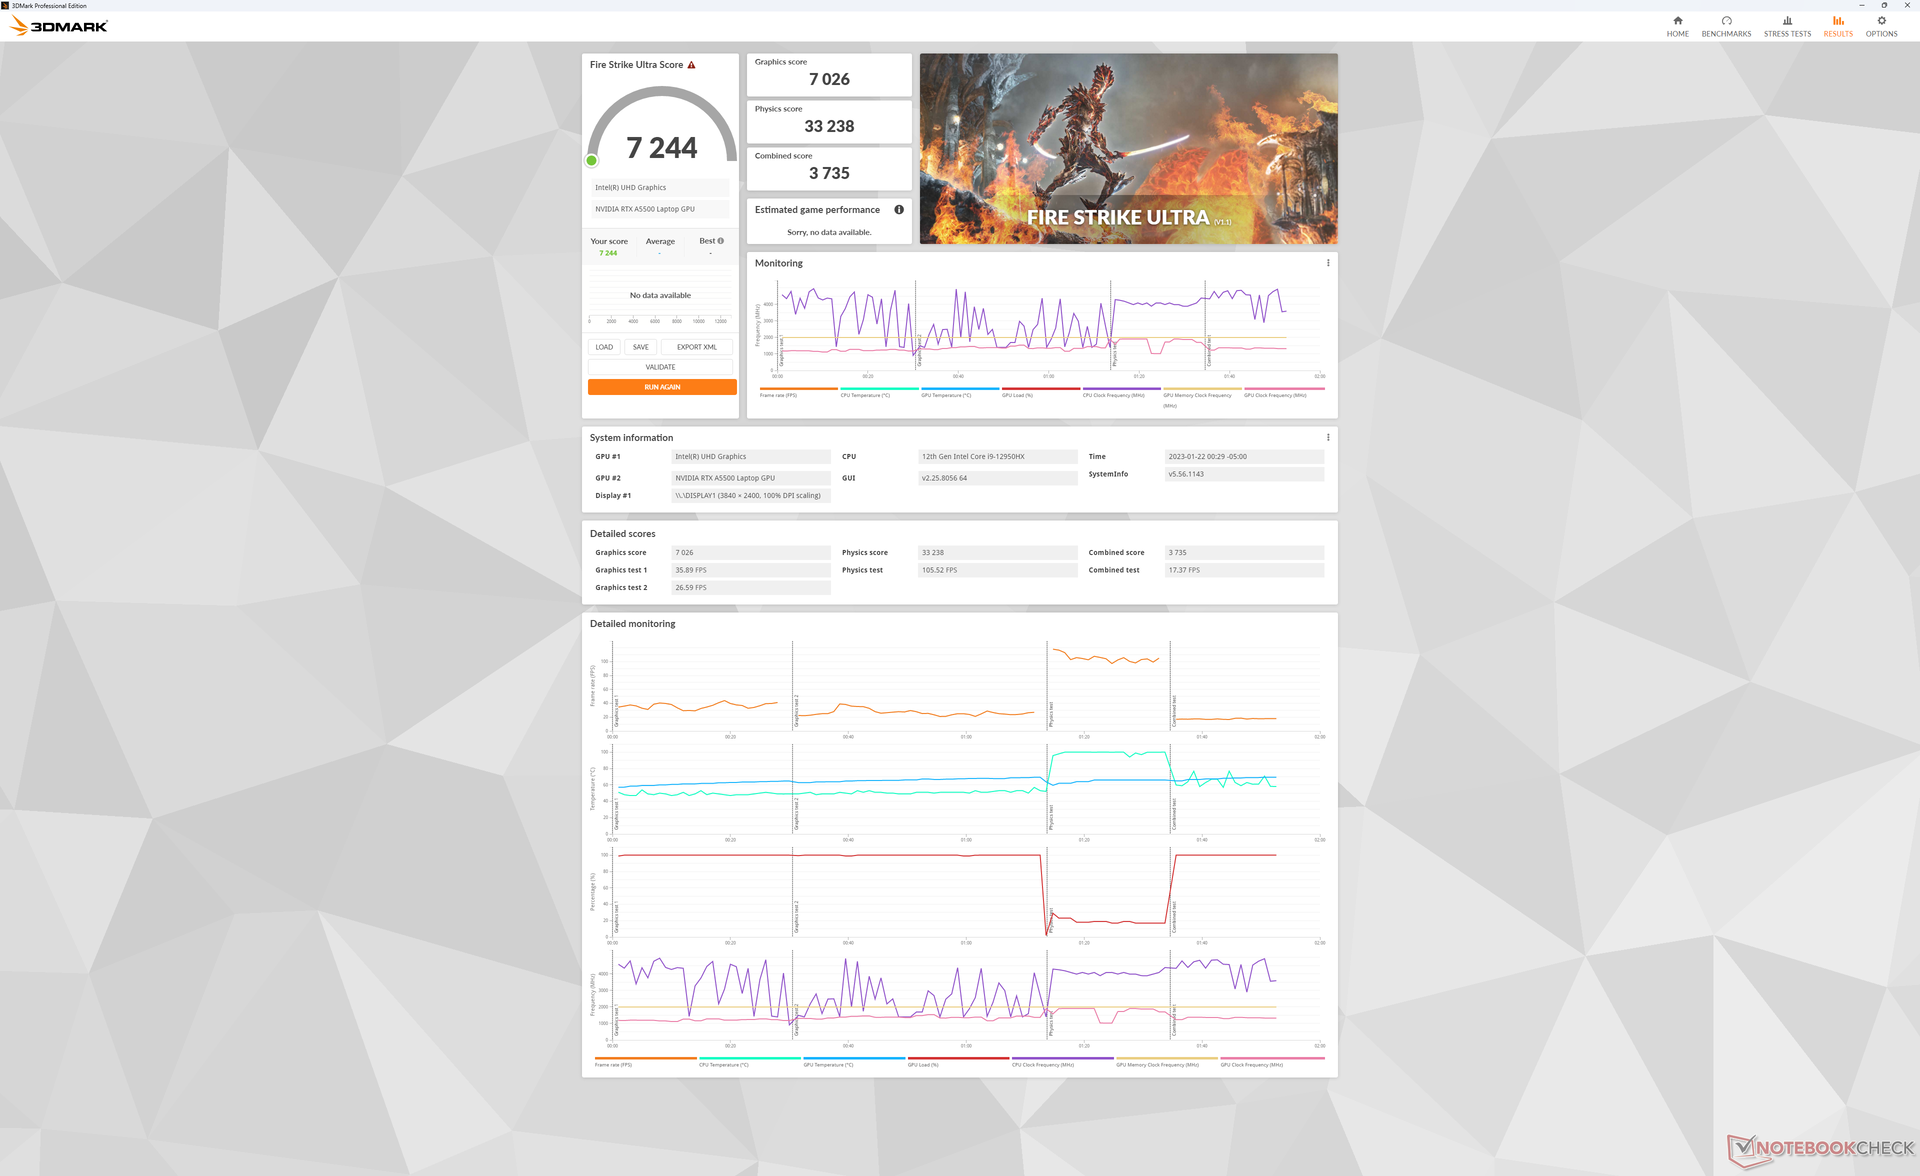
De RTX A5500 in onze Lenovo presteert ruwweg 10 procent sneller dan dezelfde GPU in de concurrerende Precision 7670. Dit ondanks het feit dat de GPU in de Dell volgens het Nvidia-controlepaneel is berekend op 135 W TGP tegenover de 130 W TGP in onze Lenovo. In het lagere segment RTX A2000 SKU vermindert de grafische prestaties met maar liefst 50 tot 65 procent.
| 3DMark Performance rating - Percent | |
| Lenovo Legion 7 16IAX7-82TD004SGE -34! | |
| Lenovo ThinkPad P16 G1 RTX A5500 | |
| Dell Precision 7000 7670 Performance -1! | |
| Gemiddeld NVIDIA RTX A5500 Laptop GPU | |
| Asus ProArt StudioBook 16 W7600H5A-2BL2 -19! | |
| MSI WE76 11UM-456 -9! | |
| HP ZBook Fury 15 G8 -1! | |
| MSI CreatorPro Z16P B12UKST -17! | |
| HP ZBook Studio 15 G8 -17! | |
| HP ZBook Studio G7 -17! | |
| HP ZBook Studio 16 G9 62U04EA -9! | |
| Dell Precision 5000 5470 -9! | |
| Lenovo ThinkPad P16 G1 21D6001DMB -17! | |
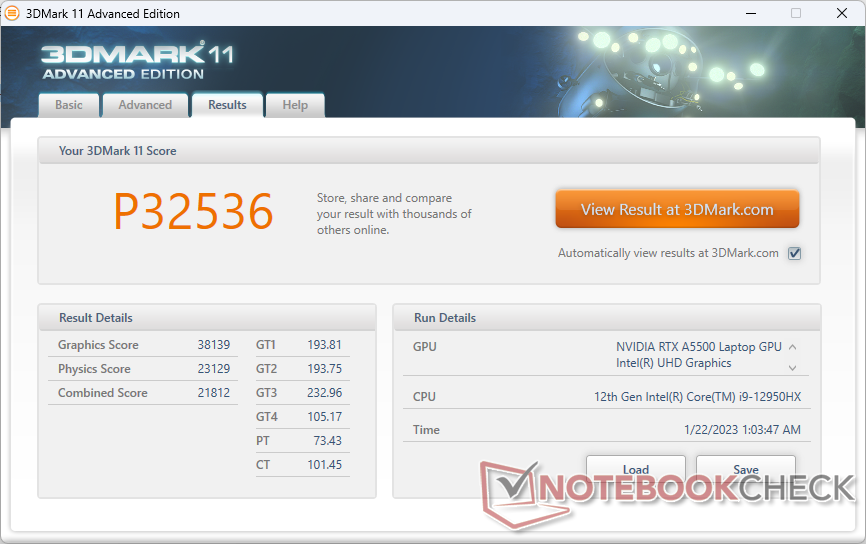
| 3DMark 11 Performance | 32536 punten | |
| 3DMark Cloud Gate Standard Score | 54323 punten | |
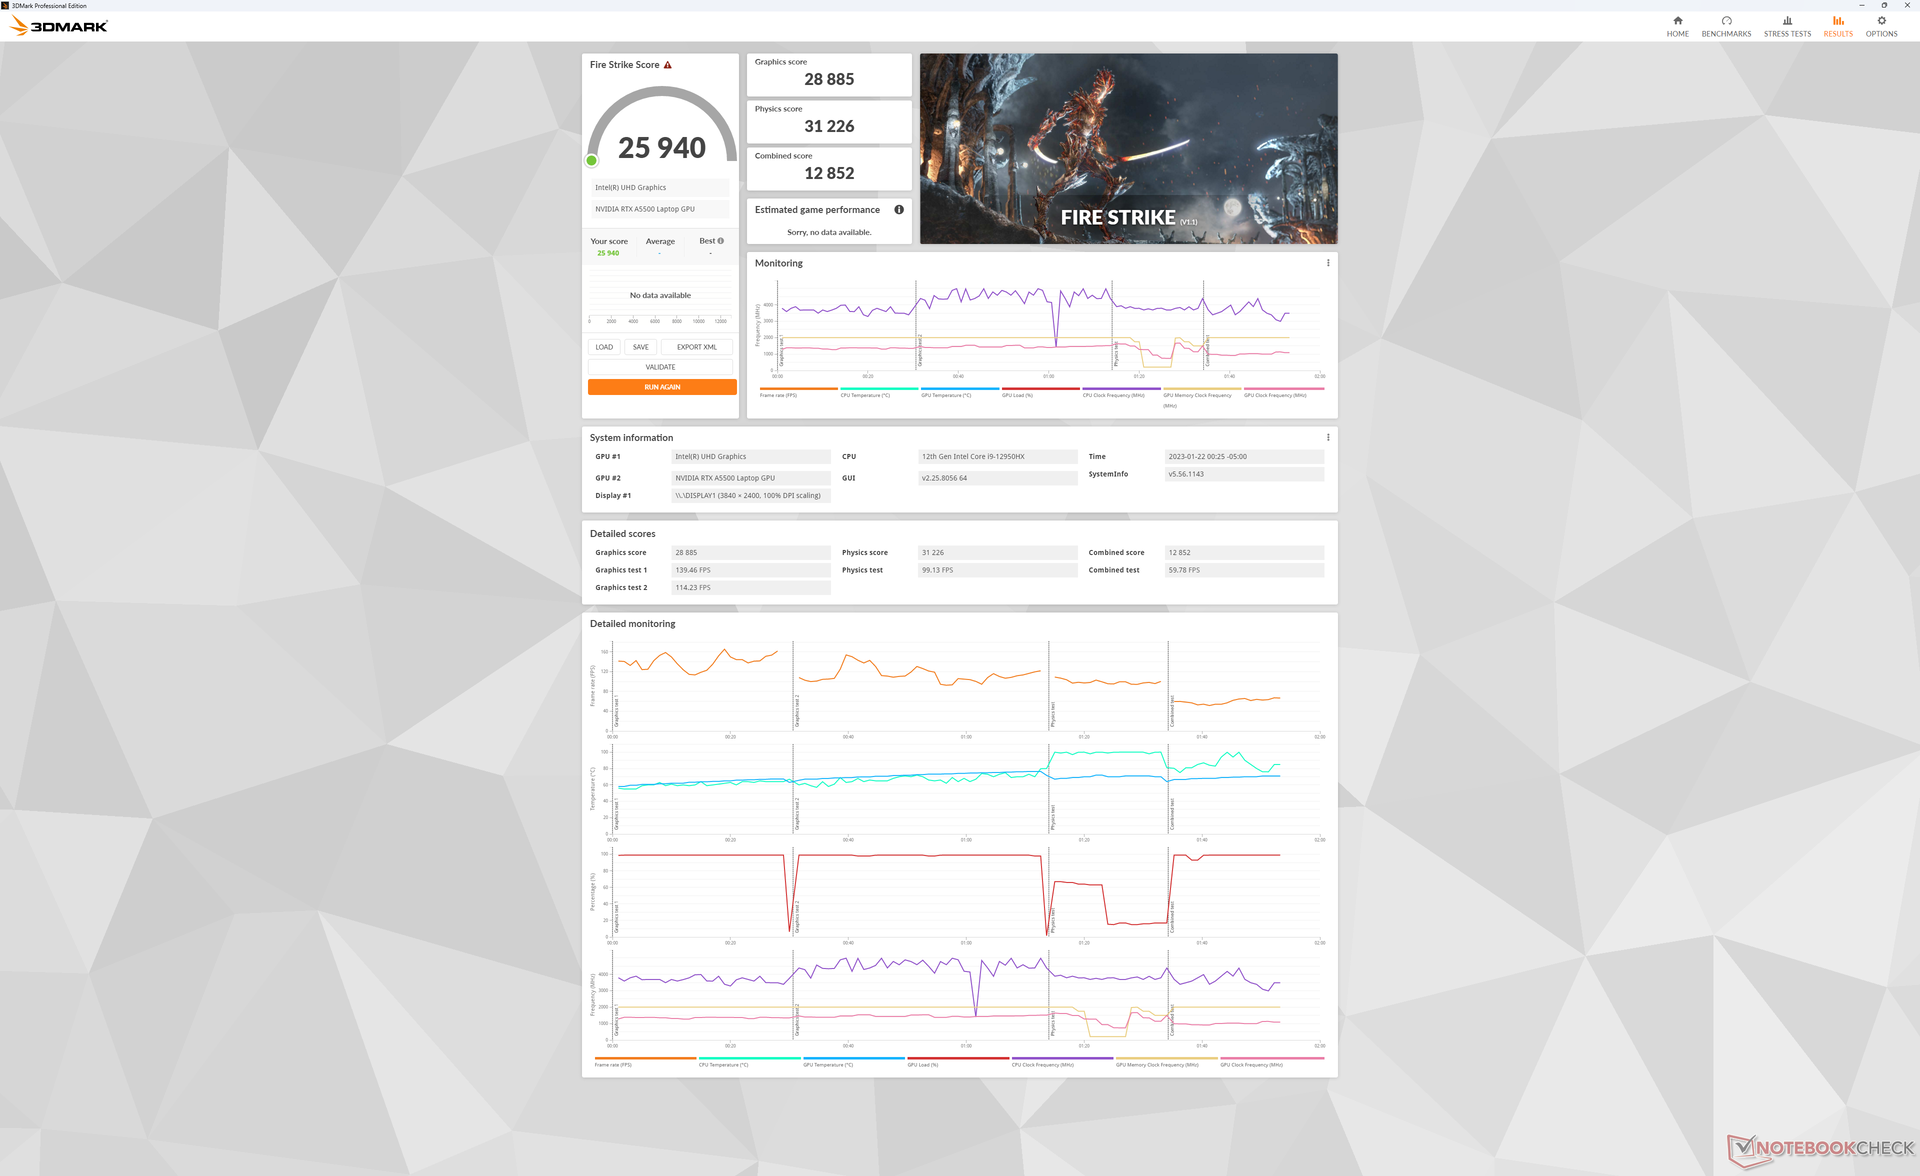
| 3DMark Fire Strike Score | 25940 punten | |
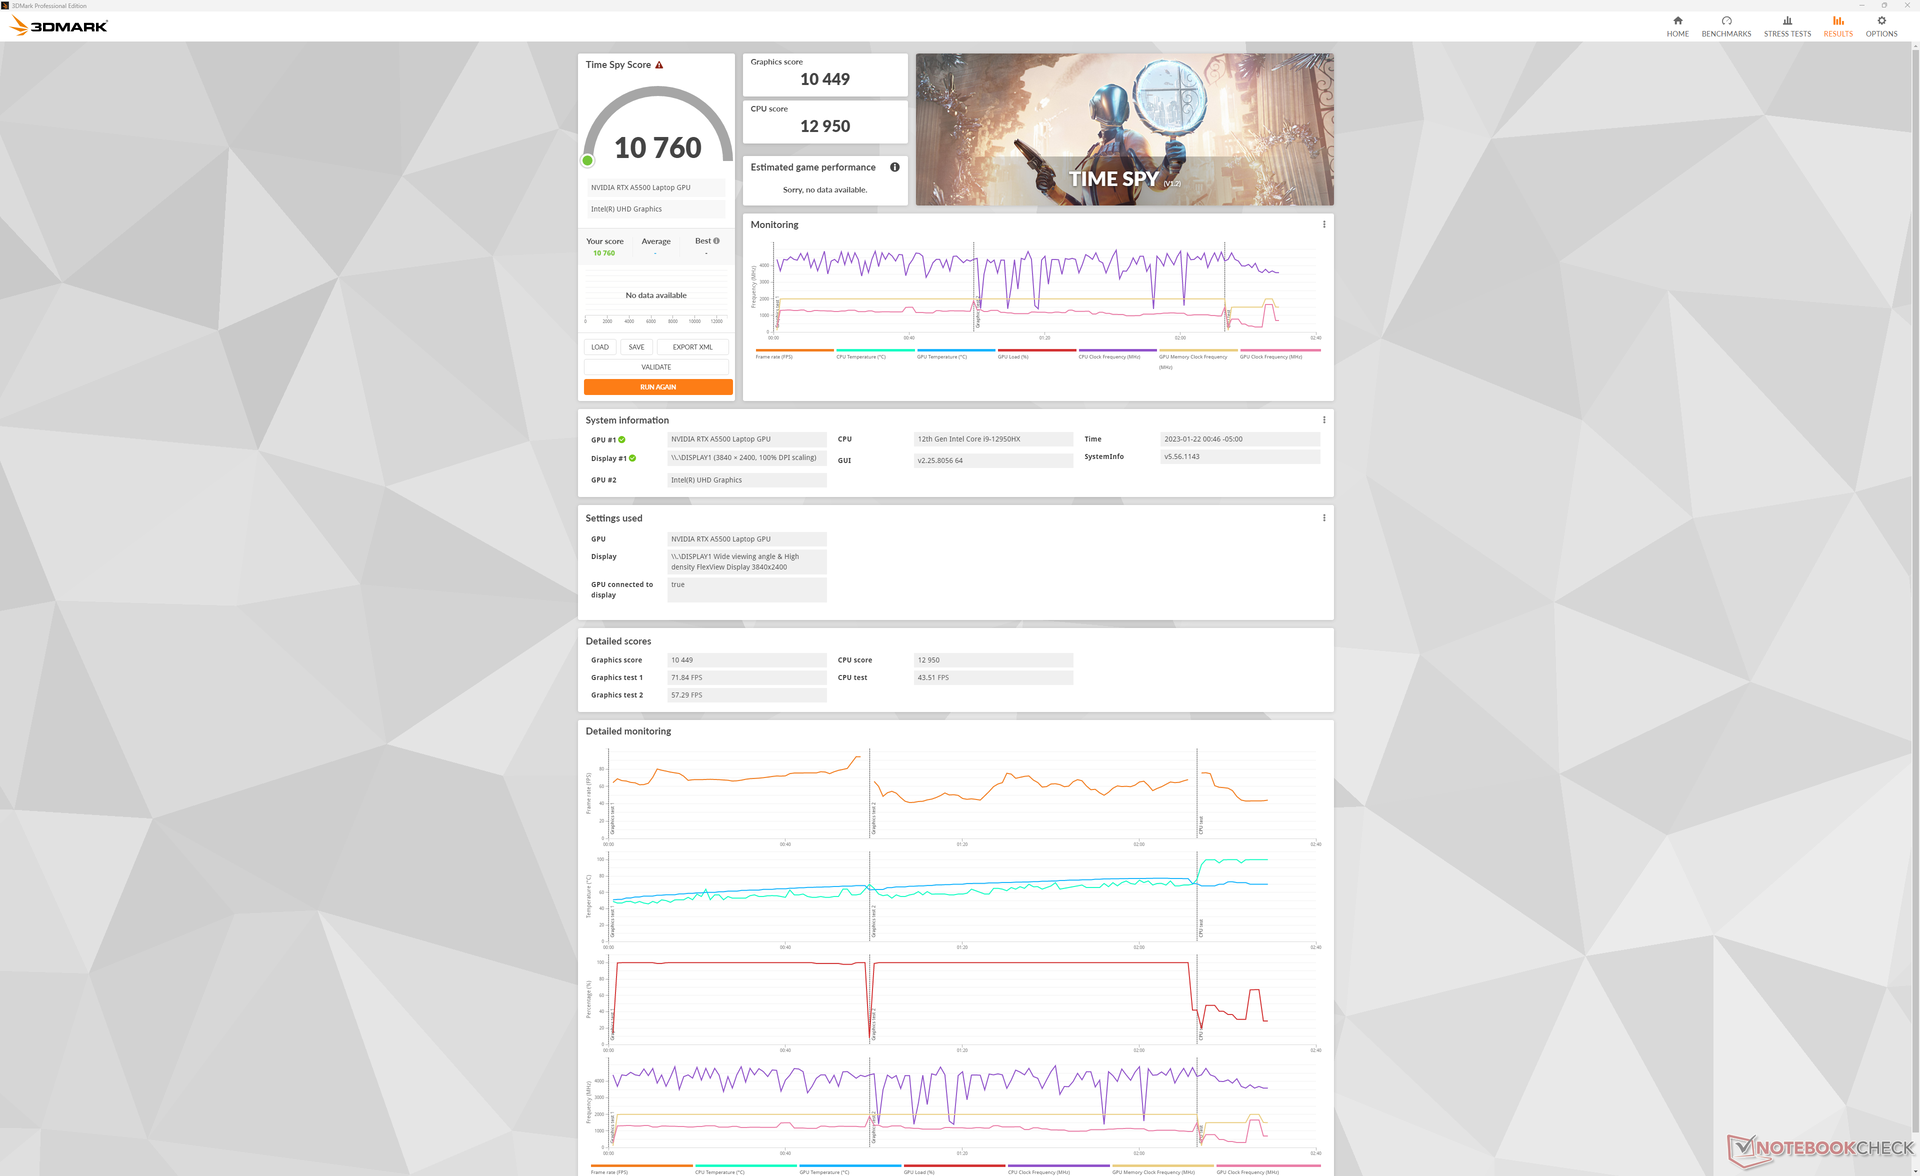
| 3DMark Time Spy Score | 10760 punten | |
Help | ||
* ... kleiner is beter
Witcher 3 FPS Chart
| lage | gem. | hoge | ultra | QHD | 4K | |
|---|---|---|---|---|---|---|
| GTA V (2015) | 185.9 | 183.4 | 177.7 | 124.4 | 103.5 | |
| The Witcher 3 (2015) | 489.4 | 329.9 | 211.8 | 110.4 | 63.7 | |
| Dota 2 Reborn (2015) | 194.3 | 174.5 | 166.1 | 156.3 | 132.8 | |
| Final Fantasy XV Benchmark (2018) | 212 | 142.5 | 113.1 | 83.5 | 45.4 | |
| X-Plane 11.11 (2018) | 155.8 | 137.6 | 108.8 | 93.7 | ||
| Strange Brigade (2018) | 442 | 264 | 223 | 197.7 | 138.6 | |
| Cyberpunk 2077 1.6 (2022) | 132.3 | 117.7 | 96.1 | 80.7 | 47 | 20.4 |
Emissies
Systeemgeluid
In de standaard Balanced mode bleven de ventilatoren langer stil dan verwacht, ondanks de krachtige processoren. Bij het draaien van 3DMark 06, bijvoorbeeld, bereikte de neus van de ventilator een piek van slechts 28 dB(A) aan het einde van de eerste benchmarkscène. Het zou meerdere runs duren voordat de ventilatoren zouden pulseren naar luidere RPMs tot 40 dB(A).
Het ventilatorgeluid bij meer veeleisende belastingen in de Performance-modus piekt op iets meer dan 50 dB(A) en is daarmee merkbaar luider dan dat van concurrerende werkstations, waaronder de Precision 7670, zoals de onderstaande tabel laat zien. Natuurlijk zijn deze alternatieven ook langzamer dan onze Lenovo-configuratie.
Geluidsniveau
| Onbelast |
| 23.1 / 23.1 / 23.1 dB (A) |
| Belasting |
| 28.9 / 51.4 dB (A) |
 | ||
30 dB stil 40 dB(A) hoorbaar 50 dB(A) luid |
||
min: | ||
| Lenovo ThinkPad P16 G1 RTX A5500 RTX A5500 Laptop GPU, i9-12950HX, WDC PC SN810 2TB | Asus ProArt StudioBook 16 W7600H5A-2BL2 RTX A5000 Laptop GPU, W-11955M, 2x Micron 2300 2TB MTFDHBA2T0TDV (RAID 0) | Dell Precision 7000 7670 Performance RTX A5500 Laptop GPU, i9-12950HX | Lenovo ThinkPad P16 G1 21D6001DMB RTX A2000 Laptop GPU, i7-12850HX, Micron 3400 1TB MTFDKBA1T0TFH | MSI CreatorPro Z16P B12UKST RTX A3000 Laptop GPU, i7-12700H, Samsung PM9A1 MZVL21T0HCLR | HP ZBook Studio 16 G9 62U04EA RTX A2000 Laptop GPU, i7-12800H, Micron 3400 1TB MTFDKBA1T0TFH | |
|---|---|---|---|---|---|---|
| Noise | -14% | -16% | -6% | -11% | -9% | |
| uit / omgeving * (dB) | 23.1 | 26 -13% | 23.9 -3% | 23.2 -0% | 24.1 -4% | 24 -4% |
| Idle Minimum * (dB) | 23.1 | 26 -13% | 24 -4% | 23.2 -0% | 27.1 -17% | 24 -4% |
| Idle Average * (dB) | 23.1 | 26 -13% | 24 -4% | 23.2 -0% | 27.1 -17% | 27.7 -20% |
| Idle Maximum * (dB) | 23.1 | 26.5 -15% | 38 -65% | 23.2 -0% | 27.1 -17% | 27.7 -20% |
| Load Average * (dB) | 28.9 | 42 -45% | 46.3 -60% | 47.8 -65% | 42.9 -48% | 39.8 -38% |
| Witcher 3 ultra * (dB) | 51.6 | 41.9 19% | 34.1 34% | 44 15% | 44.3 14% | |
| Load Maximum * (dB) | 51.4 | 43 16% | 47.9 7% | 56.3 -10% | 47 9% | 47.7 7% |
* ... kleiner is beter
Temperatuur
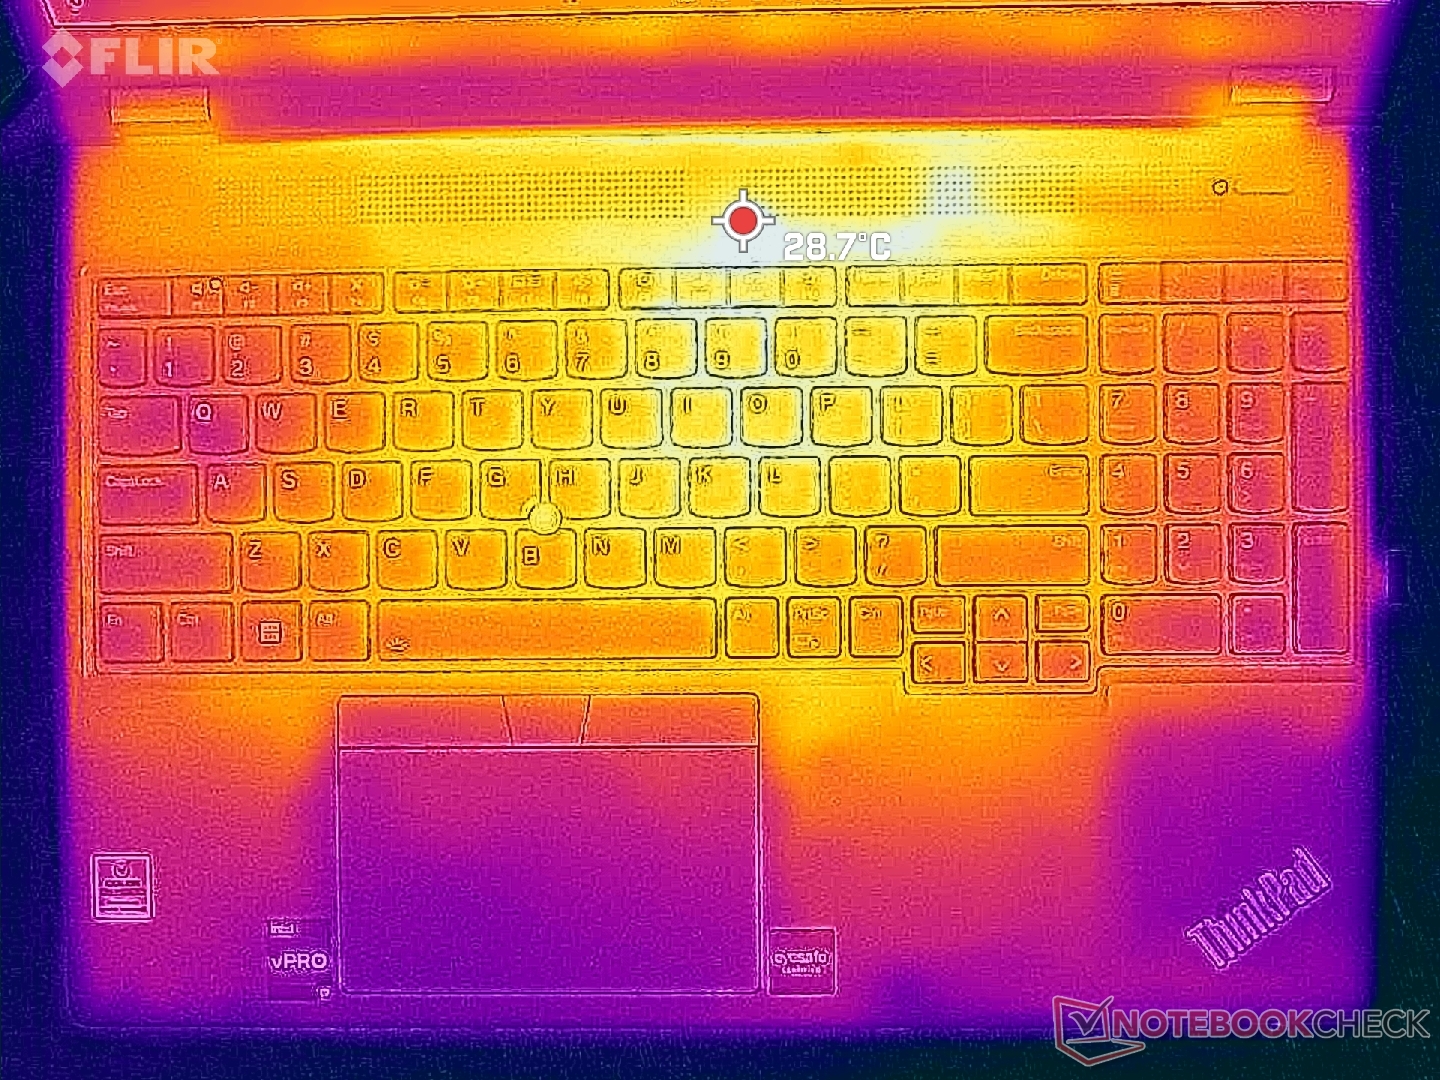
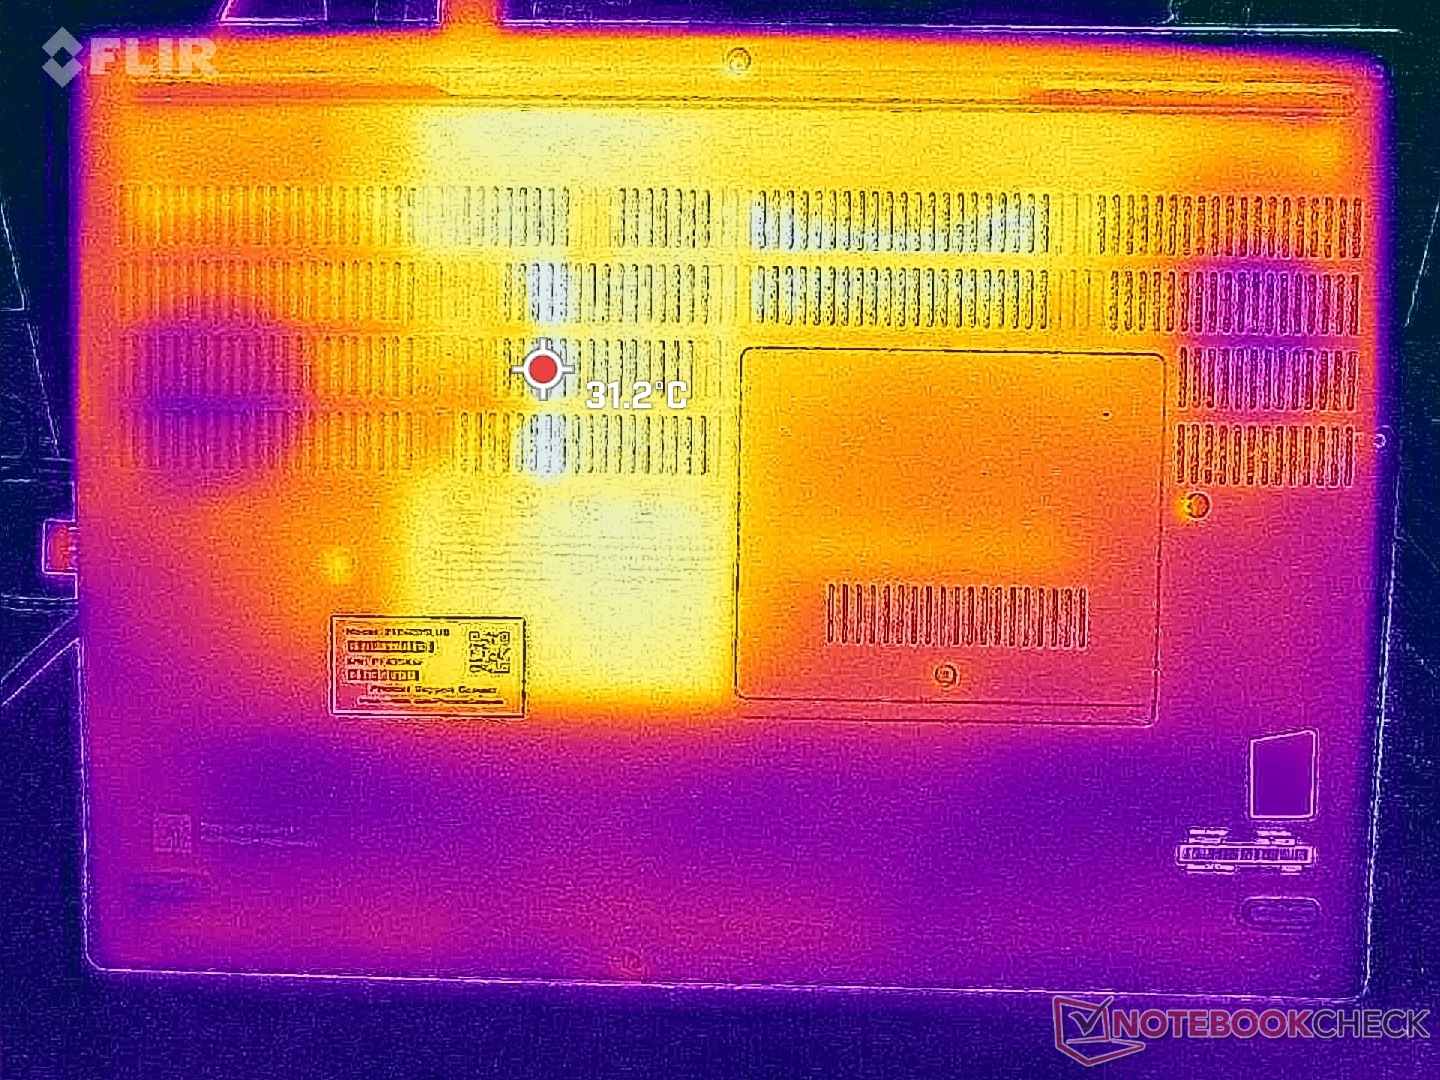
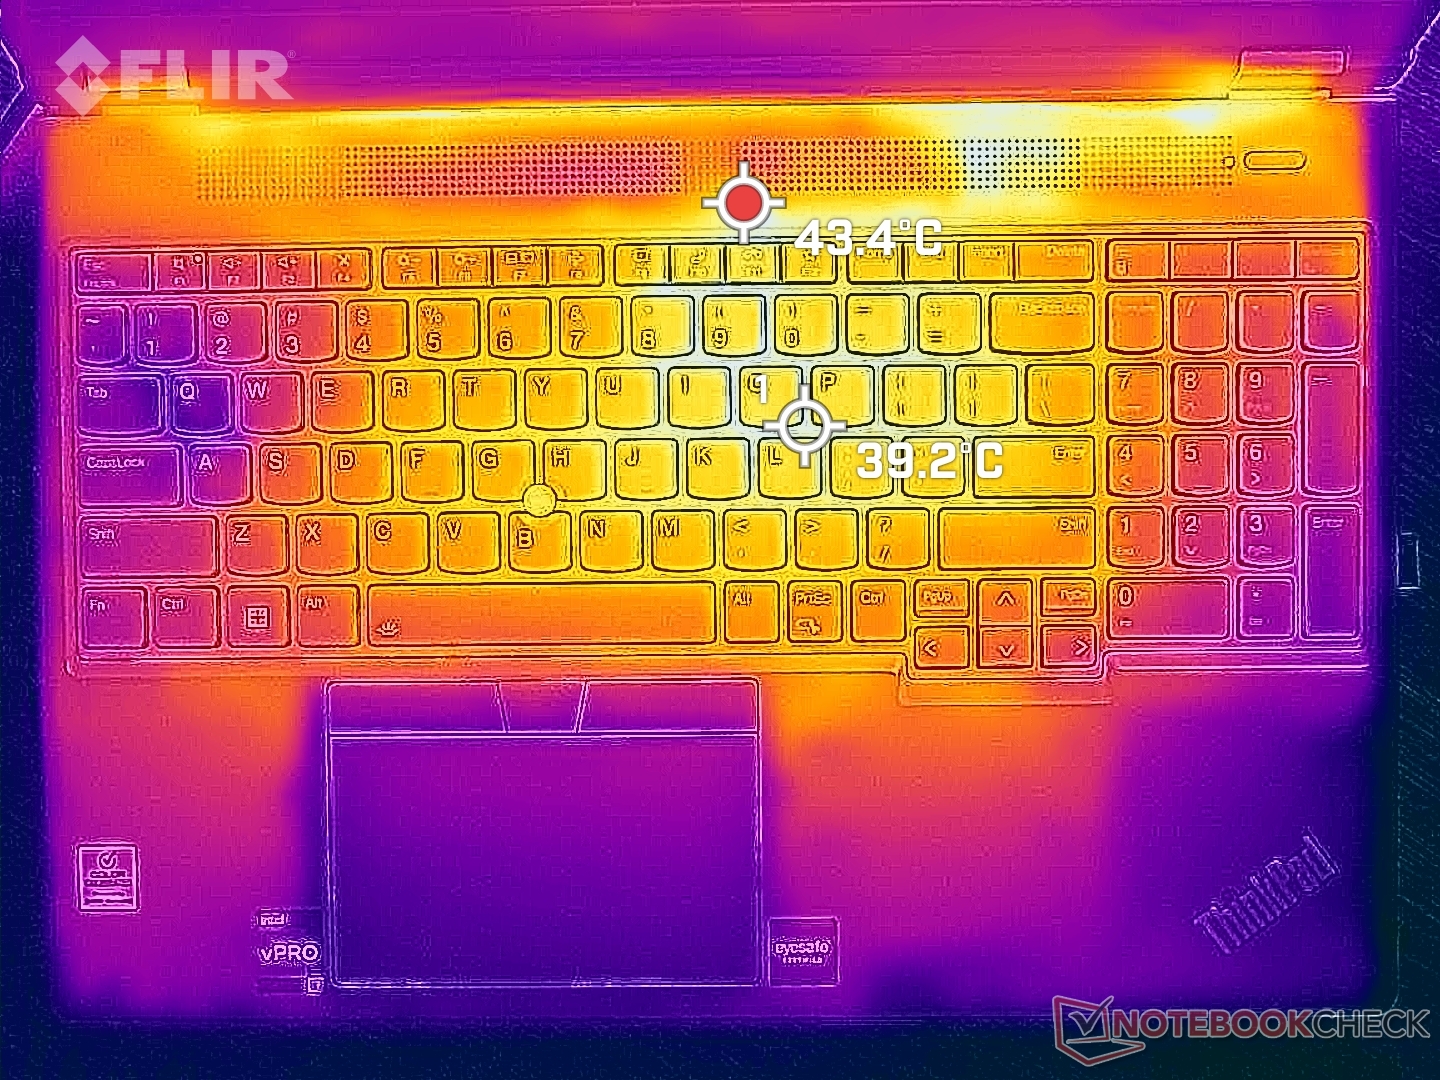
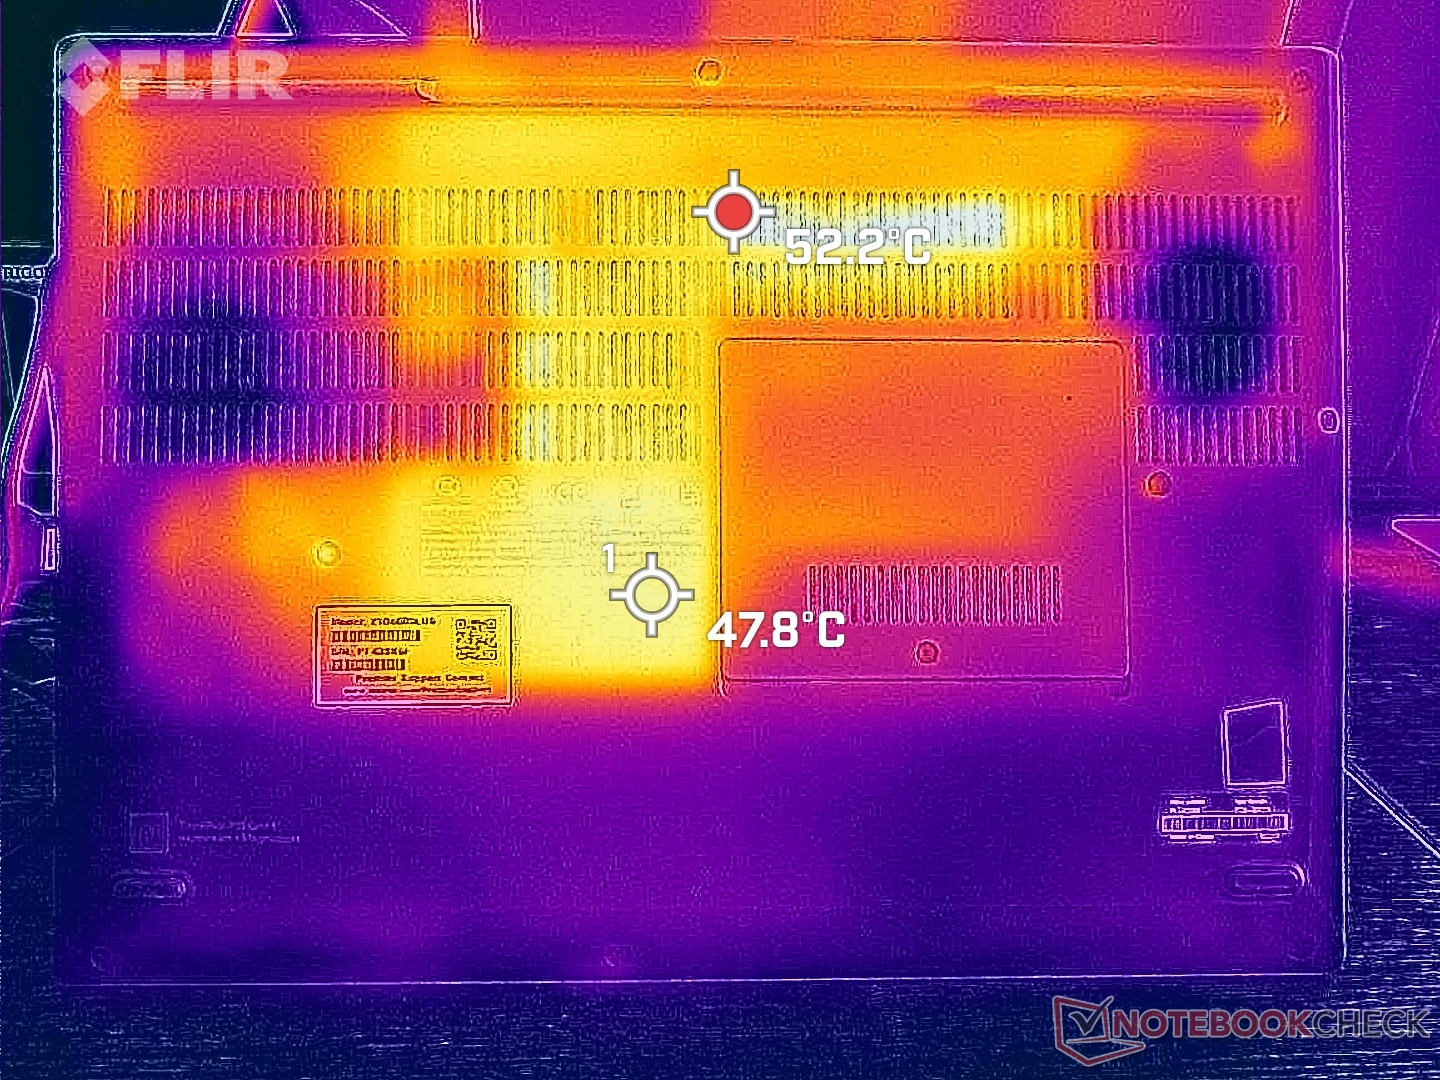
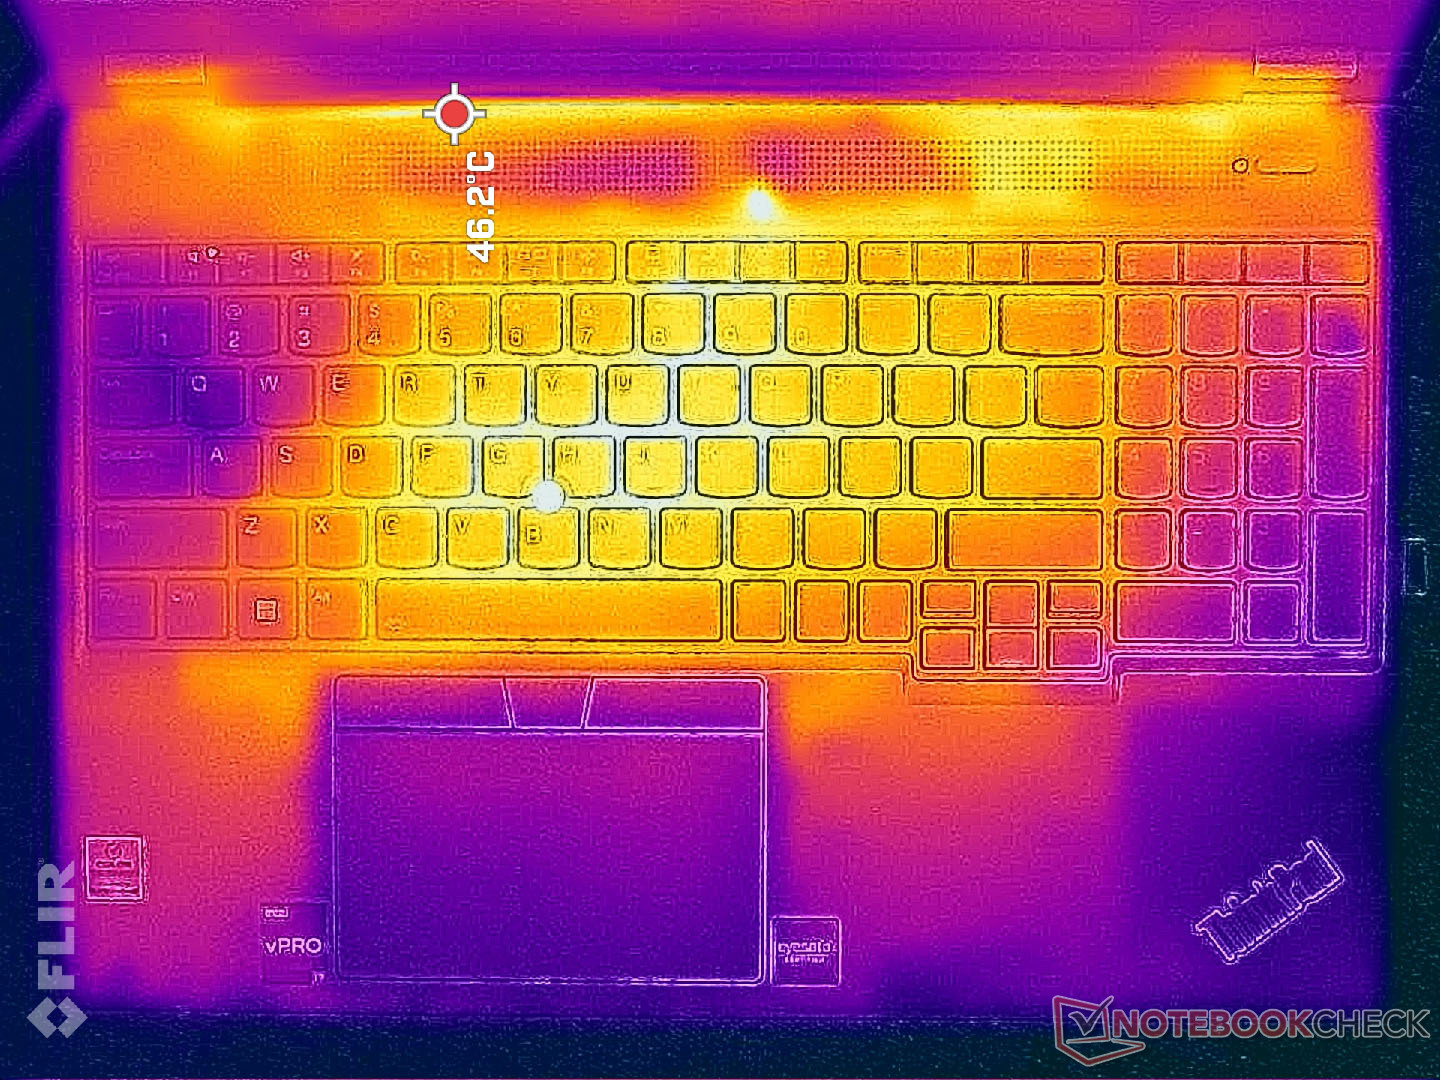
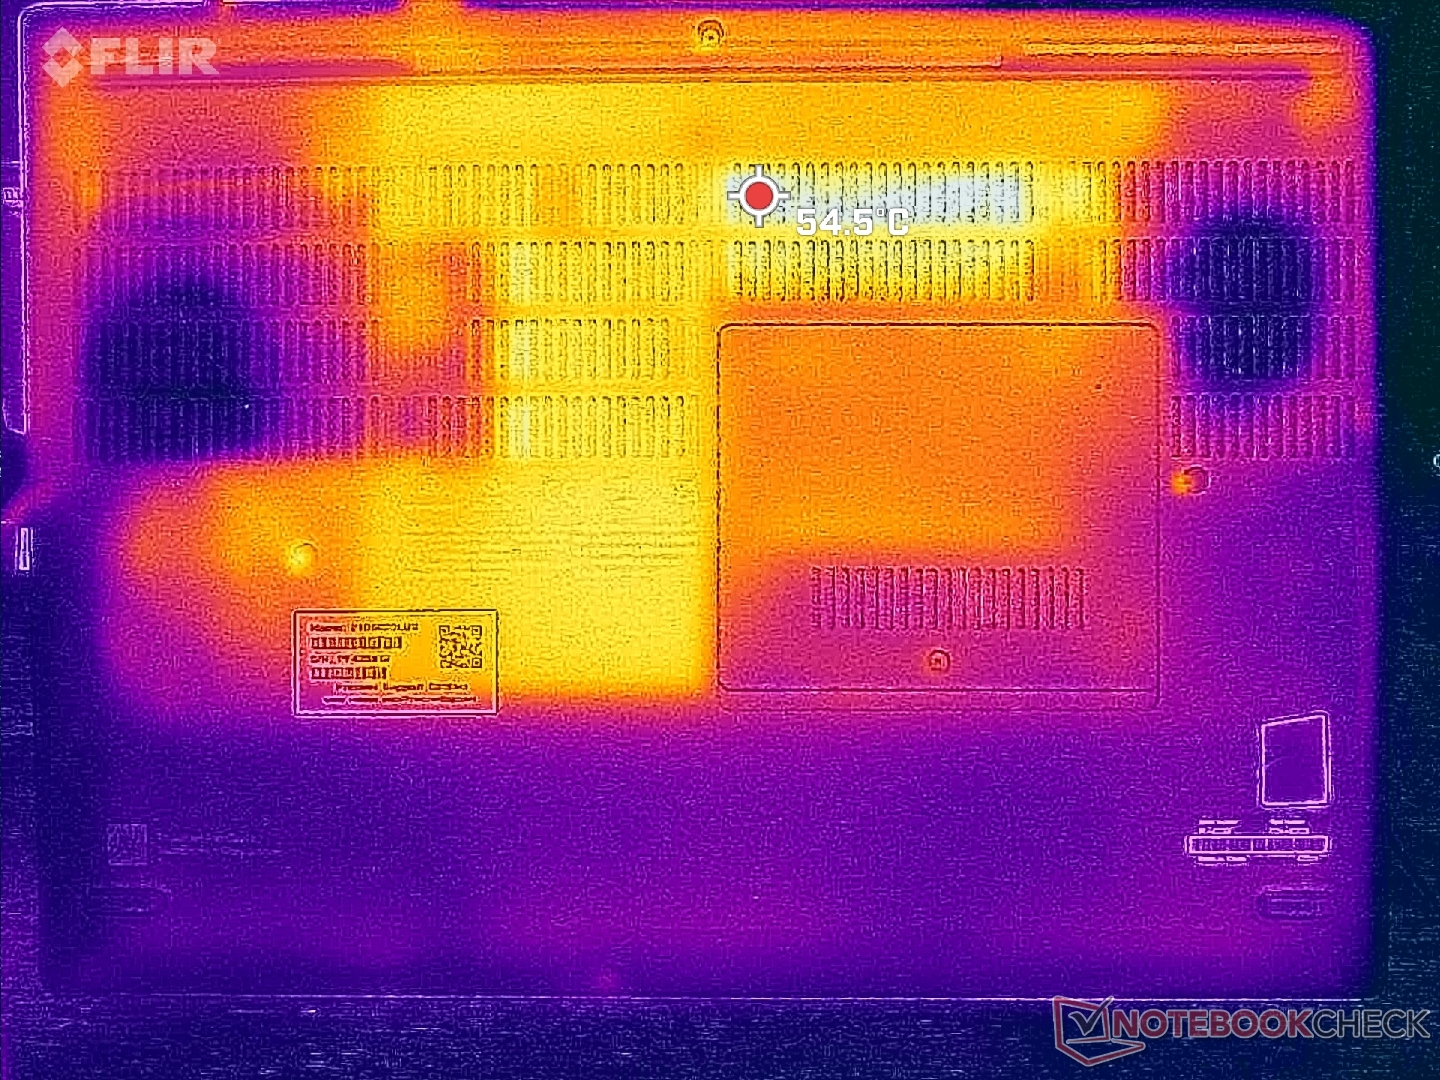
De oppervlaktetemperaturen zijn warmer dan verwacht, zelfs bij stationair draaien op de desktop zonder lopende toepassingen. De onderkant kan bijvoorbeeld wel 37 C warm worden, vergeleken met slechts 31 C op de Precision 7670. Bij hogere belasting kunnen deze zelfde warme plekken op de Lenovo 49 C of warmer bereiken, terwijl het midden van het toetsenbord 40 C kan bereiken. De huidtemperatuur kan oncomfortabel aanvoelen als de laptop op schoot ligt in plaats van op een tafel.
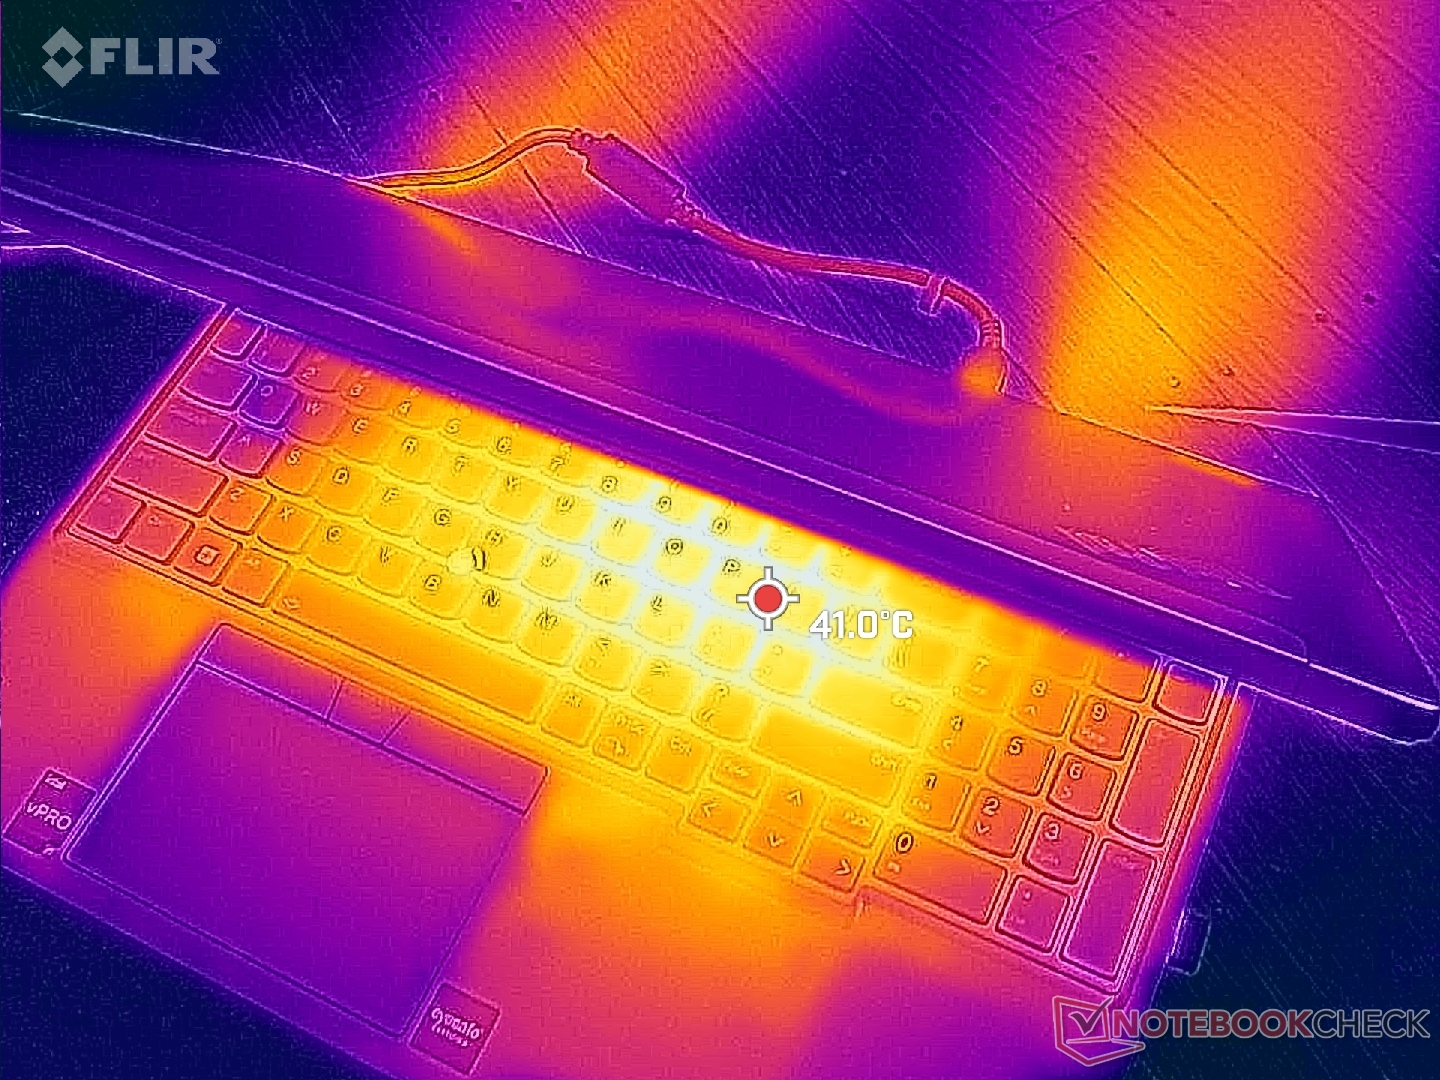
(±) De maximumtemperatuur aan de bovenzijde bedraagt 44.8 °C / 113 F, vergeleken met het gemiddelde van 38.2 °C / 101 F, variërend van 22.2 tot 69.8 °C voor de klasse Workstation.
(-) De bodem warmt op tot een maximum van 49.8 °C / 122 F, vergeleken met een gemiddelde van 41.1 °C / 106 F
(+) Bij onbelast gebruik bedraagt de gemiddelde temperatuur voor de bovenzijde 28.6 °C / 83 F, vergeleken met het apparaatgemiddelde van 32 °C / 90 F.
(±) Bij het spelen van The Witcher 3 is de gemiddelde temperatuur voor de bovenzijde 36.4 °C / 98 F, vergeleken met het apparaatgemiddelde van 32 °C / 90 F.
(+) De handpalmsteunen en het touchpad bereiken maximaal de huidtemperatuur (32.4 °C / 90.3 F) en zijn dus niet heet.
(-) De gemiddelde temperatuur van de handpalmsteun van soortgelijke toestellen bedroeg 27.8 °C / 82 F (-4.6 °C / -8.3 F).
| Lenovo ThinkPad P16 G1 RTX A5500 Intel Core i9-12950HX, NVIDIA RTX A5500 Laptop GPU | Asus ProArt StudioBook 16 W7600H5A-2BL2 Intel Xeon W-11955M, NVIDIA RTX A5000 Laptop GPU | Dell Precision 7000 7670 Performance Intel Core i9-12950HX, NVIDIA RTX A5500 Laptop GPU | Lenovo ThinkPad P16 G1 21D6001DMB Intel Core i7-12850HX, NVIDIA RTX A2000 Laptop GPU | MSI CreatorPro Z16P B12UKST Intel Core i7-12700H, NVIDIA RTX A3000 Laptop GPU | HP ZBook Studio 16 G9 62U04EA Intel Core i7-12800H, NVIDIA RTX A2000 Laptop GPU | |
|---|---|---|---|---|---|---|
| Heat | -1% | -3% | 17% | -3% | 9% | |
| Maximum Upper Side * (°C) | 44.8 | 45.7 -2% | 53 -18% | 43.1 4% | 56.3 -26% | 38.7 14% |
| Maximum Bottom * (°C) | 49.8 | 48.3 3% | 43.2 13% | 39.9 20% | 68.3 -37% | 53.4 -7% |
| Idle Upper Side * (°C) | 30.6 | 35.3 -15% | 36.8 -20% | 26 15% | 25.2 18% | 27.3 11% |
| Idle Bottom * (°C) | 38.6 | 34.4 11% | 33.8 12% | 27.6 28% | 25.9 33% | 31.6 18% |
* ... kleiner is beter
Stresstest
Het systeem wordt zeker belast wanneer de processoren zwaar belast worden. Wanneer bijvoorbeeld Prime95 werd uitgevoerd, steeg de CPU kloksnelheid en het opgenomen vermogen tot respectievelijk 4,1 GHz en 135 W. Helaas liep de kerntemperatuur vrijwel onmiddellijk op tot 100 C. Helaas steeg de kerntemperatuur vrijwel onmiddellijk tot 100 C, zodat de kloksnelheid snel daalde om nog hogere temperaturen te voorkomen. De processor stabiliseerde zich uiteindelijk op 3 GHz, 82 W en 100 C, wat betekent dat hij de grenzen van de ThinkPad P16 G1 koeloplossing opzoekt. Het herhalen van deze test op de Precision 7670 met dezelfde processor zou resulteren in een langzamere stabiele kloksnelheid van 2,3 GHz en een koelere kerntemperatuur van 78 C.
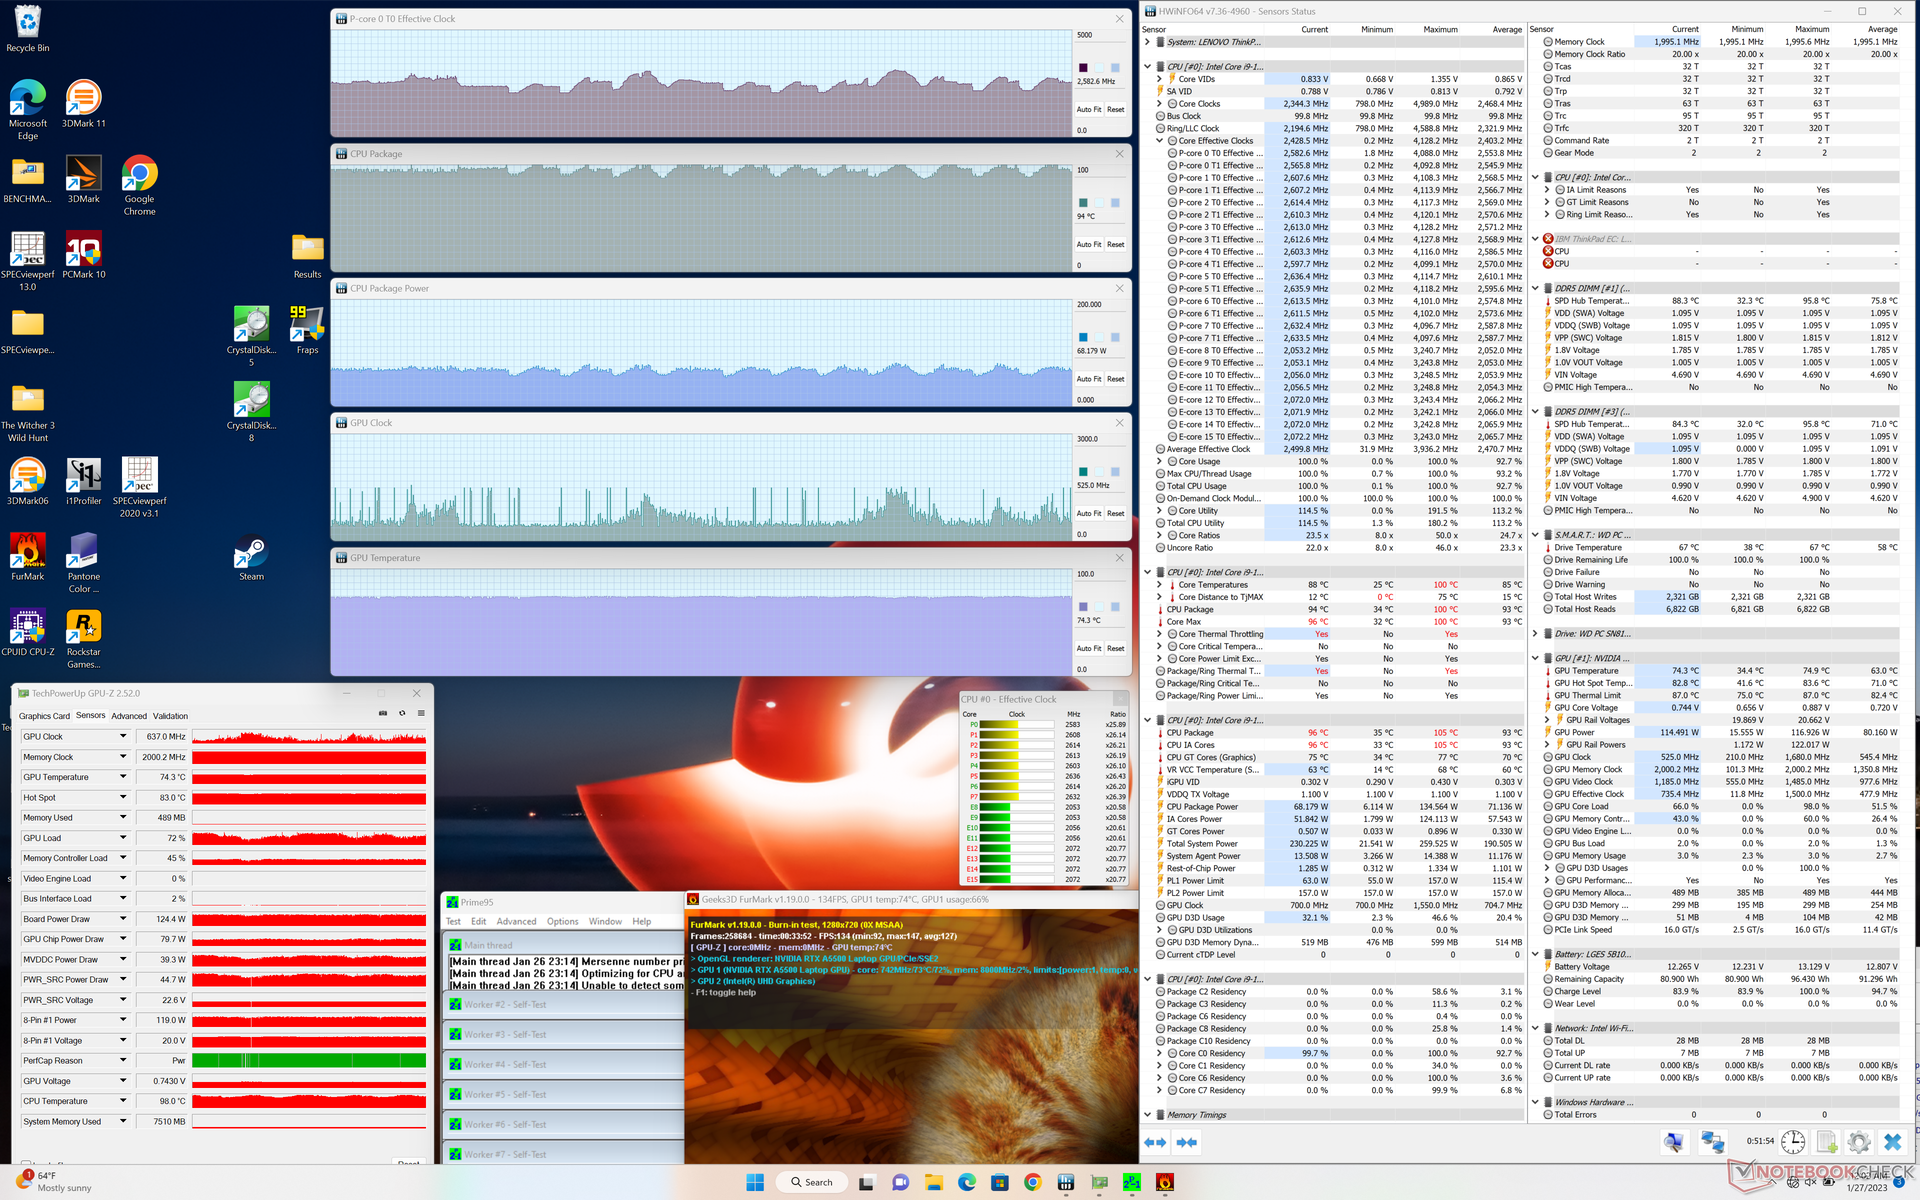
Bij het uitvoeren van Witcher 3 om hoge belastingen weer te geven, zouden de GPU-kloksnelheid, geheugenklok en temperatuur zich stabiliseren op respectievelijk 1477 MHz, 2000 MHz en 78 C, vergeleken met 1417 MHz, 1750 MHz en 82 C op de Precision 7670 onder vergelijkbare omstandigheden. Het stroomverbruik op onze Lenovo zou ook hoger zijn met 129 W, vergeleken met slechts 100 W op de Dell, wat de bovengenoemde prestatievoordelen van de GPU zou verklaren.
Werken op batterijen beperkt de prestaties. Een Fire Strike test op batterijen zou Physics en Graphics scores opleveren van respectievelijk 18903 en 12395 punten, vergeleken met 31226 en 28885 punten op netstroom.
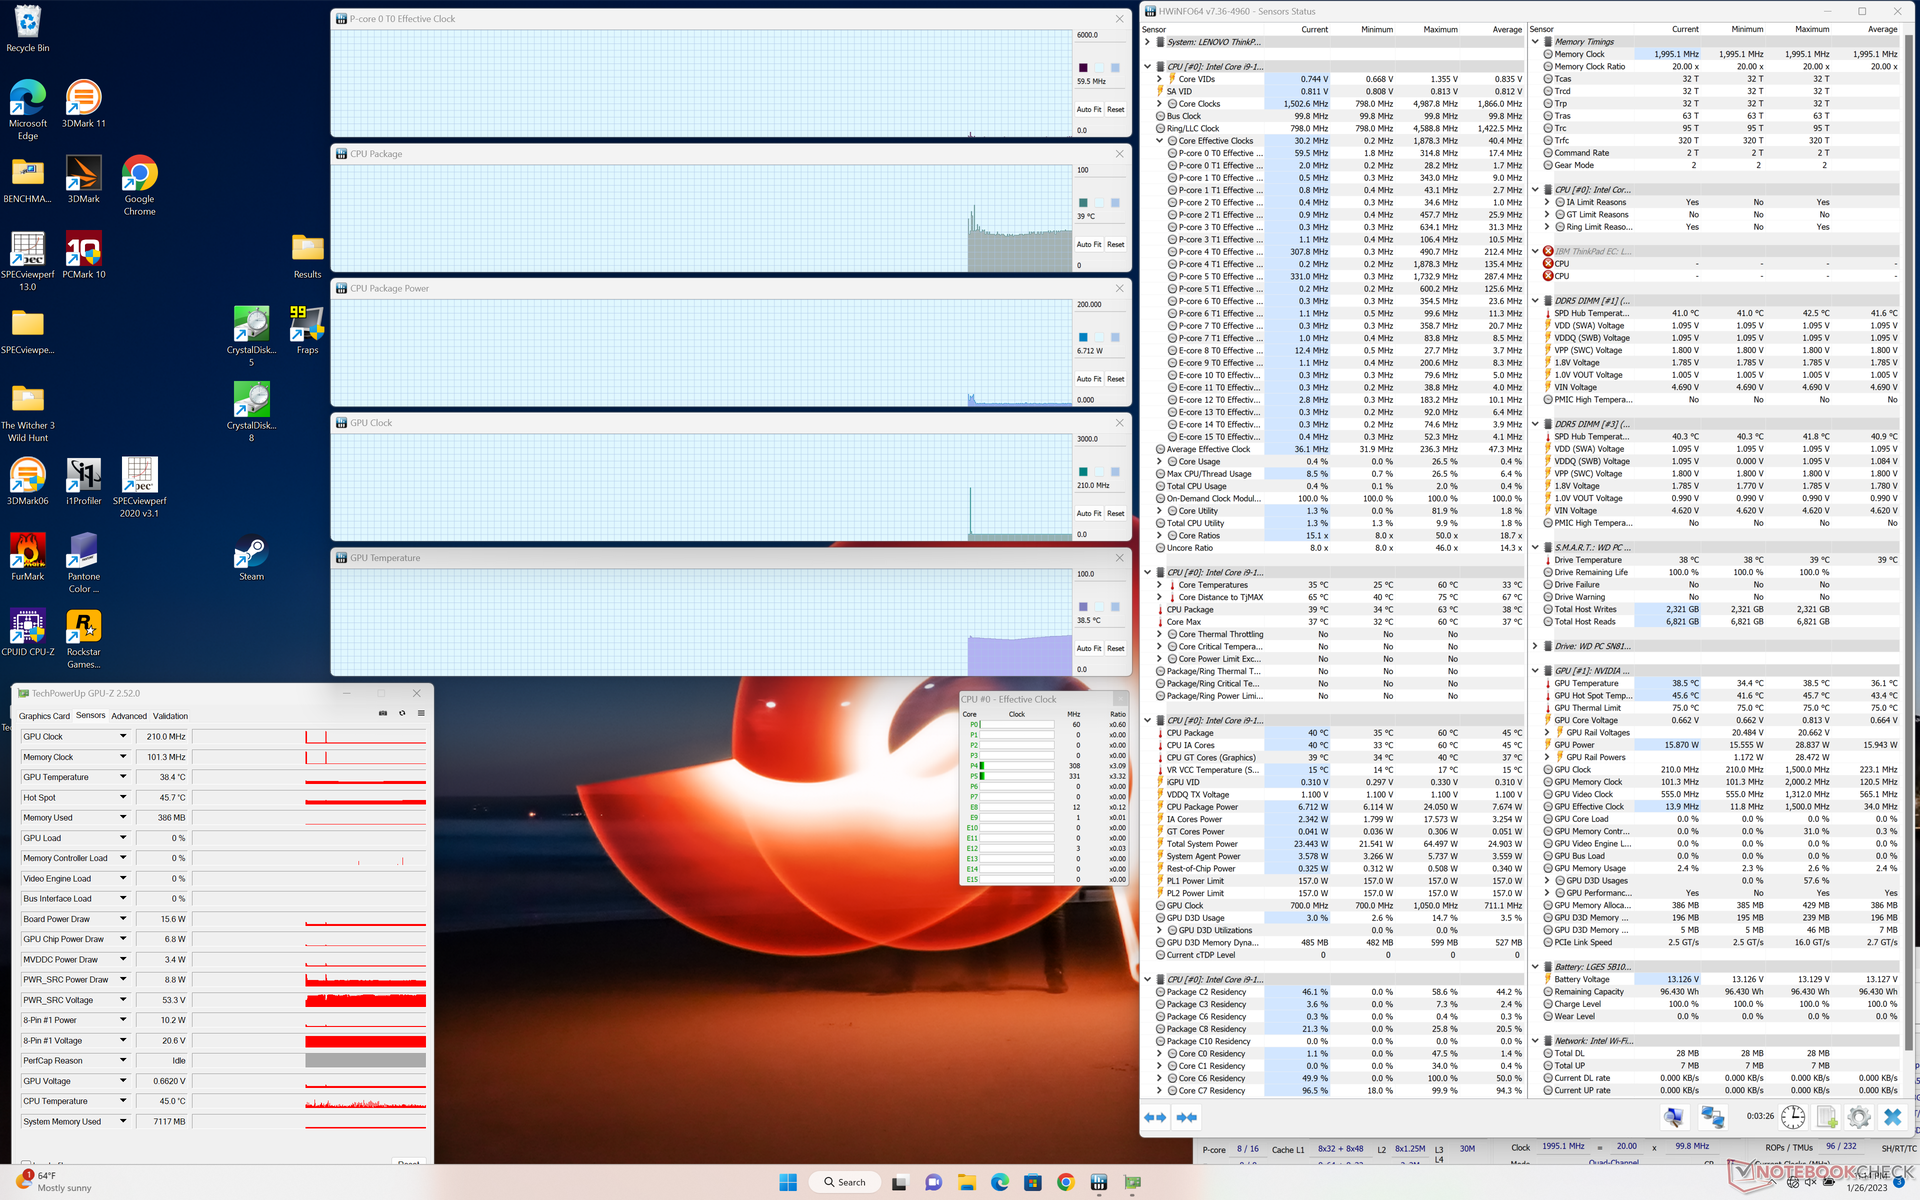
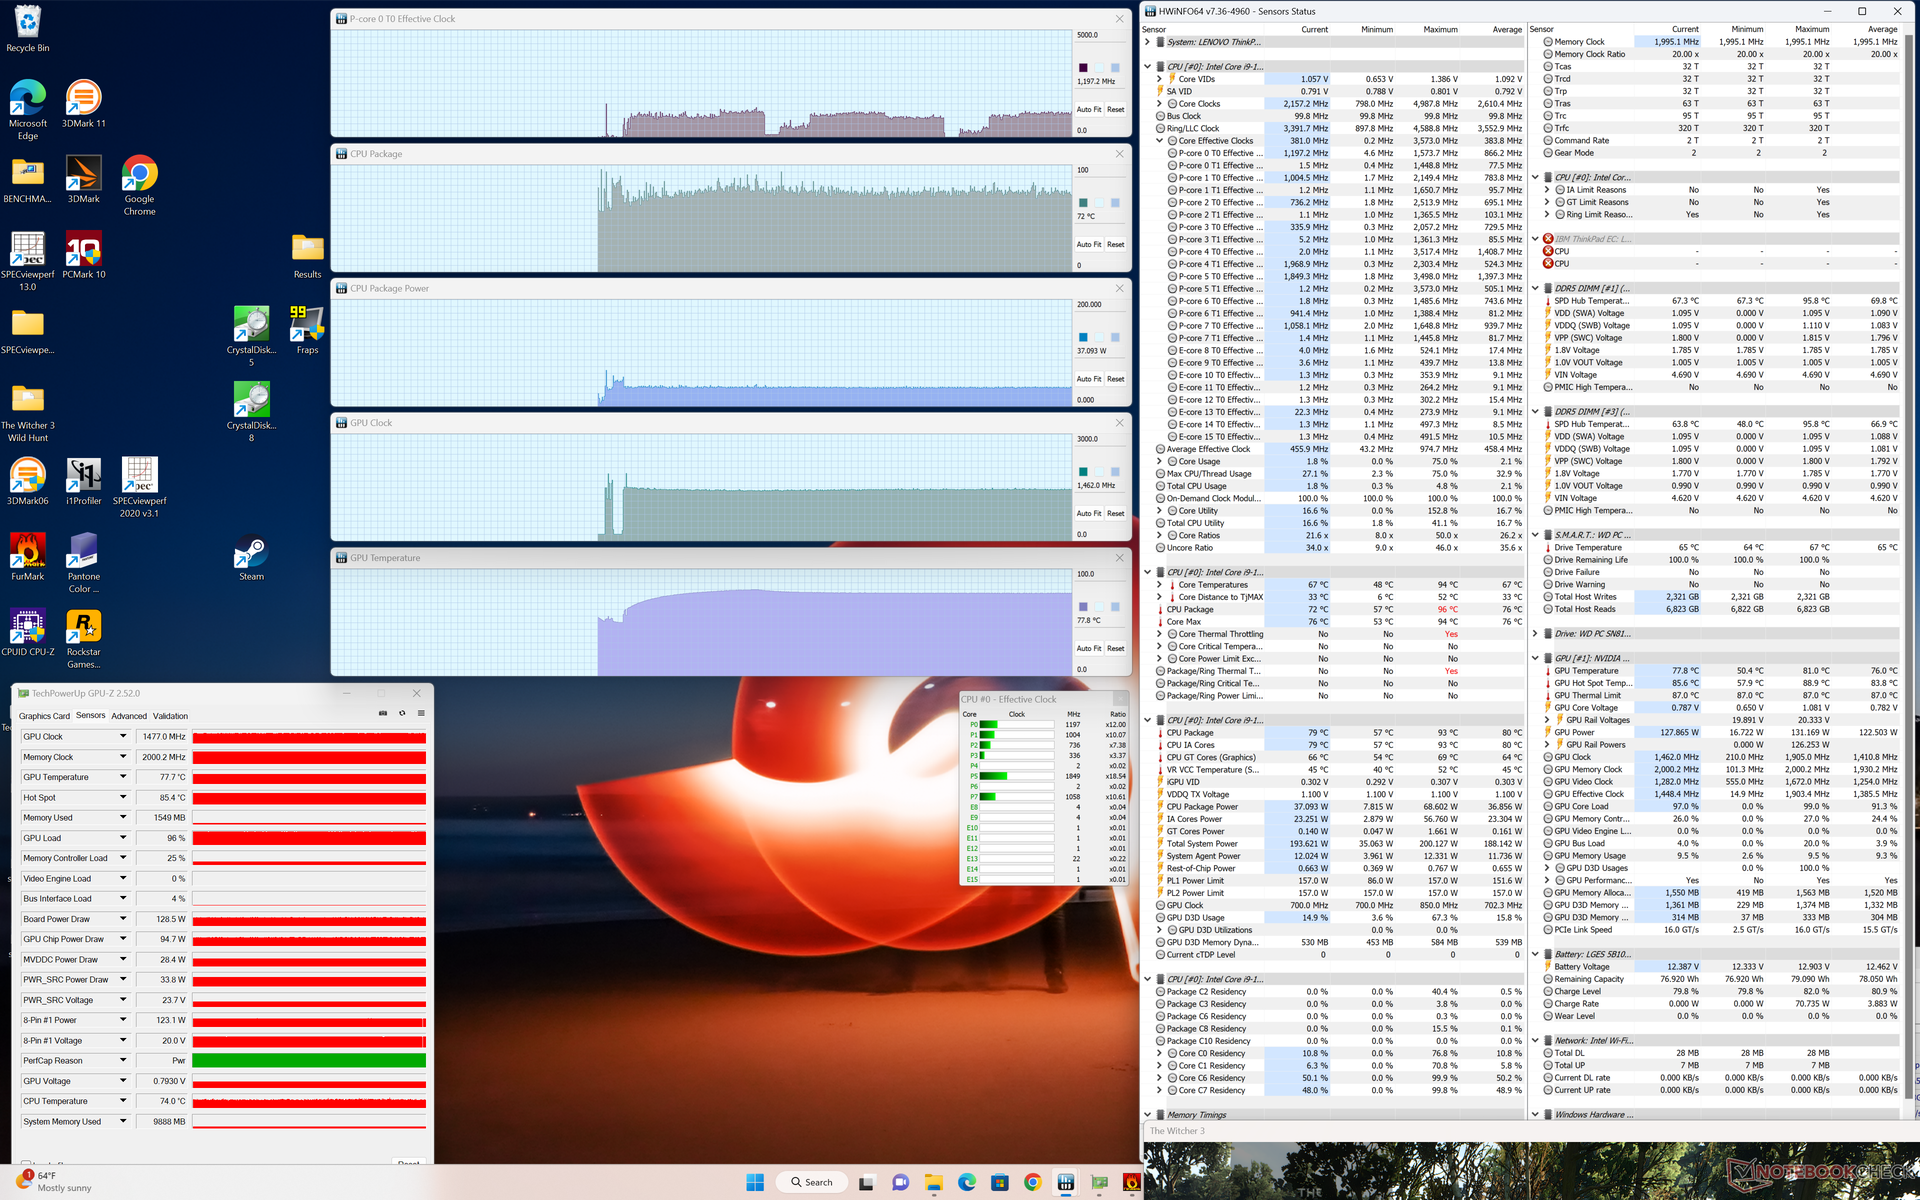
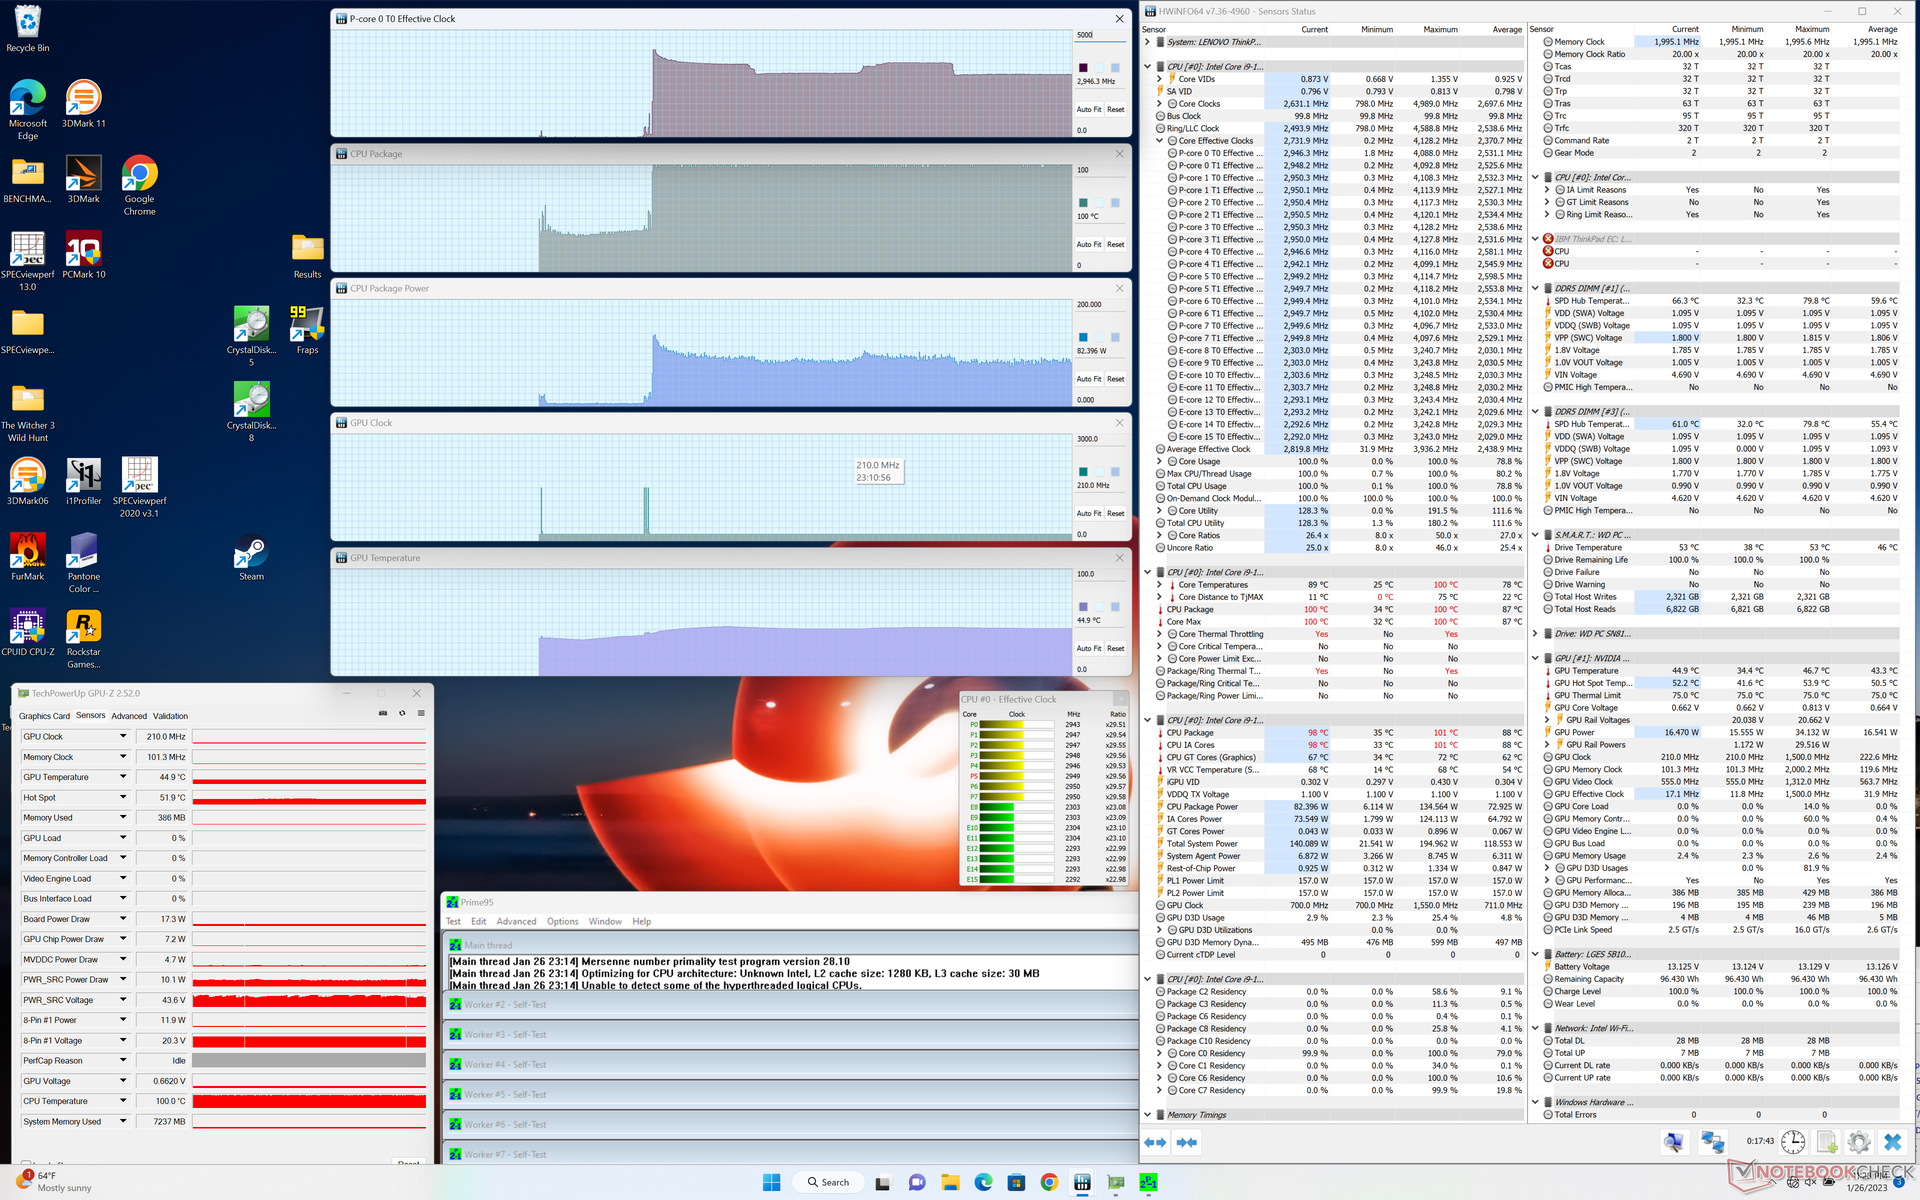
| CPU-klok (GHz) | GPU-klok (MHz) | Gemiddelde CPU-temperatuur (°C) | Gemiddelde GPU-temperatuur (°C) | |
| Systeem Idle | -- | -- | 39 | 39 |
| Prime95 Stress | 3.0 | -- | 100 | 45 |
| Prime95 + FurMark Stress | 2.1 - 2.8 | ~500 - 1550 | 88 - 100 | 75 |
| Witcher 3 Stress | ~1.2 | 1477 | 72 | 78 |
Luidsprekers
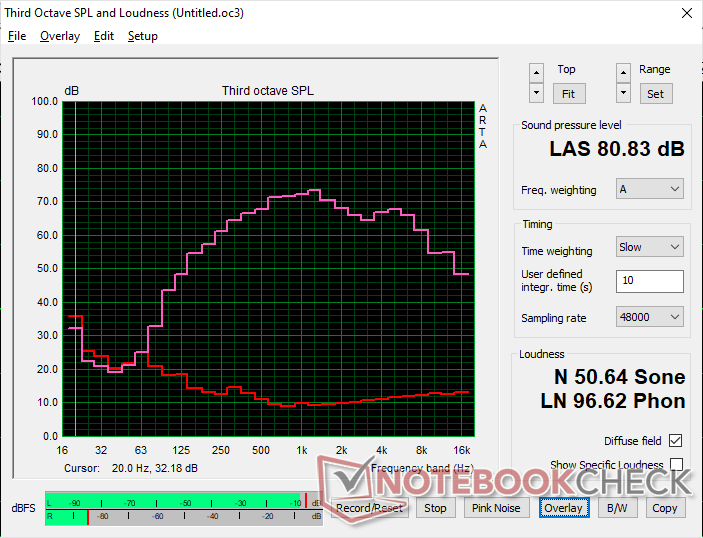
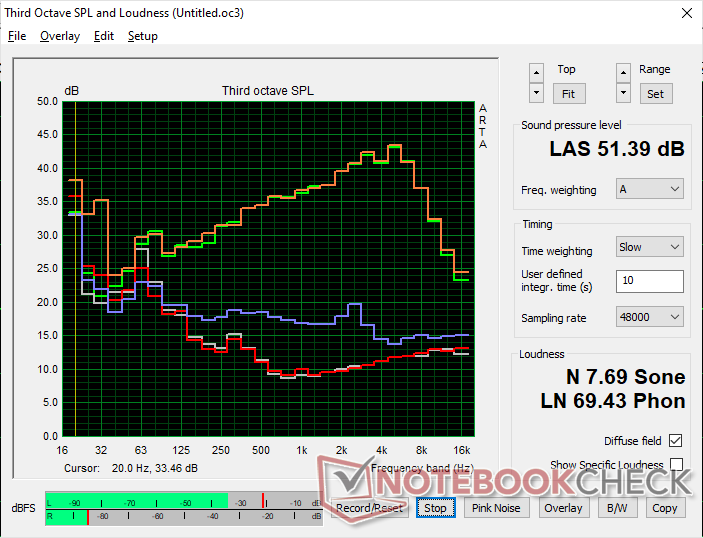
Lenovo ThinkPad P16 G1 RTX A5500 audioanalyse
(±) | luidspreker luidheid is gemiddeld maar goed (80.8 dB)
Bas 100 - 315 Hz
(±) | verminderde zeebaars - gemiddeld 11.1% lager dan de mediaan
(±) | lineariteit van de lage tonen is gemiddeld (9.7% delta ten opzichte van de vorige frequentie)
Midden 400 - 2000 Hz
(+) | evenwichtige middens - slechts 4.1% verwijderd van de mediaan
(+) | de middentonen zijn lineair (3.3% delta ten opzichte van de vorige frequentie)
Hoog 2 - 16 kHz
(+) | evenwichtige hoogtepunten - slechts 2.9% verwijderd van de mediaan
(+) | de hoge tonen zijn lineair (5.2% delta naar de vorige frequentie)
Algemeen 100 - 16.000 Hz
(+) | het totale geluid is lineair (13.2% verschil met de mediaan)
Vergeleken met dezelfde klasse
» 23% van alle geteste apparaten in deze klasse waren beter, 6% vergelijkbaar, 71% slechter
» De beste had een delta van 7%, het gemiddelde was 17%, de slechtste was 35%
Vergeleken met alle geteste toestellen
» 14% van alle geteste apparaten waren beter, 3% gelijk, 84% slechter
» De beste had een delta van 4%, het gemiddelde was 23%, de slechtste was 134%
Apple MacBook Pro 16 2021 M1 Pro audioanalyse
(+) | luidsprekers kunnen relatief luid spelen (84.7 dB)
Bas 100 - 315 Hz
(+) | goede baars - slechts 3.8% verwijderd van de mediaan
(+) | de lage tonen zijn lineair (5.2% delta naar de vorige frequentie)
Midden 400 - 2000 Hz
(+) | evenwichtige middens - slechts 1.3% verwijderd van de mediaan
(+) | de middentonen zijn lineair (2.1% delta ten opzichte van de vorige frequentie)
Hoog 2 - 16 kHz
(+) | evenwichtige hoogtepunten - slechts 1.9% verwijderd van de mediaan
(+) | de hoge tonen zijn lineair (2.7% delta naar de vorige frequentie)
Algemeen 100 - 16.000 Hz
(+) | het totale geluid is lineair (4.6% verschil met de mediaan)
Vergeleken met dezelfde klasse
» 0% van alle geteste apparaten in deze klasse waren beter, 0% vergelijkbaar, 100% slechter
» De beste had een delta van 5%, het gemiddelde was 17%, de slechtste was 45%
Vergeleken met alle geteste toestellen
» 0% van alle geteste apparaten waren beter, 0% gelijk, 100% slechter
» De beste had een delta van 4%, het gemiddelde was 23%, de slechtste was 134%
Energiebeheer
Stroomverbruik
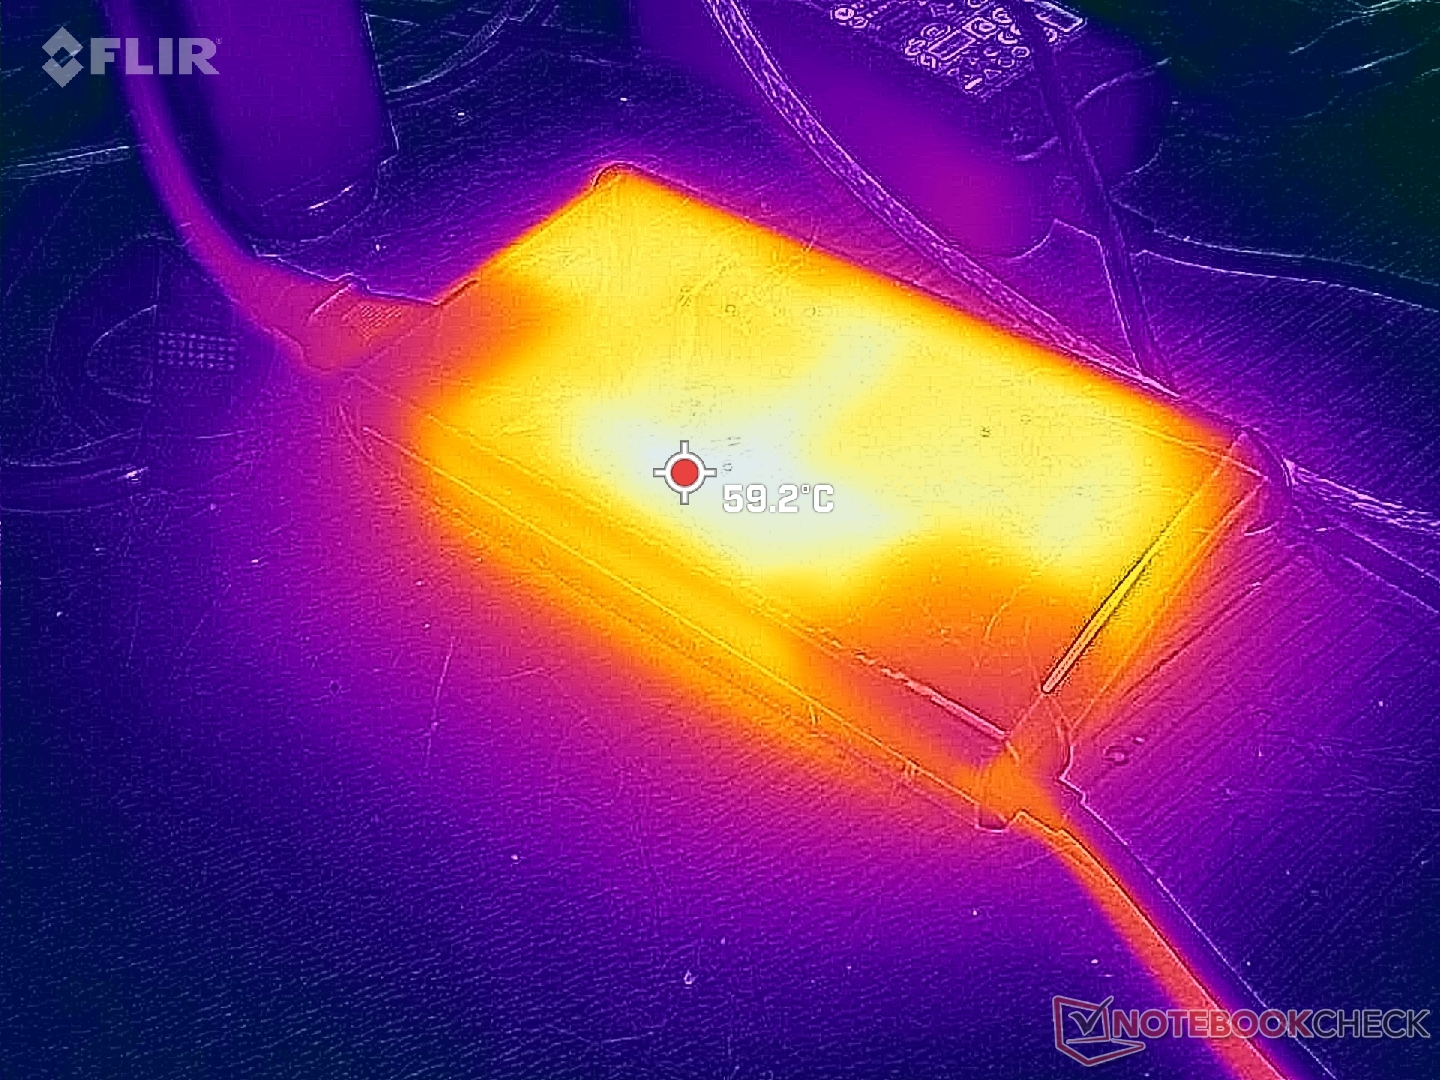
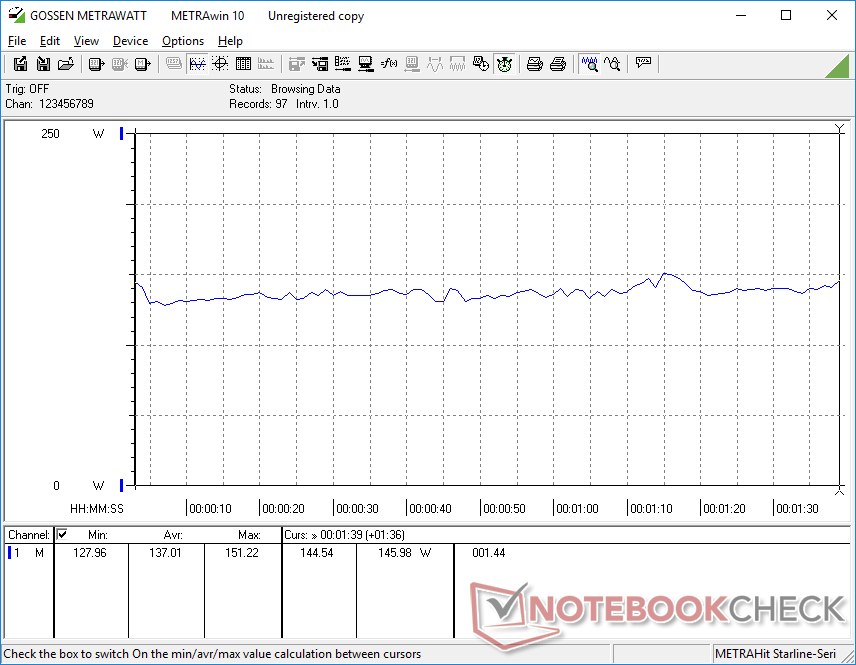
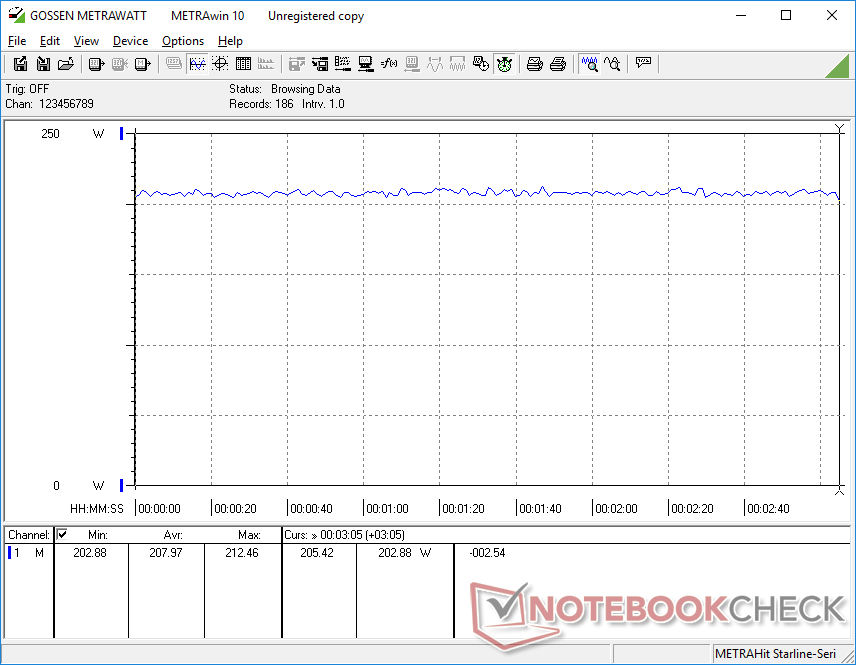
Het stroomverbruik bij stationair draaien is enkele watt lager dan op de Precision 7670, waarschijnlijk vanwege het zwaardere OLED-paneel op laatstgenoemde. Bij hogere belastingen zoals Witcher 3wordt het verbruik op de Lenovo echter merkbaar hoger dan op de Dell (208 W vs. 159 W). Het hogere stroomverbruik valt samen met de snellere CPU en GPU prestaties ten opzichte van het concurrerende Dell model, zoals blijkt uit onze benchmarks hierboven.
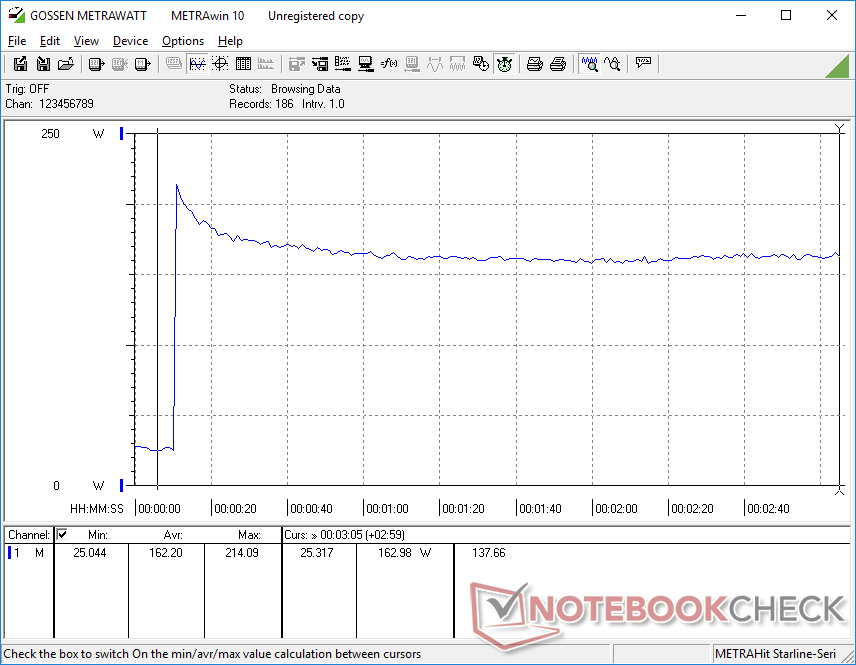
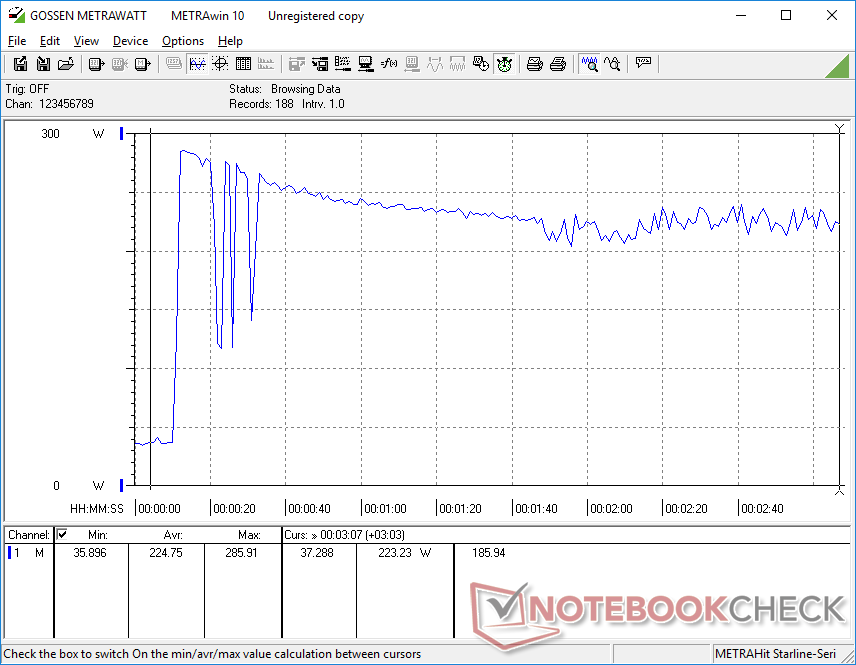
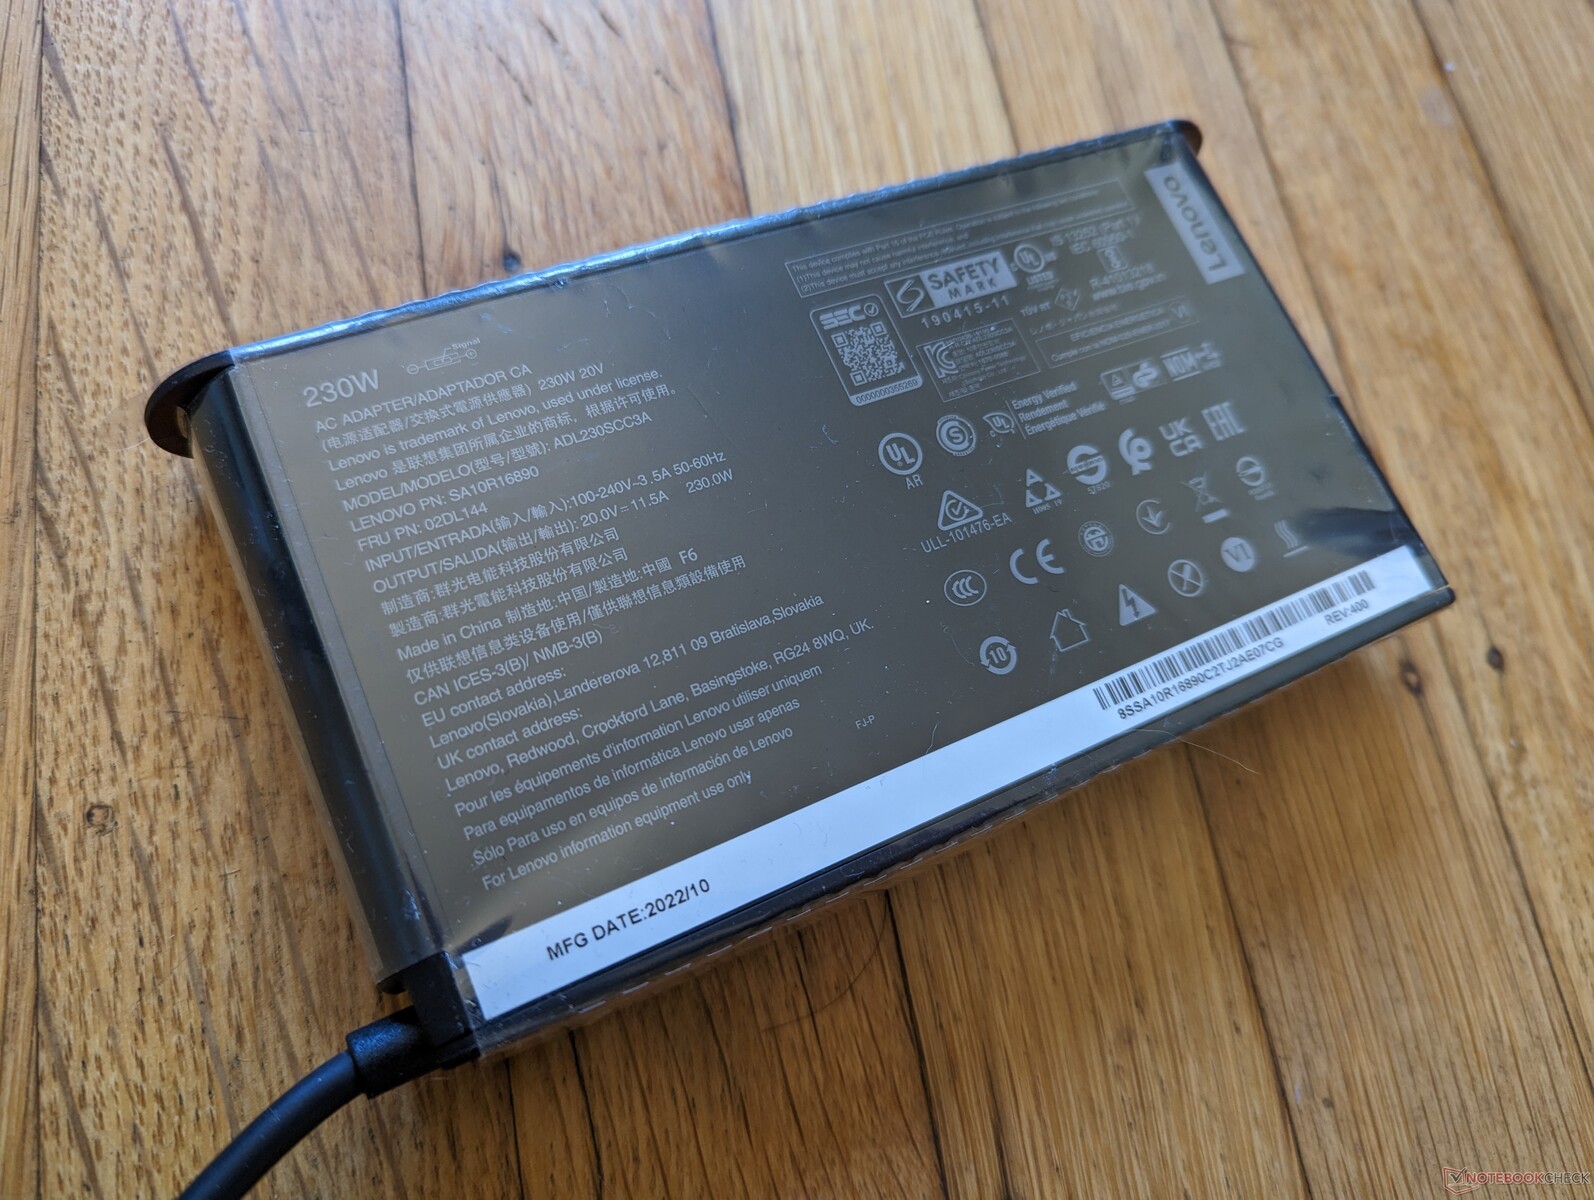
Hoewel krachtige gebruikers de extra prestaties wellicht zullen waarderen, is onze volledig geladen Lenovo aanzienlijk veeleisender dan de meeste andere mobiele werkstations. In feite is de middelgrote (~15 x 8,6 x 2,6 cm) 230 W AC adapter misschien niet genoeg om de machine van stroom te voorzien wanneer de CPU en GPU zwaar worden belast. We meten een tijdelijke maximale stroomafname van 286 W van de 230 W adapter voordat deze uiteindelijk daalt en zich stabiliseert op ongeveer 223 W. Verwacht dus dat de acculaadsnelheid vertraagt of zelfs negatief wordt bij zware belasting. Bij 90 minuten Witcher 3 90 minuten achtereen, bijvoorbeeld, zagen we het batterijniveau dalen van 100 procent naar 87 procent. Een soortgelijk gedrag werd waargenomen op de oudere XPS 17 of Precision 5750. Het is jammer dat Lenovo bij het afrekenen geen AC-adapteropties hoger dan 230 W aanbiedt.
Configuratie met de goedkopere RTX A2000 zou het verbruik met ongeveer de helft verminderen. In dit geval zou de 230 W AC-adapter voldoende zijn.
| Uit / Standby | |
| Inactief | |
| Belasting |
|
Key:
min: | |
| Lenovo ThinkPad P16 G1 RTX A5500 i9-12950HX, RTX A5500 Laptop GPU, WDC PC SN810 2TB, IPS, 3840x2400, 16" | Asus ProArt StudioBook 16 W7600H5A-2BL2 W-11955M, RTX A5000 Laptop GPU, 2x Micron 2300 2TB MTFDHBA2T0TDV (RAID 0), OLED, 3840x2400, 16" | Dell Precision 7000 7670 Performance i9-12950HX, RTX A5500 Laptop GPU, , OLED, 3840x2400, 16" | Lenovo ThinkPad P16 G1 21D6001DMB i7-12850HX, RTX A2000 Laptop GPU, Micron 3400 1TB MTFDKBA1T0TFH, IPS LED, 2560x1600, 16" | MSI CreatorPro Z16P B12UKST i7-12700H, RTX A3000 Laptop GPU, Samsung PM9A1 MZVL21T0HCLR, IPS, 2560x1600, 16" | HP ZBook Studio 16 G9 62U04EA i7-12800H, RTX A2000 Laptop GPU, Micron 3400 1TB MTFDKBA1T0TFH, IPS, 3840x2400, 16" | |
|---|---|---|---|---|---|---|
| Power Consumption | 14% | -35% | 45% | 19% | 28% | |
| Idle Minimum * (Watt) | 7.5 | 12.4 -65% | 16.4 -119% | 5.1 32% | 10.8 -44% | 7.2 4% |
| Idle Average * (Watt) | 20.1 | 16.5 18% | 35.9 -79% | 9.2 54% | 16.3 19% | 18.1 10% |
| Idle Maximum * (Watt) | 40 | 25 37% | 47 -18% | 9.9 75% | 16.9 58% | 18.5 54% |
| Load Average * (Watt) | 137 | 132 4% | 147.1 -7% | 124.1 9% | 111.7 18% | 112.8 18% |
| Witcher 3 ultra * (Watt) | 208 | 132 37% | 158.8 24% | 87.7 58% | 152.1 27% | 106.7 49% |
| Load Maximum * (Watt) | 285.9 | 134 53% | 311 -9% | 168.9 41% | 177.4 38% | 186 35% |
* ... kleiner is beter
Power Consumption Witcher 3 / Stresstest
Power Consumption external Monitor
Levensduur van de batterij
De looptijd is enkele uren korter dan op onze mindere RTX A2000 SKU voor een totaal van iets minder dan 6 uur indien ingesteld op het gebalanceerde stroomprofiel.
Opladen van leeg naar vol duurt ongeveer 2 uur. Lenovo's geschatte laadtijd is echter niet zo nauwkeurig, want Vantage kan in het begin wel 4 uur laten zien voordat het zichzelf automatisch opnieuw kalibreert. Houd er rekening mee dat de oplaadsnelheid aanzienlijk zal vertragen als veeleisende toepassingen worden uitgevoerd, zoals hierboven vermeld.
Het systeem kan niet worden opgeladen via USB-C.
| Lenovo ThinkPad P16 G1 RTX A5500 i9-12950HX, RTX A5500 Laptop GPU, 94 Wh | Asus ProArt StudioBook 16 W7600H5A-2BL2 W-11955M, RTX A5000 Laptop GPU, 90 Wh | Dell Precision 7000 7670 Performance i9-12950HX, RTX A5500 Laptop GPU, 93 Wh | Lenovo ThinkPad P16 G1 21D6001DMB i7-12850HX, RTX A2000 Laptop GPU, 94 Wh | MSI CreatorPro Z16P B12UKST i7-12700H, RTX A3000 Laptop GPU, 90 Wh | HP ZBook Studio 16 G9 62U04EA i7-12800H, RTX A2000 Laptop GPU, 86 Wh | |
|---|---|---|---|---|---|---|
| Batterijduur | -14% | -19% | 62% | 0% | 9% | |
| WiFi v1.3 (h) | 5.8 | 5 -14% | 4.7 -19% | 9.4 62% | 5.8 0% | 6.3 9% |
| H.264 (h) | 1.8 | 8.5 | ||||
| Witcher 3 ultra (h) | 1.6 | |||||
| Load (h) | 1.8 | 1.1 |
Pro
Contra
Verdict - De 230 W wisselstroomadapter is niet genoeg
Vanuit een puur prestatieperspectief is de ThinkPad P16 G1 een van de snelste mobiele werkstations die momenteel beschikbaar zijn, ongeacht de schermgrootte. Zijn Core i9-12950HX CPU en RTX A5500 GPU presteren iets maar consequent beter dan de Precision 7670 ook al wordt het Dell-model geleverd met vergelijkbare processoropties.
Er zijn twee belangrijke nadelen waarvan we hopen dat Lenovo ze op toekomstige iteraties kan aanpakken. Ten eerste zijn de CPU temperaturen veel warmer dan gemiddeld bij het uitvoeren van veeleisende belastingen. Hoge temperaturen zijn natuurlijk niet onverwacht, maar een plateau van 100 C is gewoon te warm voor comfort wanneer dezelfde CPU in het eerder genoemde Dell-model nauwelijks de 80 C-grens zou kraken onder vergelijkbare omstandigheden. De hoge temperatuur is misschien de prijs die betaald moet worden voor de iets snellere prestaties.
Ten tweede zweet de 230 W AC adapter kogels bij het voeden van een 100+ W CPU en een 130 W GPU. De strijd is merkbaar bij veeleisende belastingen, aangezien de oplaadsnelheid van het systeem aanzienlijk vertraagt of zelfs de batterij begint leeg te lopen in bepaalde scenario's. Als we een piekbelasting van 285 W kunnen meten met een AC-adapter van slechts 230 W, dan is er duidelijk sprake van een knelpunt. Een grotere 280 W of 330 W AC-adapter zou meer geschikt zijn geweest gezien ons configuratieniveau.
De ThinkPad P16 Gen 1 maximaliseert de prestaties, zelfs als dat een hoger stroomverbruik en hogere kerntemperaturen betekent. De 230 W AC-adapter is echter mogelijk te conservatief, gezien de zeer veeleisende processoren van onze top-end configuratie.
De algemene hoge systeemprestaties zijn niettemin onmiskenbaar, ondanks de hoge temperaturen en de ontoereikende 230 W voedingsblok. Zorg ervoor dat u veeleisende toepassingen uitschakelt voor fatsoenlijke laadsnelheden.
Prijs en beschikbaarheid
De ThinkPad P16 G1 wordt nu verzonden bij Best Buy en Amazon op lagere configuratieniveaus vanaf 2570 USD of 3850 USD, respectievelijk. Wij raden aan rechtstreeks bij Lenovo te kopen, omdat zij de meest configureerbare opties op voorraad hebben.
Lenovo ThinkPad P16 G1 RTX A5500
- 06-02-2023 v7 (old)
Allen Ngo
Transparantie
De selectie van te beoordelen apparaten wordt gemaakt door onze redactie. Het testexemplaar werd ten behoeve van deze beoordeling door de fabrikant of detailhandelaar in bruikleen aan de auteur verstrekt. De kredietverstrekker had geen invloed op deze recensie, noch ontving de fabrikant vóór publicatie een exemplaar van deze recensie. Er bestond geen verplichting om deze recensie te publiceren. Als onafhankelijk mediabedrijf is Notebookcheck niet onderworpen aan het gezag van fabrikanten, detailhandelaren of uitgevers.
[transparency_disclaimer]Dit is hoe Notebookcheck test
Elk jaar beoordeelt Notebookcheck onafhankelijk honderden laptops en smartphones met behulp van gestandaardiseerde procedures om ervoor te zorgen dat alle resultaten vergelijkbaar zijn. We hebben onze testmethoden al zo'n 20 jaar voortdurend ontwikkeld en daarbij de industriestandaard bepaald. In onze testlaboratoria wordt gebruik gemaakt van hoogwaardige meetapparatuur door ervaren technici en redacteuren. Deze tests omvatten een validatieproces in meerdere fasen. Ons complexe beoordelingssysteem is gebaseerd op honderden goed onderbouwde metingen en benchmarks, waardoor de objectiviteit behouden blijft. Meer informatie over onze testmethoden kunt u hier vinden.
Price comparison

