Notebookcheck Logo

Intel NUC 13 Extreme Raptor Canyon mini PC met Core i9-13900K en GeForce RTX 3080 Ti in review

Compact, snel en veelzijdig! Intel's NUC Extreme serie is bijgewerkt naar de nieuwste 13e gen. Raptor Lake processoren. In vergelijking met zijn voorganger is er veel veranderd op het gebied van het uiterlijk ontwerp. In deze review evalueren we de prestaties van de NUC 13 Extreme Kit met Intels snelste CPU en een GeForce RTX 3080 Ti met veel benchmarks en technische details.
Intel NUC 13 Extreme Raptor Canyon + Uperfect X Pro LapDock (niet meegeleverd)

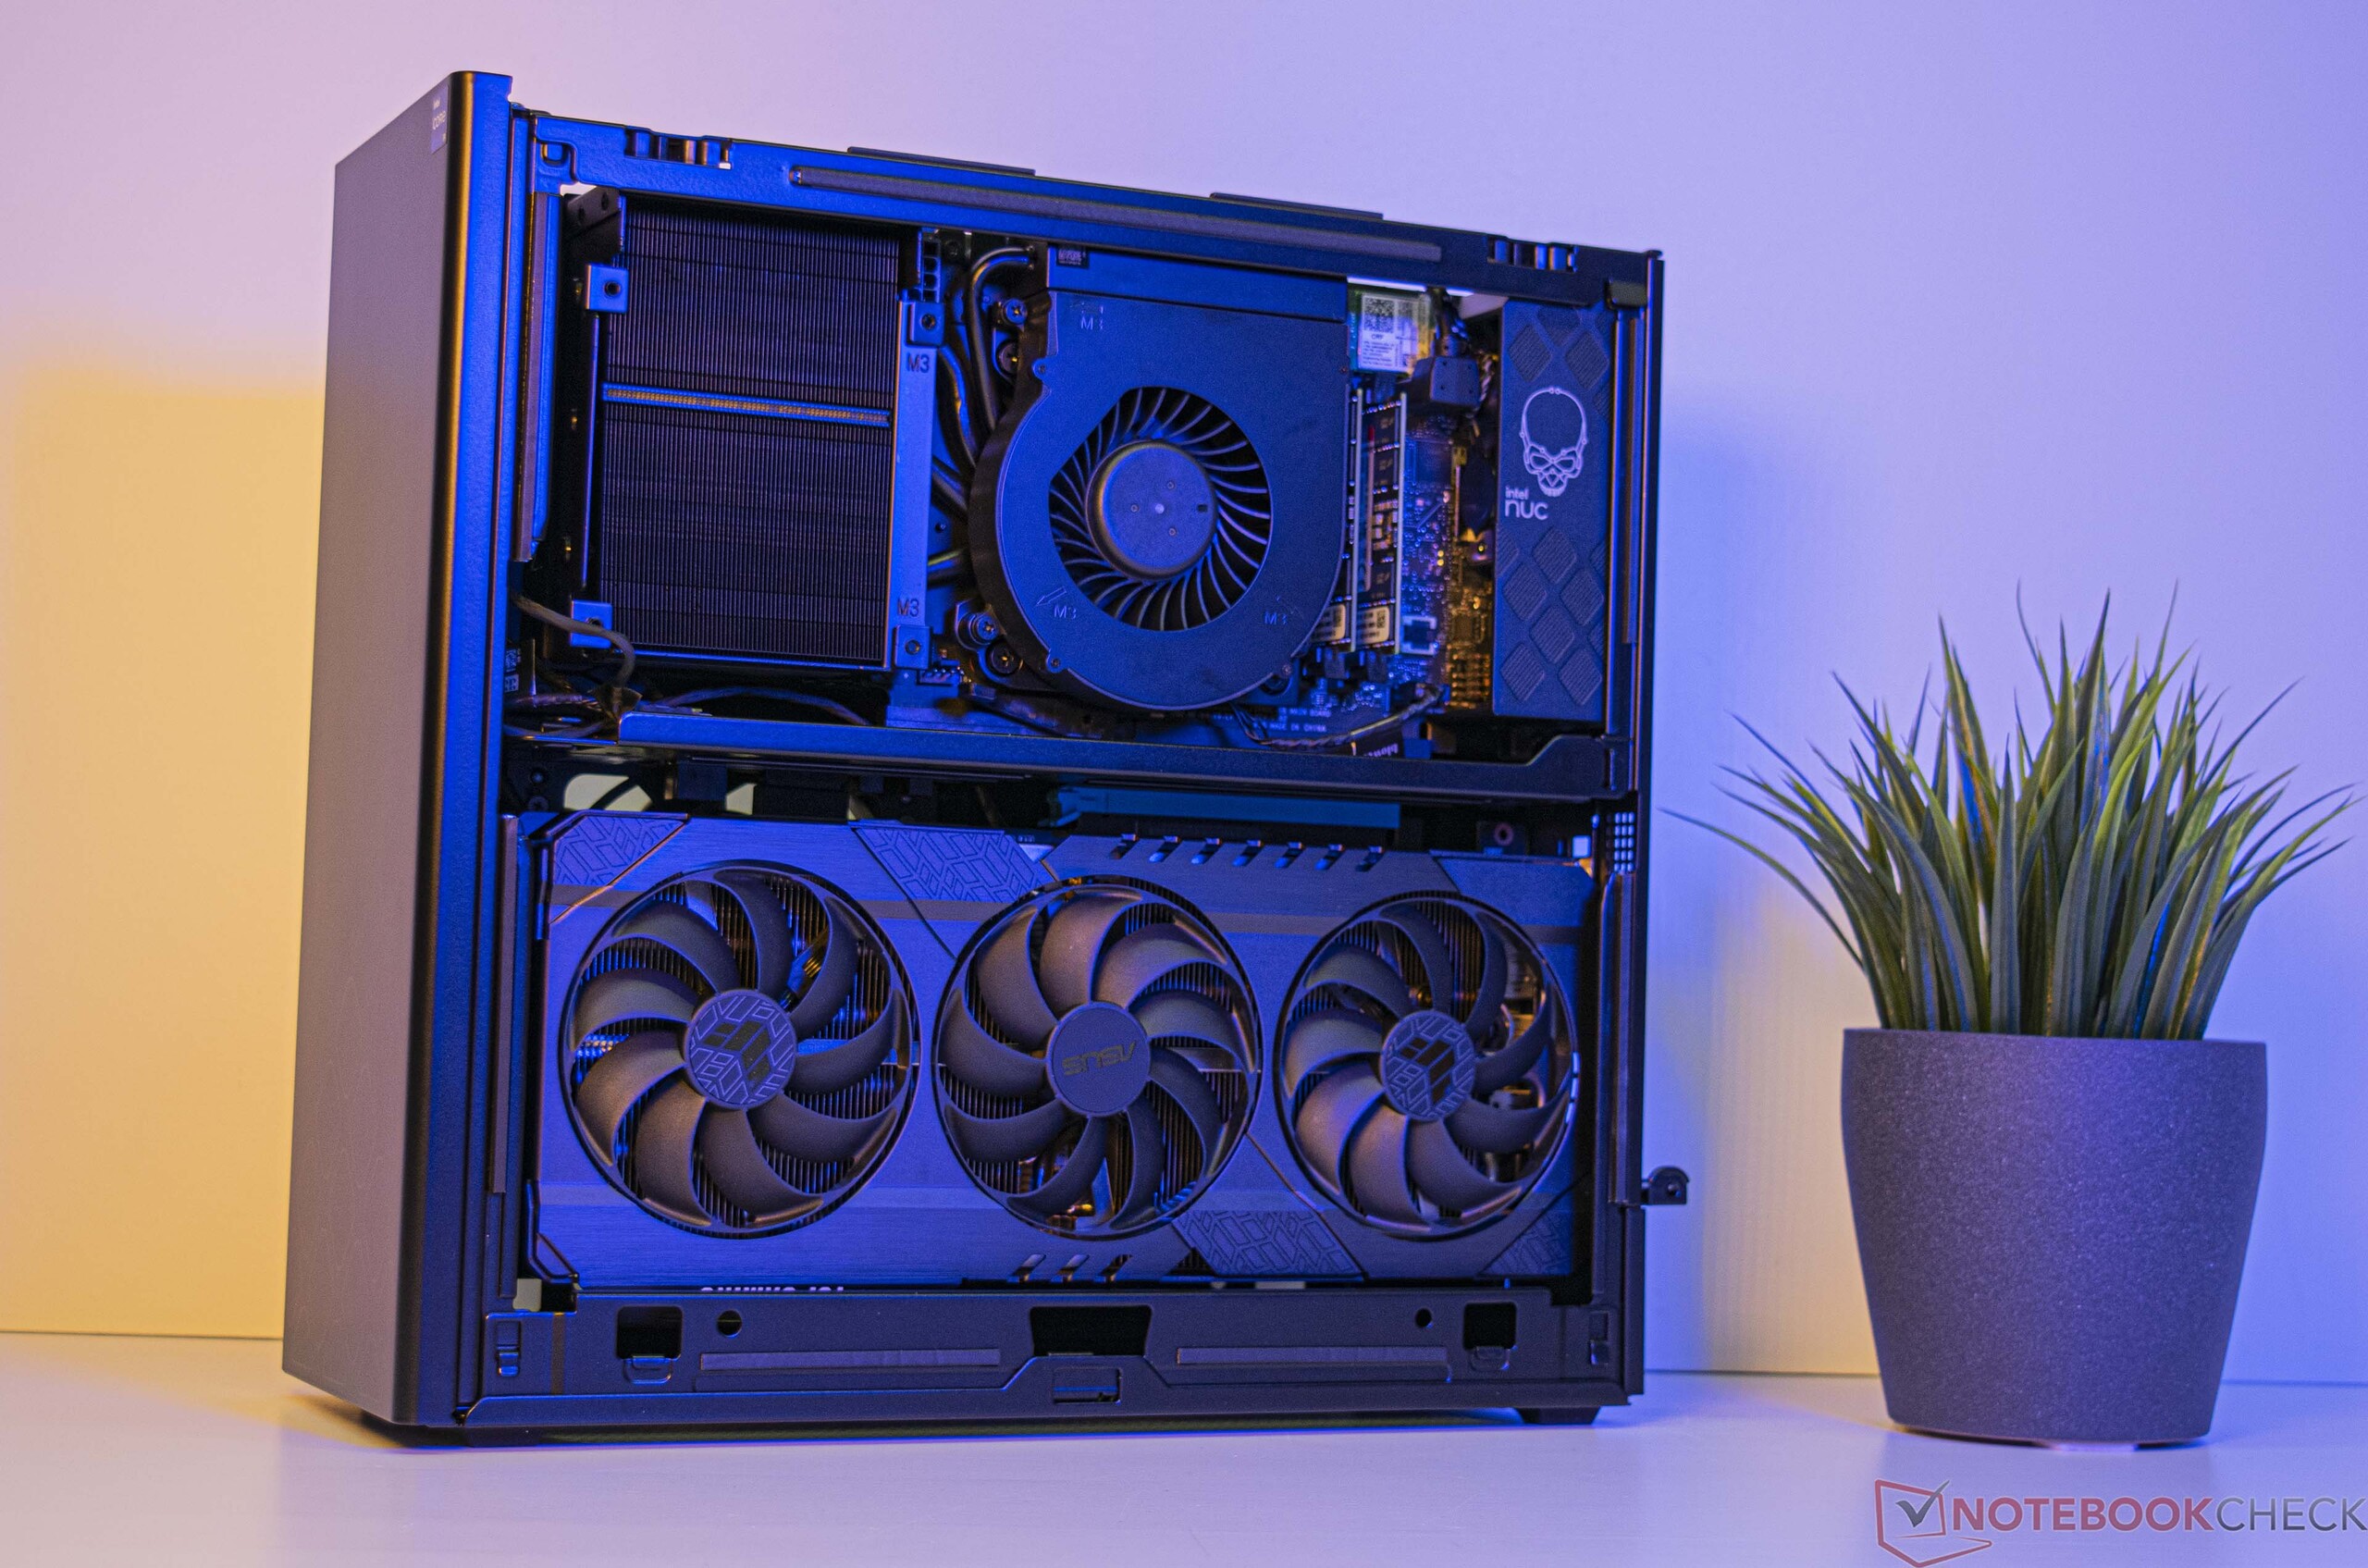
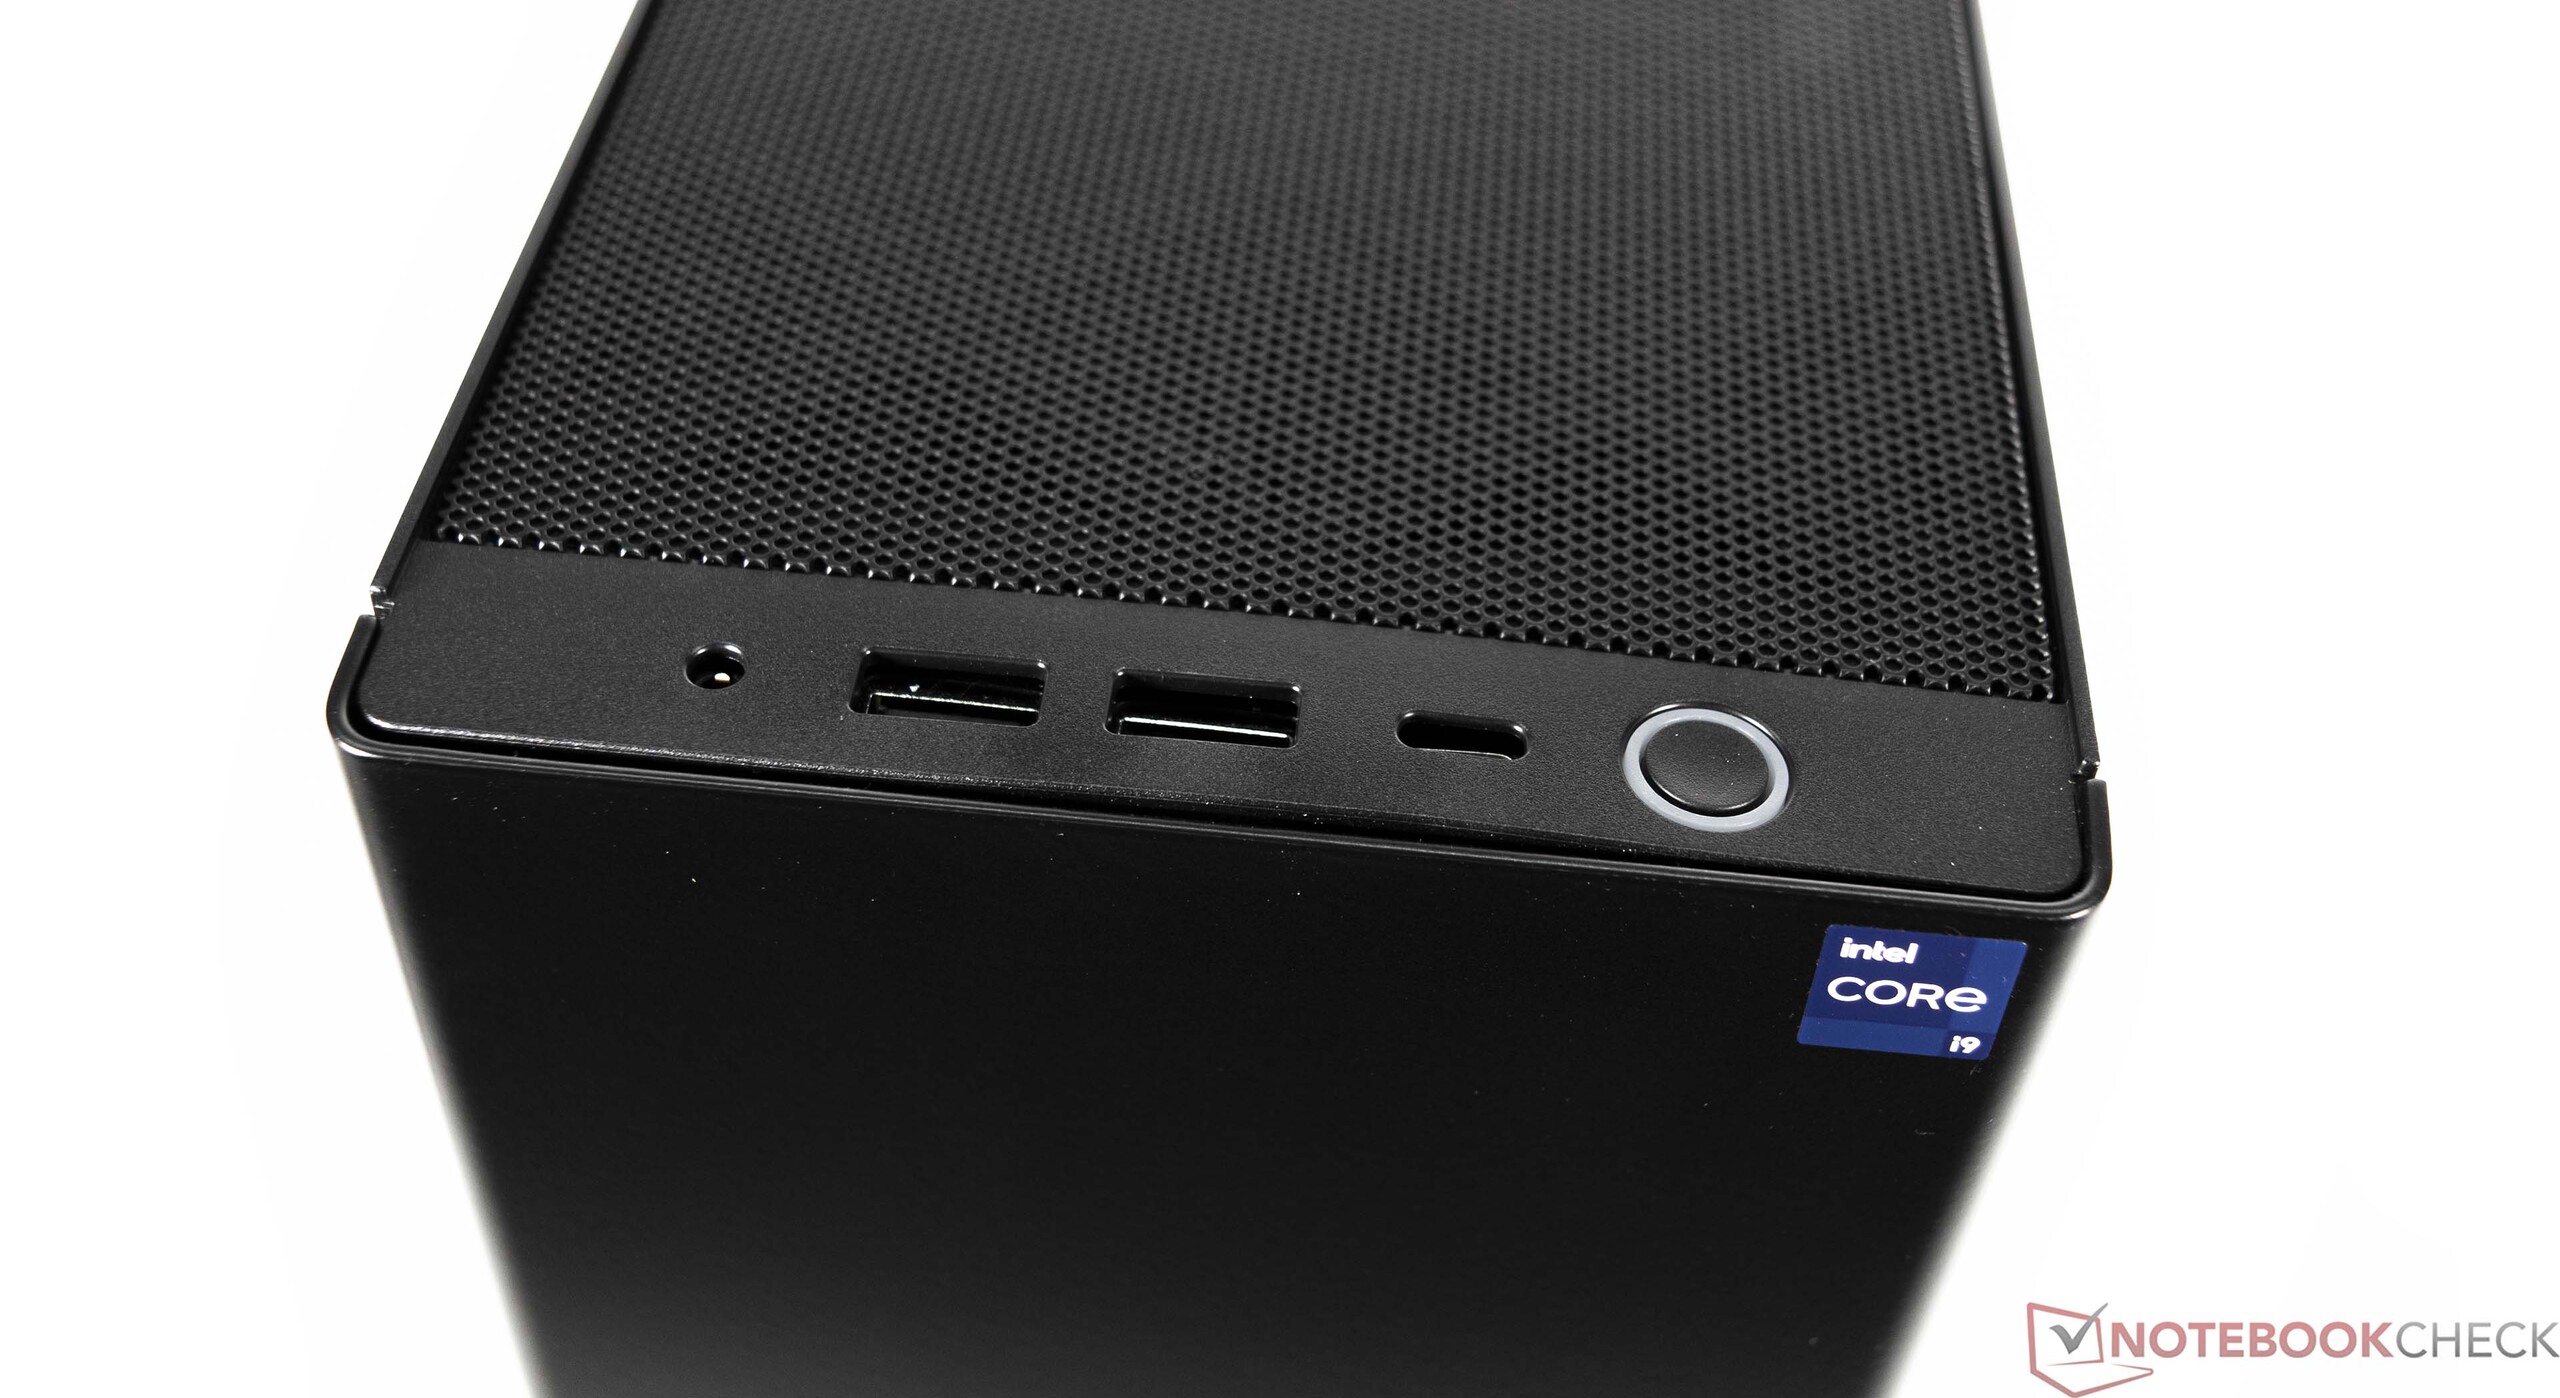
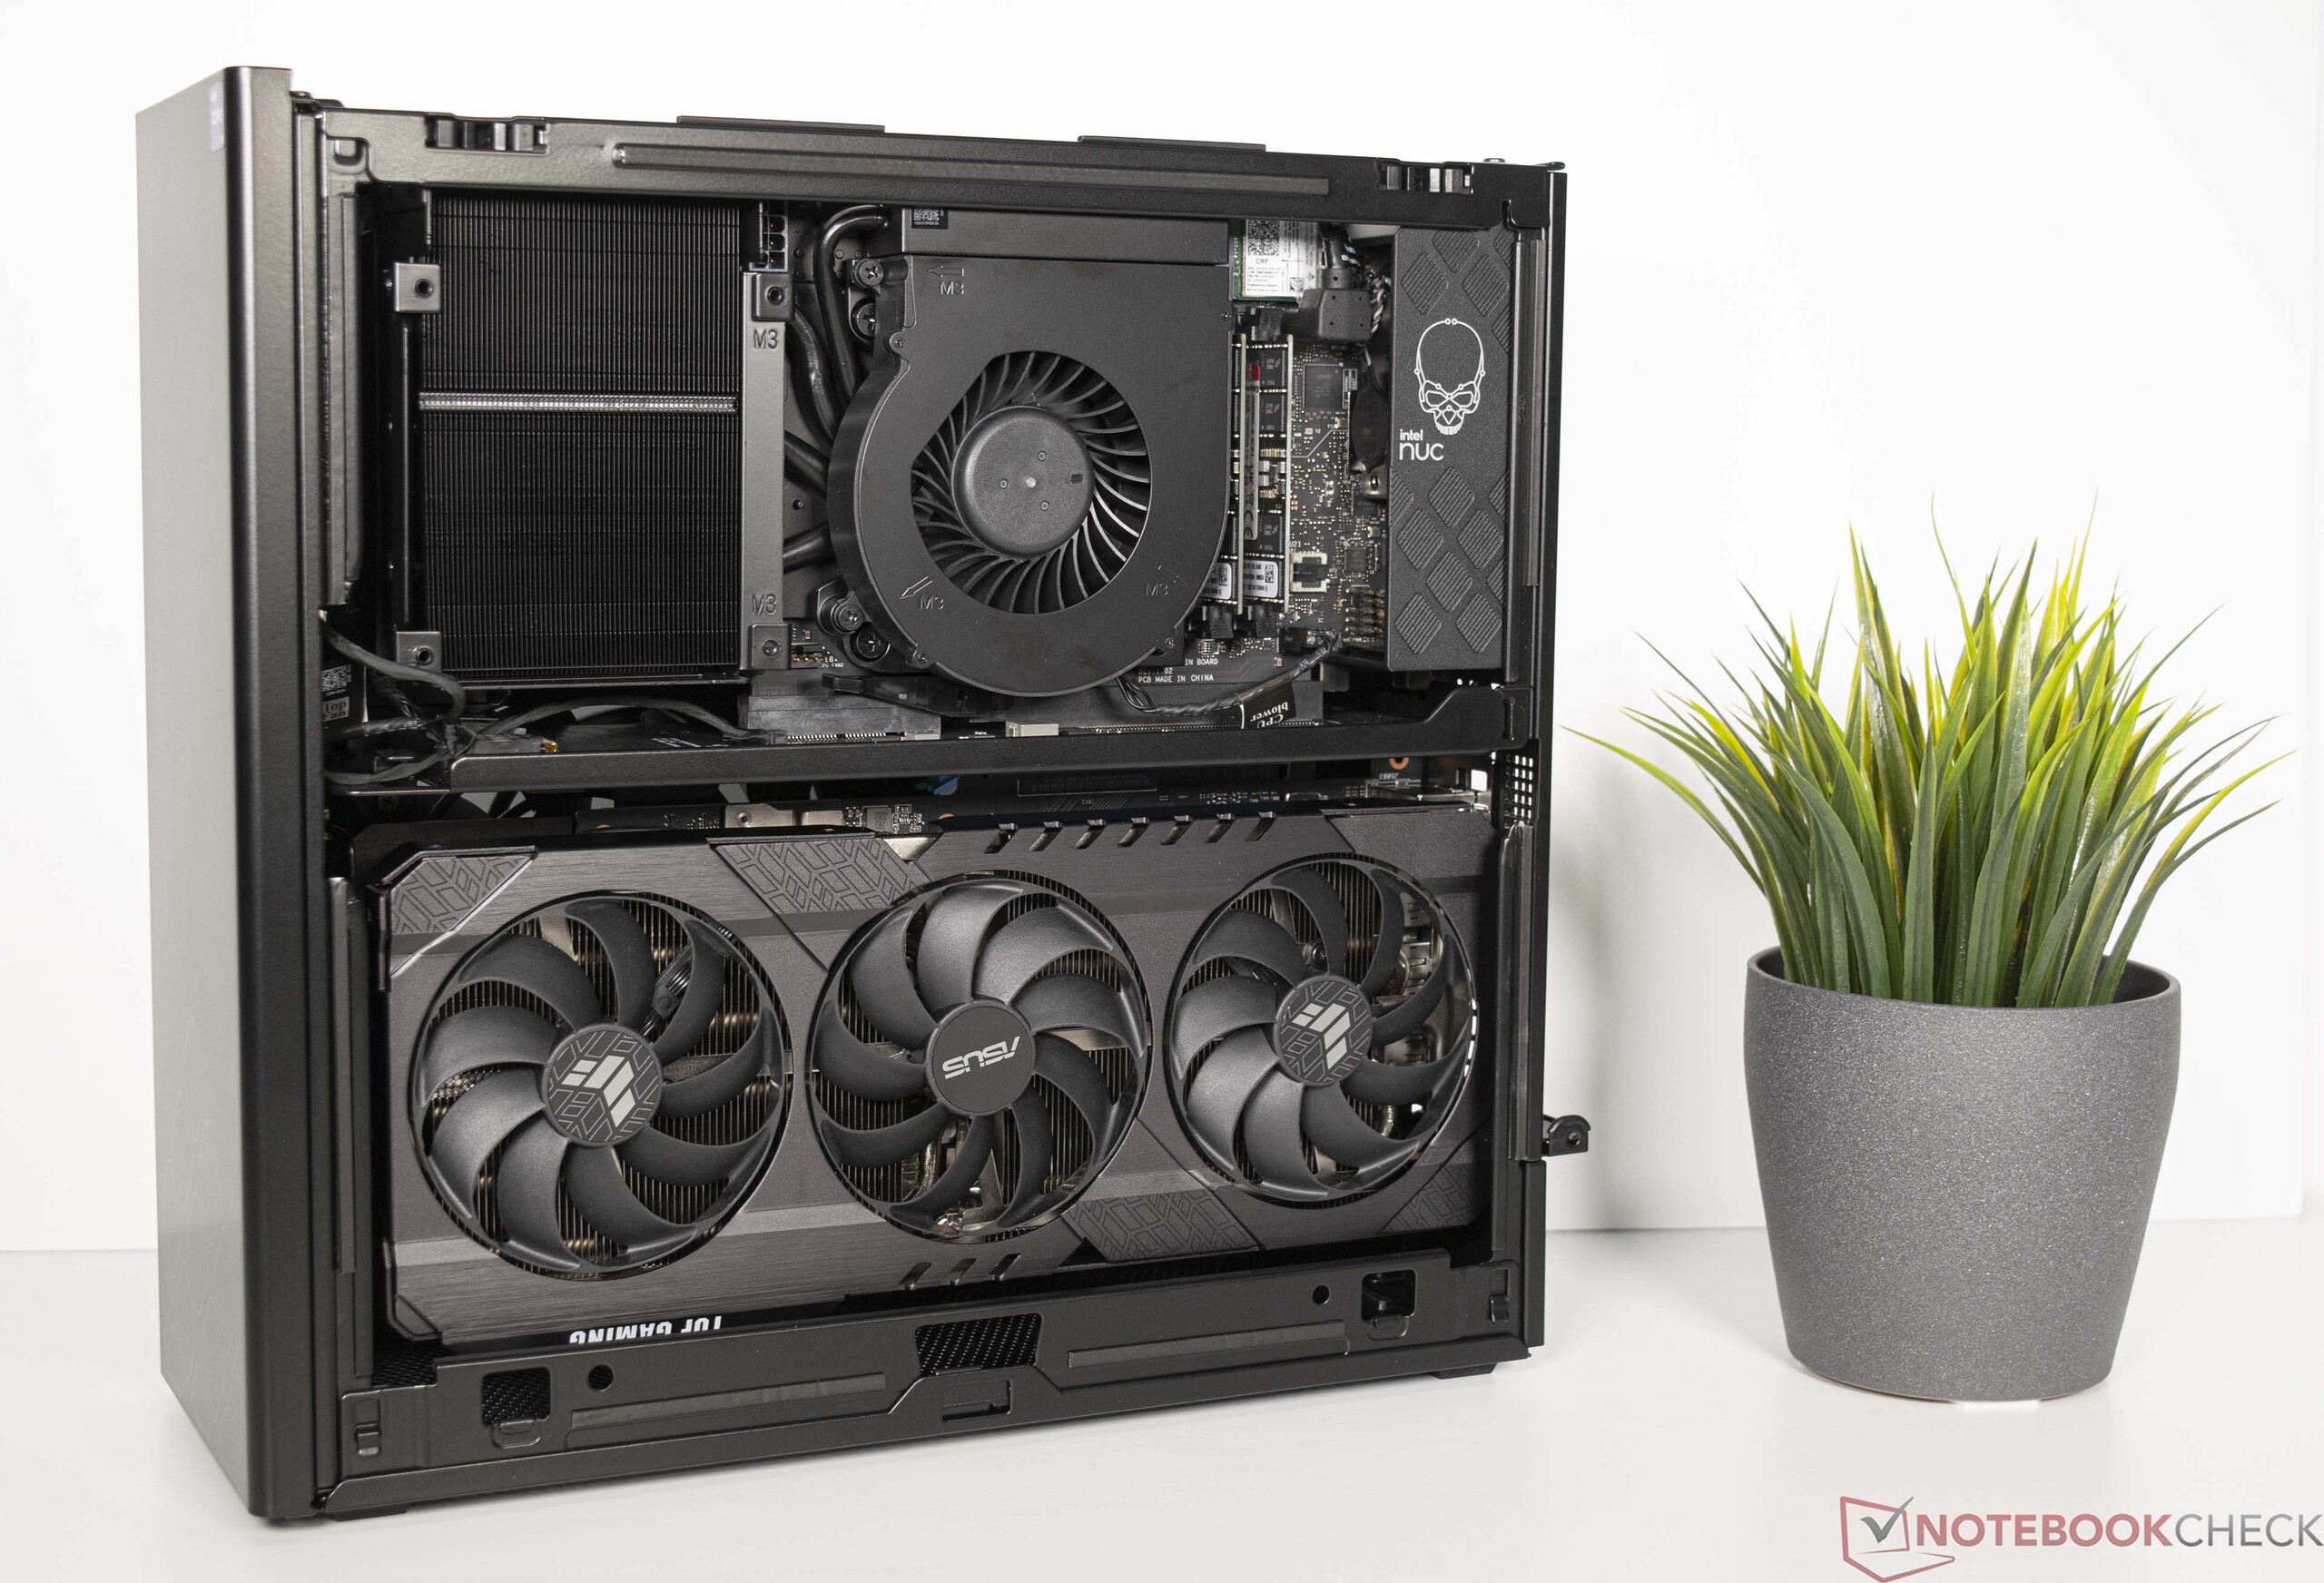
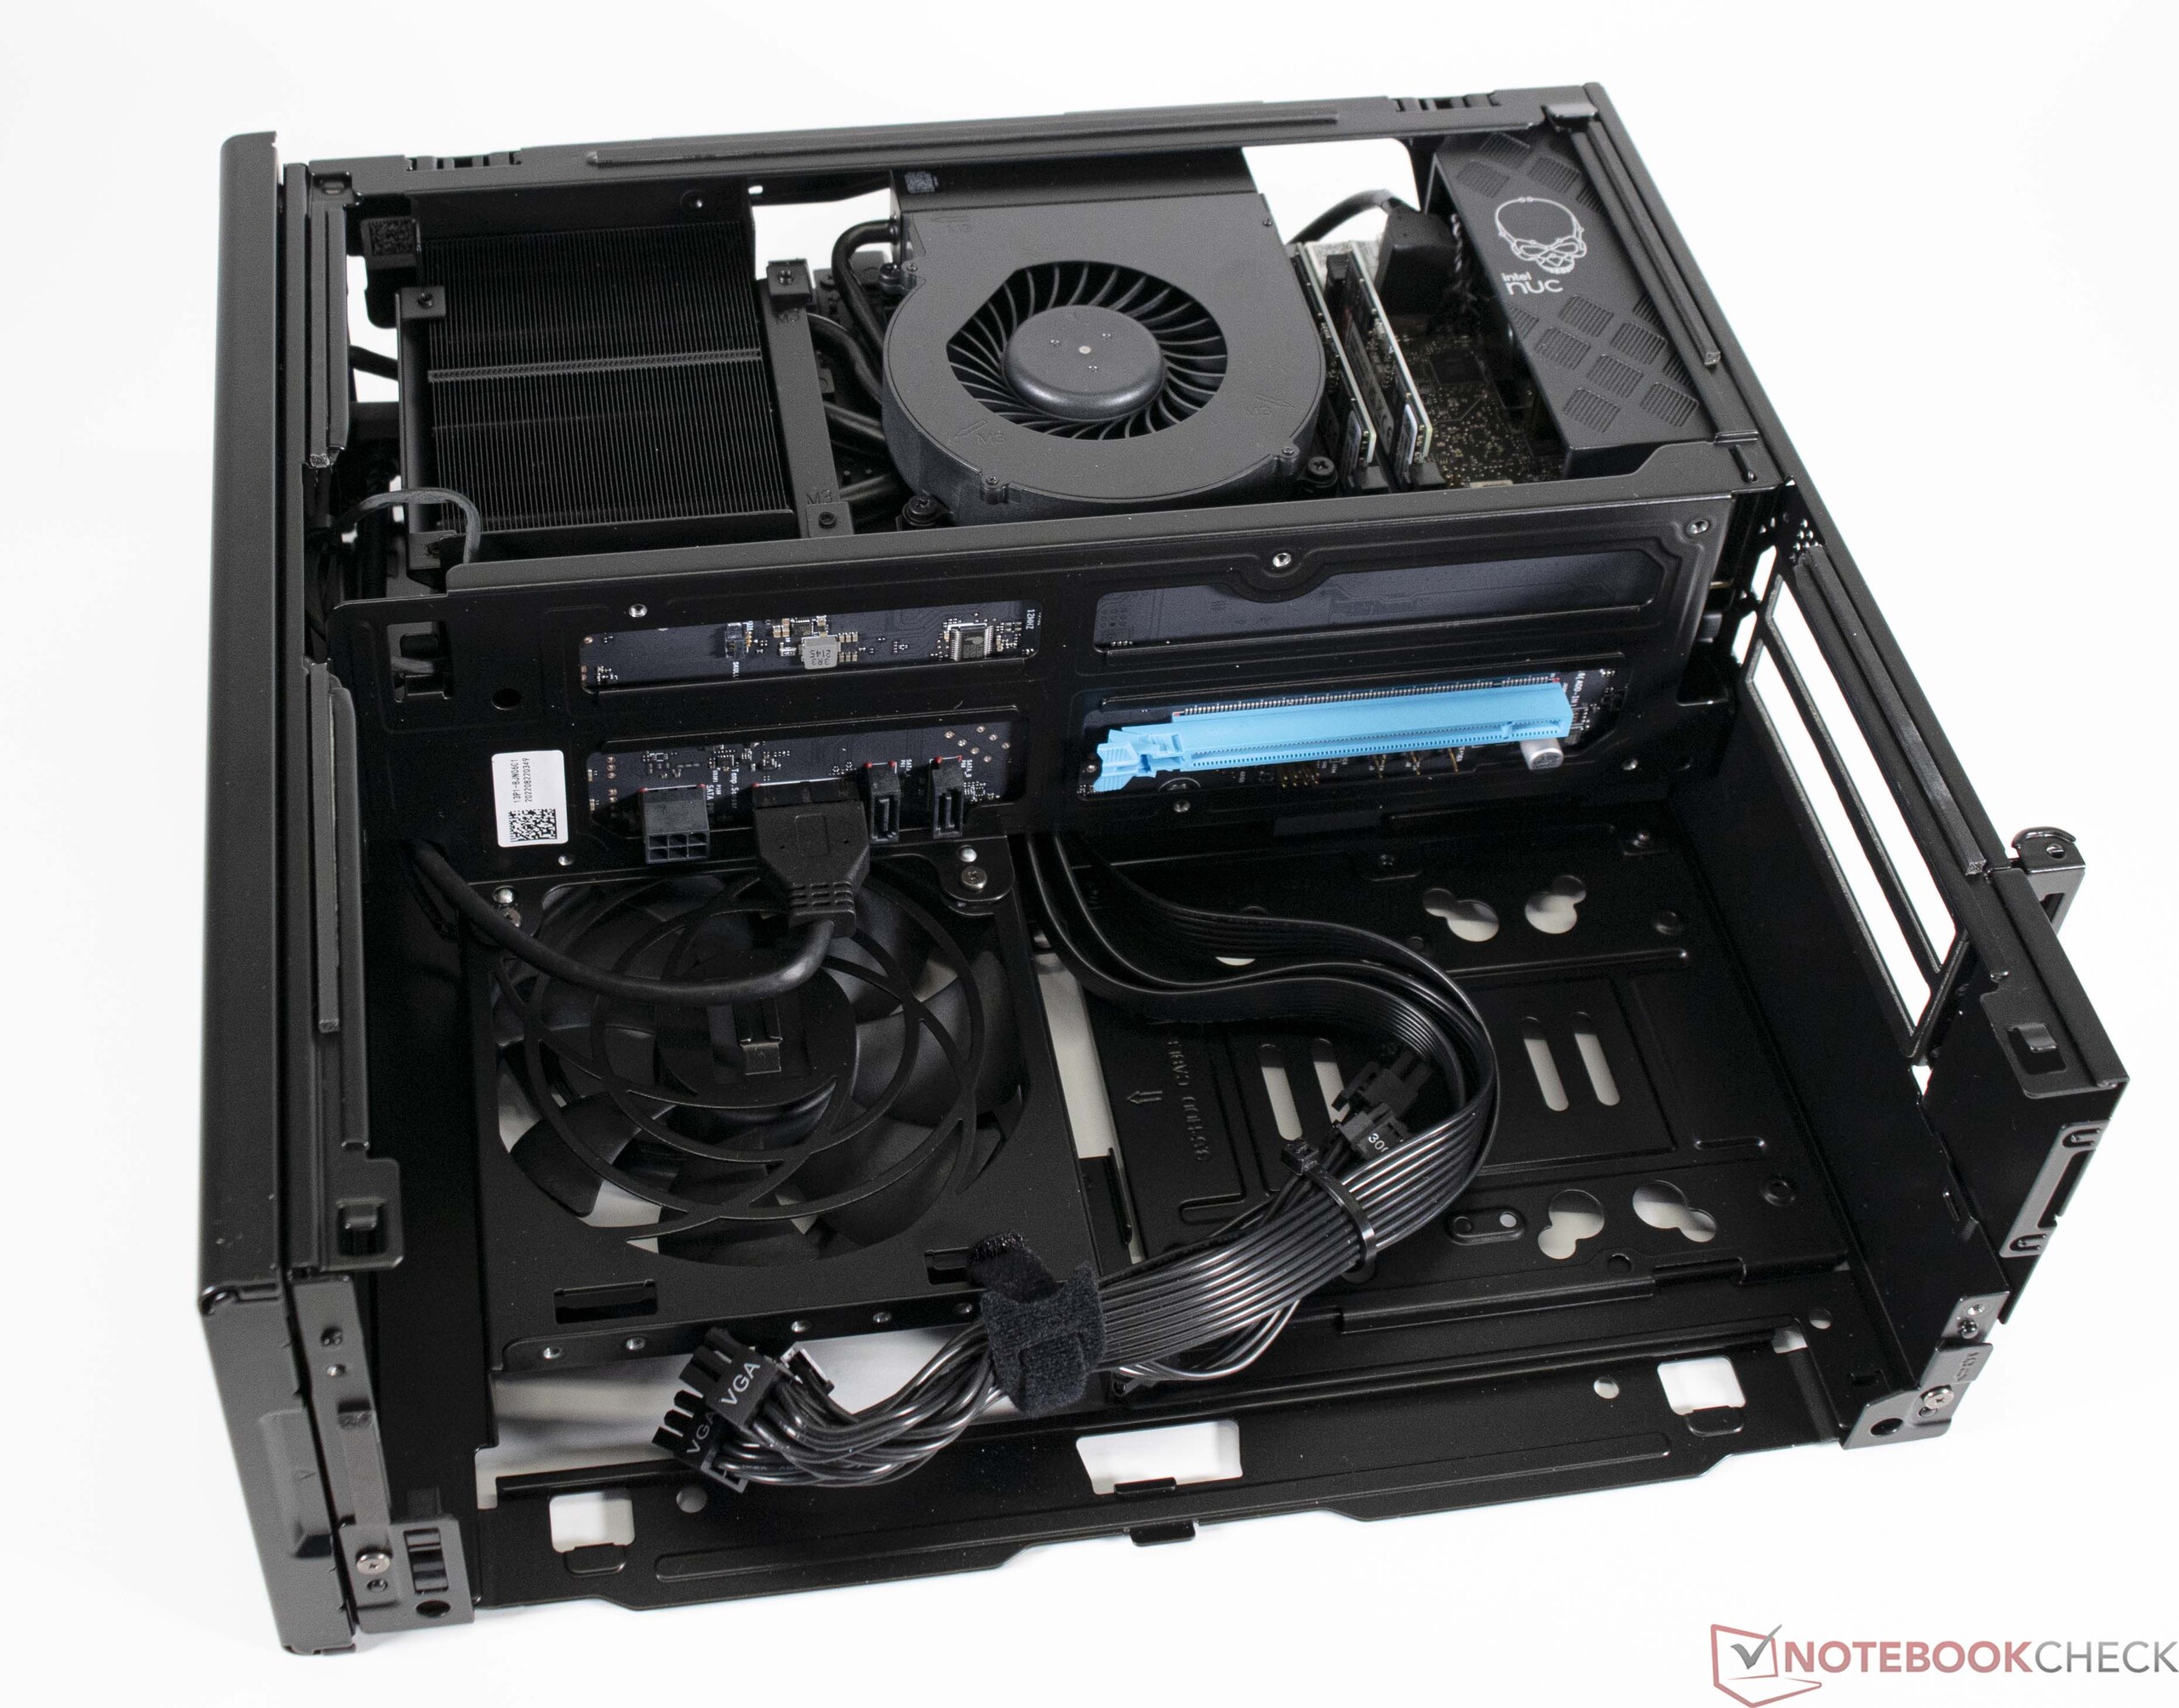
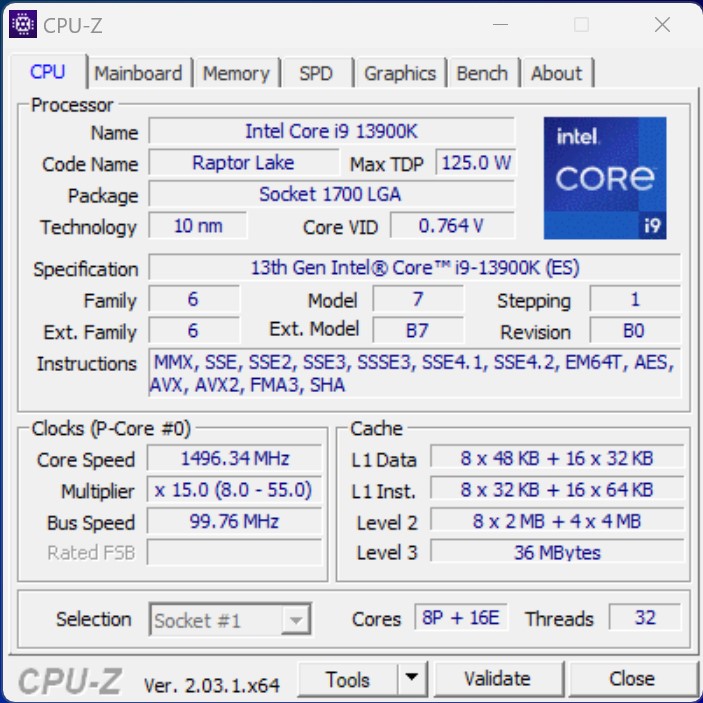
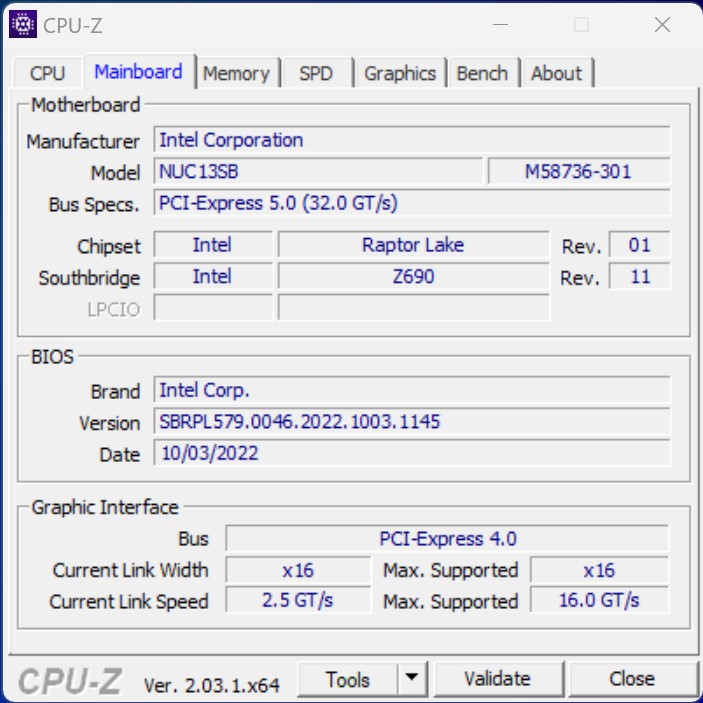
Na Beast Canyon en Dragon Canyon wijkt Intels nieuwste Raptor Canyon NUC Extreme Kit aanzienlijk af van het ontwerp van zijn voorgangers. Intel mikt echter nog steeds op een zeer compacte pc die nauwelijks iets te wensen overlaat. Bovendien kan een full-size grafische kaart worden geïnstalleerd. Voor de CPU zijn modellen uit Intels huidige Raptor Lake line-up beschikbaar. Gebruikers kunnen natuurlijk ook hun eigen CPU kiezen, aangezien de processor niet gesoldeerd is. In deze review gebruikt onze NUC 13 Extreme Raptor Canyon een Intel Core i9-13900K. Daarnaast is de Nvidia GeForce RTX 3080 Ti voldoende 3D-prestaties, zelfs voor veeleisende gamers.

Er moet worden opgemerkt dat de Intel NUC 13 Extreme Kit een barebone systeem is dat wordt geleverd zonder SSD, RAM of grafische kaart. De prijs is afhankelijk van de meegeleverde CPU. Het basismodel met deIntel Core i5-13600K kost 1179 USD, terwijl de hoogste configuratie beschikbaar is voor 1549 USD.

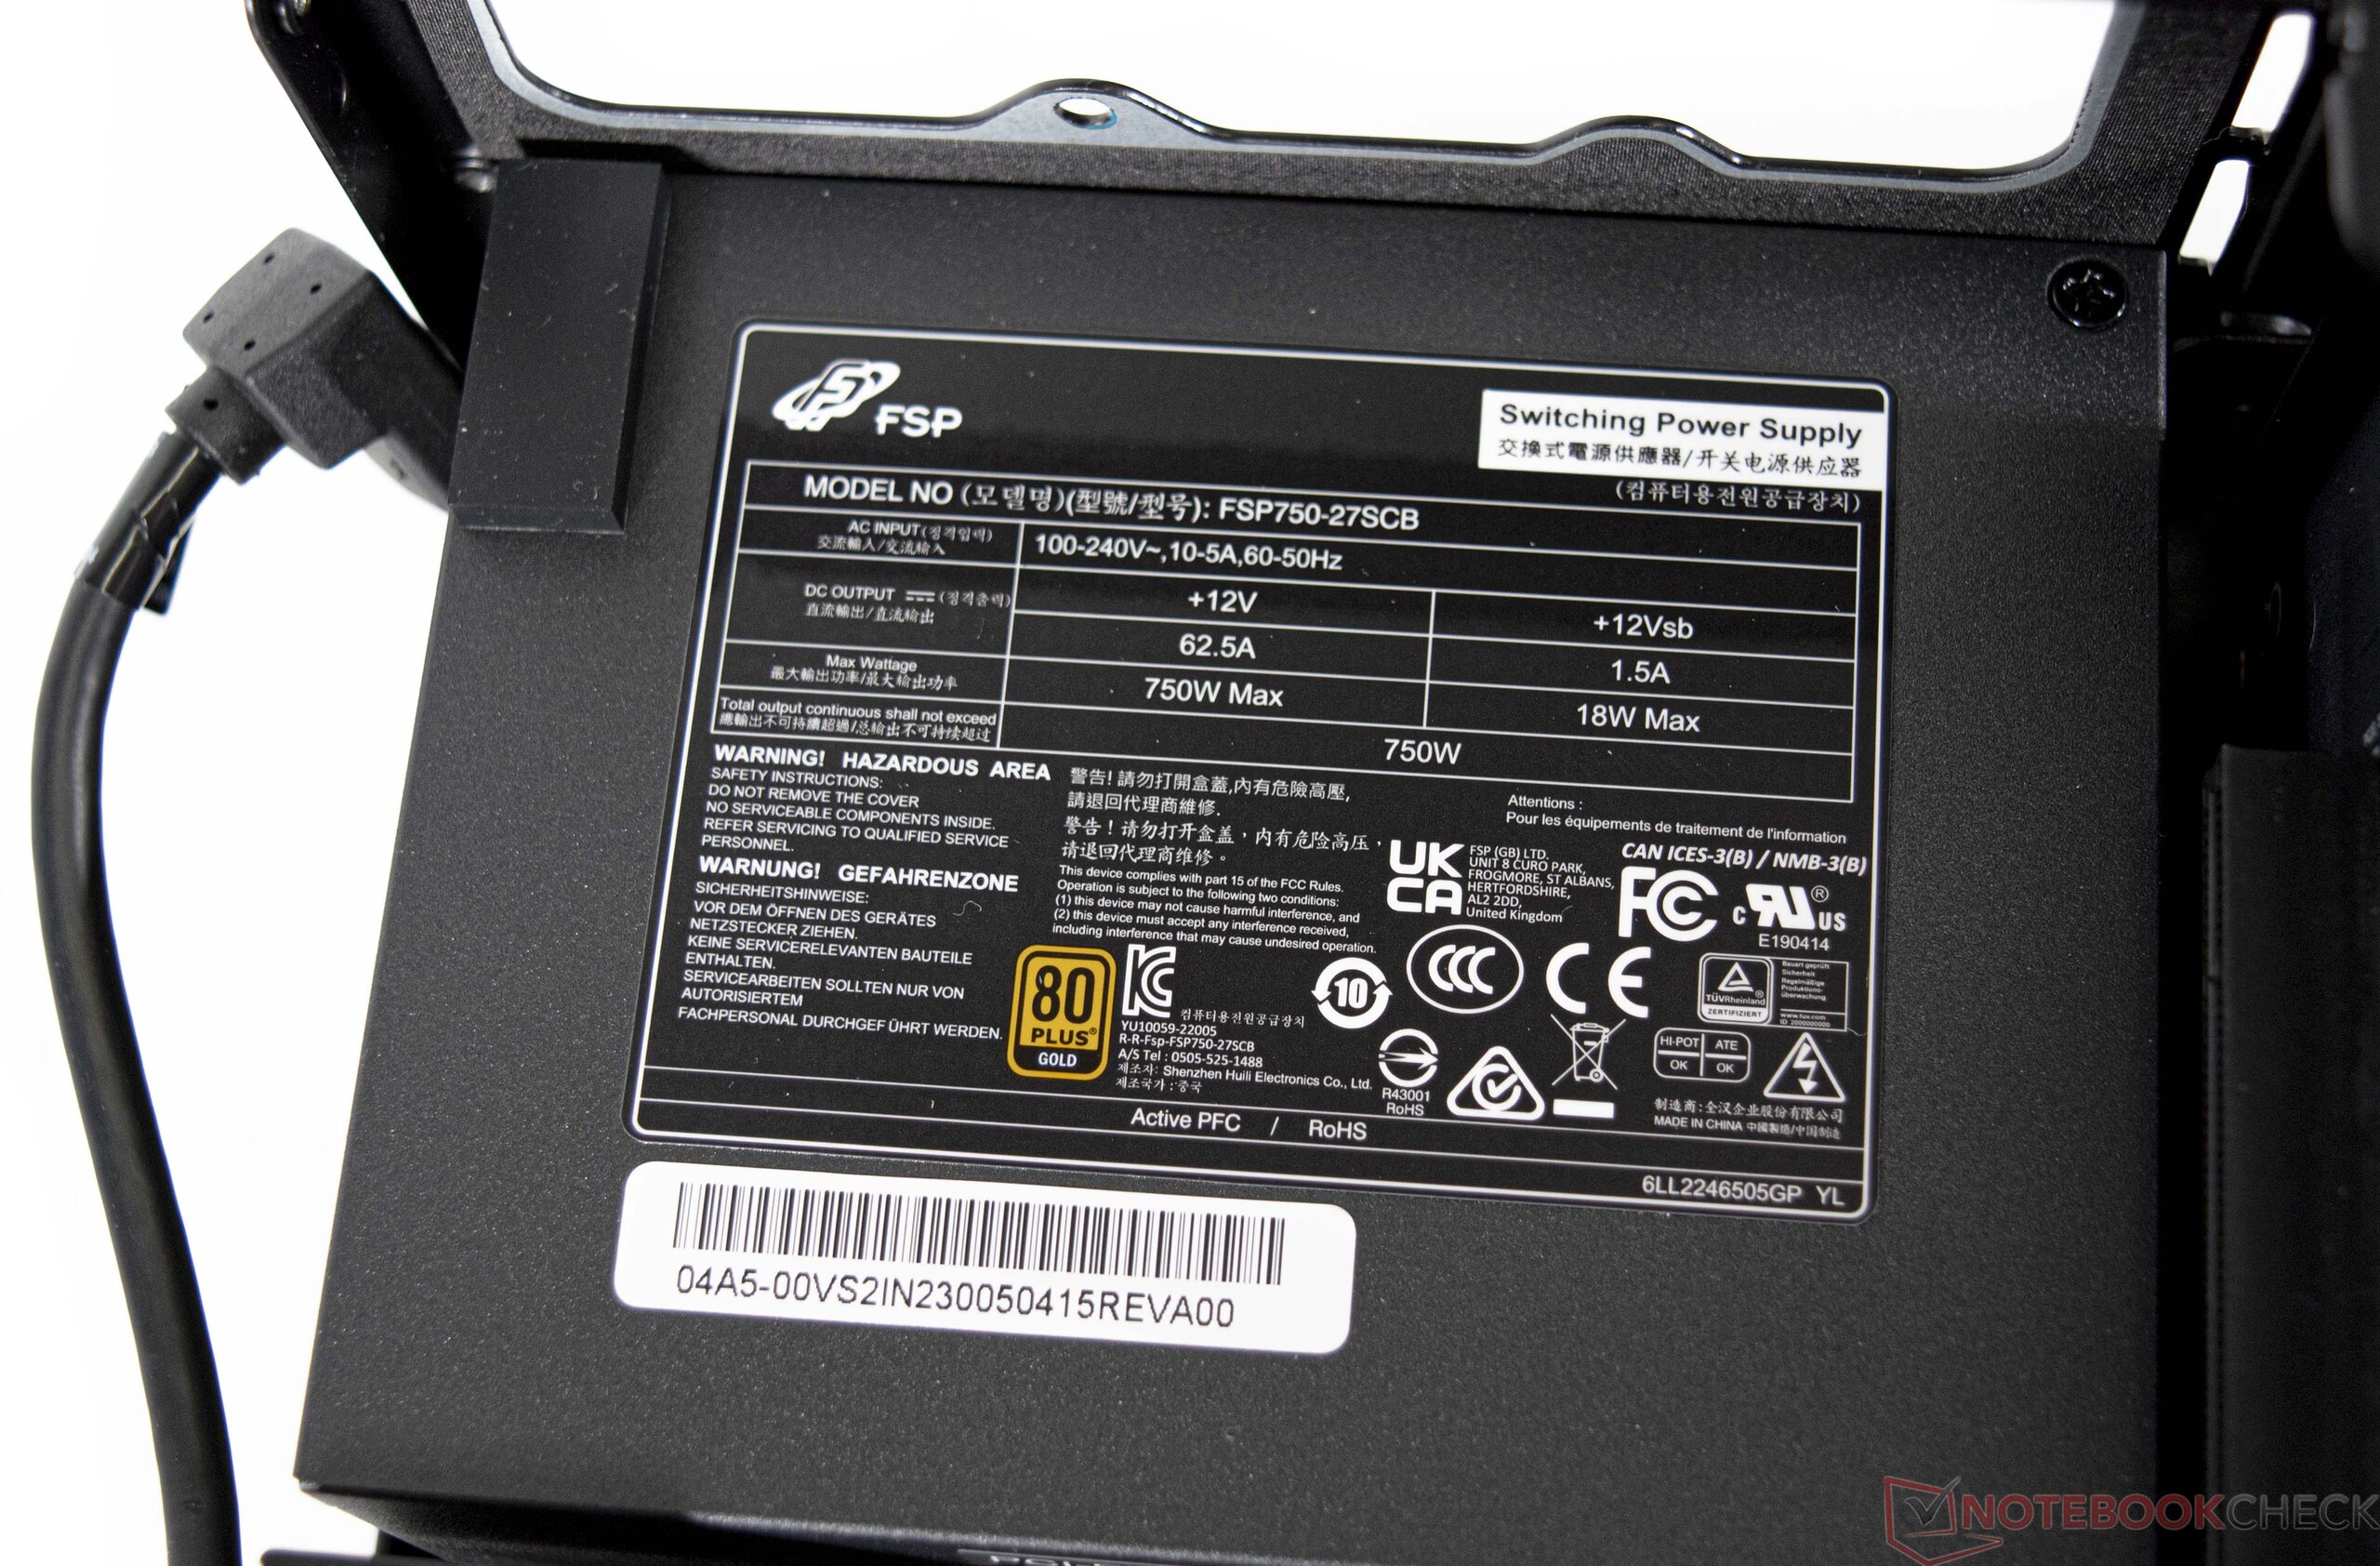
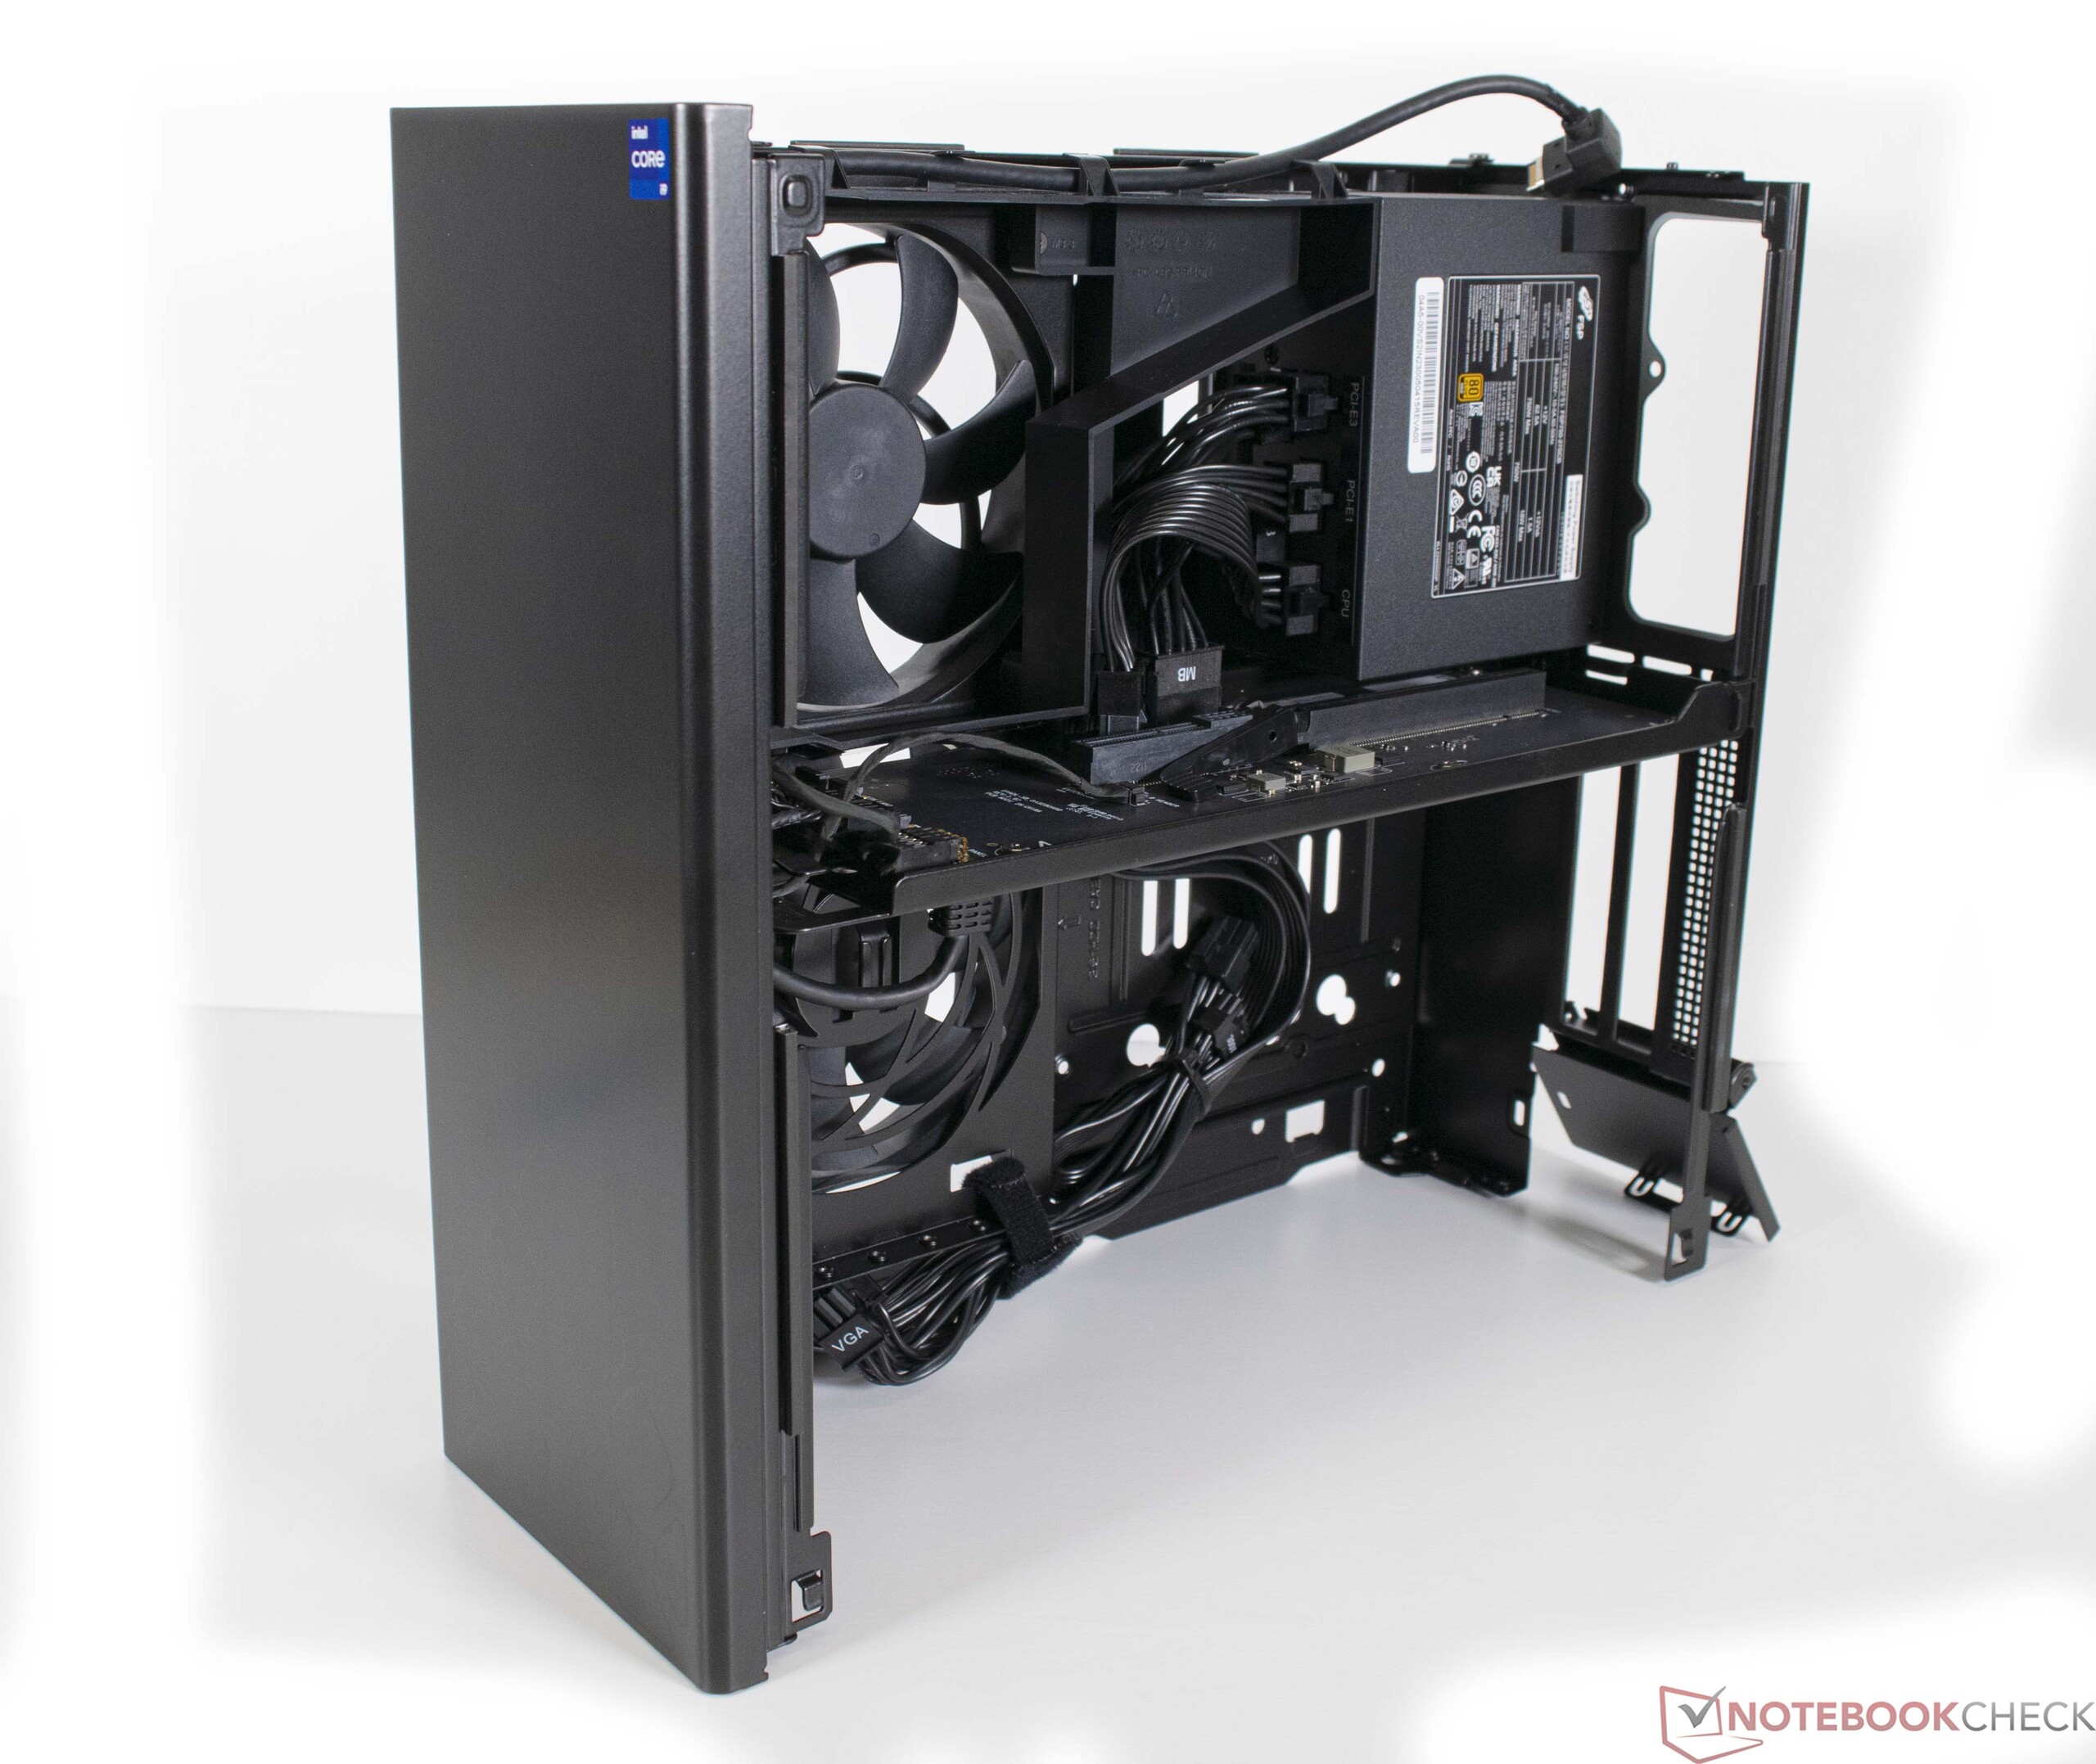
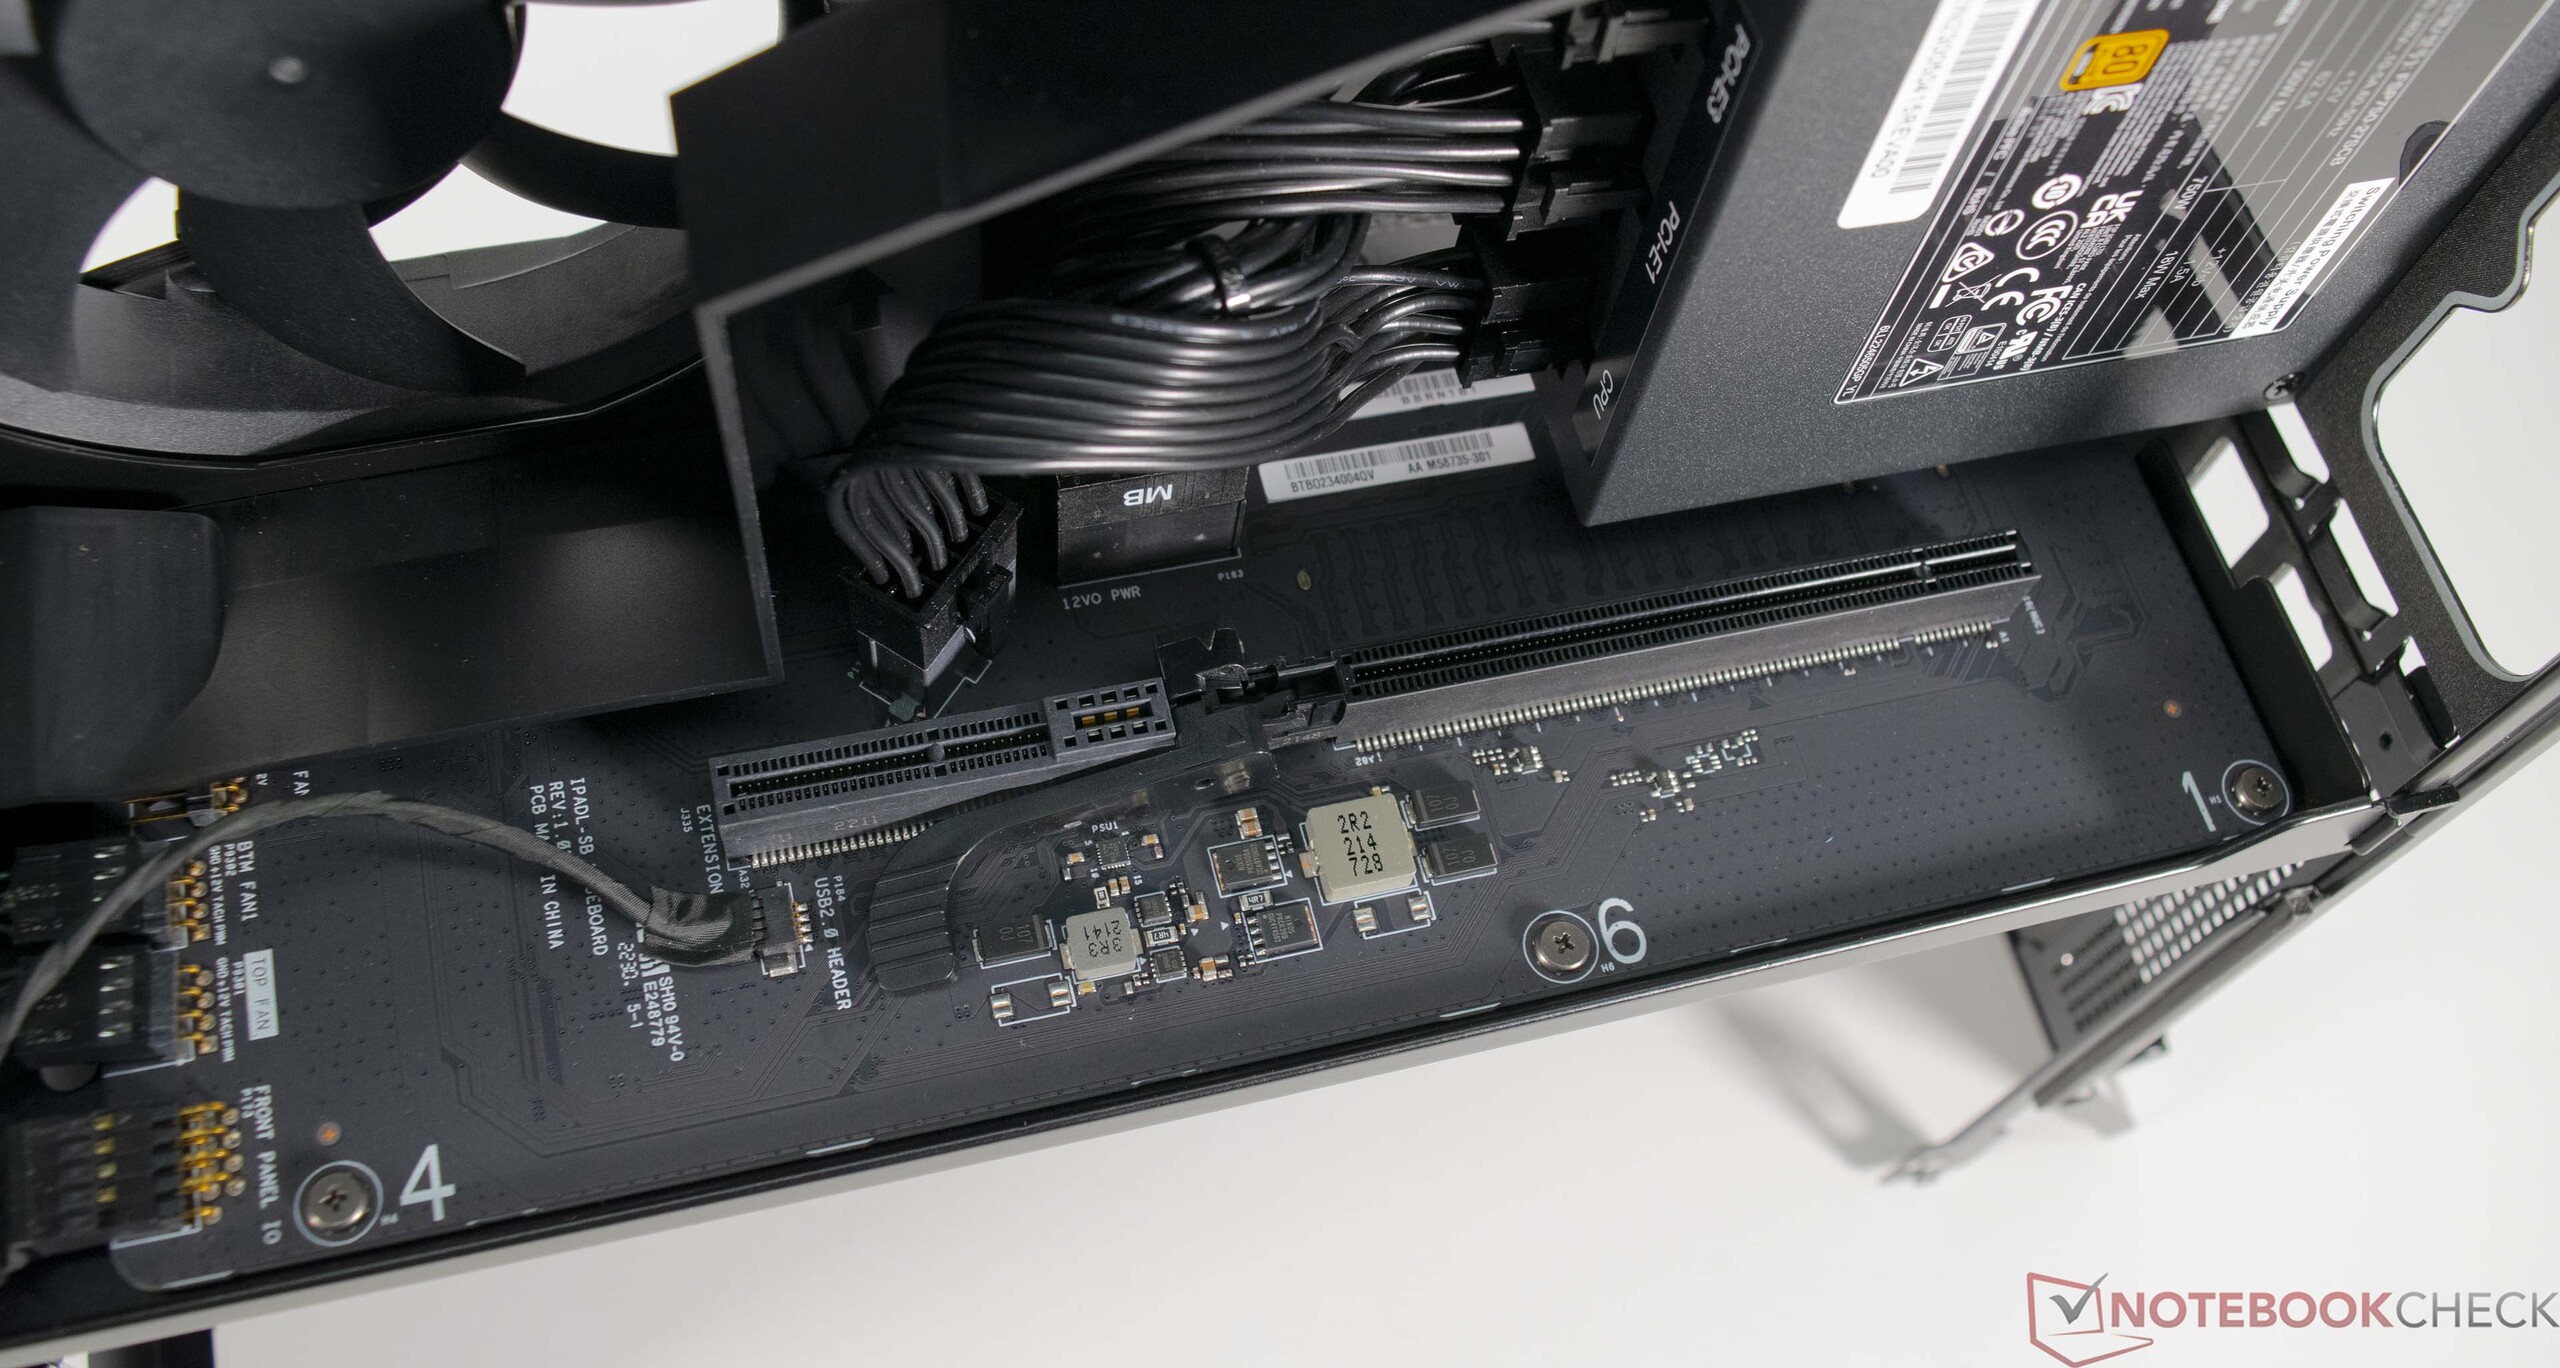
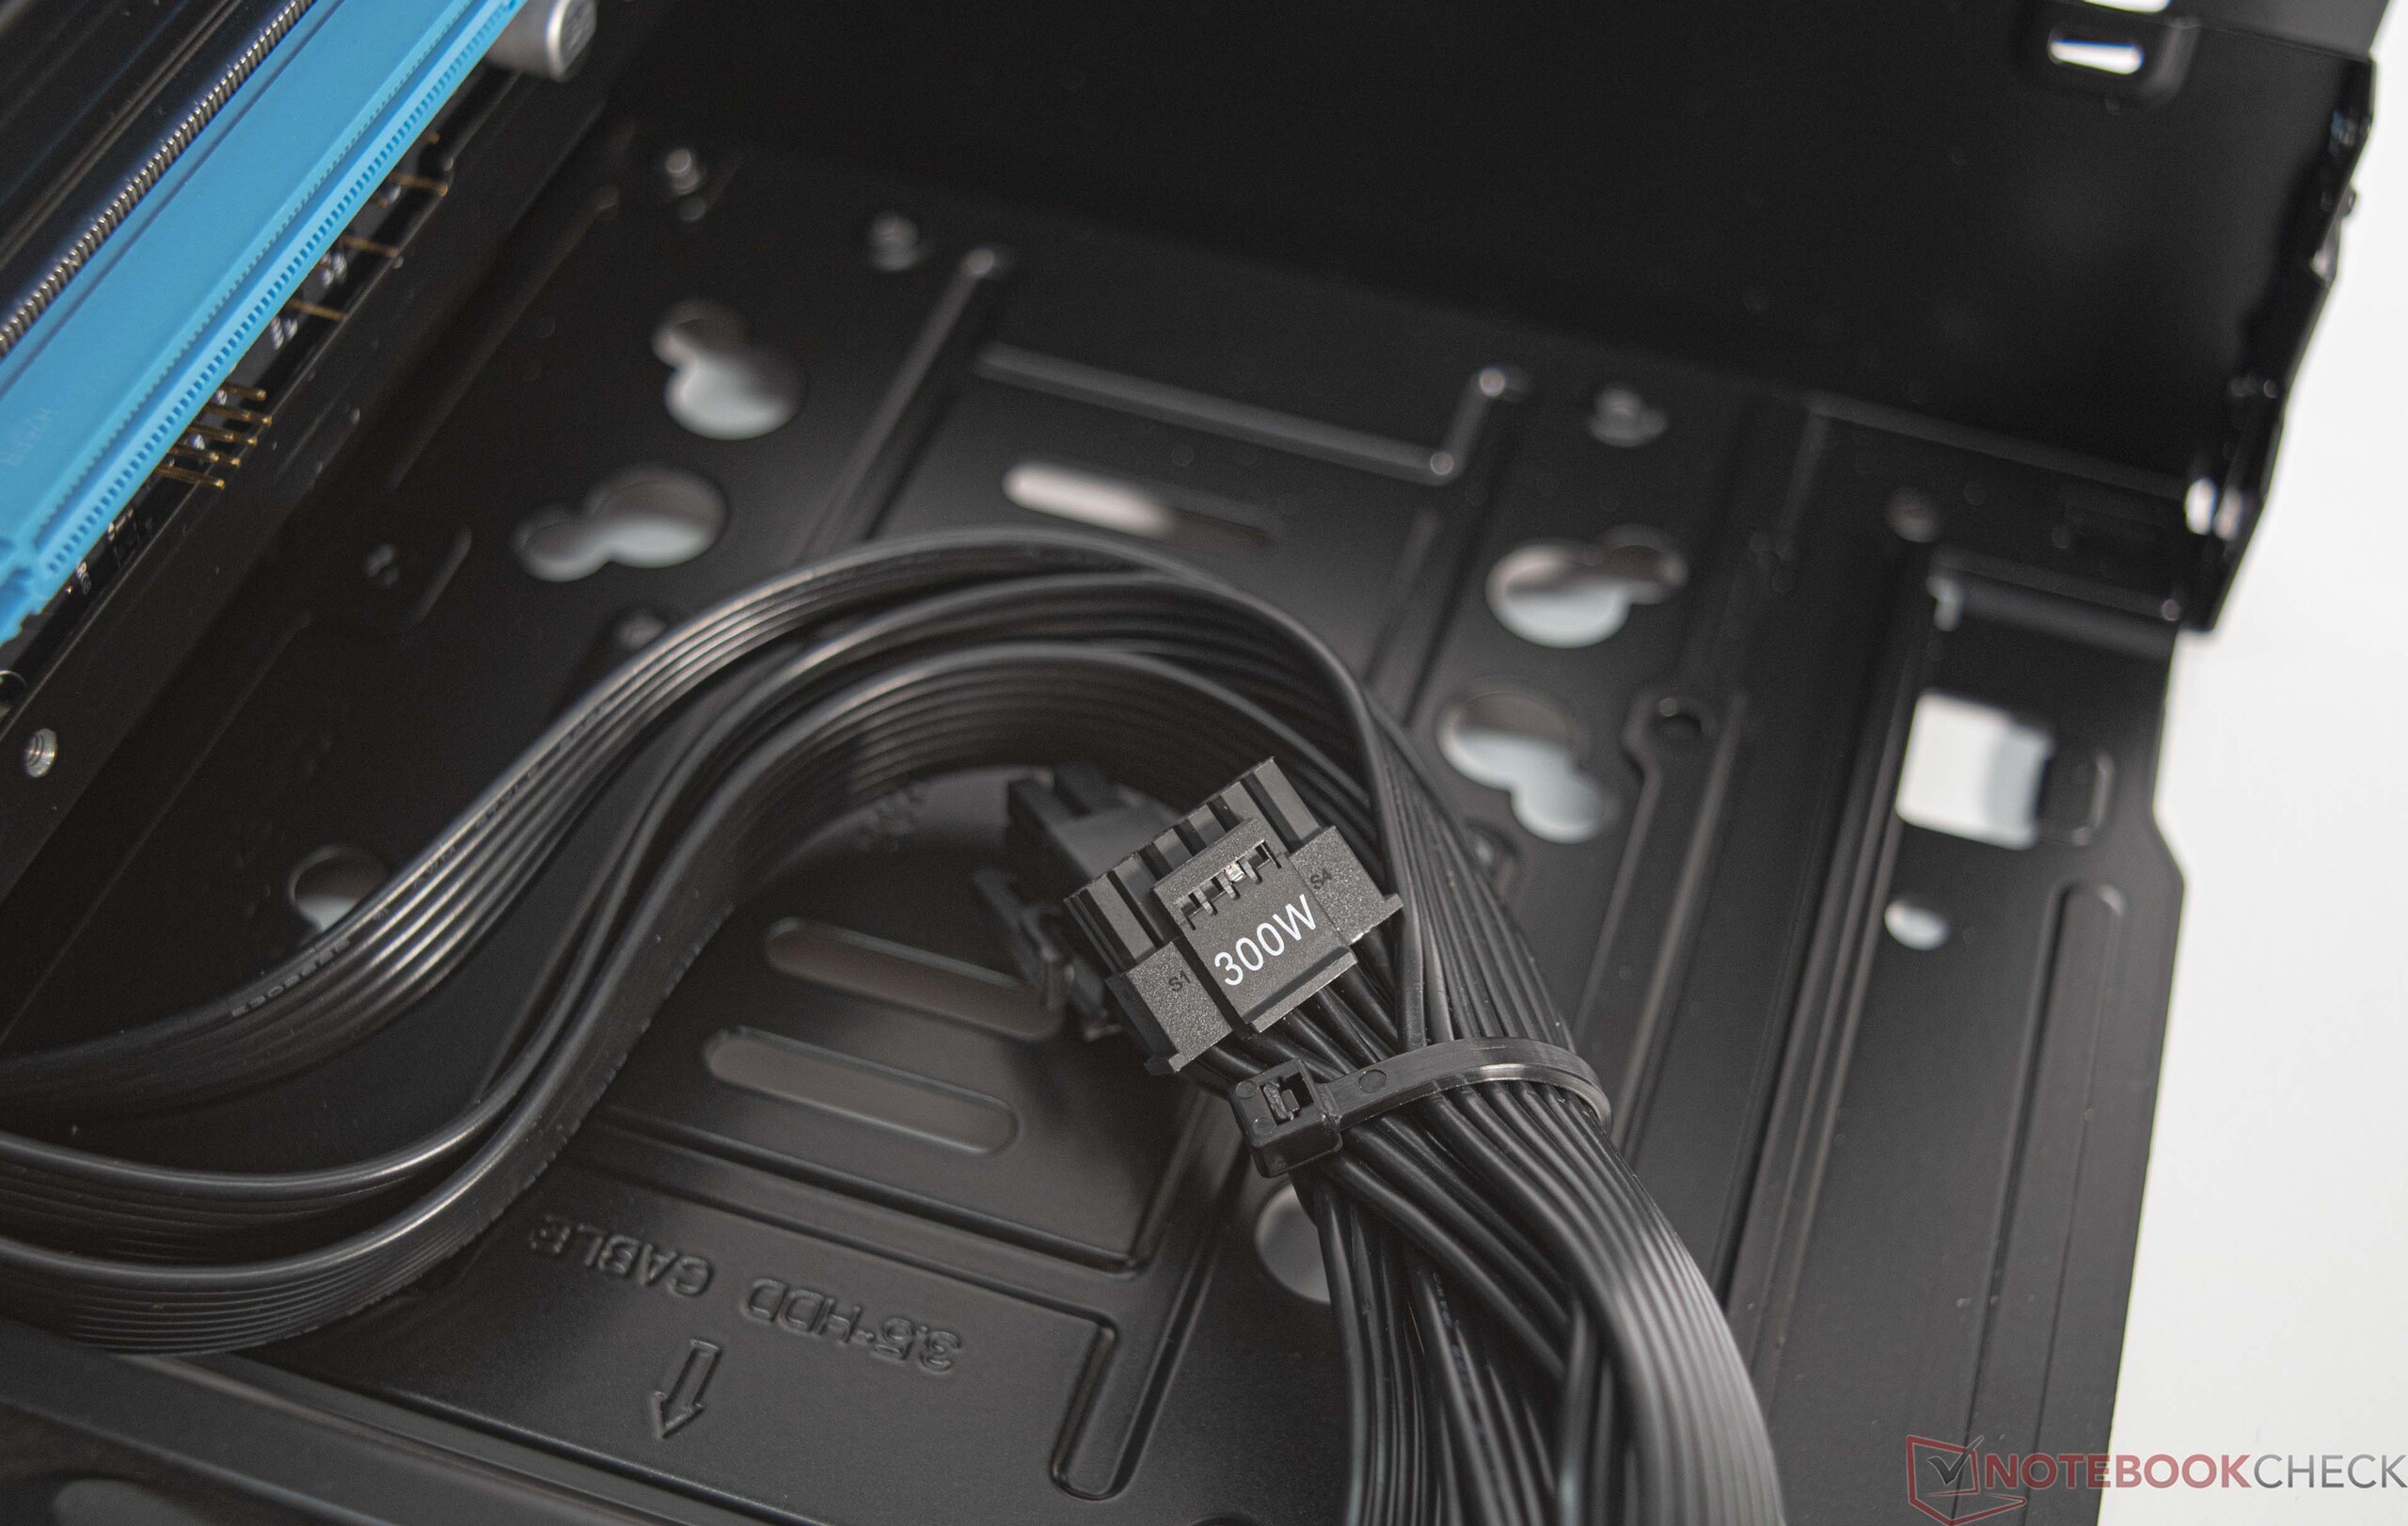
Dedicated grafische oplossingen met een maximale lengte van 31 cm (~12 in) worden ondersteund. Dankzij de meegeleverde SFX-voeding van 750 watt kunnen zelfs de huidige high-end GPU-modellen worden gebruikt. Theoretisch is het mogelijk om zelfs een Nvidia GeForce RTX 4090 FE. Het probleem is de 12VHPWR-kabel, die slechts tot 300 watt kan leveren. Aangezien de voeding alleen wordt geleverd met drie 6+2 kabels voor de GPU, is het stroombudget sowieso beperkt tot 450 watt.

Intel NUC13 Raptor Canyon
Processor
Intel Core i9-13900K 24 x 3 - 5.8 GHz, 250 W PL2 / Short Burst, 150 W PL1 / Sustained, Raptor Lake
Grafische kaart
NVIDIA GeForce RTX 3080 Ti - 12 GB VRAM, Core: 1665 MHz, Geheugen: 1188 MHz, 350 W TDP, Nvidia 526.98
Geheugen
32 GB 
, DDR5-5600, SO-DIMM, 2 of 2 occupied, up to 64 GB
Moederbord
Intel Z690 (Alder Lake-S PCH)
Opslag
Kingston Fury Renegade SFYRS1000G, 1024 GB 
, M.2-2280 NVMe
Geluidskaart
Intel Alder Lake-S PCH - cAVS (Audio, Voice, Speech)
Verbindingen
2 USB 3.0, 7 USB 3.1 Gen2, 2 USB 3.2 Gen 2x2 20Gbps, 2 Thunderbolt, 1 HDMI
Netwerkmogelijkheden
Aquantia AQtion 10Gbit Network Adapter (10/100/1000/2500/5000/10000MBit/s), Killer Wi-Fi 6E AX1690i 160MHz (a/b/g/h/n = Wi-Fi 4/ac = Wi-Fi 5/ax = Wi-Fi 6/ Wi-Fi 6E 6 GHz), Bluetooth 5.2
Afmetingen
hoogte x breedte x diepte (in mm): 318 x 129 x 337
Besturingssysteem
Microsoft Windows 11 Pro
Bijkomende functionaliteiten
36 Maanden Garantie
Opmerking: De fabrikant kan onderdelen van verschillende leveranciers gebruiken, waaronder beeldschermen, schijven of geheugensticks met vergelijkbare specificaties.


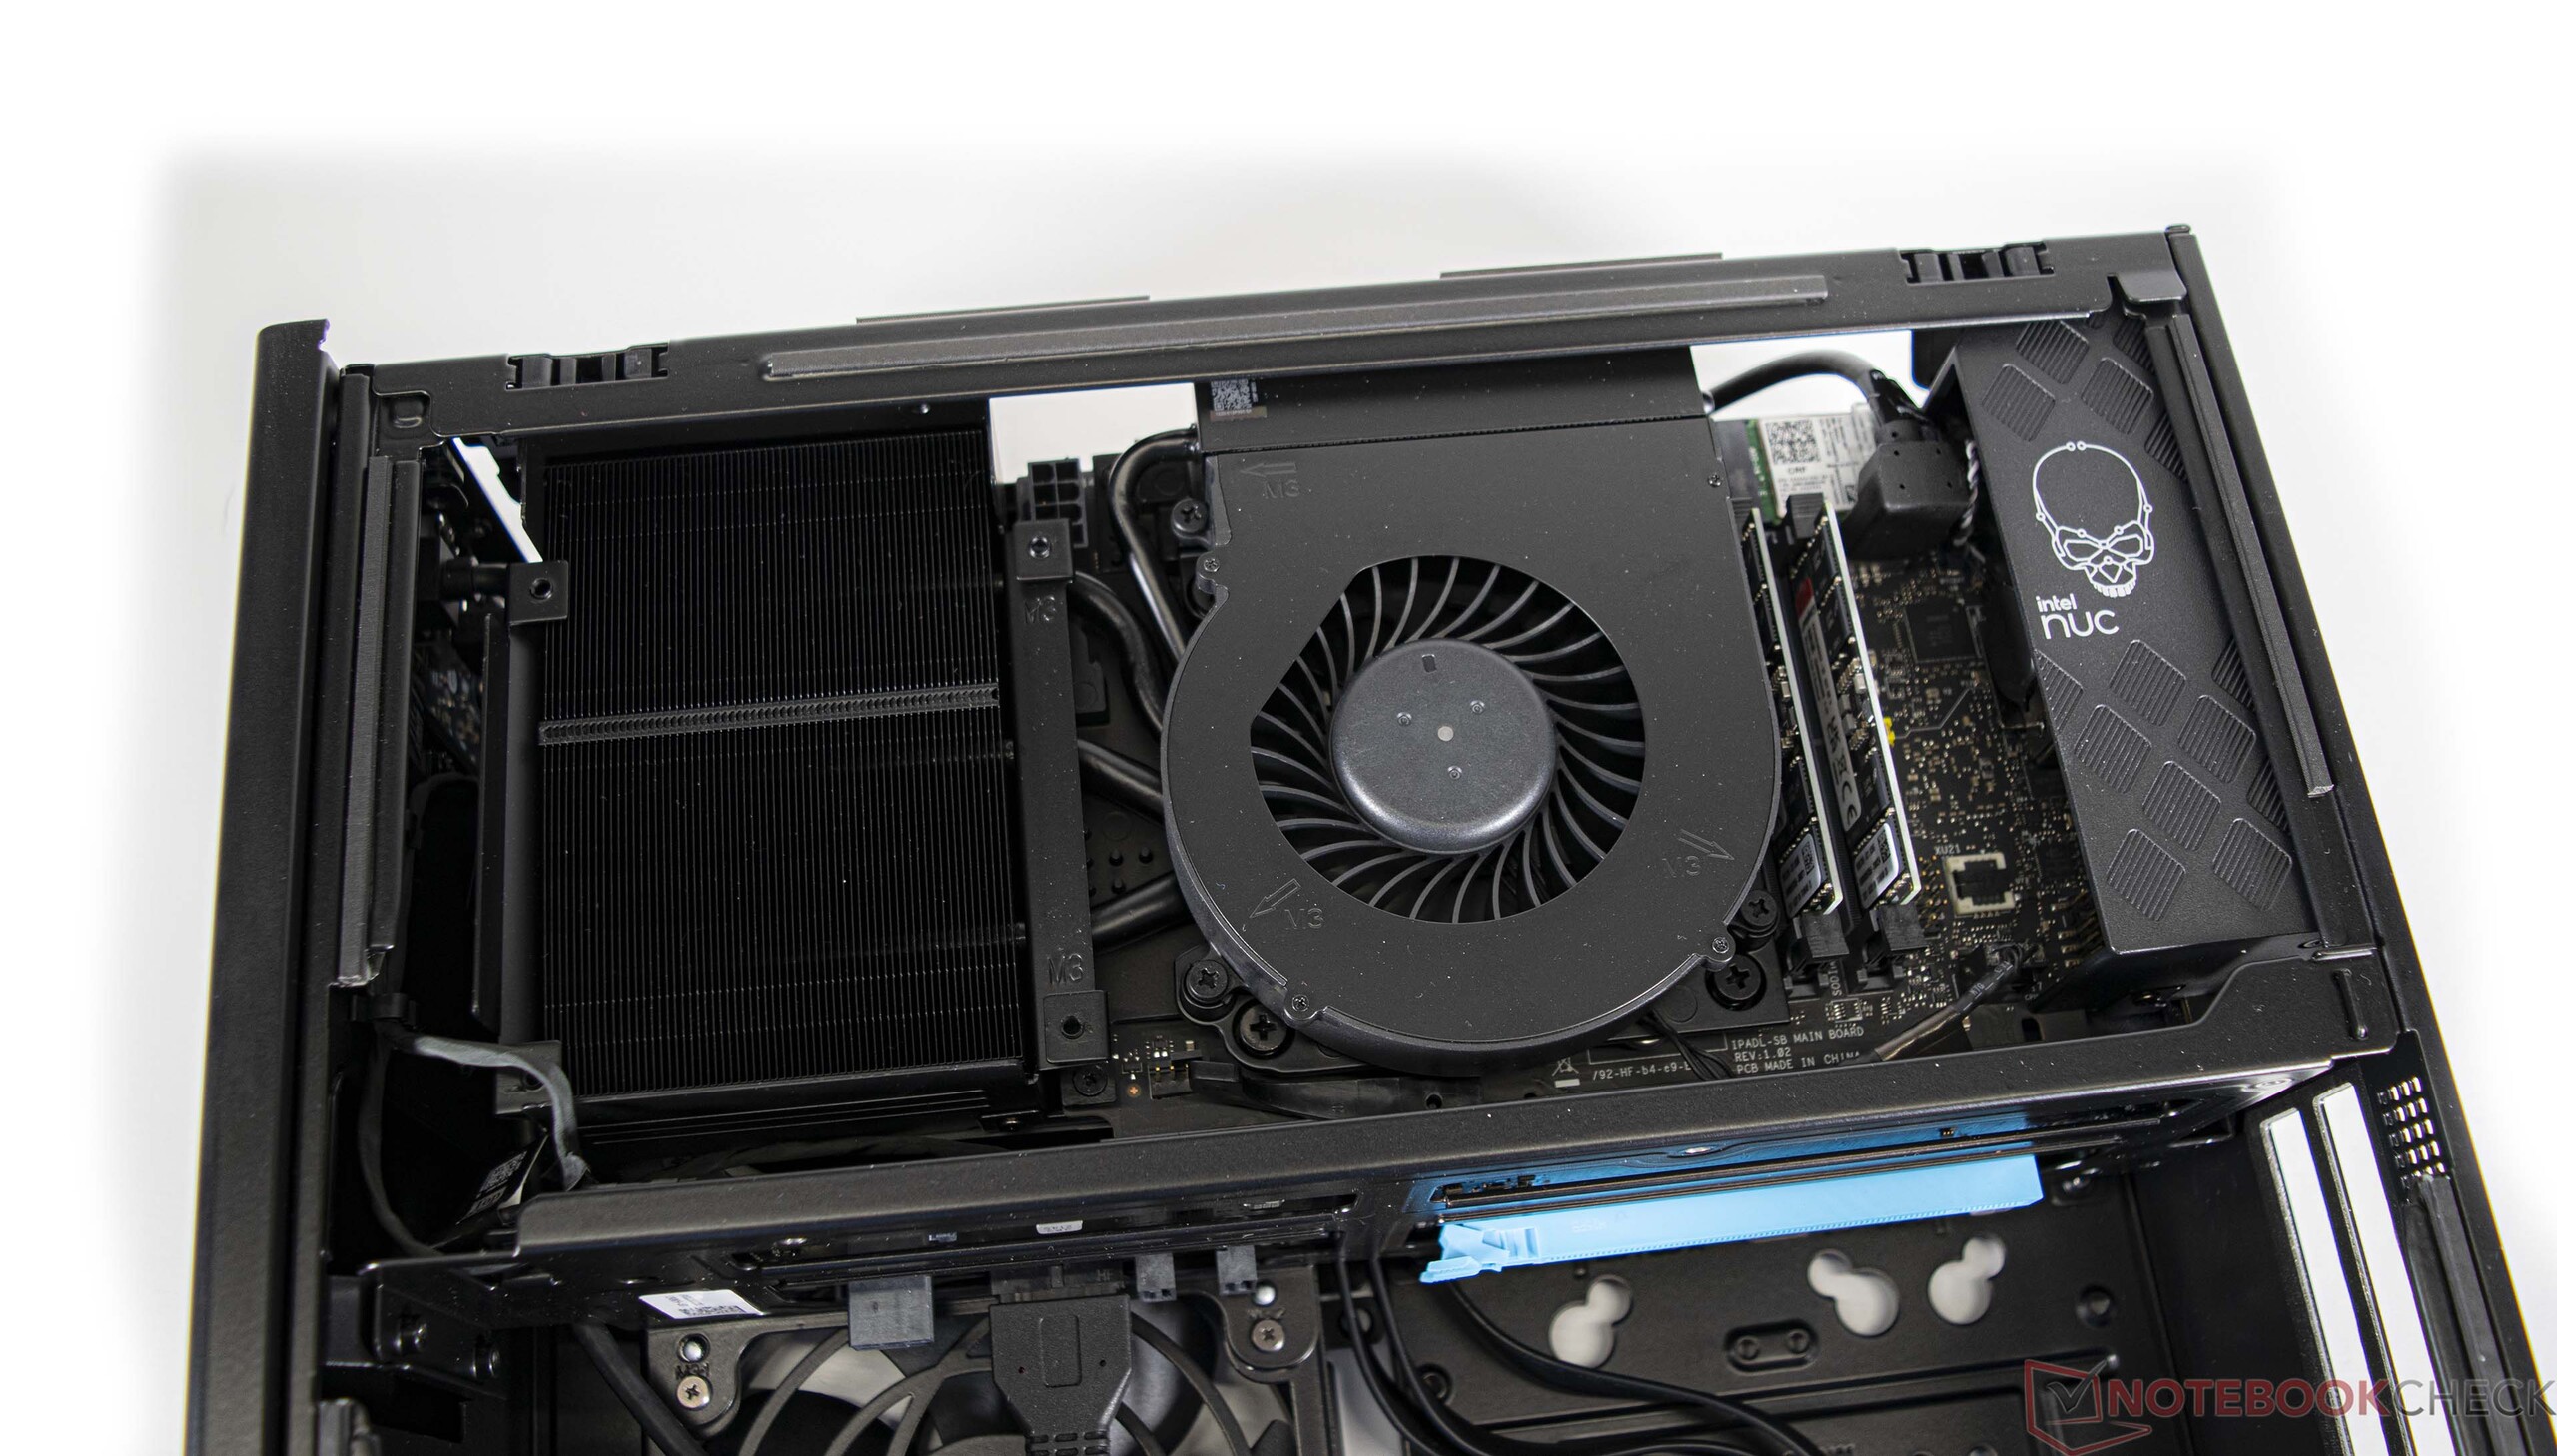
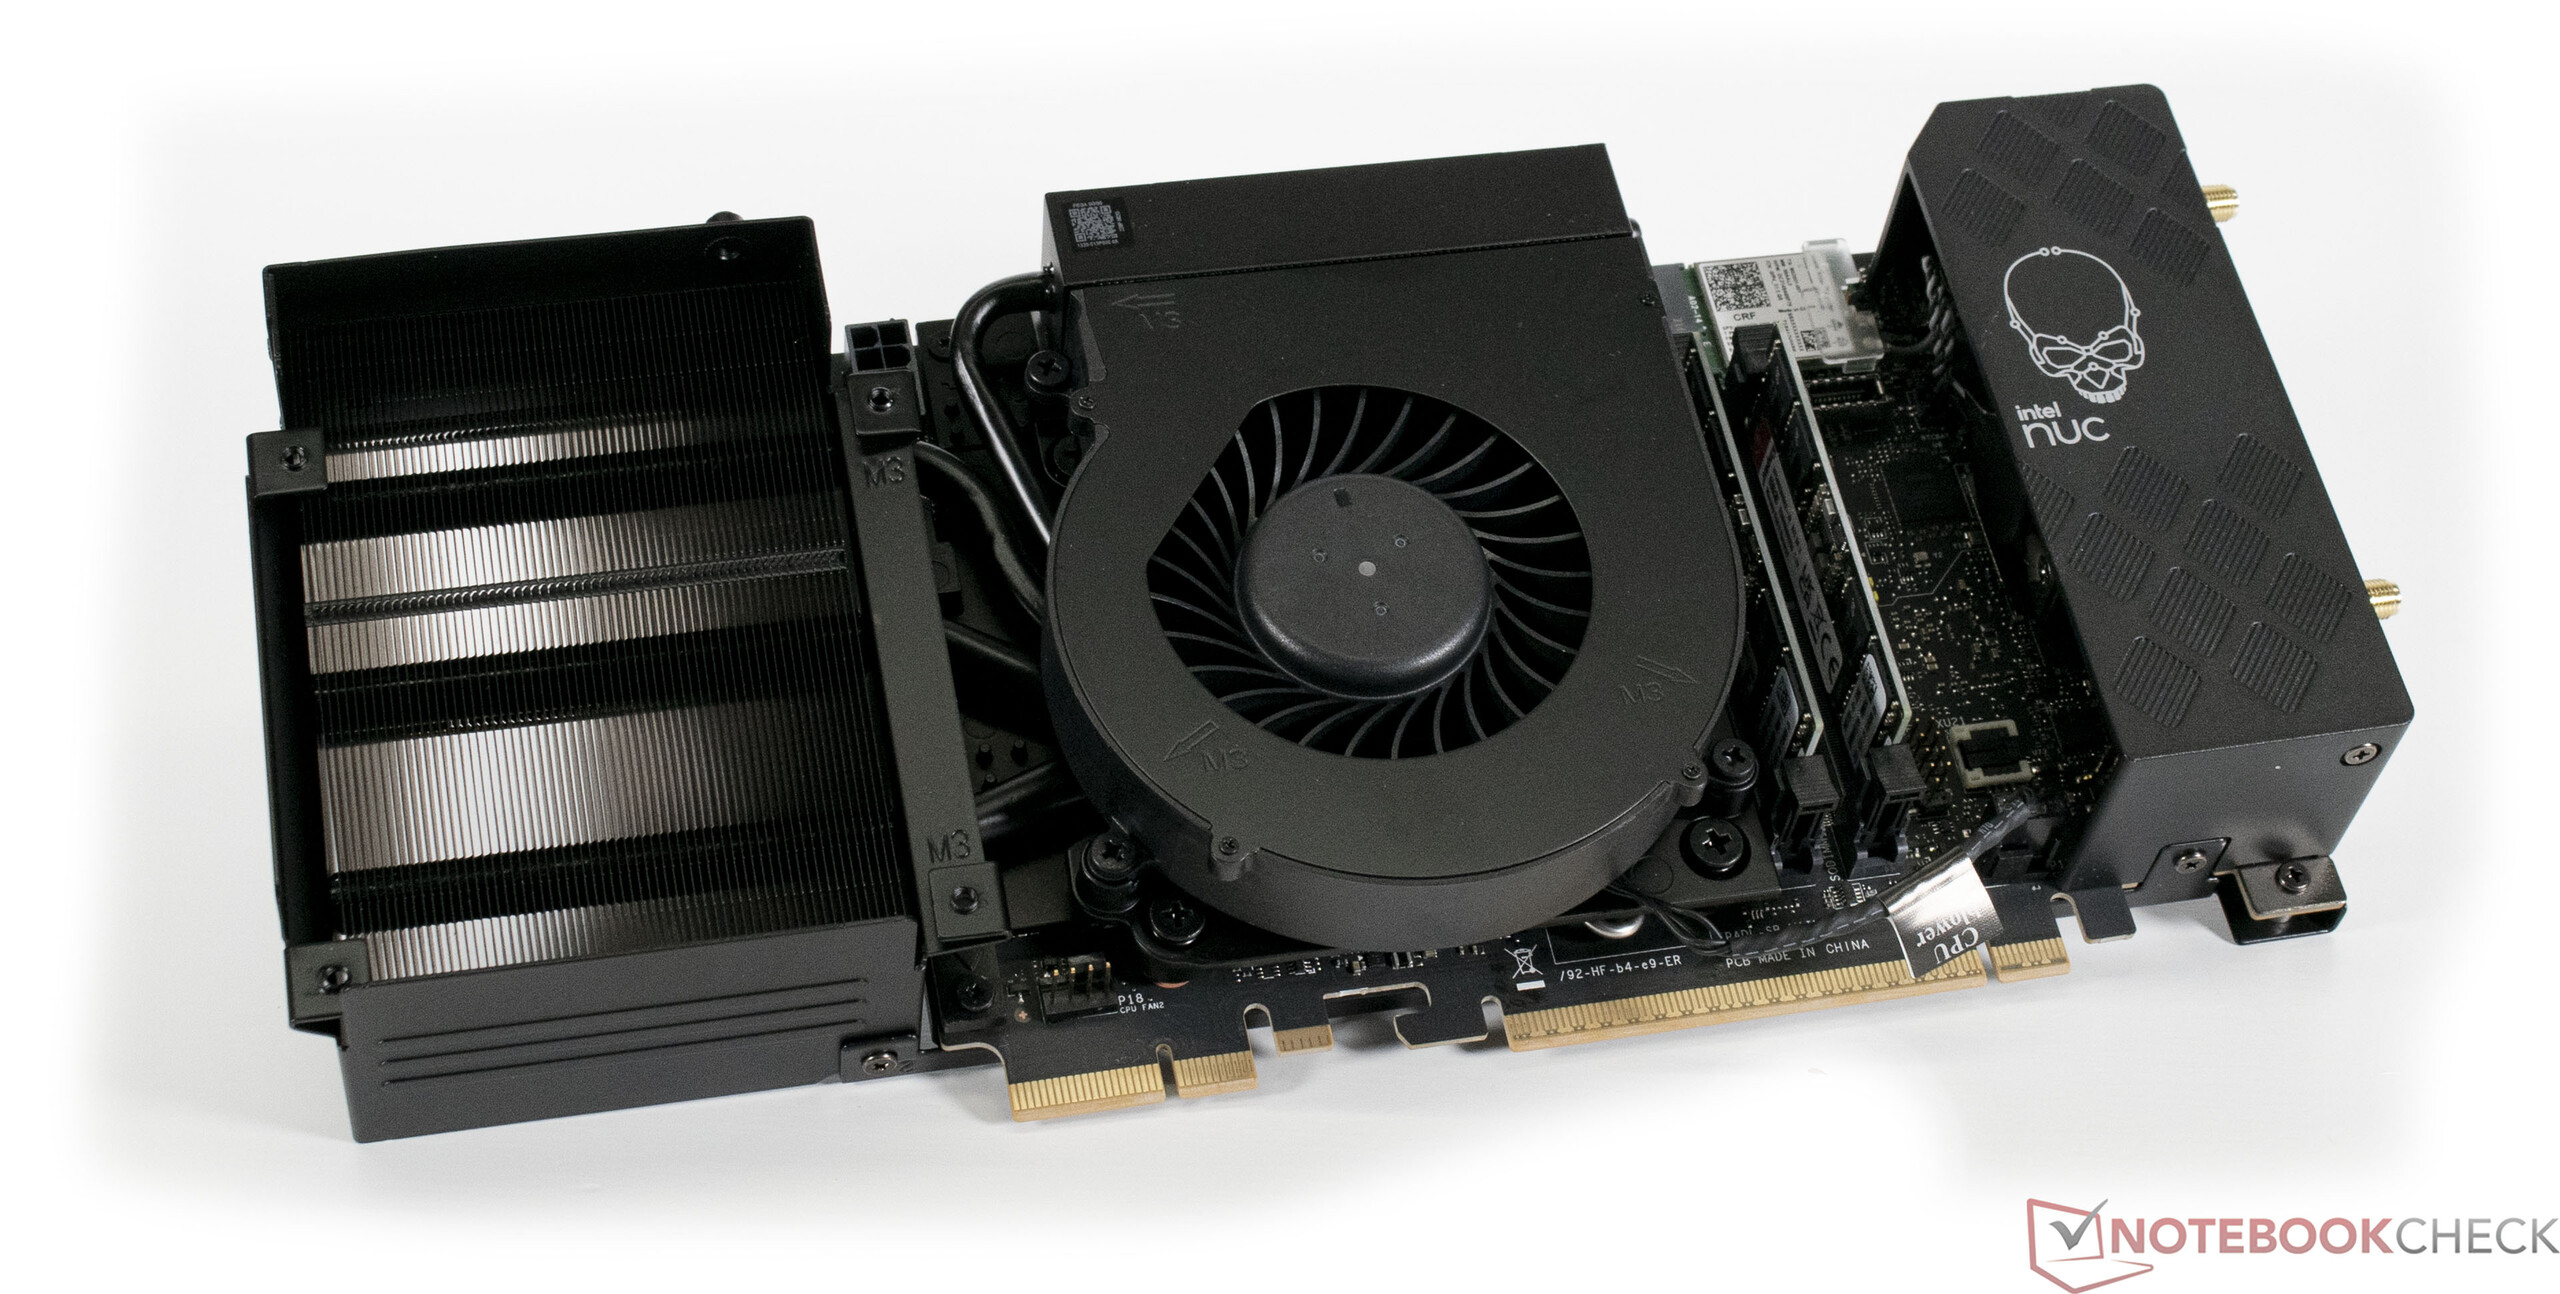
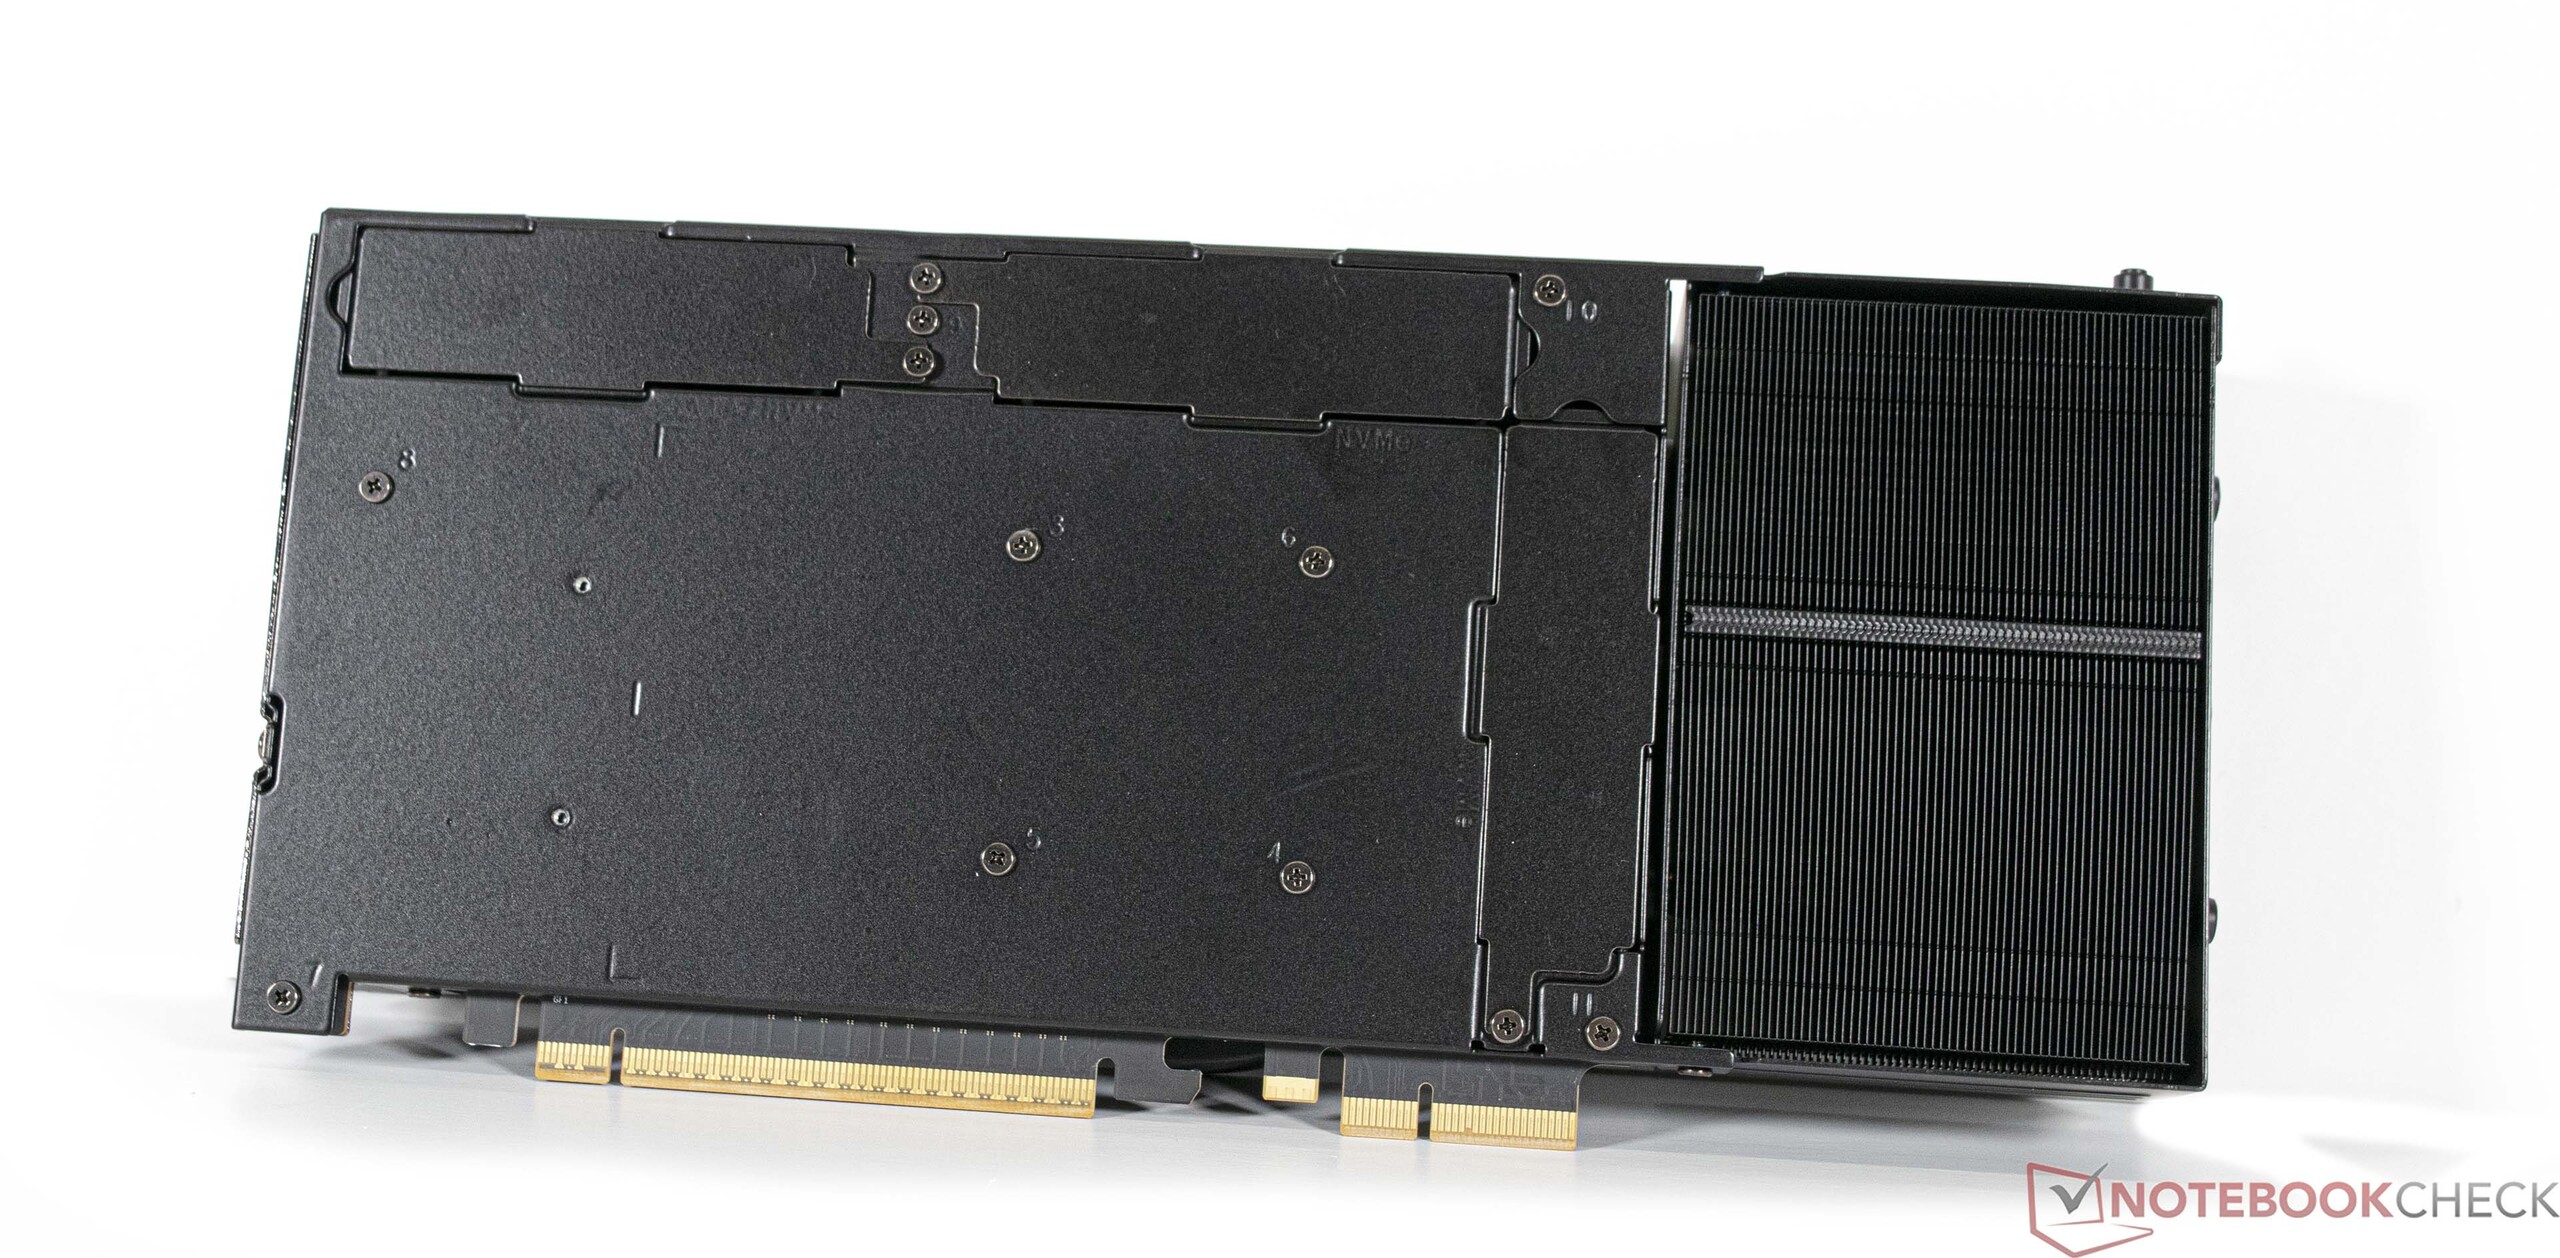
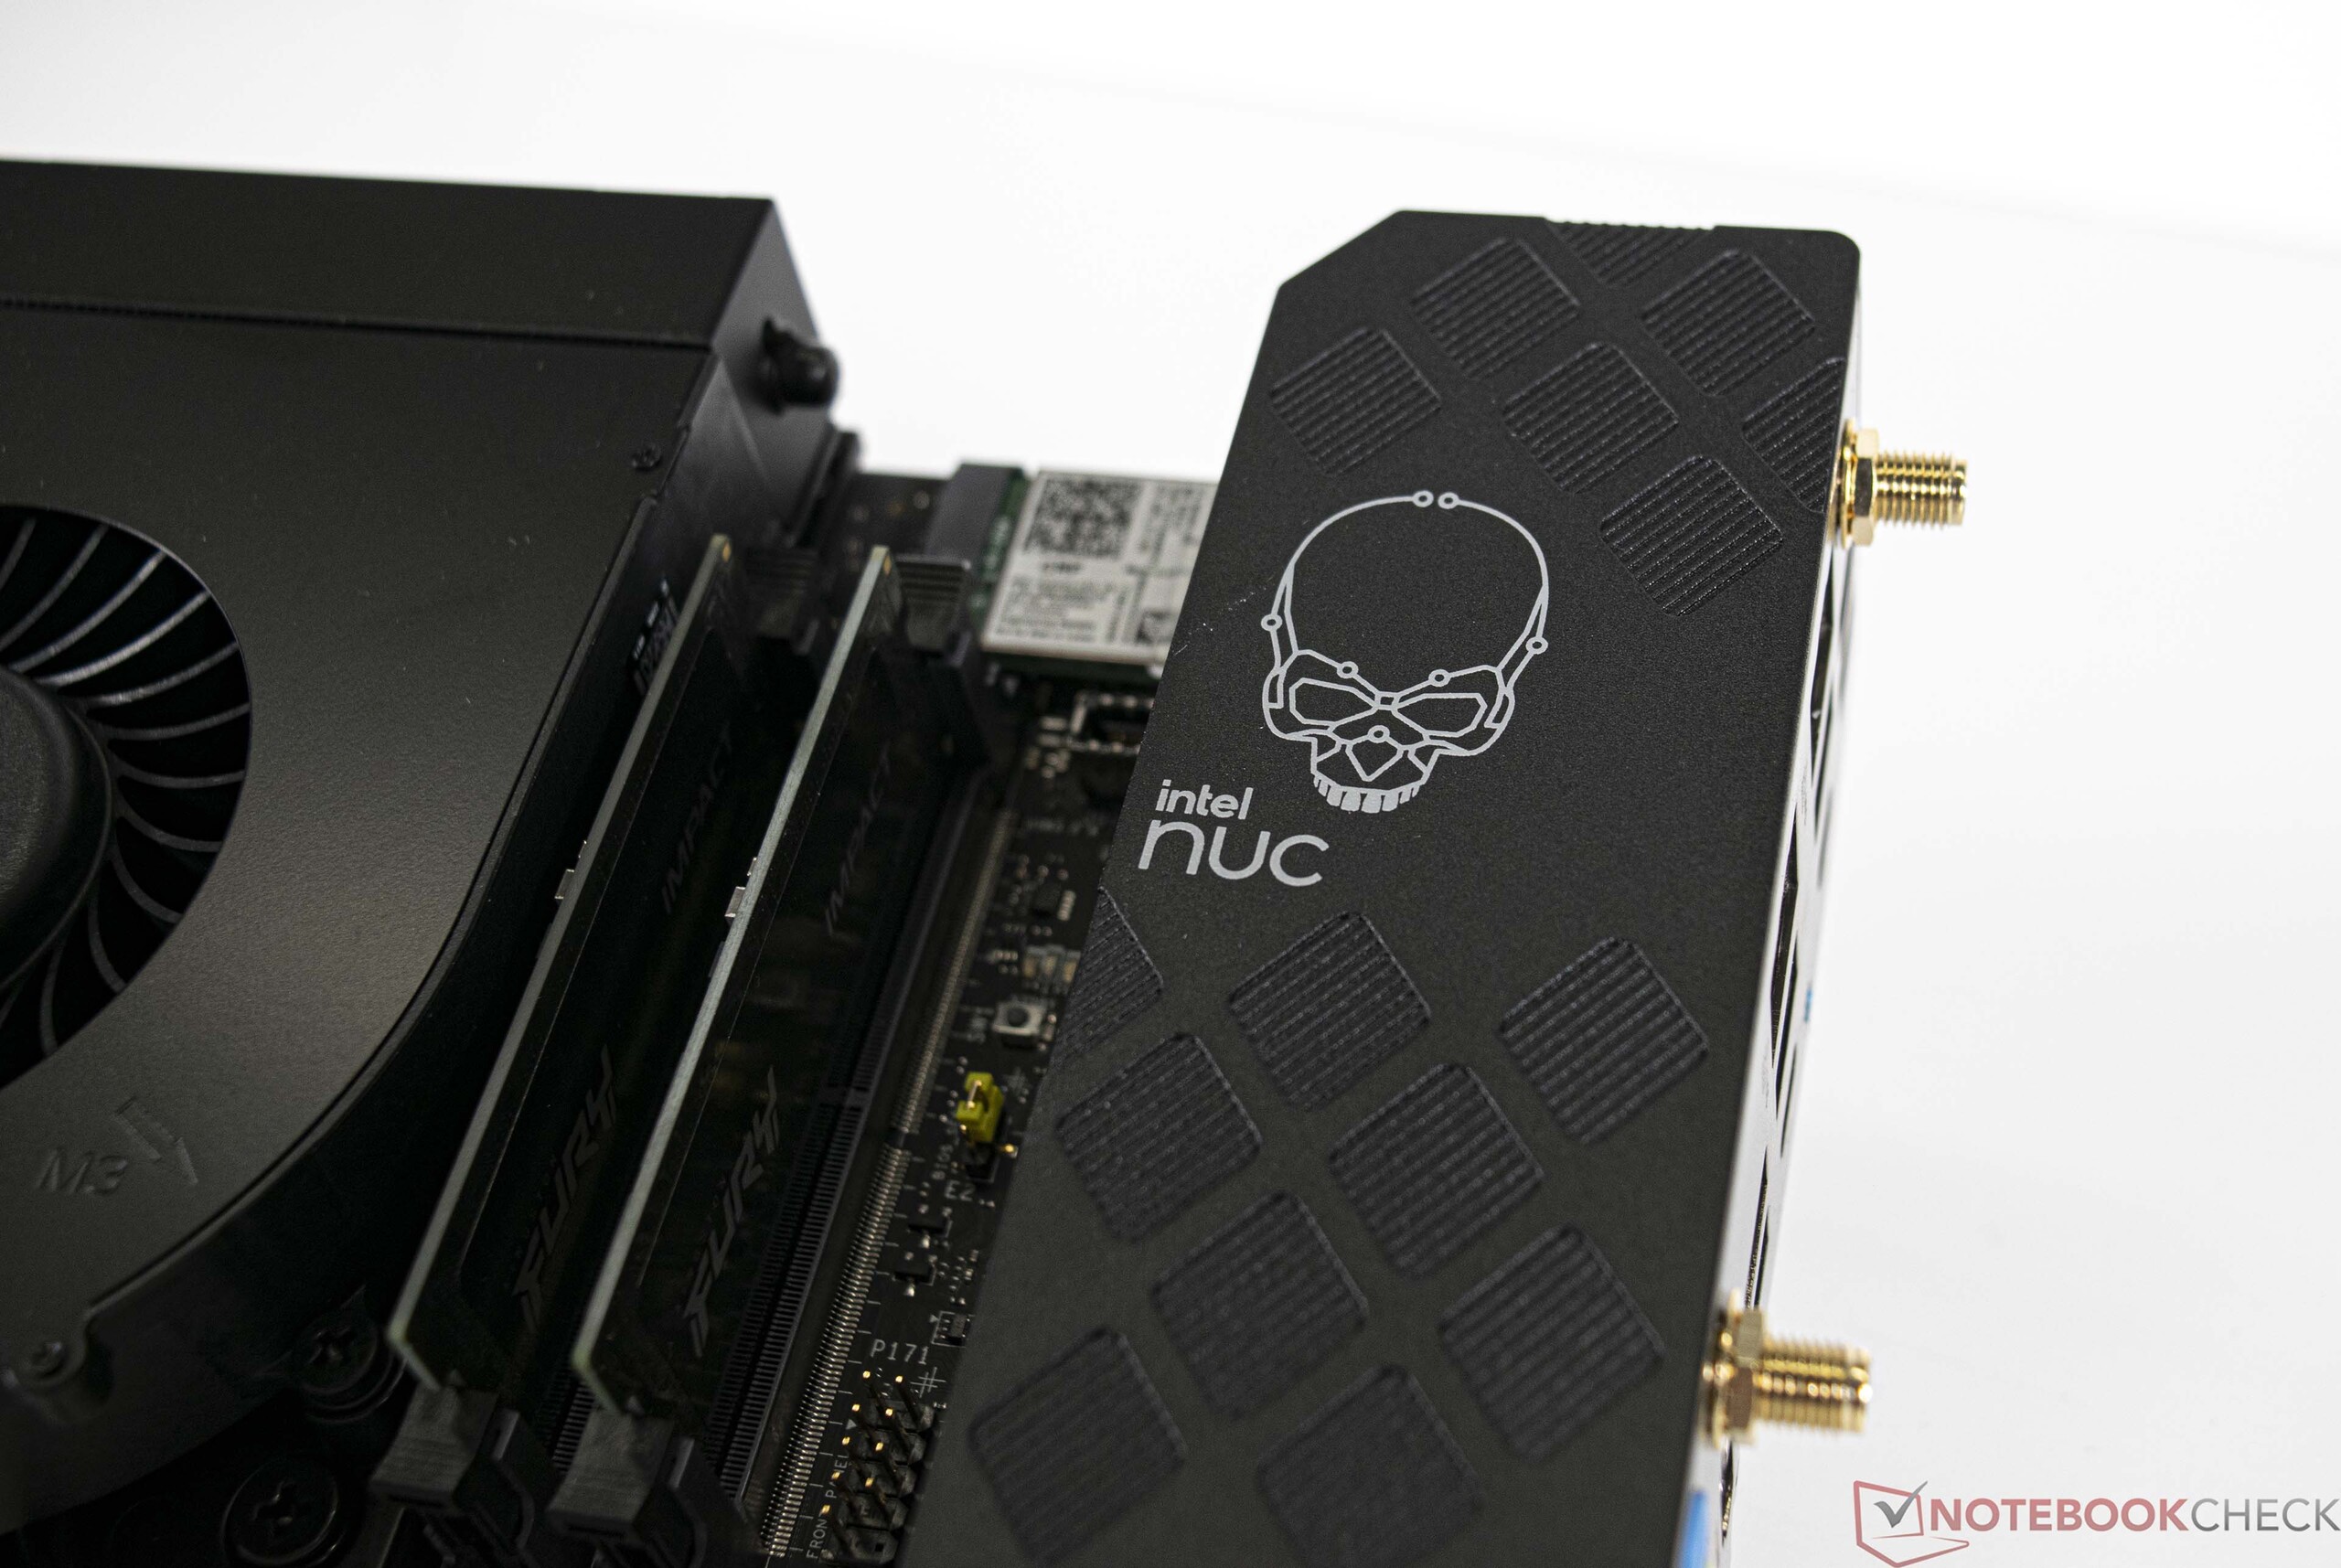
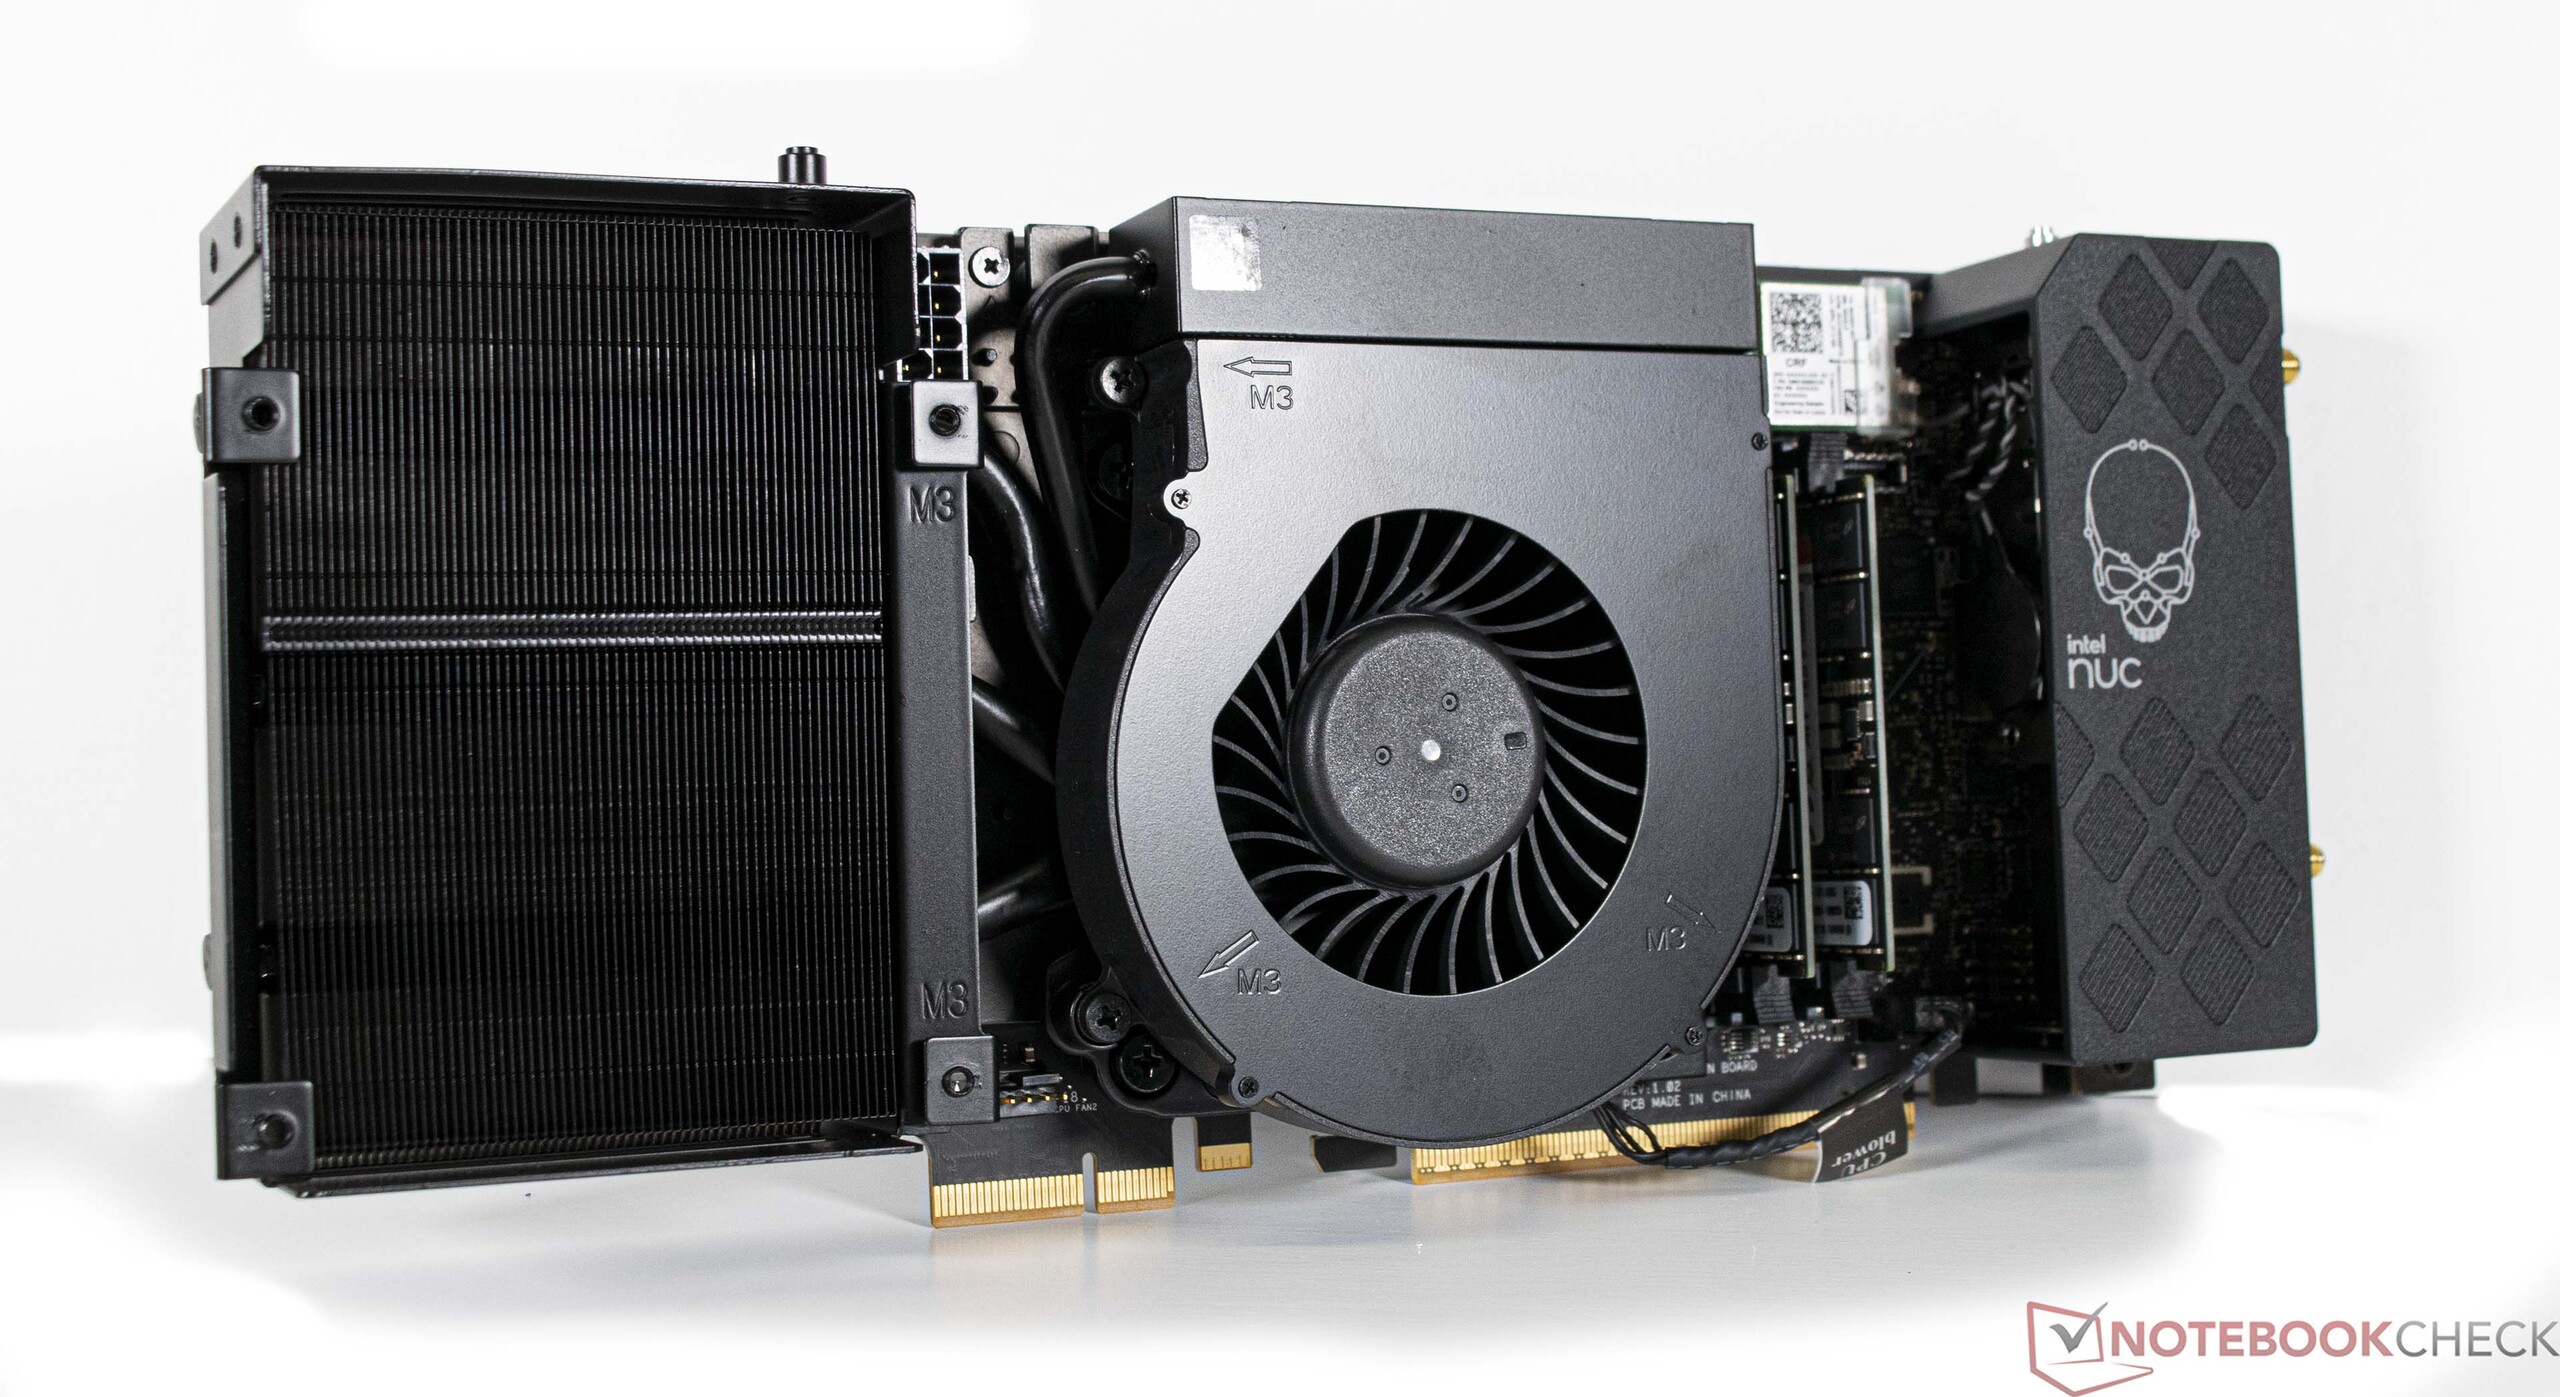
Intel NUC 13 Extreme Compute Element in detail

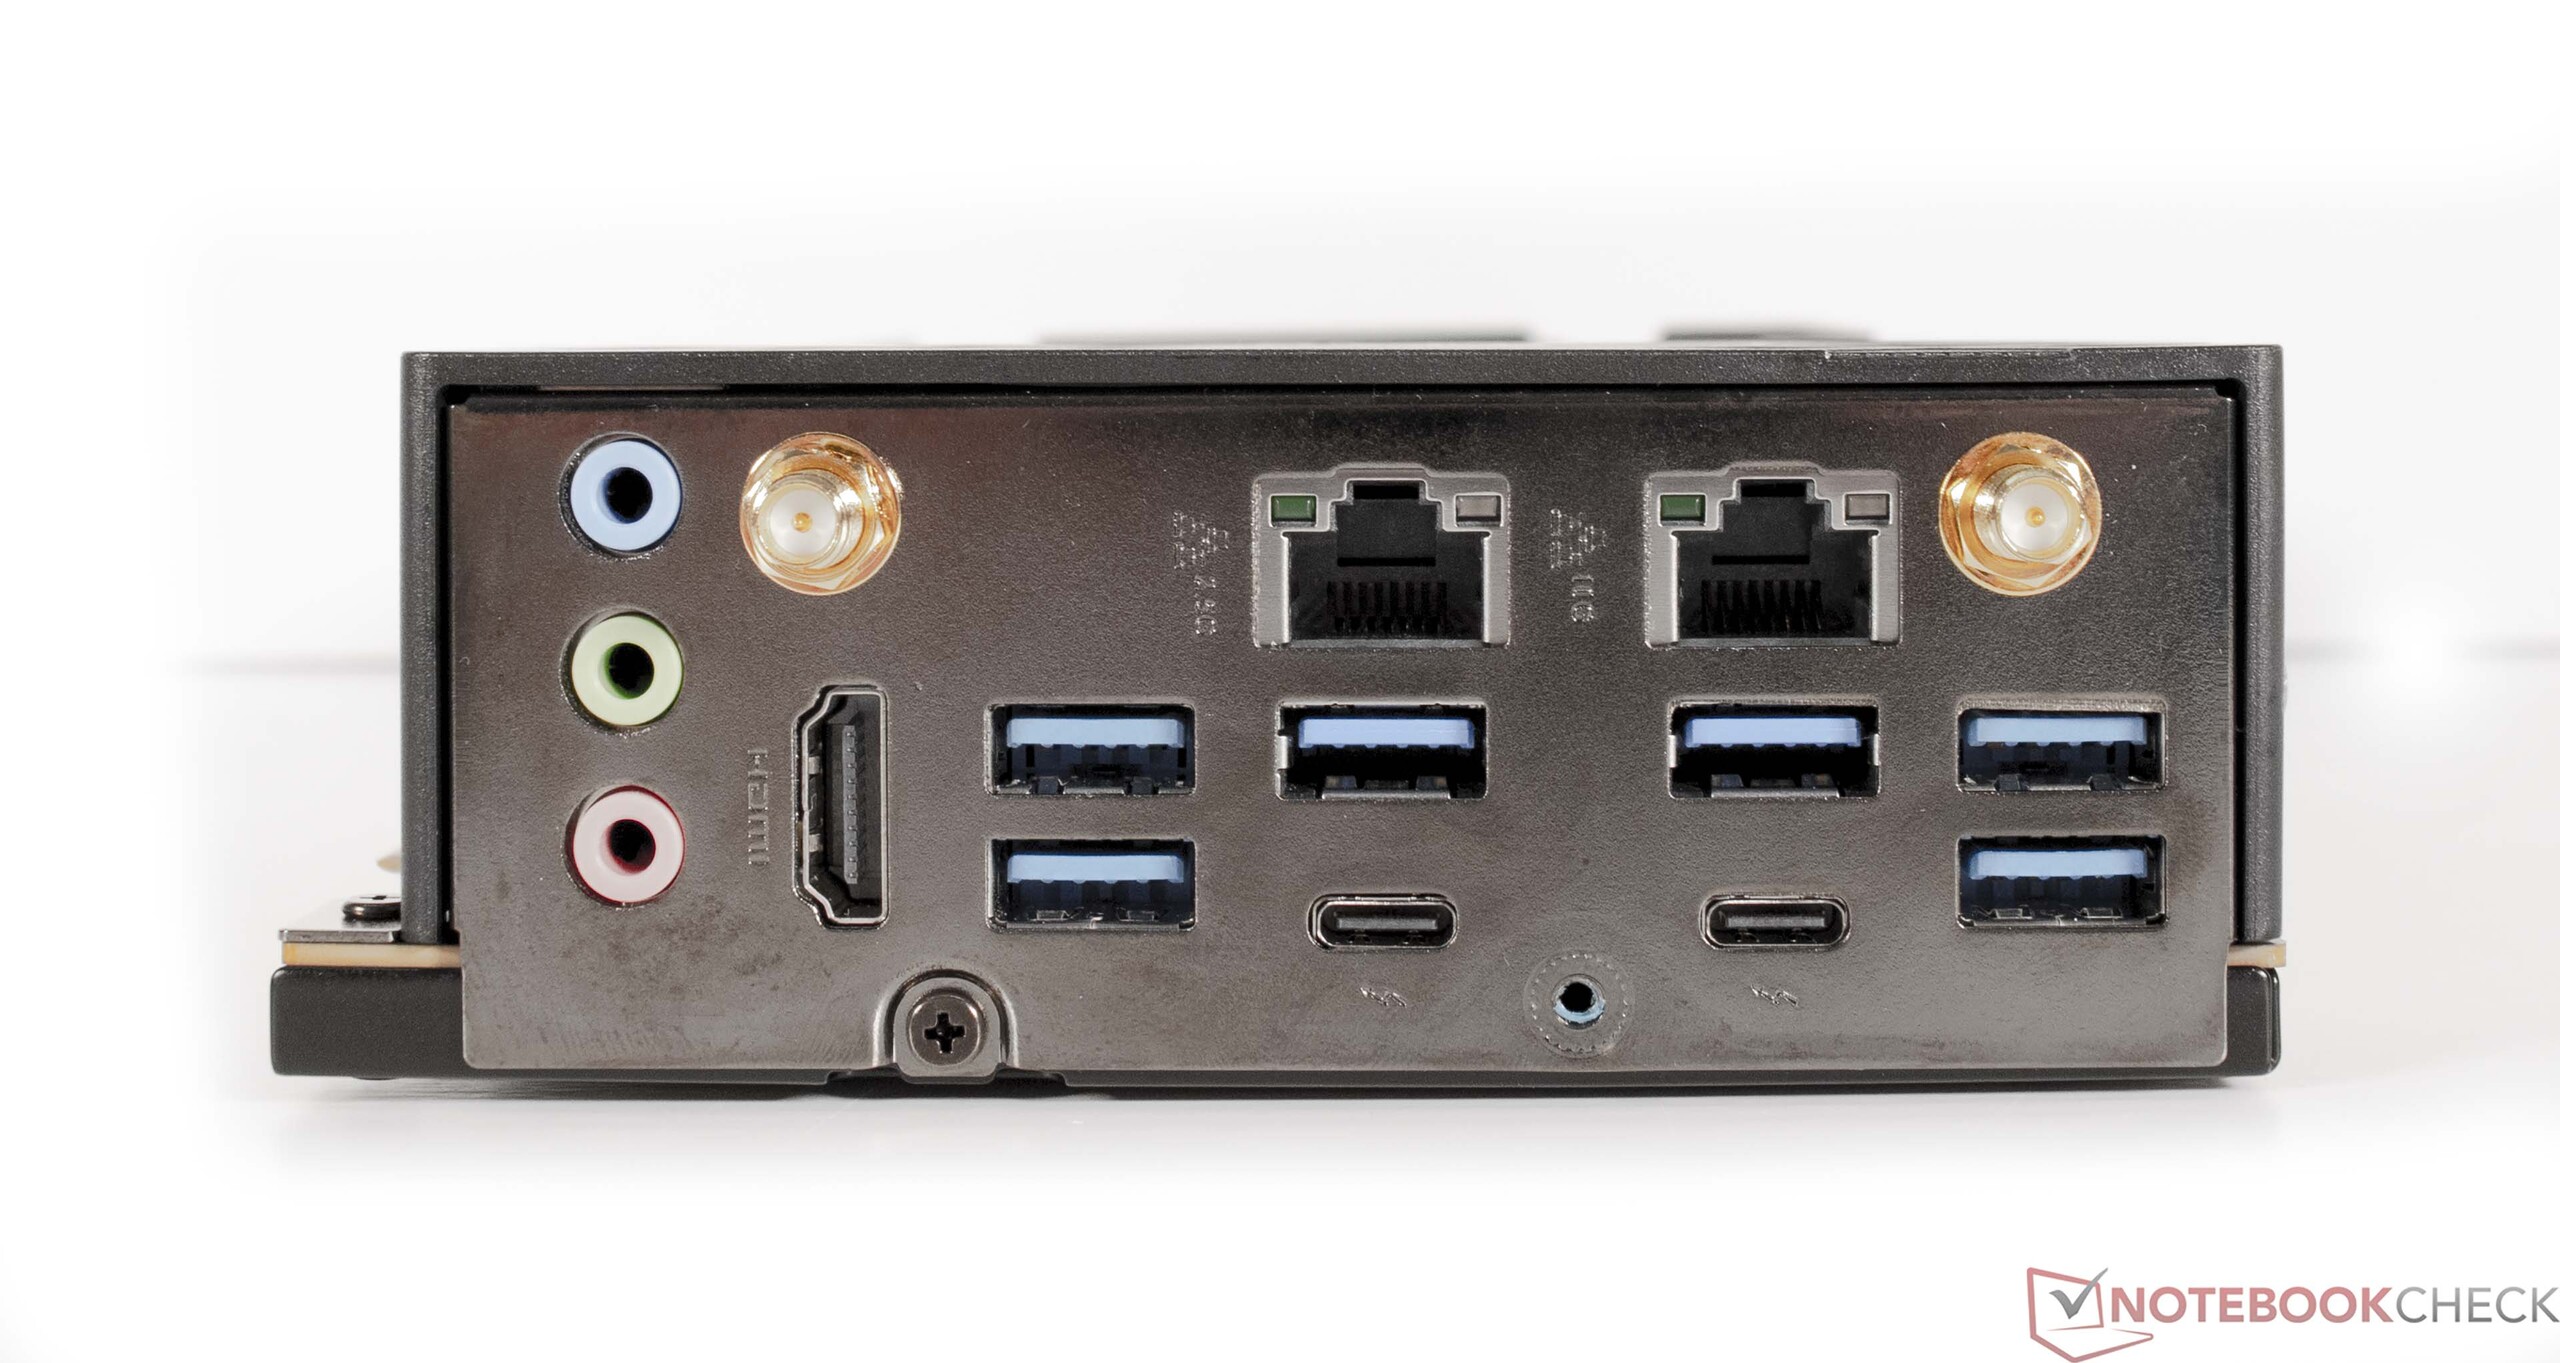
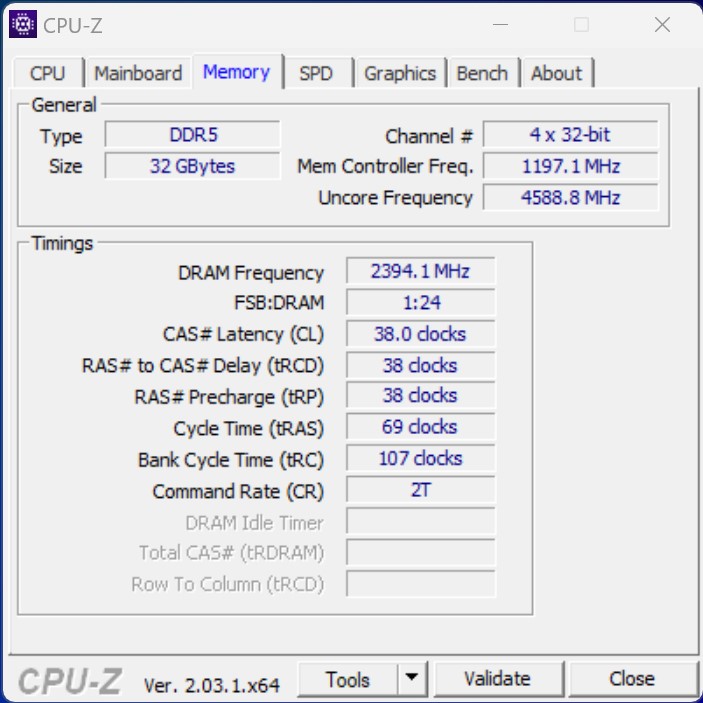
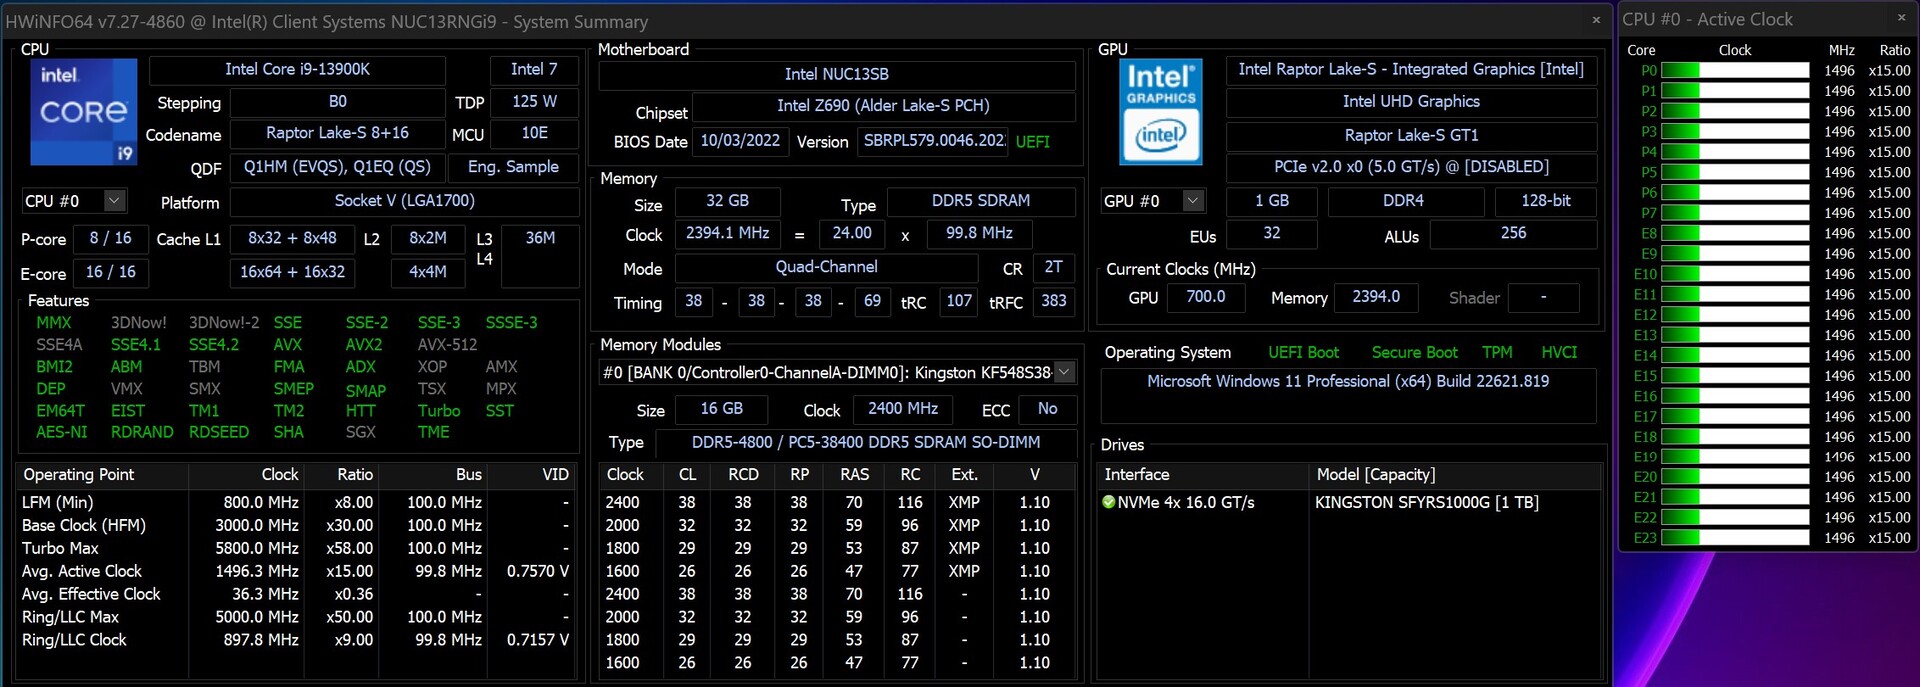
Met de Intel Core i9-13900Kwordt onze configuratie van de Intel NUC 13 Extreme geleverd met de snelste gaming CPU die momenteel beschikbaar is. Het heeft een totaal van 24 kernen en 32 threads. Het is algemeen bekend geworden dat de Raptor Lake generatie CPU's een hybride ontwerp met E- en P-kernen gebruiken. Net als op de Intel NUC 12 Extreme, bevat zijn voorganger ook een standaard desktop processor. Daarnaast wordt de Compute Element geleverd met alle benodigde poorten. Er zijn drie NVMe SSD slots aan de onderkant van het PCB en alle externe interfaces aan de zijkant.

Wi-Fi prestaties

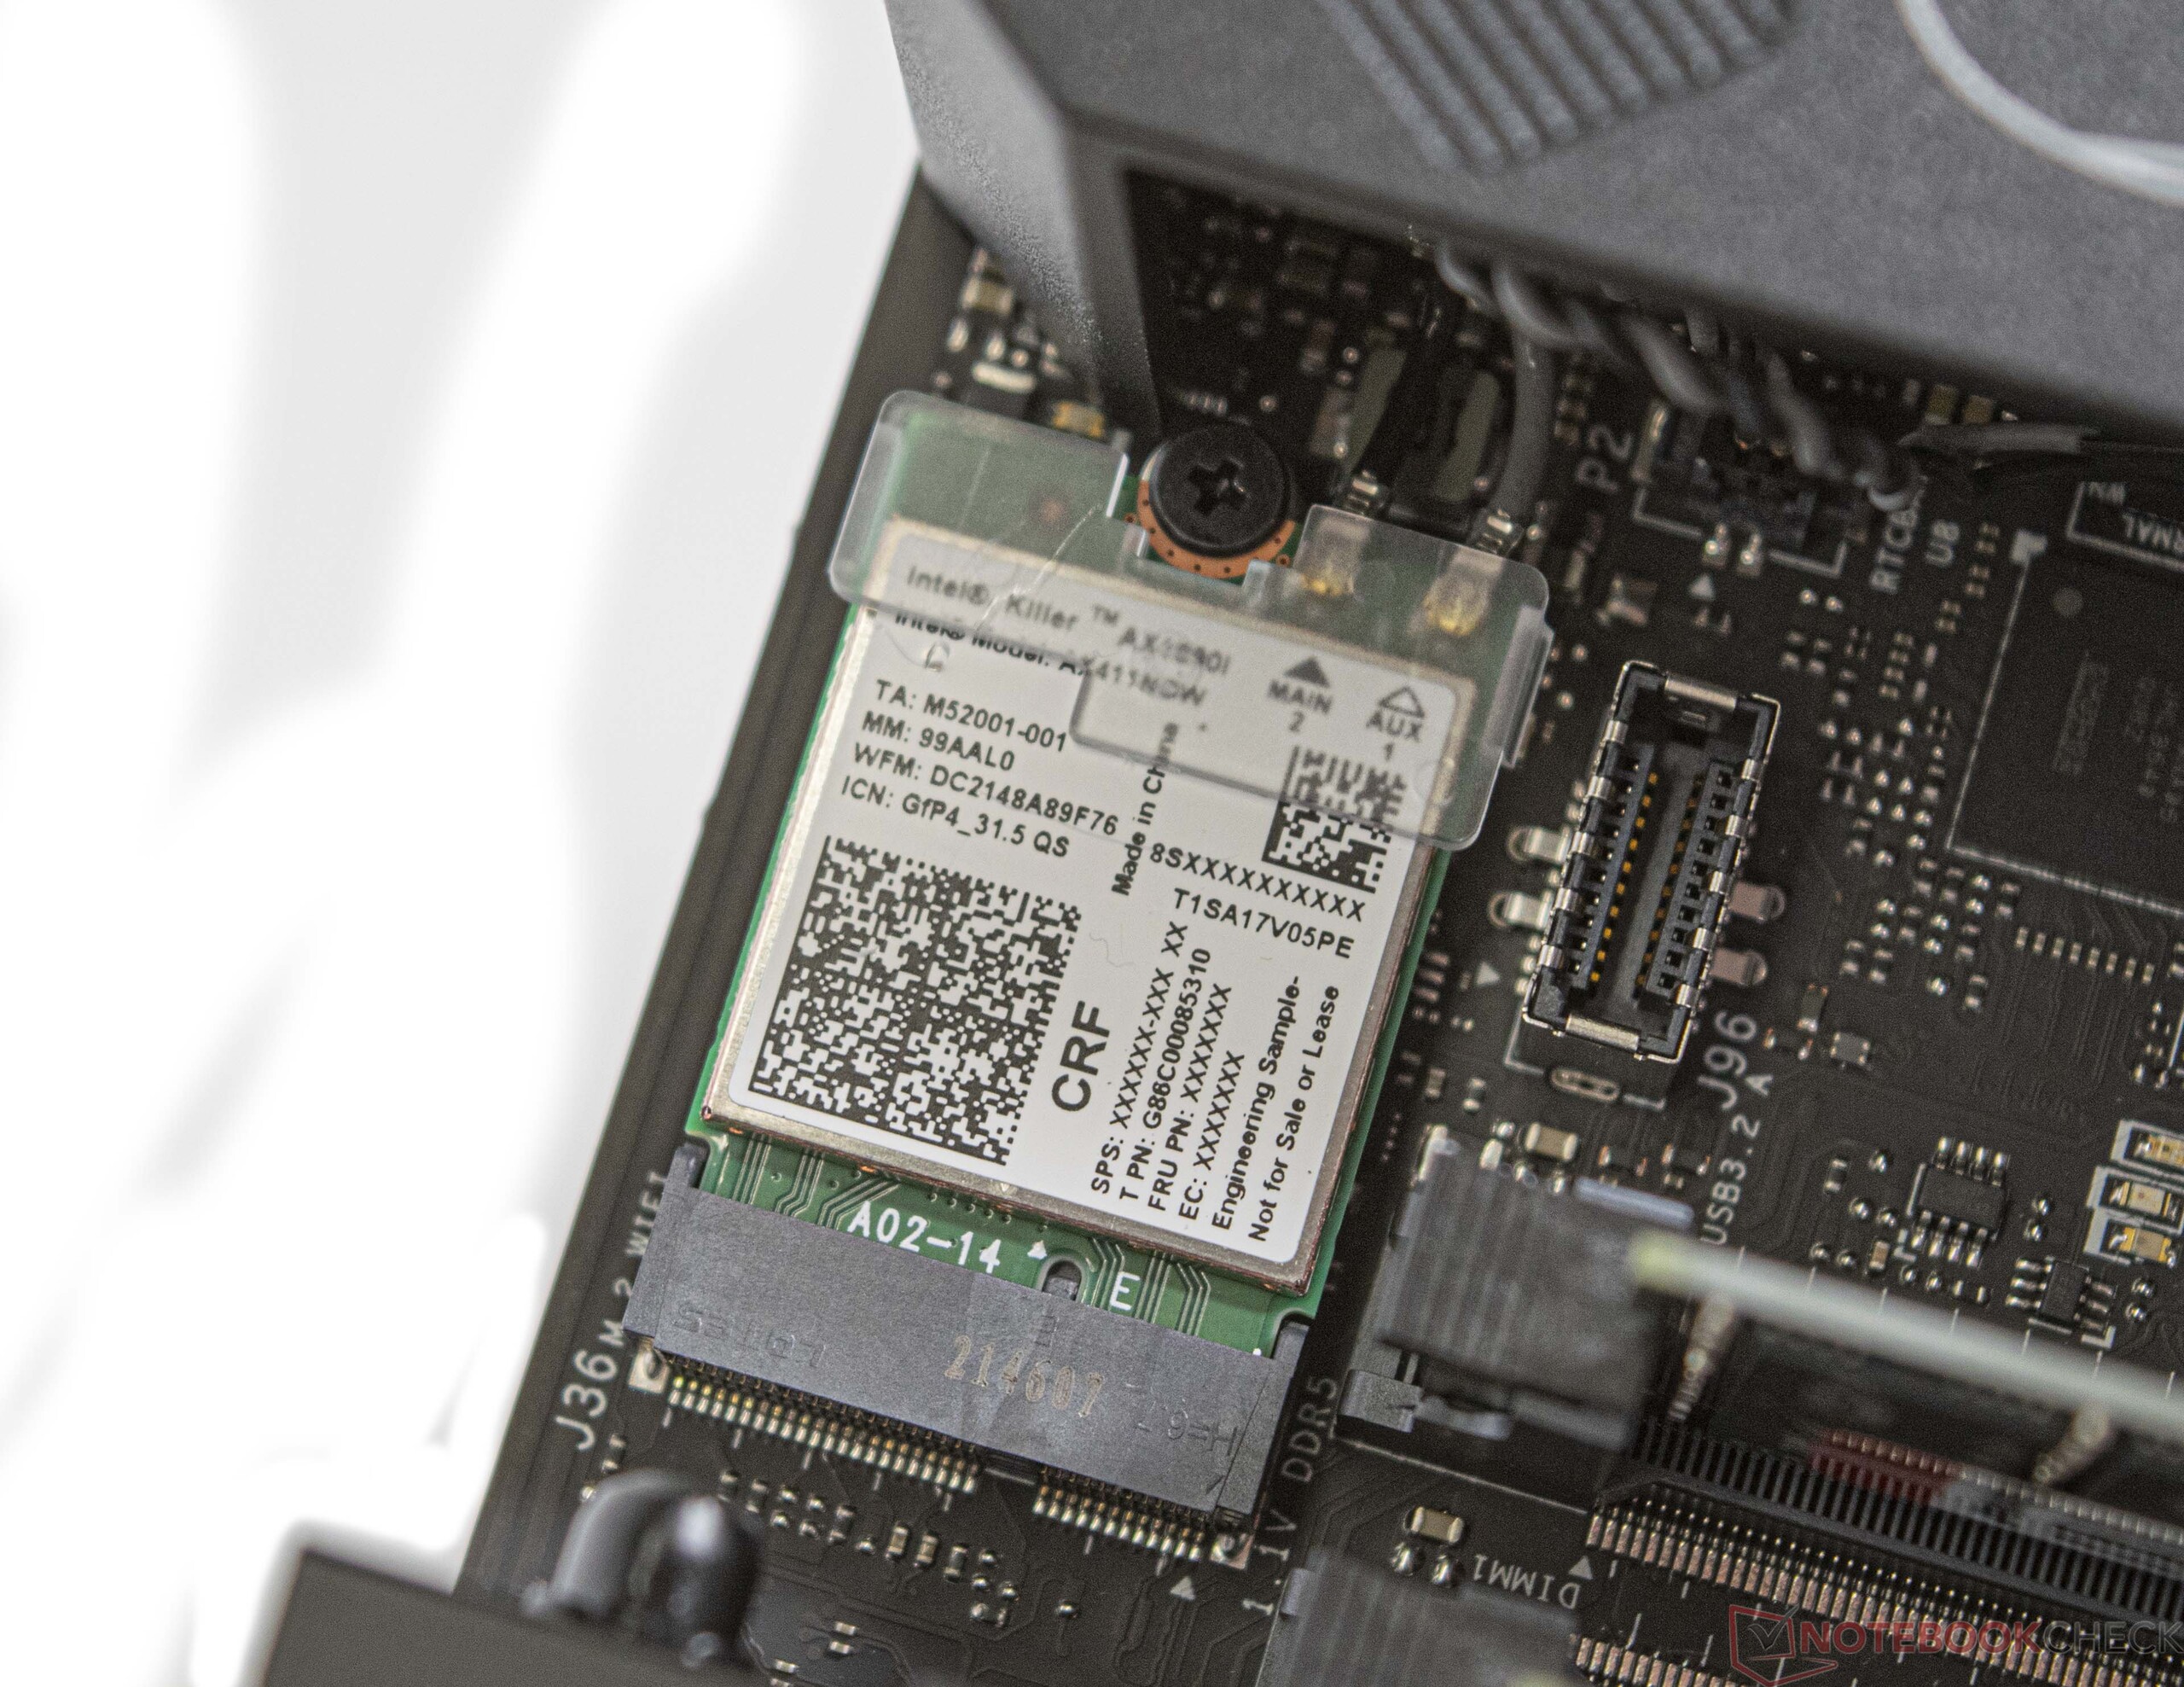
De Intel NUC 13 Extreme Raptor Canyon integreert de Killer Wi-Fi 6E AX1690i Wi-Fi module. In combinatie met onze Asus ROG Rapture GT-AXE11000 referentie router meten we goede upload- en downloadsnelheden. De Wi-Fi-unit is een module op het Compute Element en dus door de gebruiker vervangbaar. Voor bekabelde communicatie is zowel een 10Gb/s als een 2,5Gb/s interface beschikbaar.

Opmerking

We konden geen stabiele Wi-Fi 6G-verbinding krijgen met ons testapparaat. Het updaten van de componenten met de laatste drivers en firmware updates voor de Intel NUC 13 Extreme Raptor Canyon en onze test router bracht geen verbetering. We zullen dit deel van de review herzien als de situatie in de komende dagen verandert voordat we het apparaat moeten terugsturen.

Networking
iperf3 receive AXE11000
Intel NUC Pro Chassis_i7_1185G7
Intel Wi-Fi 6 AX201
1685 (841min - 1722max) MBit/s +84%
Gemiddeld Killer Wi-Fi 6E AX1690i 160MHz
  (917 - 1727, n=8)
1477 MBit/s +61%
Intel NUC13 Raptor Canyon
Killer Wi-Fi 6E AX1690i 160MHz
917 (844min - 932max) MBit/s
Corsair Voyager a1600
Qualcomm WCN685x
852 (425min - 931max) MBit/s -7%
Gemiddelde van klas Desktop
  (322 - 1478, n=10, laatste 2 jaar)
803 MBit/s -12%
iperf3 transmit AXE11000
Corsair Voyager a1600
Qualcomm WCN685x
1780 (896min - 1840max) MBit/s +10%
Intel NUC13 Raptor Canyon
Killer Wi-Fi 6E AX1690i 160MHz
1618 (1563min - 1670max) MBit/s
Gemiddeld Killer Wi-Fi 6E AX1690i 160MHz
  (1145 - 1650, n=7)
1470 MBit/s -9%
Intel NUC Pro Chassis_i7_1185G7
Intel Wi-Fi 6 AX201
1011 (529min - 1068max) MBit/s -38%
Gemiddelde van klas Desktop
  (188.4 - 1618, n=9, laatste 2 jaar)
734 MBit/s -55%
05010015020025030035040045050055060065070075080085090095010001050110011501200125013001350140014501500155016001650Tooltip
Intel NUC13 Raptor Canyon; iperf3 receive AXE11000; iperf 3.1.3: Ø916 (844-932)
Intel NUC13 Raptor Canyon; iperf3 transmit AXE11000; iperf 3.1.3: Ø1618 (1563-1670)

Processor benchmarks

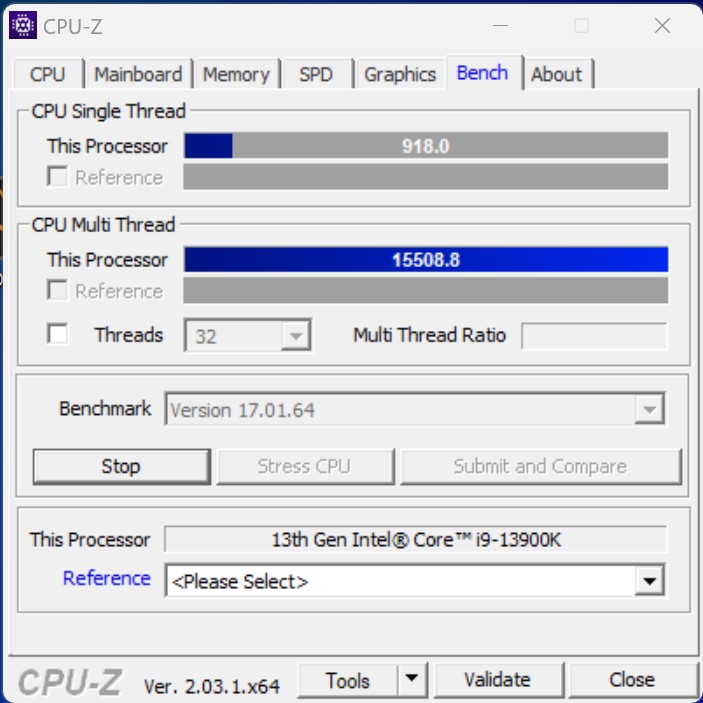
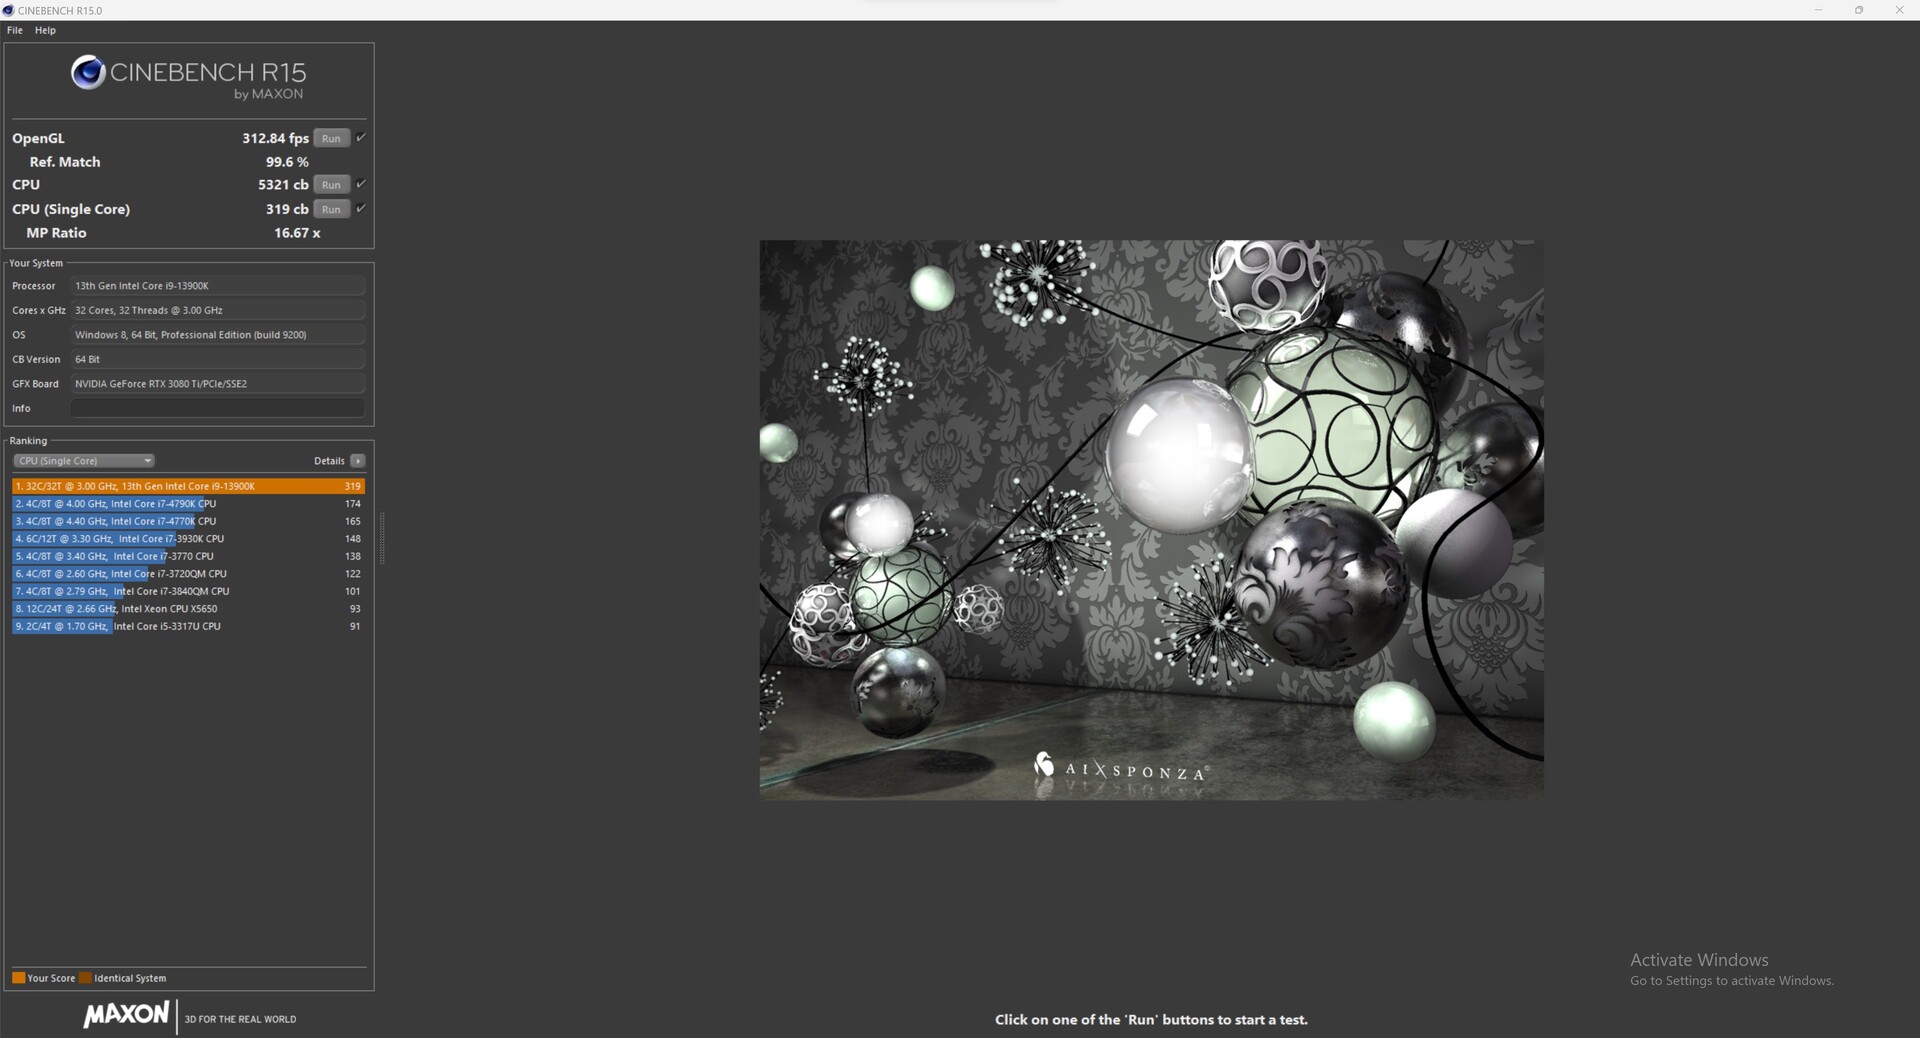
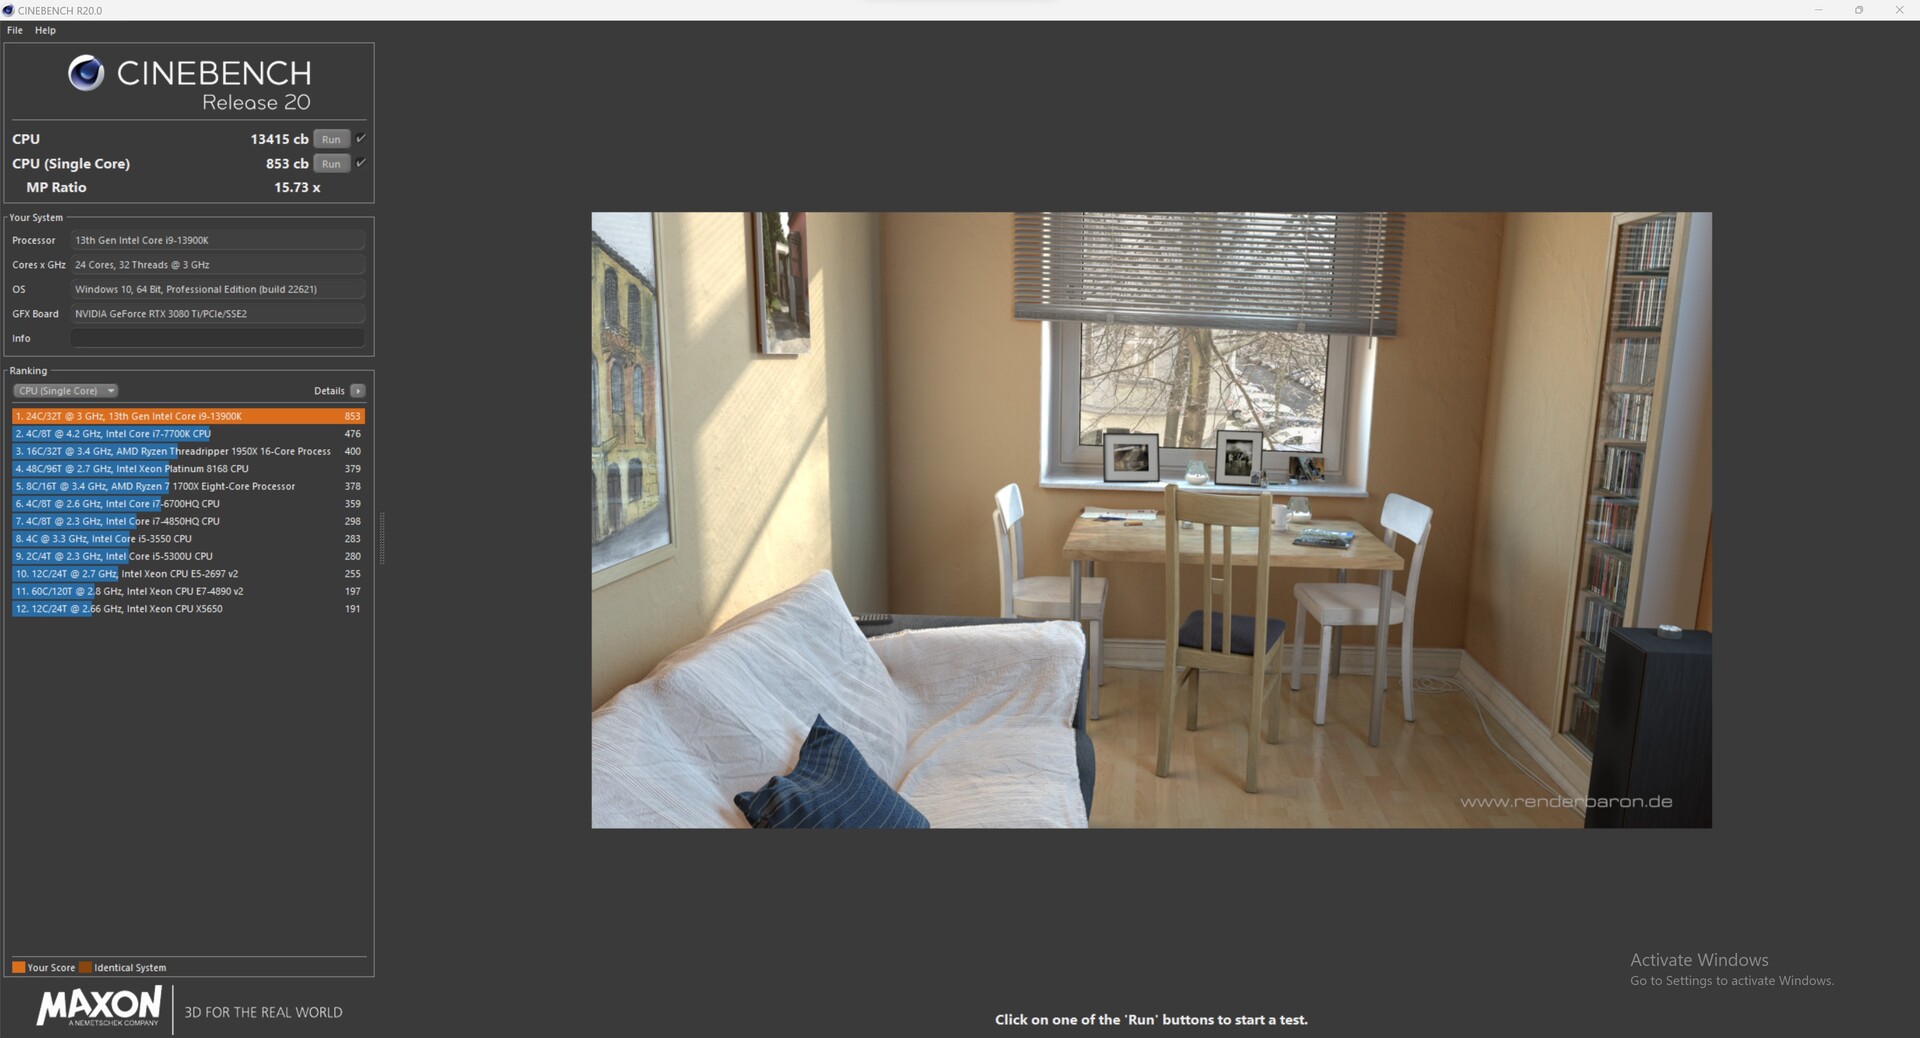
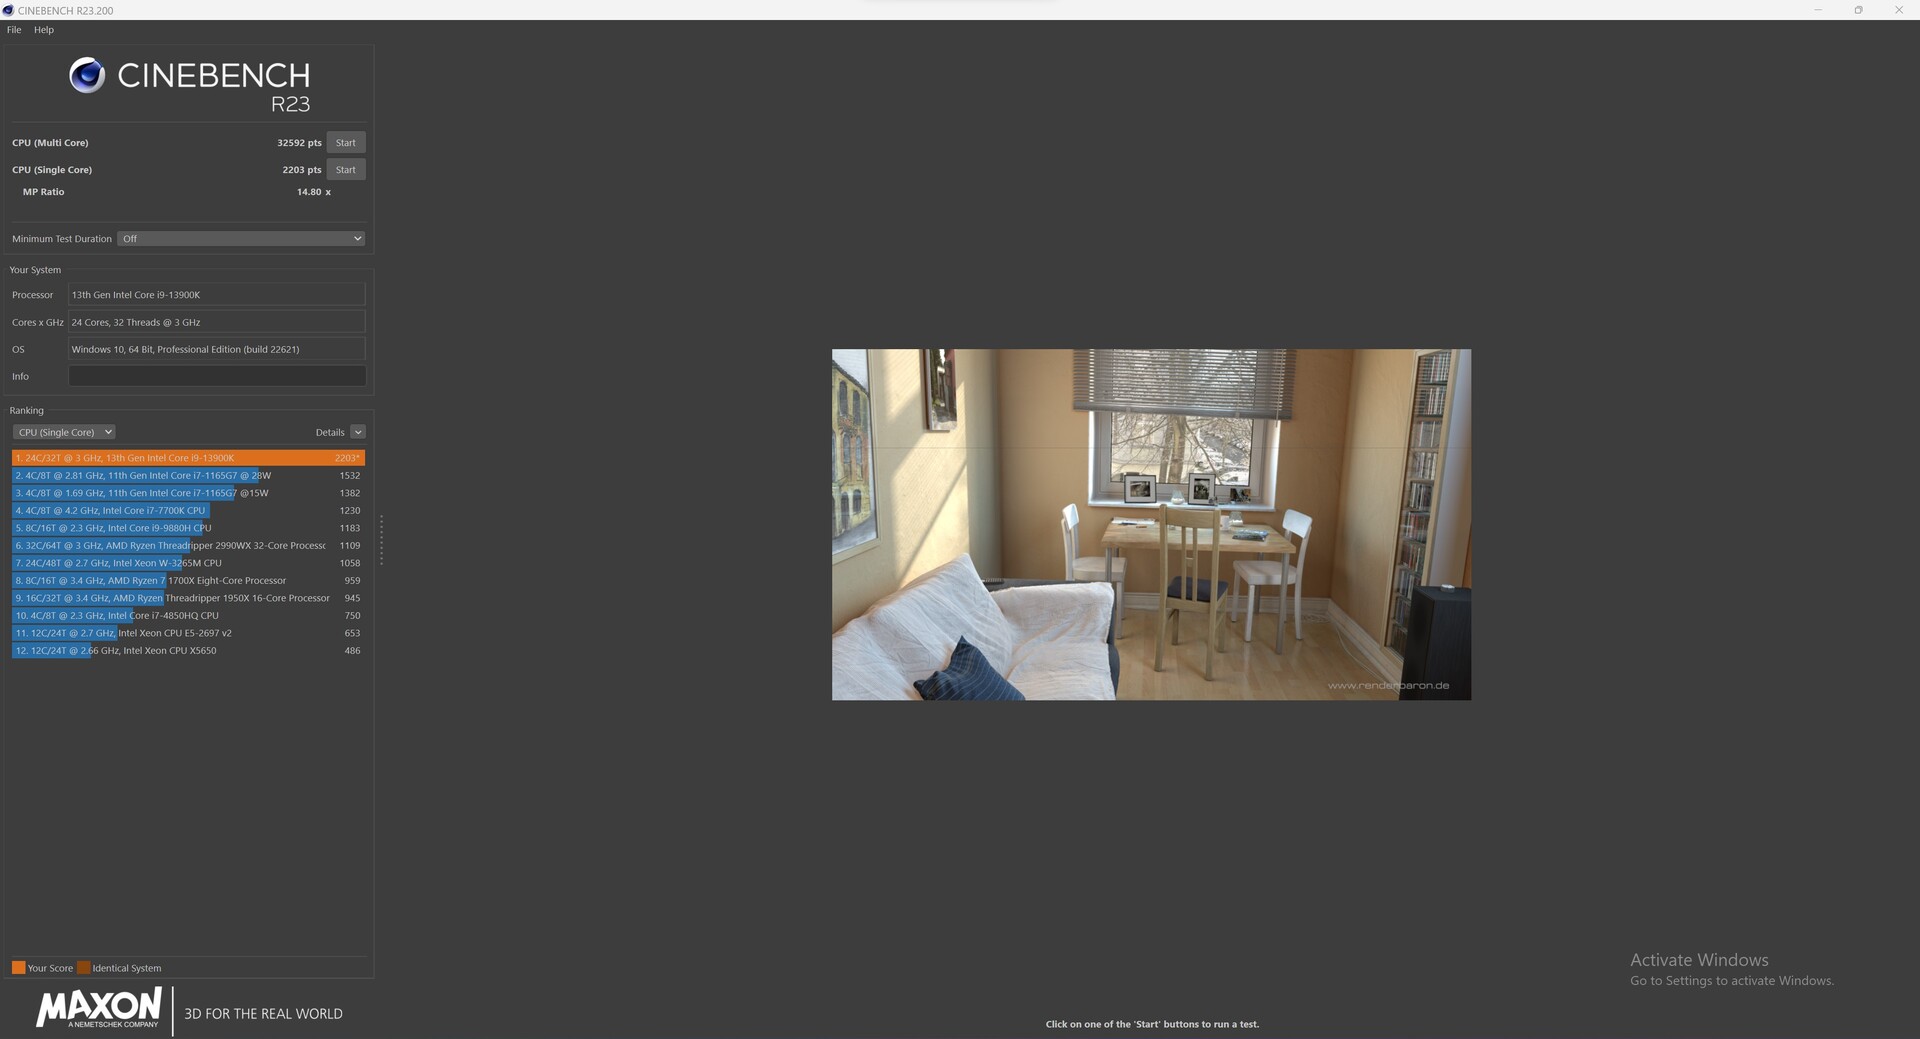
Met de Intel Core i9-13900Kmaakt de Intel NUC 13 Extreme Raptor Canyon gebruik van Intels snelste gaming CPU. Als zodanig komen de goede benchmark resultaten overeen met onze verwachtingen. Ondanks de relatief kleine koeloplossing meten we een prestatietekort van slechts 7% in vergelijking met een ander desktopsysteem met een krachtige vloeistofkoeler.

Wat betreft de vermogensgrenzen zijn er enkele kleine beperkingen en de 150-watt grens verklaart het kleine verschil. De meeste toepassingen zullen geen gebruik maken van de volledige 250 watt. Wanneer de Intel NUC 13 Extreme Raptor Canyon gecombineerd wordt met de minder krachtige Intel Core i5-13600K, zou het prestatieniveau overeen moeten komen met de resultaten in onze vergelijkingstabel. De lagere PL2 (181 watt) zal waarschijnlijk een deel van het tekort onder volledige belasting compenseren.

Meer processor benchmarks zijn te vinden hier.

CPU-Z
CPU-Z
CPU-Z
CPU-Z
CPU-Z
CPU-Z
HWiNFO
Cinebench R15
Cinebench R15
Cinebench R20
Cinebench R20
Cinebench R23
Cinebench R23
Performance Rating - Percent
Intel Core i9-13900K
i9-13900K, 3000 MHz
74.1 pt
AMD Ryzen 9 7950X
R9 7950X, 4500 MHz
72.7 pt
Intel Core i9-13900K
i9-13900K, 3000 MHz
69.4 pt
AMD Ryzen 9 7900X
R9 7900X, 4700 MHz
67.7 pt
Intel Core i9-12900K
i9-12900K, 3200 MHz
62.9 pt
Intel Core i5-13600K
i5-13600K, 3500 MHz
61.8 pt
AMD Ryzen 5 7600X
R5 7600X, 4700 MHz
57.5 pt
Intel Core i5-12600K
i5-12600K, 2800 MHz
54.8 pt
Cinebench R15
CPU Single 64Bit
AMD Ryzen 9 7950X
R9 7950X, 4500 MHz
328 Points +3%
Intel Core i9-13900K
i9-13900K, 3000 MHz
327 Points +3%
AMD Ryzen 9 7900X
R9 7900X, 4700 MHz
324 Points +2%
Intel Core i9-13900K
i9-13900K, 3000 MHz
319 Points
AMD Ryzen 5 7600X
R5 7600X, 4700 MHz
315 Points -1%
Intel Core i5-13600K
i5-13600K, 3500 MHz
289 Points -9%
Intel Core i9-12900K
i9-12900K, 3200 MHz
286 Points -10%
Intel Core i5-12600K
i5-12600K, 2800 MHz
275 Points -14%
CPU Multi 64Bit
AMD Ryzen 9 7950X
R9 7950X, 4500 MHz
6209 Points +17%
Intel Core i9-13900K
i9-13900K, 3000 MHz
6191 Points +16%
Intel Core i9-13900K
i9-13900K, 3000 MHz
5321 Points
AMD Ryzen 9 7900X
R9 7900X, 4700 MHz
4856 Points -9%
Intel Core i9-12900K
i9-12900K, 3200 MHz
4057 Points -24%
Intel Core i5-13600K
i5-13600K, 3500 MHz
3643 Points -32%
Intel Core i5-12600K
i5-12600K, 2800 MHz
2555 Points -52%
AMD Ryzen 5 7600X
R5 7600X, 4700 MHz
2507 Points -53%
Cinebench R20
CPU (Single Core)
Intel Core i9-13900K
i9-13900K, 3000 MHz
853 Points
Intel Core i9-13900K
i9-13900K, 3000 MHz
828 Points -3%
AMD Ryzen 9 7950X
R9 7950X, 4500 MHz
795 Points -7%
AMD Ryzen 9 7900X
R9 7900X, 4700 MHz
786 Points -8%
Intel Core i5-13600K
i5-13600K, 3500 MHz
775 Points -9%
Intel Core i9-12900K
i9-12900K, 3200 MHz
766 Points -10%
AMD Ryzen 5 7600X
R5 7600X, 4700 MHz
761 Points -11%
Intel Core i5-12600K
i5-12600K, 2800 MHz
734 Points -14%
CPU (Multi Core)
Intel Core i9-13900K
i9-13900K, 3000 MHz
15181 Points +13%
AMD Ryzen 9 7950X
R9 7950X, 4500 MHz
14786 Points +10%
Intel Core i9-13900K
i9-13900K, 3000 MHz
13415 Points
AMD Ryzen 9 7900X
R9 7900X, 4700 MHz
11563 Points -14%
Intel Core i9-12900K
i9-12900K, 3200 MHz
10240 Points -24%
Intel Core i5-13600K
i5-13600K, 3500 MHz
9265 Points -31%
Intel Core i5-12600K
i5-12600K, 2800 MHz
6692 Points -50%
AMD Ryzen 5 7600X
R5 7600X, 4700 MHz
5985 Points -55%
Cinebench R23
Single Core
Intel Core i9-13900K
i9-13900K, 3000 MHz
2267 Points +3%
Intel Core i9-13900K
i9-13900K, 3000 MHz
2203 Points
AMD Ryzen 9 7950X
R9 7950X, 4500 MHz
2045 Points -7%
AMD Ryzen 9 7900X
R9 7900X, 4700 MHz
2039 Points -7%
Intel Core i5-13600K
i5-13600K, 3500 MHz
2010 Points -9%
Intel Core i9-12900K
i9-12900K, 3200 MHz
1998 Points -9%
AMD Ryzen 5 7600X
R5 7600X, 4700 MHz
1967 Points -11%
Intel Core i5-12600K
i5-12600K, 2800 MHz
1907 Points -13%
Multi Core
Intel Core i9-13900K
i9-13900K, 3000 MHz
40103 Points +23%
AMD Ryzen 9 7950X
R9 7950X, 4500 MHz
37792 Points +16%
Intel Core i9-13900K
i9-13900K, 3000 MHz
32592 Points
AMD Ryzen 9 7900X
R9 7900X, 4700 MHz
29480 Points -10%
Intel Core i9-12900K
i9-12900K, 3200 MHz
27005 Points -17%
Intel Core i5-13600K
i5-13600K, 3500 MHz
24268 Points -26%
Intel Core i5-12600K
i5-12600K, 2800 MHz
17491 Points -46%
AMD Ryzen 5 7600X
R5 7600X, 4700 MHz
15322 Points -53%
Cinebench R11.5
CPU Single 64Bit
Intel Core i9-13900K
i9-13900K, 3000 MHz
3.92 Points +3%
AMD Ryzen 9 7950X
R9 7950X, 4500 MHz
3.86 Points +2%
AMD Ryzen 9 7900X
R9 7900X, 4700 MHz
3.83 Points +1%
Intel Core i9-13900K
i9-13900K, 3000 MHz
3.8 Points
AMD Ryzen 5 7600X
R5 7600X, 4700 MHz
3.72 Points -2%
Intel Core i9-12900K
i9-12900K, 3200 MHz
3.49 Points -8%
Intel Core i5-13600K
i5-13600K, 3500 MHz
3.48 Points -8%
Intel Core i5-12600K
i5-12600K, 2800 MHz
3.31 Points -13%
CPU Multi 64Bit
Intel Core i9-13900K
i9-13900K, 3000 MHz
70.78 Points +14%
AMD Ryzen 9 7950X
R9 7950X, 4500 MHz
68.61 Points +10%
Intel Core i9-13900K
i9-13900K, 3000 MHz
62.2 Points
AMD Ryzen 9 7900X
R9 7900X, 4700 MHz
54.51 Points -12%
Intel Core i9-12900K
i9-12900K, 3200 MHz
47.06 Points -24%
Intel Core i5-13600K
i5-13600K, 3500 MHz
42.38 Points -32%
Intel Core i5-12600K
i5-12600K, 2800 MHz
30.01 Points -52%
AMD Ryzen 5 7600X
R5 7600X, 4700 MHz
28.41 Points -54%
Cinebench R10
Rendering Single CPUs 64Bit
Intel Core i9-13900K
i9-13900K, 3000 MHz
18236 Points +3%
Intel Core i9-13900K
i9-13900K, 3000 MHz
17761 Points
AMD Ryzen 9 7900X
R9 7900X, 4700 MHz
16338 Points -8%
AMD Ryzen 9 7950X
R9 7950X, 4500 MHz
16260 Points -8%
Intel Core i5-13600K
i5-13600K, 3500 MHz
16235 Points -9%
Intel Core i9-12900K
i9-12900K, 3200 MHz
16144 Points -9%
AMD Ryzen 5 7600X
R5 7600X, 4700 MHz
16010 Points -10%
Intel Core i5-12600K
i5-12600K, 2800 MHz
15180 Points -15%
Rendering Multiple CPUs 64Bit
Intel Core i9-13900K
i9-13900K, 3000 MHz
138969 Points
Intel Core i9-13900K
i9-13900K, 3000 MHz
132000 Points -5%
AMD Ryzen 9 7950X
R9 7950X, 4500 MHz
130289 Points -6%
AMD Ryzen 9 7900X
R9 7900X, 4700 MHz
121250 Points -13%
Intel Core i9-12900K
i9-12900K, 3200 MHz
112749 Points -19%
Intel Core i5-13600K
i5-13600K, 3500 MHz
110412 Points -21%
AMD Ryzen 5 7600X
R5 7600X, 4700 MHz
89641 Points -35%
Intel Core i5-12600K
i5-12600K, 2800 MHz
89478 Points -36%
Blender - v2.79 BMW27 CPU
AMD Ryzen 5 7600X
R5 7600X, 4700 MHz
203 Seconds * -101%
Intel Core i5-12600K
i5-12600K, 2800 MHz
189.5 Seconds * -88%
Intel Core i5-13600K
i5-13600K, 3500 MHz
135 Seconds * -34%
Intel Core i9-12900K
i9-12900K, 3200 MHz
121.1 Seconds * -20%
AMD Ryzen 9 7900X
R9 7900X, 4700 MHz
106 Seconds * -5%
Intel Core i9-13900K
i9-13900K, 3000 MHz
101 Seconds *
AMD Ryzen 9 7950X
R9 7950X, 4500 MHz
85 Seconds * +16%
Intel Core i9-13900K
i9-13900K, 3000 MHz
80 Seconds * +21%
wPrime 2.10
32m
Intel Core i9-12900K
i9-12900K, 3200 MHz
4.924 s * -150%
Intel Core i5-12600K
i5-12600K, 2800 MHz
4.725 s * -140%
AMD Ryzen 5 7600X
R5 7600X, 4700 MHz
2.78 s * -41%
Intel Core i5-13600K
i5-13600K, 3500 MHz
2.527 s * -28%
Intel Core i9-13900K
i9-13900K, 3000 MHz
1.97 s *
Intel Core i9-13900K
i9-13900K, 3000 MHz
1.818 s * +8%
AMD Ryzen 9 7900X
R9 7900X, 4700 MHz
1.781 s * +10%
AMD Ryzen 9 7950X
R9 7950X, 4500 MHz
1.669 s * +15%
1024m
Intel Core i5-12600K
i5-12600K, 2800 MHz
202.7 s * -125%
Intel Core i9-12900K
i9-12900K, 3200 MHz
190.6 s * -111%
Intel Core i5-13600K
i5-13600K, 3500 MHz
177.592 s * -97%
Intel Core i9-13900K
i9-13900K, 3000 MHz
90.13 s *
Intel Core i9-13900K
i9-13900K, 3000 MHz
79.738 s * +12%
AMD Ryzen 5 7600X
R5 7600X, 4700 MHz
74.491 s * +17%
AMD Ryzen 9 7900X
R9 7900X, 4700 MHz
39.954 s * +56%
AMD Ryzen 9 7950X
R9 7950X, 4500 MHz
30.811 s * +66%
X264 HD Benchmark 4.0
Pass 1
Intel Core i9-13900K
i9-13900K, 3000 MHz
416.5 (414min - 417max) fps
Intel Core i9-13900K
i9-13900K, 3000 MHz
412 (410min - 417max) fps -1%
Intel Core i5-13600K
i5-13600K, 3500 MHz
388 (386min - 388max) fps -7%
AMD Ryzen 9 7950X
R9 7950X, 4500 MHz
379.5 (378min - 385max) fps -9%
AMD Ryzen 9 7900X
R9 7900X, 4700 MHz
376 (369min - 378max) fps -10%
Intel Core i9-12900K
i9-12900K, 3200 MHz
368.5 (366min - 369max) fps -12%
AMD Ryzen 5 7600X
R5 7600X, 4700 MHz
367 (363min - 371max) fps -12%
Intel Core i5-12600K
i5-12600K, 2800 MHz
333.5 (332min - 336max) fps -20%
Pass 2
Intel Core i9-13900K
i9-13900K, 3000 MHz
267 (266min - 271max) fps +8%
AMD Ryzen 9 7950X
R9 7950X, 4500 MHz
266.5 (263min - 267max) fps +8%
Intel Core i9-13900K
i9-13900K, 3000 MHz
247.5 (238min - 251max) fps
AMD Ryzen 9 7900X
R9 7900X, 4700 MHz
241 (240min - 242max) fps -3%
Intel Core i9-12900K
i9-12900K, 3200 MHz
206 (206min - 206max) fps -17%
Intel Core i5-13600K
i5-13600K, 3500 MHz
199 (198.5min - 199.4max) fps -20%
Intel Core i5-12600K
i5-12600K, 2800 MHz
148 (147min - 148max) fps -40%
AMD Ryzen 5 7600X
R5 7600X, 4700 MHz
147.8 (147.7min - 147.9max) fps -40%
WinRAR - Result
AMD Ryzen 9 7900X
R9 7900X, 4700 MHz
17225 KB/s +30%
AMD Ryzen 9 7950X
R9 7950X, 4500 MHz
16351 KB/s +24%
AMD Ryzen 5 7600X
R5 7600X, 4700 MHz
16178 KB/s +22%
Intel Core i9-13900K
i9-13900K, 3000 MHz
14836 KB/s +12%
Intel Core i9-13900K
i9-13900K, 3000 MHz
13210 KB/s
Intel Core i5-13600K
i5-13600K, 3500 MHz
10937 KB/s -17%
Intel Core i9-12900K
i9-12900K, 3200 MHz
10792 KB/s -18%
Intel Core i5-12600K
i5-12600K, 2800 MHz
6239 KB/s -53%
TrueCrypt
AES Mean 100MB
AMD Ryzen 9 7950X
R9 7950X, 4500 MHz
30.7 GB/s +50%
Intel Core i9-13900K
i9-13900K, 3000 MHz
27 GB/s +32%
Intel Core i9-13900K
i9-13900K, 3000 MHz
20.5 GB/s
Intel Core i5-13600K
i5-13600K, 3500 MHz
18.8 GB/s -8%
Intel Core i9-12900K
i9-12900K, 3200 MHz
18.5 GB/s -10%
AMD Ryzen 9 7900X
R9 7900X, 4700 MHz
14.8 GB/s -28%
AMD Ryzen 5 7600X
R5 7600X, 4700 MHz
13.2 GB/s -36%
Intel Core i5-12600K
i5-12600K, 2800 MHz
12.8 GB/s -38%
Twofish Mean 100MB
Intel Core i9-13900K
i9-13900K, 3000 MHz
5.4 GB/s +4%
Intel Core i9-13900K
i9-13900K, 3000 MHz
5.2 GB/s
AMD Ryzen 9 7950X
R9 7950X, 4500 MHz
4.5 GB/s -13%
Intel Core i9-12900K
i9-12900K, 3200 MHz
3.7 GB/s -29%
Intel Core i5-13600K
i5-13600K, 3500 MHz
3.1 GB/s -40%
AMD Ryzen 9 7900X
R9 7900X, 4700 MHz
2.8 GB/s -46%
Intel Core i5-12600K
i5-12600K, 2800 MHz
2.2 GB/s -58%
AMD Ryzen 5 7600X
R5 7600X, 4700 MHz
1.8 GB/s -65%
Serpent Mean 100MB
Intel Core i9-13900K
i9-13900K, 3000 MHz
3 GB/s +15%
AMD Ryzen 9 7950X
R9 7950X, 4500 MHz
2.8 GB/s +8%
Intel Core i9-13900K
i9-13900K, 3000 MHz
2.6 GB/s
Intel Core i9-12900K
i9-12900K, 3200 MHz
1.9 GB/s -27%
Intel Core i5-13600K
i5-13600K, 3500 MHz
1.7 GB/s -35%
AMD Ryzen 9 7900X
R9 7900X, 4700 MHz
1.5 GB/s -42%
Intel Core i5-12600K
i5-12600K, 2800 MHz
1.3 GB/s -50%
AMD Ryzen 5 7600X
R5 7600X, 4700 MHz
1.1 GB/s -58%
Geekbench 5.5
Multi-Core
AMD Ryzen 9 7950X
R9 7950X, 4500 MHz
24625 Points +10%
Intel Core i9-13900K
i9-13900K, 3000 MHz
24157 Points +8%
Intel Core i9-13900K
i9-13900K, 3000 MHz
22448 Points
AMD Ryzen 9 7900X
R9 7900X, 4700 MHz
19987 Points -11%
Intel Core i9-12900K
i9-12900K, 3200 MHz
17854 Points -20%
Intel Core i5-13600K
i5-13600K, 3500 MHz
16651 Points -26%
Intel Core i5-12600K
i5-12600K, 2800 MHz
12797 Points -43%
AMD Ryzen 5 7600X
R5 7600X, 4700 MHz
11917 Points -47%
Single-Core
AMD Ryzen 9 7950X
R9 7950X, 4500 MHz
2311 Points +10%
Intel Core i9-13900K
i9-13900K, 3000 MHz
2290 Points +9%
AMD Ryzen 9 7900X
R9 7900X, 4700 MHz
2274 Points +8%
AMD Ryzen 5 7600X
R5 7600X, 4700 MHz
2205 Points +5%
Intel Core i9-13900K
i9-13900K, 3000 MHz
2106 Points
Intel Core i9-12900K
i9-12900K, 3200 MHz
2042 Points -3%
Intel Core i5-13600K
i5-13600K, 3500 MHz
1967 Points -7%
Intel Core i5-12600K
i5-12600K, 2800 MHz
1904 Points -10%
Geekbench 5.0
5.0 Multi-Core
AMD Ryzen 9 7950X
R9 7950X, 4500 MHz
24479 Points +11%
Intel Core i9-13900K
i9-13900K, 3000 MHz
24021 Points +9%
Intel Core i9-13900K
i9-13900K, 3000 MHz
22024 Points
AMD Ryzen 9 7900X
R9 7900X, 4700 MHz
19975 Points -9%
Intel Core i9-12900K
i9-12900K, 3200 MHz
17959 Points -18%
Intel Core i5-13600K
i5-13600K, 3500 MHz
16635 Points -24%
Intel Core i5-12600K
i5-12600K, 2800 MHz
12746 Points -42%
AMD Ryzen 5 7600X
R5 7600X, 4700 MHz
11880 Points -46%
5.0 Single-Core
AMD Ryzen 9 7950X
R9 7950X, 4500 MHz
2222 Points +3%
Intel Core i9-13900K
i9-13900K, 3000 MHz
2214 Points +3%
AMD Ryzen 9 7900X
R9 7900X, 4700 MHz
2194 Points +2%
Intel Core i9-13900K
i9-13900K, 3000 MHz
2148 Points
AMD Ryzen 5 7600X
R5 7600X, 4700 MHz
2126 Points -1%
Intel Core i9-12900K
i9-12900K, 3200 MHz
1968 Points -8%
Intel Core i5-13600K
i5-13600K, 3500 MHz
1931 Points -10%
Intel Core i5-12600K
i5-12600K, 2800 MHz
1821 Points -15%
Geekbench 4.4
64 Bit Single-Core Score
Intel Core i9-13900K
i9-13900K, 3000 MHz
9598 Points +4%
AMD Ryzen 9 7950X
R9 7950X, 4500 MHz
9322 Points +1%
Intel Core i9-13900K
i9-13900K, 3000 MHz
9218 Points
AMD Ryzen 9 7900X
R9 7900X, 4700 MHz
9193 Points 0%
AMD Ryzen 5 7600X
R5 7600X, 4700 MHz
8926 Points -3%
Intel Core i9-12900K
i9-12900K, 3200 MHz
8665 Points -6%
Intel Core i5-13600K
i5-13600K, 3500 MHz
8618 Points -7%
Intel Core i5-12600K
i5-12600K, 2800 MHz
8223 Points -11%
64 Bit Multi-Core Score
AMD Ryzen 9 7950X
R9 7950X, 4500 MHz
89678 Points +16%
Intel Core i9-13900K
i9-13900K, 3000 MHz
86695 Points +12%
Intel Core i9-13900K
i9-13900K, 3000 MHz
77347 Points
AMD Ryzen 9 7900X
R9 7900X, 4700 MHz
74731 Points -3%
Intel Core i9-12900K
i9-12900K, 3200 MHz
63583 Points -18%
Intel Core i5-13600K
i5-13600K, 3500 MHz
60407 Points -22%
AMD Ryzen 5 7600X
R5 7600X, 4700 MHz
47407 Points -39%
Intel Core i5-12600K
i5-12600K, 2800 MHz
46557 Points -40%
3DMark 11 - 1280x720 Performance Physics
Intel Core i9-13900K
i9-13900K, 3000 MHz
32273 Points +11%
Intel Core i5-13600K
i5-13600K, 3500 MHz
30480 Points +5%
Intel Core i9-13900K
i9-13900K, 3000 MHz
29023 Points
AMD Ryzen 9 7900X
R9 7900X, 4700 MHz
28618 Points -1%
AMD Ryzen 9 7950X
R9 7950X, 4500 MHz
28618 Points -1%
Intel Core i9-12900K
i9-12900K, 3200 MHz
28211 Points -3%
AMD Ryzen 5 7600X
R5 7600X, 4700 MHz
25396 Points -12%
Intel Core i5-12600K
i5-12600K, 2800 MHz
25017 Points -14%
7-Zip 18.03
7z b 4
AMD Ryzen 9 7950X
R9 7950X, 4500 MHz
161724 MIPS +27%
Intel Core i9-13900K
i9-13900K, 3000 MHz
147068 MIPS +16%
Intel Core i9-13900K
i9-13900K, 3000 MHz
127201 MIPS
AMD Ryzen 9 7900X
R9 7900X, 4700 MHz
124975 MIPS -2%
Intel Core i9-12900K
i9-12900K, 3200 MHz
97671 MIPS -23%
Intel Core i5-13600K
i5-13600K, 3500 MHz
89647 MIPS -30%
AMD Ryzen 5 7600X
R5 7600X, 4700 MHz
69291 MIPS -46%
Intel Core i5-12600K
i5-12600K, 2800 MHz
64260 MIPS -49%
7z b 4 -mmt1
AMD Ryzen 9 7950X
R9 7950X, 4500 MHz
8365 MIPS +15%
AMD Ryzen 9 7900X
R9 7900X, 4700 MHz
8282 MIPS +14%
AMD Ryzen 5 7600X
R5 7600X, 4700 MHz
8063 MIPS +11%
Intel Core i9-13900K
i9-13900K, 3000 MHz
7272 MIPS 0%
Intel Core i9-13900K
i9-13900K, 3000 MHz
7255 MIPS
Intel Core i9-12900K
i9-12900K, 3200 MHz
6571 MIPS -9%
Intel Core i5-13600K
i5-13600K, 3500 MHz
6502 MIPS -10%
Intel Core i5-12600K
i5-12600K, 2800 MHz
5944 MIPS -18%
HWBOT x265 Benchmark v2.2 - 4k Preset
AMD Ryzen 9 7950X
R9 7950X, 4500 MHz
44.4 fps +29%
Intel Core i9-13900K
i9-13900K, 3000 MHz
42.6 fps +23%
AMD Ryzen 9 7900X
R9 7900X, 4700 MHz
36.2 fps +5%
Intel Core i9-13900K
i9-13900K, 3000 MHz
34.5 fps
Intel Core i5-12600K
i5-12600K, 2800 MHz
30.1 fps -13%
Intel Core i9-12900K
i9-12900K, 3200 MHz
30 fps -13%
Intel Core i5-13600K
i5-13600K, 3500 MHz
27.6 fps -20%
AMD Ryzen 5 7600X
R5 7600X, 4700 MHz
21.1 fps -39%
R Benchmark 2.5 - Overall mean
Intel Core i5-12600K
i5-12600K, 2800 MHz
0.4456 sec * -14%
Intel Core i9-12900K
i9-12900K, 3200 MHz
0.4216 sec * -8%
Intel Core i5-13600K
i5-13600K, 3500 MHz
0.405 sec * -4%
Intel Core i9-13900K
i9-13900K, 3000 MHz
0.3911 sec *
AMD Ryzen 5 7600X
R5 7600X, 4700 MHz
0.3749 sec * +4%
AMD Ryzen 9 7900X
R9 7900X, 4700 MHz
0.3736 sec * +4%
AMD Ryzen 9 7950X
R9 7950X, 4500 MHz
0.3682 sec * +6%
Intel Core i9-13900K
i9-13900K, 3000 MHz
0.3539 sec * +10%
LibreOffice - 20 Documents To PDF
Intel Core i5-12600K
i5-12600K, 2800 MHz
71.8 s * -73%
Intel Core i9-13900K
i9-13900K, 3000 MHz
41.6 s *
Intel Core i9-12900K
i9-12900K, 3200 MHz
40.6 s * +2%
AMD Ryzen 5 7600X
R5 7600X, 4700 MHz
36.8 s * +12%
Intel Core i9-13900K
i9-13900K, 3000 MHz
36.6 s * +12%
AMD Ryzen 9 7950X
R9 7950X, 4500 MHz
35.5 s * +15%
Intel Core i5-13600K
i5-13600K, 3500 MHz
35 s * +16%
AMD Ryzen 9 7900X
R9 7900X, 4700 MHz
34.9 s * +16%
WebXPRT 3 - Overall
AMD Ryzen 9 7900X
R9 7900X, 4700 MHz
371 Points +10%
AMD Ryzen 9 7950X
R9 7950X, 4500 MHz
366 Points +8%
AMD Ryzen 5 7600X
R5 7600X, 4700 MHz
362 Points +7%
Intel Core i9-13900K
i9-13900K, 3000 MHz
361 Points +7%
Intel Core i9-13900K
i9-13900K, 3000 MHz
338 Points
Intel Core i5-13600K
i5-13600K, 3500 MHz
333 Points -1%
Intel Core i9-12900K
i9-12900K, 3200 MHz
320 Points -5%
Intel Core i5-12600K
i5-12600K, 2800 MHz
293 Points -13%
Mozilla Kraken 1.1 - Total
Intel Core i5-12600K
i5-12600K, 2800 MHz
511 ms * -17%
Intel Core i9-12900K
i9-12900K, 3200 MHz
481 ms * -10%
Intel Core i5-13600K
i5-13600K, 3500 MHz
469 ms * -7%
AMD Ryzen 5 7600X
R5 7600X, 4700 MHz
441 ms * -1%
Intel Core i9-13900K
i9-13900K, 3000 MHz
438 ms *
AMD Ryzen 9 7950X
R9 7950X, 4500 MHz
433 ms * +1%
Intel Core i9-13900K
i9-13900K, 3000 MHz
432 ms * +1%
AMD Ryzen 9 7900X
R9 7900X, 4700 MHz
431 ms * +2%
3DMark
3840x2160 Fire Strike Ultra Physics
Intel Core i9-13900K
i9-13900K, 3000 MHz
54036 Points +17%
Intel Core i9-13900K
i9-13900K, 3000 MHz
46030 Points
AMD Ryzen 9 7900X
R9 7900X, 4700 MHz
42399 Points -8%
AMD Ryzen 9 7950X
R9 7950X, 4500 MHz
42399 Points -8%
Intel Core i9-12900K
i9-12900K, 3200 MHz
39462 Points -14%
Intel Core i5-13600K
i5-13600K, 3500 MHz
36774 Points -20%
AMD Ryzen 5 7600X
R5 7600X, 4700 MHz
30780 Points -33%
Intel Core i5-12600K
i5-12600K, 2800 MHz
29443 Points -36%
1920x1080 Fire Strike Physics
Intel Core i9-13900K
i9-13900K, 3000 MHz
53853 Points +17%
Intel Core i9-13900K
i9-13900K, 3000 MHz
46013 Points
AMD Ryzen 9 7900X
R9 7900X, 4700 MHz
42682 Points -7%
AMD Ryzen 9 7950X
R9 7950X, 4500 MHz
42682 Points -7%
Intel Core i9-12900K
i9-12900K, 3200 MHz
39112 Points -15%
Intel Core i5-13600K
i5-13600K, 3500 MHz
35386 Points -23%
AMD Ryzen 5 7600X
R5 7600X, 4700 MHz
30691 Points -33%
Intel Core i5-12600K
i5-12600K, 2800 MHz
29671 Points -36%
2560x1440 Time Spy CPU
Intel Core i9-13900K
i9-13900K, 3000 MHz
19392 Points +19%
Intel Core i9-12900K
i9-12900K, 3200 MHz
18431 Points +14%
Intel Core i5-13600K
i5-13600K, 3500 MHz
17124 Points +5%
AMD Ryzen 9 7900X
R9 7900X, 4700 MHz
16616 Points +2%
AMD Ryzen 9 7950X
R9 7950X, 4500 MHz
16616 Points +2%
Intel Core i9-13900K
i9-13900K, 3000 MHz
16236 Points
Intel Core i5-12600K
i5-12600K, 2800 MHz
13869 Points -15%
AMD Ryzen 5 7600X
R5 7600X, 4700 MHz
10458 Points -36%

* ... kleiner is beter

Performance Rating
AMD Ryzen 9 7950X
NVIDIA GeForce RTX 3090 Founders Edition
98.8 pt
Intel Core i9-13900K
78.7 pt
AMD Ryzen 9 7900X
AMD Ryzen 9 7900X
75 pt
Intel Core i9-13900K
Intel NUC13 Raptor Canyon
61.7 pt
Intel Core i5-13600K
52.5 pt
Intel Core i9-12900K
44 pt
AMD Ryzen 5 7600X
AMD Ryzen 5 7600X
41.8 pt
AMD Ryzen 9 5900HX
Minisforum Neptune Series HX90G
37.4 pt
Gemiddelde van klas Desktop
 
36.6 pt
Intel Core i5-12600K
32.5 pt
Intel Core i7-11800H
Minisforum NUCX i7
31.6 pt
AIDA64 / FP32 Ray-Trace
AMD Ryzen 9 7950X
NVIDIA GeForce RTX 3090 Founders Edition
61180 KRay/s +117%
Intel Core i9-13900K
36939 KRay/s +31%
AMD Ryzen 9 7900X
AMD Ryzen 9 7900X
33676 KRay/s +19%
Intel Core i9-13900K
Intel NUC13 Raptor Canyon
28226 KRay/s
Intel Core i5-13600K
23446 KRay/s -17%
AMD Ryzen 5 7600X
AMD Ryzen 5 7600X
17633 KRay/s -38%
Gemiddelde van klas Desktop
  (490 - 62786, n=25, laatste 2 jaar)
17460 KRay/s -38%
AMD Ryzen 9 5900HX
Minisforum Neptune Series HX90G
15334 KRay/s -46%
Intel Core i9-12900K
13266 KRay/s -53%
Intel Core i7-11800H
Minisforum NUCX i7
12788 KRay/s -55%
Intel Core i5-12600K
8243 KRay/s -71%
AIDA64 / FPU Julia
AMD Ryzen 9 7950X
NVIDIA GeForce RTX 3090 Founders Edition
234844 Points +66%
AMD Ryzen 9 7900X
AMD Ryzen 9 7900X
201995 Points +43%
Intel Core i9-13900K
183390 Points +30%
Intel Core i9-13900K
Intel NUC13 Raptor Canyon
141111 Points
Intel Core i5-13600K
111374 Points -21%
AMD Ryzen 5 7600X
AMD Ryzen 5 7600X
103526 Points -27%
AMD Ryzen 9 5900HX
Minisforum Neptune Series HX90G
99427 Points -30%
Gemiddelde van klas Desktop
  (2932 - 264044, n=25, laatste 2 jaar)
81505 Points -42%
Intel Core i9-12900K
59419 Points -58%
Intel Core i7-11800H
Minisforum NUCX i7
54342 Points -61%
Intel Core i5-12600K
37321 Points -74%
AIDA64 / CPU SHA3
AMD Ryzen 9 7950X
NVIDIA GeForce RTX 3090 Founders Edition
10076 MB/s +48%
Intel Core i9-13900K
9180 MB/s +35%
AMD Ryzen 9 7900X
AMD Ryzen 9 7900X
7018 MB/s +3%
Intel Core i9-13900K
Intel NUC13 Raptor Canyon
6810 MB/s
Intel Core i5-13600K
5253 MB/s -23%
Intel Core i9-12900K
4952 MB/s -27%
Gemiddelde van klas Desktop
  (202 - 10362, n=25, laatste 2 jaar)
3734 MB/s -45%
Intel Core i7-11800H
Minisforum NUCX i7
3655 MB/s -46%
AMD Ryzen 5 7600X
AMD Ryzen 5 7600X
3601 MB/s -47%
AMD Ryzen 9 5900HX
Minisforum Neptune Series HX90G
3401 MB/s -50%
Intel Core i5-12600K
3250 MB/s -52%
AIDA64 / CPU Queen
AMD Ryzen 9 7950X
NVIDIA GeForce RTX 3090 Founders Edition
203324 Points +30%
AMD Ryzen 9 7900X
AMD Ryzen 9 7900X
172637 Points +11%
Intel Core i9-13900K
159676 Points +2%
Intel Core i9-13900K
Intel NUC13 Raptor Canyon
155930 Points
Intel Core i5-13600K
120485 Points -23%
Intel Core i9-12900K
112694 Points -28%
AMD Ryzen 5 7600X
AMD Ryzen 5 7600X
107954 Points -31%
AMD Ryzen 9 5900HX
Minisforum Neptune Series HX90G
104437 Points -33%
Gemiddelde van klas Desktop
  (8820 - 205588, n=25, laatste 2 jaar)
94006 Points -40%
Intel Core i7-11800H
Minisforum NUCX i7
89290 Points -43%
Intel Core i5-12600K
88337 Points -43%
AIDA64 / FPU SinJulia
AMD Ryzen 9 7950X
NVIDIA GeForce RTX 3090 Founders Edition
32823 Points +89%
AMD Ryzen 9 7900X
AMD Ryzen 9 7900X
24881 Points +43%
Intel Core i9-13900K
19920 Points +14%
Intel Core i9-13900K
Intel NUC13 Raptor Canyon
17400 Points
Intel Core i9-12900K
14664 Points -16%
AMD Ryzen 5 7600X
AMD Ryzen 5 7600X
12774 Points -27%
AMD Ryzen 9 5900HX
Minisforum Neptune Series HX90G
12662 Points -27%
Intel Core i5-13600K
12201 Points -30%
Gemiddelde van klas Desktop
  (396 - 32855, n=25, laatste 2 jaar)
10987 Points -37%
Intel Core i7-11800H
Minisforum NUCX i7
9734 Points -44%
Intel Core i5-12600K
9510 Points -45%
AIDA64 / FPU Mandel
AMD Ryzen 9 7950X
NVIDIA GeForce RTX 3090 Founders Edition
118564 Points +68%
AMD Ryzen 9 7900X
AMD Ryzen 9 7900X
106620 Points +51%
Intel Core i9-13900K
91721 Points +30%
Intel Core i9-13900K
Intel NUC13 Raptor Canyon
70668 Points
Intel Core i5-13600K
57797 Points -18%
AMD Ryzen 9 5900HX
Minisforum Neptune Series HX90G
54893 Points -22%
AMD Ryzen 5 7600X
AMD Ryzen 5 7600X
54555 Points -23%
Gemiddelde van klas Desktop
  (1558 - 138291, n=25, laatste 2 jaar)
43317 Points -39%
Intel Core i9-12900K
38042 Points -46%
Intel Core i7-11800H
Minisforum NUCX i7
32372 Points -54%
Intel Core i5-12600K
24230 Points -66%
AIDA64 / CPU AES
AMD Ryzen 9 7950X
NVIDIA GeForce RTX 3090 Founders Edition
377952 MB/s +183%
Intel Core i9-13900K
297727 MB/s +123%
AMD Ryzen 9 7900X
AMD Ryzen 9 7900X
279956 MB/s +110%
Intel Core i5-13600K
175556 MB/s +31%
AMD Ryzen 5 7600X
AMD Ryzen 5 7600X
144365 MB/s +8%
AMD Ryzen 9 5900HX
Minisforum Neptune Series HX90G
134031 MB/s 0%
Intel Core i9-13900K
Intel NUC13 Raptor Canyon
133509 MB/s
Intel Core i7-11800H
Minisforum NUCX i7
128262 MB/s -4%
Gemiddelde van klas Desktop
  (3778 - 379659, n=25, laatste 2 jaar)
108385 MB/s -19%
Intel Core i9-12900K
94062 MB/s -30%
Intel Core i5-12600K
58635 MB/s -56%
AIDA64 / CPU ZLib
Intel Core i9-13900K
2490 MB/s +27%
AMD Ryzen 9 7950X
NVIDIA GeForce RTX 3090 Founders Edition
2427 MB/s +24%
Intel Core i9-13900K
Intel NUC13 Raptor Canyon
1965 MB/s
AMD Ryzen 9 7900X
AMD Ryzen 9 7900X
1848 MB/s -6%
Intel Core i9-12900K
1560 MB/s -21%
Intel Core i5-13600K
1426 MB/s -27%
Intel Core i5-12600K
988 MB/s -50%
AMD Ryzen 5 7600X
AMD Ryzen 5 7600X
945 MB/s -52%
Gemiddelde van klas Desktop
  (75.2 - 2441, n=25, laatste 2 jaar)
936 MB/s -52%
AMD Ryzen 9 5900HX
Minisforum Neptune Series HX90G
859 MB/s -56%
Intel Core i7-11800H
Minisforum NUCX i7
756 MB/s -62%
AIDA64 / FP64 Ray-Trace
AMD Ryzen 9 7950X
NVIDIA GeForce RTX 3090 Founders Edition
32883 KRay/s +114%
Intel Core i9-13900K
20298 KRay/s +32%
AMD Ryzen 9 7900X
AMD Ryzen 9 7900X
18490 KRay/s +20%
Intel Core i9-13900K
Intel NUC13 Raptor Canyon
15363 KRay/s
Intel Core i5-13600K
12806 KRay/s -17%
AMD Ryzen 5 7600X
AMD Ryzen 5 7600X
9488 KRay/s -38%
Gemiddelde van klas Desktop
  (273 - 33821, n=25, laatste 2 jaar)
9478 KRay/s -38%
Intel Core i9-12900K
8078 KRay/s -47%
AMD Ryzen 9 5900HX
Minisforum Neptune Series HX90G
8000 KRay/s -48%
Intel Core i7-11800H
Minisforum NUCX i7
7109 KRay/s -54%
Intel Core i5-12600K
5149 KRay/s -66%
AIDA64 / CPU PhotoWorxx
Intel Core i9-13900K
48674 MPixel/s +8%
Intel Core i5-12600K
48577 MPixel/s +8%
Intel Core i5-13600K
48434 MPixel/s +8%
Intel Core i9-12900K
48307 MPixel/s +7%
Intel Core i9-13900K
Intel NUC13 Raptor Canyon
45051 MPixel/s
AMD Ryzen 9 7950X
NVIDIA GeForce RTX 3090 Founders Edition
43947 MPixel/s -2%
AMD Ryzen 9 7900X
AMD Ryzen 9 7900X
40893 MPixel/s -9%
AMD Ryzen 5 7600X
AMD Ryzen 5 7600X
32202 MPixel/s -29%
Gemiddelde van klas Desktop
  (5125 - 54037, n=25, laatste 2 jaar)
26592 MPixel/s -41%
Intel Core i7-11800H
Minisforum NUCX i7
23758 MPixel/s -47%
AMD Ryzen 9 5900HX
Minisforum Neptune Series HX90G
20422 MPixel/s -55%

Intel NUC 13 Extreme Kit: Cinebench R15 Multi Loop

Onze Cinebench R15 Multi loop toont een aanzienlijke prestatiedaling na de eerste loop. Door de compacte koeloplossing en de vermogenslimieten zien we een lager prestatieniveau in vergelijking met een Intel Core i9-13900K in een alternatief systeem met de Intel Core i9-13900K onder continue CPU-stress. Dit gezegd zijnde, is het resultaat van 4779 punten nog steeds aanzienlijk hoger dan dat van de Intel Dragon Canyon NUC.

03156309451260157518902205252028353150346537804095441047255040535556705985Tooltip
Intel NUC13 Raptor Canyon Intel Core i9-13900K, Intel Core i9-13900K: Ø4779 (4708.1-5265.93)
Intel Ghost Canyon NUC (RTX 2070) Intel Core i9-9980HK, Intel Core i9-9980HK: Ø1463 (1410.79-1593.44)
Intel Beast Canyon NUC Intel Core i9-11900KB, Intel Core i9-11900KB: Ø1800 (1776.75-1859.25)
Intel Dragon Canyon NUC - RTX 3060 Intel Core i9-12900, Intel Core i9-12900: Ø2592 (2433.39-3346.44)
Intel Core i9-13900K Intel Core i9-13900K, Intel Core i9-13900K: Ø6182 (6045.95-6213.11)
Intel Core i9-12900K Intel Core i9-12900K, Intel Core i9-12900K: Ø3987 (3920.42-4037.55)

Systeemprestaties

Als het aankomt op synthetische benchmarks, schittert de Intel NUC 13 Extreme Raptor Canyon met zeer snelle systeemprestaties. Hier is deIntel Core i9-13900K met betere koeling nog steeds een kleine voorsprong. Concurrenten van Minisforum en directe voorgangers uit de NUC-serie maken echter geen schijn van kans. Subjectief gezien is ons testsysteem zeer snel en responsief en zijn er geen merkbare vertragingen.
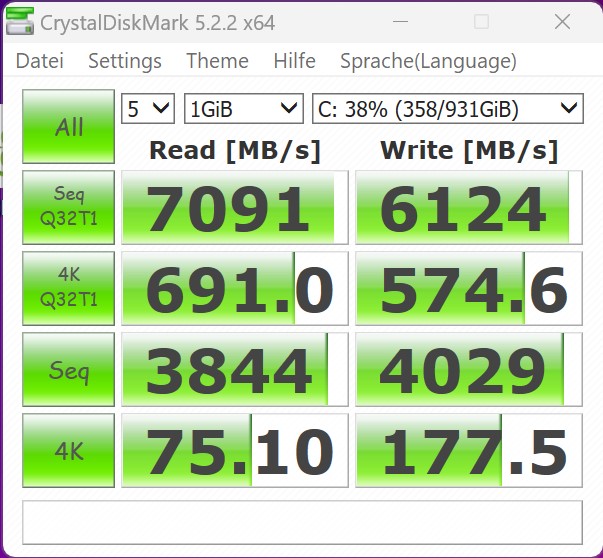
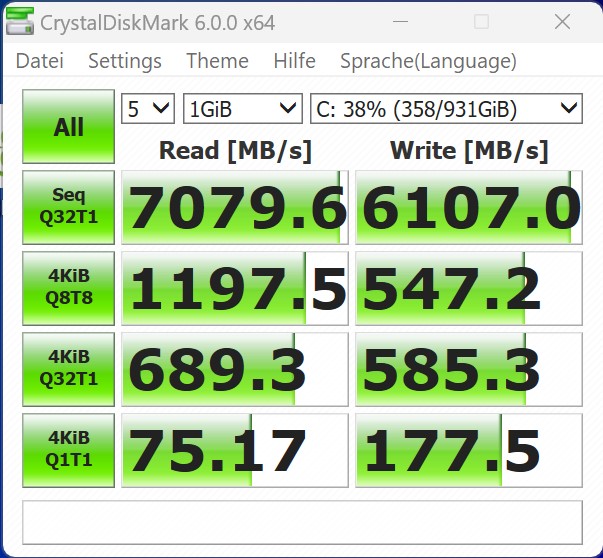
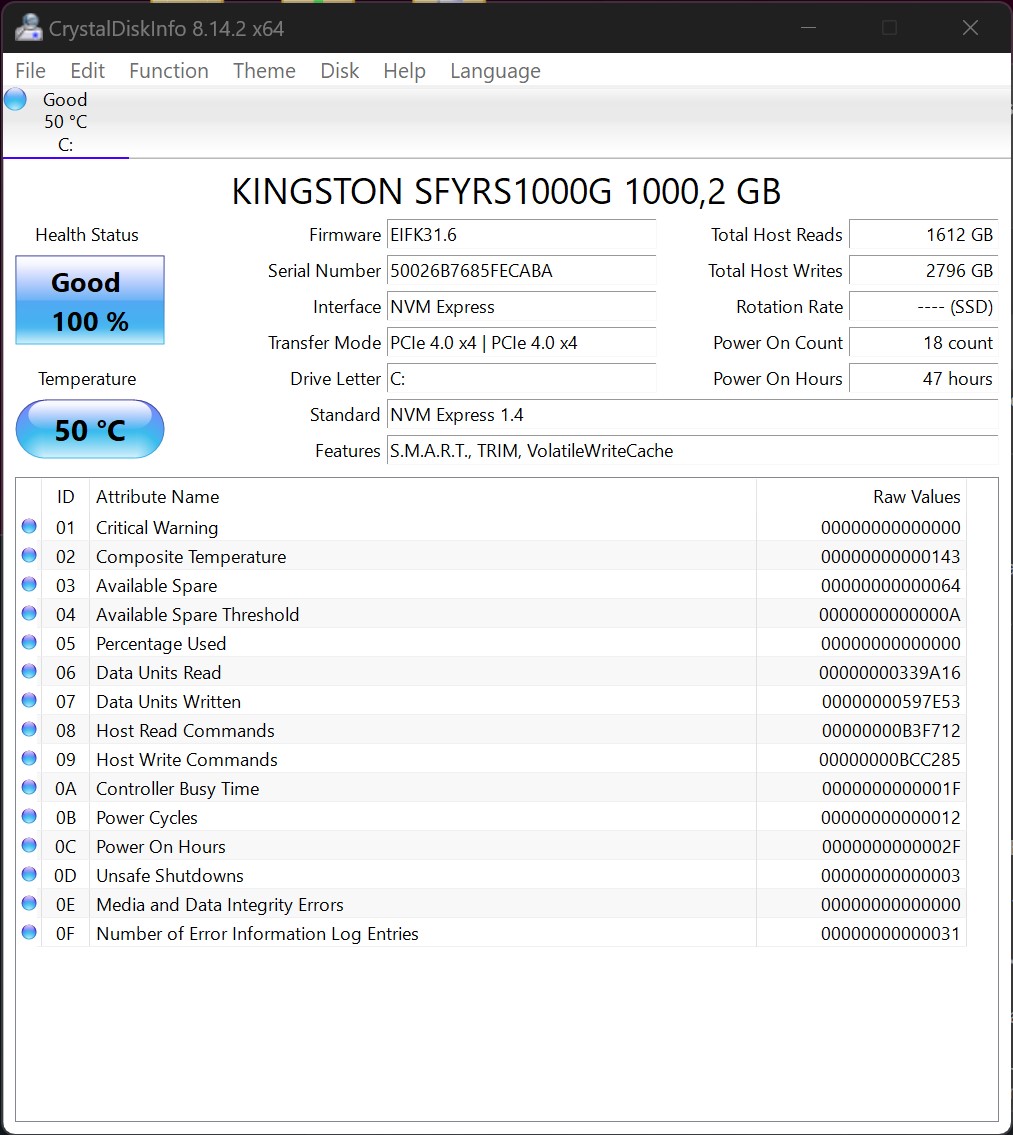
Performance Rating - Percent
AMD Ryzen 9 7900X, AMD Ryzen 9 7900X
NVIDIA GeForce RTX 3090,
97.4 pt
NVIDIA GeForce RTX 3090 Founders Edition, AMD Ryzen 9 7950X
NVIDIA GeForce RTX 3090, Corsair MP600
97.4 pt
AMD Ryzen 5 7600X, AMD Ryzen 5 7600X
NVIDIA GeForce RTX 3090,
96.9 pt
Intel Core i9-13900K, Intel Core i9-13900K
NVIDIA GeForce RTX 3090, Corsair MP600
96.3 pt
Intel Core i5-13600K, Intel Core i5-13600K
NVIDIA GeForce RTX 3090, Corsair MP600
94.1 pt
Intel NUC13 Raptor Canyon, Intel Core i9-13900K
NVIDIA GeForce RTX 3080 Ti, Kingston Fury Renegade SFYRS1000G
89.8 pt
Intel Core i9-12900K, Intel Core i9-12900K
NVIDIA Titan RTX, Intel Optane 905P 480GB 2.5
85.9 pt
Intel Core i5-12600K, Intel Core i5-12600K
NVIDIA Titan RTX, Intel Optane 905P 480GB 2.5
84.4 pt
Intel Dragon Canyon NUC - RTX 3060, Intel Core i9-12900
NVIDIA GeForce RTX 3060, Transcend M.2 SSD 2200S TS512GMTE220S
83.1 pt
Intel Beast Canyon NUC, Intel Core i9-11900KB
NVIDIA GeForce RTX 3060, Sabrent Rocket 4.0 500GB
76.8 pt
Minisforum Neptune Series HX90G, AMD Ryzen 9 5900HX
AMD Radeon RX 6600M, ESO512GYLCT
76.6 pt
Minisforum NUCX i7, Intel Core i7-11800H
NVIDIA GeForce RTX 3070 Laptop GPU,
71.3 pt
PCMark 10
Score
AMD Ryzen 9 7900X, AMD Ryzen 9 7900X
NVIDIA GeForce RTX 3090,
9911 Points +9%
NVIDIA GeForce RTX 3090 Founders Edition, AMD Ryzen 9 7950X
NVIDIA GeForce RTX 3090, Corsair MP600
9911 Points +9%
Intel Core i9-13900K, Intel Core i9-13900K
NVIDIA GeForce RTX 3090, Corsair MP600
9788 Points +7%
AMD Ryzen 5 7600X, AMD Ryzen 5 7600X
NVIDIA GeForce RTX 3090,
9470 Points +4%
Intel Core i5-13600K, Intel Core i5-13600K
NVIDIA GeForce RTX 3090, Corsair MP600
9362 Points +3%
Intel NUC13 Raptor Canyon, Intel Core i9-13900K
NVIDIA GeForce RTX 3080 Ti, Kingston Fury Renegade SFYRS1000G
9118 Points
Intel Core i9-12900K, Intel Core i9-12900K
NVIDIA Titan RTX, Intel Optane 905P 480GB 2.5
8604 Points -6%
Intel Core i5-12600K, Intel Core i5-12600K
NVIDIA Titan RTX, Intel Optane 905P 480GB 2.5
8259 Points -9%
Intel Dragon Canyon NUC - RTX 3060, Intel Core i9-12900
NVIDIA GeForce RTX 3060, Transcend M.2 SSD 2200S TS512GMTE220S
8083 Points -11%
Minisforum Neptune Series HX90G, AMD Ryzen 9 5900HX
AMD Radeon RX 6600M, ESO512GYLCT
7341 Points -19%
Intel Beast Canyon NUC, Intel Core i9-11900KB
NVIDIA GeForce RTX 3060, Sabrent Rocket 4.0 500GB
7281 Points -20%
Minisforum NUCX i7, Intel Core i7-11800H
NVIDIA GeForce RTX 3070 Laptop GPU,
6863 Points -25%
Essentials
Intel Core i9-13900K, Intel Core i9-13900K
NVIDIA GeForce RTX 3090, Corsair MP600
12868 Points +11%
AMD Ryzen 9 7900X, AMD Ryzen 9 7900X
NVIDIA GeForce RTX 3090,
12651 Points +9%
NVIDIA GeForce RTX 3090 Founders Edition, AMD Ryzen 9 7950X
NVIDIA GeForce RTX 3090, Corsair MP600
12651 Points +9%
Intel Core i5-13600K, Intel Core i5-13600K
NVIDIA GeForce RTX 3090, Corsair MP600
12306 Points +6%
AMD Ryzen 5 7600X, AMD Ryzen 5 7600X
NVIDIA GeForce RTX 3090,
12259 Points +6%
Intel NUC13 Raptor Canyon, Intel Core i9-13900K
NVIDIA GeForce RTX 3080 Ti, Kingston Fury Renegade SFYRS1000G
11598 Points
Intel Dragon Canyon NUC - RTX 3060, Intel Core i9-12900
NVIDIA GeForce RTX 3060, Transcend M.2 SSD 2200S TS512GMTE220S
11171 Points -4%
Intel Core i9-12900K, Intel Core i9-12900K
NVIDIA Titan RTX, Intel Optane 905P 480GB 2.5
11086 Points -4%
Intel Core i5-12600K, Intel Core i5-12600K
NVIDIA Titan RTX, Intel Optane 905P 480GB 2.5
10650 Points -8%
Minisforum Neptune Series HX90G, AMD Ryzen 9 5900HX
AMD Radeon RX 6600M, ESO512GYLCT
10552 Points -9%
Intel Beast Canyon NUC, Intel Core i9-11900KB
NVIDIA GeForce RTX 3060, Sabrent Rocket 4.0 500GB
10422 Points -10%
Minisforum NUCX i7, Intel Core i7-11800H
NVIDIA GeForce RTX 3070 Laptop GPU,
9865 Points -15%
Productivity
AMD Ryzen 5 7600X, AMD Ryzen 5 7600X
NVIDIA GeForce RTX 3090,
12608 Points +15%
AMD Ryzen 9 7900X, AMD Ryzen 9 7900X
NVIDIA GeForce RTX 3090,
11853 Points +8%
NVIDIA GeForce RTX 3090 Founders Edition, AMD Ryzen 9 7950X
NVIDIA GeForce RTX 3090, Corsair MP600
11853 Points +8%
Intel Core i5-13600K, Intel Core i5-13600K
NVIDIA GeForce RTX 3090, Corsair MP600
11630 Points +6%
Intel Core i9-13900K, Intel Core i9-13900K
NVIDIA GeForce RTX 3090, Corsair MP600
11370 Points +3%
Intel Core i5-12600K, Intel Core i5-12600K
NVIDIA Titan RTX, Intel Optane 905P 480GB 2.5
11001 Points 0%
Intel NUC13 Raptor Canyon, Intel Core i9-13900K
NVIDIA GeForce RTX 3080 Ti, Kingston Fury Renegade SFYRS1000G
10988 Points
Intel Core i9-12900K, Intel Core i9-12900K
NVIDIA Titan RTX, Intel Optane 905P 480GB 2.5
10699 Points -3%
Intel Dragon Canyon NUC - RTX 3060, Intel Core i9-12900
NVIDIA GeForce RTX 3060, Transcend M.2 SSD 2200S TS512GMTE220S
10205 Points -7%
Intel Beast Canyon NUC, Intel Core i9-11900KB
NVIDIA GeForce RTX 3060, Sabrent Rocket 4.0 500GB
9582 Points -13%
Minisforum Neptune Series HX90G, AMD Ryzen 9 5900HX
AMD Radeon RX 6600M, ESO512GYLCT
9288 Points -15%
Minisforum NUCX i7, Intel Core i7-11800H
NVIDIA GeForce RTX 3070 Laptop GPU,
8579 Points -22%

Opslagoplossing

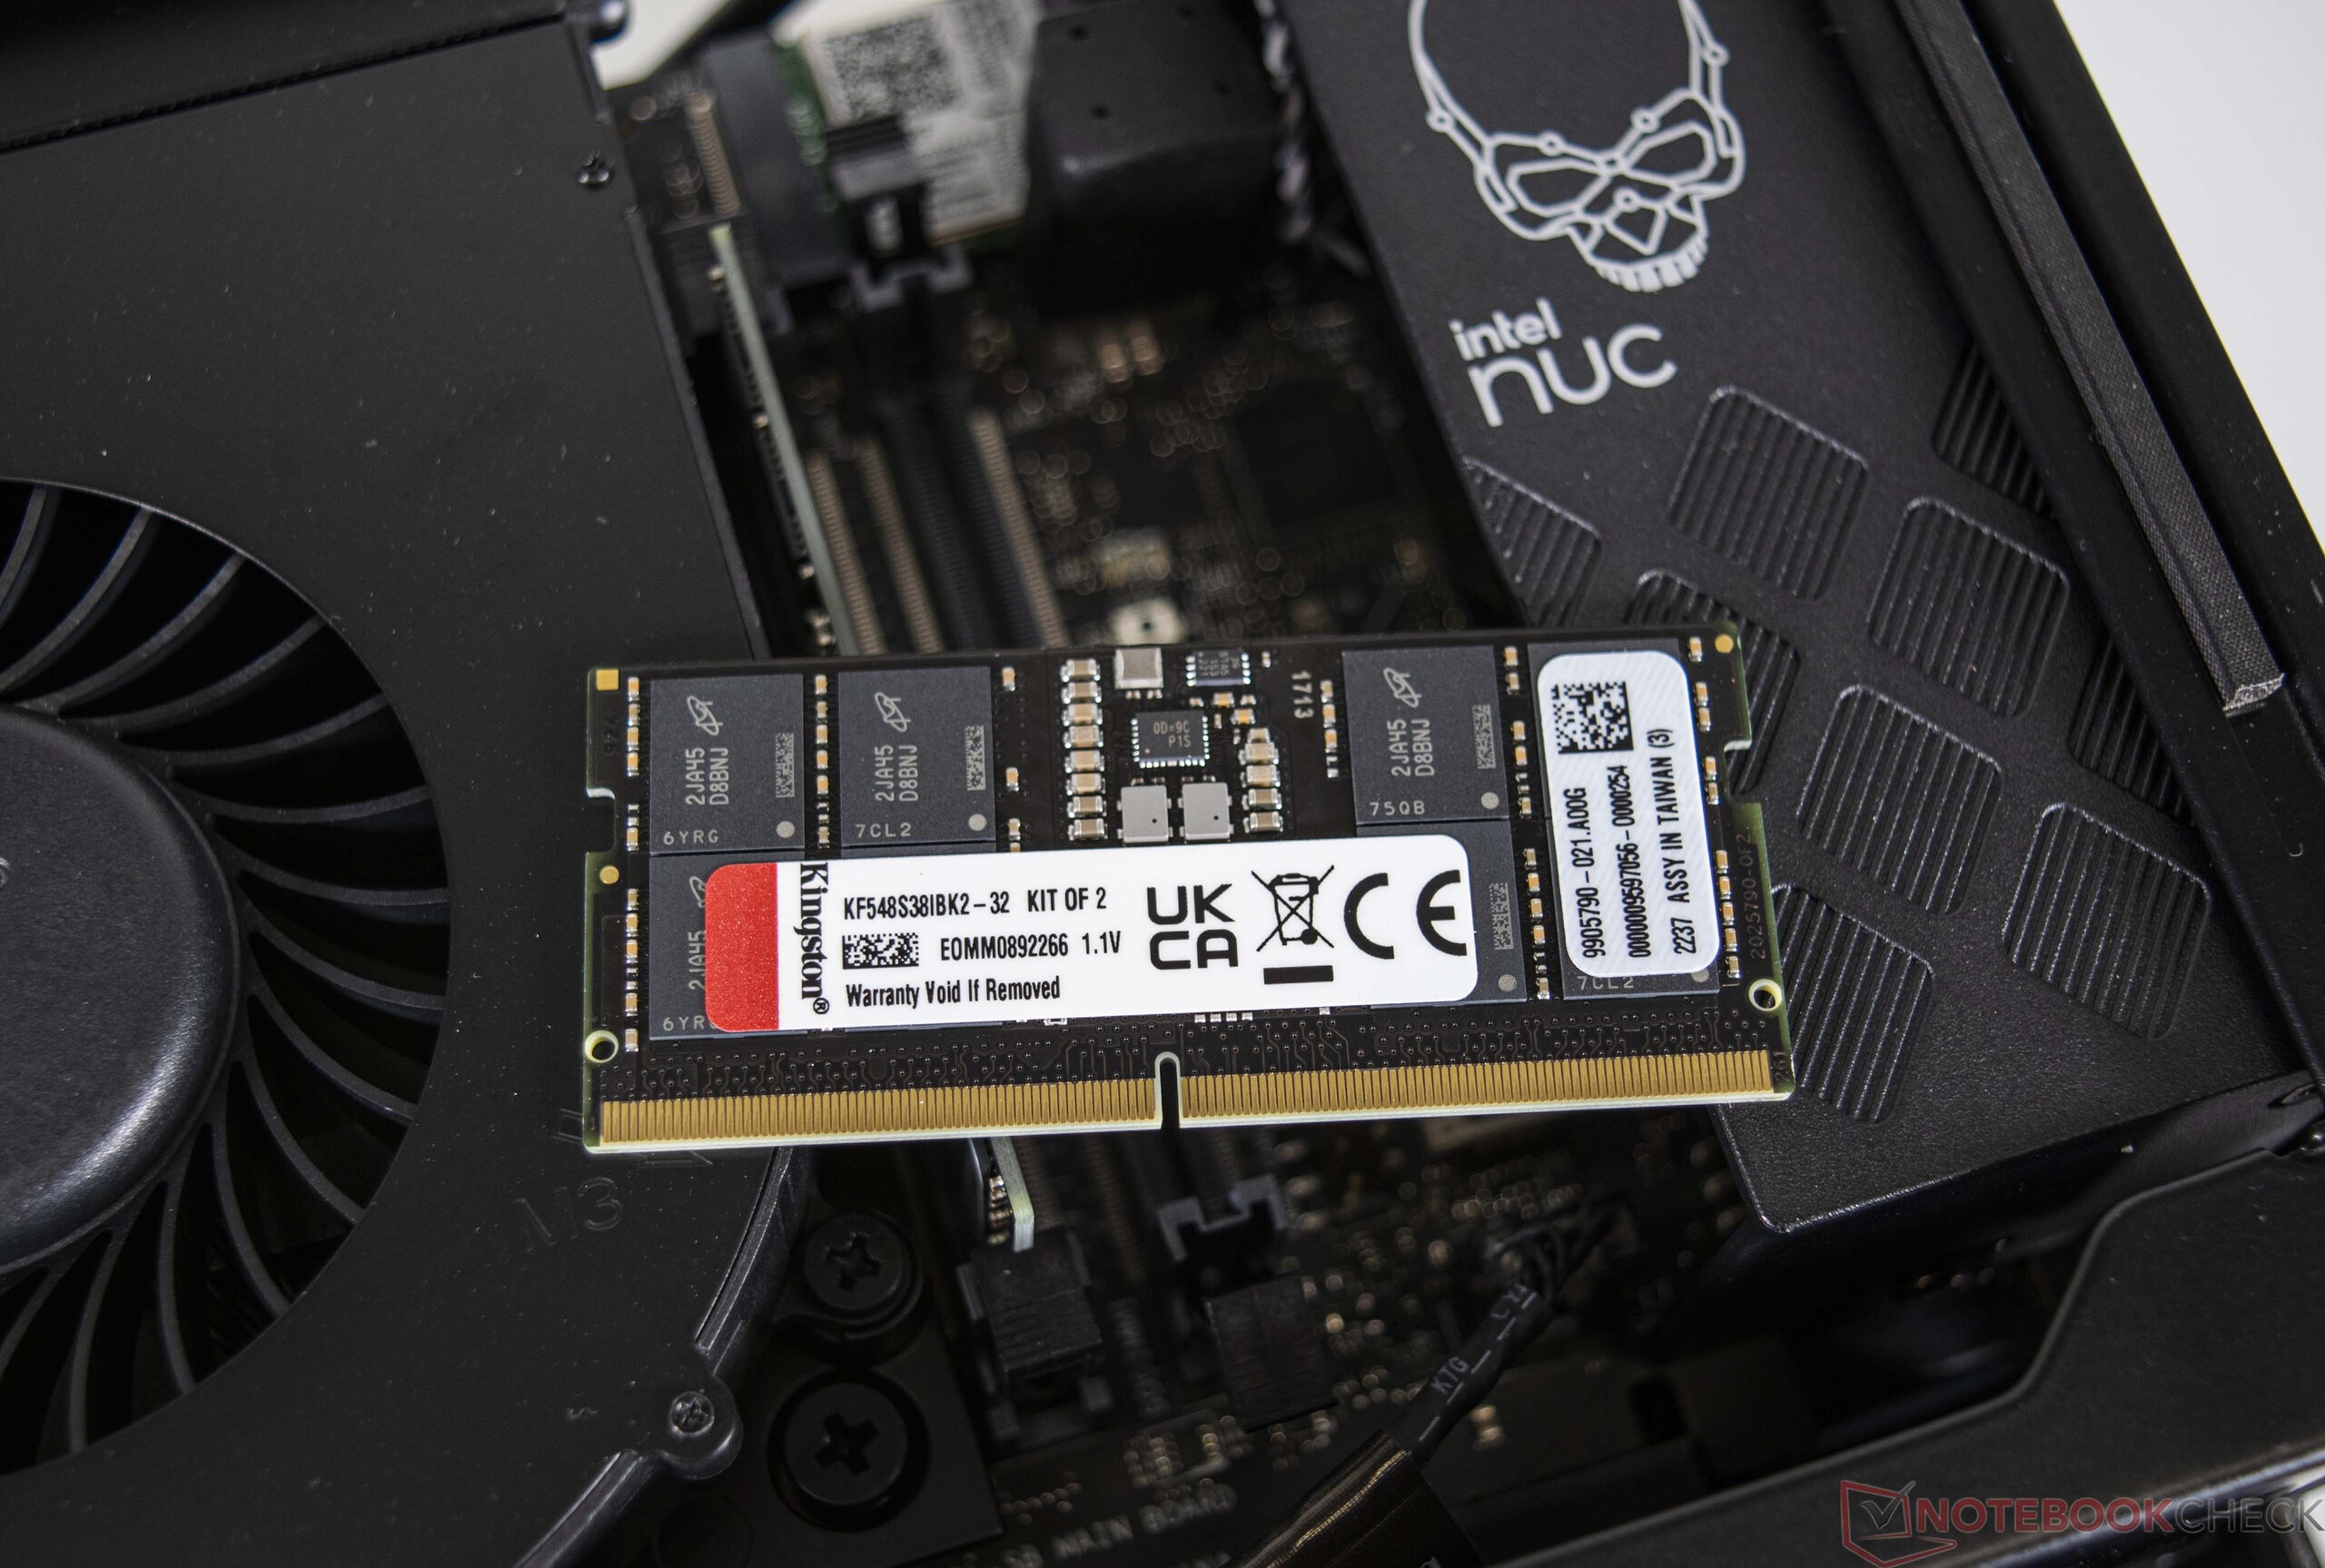
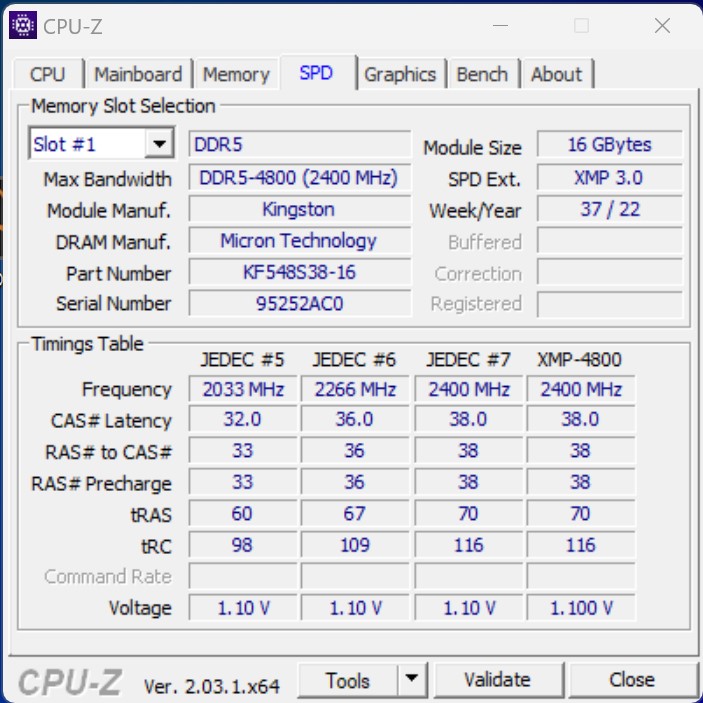
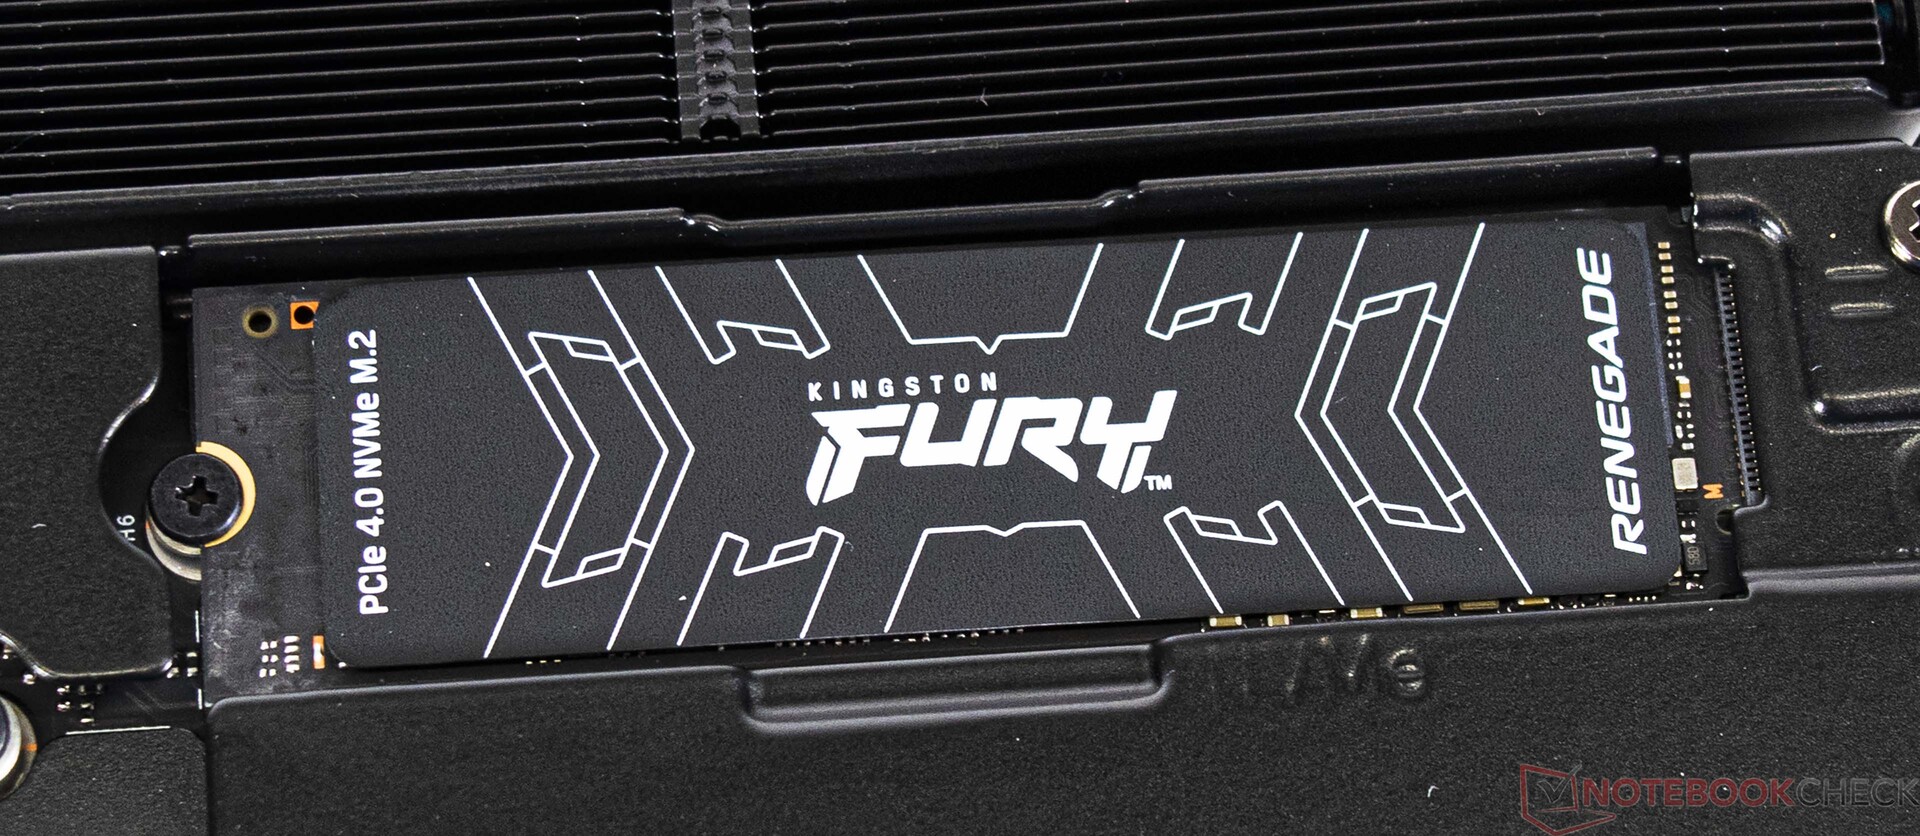
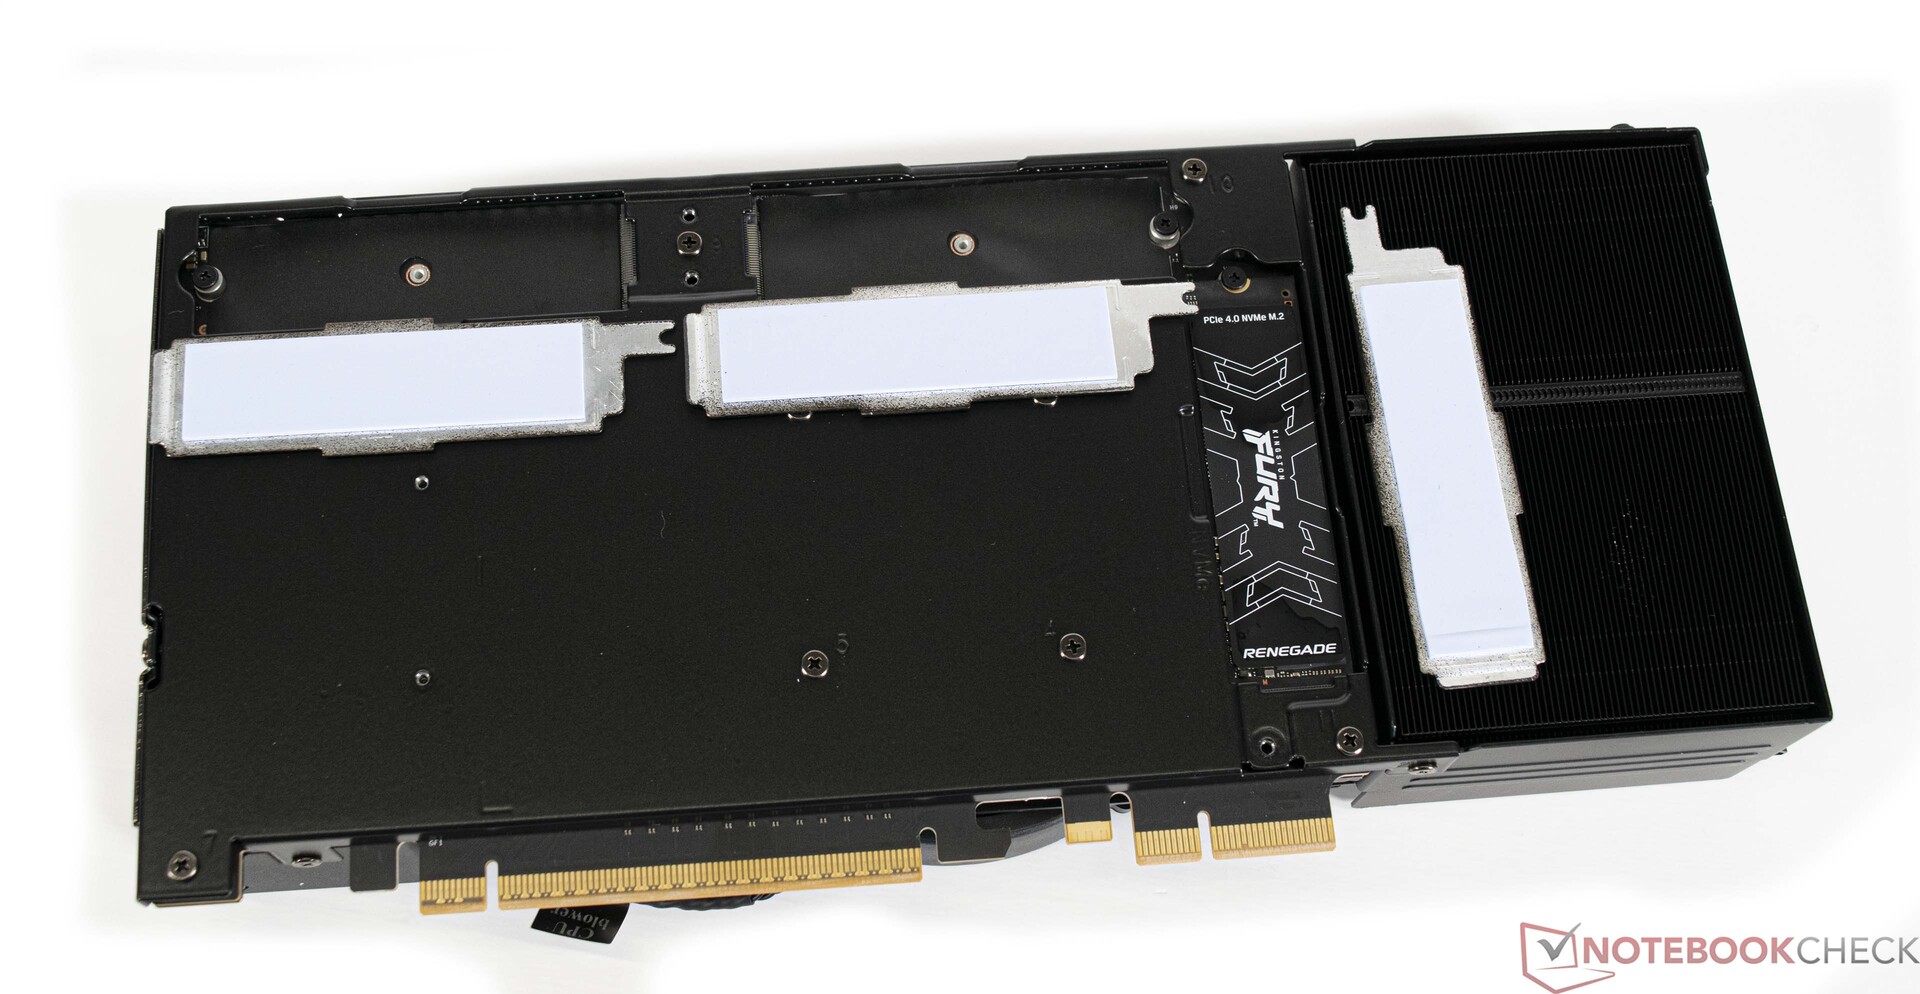
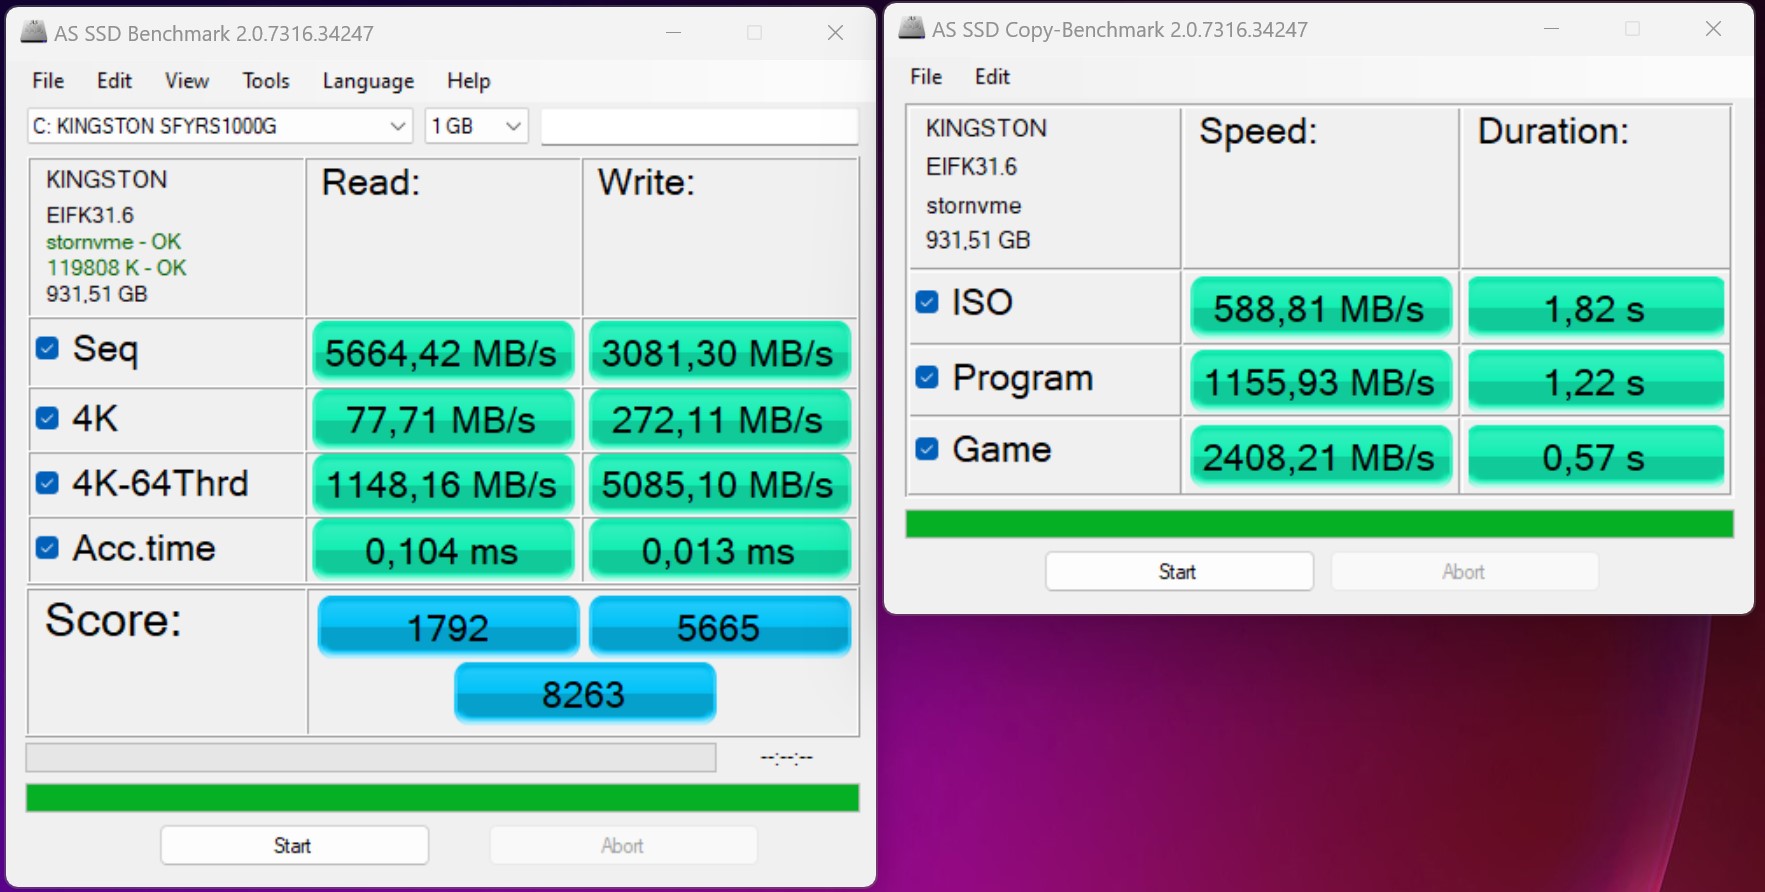
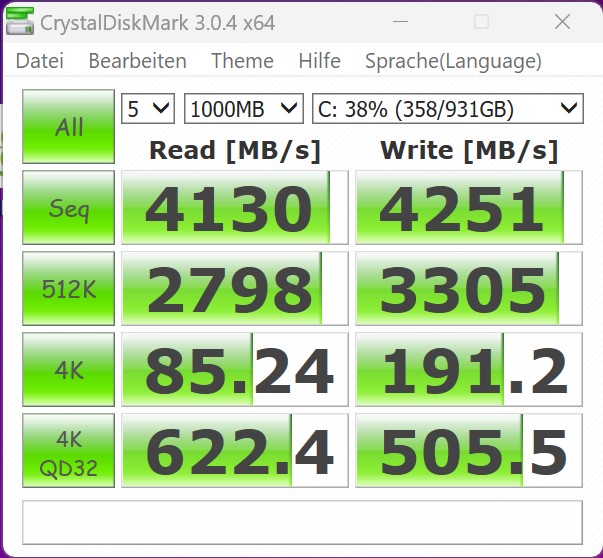
Ons testvoorbeeld gebruikt een zeer snelle Kingston NVMe SSD als systeemschijf. Het model presteert erg goed en haalt razendsnelle overdrachtssnelheden in zowel AS SSD als DiskSpd. Aangezien de Intel NUC 13 Extreme Raptor Canyon een barebone systeem is, kunnen gebruikers kiezen welke SSD schijf ze willen installeren. Het Compute Element ondersteunt maximaal drie M.2 SSD's in totaal. Het installeren van de SSD's is een beetje een gedoe, omdat het Compute Element eerst helemaal uit de NUC 13 moet worden gehaald.

Meer vergelijkingen en benchmarks zijn te vinden in onze vergelijkingstabel.

1-TB Kingston SSD
1-TB Kingston SSD
Het Compute Element biedt plaats aan maximaal drie M.2-2280 SSD's.
AS SSD
AS SSD
CDM 3
CDM 3
CDM 5
CDM 5
CDM 6
CDM 6
CDI
CDI
Kingston Fury Renegade SFYRS1000G
Sequential Read: 4130 MB/s
Sequential Write: 4251 MB/s
512K Read: 2798 MB/s
512K Write: 3305 MB/s
4K Read: 85.24 MB/s
4K Write: 191.2 MB/s
4K QD32 Read: 622.4 MB/s
4K QD32 Write: 505.5 MB/s
Drive Performance Rating - Percent
Intel NUC13 Raptor Canyon
Kingston Fury Renegade SFYRS1000G
84.9 pt
Gemiddeld Kingston Fury Renegade SFYRS1000G
 
84.9 pt
Intel Beast Canyon NUC
Sabrent Rocket 4.0 500GB
72.1 pt
Intel Dragon Canyon NUC - RTX 3060 -11!
Transcend M.2 SSD 2200S TS512GMTE220S
63.8 pt
Minisforum Neptune Series HX90G
ESO512GYLCT
45.7 pt
Gemiddelde van klas Desktop
 
45.4 pt
Minisforum NUCX i7
 
40.7 pt
DiskSpd
seq read
Intel NUC13 Raptor Canyon
Kingston Fury Renegade SFYRS1000G
3912 (3515.15min - 3912.09max) MB/s
Gemiddeld Kingston Fury Renegade SFYRS1000G
  ()
3912 MB/s 0%
Intel Beast Canyon NUC
Sabrent Rocket 4.0 500GB
1936 (1755.26min - 1936.41max) MB/s -51%
Intel Dragon Canyon NUC - RTX 3060
Transcend M.2 SSD 2200S TS512GMTE220S
1936 (1755.26min - 1936.41max) MB/s -51%
Gemiddelde van klas Desktop
  (229 - 4276, n=20, laatste 2 jaar)
1935 MB/s -51%
Minisforum NUCX i7
 
1620 (1579.16min - 1620.17max) MB/s -59%
Minisforum Neptune Series HX90G
ESO512GYLCT
1614 (1595.77min - 1613.55max) MB/s -59%
seq write
Intel NUC13 Raptor Canyon
Kingston Fury Renegade SFYRS1000G
4256 (3822.69min - 4255.75max) MB/s
Gemiddeld Kingston Fury Renegade SFYRS1000G
  ()
4256 MB/s 0%
Gemiddelde van klas Desktop
  (105.7 - 6288, n=20, laatste 2 jaar)
2108 MB/s -50%
Intel Beast Canyon NUC
Sabrent Rocket 4.0 500GB
1744 (525.75min - 1743.78max) MB/s -59%
Intel Dragon Canyon NUC - RTX 3060
Transcend M.2 SSD 2200S TS512GMTE220S
1744 (525.75min - 1743.78max) MB/s -59%
Minisforum NUCX i7
 
1707 (1684.21min - 1706.66max) MB/s -60%
Minisforum Neptune Series HX90G
ESO512GYLCT
1681 (1674.37min - 1681.28max) MB/s -61%
seq q8 t1 read
Intel NUC13 Raptor Canyon
Kingston Fury Renegade SFYRS1000G
7116 (6584.47min - 7116.06max) MB/s
Gemiddeld Kingston Fury Renegade SFYRS1000G
  ()
7116 MB/s 0%
Intel Beast Canyon NUC
Sabrent Rocket 4.0 500GB
4996 (4330.97min - 4996.25max) MB/s -30%
Intel Dragon Canyon NUC - RTX 3060
Transcend M.2 SSD 2200S TS512GMTE220S
4996 (4330.97min - 4996.25max) MB/s -30%
Gemiddelde van klas Desktop
  (254 - 7219, n=20, laatste 2 jaar)
3190 MB/s -55%
Minisforum Neptune Series HX90G
ESO512GYLCT
2344 (2130.71min - 2343.78max) MB/s -67%
Minisforum NUCX i7
 
2308 (2036.12min - 2307.5max) MB/s -68%
seq q8 t1 write
Intel NUC13 Raptor Canyon
Kingston Fury Renegade SFYRS1000G
6135 (6096.84min - 6134.8max) MB/s
Gemiddeld Kingston Fury Renegade SFYRS1000G
  ()
6135 MB/s 0%
Gemiddelde van klas Desktop
  (100.9 - 6920, n=20, laatste 2 jaar)
2620 MB/s -57%
Intel Beast Canyon NUC
Sabrent Rocket 4.0 500GB
2524 (535.17min - 2524.36max) MB/s -59%
Intel Dragon Canyon NUC - RTX 3060
Transcend M.2 SSD 2200S TS512GMTE220S
2524 (535.17min - 2524.36max) MB/s -59%
Minisforum Neptune Series HX90G
ESO512GYLCT
1849 (1833.02min - 1849.14max) MB/s -70%
Minisforum NUCX i7
 
1843 (1731.1min - 1843.4max) MB/s -70%
4k q1 t1 read
Intel NUC13 Raptor Canyon
Kingston Fury Renegade SFYRS1000G
86.5 (82.21min - 86.46max) MB/s
Gemiddeld Kingston Fury Renegade SFYRS1000G
  ()
86.5 MB/s 0%
Gemiddelde van klas Desktop
  (13.7 - 91.9, n=20, laatste 2 jaar)
51.9 MB/s -40%
Intel Beast Canyon NUC
Sabrent Rocket 4.0 500GB
45.7 (45.38min - 45.71max) MB/s -47%
Intel Dragon Canyon NUC - RTX 3060
Transcend M.2 SSD 2200S TS512GMTE220S
45.7 (45.38min - 45.71max) MB/s -47%
Minisforum NUCX i7
 
38.9 (38.65min - 38.87max) MB/s -55%
Minisforum Neptune Series HX90G
ESO512GYLCT
37.9 (37.34min - 37.87max) MB/s -56%
4k q1 t1 write
Intel Beast Canyon NUC
Sabrent Rocket 4.0 500GB
320 (298.75min - 319.53max) MB/s +67%
Intel Dragon Canyon NUC - RTX 3060
Transcend M.2 SSD 2200S TS512GMTE220S
320 (298.75min - 319.53max) MB/s +67%
Intel NUC13 Raptor Canyon
Kingston Fury Renegade SFYRS1000G
192 (183.56min - 191.99max) MB/s
Gemiddeld Kingston Fury Renegade SFYRS1000G
  ()
192 MB/s 0%
Minisforum NUCX i7
 
187.4 (170.03min - 187.4max) MB/s -2%
Gemiddelde van klas Desktop
  (13.8 - 364, n=20, laatste 2 jaar)
181 MB/s -6%
Minisforum Neptune Series HX90G
ESO512GYLCT
161.3 (150.7min - 161.34max) MB/s -16%
4k q32 t16 read
Gemiddelde van klas Desktop
  (26 - 4319, n=20, laatste 2 jaar)
1201 MB/s +2%
Intel NUC13 Raptor Canyon
Kingston Fury Renegade SFYRS1000G
1176 (1157.2min - 1176.4max) MB/s
Gemiddeld Kingston Fury Renegade SFYRS1000G
  ()
1176 MB/s 0%
Intel Beast Canyon NUC
Sabrent Rocket 4.0 500GB
970 (966.45min - 970.29max) MB/s -18%
Intel Dragon Canyon NUC - RTX 3060
Transcend M.2 SSD 2200S TS512GMTE220S
970 (966.45min - 970.29max) MB/s -18%
Minisforum Neptune Series HX90G
ESO512GYLCT
822 (773.05min - 821.5max) MB/s -30%
Minisforum NUCX i7
 
786 (734.36min - 786.34max) MB/s -33%
4k q32 t16 write
Minisforum Neptune Series HX90G
ESO512GYLCT
1492 (333.99min - 1492.35max) MB/s +177%
Gemiddelde van klas Desktop
  (13.1 - 5015, n=20, laatste 2 jaar)
1241 MB/s +131%
Intel Beast Canyon NUC
Sabrent Rocket 4.0 500GB
1119 (483.18min - 1119.3max) MB/s +108%
Intel Dragon Canyon NUC - RTX 3060
Transcend M.2 SSD 2200S TS512GMTE220S
1119 (483.18min - 1119.3max) MB/s +108%
Minisforum NUCX i7
 
1032 (266.97min - 1032.05max) MB/s +92%
Intel NUC13 Raptor Canyon
Kingston Fury Renegade SFYRS1000G
538 (527.91min - 538.21max) MB/s
Gemiddeld Kingston Fury Renegade SFYRS1000G
  ()
538 MB/s 0%
AS SSD
Score Total
Intel NUC13 Raptor Canyon
Kingston Fury Renegade SFYRS1000G
8263 Points
Gemiddeld Kingston Fury Renegade SFYRS1000G
  ()
8263 Points 0%
Intel Beast Canyon NUC
Sabrent Rocket 4.0 500GB
6467 Points -22%
Gemiddelde van klas Desktop
  (136 - 8347, n=16, laatste 2 jaar)
3122 Points -62%
Minisforum Neptune Series HX90G
ESO512GYLCT
2988 Points -64%
Minisforum NUCX i7
 
1054.23 Points -87%
Score Read
Intel Beast Canyon NUC
Sabrent Rocket 4.0 500GB
2462 Points +37%
Intel NUC13 Raptor Canyon
Kingston Fury Renegade SFYRS1000G
1792 Points
Gemiddeld Kingston Fury Renegade SFYRS1000G
  ()
1792 Points 0%
Gemiddelde van klas Desktop
  (65 - 3253, n=16, laatste 2 jaar)
1112 Points -38%
Minisforum Neptune Series HX90G
ESO512GYLCT
1001 Points -44%
Minisforum NUCX i7
 
895 Points -50%
Score Write
Intel NUC13 Raptor Canyon
Kingston Fury Renegade SFYRS1000G
5665 Points
Gemiddeld Kingston Fury Renegade SFYRS1000G
  ()
5665 Points 0%
Intel Beast Canyon NUC
Sabrent Rocket 4.0 500GB
2827 Points -50%
Gemiddelde van klas Desktop
  (39 - 5665, n=16, laatste 2 jaar)
1582 Points -72%
Minisforum NUCX i7
 
1556 Points -73%
Minisforum Neptune Series HX90G
ESO512GYLCT
1482 Points -74%
Seq Read
Intel NUC13 Raptor Canyon
Kingston Fury Renegade SFYRS1000G
5664 MB/s
Gemiddeld Kingston Fury Renegade SFYRS1000G
  ()
5664 MB/s 0%
Intel Beast Canyon NUC
Sabrent Rocket 4.0 500GB
4274 MB/s -25%
Gemiddelde van klas Desktop
  (265 - 6331, n=16, laatste 2 jaar)
2332 MB/s -59%
Minisforum Neptune Series HX90G
ESO512GYLCT
2215 MB/s -61%
Minisforum NUCX i7
 
1613 MB/s -72%
Seq Write
Intel NUC13 Raptor Canyon
Kingston Fury Renegade SFYRS1000G
3081 MB/s
Gemiddeld Kingston Fury Renegade SFYRS1000G
  ()
3081 MB/s 0%
Intel Beast Canyon NUC
Sabrent Rocket 4.0 500GB
2382 MB/s -23%
Minisforum Neptune Series HX90G
ESO512GYLCT
1780 MB/s -42%
Gemiddelde van klas Desktop
  (117 - 5326, n=16, laatste 2 jaar)
1630 MB/s -47%
Minisforum NUCX i7
 
1468 MB/s -52%
4K Read
Intel Beast Canyon NUC
Sabrent Rocket 4.0 500GB
83.9 MB/s +8%
Intel NUC13 Raptor Canyon
Kingston Fury Renegade SFYRS1000G
77.71 MB/s
Gemiddeld Kingston Fury Renegade SFYRS1000G
  ()
77.7 MB/s 0%
Minisforum NUCX i7
 
54.25 MB/s -30%
Minisforum Neptune Series HX90G
ESO512GYLCT
53.18 MB/s -32%
Gemiddelde van klas Desktop
  (13.2 - 83.7, n=16, laatste 2 jaar)
48.2 MB/s -38%
4K Write
Intel Beast Canyon NUC
Sabrent Rocket 4.0 500GB
308.4 MB/s +13%
Intel NUC13 Raptor Canyon
Kingston Fury Renegade SFYRS1000G
272.11 MB/s
Gemiddeld Kingston Fury Renegade SFYRS1000G
  ()
272 MB/s 0%
Minisforum Neptune Series HX90G
ESO512GYLCT
157.2 MB/s -42%
Gemiddelde van klas Desktop
  (13.5 - 272, n=16, laatste 2 jaar)
141.9 MB/s -48%
Minisforum NUCX i7
 
129.81 MB/s -52%
4K-64 Read
Intel Beast Canyon NUC
Sabrent Rocket 4.0 500GB
1950 MB/s +70%
Intel NUC13 Raptor Canyon
Kingston Fury Renegade SFYRS1000G
1148.16 MB/s
Gemiddeld Kingston Fury Renegade SFYRS1000G
  ()
1148 MB/s 0%
Gemiddelde van klas Desktop
  (25.7 - 2536, n=16, laatste 2 jaar)
830 MB/s -28%
Minisforum Neptune Series HX90G
ESO512GYLCT
725.98 MB/s -37%
Minisforum NUCX i7
 
679.23 MB/s -41%
4K-64 Write
Intel NUC13 Raptor Canyon
Kingston Fury Renegade SFYRS1000G
5085.1 MB/s
Gemiddeld Kingston Fury Renegade SFYRS1000G
  ()
5085 MB/s 0%
Intel Beast Canyon NUC
Sabrent Rocket 4.0 500GB
2281 MB/s -55%
Minisforum NUCX i7
 
1279.71 MB/s -75%
Gemiddelde van klas Desktop
  (13.7 - 5085, n=16, laatste 2 jaar)
1277 MB/s -75%
Minisforum Neptune Series HX90G
ESO512GYLCT
1146.83 MB/s -77%
Access Time Read
Gemiddelde van klas Desktop
  (0.031 - 0.311, n=16, laatste 2 jaar)
0.123 ms * -18%
Minisforum Neptune Series HX90G
ESO512GYLCT
0.117 ms * -13%
Intel NUC13 Raptor Canyon
Kingston Fury Renegade SFYRS1000G
0.104 ms *
Gemiddeld Kingston Fury Renegade SFYRS1000G
  ()
0.104 ms * -0%
Minisforum NUCX i7
 
0.092 ms * +12%
Intel Beast Canyon NUC
Sabrent Rocket 4.0 500GB
0.071 ms * +32%
Access Time Write
Gemiddelde van klas Desktop
  (0.013 - 0.942, n=16, laatste 2 jaar)
0.1468 ms * -1029%
Minisforum NUCX i7
 
0.079 ms * -508%
Minisforum Neptune Series HX90G
ESO512GYLCT
0.024 ms * -85%
Intel NUC13 Raptor Canyon
Kingston Fury Renegade SFYRS1000G
0.013 ms *
Gemiddeld Kingston Fury Renegade SFYRS1000G
  ()
0.013 ms * -0%
Intel Beast Canyon NUC
Sabrent Rocket 4.0 500GB
0.012 ms * +8%

* ... kleiner is beter

Disk Throttling: DiskSpd Read Loop, Queue Depth 8
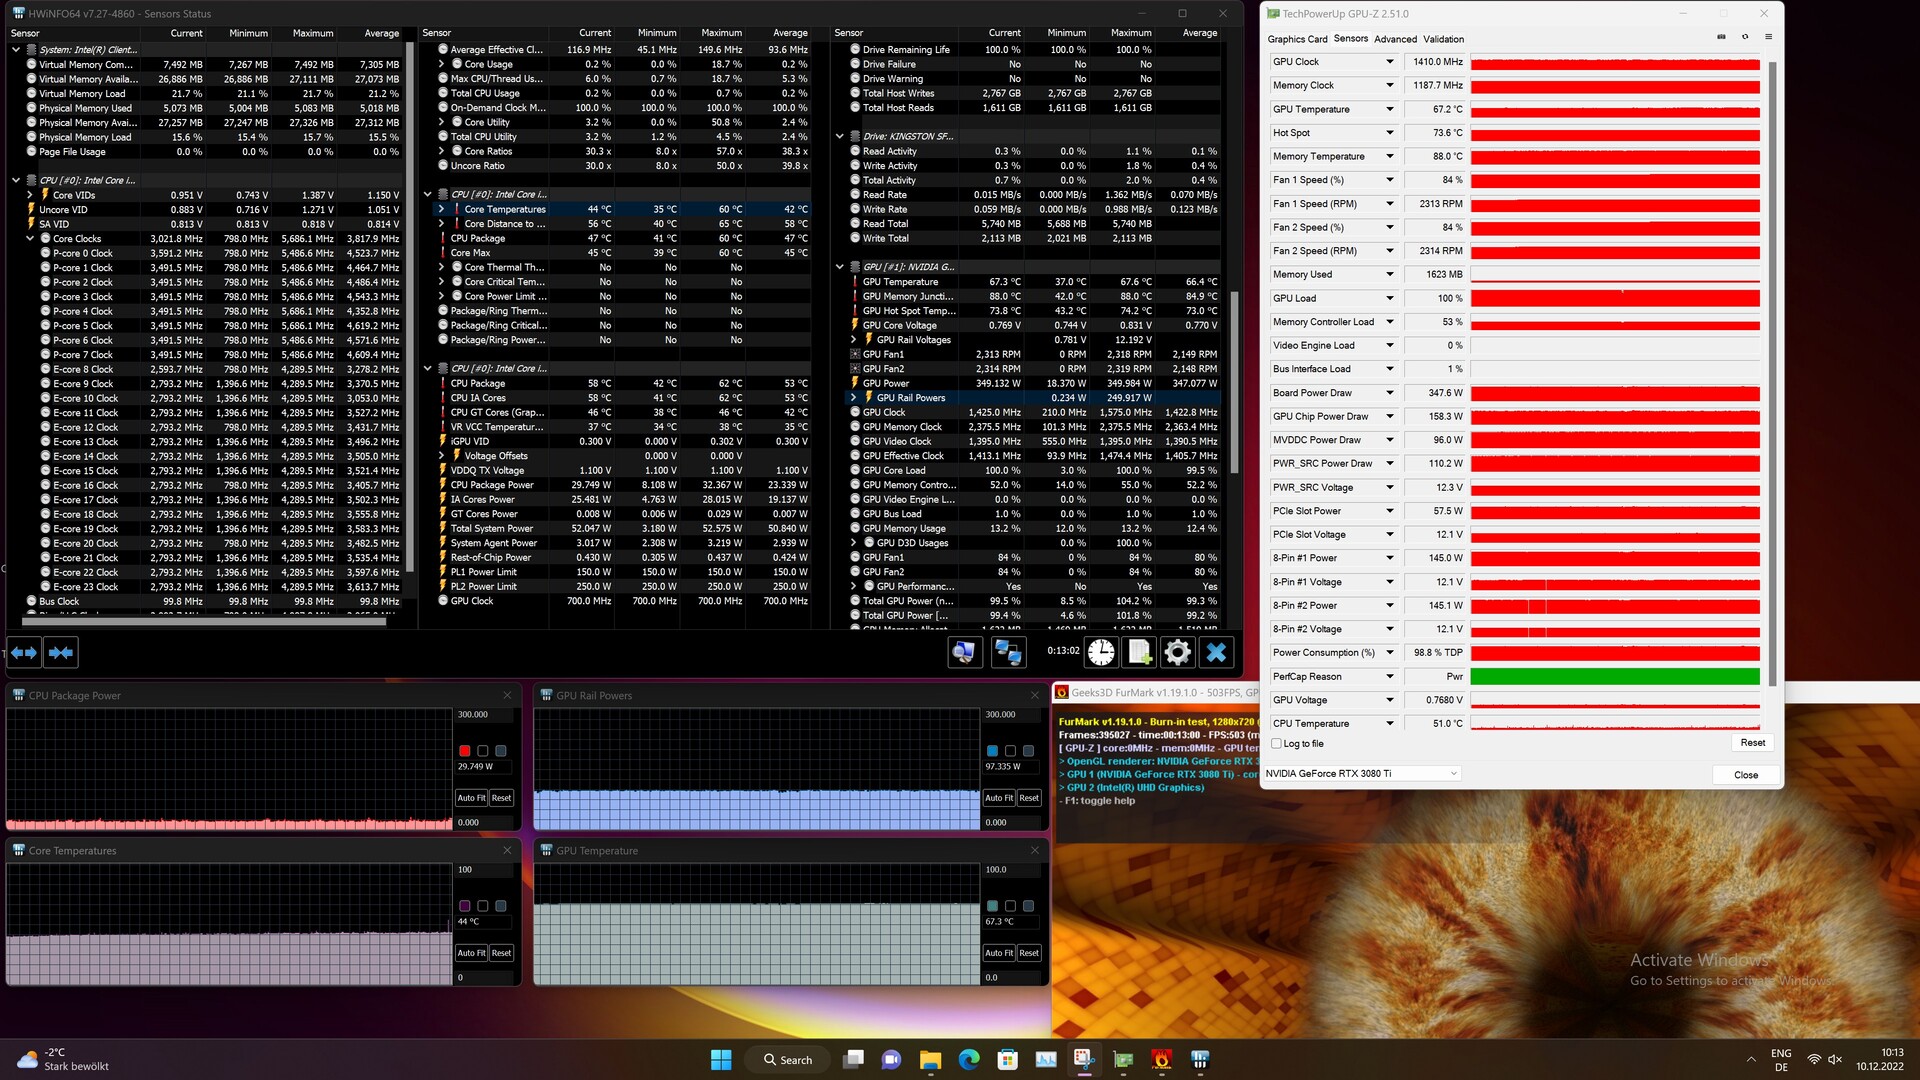
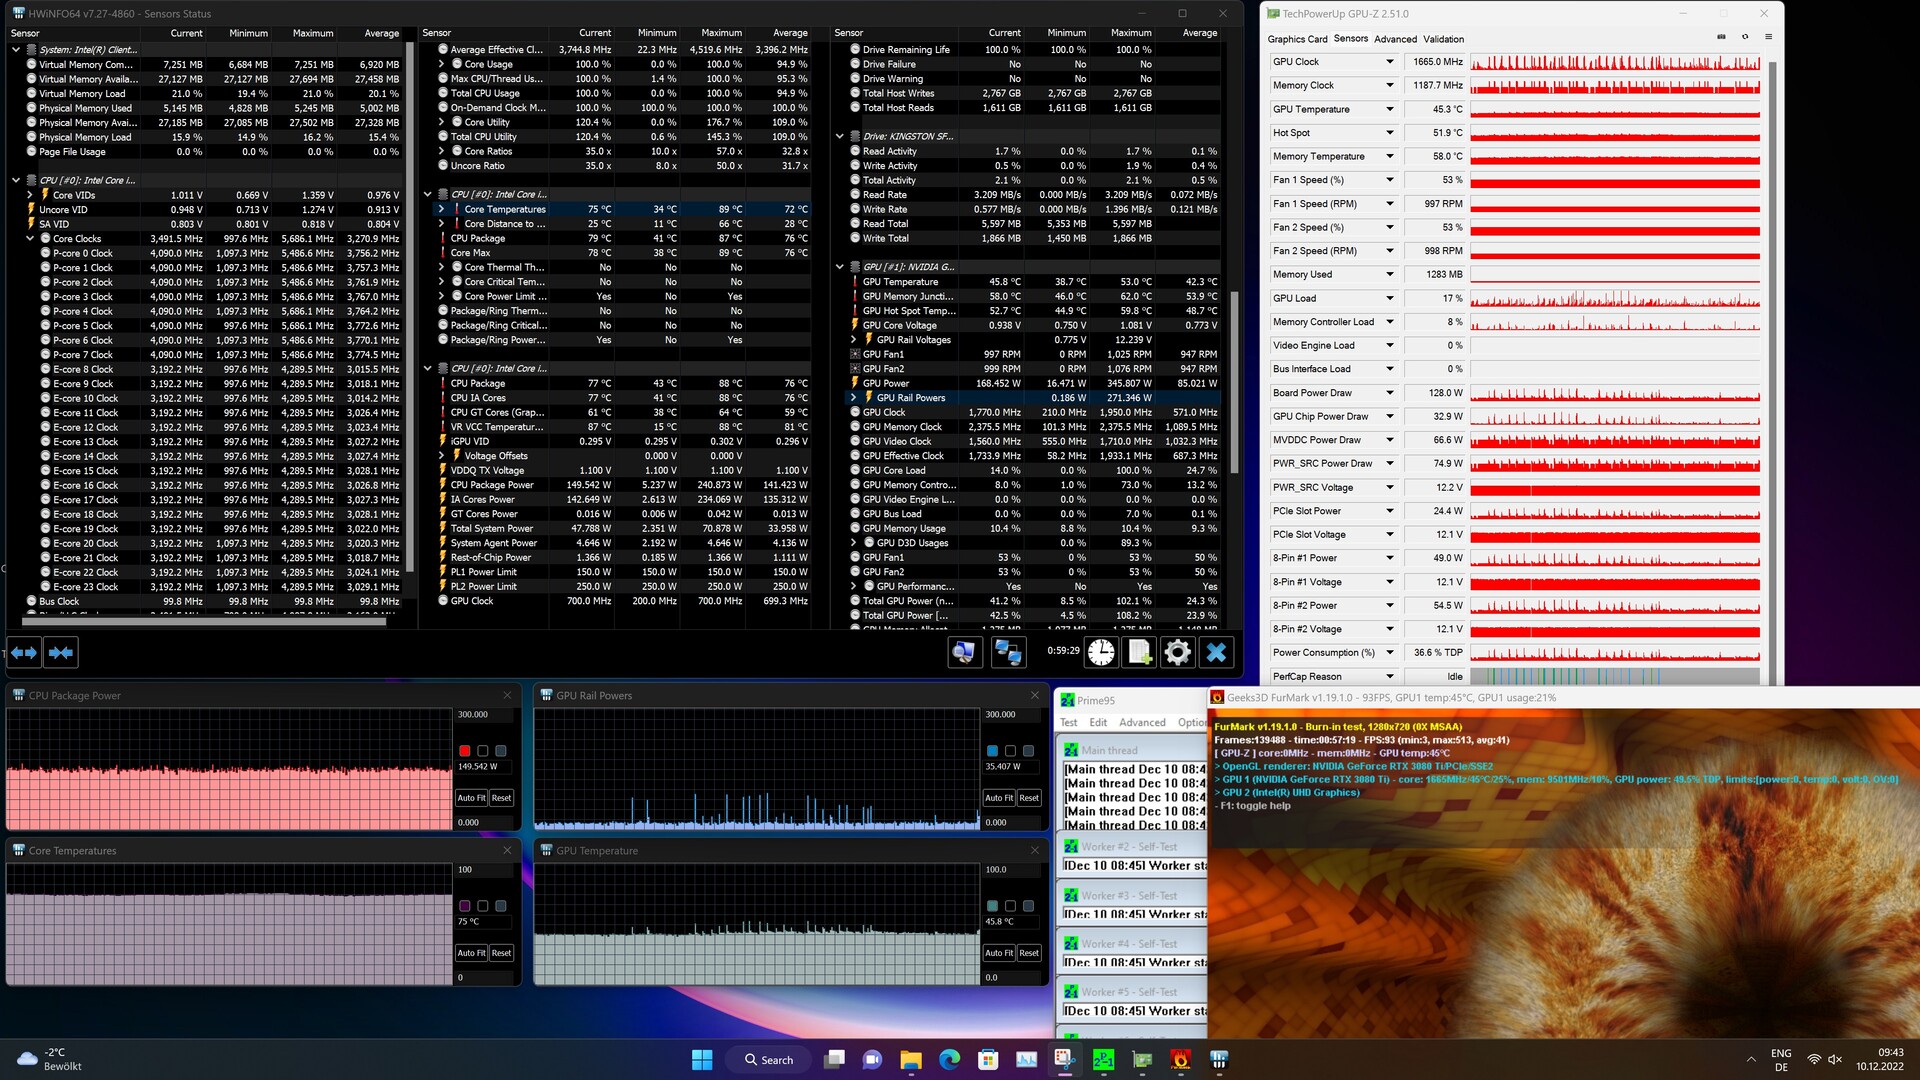
035571010651420177521302485284031953550390542604615497053255680603563906745Tooltip
Intel NUC13 Raptor Canyon Kingston Fury Renegade SFYRS1000G: Ø6568 (2645.61-7096.48)
Intel Beast Canyon NUC Sabrent Rocket 4.0 500GB: Ø3896 (225.06-5002.7)
Zotac ZBOX Magnus EN173070C Transcend M.2 SSD 2200S TS512GMTE220S: Ø2440 (1786.98-2501.9)
Intel Dragon Canyon NUC - RTX 3060 Transcend M.2 SSD 2200S TS512GMTE220S: Ø3896 (225.06-5002.7)
Minisforum NUCX i7  : Ø2309 (2137.76-2318.4)
Minisforum Neptune Series HX90G ESO512GYLCT: Ø1859 (996.67-1961.26)

GPU-prestaties

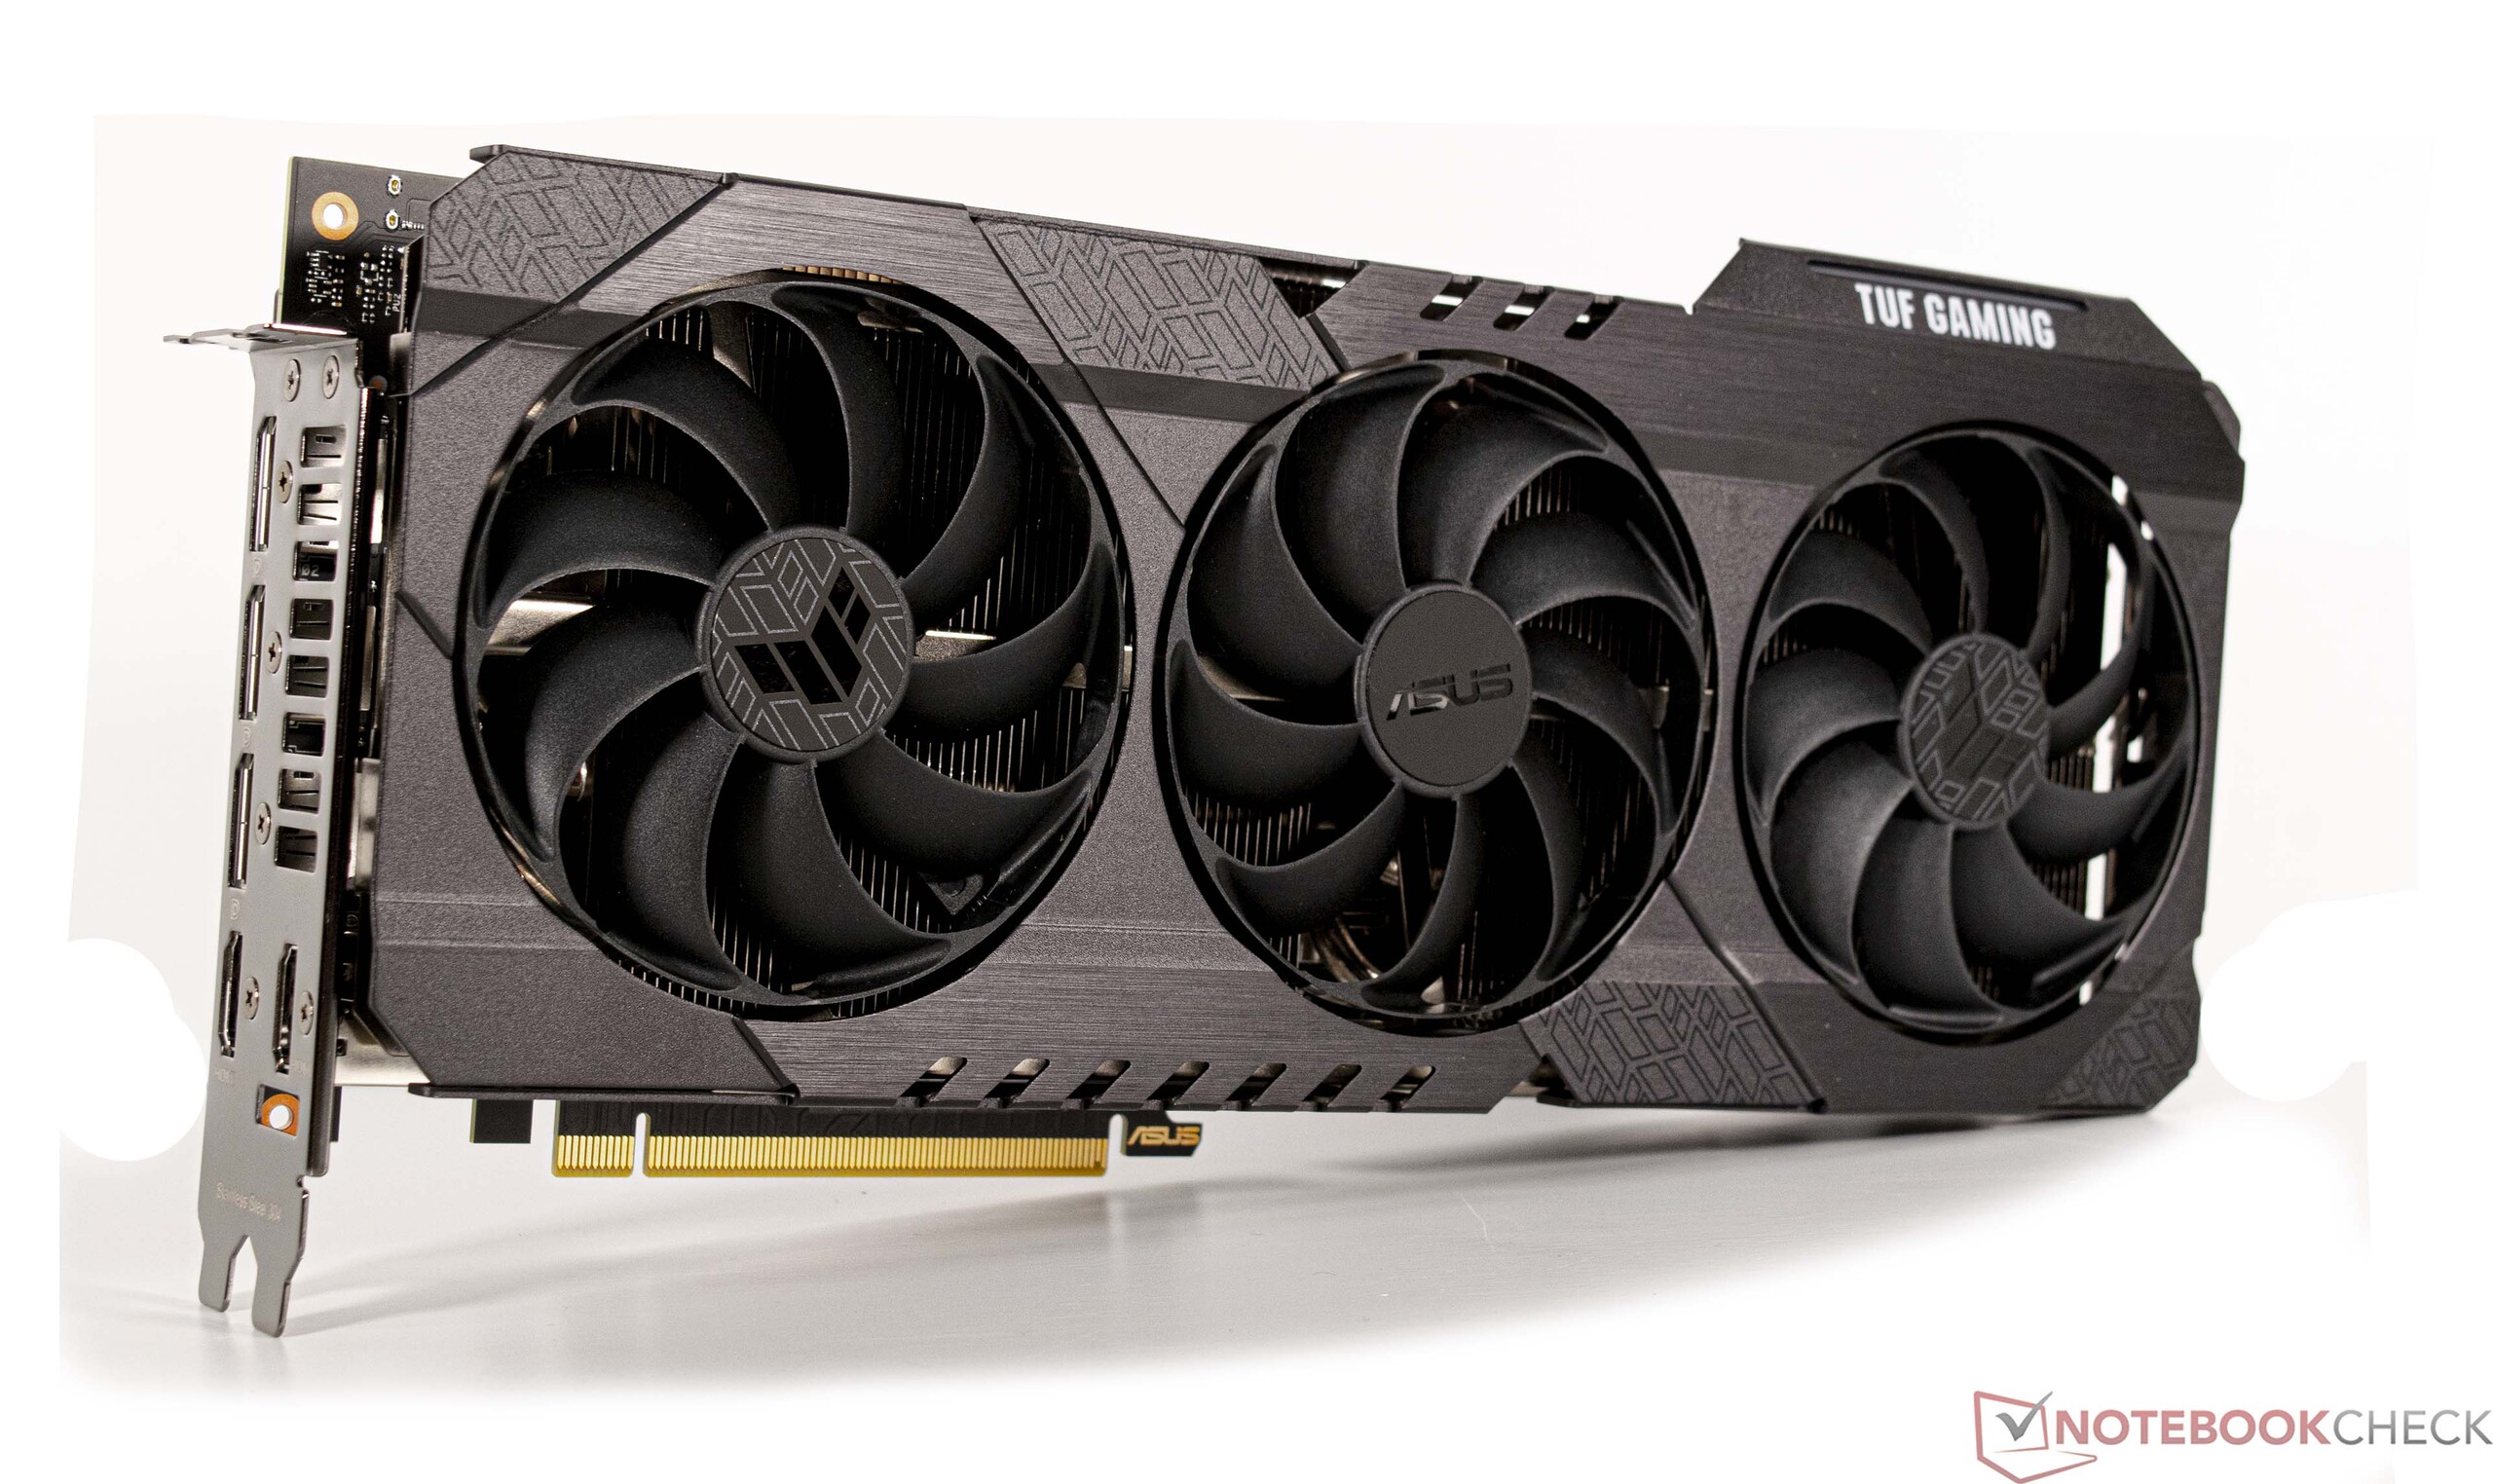
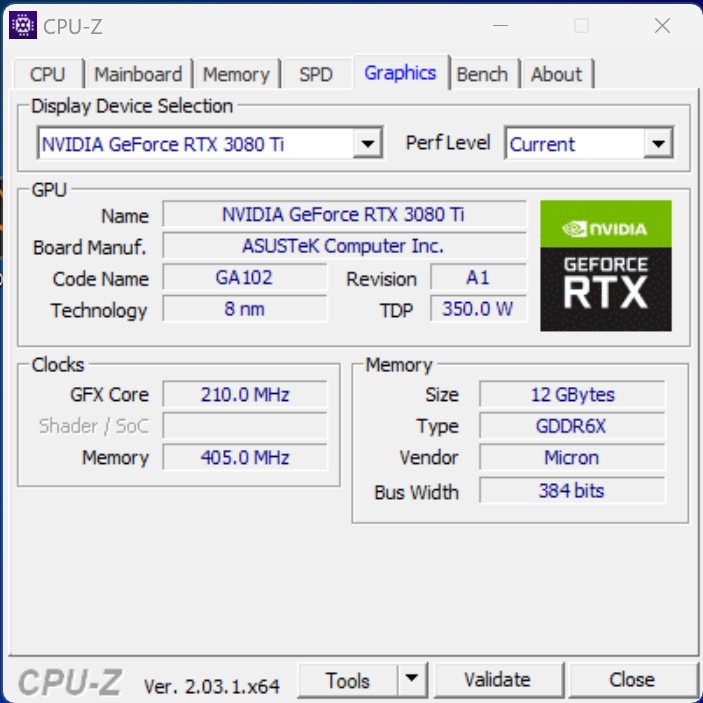
Intel rust ons testexemplaar uit met een Nvidia GeForce RTX 3080 Ti. De GPU biedt geweldige prestaties en evenaart bijna de Nvidia GeForce RTX 3090. Hoewel het met 12 GB VRAM met de helft van het VRAM van de RTX 3090 komt, is dit in de meeste gevallen nog steeds voldoende. Met 350 watt loopt het geïnstalleerde model op de grens van wat we redelijk zouden vinden en we raden niet aan om nog grotere GPU's in het compacte systeem te gebruiken. Dit geldt alleen voor de stroomafname, aangezien het systeem fysiek zelfs de Nvidia GeForce RTX 4090. Gebruikers die aandringen op een kaart uit de GeForce-RTX-4000-serie zijn wellicht beter af met een Nvidia GeForce RTX 4080. Met een TGP van maximaal 320 watt is hij zuiniger en aanzienlijk sneller dan onze GeForce RTX 3080 Ti van Asus.

Meer vergelijkingen en benchmarks zijn te vinden op onze GPU pagina.

3DMark Performance Rating - Percent
ASUS TUF Gaming GeForce RTX 3080 Ti OC
NVIDIA GeForce RTX 3080 Ti, AMD Ryzen 9 7950X
100 pt
Corsair One i300
NVIDIA GeForce RTX 3080 Ti, Intel Core i9-12900K
98 pt
Intel Core i9-13900K
NVIDIA GeForce RTX 3090, Intel Core i9-13900K
97.6 pt
Intel NUC13 Raptor Canyon
NVIDIA GeForce RTX 3080 Ti, Intel Core i9-13900K
97 pt
Minisforum NUCX i7
NVIDIA GeForce RTX 3070 Laptop GPU, Intel Core i7-11800H
50.6 pt
Minisforum Neptune Series HX90G
AMD Radeon RX 6600M, AMD Ryzen 9 5900HX
45.3 pt
Intel Dragon Canyon NUC - RTX 3060
NVIDIA GeForce RTX 3060, Intel Core i9-12900
44.6 pt
Intel Beast Canyon NUC
NVIDIA GeForce RTX 3060, Intel Core i9-11900KB
44.1 pt
3DMark 11 - 1280x720 Performance GPU
ASUS TUF Gaming GeForce RTX 3080 Ti OC
NVIDIA GeForce RTX 3080 Ti, AMD Ryzen 9 7950X
62189 Points +4%
Corsair One i300
NVIDIA GeForce RTX 3080 Ti, Intel Core i9-12900K
60716 Points +2%
Intel Core i9-13900K
NVIDIA GeForce RTX 3090, Intel Core i9-13900K
59972 Points 0%
Intel NUC13 Raptor Canyon
NVIDIA GeForce RTX 3080 Ti, Intel Core i9-13900K
59799 Points
Minisforum NUCX i7
NVIDIA GeForce RTX 3070 Laptop GPU, Intel Core i7-11800H
34986 Points -41%
Minisforum Neptune Series HX90G
AMD Radeon RX 6600M, AMD Ryzen 9 5900HX
31877 Points -47%
Intel Dragon Canyon NUC - RTX 3060
NVIDIA GeForce RTX 3060, Intel Core i9-12900
29172 Points -51%
Intel Beast Canyon NUC
NVIDIA GeForce RTX 3060, Intel Core i9-11900KB
28939 Points -52%
3DMark
1920x1080 Fire Strike Graphics
ASUS TUF Gaming GeForce RTX 3080 Ti OC
NVIDIA GeForce RTX 3080 Ti, AMD Ryzen 9 7950X
48709 Points +5%
Corsair One i300
NVIDIA GeForce RTX 3080 Ti, Intel Core i9-12900K
47757 Points +3%
Intel Core i9-13900K
NVIDIA GeForce RTX 3090, Intel Core i9-13900K
47241 Points +2%
Intel NUC13 Raptor Canyon
NVIDIA GeForce RTX 3080 Ti, Intel Core i9-13900K
46469 Points
Minisforum NUCX i7
NVIDIA GeForce RTX 3070 Laptop GPU, Intel Core i7-11800H
24451 Points -47%
Minisforum Neptune Series HX90G
AMD Radeon RX 6600M, AMD Ryzen 9 5900HX
22884 Points -51%
Intel Dragon Canyon NUC - RTX 3060
NVIDIA GeForce RTX 3060, Intel Core i9-12900
21984 Points -53%
Intel Beast Canyon NUC
NVIDIA GeForce RTX 3060, Intel Core i9-11900KB
21379 Points -54%
2560x1440 Time Spy Graphics
ASUS TUF Gaming GeForce RTX 3080 Ti OC
NVIDIA GeForce RTX 3080 Ti, AMD Ryzen 9 7950X
19460 Points 0%
Intel NUC13 Raptor Canyon
NVIDIA GeForce RTX 3080 Ti, Intel Core i9-13900K
19367 Points
Intel Core i9-13900K
NVIDIA GeForce RTX 3090, Intel Core i9-13900K
19198 Points -1%
Corsair One i300
NVIDIA GeForce RTX 3080 Ti, Intel Core i9-12900K
19041 Points -2%
Minisforum NUCX i7
NVIDIA GeForce RTX 3070 Laptop GPU, Intel Core i7-11800H
9205 Points -52%
Intel Dragon Canyon NUC - RTX 3060
NVIDIA GeForce RTX 3060, Intel Core i9-12900
8578 Points -56%
Intel Beast Canyon NUC
NVIDIA GeForce RTX 3060, Intel Core i9-11900KB
8525 Points -56%
Minisforum Neptune Series HX90G
AMD Radeon RX 6600M, AMD Ryzen 9 5900HX
7685 Points -60%
Fire Strike Extreme Graphics
ASUS TUF Gaming GeForce RTX 3080 Ti OC
NVIDIA GeForce RTX 3080 Ti, AMD Ryzen 9 7950X
24250 Points +3%
Intel Core i9-13900K
NVIDIA GeForce RTX 3090, Intel Core i9-13900K
23839 Points +2%
Corsair One i300
NVIDIA GeForce RTX 3080 Ti, Intel Core i9-12900K
23835 Points +2%
Intel NUC13 Raptor Canyon
NVIDIA GeForce RTX 3080 Ti, Intel Core i9-13900K
23460 Points
Minisforum NUCX i7
NVIDIA GeForce RTX 3070 Laptop GPU, Intel Core i7-11800H
11757 Points -50%
Minisforum Neptune Series HX90G
AMD Radeon RX 6600M, AMD Ryzen 9 5900HX
10545 Points -55%
Intel Dragon Canyon NUC - RTX 3060
NVIDIA GeForce RTX 3060, Intel Core i9-12900
10244 Points -56%
Intel Beast Canyon NUC
NVIDIA GeForce RTX 3060, Intel Core i9-11900KB
10181 Points -57%
Performance Rating - Percent
ASUS TUF Gaming GeForce RTX 3080 Ti OC
NVIDIA GeForce RTX 3080 Ti, R9 7950X, Corsair MP600
99.4 pt
Intel Core i9-13900K
NVIDIA GeForce RTX 3090, i9-13900K, Corsair MP600
99.2 pt
Intel NUC13 Raptor Canyon
NVIDIA GeForce RTX 3080 Ti, i9-13900K, Kingston Fury Renegade SFYRS1000G
98.3 pt
Corsair One i300
NVIDIA GeForce RTX 3080 Ti, i9-12900K, Samsung PM9A1 MZVL22T0HBLB
96.7 pt
Minisforum NUCX i7
GeForce RTX 3070 Laptop GPU, i7-11800H
48.6 pt
Intel Dragon Canyon NUC - RTX 3060
NVIDIA GeForce RTX 3060, i9-12900, Transcend M.2 SSD 2200S TS512GMTE220S
42.8 pt
Intel Beast Canyon NUC
NVIDIA GeForce RTX 3060, i9-11900KB, Sabrent Rocket 4.0 500GB
42.2 pt
Minisforum Neptune Series HX90G
Radeon RX 6600M, R9 5900HX, ESO512GYLCT
38.7 pt
Unigine Heaven 4.0
Extreme Preset OpenGL
ASUS TUF Gaming GeForce RTX 3080 Ti OC
NVIDIA GeForce RTX 3080 Ti, R9 7950X, Corsair MP600
282.1 fps +1%
Intel NUC13 Raptor Canyon
NVIDIA GeForce RTX 3080 Ti, i9-13900K, Kingston Fury Renegade SFYRS1000G
279.3 fps
Intel Core i9-13900K
NVIDIA GeForce RTX 3090, i9-13900K, Corsair MP600
277.9 fps -1%
Corsair One i300
NVIDIA GeForce RTX 3080 Ti, i9-12900K, Samsung PM9A1 MZVL22T0HBLB
271.9 fps -3%
Minisforum NUCX i7
GeForce RTX 3070 Laptop GPU, i7-11800H
139.4 fps -50%
Minisforum Neptune Series HX90G
Radeon RX 6600M, R9 5900HX, ESO512GYLCT
135.1 fps -52%
Intel Dragon Canyon NUC - RTX 3060
NVIDIA GeForce RTX 3060, i9-12900, Transcend M.2 SSD 2200S TS512GMTE220S
124.9 fps -55%
Intel Beast Canyon NUC
NVIDIA GeForce RTX 3060, i9-11900KB, Sabrent Rocket 4.0 500GB
121 fps -57%
Extreme Preset DX11
ASUS TUF Gaming GeForce RTX 3080 Ti OC
NVIDIA GeForce RTX 3080 Ti, R9 7950X, Corsair MP600
311.6 fps +3%
Intel Core i9-13900K
NVIDIA GeForce RTX 3090, i9-13900K, Corsair MP600
309.2 fps +2%
Intel NUC13 Raptor Canyon
NVIDIA GeForce RTX 3080 Ti, i9-13900K, Kingston Fury Renegade SFYRS1000G
302.6 fps
Corsair One i300
NVIDIA GeForce RTX 3080 Ti, i9-12900K, Samsung PM9A1 MZVL22T0HBLB
296.6 fps -2%
Minisforum NUCX i7
GeForce RTX 3070 Laptop GPU, i7-11800H
152.9 fps -49%
Intel Dragon Canyon NUC - RTX 3060
NVIDIA GeForce RTX 3060, i9-12900, Transcend M.2 SSD 2200S TS512GMTE220S
134.8 fps -55%
Intel Beast Canyon NUC
NVIDIA GeForce RTX 3060, i9-11900KB, Sabrent Rocket 4.0 500GB
130.8 fps -57%
Minisforum Neptune Series HX90G
Radeon RX 6600M, R9 5900HX, ESO512GYLCT
127.7 fps -58%
Unigine Valley 1.0
1920x1080 Extreme HD DirectX AA:x8
Intel Core i9-13900K
NVIDIA GeForce RTX 3090, i9-13900K, Corsair MP600
245 fps +2%
Intel NUC13 Raptor Canyon
NVIDIA GeForce RTX 3080 Ti, i9-13900K, Kingston Fury Renegade SFYRS1000G
240.4 fps
ASUS TUF Gaming GeForce RTX 3080 Ti OC
NVIDIA GeForce RTX 3080 Ti, R9 7950X, Corsair MP600
237.3 fps -1%
Corsair One i300
NVIDIA GeForce RTX 3080 Ti, i9-12900K, Samsung PM9A1 MZVL22T0HBLB
229.3 fps -5%
Minisforum NUCX i7
GeForce RTX 3070 Laptop GPU, i7-11800H
120.9 fps -50%
Intel Dragon Canyon NUC - RTX 3060
NVIDIA GeForce RTX 3060, i9-12900, Transcend M.2 SSD 2200S TS512GMTE220S
108.3 fps -55%
Intel Beast Canyon NUC
NVIDIA GeForce RTX 3060, i9-11900KB, Sabrent Rocket 4.0 500GB
106.7 fps -56%
Minisforum Neptune Series HX90G
Radeon RX 6600M, R9 5900HX, ESO512GYLCT
93.3 fps -61%
1920x1080 Extreme HD Preset OpenGL AA:x8
Intel Core i9-13900K
NVIDIA GeForce RTX 3090, i9-13900K, Corsair MP600
210.8 fps 0%
Intel NUC13 Raptor Canyon
NVIDIA GeForce RTX 3080 Ti, i9-13900K, Kingston Fury Renegade SFYRS1000G
209.8 fps
ASUS TUF Gaming GeForce RTX 3080 Ti OC
NVIDIA GeForce RTX 3080 Ti, R9 7950X, Corsair MP600
208.8 fps 0%
Corsair One i300
NVIDIA GeForce RTX 3080 Ti, i9-12900K, Samsung PM9A1 MZVL22T0HBLB
202.9 fps -3%
Minisforum NUCX i7
GeForce RTX 3070 Laptop GPU, i7-11800H
104.8 fps -50%
Intel Dragon Canyon NUC - RTX 3060
NVIDIA GeForce RTX 3060, i9-12900, Transcend M.2 SSD 2200S TS512GMTE220S
96.1 fps -54%
Intel Beast Canyon NUC
NVIDIA GeForce RTX 3060, i9-11900KB, Sabrent Rocket 4.0 500GB
93.9 fps -55%
Minisforum Neptune Series HX90G
Radeon RX 6600M, R9 5900HX, ESO512GYLCT
91.6 fps -56%
Unigine Superposition
1920x1080 1080p High
ASUS TUF Gaming GeForce RTX 3080 Ti OC
NVIDIA GeForce RTX 3080 Ti, R9 7950X, Corsair MP600
26711 Points +2%
Intel Core i9-13900K
NVIDIA GeForce RTX 3090, i9-13900K, Corsair MP600
26393 Points +1%
Corsair One i300
NVIDIA GeForce RTX 3080 Ti, i9-12900K, Samsung PM9A1 MZVL22T0HBLB
26193 Points 0%
Intel NUC13 Raptor Canyon
NVIDIA GeForce RTX 3080 Ti, i9-13900K, Kingston Fury Renegade SFYRS1000G
26131 Points
Minisforum NUCX i7
GeForce RTX 3070 Laptop GPU, i7-11800H
12667 Points -52%
Intel Beast Canyon NUC
NVIDIA GeForce RTX 3060, i9-11900KB, Sabrent Rocket 4.0 500GB
11177 Points -57%
Intel Dragon Canyon NUC - RTX 3060
NVIDIA GeForce RTX 3060, i9-12900, Transcend M.2 SSD 2200S TS512GMTE220S
11130 Points -57%
Minisforum Neptune Series HX90G
Radeon RX 6600M, R9 5900HX, ESO512GYLCT
10187 Points -61%
1920x1080 1080p Extreme
ASUS TUF Gaming GeForce RTX 3080 Ti OC
NVIDIA GeForce RTX 3080 Ti, R9 7950X, Corsair MP600
12347 Points +2%
Corsair One i300
NVIDIA GeForce RTX 3080 Ti, i9-12900K, Samsung PM9A1 MZVL22T0HBLB
12100 Points 0%
Intel NUC13 Raptor Canyon
NVIDIA GeForce RTX 3080 Ti, i9-13900K, Kingston Fury Renegade SFYRS1000G
12071 Points
Intel Core i9-13900K
NVIDIA GeForce RTX 3090, i9-13900K, Corsair MP600
12069 Points 0%
Minisforum NUCX i7
GeForce RTX 3070 Laptop GPU, i7-11800H
5847 Points -52%
Intel Dragon Canyon NUC - RTX 3060
NVIDIA GeForce RTX 3060, i9-12900, Transcend M.2 SSD 2200S TS512GMTE220S
5008 Points -59%
Intel Beast Canyon NUC
NVIDIA GeForce RTX 3060, i9-11900KB, Sabrent Rocket 4.0 500GB
5006 Points -59%
Minisforum Neptune Series HX90G
Radeon RX 6600M, R9 5900HX, ESO512GYLCT
4274 Points -65%
3840x2160 4k Optimized
ASUS TUF Gaming GeForce RTX 3080 Ti OC
NVIDIA GeForce RTX 3080 Ti, R9 7950X, Corsair MP600
16412 Points +2%
Intel Core i9-13900K
NVIDIA GeForce RTX 3090, i9-13900K, Corsair MP600
16322 Points +1%
Corsair One i300
NVIDIA GeForce RTX 3080 Ti, i9-12900K, Samsung PM9A1 MZVL22T0HBLB
16124 Points 0%
Intel NUC13 Raptor Canyon
NVIDIA GeForce RTX 3080 Ti, i9-13900K, Kingston Fury Renegade SFYRS1000G
16108 Points
Minisforum NUCX i7
GeForce RTX 3070 Laptop GPU, i7-11800H
7574 Points -53%
Intel Beast Canyon NUC
NVIDIA GeForce RTX 3060, i9-11900KB, Sabrent Rocket 4.0 500GB
6733 Points -58%
Intel Dragon Canyon NUC - RTX 3060
NVIDIA GeForce RTX 3060, i9-12900, Transcend M.2 SSD 2200S TS512GMTE220S
6694 Points -58%
Minisforum Neptune Series HX90G
Radeon RX 6600M, R9 5900HX, ESO512GYLCT
5478 Points -66%
ComputeMark v2.1 - 1024x600 Normal, Score
Intel Core i9-13900K
NVIDIA GeForce RTX 3090, i9-13900K, Corsair MP600
49118 Points +1%
ASUS TUF Gaming GeForce RTX 3080 Ti OC
NVIDIA GeForce RTX 3080 Ti, R9 7950X, Corsair MP600
48892 Points 0%
Intel NUC13 Raptor Canyon
NVIDIA GeForce RTX 3080 Ti, i9-13900K, Kingston Fury Renegade SFYRS1000G
48749 Points
Corsair One i300
NVIDIA GeForce RTX 3080 Ti, i9-12900K, Samsung PM9A1 MZVL22T0HBLB
48047 Points -1%
Minisforum NUCX i7
GeForce RTX 3070 Laptop GPU, i7-11800H
24877 Points -49%
Intel Dragon Canyon NUC - RTX 3060
NVIDIA GeForce RTX 3060, i9-12900, Transcend M.2 SSD 2200S TS512GMTE220S
20805 Points -57%
Intel Beast Canyon NUC
NVIDIA GeForce RTX 3060, i9-11900KB, Sabrent Rocket 4.0 500GB
20322 Points -58%
Minisforum Neptune Series HX90G
Radeon RX 6600M, R9 5900HX, ESO512GYLCT
16123 Points -67%
3DMark 05 Standard
82816 punten
3DMark 06 Standard Score
71555 punten
3DMark Vantage P Result
118753 punten
3DMark 11 Performance
46806 punten
3DMark Ice Storm Standard Score
288716 punten
3DMark Cloud Gate Standard Score
76027 punten
3DMark Fire Strike Score
37178 punten
3DMark Fire Strike Extreme Score
23232 punten
3DMark Time Spy Score
18822 punten
Help

Spelprestaties

Hoewel de Nvidia GeForce RTX 3080 Ti niet meer tot de nieuwste grafische kaarten behoort, is het model zeker geen slechte keuze. Een combinatie van de Intel Core i9-13900K en de GeForce RTX 3080 Ti is nog steeds erg zinvol, omdat het zelfs recente games soepel kan weergeven op maximale instellingen. Het prestatietekort ten opzichte van de snellere Nvidia GeForce RTX 3090 is marginaal. In een systeem gebaseerd op deAMD Ryzen 9 7950Xdie we ter vergelijking hebben gebouwd, kan dezelfde Nvidia GeForce RTX 3080 Ti geen grote prestatiesprong, omdat de prestaties van de processor minder belangrijk worden wanneer de GPU bijna volledig wordt belast.

Bij het kiezen van een grafische kaart raden wij gebruikers aan de compatibiliteit van hun favoriete model te controleren, aangezien de ondersteunde maximale lengte beperkt is. Grafische oplossingen mogen de maximale lengte van 31,3 cm (~12,32 in) niet overschrijden. Qua dikte laat de behuizing maximaal drie slots toe.

GTA V
1920x1080 Highest Settings possible AA:4xMSAA + FX AF:16x
Intel Core i9-13900K
NVIDIA GeForce RTX 3090, i9-13900K, Corsair MP600
165.6 (9.1min, 125P1 - 349max) fps +3%
ASUS TUF Gaming GeForce RTX 3080 Ti OC
NVIDIA GeForce RTX 3080 Ti, R9 7950X, Corsair MP600
163.6 (8.63min, 111.1P1 - 329max) fps +1%
Intel NUC13 Raptor Canyon
NVIDIA GeForce RTX 3080 Ti, i9-13900K, Kingston Fury Renegade SFYRS1000G
161.5 (2.84min, 125P1 - 280max) fps
Corsair One i300
NVIDIA GeForce RTX 3080 Ti, i9-12900K, Samsung PM9A1 MZVL22T0HBLB
149 (8.57min, 100P1 - 295max) fps -8%
Minisforum NUCX i7
GeForce RTX 3070 Laptop GPU, i7-11800H
106 (6.46min, 76.9P1 - 212max) fps -34%
Intel Beast Canyon NUC
NVIDIA GeForce RTX 3060, i9-11900KB, Sabrent Rocket 4.0 500GB
104 (4.33min, 71.4P1 - 206max) fps -36%
Intel Dragon Canyon NUC - RTX 3060
NVIDIA GeForce RTX 3060, i9-12900, Transcend M.2 SSD 2200S TS512GMTE220S
104 (4.33min, 71.4P1 - 206max) fps -36%
Minisforum Neptune Series HX90G
Radeon RX 6600M, R9 5900HX, ESO512GYLCT
86.6 (3.43min, 58.8P1 - 176max) fps -46%
3840x2160 High/On (Advanced Graphics Off) AA:FX AF:8x
ASUS TUF Gaming GeForce RTX 3080 Ti OC
NVIDIA GeForce RTX 3080 Ti, R9 7950X, Corsair MP600
182.6 (2.49min, 125P1 - 569max) fps 0%
Intel Core i9-13900K
NVIDIA GeForce RTX 3090, i9-13900K, Corsair MP600
182.5 (1.708min, 142.9P1 - 583max) fps 0%
Intel NUC13 Raptor Canyon
NVIDIA GeForce RTX 3080 Ti, i9-13900K, Kingston Fury Renegade SFYRS1000G
182 (1.762min, 125P1 - 491max) fps
Corsair One i300
NVIDIA GeForce RTX 3080 Ti, i9-12900K, Samsung PM9A1 MZVL22T0HBLB
180 (2.49min, 143P1 - 329max) fps -1%
Minisforum NUCX i7
GeForce RTX 3070 Laptop GPU, i7-11800H
85.6 fps -53%
Intel Beast Canyon NUC
NVIDIA GeForce RTX 3060, i9-11900KB, Sabrent Rocket 4.0 500GB
82.3 (7.1min, 58.8P1 - 158max) fps -55%
Intel Dragon Canyon NUC - RTX 3060
NVIDIA GeForce RTX 3060, i9-12900, Transcend M.2 SSD 2200S TS512GMTE220S
82.3 (7.1min, 58.8P1 - 158max) fps -55%
Minisforum Neptune Series HX90G
Radeon RX 6600M, R9 5900HX, ESO512GYLCT
57.9 (7.18min, 41.7P1 - 231max) fps -68%
The Witcher 3
1920x1080 Ultra Graphics & Postprocessing (HBAO+)
ASUS TUF Gaming GeForce RTX 3080 Ti OC
NVIDIA GeForce RTX 3080 Ti, R9 7950X, Corsair MP600
184.6 (67.2min, 103.2P0.1, 158P1 - 493max) fps +3%
Corsair One i300
NVIDIA GeForce RTX 3080 Ti, i9-12900K, Samsung PM9A1 MZVL22T0HBLB
183 (62.1min, 107P0.1, 149P1 - 431max) fps +2%
Intel Core i9-13900K
NVIDIA GeForce RTX 3090, i9-13900K, Corsair MP600
179.8 (98.3min, 120.2P0.1, 148.7P1 - 458max) fps 0%
Intel NUC13 Raptor Canyon
NVIDIA GeForce RTX 3080 Ti, i9-13900K, Kingston Fury Renegade SFYRS1000G
179.1 (88.3min, 112.8P0.1, 149.4P1 - 475max) fps
Minisforum NUCX i7
GeForce RTX 3070 Laptop GPU, i7-11800H
104.1 (24.9min, 51.1P0.1, 81.2P1 - 254max) fps -42%
Intel Dragon Canyon NUC - RTX 3060
NVIDIA GeForce RTX 3060, i9-12900, Transcend M.2 SSD 2200S TS512GMTE220S
91.3 (52.3min, 64.5P0.1, 77.1P1 - 310max) fps -49%
Minisforum Neptune Series HX90G
Radeon RX 6600M, R9 5900HX, ESO512GYLCT
88 (41.9min, 48.7P0.1, 72.5P1 - 232max) fps -51%
3840x2160 High Graphics & Postprocessing (Nvidia HairWorks Off)
Intel NUC13 Raptor Canyon
NVIDIA GeForce RTX 3080 Ti, i9-13900K, Kingston Fury Renegade SFYRS1000G
156.8 (29.3min, 110.6P0.1, 134.2P1 - 617max) fps
ASUS TUF Gaming GeForce RTX 3080 Ti OC
NVIDIA GeForce RTX 3080 Ti, R9 7950X, Corsair MP600
154.9 (54.5min, 91.3P0.1, 134.4P1 - 636max) fps -1%
Intel Core i9-13900K
NVIDIA GeForce RTX 3090, i9-13900K, Corsair MP600
151.6 (24.7min, 114.1P0.1, 131.8P1 - 659max) fps -3%
Corsair One i300
NVIDIA GeForce RTX 3080 Ti, i9-12900K, Samsung PM9A1 MZVL22T0HBLB
149 (41.5min, 102P0.1, 127P1 - 584max) fps -5%
Minisforum NUCX i7
GeForce RTX 3070 Laptop GPU, i7-11800H
71.6 (27.6min, 44.2P0.1, 60.8P1 - 323max) fps -54%
Intel Dragon Canyon NUC - RTX 3060
NVIDIA GeForce RTX 3060, i9-12900, Transcend M.2 SSD 2200S TS512GMTE220S
62.5 (22min, 41.4P0.1, 54.9P1 - 339max) fps -60%
Minisforum Neptune Series HX90G
Radeon RX 6600M, R9 5900HX, ESO512GYLCT
43.9 (32.8min, 33P0.1, 34.2P1 - 66.8max) fps -72%
Final Fantasy XV Benchmark
3840x2160 High Quality
Intel Core i9-13900K
NVIDIA GeForce RTX 3090, i9-13900K, Corsair MP600
88.5 fps +5%
ASUS TUF Gaming GeForce RTX 3080 Ti OC
NVIDIA GeForce RTX 3080 Ti, R9 7950X, Corsair MP600
86.4 fps +3%
Intel NUC13 Raptor Canyon
NVIDIA GeForce RTX 3080 Ti, i9-13900K, Kingston Fury Renegade SFYRS1000G
84.2 fps
Corsair One i300
NVIDIA GeForce RTX 3080 Ti, i9-12900K, Samsung PM9A1 MZVL22T0HBLB
84 fps 0%
Minisforum NUCX i7
GeForce RTX 3070 Laptop GPU, i7-11800H
45.6 fps -46%
Intel Beast Canyon NUC
NVIDIA GeForce RTX 3060, i9-11900KB, Sabrent Rocket 4.0 500GB
38 fps -55%
Intel Dragon Canyon NUC - RTX 3060
NVIDIA GeForce RTX 3060, i9-12900, Transcend M.2 SSD 2200S TS512GMTE220S
38 fps -55%
Minisforum Neptune Series HX90G
Radeon RX 6600M, R9 5900HX, ESO512GYLCT
30.6 fps -64%
1920x1080 High Quality
Intel Core i9-13900K
NVIDIA GeForce RTX 3090, i9-13900K, Corsair MP600
188.9 fps +5%
ASUS TUF Gaming GeForce RTX 3080 Ti OC
NVIDIA GeForce RTX 3080 Ti, R9 7950X, Corsair MP600
186.4 fps +3%
Intel NUC13 Raptor Canyon
NVIDIA GeForce RTX 3080 Ti, i9-13900K, Kingston Fury Renegade SFYRS1000G
180.6 fps
Corsair One i300
NVIDIA GeForce RTX 3080 Ti, i9-12900K, Samsung PM9A1 MZVL22T0HBLB
175 fps -3%
Minisforum NUCX i7
GeForce RTX 3070 Laptop GPU, i7-11800H
103.3 fps -43%
Intel Beast Canyon NUC
NVIDIA GeForce RTX 3060, i9-11900KB, Sabrent Rocket 4.0 500GB
88.6 fps -51%
Intel Dragon Canyon NUC - RTX 3060
NVIDIA GeForce RTX 3060, i9-12900, Transcend M.2 SSD 2200S TS512GMTE220S
88.6 fps -51%
Minisforum Neptune Series HX90G
Radeon RX 6600M, R9 5900HX, ESO512GYLCT
81.4 fps -55%
X-Plane 11.11
3840x2160 high (fps_test=3)
Intel Core i9-13900K
NVIDIA GeForce RTX 3090, i9-13900K, Corsair MP600
128.4 fps +1%
Intel NUC13 Raptor Canyon
NVIDIA GeForce RTX 3080 Ti, i9-13900K, Kingston Fury Renegade SFYRS1000G
127.3 fps
Corsair One i300
NVIDIA GeForce RTX 3080 Ti, i9-12900K, Samsung PM9A1 MZVL22T0HBLB
118 fps -7%
ASUS TUF Gaming GeForce RTX 3080 Ti OC
NVIDIA GeForce RTX 3080 Ti, R9 7950X, Corsair MP600
118 fps -7%
Intel Beast Canyon NUC
NVIDIA GeForce RTX 3060, i9-11900KB, Sabrent Rocket 4.0 500GB
88.5 fps -30%
Intel Dragon Canyon NUC - RTX 3060
NVIDIA GeForce RTX 3060, i9-12900, Transcend M.2 SSD 2200S TS512GMTE220S
88.5 fps -30%
Minisforum NUCX i7
GeForce RTX 3070 Laptop GPU, i7-11800H
81.5 fps -36%
Minisforum Neptune Series HX90G
Radeon RX 6600M, R9 5900HX, ESO512GYLCT
29 fps -77%
1920x1080 high (fps_test=3)
Intel NUC13 Raptor Canyon
NVIDIA GeForce RTX 3080 Ti, i9-13900K, Kingston Fury Renegade SFYRS1000G
148.8 fps
Intel Core i9-13900K
NVIDIA GeForce RTX 3090, i9-13900K, Corsair MP600
148.4 fps 0%
ASUS TUF Gaming GeForce RTX 3080 Ti OC
NVIDIA GeForce RTX 3080 Ti, R9 7950X, Corsair MP600
140.1 fps -6%
Corsair One i300
NVIDIA GeForce RTX 3080 Ti, i9-12900K, Samsung PM9A1 MZVL22T0HBLB
135 fps -9%
Intel Beast Canyon NUC
NVIDIA GeForce RTX 3060, i9-11900KB, Sabrent Rocket 4.0 500GB
105 fps -29%
Intel Dragon Canyon NUC - RTX 3060
NVIDIA GeForce RTX 3060, i9-12900, Transcend M.2 SSD 2200S TS512GMTE220S
105 fps -29%
Minisforum NUCX i7
GeForce RTX 3070 Laptop GPU, i7-11800H
94.8 fps -36%
Minisforum Neptune Series HX90G
Radeon RX 6600M, R9 5900HX, ESO512GYLCT
47.1 fps -68%
Far Cry 5
1920x1080 Ultra Preset AA:T
Intel Core i9-13900K
NVIDIA GeForce RTX 3090, i9-13900K, Corsair MP600
205 (155min - 278max) fps +10%
ASUS TUF Gaming GeForce RTX 3080 Ti OC
NVIDIA GeForce RTX 3080 Ti, R9 7950X, Corsair MP600
188 (137min - 271max) fps +1%
Intel NUC13 Raptor Canyon
NVIDIA GeForce RTX 3080 Ti, i9-13900K, Kingston Fury Renegade SFYRS1000G
186 (141min - 254max) fps
Corsair One i300
NVIDIA GeForce RTX 3080 Ti, i9-12900K, Samsung PM9A1 MZVL22T0HBLB
175 (134min - 238max) fps -6%
Intel Dragon Canyon NUC - RTX 3060
NVIDIA GeForce RTX 3060, i9-12900, Transcend M.2 SSD 2200S TS512GMTE220S
132 (114min - 150max) fps -29%
Intel Beast Canyon NUC
NVIDIA GeForce RTX 3060, i9-11900KB, Sabrent Rocket 4.0 500GB
122 (93min - 151max) fps -34%
Minisforum NUCX i7
GeForce RTX 3070 Laptop GPU, i7-11800H
119 (90min - 152max) fps -36%
Minisforum Neptune Series HX90G
Radeon RX 6600M, R9 5900HX, ESO512GYLCT
110 (87min - 142max) fps -41%
3840x2160 Ultra Preset AA:T
Intel Core i9-13900K
NVIDIA GeForce RTX 3090, i9-13900K, Corsair MP600
110 (99min - 129max) fps +1%
ASUS TUF Gaming GeForce RTX 3080 Ti OC
NVIDIA GeForce RTX 3080 Ti, R9 7950X, Corsair MP600
109 (98min - 128max) fps 0%
Intel NUC13 Raptor Canyon
NVIDIA GeForce RTX 3080 Ti, i9-13900K, Kingston Fury Renegade SFYRS1000G
109 (98min - 129max) fps
Corsair One i300
NVIDIA GeForce RTX 3080 Ti, i9-12900K, Samsung PM9A1 MZVL22T0HBLB
108 (97min - 128max) fps -1%
Minisforum NUCX i7
GeForce RTX 3070 Laptop GPU, i7-11800H
55 (48min - 67max) fps -50%
Intel Beast Canyon NUC
NVIDIA GeForce RTX 3060, i9-11900KB, Sabrent Rocket 4.0 500GB
49 (44min - 60max) fps -55%
Intel Dragon Canyon NUC - RTX 3060
NVIDIA GeForce RTX 3060, i9-12900, Transcend M.2 SSD 2200S TS512GMTE220S
48 (43min - 59max) fps -56%
Minisforum Neptune Series HX90G
Radeon RX 6600M, R9 5900HX, ESO512GYLCT
43 (36min - 57max) fps -61%
Far Cry New Dawn
1920x1080 Ultra Preset
Intel Core i9-13900K
NVIDIA GeForce RTX 3090, i9-13900K, Corsair MP600
166 (118min - 265max) fps +11%
ASUS TUF Gaming GeForce RTX 3080 Ti OC
NVIDIA GeForce RTX 3080 Ti, R9 7950X, Corsair MP600
153 (104min - 256max) fps +2%
Intel NUC13 Raptor Canyon
NVIDIA GeForce RTX 3080 Ti, i9-13900K, Kingston Fury Renegade SFYRS1000G
150 (106min - 242max) fps
Corsair One i300
NVIDIA GeForce RTX 3080 Ti, i9-12900K, Samsung PM9A1 MZVL22T0HBLB
141 (98min - 229max) fps -6%
Intel Dragon Canyon NUC - RTX 3060
NVIDIA GeForce RTX 3060, i9-12900, Transcend M.2 SSD 2200S TS512GMTE220S
113 (86min - 148max) fps -25%
Intel Beast Canyon NUC
NVIDIA GeForce RTX 3060, i9-11900KB, Sabrent Rocket 4.0 500GB
102 (72min - 145max) fps -32%
Minisforum NUCX i7
GeForce RTX 3070 Laptop GPU, i7-11800H
100 (71min - 156max) fps -33%
Minisforum Neptune Series HX90G
Radeon RX 6600M, R9 5900HX, ESO512GYLCT
90 (63min - 144max) fps -40%
3840x2160 Ultra Preset
Intel Core i9-13900K
NVIDIA GeForce RTX 3090, i9-13900K, Corsair MP600
111 (94min - 132max) fps +2%
ASUS TUF Gaming GeForce RTX 3080 Ti OC
NVIDIA GeForce RTX 3080 Ti, R9 7950X, Corsair MP600
110 (85min - 131max) fps +1%
Intel NUC13 Raptor Canyon
NVIDIA GeForce RTX 3080 Ti, i9-13900K, Kingston Fury Renegade SFYRS1000G
109 (93min - 130max) fps
Corsair One i300
NVIDIA GeForce RTX 3080 Ti, i9-12900K, Samsung PM9A1 MZVL22T0HBLB
107 (85min - 127max) fps -2%
Minisforum NUCX i7
GeForce RTX 3070 Laptop GPU, i7-11800H
58 (50min - 71max) fps -47%
Intel Dragon Canyon NUC - RTX 3060
NVIDIA GeForce RTX 3060, i9-12900, Transcend M.2 SSD 2200S TS512GMTE220S
51 (42min - 61max) fps -53%
Intel Beast Canyon NUC
NVIDIA GeForce RTX 3060, i9-11900KB, Sabrent Rocket 4.0 500GB
50 (42min - 60max) fps -54%
Minisforum Neptune Series HX90G
Radeon RX 6600M, R9 5900HX, ESO512GYLCT
48 (38min - 62max) fps -56%
Far Cry 6
1920x1080 Ultra Graphics Quality + HD Textures AA:T
ASUS TUF Gaming GeForce RTX 3080 Ti OC
NVIDIA GeForce RTX 3080 Ti, R9 7950X, Corsair MP600
159.6 (123min - 198max) fps +32%
Intel Core i9-13900K
NVIDIA GeForce RTX 3090, i9-13900K, Corsair MP600
159.1 (137min - 188max) fps +32%
Corsair One i300
NVIDIA GeForce RTX 3080 Ti, i9-12900K, Samsung PM9A1 MZVL22T0HBLB
149 (125min - 185max) fps +23%
Intel NUC13 Raptor Canyon
NVIDIA GeForce RTX 3080 Ti, i9-13900K, Kingston Fury Renegade SFYRS1000G
120.7 (100min - 164max) fps
Intel Dragon Canyon NUC - RTX 3060
NVIDIA GeForce RTX 3060, i9-12900, Transcend M.2 SSD 2200S TS512GMTE220S
96 (83min - 107max) fps -20%
Intel Beast Canyon NUC
NVIDIA GeForce RTX 3060, i9-11900KB, Sabrent Rocket 4.0 500GB
90.8 (78min - 103max) fps -25%
Minisforum Neptune Series HX90G
Radeon RX 6600M, R9 5900HX, ESO512GYLCT
71.5 (51min - 93max) fps -41%
3840x2160 Ultra Graphics Quality + HD Textures AA:T
ASUS TUF Gaming GeForce RTX 3080 Ti OC
NVIDIA GeForce RTX 3080 Ti, R9 7950X, Corsair MP600
86.2 (79min - 93max) fps 0%
Intel NUC13 Raptor Canyon
NVIDIA GeForce RTX 3080 Ti, i9-13900K, Kingston Fury Renegade SFYRS1000G
86 (77min - 93max) fps
Intel Core i9-13900K
NVIDIA GeForce RTX 3090, i9-13900K, Corsair MP600
84.5 (76min - 92max) fps -2%
Corsair One i300
NVIDIA GeForce RTX 3080 Ti, i9-12900K, Samsung PM9A1 MZVL22T0HBLB
81.6 (74min - 88max) fps -5%
Intel Dragon Canyon NUC - RTX 3060
NVIDIA GeForce RTX 3060, i9-12900, Transcend M.2 SSD 2200S TS512GMTE220S
39.3 (34min - 43max) fps -54%
Intel Beast Canyon NUC
NVIDIA GeForce RTX 3060, i9-11900KB, Sabrent Rocket 4.0 500GB
38.8 (34min - 42max) fps -55%
Minisforum Neptune Series HX90G
Radeon RX 6600M, R9 5900HX, ESO512GYLCT
2.85 (2min - 3max) fps -97%
Metro Exodus
1920x1080 Ultra Quality AF:16x
ASUS TUF Gaming GeForce RTX 3080 Ti OC
NVIDIA GeForce RTX 3080 Ti, R9 7950X, Corsair MP600
144.2 (71.71min - 266.45max) fps +8%
Intel Core i9-13900K
NVIDIA GeForce RTX 3090, i9-13900K, Corsair MP600
141.3 (72.08min - 276.09max) fps +5%
Corsair One i300
NVIDIA GeForce RTX 3080 Ti, i9-12900K, Samsung PM9A1 MZVL22T0HBLB
137 (66.86min - 244.08max) fps +2%
Intel NUC13 Raptor Canyon
NVIDIA GeForce RTX 3080 Ti, i9-13900K, Kingston Fury Renegade SFYRS1000G
134 (62.23min - 264.55max) fps
Minisforum NUCX i7
GeForce RTX 3070 Laptop GPU, i7-11800H
74.6 (38.07min - 133.07max) fps -44%
Intel Dragon Canyon NUC - RTX 3060
NVIDIA GeForce RTX 3060, i9-12900, Transcend M.2 SSD 2200S TS512GMTE220S
65.3 (34.71min - 117.86max) fps -51%
Intel Beast Canyon NUC
NVIDIA GeForce RTX 3060, i9-11900KB, Sabrent Rocket 4.0 500GB
59.8 (30.99min - 119.9max) fps -55%
Minisforum Neptune Series HX90G
Radeon RX 6600M, R9 5900HX, ESO512GYLCT
59.2 (34.14min - 86.99max) fps -56%
3840x2160 Ultra Quality AF:16x
ASUS TUF Gaming GeForce RTX 3080 Ti OC
NVIDIA GeForce RTX 3080 Ti, R9 7950X, Corsair MP600
77.1 (48.66min - 128.68max) fps +1%
Intel NUC13 Raptor Canyon
NVIDIA GeForce RTX 3080 Ti, i9-13900K, Kingston Fury Renegade SFYRS1000G
76.5 (48.81min - 120.82max) fps
Intel Core i9-13900K
NVIDIA GeForce RTX 3090, i9-13900K, Corsair MP600
76.2 (48.9min - 128.44max) fps 0%
Corsair One i300
NVIDIA GeForce RTX 3080 Ti, i9-12900K, Samsung PM9A1 MZVL22T0HBLB
75 (46.62min - 125.88max) fps -2%
Minisforum NUCX i7
GeForce RTX 3070 Laptop GPU, i7-11800H
37.6 (22.55min - 69.77max) fps -51%
Intel Dragon Canyon NUC - RTX 3060
NVIDIA GeForce RTX 3060, i9-12900, Transcend M.2 SSD 2200S TS512GMTE220S
32.2 (20.64min - 49.49max) fps -58%
Intel Beast Canyon NUC
NVIDIA GeForce RTX 3060, i9-11900KB, Sabrent Rocket 4.0 500GB
31.3 (19.73min - 51.77max) fps -59%
Minisforum Neptune Series HX90G
Radeon RX 6600M, R9 5900HX, ESO512GYLCT
27.3 (18.02min - 35.61max) fps -64%
Borderlands 3
3840x2160 Badass Overall Quality (DX11)
Intel NUC13 Raptor Canyon
NVIDIA GeForce RTX 3080 Ti, i9-13900K, Kingston Fury Renegade SFYRS1000G
74 fps
ASUS TUF Gaming GeForce RTX 3080 Ti OC
NVIDIA GeForce RTX 3080 Ti, R9 7950X, Corsair MP600
73.8 fps 0%
Intel Core i9-13900K
NVIDIA GeForce RTX 3090, i9-13900K, Corsair MP600
73.1 fps -1%
Corsair One i300
NVIDIA GeForce RTX 3080 Ti, i9-12900K, Samsung PM9A1 MZVL22T0HBLB
72 fps -3%
Intel Beast Canyon NUC
NVIDIA GeForce RTX 3060, i9-11900KB, Sabrent Rocket 4.0 500GB
36.8 fps -50%
Minisforum NUCX i7
GeForce RTX 3070 Laptop GPU, i7-11800H
34.8 fps -53%
Intel Dragon Canyon NUC - RTX 3060
NVIDIA GeForce RTX 3060, i9-12900, Transcend M.2 SSD 2200S TS512GMTE220S
33.3 fps -55%
Minisforum Neptune Series HX90G
Radeon RX 6600M, R9 5900HX, ESO512GYLCT
23.7 fps -68%
1920x1080 Badass Overall Quality (DX11)
ASUS TUF Gaming GeForce RTX 3080 Ti OC
NVIDIA GeForce RTX 3080 Ti, R9 7950X, Corsair MP600
164.9 fps +3%
Intel Core i9-13900K
NVIDIA GeForce RTX 3090, i9-13900K, Corsair MP600
163 fps +2%
Intel NUC13 Raptor Canyon
NVIDIA GeForce RTX 3080 Ti, i9-13900K, Kingston Fury Renegade SFYRS1000G
160 fps
Corsair One i300
NVIDIA GeForce RTX 3080 Ti, i9-12900K, Samsung PM9A1 MZVL22T0HBLB
152 fps -5%
Intel Beast Canyon NUC
NVIDIA GeForce RTX 3060, i9-11900KB, Sabrent Rocket 4.0 500GB
100 fps -37%
Intel Dragon Canyon NUC - RTX 3060
NVIDIA GeForce RTX 3060, i9-12900, Transcend M.2 SSD 2200S TS512GMTE220S
84.7 fps -47%
Minisforum NUCX i7
GeForce RTX 3070 Laptop GPU, i7-11800H
84.7 fps -47%
Minisforum Neptune Series HX90G
Radeon RX 6600M, R9 5900HX, ESO512GYLCT
66.2 fps -59%
F1 2020
1920x1080 Ultra High Preset AA:T AF:16x
ASUS TUF Gaming GeForce RTX 3080 Ti OC
NVIDIA GeForce RTX 3080 Ti, R9 7950X, Corsair MP600
313 (254min - 380max) fps +1%
Intel NUC13 Raptor Canyon
NVIDIA GeForce RTX 3080 Ti, i9-13900K, Kingston Fury Renegade SFYRS1000G
310 (246min - 379max) fps
Corsair One i300
NVIDIA GeForce RTX 3080 Ti, i9-12900K, Samsung PM9A1 MZVL22T0HBLB
298 (238min - 364max) fps -4%
Intel Core i9-13900K
NVIDIA GeForce RTX 3090, i9-13900K, Corsair MP600
297 (238min - 361max) fps -4%
Minisforum NUCX i7
GeForce RTX 3070 Laptop GPU, i7-11800H
166.2 (136min - 198max) fps -46%
Intel Beast Canyon NUC
NVIDIA GeForce RTX 3060, i9-11900KB, Sabrent Rocket 4.0 500GB
142 (114min - 171max) fps -54%
Intel Dragon Canyon NUC - RTX 3060
NVIDIA GeForce RTX 3060, i9-12900, Transcend M.2 SSD 2200S TS512GMTE220S
142 (114min - 171max) fps -54%
Minisforum Neptune Series HX90G
Radeon RX 6600M, R9 5900HX, ESO512GYLCT
132.4 (98min - 165max) fps -57%
3840x2160 Ultra High Preset AA:T AF:16x
ASUS TUF Gaming GeForce RTX 3080 Ti OC
NVIDIA GeForce RTX 3080 Ti, R9 7950X, Corsair MP600
145.9 (124min - 173max) fps 0%
Intel NUC13 Raptor Canyon
NVIDIA GeForce RTX 3080 Ti, i9-13900K, Kingston Fury Renegade SFYRS1000G
145.2 (122min - 172max) fps
Corsair One i300
NVIDIA GeForce RTX 3080 Ti, i9-12900K, Samsung PM9A1 MZVL22T0HBLB
143 (122min - 169max) fps -2%
Intel Core i9-13900K
NVIDIA GeForce RTX 3090, i9-13900K, Corsair MP600
142.4 (118min - 168max) fps -2%
Minisforum NUCX i7
GeForce RTX 3070 Laptop GPU, i7-11800H
69.7 (59min - 82max) fps -52%
Intel Beast Canyon NUC
NVIDIA GeForce RTX 3060, i9-11900KB, Sabrent Rocket 4.0 500GB
60.2 (51min - 71max) fps -59%
Intel Dragon Canyon NUC - RTX 3060
NVIDIA GeForce RTX 3060, i9-12900, Transcend M.2 SSD 2200S TS512GMTE220S
60.2 (51min - 71max) fps -59%
Minisforum Neptune Series HX90G
Radeon RX 6600M, R9 5900HX, ESO512GYLCT
52.6 (42min - 63max) fps -64%
F1 2021
1920x1080 Ultra High Preset + Raytracing AA:T AF:16x
ASUS TUF Gaming GeForce RTX 3080 Ti OC
NVIDIA GeForce RTX 3080 Ti, R9 7950X, Corsair MP600
234 (196min, 186P1 - 256max) fps +4%
Intel NUC13 Raptor Canyon
NVIDIA GeForce RTX 3080 Ti, i9-13900K, Kingston Fury Renegade SFYRS1000G
225 (181min, 182P1 - 249max) fps
Intel Core i9-13900K
NVIDIA GeForce RTX 3090, i9-13900K, Corsair MP600
224 (191min, 182P1 - 252max) fps 0%
Corsair One i300
NVIDIA GeForce RTX 3080 Ti, i9-12900K, Samsung PM9A1 MZVL22T0HBLB
219 fps -3%
Minisforum NUCX i7
GeForce RTX 3070 Laptop GPU, i7-11800H
123.1 (104min, 93P1 - 137max) fps -45%
Intel Beast Canyon NUC
NVIDIA GeForce RTX 3060, i9-11900KB, Sabrent Rocket 4.0 500GB
96.9 (83min, 83P1 - 107max) fps -57%
Intel Dragon Canyon NUC - RTX 3060
NVIDIA GeForce RTX 3060, i9-12900, Transcend M.2 SSD 2200S TS512GMTE220S
96.9 (83min, 83P1 - 107max) fps -57%
Minisforum Neptune Series HX90G
Radeon RX 6600M, R9 5900HX, ESO512GYLCT
95.8 (80min, 80P1 - 110max) fps -57%
3840x2160 Ultra High Preset + Raytracing AA:T AF:16x
ASUS TUF Gaming GeForce RTX 3080 Ti OC
NVIDIA GeForce RTX 3080 Ti, R9 7950X, Corsair MP600
105.6 (91min, 91P1 - 117max) fps +2%
Intel Core i9-13900K
NVIDIA GeForce RTX 3090, i9-13900K, Corsair MP600
103.4 (90min, 89P1 - 116max) fps 0%
Intel NUC13 Raptor Canyon
NVIDIA GeForce RTX 3080 Ti, i9-13900K, Kingston Fury Renegade SFYRS1000G
103.2 (89min, 89P1 - 115max) fps
Corsair One i300
NVIDIA GeForce RTX 3080 Ti, i9-12900K, Samsung PM9A1 MZVL22T0HBLB
101 (88min, 87P1 - 114max) fps -2%
Minisforum NUCX i7
GeForce RTX 3070 Laptop GPU, i7-11800H
51.1 (44min, 43P1 - 58max) fps -50%
Intel Beast Canyon NUC
NVIDIA GeForce RTX 3060, i9-11900KB, Sabrent Rocket 4.0 500GB
40.9 (35min, 35P1 - 46max) fps -60%
Intel Dragon Canyon NUC - RTX 3060
NVIDIA GeForce RTX 3060, i9-12900, Transcend M.2 SSD 2200S TS512GMTE220S
40.9 (35min, 35P1 - 46max) fps -60%
Minisforum Neptune Series HX90G
Radeon RX 6600M, R9 5900HX, ESO512GYLCT
31.6 (27min, 26P1 - 38max) fps -69%
Forza Horizon 5
1920x1080 Extreme Preset
ASUS TUF Gaming GeForce RTX 3080 Ti OC
NVIDIA GeForce RTX 3080 Ti, R9 7950X, Corsair MP600
141 fps +9%
Intel NUC13 Raptor Canyon
NVIDIA GeForce RTX 3080 Ti, i9-13900K, Kingston Fury Renegade SFYRS1000G
129 fps
Intel Core i9-13900K
NVIDIA GeForce RTX 3090, i9-13900K, Corsair MP600
127 fps -2%
Corsair One i300
NVIDIA GeForce RTX 3080 Ti, i9-12900K, Samsung PM9A1 MZVL22T0HBLB
126 fps -2%
Minisforum NUCX i7
GeForce RTX 3070 Laptop GPU, i7-11800H
81 fps -37%
Minisforum Neptune Series HX90G
Radeon RX 6600M, R9 5900HX, ESO512GYLCT
62 fps -52%
3840x2160 Extreme Preset
ASUS TUF Gaming GeForce RTX 3080 Ti OC
NVIDIA GeForce RTX 3080 Ti, R9 7950X, Corsair MP600
90 fps +3%
Intel NUC13 Raptor Canyon
NVIDIA GeForce RTX 3080 Ti, i9-13900K, Kingston Fury Renegade SFYRS1000G
87 fps
Intel Core i9-13900K
NVIDIA GeForce RTX 3090, i9-13900K, Corsair MP600
85 fps -2%
Corsair One i300
NVIDIA GeForce RTX 3080 Ti, i9-12900K, Samsung PM9A1 MZVL22T0HBLB
84 fps -3%
Minisforum NUCX i7
GeForce RTX 3070 Laptop GPU, i7-11800H
50 fps -43%
Minisforum Neptune Series HX90G
Radeon RX 6600M, R9 5900HX, ESO512GYLCT
30 fps -66%
lage gem. hoge ultraQHD4K
GTA V (2015) 187.6 187.4 187 161.5 152.8 182
The Witcher 3 (2015) 702 564 374 179.1 156.8
Dota 2 Reborn (2015) 278.9 242.4 234.1 216.6 211.1
Final Fantasy XV Benchmark (2018) 234 229 180.6 141 84.2
X-Plane 11.11 (2018) 232 202 148.8 127.3
Far Cry 5 (2018) 239 208 198 186 176 109
Strange Brigade (2018) 613 489 407 359 269 161
Far Cry New Dawn (2019) 200 174 167 150 144 109
Metro Exodus (2019) 241 200 165.8 134 115 76.5
Borderlands 3 (2019) 229 195.3 179.7 160 128.7 74
F1 2020 (2020) 520 448 419 310 240 145.2
F1 2021 (2021) 615 525 428 225 174.3 103.2
Far Cry 6 (2021) 211 180.4 160.6 120.7 136 86
Forza Horizon 5 (2021) 256 191 182 129 117 87
God of War (2022) 229 200 166.6 119.6 105.8 77.5
Tiny Tina's Wonderlands (2022) 355 291 211 168.5 123.1 70
F1 22 (2022) 367 342 321 128.8 85.6 43

Emissies

Temperaturen en systeemgeluid

Intel NUC 13 Extreme Raptor Canyon tijdens onze stresstest

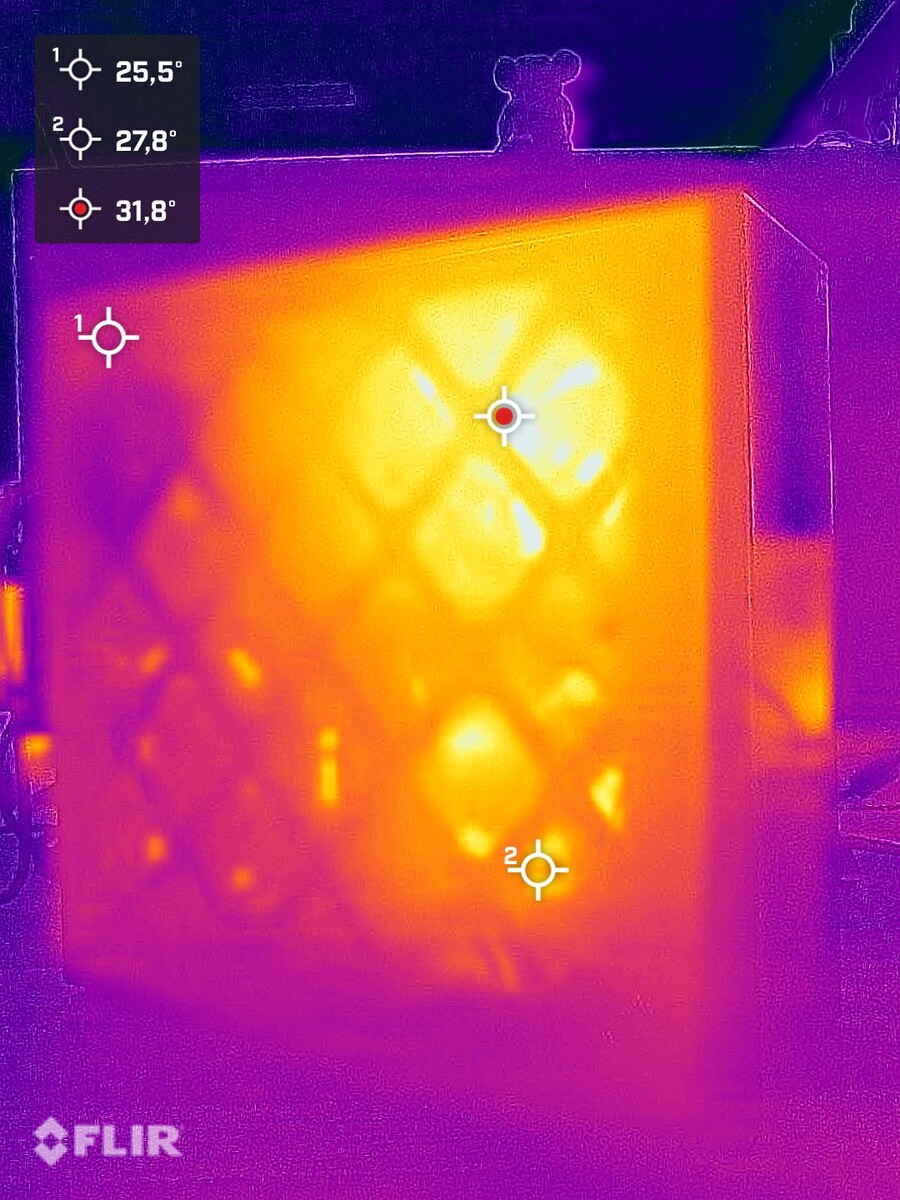
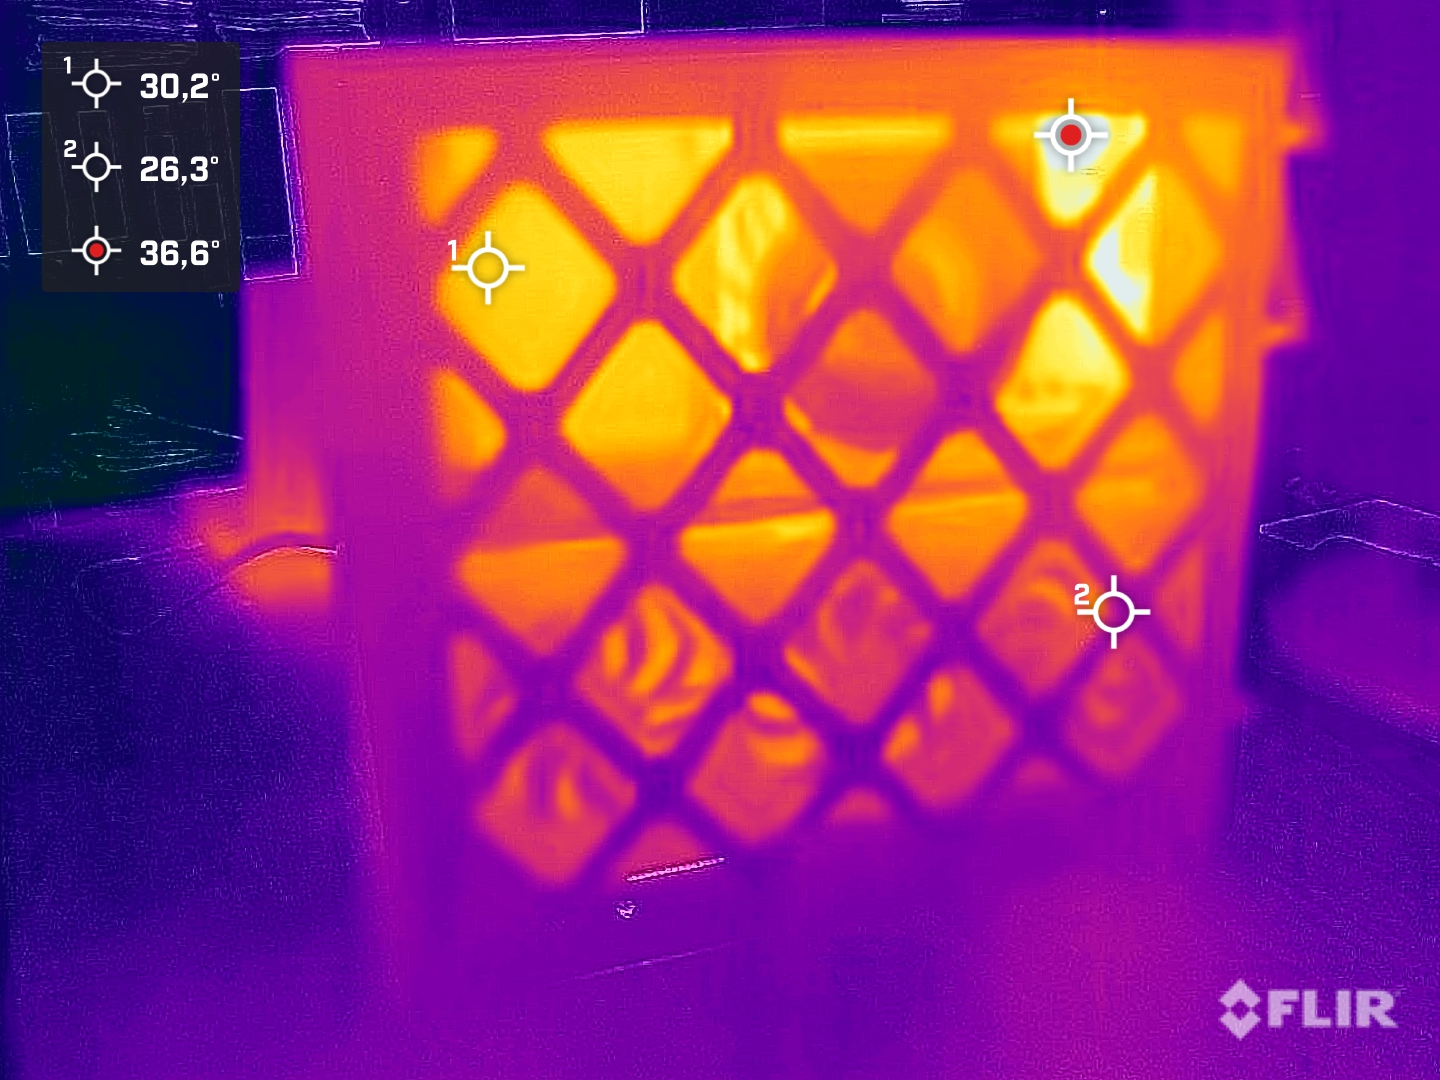
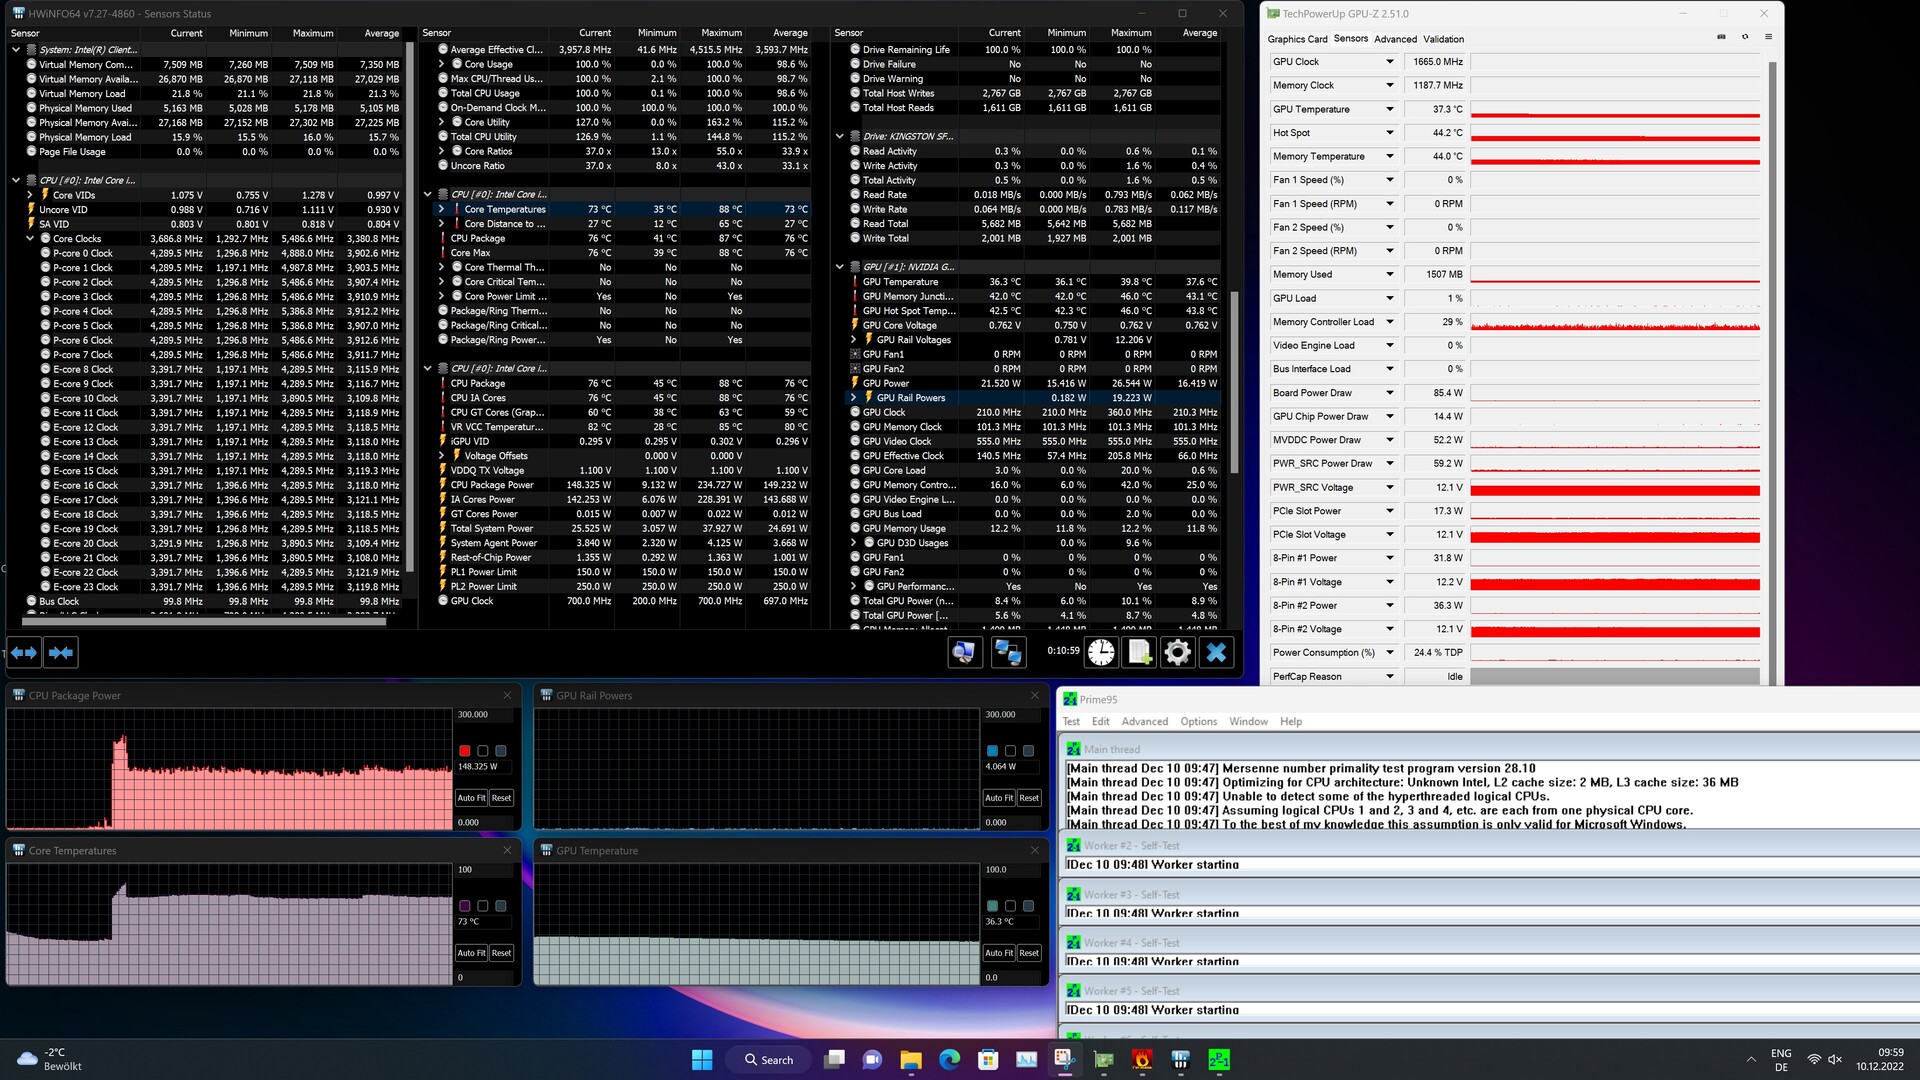
De behuizing van de Intel NUC 13 Extreme Raptor Canyon is verdeeld in twee kamers. Het bovenste deel herbergt het Compute Element, dat de CPU, RAM en SSD en de voeding bevat, terwijl het onderste deel volledig is gereserveerd voor een speciale grafische kaart. Hoewel dit concept in de praktijk goed werkt, is de PL2 van de Intel Core i9-13900K slechts korte tijd vol te houden. De CPU bereikt onvermijdelijk 100 °C onder belasting. Dit gezegd zijnde, bereikt de CPU deze temperatuur echter slechts zelden voor zeer korte periodes. Gemiddeld stabiliseert de CPU-temperatuur zich tussen 60 en 90 °C, afhankelijk van het scenario.

Wat de geluidsemissies betreft, blijft onze configuratie van het systeem relatief stil. Hoewel het systeemgeluid met 39 dB(A) onder volle belasting merkbaar is, is het nog lang niet hinderlijk. Tijdens het gamen meten we een vergelijkbare waarde van net boven de 38 dB(A). De geïnstalleerde grafische kaart is dus de belangrijkste bron van geluid onder belasting. Het is mogelijk om een zeer stil systeem te creëren met een stiller model.

Geluidsniveau

Onbelast
32.1 / 32.1 / 32.1 dB (A)
Belasting
33.4 / 39 dB (A)
  red to green bar
 
 
30 dB
stil
40 dB(A)
hoorbaar
50 dB(A)
luid
 
min: dark, med: mid, max: light   Earthworks M23R, Arta (15 cm afstand)   omgevingslawaai: 30.4 dB(A)
dB(A) 0102030405060708090Deep BassMiddle BassHigh BassLower RangeMidsHigher MidsLower HighsMid HighsUpper HighsSuper Highs2034.435.23434.234.42531.534.434.631.531.53132.634.134.330.532.64030.13131.92930.15030.231.831.831.130.26329.1303126.529.18030.53029.727.530.510033.430302733.412530.227.929.525.330.216030.826.728.124.730.8200282625.723.12825028.424.622.422.428.431528.523.72321.428.54003124.824.420.23150030.123.521.820.530.163031.323.522.319.431.380029.723.52118.729.7100030.924.121.718.330.9125029.822.520.41829.8160027.420.919.117.827.4200027.321.11917.627.3250026.120.518.417.426.1315022.218.618.317.222.2400020.718.618.217.520.7500020.518.918.317.620.5630019.518.618.417.919.5800018.618.418.41818.61000018.718.518.618.318.71250018.918.918.918.718.91600019.319.319.419.119.3SPL3933.432.130.439N3.121.81.43.1median 28median 22.5median 20.4median 18.7median 28Delta4.93.12.62.24.9hearing rangehide median Fan NoiseIntel NUC13 Raptor Canyon
Stresstest FurMark solo
Stresstest Prime95 solo
Stresstest Prime95+FurMark

Energieverbruik

750-watt SFX voeding

Een 750-watt SFX voeding zorgt voor de AC conversie. Aangezien we een maximale stroomopname van 499 watt hebben gemeten tijdens het gamen, hoeven gebruikers zich geen zorgen te maken, zelfs als het systeem onder volle belasting staat. We hebben tijdens onze tests ook pieken van 544 watt waargenomen, wat niet tot problemen leidde. Met 350 watt verbruikt de grafische kaart het leeuwendeel van de stroom tijdens het gamen. We raden het gebruik van GPU's met een nog hogere TGP af. De nieuwe 21VHPWR kabel kan sowieso maar maximaal 300 watt leveren - althans volgens de legenda op de stekker. In totaal zijn er drie 6+2-PCIe kabels.

Intel NUC13 Raptor Canyon
i9-13900K, NVIDIA GeForce RTX 3080 Ti
Minisforum Neptune Series HX90G
R9 5900HX, Radeon RX 6600M
Minisforum NUCX i7
i7-11800H, GeForce RTX 3070 Laptop GPU
Gemiddeld NVIDIA GeForce RTX 3080 Ti
 
Gemiddelde van klas Desktop
 
Power Consumption
51%
36%
0%
49%
Idle Minimum *
39
17.8
54%
28.2
28%
39 ?()
-0%
Idle Average *
42
17.9
57%
29.9
29%
42 ?()
-0%
Idle Maximum *
52
18.1
65%
36.2
30%
52 ?()
-0%
Load Average *
228
82.1
64%
83.2
64%
228 ?()
-0%
Load Maximum *
308
262
15%
215.7
30%
308 ?()
-0%
Witcher 3 ultra *
167

* ... kleiner is beter

Stroomgebruik
Uit / Standbydarklight 2.5 / 25 Watt
Inactiefdarkmidlight 39 / 42 / 52 Watt
Belasting midlight 228 / 308 Watt
 color bar
Key: min: dark, med: mid, max: light        Metrahit Energy
Currently we use the Metrahit Energy, a professional single phase power quality and energy measurement digital multimeter, for our measurements. Find out more about it here. All of our test methods can be found here.

Consumption External Monitor

0306090120150180210240270300330360390420450480510540Tooltip
Intel NUC13 Raptor Canyon; Prime95 V2810 Stress (external Monitor): Ø228 (209-335)
Intel NUC13 Raptor Canyon; Cinebench R15 Multi (external Monitor): Ø349 (264-406)
Intel NUC13 Raptor Canyon; 1280x720 FurMark 1.19 GPU Stress Test (external Monitor): Ø427 (410-454)
Intel NUC13 Raptor Canyon; 1920x1080 The Witcher 3 ultra (external Monitor): Ø499 (487-544)
Intel NUC13 Raptor Canyon; Idle 1min (external Monitor): Ø41.8 (39.3-51.5)

Pro

+ hoogwaardige, robuuste behuizing
+ Core i9 met 24 kernen en 32 threads
+ socketed processor (volwaardige desktop CPU)
+ snelle systeemprestaties
+ SFX PSU met 750W en 12VHPWR
+ veel moderne connectiviteit
+ 2x Thunderbolt 4
+ Wi-Fi 6E
+ 2.5Gb/s en 10Gb/s LAN

Contra

- moeilijk onderhoud van de SSD
- geen SD-kaartlezer
- beperkte compatibiliteitsbeperkingen

Verdict - Veel verbeteringen en aanzienlijk meer prestaties

Intel NUC 13 Extreme Raptor Canyon in review, met dank aan Intel Duitsland.

De Intel NUC 13 Extreme Raptor Canyon doet het in veel opzichten goed. Met de huidige Raptor Lake-modellen werkt de fabrikant niet alleen de hardware bij, maar gaat ook de behuizing op de schop. Deze is nu aanzienlijk groter dan voorheen. Daardoor beschouwen we dit systeem niet langer als een mini-pc, ook al is Intel het daar misschien niet mee eens. Met een volume van 14 liter neemt de Intel NUC 13 Extreme Raptor Canyon het op tegen de Corsair-One-i300 seriedie met 12 liter iets compacter is.

Onze configuratie van het systeem komt met voldoende prestaties voor alle recente titels op 2160p. Door de barebone aard van de NUC 13 Raptor Canyon kan het apparaat worden aangepast aan de eisen en voorkeuren van de gebruiker. De Intel Core i9-13900K presteert uitzonderlijk goed, wat we niet hadden verwacht. Bovendien blijft het apparaat relatief stil, zelfs onder belasting.

De Intel NUC 13 Extreme Kit is gebaseerd op de Intel Core i9-13900K en biedt zeer snelle prestaties. Gepaard met een geschikte GPU kan het een geweldig gaming systeem of een high-end werkstation zijn.

Het systeem, inclusief de CPU, kost momenteel 1550 USD. Het toevoegen van RAM, een SSD en een GPU kan de prijs snel naar duizelingwekkende hoogten doen stijgen. Dat gezegd hebbende, concurrenten zoals de eerder genoemde Corsair One i300 zijn ook geprijsd tot ongeveer 5000 USD.

De nieuwe behuizing ziet er strak uit en voelt robuust aan dankzij de hoogwaardige materialen. Daarnaast heeft het een functioneel ontwerp, wat de koelingsmogelijkheden ten goede komt. Toch zijn er nadelen, zoals de moeilijk bereikbare SSD's en het ontbreken van een kaartlezer. Het model van vorig jaar bevatte dat laatste nog wel, met snelle UHS-II snelheden.

Prijs en beschikbaarheid

In China wordt de Intel NUC 13 Extreme Raptor Canyon uitgebracht in Q4 2022. Een wereldwijde lancering volgt in Q1 2023. Afhankelijk van de configuratie kost de NUC 13 Extreme tussen de 1179 USD en 1549 USD zonder GPU, RAM of SSD - dit is normaal voor NUC's. Het Compute Element is ook los verkrijgbaar zonder pc-behuizing voor 760 tot 1100 USD.

Intel heeft ons de Intel NUC 13 Extreme Raptor Canyon ter beschikking gesteld voor de duur van deze review.

Please share our article, every link counts!
> Overzichten en testrapporten over laptops en mobieltjes > Testrapporten > Intel NUC 13 Extreme Raptor Canyon mini PC met Core i9-13900K en GeForce RTX 3080 Ti in review
Sebastian Bade, 2022-12-15 (Update: 2022-12-15)