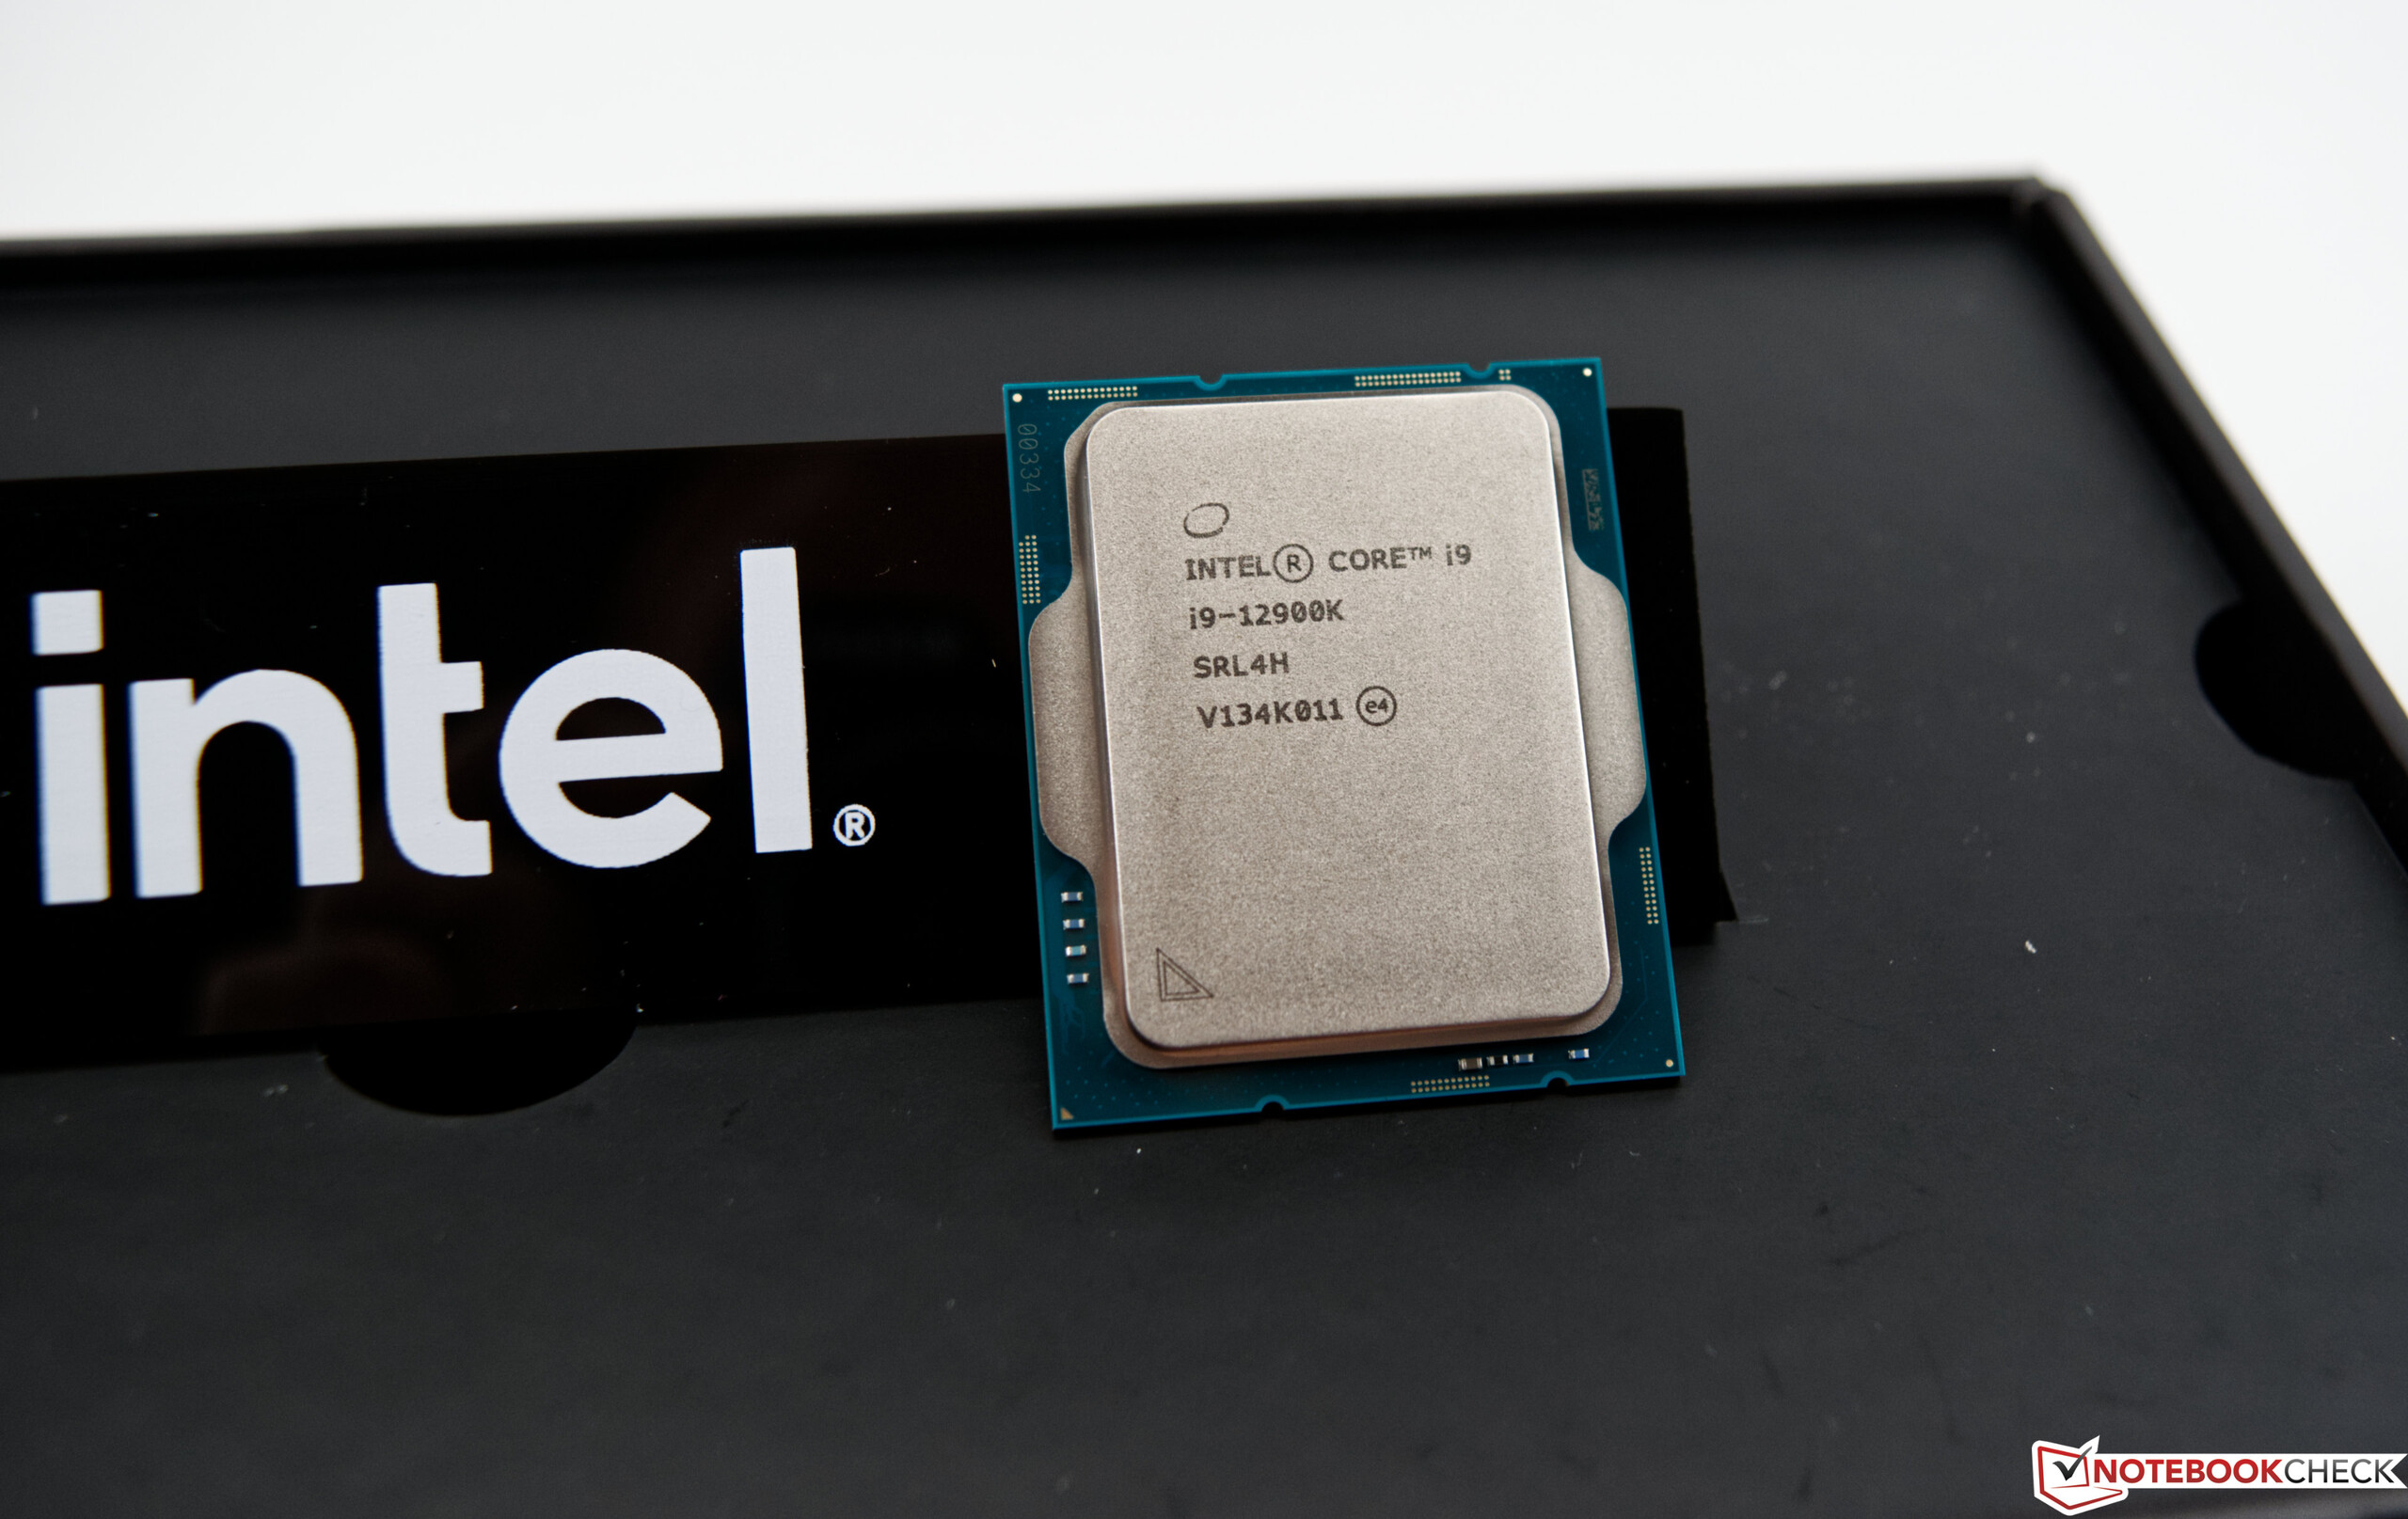
Intel Alder Lake-S review: Heeft Intel weer de snelste gaming CPU?
Intel heeft veel plannen metAlder Lake-S. Jarenlang was Intel de benchmark-standaard voor de snelste gaming CPU, totdat AMD de zaken versnelde met zijn Ryzen 5000 en de kroon overnam. Voor de eindgebruiker heeft dit kat-en-muisspel veel voordelen, omdat het helpt om verbeteringen sneller bij de massa te krijgen.
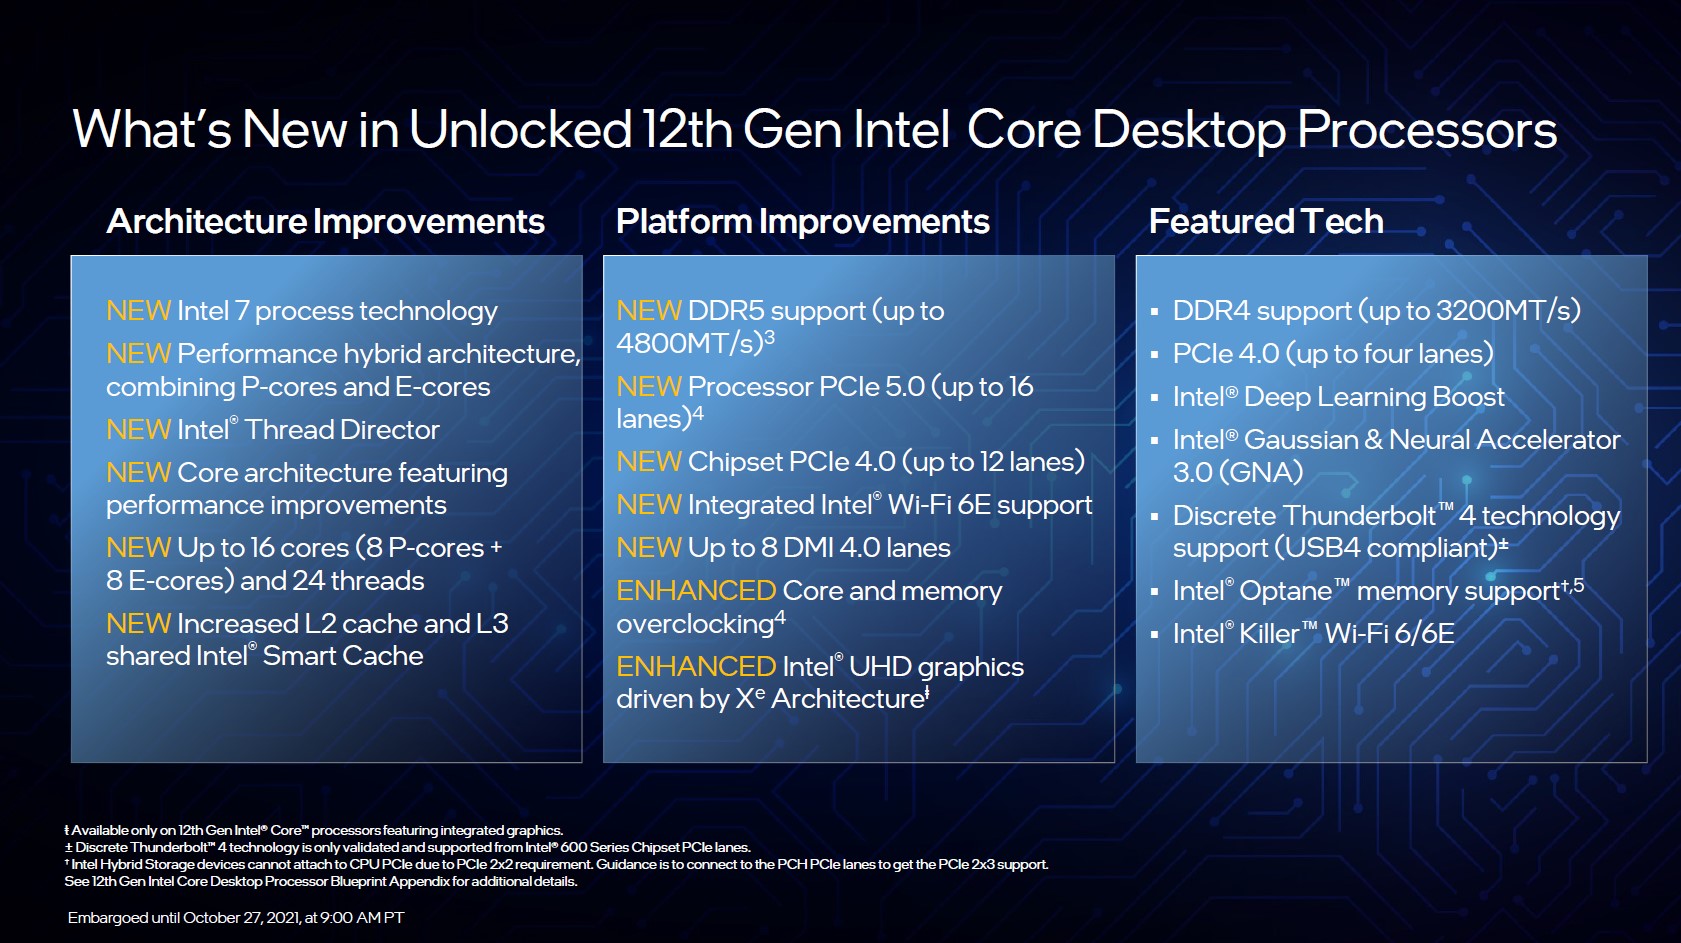
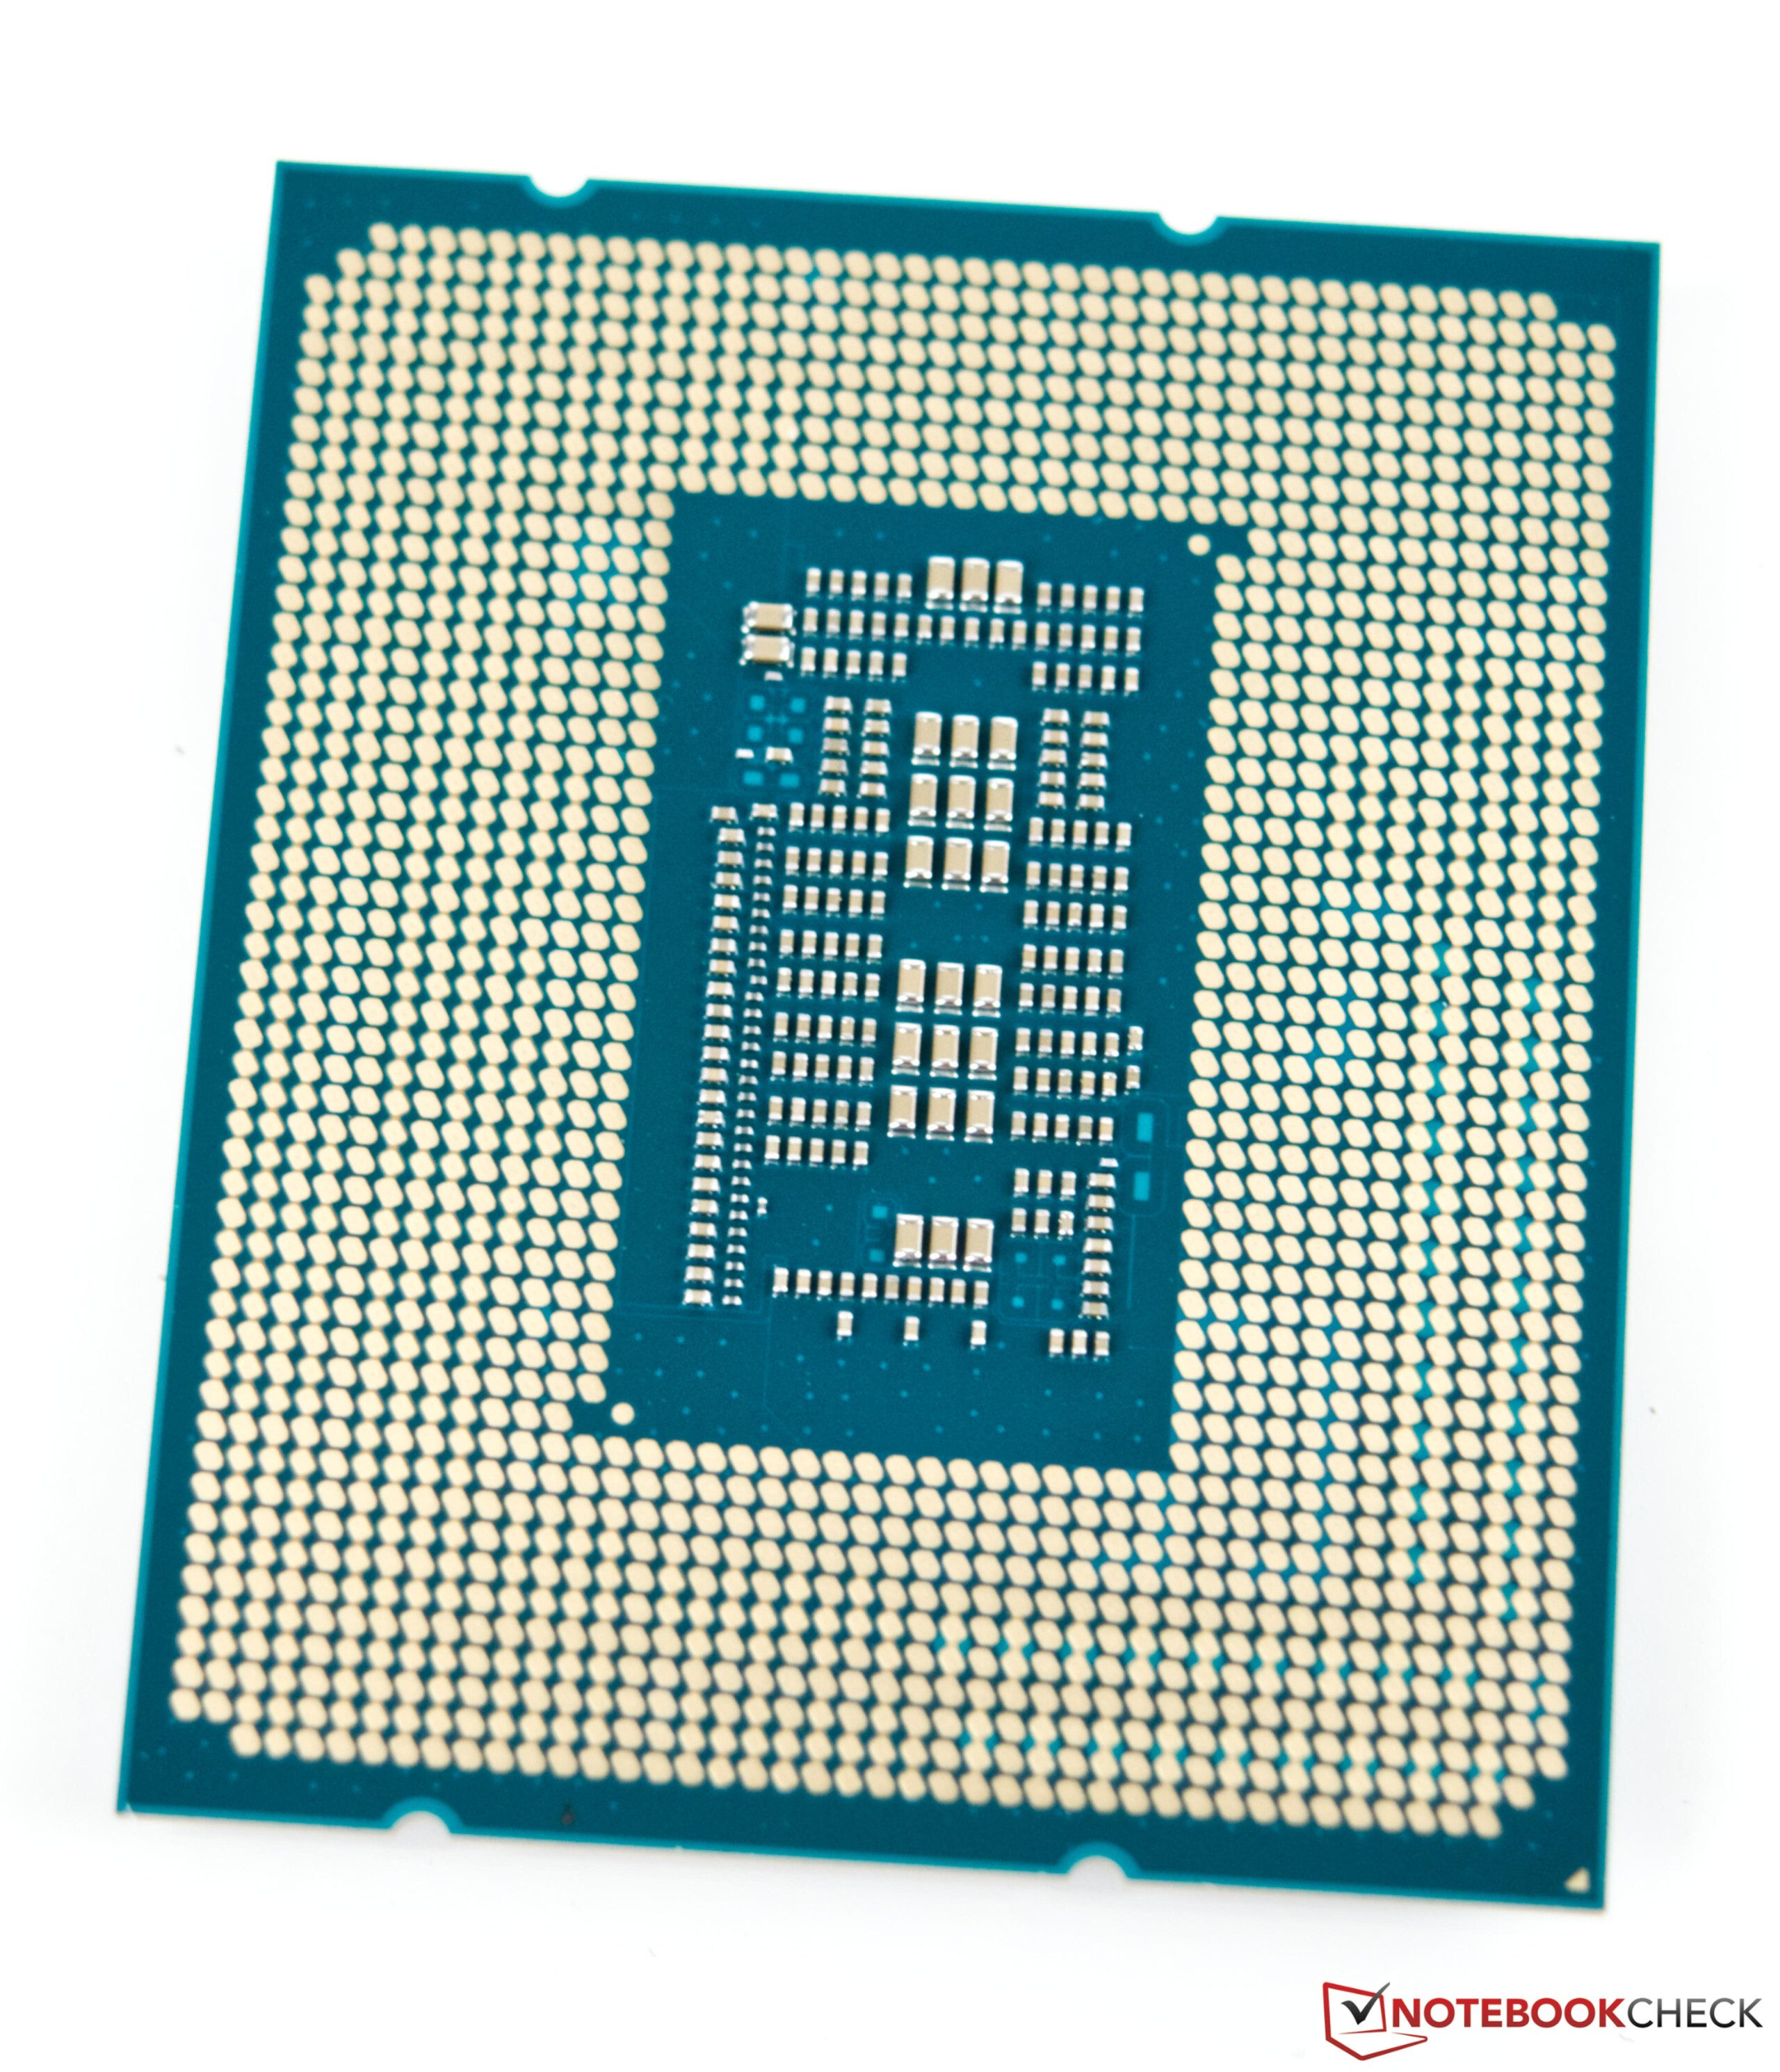
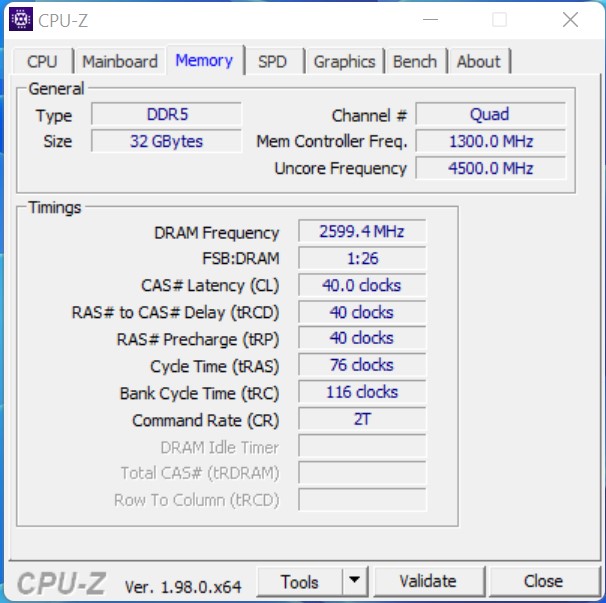
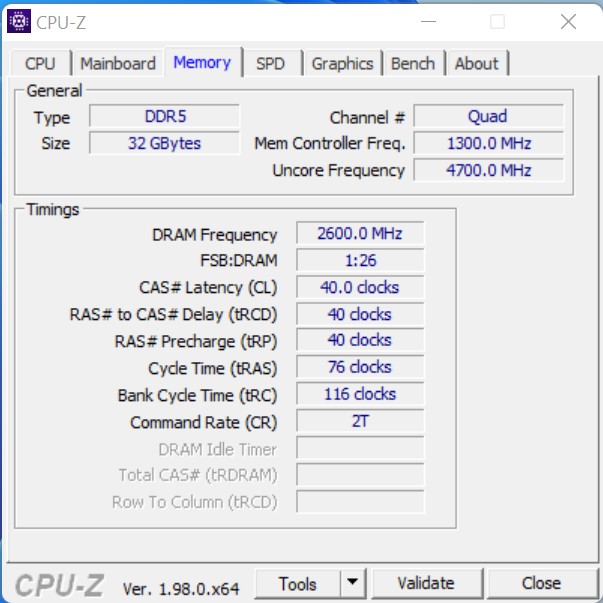
Met de nieuwste processoren voor het desktopsegment en de 12e generatie van de Core-serie introduceert Intel opnieuw een verandering van het platform. Na Comet Lake-S en Rocket Lack-S is LGA1200 alweer verleden tijd, en neemt de grotere LGA 1700 socket het over. De meest bekende verbeteringen zijn de DDR5 en PCIe 5.0 ondersteuning. Op dit moment zijn er echter nog geen producten beschikbaar die deze volledige bandbreedte kunnen gebruiken. Dit maakt de investering in het platform een investering die pas in de toekomst kan worden gebruikt. Bij het werkgeheugen ziet het er iets beter uit. Wie mee wil met de nieuwste trend en de beste prestaties wil halen, komt niet om het nieuwe DDR5-werkgeheugen heen. Maar de Intel Alder Lake-S processoren ondersteunen ook DDR4 RAM. De bijbehorende borden zijn ook te koop met de nieuwe high-end Z690 chipset.
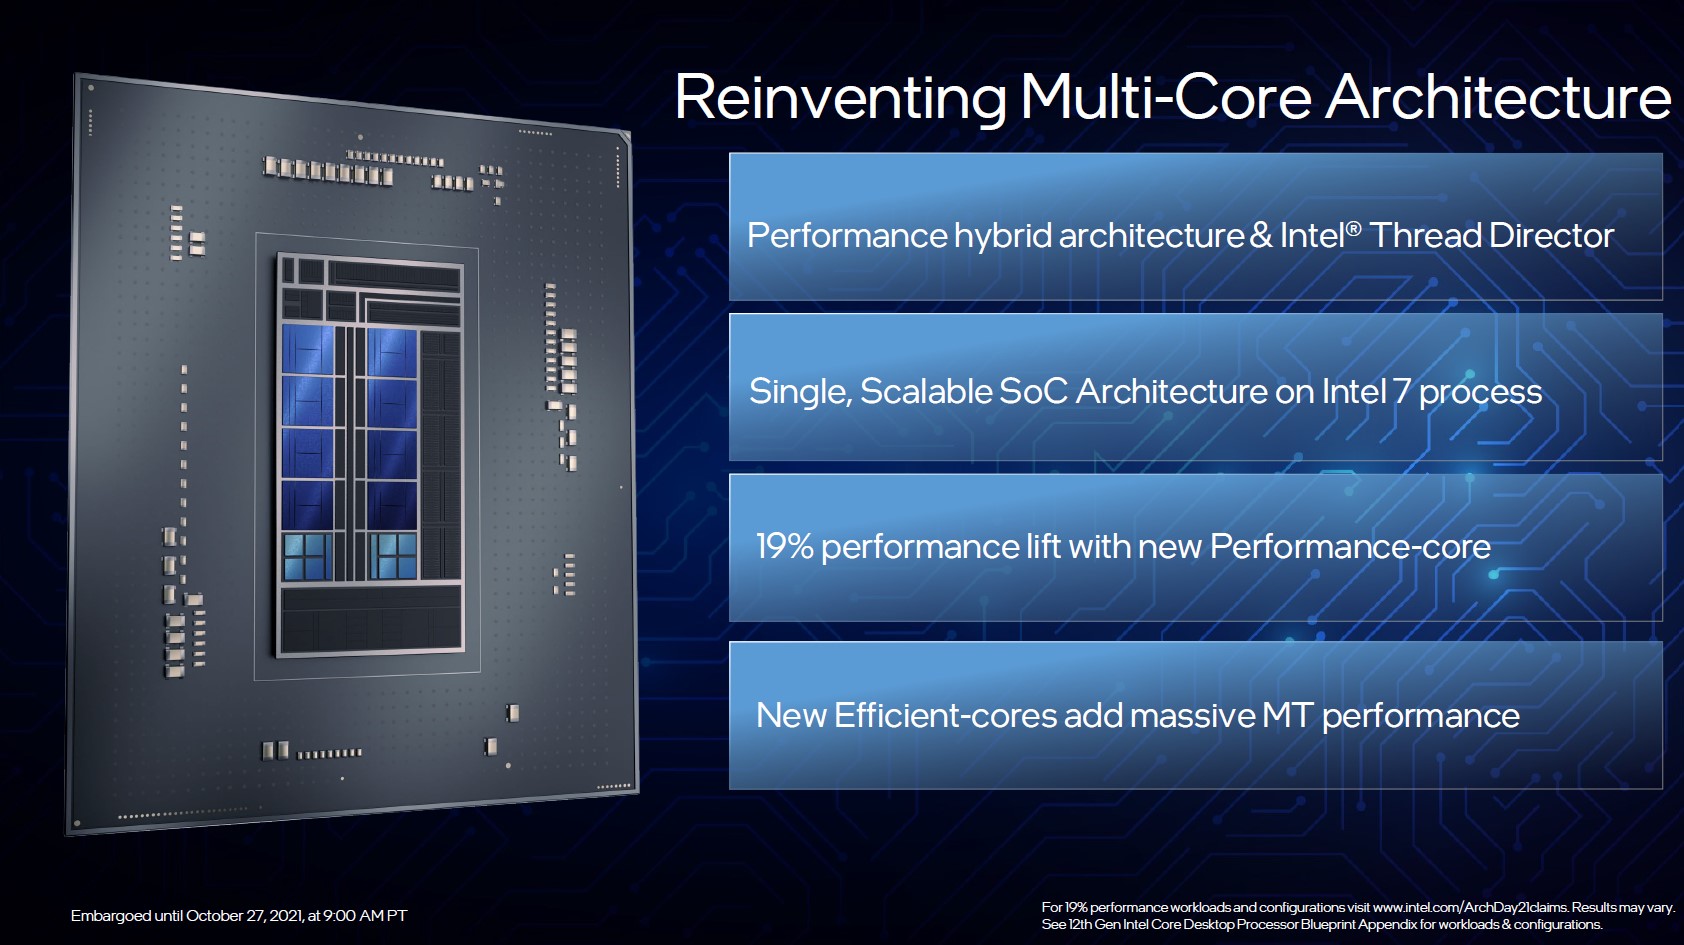
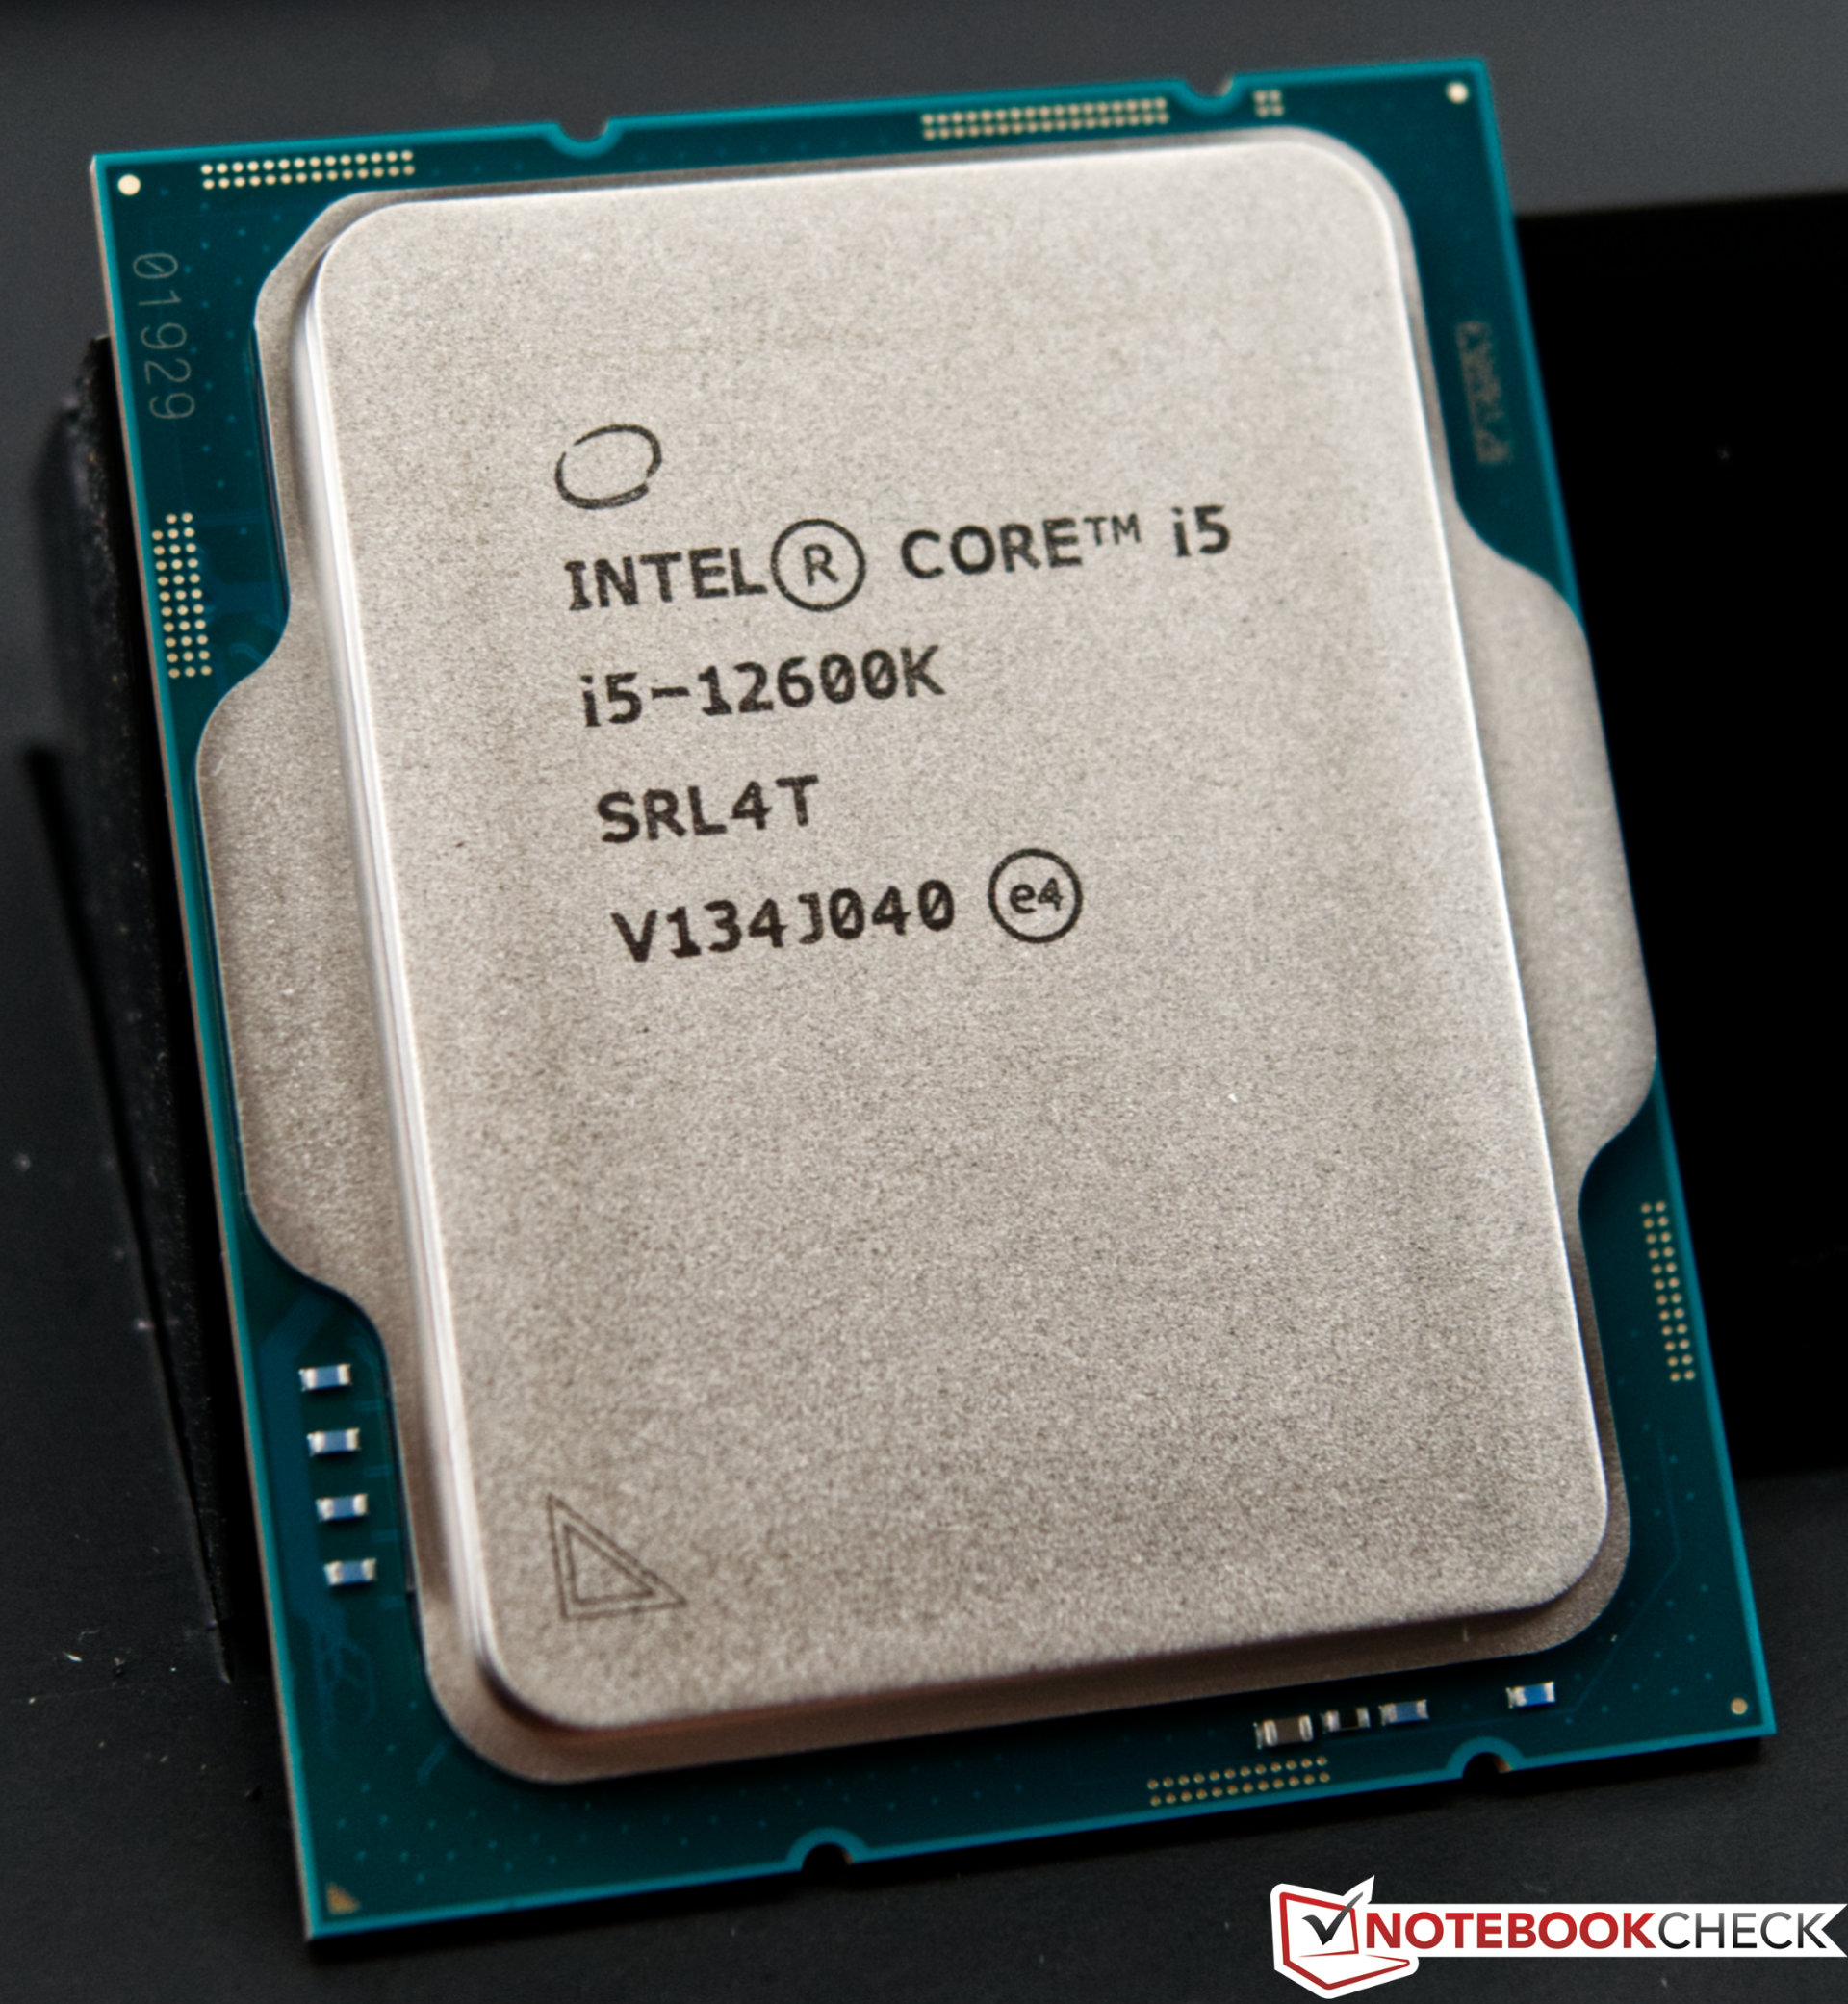
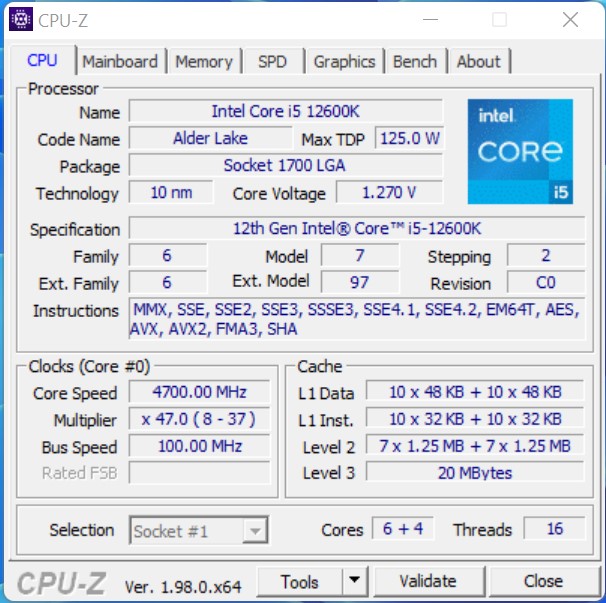
Met Alder Lake-S zet Intel een grote stap vooruit die niet zomaar een kleine Rocket Lake-S refresh is. Het nieuwe ontwerp is verdeeld in prestatie-kernen, de zogenaamde P-kernen, en energiezuinige kernen, de E-cores. Hierdoor kan het topmodel 24 threads aan, resulterend uit 8 P-cores inclusief hyperthreading (HT) en 8 E-cores zonder HT. In de kleinere Intel Core i5-12600K, die we in deze review ook onder de loep nemen, gaat het om 6 P-cores en 4 E-cores, resulterend in 16 threads. De nieuwe E-cores worden verondersteld de P-cores wat te ontlasten, zodat deze voldoende rekenkracht kunnen bieden voor veeleisende toepassingen, terwijl de E-cores de achtergrondprocessen afhandelen. Maar de E-cores zijn zeker geen trage rekeneenheden, en hun prestaties liggen op het Skylake niveau. Het optimale beheer van de cores wordt verzorgd door de Intel Thread Director. Windows 11 als besturingssysteem is een vereiste voor optimaal gebruik.
Wij hebben de belangrijkste vertegenwoordigers van de nieuwe Alder Lake-S familie voor u verzameld in de onderstaande lijst
Die Core-Prozessoren der Alder Lake-S Serie im Überblick
| Model | Cores / Threads |
Kloksnelheid P-Core / Turbo | Turbo 3.0 | Kloksnelheid E-Core / Turbo | Cache L2 + L3 | Graphics | PBP | MTB | Prijs (SRP) |
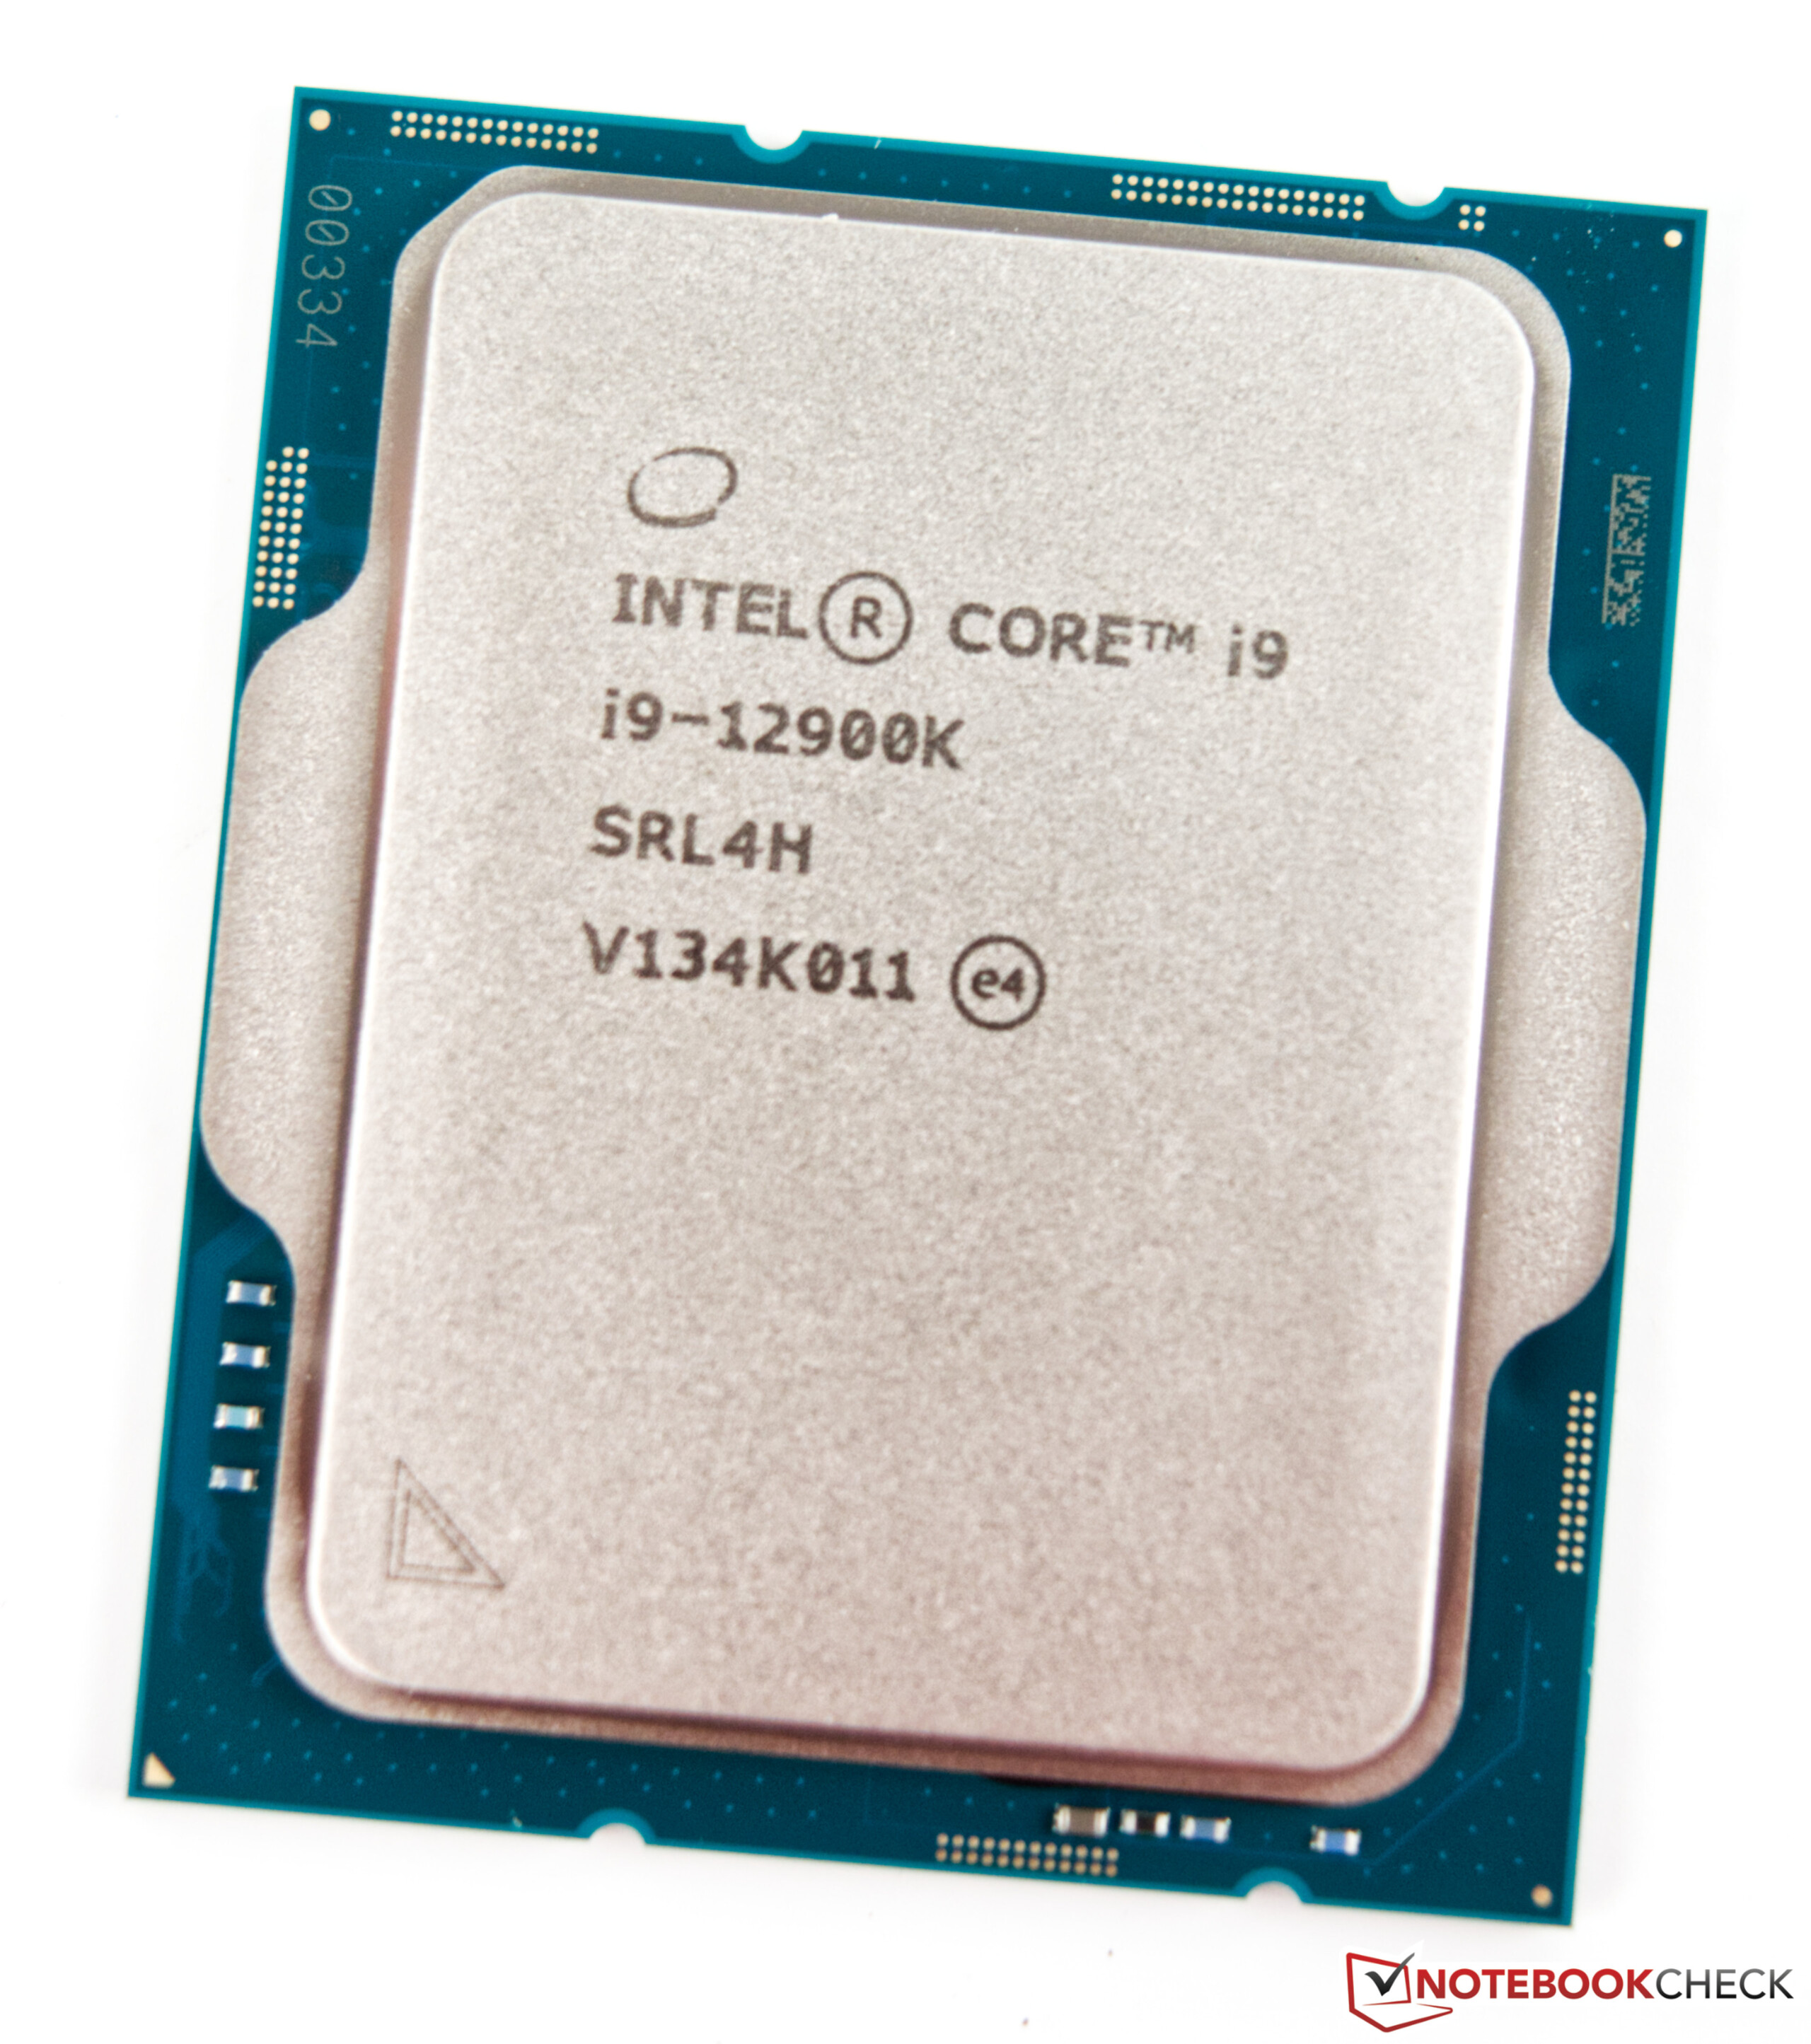
| Core i9-12900K | 16(8P + 8E) /24 | 3.2 GHz / 5.1 GHz | 5.2 GHz | 2.4 GHz / 3.9 GHz | 14+ 30 MB | UHD770 | 125Watt | 241Watt | $ 589 |
| Core i9-12900KF | 16 (8P + 8E) /24 | 3.2 GHz / 5.1 GHz | 5.2 GHz | 2.4 GHz / 3.9 GHz | 14 + 30 MB | - | 125 Watt | 241 Watt | $ 564 |
| Core i7-12700K | 12 (8P + 4E) /20 | 3.6 GHz / 4.9 GHz | 5.0 GHz | 2.7 GHz / 3.8 GHz | 12 + 25 MB | UHD 770 | 125 Watt | 190 Watt | $ 409 |
| Core i7-12700KF | 12 (8P + 4E) /20 | 3.6 GHz / 4.9 GHz | 5.0 GHz | 2.7 GHz / 3.8 GHz | 12 + 25 MB | - | 125 Watt | 190 Watt | $ 384 |
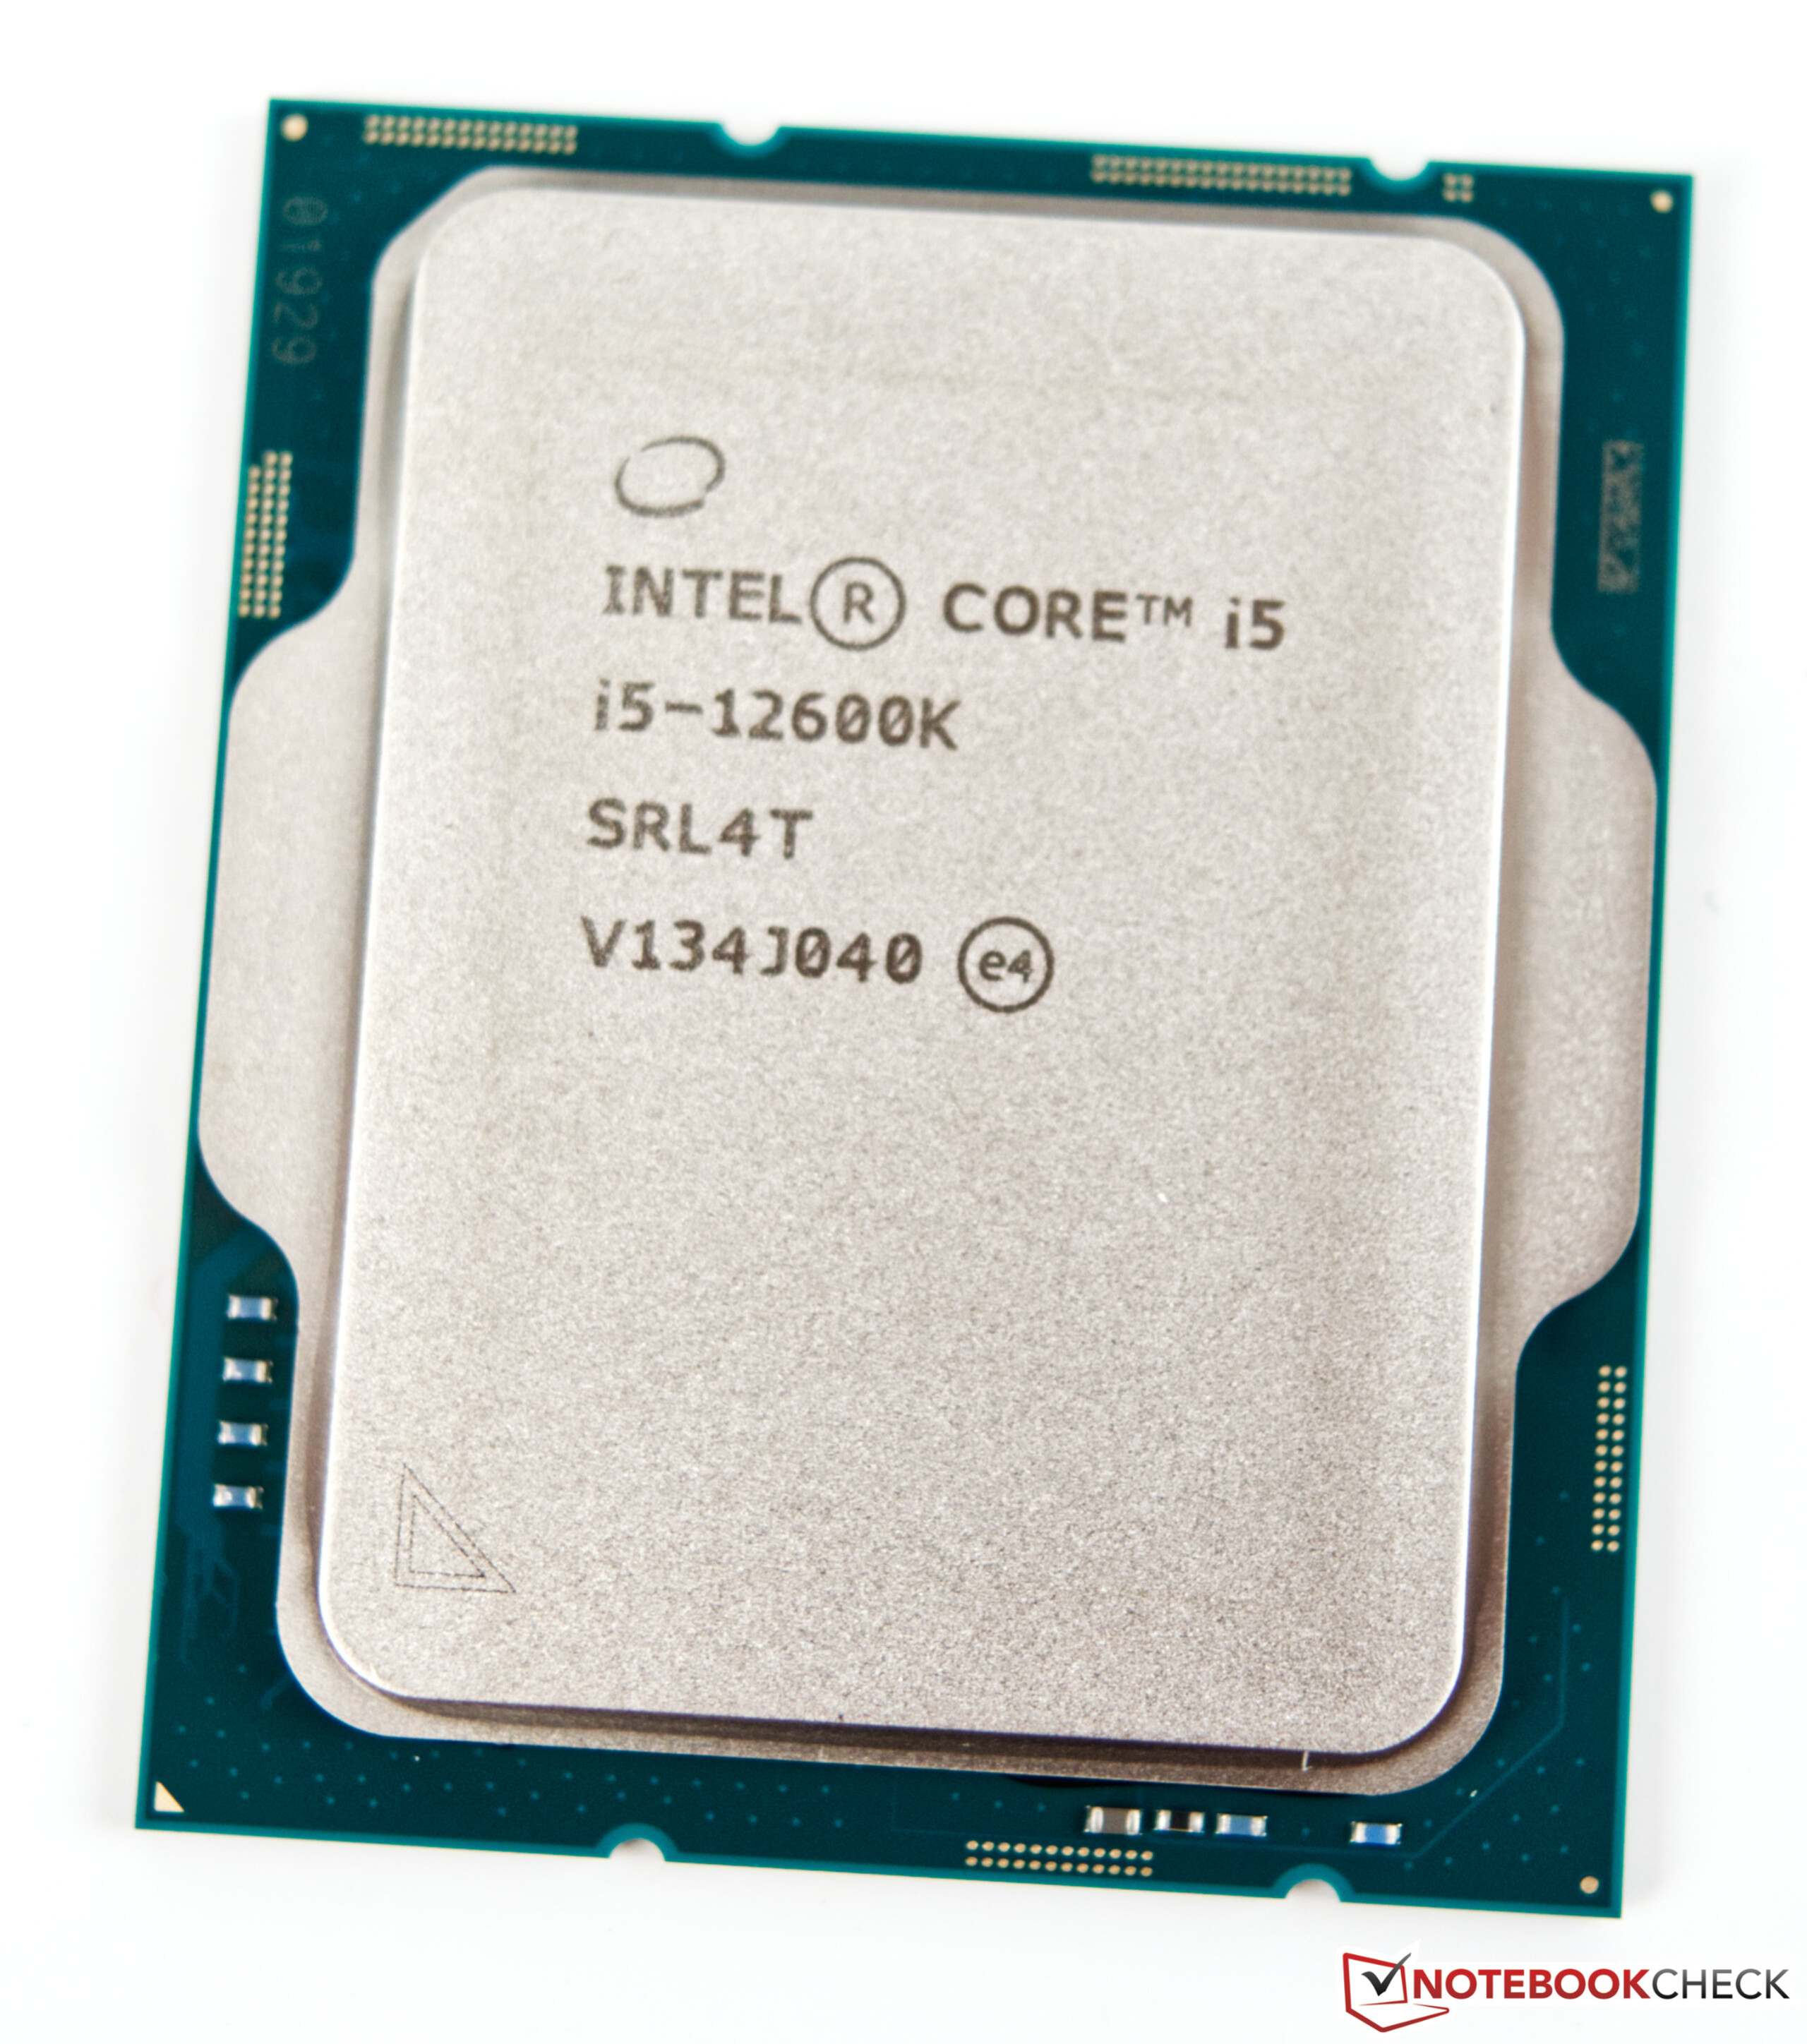
| Core i5-12600K | 10(6P + 4E) /16 | 3.7 GHz / 4.9 GHz | - | 2.8 GHz / 3.6 GHz | 9.5 + 20 MB | UHD770 | 125Watt | 150Watt | $ 289 |
| Core i5-12600KF | 10 (6P + 4E) /16 | 3,7 GHz / 4,9 GHz | - | 2,8 GHz / 3,6 GHz | 9,5 + 20 MB | - | 125 Watt | 150 Watt | $ 264 |
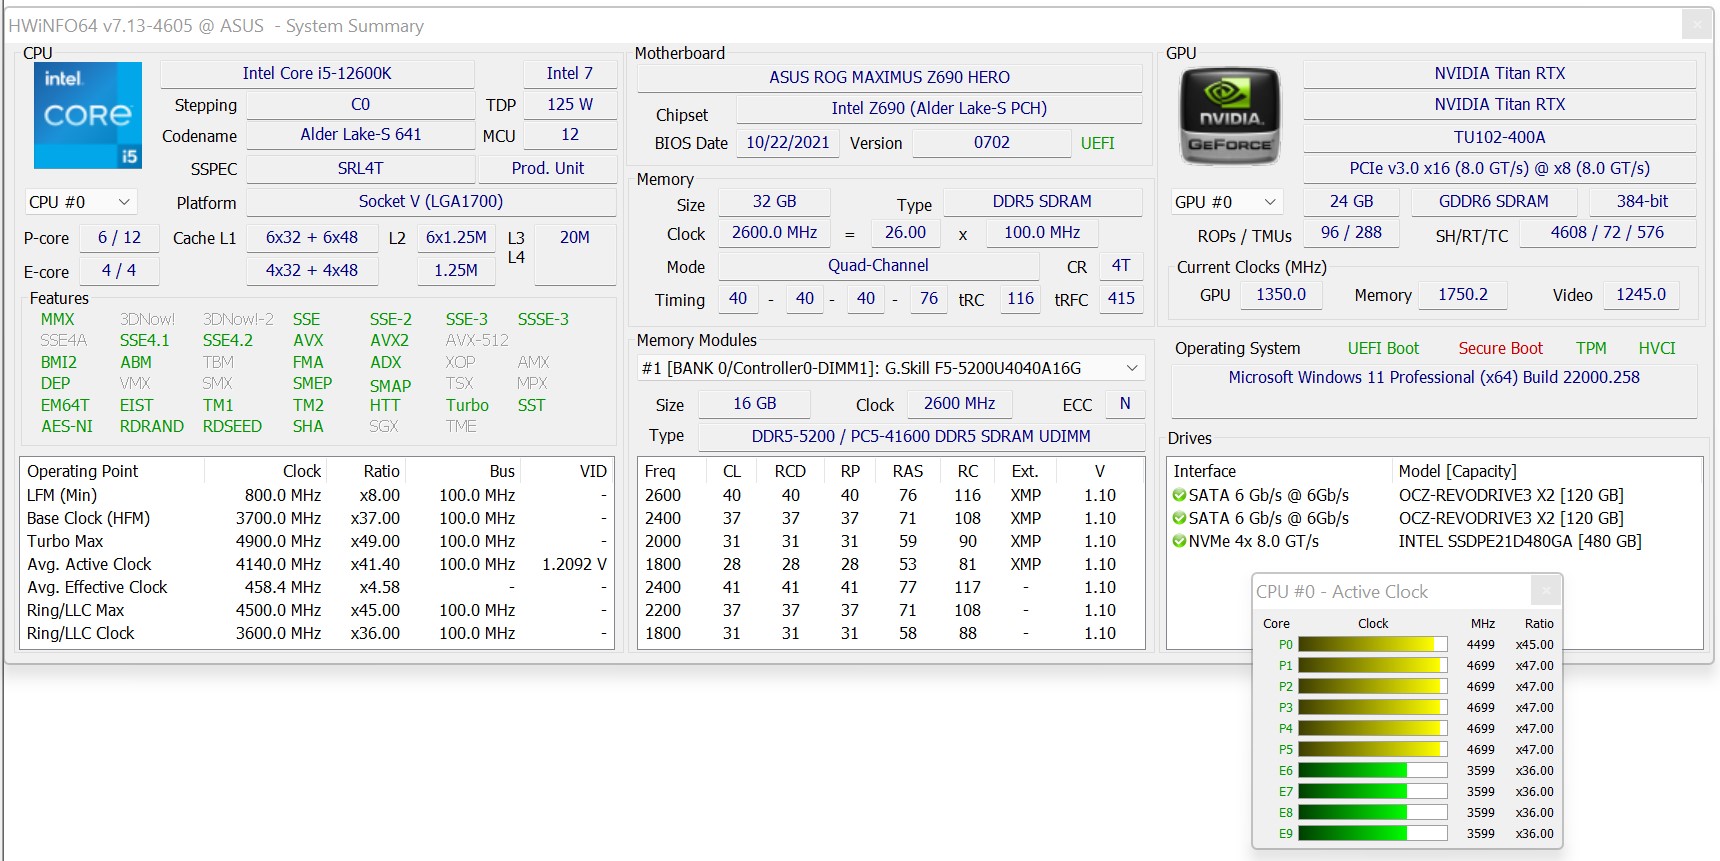
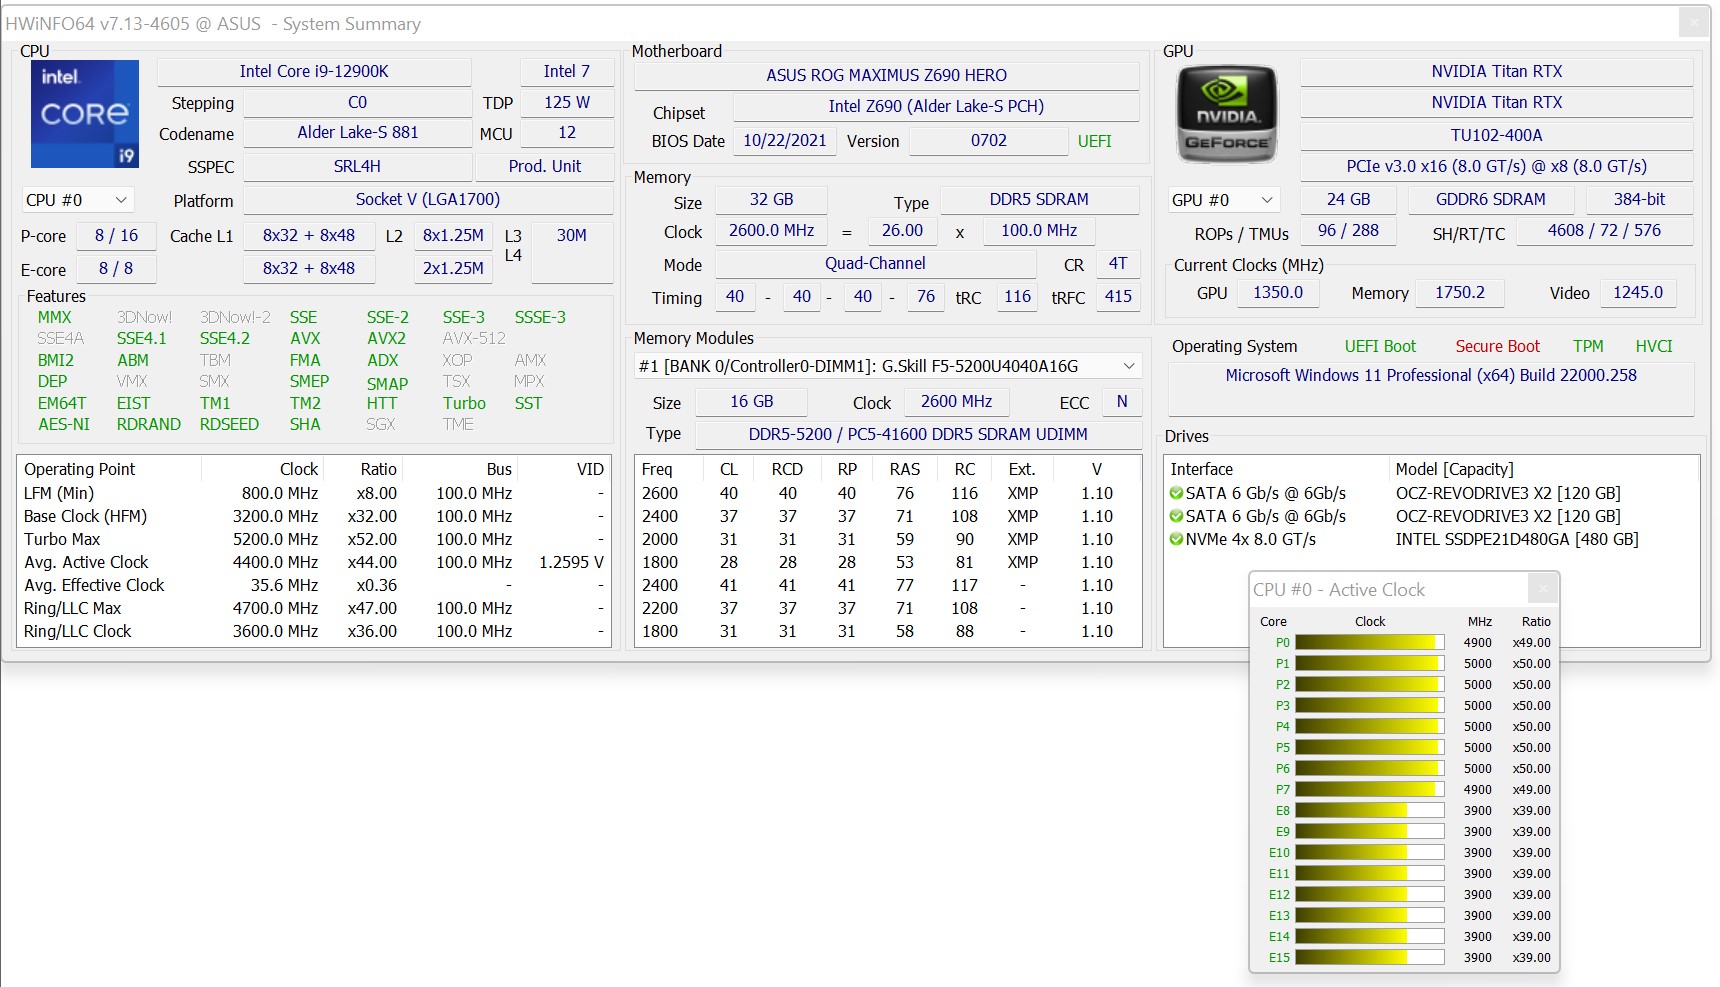
Details van ons testsysteem
We gebruiken het volgende systeem voor onze benchmarks en tests hieronder:
- Raijintek Pean Benchtafel
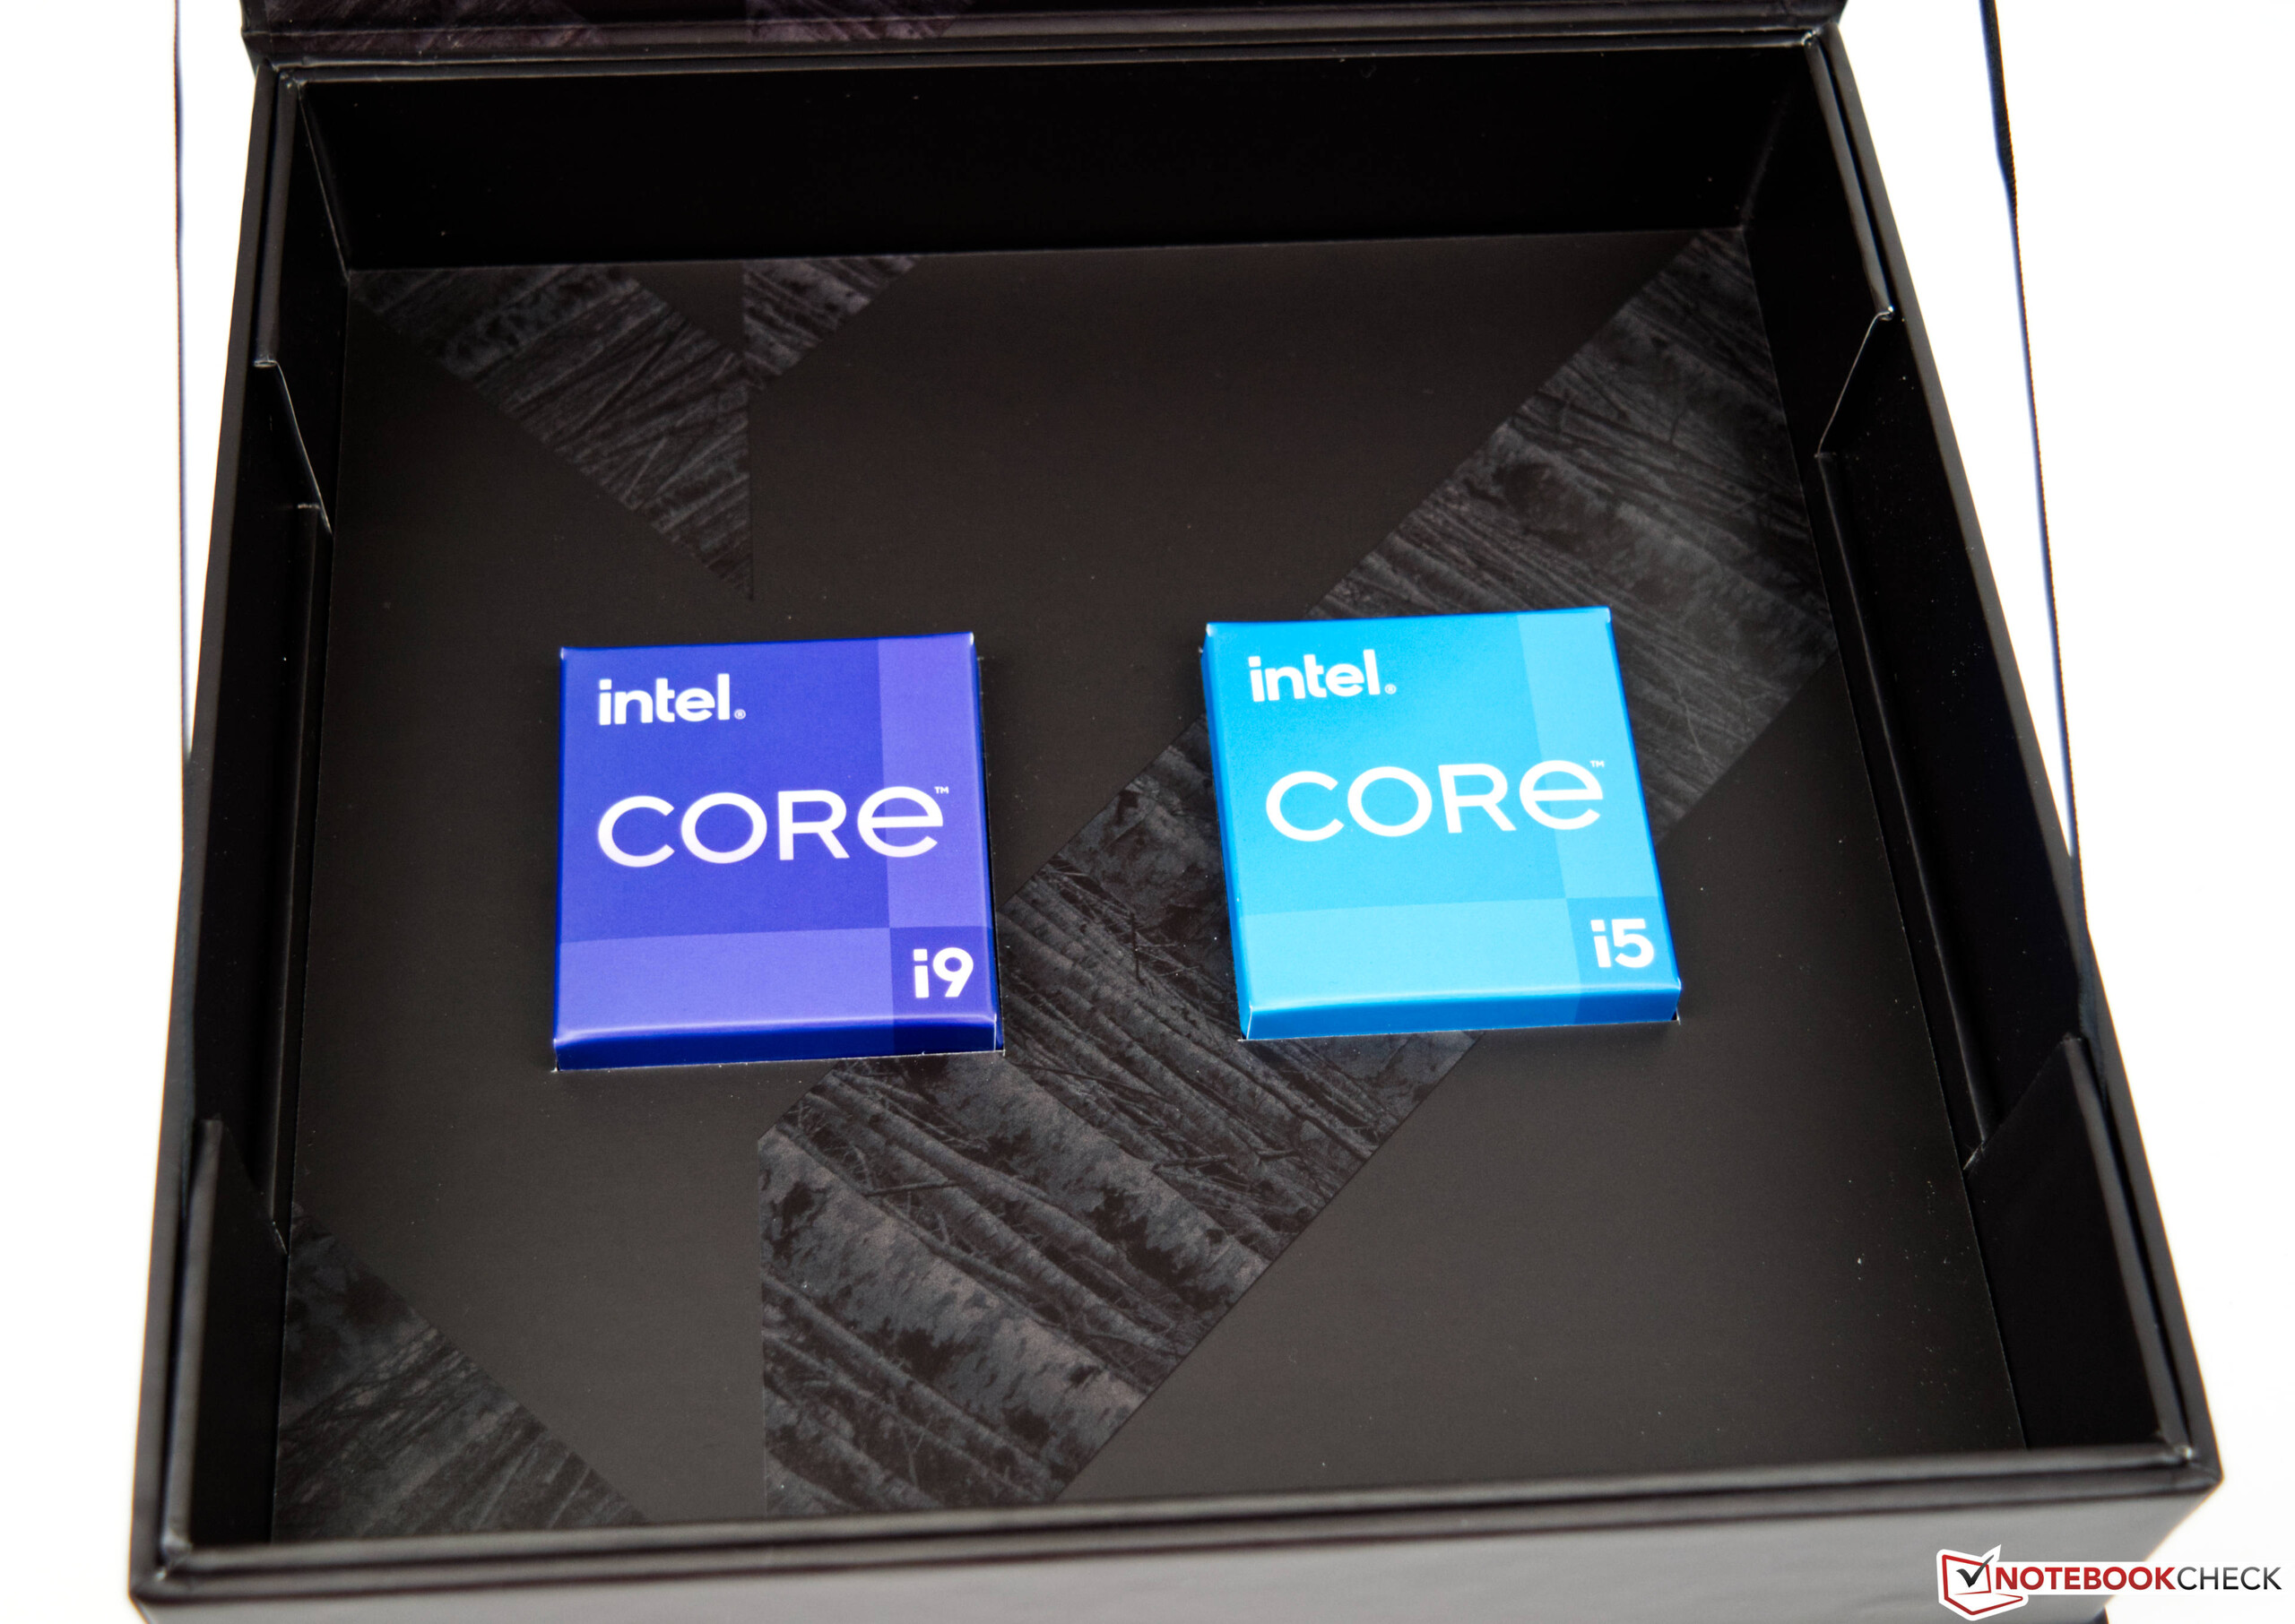
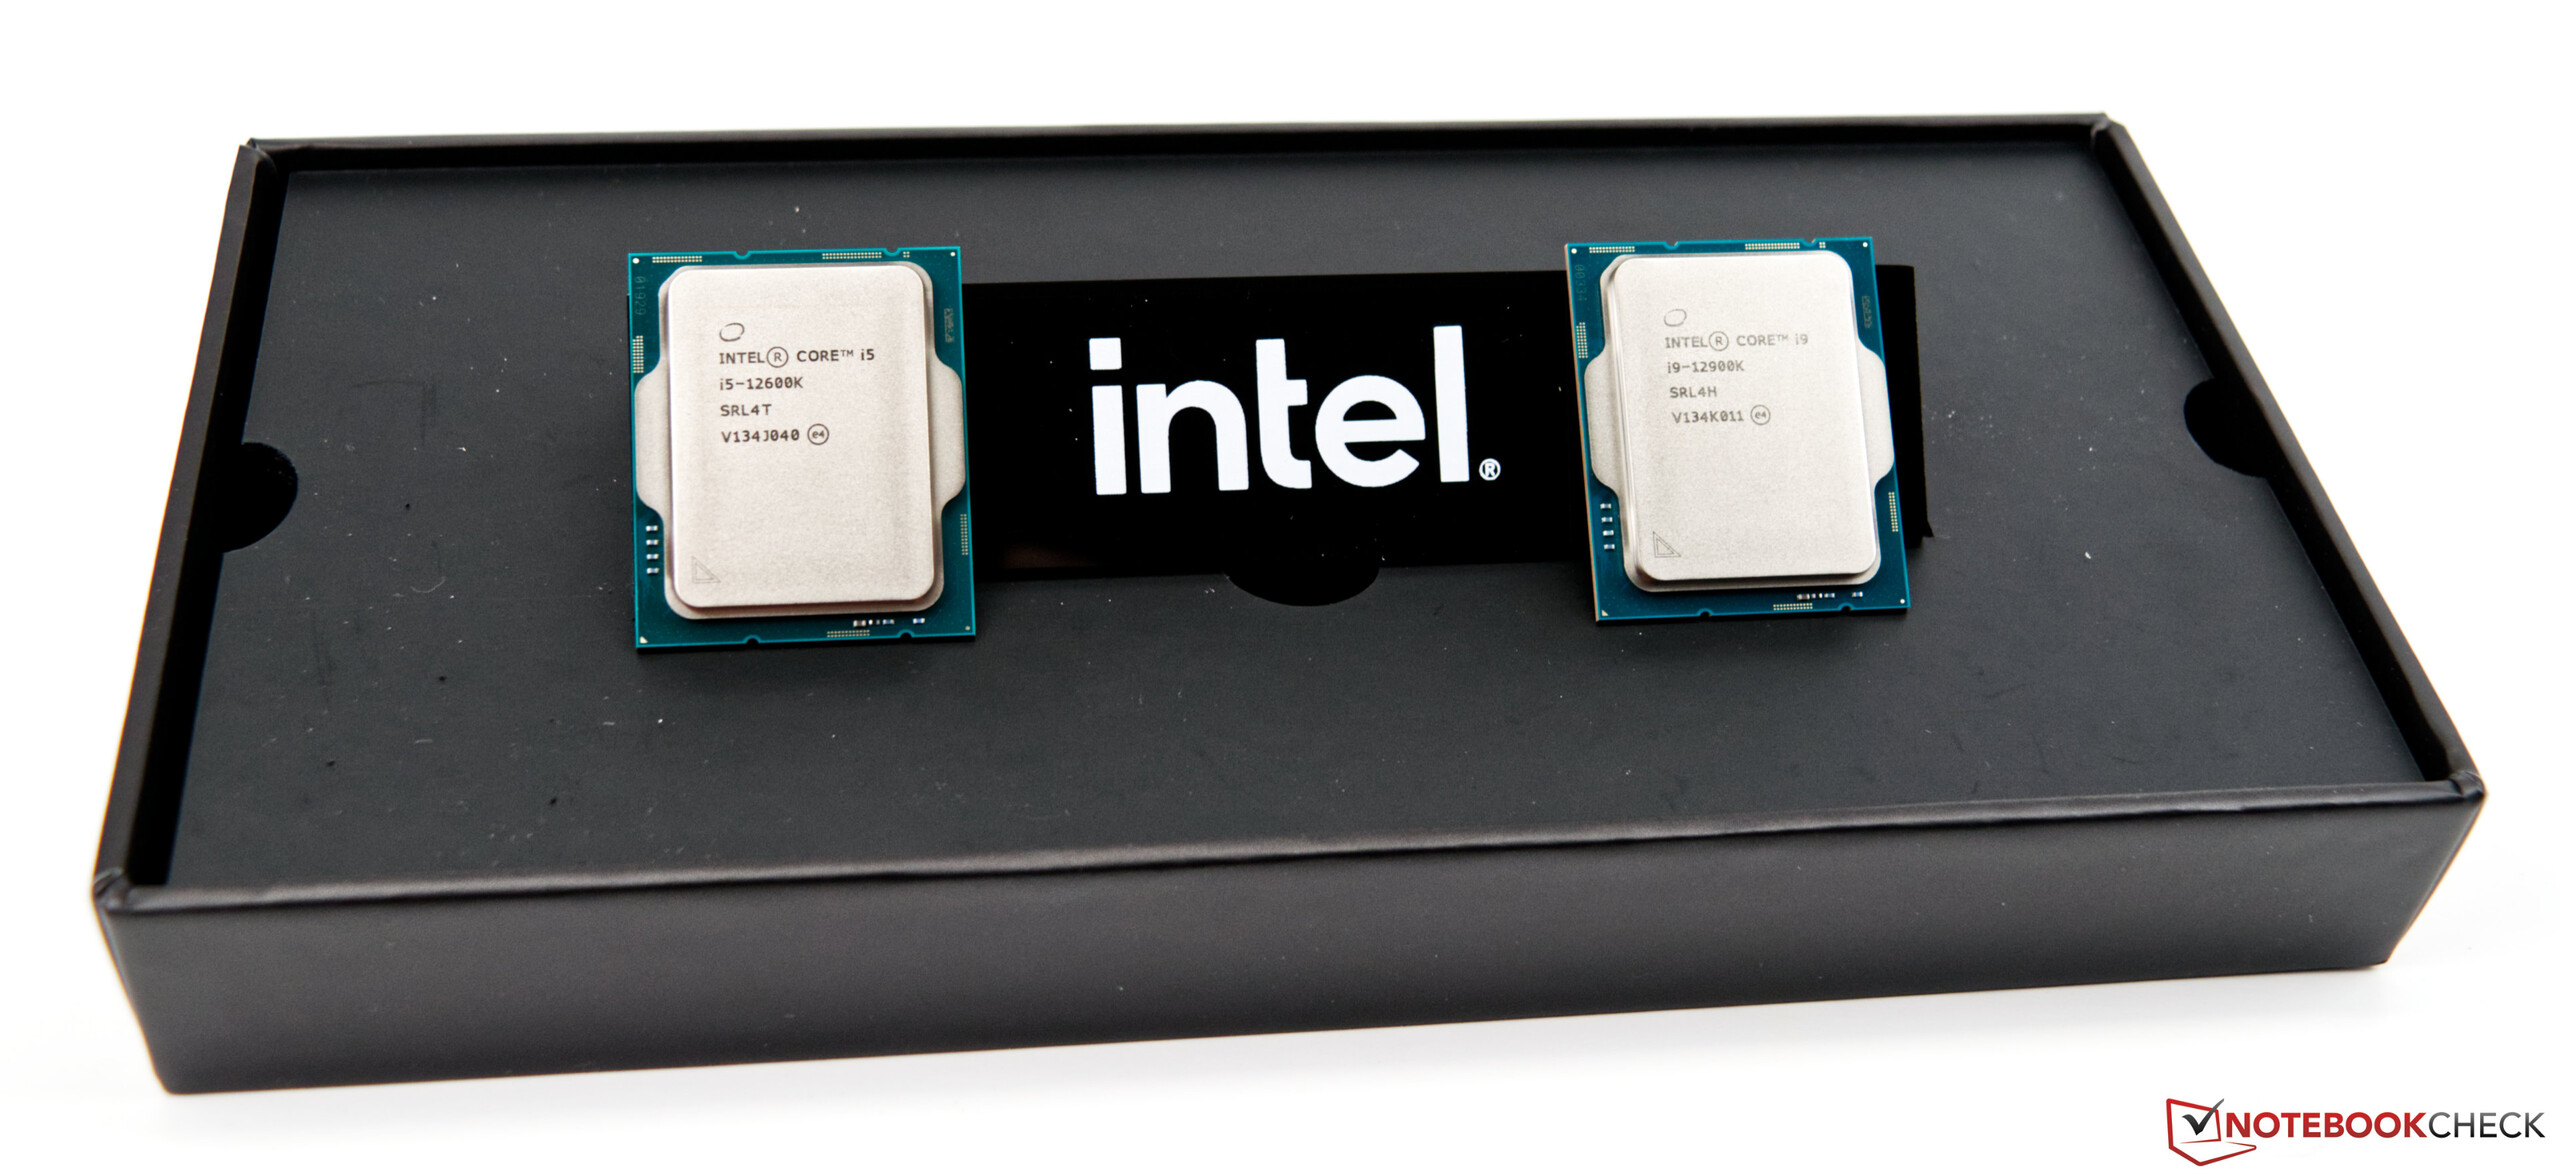
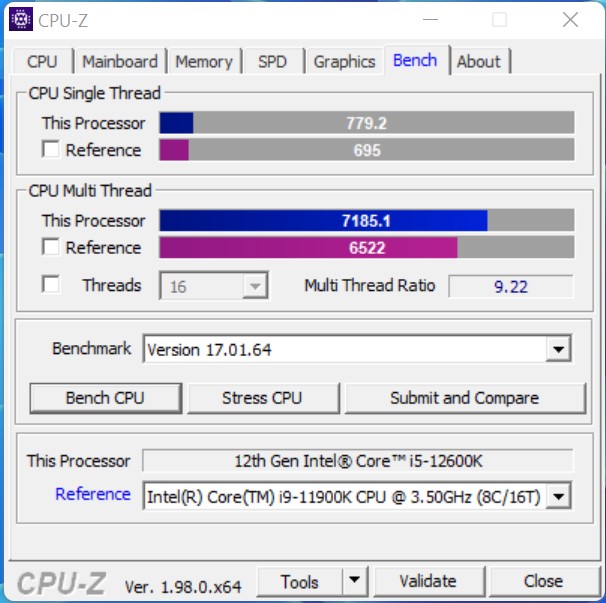
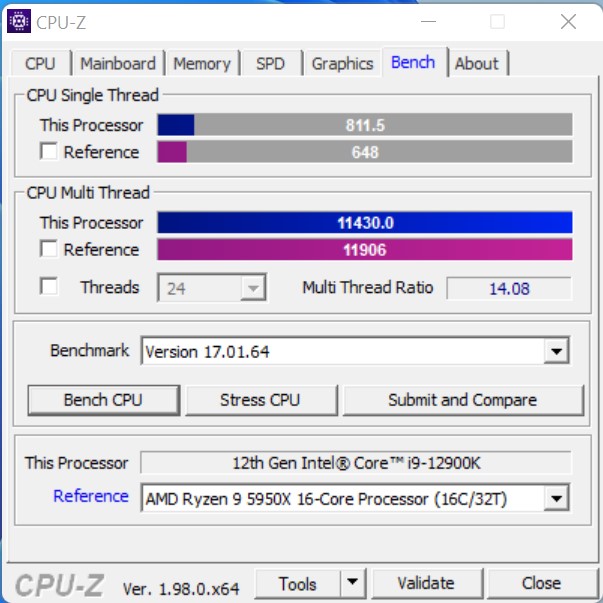
- Intel Core i9-12900K, Intel Core i5-12600K
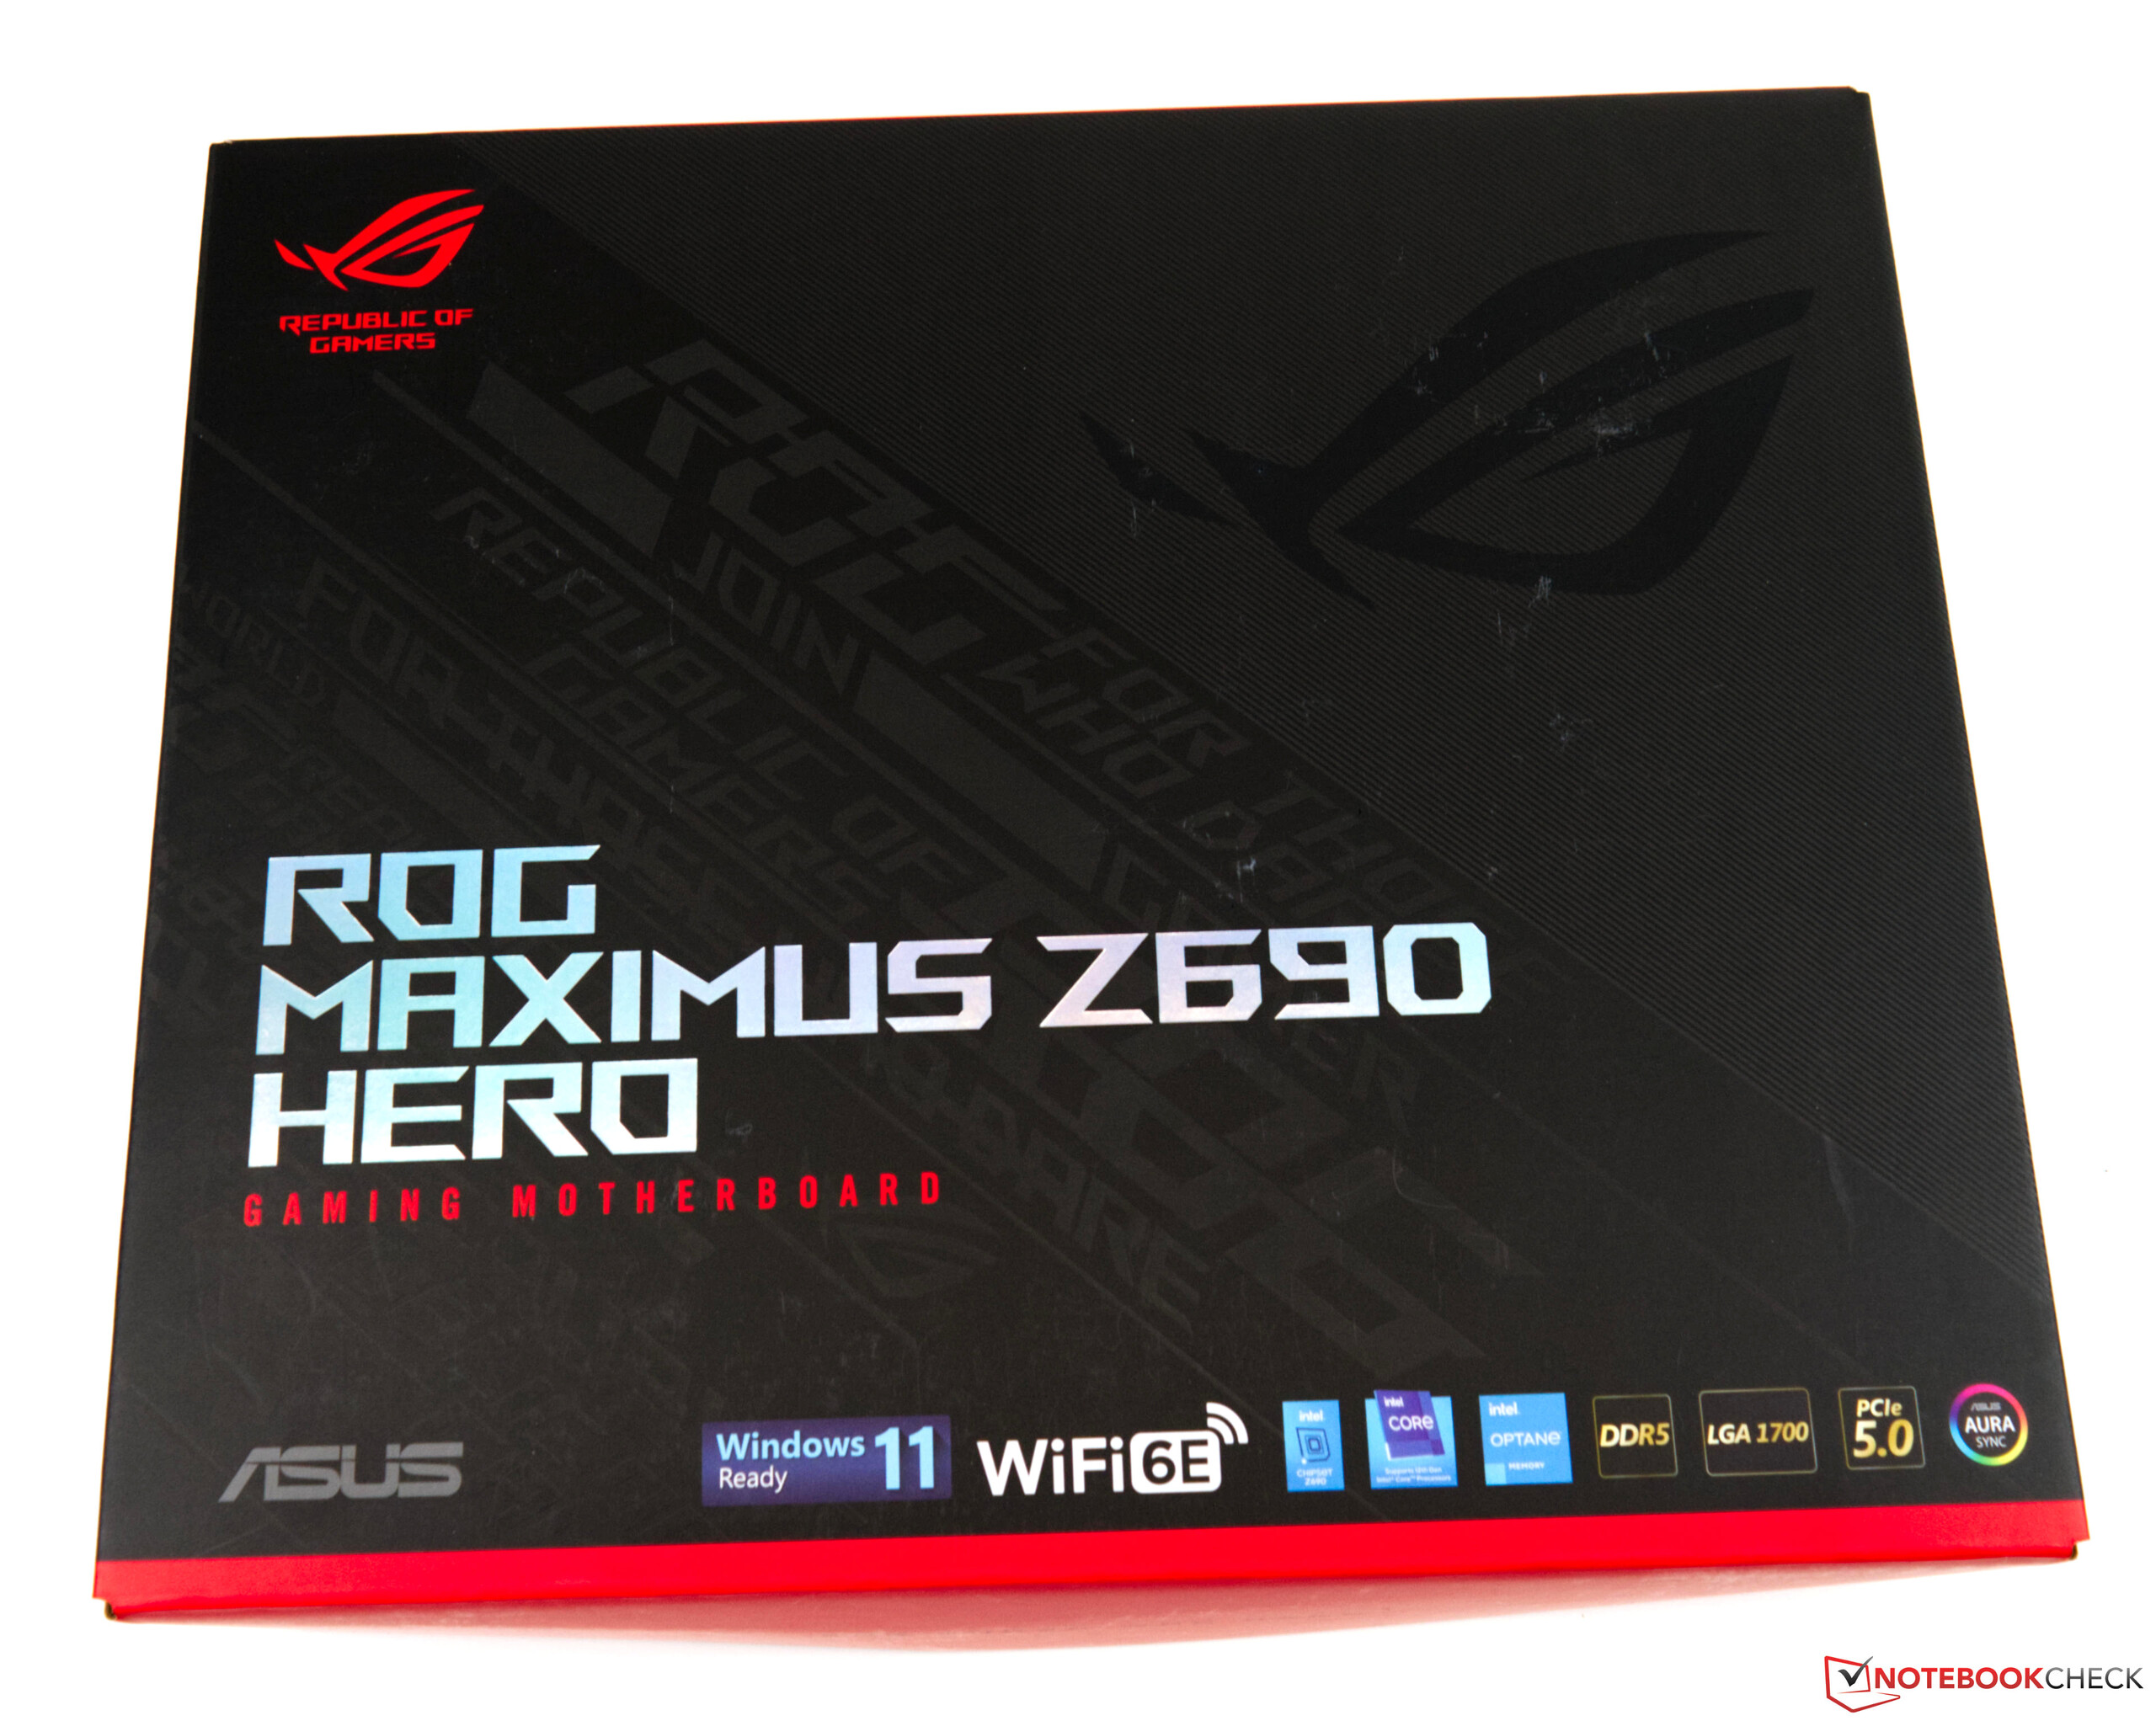
- Asus ROG Maximus Z690 Hero
- Alphacool Eisbear Aurora 280 AiO
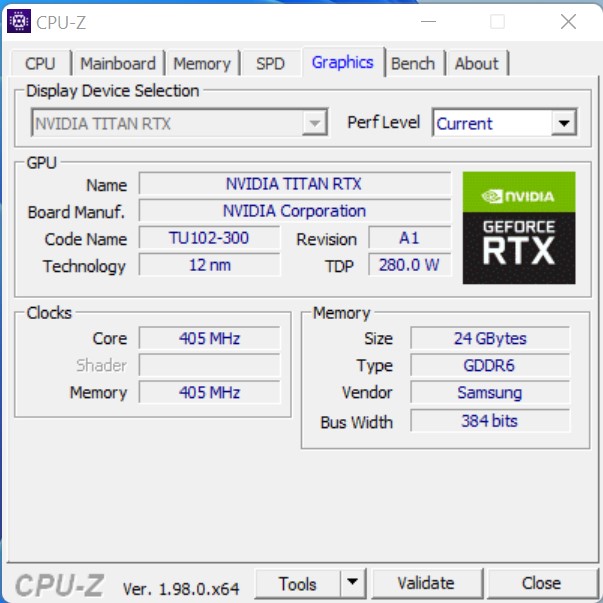
- Nvidia Titan RTX
- Corsair HX 1200X voeding
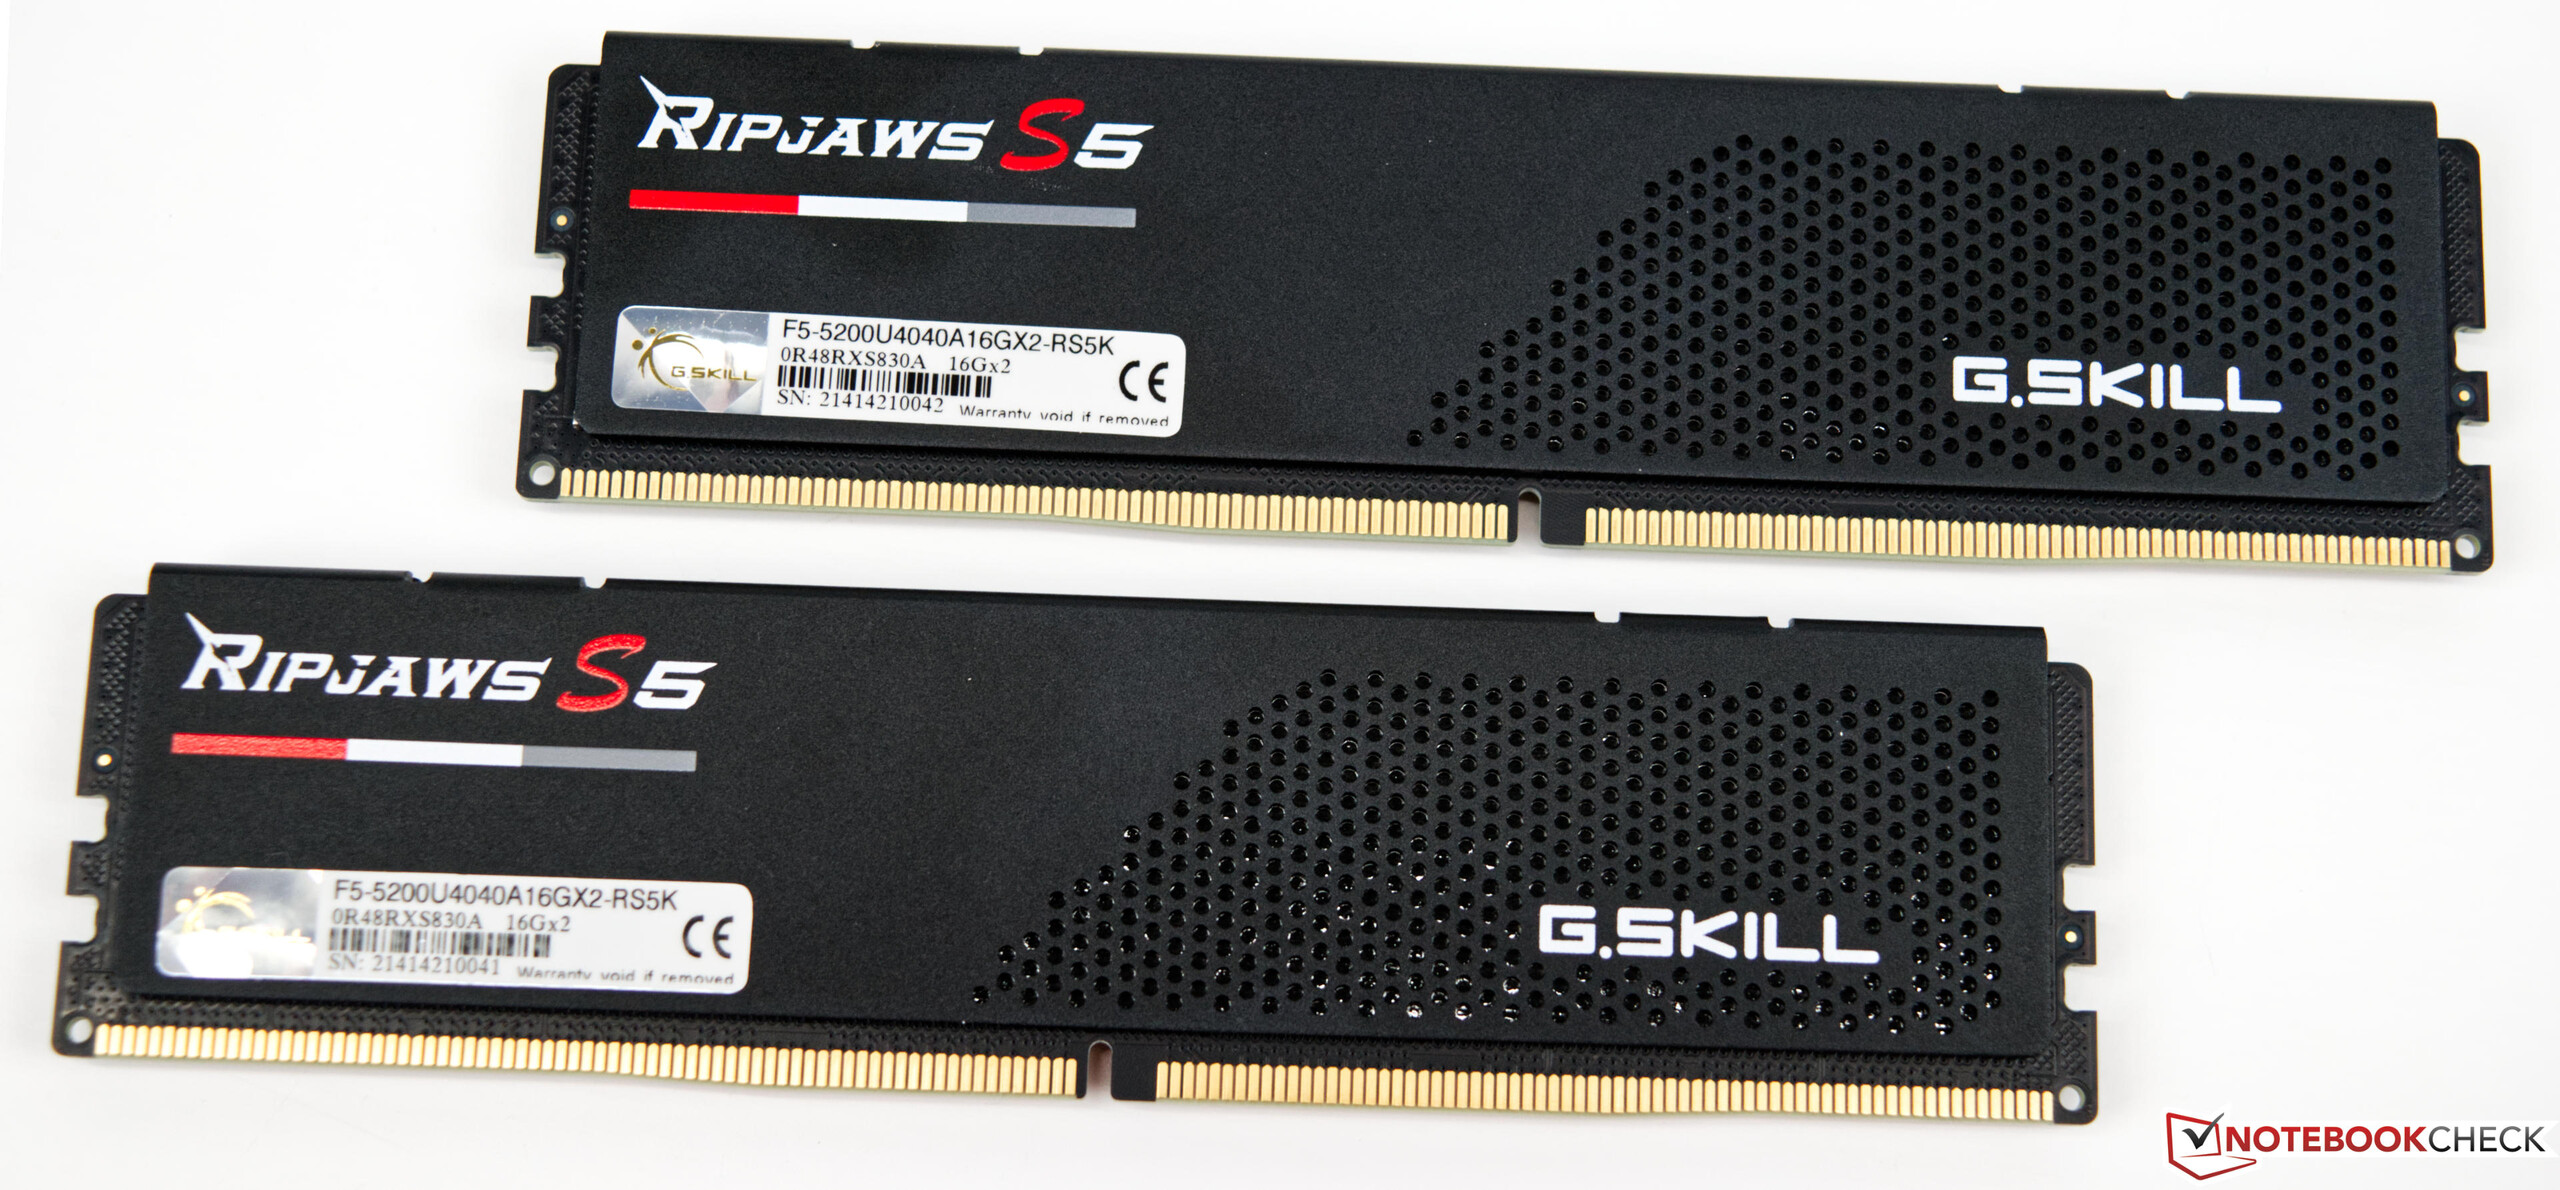
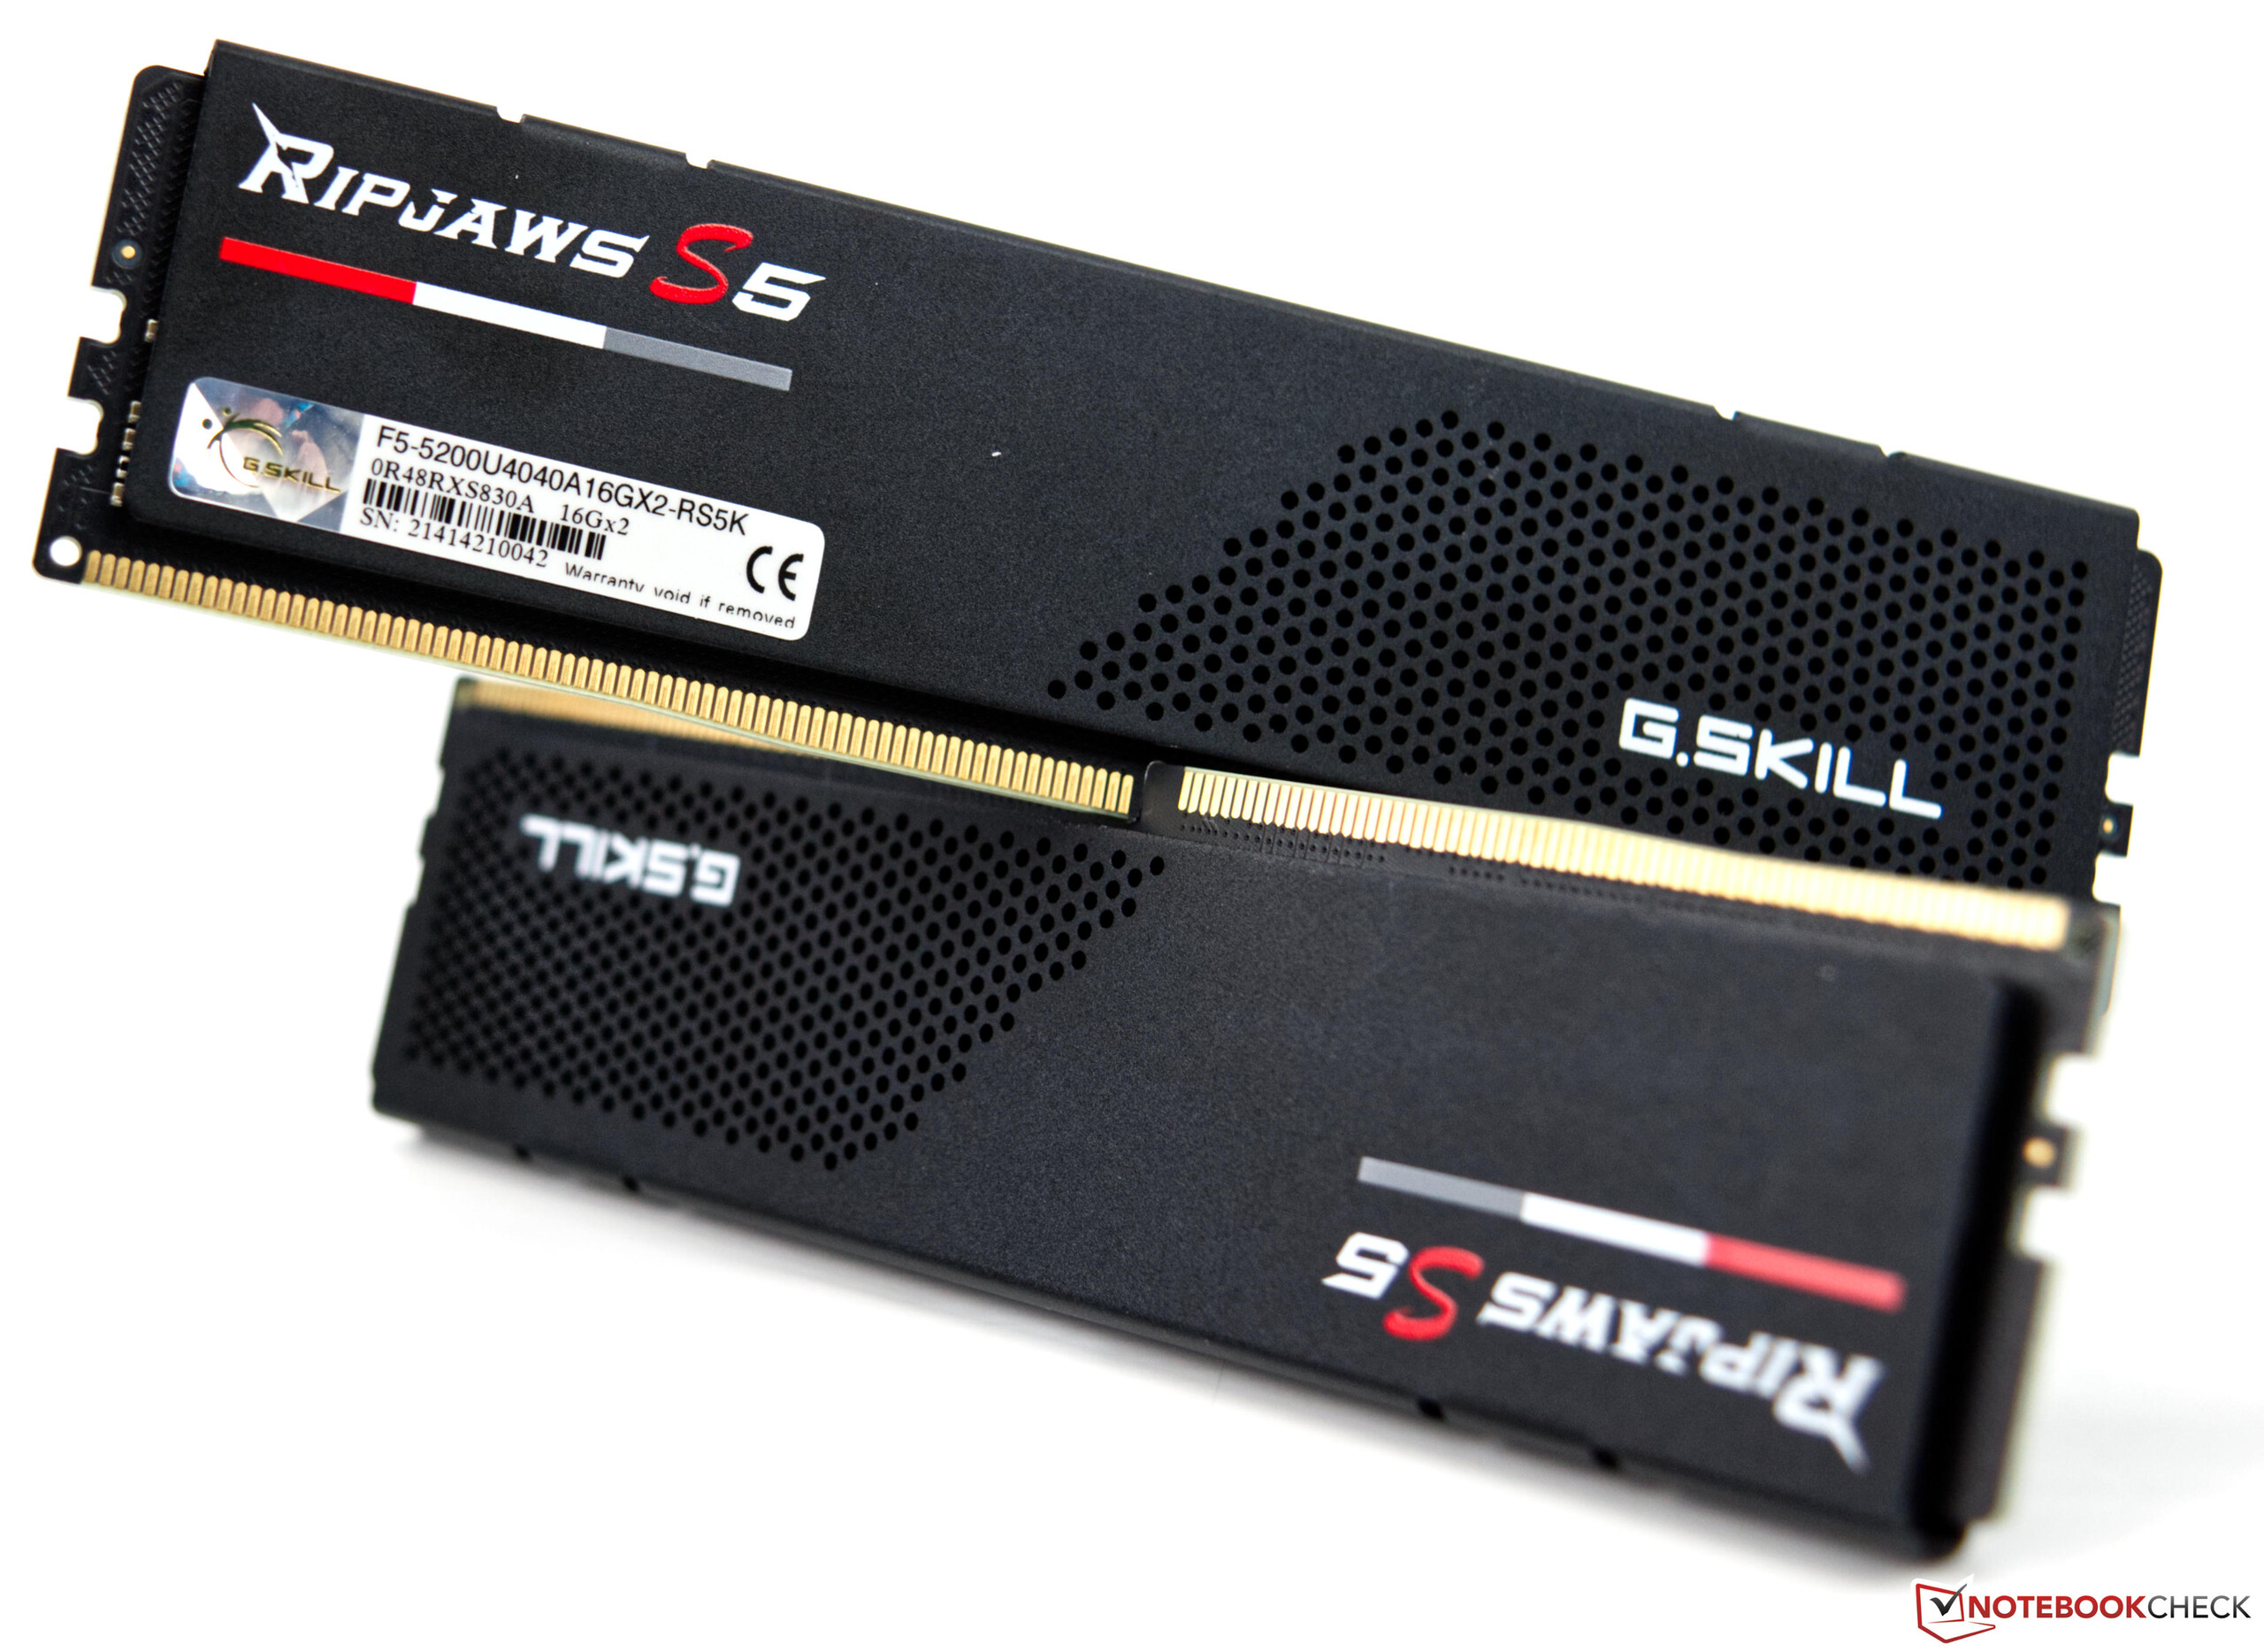
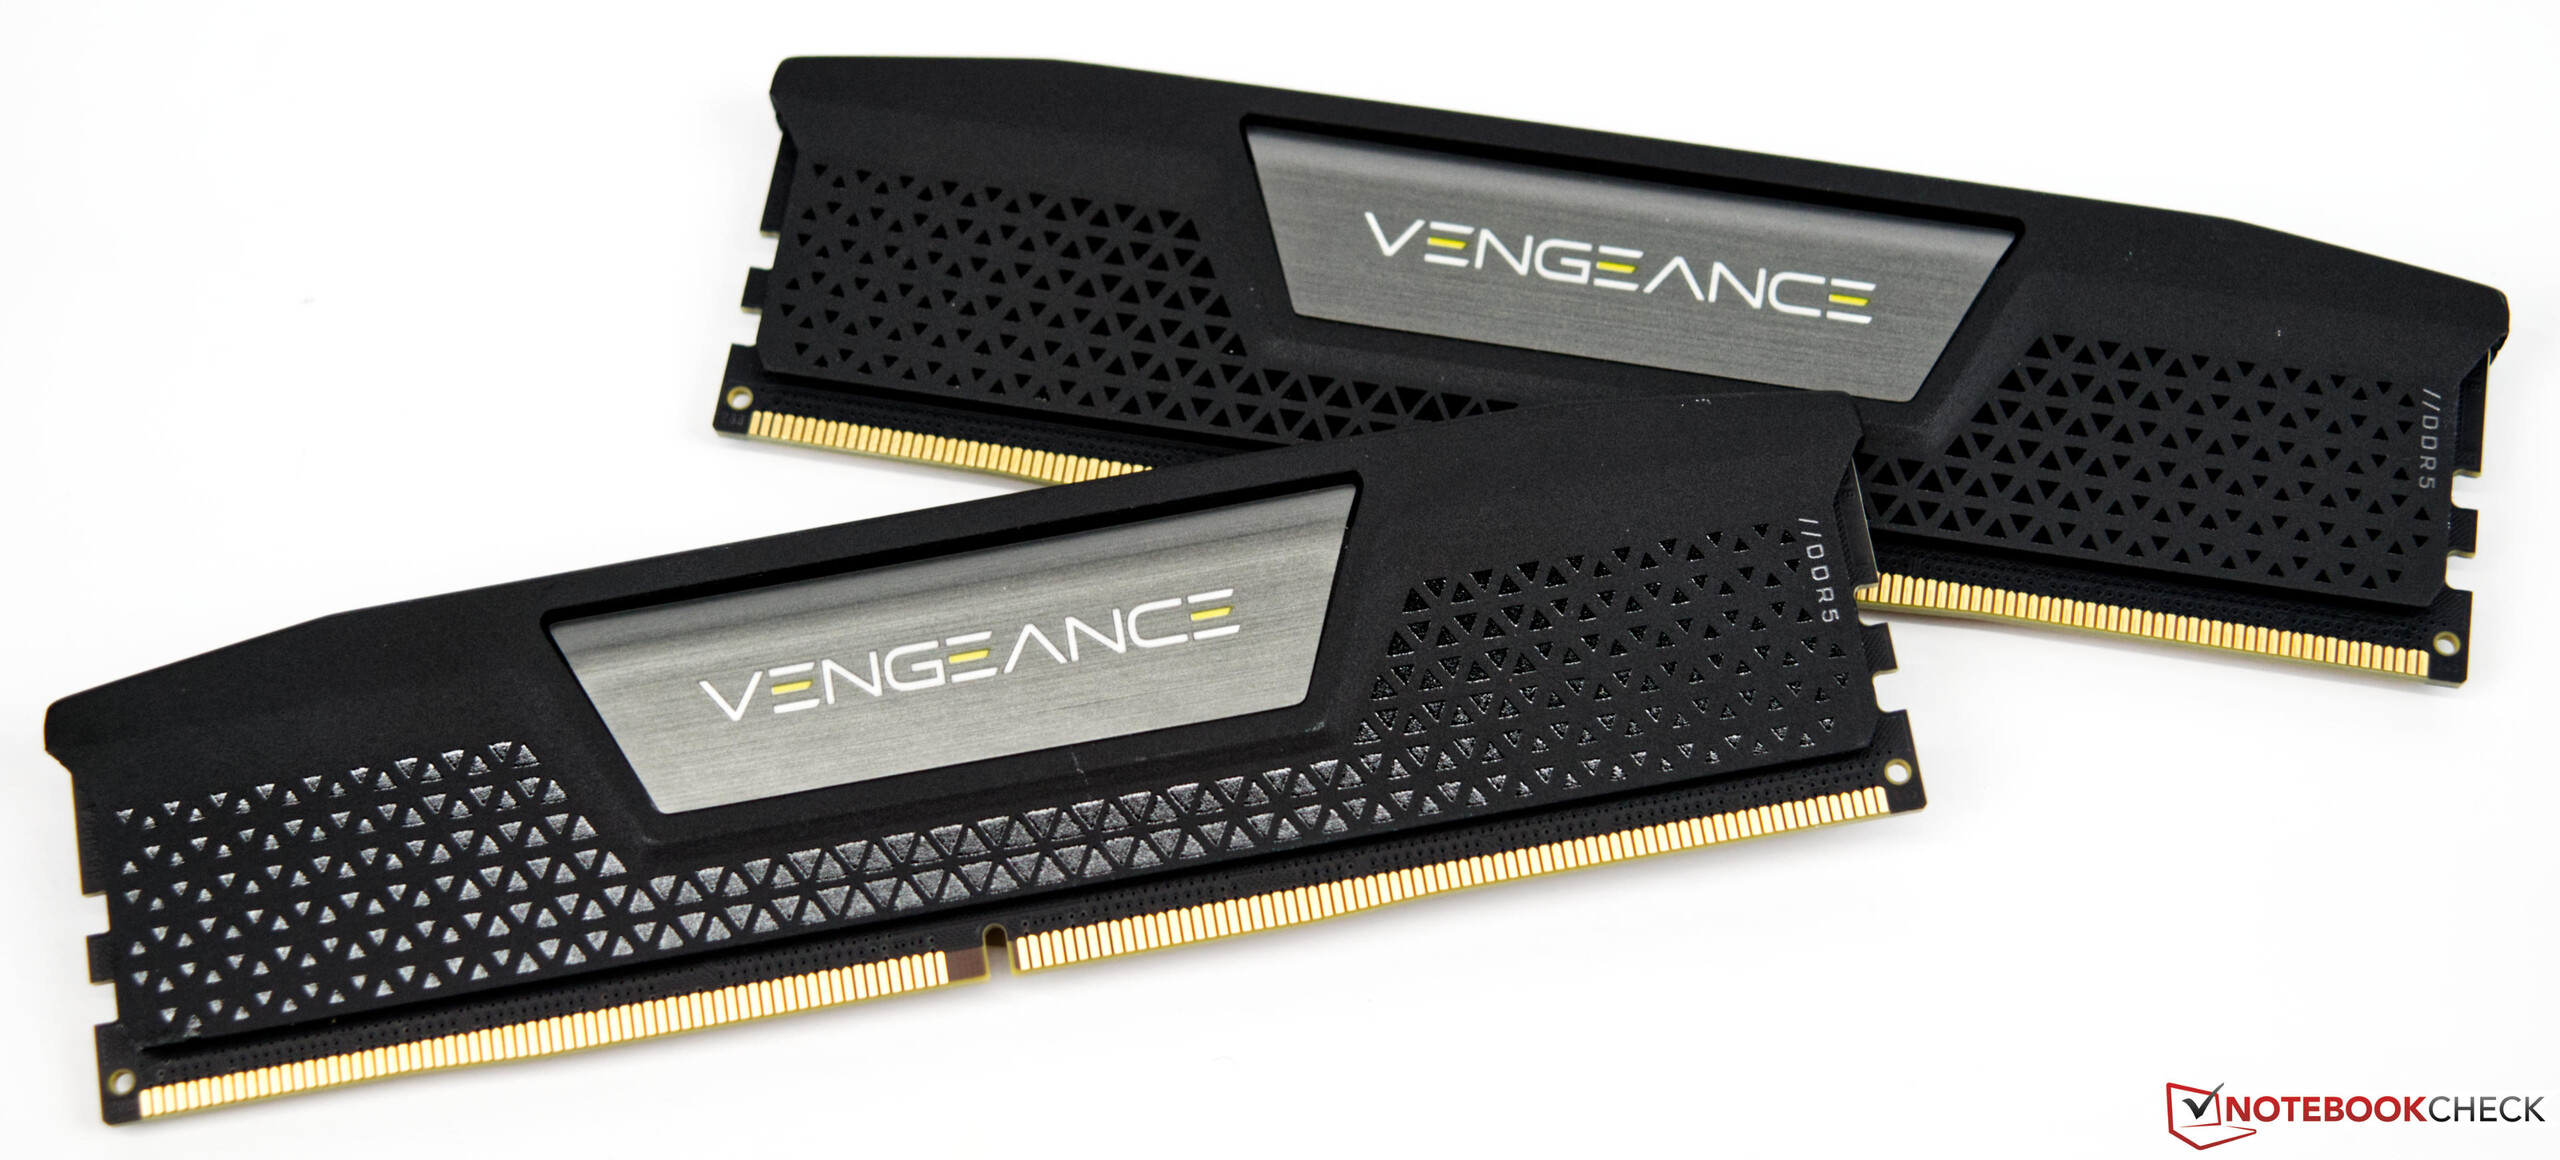
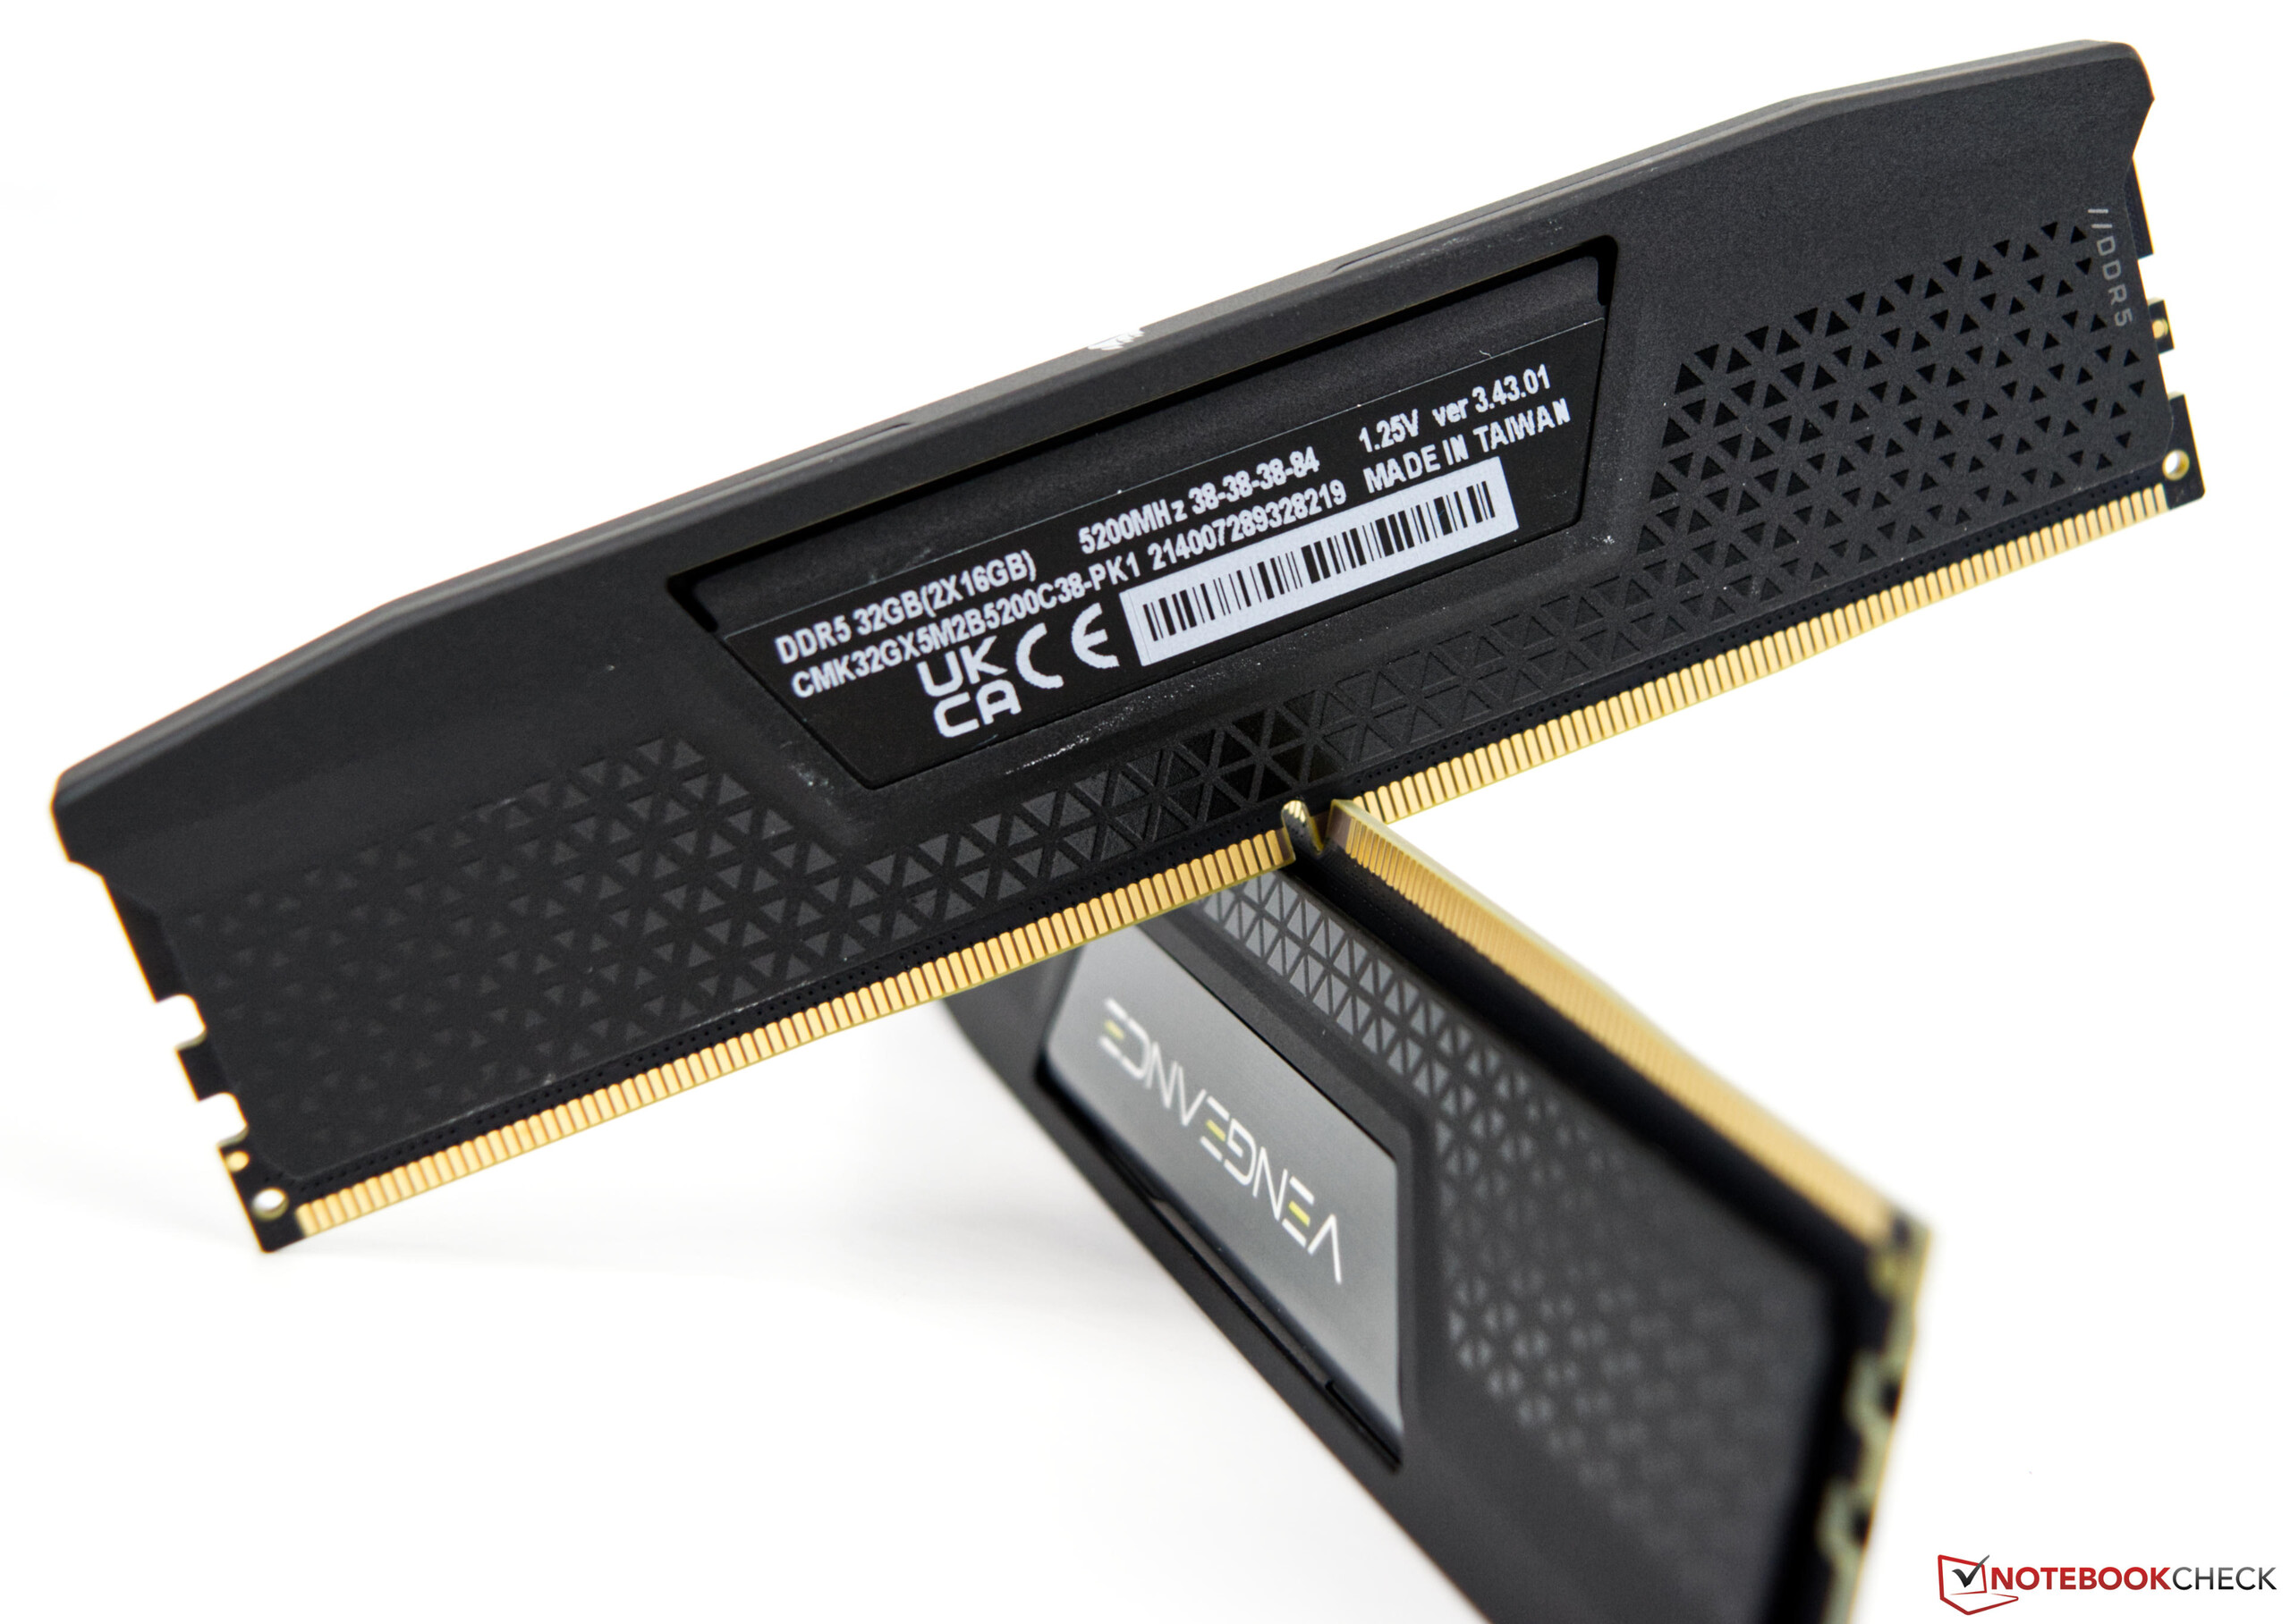
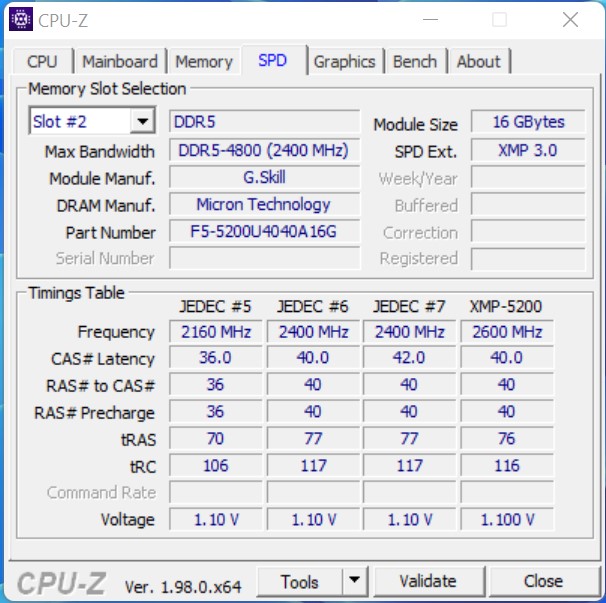
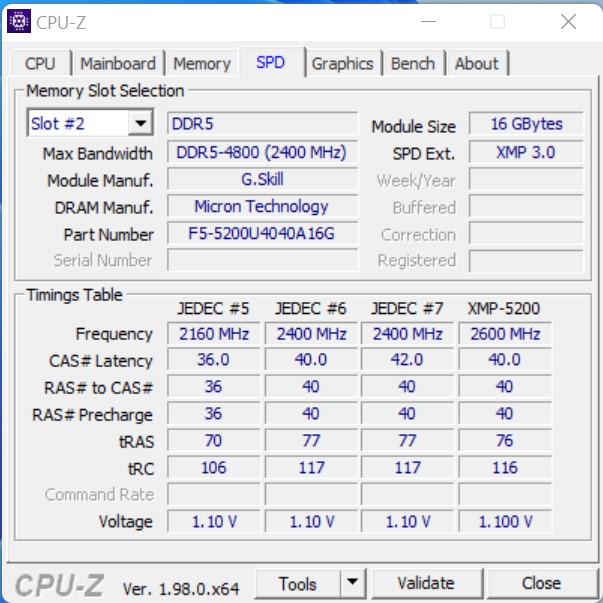
- G.Skill Ripjaws S5 (2x 16GB - DDR5-5200) / Corsair Vengeance (2x 16GB - DDR5-5200)
- Intel Optane 905p (480 GB systeem + benchmarks)
- OCZ Revodrive (480 GB voor games)
- Microsoft Windows 11 Professional 64-Bit (versie 21H2)
De twee processoren komen rechtstreeks van Intel. G.Skill en ook Corsair leverden het gloednieuwe DDR5 werkgeheugen voor ons, en het nieuwe Z690 moederbordkomt rechtstreeks van Asus. Caseking ondersteunt ons met de Raijintek Pean Showcase, en als koeling gebruiken we de Alphacool Eisbear Aurora 280 AiOdie ons ter beschikking is gesteld door Alphacool.
Belangrijke opmerking
Alle benchmarks zijn uitgevoerd op een vers geïnstalleerd Windows 11 systeem. De meest recente Bios versie werd ons door Asus ter beschikking gesteld. Wat belangrijk is om te weten is dat met de standaard instellingen PL1 en PL2 gelijk zijn, wat betekent dat de CPU altijd de maximale prestaties kan halen zonder enige beperkingen. We hebben de standaard instellingen gebruikt voor deze review.

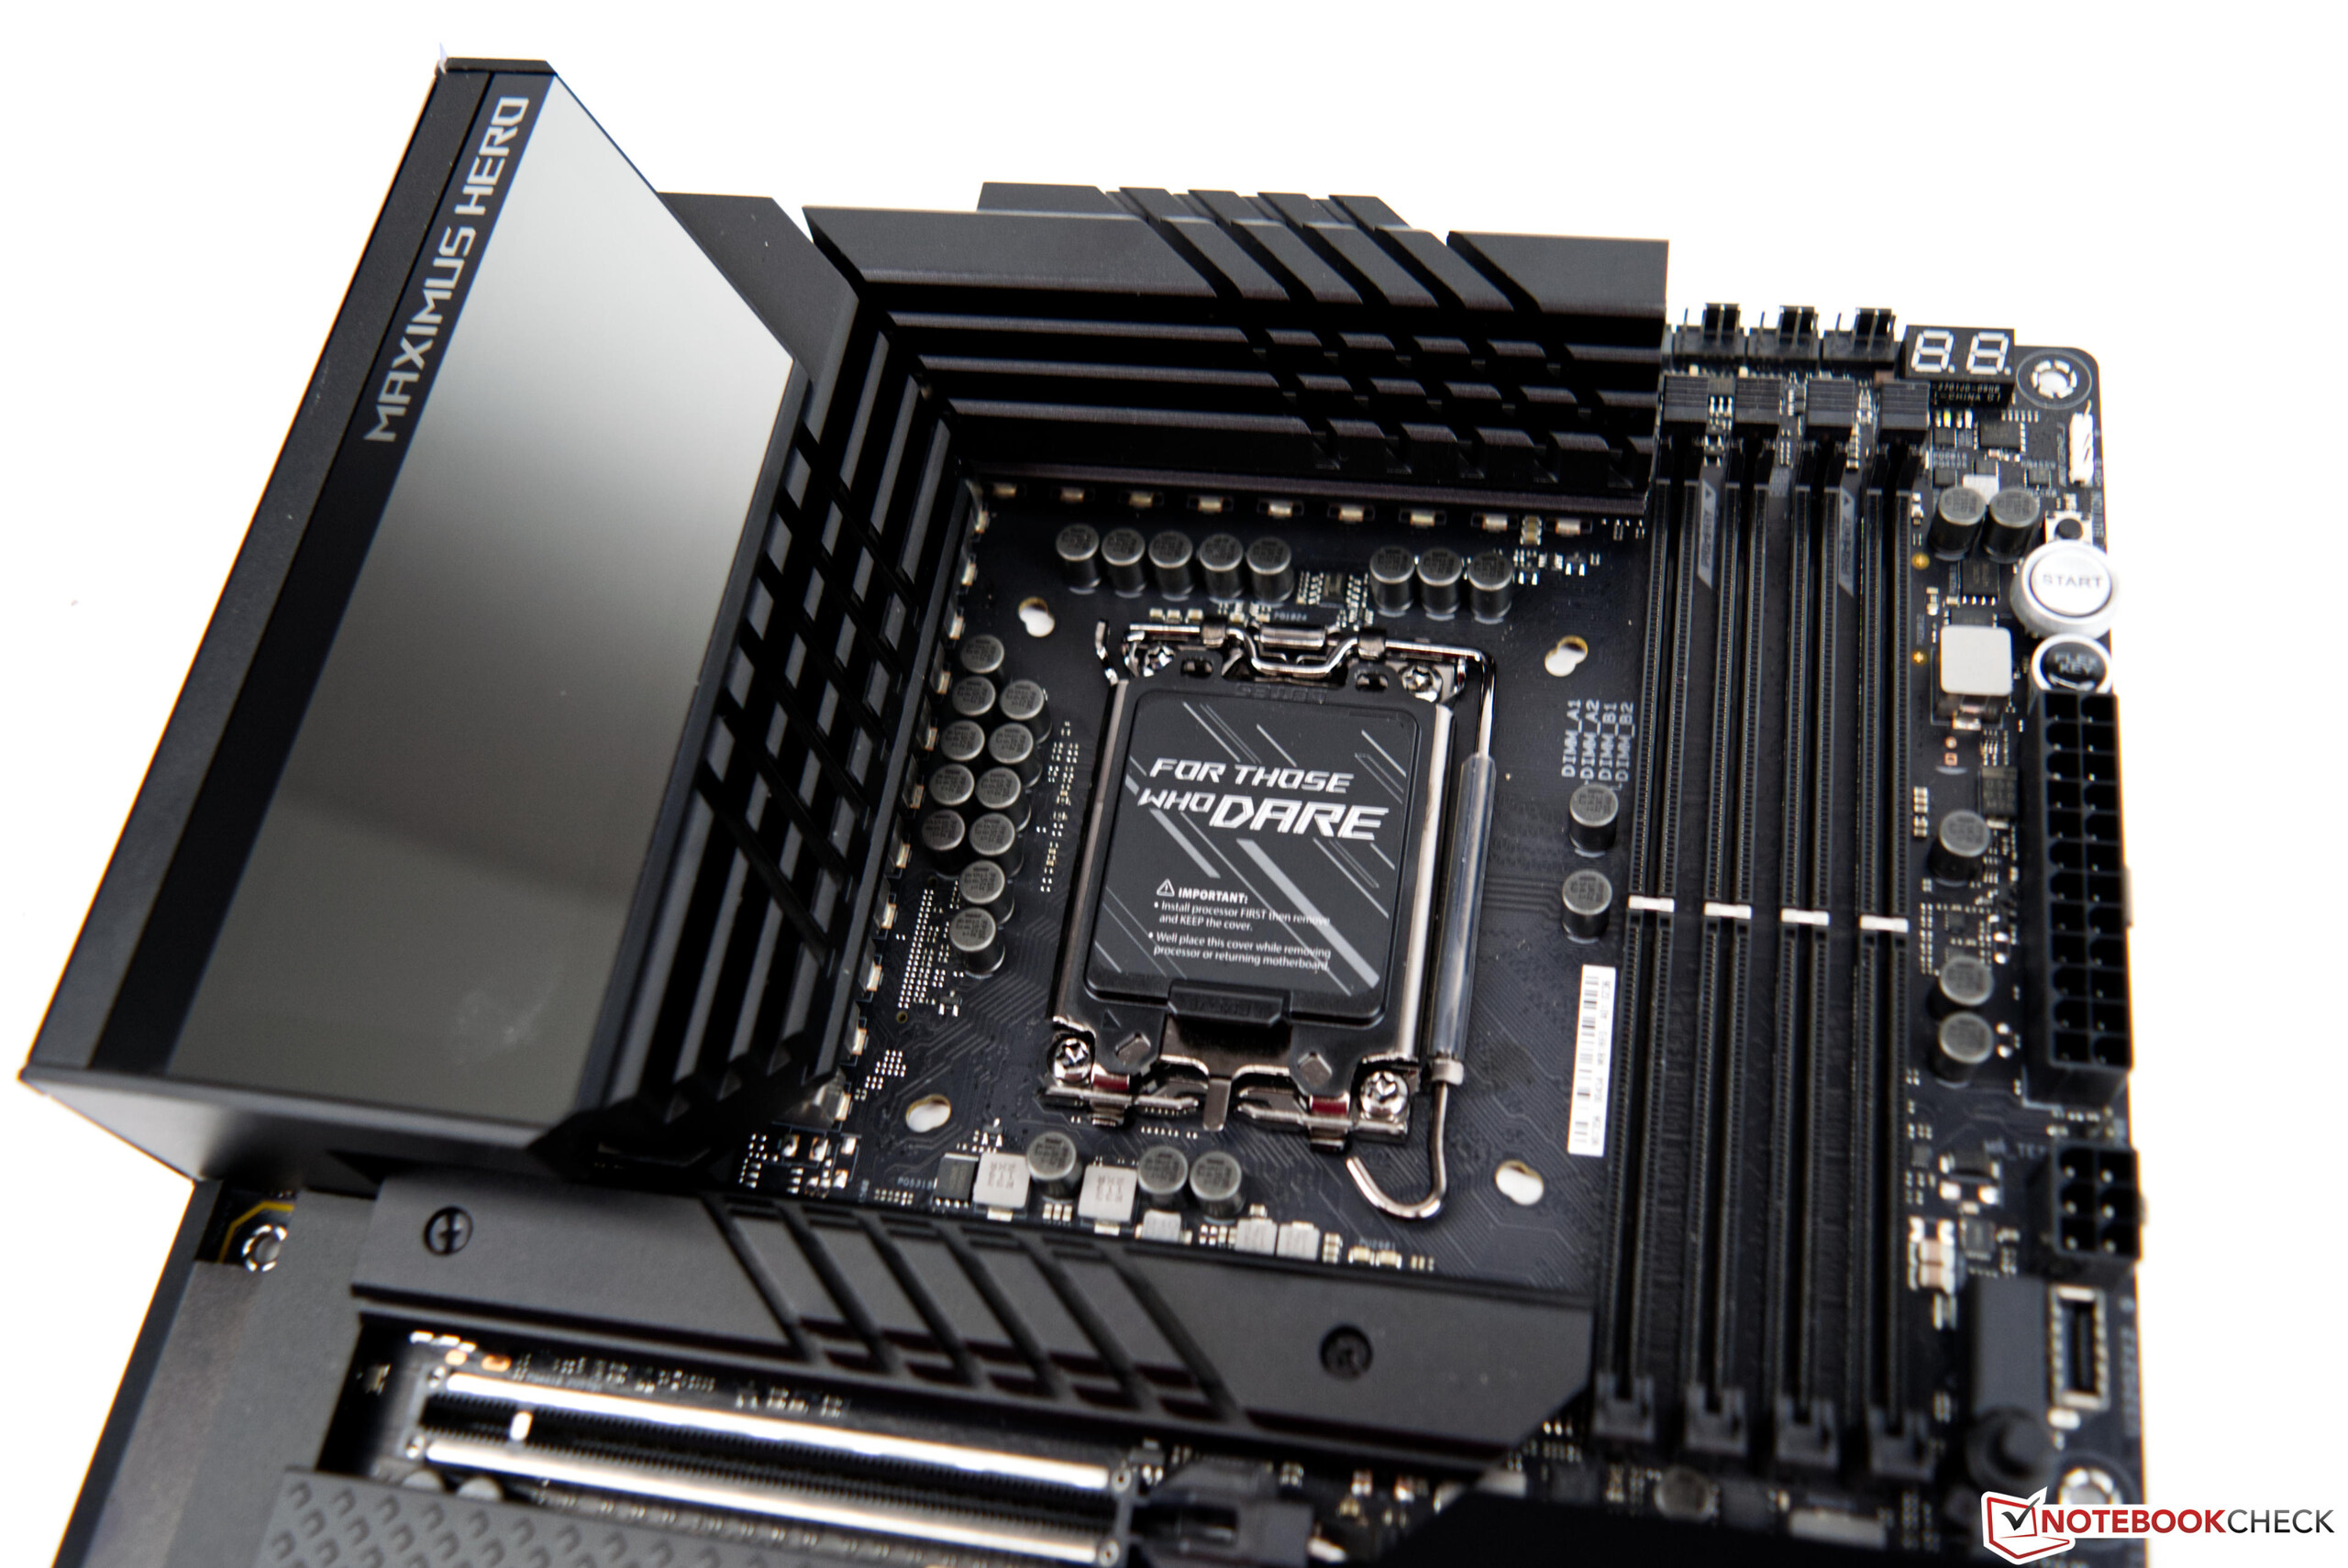
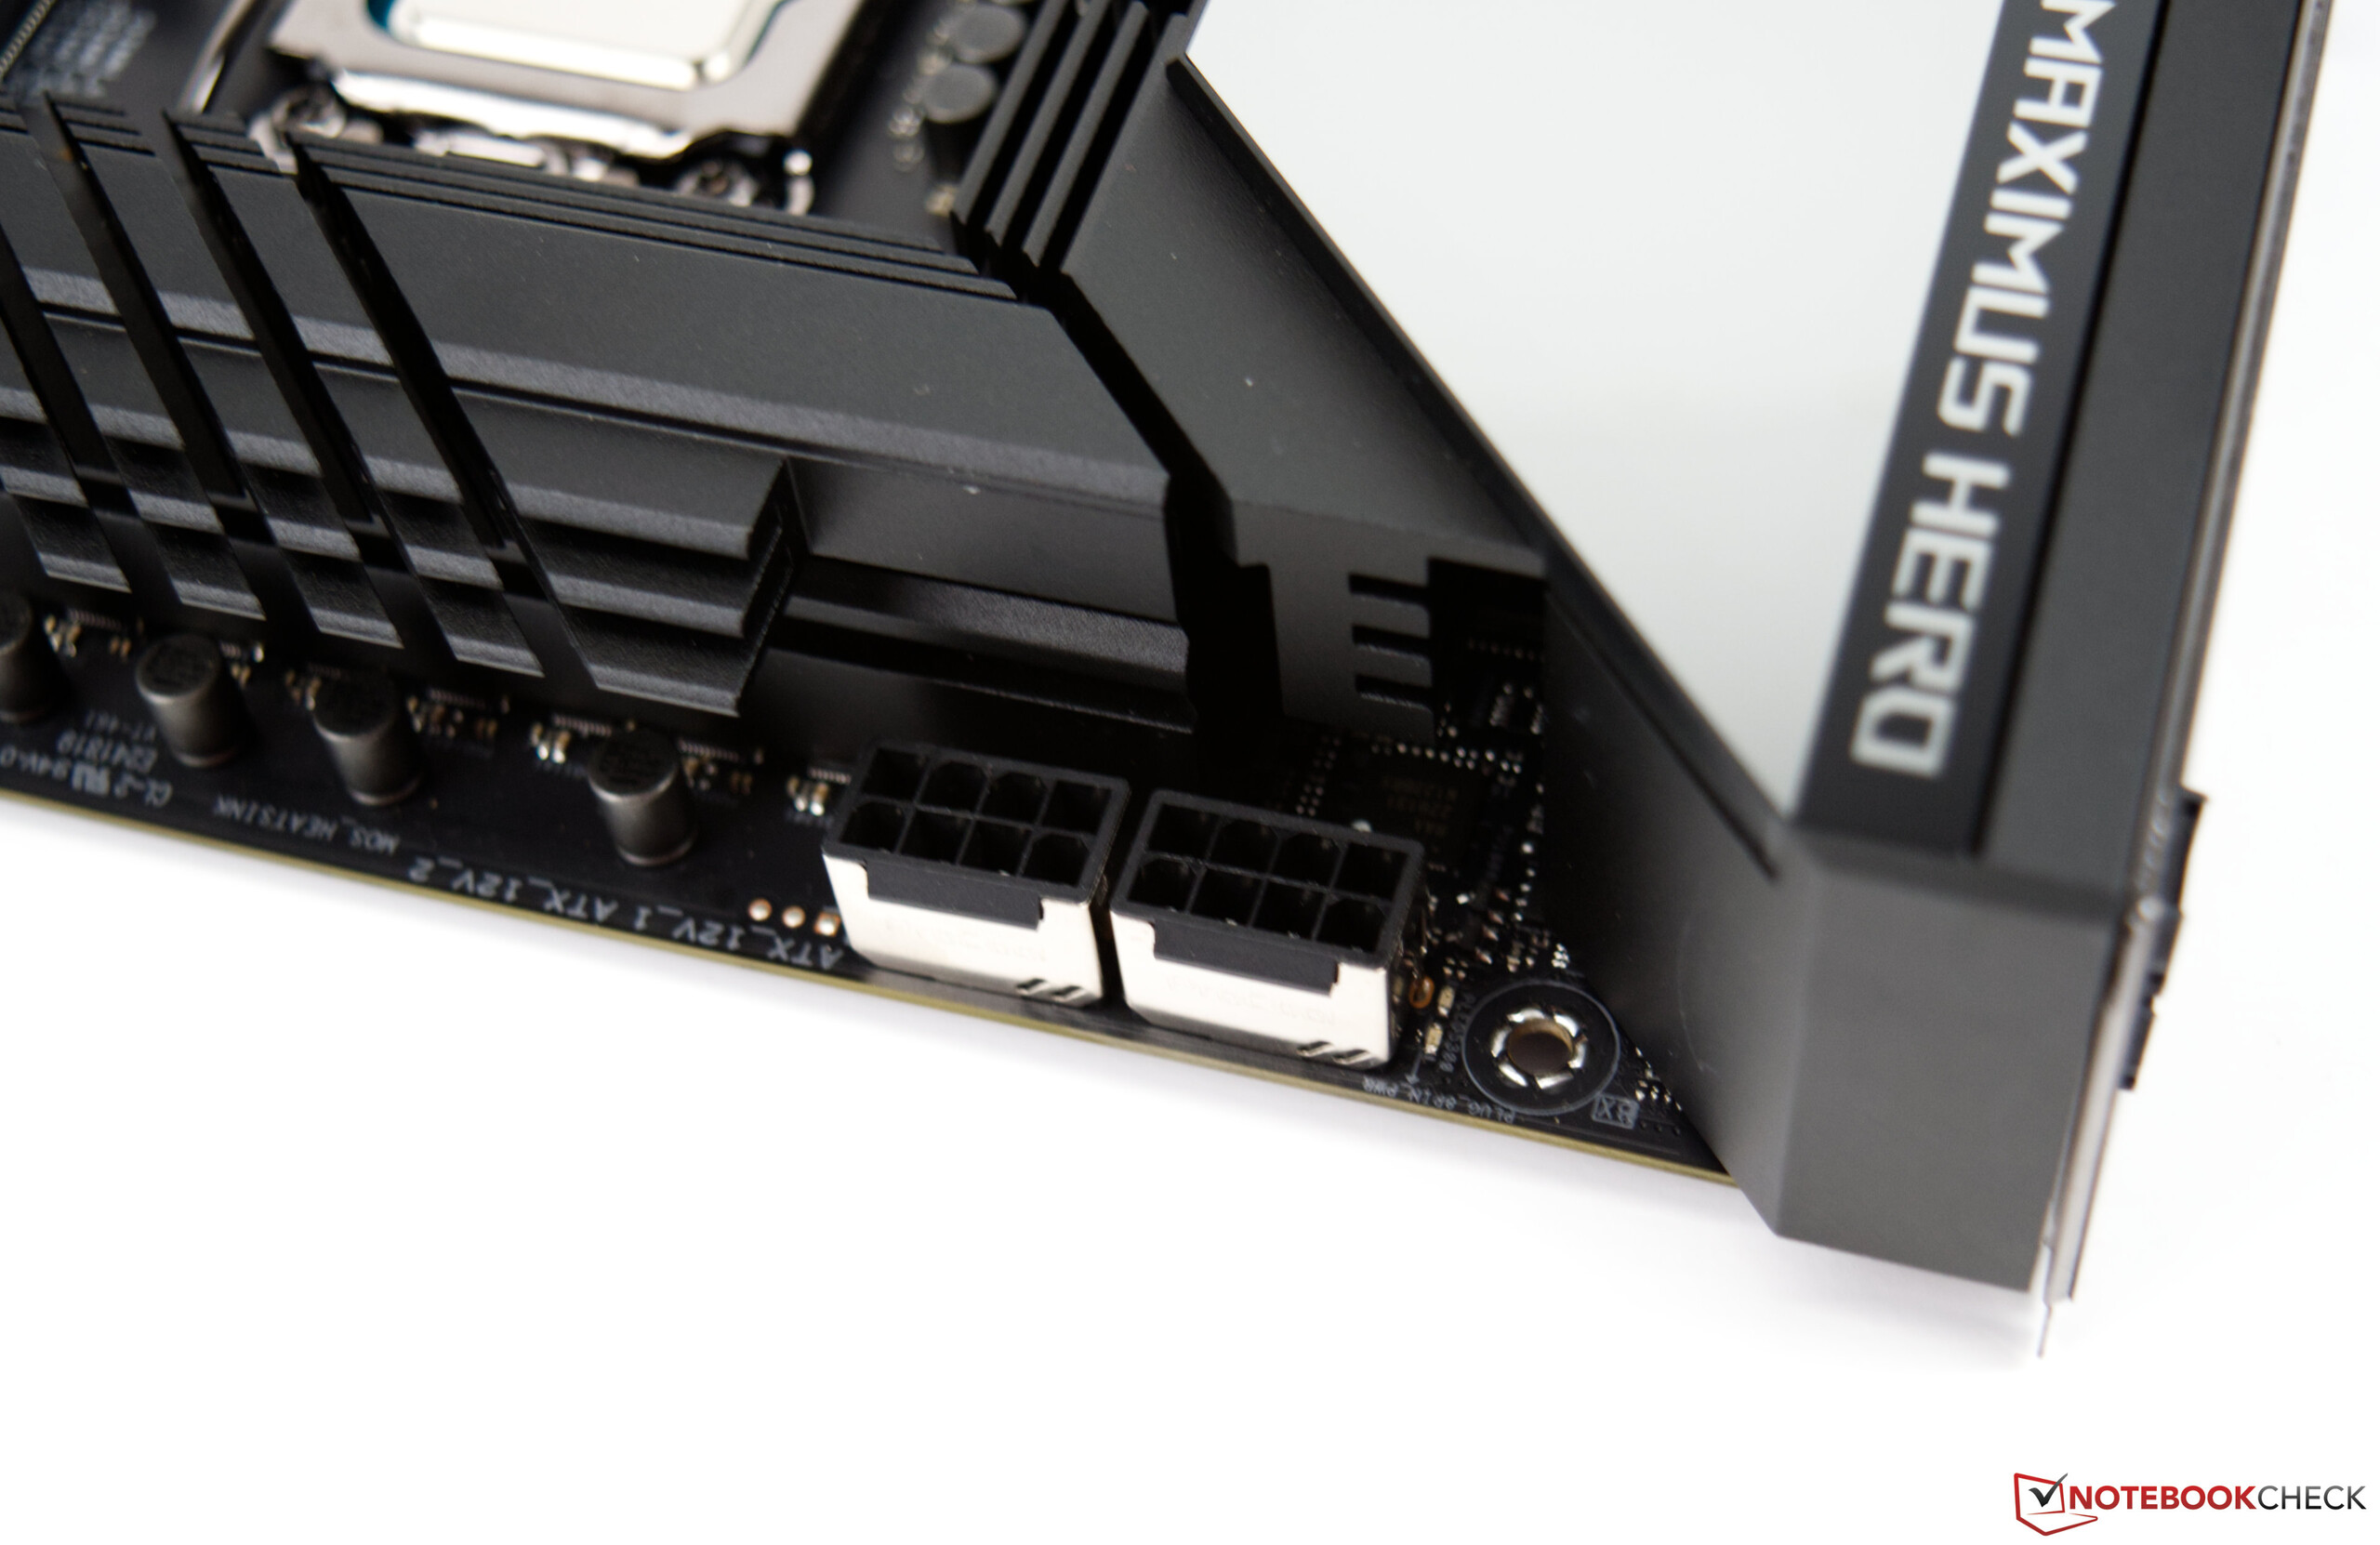
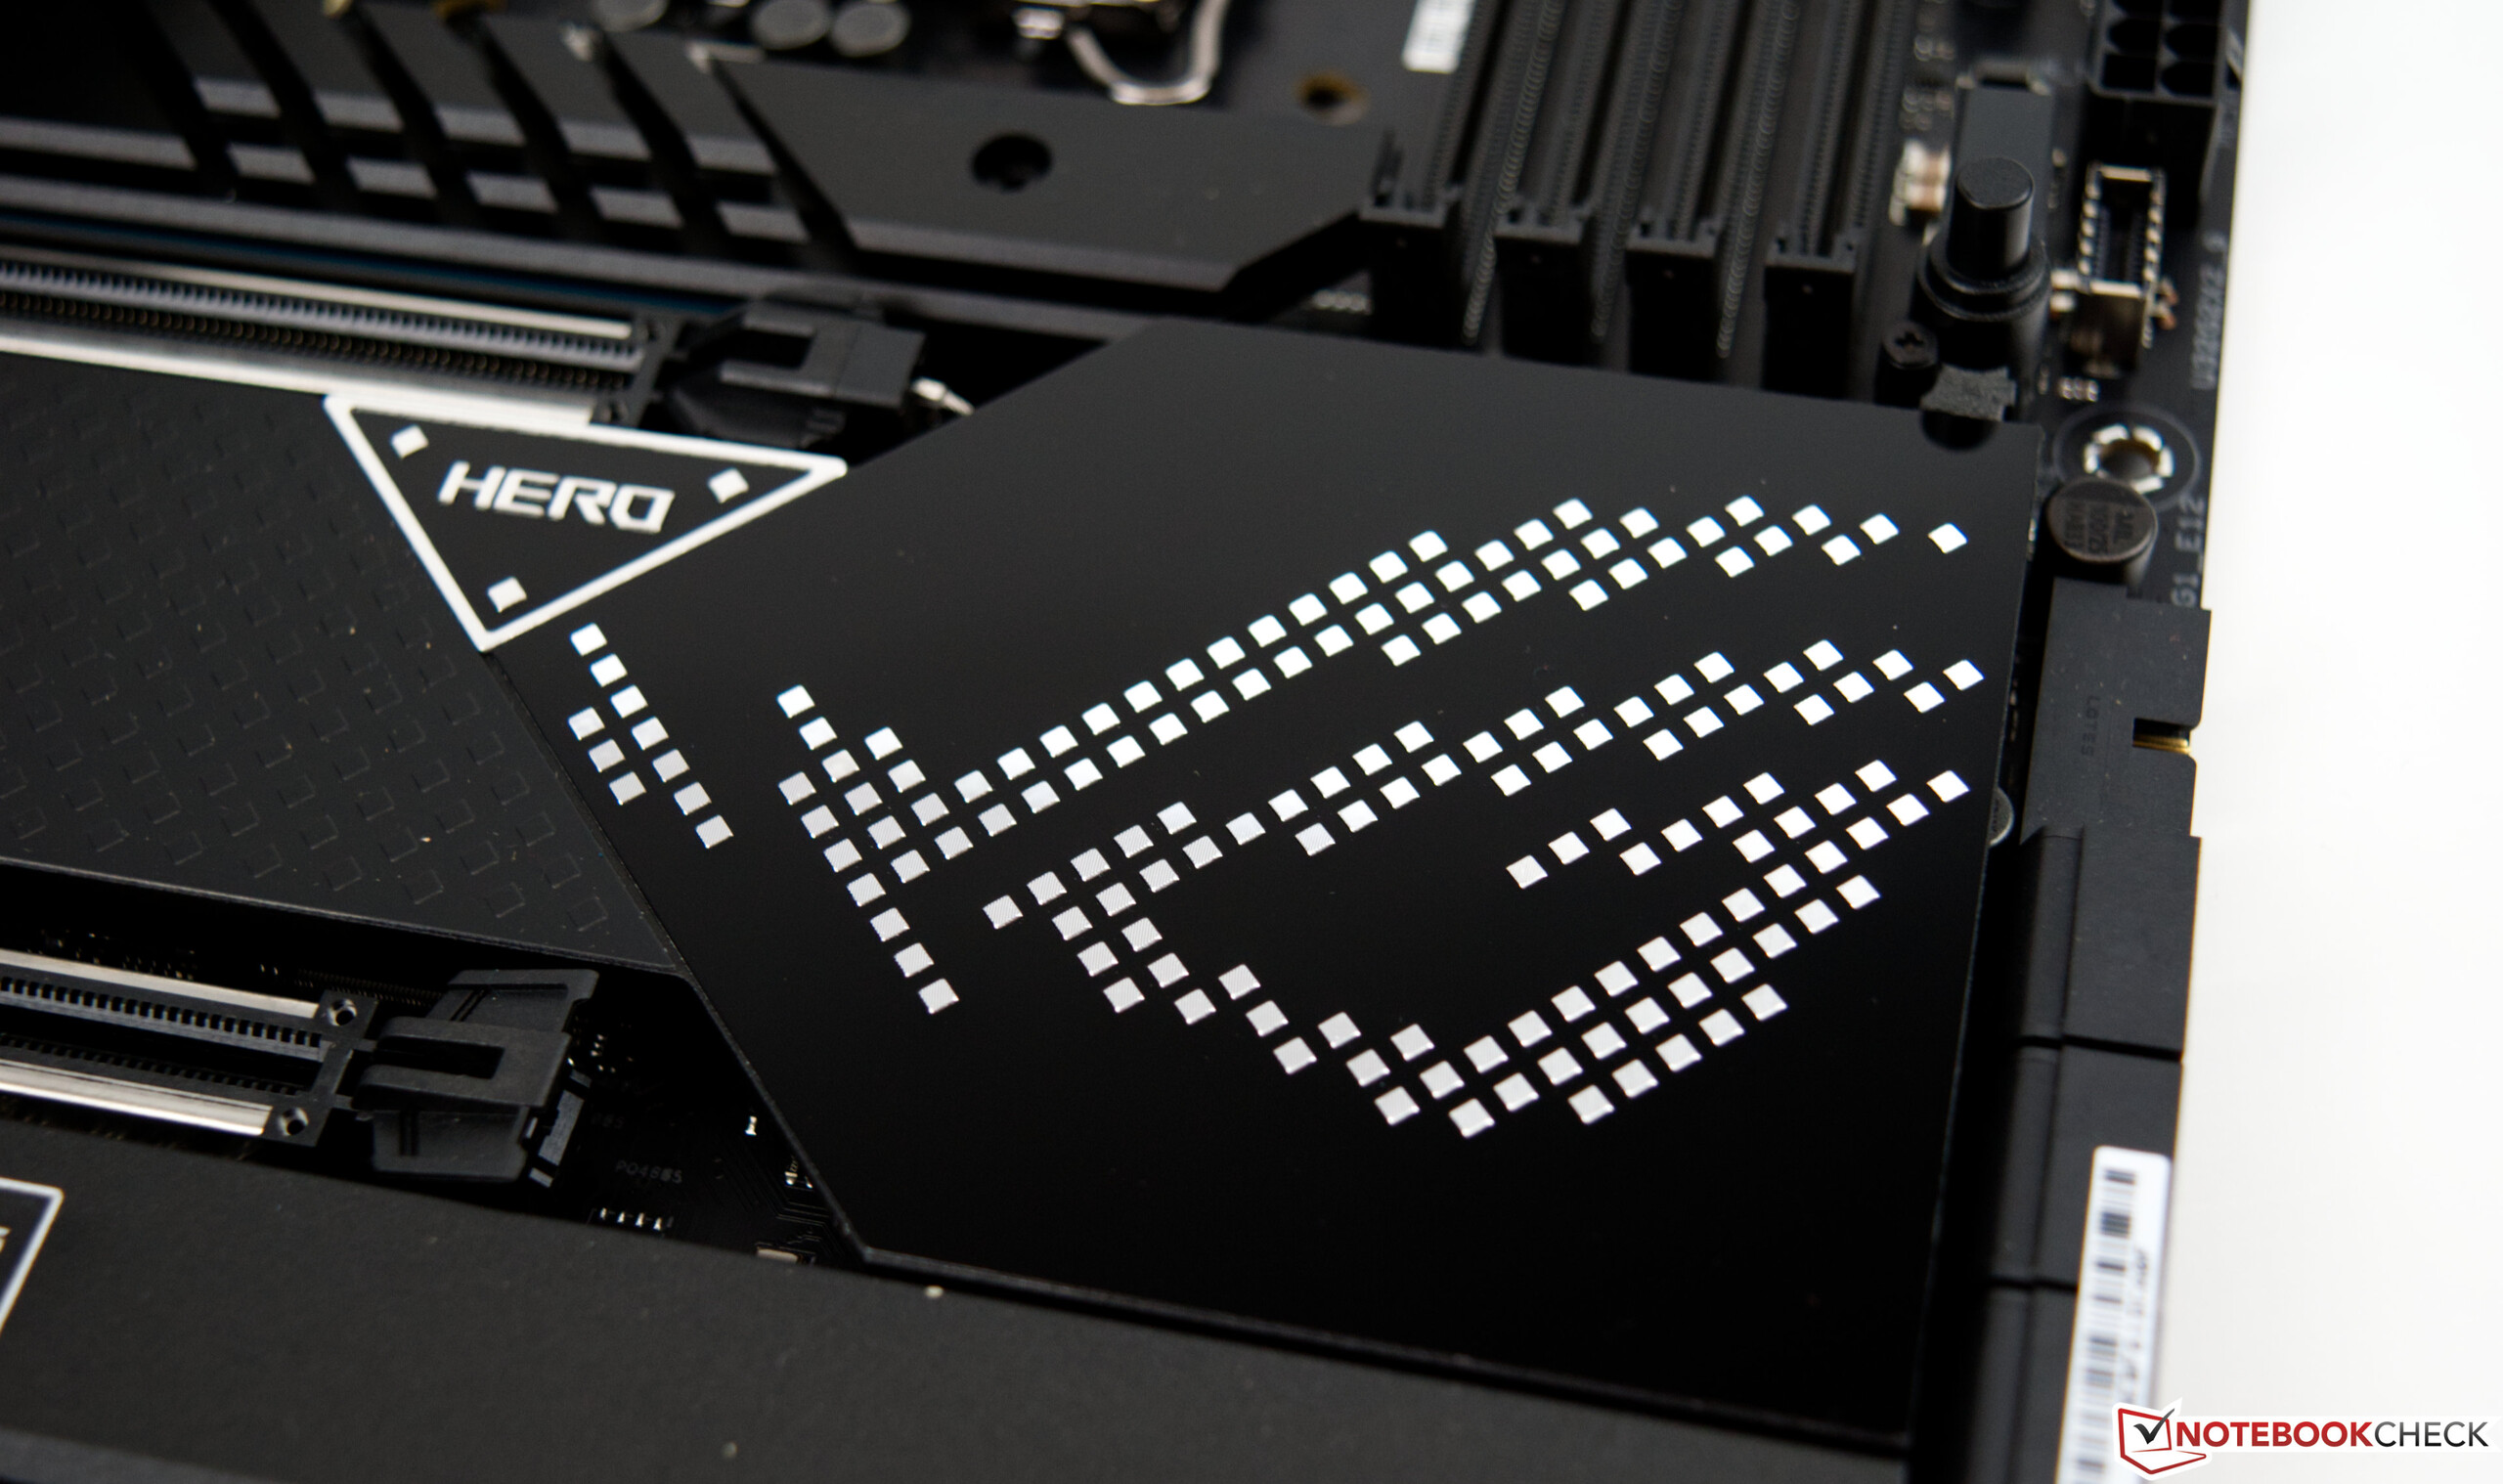
De Asus ROG Maximus Z690 Hero in detail
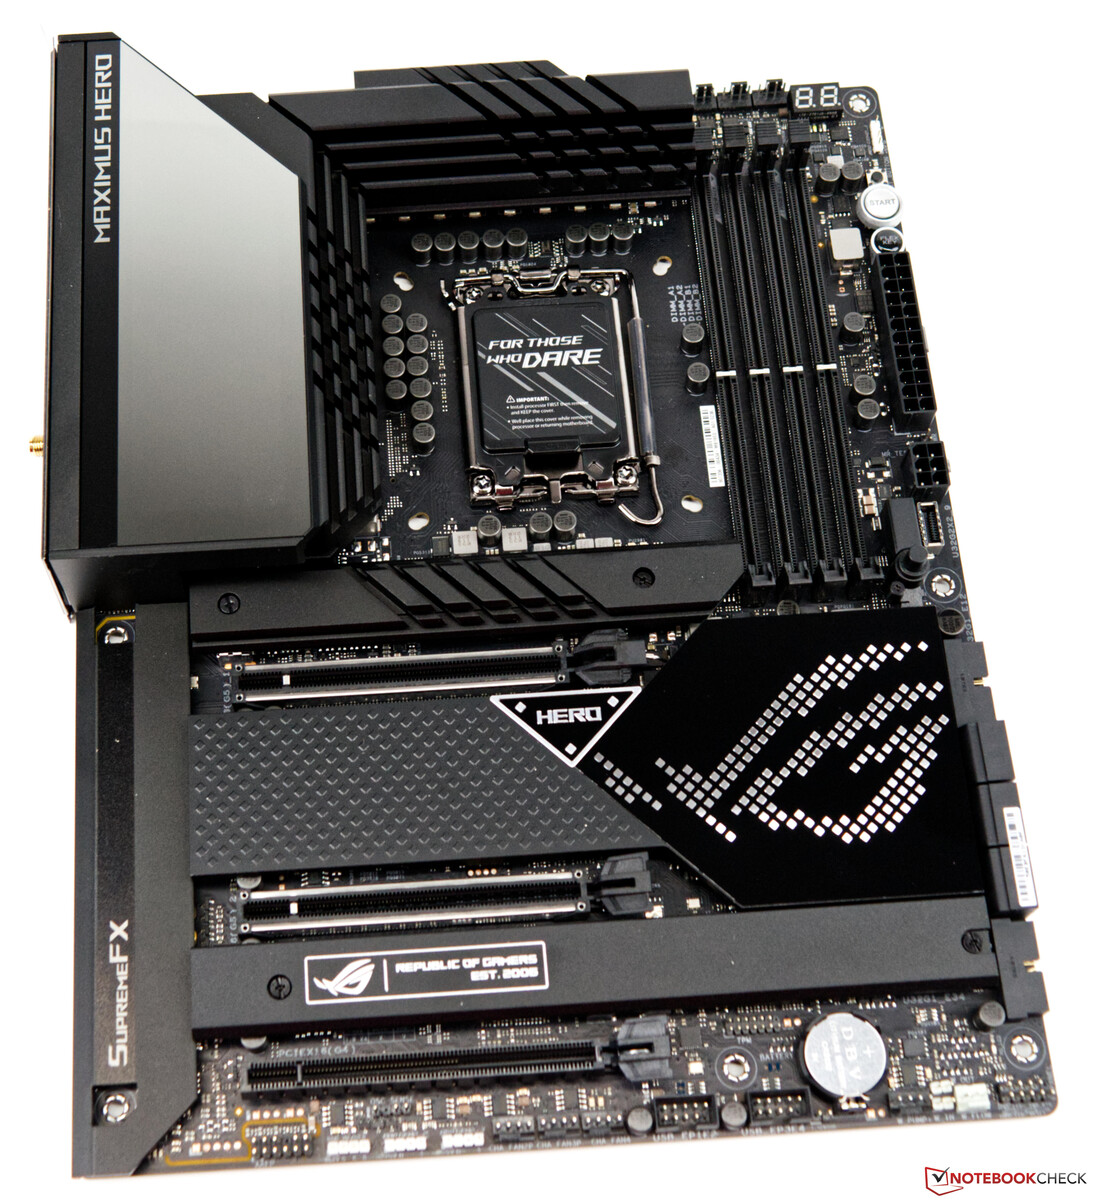
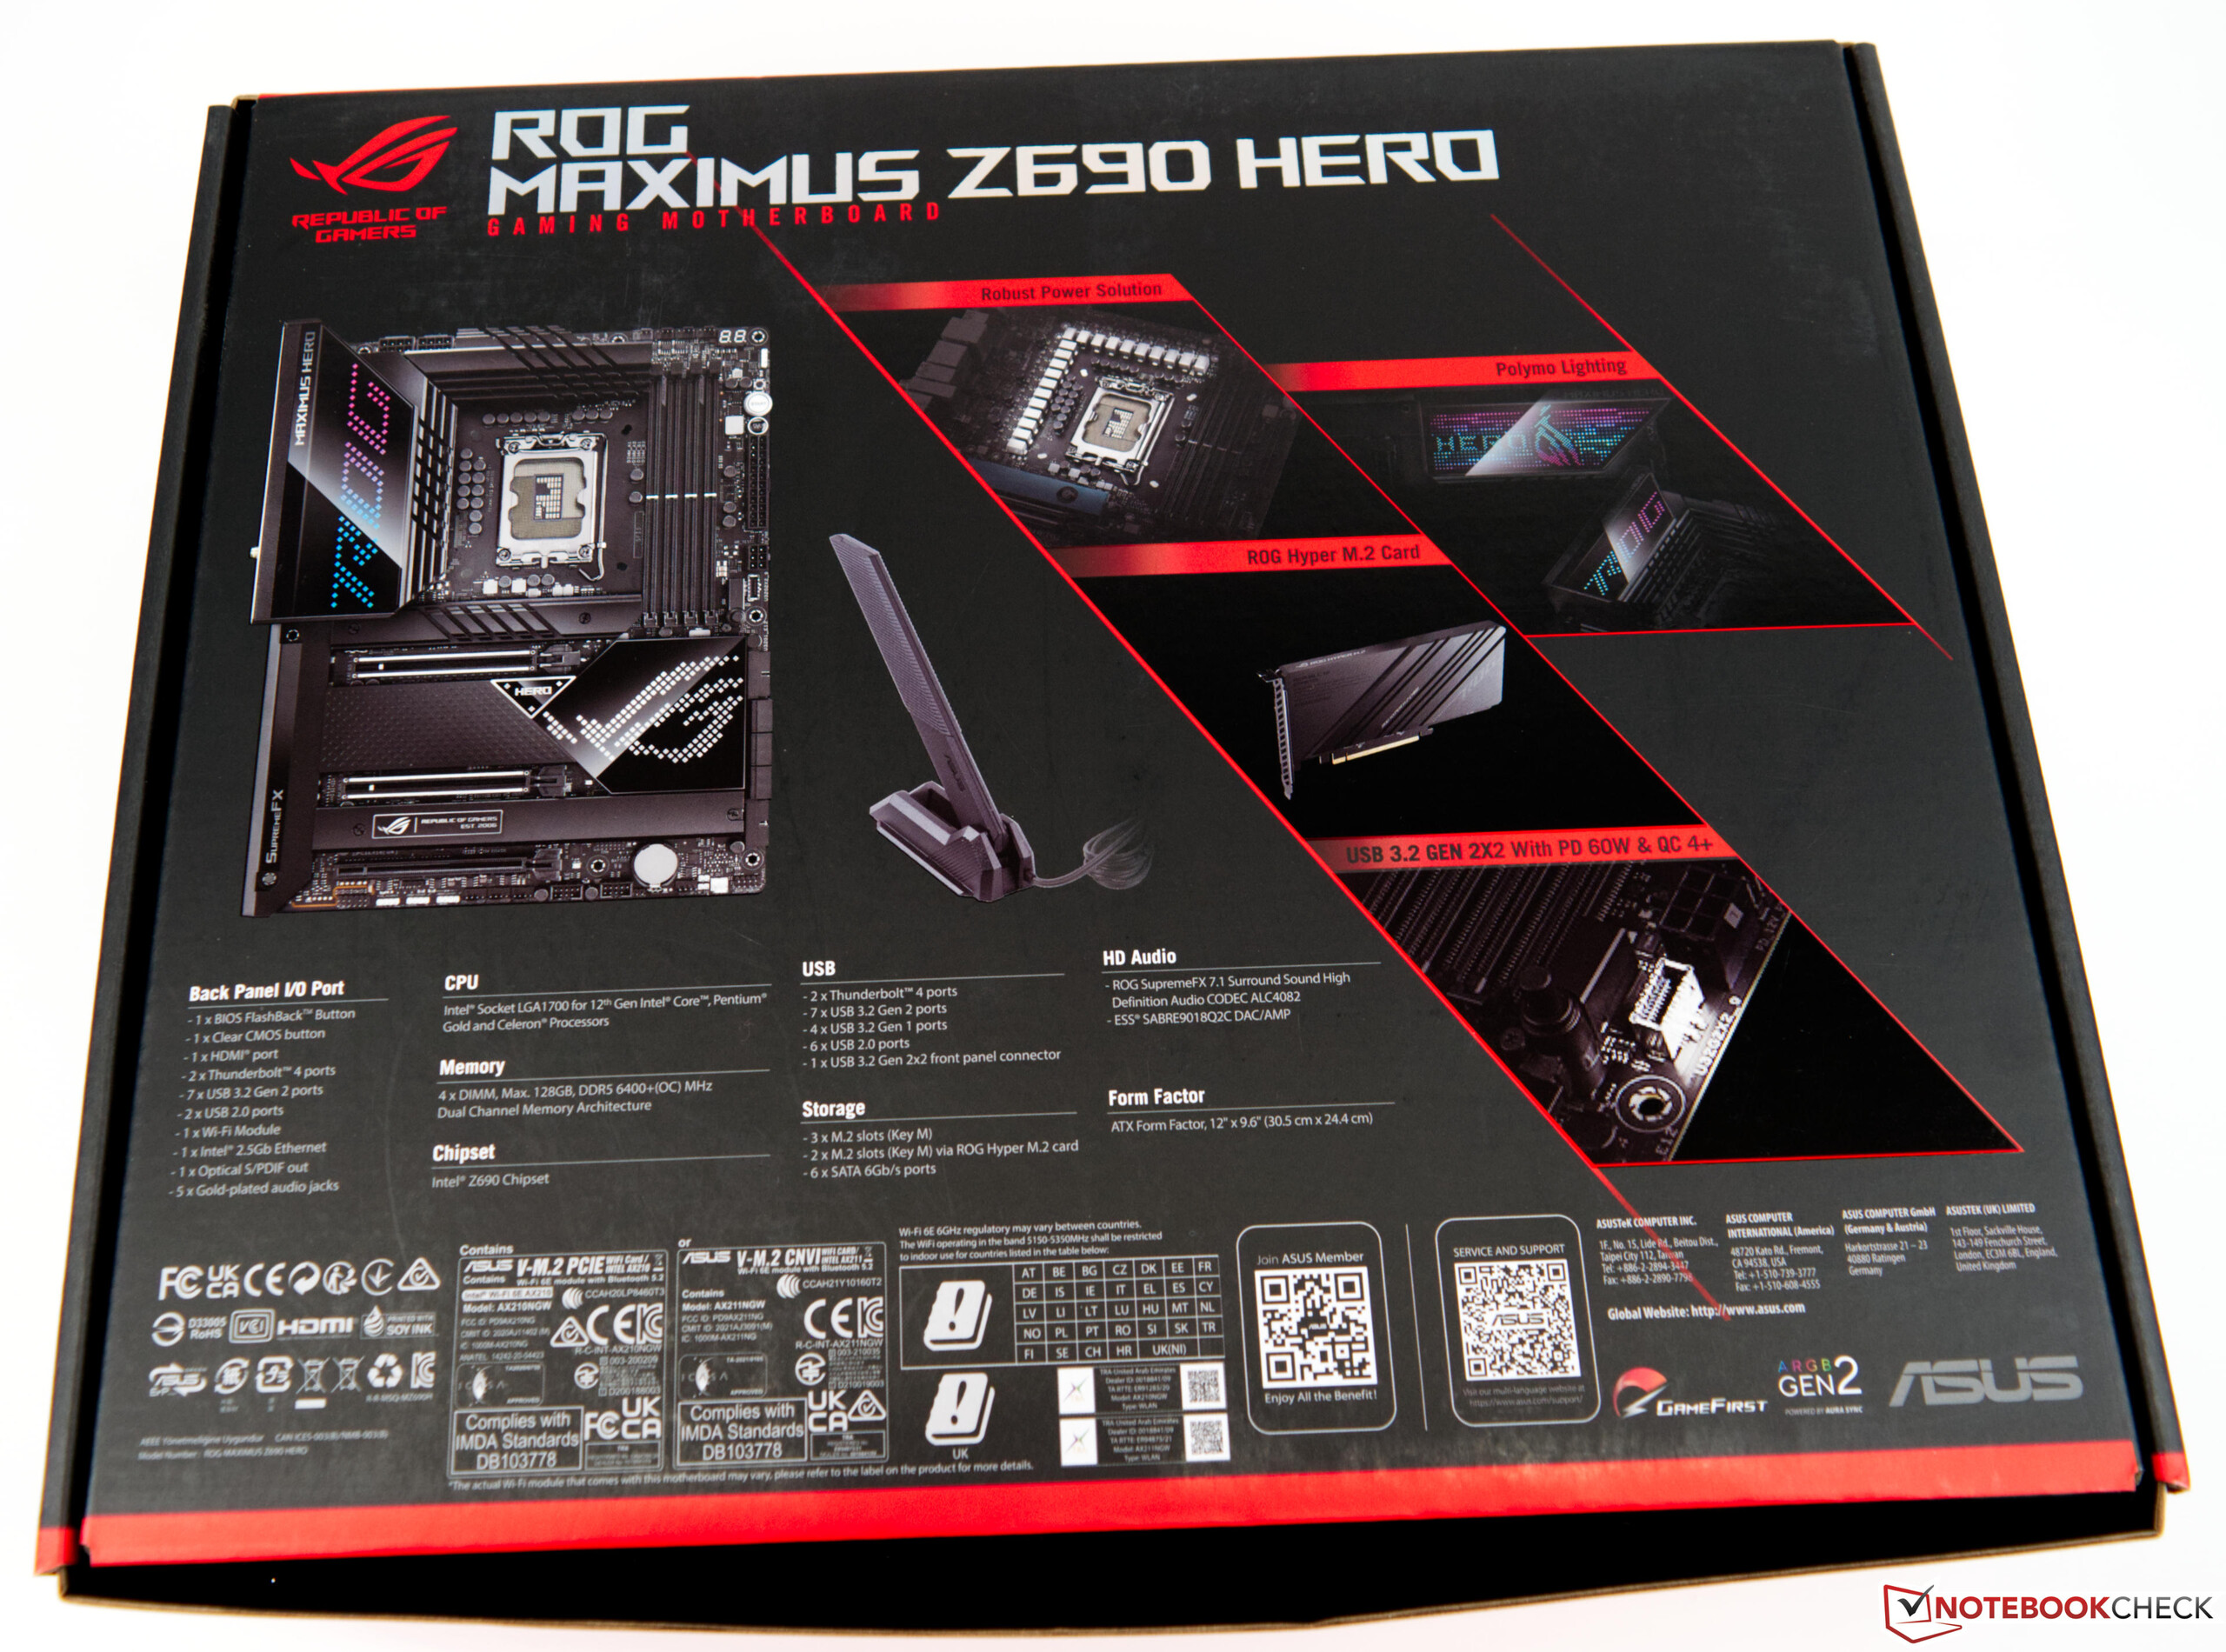
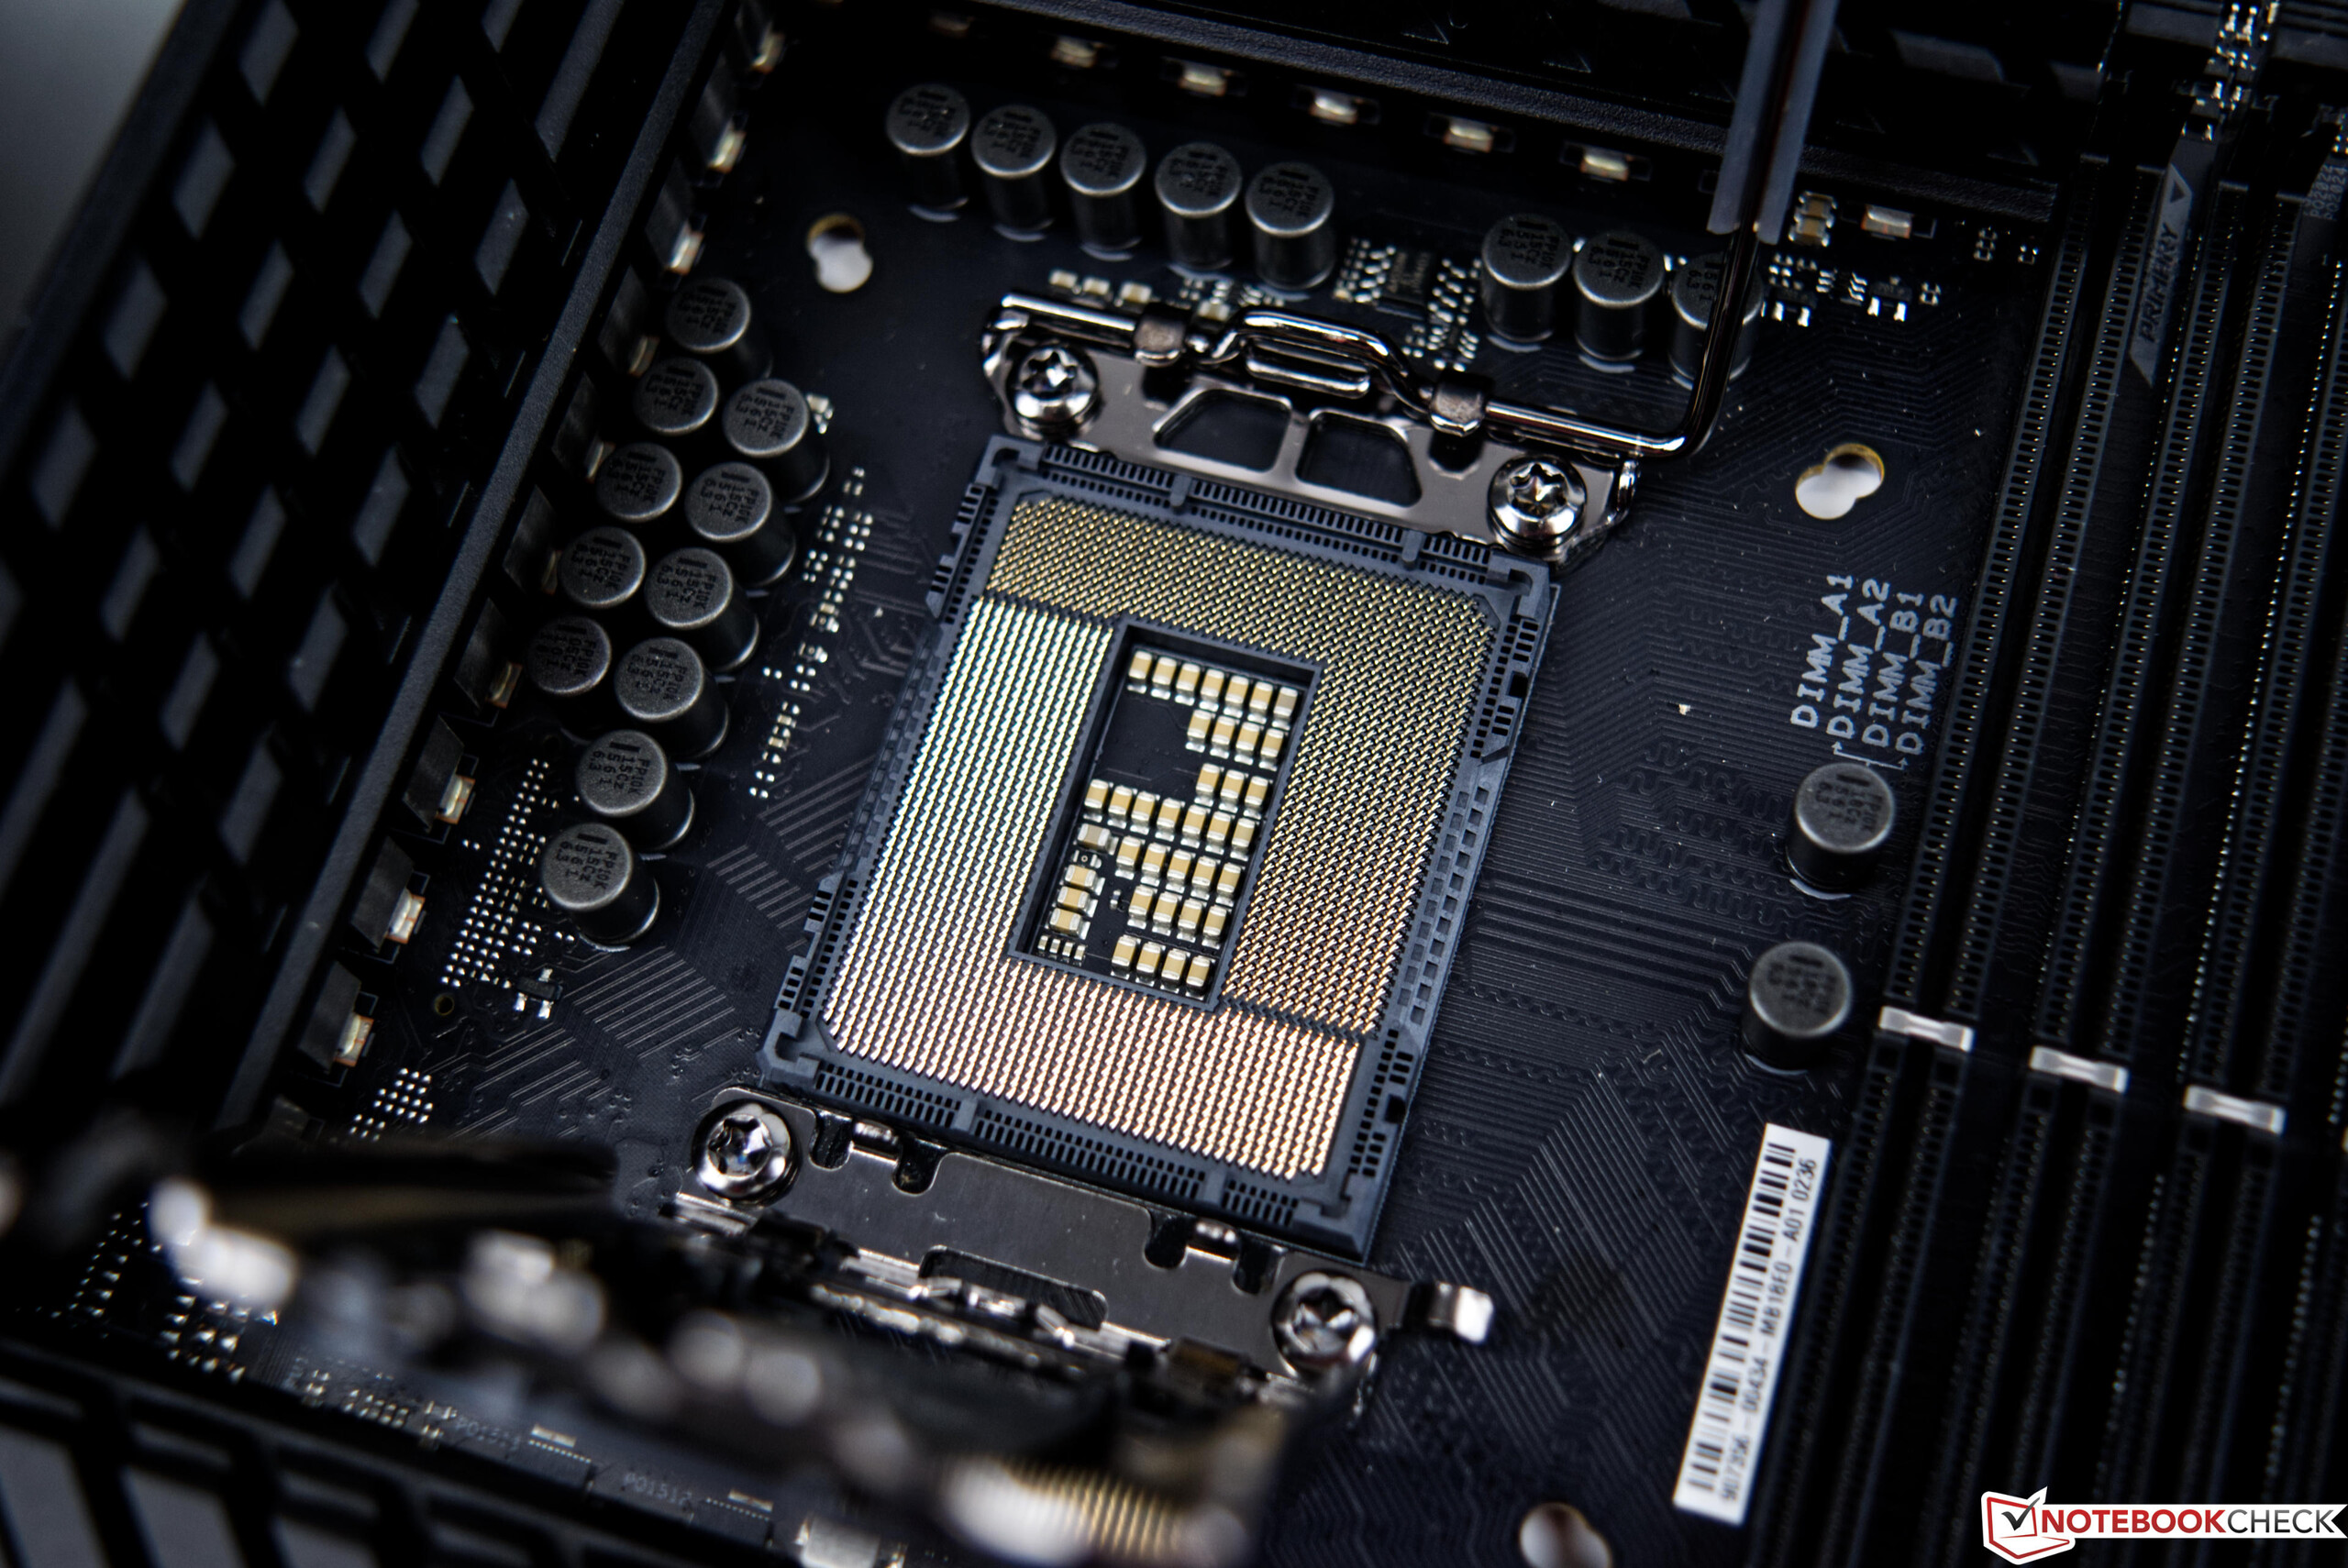
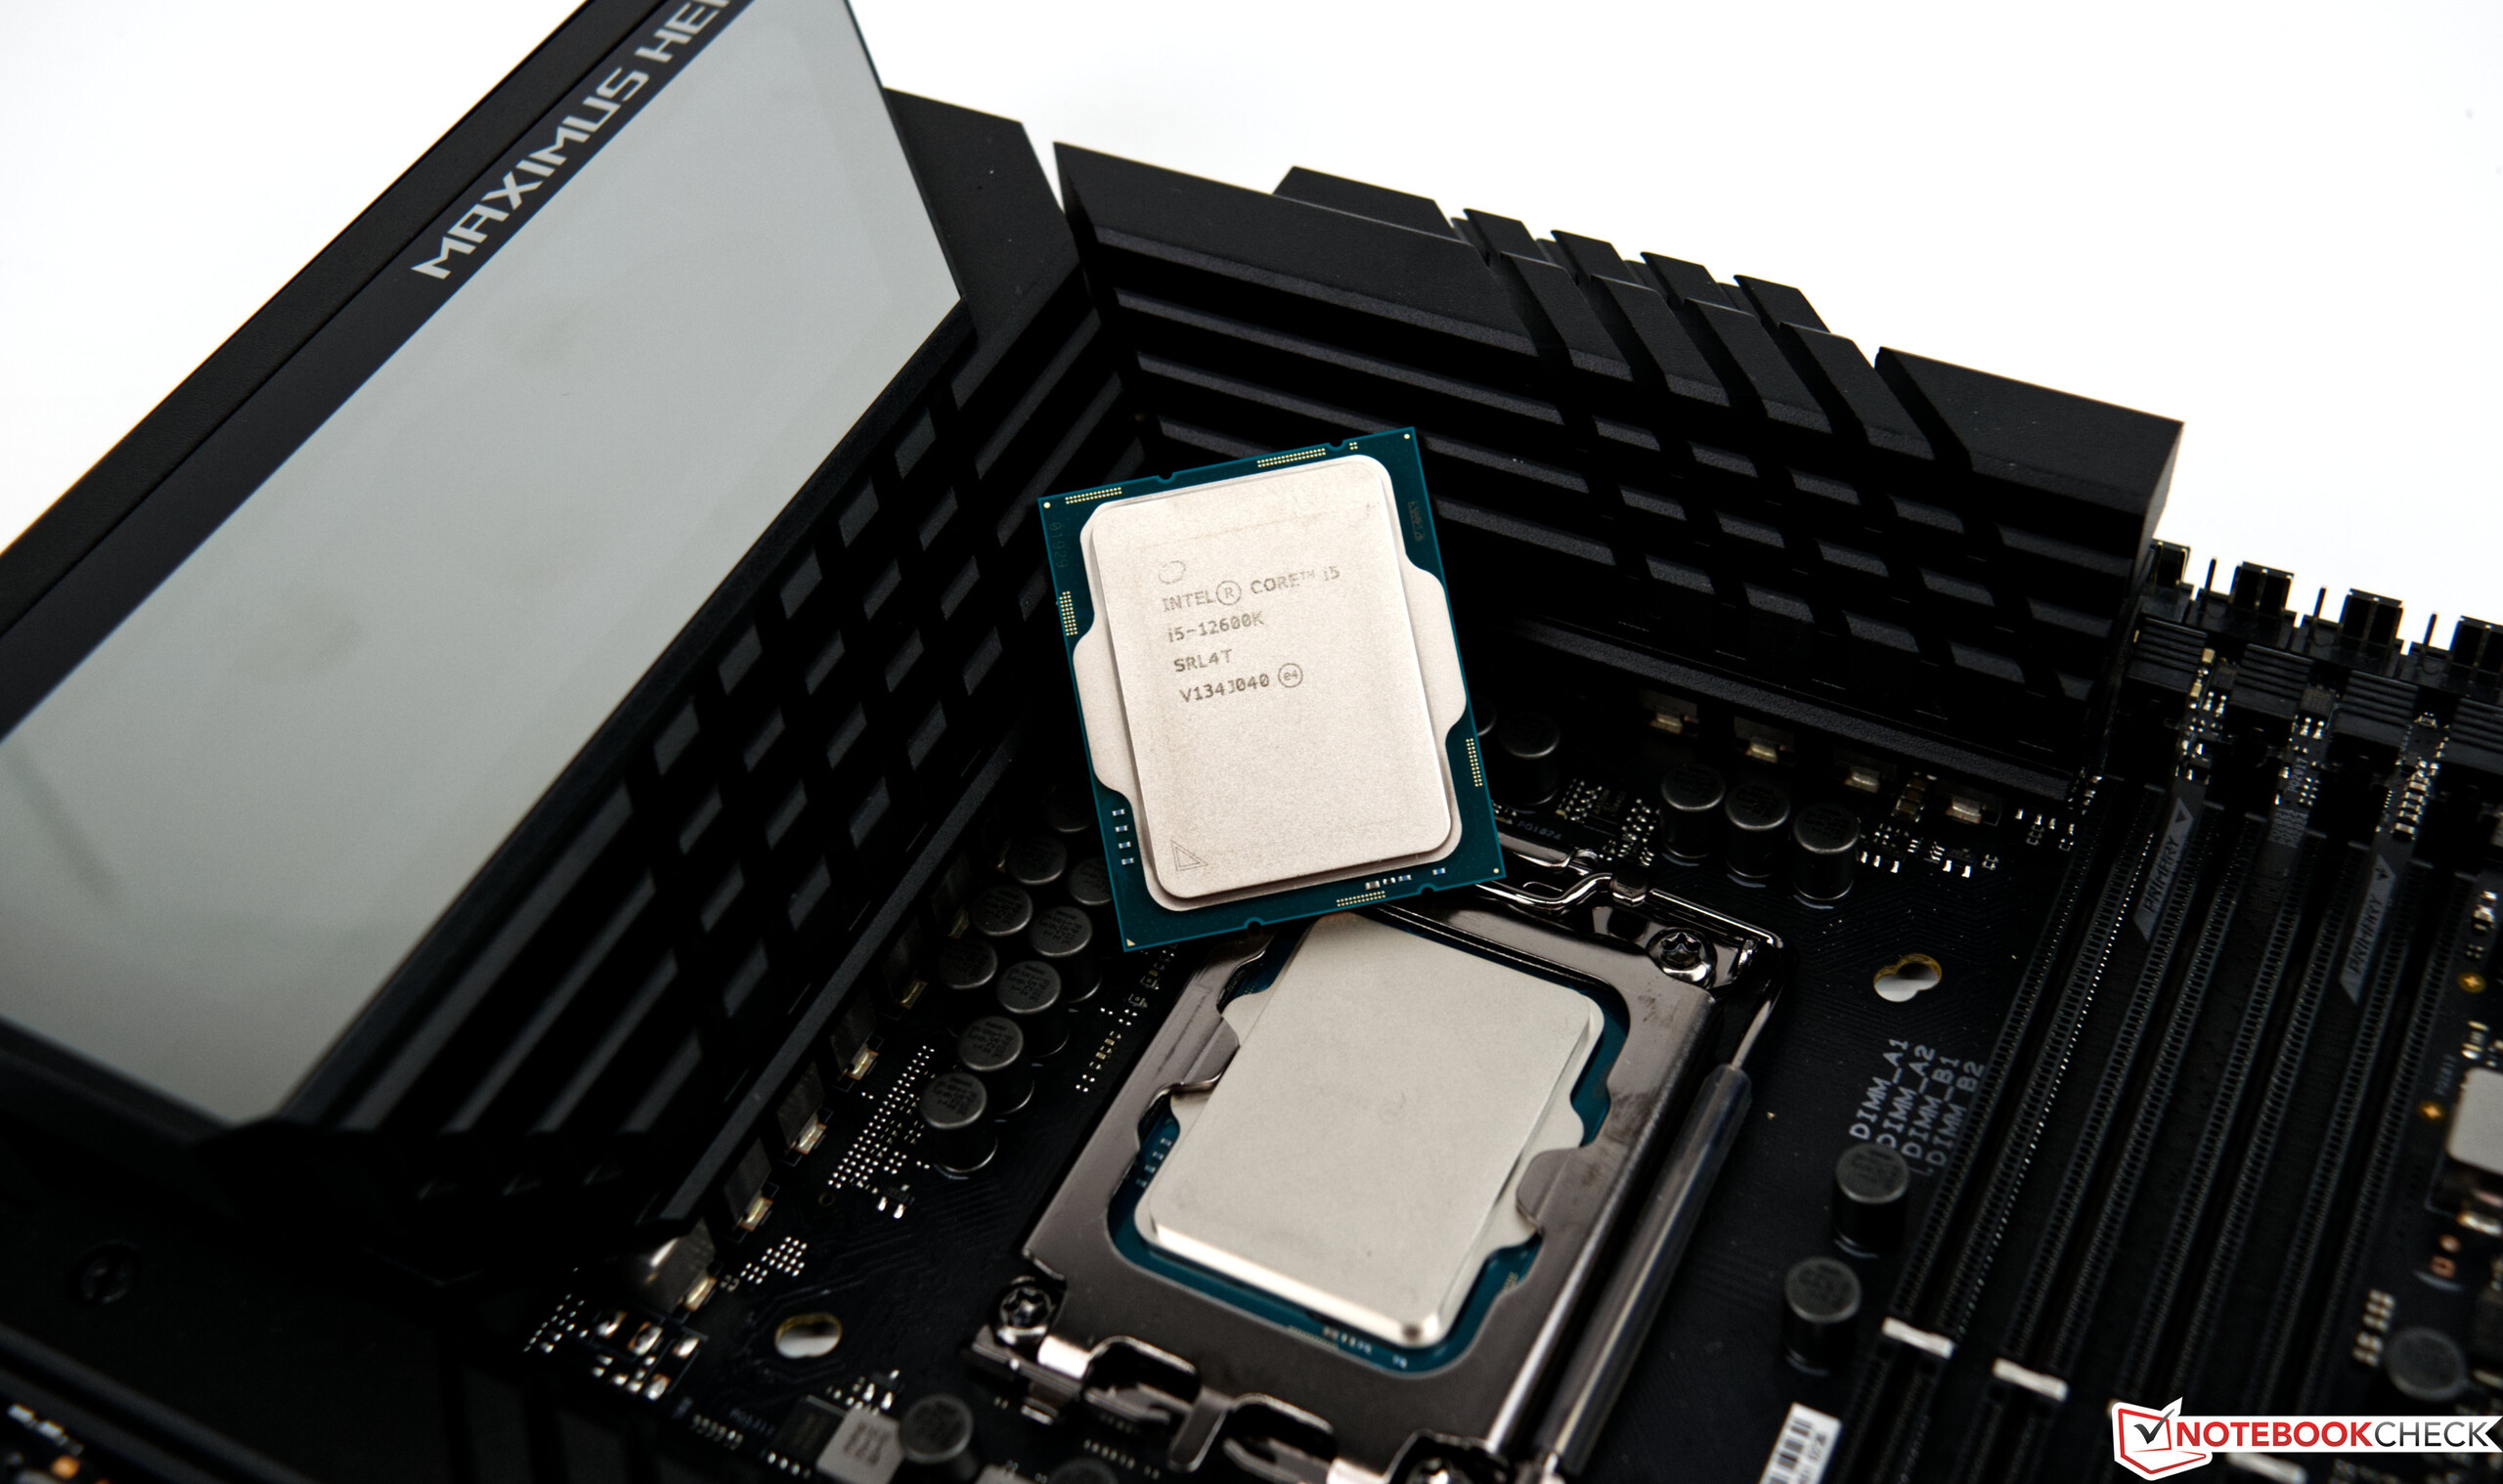
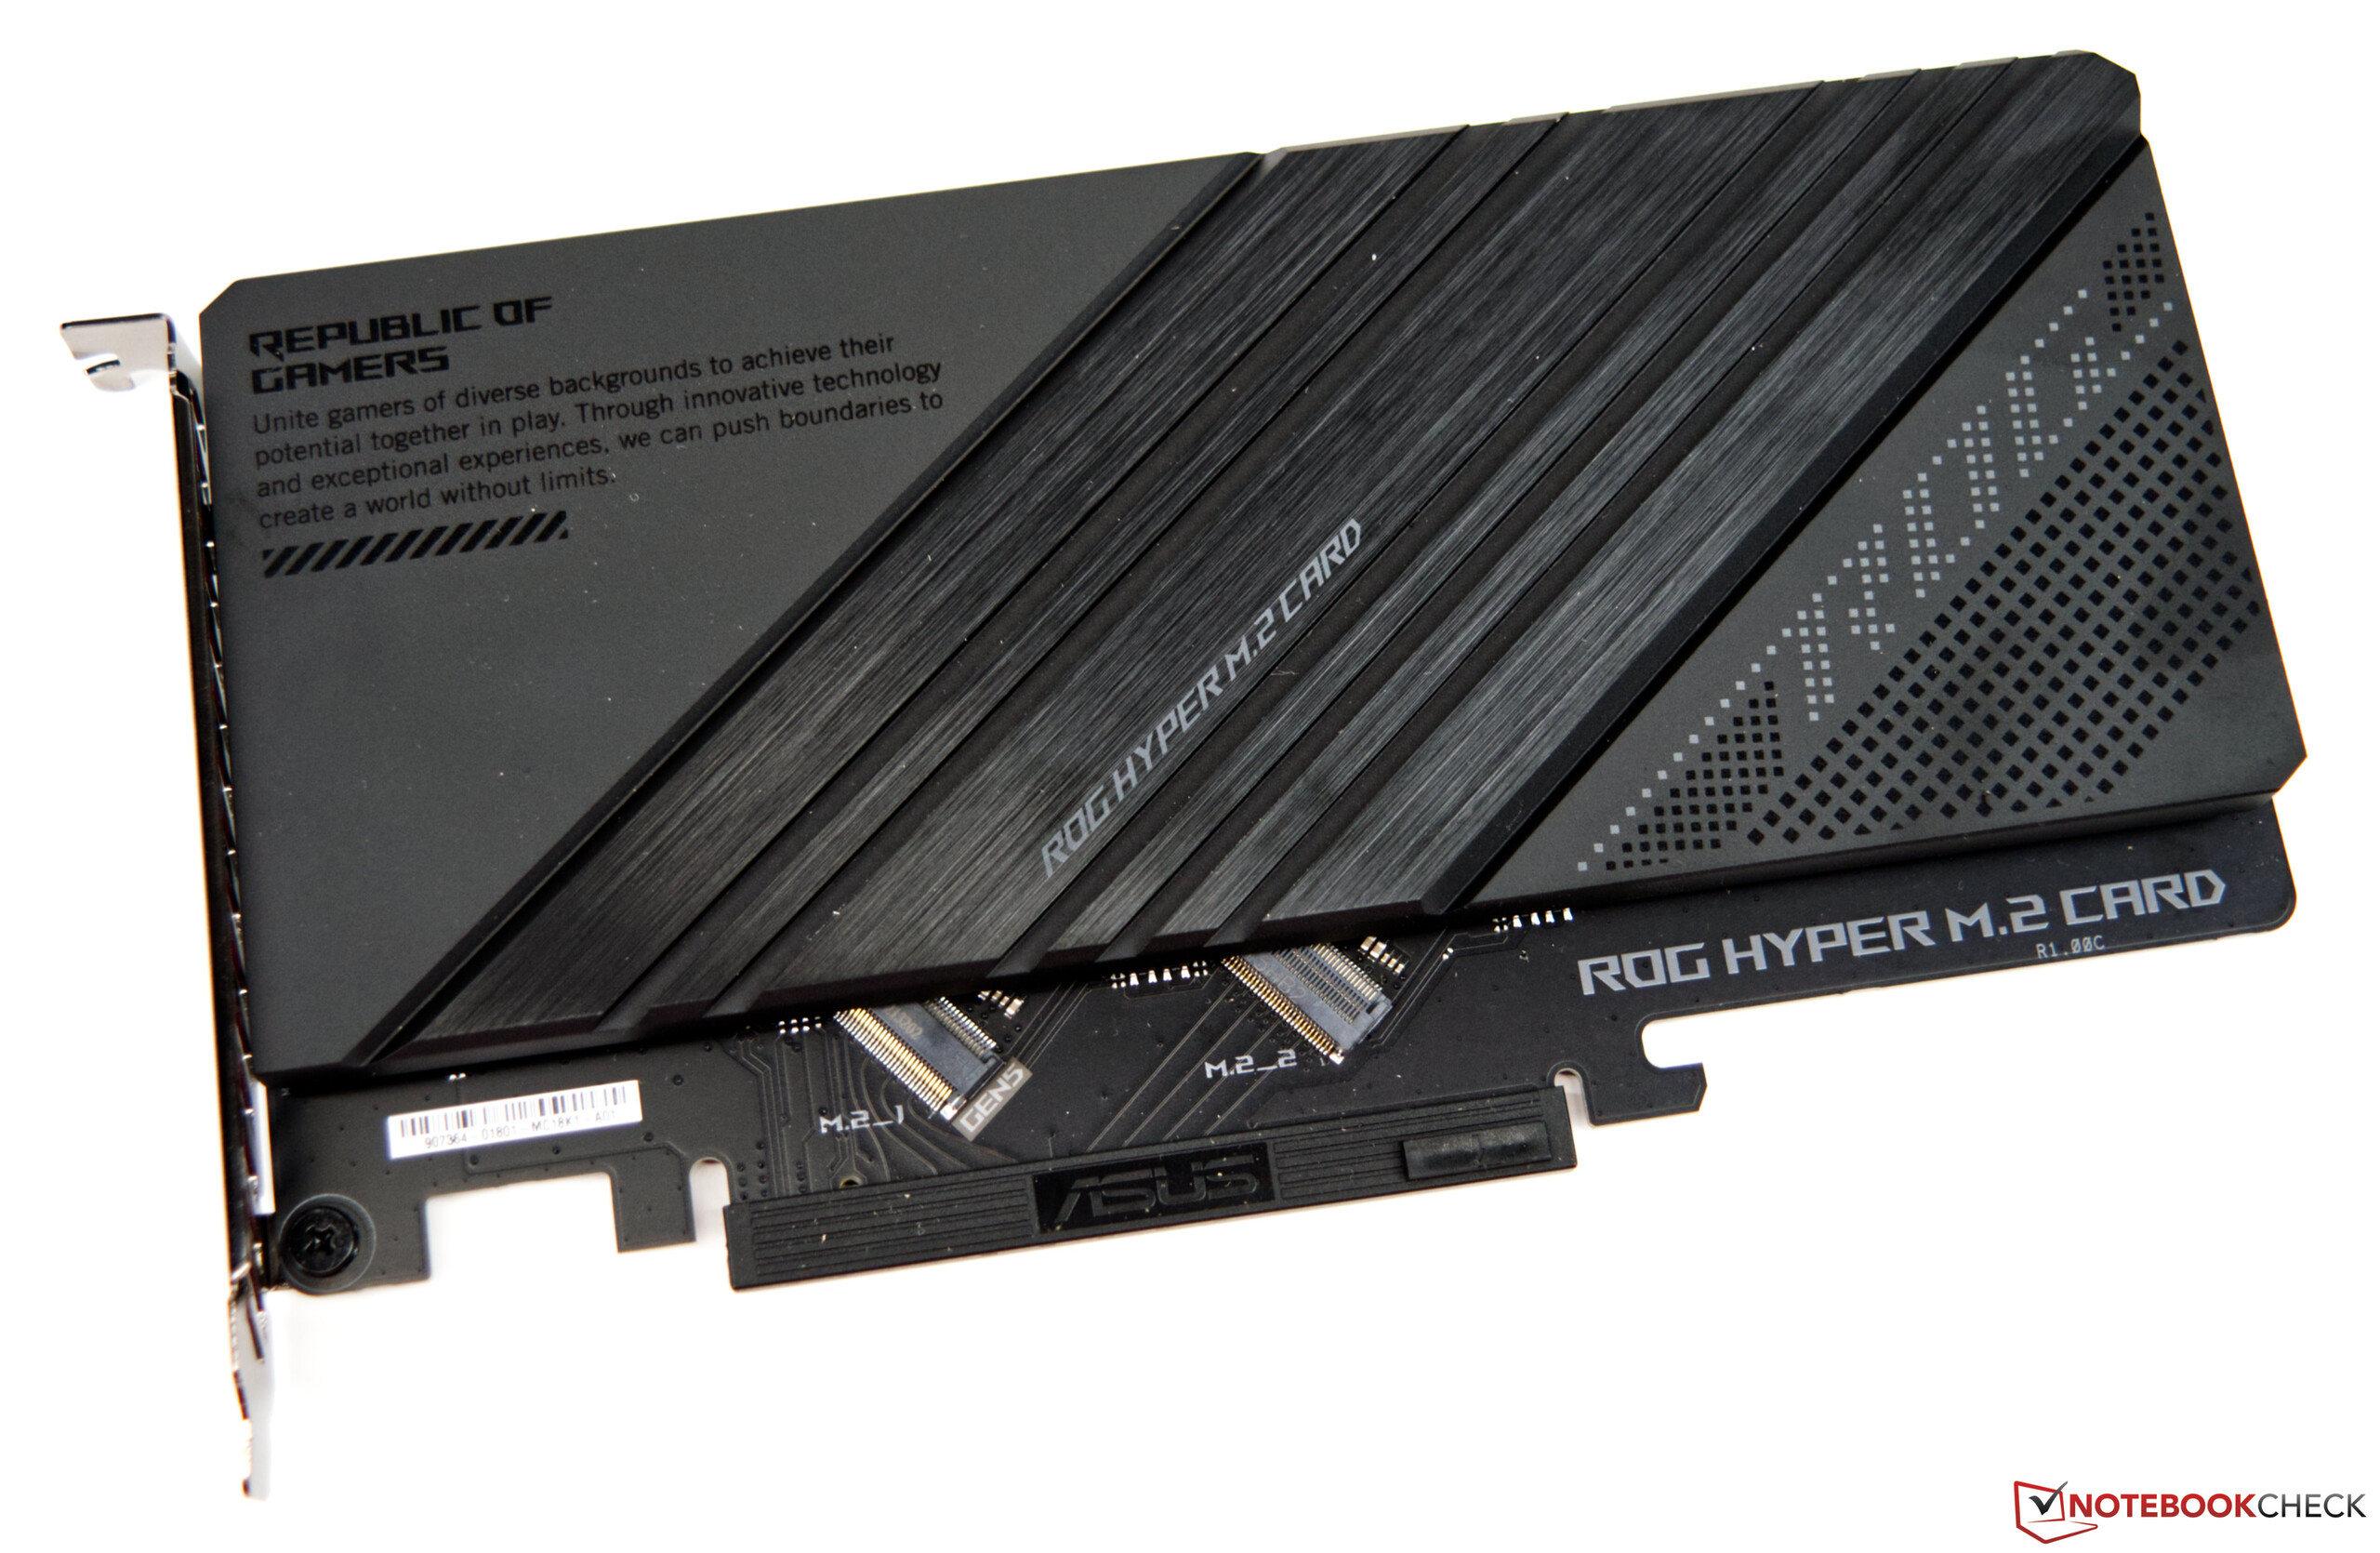
Asus heeft ons op tijd voorzien van de ROG Maximus Z690 Hero, die als basis dient voor deze review. We danken Asus Duitsland voor dit leentoestel. De Asus ROG Maximus Z690 Hero ziet er erg massief uit, wat terug te voeren is op het grote koelsysteem. In totaal kun je tot vijf M.2 SSD's op het moederbord plaatsen, maar dan moet je wel twee van de vijf SSD's op een aparte Hyper M.2 kaart installeren. Deze zal de volledige bandbreedte van de Gen 5 ondersteuning kunnen gebruiken en wordt als accessoire in de doos meegeleverd. De nieuwe LGA 1700 socket valt op door het iets langgerekte ontwerp. Veel LGA 1200 koelsystemen zijn ook compatibel met de nieuwe LGA 1700 socket, maar je moet er wel voor zorgen dat je dit rechtstreeks aan de fabrikant vraagt. Soms worden voor de LGA 1700 socket andere montagebeugels aangeboden om een optimale contactdruk op de CPU te garanderen.
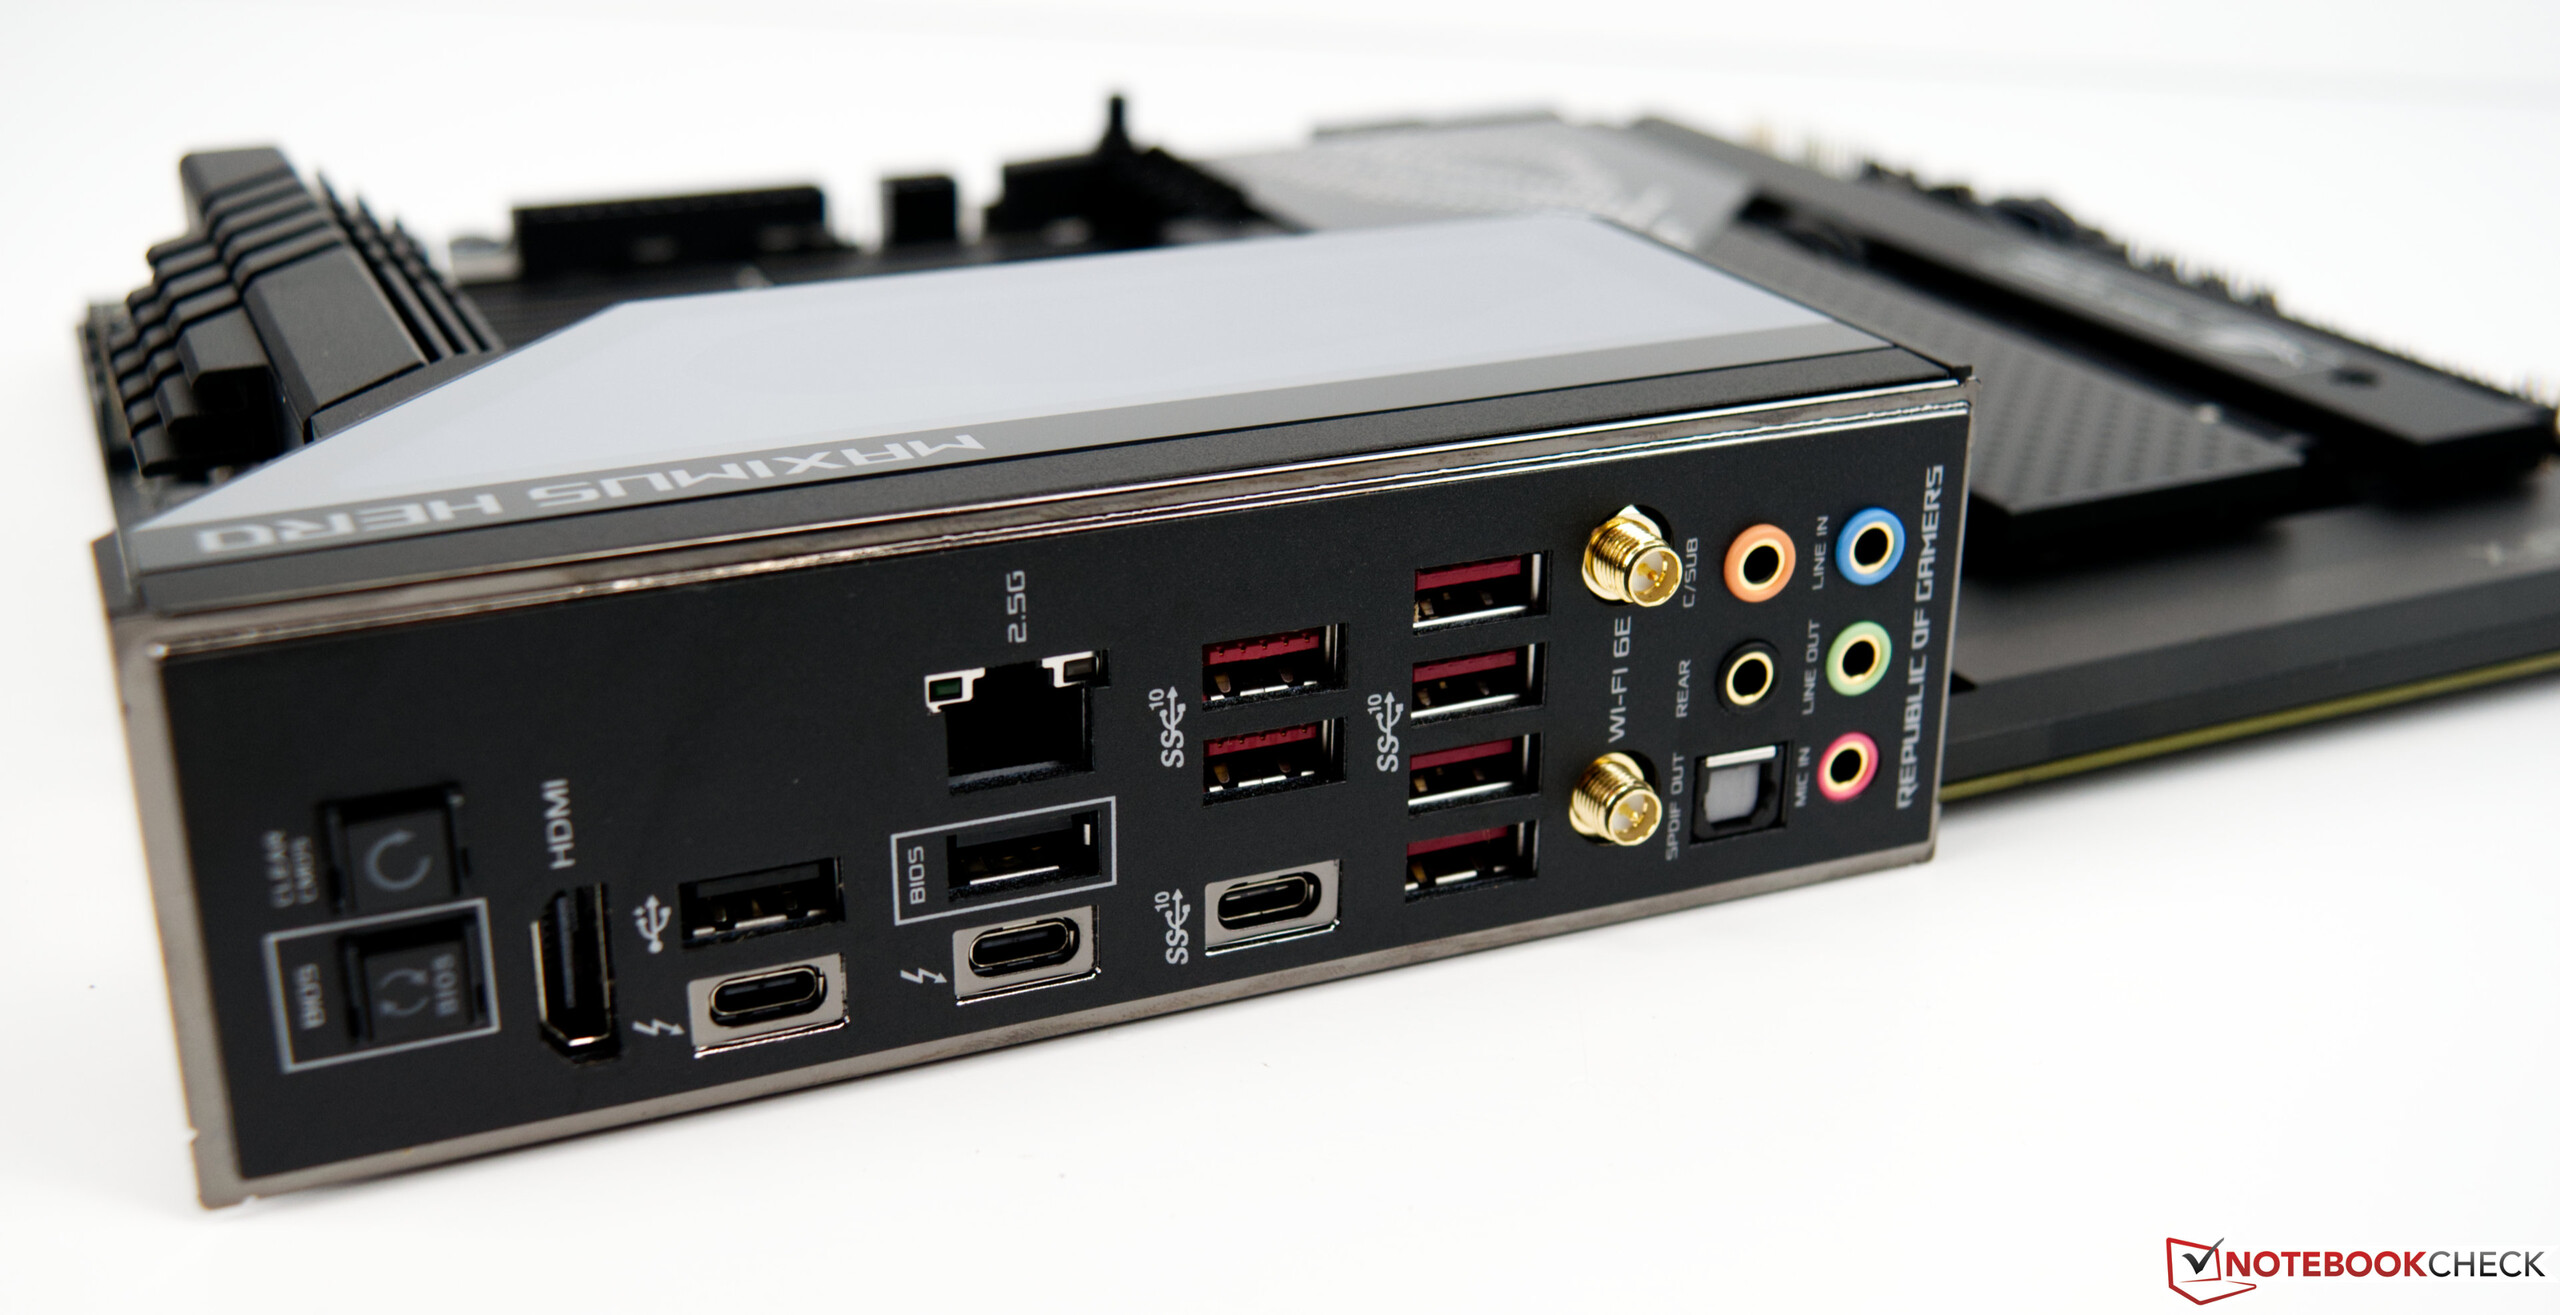
U kunt tot 128 GB van het nieuwe DDR5 werkgeheugen installeren. WiFi, 2,5 Gbit LAN, en een totaal van 20 USB poorten zorgen ervoor dat je voldoende connectiviteit hebt.
Twee 8-pins voedingsaansluitingen niet ver van de socket zorgen voor de stroomvoorziening van de CPU. De spanningstransformatoren worden afgedekt door een zeer massief koelblok inclusief een heat pipe. Bovendien is er een aantrekkelijk Polymo lightning paneel boven het I/O Shield, dat er behoorlijk uitziet.
Processor Benchmarks
Intel is in staat om de belofte van een aanzienlijke prestatieverhogingten opzichte van de Rocket Lake-S processoren waar te maken. In de prestatiebeoordeling, die het prestatieverschil over alle vermelde benchmarks weergeeft, weet de Intel Core i9-12900K zich duidelijk aan de top te plaatsen. Vergeleken met deAMD Ryzen 9 5900X, die ook 24 threads in totaal biedt, ligt het nieuwe vlaggenschip van Intel 13 procentpunten voor. Als we deIntel Core i9-11900K als referentie nemen, loopt de Core i9-12900K 23% sneller. Hoewel de verschillen in de afzonderlijke benchmarks iets verschillen, is dit te wijten aan de overeenkomstige CPU-architectuur.
We zien een vergelijkbaar beeld met de kleinere Intel Core i5-12600K. Als we de AMD Ryzen 7 5800X als concurrent gebruiken, aangezien deze dezelfde hoeveelheid threads heeft, presteren beide concurrenten op ooghoogte in de cumulatieve benchmarkresultaten. Aan de andere kant heeft de Zen3 processor het moeilijk om te concurreren met de krachtige single-core prestaties van Intel. Maar je moet AMD nog niet afschrijven, want de Zen3 CPU's zijn al een jaar op de markt en volgens sommige geruchten staat de opvolger al in de startblokken. Als die er is, worden de dobbelstenen opnieuw geworpen en moet Rocket Lake-S zich opnieuw bewijzen.
Vanwege de PL1 = PL2 discussie, namen we Cinebench R23 en voerden opnieuw een run uit met een PL1 waarde beperkt tot 125 watt. Er waren geen noemenswaardige veranderingen in het resultaat. De verschillen waren minimaal en kunnen worden beschouwd als vallend binnen de meettoleranties.
Het was duidelijk dat Intel een aanzienlijke sprong voorwaarts zou maken met het nieuwe ontwerp van de P- en E-cores. Hiermee kan Intel ook het gat dichten naar de 12 en 16 core processoren van AMD, wat niet mogelijk was met de Core i9-11900K.
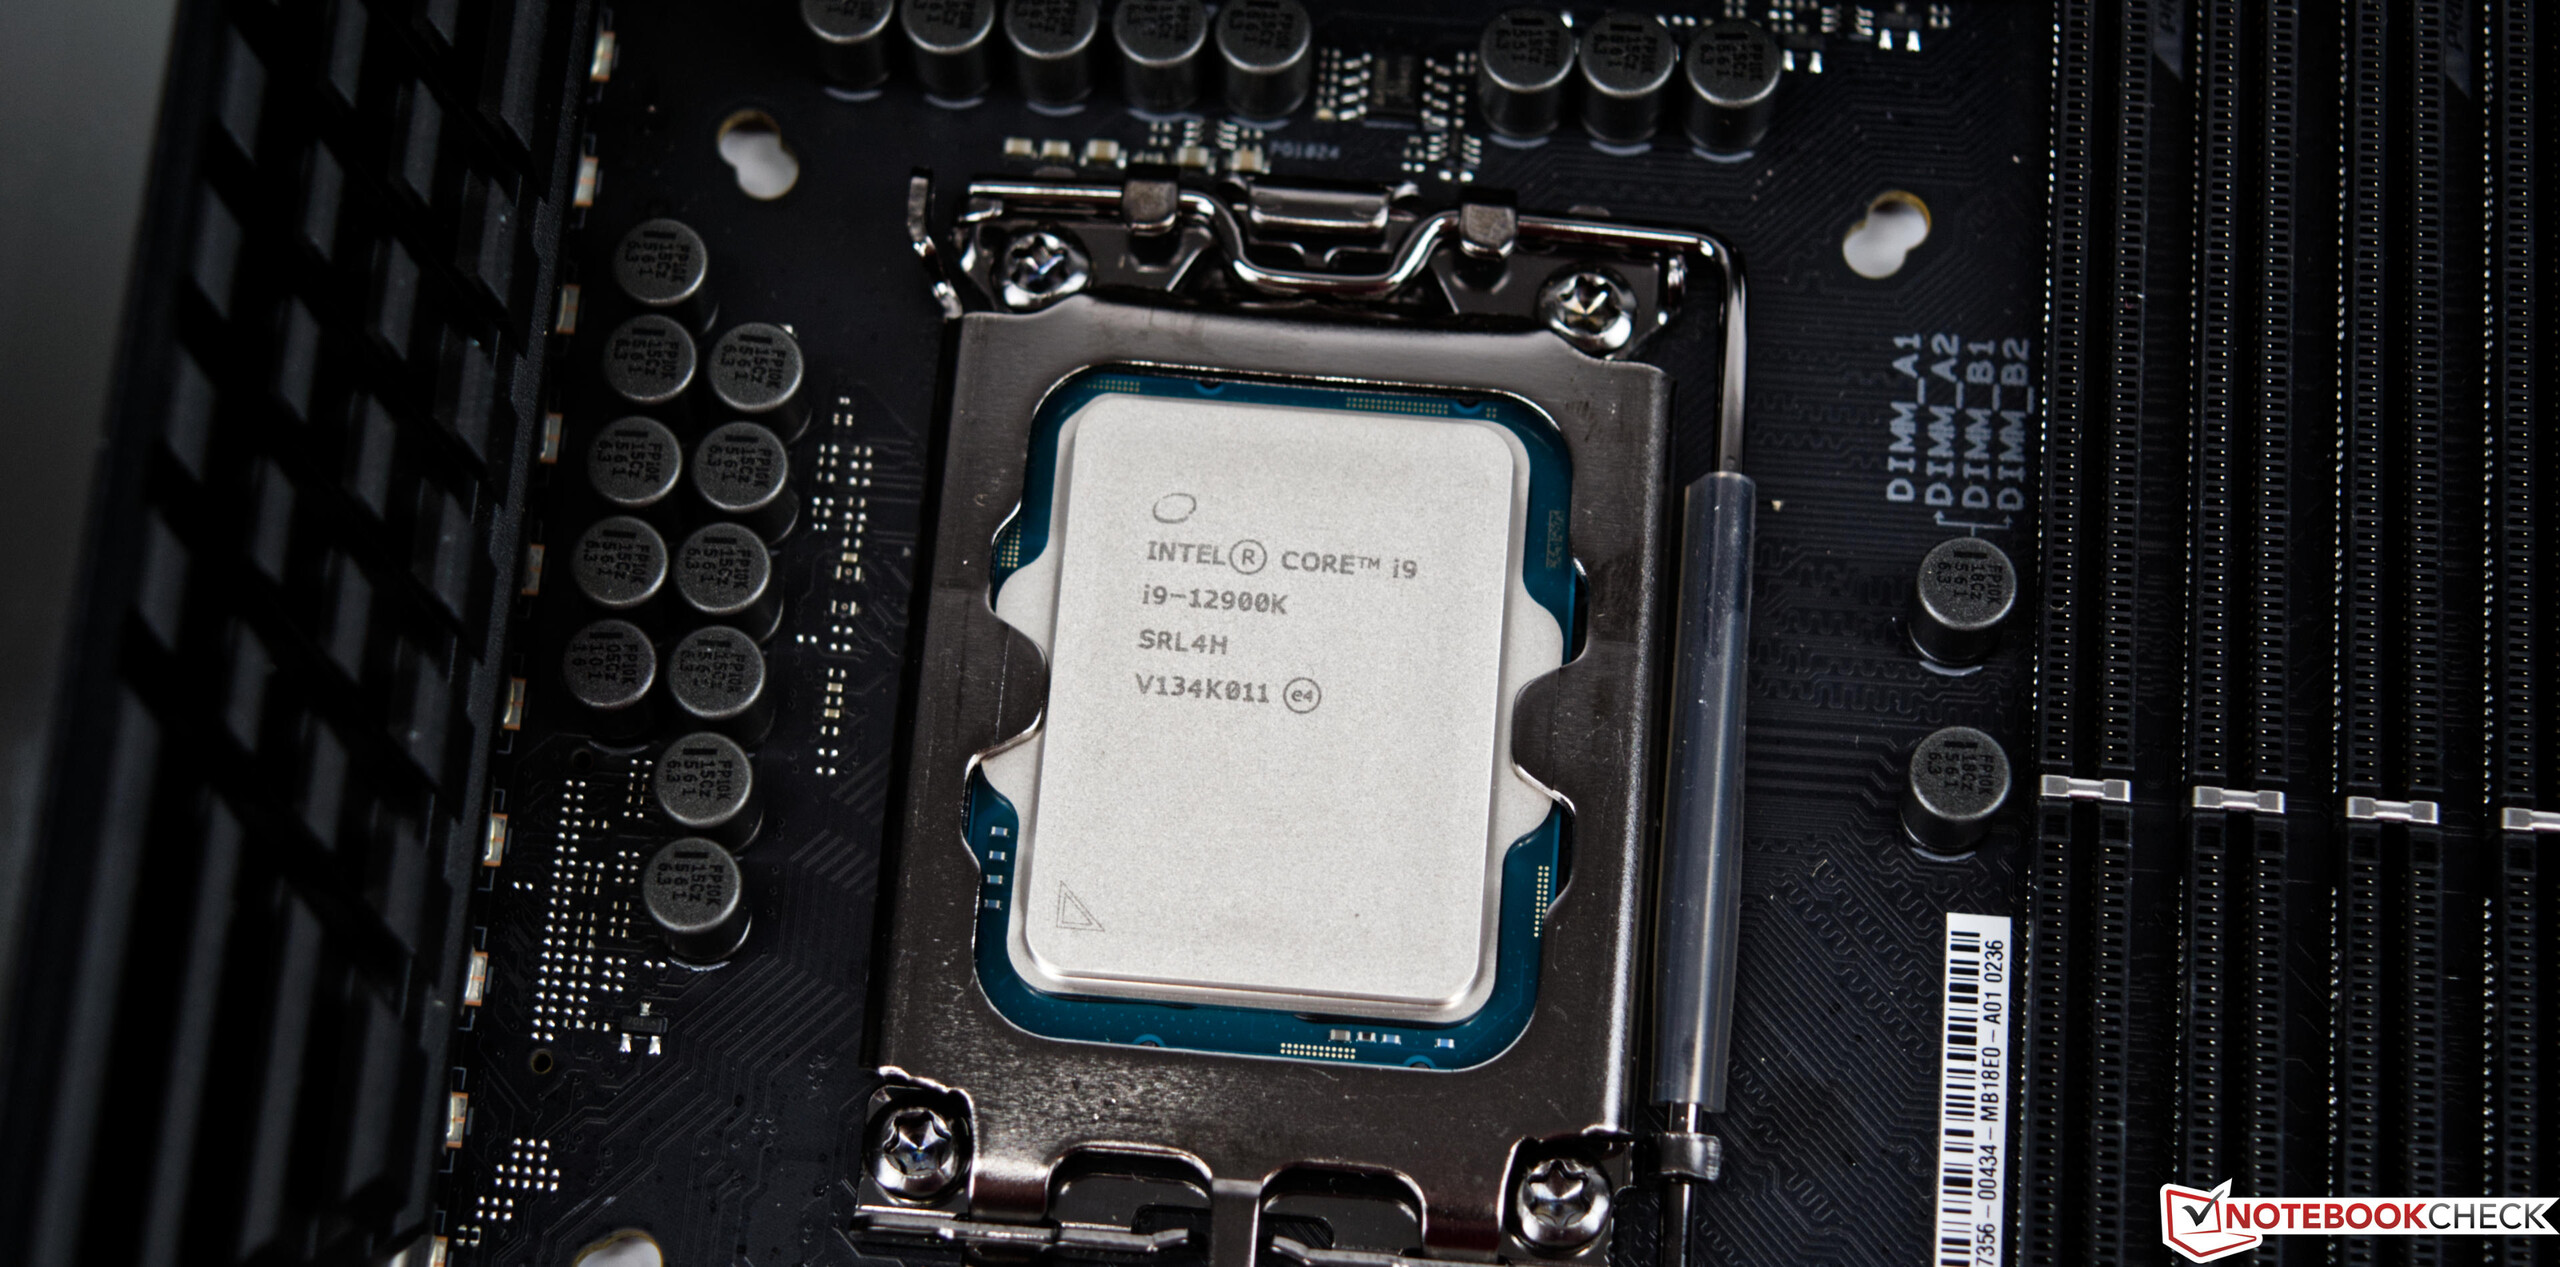
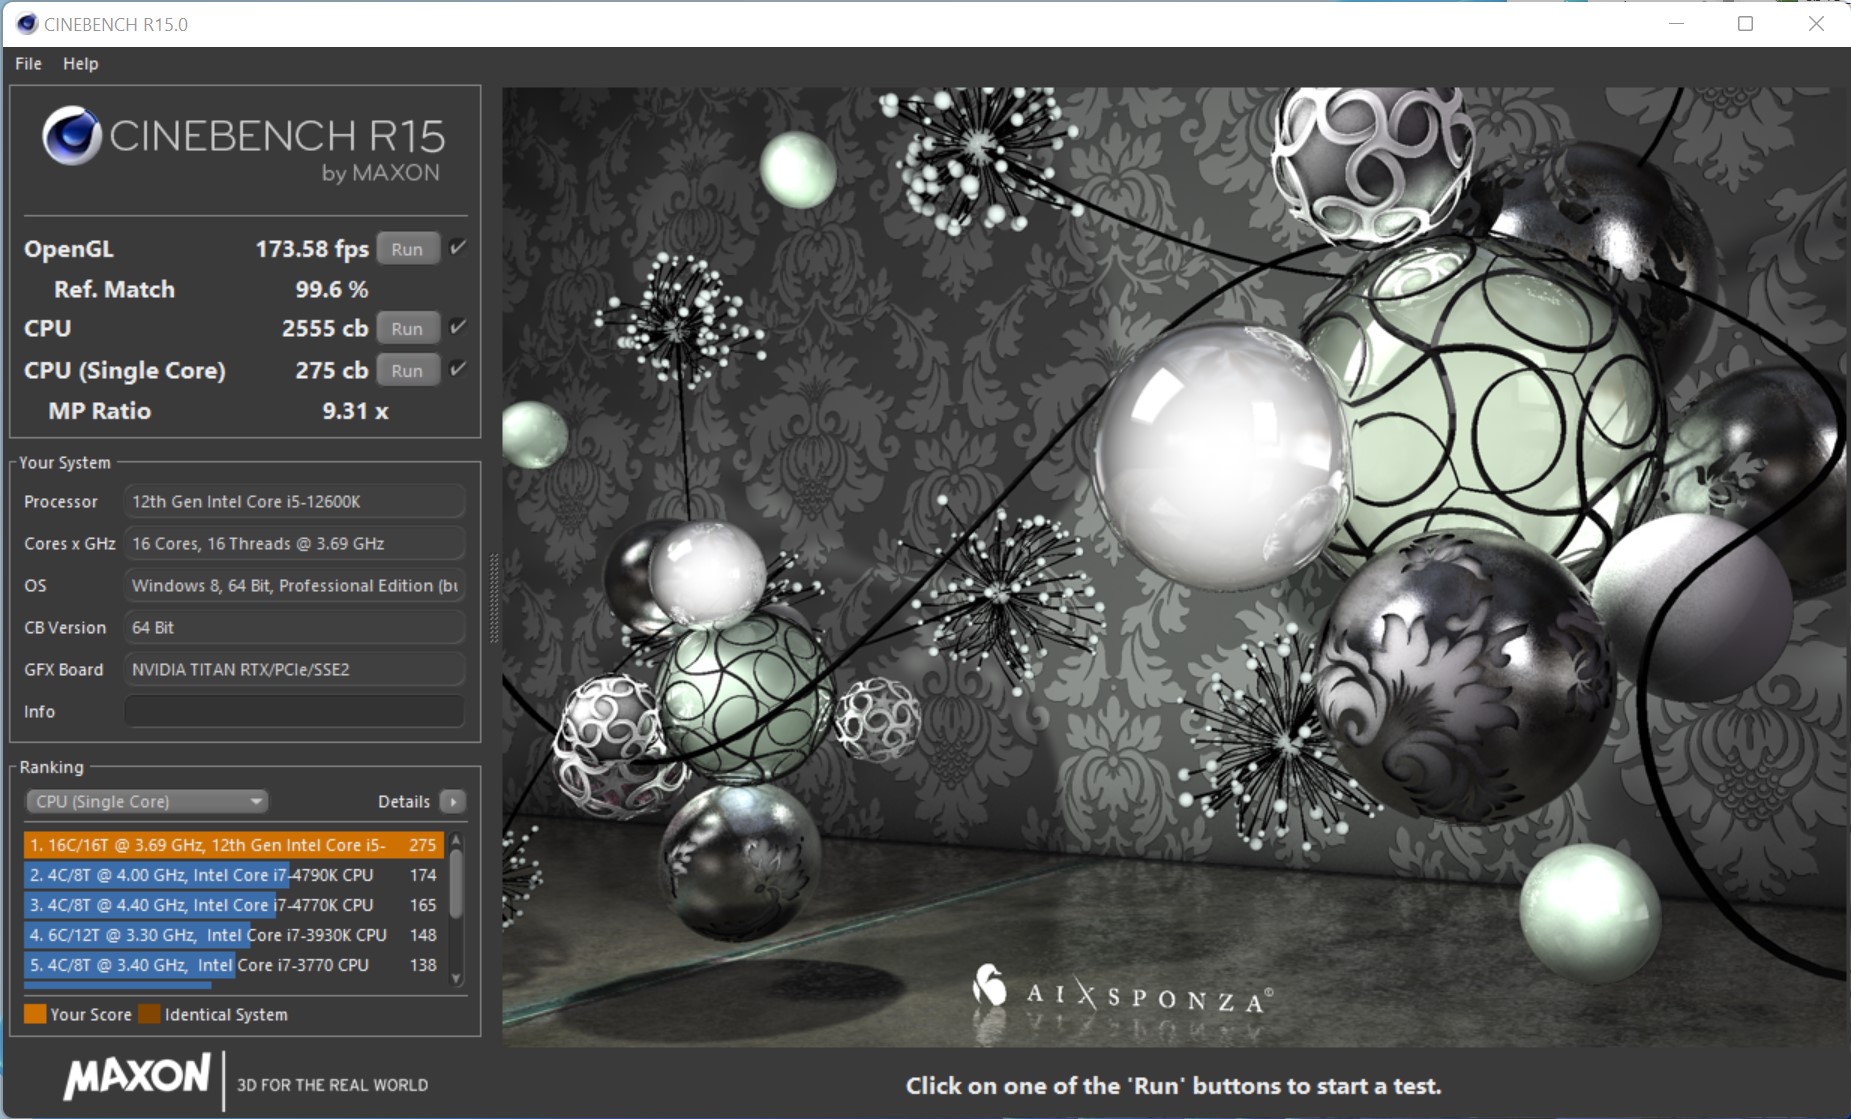
Intel Core i5-12600K


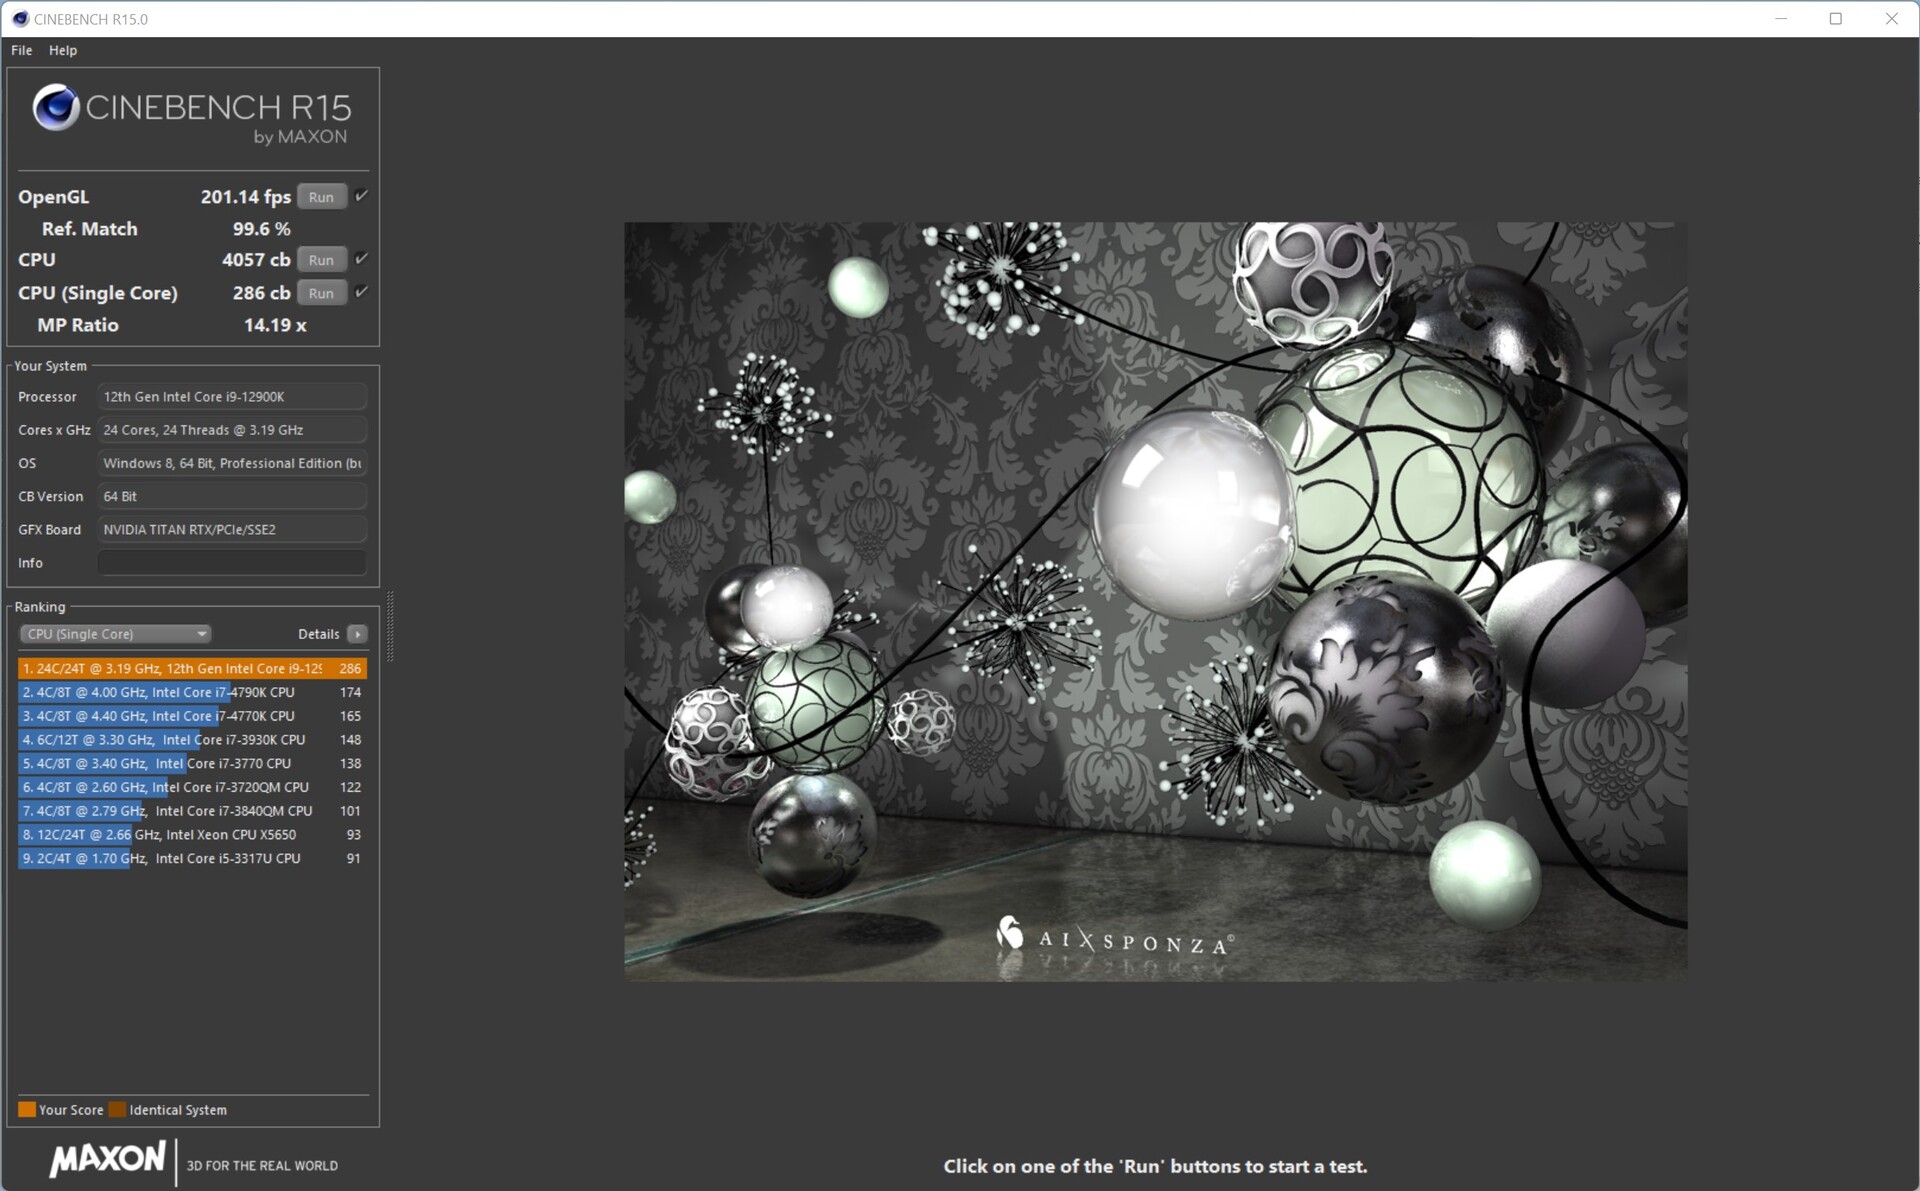
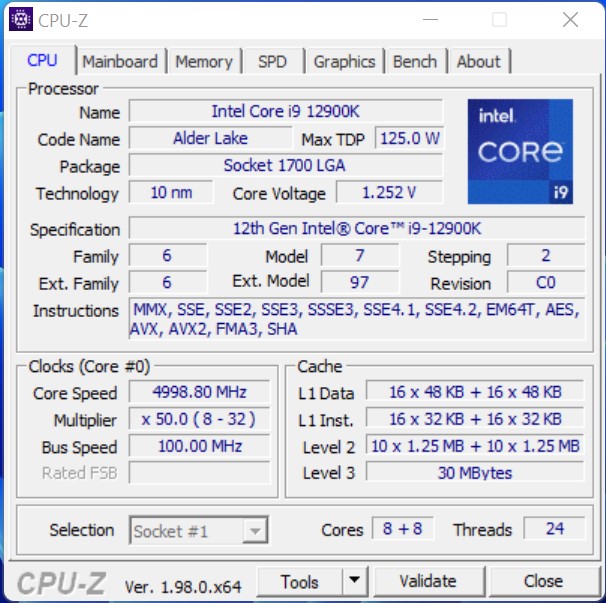
Intel Core i9-12900K

| Performance rating - Percent | |
| Intel Core i9-12900K | |
| AMD Ryzen 9 5950X | |
| Intel Core i5-12600K | |
| AMD Ryzen 9 5900X -2! | |
| AMD Ryzen 7 5800X | |
| Intel Core i9-11900K | |
| Intel Core i9-10900K | |
| AMD Ryzen 5 5600X | |
| Intel Core i5-11600K | |
| Intel Core i5-10600K | |
| Cinebench R15 | |
| CPU Single 64Bit | |
| Intel Core i9-12900K | |
| Intel Core i5-12600K | |
| AMD Ryzen 9 5950X | |
| AMD Ryzen 9 5900X | |
| AMD Ryzen 7 5800X | |
| Intel Core i9-11900K | |
| AMD Ryzen 5 5600X | |
| Intel Core i5-11600K | |
| Intel Core i9-10900K | |
| Intel Core i5-10600K | |
| CPU Multi 64Bit | |
| AMD Ryzen 9 5950X | |
| Intel Core i9-12900K | |
| AMD Ryzen 9 5900X | |
| Intel Core i9-10900K | |
| AMD Ryzen 7 5800X | |
| Intel Core i5-12600K | |
| Intel Core i9-11900K | |
| AMD Ryzen 5 5600X | |
| Intel Core i5-11600K | |
| Intel Core i5-10600K | |
| Cinebench R20 | |
| CPU (Single Core) | |
| Intel Core i9-12900K | |
| Intel Core i5-12600K | |
| Intel Core i9-11900K | |
| AMD Ryzen 9 5950X | |
| AMD Ryzen 9 5900X | |
| AMD Ryzen 7 5800X | |
| AMD Ryzen 5 5600X | |
| Intel Core i5-11600K | |
| Intel Core i9-10900K | |
| Intel Core i5-10600K | |
| CPU (Multi Core) | |
| AMD Ryzen 9 5950X | |
| Intel Core i9-12900K | |
| AMD Ryzen 9 5900X | |
| Intel Core i5-12600K | |
| Intel Core i9-10900K | |
| AMD Ryzen 7 5800X | |
| Intel Core i9-11900K | |
| AMD Ryzen 5 5600X | |
| Intel Core i5-11600K | |
| Intel Core i5-10600K | |
| Cinebench R23 | |
| Single Core | |
| Intel Core i9-12900K | |
| Intel Core i5-12600K | |
| Intel Core i9-11900K | |
| AMD Ryzen 9 5950X | |
| AMD Ryzen 9 5900X | |
| Intel Core i5-11600K | |
| AMD Ryzen 7 5800X | |
| AMD Ryzen 5 5600X | |
| Intel Core i5-10600K | |
| Intel Core i9-10900K | |
| Multi Core | |
| AMD Ryzen 9 5950X | |
| Intel Core i9-12900K | |
| AMD Ryzen 9 5900X | |
| Intel Core i5-12600K | |
| Intel Core i9-10900K | |
| Intel Core i9-11900K | |
| AMD Ryzen 7 5800X | |
| AMD Ryzen 5 5600X | |
| Intel Core i5-11600K | |
| Intel Core i5-10600K | |
| Cinebench R11.5 | |
| CPU Single 64Bit | |
| Intel Core i9-12900K | |
| Intel Core i5-12600K | |
| AMD Ryzen 9 5900X | |
| AMD Ryzen 9 5950X | |
| Intel Core i9-11900K | |
| AMD Ryzen 7 5800X | |
| AMD Ryzen 5 5600X | |
| Intel Core i5-11600K | |
| Intel Core i9-10900K | |
| Intel Core i5-10600K | |
| CPU Multi 64Bit | |
| AMD Ryzen 9 5950X | |
| Intel Core i9-12900K | |
| AMD Ryzen 9 5900X | |
| Intel Core i5-12600K | |
| AMD Ryzen 7 5800X | |
| Intel Core i9-10900K | |
| Intel Core i9-11900K | |
| AMD Ryzen 5 5600X | |
| Intel Core i5-11600K | |
| Intel Core i5-10600K | |
| Cinebench R10 | |
| Rendering Single CPUs 64Bit | |
| Intel Core i9-12900K | |
| Intel Core i5-12600K | |
| Intel Core i9-11900K | |
| AMD Ryzen 9 5950X | |
| AMD Ryzen 7 5800X | |
| Intel Core i5-11600K | |
| AMD Ryzen 9 5900X | |
| AMD Ryzen 5 5600X | |
| Intel Core i9-10900K | |
| Intel Core i5-10600K | |
| Rendering Multiple CPUs 64Bit | |
| Intel Core i9-12900K | |
| AMD Ryzen 9 5950X | |
| AMD Ryzen 9 5900X | |
| Intel Core i5-12600K | |
| AMD Ryzen 7 5800X | |
| Intel Core i9-11900K | |
| Intel Core i9-10900K | |
| AMD Ryzen 5 5600X | |
| Intel Core i5-11600K | |
| Intel Core i5-10600K | |
| Blender - v2.79 BMW27 CPU | |
| Intel Core i5-10600K | |
| Intel Core i5-11600K | |
| AMD Ryzen 5 5600X | |
| AMD Ryzen 7 5800X | |
| Intel Core i9-11900K | |
| Intel Core i5-12600K | |
| Intel Core i9-10900K | |
| AMD Ryzen 9 5900X | |
| Intel Core i9-12900K | |
| AMD Ryzen 9 5950X | |
| wPrime 2.10 | |
| 32m | |
| Intel Core i9-12900K | |
| Intel Core i5-11600K | |
| Intel Core i5-12600K | |
| Intel Core i5-10600K | |
| Intel Core i9-11900K | |
| AMD Ryzen 5 5600X | |
| Intel Core i9-10900K | |
| AMD Ryzen 7 5800X | |
| AMD Ryzen 9 5950X | |
| 1024m | |
| Intel Core i5-12600K | |
| Intel Core i9-12900K | |
| AMD Ryzen 5 5600X | |
| Intel Core i5-10600K | |
| Intel Core i5-11600K | |
| AMD Ryzen 7 5800X | |
| Intel Core i9-11900K | |
| Intel Core i9-10900K | |
| AMD Ryzen 9 5950X | |
| X264 HD Benchmark 4.0 | |
| Pass 1 | |
| Intel Core i9-12900K | |
| AMD Ryzen 7 5800X | |
| AMD Ryzen 9 5950X | |
| AMD Ryzen 9 5900X | |
| Intel Core i5-12600K | |
| AMD Ryzen 5 5600X | |
| Intel Core i9-11900K | |
| Intel Core i5-11600K | |
| Intel Core i9-10900K | |
| Intel Core i5-10600K | |
| Pass 2 | |
| AMD Ryzen 9 5950X | |
| Intel Core i9-12900K | |
| AMD Ryzen 9 5900X | |
| AMD Ryzen 7 5800X | |
| Intel Core i9-10900K | |
| Intel Core i5-12600K | |
| Intel Core i9-11900K | |
| AMD Ryzen 5 5600X | |
| Intel Core i5-11600K | |
| Intel Core i5-10600K | |
| WinRAR - Result | |
| AMD Ryzen 7 5800X | |
| AMD Ryzen 9 5900X | |
| AMD Ryzen 5 5600X | |
| AMD Ryzen 9 5950X | |
| Intel Core i9-12900K | |
| Intel Core i9-10900K | |
| Intel Core i9-11900K | |
| Intel Core i5-11600K | |
| Intel Core i5-10600K | |
| Intel Core i5-12600K | |
| TrueCrypt | |
| AES Mean 100MB | |
| AMD Ryzen 9 5950X | |
| AMD Ryzen 9 5900X | |
| Intel Core i9-12900K | |
| AMD Ryzen 7 5800X | |
| Intel Core i9-10900K | |
| Intel Core i9-11900K | |
| Intel Core i5-12600K | |
| AMD Ryzen 5 5600X | |
| Intel Core i5-11600K | |
| Intel Core i5-10600K | |
| Twofish Mean 100MB | |
| AMD Ryzen 9 5950X | |
| Intel Core i9-12900K | |
| AMD Ryzen 9 5900X | |
| Intel Core i9-10900K | |
| Intel Core i5-12600K | |
| AMD Ryzen 7 5800X | |
| Intel Core i9-11900K | |
| AMD Ryzen 5 5600X | |
| Intel Core i5-11600K | |
| Intel Core i5-10600K | |
| Serpent Mean 100MB | |
| AMD Ryzen 9 5950X | |
| Intel Core i9-12900K | |
| AMD Ryzen 9 5900X | |
| Intel Core i9-10900K | |
| AMD Ryzen 7 5800X | |
| Intel Core i5-12600K | |
| Intel Core i9-11900K | |
| AMD Ryzen 5 5600X | |
| Intel Core i5-11600K | |
| Intel Core i5-10600K | |
| Geekbench 5.5 | |
| Multi-Core | |
| Intel Core i9-12900K | |
| AMD Ryzen 9 5950X | |
| AMD Ryzen 9 5900X | |
| Intel Core i5-12600K | |
| Intel Core i9-10900K | |
| AMD Ryzen 7 5800X | |
| Intel Core i9-11900K | |
| AMD Ryzen 5 5600X | |
| Intel Core i5-11600K | |
| Intel Core i5-10600K | |
| Single-Core | |
| Intel Core i9-12900K | |
| Intel Core i5-12600K | |
| Intel Core i9-11900K | |
| Intel Core i5-11600K | |
| AMD Ryzen 9 5950X | |
| AMD Ryzen 9 5900X | |
| AMD Ryzen 7 5800X | |
| AMD Ryzen 5 5600X | |
| Intel Core i9-10900K | |
| Intel Core i5-10600K | |
| Geekbench 5.0 | |
| 5.0 Multi-Core | |
| Intel Core i9-12900K | |
| AMD Ryzen 9 5950X | |
| AMD Ryzen 9 5900X | |
| Intel Core i5-12600K | |
| Intel Core i9-10900K | |
| AMD Ryzen 7 5800X | |
| Intel Core i9-11900K | |
| AMD Ryzen 5 5600X | |
| Intel Core i5-11600K | |
| Intel Core i5-10600K | |
| 5.0 Single-Core | |
| Intel Core i9-12900K | |
| Intel Core i9-11900K | |
| Intel Core i5-12600K | |
| Intel Core i5-11600K | |
| AMD Ryzen 9 5950X | |
| AMD Ryzen 7 5800X | |
| AMD Ryzen 9 5900X | |
| AMD Ryzen 5 5600X | |
| Intel Core i9-10900K | |
| Intel Core i5-10600K | |
| Geekbench 4.4 | |
| 64 Bit Single-Core Score | |
| Intel Core i9-12900K | |
| Intel Core i5-12600K | |
| Intel Core i9-11900K | |
| Intel Core i5-11600K | |
| AMD Ryzen 7 5800X | |
| AMD Ryzen 9 5900X | |
| AMD Ryzen 9 5950X | |
| AMD Ryzen 5 5600X | |
| Intel Core i9-10900K | |
| Intel Core i5-10600K | |
| 64 Bit Multi-Core Score | |
| Intel Core i9-12900K | |
| AMD Ryzen 9 5950X | |
| AMD Ryzen 9 5900X | |
| Intel Core i5-12600K | |
| AMD Ryzen 7 5800X | |
| Intel Core i9-10900K | |
| Intel Core i9-11900K | |
| AMD Ryzen 5 5600X | |
| Intel Core i5-11600K | |
| Intel Core i5-10600K | |
| 3DMark 11 - 1280x720 Performance Physics | |
| Intel Core i9-12900K | |
| AMD Ryzen 9 5950X | |
| Intel Core i5-12600K | |
| AMD Ryzen 9 5900X | |
| AMD Ryzen 7 5800X | |
| Intel Core i9-10900K | |
| Intel Core i9-11900K | |
| AMD Ryzen 5 5600X | |
| Intel Core i5-11600K | |
| Intel Core i5-10600K | |
| 7-Zip 18.03 | |
| 7z b 4 | |
| AMD Ryzen 9 5950X | |
| Intel Core i9-12900K | |
| AMD Ryzen 9 5900X | |
| AMD Ryzen 7 5800X | |
| Intel Core i9-10900K | |
| Intel Core i5-12600K | |
| Intel Core i9-11900K | |
| AMD Ryzen 5 5600X | |
| Intel Core i5-11600K | |
| Intel Core i5-10600K | |
| 7z b 4 -mmt1 | |
| AMD Ryzen 9 5950X | |
| AMD Ryzen 7 5800X | |
| AMD Ryzen 9 5900X | |
| Intel Core i9-11900K | |
| AMD Ryzen 5 5600X | |
| Intel Core i9-12900K | |
| Intel Core i5-11600K | |
| Intel Core i9-10900K | |
| Intel Core i5-12600K | |
| Intel Core i5-10600K | |
| HWBOT x265 Benchmark v2.2 - 4k Preset | |
| AMD Ryzen 9 5950X | |
| Intel Core i5-12600K | |
| Intel Core i9-12900K | |
| AMD Ryzen 9 5900X | |
| Intel Core i9-10900K | |
| AMD Ryzen 7 5800X | |
| Intel Core i9-11900K | |
| AMD Ryzen 5 5600X | |
| Intel Core i5-11600K | |
| Intel Core i5-10600K | |
| R Benchmark 2.5 - Overall mean | |
| Intel Core i5-10600K | |
| Intel Core i9-10900K | |
| Intel Core i5-11600K | |
| AMD Ryzen 5 5600X | |
| Intel Core i9-11900K | |
| AMD Ryzen 9 5950X | |
| AMD Ryzen 9 5900X | |
| AMD Ryzen 7 5800X | |
| Intel Core i5-12600K | |
| Intel Core i9-12900K | |
| LibreOffice - 20 Documents To PDF | |
| Intel Core i9-10900K | |
| Intel Core i9-11900K | |
| Intel Core i5-12600K | |
| AMD Ryzen 9 5900X | |
| Intel Core i5-10600K | |
| AMD Ryzen 9 5950X | |
| AMD Ryzen 5 5600X | |
| AMD Ryzen 7 5800X | |
| Intel Core i9-12900K | |
| Intel Core i5-11600K | |
| WebXPRT 3 - Overall | |
| Intel Core i9-12900K | |
| AMD Ryzen 7 5800X | |
| Intel Core i5-12600K | |
| AMD Ryzen 9 5950X | |
| AMD Ryzen 5 5600X | |
| AMD Ryzen 9 5900X | |
| Intel Core i5-11600K | |
| Intel Core i9-10900K | |
| Intel Core i5-10600K | |
| Intel Core i9-11900K | |
| Mozilla Kraken 1.1 - Total | |
| Intel Core i5-10600K | |
| Intel Core i9-10900K | |
| Intel Core i5-11600K | |
| AMD Ryzen 5 5600X | |
| AMD Ryzen 9 5900X | |
| AMD Ryzen 7 5800X | |
| AMD Ryzen 9 5950X | |
| Intel Core i9-11900K | |
| Intel Core i5-12600K | |
| Intel Core i9-12900K | |
| 3DMark | |
| 3840x2160 Fire Strike Ultra Physics | |
| Intel Core i9-12900K | |
| AMD Ryzen 9 5950X | |
| AMD Ryzen 9 5900X | |
| AMD Ryzen 7 5800X | |
| Intel Core i5-12600K | |
| Intel Core i9-10900K | |
| Intel Core i9-11900K | |
| AMD Ryzen 5 5600X | |
| Intel Core i5-11600K | |
| Intel Core i5-10600K | |
| 1920x1080 Fire Strike Physics | |
| AMD Ryzen 9 5950X | |
| Intel Core i9-12900K | |
| AMD Ryzen 9 5900X | |
| AMD Ryzen 7 5800X | |
| Intel Core i9-10900K | |
| Intel Core i5-12600K | |
| Intel Core i9-11900K | |
| AMD Ryzen 5 5600X | |
| Intel Core i5-11600K | |
| Intel Core i5-10600K | |
| 2560x1440 Time Spy CPU | |
| Intel Core i9-12900K | |
| Intel Core i9-10900K | |
| Intel Core i5-12600K | |
| AMD Ryzen 9 5950X | |
| Intel Core i9-11900K | |
| AMD Ryzen 9 5900X | |
| AMD Ryzen 7 5800X | |
| Intel Core i5-11600K | |
| AMD Ryzen 5 5600X | |
| Intel Core i5-10600K | |
* ... kleiner is beter
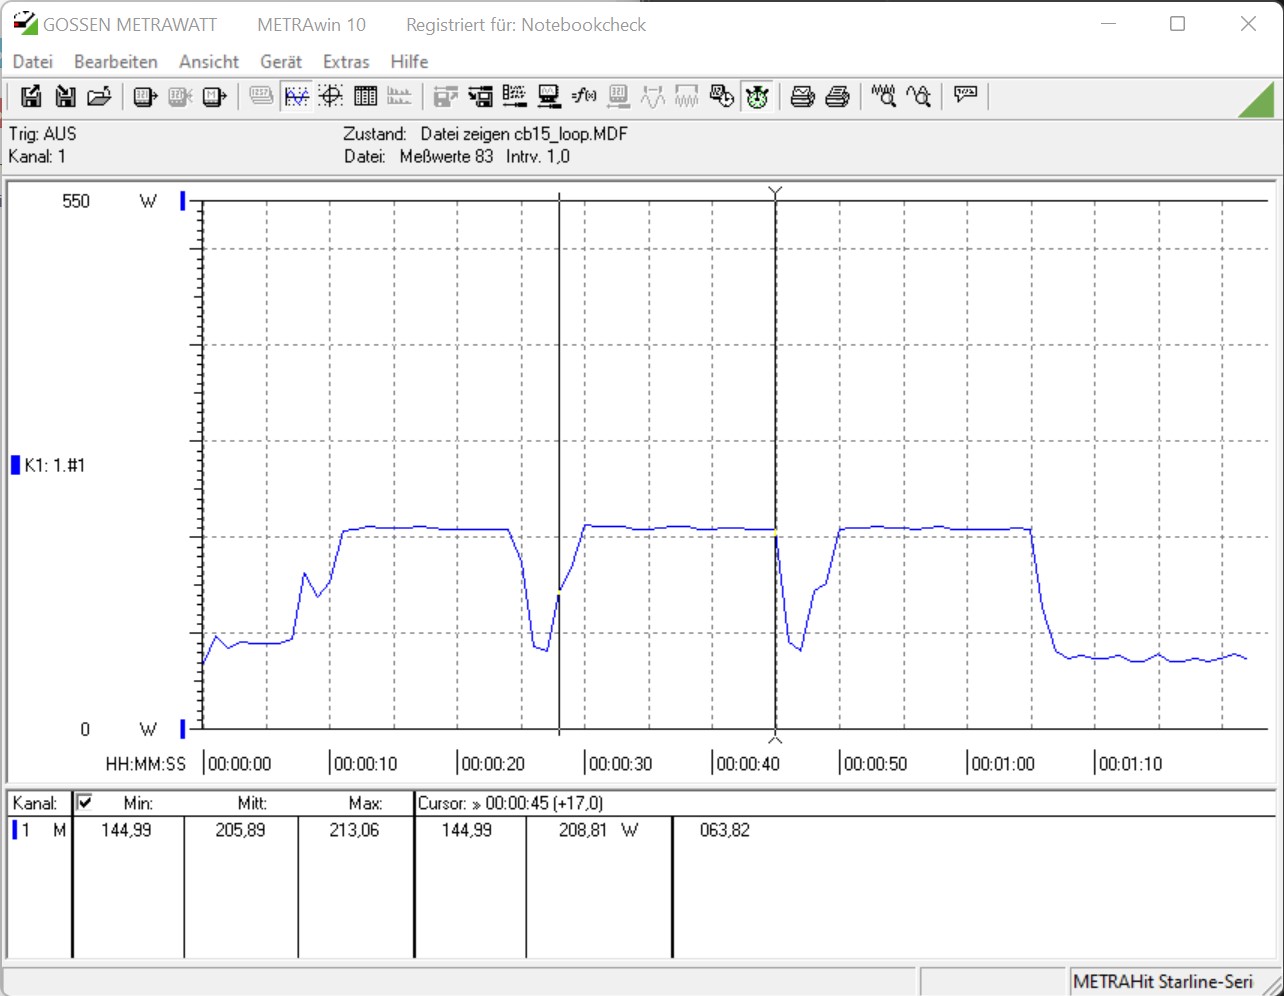
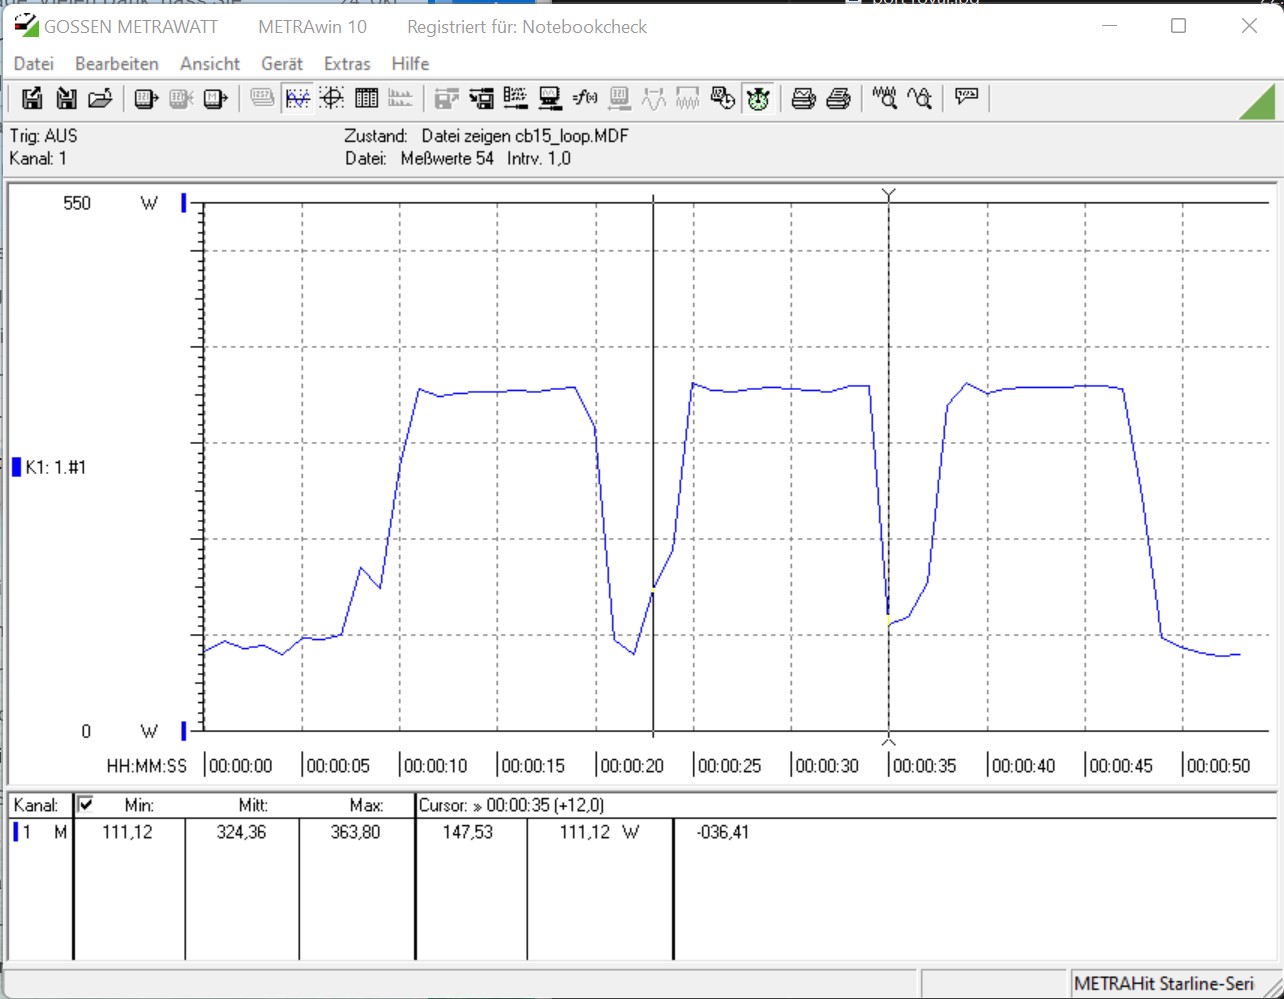
Alder Lake-S vs. Cinebench R15 Multi Loop
Onze beide testeenheden presteren zeer stabiel in de belastingstest. Vergeleken met deIntel Core i9-11900Kis de Intel Core i9-12900K in staat om continu en zonder enige prestatiedaling de eerste plaats in te nemen met een gemiddelde van 3987 punten. De Intel Core i5-12600K is ook in staat om een stabiele voorsprong te nemen op de Intel Core i5-11600KRocket Lake-S voorganger met een aanzienlijk voordeel. Het hogere aantal native rekenkernen zorgt voor dit algemene prestatieverschil
Synthetische benchmarks en applicatieprestaties
In de synthetische benchmarks liggen de nieuwe Alder Lake-S processoren voor. Afgezien van enkele uitzonderingen waarbij AMD het betere platform zou bieden, weet de Intel Core i9-12900K een stevige voorsprong te behalen. Het is dan ook niet verbazingwekkend dat de twee Alder Lake-S CPU's de twee topplaatsen delen in de twee cumulatieve benchmarkresultaten. We waren echter nog steeds een beetje verrast, omdat we geen tweede plaats hadden verwacht voor de Intel Core i5-12600K in de algemene rangschikking.
| Performance rating - Percent | |
| Intel Core i9-12900K | |
| Intel Core i5-12600K | |
| AMD Ryzen 7 5800X | |
| AMD Ryzen 9 5950X | |
| AMD Ryzen 5 5600X | |
| AMD Ryzen 9 5900X | |
| Intel Core i9-11900K | |
| Intel Core i9-10900K | |
| Intel Core i5-11600K | |
| Intel Core i7-10700K | |
| Intel Core i5-10600K | |
| 3DMark | |
| 1920x1080 Fire Strike Physics | |
| AMD Ryzen 9 5950X | |
| Intel Core i9-12900K | |
| AMD Ryzen 9 5900X | |
| AMD Ryzen 7 5800X | |
| Intel Core i9-10900K | |
| Intel Core i5-12600K | |
| Intel Core i9-11900K | |
| AMD Ryzen 5 5600X | |
| Intel Core i7-10700K | |
| Intel Core i5-11600K | |
| Intel Core i5-10600K | |
| 1920x1080 Fire Strike Graphics | |
| Intel Core i5-12600K | |
| Intel Core i9-12900K | |
| Intel Core i7-10700K | |
| Intel Core i5-11600K | |
| AMD Ryzen 7 5800X | |
| Intel Core i9-10900K | |
| Intel Core i9-11900K | |
| AMD Ryzen 9 5950X | |
| AMD Ryzen 5 5600X | |
| Intel Core i5-10600K | |
| AMD Ryzen 9 5900X | |
| Fire Strike Extreme Graphics | |
| Intel Core i5-12600K | |
| Intel Core i9-12900K | |
| Intel Core i5-11600K | |
| AMD Ryzen 5 5600X | |
| Intel Core i7-10700K | |
| Intel Core i9-11900K | |
| AMD Ryzen 9 5950X | |
| AMD Ryzen 7 5800X | |
| Intel Core i9-10900K | |
| AMD Ryzen 9 5900X | |
| Intel Core i5-10600K | |
| 3840x2160 Fire Strike Ultra Graphics | |
| Intel Core i5-12600K | |
| Intel Core i9-12900K | |
| Intel Core i5-11600K | |
| Intel Core i9-11900K | |
| AMD Ryzen 7 5800X | |
| AMD Ryzen 5 5600X | |
| Intel Core i7-10700K | |
| AMD Ryzen 9 5950X | |
| Intel Core i9-10900K | |
| AMD Ryzen 9 5900X | |
| Intel Core i5-10600K | |
| 3DMark 11 | |
| 1280x720 Performance GPU | |
| Intel Core i7-10700K | |
| Intel Core i5-12600K | |
| Intel Core i9-10900K | |
| AMD Ryzen 9 5950X | |
| AMD Ryzen 7 5800X | |
| Intel Core i9-12900K | |
| AMD Ryzen 5 5600X | |
| Intel Core i9-11900K | |
| Intel Core i5-10600K | |
| Intel Core i5-11600K | |
| AMD Ryzen 9 5900X | |
| 1280x720 Performance Physics | |
| Intel Core i9-12900K | |
| AMD Ryzen 9 5950X | |
| Intel Core i5-12600K | |
| AMD Ryzen 9 5900X | |
| AMD Ryzen 7 5800X | |
| Intel Core i9-10900K | |
| Intel Core i9-11900K | |
| AMD Ryzen 5 5600X | |
| Intel Core i7-10700K | |
| Intel Core i5-11600K | |
| Intel Core i5-10600K | |
| PCMark 10 - Score | |
| AMD Ryzen 9 5950X | |
| Intel Core i9-12900K | |
| AMD Ryzen 9 5900X | |
| AMD Ryzen 5 5600X | |
| Intel Core i5-12600K | |
| AMD Ryzen 7 5800X | |
| Intel Core i9-11900K | |
| Intel Core i5-11600K | |
| Intel Core i9-10900K | |
| Intel Core i7-10700K | |
| Intel Core i5-10600K | |
Gaming-benchmarks
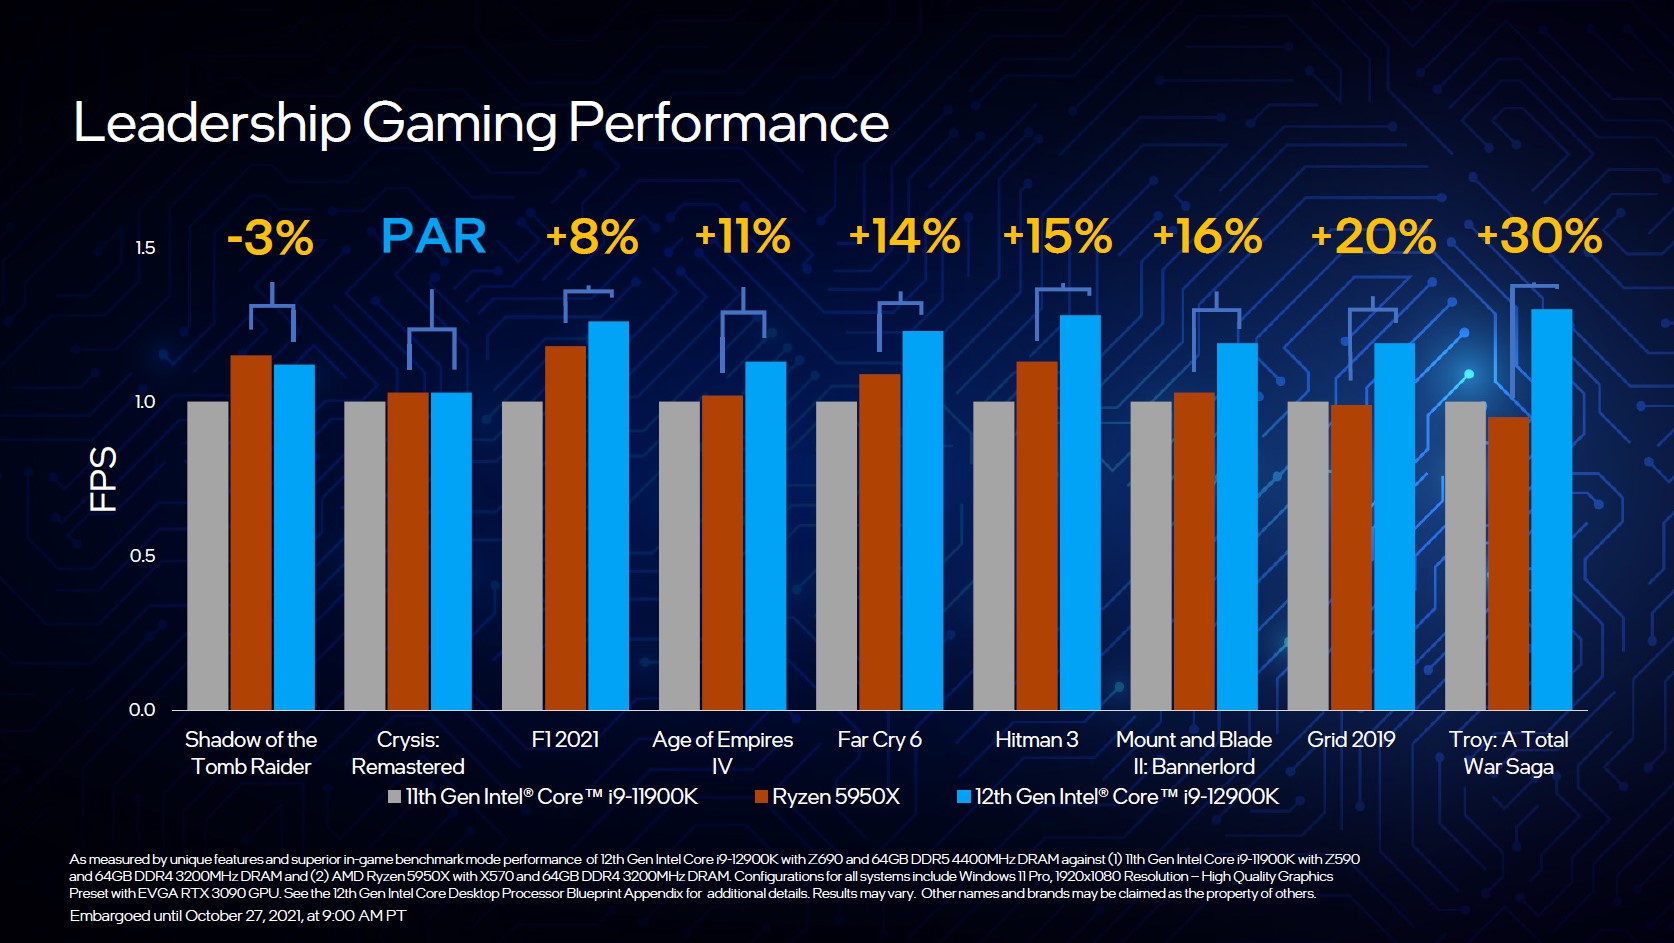
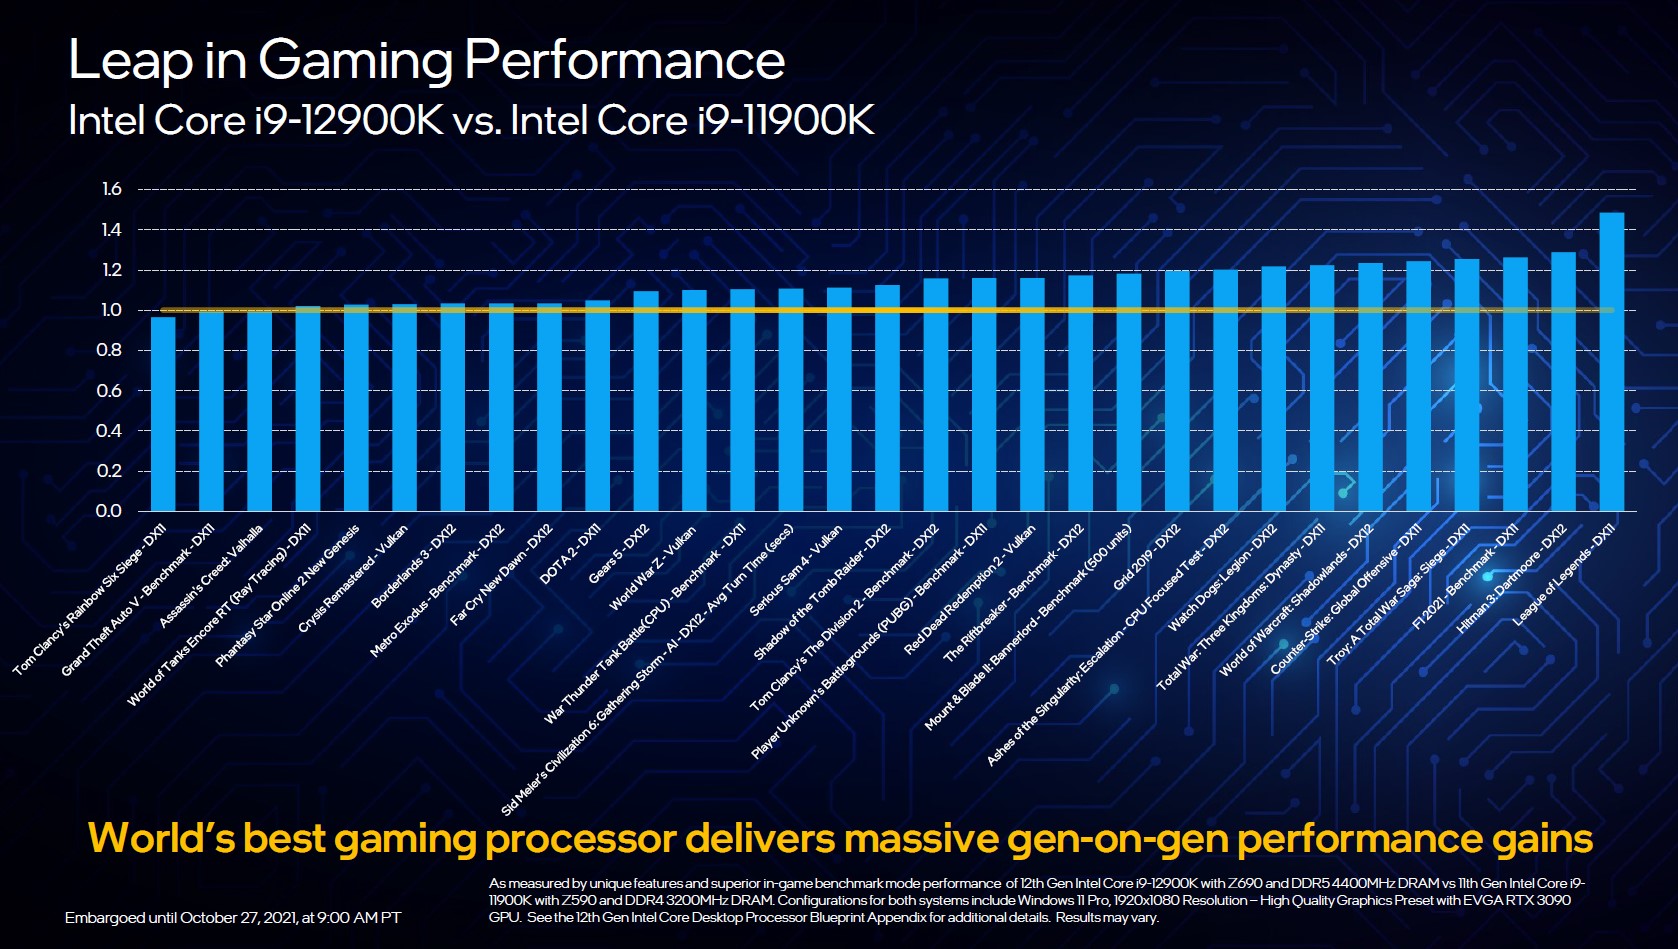
Nu komen we bij de meest interessante benchmarks en het vakgebied waar de nieuwe Intel Alder Lake-S processoren echt hun capaciteiten kunnen tonen. In vergelijking met Rocket Lake-S zijn de nieuwe processoren in staat om hun prestaties aanzienlijk te verhogen, zoals je kunt zien in de gaming benchmarks. In de cumulatieve vergelijking van de negen games, is de Intel Core i9-12900K in staat om net voor te gaan op de AMD Ryzen 9 5900X. Je moet hier ook weten dat er sommige games zijn die beter harmoniëren met Intel processoren en andere die de betere prestaties bieden met AMD processoren. In de interne competitie van de twee Alder Lake-S processoren, verliest de Intel Core i5-12600K met 8 procentpunten ten opzichte van het vlaggenschip, en eindigt net voor de Intel Core i5-11600Kmet dit.
Desalniettemin leveren beide processoren zeer goede gaming prestaties. Door de vele veranderingen in het platform en het besturingssysteem kunnen we in de toekomst wellicht ook nog wat prestatieverbeteringen verwachten in de vorm van updates. Maar daar is geen garantie voor. De prestaties in de pure CPU-limiet zijn zeer hoog en afhankelijk van het spel ook aanzienlijk beter dan de concurrenten. Toch moeten we opmerken dat Intel hier weliswaar de snelste gaming CPU in zijn portfolio heeft, maar dat de afstand tot de Zen3 processor niet uitmuntend genoemd kan worden. Bovendien schuiven alle concurrenten dichter naar elkaar toe naarmate de resolutie toeneemt, zodat de CPU slechts de tweede viool speelt achter de GPU als bepalende factor voor FPS boosting. Wie naast het eigenlijke gamen ook content streamt, zal profiteren van het hogere aantal threads, wat de nieuwe modellen ook zeer interessant maakt voor content creators.
| Performance rating - Percent | |
| Intel Core i9-12900K | |
| AMD Ryzen 9 5900X -2! | |
| AMD Ryzen 7 5800X -2! | |
| AMD Ryzen 9 5950X -2! | |
| AMD Ryzen 5 5600X -2! | |
| Intel Core i9-11900K | |
| Intel Core i5-12600K | |
| Intel Core i5-11600K | |
| Intel Core i9-10900K | |
| Intel Core i7-10700K -4! | |
| Intel Core i5-10600K | |
| Borderlands 3 | |
| 1280x720 Very Low Overall Quality (DX11) | |
| AMD Ryzen 9 5900X | |
| AMD Ryzen 7 5800X | |
| AMD Ryzen 9 5950X | |
| AMD Ryzen 5 5600X | |
| Intel Core i9-12900K | |
| Intel Core i9-11900K | |
| Intel Core i9-10900K | |
| Intel Core i5-11600K | |
| Intel Core i7-10700K | |
| Intel Core i5-12600K | |
| Intel Core i5-10600K | |
| 1920x1080 Badass Overall Quality (DX11) | |
| Intel Core i9-12900K | |
| Intel Core i5-12600K | |
| AMD Ryzen 9 5900X | |
| Intel Core i9-11900K | |
| Intel Core i9-10900K | |
| Intel Core i7-10700K | |
| AMD Ryzen 9 5950X | |
| Intel Core i5-11600K | |
| AMD Ryzen 7 5800X | |
| AMD Ryzen 5 5600X | |
| Intel Core i5-10600K | |
| Far Cry New Dawn | |
| 1280x720 Low Preset | |
| Intel Core i9-12900K | |
| Intel Core i9-11900K | |
| AMD Ryzen 9 5900X | |
| Intel Core i5-12600K | |
| Intel Core i5-11600K | |
| AMD Ryzen 7 5800X | |
| AMD Ryzen 9 5950X | |
| Intel Core i7-10700K | |
| AMD Ryzen 5 5600X | |
| Intel Core i9-10900K | |
| Intel Core i5-10600K | |
| 1920x1080 Ultra Preset | |
| Intel Core i9-12900K | |
| Intel Core i9-11900K | |
| AMD Ryzen 9 5900X | |
| Intel Core i5-11600K | |
| Intel Core i7-10700K | |
| Intel Core i5-12600K | |
| AMD Ryzen 7 5800X | |
| AMD Ryzen 9 5950X | |
| AMD Ryzen 5 5600X | |
| Intel Core i5-10600K | |
| Intel Core i9-10900K | |
| Forza Horizon 4 | |
| 1280x720 Very Low Preset | |
| Intel Core i9-12900K | |
| Intel Core i5-12600K | |
| Intel Core i9-11900K | |
| Intel Core i9-10900K | |
| Intel Core i5-11600K | |
| Intel Core i5-10600K | |
| 1920x1080 Ultra Preset AA:2xMS | |
| Intel Core i9-10900K | |
| Intel Core i9-11900K | |
| Intel Core i5-11600K | |
| Intel Core i5-10600K | |
| Intel Core i9-12900K | |
| Intel Core i5-12600K | |
| Far Cry 5 | |
| 1280x720 Low Preset AA:T | |
| Intel Core i9-12900K | |
| AMD Ryzen 9 5900X | |
| Intel Core i9-11900K | |
| AMD Ryzen 7 5800X | |
| AMD Ryzen 9 5950X | |
| AMD Ryzen 5 5600X | |
| Intel Core i5-12600K | |
| Intel Core i5-11600K | |
| Intel Core i9-10900K | |
| Intel Core i7-10700K | |
| Intel Core i5-10600K | |
| 1920x1080 Ultra Preset AA:T | |
| Intel Core i9-12900K | |
| Intel Core i9-11900K | |
| AMD Ryzen 9 5900X | |
| AMD Ryzen 7 5800X | |
| Intel Core i5-11600K | |
| AMD Ryzen 9 5950X | |
| Intel Core i5-12600K | |
| AMD Ryzen 5 5600X | |
| Intel Core i7-10700K | |
| Intel Core i9-10900K | |
| Intel Core i5-10600K | |
| X-Plane 11.11 | |
| 1280x720 low (fps_test=1) | |
| Intel Core i9-12900K | |
| AMD Ryzen 7 5800X | |
| AMD Ryzen 9 5900X | |
| AMD Ryzen 5 5600X | |
| Intel Core i5-12600K | |
| Intel Core i9-11900K | |
| AMD Ryzen 9 5950X | |
| Intel Core i5-11600K | |
| Intel Core i9-10900K | |
| Intel Core i7-10700K | |
| Intel Core i5-10600K | |
| 1920x1080 high (fps_test=3) | |
| Intel Core i9-12900K | |
| AMD Ryzen 9 5900X | |
| AMD Ryzen 7 5800X | |
| Intel Core i9-11900K | |
| AMD Ryzen 5 5600X | |
| Intel Core i5-12600K | |
| AMD Ryzen 9 5950X | |
| Intel Core i5-11600K | |
| Intel Core i9-10900K | |
| Intel Core i7-10700K | |
| Intel Core i5-10600K | |
| Final Fantasy XV Benchmark | |
| 1280x720 Lite Quality | |
| Intel Core i9-12900K | |
| AMD Ryzen 9 5900X | |
| AMD Ryzen 7 5800X | |
| AMD Ryzen 9 5950X | |
| AMD Ryzen 5 5600X | |
| Intel Core i9-10900K | |
| Intel Core i9-11900K | |
| Intel Core i5-12600K | |
| Intel Core i5-11600K | |
| Intel Core i5-10600K | |
| Intel Core i7-10700K | |
| 1920x1080 High Quality | |
| Intel Core i9-12900K | |
| Intel Core i9-11900K | |
| Intel Core i9-10900K | |
| AMD Ryzen 9 5950X | |
| Intel Core i5-11600K | |
| Intel Core i5-12600K | |
| Intel Core i5-10600K | |
| AMD Ryzen 7 5800X | |
| AMD Ryzen 9 5900X | |
| AMD Ryzen 5 5600X | |
| Intel Core i7-10700K | |
| Dota 2 Reborn | |
| 1280x720 min (0/3) fastest | |
| AMD Ryzen 7 5800X | |
| AMD Ryzen 9 5900X | |
| AMD Ryzen 5 5600X | |
| AMD Ryzen 9 5950X | |
| Intel Core i9-12900K | |
| Intel Core i9-10900K | |
| Intel Core i9-11900K | |
| Intel Core i7-10700K | |
| Intel Core i5-11600K | |
| Intel Core i5-12600K | |
| Intel Core i5-10600K | |
| 1920x1080 ultra (3/3) best looking | |
| Intel Core i9-12900K | |
| AMD Ryzen 7 5800X | |
| AMD Ryzen 9 5900X | |
| AMD Ryzen 5 5600X | |
| AMD Ryzen 9 5950X | |
| Intel Core i5-12600K | |
| Intel Core i9-10900K | |
| Intel Core i9-11900K | |
| Intel Core i5-11600K | |
| Intel Core i7-10700K | |
| Intel Core i5-10600K | |
| The Witcher 3 | |
| 1024x768 Low Graphics & Postprocessing | |
| AMD Ryzen 9 5900X | |
| AMD Ryzen 7 5800X | |
| AMD Ryzen 9 5950X | |
| Intel Core i9-12900K | |
| AMD Ryzen 5 5600X | |
| Intel Core i9-10900K | |
| Intel Core i9-11900K | |
| Intel Core i5-12600K | |
| Intel Core i7-10700K | |
| Intel Core i5-11600K | |
| Intel Core i5-10600K | |
| 1920x1080 Ultra Graphics & Postprocessing (HBAO+) | |
| Intel Core i5-11600K | |
| Intel Core i5-12600K | |
| Intel Core i7-10700K | |
| AMD Ryzen 9 5900X | |
| AMD Ryzen 9 5950X | |
| Intel Core i5-10600K | |
| Intel Core i9-11900K | |
| Intel Core i9-10900K | |
| AMD Ryzen 7 5800X | |
| AMD Ryzen 5 5600X | |
| Intel Core i9-12900K | |
| Shadow of the Tomb Raider | |
| 1280x720 Lowest Preset | |
| AMD Ryzen 7 5800X | |
| AMD Ryzen 9 5950X | |
| AMD Ryzen 9 5900X | |
| Intel Core i9-12900K | |
| AMD Ryzen 5 5600X | |
| Intel Core i9-10900K | |
| Intel Core i9-11900K | |
| Intel Core i5-12600K | |
| Intel Core i5-11600K | |
| Intel Core i5-10600K | |
| 1920x1080 Highest Preset AA:T | |
| AMD Ryzen 7 5800X | |
| Intel Core i9-12900K | |
| Intel Core i9-11900K | |
| AMD Ryzen 9 5950X | |
| AMD Ryzen 9 5900X | |
| Intel Core i9-10900K | |
| AMD Ryzen 5 5600X | |
| Intel Core i5-12600K | |
| Intel Core i5-11600K | |
| Intel Core i5-10600K | |
Intel Core i9-12900K + Nvidia Titan RTX
| lage | gem. | hoge | ultra | QHD | 4K | |
|---|---|---|---|---|---|---|
| GTA V (2015) | 187 | 187 | 185 | 135 | 123 | 138 |
| The Witcher 3 (2015) | 589 | 422 | 271 | 139 | 103 | |
| Dota 2 Reborn (2015) | 203.5 | 208.7 | 201.7 | 189.7 | 178.9 | |
| Final Fantasy XV Benchmark (2018) | 227 | 195 | 144 | 108 | 64.1 | |
| X-Plane 11.11 (2018) | 200 | 176 | 137 | 117 | ||
| Far Cry 5 (2018) | 220 | 191 | 178 | 167 | 145 | 83 |
| Strange Brigade (2018) | 593 | 371 | 308 | 266 | 197 | 115 |
| Shadow of the Tomb Raider (2018) | 221 | 192 | 183 | 169 | 124 | 69.3 |
| Forza Horizon 4 (2018) | 293 | 227 | 216 | 178 | 153 | 111 |
| Far Cry New Dawn (2019) | 188 | 162 | 154 | 140 | 129 | 84 |
| Borderlands 3 (2019) | 202 | 172 | 147 | 124 | 89.9 | 49.2 |
| F1 2020 (2020) | 432 | 343 | 303 | 213 | 167 | 101 |
| F1 2021 (2021) | 491 | 383 | 307 | 160 | 121 | 71.9 |
| Far Cry 6 (2021) | 185 | 157 | 142 | 134 | 109 | 64 |
Intel Core i5-12600K + Nvidia Titan RTX
| lage | gem. | hoge | ultra | QHD | 4K | |
|---|---|---|---|---|---|---|
| GTA V (2015) | 186 | 185 | 181 | 124 | 115 | 136 |
| The Witcher 3 (2015) | 500 | 406 | 277 | 144 | 107 | |
| Dota 2 Reborn (2015) | 183.7 | 188 | 181.1 | 174.9 | 165.8 | |
| Final Fantasy XV Benchmark (2018) | 218 | 192 | 141 | 107 | 63.6 | |
| X-Plane 11.11 (2018) | 172 | 153 | 119 | 104 | ||
| Far Cry 5 (2018) | 200 | 174 | 165 | 154 | 140 | 81 |
| Strange Brigade (2018) | 489 | 352 | 301 | 262 | 196 | 114 |
| Shadow of the Tomb Raider (2018) | 195 | 176 | 172 | 163 | 124 | 70.1 |
| Forza Horizon 4 (2018) | 263 | 218 | 212 | 178 | 154 | 112 |
| Far Cry New Dawn (2019) | 171 | 147 | 141 | 126 | 121 | 84 |
| Metro Exodus (2019) | 227 | 174 | 135 | 108 | 87.7 | 56.6 |
| Borderlands 3 (2019) | 175 | 155 | 138 | 119 | 90.4 | 49.8 |
| F1 2020 (2020) | 340 | 291 | 288 | 216 | 168 | 103 |
| F1 2021 (2021) | 407 | 367 | 302 | 160 | 122 | 72.6 |
| Far Cry 6 (2021) | 164 | 136 | 129 | 124 | 105 | 64 |
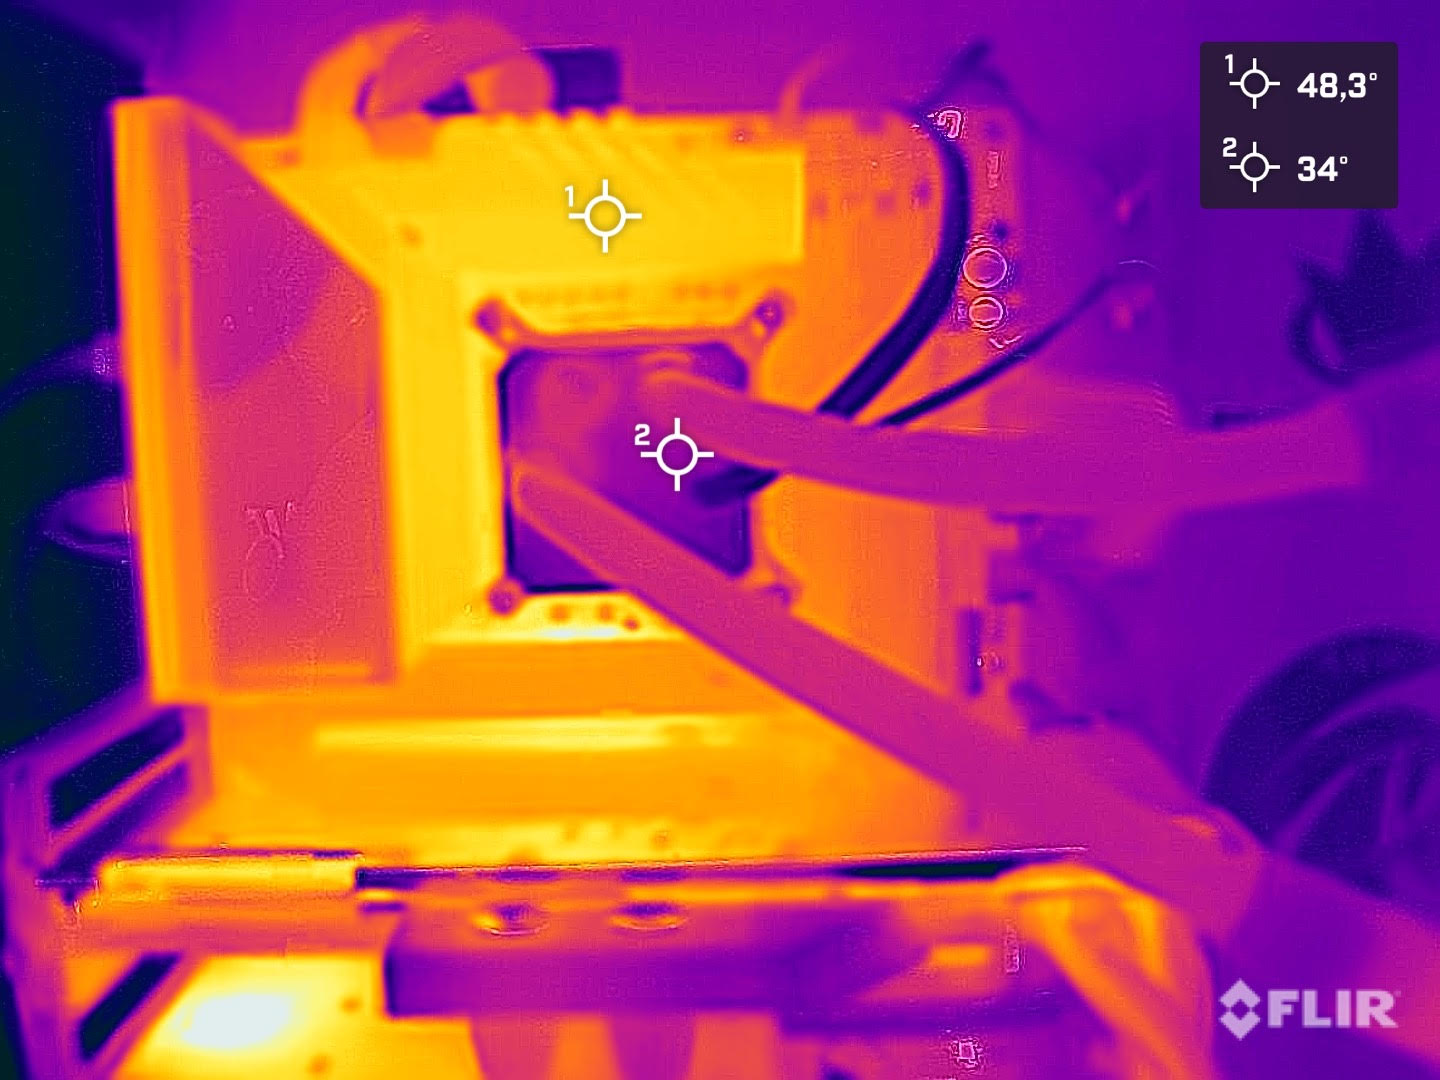
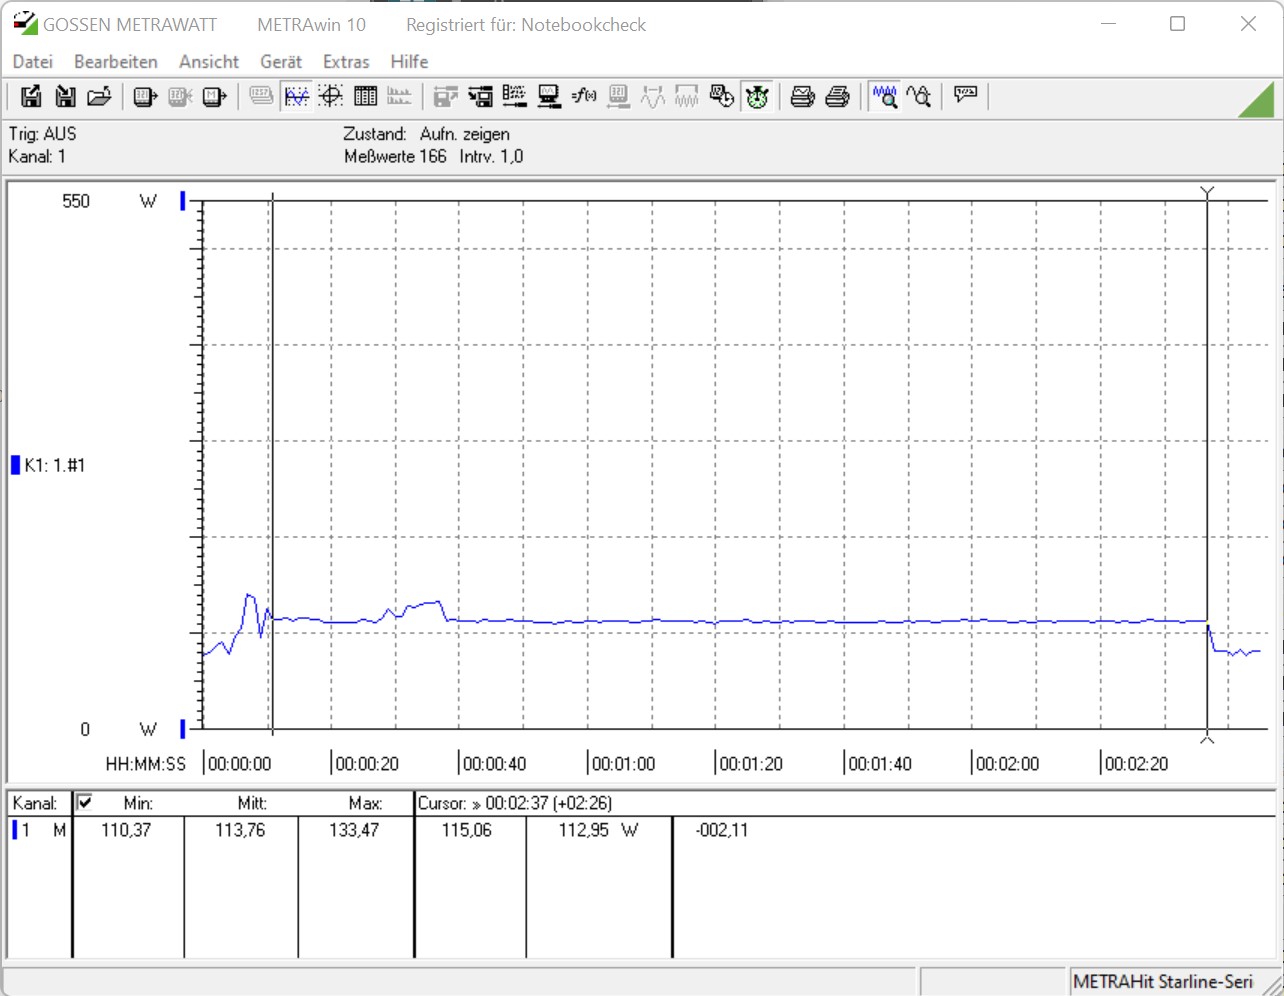
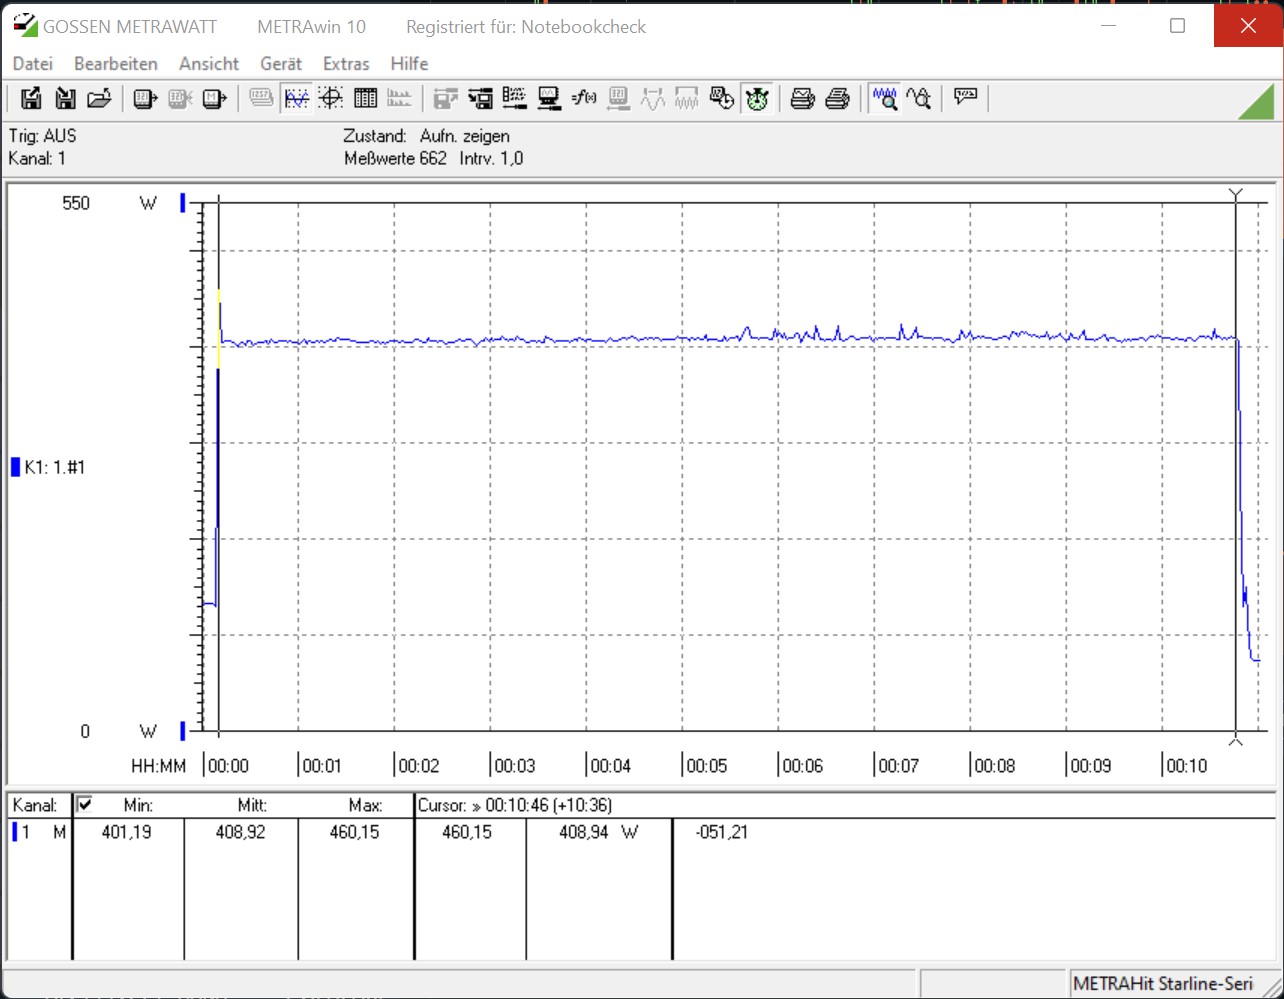
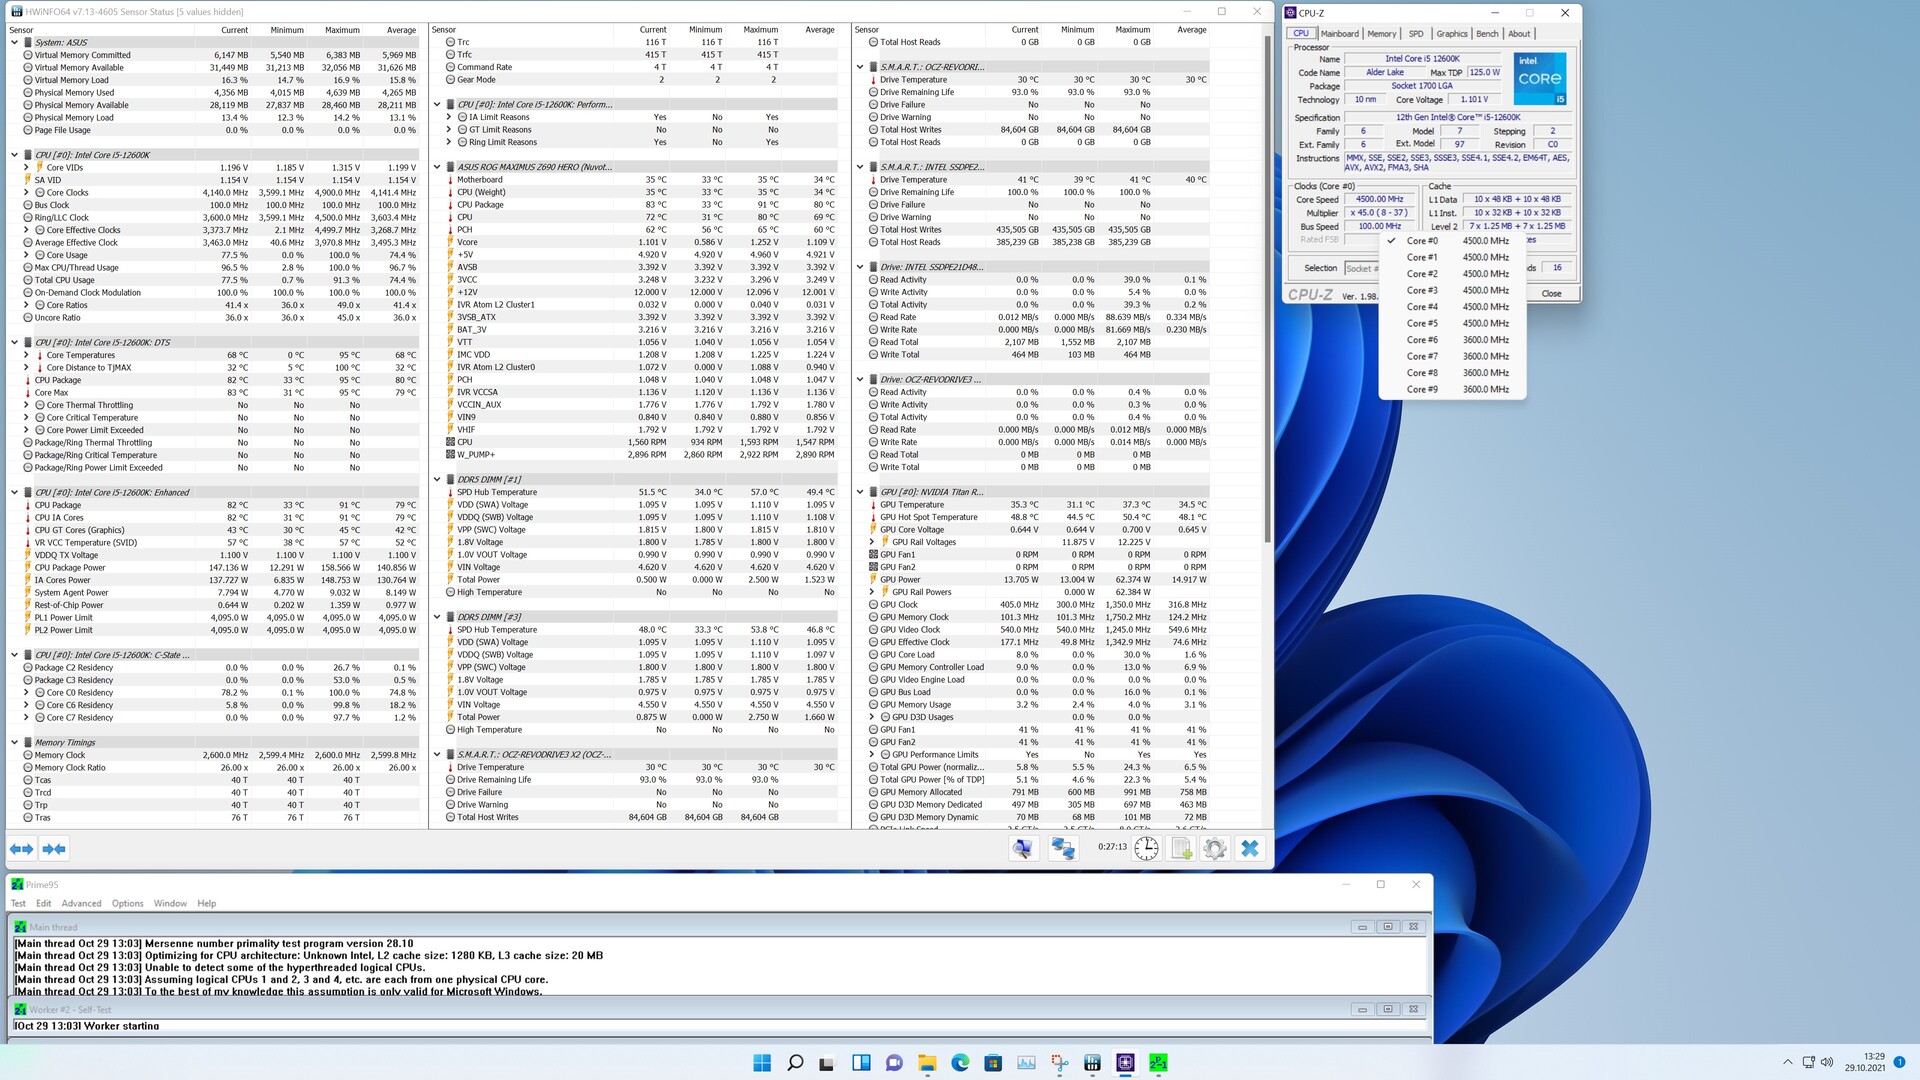
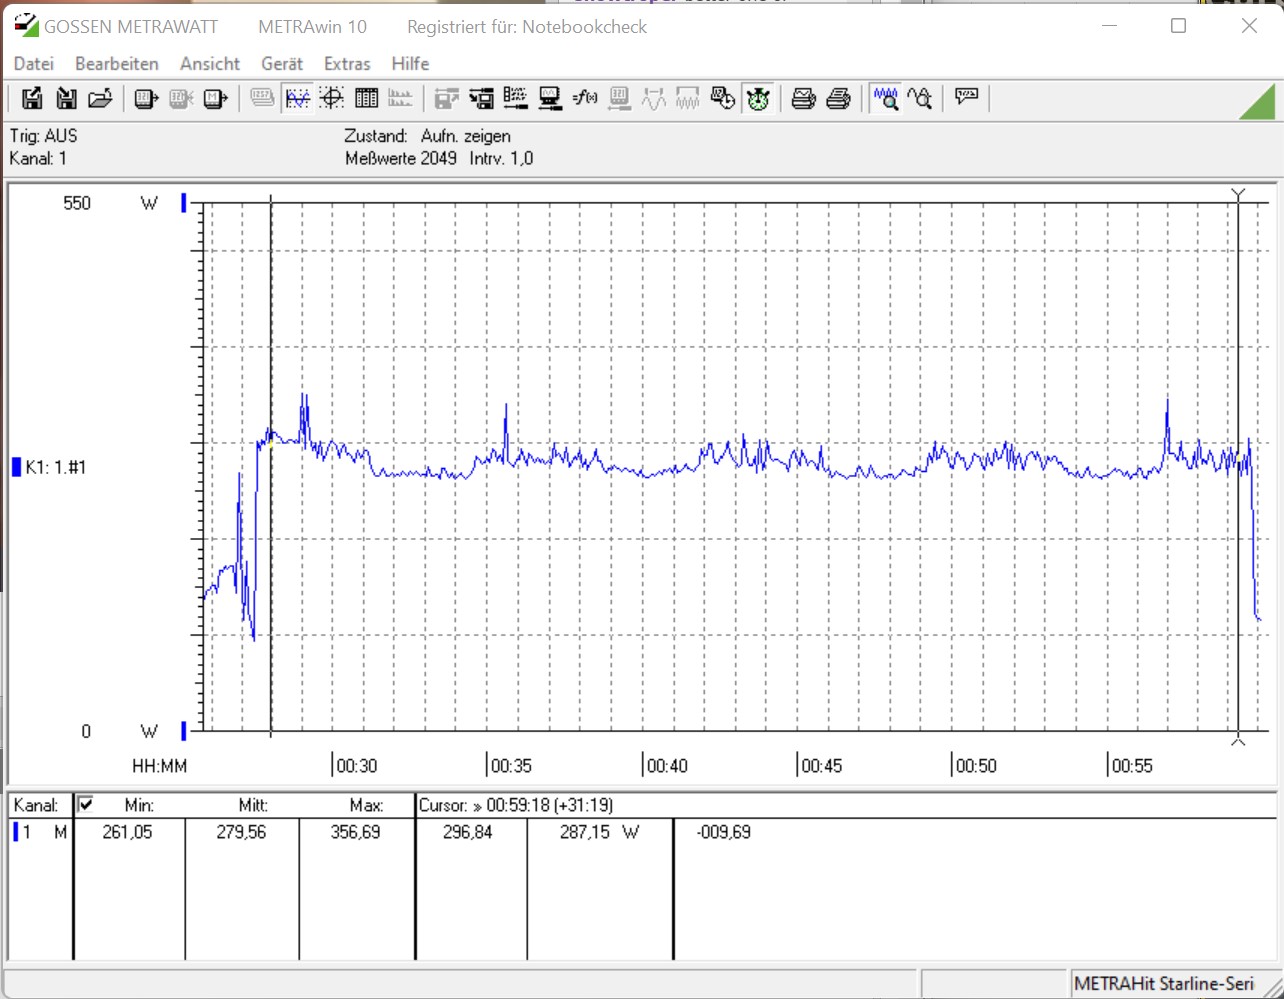
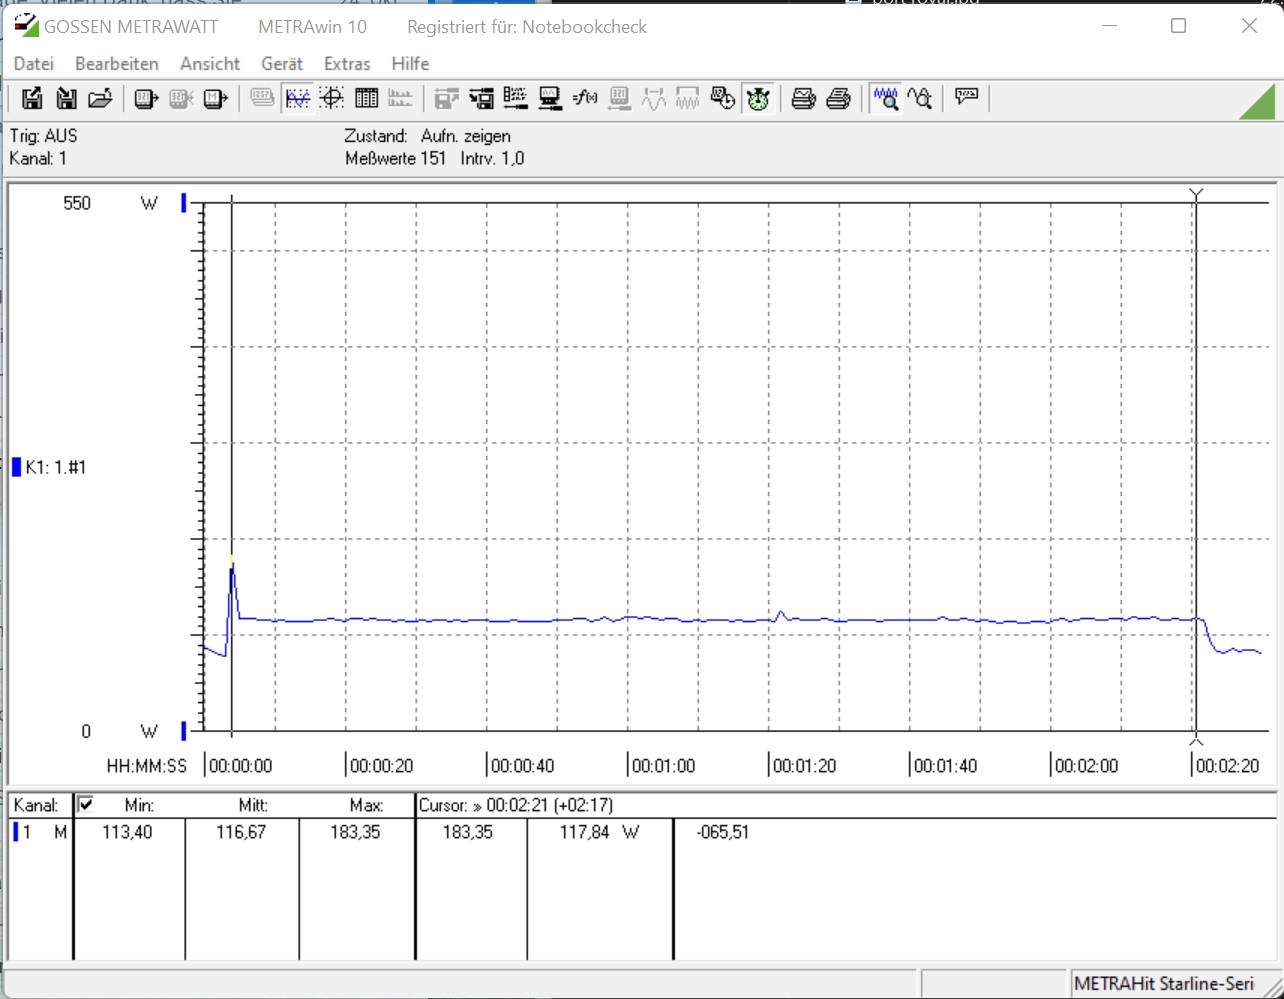
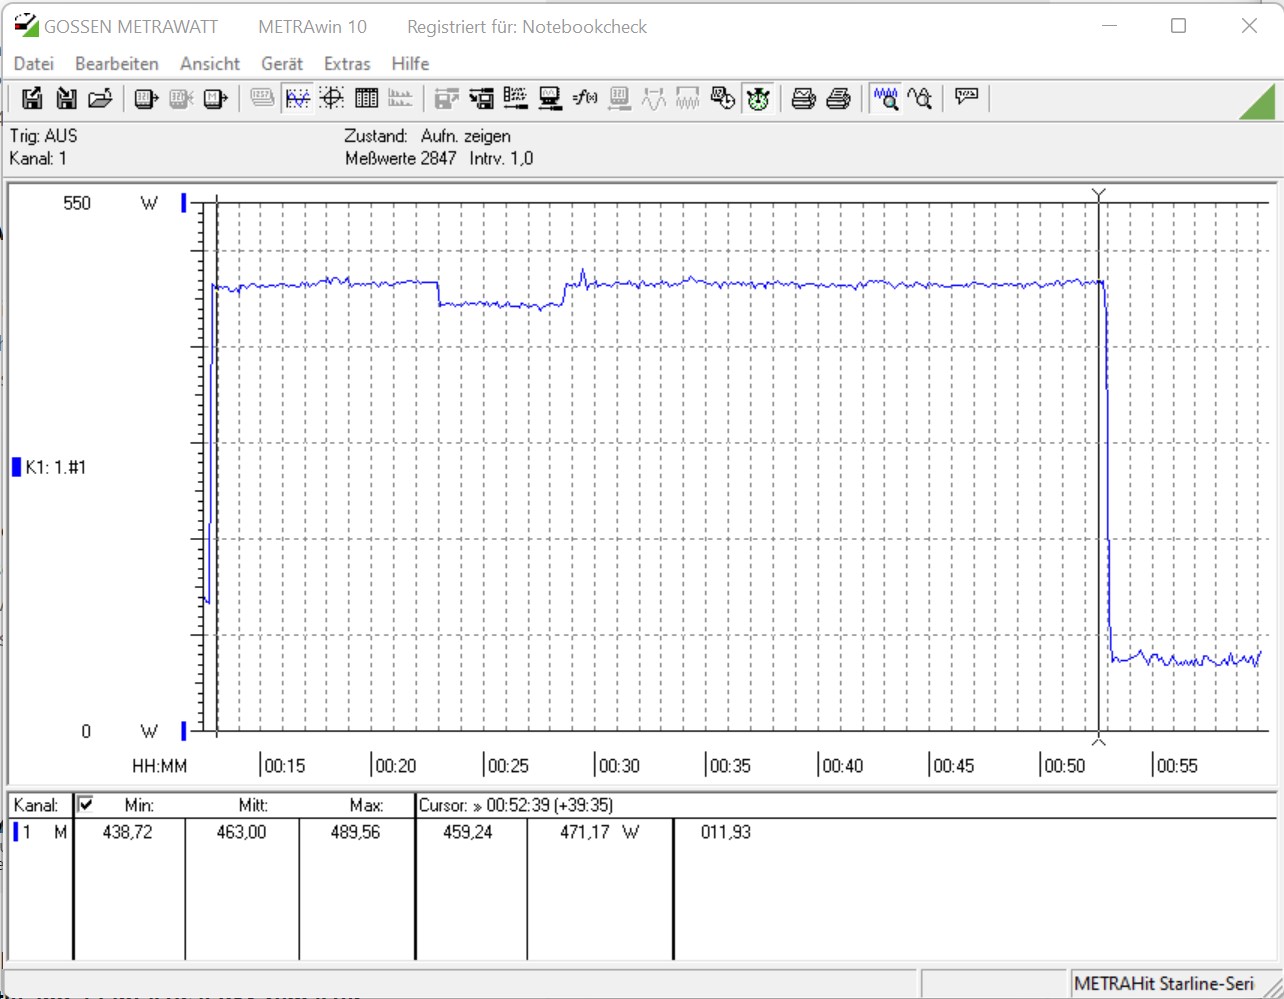
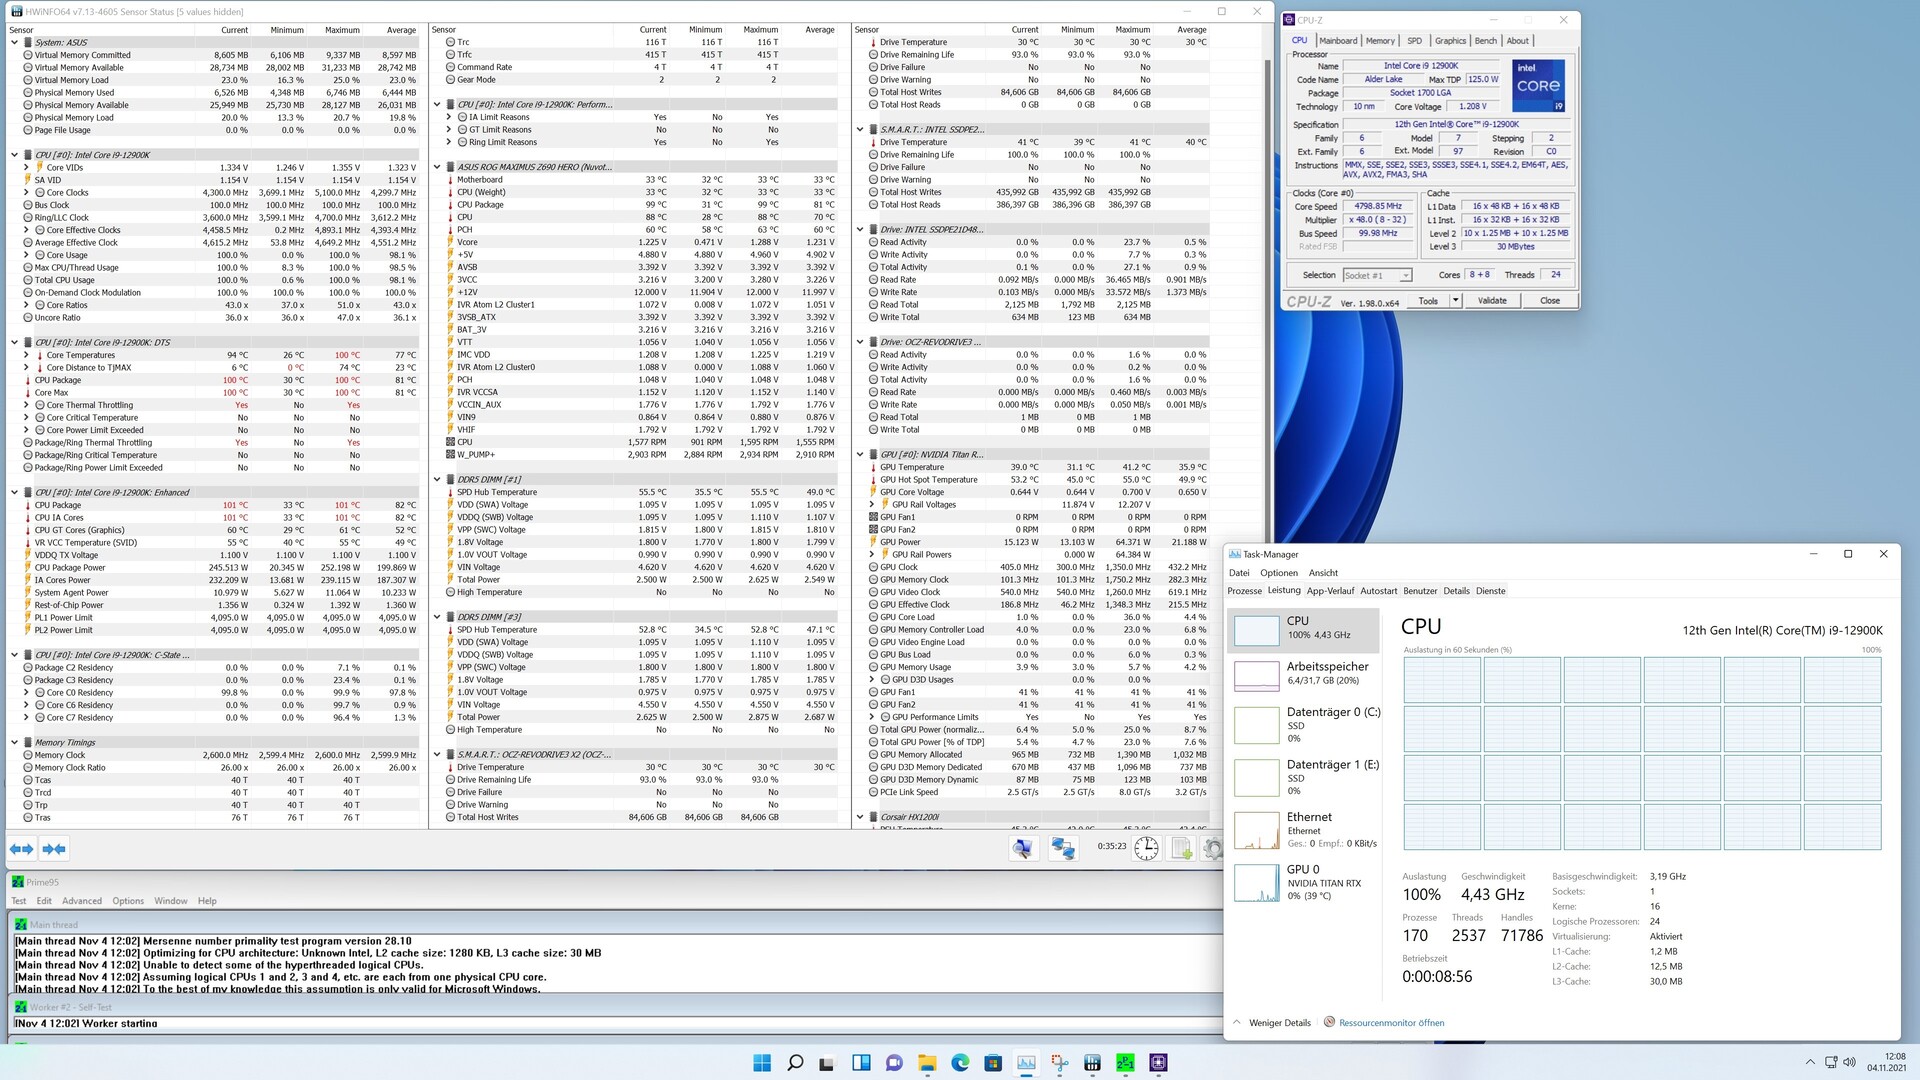
Stroomverbruik en temperaturen
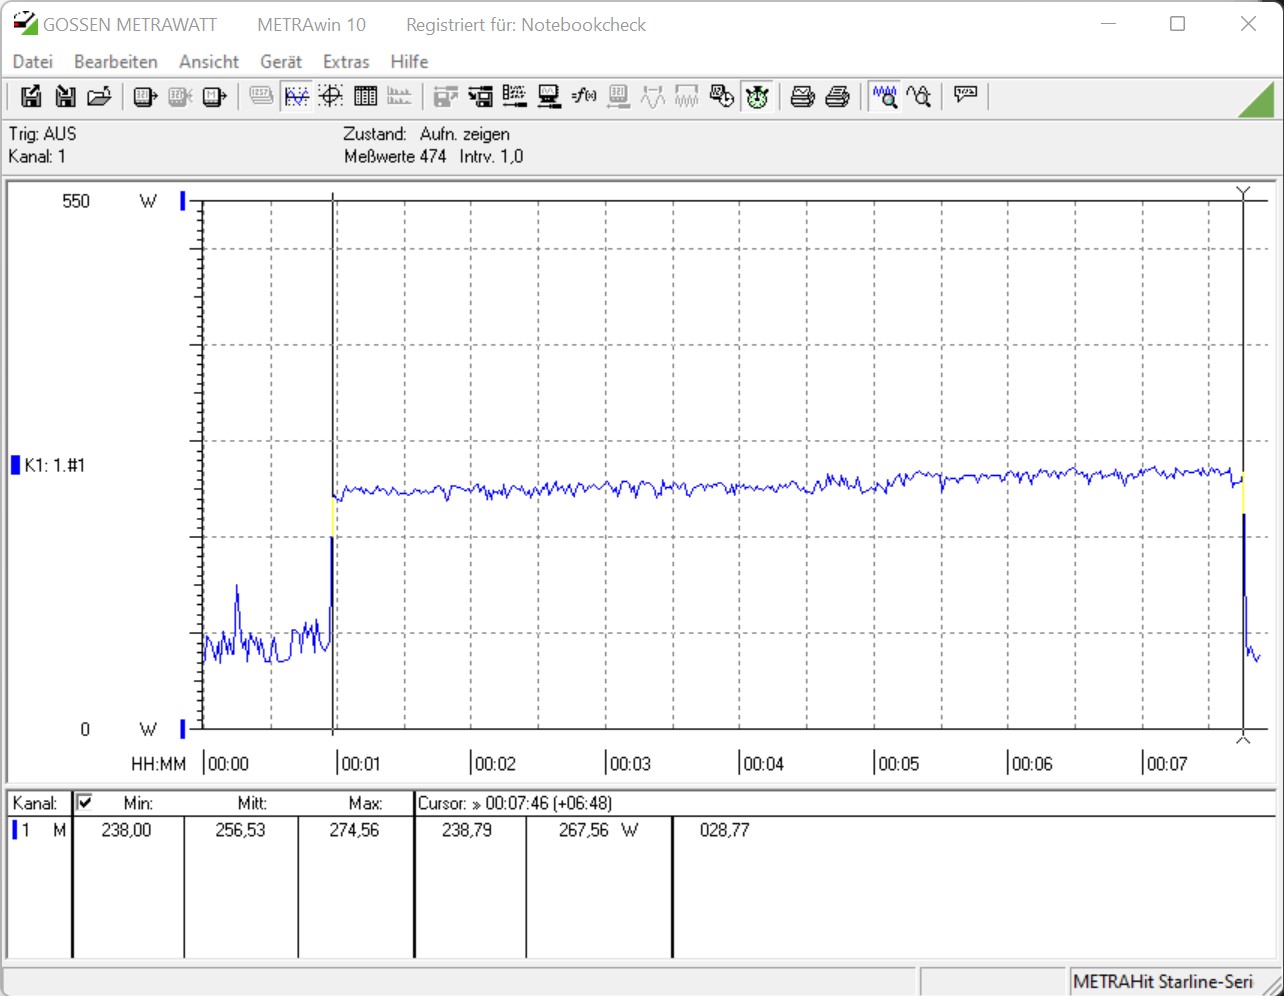
Volgens de technische specificaties bieden de processoren een TDP van 125 watt. Dit verwijst naar de PL1-waarde. De PL2-waarde specificeert de hoeveelheid watt die de processor onder volledige belasting ter beschikking staat als aan alle eisen is voldaan. Met een maximum van 241 watt is de Intel Core i9-12900K iets efficiënter dan de Intel Core i9-11900K. In onze test was het Alder Lake-S vlaggenschip inderdaad alleen efficiënterdan de voorganger in de Prime95 stress test. Onze metingen toonden echter nog steeds net onder de 280 watt voor het hele systeem. In de Cinebench R15 Multi test verbruikte ons testsysteem bijna 25% meer stroom. Dit is een toename die niet zomaar kan worden weggegooid. In de Intel Core i5-12600K is de PL2 waarde begrensd op 150 watt, wat ook terug te vinden is in onze meetresultaten. Vergeleken met de Intel Core i5-11600Kis de Intel Core i5-12600K 7% efficiënter. Bij de stresstest verandert het beeld echter, en trekt de Core i5-12600K 13% meer stroom uit het stopcontact. De gemeten waarden tijdens gamen worden natuurlijk verhoogd door de Nvidia Titan RTX. Ook hier zien we echter dat het Alder Lake-S platform niet uitnodigt tot energiebesparing.
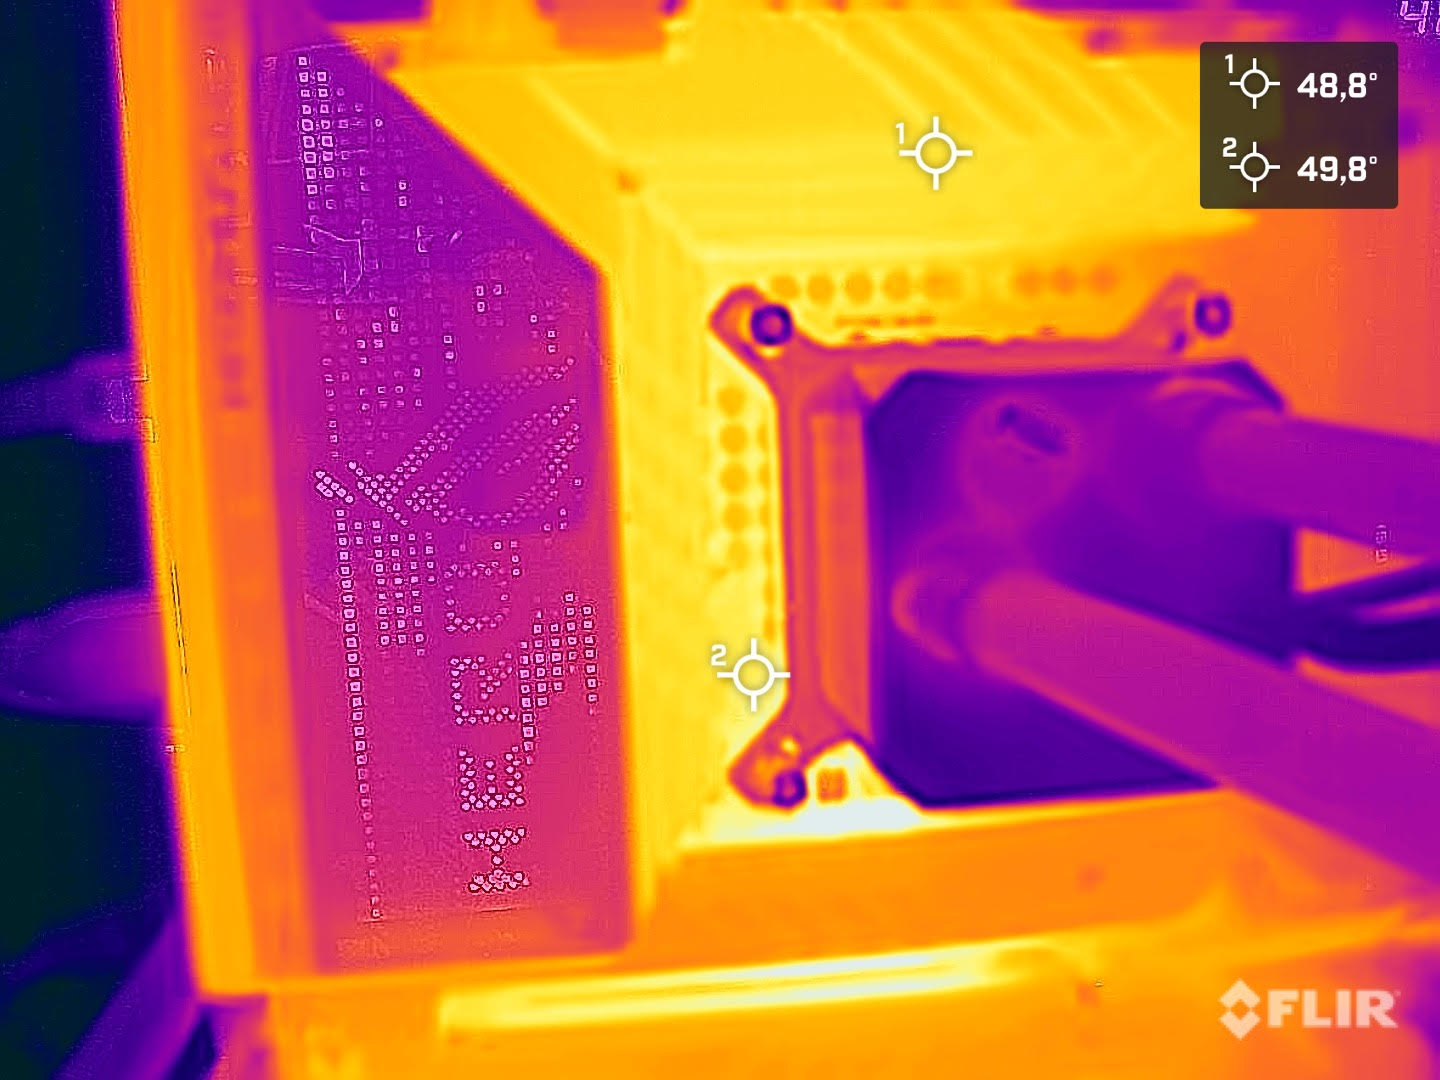
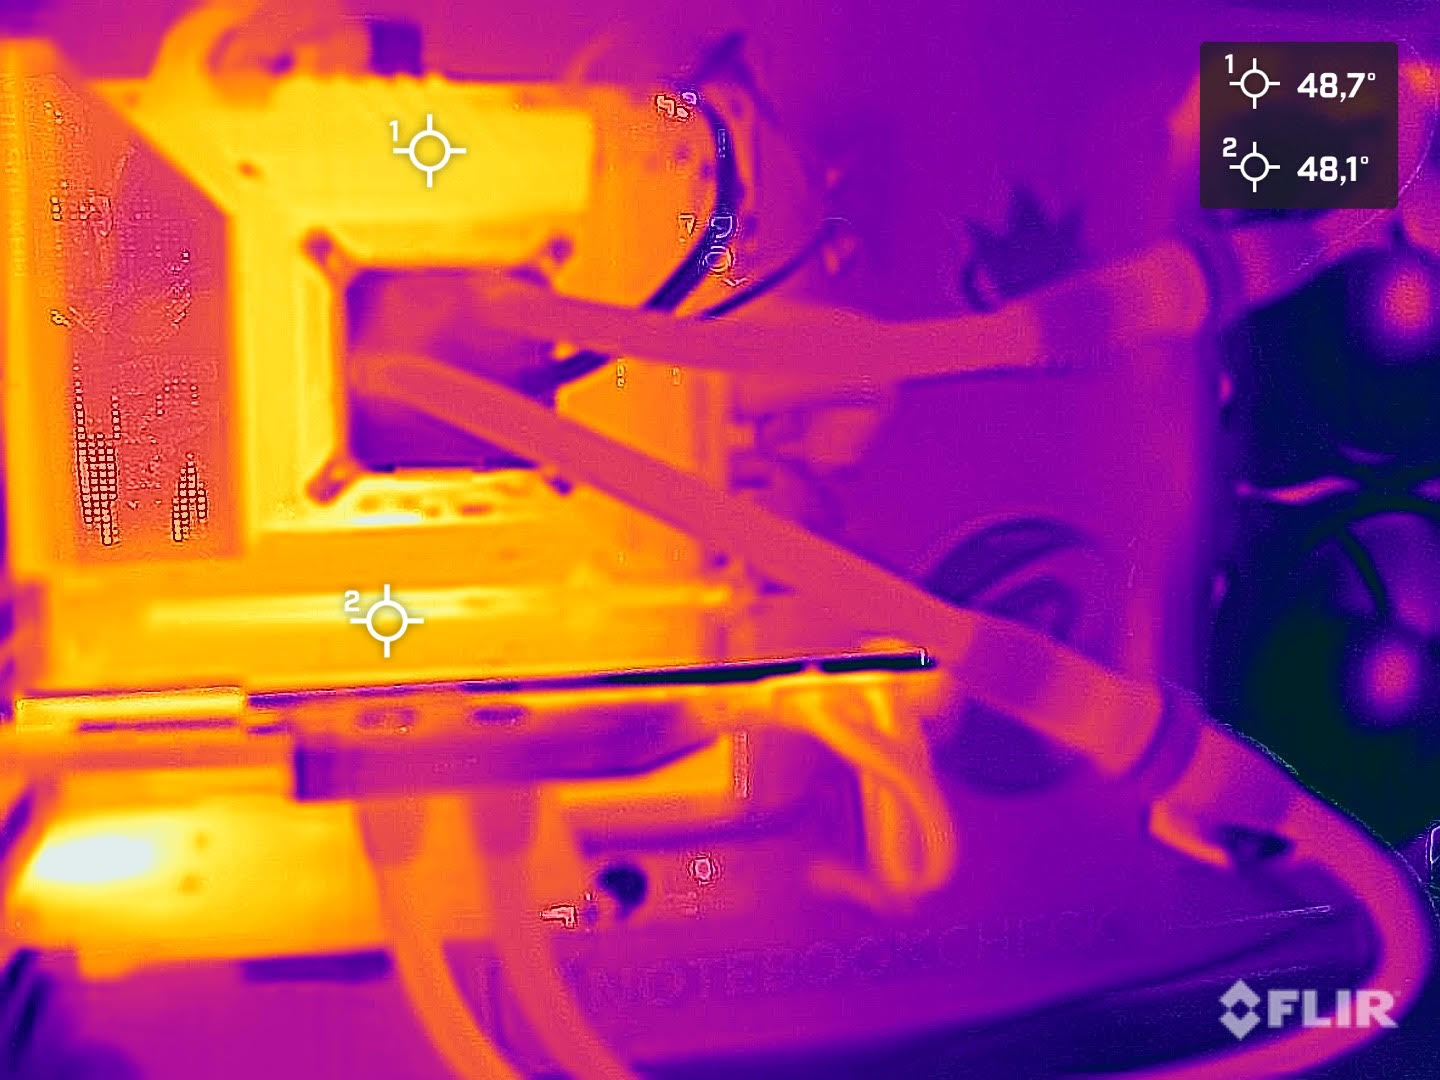
Onze gemeten temperaturen toonden aan dat de Intel Core i9-12900K reeds 100 °C (212 °F ) bereikte enkele minuten na het starten van de Prime95 benchmark. Bij het voortzetten van de stresstest moest de CPU vervolgens worden afgeremd om schade te voorkomen. Dit is het nadeel van de PL1 = PL2 instelling in het Bios. We merkten echter geen throttling onder belasting in de Cinebench R15 Multi loop. Om een slechte installatie van het koelsysteem uit te sluiten, hebben we het op een gegeven moment ook verwijderd en daarna opnieuw geïnstalleerd, maar het resultaat was daarna hetzelfde. We hebben ook contact opgenomen met Alphacool om er zeker van te zijn dat er geen incompatibiliteit is van de koeler die we hebben gebruikt. Volgens de fabrikant is de Alphacool Eisbear Aurora 280 AiO die we gebruikten compatibel met de LGA 1700 socket. De Intel Core i5-12600K was iets gemakkelijker te koelen onder belasting, maar we noteerden nog steeds een maximum temperatuur van 95 °C (203°F).
Wie dus een Intel Core i9-12900K wil gebruiken, moet ook een zeer krachtig koelsysteem aanschaffen om het maximum uit de processor te halen.
| Power Consumption | |
| 1920x1080 The Witcher 3 ultra (external Monitor) | |
| Intel Core i9-12900K (Idle: 70.5 W) | |
| AMD Ryzen 9 5950X (Idle: 78 W) | |
| AMD Ryzen 9 5900X (Idle: 78.1 W) | |
| Intel Core i5-11600K (Idle: 69.49 W) | |
| AMD Ryzen 7 5800X (Idle: 77.5 W) | |
| AMD Ryzen 5 5600X (Idle: 79.23 W) | |
| Intel Core i5-12600K (Idle: 70.45 W) | |
| Intel Core i7-10700K (Idle: 67.7 W) | |
| Intel Core i9-10900K (Idle: 52.3 W) | |
| Intel Core i9-11900K (Idle: 57.3 W) | |
| Intel Core i5-10600K (Idle: 52.2 W) | |
| Prime95 V2810 Stress (external Monitor) | |
| Intel Core i9-11900K (Idle: 57.3 W) | |
| Intel Core i9-12900K (Idle: 70.5 W) | |
| Intel Core i9-10900K (Idle: 52.3 W) | |
| Intel Core i5-12600K (Idle: 70.45 W) | |
| AMD Ryzen 9 5950X (Idle: 78 W) | |
| AMD Ryzen 7 5800X (Idle: 77.5 W) | |
| AMD Ryzen 9 5900X (Idle: 78.1 W) | |
| Intel Core i5-11600K (Idle: 69.49 W) | |
| Intel Core i7-10700K (Idle: 67.7 W) | |
| Intel Core i5-10600K (Idle: 52.2 W) | |
| AMD Ryzen 5 5600X (Idle: 79.23 W) | |
| Cinebench R15 Multi (external Monitor) | |
| Intel Core i9-12900K (Idle: 70.5 W) | |
| Intel Core i9-10900K (Idle: 52.3 W) | |
| Intel Core i9-11900K (Idle: 57.3 W) | |
| AMD Ryzen 9 5900X (Idle: 78.1 W) | |
| AMD Ryzen 9 5950X (Idle: 78 W) | |
| AMD Ryzen 7 5800X (Idle: 77.5 W) | |
| Intel Core i5-11600K (Idle: 69.49 W) | |
| Intel Core i7-10700K (Idle: 67.7 W) | |
| Intel Core i5-12600K (Idle: 70.45 W) | |
| Intel Core i5-10600K (Idle: 52.2 W) | |
| AMD Ryzen 5 5600X (Idle: 79.23 W) | |
| Temperatures - CPU Temperature Prime95 | |
| Intel Core i9-11900K | |
| AMD Ryzen 7 5800X | |
| Intel Core i9-10900K | |
| Intel Core i5-11600K | |
| AMD Ryzen 9 5900X | |
| Intel Core i5-10600K | |
| AMD Ryzen 9 5950X | |
* ... kleiner is beter
Pro
Contra
Verdict - Terug naar de top met een totaal van 24 Threads
Met Alder Lake-S slaagt Intel er inderdaad in de snelste Gaming CPU te hebben, althans voor nu. Maar dit is nog niet alles. Alder Lake-S is niet alleen een opgevoerde last-gen processor, zoals we wel vaker hebben gezien. Dat is hier niet het geval, want de nieuwe architectuur bevat veel verbeteringen. Veel daarvan kennen we al uit de mobiele sector, want smartphones en tablets bevatten al jaren processoren met prestatie- en energiezuinige kernen. Intel maakt ook gebruik van dit ontwerp in zijn huidige desktop line-up, waardoor de multi-core prestaties drastisch toenemen. Zo is de Intel Core i9-12900K in staat om in totaal 24 threads parallel te laten werken. Daarnaast is ook de IPC aanzienlijk verbeterd, wat gaming enorm ten goede komt
De onderliggende basis is ook volledig veranderd en een eenvoudige upgrade van Rocket Lake-S is onmogelijk zonder het moederbord te vervangen. Dit moet je zeker meenemen in je kostenberekening. Apropos kosten, de aanbevolen aankoopprijs is $589 en hij is momenteel op sommige plaatsen verkrijgbaar vanaf 659 euro (~$762). Afhankelijk van de beschikbaarheid kunnen er hier wat prijsstijgingen zijn, zoals bij de grafische kaarten. De iets zwakkere maar nog steeds zeer snelle Intel Core i5-12600K begint volgens Intel bij een adviesprijs van $289. Volgens ons eerste onderzoek is het model op sommige plaatsen al verkrijgbaar vanaf 319 euro (~$369). Dit is een aantrekkelijke prijs waar zelfs AMD momenteel niet aan kan tippen. De overeenkomstige AMD Ryzen 7 5800Xkost op dit moment 379 euro (~$438). De zaken zien er hier een beetje anders uit met het topmodel, waar de AMD Ryzen 9 5900Xaanzienlijk betaalbaarder is met 519 euro (~$600).
De Intel Core i9-12900K is een zeer goede gaming CPU met enige reserves voor de toekomst. Met de snelste gaming CPU op de markt kan Intel zichzelf voorlopig een schouderklopje geven.
Om de Intel Core i9-12900K competitiever te maken, zou de prijs echter moeten dalen, want zoals we al zeiden, moet je zeker ook investeren in een nieuw moederbord en in sommige omstandigheden ook in nieuw werkgeheugen als het DDR5 moet zijn. Maar we vinden het prettig dat je ook de optie hebt om DDR4 te blijven gebruiken. De moederbordfabrikanten bieden hiervoor enkele specifieke modellen met DDR4 RAM aan. Maar of deze dan ook Raptor Lake-S zullen ondersteunen, is op dit moment helaas nog niet bekend.
We waren een beetje teleurgesteld over het stroomverbruik. Natuurlijk zijn de prestaties drastisch verbeterd en blijft het bijbehorende iets hogere stroomverbruik binnen de perken. Maar het zou geweldig geweest zijn, als deze prestatieverhoging gecombineerd kon worden met een merkbaar lager stroomverbruik. Dit zou ook helpen om de koelingsproblemen beter onder controle te krijgen.
Wie nu al zijn slag wil slaan, kan de Intel Core i5-12600K bijAmazon aanschaffen voor ~$323 en de Intel Core i9-12900K ook van Amazon voor ~$1400. Terwijl Newegg vermeldt het voor $649, is het daar momenteel uitverkocht.

