Een tweede blik op de Vermeer - AMD Ryzen 9 5950X en AMD Ryzen 5 5600X Review
Nadat we eerder de AMD Ryzen 9 5900X en AMD Ryzen 7 5800X diepgaand hebben geëvalueerd, nemen we in deze review de AMD Ryzen 9 5950X en de AMD Ryzen 5 5600X onder de loep. Met deze processoren breidt AMD de boven- en onderkant van de nieuweVermeer-serieuitin haarnieuwe portfolio.
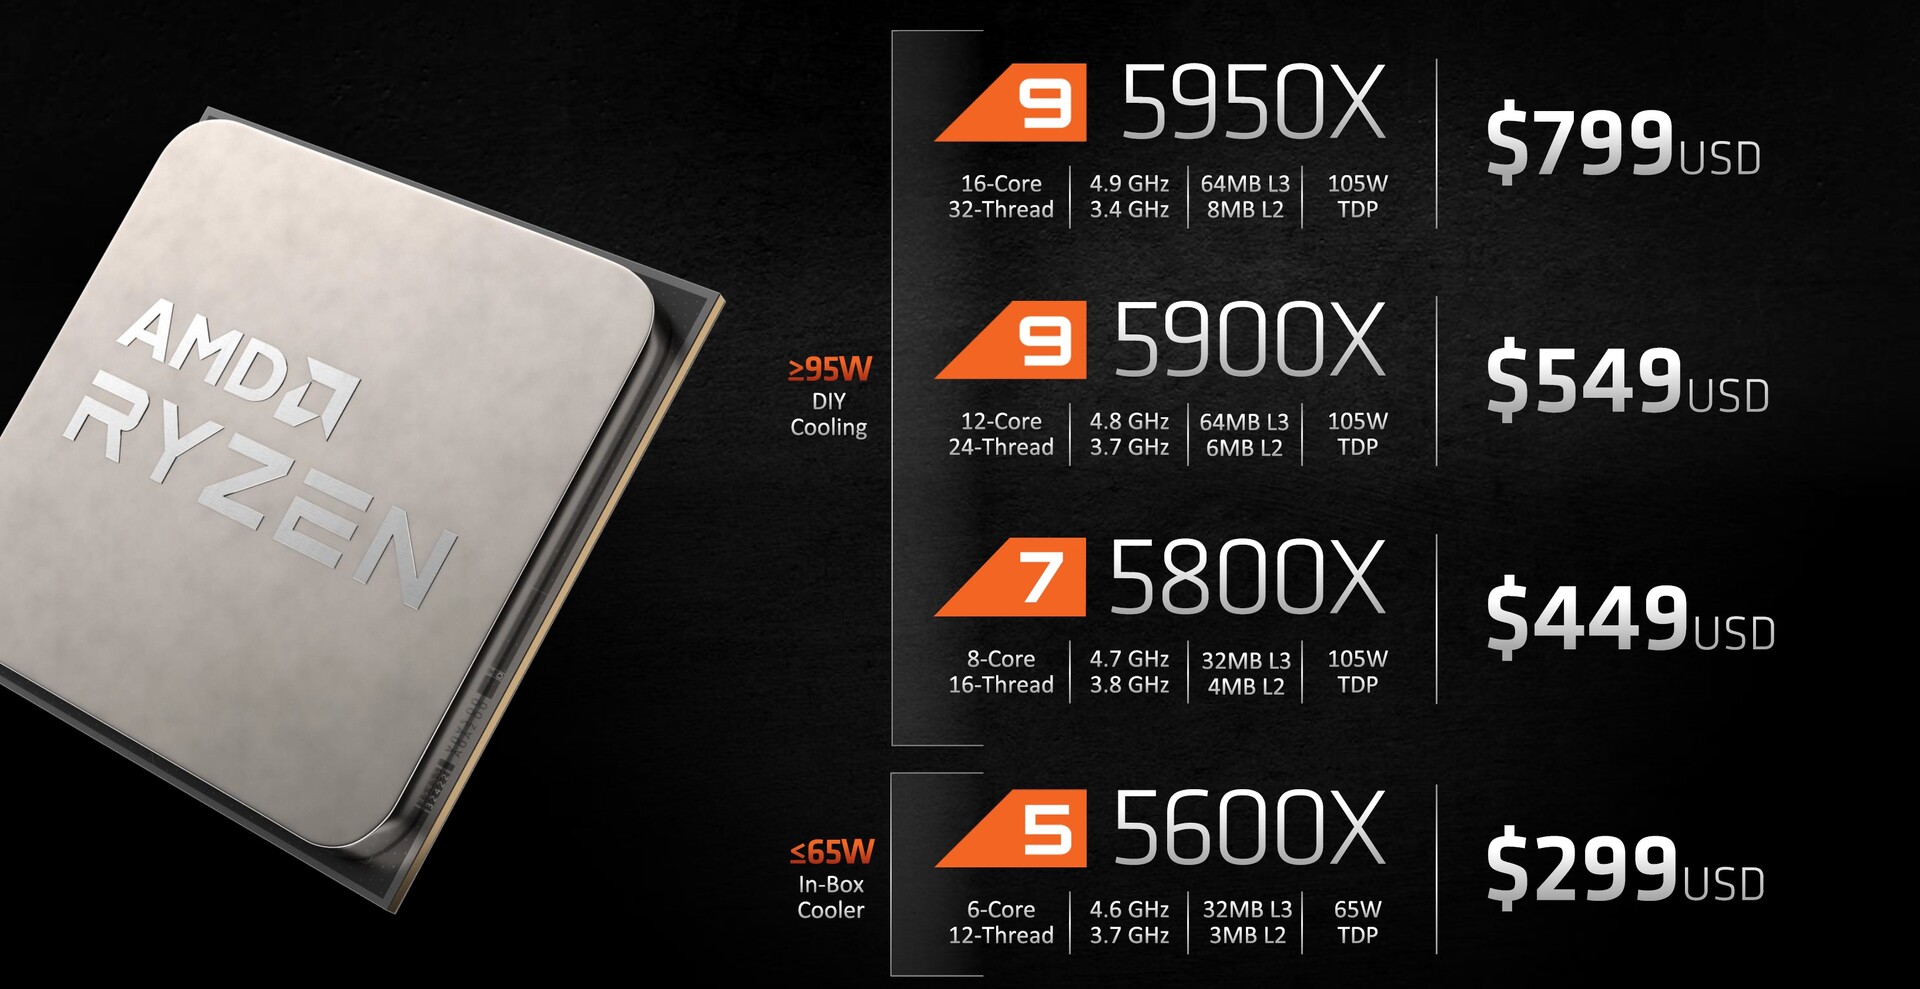
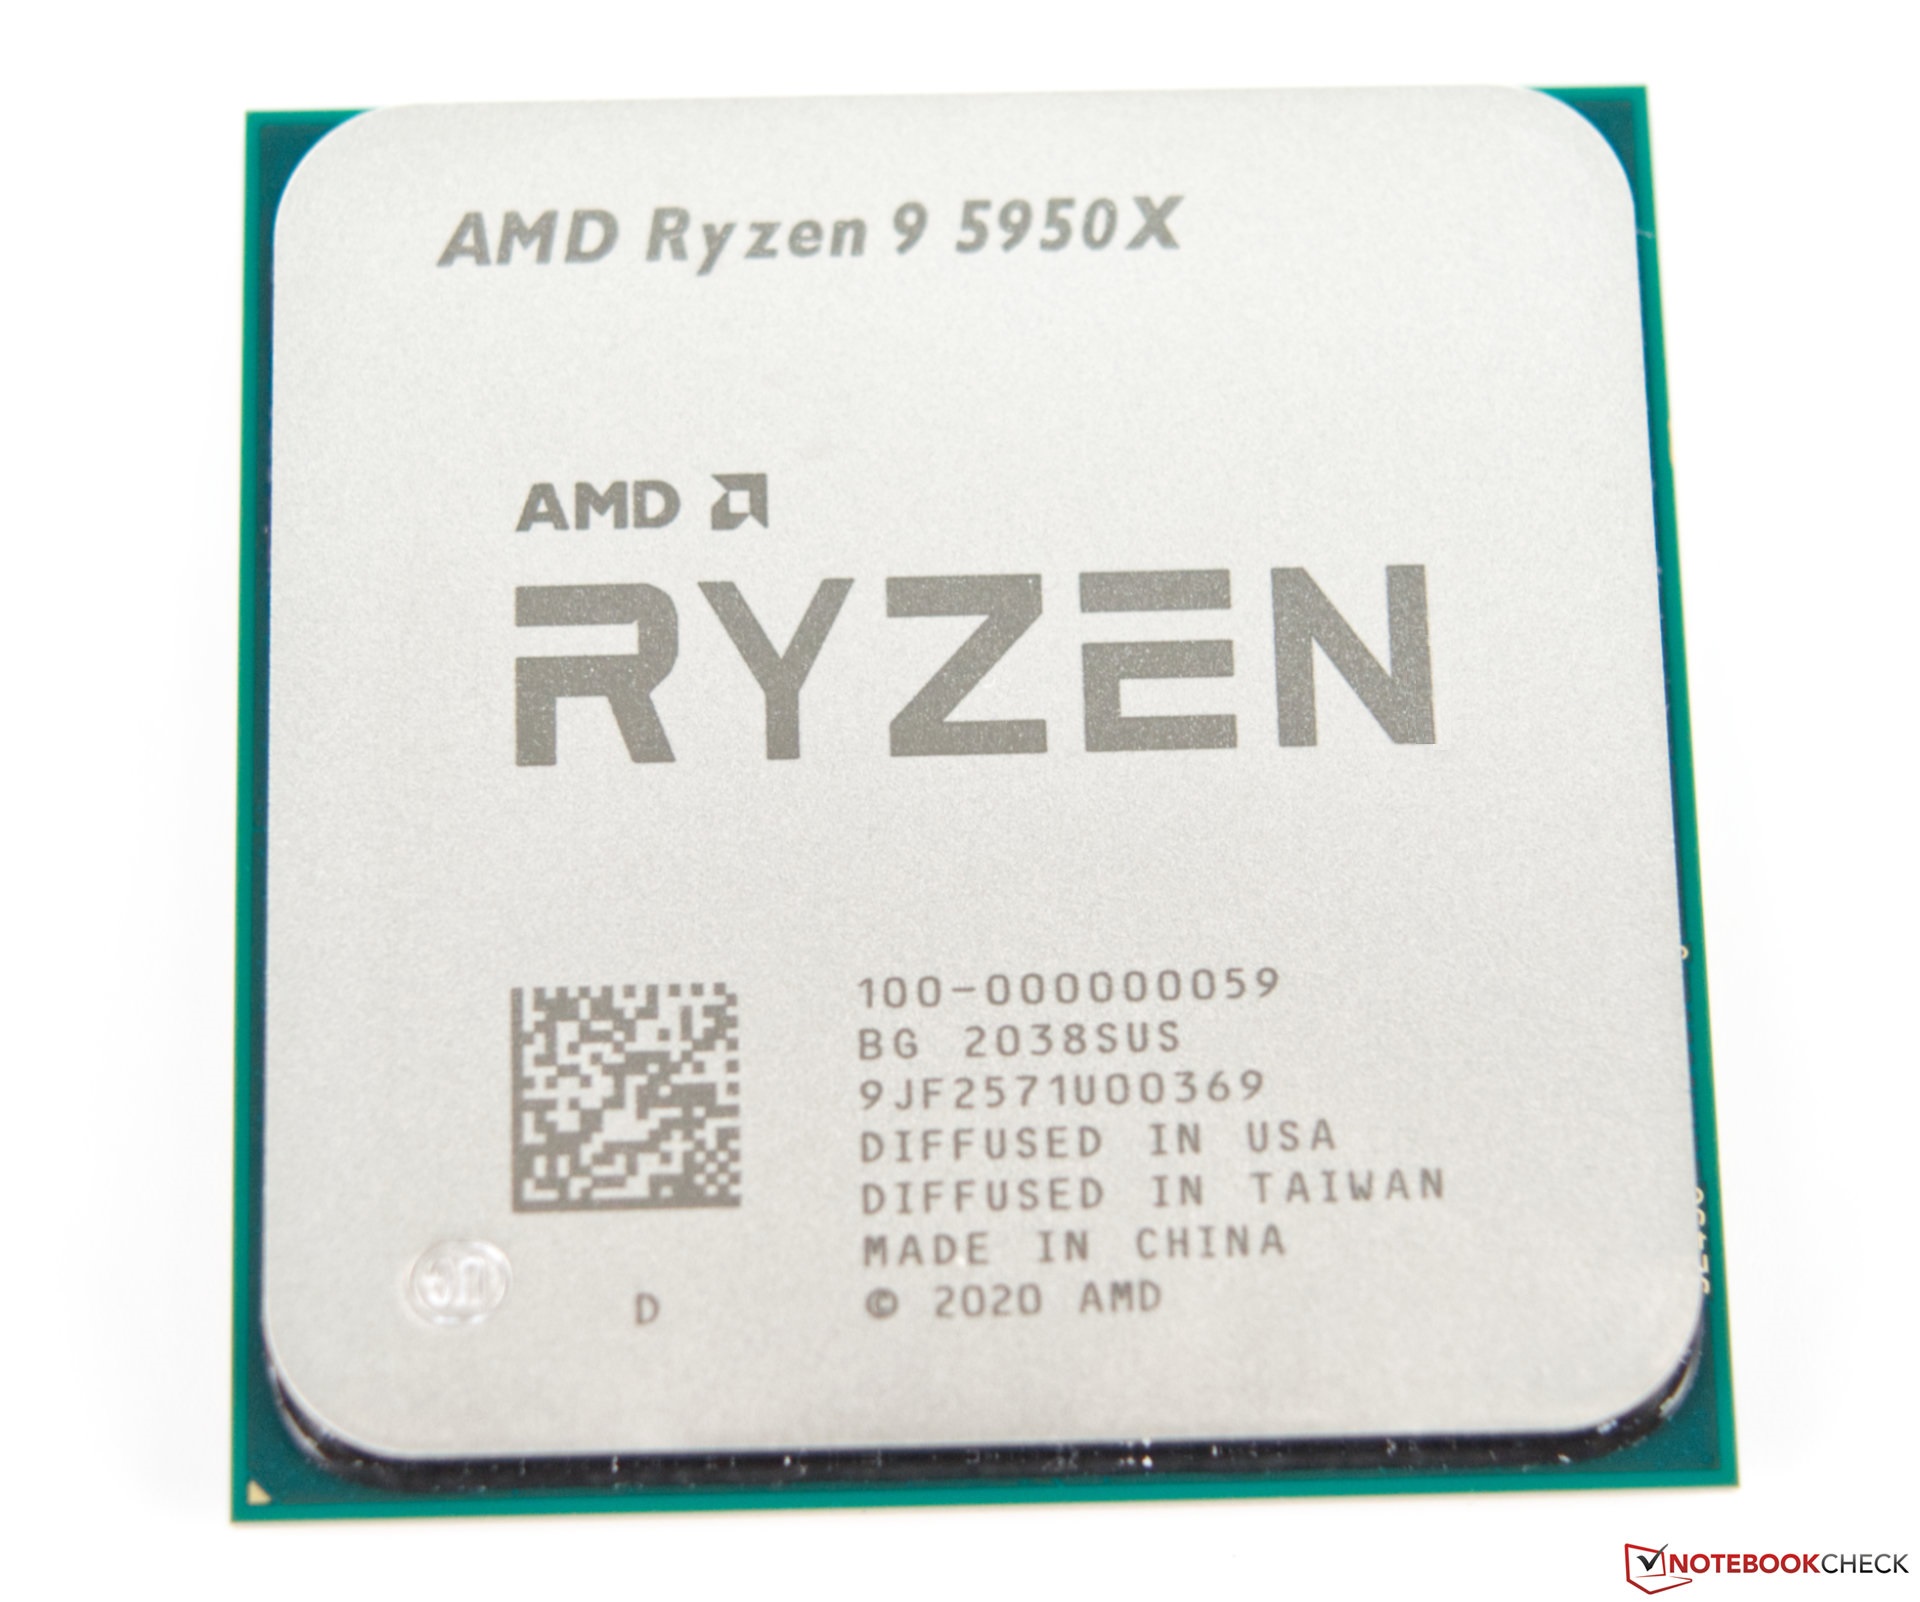
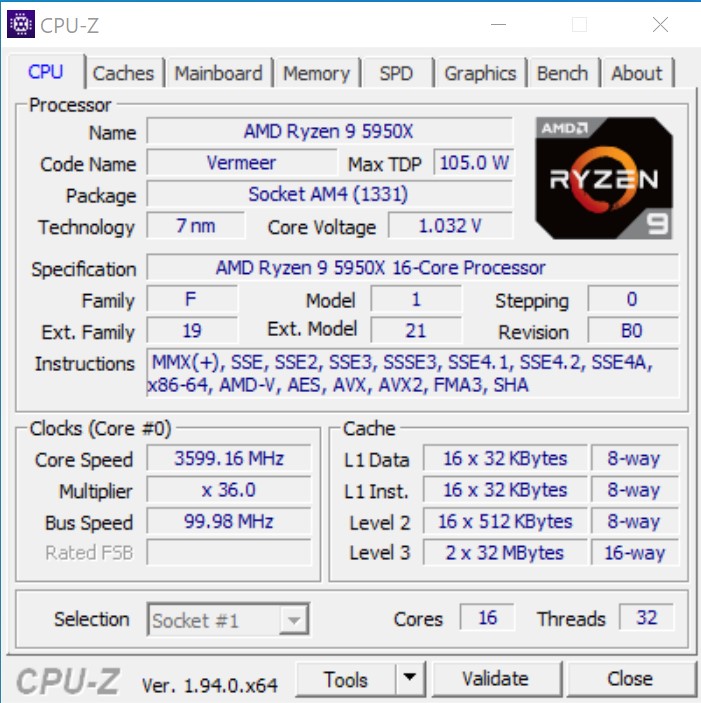
De AMD Ryzen 9 5950X is een opvolger van de AMD Ryzen 9 3950X en biedt tevens 16 kernen en 32 draden. De vele innovaties van de Vermeer-architectuur beloven ook een behoorlijke prestatiesprong. Tegelijkertijd verbruikt het nieuwe topmodel niet meer vermogen dan zijn voorganger, aangezien AMD ook een TDP van 105 Watt voorschrijft. Of deze waarde ook in de werkelijkheid wordt weerspiegeld, zullen we later uitleggen.
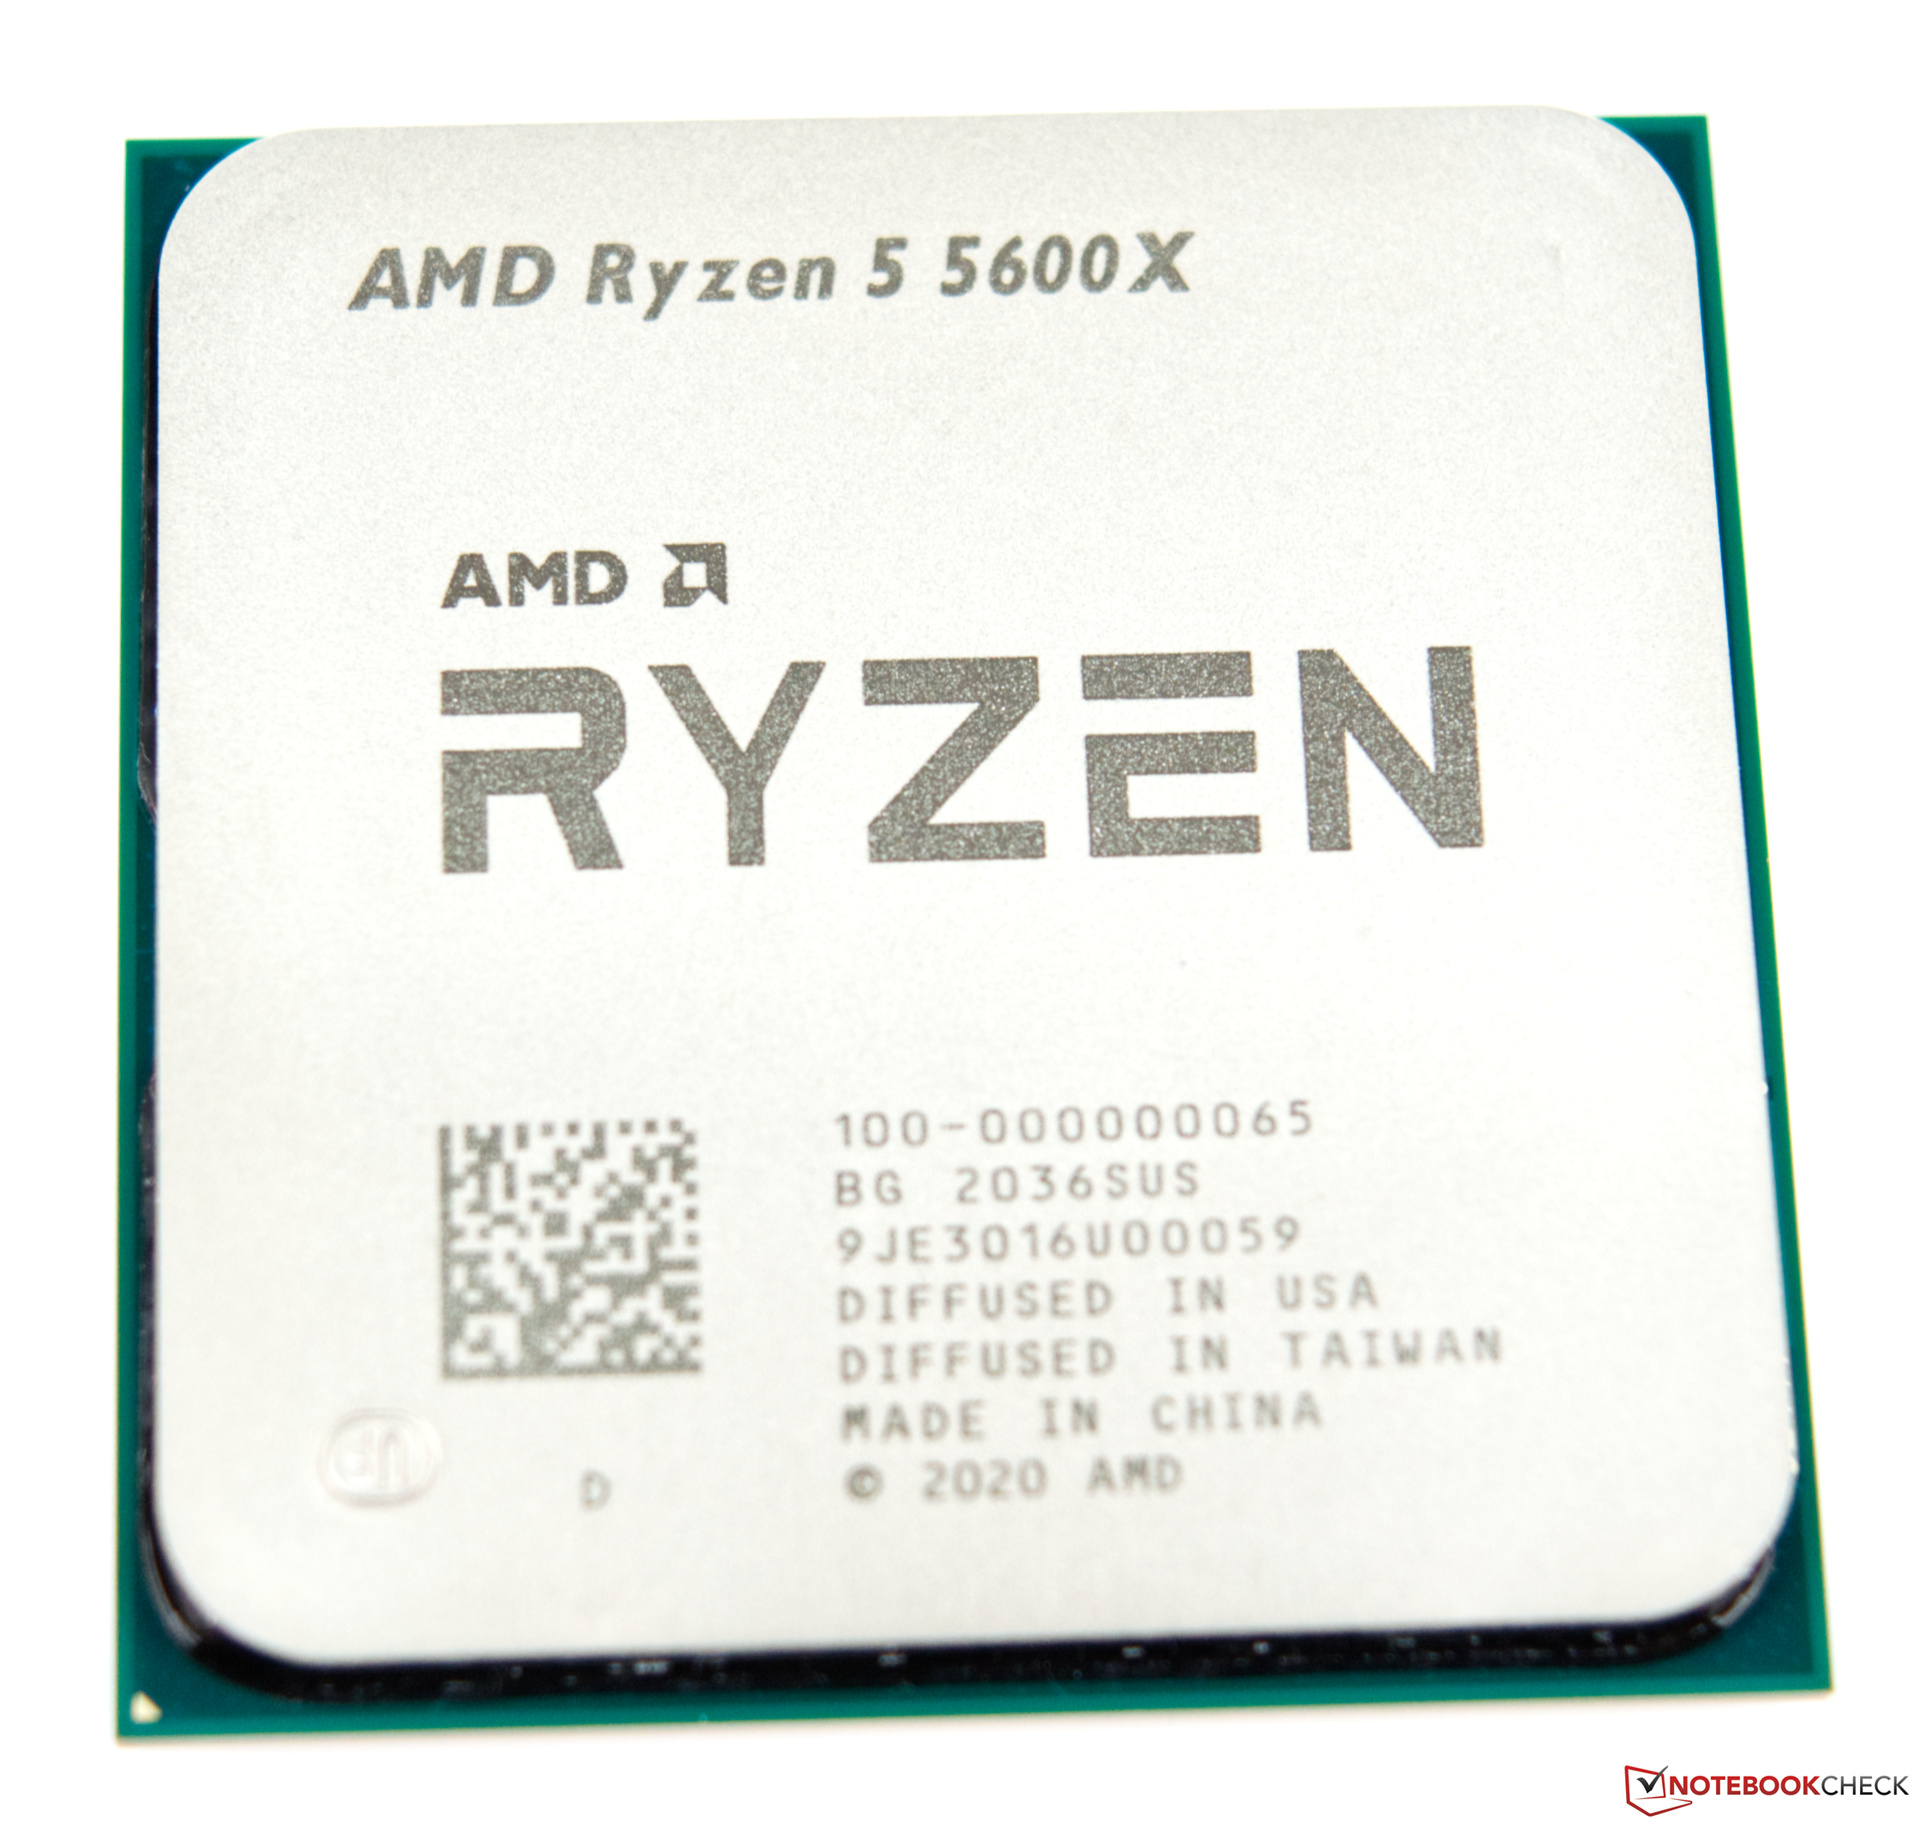
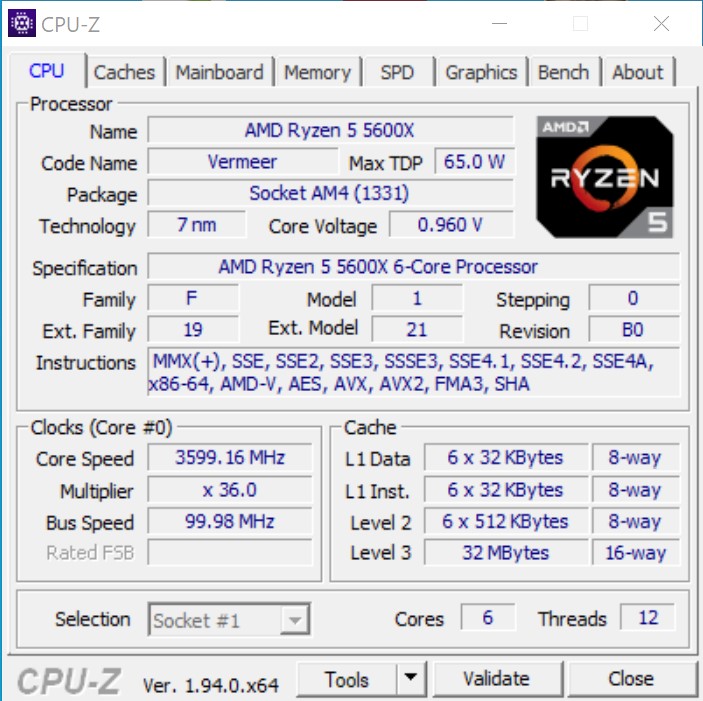
Tot slot is de AMD Ryzen 5 5600X niet alleen de kleinste Ryzen met 6 kernen en 12 draden, maar met een TDP van 65 watt ook de meest efficiënte, als je de puur technische specificaties vergelijkt.
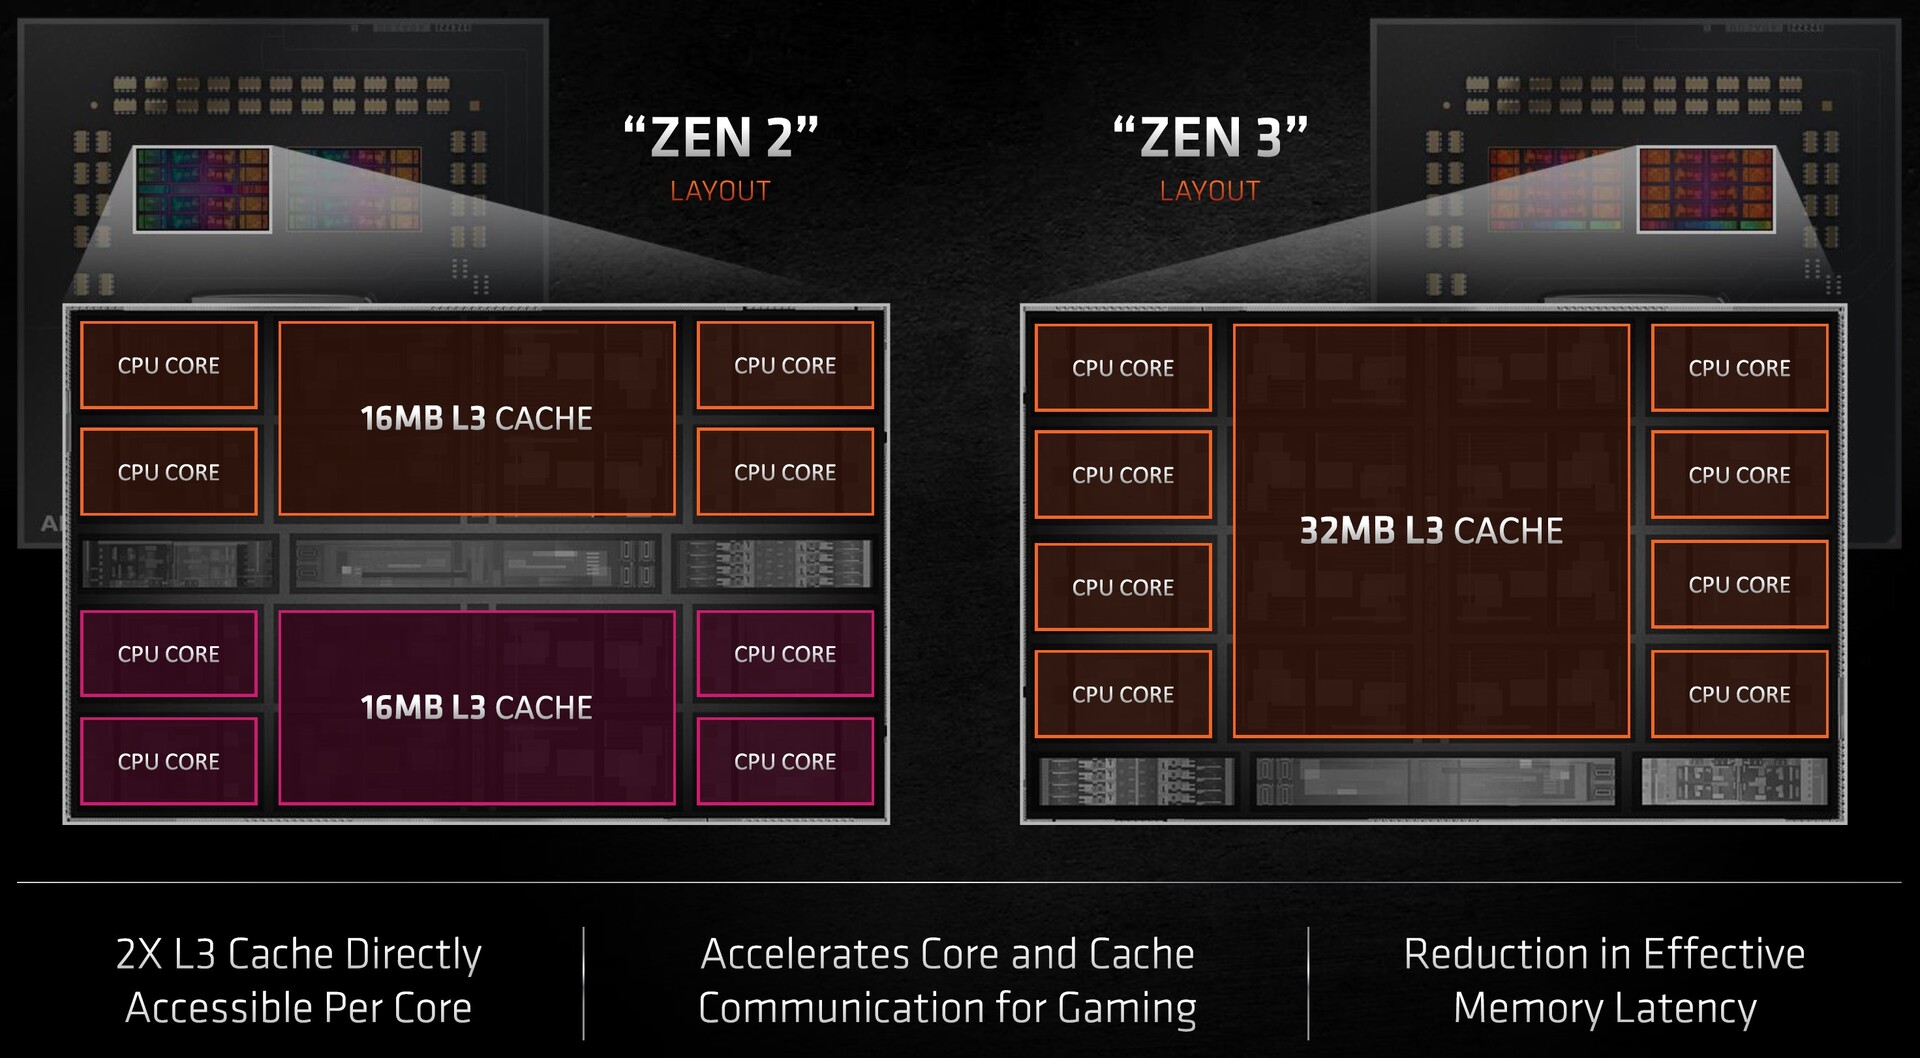
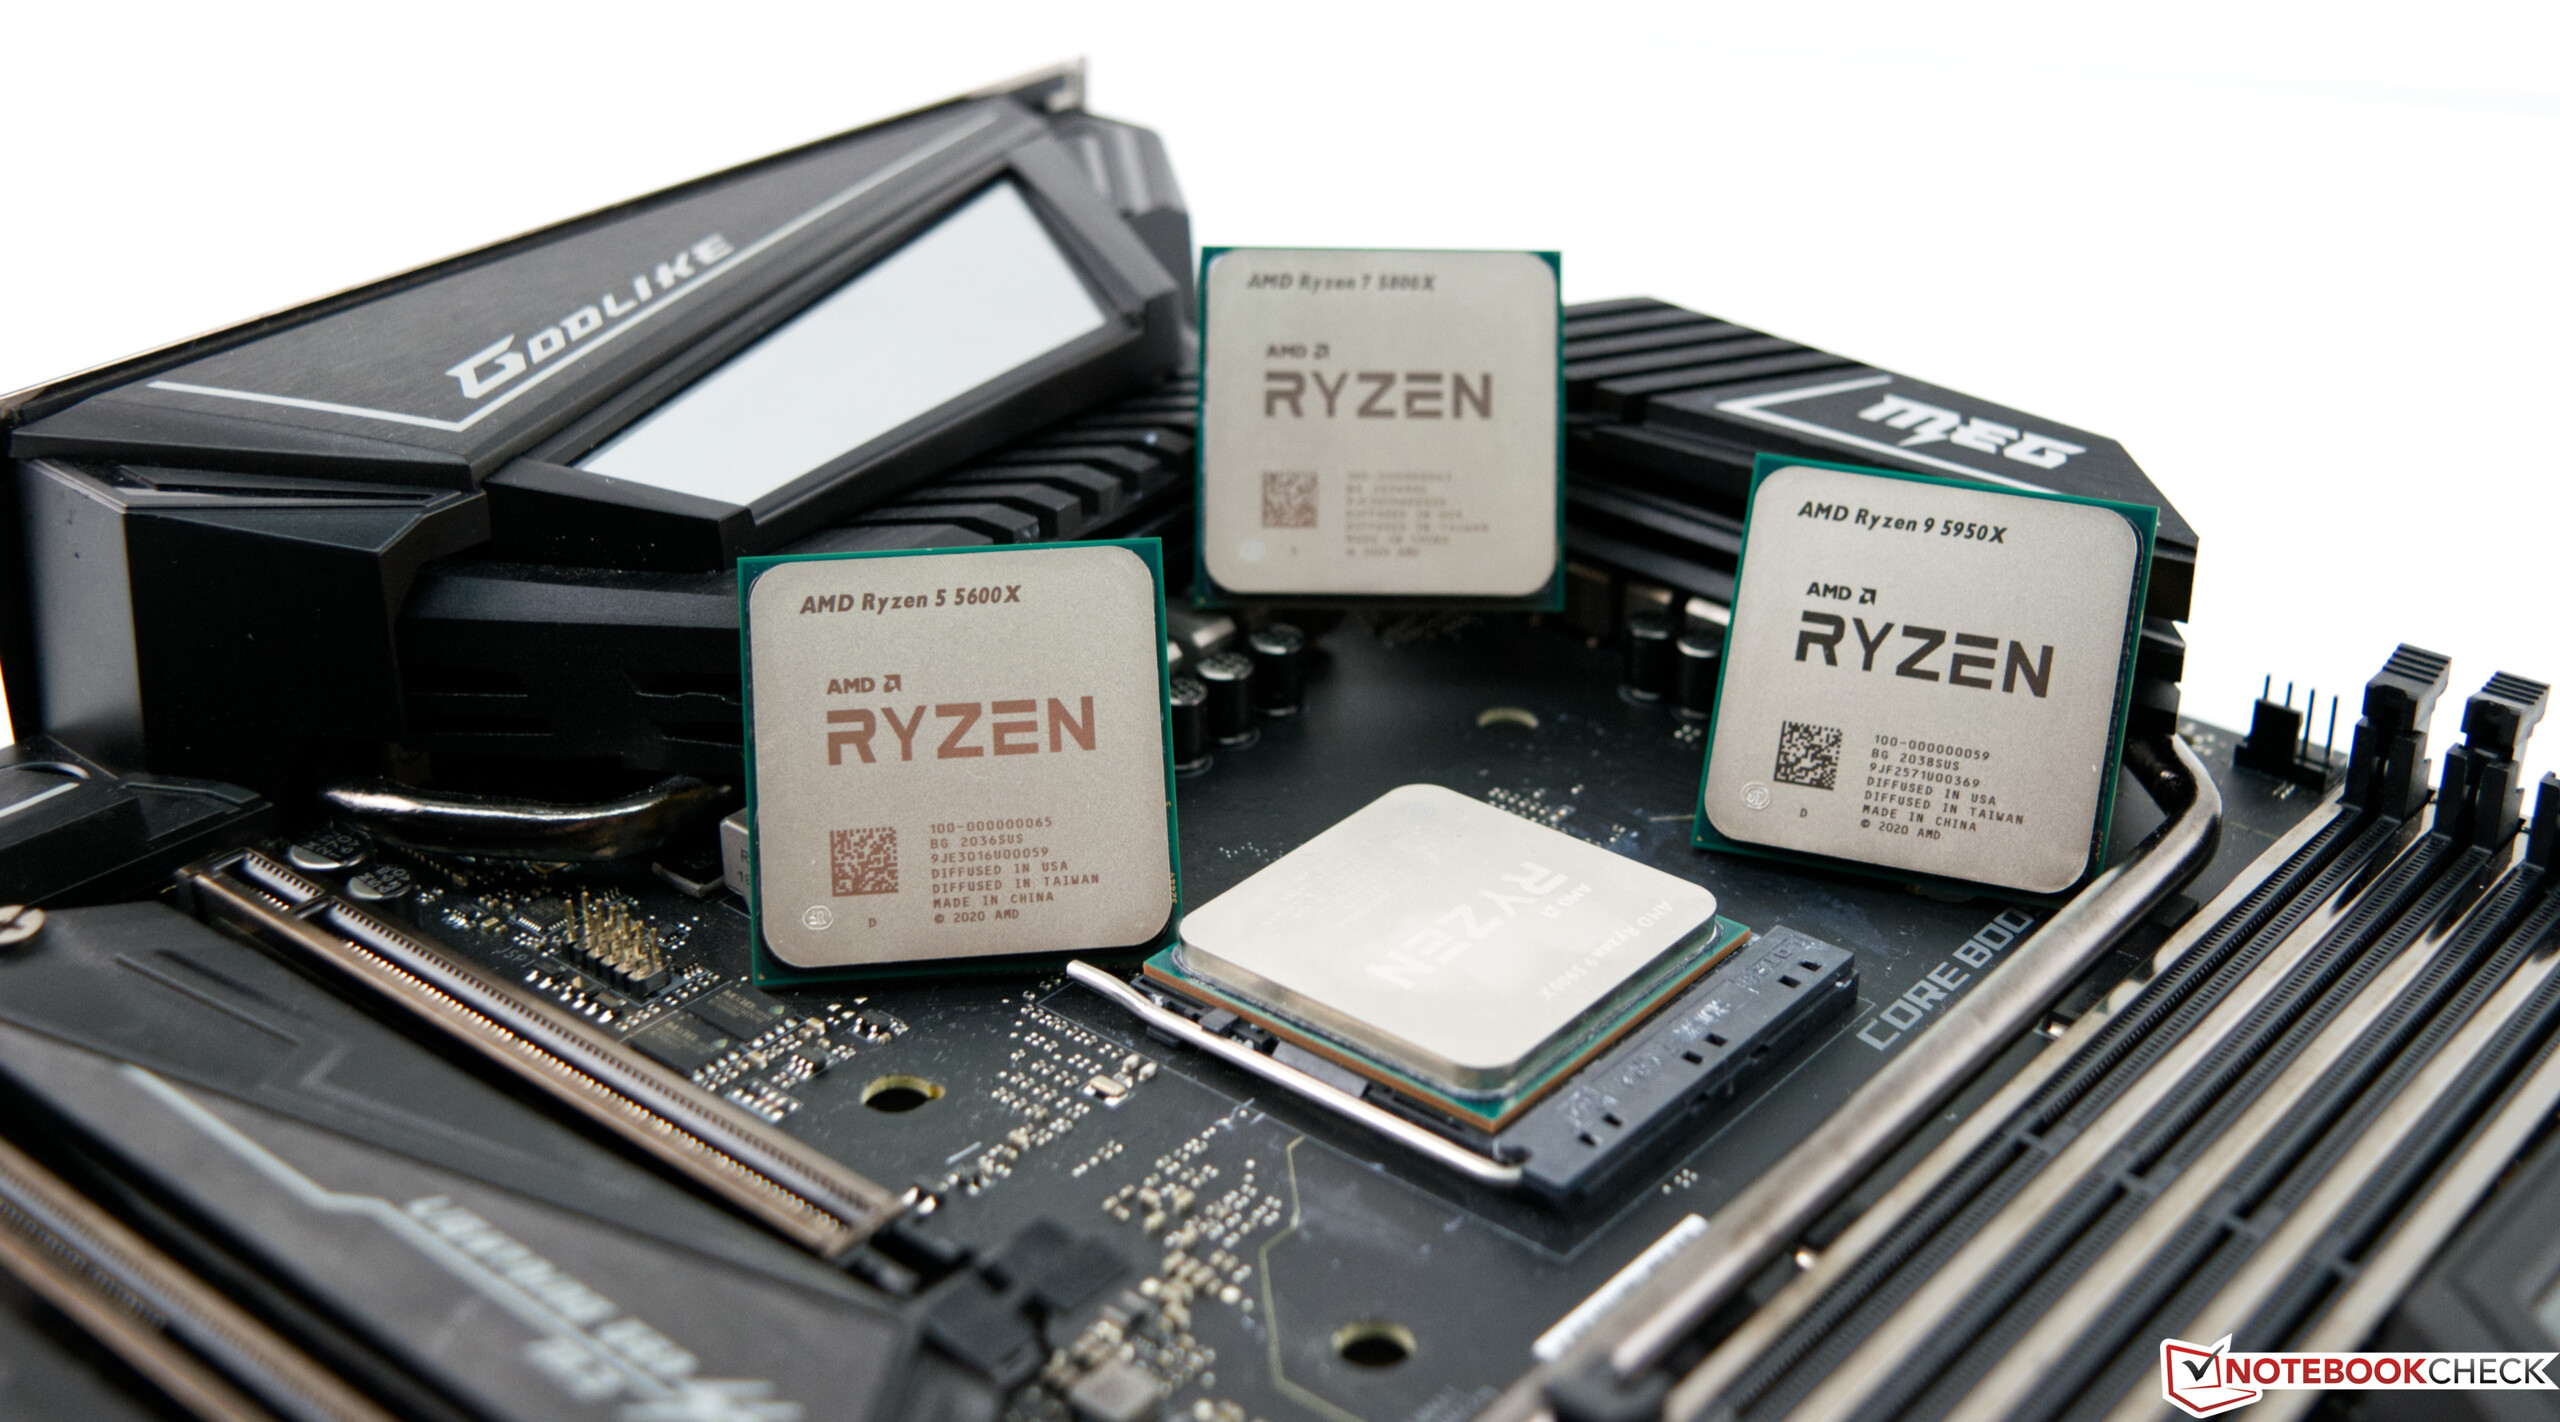
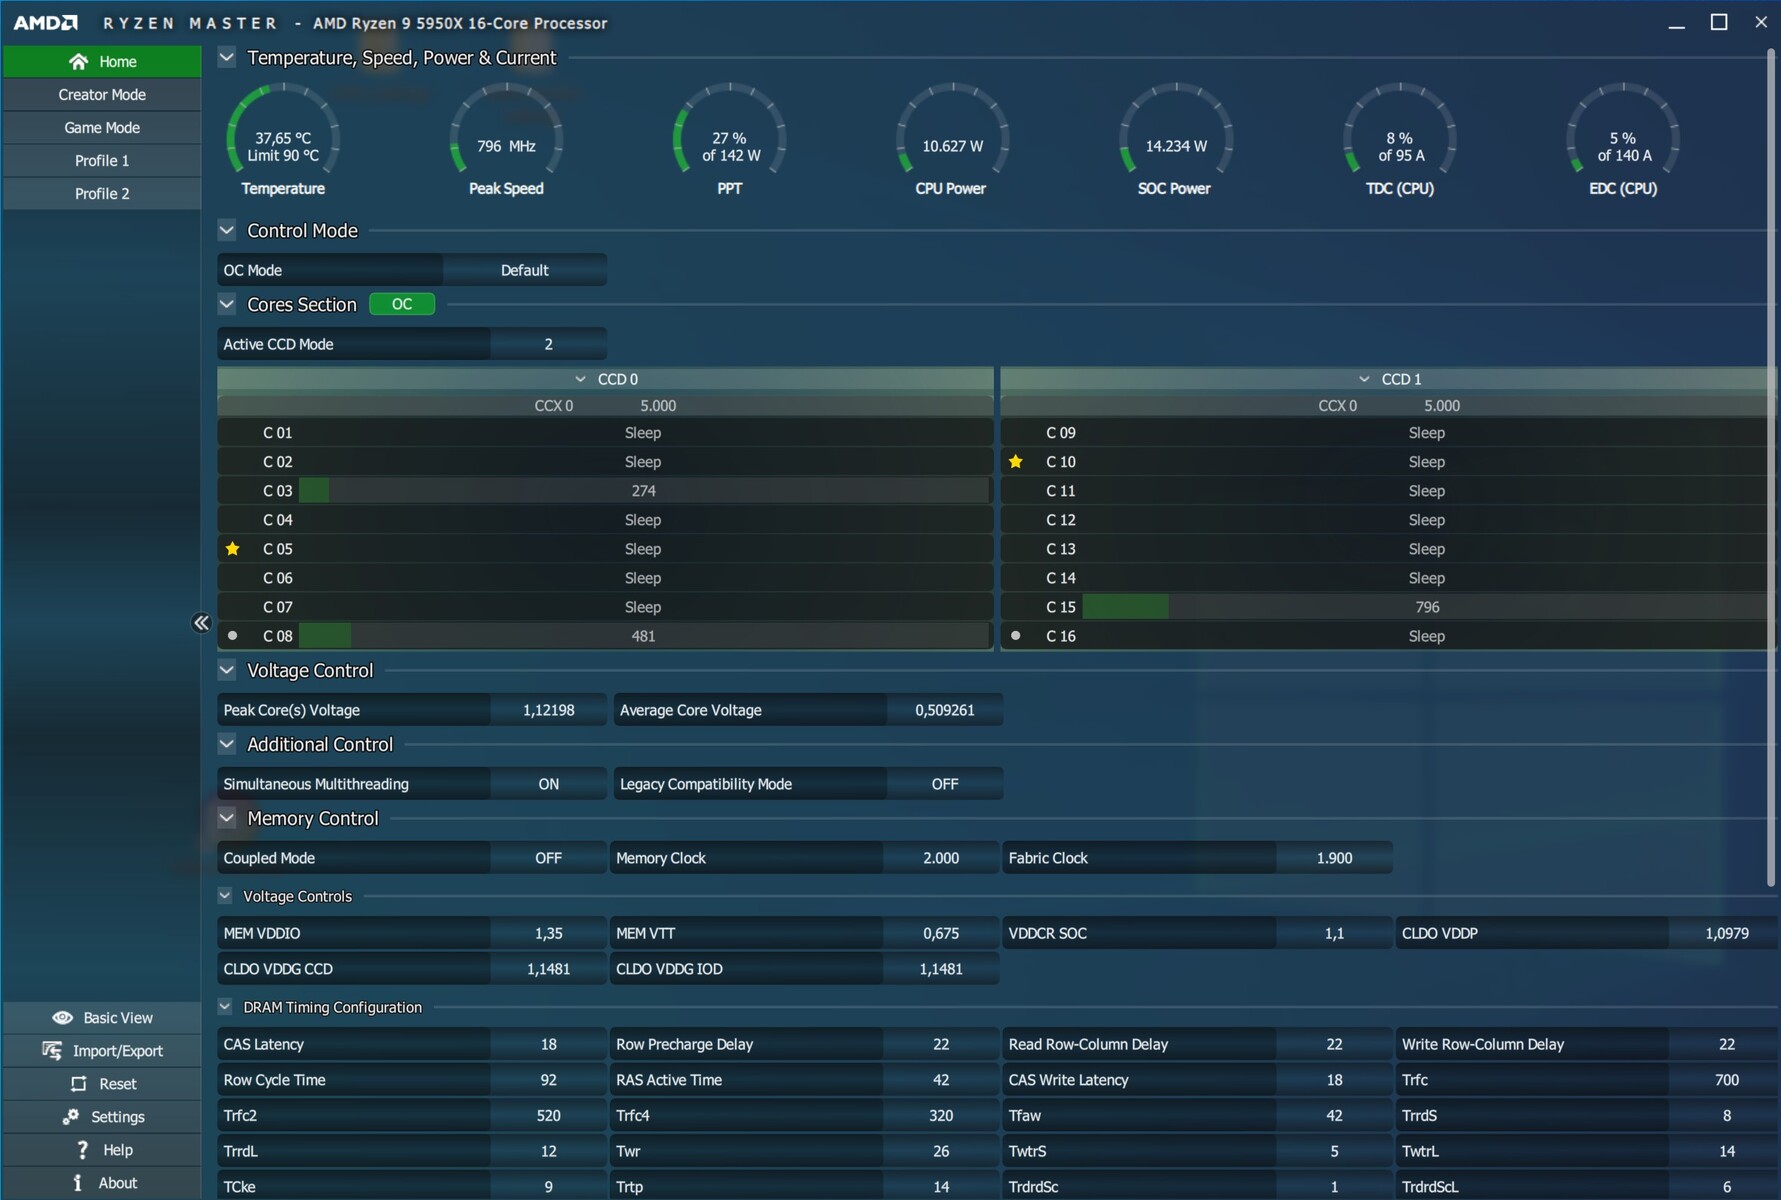
De Ryzen 9 5950X gebruikt als topmodel 2 CCD's met elk 8 aders. In de Ryzen 5 5600X zijn slechts 6 kernen van één CCD actief. In vergelijking met Intel (PL2 250 Watt) is het topmodel met 142 Watt ook aanzienlijk efficiënter bij gebruik van de PL2. We hebben in deze test al aanvullende innovaties van de Zen-3-architectuur geëvalueerd.
Overzicht van de AMD Ryzen Processors
| Model | Cores/Threads | Clock Speed | Turbo Speed | L3 Cache | TDP | Launch Price |
|---|---|---|---|---|---|---|
| Ryzen 9 5950X | 16/32 | 3,4 GHz | 4,9 GHz | 64MB | 105Watt | 799USD |
| Ryzen 9 3950X | 16/32 | 3,5 GHz | 4,7 GHz | 64 MB | 105 Watt | 749 USD |
| Ryzen 9 5900X | 12/243,7 GHz | 4,8 GHz | 64MB | 105Watt | 549USD | |
| Ryzen 9 3900XT | 12/24 | 3,8 GHz | 4,7 GHz | 64 MB | 105 Watt | 499 USD |
| Ryzen 9 3900X | 12/24 | 3,8 GHz | 4,6 GHz | 64 MB | 105 Watt | 499 USD |
| Ryzen 7 5800X | 8/163,8 GHz | 4,7 GHz | 32 MB | 105Watt | 449USD | |
| Ryzen 7 3800XT | 8/163,9 GHz | 4,7 GHz | 32 MB | 105 Watt | 399 USD | |
| Ryzen 7 3800X | 8/16 | 3,9 GHz | 4,5 GHz | 32 MB | 105 Watt | 399 USD |
| Ryzen 7 3700X | 8/163,6 GHz | 4,4 GHz | 32 MB | 65 Watt | 329 USD | |
| Ryzen 5 5600X | 6/12 | 3,7 GHz | 4,6 GHz | 32MB | 65Watt | 299USD |
| Ryzen 5 3600XT | 6/12 | 3,8 GHz | 4,5 GHz | 32 MB | 95 Watt | 249 USD |
| Ryzen 5 3600X | 6/12 | 3,8 GHz | 4,4 GHz | 32 MB | 95 Watt | 229 USD |
| Ryzen 5 3600 | 6/12 | 3,6 GHz | 4,2 GHz | 32 MB | 65 Watt | 199 USD |
Details van ons testsysteem
We gebruiken het volgende systeem voor de onderstaande benchmarks:
- Raijintek Pean Benchtable
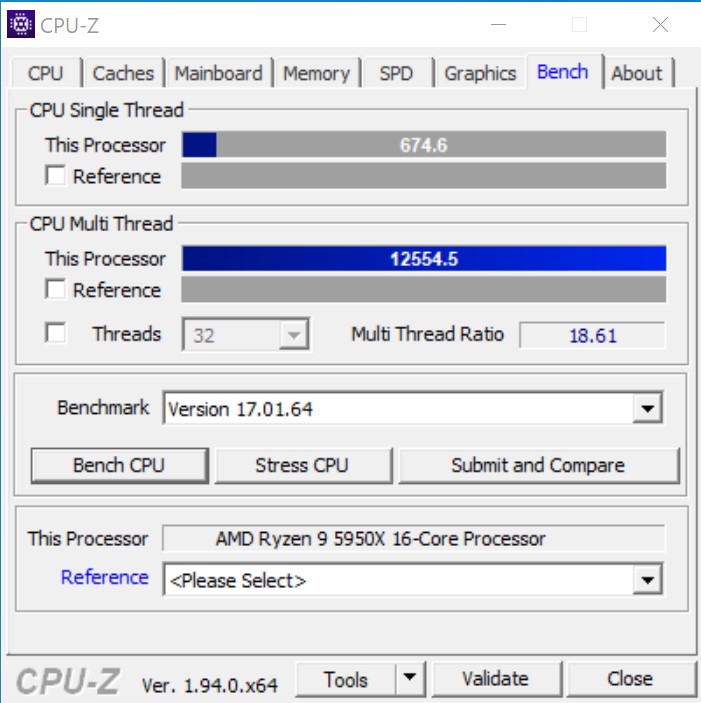
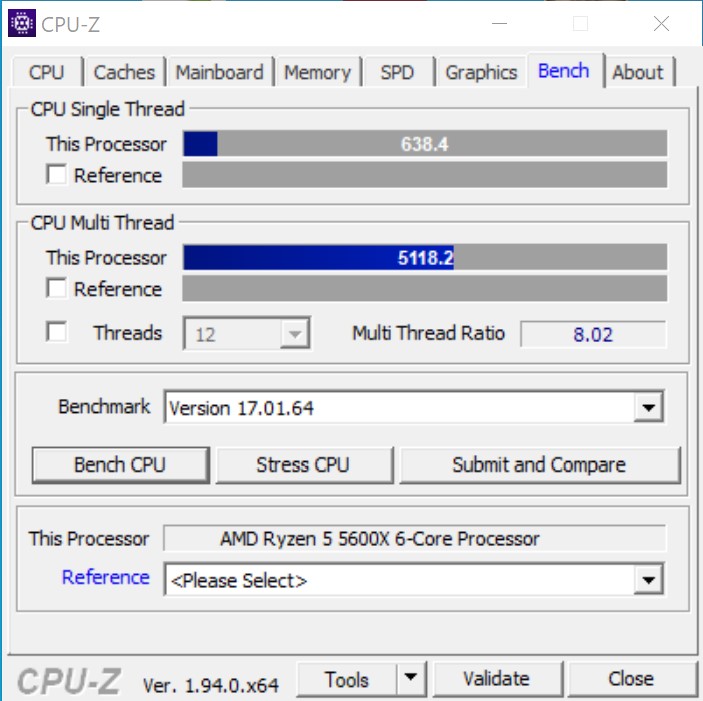
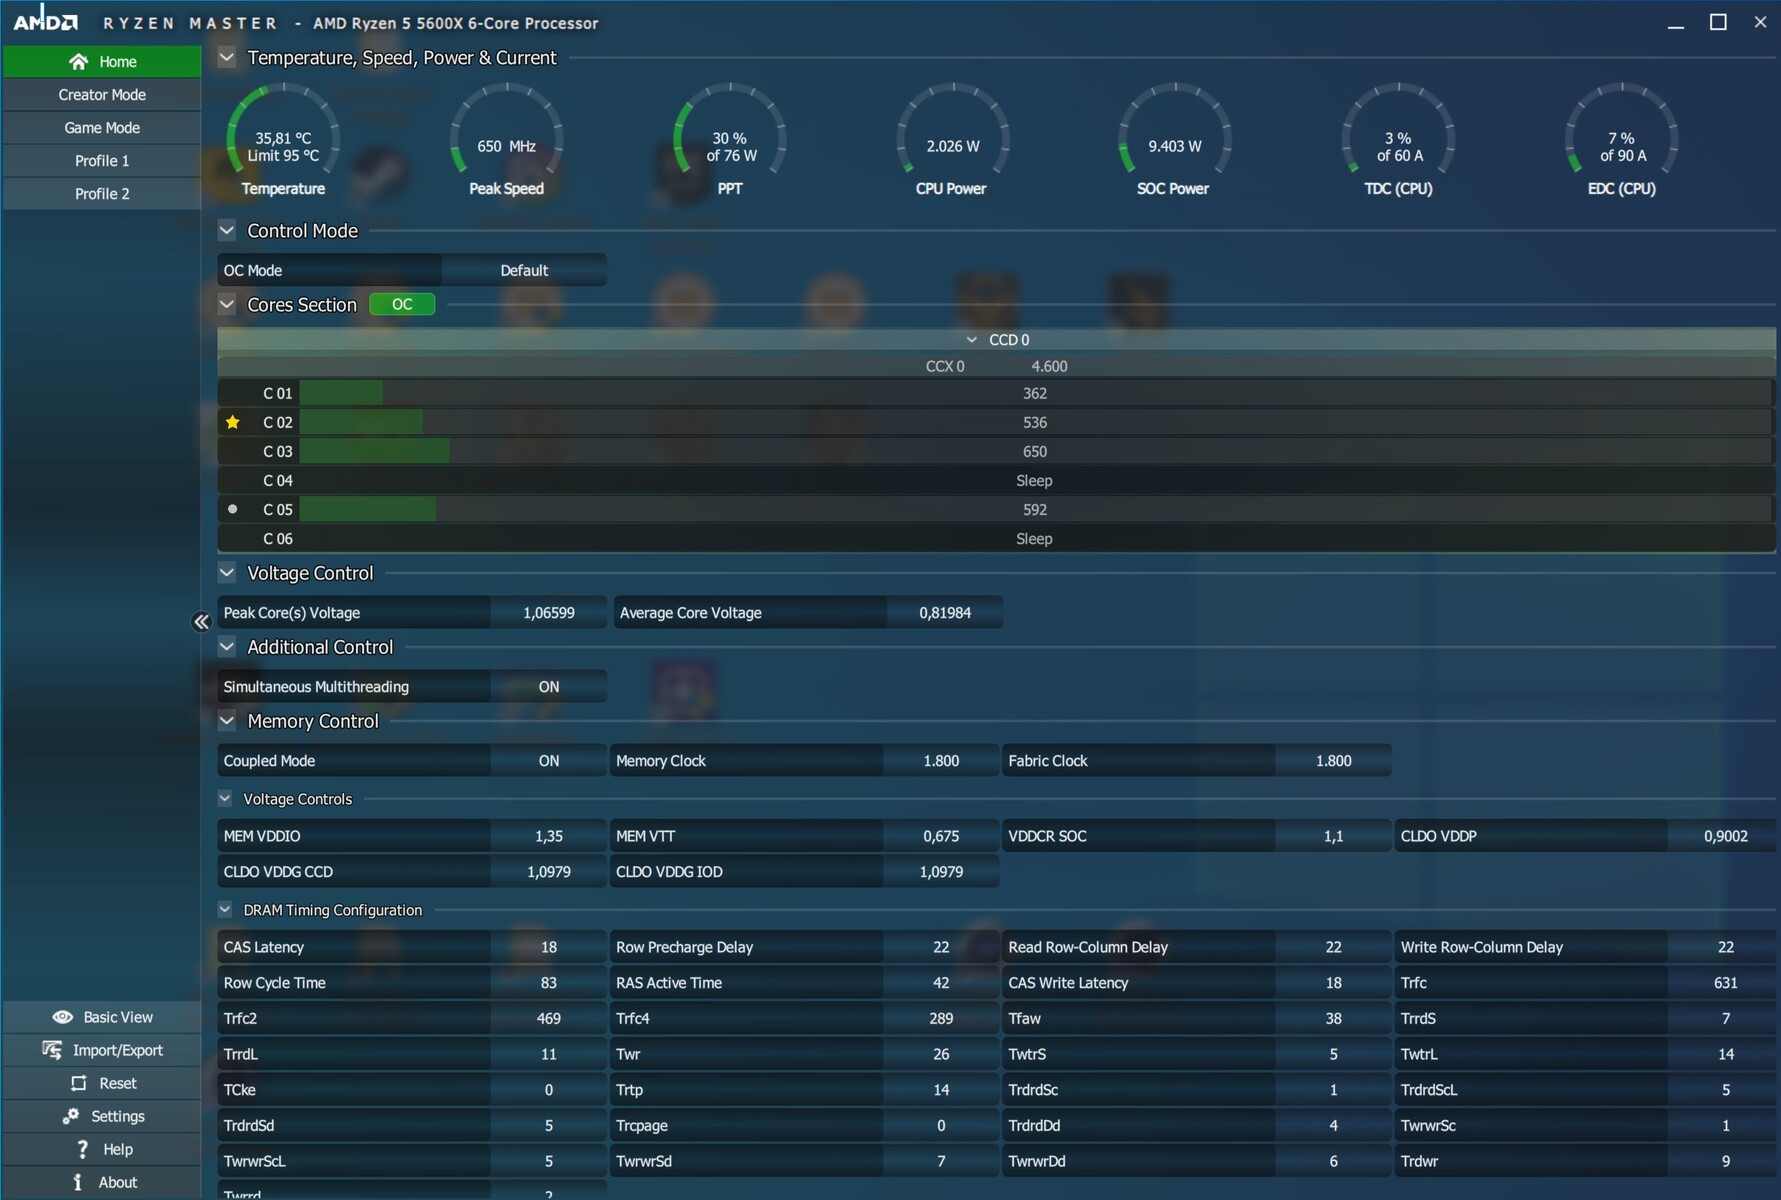
- AMD Ryzen 9 5950X, AMD Ryzen 5 5600X
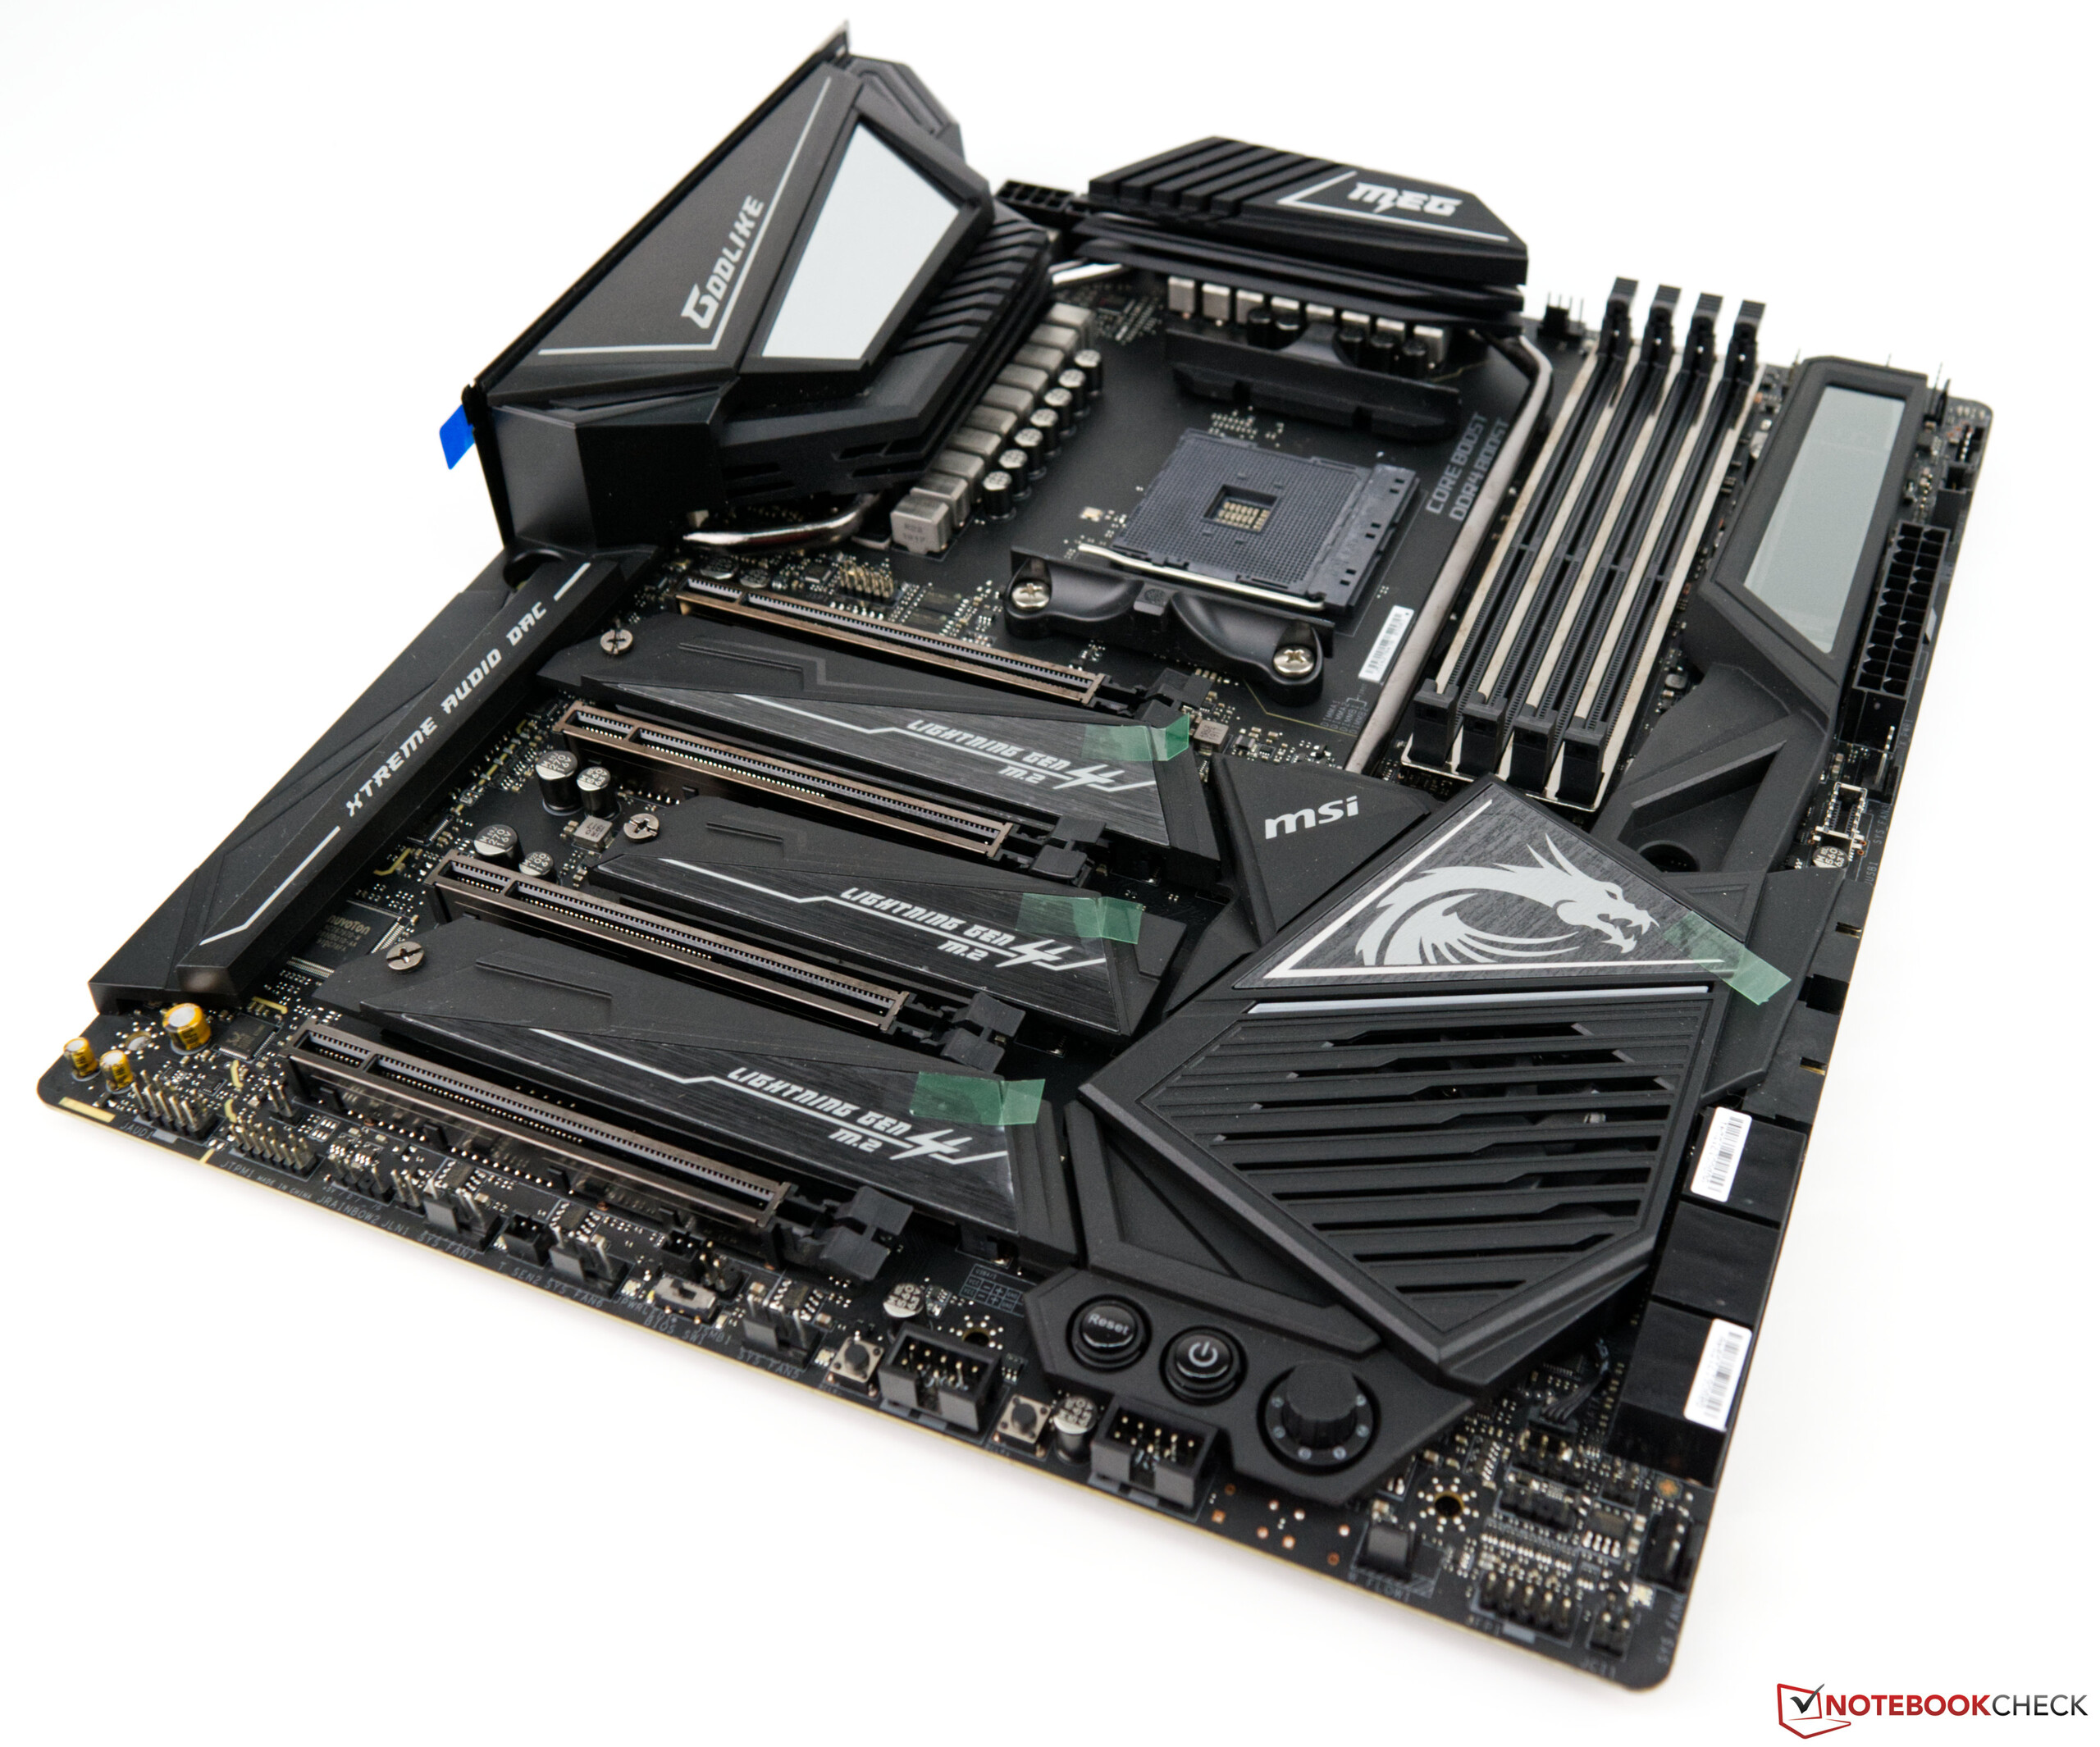
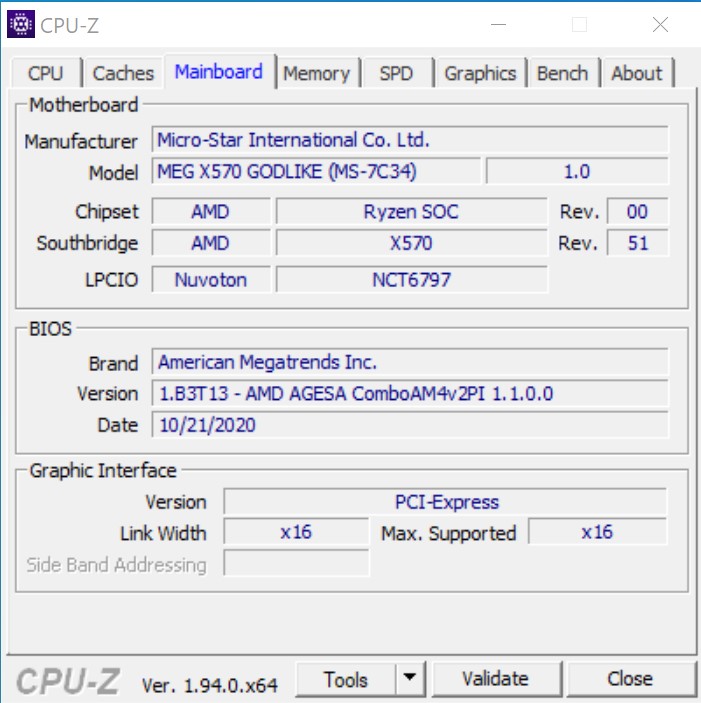
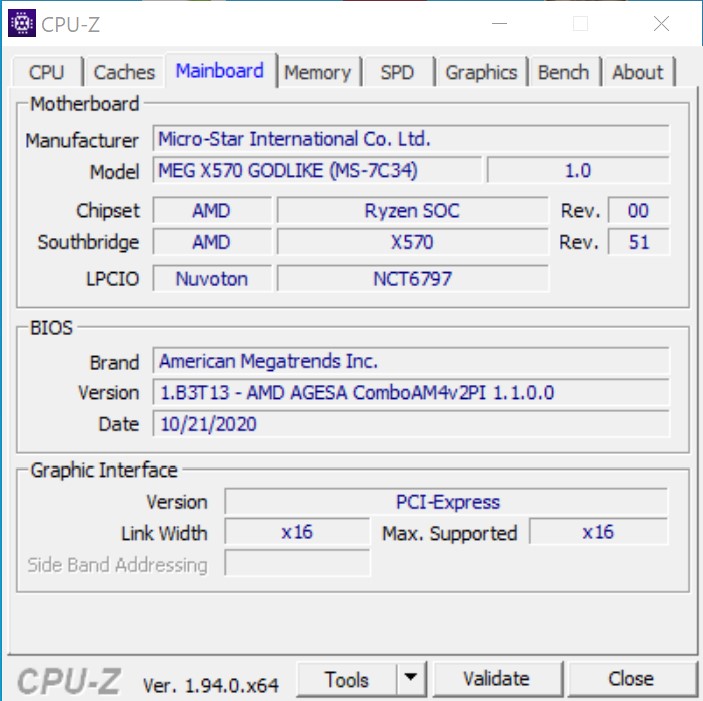
- MSI MEG X570 Goddelijke
- Alphacool Eisbear 280 AiO
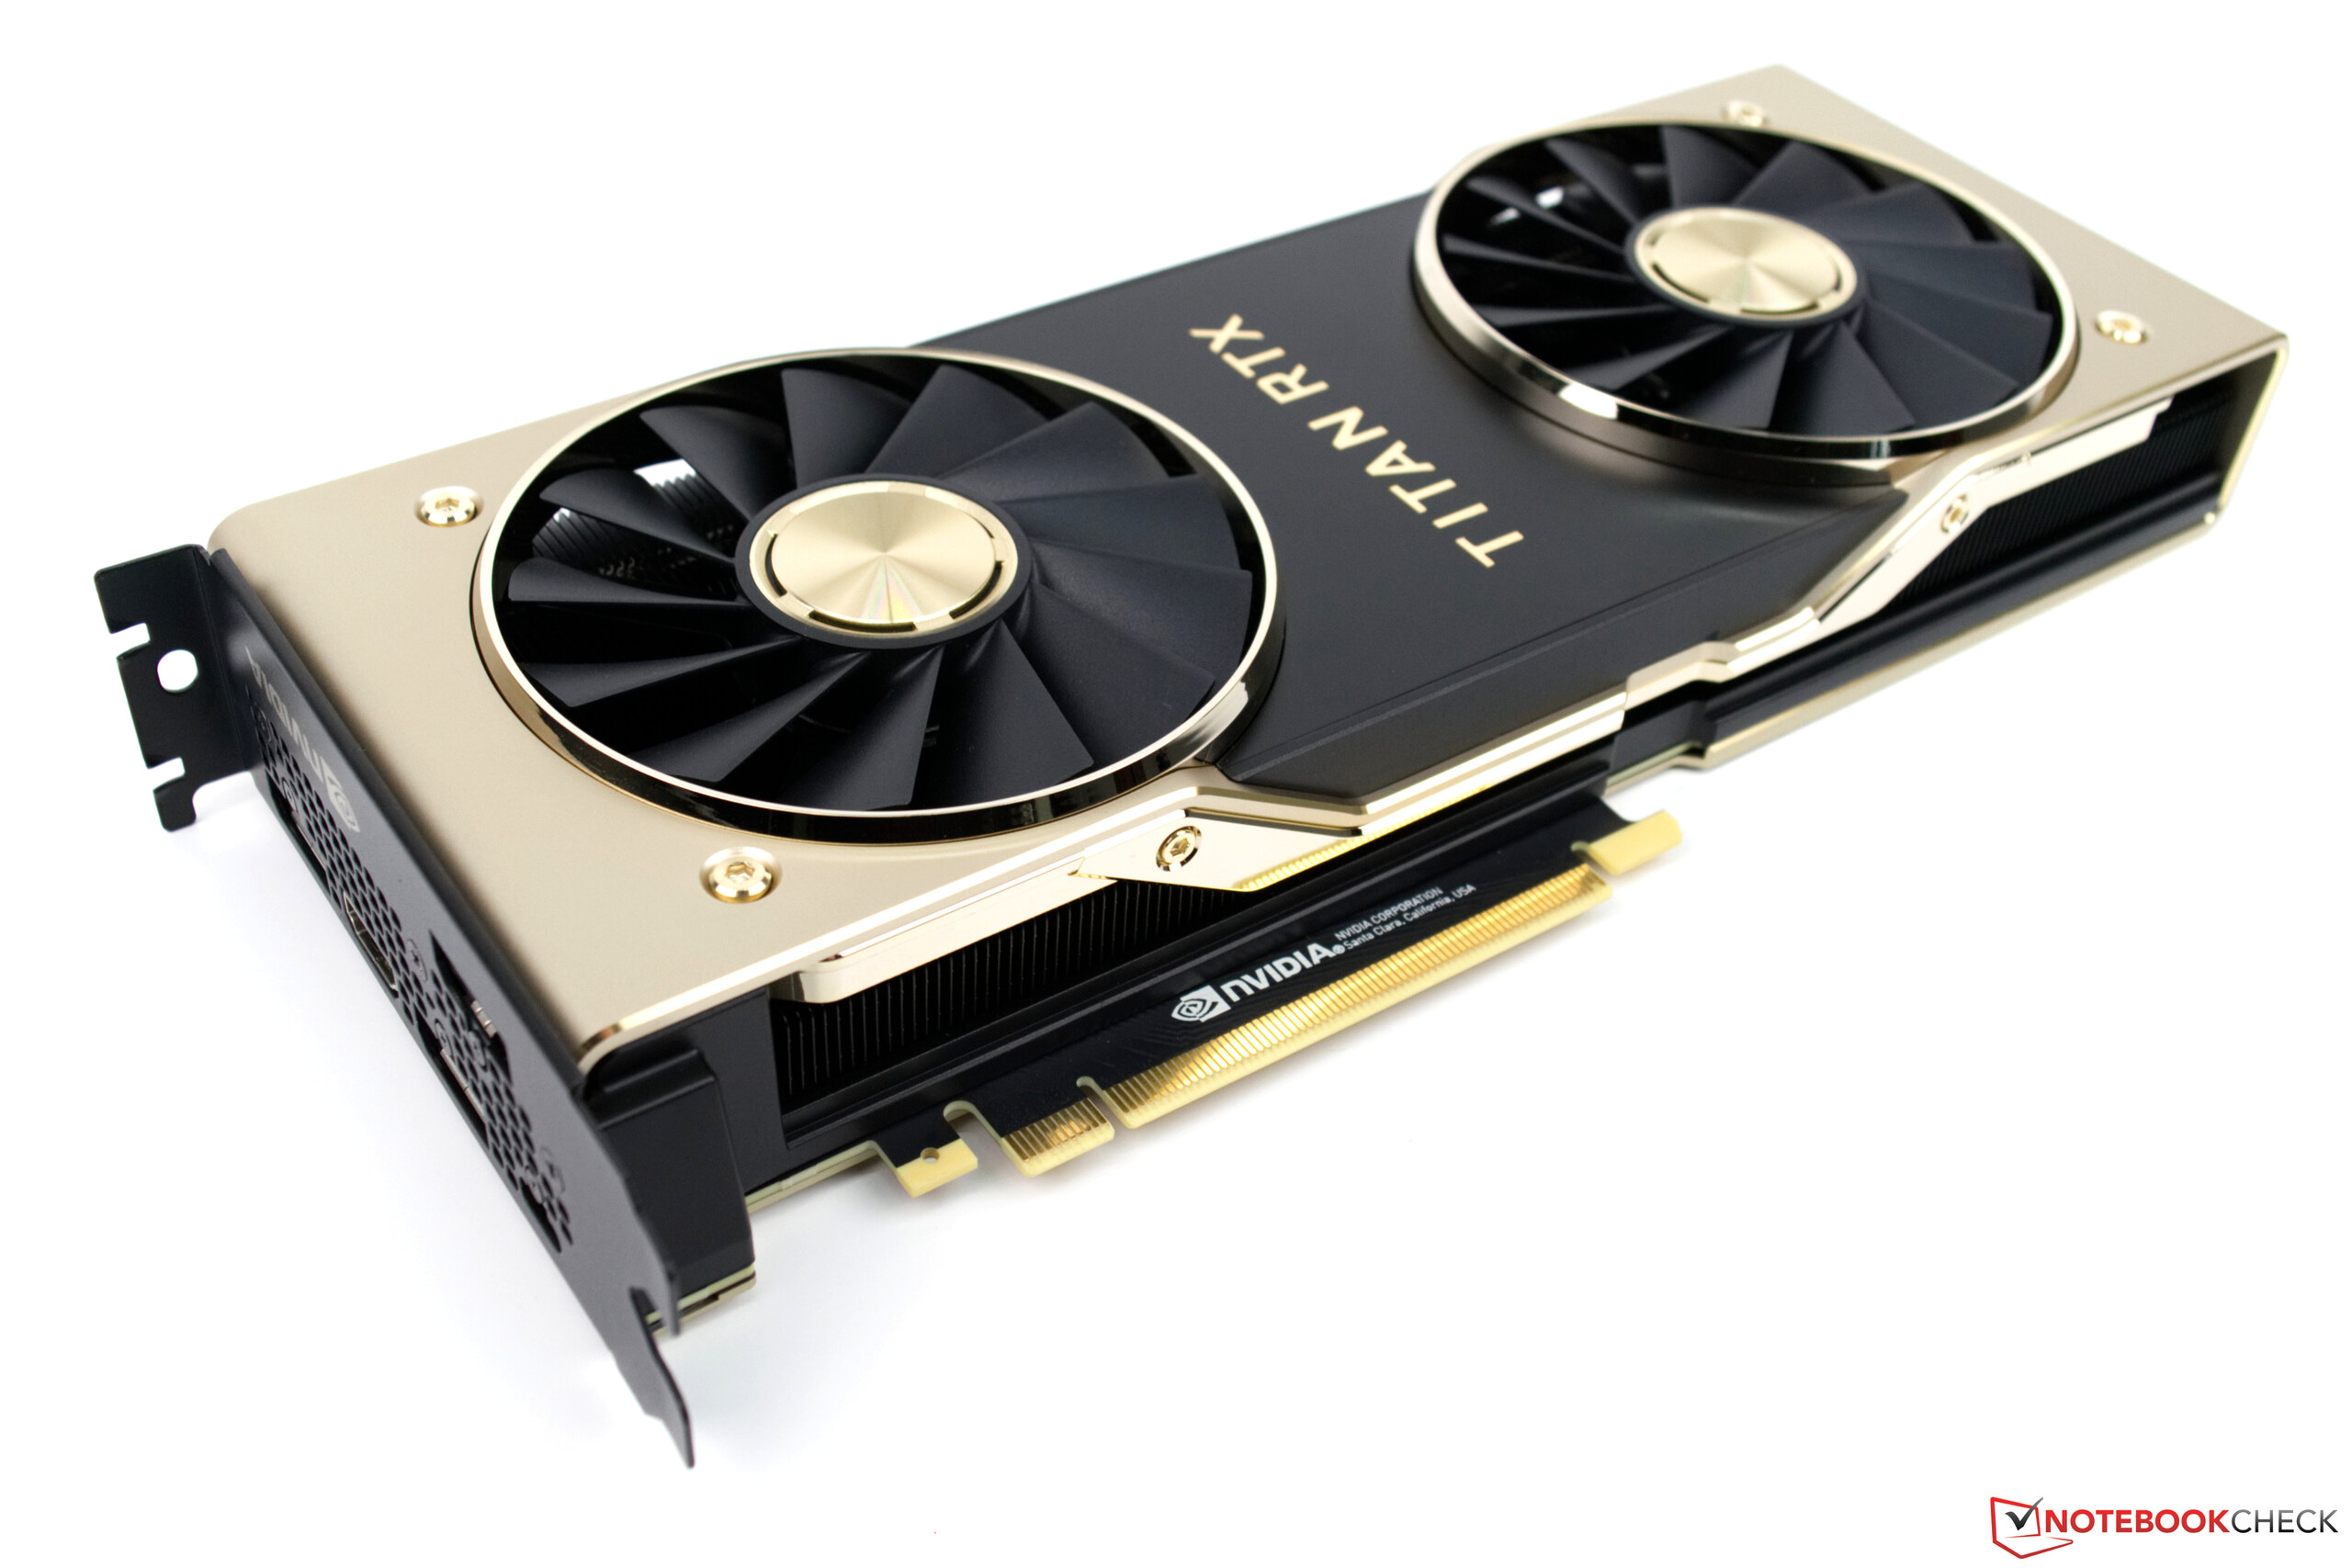
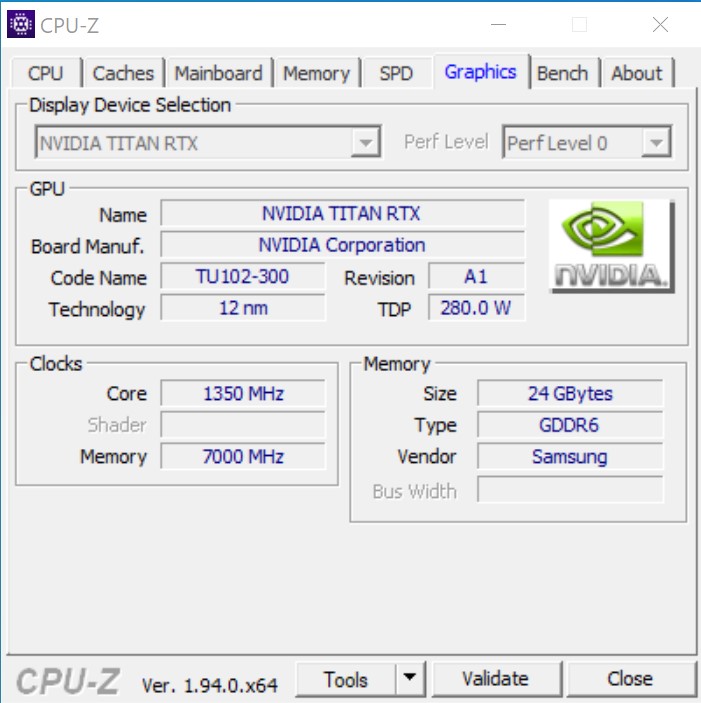
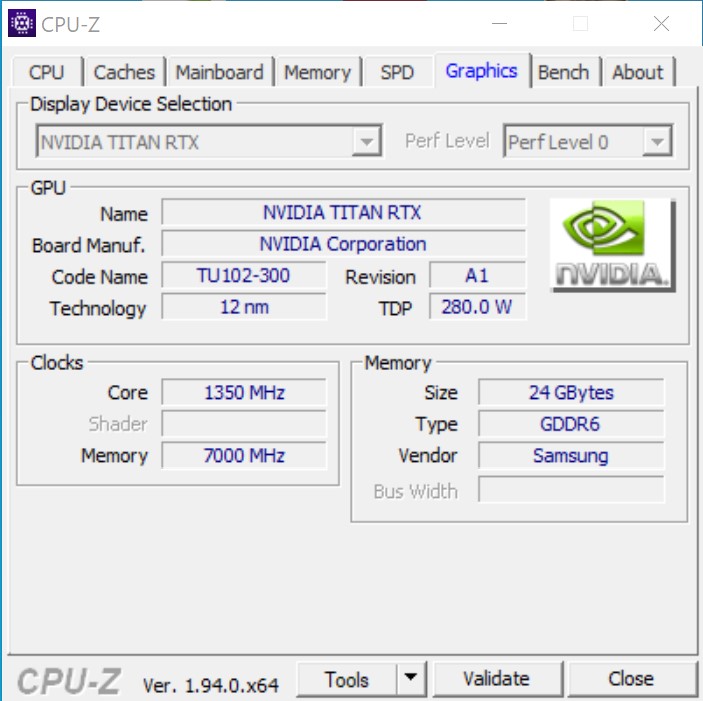
- Nvidia Titan RTX
- Corsair HX 1200i voeding
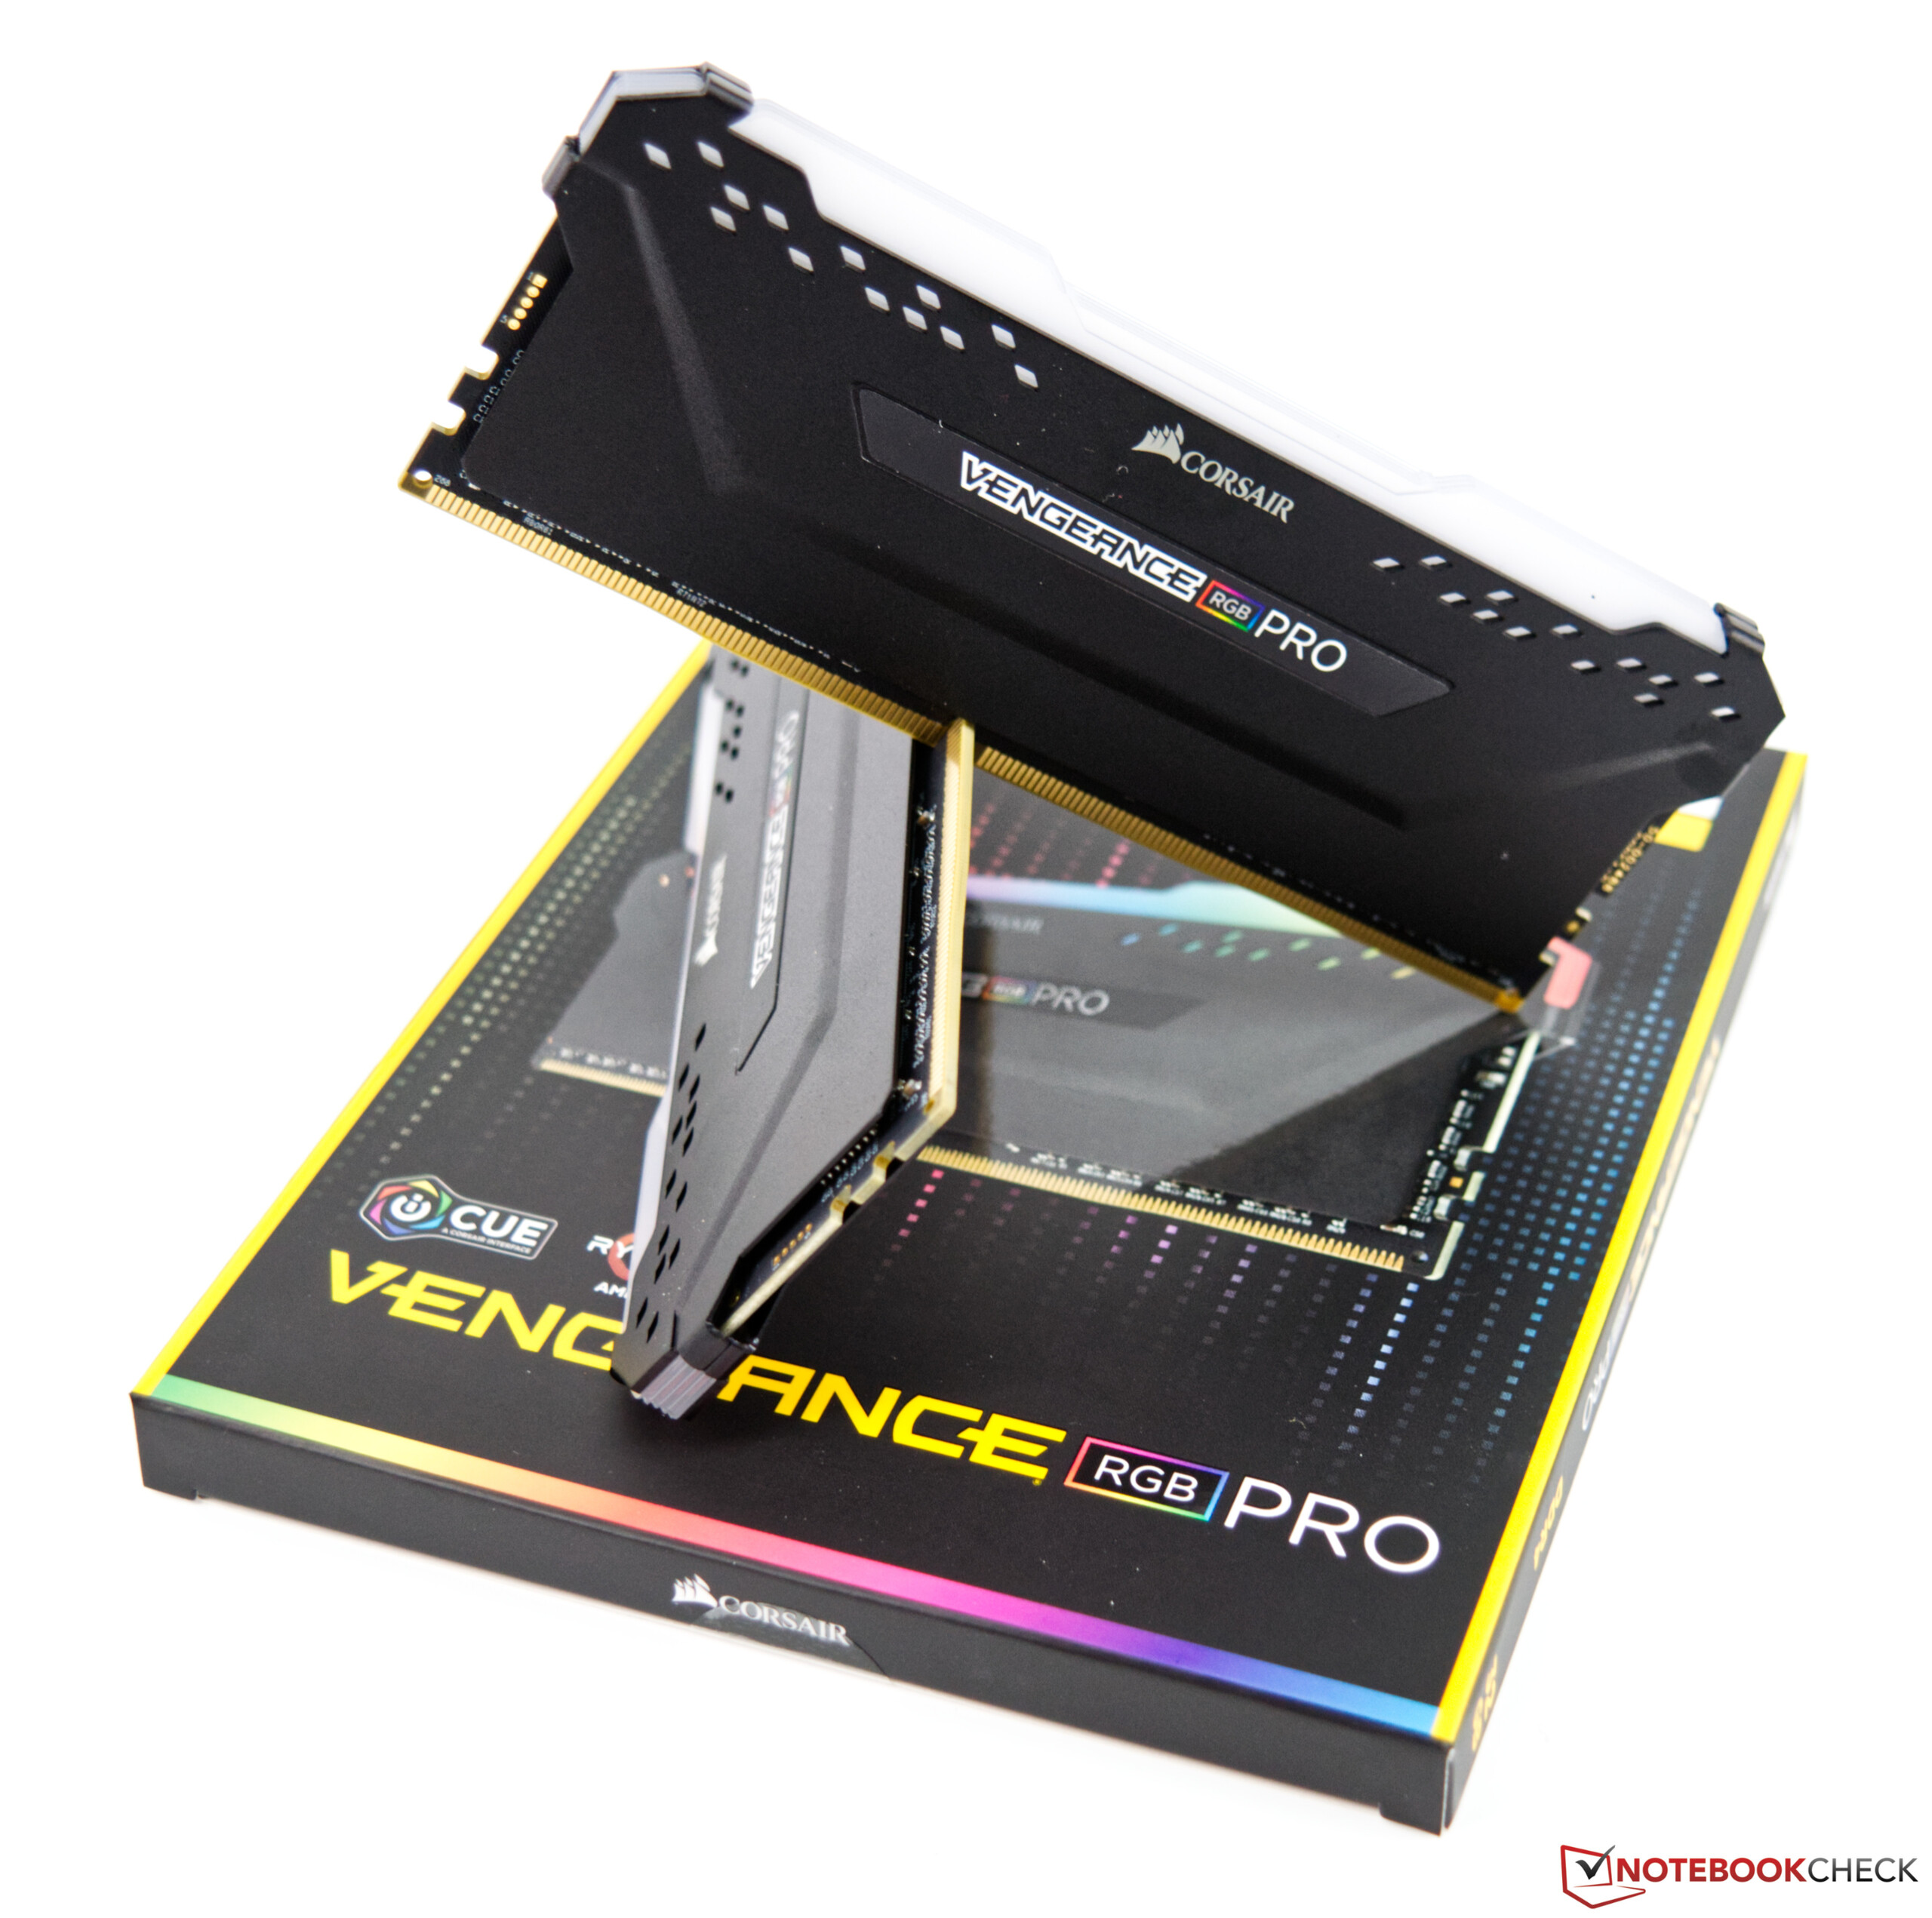
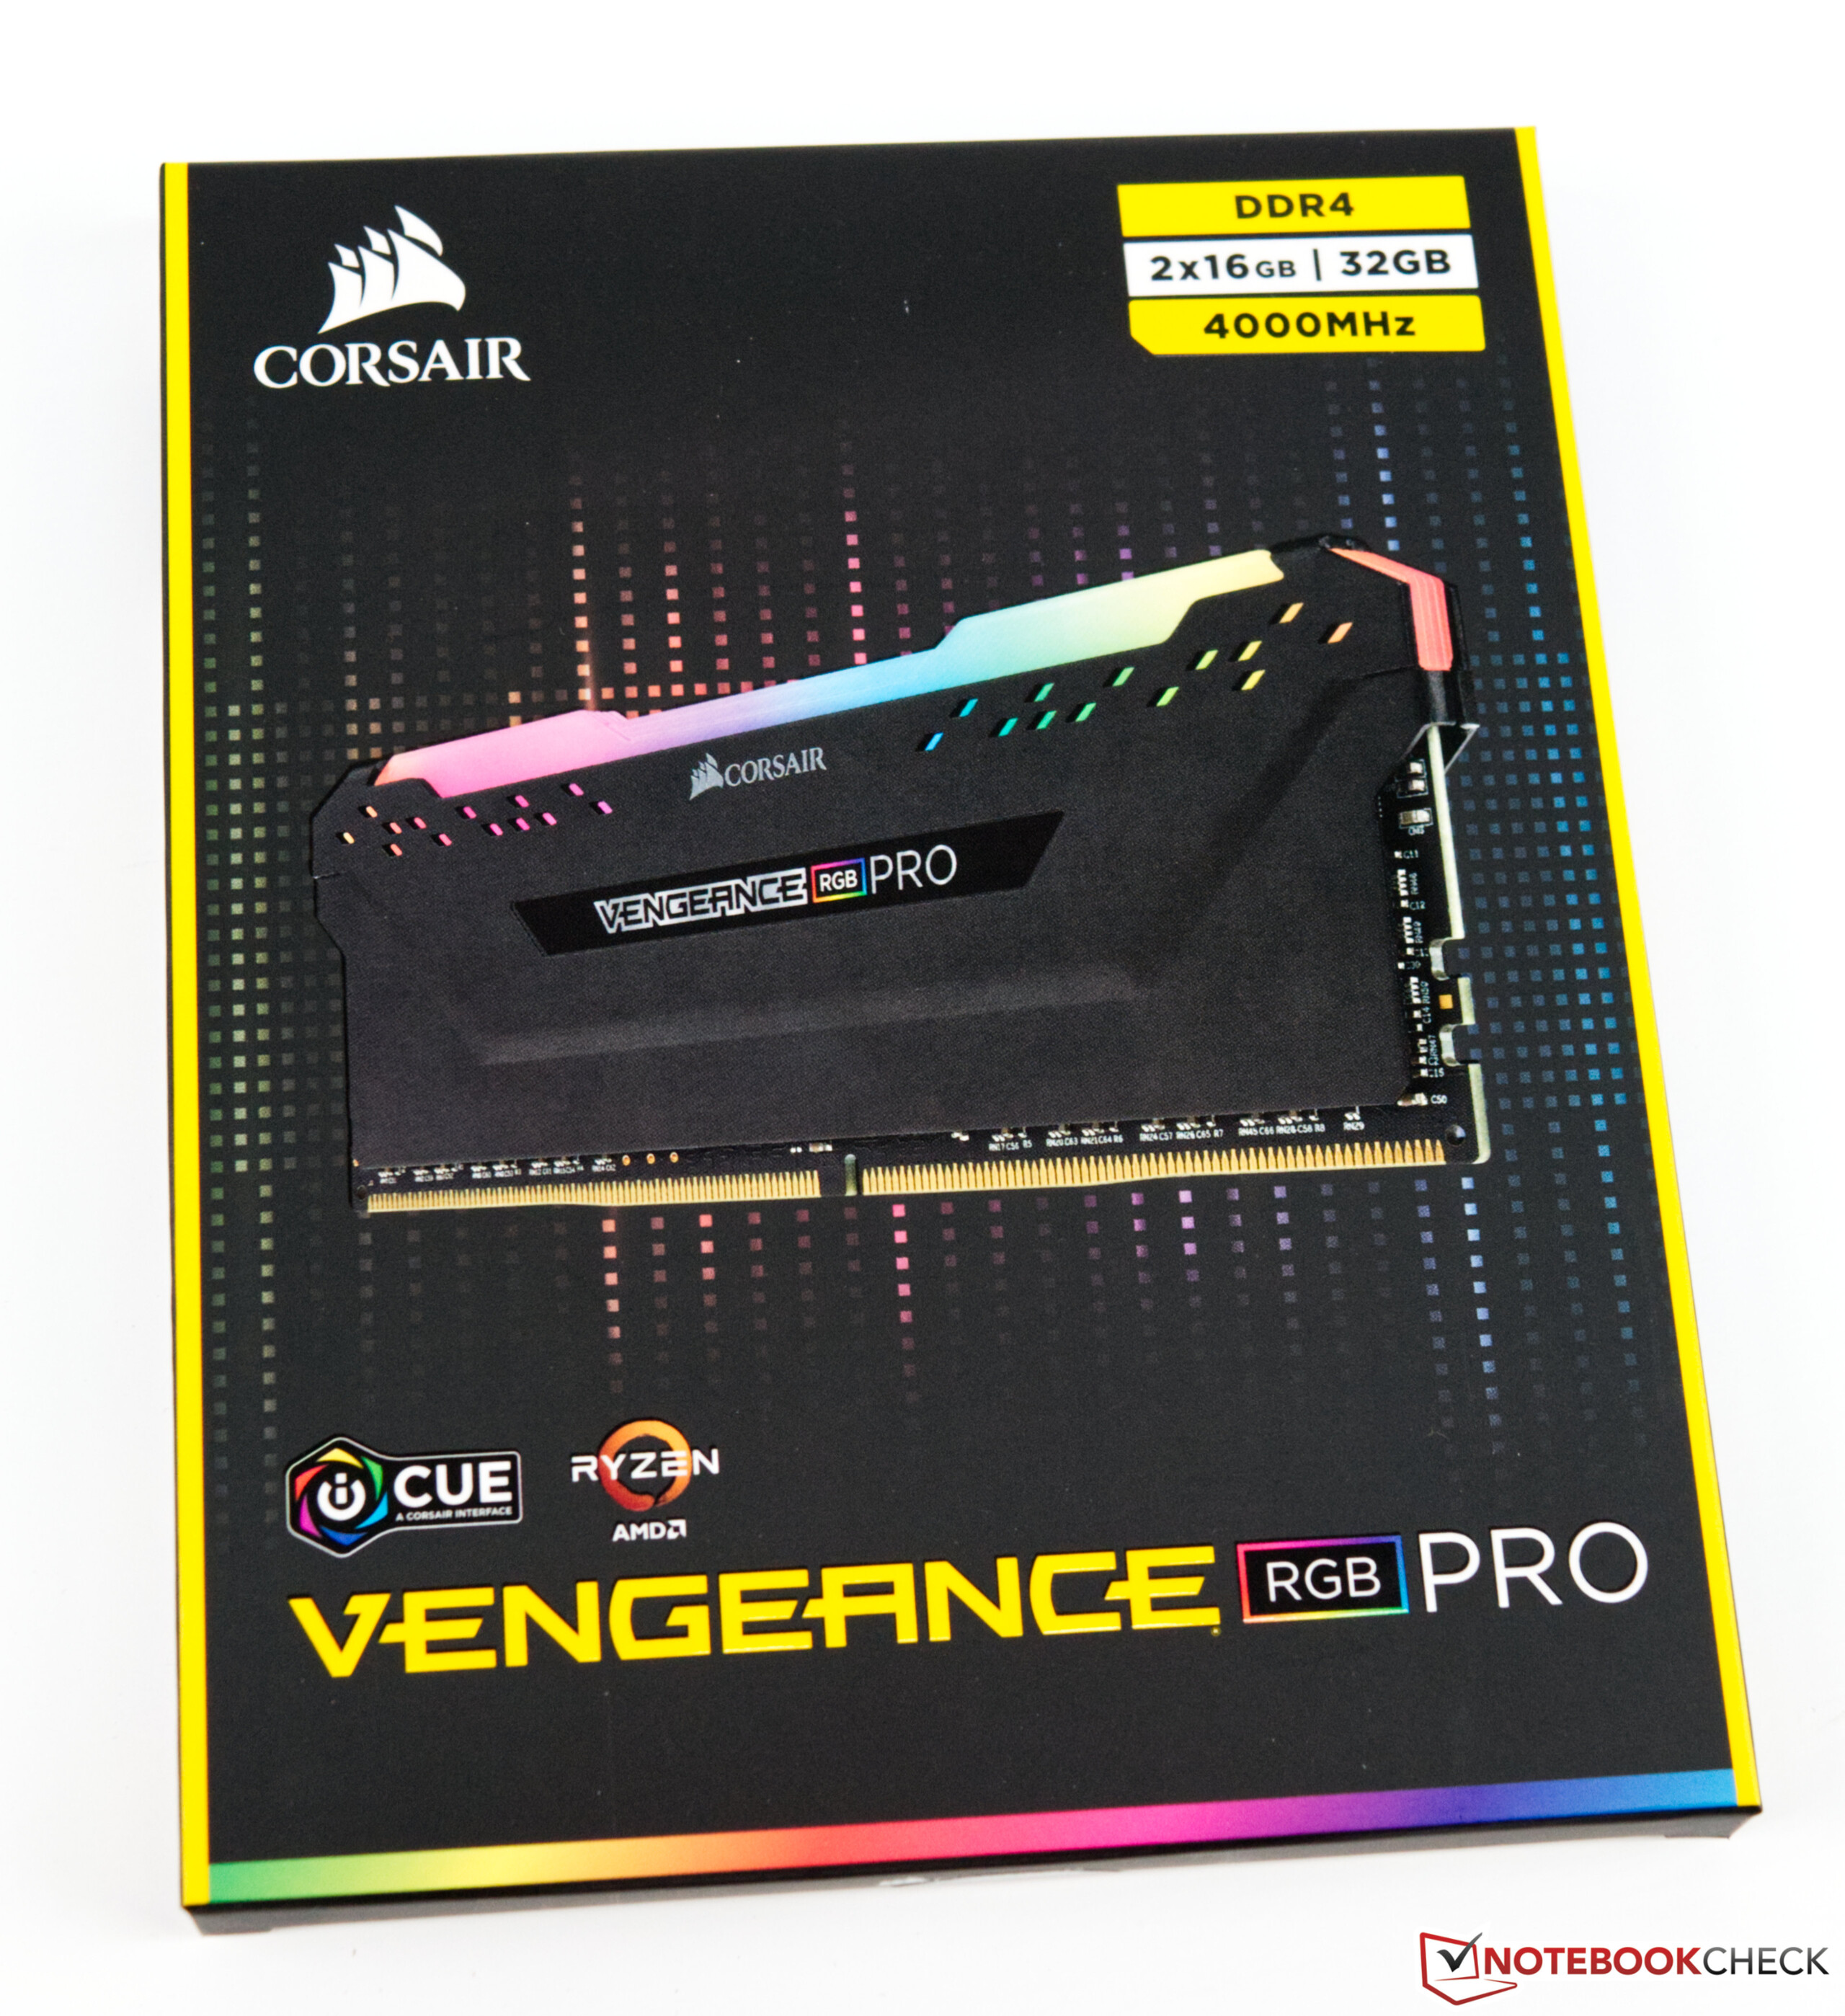
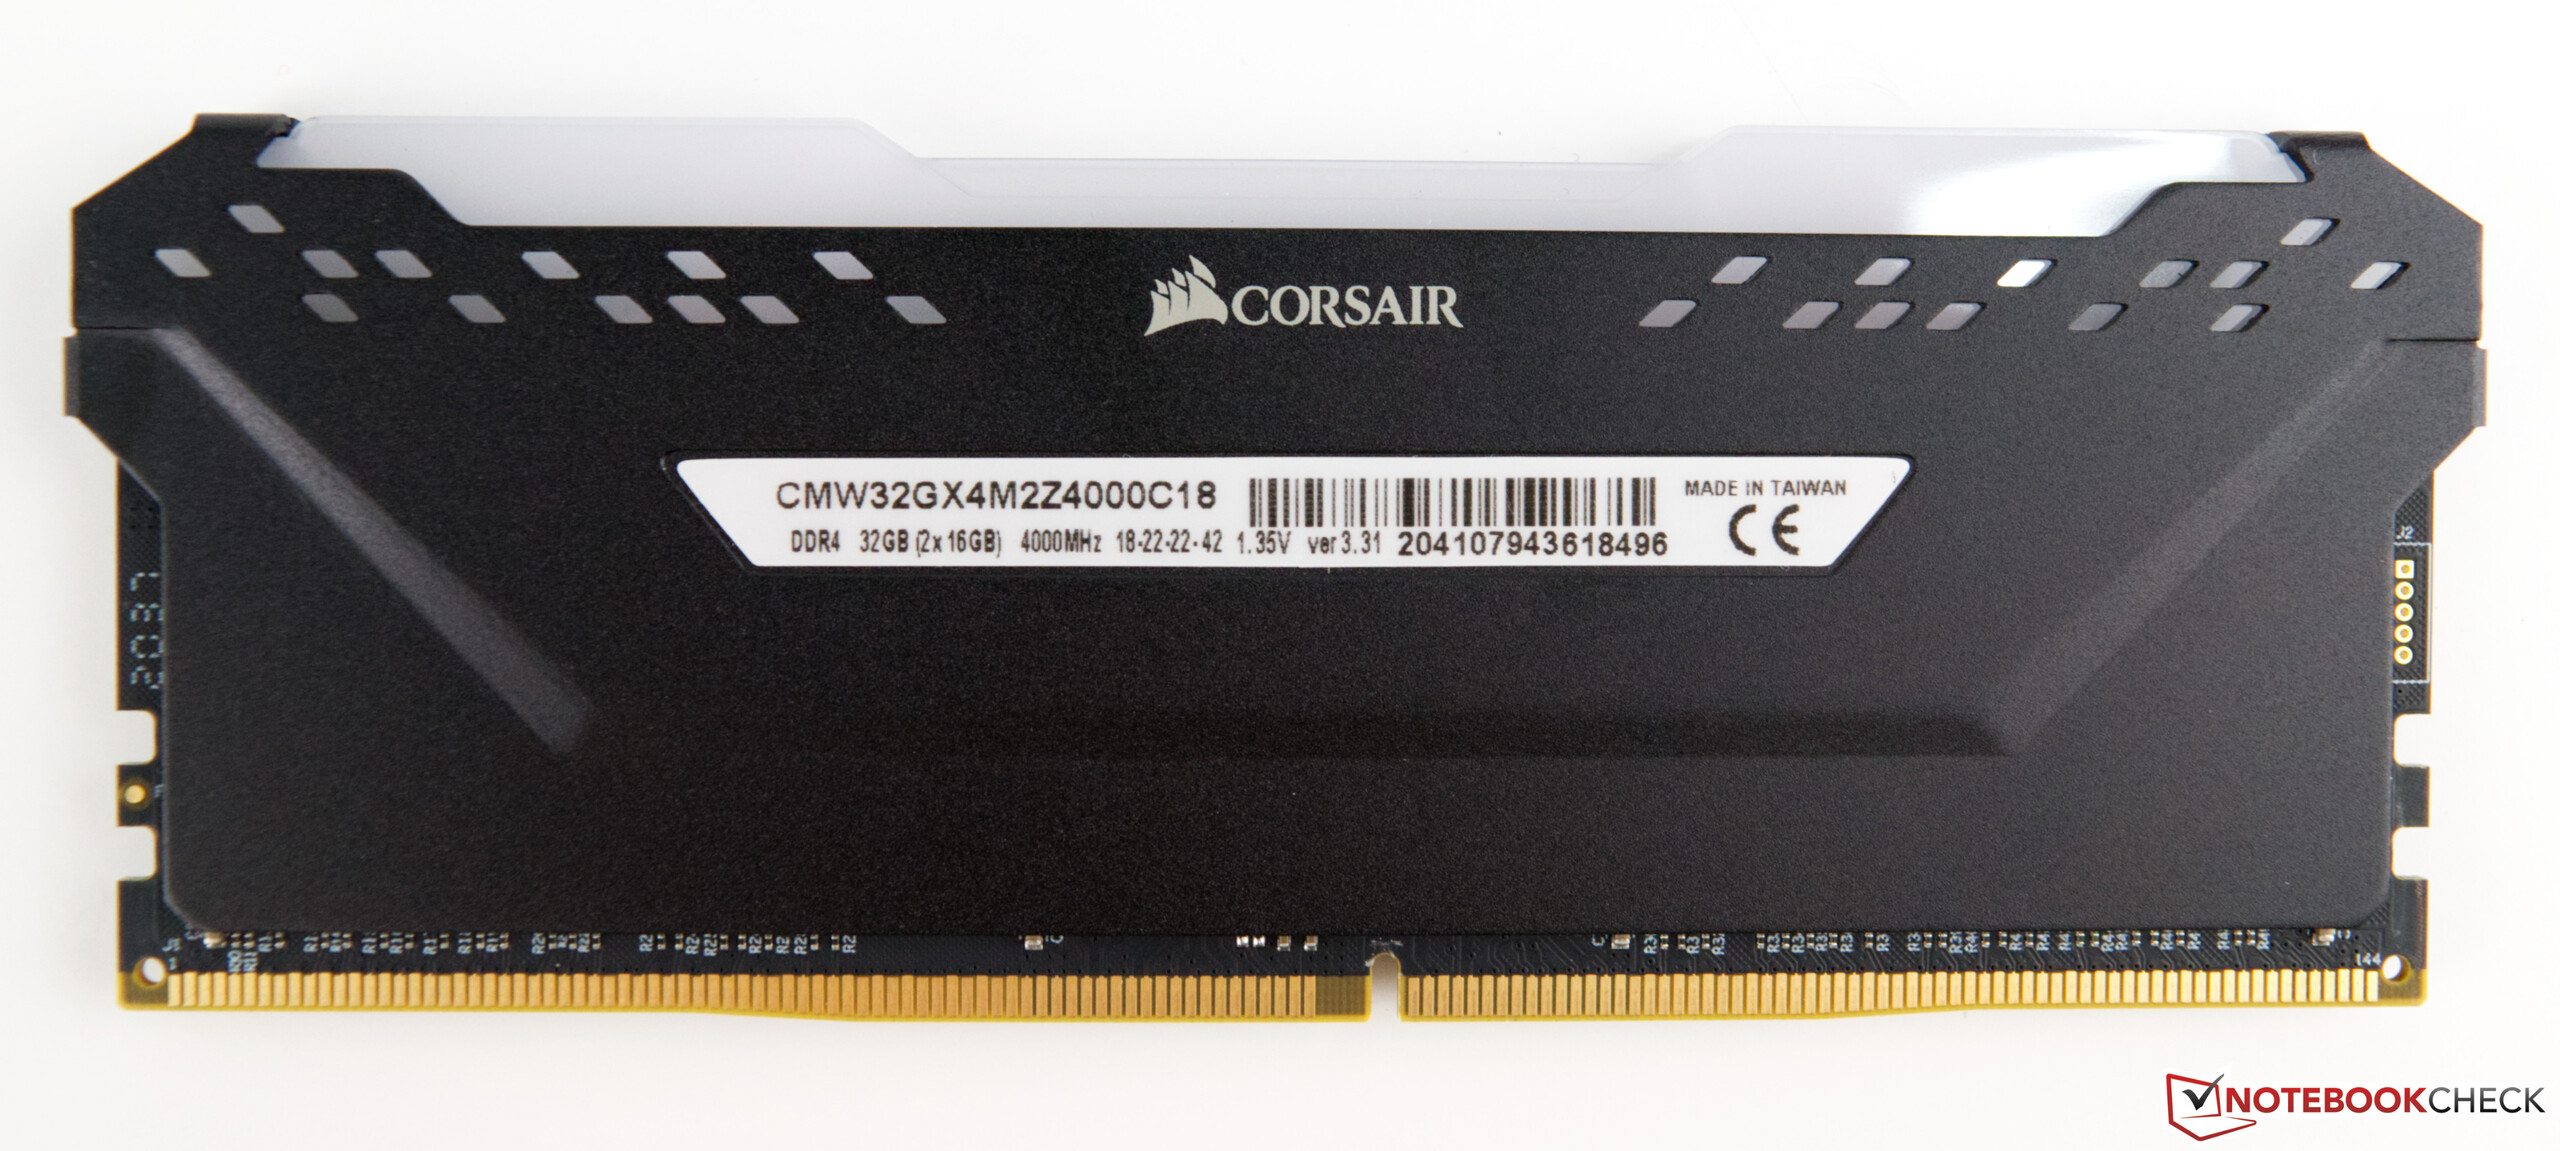
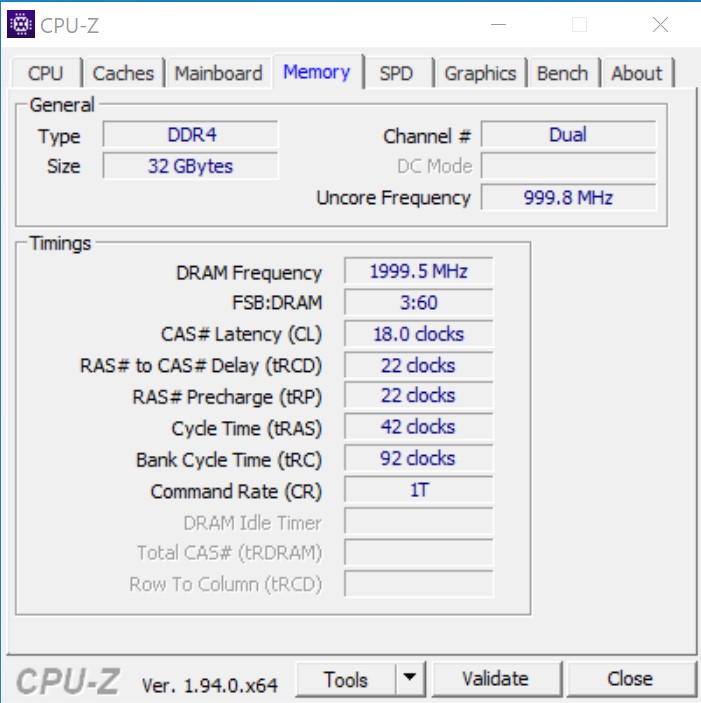
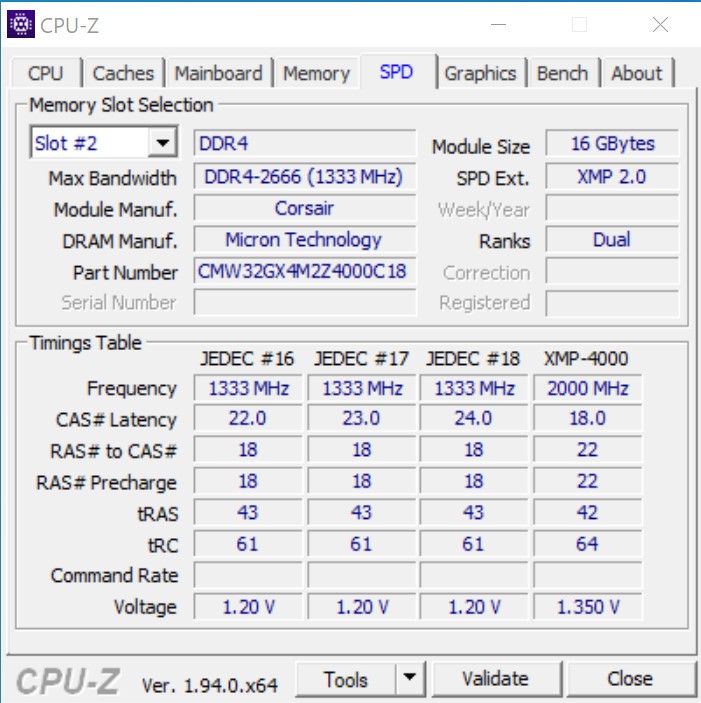
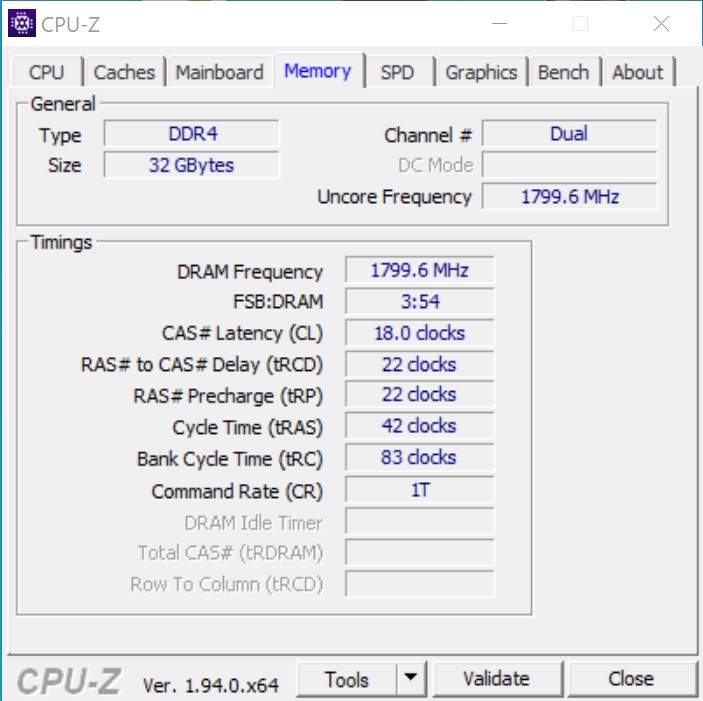
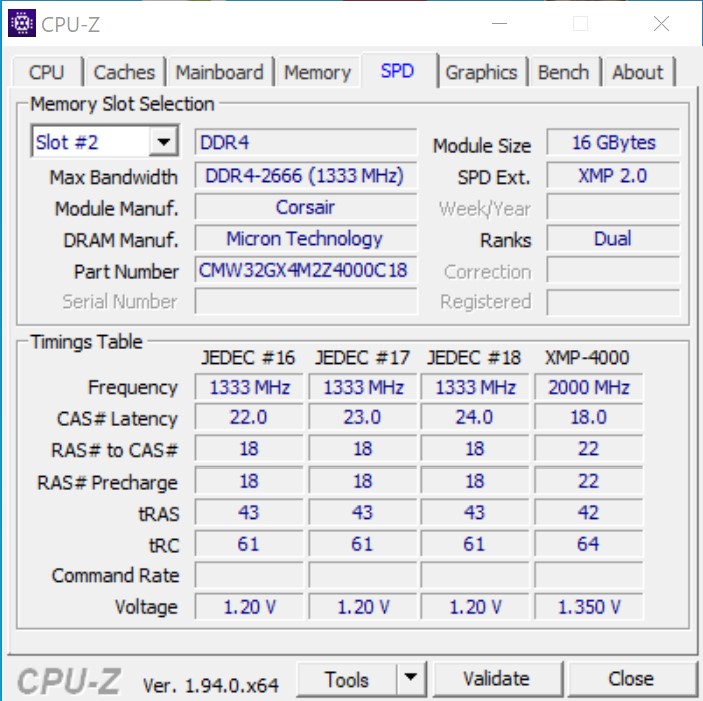
- Corsair Vengeance RGB Pro DDR4-4000 opslagset 2 x 16 GB
- Intel Optane 905P 480GB PCIe SSD
- Microsoft Windows 10 Professional 64-Bit (Versie 2004)
Op dit punt willen we Caseking bedanken voor het uitlenen van de Raijintek Pean, die ook met lasergravures is geïndividualiseerd. AMD Direct leverde het moederbord, dat bij de release van de AMD Ryzen 9 3900X en AMD Ryzen 7 3700X Zen 2 processoren in de perskit werd opgenomen. Als koeling gebruiken we de Alphacool Eisbear 280 die Alphacool ons heeft geleverd. Ook willen we Corsair bedanken voor hun ondersteuning van het werkgeheugen


Bewerkersbenchmarks
We hebben al kunnen vaststellen dat de innovaties van de Zen 3-architectuur succesvol zijn geweest. Met de 16-core processor verhoogt AMD nu opnieuw de lat hoog, en niet alleen de multi-core prestaties. Door de hogere Boost is de single-core performance ook verhoogd ten opzichte van de AMD Ryzen 9 5900X. De processor stopt niet bij 4.9 GHz maar overschrijdt vaak zelfs de 5 GHz limiet. Zoals verwacht plaatst de AMD Ryzen 5 5600X zich achter zijn grotere broers en zussen. De prestaties van de 6-core processor moeten echter niet worden onderschat, omdat deze in de single-core vergelijking vaak zelfs de Intel Core i9-10900K overstijgt. In de multi-core prestaties is het bijna voldoende om de AMD Ryzen 7 3700X te benaderen, ook al biedt dat twee extra cores.
U kunt extra benchmarks vinden op de processors hier
AMD Ryzen 9 5950X
AMD Ryzen 5 5600X
| Cinebench R20 | |
| CPU (Single Core) | |
| AMD Ryzen 9 5950X | |
| AMD Ryzen 9 5900X | |
| AMD Ryzen 7 5800X | |
| AMD Ryzen 5 5600X | |
| Intel Core i9-10900K | |
| AMD Ryzen 9 3950X | |
| AMD Ryzen 9 3900X | |
| AMD Ryzen 7 3700X | |
| AMD Ryzen 3 3300X | |
| CPU (Multi Core) | |
| AMD Ryzen 9 5950X | |
| AMD Ryzen 9 3950X | |
| AMD Ryzen 9 5900X | |
| AMD Ryzen 9 3900X | |
| Intel Core i9-10900K | |
| AMD Ryzen 7 5800X | |
| AMD Ryzen 7 3700X | |
| AMD Ryzen 5 5600X | |
| AMD Ryzen 3 3300X | |
| Cinebench R15 | |
| CPU Single 64Bit | |
| AMD Ryzen 9 5950X | |
| AMD Ryzen 9 5900X | |
| AMD Ryzen 7 5800X | |
| AMD Ryzen 5 5600X | |
| Intel Core i9-10900K | |
| AMD Ryzen 9 3900X | |
| AMD Ryzen 9 3950X | |
| AMD Ryzen 7 3700X | |
| AMD Ryzen 3 3300X | |
| CPU Multi 64Bit | |
| AMD Ryzen 9 5950X | |
| AMD Ryzen 9 3950X | |
| AMD Ryzen 9 5900X | |
| AMD Ryzen 9 3900X | |
| Intel Core i9-10900K | |
| AMD Ryzen 7 5800X | |
| AMD Ryzen 7 3700X | |
| AMD Ryzen 5 5600X | |
| AMD Ryzen 3 3300X | |
| Cinebench R11.5 | |
| CPU Single 64Bit | |
| AMD Ryzen 9 5900X | |
| AMD Ryzen 9 5950X | |
| AMD Ryzen 7 5800X | |
| AMD Ryzen 5 5600X | |
| Intel Core i9-10900K | |
| AMD Ryzen 9 3950X | |
| AMD Ryzen 9 3900X | |
| AMD Ryzen 7 3700X | |
| AMD Ryzen 3 3300X | |
| CPU Multi 64Bit | |
| AMD Ryzen 9 5950X | |
| AMD Ryzen 9 3950X | |
| AMD Ryzen 9 5900X | |
| AMD Ryzen 9 3900X | |
| AMD Ryzen 7 5800X | |
| Intel Core i9-10900K | |
| AMD Ryzen 7 3700X | |
| AMD Ryzen 5 5600X | |
| AMD Ryzen 3 3300X | |
| Cinebench R10 | |
| Rendering Single CPUs 64Bit | |
| AMD Ryzen 9 5950X | |
| AMD Ryzen 7 5800X | |
| AMD Ryzen 9 5900X | |
| AMD Ryzen 5 5600X | |
| Intel Core i9-10900K | |
| AMD Ryzen 9 3950X | |
| AMD Ryzen 9 3900X | |
| AMD Ryzen 3 3300X | |
| AMD Ryzen 7 3700X | |
| Rendering Multiple CPUs 64Bit | |
| AMD Ryzen 9 5950X | |
| AMD Ryzen 9 5900X | |
| AMD Ryzen 9 3950X | |
| AMD Ryzen 7 5800X | |
| Intel Core i9-10900K | |
| AMD Ryzen 9 3900X | |
| AMD Ryzen 5 5600X | |
| AMD Ryzen 7 3700X | |
| AMD Ryzen 3 3300X | |
| Blender - v2.79 BMW27 CPU | |
| AMD Ryzen 3 3300X | |
| AMD Ryzen 5 5600X | |
| AMD Ryzen 7 5800X | |
| AMD Ryzen 7 3700X | |
| Intel Core i9-10900K | |
| AMD Ryzen 9 3900X | |
| AMD Ryzen 9 5900X | |
| AMD Ryzen 9 3950X | |
| AMD Ryzen 9 5950X | |
| wPrime 2.10 | |
| 32m | |
| AMD Ryzen 3 3300X | |
| AMD Ryzen 9 3950X | |
| AMD Ryzen 5 5600X | |
| AMD Ryzen 7 3700X | |
| Intel Core i9-10900K | |
| AMD Ryzen 7 5800X | |
| AMD Ryzen 9 3900X | |
| AMD Ryzen 9 5950X | |
| 1024m | |
| AMD Ryzen 3 3300X | |
| AMD Ryzen 5 5600X | |
| AMD Ryzen 7 3700X | |
| AMD Ryzen 7 5800X | |
| Intel Core i9-10900K | |
| AMD Ryzen 9 5950X | |
| AMD Ryzen 9 3900X | |
| AMD Ryzen 9 3950X | |
| X264 HD Benchmark 4.0 | |
| Pass 1 | |
| AMD Ryzen 7 5800X | |
| AMD Ryzen 9 5950X | |
| AMD Ryzen 9 5900X | |
| AMD Ryzen 5 5600X | |
| Intel Core i9-10900K | |
| AMD Ryzen 7 3700X | |
| AMD Ryzen 9 3900X | |
| AMD Ryzen 9 3950X | |
| AMD Ryzen 3 3300X | |
| Pass 2 | |
| AMD Ryzen 9 5950X | |
| AMD Ryzen 9 5900X | |
| AMD Ryzen 9 3950X | |
| AMD Ryzen 7 5800X | |
| Intel Core i9-10900K | |
| AMD Ryzen 9 3900X | |
| AMD Ryzen 5 5600X | |
| AMD Ryzen 7 3700X | |
| AMD Ryzen 3 3300X | |
| WinRAR - Result | |
| AMD Ryzen 7 5800X | |
| AMD Ryzen 9 5900X | |
| AMD Ryzen 5 5600X | |
| AMD Ryzen 9 5950X | |
| Intel Core i9-10900K | |
| AMD Ryzen 9 3900X | |
| AMD Ryzen 7 3700X | |
| AMD Ryzen 9 3950X | |
| AMD Ryzen 3 3300X | |
| TrueCrypt | |
| AES Mean 100MB | |
| AMD Ryzen 9 5950X | |
| AMD Ryzen 9 5900X | |
| AMD Ryzen 7 5800X | |
| Intel Core i9-10900K | |
| AMD Ryzen 7 3700X | |
| AMD Ryzen 9 3900X | |
| AMD Ryzen 9 3950X | |
| AMD Ryzen 5 5600X | |
| AMD Ryzen 3 3300X | |
| Twofish Mean 100MB | |
| AMD Ryzen 9 5950X | |
| AMD Ryzen 9 3950X | |
| AMD Ryzen 9 3900X | |
| AMD Ryzen 9 5900X | |
| Intel Core i9-10900K | |
| AMD Ryzen 7 3700X | |
| AMD Ryzen 7 5800X | |
| AMD Ryzen 5 5600X | |
| AMD Ryzen 3 3300X | |
| Serpent Mean 100MB | |
| AMD Ryzen 9 5950X | |
| AMD Ryzen 9 3950X | |
| AMD Ryzen 9 5900X | |
| AMD Ryzen 9 3900X | |
| Intel Core i9-10900K | |
| AMD Ryzen 7 5800X | |
| AMD Ryzen 7 3700X | |
| AMD Ryzen 5 5600X | |
| AMD Ryzen 3 3300X | |
| Geekbench 5.5 | |
| Multi-Core | |
| AMD Ryzen 9 5950X | |
| AMD Ryzen 9 5900X | |
| AMD Ryzen 9 3950X | |
| Intel Core i9-10900K | |
| AMD Ryzen 7 5800X | |
| AMD Ryzen 9 3900X | |
| AMD Ryzen 5 5600X | |
| AMD Ryzen 7 3700X | |
| AMD Ryzen 3 3300X | |
| Single-Core | |
| AMD Ryzen 9 5950X | |
| AMD Ryzen 9 5900X | |
| AMD Ryzen 7 5800X | |
| AMD Ryzen 5 5600X | |
| Intel Core i9-10900K | |
| AMD Ryzen 9 3950X | |
| AMD Ryzen 7 3700X | |
| AMD Ryzen 3 3300X | |
| AMD Ryzen 9 3900X | |
| Geekbench 5.0 | |
| 5.0 Multi-Core | |
| AMD Ryzen 9 5950X | |
| AMD Ryzen 9 3950X | |
| AMD Ryzen 9 5900X | |
| Intel Core i9-10900K | |
| AMD Ryzen 7 5800X | |
| AMD Ryzen 9 3900X | |
| AMD Ryzen 5 5600X | |
| AMD Ryzen 3 3300X | |
| 5.0 Single-Core | |
| AMD Ryzen 9 5950X | |
| AMD Ryzen 7 5800X | |
| AMD Ryzen 9 5900X | |
| AMD Ryzen 5 5600X | |
| Intel Core i9-10900K | |
| AMD Ryzen 9 3950X | |
| AMD Ryzen 3 3300X | |
| AMD Ryzen 9 3900X | |
| Geekbench 4.4 | |
| 64 Bit Single-Core Score | |
| AMD Ryzen 7 5800X | |
| AMD Ryzen 9 5900X | |
| AMD Ryzen 9 5950X | |
| AMD Ryzen 5 5600X | |
| Intel Core i9-10900K | |
| AMD Ryzen 9 3900X | |
| AMD Ryzen 7 3700X | |
| AMD Ryzen 3 3300X | |
| AMD Ryzen 9 3950X | |
| 64 Bit Multi-Core Score | |
| AMD Ryzen 9 5950X | |
| AMD Ryzen 9 5900X | |
| AMD Ryzen 9 3950X | |
| AMD Ryzen 7 5800X | |
| AMD Ryzen 9 3900X | |
| Intel Core i9-10900K | |
| AMD Ryzen 5 5600X | |
| AMD Ryzen 7 3700X | |
| AMD Ryzen 3 3300X | |
| 3DMark 11 - 1280x720 Performance Physics | |
| AMD Ryzen 9 5950X | |
| AMD Ryzen 9 5900X | |
| AMD Ryzen 7 5800X | |
| Intel Core i9-10900K | |
| AMD Ryzen 9 3950X | |
| AMD Ryzen 5 5600X | |
| AMD Ryzen 9 3900X | |
| AMD Ryzen 7 3700X | |
| AMD Ryzen 3 3300X | |
| 7-Zip 18.03 | |
| 7z b 4 | |
| AMD Ryzen 9 5950X | |
| AMD Ryzen 9 3950X | |
| AMD Ryzen 9 5900X | |
| AMD Ryzen 9 3900X | |
| AMD Ryzen 7 5800X | |
| Intel Core i9-10900K | |
| AMD Ryzen 7 3700X | |
| AMD Ryzen 5 5600X | |
| AMD Ryzen 3 3300X | |
| 7z b 4 -mmt1 | |
| AMD Ryzen 9 5950X | |
| AMD Ryzen 7 5800X | |
| AMD Ryzen 9 5900X | |
| AMD Ryzen 5 5600X | |
| Intel Core i9-10900K | |
| AMD Ryzen 9 3900X | |
| AMD Ryzen 9 3950X | |
| AMD Ryzen 7 3700X | |
| AMD Ryzen 3 3300X | |
| HWBOT x265 Benchmark v2.2 - 4k Preset | |
| AMD Ryzen 9 5950X | |
| AMD Ryzen 9 5900X | |
| Intel Core i9-10900K | |
| AMD Ryzen 9 3900X | |
| AMD Ryzen 7 5800X | |
| AMD Ryzen 9 3950X | |
| AMD Ryzen 5 5600X | |
| AMD Ryzen 7 3700X | |
| AMD Ryzen 3 3300X | |
| R Benchmark 2.5 - Overall mean | |
| AMD Ryzen 9 3900X | |
| AMD Ryzen 3 3300X | |
| Intel Core i9-10900K | |
| AMD Ryzen 9 3950X | |
| AMD Ryzen 5 5600X | |
| AMD Ryzen 9 5950X | |
| AMD Ryzen 9 5900X | |
| AMD Ryzen 7 5800X | |
| LibreOffice - 20 Documents To PDF | |
| Intel Core i9-10900K | |
| AMD Ryzen 9 3900X | |
| AMD Ryzen 9 3950X | |
| AMD Ryzen 3 3300X | |
| AMD Ryzen 9 5900X | |
| AMD Ryzen 9 5950X | |
| AMD Ryzen 5 5600X | |
| AMD Ryzen 7 5800X | |
| WebXPRT 3 - Overall | |
| AMD Ryzen 7 5800X | |
| AMD Ryzen 9 5950X | |
| AMD Ryzen 5 5600X | |
| AMD Ryzen 9 5900X | |
| Intel Core i9-10900K | |
| AMD Ryzen 9 3950X | |
| AMD Ryzen 3 3300X | |
| Mozilla Kraken 1.1 - Total | |
| AMD Ryzen 3 3300X | |
| Intel Core i9-10900K | |
| AMD Ryzen 9 3950X | |
| AMD Ryzen 5 5600X | |
| AMD Ryzen 9 5900X | |
| AMD Ryzen 7 5800X | |
| AMD Ryzen 9 5950X | |
| 3DMark | |
| 3840x2160 Fire Strike Ultra Physics | |
| AMD Ryzen 9 5950X | |
| AMD Ryzen 9 5900X | |
| AMD Ryzen 9 3950X | |
| AMD Ryzen 7 5800X | |
| Intel Core i9-10900K | |
| AMD Ryzen 9 3900X | |
| AMD Ryzen 5 5600X | |
| AMD Ryzen 7 3700X | |
| AMD Ryzen 3 3300X | |
| 1920x1080 Fire Strike Physics | |
| AMD Ryzen 9 5950X | |
| AMD Ryzen 9 5900X | |
| AMD Ryzen 9 3950X | |
| AMD Ryzen 7 5800X | |
| Intel Core i9-10900K | |
| AMD Ryzen 9 3900X | |
| AMD Ryzen 5 5600X | |
| AMD Ryzen 7 3700X | |
| AMD Ryzen 3 3300X | |
| 2560x1440 Time Spy CPU | |
| Intel Core i9-10900K | |
| AMD Ryzen 9 5950X | |
| AMD Ryzen 9 5900X | |
| AMD Ryzen 9 3950X | |
| AMD Ryzen 9 3900X | |
| AMD Ryzen 7 5800X | |
| AMD Ryzen 7 3700X | |
| AMD Ryzen 5 5600X | |
| AMD Ryzen 3 3300X | |
* ... kleiner is beter
Belastingstest met de Cinebench R15 Multi Loop
Bij de belastingstest met de Cinebench R15 multi loop hebben noch de AMD Ryzen 9 5950X, noch de AMD Ryzen 5 5600X problemen. De ingebouwde AiO en de 280 millimeter (11 in) radiator hebben geen moeite om de processoren betrouwbaar te koelen. Overigens is het aanzienlijk eenvoudiger om deAMD Ryzen 5 5600X te koelendoor het lagere stroomverbruik.
De Gaming Performance van de Ryzen 3000 Processors
Sinds 11/5/2020 is het officieel dat AMD op dit moment de snelste gaming CPU aanbiedt. Toch is de AMD Ryzen 9 5950X nog steeds in staat om een paar FPS meer uit de Nvidia Titan RTX te persen in sommige games. Dit maakt echter geen merkbaar verschil voor het speelplezier. Met toenemende resolutie en kwaliteitsinstellingen beginnen de voordelen van de CPU's te smelten, zodat zelfs de AMD Ryzen 5 5600X in staat is om de AMD Ryzen 9 5950X bij te houden. Als je je alleen maar zorgen maakt over de pure gameprestaties, maak je op dit moment geen enkele fout als je kiest voor de instapmodel-processor. Zowel makers van content als streamers kunnen bijvoorbeeld zonder een aparte streaming-pc met elkaar overweg als ze kiezen voor de AMD Ryzen 9 5950X. Dit biedt voldoende middelen om naast de pure gaming ook de online stream af te handelen.
| 3DMark 11 - 1280x720 Performance GPU | |
| Intel Core i7-10700K | |
| Intel Core i9-10900K | |
| AMD Ryzen 9 5950X | |
| AMD Ryzen 7 5800X | |
| AMD Ryzen 5 5600X | |
| AMD Ryzen 7 3800XT | |
| AMD Ryzen 3 3300X | |
| AMD Ryzen 9 5900X | |
| AMD Ryzen 3 3100 | |
| AMD Ryzen 9 3950X | |
| AMD Ryzen 5 1600 | |
| AMD Ryzen 3 3100 | |
| AMD Ryzen 9 3900X | |
| AMD Ryzen 7 2700X | |
| Unigine Heaven 4.0 | |
| Extreme Preset DX11 | |
| AMD Ryzen 9 5900X | |
| AMD Ryzen 9 5950X | |
| AMD Ryzen 7 5800X | |
| AMD Ryzen 9 3900X | |
| AMD Ryzen 5 5600X | |
| AMD Ryzen 7 2700X | |
| Extreme Preset OpenGL | |
| AMD Ryzen 7 5800X | |
| AMD Ryzen 9 5900X | |
| AMD Ryzen 9 5950X | |
| AMD Ryzen 9 3900X | |
| AMD Ryzen 5 5600X | |
| AMD Ryzen 7 2700X | |
| Unigine Valley 1.0 | |
| 1920x1080 Extreme HD Preset OpenGL AA:x8 | |
| AMD Ryzen 9 5900X | |
| AMD Ryzen 7 5800X | |
| AMD Ryzen 9 5950X | |
| AMD Ryzen 5 5600X | |
| AMD Ryzen 9 3900X | |
| AMD Ryzen 7 2700X | |
| 1920x1080 Extreme HD DirectX AA:x8 | |
| AMD Ryzen 9 5950X | |
| AMD Ryzen 9 5900X | |
| AMD Ryzen 7 5800X | |
| AMD Ryzen 5 5600X | |
| AMD Ryzen 9 3900X | |
| AMD Ryzen 7 2700X | |
| Unigine Superposition | |
| 1280x720 720p Low | |
| AMD Ryzen 7 5800X | |
| AMD Ryzen 5 5600X | |
| AMD Ryzen 9 5950X | |
| AMD Ryzen 9 5900X | |
| AMD Ryzen 9 3900X | |
| 1920x1080 1080p Extreme | |
| AMD Ryzen 9 5900X | |
| AMD Ryzen 7 5800X | |
| AMD Ryzen 9 5950X | |
| AMD Ryzen 5 5600X | |
| AMD Ryzen 9 3900X | |
| 7680x4320 8k Optimized | |
| AMD Ryzen 9 5900X | |
| AMD Ryzen 5 5600X | |
| AMD Ryzen 7 5800X | |
| AMD Ryzen 9 5950X | |
| AMD Ryzen 9 3900X | |
Ryzen 9 5950X with Nvidia Titan RTX
| lage | gem. | hoge | ultra | QHD | 4K | |
|---|---|---|---|---|---|---|
| GTA V (2015) | 187 | 186 | 182 | 121 | 113 | 134 |
| The Witcher 3 (2015) | 594 | 420 | 271 | 141 | 102 | |
| Dota 2 Reborn (2015) | 214.5 | 192.3 | 193.3 | 179.2 | 161.6 | |
| Final Fantasy XV Benchmark (2018) | 225 | 183 | 141 | 105 | 63.4 | |
| X-Plane 11.11 (2018) | 168 | 152 | 117 | 101 | ||
| Far Cry 5 (2018) | 201 | 174 | 166 | 154 | 137 | 80 |
| Strange Brigade (2018) | 604 | 350 | 286 | 241 | 183 | 110 |
| Shadow of the Tomb Raider (2018) | 225.1 | 184.2 | 177.9 | 166.1 | 120.1 | 66.4 |
| Far Cry New Dawn (2019) | 165 | 142 | 123 | 115 | 82 | |
| Metro Exodus (2019) | 232 | 172 | 133 | 106 | 86.1 | 56.4 |
| Borderlands 3 (2019) | 217 | 182 | 141 | 117 | 84.4 | 46.6 |
Ryzen 5 5600X with Nvidia Titan RTX
| lage | gem. | hoge | ultra | QHD | 4K | |
|---|---|---|---|---|---|---|
| GTA V (2015) | 187 | 186 | 181 | 118 | 109 | 133 |
| The Witcher 3 (2015) | 570 | 413 | 268 | 139 | 101 | |
| Dota 2 Reborn (2015) | 228.9 | 200.7 | 191 | 180 | 168.3 | |
| Final Fantasy XV Benchmark (2018) | 225 | 179 | 138 | 104 | 63.2 | |
| X-Plane 11.11 (2018) | 172 | 156 | 123 | 105 | ||
| Far Cry 5 (2018) | 200 | 171 | 166 | 153 | 135 | 80 |
| Strange Brigade (2018) | 643 | 351 | 286 | 243 | 184 | 110 |
| Shadow of the Tomb Raider (2018) | 217 | 185 | 178 | 165 | 121 | 66.5 |
| Far Cry New Dawn (2019) | 164 | 144 | 136 | 123 | 116 | 81 |
| Metro Exodus (2019) | 236 | 172 | 133 | 107 | 85.4 | 54.6 |
| Borderlands 3 (2019) | 214 | 177 | 138 | 115 | 83.9 | 46.5 |
Toepassingsprestaties
Zoals we al zagen in de CPU benchmarks, liggen alle nieuwe Vermeer-processoren op een zeer goed traject wat betreft de prestaties. Dit komt ook tot uiting in onze applicatie- en renderproeven. Het hele systeem draait zeer snel, zelfs als de SSD niet de nieuwste PCI Express 4.0 standaard gebruikt. In het dagelijks gebruik is dit echter geen nadeel, aangezien de Intel Optane 905P nog steeds tot de snellere PCIe SSD's behoort.
In de PCMark 10 kan de AMD Ryzen 9 5950X er bovenop komen en een klein voordeel van 4% behalen ten opzichte van de AMD Ryzen 9 5900X. De kleinere Ryzen 5 5600X is op ooghoogte met de AMD Ryzen 7 5800X
, maar duidelijk beter dan het oudere topmodel, de AMD Ryzen 9 3950X. De Intel-processors zijn alleen te vinden in het midden van het veld met een nadeel van 15% ten opzichte van de Ryzen 9 5950X.
In de renderproeven ziet het totaalresultaat er meer gemengd uit, omdat de grafische kaart hier de beperkende factor is. Het is echter mogelijk om in sommige tests te zien dat bij een toenemend aantal cores ook de prestaties toenemen, hoewel het aantal CPU-cores bij sommige werklasten niet van belang is. Hier moet u zorgvuldig afwegen wat voor u het belangrijkst is, als u niet altijd het topmodel wilt kiezen.
* ... kleiner is beter
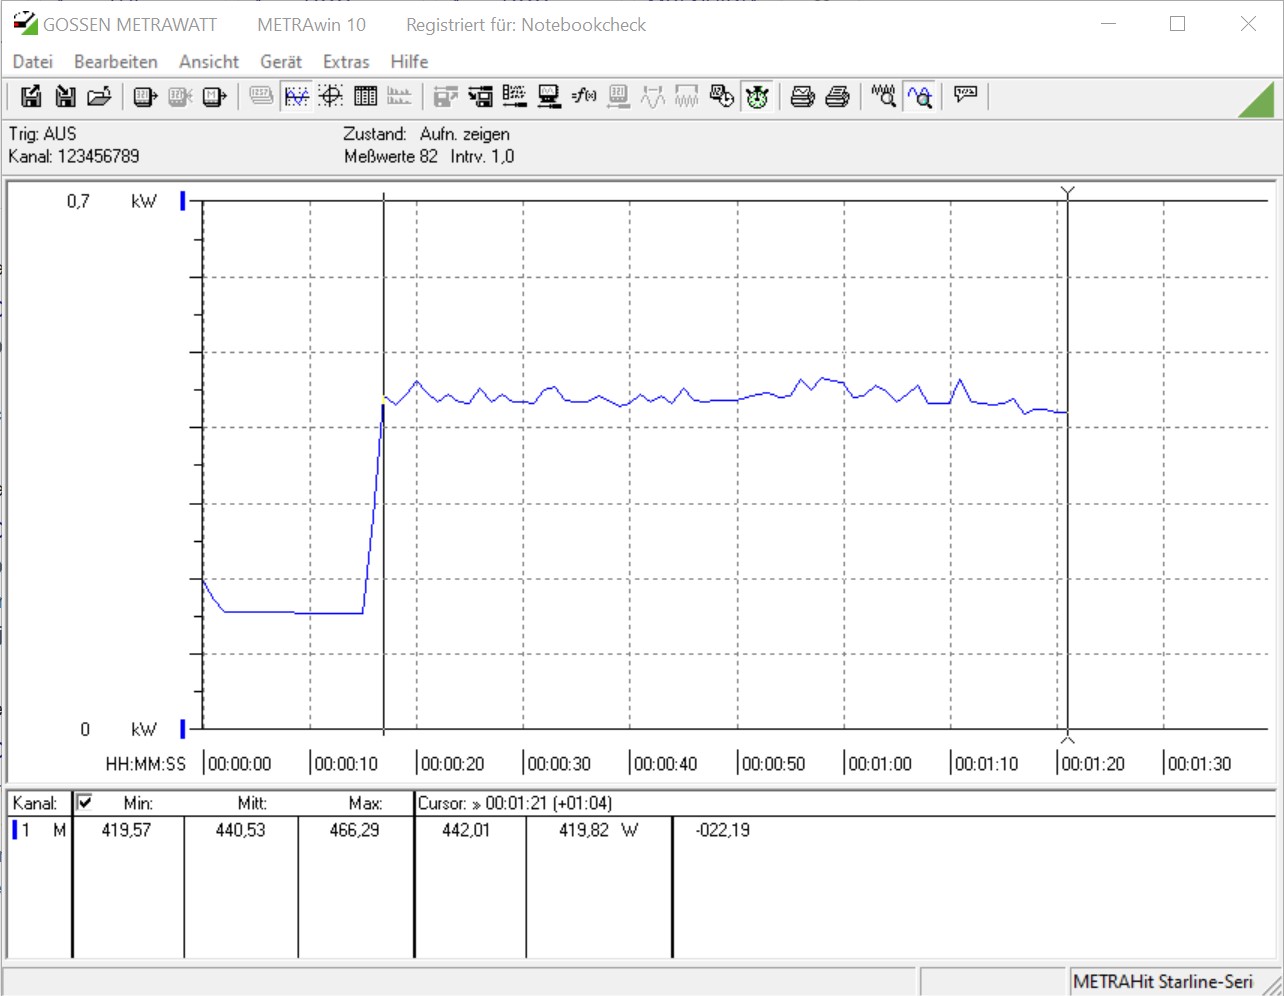
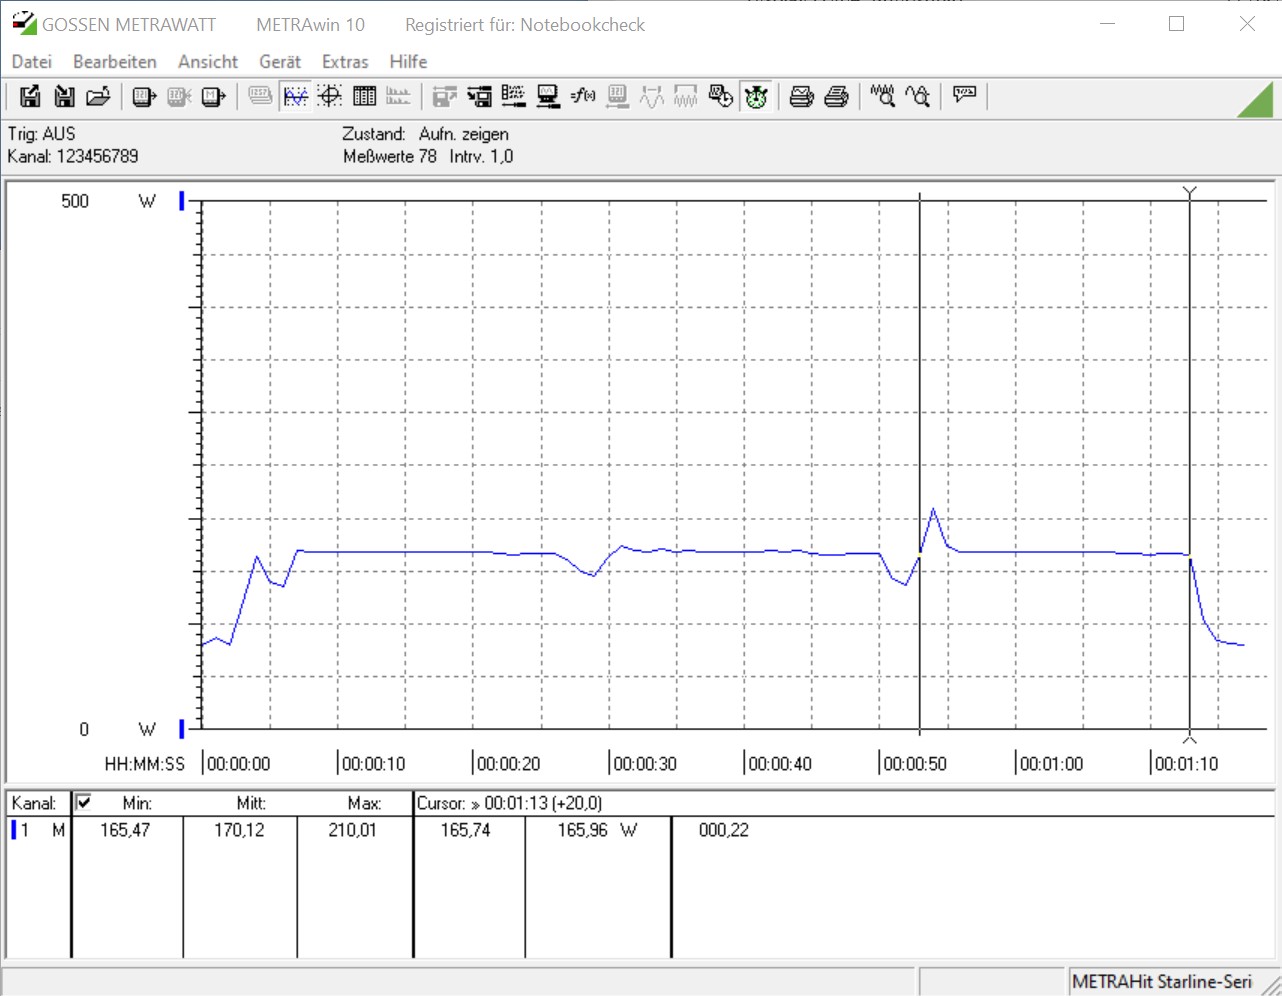
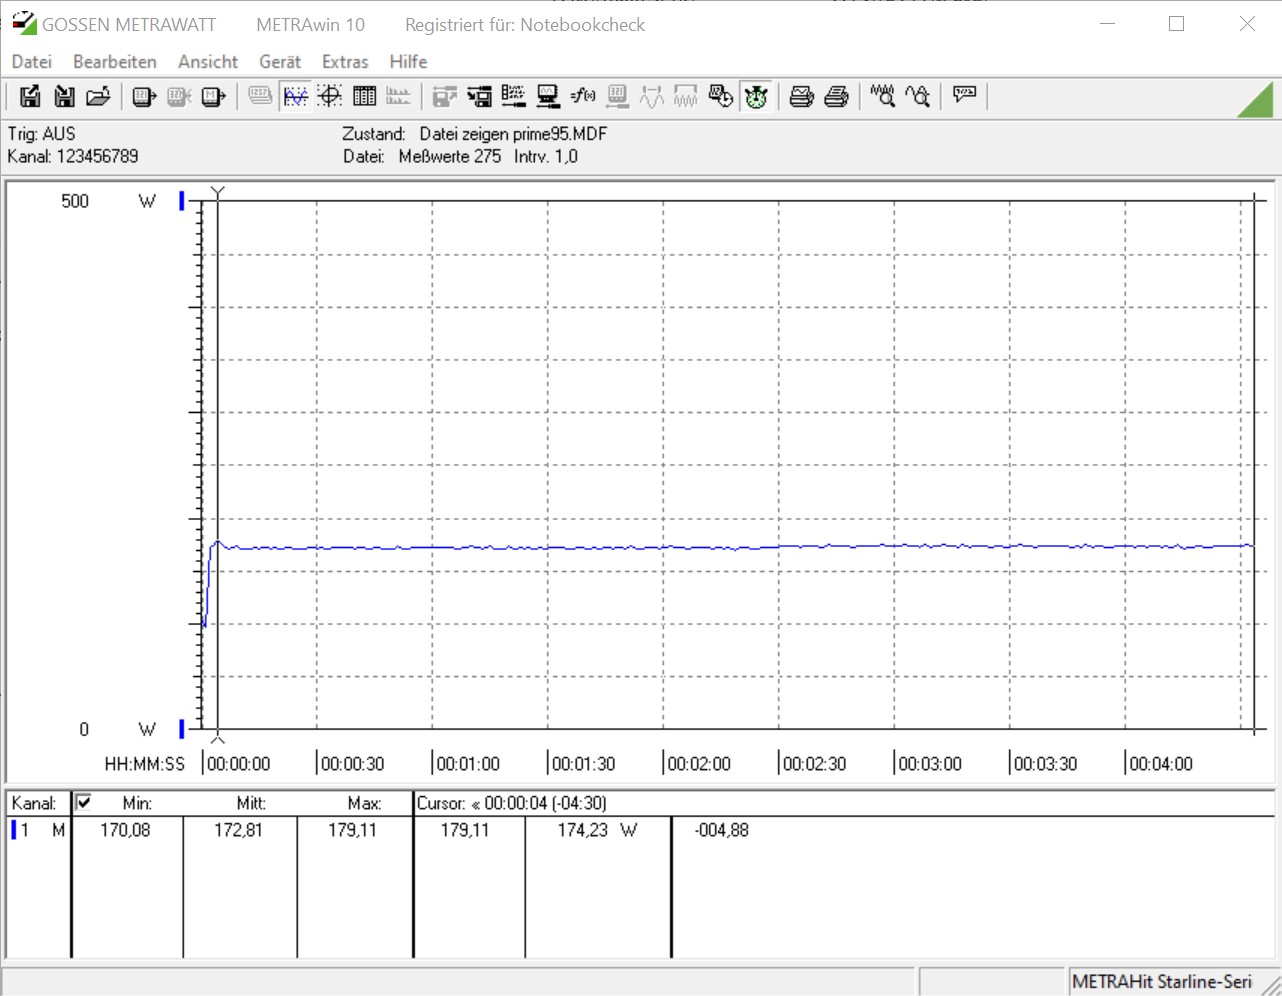
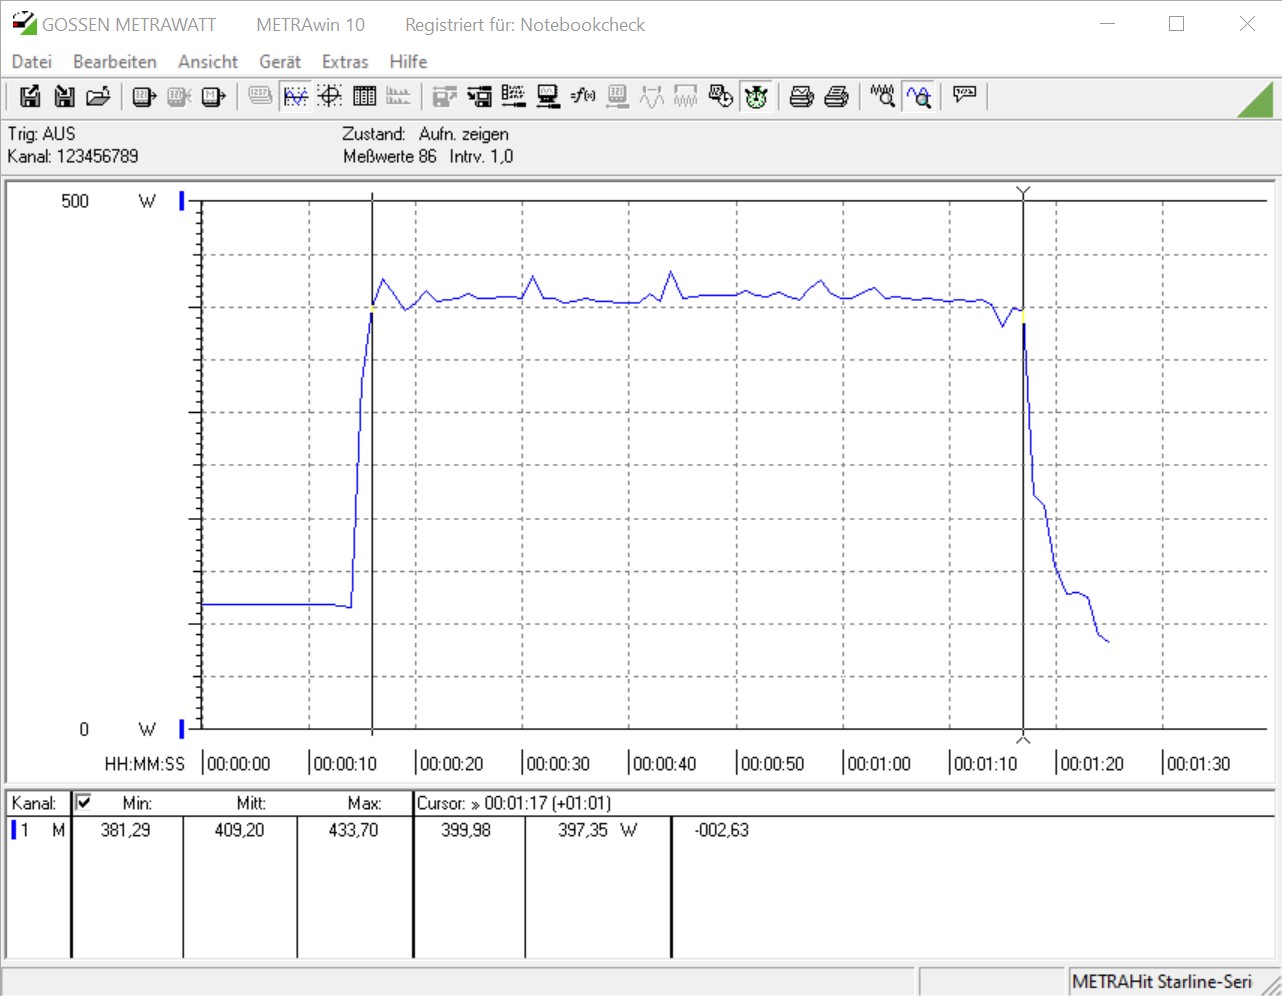
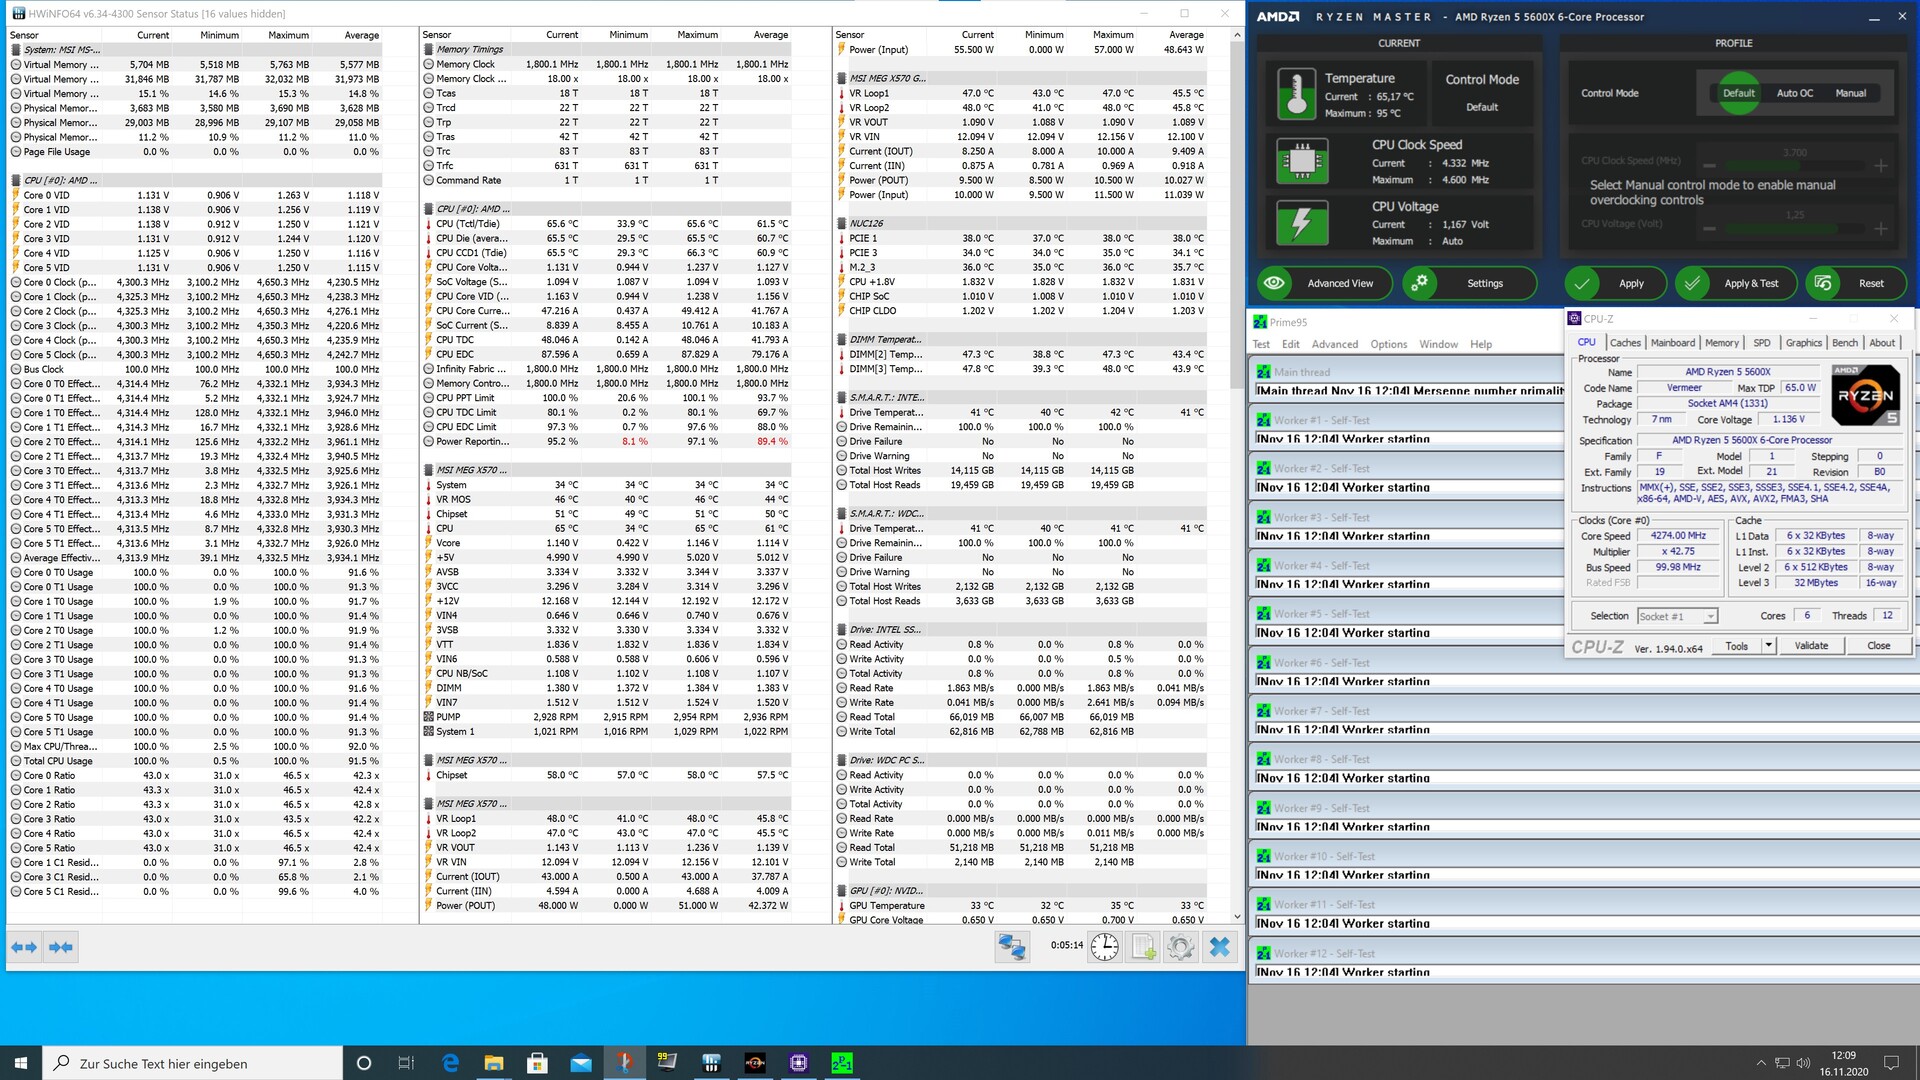
Stroomverbruik
Zoals reeds eerder voor de Ryzen 9 5900X en Ryzen 7 5800X, geeft AMD ook voor de Ryzen 9 5950X een TDP van 105 watt aan. Hiermee blijft het binnen de specificaties van het X570-platform, aangezien AMD geen nieuwe chipset met de Vermeer-generatie heeft geïntroduceerd. Uiteindelijk is de 105 watt echter niet voldoende, want de vermogensgrens van de CPU ligt op 142 watt, wat de 16-core processor wel degelijk verbruikt onder belasting.
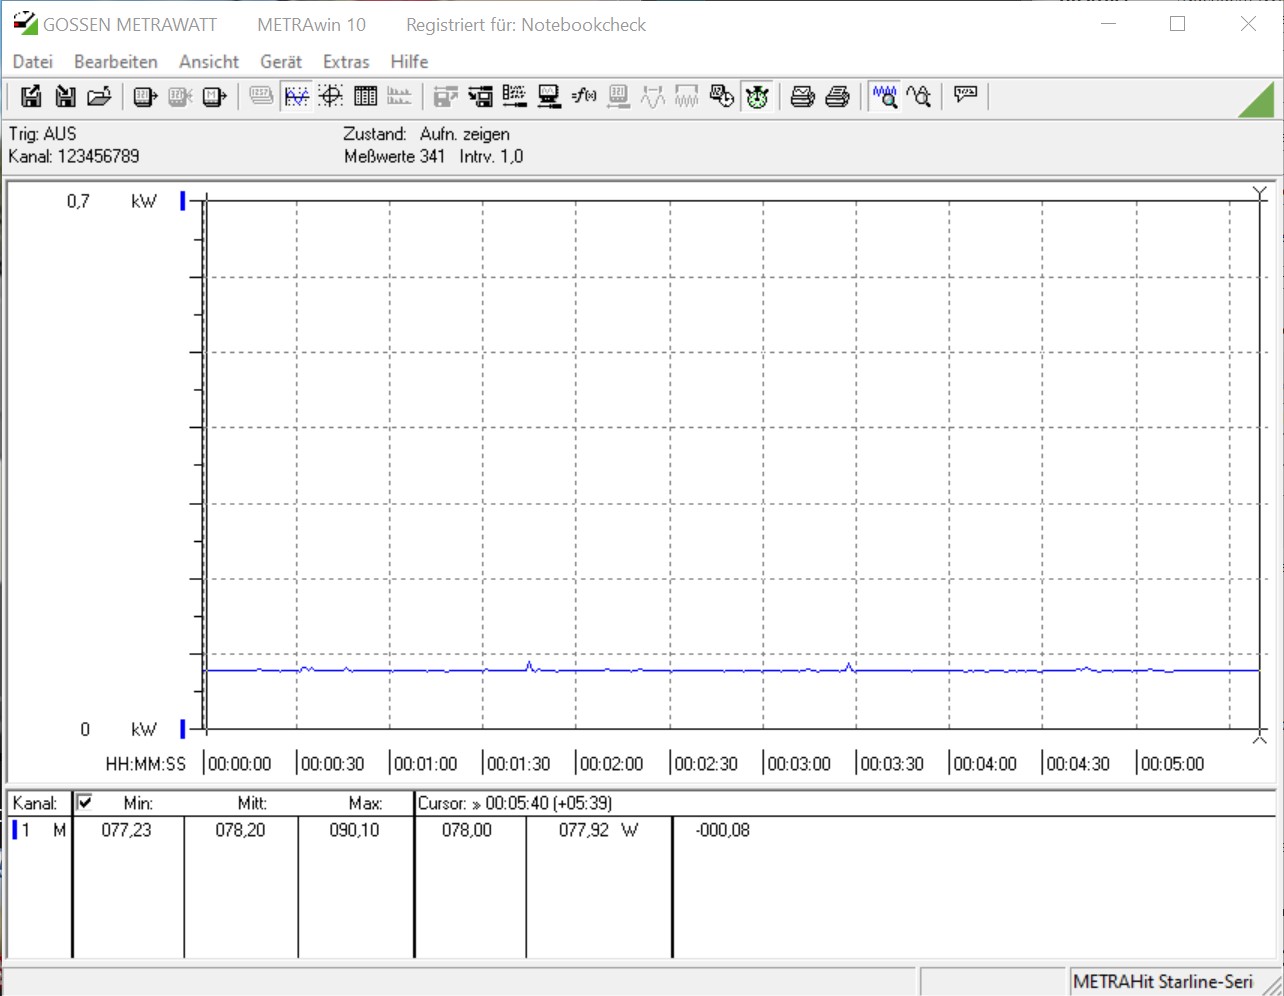
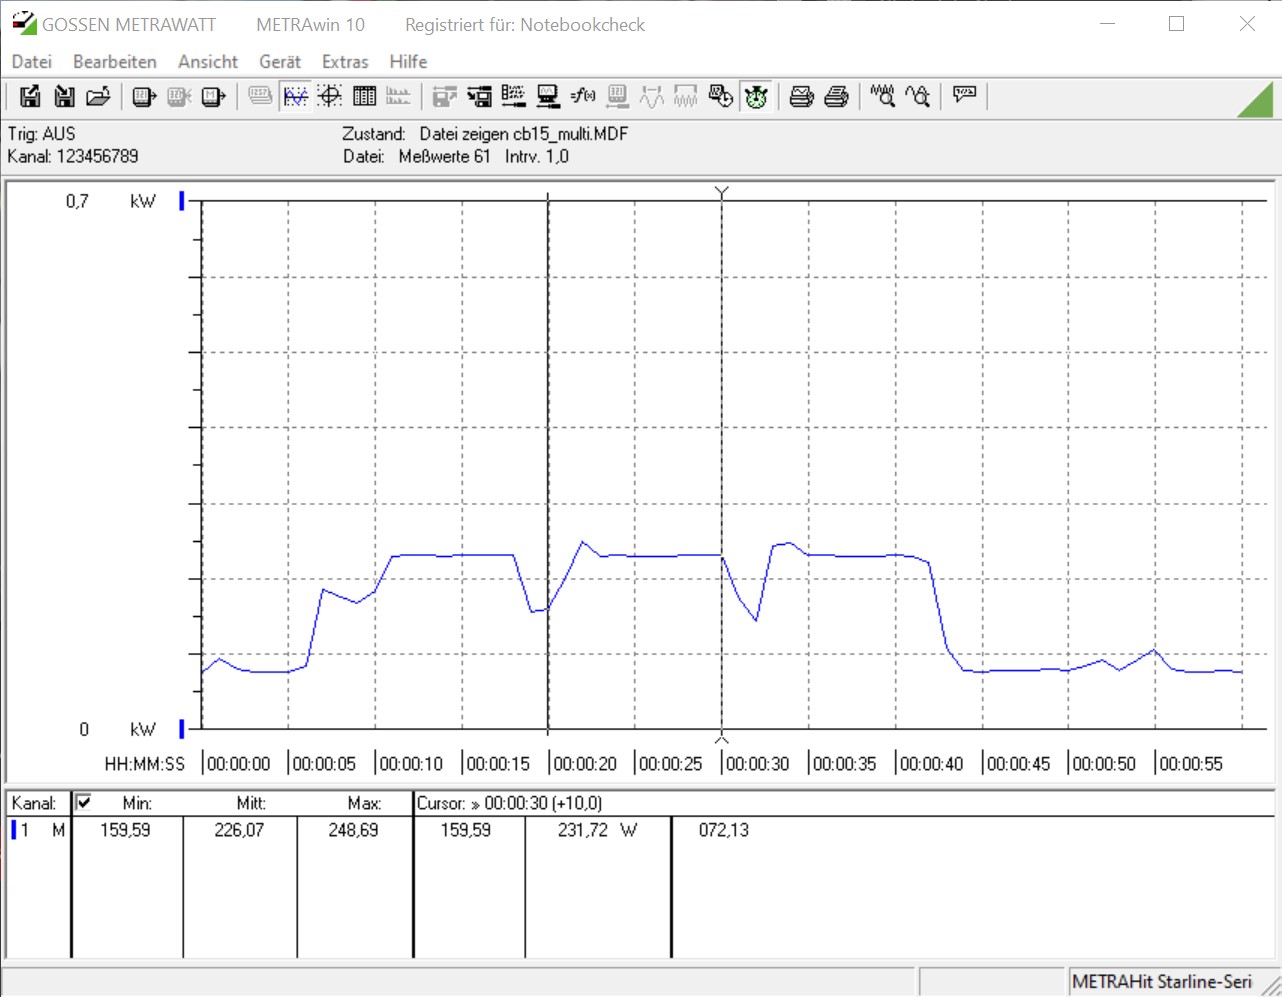
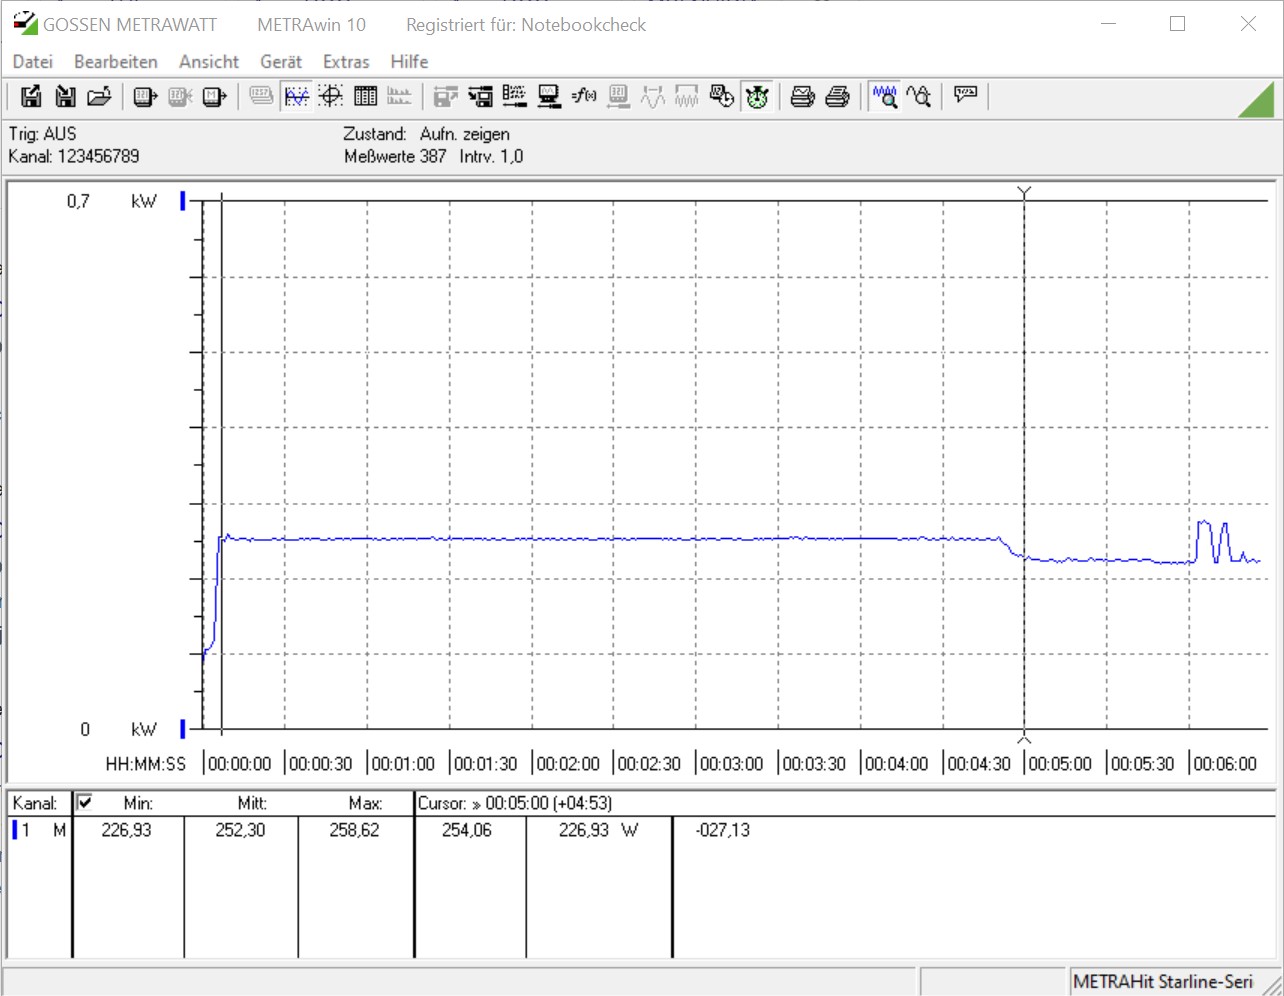
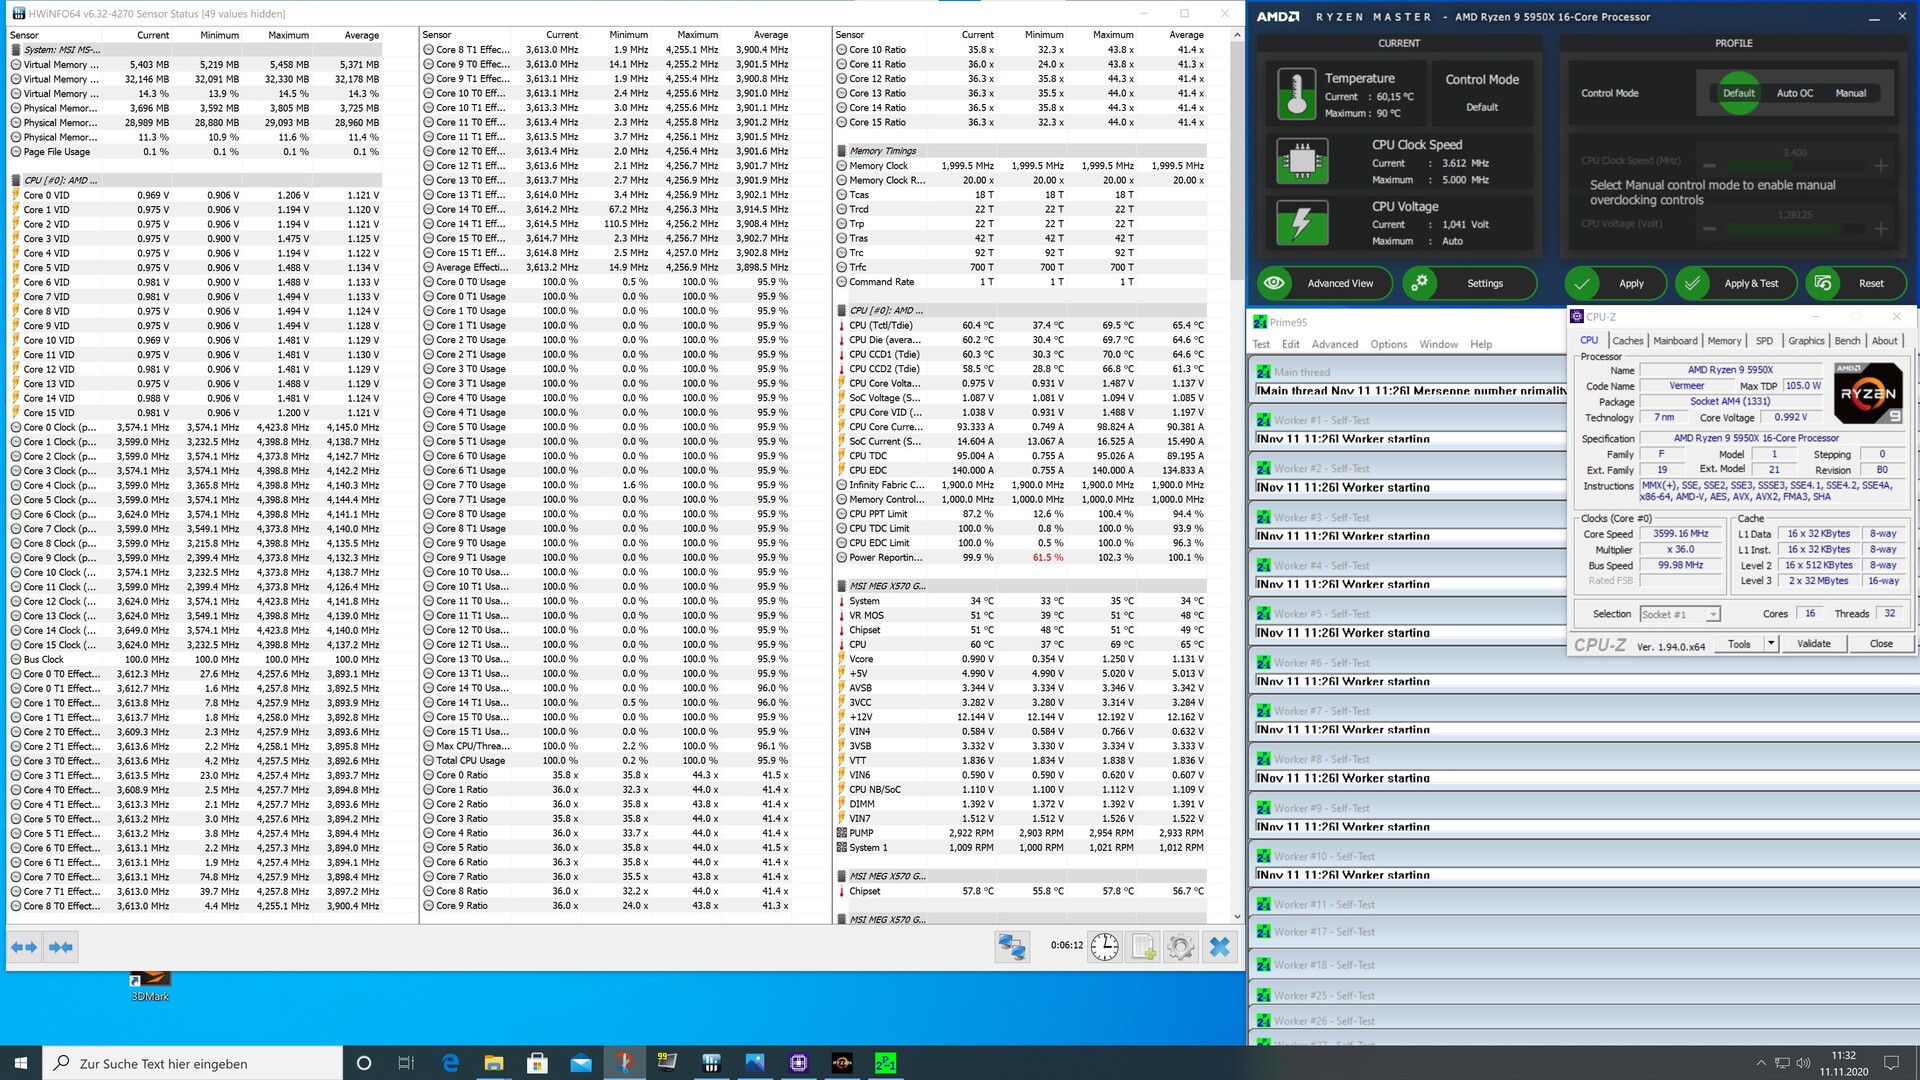
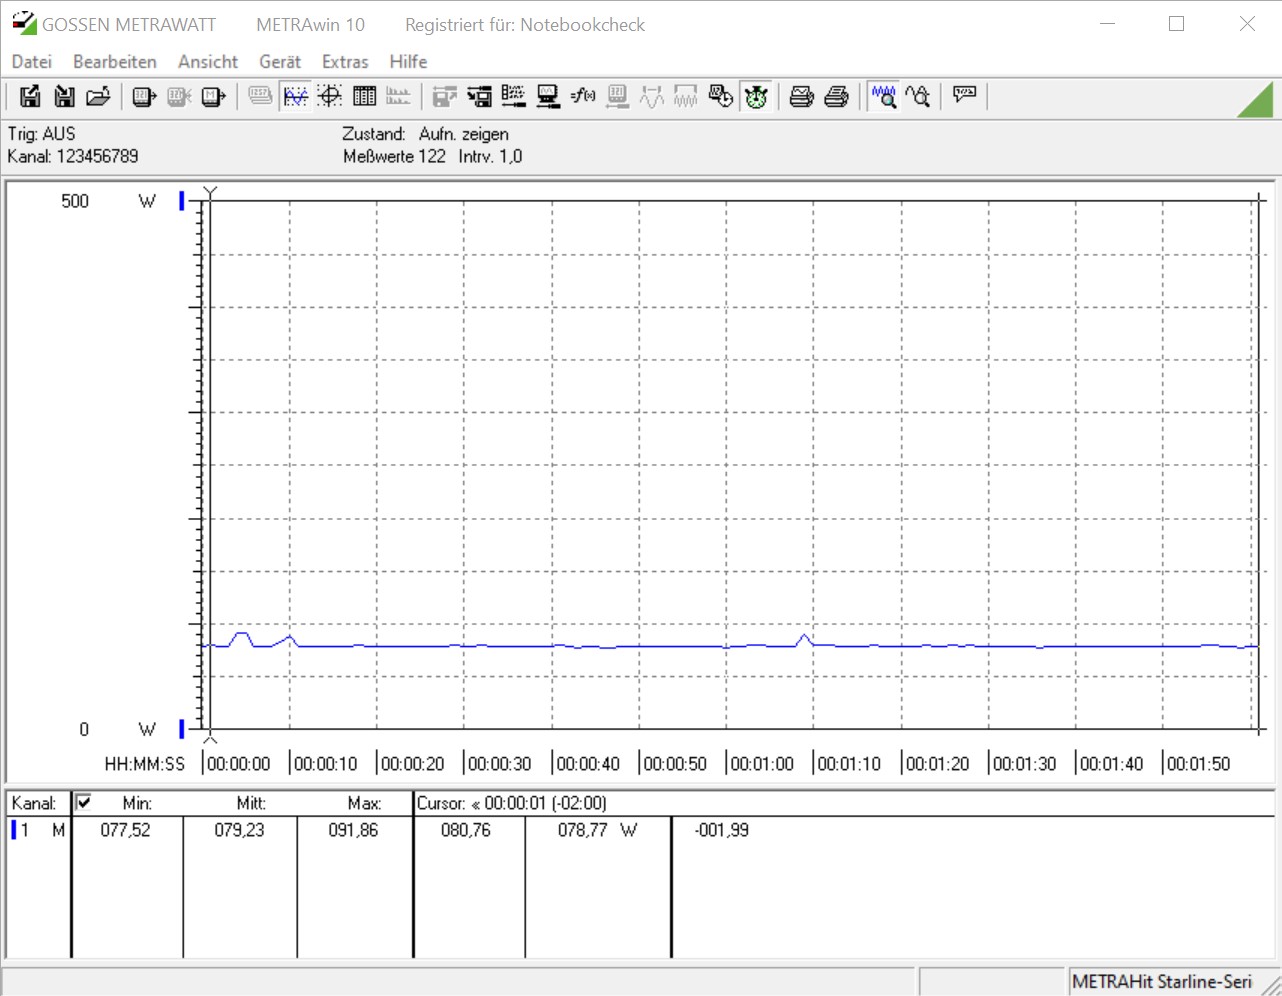
Zonder belasting zijn er geen veranderingen ten opzichte van de twee andere Vermeer CPU's en meten we met ons meetapparaat net onder de 80 Watt tussen het stopcontact en de stroomvoorziening. Onder belasting neemt het verbruik toe. In de Cinebench R15-multitest bepalen we 226 watt voor de 16-core processor. Bij de Ryzen 5 5600X ligt het verbruik van het testsysteem bij 170 watt in dezelfde test. Dit is een goed resultaat voor beide kandidaten. Tijdens het gamen loopt de AMD Ryzen 9 5950X voorop met 440 watt. Met 439 watt is ons testsysteem met de AMD Ryzen 5 5900X echter niet veel zuiniger. Met de AMD Ryzen 5 5600X daalt het stroomverbruik iets met ongeveer 30 watt. Bij volle belasting moet je echter ook nog eens ongeveer 280 watt voor de grafische kaart berekenen, wat altijd een rol speelt tijdens de goktest.
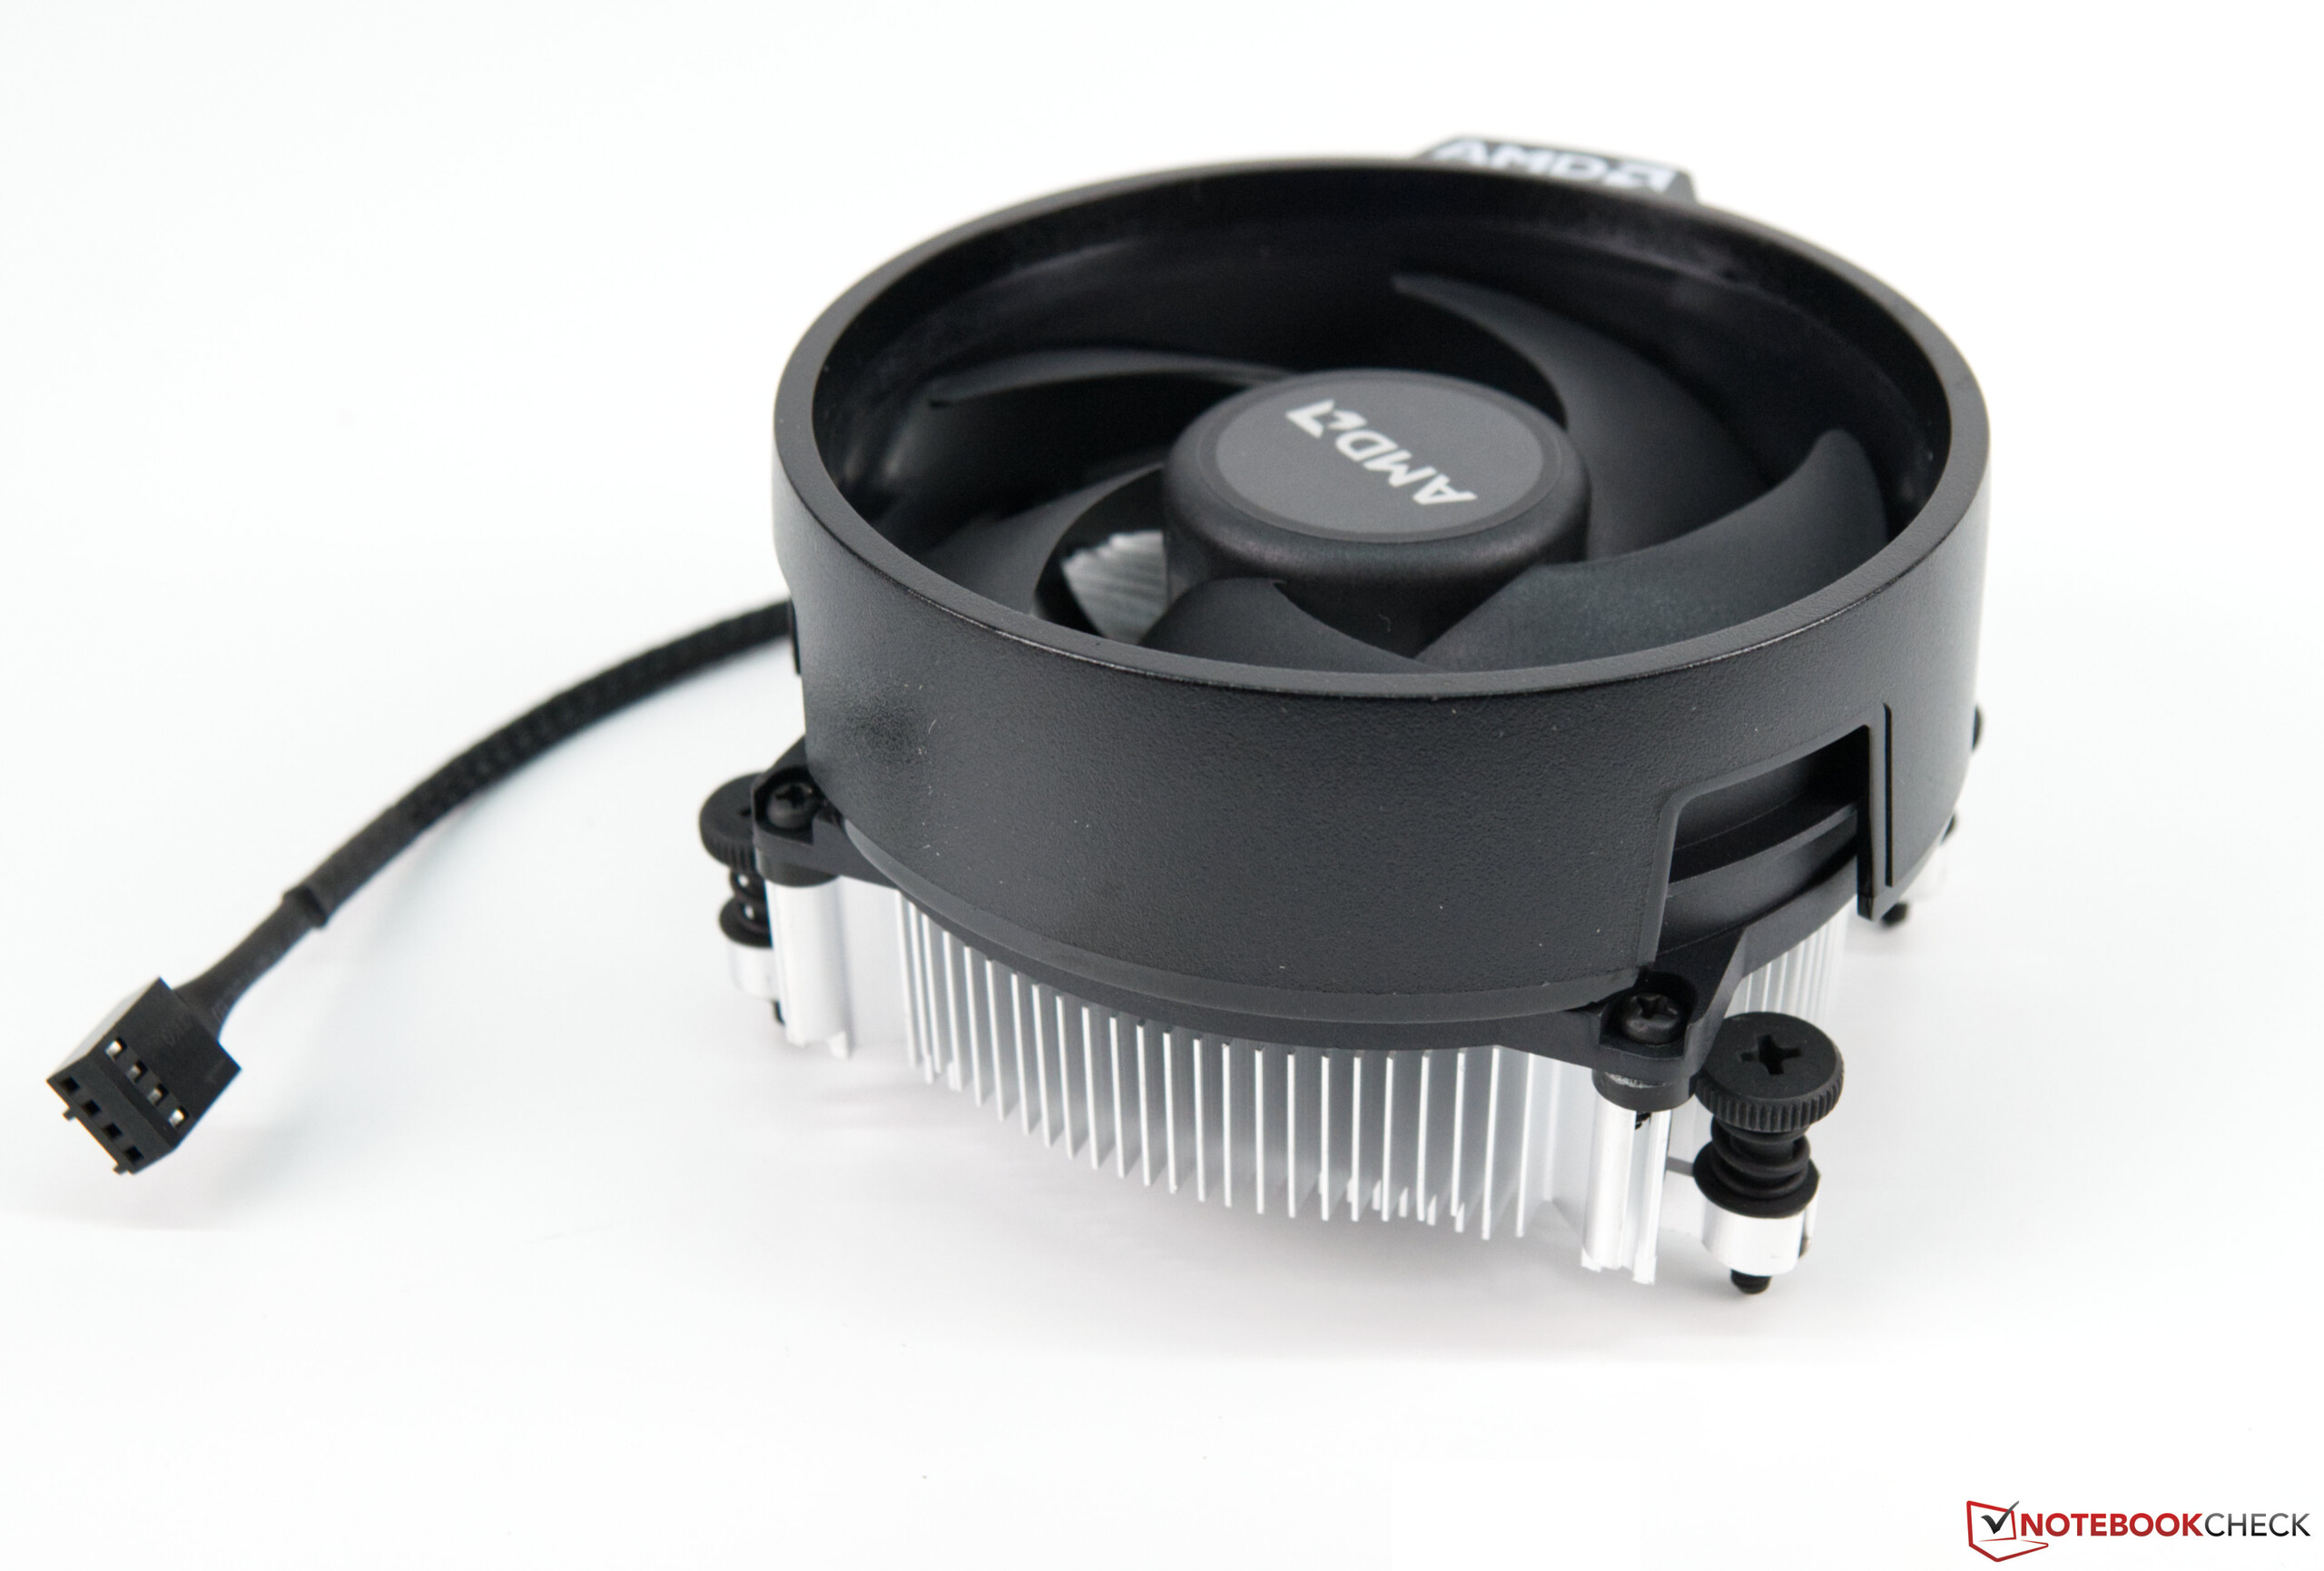
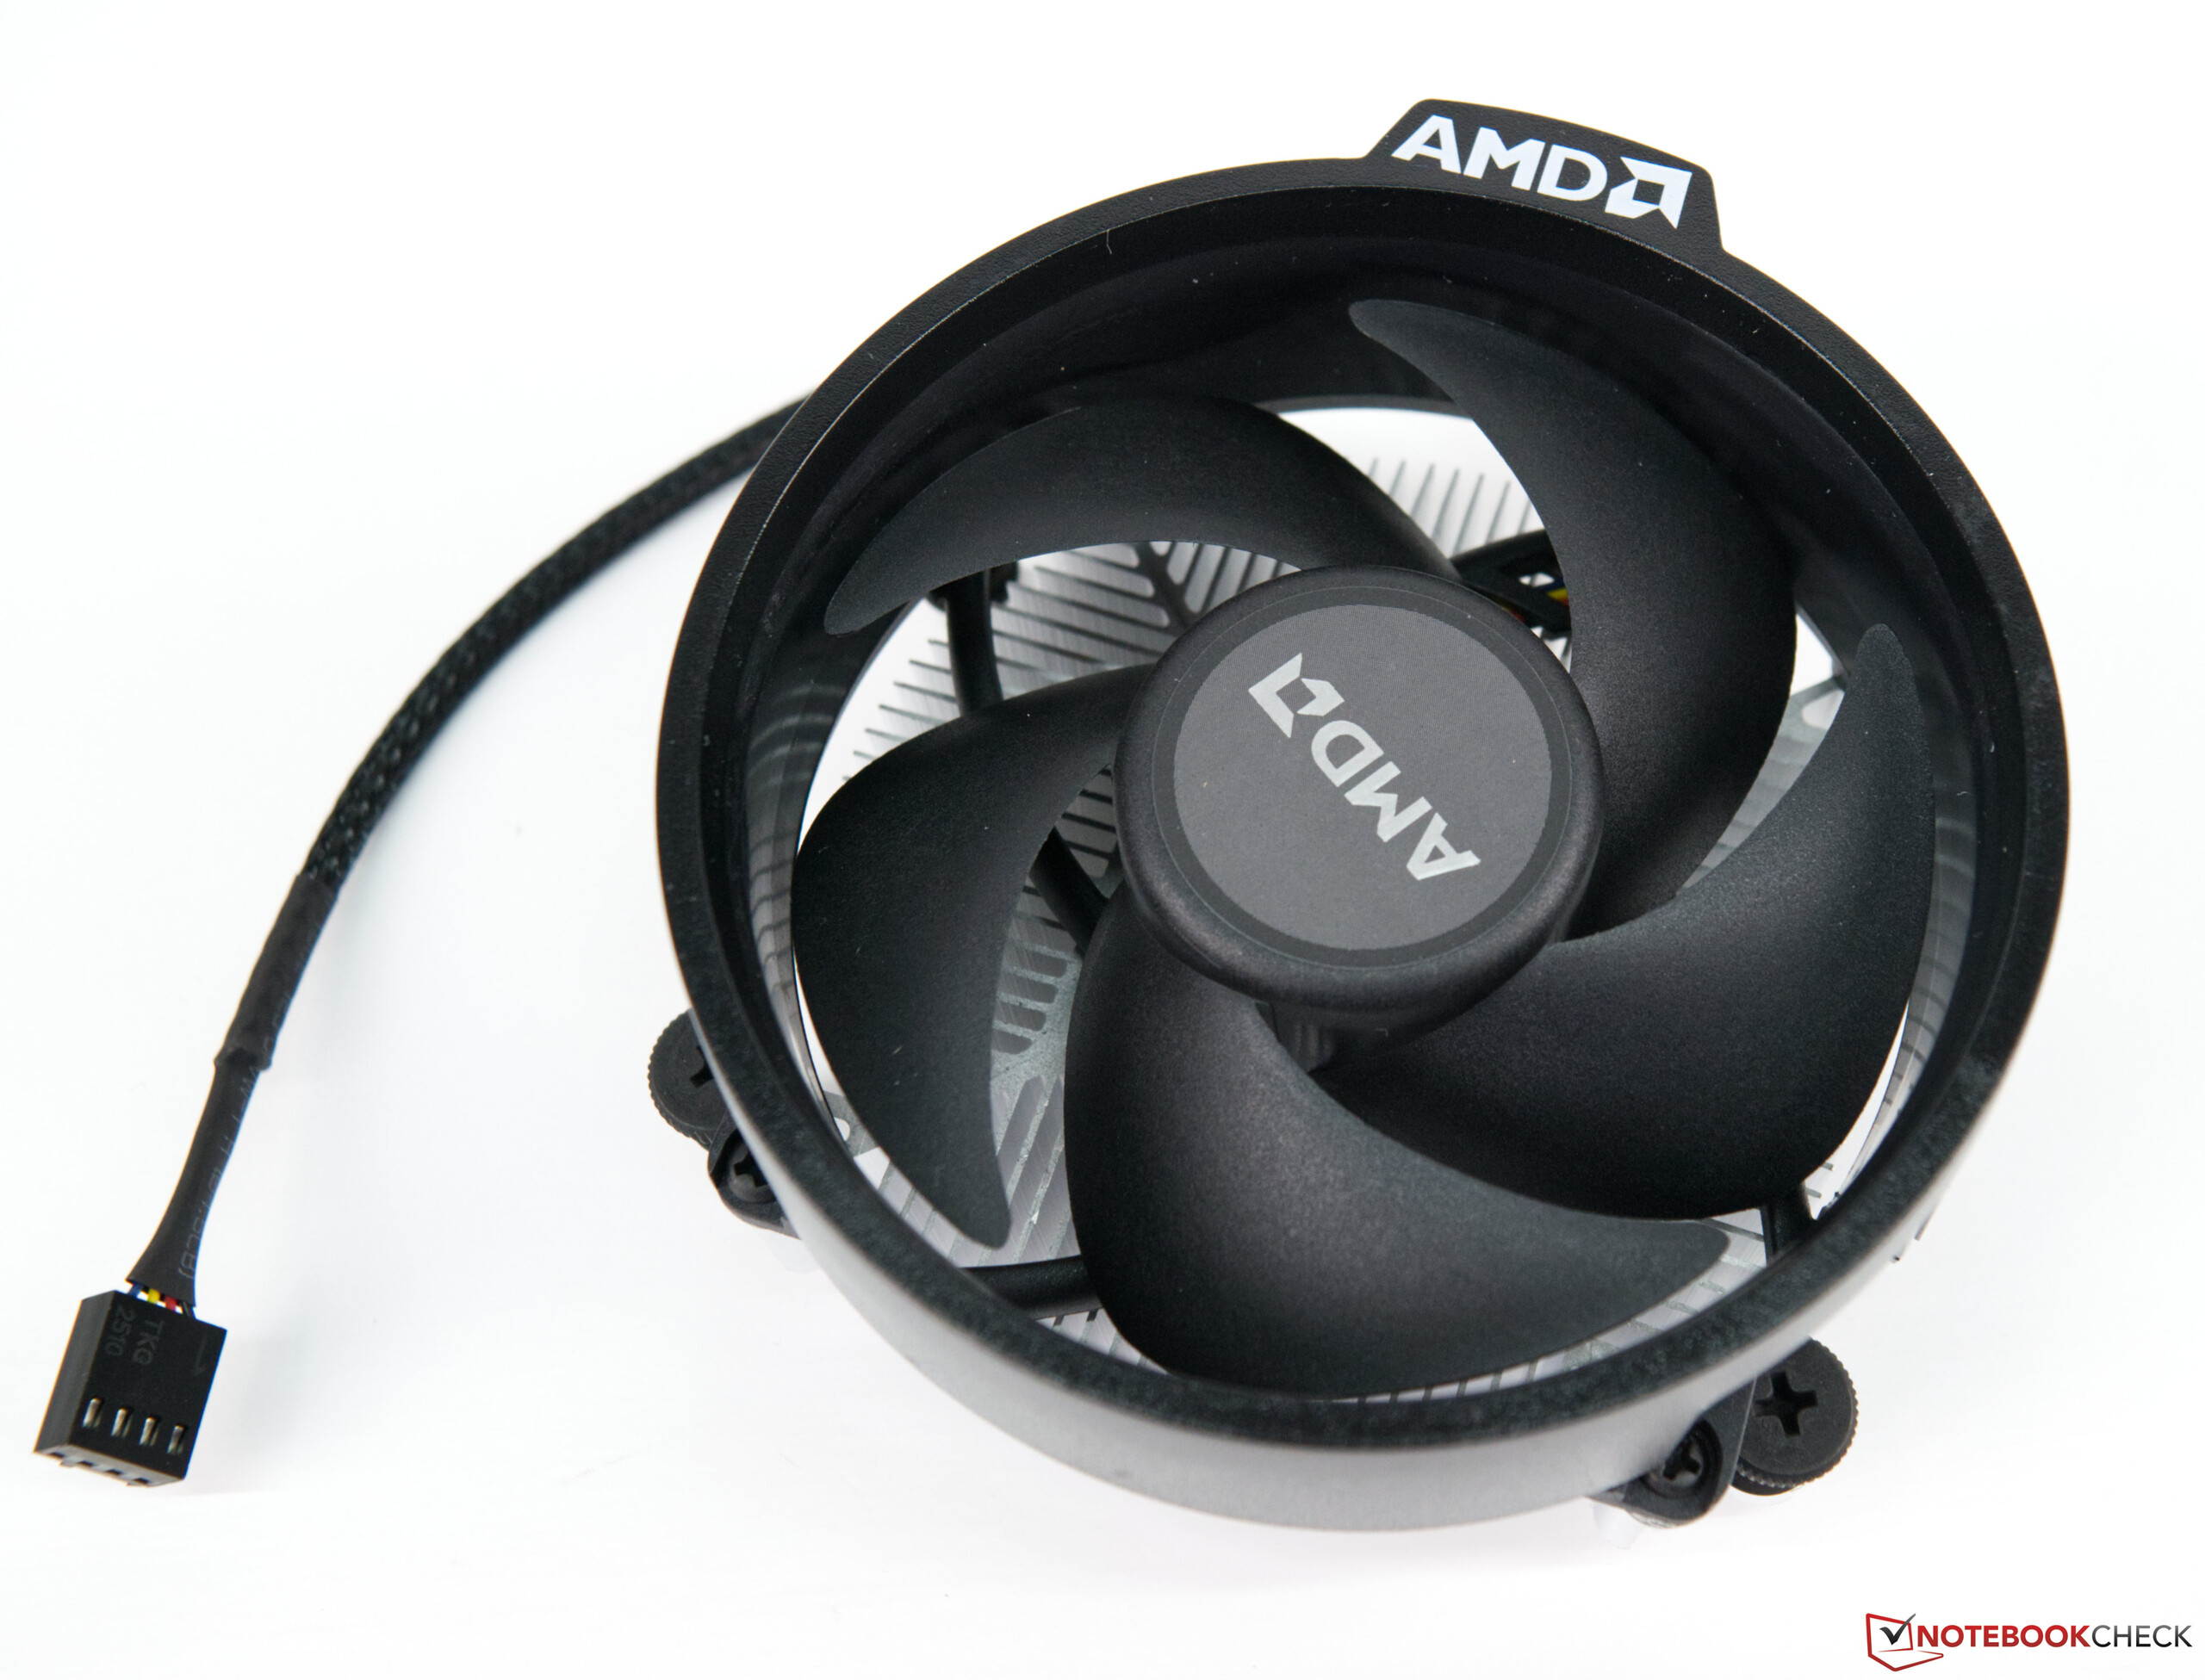
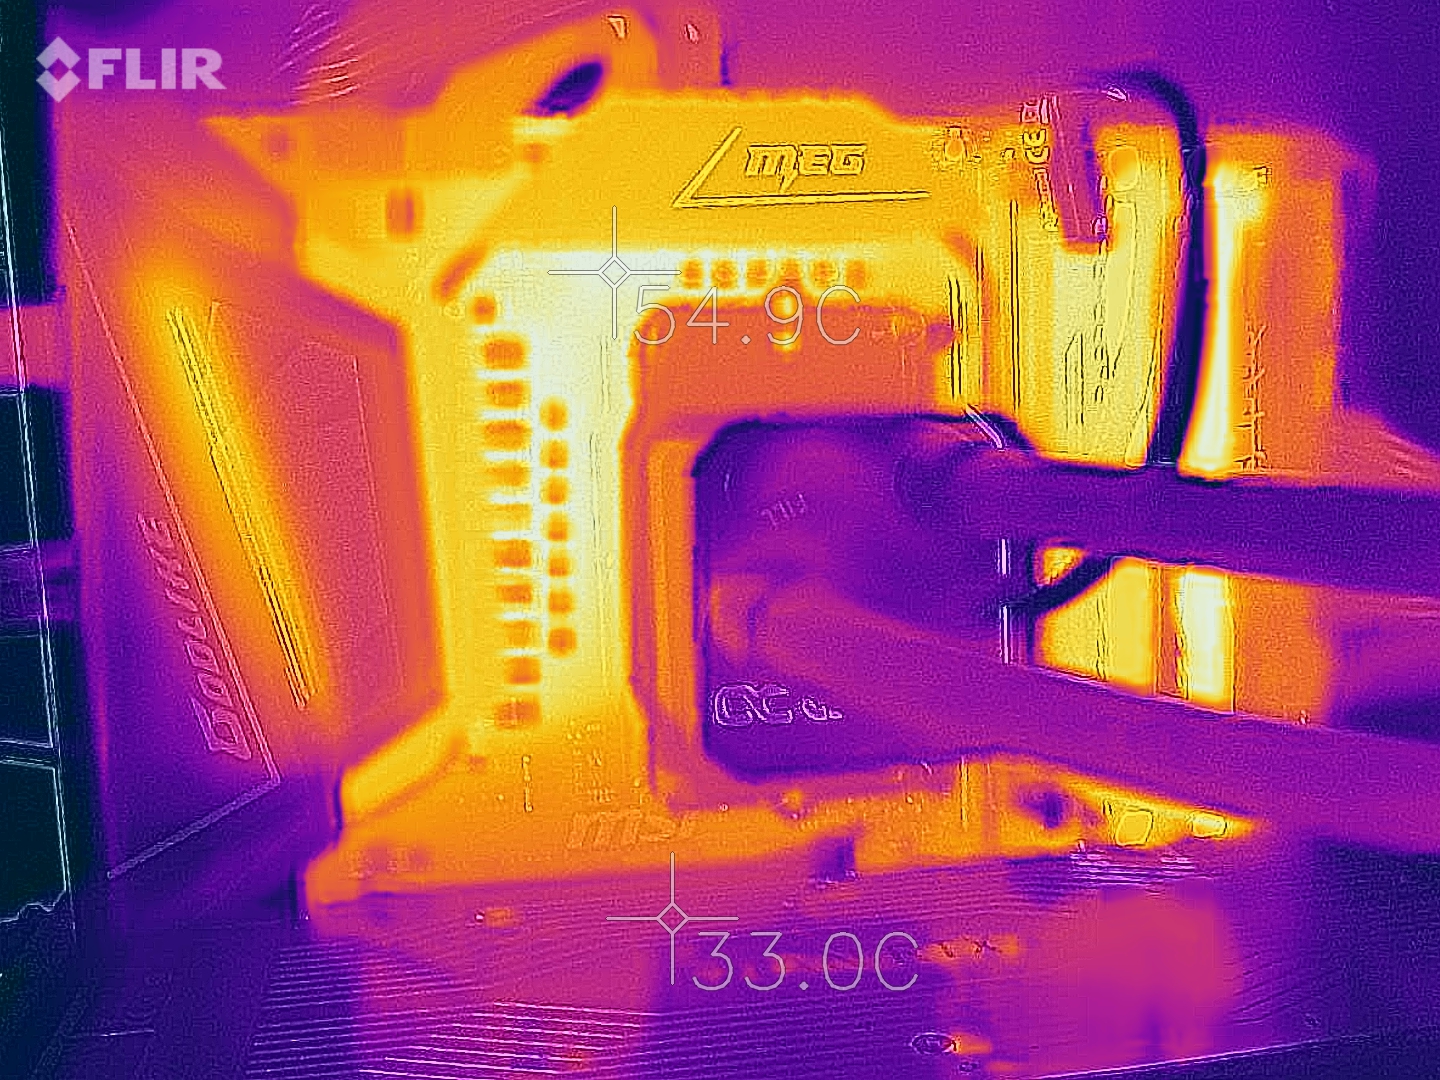
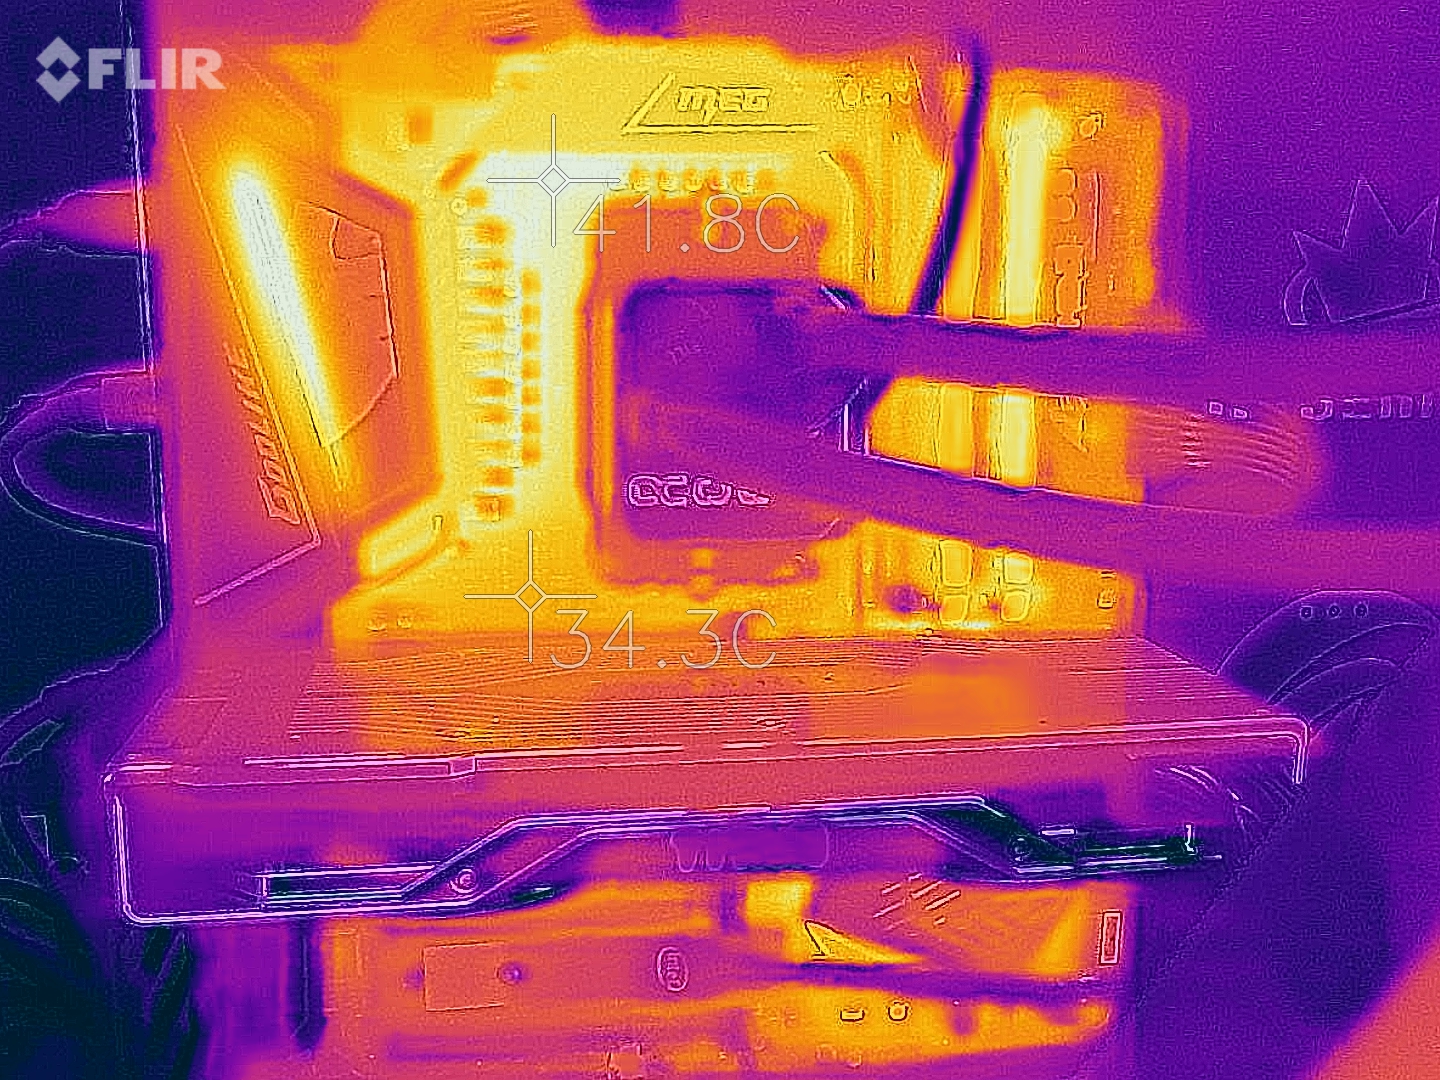
Er zijn geen zorgen over de temperaturen. In de stresstest bereikte de Ryzen 9 5950X nauwelijks 70 °C (158 °F), hoewel de Ryzen 5 5600X iets koeler bleef bij bijna 66 °C (151 °F). De gebruikte AiO van Alphacool heeft dus geen probleem om het topmodel betrouwbaar koel te houden. AMD bevat een kleine boxkoeler met de Ryzen 5 5600X.
AMD Ryzen 9 5950X
AMD Ryzen 5 5600X
| Power Consumption / The Witcher 3 ultra (external Monitor) | |
| AMD Ryzen 9 5950X, NVIDIA Titan RTX (Idle: 78 W) | |
| AMD Ryzen 9 5900X, NVIDIA Titan RTX (Idle: 78.1 W) | |
| AMD Ryzen 7 2700X, NVIDIA Titan RTX | |
| AMD Ryzen 9 3950X, NVIDIA Titan RTX (Idle: 95 W) | |
| AMD Ryzen 9 3900X, NVIDIA Titan RTX (Idle: 87.4 W) | |
| AMD Ryzen 7 5800X, NVIDIA Titan RTX (Idle: 77.5 W) | |
| AMD Ryzen 7 3800XT, NVIDIA Titan RTX (Idle: 96.1 W) | |
| AMD Ryzen 5 5600X, NVIDIA Titan RTX (Idle: 79.23 W) | |
| AMD Ryzen 5 1600, NVIDIA Titan RTX (Idle: 85.9 W) | |
| Intel Core i7-10700K, NVIDIA Titan RTX (Idle: 67.7 W) | |
| AMD Ryzen 3 3300X, NVIDIA Titan RTX (Idle: 88.8 W) | |
| Intel Core i9-10900K, NVIDIA Titan RTX (Idle: 52.3 W) | |
| AMD Ryzen 3 3100, NVIDIA Titan RTX (Idle: 86 W) | |
| Power Consumption / Prime95 V2810 Stress (external Monitor) | |
| Intel Core i9-10900K, NVIDIA Titan RTX (Idle: 52.3 W) | |
| AMD Ryzen 9 5950X, NVIDIA Titan RTX (Idle: 78 W) | |
| AMD Ryzen 7 5800X, NVIDIA Titan RTX (Idle: 77.5 W) | |
| AMD Ryzen 9 5900X, NVIDIA Titan RTX (Idle: 78.1 W) | |
| Intel Core i7-10700K, NVIDIA Titan RTX (Idle: 67.7 W) | |
| AMD Ryzen 9 3950X, NVIDIA Titan RTX (Idle: 95 W) | |
| AMD Ryzen 9 3900X, NVIDIA Titan RTX (Idle: 87.4 W) | |
| AMD Ryzen 7 3800XT, NVIDIA Titan RTX (Idle: 96.1 W) | |
| AMD Ryzen 5 1600, NVIDIA Titan RTX (Idle: 85.9 W) | |
| AMD Ryzen 5 5600X, NVIDIA Titan RTX (Idle: 79.23 W) | |
| AMD Ryzen 3 3300X, NVIDIA Titan RTX (Idle: 88.8 W) | |
| AMD Ryzen 3 3100, NVIDIA Titan RTX (Idle: 86 W) | |
| Power Consumption / Cinebench R15 Multi (external Monitor) | |
| Intel Core i9-10900K, NVIDIA Titan RTX (Idle: 52.3 W) | |
| AMD Ryzen 9 5900X, NVIDIA Titan RTX (Idle: 78.1 W) | |
| AMD Ryzen 9 5950X, NVIDIA Titan RTX (Idle: 78 W) | |
| AMD Ryzen 7 5800X, NVIDIA Titan RTX (Idle: 77.5 W) | |
| AMD Ryzen 9 3950X, NVIDIA Titan RTX (Idle: 95 W) | |
| AMD Ryzen 9 3900X, NVIDIA Titan RTX (Idle: 87.4 W) | |
| Intel Core i7-10700K, NVIDIA Titan RTX (Idle: 67.7 W) | |
| AMD Ryzen 7 3800XT, NVIDIA Titan RTX (Idle: 96.1 W) | |
| AMD Ryzen 5 5600X, NVIDIA Titan RTX (Idle: 79.23 W) | |
| AMD Ryzen 5 1600, NVIDIA Titan RTX (Idle: 85.9 W) | |
| AMD Ryzen 3 3300X, NVIDIA Titan RTX (Idle: 88.8 W) | |
| AMD Ryzen 3 3100, NVIDIA Titan RTX (Idle: 86 W) | |
| Power Consumption / Cinebench R20 Multi (external Monitor) | |
| AMD Ryzen 9 5950X, NVIDIA Titan RTX (78) | |
| AMD Ryzen 5 5600X, NVIDIA Titan RTX (79.23) | |
| Power Consumption / Cinebench R20 Single (external Monitor) | |
| AMD Ryzen 9 5950X, NVIDIA Titan RTX (78) | |
| AMD Ryzen 5 5600X, NVIDIA Titan RTX (79.23) | |
* ... kleiner is beter
Pro
Contra
Oordeel - Zeer snel AMD Ryzen 5000
Na de eerste bespreking van de nieuwe Ryzen 5000-serie waren we al positief verrast over de prestaties. De eerdere zwakte van de single-core prestaties ten opzichte van Intel behoort tot het verleden sinds de introductie van de nieuwe Ryzen 5000-serie. Zelfs de kleine Ryzen 5 5600X is in staat om gemakkelijk een Intel Core i9-10900K te overtreffen. Tegelijkertijd moeten we afwachten of Intel in staat is om in de nabije toekomst met Rocket Lake
tegen te gaan.
Maar tot die tijd is AMD in staat om de kroon van de snelste gaming CPU te dragen. Dit hebben we al geattesteerd voor de AMD Ryzen 9 5900X
. De AMD Ryzen 9 5950X is zelfs in staat om de single-thread performance te verbeteren. Niets anders is echter in staat om de AMD Ryzen 9 5950X bij te houden in multi-thread prestaties. De AMD verlaagt zelfs duidelijk de rating van de AMD Ryzen 9 3950X.
Terwijl u kunt praten over de prijs, staat het topmodel momenteel genoteerd op 899 euro (~$1063). Dit is 100 euro (~$118) meer dan de aanbevolen verkoopprijs bij de introductie, wat te wijten is aan het huidige gebrek aan beschikbaarheid. Voor het instapmodel ziet de beschikbaarheid er niet veel beter uit, waardoor de huidige prijzen veel hoger zijn dan de adviesprijs van 299 euro (~$353). Degenen die overwegen om een nieuwe Ryzen 5000 te kopen, moeten op dit moment plannen maken voor de lange termijn, omdat het momenteel te duur is. Zodra de voorraden in de winkels een beetje zijn hersteld, zouden de prijzen weer op een redelijker niveau moeten komen te liggen. Maar voor nu is er een probleem met de beschikbaarheid. De nieuwe AMD Radeon RX 6800 grafische kaarten zijn ook niet beschikbaar, en het ziet er ook niet anders uit voor Nvidia's GeForce RTX 3000 kaarten.
AMD legt de lat voor de krachtigste gaming CPU op een nieuw niveau en de opgegeven kloksnelheden worden bijna altijd aanzienlijk overschreden.
De gelukkigen die nog steeds in staat zijn om een van de nieuwe Ryzen CPU's te grijpen, zullen de merkbare prestatieverhoging kunnen bevestigen. Iedereen moet echter zelf beslissen welke CPU voor hem of haar geschikt is. Als het puur een kwestie van gaming is, dan is de AMD Ryzen 5 5600X voldoende. Maar als je ook nog eens videobewerking wilt doen, dan is de AMD Ryzen 7 5800X de moeite waard. En voor contentmakers zijn de Ryzen 9 modellen die ook een extra streaming PC kunnen vervangen de moeite waard.

