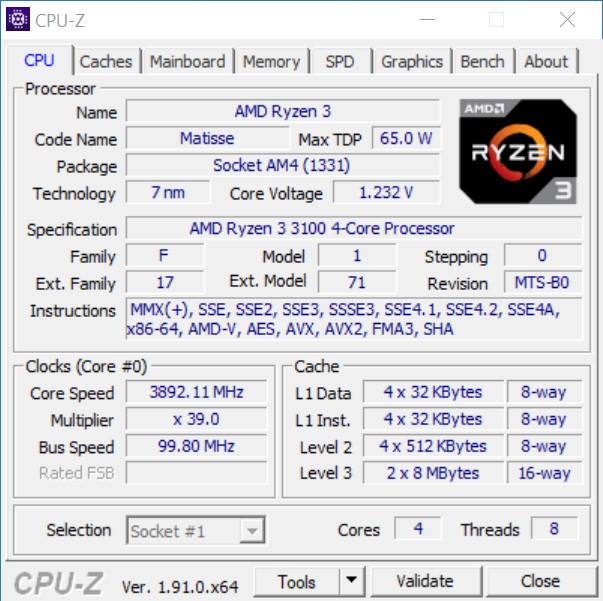
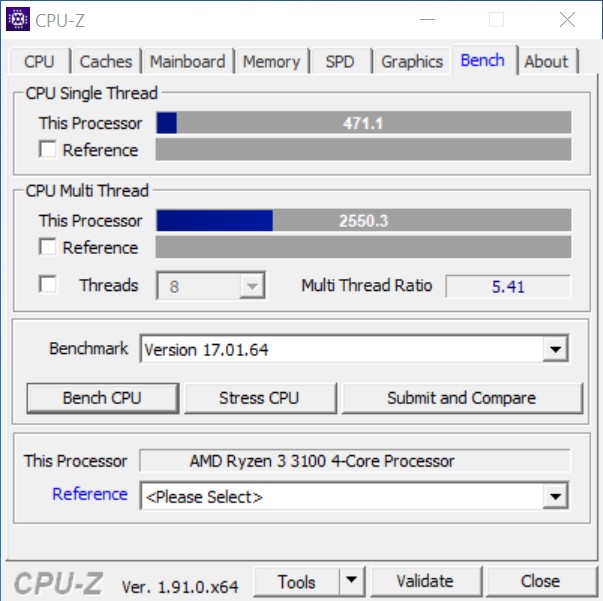
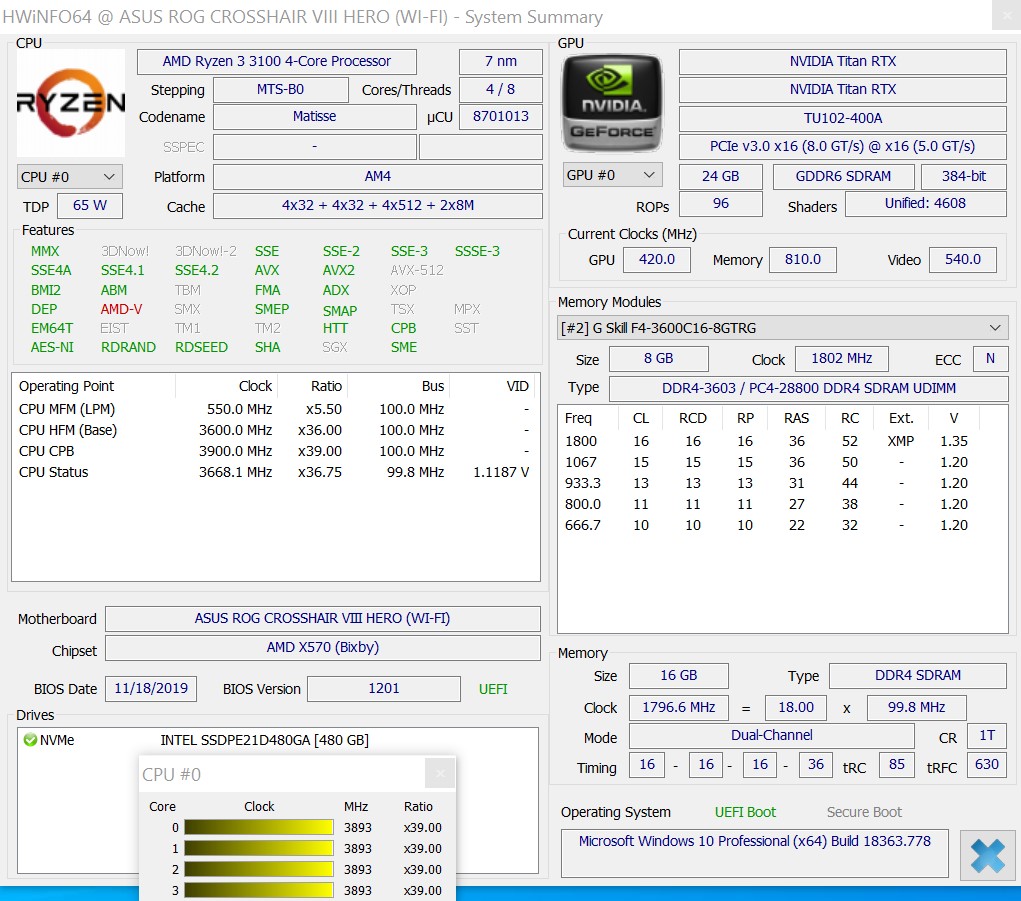
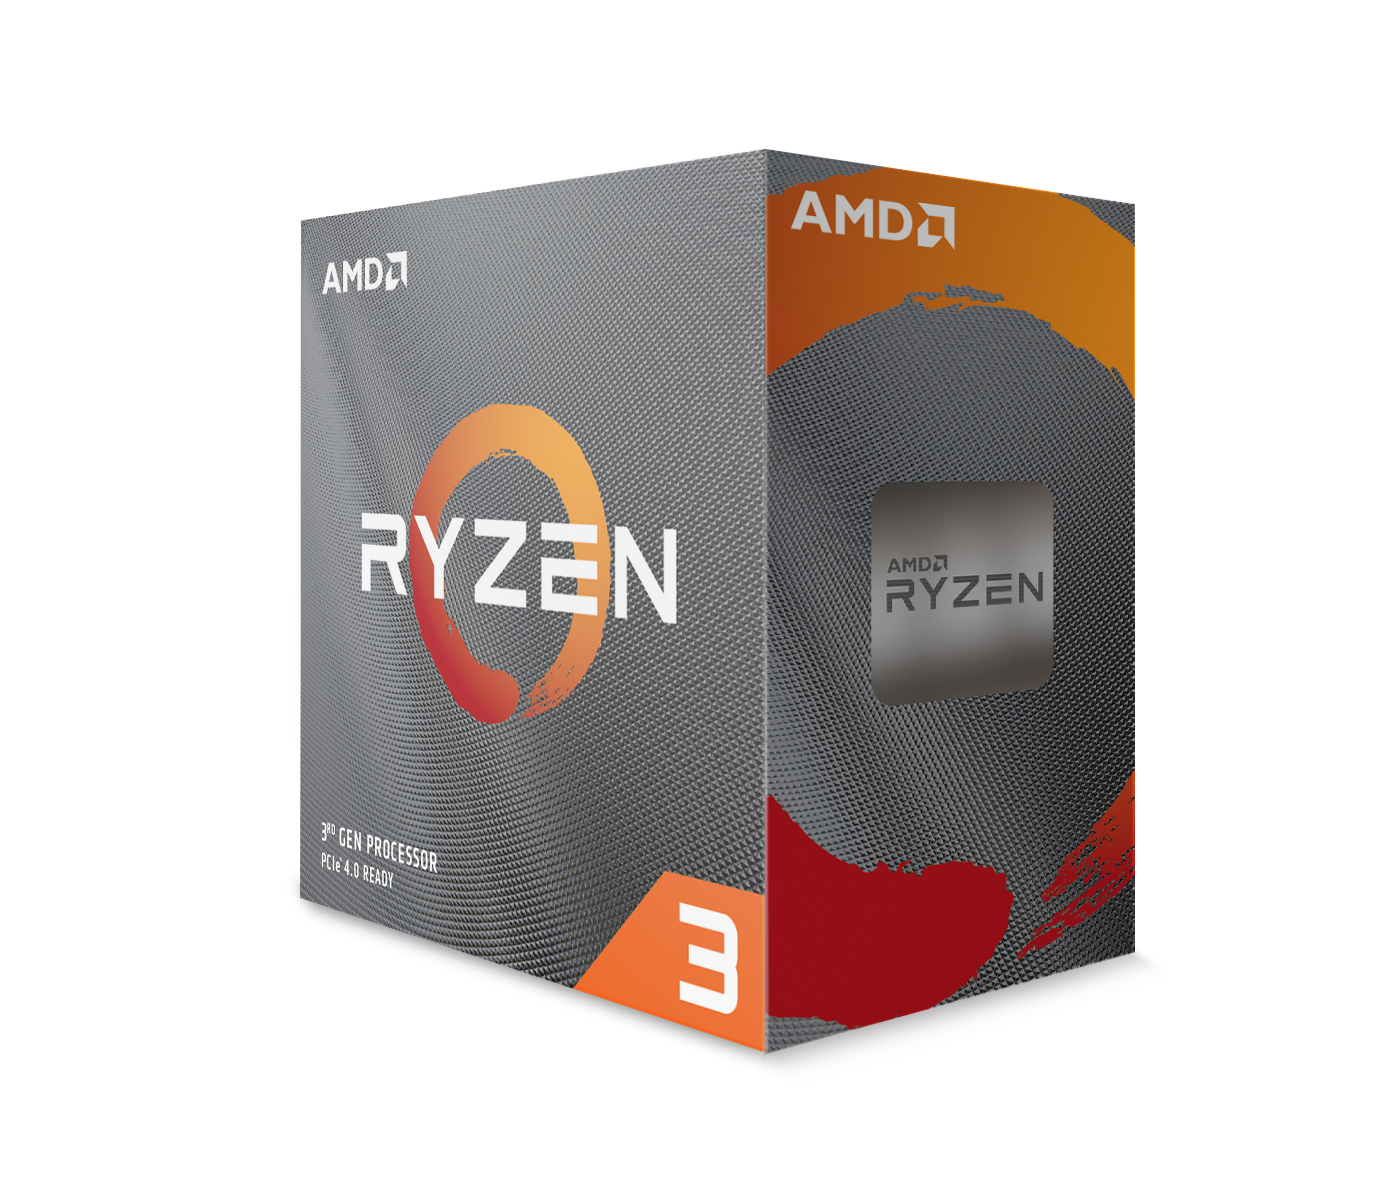
Kort testrapport AMD Ryzen 3 3100 en Ryzen 3 3300X met 4 cores en 8 threads
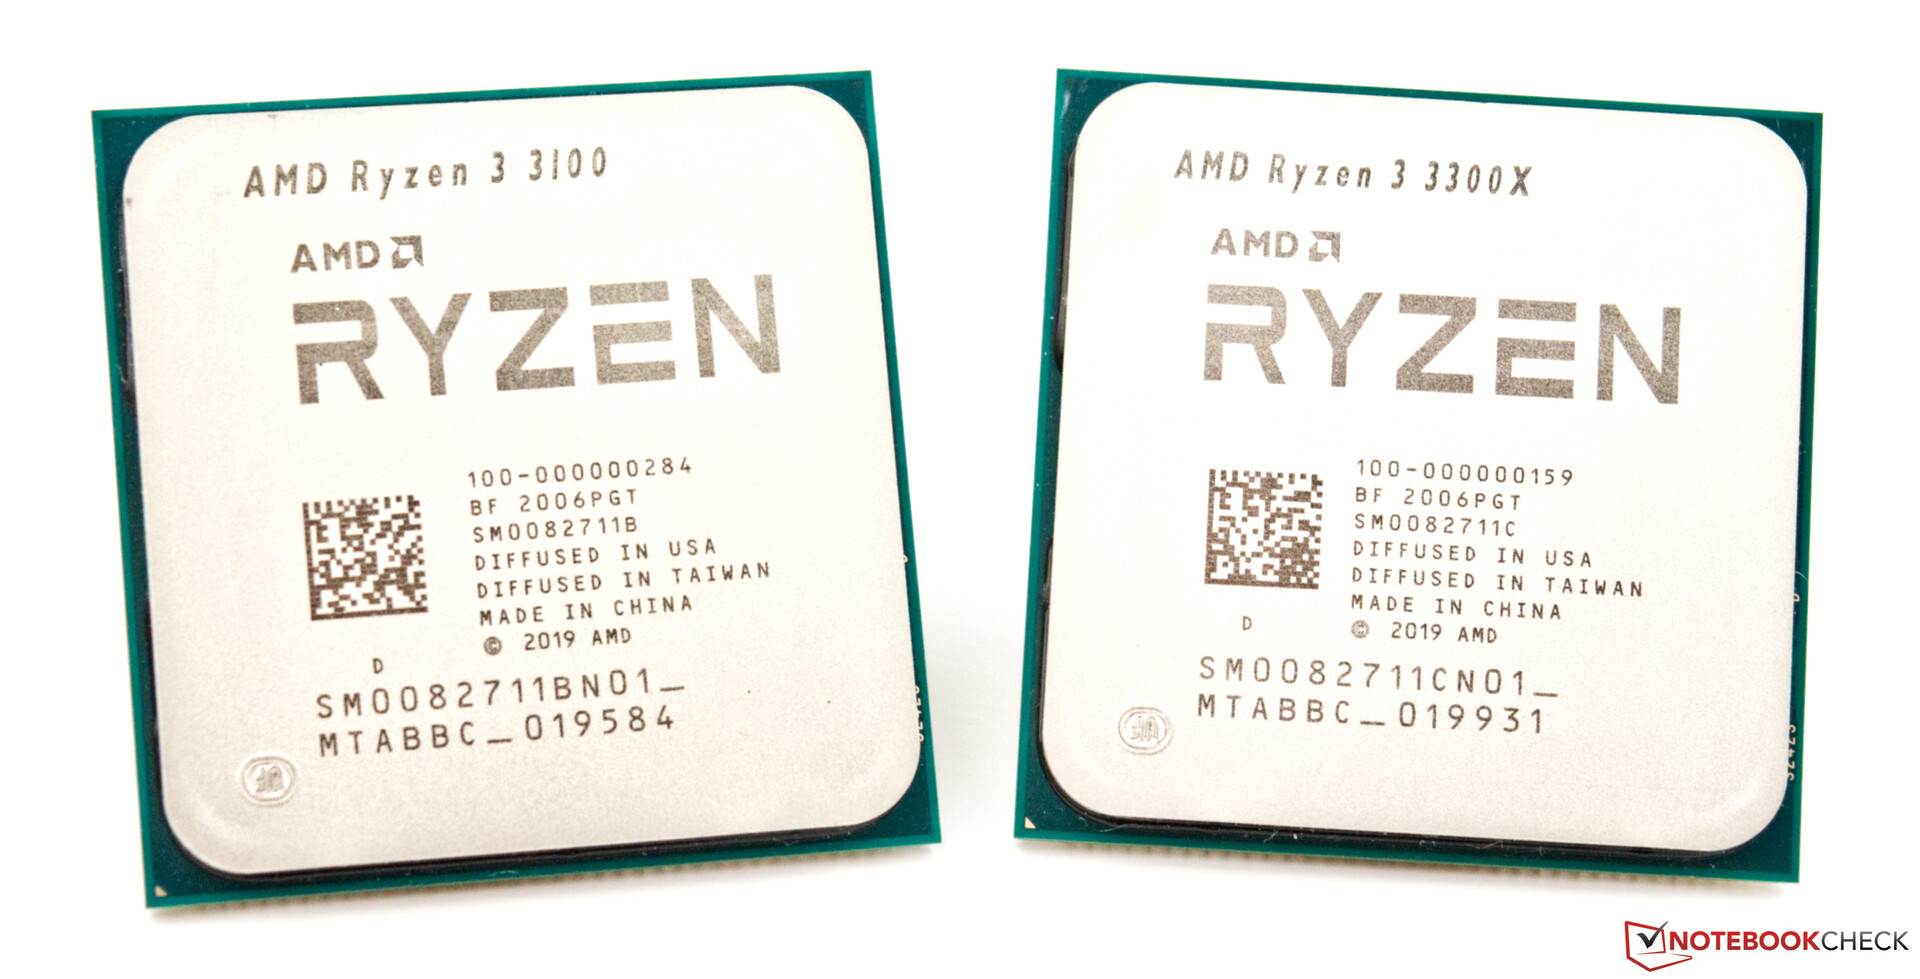
AMD Ryzen 3 3100


AMD Ryzen 3 3300X


| Performance rating - Percent | |
| Gemiddeld Intel Core i7-7740X | |
| AMD Ryzen 3 3300X | |
| Intel Core i5-9400F | |
| AMD Ryzen 3 3100 | |
| AMD Ryzen 5 1600 | |
| Intel Core i3-9100F | |
| Cinebench R10 | |
| Rendering Single CPUs 64Bit | |
| AMD Ryzen 3 3300X | |
| Gemiddeld Intel Core i7-7740X (n=1) | |
| AMD Ryzen 3 3100 | |
| Intel Core i3-9100F | |
| Intel Core i5-9400F | |
| AMD Ryzen 5 1600 | |
| Rendering Multiple CPUs 64Bit | |
| AMD Ryzen 5 1600 | |
| AMD Ryzen 3 3300X | |
| Intel Core i5-9400F | |
| Gemiddeld Intel Core i7-7740X (n=1) | |
| AMD Ryzen 3 3100 | |
| Intel Core i3-9100F | |
| Blender - v2.79 BMW27 CPU | |
| Intel Core i3-9100F | |
| AMD Ryzen 3 3100 | |
| Intel Core i5-9400F | |
| Gemiddeld Intel Core i7-7740X (n=1) | |
| AMD Ryzen 3 3300X | |
| AMD Ryzen 5 1600 | |
| WinRAR - Result | |
| AMD Ryzen 3 3300X | |
| Gemiddeld Intel Core i7-7740X (n=1) | |
| Intel Core i5-9400F | |
| AMD Ryzen 3 3100 | |
| AMD Ryzen 5 1600 | |
| Intel Core i3-9100F | |
| Geekbench 4.4 | |
| 64 Bit Single-Core Score | |
| Gemiddeld Intel Core i7-7740X (n=1) | |
| AMD Ryzen 3 3300X | |
| Intel Core i5-9400F | |
| Intel Core i3-9100F | |
| AMD Ryzen 3 3100 | |
| AMD Ryzen 5 1600 | |
| 64 Bit Multi-Core Score | |
| Intel Core i5-9400F | |
| AMD Ryzen 5 1600 | |
| AMD Ryzen 3 3300X | |
| Gemiddeld Intel Core i7-7740X (n=1) | |
| AMD Ryzen 3 3100 | |
| Intel Core i3-9100F | |
| 3DMark 11 - 1280x720 Performance Physics | |
| AMD Ryzen 3 3300X | |
| Gemiddeld Intel Core i7-7740X (12196 - 12488, n=6) | |
| AMD Ryzen 5 1600 | |
| Intel Core i5-9400F | |
| AMD Ryzen 3 3100 | |
| Intel Core i3-9100F | |
| HWBOT x265 Benchmark v2.2 - 4k Preset | |
| Intel Core i5-9400F | |
| Gemiddeld Intel Core i7-7740X (n=1) | |
| AMD Ryzen 3 3300X | |
| AMD Ryzen 3 3100 | |
| AMD Ryzen 5 1600 | |
| Intel Core i3-9100F | |
| R Benchmark 2.5 - Overall mean | |
| Intel Core i5-9400F | |
| Intel Core i3-9100F | |
| AMD Ryzen 5 1600 | |
| AMD Ryzen 3 3100 | |
| Gemiddeld Intel Core i7-7740X (n=1) | |
| AMD Ryzen 3 3300X | |
| LibreOffice - 20 Documents To PDF | |
| AMD Ryzen 5 1600 | |
| Intel Core i3-9100F | |
| AMD Ryzen 3 3100 | |
| Intel Core i5-9400F | |
| Gemiddeld Intel Core i7-7740X (n=1) | |
| AMD Ryzen 3 3300X | |
| WebXPRT 3 - Overall | |
| Gemiddeld Intel Core i7-7740X (247 - 265, n=2) | |
| AMD Ryzen 3 3300X | |
| Intel Core i5-9400F | |
| AMD Ryzen 3 3100 | |
| Intel Core i3-9100F | |
| AMD Ryzen 5 1600 | |
| Mozilla Kraken 1.1 - Total | |
| AMD Ryzen 5 1600 | |
| Intel Core i5-9400F | |
| Intel Core i3-9100F | |
| AMD Ryzen 3 3100 | |
| Gemiddeld Intel Core i7-7740X (n=1) | |
| AMD Ryzen 3 3300X | |
| 3DMark | |
| 3840x2160 Fire Strike Ultra Physics | |
| AMD Ryzen 5 1600 | |
| AMD Ryzen 3 3300X | |
| Gemiddeld Intel Core i7-7740X (n=1) | |
| AMD Ryzen 3 3100 | |
| Intel Core i5-9400F | |
| Intel Core i3-9100F | |
| 1920x1080 Fire Strike Physics | |
| AMD Ryzen 5 1600 | |
| AMD Ryzen 3 3300X | |
| Gemiddeld Intel Core i7-7740X (13230 - 14523, n=7) | |
| AMD Ryzen 3 3100 | |
| Intel Core i5-9400F | |
| Intel Core i3-9100F | |
| 2560x1440 Time Spy CPU | |
| AMD Ryzen 5 1600 | |
| Intel Core i5-9400F | |
| Gemiddeld Intel Core i7-7740X (5632 - 5792, n=7) | |
| AMD Ryzen 3 3300X | |
| AMD Ryzen 3 3100 | |
| Intel Core i3-9100F | |
* ... kleiner is beter
| PCMark 10 - Score | |
| AMD Ryzen 3 3300X | |
| Intel Core i5-9400F | |
| AMD Ryzen 3 3100 | |
| Intel Core i3-9100F | |
| AMD Ryzen 5 1600 | |
| PCMark 8 | |
| Work Score Accelerated v2 | |
| AMD Ryzen 3 3300X | |
| Intel Core i3-9100F | |
| Intel Core i5-9400F | |
| AMD Ryzen 3 3100 | |
| AMD Ryzen 5 1600 | |
| Creative Score Accelerated v2 | |
| AMD Ryzen 3 3300X | |
| Intel Core i5-9400F | |
| AMD Ryzen 3 3100 | |
| Intel Core i3-9100F | |
| AMD Ryzen 5 1600 | |
| Home Score Accelerated v2 | |
| AMD Ryzen 3 3300X | |
| Intel Core i5-9400F | |
| Intel Core i3-9100F | |
| AMD Ryzen 3 3100 | |
| AMD Ryzen 5 1600 | |
| Performance rating - Percent | |
| AMD Ryzen 3 3300X | |
| Intel Core i5-9400F | |
| AMD Ryzen 5 1600 | |
| AMD Ryzen 3 3100 | |
| Intel Core i3-9100F | |
| 3DMark 11 | |
| 1280x720 Performance | |
| AMD Ryzen 3 3300X | |
| Intel Core i5-9400F | |
| AMD Ryzen 5 1600 | |
| AMD Ryzen 3 3100 | |
| Intel Core i3-9100F | |
| 1280x720 Performance GPU | |
| Intel Core i3-9100F | |
| Intel Core i5-9400F | |
| AMD Ryzen 3 3300X | |
| AMD Ryzen 5 1600 | |
| AMD Ryzen 3 3100 | |
| 3DMark | |
| 1920x1080 Fire Strike Score | |
| AMD Ryzen 3 3300X | |
| Intel Core i5-9400F | |
| AMD Ryzen 5 1600 | |
| AMD Ryzen 3 3100 | |
| Intel Core i3-9100F | |
| 1920x1080 Fire Strike Graphics | |
| Intel Core i3-9100F | |
| Intel Core i5-9400F | |
| AMD Ryzen 3 3100 | |
| AMD Ryzen 3 3300X | |
| AMD Ryzen 5 1600 | |
| 3840x2160 Fire Strike Ultra Score | |
| AMD Ryzen 3 3300X | |
| Intel Core i5-9400F | |
| AMD Ryzen 5 1600 | |
| AMD Ryzen 3 3100 | |
| Intel Core i3-9100F | |
| 2560x1440 Time Spy Graphics | |
| Intel Core i5-9400F | |
| AMD Ryzen 3 3300X | |
| Intel Core i3-9100F | |
| AMD Ryzen 5 1600 | |
| AMD Ryzen 3 3100 | |
| 2560x1440 Time Spy Score | |
| Intel Core i5-9400F | |
| AMD Ryzen 5 1600 | |
| AMD Ryzen 3 3300X | |
| AMD Ryzen 3 3100 | |
| Intel Core i3-9100F | |
| Performance rating - Percent | |
| Intel Core i5 9400F | |
| AMD Ryzen 3 3300X | |
| Intel Core i3 9100F | |
| AMD Ryzen 3 3100 | |
| AMD Ryzen 5 1600 (12nm) | |
| Borderlands 3 | |
| 1280x720 Very Low Overall Quality (DX11) | |
| Intel Core i5 9400F | |
| AMD Ryzen 3 3300X | |
| Intel Core i3 9100F | |
| AMD Ryzen 3 3100 | |
| AMD Ryzen 5 1600 (12nm) | |
| 1920x1080 Badass Overall Quality (DX11) | |
| Intel Core i5 9400F | |
| AMD Ryzen 3 3300X | |
| Intel Core i3 9100F | |
| AMD Ryzen 3 3100 | |
| AMD Ryzen 5 1600 (12nm) | |
| Metro Exodus | |
| 1280x720 Low Quality AF:4x | |
| Intel Core i5 9400F | |
| AMD Ryzen 3 3300X | |
| AMD Ryzen 3 3100 | |
| AMD Ryzen 5 1600 (12nm) | |
| Intel Core i3 9100F | |
| 1920x1080 Ultra Quality AF:16x | |
| Intel Core i5 9400F | |
| AMD Ryzen 3 3300X | |
| AMD Ryzen 3 3100 | |
| AMD Ryzen 5 1600 (12nm) | |
| Intel Core i3 9100F | |
| Far Cry New Dawn | |
| 1280x720 Low Preset | |
| Intel Core i5 9400F | |
| AMD Ryzen 3 3300X | |
| Intel Core i3 9100F | |
| AMD Ryzen 5 1600 (12nm) | |
| AMD Ryzen 3 3100 | |
| 1920x1080 Ultra Preset | |
| Intel Core i5 9400F | |
| Intel Core i3 9100F | |
| AMD Ryzen 3 3300X | |
| AMD Ryzen 3 3100 | |
| AMD Ryzen 5 1600 (12nm) | |
| Forza Horizon 4 | |
| 1280x720 Very Low Preset | |
| Intel Core i5 9400F | |
| AMD Ryzen 3 3300X | |
| Intel Core i3 9100F | |
| AMD Ryzen 3 3100 | |
| AMD Ryzen 5 1600 (12nm) | |
| 1920x1080 Ultra Preset AA:2xMS | |
| Intel Core i5 9400F | |
| AMD Ryzen 3 3300X | |
| Intel Core i3 9100F | |
| AMD Ryzen 3 3100 | |
| AMD Ryzen 5 1600 (12nm) | |
| Shadow of the Tomb Raider | |
| 1280x720 Lowest Preset | |
| Intel Core i5 9400F | |
| AMD Ryzen 3 3300X | |
| Intel Core i3 9100F | |
| AMD Ryzen 3 3100 | |
| AMD Ryzen 5 1600 (12nm) | |
| 1920x1080 Highest Preset AA:T | |
| Intel Core i5 9400F | |
| AMD Ryzen 3 3300X | |
| AMD Ryzen 3 3100 | |
| AMD Ryzen 5 1600 (12nm) | |
| Intel Core i3 9100F | |
| Far Cry 5 | |
| 1280x720 Low Preset AA:T | |
| AMD Ryzen 3 3300X | |
| Intel Core i5 9400F | |
| AMD Ryzen 3 3100 | |
| AMD Ryzen 5 1600 (12nm) | |
| Intel Core i3 9100F | |
| 1920x1080 Ultra Preset AA:T | |
| Intel Core i5 9400F | |
| AMD Ryzen 3 3300X | |
| AMD Ryzen 3 3100 | |
| AMD Ryzen 5 1600 (12nm) | |
| Intel Core i3 9100F | |
| X-Plane 11.11 | |
| 1280x720 low (fps_test=1) | |
| Intel Core i5 9400F | |
| AMD Ryzen 3 3300X | |
| Intel Core i3 9100F | |
| AMD Ryzen 3 3100 | |
| AMD Ryzen 5 1600 (12nm) | |
| 1920x1080 high (fps_test=3) | |
| Intel Core i5 9400F | |
| AMD Ryzen 3 3300X | |
| Intel Core i3 9100F | |
| AMD Ryzen 3 3100 | |
| AMD Ryzen 5 1600 (12nm) | |
| Final Fantasy XV Benchmark | |
| 1280x720 Lite Quality | |
| Intel Core i5 9400F | |
| AMD Ryzen 3 3300X | |
| AMD Ryzen 3 3100 | |
| AMD Ryzen 5 1600 (12nm) | |
| Intel Core i3 9100F | |
| 1920x1080 High Quality | |
| Intel Core i5 9400F | |
| AMD Ryzen 3 3300X | |
| AMD Ryzen 5 1600 (12nm) | |
| AMD Ryzen 3 3100 | |
| Intel Core i3 9100F | |
| Dota 2 Reborn | |
| 1280x720 min (0/3) fastest | |
| Intel Core i5 9400F | |
| Intel Core i3 9100F | |
| AMD Ryzen 3 3300X | |
| AMD Ryzen 5 1600 (12nm) | |
| AMD Ryzen 3 3100 | |
| 1920x1080 ultra (3/3) best looking | |
| Intel Core i5 9400F | |
| Intel Core i3 9100F | |
| AMD Ryzen 3 3300X | |
| AMD Ryzen 5 1600 (12nm) | |
| AMD Ryzen 3 3100 | |
| The Witcher 3 | |
| 1024x768 Low Graphics & Postprocessing | |
| Intel Core i5 9400F | |
| AMD Ryzen 3 3300X | |
| AMD Ryzen 5 1600 (12nm) | |
| AMD Ryzen 3 3100 | |
| Intel Core i3 9100F | |
| 1920x1080 Ultra Graphics & Postprocessing (HBAO+) | |
| Intel Core i5 9400F | |
| AMD Ryzen 5 1600 (12nm) | |
| AMD Ryzen 3 3300X | |
| Intel Core i3 9100F | |
| AMD Ryzen 3 3100 | |
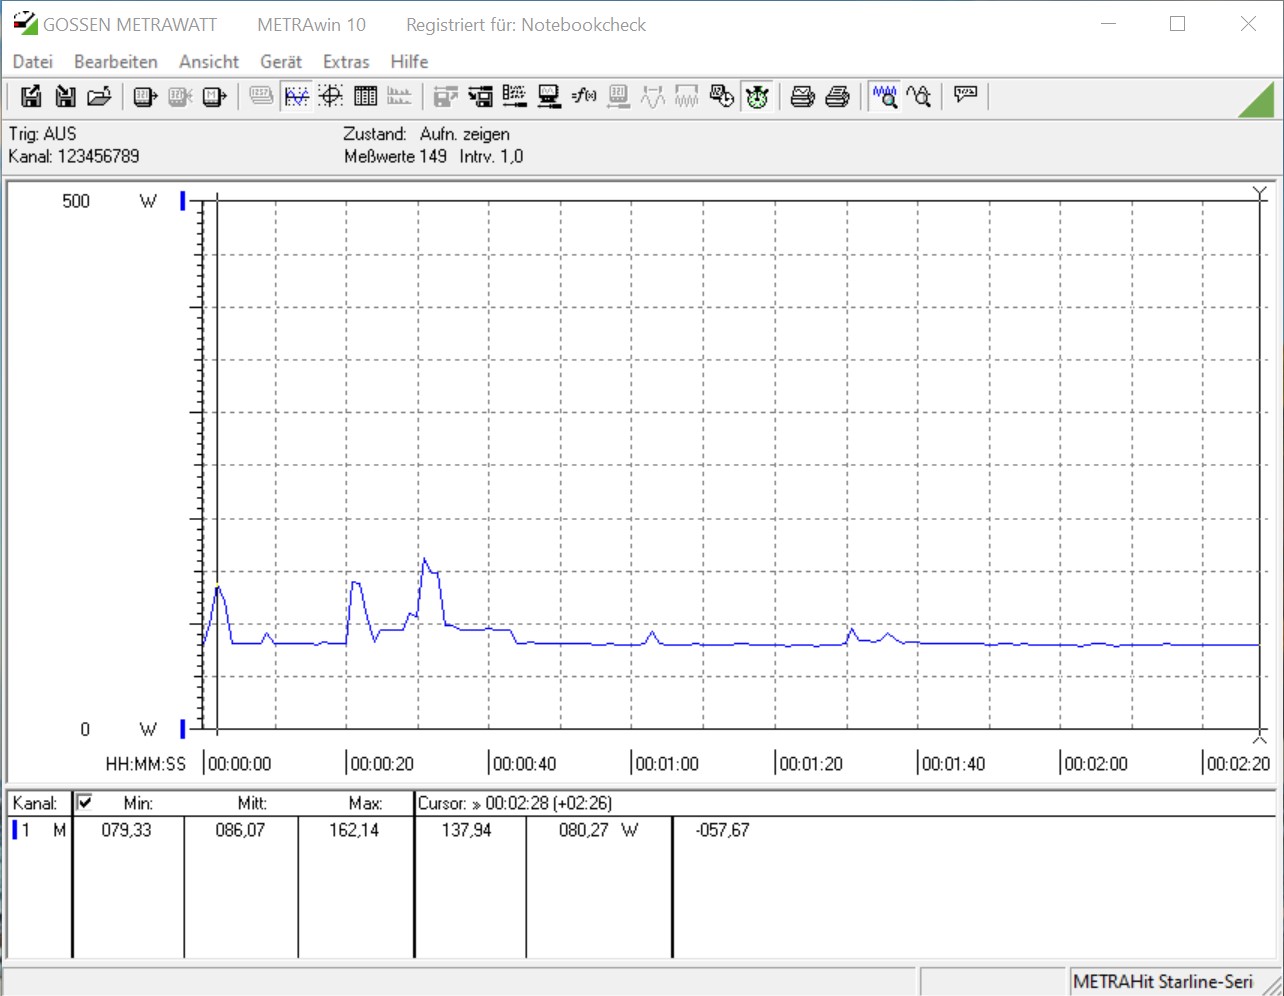
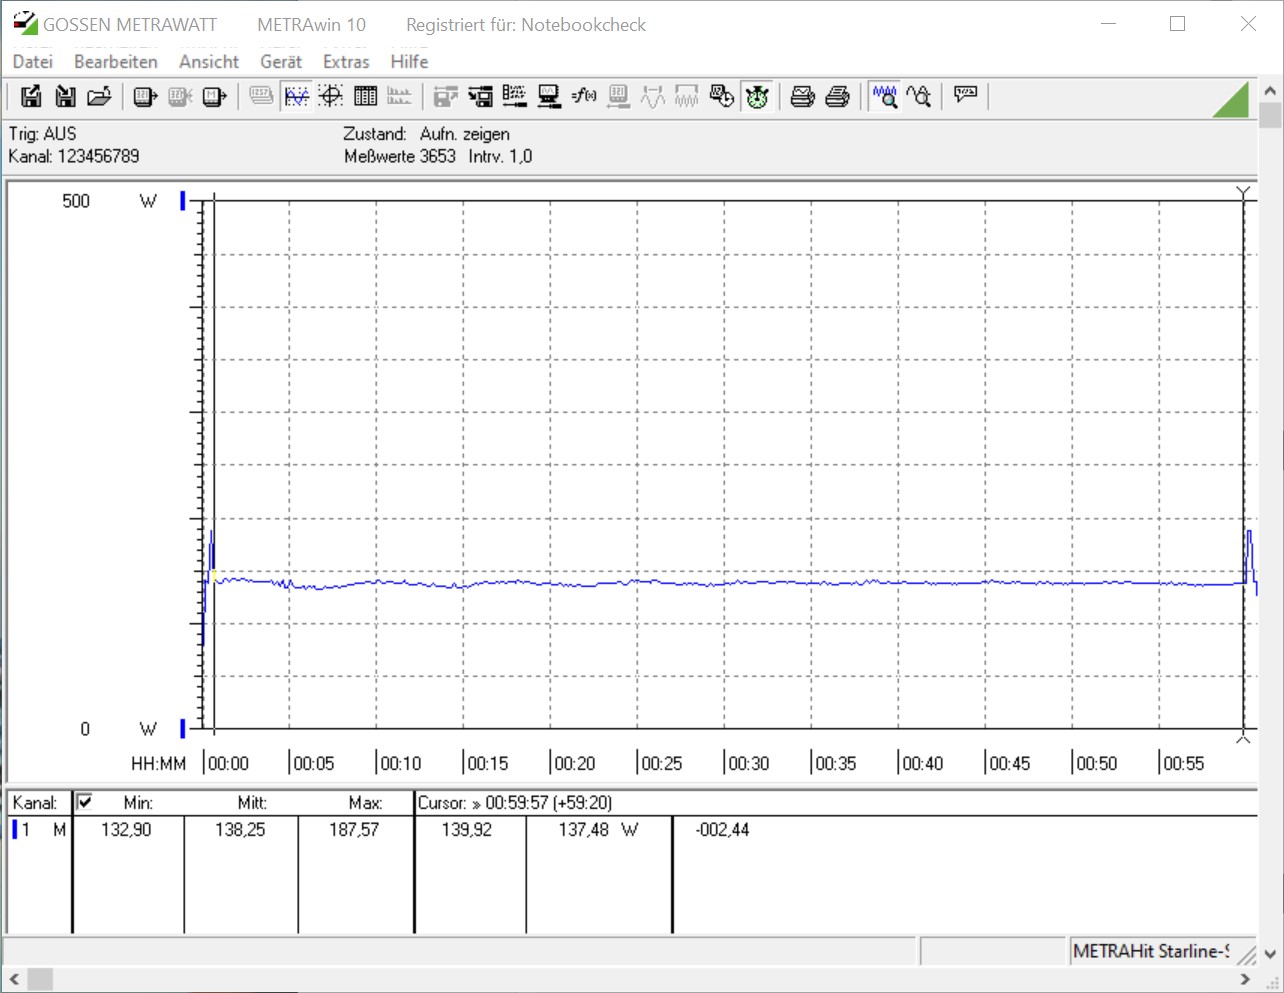
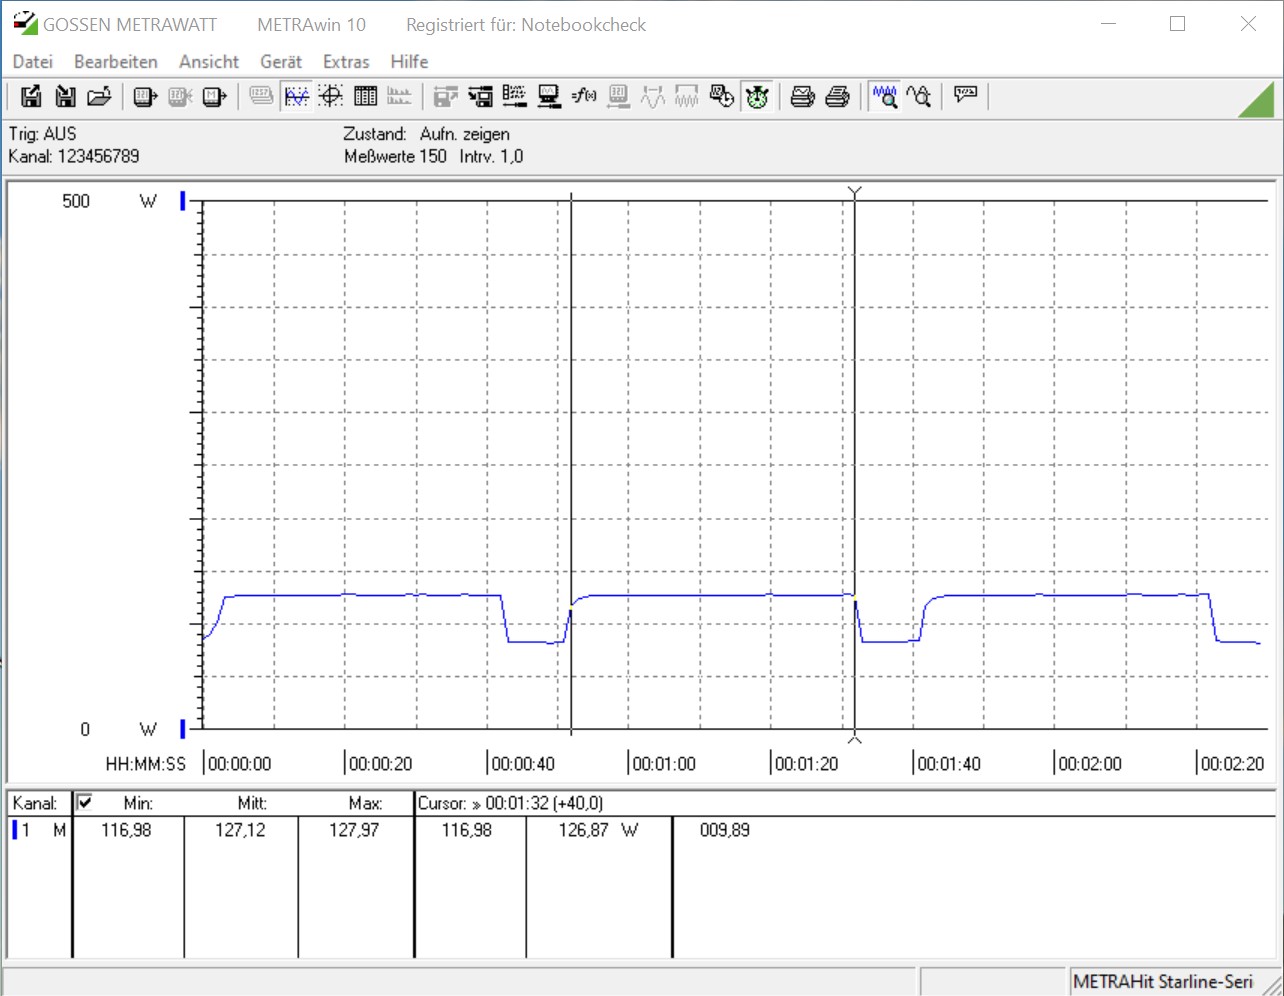
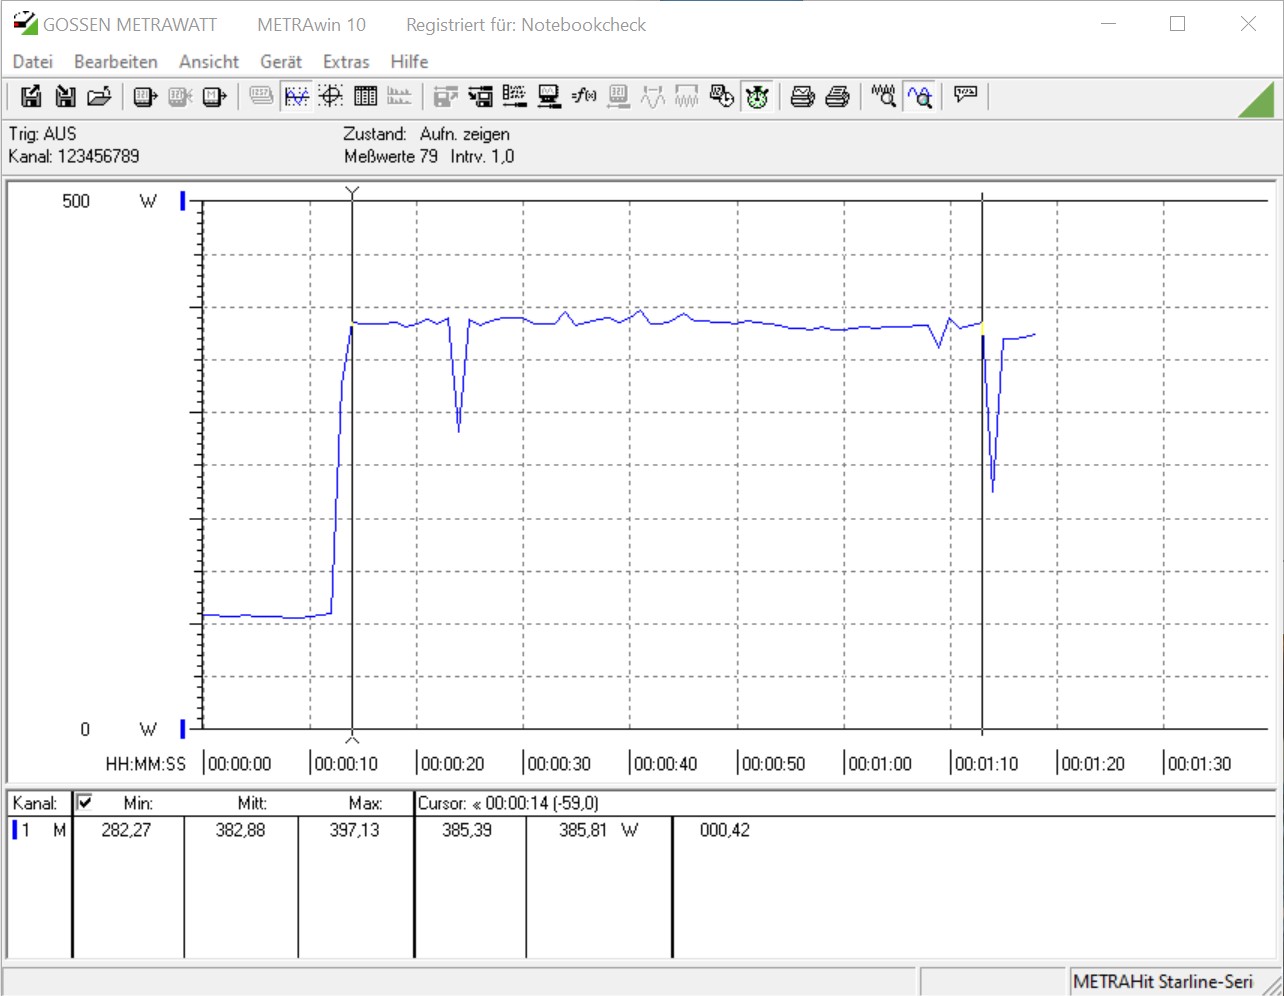
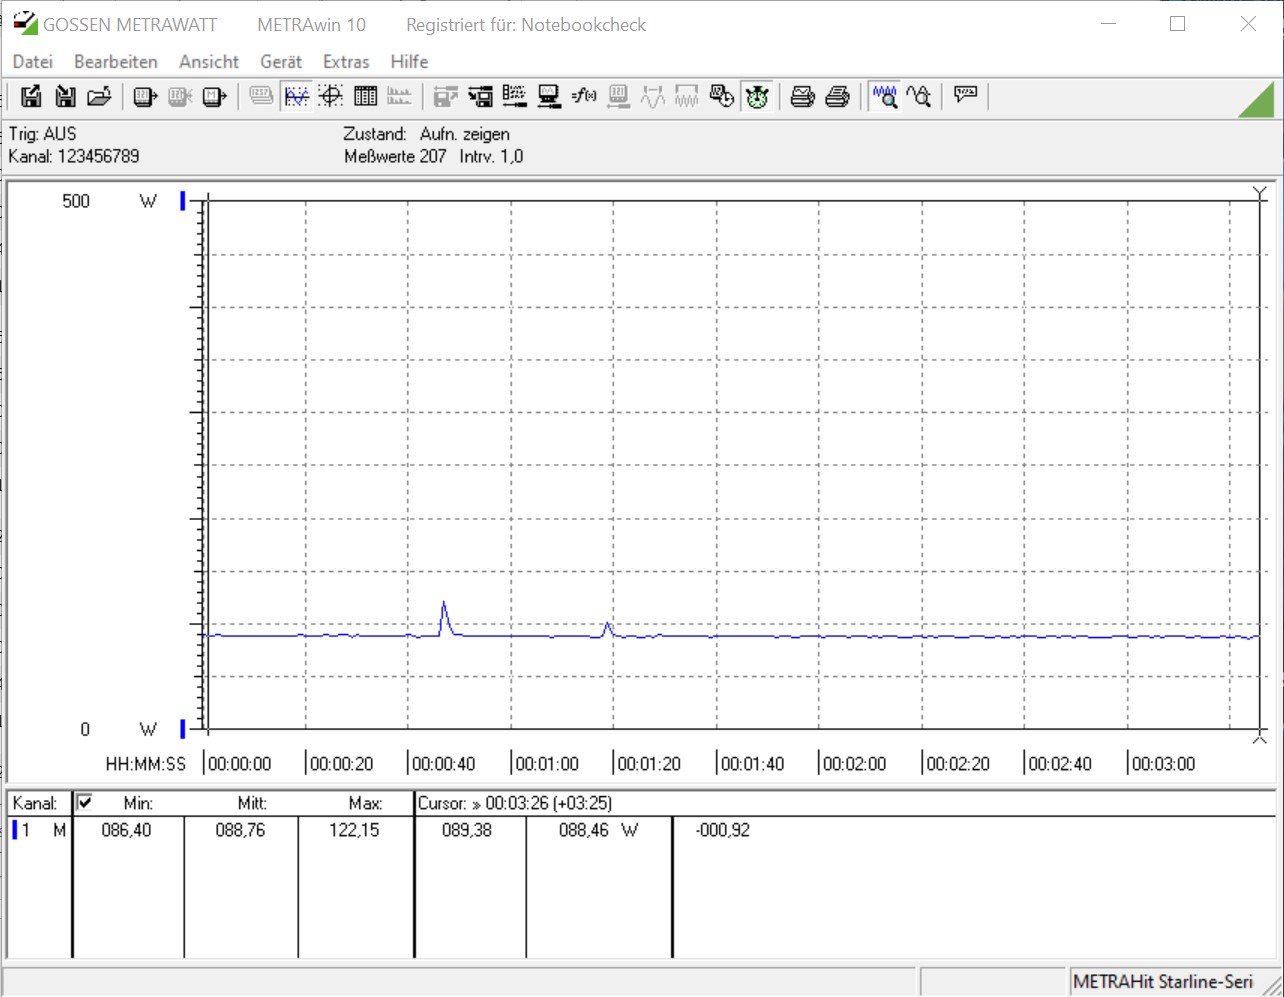
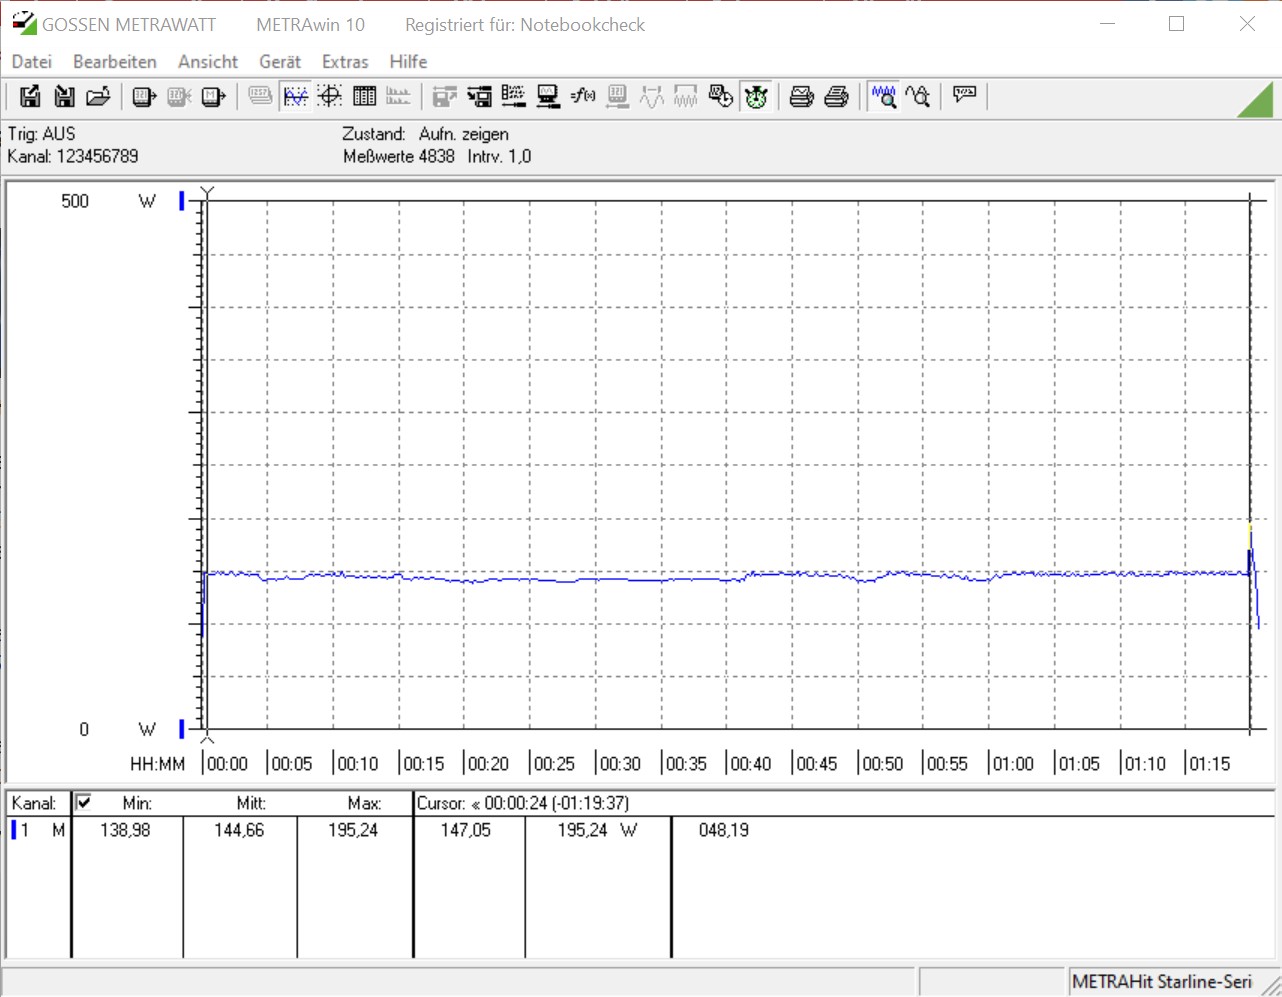
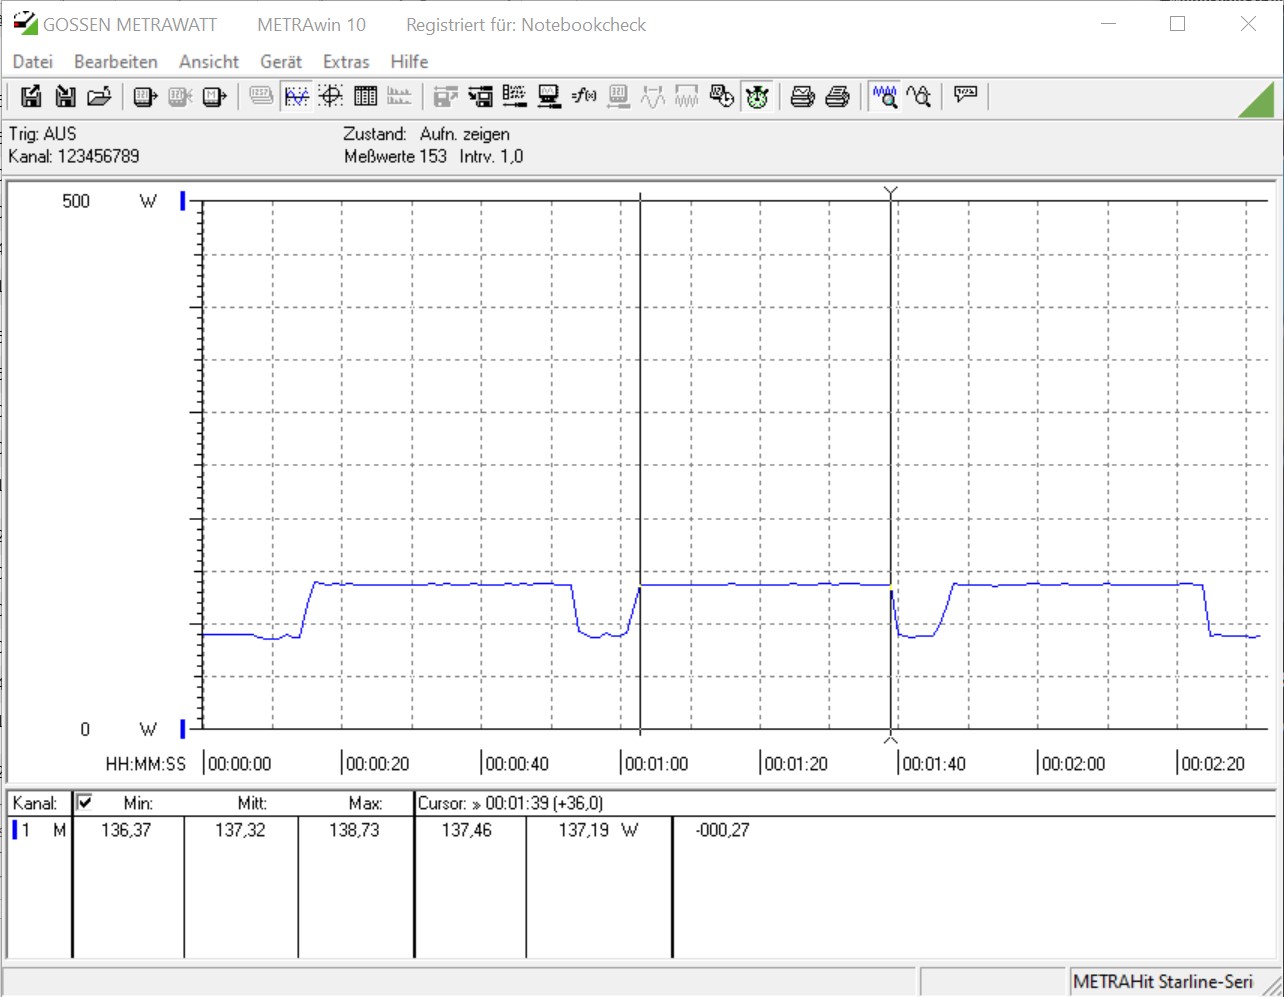
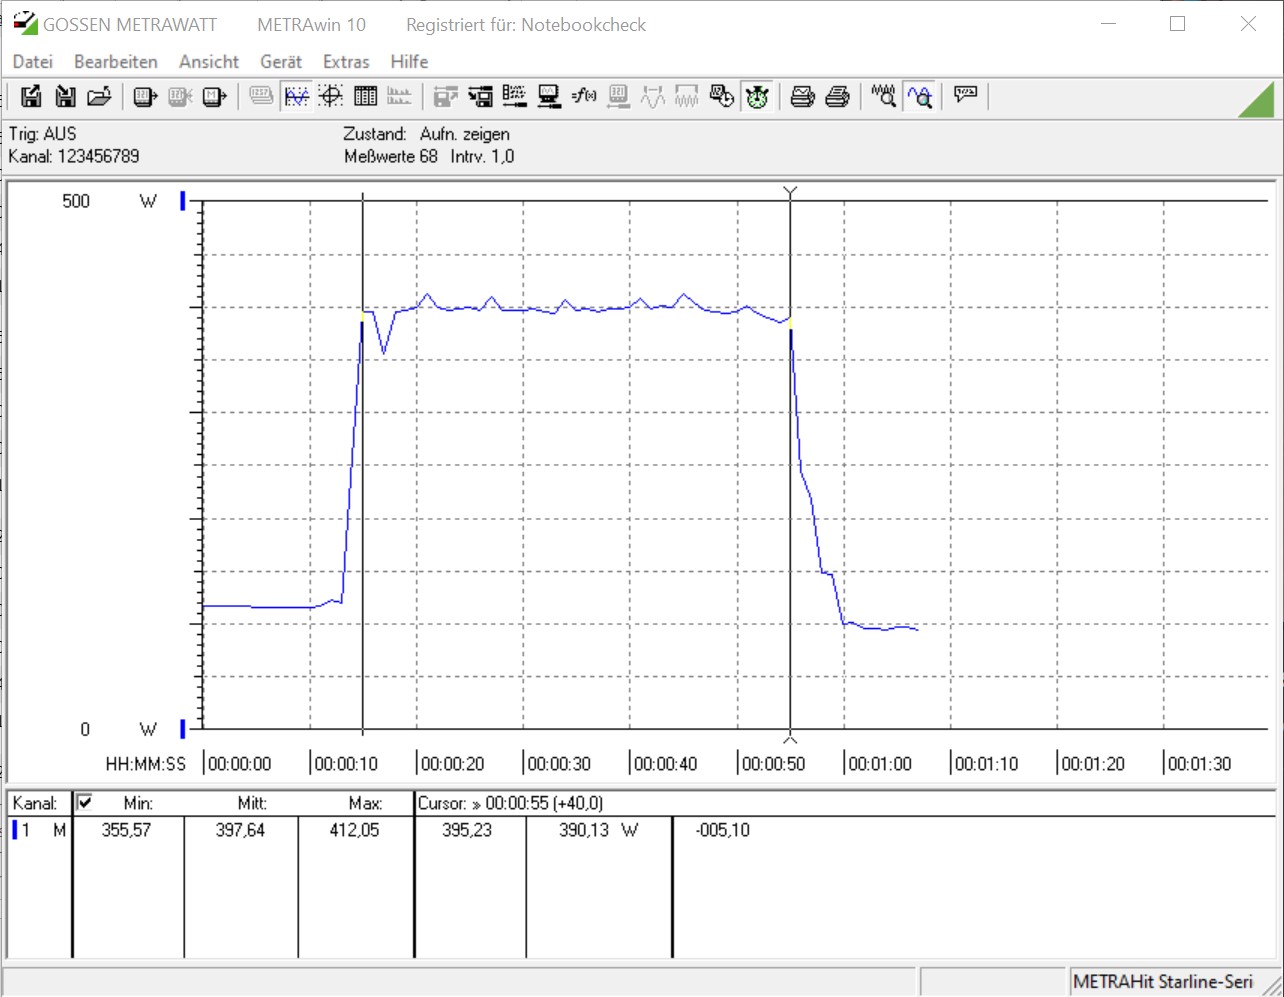
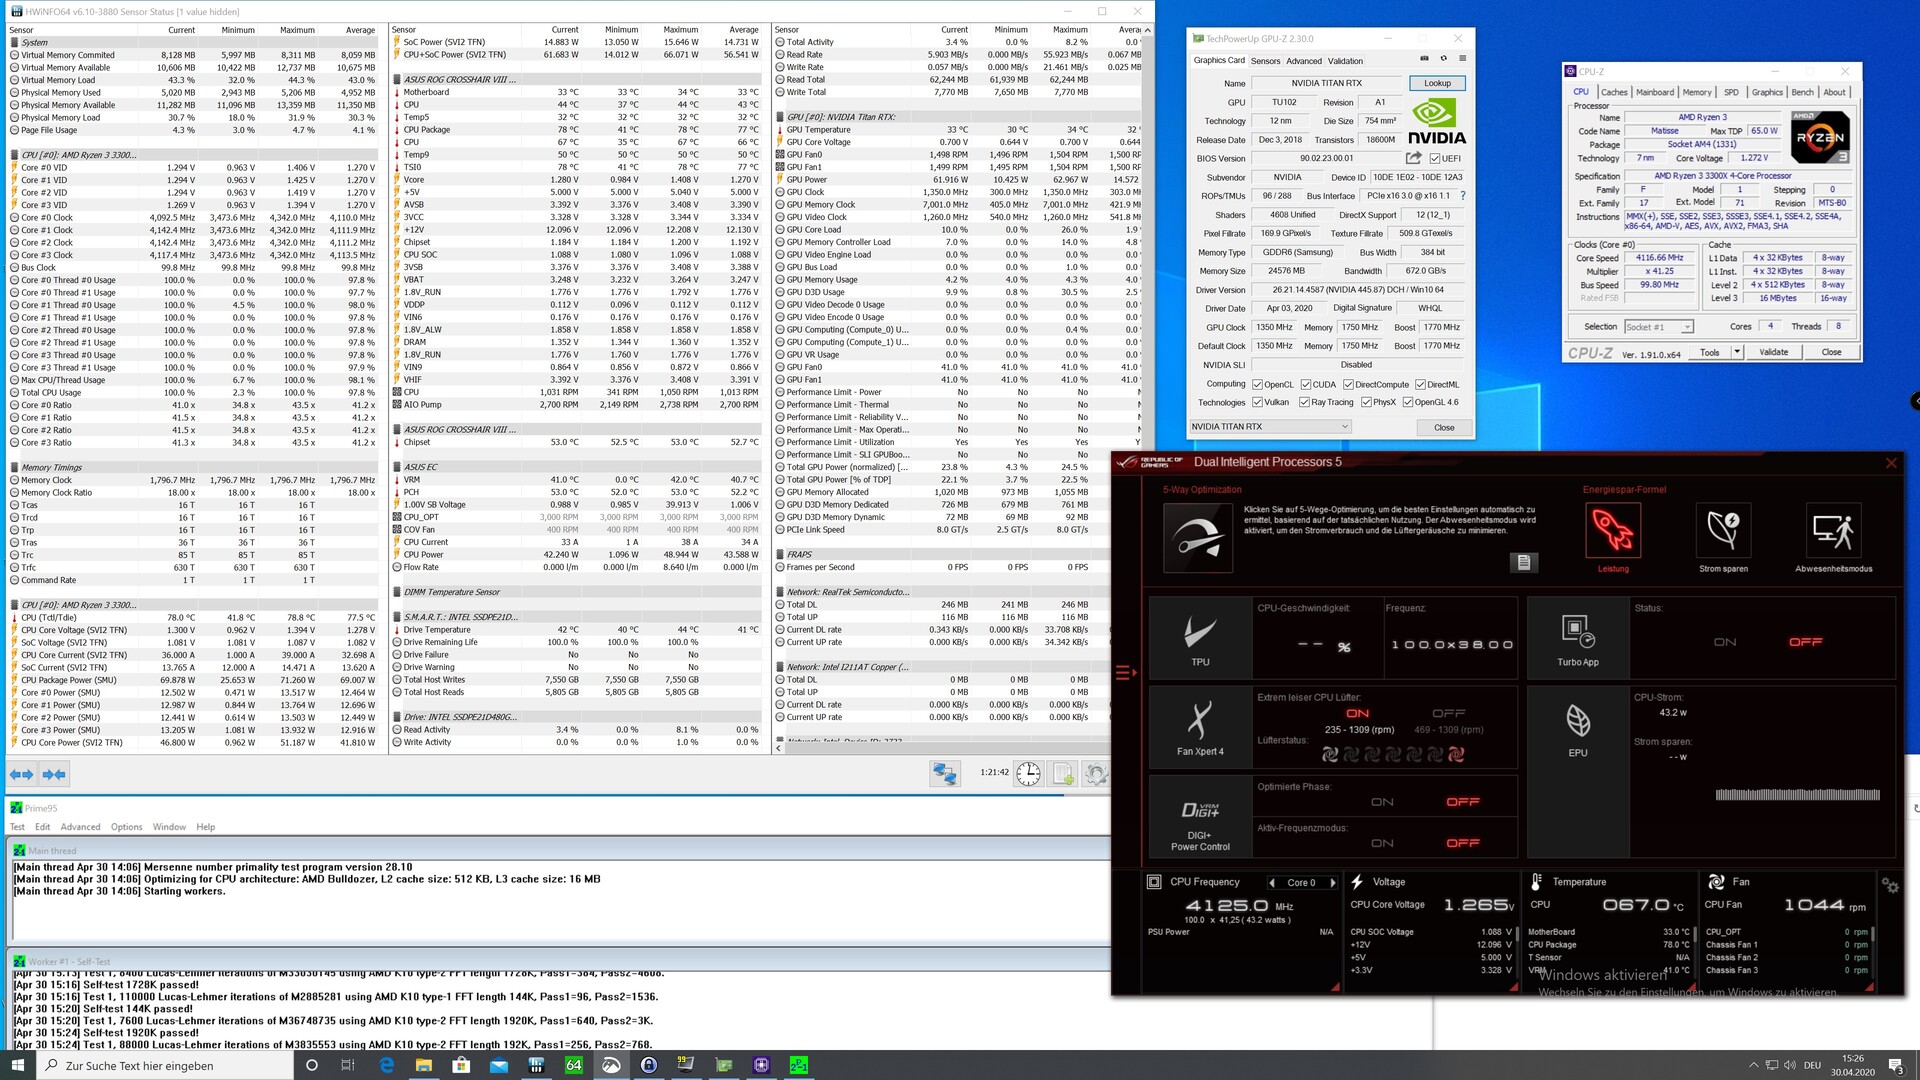
| Power Consumption | |
| 1920x1080 The Witcher 3 ultra (external Monitor) | |
| AMD Ryzen 5 1600 (12nm) (Idle: 85.9 W) | |
| AMD Ryzen 3 3300X (Idle: 88.8 W) | |
| AMD Ryzen 3 3100 (Idle: 86 W) | |
| Intel Core i5 9400F (Idle: 57 W) | |
| Intel Core i3 9100F (Idle: 56 W) | |
| Prime95 V2810 Stress (external Monitor) | |
| AMD Ryzen 5 1600 (12nm) (Idle: 85.9 W) | |
| AMD Ryzen 3 3300X (Idle: 88.8 W) | |
| Intel Core i3 9100F (Idle: 56 W) | |
| AMD Ryzen 3 3100 (Idle: 86 W) | |
| Intel Core i5 9400F (Idle: 57 W) | |
| Cinebench R15 Multi (external Monitor) | |
| AMD Ryzen 5 1600 (12nm) (Idle: 85.9 W) | |
| AMD Ryzen 3 3300X (Idle: 88.8 W) | |
| AMD Ryzen 3 3100 (Idle: 86 W) | |
| Intel Core i5 9400F (Idle: 57 W) | |
| Intel Core i3 9100F (Idle: 56 W) | |
| Temperatures - CPU Temperature Prime95 | |
| AMD Ryzen 3 3300X | |
| Intel Core i3 9100F | |
| AMD Ryzen 3 3100 | |
| AMD Ryzen 5 1600 (12nm) | |
| Intel Core i5 9400F | |
* ... kleiner is beter
| Performance rating - Percent | |
| AMD Ryzen 3 3300X @ 4.4 GHz | |
| AMD Ryzen 3 3300X | |
| AMD Ryzen 3 3100 @ 4.4 GHz | |
| AMD Ryzen 5 1600 (12nm) | |
| Intel Core i5 9400F | |
| AMD Ryzen 3 3100 | |
| Intel Core i3 9100F | |
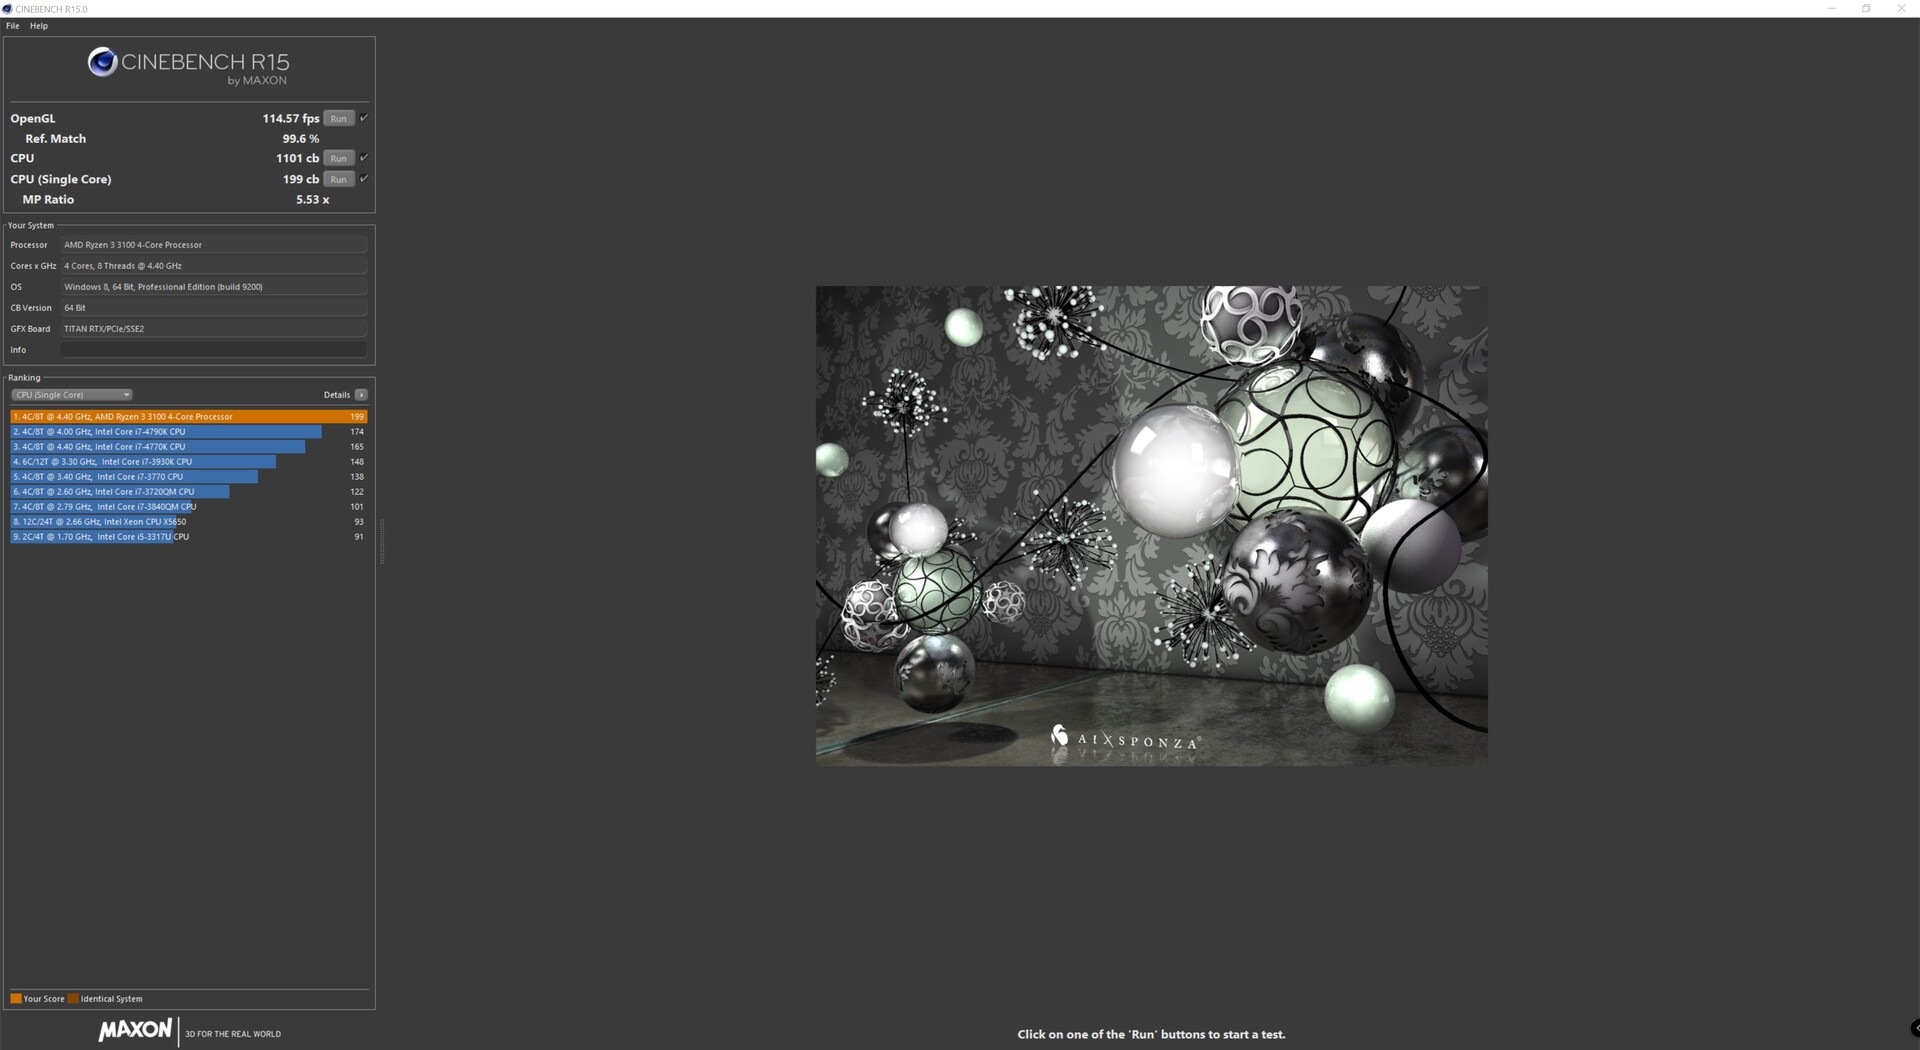
| Cinebench R15 | |
| CPU Single 64Bit | |
| AMD Ryzen 3 3300X @ 4.4 GHz | |
| AMD Ryzen 3 3100 @ 4.4 GHz | |
| AMD Ryzen 3 3300X | |
| AMD Ryzen 3 3100 | |
| Intel Core i5 9400F | |
| Intel Core i3 9100F | |
| AMD Ryzen 5 1600 (12nm) | |
| CPU Multi 64Bit | |
| AMD Ryzen 5 1600 (12nm) | |
| AMD Ryzen 3 3300X @ 4.4 GHz | |
| AMD Ryzen 3 3100 @ 4.4 GHz | |
| AMD Ryzen 3 3300X | |
| AMD Ryzen 3 3100 | |
| Intel Core i5 9400F | |
| Intel Core i3 9100F | |
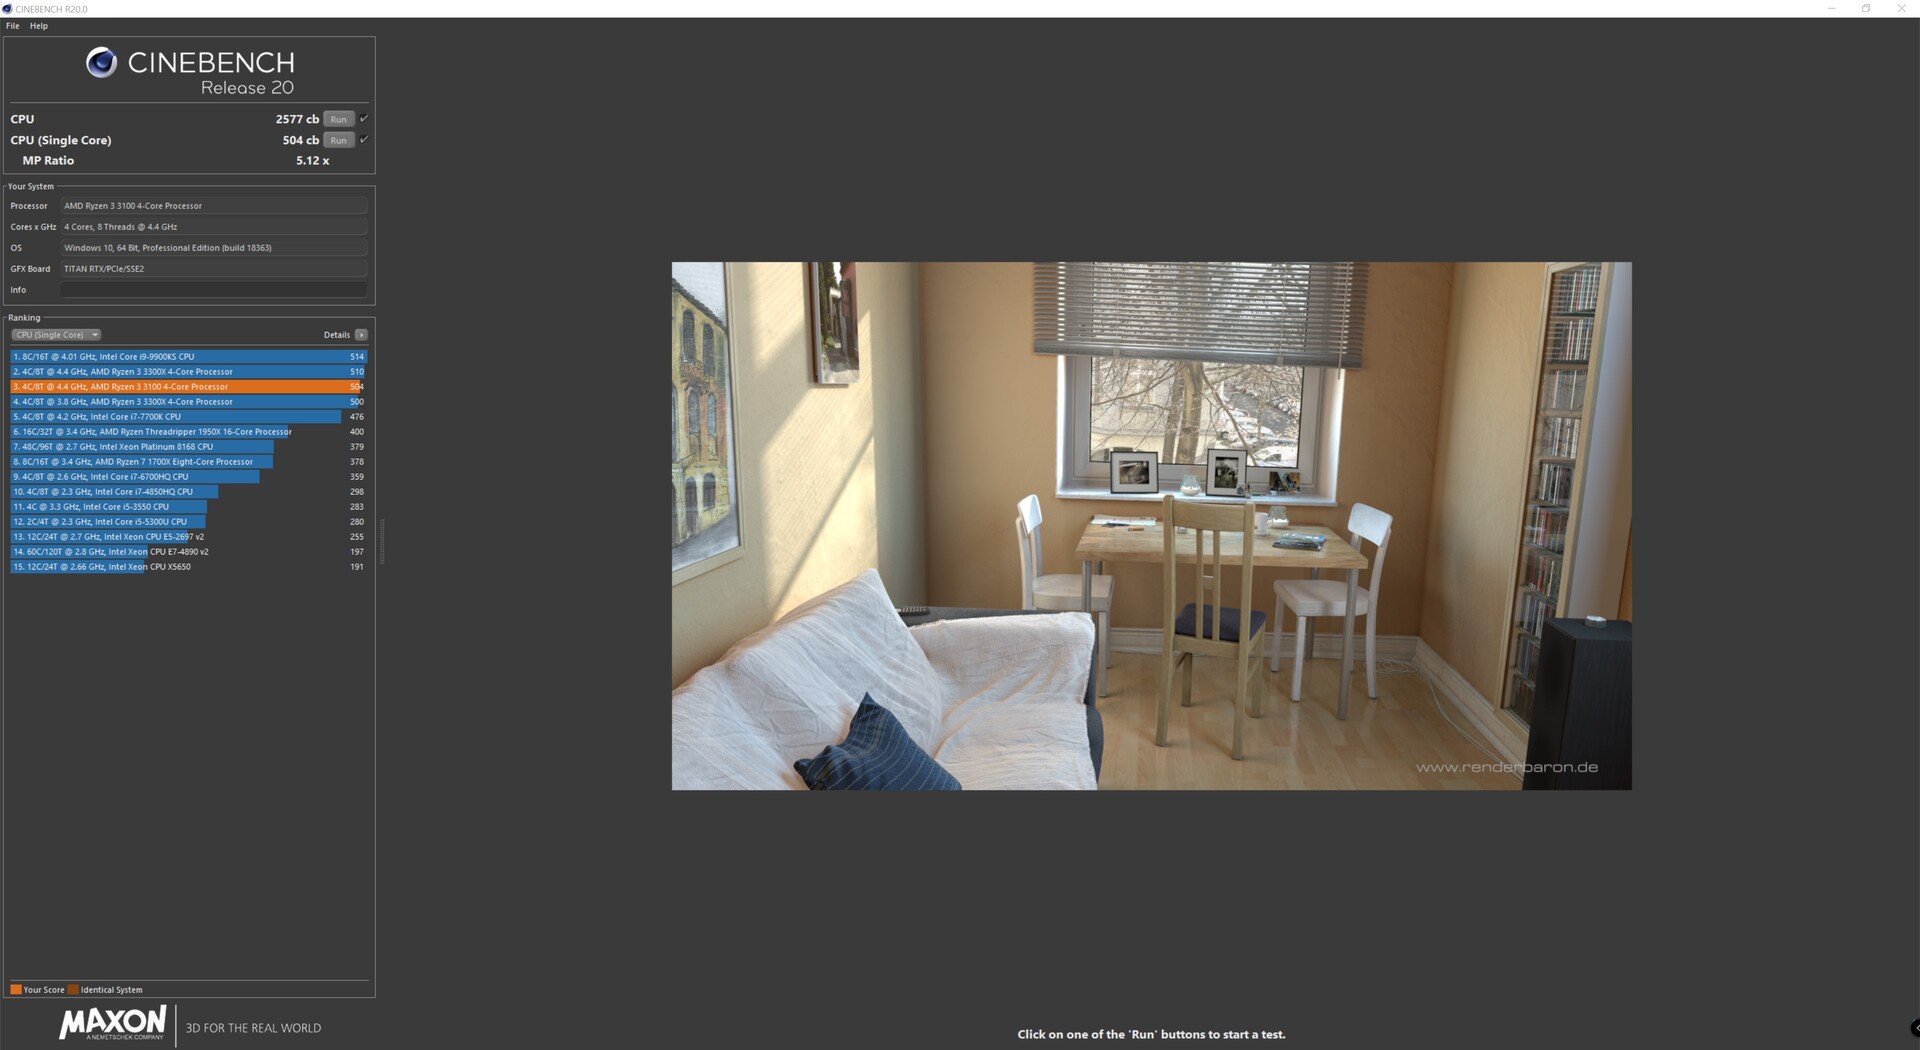
| Cinebench R20 | |
| CPU (Single Core) | |
| AMD Ryzen 3 3300X @ 4.4 GHz | |
| AMD Ryzen 3 3100 @ 4.4 GHz | |
| AMD Ryzen 3 3300X | |
| AMD Ryzen 3 3100 | |
| Intel Core i5 9400F | |
| Intel Core i3 9100F | |
| AMD Ryzen 5 1600 (12nm) | |
| CPU (Multi Core) | |
| AMD Ryzen 3 3300X @ 4.4 GHz | |
| AMD Ryzen 5 1600 (12nm) | |
| AMD Ryzen 3 3100 @ 4.4 GHz | |
| AMD Ryzen 3 3300X | |
| Intel Core i5 9400F | |
| AMD Ryzen 3 3100 | |
| Intel Core i3 9100F | |
| 3DMark 11 | |
| 1280x720 Performance | |
| AMD Ryzen 3 3300X @ 4.4 GHz | |
| AMD Ryzen 3 3300X | |
| AMD Ryzen 3 3100 @ 4.4 GHz | |
| Intel Core i5 9400F | |
| AMD Ryzen 5 1600 (12nm) | |
| AMD Ryzen 3 3100 | |
| Intel Core i3 9100F | |
| 1280x720 Performance GPU | |
| Intel Core i3 9100F | |
| Intel Core i5 9400F | |
| AMD Ryzen 3 3300X | |
| AMD Ryzen 3 3100 @ 4.4 GHz | |
| AMD Ryzen 3 3300X @ 4.4 GHz | |
| AMD Ryzen 5 1600 (12nm) | |
| AMD Ryzen 3 3100 | |
| 1280x720 Performance Physics | |
| AMD Ryzen 3 3300X @ 4.4 GHz | |
| AMD Ryzen 3 3300X | |
| AMD Ryzen 5 1600 (12nm) | |
| AMD Ryzen 3 3100 @ 4.4 GHz | |
| Intel Core i5 9400F | |
| AMD Ryzen 3 3100 | |
| Intel Core i3 9100F | |
| 3DMark | |
| 1920x1080 Fire Strike Score | |
| AMD Ryzen 3 3300X @ 4.4 GHz | |
| AMD Ryzen 3 3300X | |
| AMD Ryzen 3 3100 @ 4.4 GHz | |
| Intel Core i5 9400F | |
| AMD Ryzen 5 1600 (12nm) | |
| AMD Ryzen 3 3100 | |
| Intel Core i3 9100F | |
| 1920x1080 Fire Strike Graphics | |
| Intel Core i3 9100F | |
| Intel Core i5 9400F | |
| AMD Ryzen 3 3100 | |
| AMD Ryzen 3 3300X @ 4.4 GHz | |
| AMD Ryzen 3 3100 @ 4.4 GHz | |
| AMD Ryzen 3 3300X | |
| AMD Ryzen 5 1600 (12nm) | |
| 1920x1080 Fire Strike Physics | |
| AMD Ryzen 5 1600 (12nm) | |
| AMD Ryzen 3 3300X @ 4.4 GHz | |
| AMD Ryzen 3 3100 @ 4.4 GHz | |
| AMD Ryzen 3 3300X | |
| AMD Ryzen 3 3100 | |
| Intel Core i5 9400F | |
| Intel Core i3 9100F | |
Ryzen 3 3100 @ 4.4 GHz
Ryzen 3 3300X @ 4.4 GHz


Pro
Contra
Dit is de verkorte versie van het originele artikel. Het volledige, Engelse testrapport vind je hier.
Met de nieuwe Ryzen 3 laat AMD nogmaals zien wat mogelijk is met Zen2. In vergelijking met de vorige generatie op basis van Zen+, konden de prestaties nog aanzienlijk worden verbeterd. Daarnaast kwam Intel steeds meer onder druk te staan, maar dit kan er binnenkort weer anders uitzien omdat Comet Lake-S al in de startblokken staat. Om deze reden zou je bijna kunnen denken dat AMD de start van de nieuwe Ryzen 3-generatie een beetje heeft doorgeslapen, aangezien Zen2 al een tijdje op de markt is. AMD kan echter nog steeds vertrouwen op PCI Express 4.0 als een uniek verkoopargument, aangezien de 10e generatie van Intel dit nog niet ondersteunt. Dat Ryzen 3 nu ook is uitgerust met SMT is niet alleen prettig voor ons, maar wordt al heel lang gevraagd. Dit voegt een paar procentpunten toe in de prestatievergelijking, die AMD met zijn nieuwe processors vaak wint in vergelijking met Intel.
De budgetversie van de nieuwe Ryzen 3-processors blijkt een echte prijs-prestatiewinnaar vanwege de goede overklokmogelijkheden.
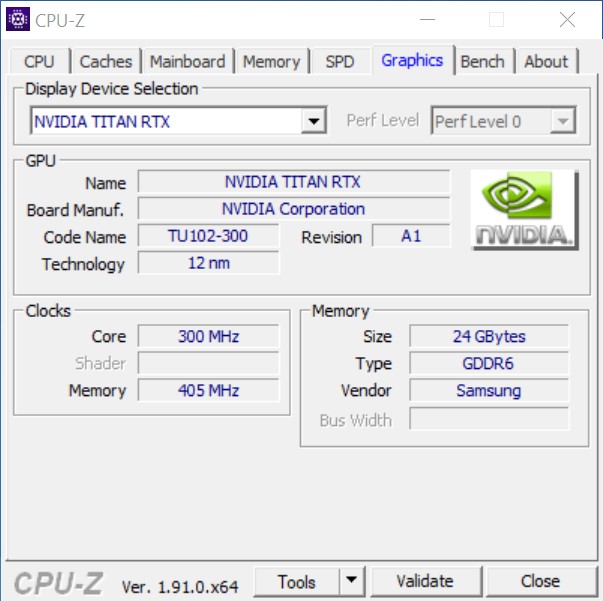
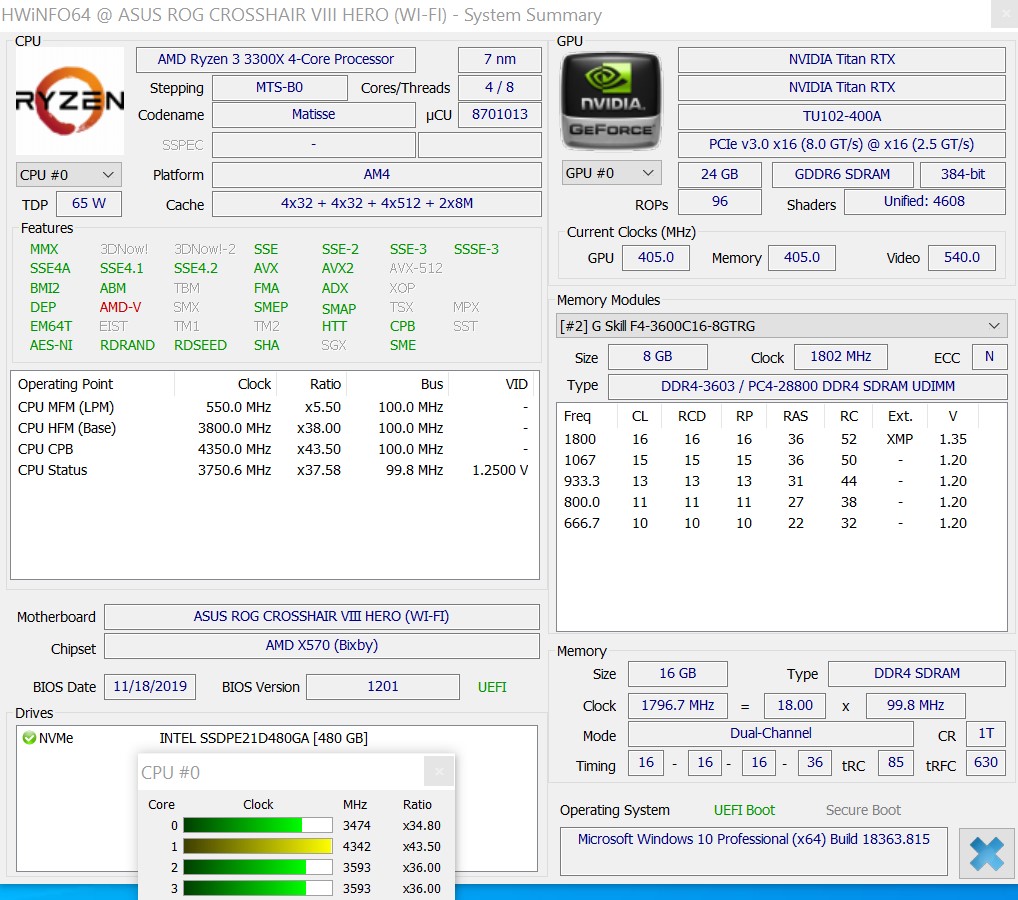
Beide Ryzen-modellen zijn snel op het vlak van pure prestaties, hoewel de zes cores van de Intel Core i5-9400F iets betere framesnelheden bieden in games. Beide modellen liggen dicht bij elkaar qua prijs en zijn aanzienlijk goedkoper dan de Intel Core i5-9400F. De AMD Ryzen 3 3100 start bij 109 euro en biedt degelijke prestaties om een snel systeem operationeel te krijgen. Omwille van de lagere basis- en turbokloksnelheden is de Ryzen 3 3100 een beetje trager dan de de Ryzen 3 3300X, waardoor de Ryzen 3 3300X aanzienlijk betere framesnelheden behaalde in games in combinatie met de Nvidia Titan RTX. Je moet slechts 20 euro meer betalen voor het snellere model, wat wij gerechtvaardigd vinden.
Beide modellen verdienen echter een aankoopadvies omdat ze zeer goede prestaties leveren voor betrekkelijk weinig geld. Daarnaast biedt de Ryzen 3 3100 prima overklokmogelijkheden, waardoor de performance van een Ryzen 3 3300X geëvenaard kan worden met een aantal slimme aanpassingen. Het overklokpotentieel van de Ryzen 3 3300X ligt aanzienlijk lager.
