Kort testrapport AMD Ryzen 7 3800XT Desktop CPU: Matisse vernieuwing van de AM4-aansluiting

| Cinebench R20 | |
| CPU (Single Core) | |
| AMD Ryzen 7 3800XT | |
| Intel Core i9-10900K | |
| AMD Ryzen 9 3950X | |
| AMD Ryzen 9 3900X | |
| Intel Core i9-9900KS | |
| AMD Ryzen 7 3700X | |
| AMD Ryzen 3 3300X | |
| Intel Core i7-9700K | |
| Intel Core i5-10600K | |
| CPU (Multi Core) | |
| AMD Ryzen 9 3950X | |
| AMD Ryzen 9 3900X | |
| Intel Core i9-10900K | |
| Intel Core i9-9900KS | |
| AMD Ryzen 7 3800XT | |
| AMD Ryzen 7 3700X | |
| Intel Core i5-10600K | |
| Intel Core i7-9700K | |
| AMD Ryzen 3 3300X | |
| Cinebench R15 | |
| CPU Single 64Bit | |
| Intel Core i9-10900K | |
| AMD Ryzen 7 3800XT | |
| Intel Core i9-9900KS | |
| Intel Core i9-9900K | |
| AMD Ryzen 9 3900X | |
| AMD Ryzen 9 3950X | |
| Intel Core i7-9700K | |
| Intel Core i5-10600K | |
| AMD Ryzen 7 3700X | |
| AMD Ryzen 3 3300X | |
| CPU Multi 64Bit | |
| AMD Ryzen 9 3950X | |
| AMD Ryzen 9 3900X | |
| Intel Core i9-10900K | |
| AMD Ryzen 7 3800XT | |
| Intel Core i9-9900KS | |
| AMD Ryzen 7 3700X | |
| Intel Core i9-9900K | |
| Intel Core i5-10600K | |
| Intel Core i7-9700K | |
| AMD Ryzen 3 3300X | |
| Cinebench R11.5 | |
| CPU Single 64Bit | |
| Intel Core i9-10900K | |
| Intel Core i9-9900KS | |
| Intel Core i9-9900K | |
| Intel Core i7-9700K | |
| AMD Ryzen 9 3950X | |
| AMD Ryzen 9 3900X | |
| AMD Ryzen 7 3800XT | |
| AMD Ryzen 7 3700X | |
| AMD Ryzen 3 3300X | |
| Intel Core i5-10600K | |
| CPU Multi 64Bit | |
| AMD Ryzen 9 3950X | |
| AMD Ryzen 9 3900X | |
| Intel Core i9-10900K | |
| AMD Ryzen 7 3800XT | |
| Intel Core i9-9900KS | |
| AMD Ryzen 7 3700X | |
| Intel Core i9-9900K | |
| Intel Core i7-9700K | |
| Intel Core i5-10600K | |
| AMD Ryzen 3 3300X | |
| Cinebench R10 | |
| Rendering Single CPUs 64Bit | |
| Intel Core i9-9900KS | |
| Intel Core i9-10900K | |
| AMD Ryzen 9 3950X | |
| AMD Ryzen 7 3800XT | |
| AMD Ryzen 9 3900X | |
| Intel Core i9-9900K | |
| AMD Ryzen 3 3300X | |
| AMD Ryzen 7 3700X | |
| Intel Core i7-9700K | |
| Intel Core i5-10600K | |
| Rendering Multiple CPUs 64Bit | |
| AMD Ryzen 9 3950X | |
| Intel Core i9-10900K | |
| AMD Ryzen 9 3900X | |
| Intel Core i9-9900KS | |
| AMD Ryzen 7 3800XT | |
| AMD Ryzen 7 3700X | |
| Intel Core i9-9900K | |
| Intel Core i7-9700K | |
| Intel Core i5-10600K | |
| AMD Ryzen 3 3300X | |
| Blender - v2.79 BMW27 CPU | |
| AMD Ryzen 3 3300X | |
| Intel Core i7-9700K | |
| Intel Core i5-10600K | |
| AMD Ryzen 7 3800XT | |
| Intel Core i9-9900K | |
| Intel Core i9-9900KS | |
| AMD Ryzen 7 3700X | |
| Intel Core i9-10900K | |
| AMD Ryzen 9 3900X | |
| AMD Ryzen 9 3950X | |
| wPrime 2.10 | |
| 32m | |
| AMD Ryzen 3 3300X | |
| Intel Core i9-9900K | |
| Intel Core i5-10600K | |
| Intel Core i7-9700K | |
| AMD Ryzen 9 3950X | |
| Intel Core i9-9900KS | |
| AMD Ryzen 7 3800XT | |
| AMD Ryzen 7 3700X | |
| Intel Core i9-10900K | |
| AMD Ryzen 9 3900X | |
| 1024m | |
| AMD Ryzen 3 3300X | |
| Intel Core i7-9700K | |
| Intel Core i5-10600K | |
| AMD Ryzen 7 3700X | |
| Intel Core i9-9900K | |
| Intel Core i9-9900KS | |
| AMD Ryzen 7 3800XT | |
| Intel Core i9-10900K | |
| AMD Ryzen 9 3900X | |
| AMD Ryzen 9 3950X | |
| X264 HD Benchmark 4.0 | |
| Pass 1 | |
| Intel Core i9-10900K | |
| Intel Core i9-9900KS | |
| AMD Ryzen 7 3800XT | |
| Intel Core i9-9900K | |
| Intel Core i7-9700K | |
| AMD Ryzen 7 3700X | |
| AMD Ryzen 9 3900X | |
| AMD Ryzen 9 3950X | |
| Intel Core i5-10600K | |
| AMD Ryzen 3 3300X | |
| Pass 2 | |
| AMD Ryzen 9 3950X | |
| Intel Core i9-10900K | |
| AMD Ryzen 9 3900X | |
| Intel Core i9-9900KS | |
| Intel Core i9-9900K | |
| AMD Ryzen 7 3800XT | |
| AMD Ryzen 7 3700X | |
| Intel Core i7-9700K | |
| Intel Core i5-10600K | |
| AMD Ryzen 3 3300X | |
| WinRAR - Result | |
| Intel Core i9-10900K | |
| Intel Core i9-9900KS | |
| Intel Core i9-9900K | |
| AMD Ryzen 9 3900X | |
| AMD Ryzen 7 3700X | |
| AMD Ryzen 7 3800XT | |
| AMD Ryzen 9 3950X | |
| Intel Core i7-9700K | |
| AMD Ryzen 3 3300X | |
| Intel Core i5-10600K | |
| TrueCrypt | |
| AES Mean 100MB | |
| Intel Core i9-10900K | |
| Intel Core i9-9900KS | |
| Intel Core i9-9900K | |
| AMD Ryzen 7 3700X | |
| AMD Ryzen 7 3800XT | |
| AMD Ryzen 9 3900X | |
| AMD Ryzen 9 3950X | |
| Intel Core i7-9700K | |
| Intel Core i5-10600K | |
| AMD Ryzen 3 3300X | |
| Twofish Mean 100MB | |
| AMD Ryzen 9 3950X | |
| AMD Ryzen 9 3900X | |
| Intel Core i9-10900K | |
| Intel Core i9-9900KS | |
| AMD Ryzen 7 3700X | |
| AMD Ryzen 7 3800XT | |
| Intel Core i9-9900K | |
| Intel Core i5-10600K | |
| Intel Core i7-9700K | |
| AMD Ryzen 3 3300X | |
| Serpent Mean 100MB | |
| AMD Ryzen 9 3950X | |
| AMD Ryzen 9 3900X | |
| Intel Core i9-10900K | |
| Intel Core i9-9900K | |
| Intel Core i9-9900KS | |
| AMD Ryzen 7 3800XT | |
| AMD Ryzen 7 3700X | |
| Intel Core i5-10600K | |
| Intel Core i7-9700K | |
| AMD Ryzen 3 3300X | |
| Geekbench 5.5 | |
| Multi-Core | |
| AMD Ryzen 9 3950X | |
| Intel Core i9-10900K | |
| AMD Ryzen 9 3900X | |
| AMD Ryzen 7 3700X | |
| AMD Ryzen 7 3800XT | |
| Intel Core i7-9700K | |
| Intel Core i5-10600K | |
| AMD Ryzen 3 3300X | |
| Single-Core | |
| Intel Core i9-10900K | |
| AMD Ryzen 7 3800XT | |
| AMD Ryzen 9 3950X | |
| AMD Ryzen 7 3700X | |
| Intel Core i7-9700K | |
| AMD Ryzen 3 3300X | |
| Intel Core i5-10600K | |
| AMD Ryzen 9 3900X | |
| Geekbench 5.0 | |
| 5.0 Multi-Core | |
| AMD Ryzen 9 3950X | |
| Intel Core i9-10900K | |
| AMD Ryzen 9 3900X | |
| AMD Ryzen 7 3800XT | |
| Intel Core i5-10600K | |
| AMD Ryzen 3 3300X | |
| 5.0 Single-Core | |
| Intel Core i9-10900K | |
| AMD Ryzen 7 3800XT | |
| AMD Ryzen 9 3950X | |
| AMD Ryzen 3 3300X | |
| Intel Core i5-10600K | |
| AMD Ryzen 9 3900X | |
| Geekbench 4.4 | |
| 64 Bit Single-Core Score | |
| Intel Core i9-10900K | |
| Intel Core i9-9900K | |
| Intel Core i9-9900KS | |
| Intel Core i7-9700K | |
| AMD Ryzen 9 3900X | |
| AMD Ryzen 7 3800XT | |
| Intel Core i5-10600K | |
| AMD Ryzen 7 3700X | |
| AMD Ryzen 3 3300X | |
| AMD Ryzen 9 3950X | |
| 64 Bit Multi-Core Score | |
| AMD Ryzen 9 3950X | |
| AMD Ryzen 9 3900X | |
| Intel Core i9-10900K | |
| Intel Core i9-9900KS | |
| AMD Ryzen 7 3800XT | |
| AMD Ryzen 7 3700X | |
| Intel Core i9-9900K | |
| Intel Core i7-9700K | |
| Intel Core i5-10600K | |
| AMD Ryzen 3 3300X | |
| 3DMark 11 - 1280x720 Performance Physics | |
| Intel Core i9-10900K | |
| AMD Ryzen 9 3950X | |
| AMD Ryzen 7 3800XT | |
| Intel Core i9-9900KS | |
| AMD Ryzen 9 3900X | |
| AMD Ryzen 7 3700X | |
| Intel Core i7-9700K | |
| Intel Core i5-10600K | |
| AMD Ryzen 3 3300X | |
| 7-Zip 18.03 | |
| 7z b 4 | |
| AMD Ryzen 9 3950X | |
| AMD Ryzen 9 3900X | |
| Intel Core i9-10900K | |
| AMD Ryzen 7 3800XT | |
| AMD Ryzen 7 3700X | |
| Intel Core i9-9900KS | |
| Intel Core i5-10600K | |
| AMD Ryzen 3 3300X | |
| 7z b 4 -mmt1 | |
| Intel Core i9-10900K | |
| Intel Core i9-9900KS | |
| AMD Ryzen 9 3900X | |
| AMD Ryzen 7 3800XT | |
| AMD Ryzen 9 3950X | |
| AMD Ryzen 7 3700X | |
| AMD Ryzen 3 3300X | |
| Intel Core i5-10600K | |
| HWBOT x265 Benchmark v2.2 - 4k Preset | |
| Intel Core i9-10900K | |
| AMD Ryzen 9 3900X | |
| Intel Core i9-9900KS | |
| Intel Core i9-9900K | |
| AMD Ryzen 7 3800XT | |
| AMD Ryzen 9 3950X | |
| AMD Ryzen 7 3700X | |
| Intel Core i7-9700K | |
| Intel Core i5-10600K | |
| AMD Ryzen 3 3300X | |
| R Benchmark 2.5 - Overall mean | |
| Intel Core i5-10600K | |
| AMD Ryzen 9 3900X | |
| AMD Ryzen 3 3300X | |
| Intel Core i9-10900K | |
| AMD Ryzen 9 3950X | |
| AMD Ryzen 7 3800XT | |
| LibreOffice - 20 Documents To PDF | |
| Intel Core i9-10900K | |
| AMD Ryzen 9 3900X | |
| AMD Ryzen 9 3950X | |
| AMD Ryzen 3 3300X | |
| Intel Core i5-10600K | |
| AMD Ryzen 7 3800XT | |
| WebXPRT 3 - Overall | |
| Intel Core i9-10900K | |
| AMD Ryzen 7 3800XT | |
| AMD Ryzen 9 3950X | |
| Intel Core i5-10600K | |
| AMD Ryzen 3 3300X | |
| Mozilla Kraken 1.1 - Total | |
| Intel Core i5-10600K | |
| AMD Ryzen 3 3300X | |
| Intel Core i9-10900K | |
| AMD Ryzen 9 3950X | |
| AMD Ryzen 7 3800XT | |
| 3DMark | |
| 3840x2160 Fire Strike Ultra Physics | |
| AMD Ryzen 9 3950X | |
| Intel Core i9-10900K | |
| AMD Ryzen 9 3900X | |
| Intel Core i9-9900KS | |
| AMD Ryzen 7 3800XT | |
| Intel Core i9-9900K | |
| AMD Ryzen 7 3700X | |
| Intel Core i5-10600K | |
| Intel Core i7-9700K | |
| AMD Ryzen 3 3300X | |
| 1920x1080 Fire Strike Physics | |
| AMD Ryzen 9 3950X | |
| Intel Core i9-10900K | |
| AMD Ryzen 9 3900X | |
| Intel Core i9-9900KS | |
| AMD Ryzen 7 3800XT | |
| Intel Core i9-9900K | |
| AMD Ryzen 7 3700X | |
| Intel Core i5-10600K | |
| Intel Core i7-9700K | |
| AMD Ryzen 3 3300X | |
| 2560x1440 Time Spy CPU | |
| Intel Core i9-10900K | |
| AMD Ryzen 9 3950X | |
| AMD Ryzen 9 3900X | |
| Intel Core i9-9900KS | |
| Intel Core i9-9900K | |
| AMD Ryzen 7 3800XT | |
| AMD Ryzen 7 3700X | |
| Intel Core i7-9700K | |
| Intel Core i5-10600K | |
| AMD Ryzen 3 3300X | |
* ... kleiner is beter
| PCMark 10 - Score | |
| Intel Core i9-9900KS | |
| AMD Ryzen 9 3950X | |
| AMD Ryzen 7 3800XT | |
| Intel Core i9-10900K | |
| AMD Ryzen 9 3900X | |
| Intel Core i5-10600K | |
| AMD Ryzen 7 3700X | |
| Intel Core i9-9900K | |
| AMD Ryzen 3 3300X | |
| Intel Core i7-9700K | |
| PCMark 8 | |
| Work Score Accelerated v2 | |
| Intel Core i9-9900K | |
| AMD Ryzen 9 3950X | |
| AMD Ryzen 7 3800XT | |
| Intel Core i9-9900KS | |
| AMD Ryzen 7 3700X | |
| AMD Ryzen 3 3300X | |
| AMD Ryzen 9 3900X | |
| Intel Core i7-9700K | |
| Intel Core i5-10600K | |
| Intel Core i9-10900K | |
| Creative Score Accelerated v2 | |
| Intel Core i9-9900KS | |
| AMD Ryzen 7 3800XT | |
| AMD Ryzen 9 3950X | |
| Intel Core i5-10600K | |
| AMD Ryzen 3 3300X | |
| Intel Core i9-10900K | |
| AMD Ryzen 7 3700X | |
| Intel Core i9-9900K | |
| AMD Ryzen 9 3900X | |
| Intel Core i7-9700K | |
| Home Score Accelerated v2 | |
| Intel Core i9-9900KS | |
| Intel Core i9-9900K | |
| AMD Ryzen 7 3800XT | |
| AMD Ryzen 3 3300X | |
| AMD Ryzen 9 3950X | |
| Intel Core i5-10600K | |
| Intel Core i9-10900K | |
| AMD Ryzen 9 3900X | |
| Intel Core i7-9700K | |
| AMD Ryzen 7 3700X | |
| 3DMark 11 | |
| 1280x720 Performance | |
| Intel Core i9-10900K | |
| Intel Core i9-9900KS | |
| AMD Ryzen 7 3800XT | |
| AMD Ryzen 9 3950X | |
| Intel Core i5-10600K | |
| AMD Ryzen 3 3300X | |
| AMD Ryzen 7 3700X | |
| AMD Ryzen 9 3900X | |
| Intel Core i7-9700K | |
| 1280x720 Performance GPU | |
| Intel Core i9-10900K | |
| Intel Core i9-9900KS | |
| Intel Core i5-10600K | |
| AMD Ryzen 7 3800XT | |
| AMD Ryzen 3 3300X | |
| AMD Ryzen 9 3950X | |
| AMD Ryzen 7 3700X | |
| AMD Ryzen 9 3900X | |
| Intel Core i7-9700K | |
| Borderlands 3 | |
| 1280x720 Very Low Overall Quality (DX11) | |
| Intel Core i9-10900K | |
| Intel Core i5-10600K | |
| Intel Core i9-9900KS, Nvidia Titan RTX | |
| AMD Ryzen 9 3900X | |
| AMD Ryzen 9 3950X | |
| AMD Ryzen 7 3800XT | |
| AMD Ryzen 3 3300X | |
| AMD Radeon RX Vega 64 | |
| AMD Ryzen 3 3100 | |
| 1920x1080 Badass Overall Quality (DX11) | |
| Intel Core i9-10900K | |
| AMD Ryzen 7 3800XT | |
| Intel Core i5-10600K | |
| Intel Core i9-9900KS, Nvidia Titan RTX | |
| AMD Ryzen 9 3900X | |
| AMD Ryzen 9 3950X | |
| AMD Ryzen 3 3300X | |
| AMD Ryzen 3 3100 | |
| AMD Radeon RX Vega 64 | |
| Metro Exodus | |
| 1280x720 Low Quality AF:4x | |
| Intel Core i9-10900K | |
| Intel Core i5-10600K | |
| Intel Core i9-9900KS, Nvidia Titan RTX | |
| AMD Ryzen 7 3800XT | |
| AMD Ryzen 9 3900X | |
| AMD Ryzen 3 3300X | |
| AMD Ryzen 9 3950X | |
| AMD Ryzen 3 3100 | |
| 1920x1080 Ultra Quality AF:16x | |
| Intel Core i9-10900K | |
| Intel Core i5-10600K | |
| Intel Core i9-9900KS, Nvidia Titan RTX | |
| AMD Ryzen 3 3300X | |
| AMD Ryzen 7 3800XT | |
| AMD Ryzen 9 3900X | |
| AMD Ryzen 9 3950X | |
| AMD Ryzen 3 3100 | |
| Far Cry New Dawn | |
| 1280x720 Low Preset | |
| Intel Core i9-10900K | |
| Intel Core i9-9900KS, Nvidia Titan RTX | |
| Intel Core i5-10600K | |
| AMD Ryzen 9 3900X | |
| AMD Ryzen 7 3800XT | |
| AMD Radeon RX Vega 64 | |
| AMD Radeon RX Vega 64 | |
| AMD Ryzen 9 3950X | |
| AMD Ryzen 3 3300X | |
| AMD Ryzen 3 3100 | |
| 1920x1080 Ultra Preset | |
| Intel Core i9-9900KS, Nvidia Titan RTX | |
| Intel Core i5-10600K | |
| AMD Ryzen 7 3800XT | |
| Intel Core i9-10900K | |
| AMD Radeon RX Vega 64 | |
| AMD Ryzen 9 3950X | |
| AMD Ryzen 9 3900X | |
| AMD Radeon RX Vega 64 | |
| AMD Ryzen 3 3300X | |
| AMD Ryzen 3 3100 | |
| Forza Horizon 4 | |
| 1280x720 Very Low Preset | |
| Intel Core i7-9700K, AMD Radeon RX Vega 64 | |
| Intel Core i9-9900K, AMD Radeon RX Vega 64 | |
| Intel Core i9-10900K | |
| AMD Radeon RX Vega 64 | |
| Intel Core i9-9900KS, Nvidia Titan RTX | |
| AMD Radeon RX Vega 64 | |
| Intel Core i5-10600K | |
| AMD Ryzen 7 3800XT | |
| AMD Ryzen 9 3950X | |
| AMD Ryzen 3 3300X | |
| AMD Ryzen 9 3900X | |
| AMD Ryzen 3 3100 | |
| 1920x1080 Ultra Preset AA:2xMS | |
| Intel Core i9-10900K | |
| Intel Core i5-10600K | |
| Intel Core i9-9900KS, Nvidia Titan RTX | |
| AMD Ryzen 9 3950X | |
| AMD Ryzen 7 3800XT | |
| AMD Ryzen 3 3300X | |
| AMD Ryzen 9 3900X | |
| AMD Ryzen 3 3100 | |
| Intel Core i9-9900K, AMD Radeon RX Vega 64 | |
| Intel Core i7-9700K, AMD Radeon RX Vega 64 | |
| AMD Radeon RX Vega 64 | |
| AMD Radeon RX Vega 64 | |
| Far Cry 5 | |
| 1280x720 Low Preset AA:T | |
| Intel Core i9-10900K | |
| Intel Core i9-9900KS, Nvidia Titan RTX | |
| Intel Core i9-9900K, AMD Radeon RX Vega 64 | |
| Intel Core i5-10600K | |
| Intel Core i7-9700K, AMD Radeon RX Vega 64 | |
| AMD Ryzen 9 3900X | |
| AMD Ryzen 7 3800XT | |
| AMD Ryzen 9 3950X | |
| AMD Radeon RX Vega 64 | |
| AMD Ryzen 3 3300X | |
| AMD Radeon RX Vega 64 | |
| AMD Ryzen 3 3100 | |
| 1920x1080 Ultra Preset AA:T | |
| Intel Core i9-10900K | |
| Intel Core i9-9900KS, Nvidia Titan RTX | |
| Intel Core i5-10600K | |
| AMD Ryzen 9 3900X | |
| Intel Core i9-9900K, AMD Radeon RX Vega 64 | |
| AMD Ryzen 7 3800XT | |
| AMD Ryzen 9 3950X | |
| AMD Ryzen 3 3300X | |
| AMD Radeon RX Vega 64 | |
| AMD Radeon RX Vega 64 | |
| Intel Core i7-9700K, AMD Radeon RX Vega 64 | |
| AMD Ryzen 3 3100 | |
| X-Plane 11.11 | |
| 1280x720 low (fps_test=1) | |
| Intel Core i9-10900K | |
| Intel Core i9-9900KS, Nvidia Titan RTX | |
| Intel Core i5-10600K | |
| AMD Ryzen 7 3800XT | |
| AMD Ryzen 9 3900X | |
| AMD Ryzen 9 3950X | |
| AMD Ryzen 3 3300X | |
| AMD Ryzen 3 3100 | |
| AMD Radeon RX Vega 64 | |
| AMD Radeon RX Vega 64 | |
| 1920x1080 high (fps_test=3) | |
| Intel Core i9-9900KS, Nvidia Titan RTX | |
| Intel Core i9-10900K | |
| Intel Core i5-10600K | |
| AMD Ryzen 7 3800XT | |
| AMD Ryzen 9 3900X | |
| AMD Ryzen 9 3950X | |
| AMD Ryzen 3 3300X | |
| AMD Ryzen 3 3100 | |
| AMD Radeon RX Vega 64 | |
| AMD Radeon RX Vega 64 | |
| Final Fantasy XV Benchmark | |
| 1280x720 Lite Quality | |
| Intel Core i9-10900K | |
| Intel Core i9-9900KS, Nvidia Titan RTX | |
| Intel Core i5-10600K | |
| AMD Ryzen 7 3800XT | |
| AMD Ryzen 9 3950X | |
| AMD Ryzen 9 3900X | |
| AMD Ryzen 3 3300X | |
| Intel Core i9-9900K, AMD Radeon RX Vega 64 | |
| Intel Core i7-9700K, AMD Radeon RX Vega 64 | |
| AMD Ryzen 3 3100 | |
| 1920x1080 High Quality | |
| Intel Core i9-10900K | |
| Intel Core i5-10600K | |
| Intel Core i9-9900KS, Nvidia Titan RTX | |
| AMD Ryzen 9 3950X | |
| AMD Ryzen 9 3900X | |
| AMD Ryzen 7 3800XT | |
| AMD Ryzen 3 3300X | |
| AMD Ryzen 3 3100 | |
| Intel Core i9-9900K, AMD Radeon RX Vega 64 | |
| Intel Core i7-9700K, AMD Radeon RX Vega 64 | |
| Dota 2 Reborn | |
| 1280x720 min (0/3) fastest | |
| Intel Core i9-10900K | |
| Intel Core i9-9900KS, Nvidia Titan RTX | |
| Intel Core i5-10600K | |
| AMD Ryzen 7 3800XT | |
| AMD Radeon RX Vega 64 | |
| AMD Ryzen 9 3900X | |
| AMD Radeon RX Vega 64 | |
| AMD Ryzen 9 3950X | |
| AMD Ryzen 3 3300X | |
| AMD Ryzen 3 3100 | |
| 1920x1080 ultra (3/3) best looking | |
| Intel Core i9-10900K | |
| Intel Core i9-9900KS, Nvidia Titan RTX | |
| Intel Core i5-10600K | |
| AMD Radeon RX Vega 64 | |
| AMD Ryzen 7 3800XT | |
| AMD Ryzen 9 3900X | |
| AMD Radeon RX Vega 64 | |
| AMD Ryzen 9 3950X | |
| AMD Ryzen 3 3300X | |
| AMD Ryzen 3 3100 | |
| The Witcher 3 | |
| 1024x768 Low Graphics & Postprocessing | |
| Intel Core i9-10900K | |
| Intel Core i9-9900KS, Nvidia Titan RTX | |
| Intel Core i5-10600K | |
| AMD Ryzen 9 3900X | |
| AMD Ryzen 7 3800XT | |
| AMD Ryzen 9 3950X | |
| Intel Core i9-9900K, AMD Radeon RX Vega 64 | |
| Intel Core i7-9700K, AMD Radeon RX Vega 64 | |
| AMD Ryzen 3 3300X | |
| AMD Radeon RX Vega 64 | |
| AMD Radeon RX Vega 64 | |
| AMD Ryzen 3 3100 | |
| 1920x1080 Ultra Graphics & Postprocessing (HBAO+) | |
| Intel Core i5-10600K | |
| Intel Core i9-10900K | |
| AMD Ryzen 7 3800XT | |
| AMD Ryzen 9 3900X | |
| Intel Core i9-9900KS, Nvidia Titan RTX | |
| AMD Ryzen 9 3950X | |
| AMD Ryzen 3 3300X | |
| AMD Ryzen 3 3100 | |
| Intel Core i9-9900K, AMD Radeon RX Vega 64 | |
| Intel Core i7-9700K, AMD Radeon RX Vega 64 | |
| AMD Radeon RX Vega 64 | |
| AMD Radeon RX Vega 64 | |
| Shadow of the Tomb Raider | |
| 1280x720 Lowest Preset | |
| Intel Core i7-9700K, AMD Radeon RX Vega 64 | |
| Intel Core i9-9900K, AMD Radeon RX Vega 64 | |
| Intel Core i9-10900K | |
| Intel Core i5-10600K | |
| AMD Radeon RX Vega 64 | |
| AMD Ryzen 9 3950X | |
| AMD Ryzen 7 3800XT | |
| AMD Radeon RX Vega 64 | |
| AMD Ryzen 9 3900X | |
| AMD Ryzen 3 3300X | |
| AMD Ryzen 3 3100 | |
| 1920x1080 Highest Preset AA:T | |
| Intel Core i9-10900K | |
| Intel Core i5-10600K | |
| AMD Ryzen 7 3800XT | |
| AMD Ryzen 9 3950X | |
| AMD Ryzen 3 3300X | |
| AMD Ryzen 9 3900X | |
| AMD Ryzen 3 3100 | |
| Intel Core i9-9900K, AMD Radeon RX Vega 64 | |
| Intel Core i7-9700K, AMD Radeon RX Vega 64 | |
| AMD Radeon RX Vega 64 | |
| AMD Radeon RX Vega 64 | |
Intel Core i9-10900K + Nvidia Titan RTX
| lage | gem. | hoge | ultra | QHD | 4K | |
|---|---|---|---|---|---|---|
| The Witcher 3 (2015) | 388 | 348 | 252 | 139 | 103 | |
| Dota 2 Reborn (2015) | 169.8 | 151.6 | 151.2 | 139.7 | 138.1 | |
| Final Fantasy XV Benchmark (2018) | 189 | 161 | 118 | 59.3 | ||
| X-Plane 11.11 (2018) | 131 | 118 | 96 | 82.8 | ||
| Far Cry 5 (2018) | 148 | 129 | 122 | 115 | 110 | 78 |
| Shadow of the Tomb Raider (2018) | 154 | 145 | 142 | 138 | 118 | 66.8 |
| Forza Horizon 4 (2018) | 210 | 185 | 184 | 173 | 157 | 112 |
| Far Cry New Dawn (2019) | 132 | 115 | 111 | 101 | 97 | 76 |
| Metro Exodus (2019) | 169 | 142 | 121 | 99.3 | 80.2 | 52.3 |
| Borderlands 3 (2019) | 151 | 138 | 124 | 116 | 93.1 | 52.8 |
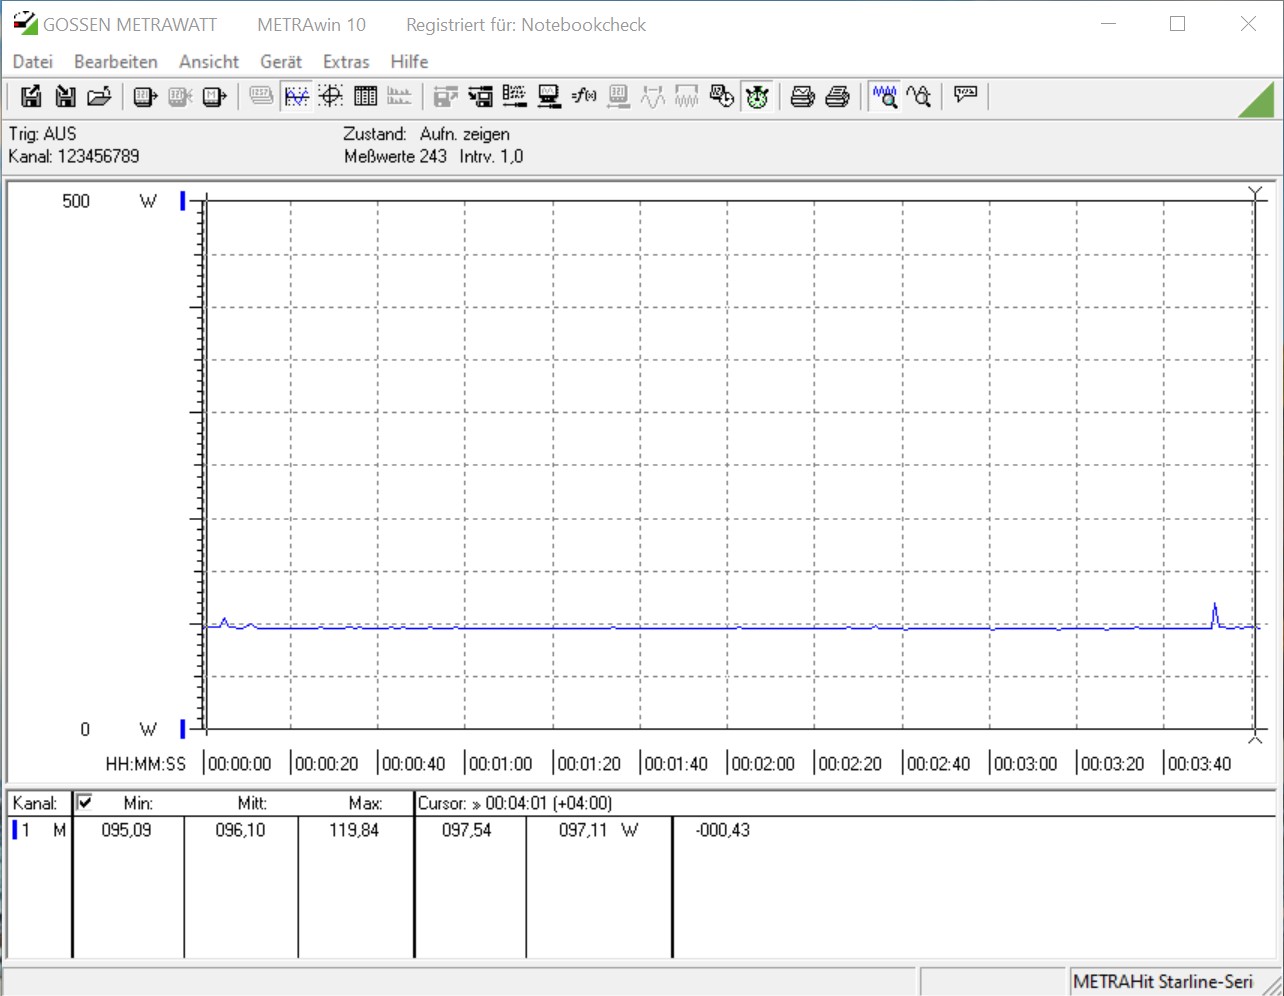
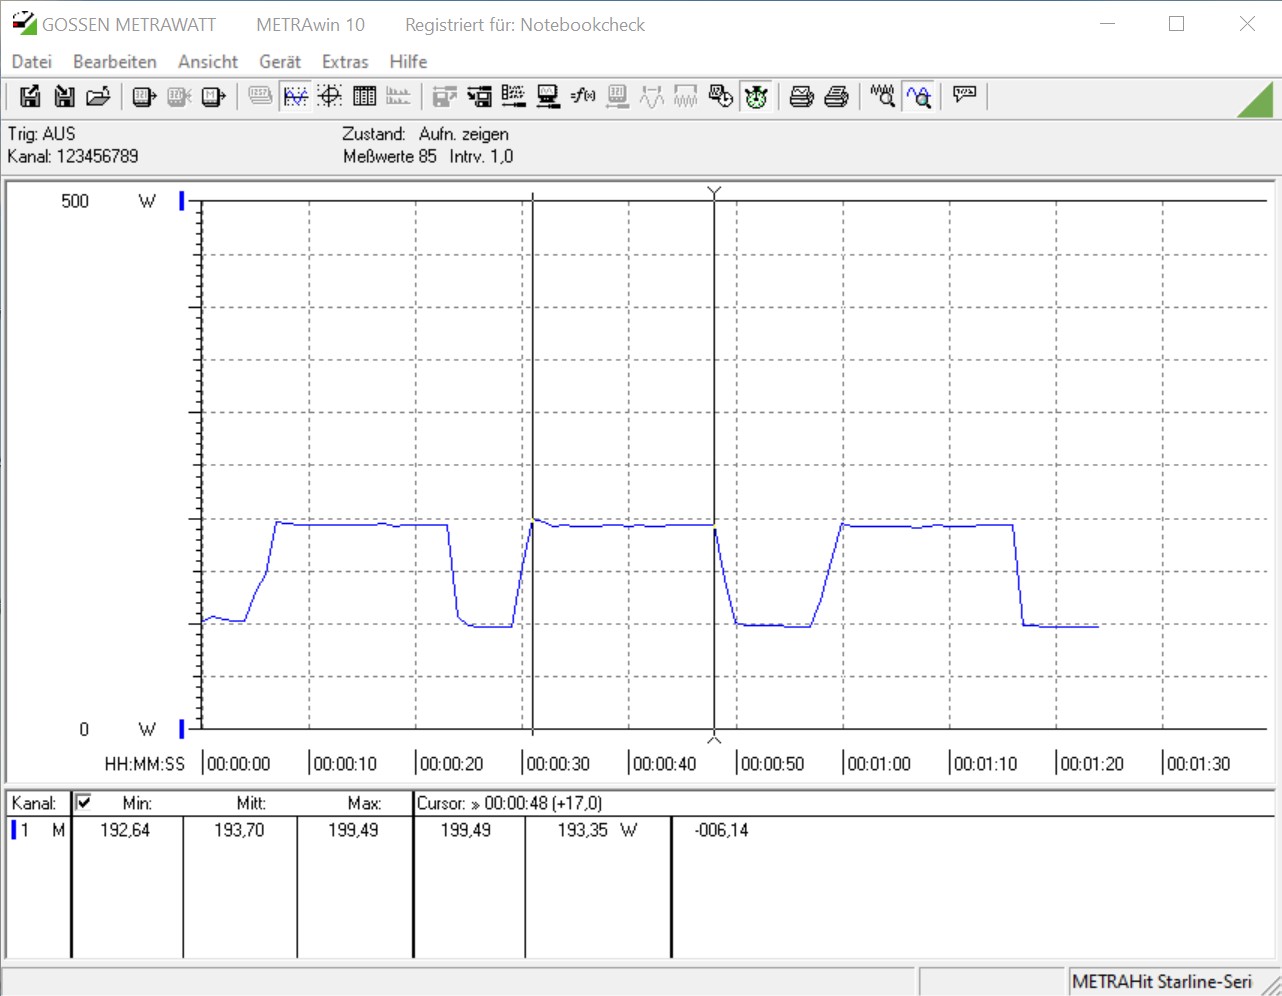
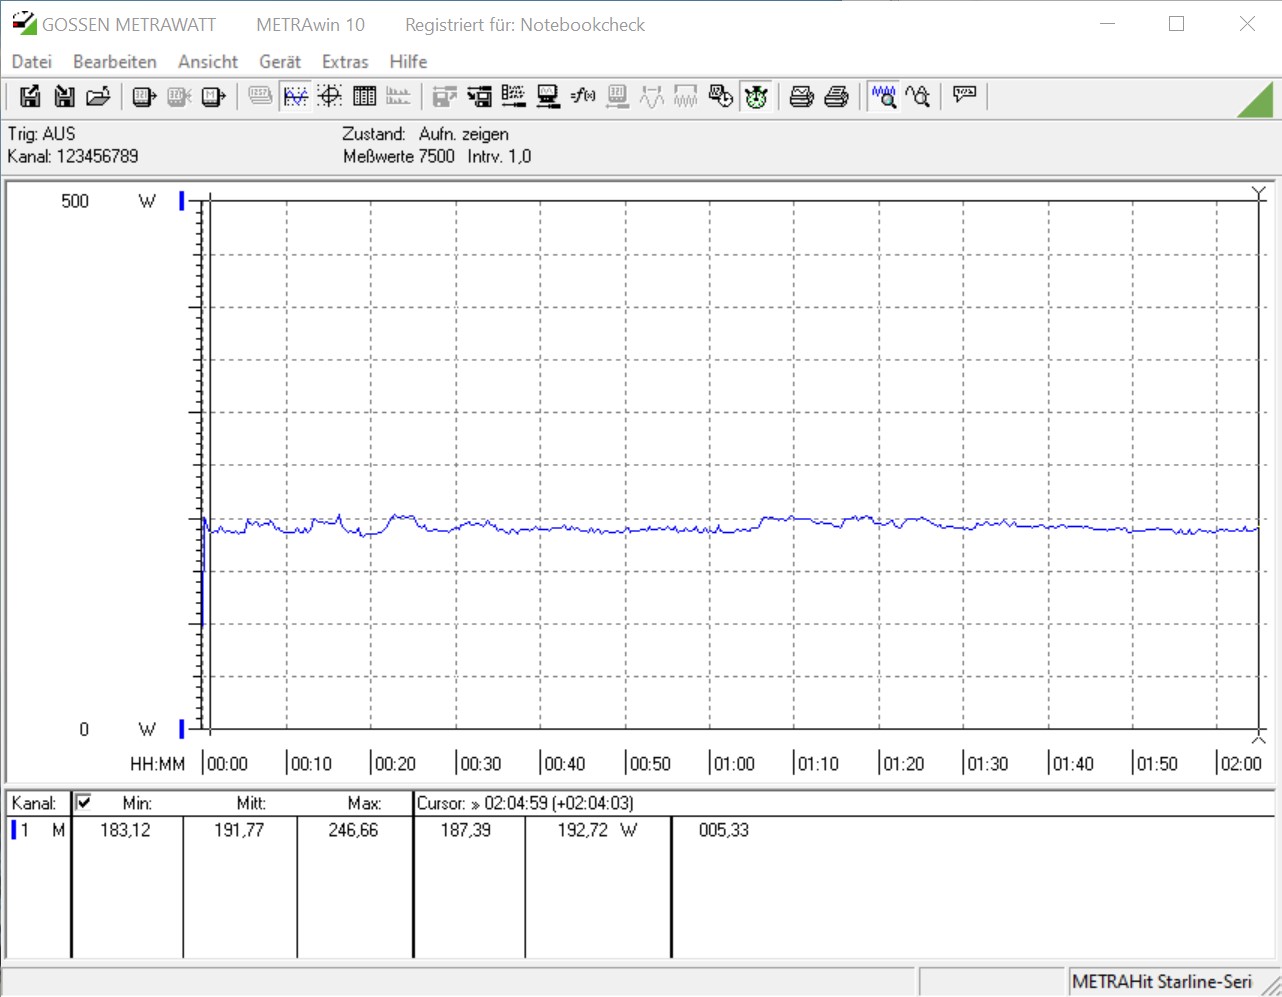
| Power Consumption | |
| 1920x1080 The Witcher 3 ultra (external Monitor) | |
| AMD Ryzen 9 3950X, NVIDIA Titan RTX (Idle: 95 W) | |
| AMD Ryzen 9 3900X, NVIDIA Titan RTX (Idle: 87.4 W) | |
| AMD Ryzen 7 3800XT, NVIDIA Titan RTX (Idle: 96.1 W) | |
| AMD Ryzen 3 3300X, NVIDIA Titan RTX (Idle: 88.8 W) | |
| Intel Core i9-10900K, NVIDIA Titan RTX (Idle: 52.3 W) | |
| Intel Core i9-9900KS, NVIDIA Titan RTX (Idle: 48.6 W) | |
| Intel Core i5-10600K, NVIDIA Titan RTX (Idle: 52.2 W) | |
| AMD Ryzen 3 3100, NVIDIA Titan RTX (Idle: 86 W) | |
| Prime95 V2810 Stress (external Monitor) | |
| Intel Core i9-10900K, NVIDIA Titan RTX (Idle: 52.3 W) | |
| Intel Core i9-9900KS, NVIDIA Titan RTX (Idle: 48.6 W) | |
| Intel Core i5-10600K, NVIDIA Titan RTX (Idle: 52.2 W) | |
| AMD Ryzen 9 3950X, NVIDIA Titan RTX (Idle: 95 W) | |
| AMD Ryzen 9 3900X, NVIDIA Titan RTX (Idle: 87.4 W) | |
| AMD Ryzen 7 3800XT, NVIDIA Titan RTX (Idle: 96.1 W) | |
| AMD Ryzen 3 3300X, NVIDIA Titan RTX (Idle: 88.8 W) | |
| AMD Ryzen 3 3100, NVIDIA Titan RTX (Idle: 86 W) | |
| Cinebench R15 Multi (external Monitor) | |
| Intel Core i9-9900KS, NVIDIA Titan RTX (Idle: 48.6 W) | |
| Intel Core i9-10900K, NVIDIA Titan RTX (Idle: 52.3 W) | |
| AMD Ryzen 9 3950X, NVIDIA Titan RTX (Idle: 95 W) | |
| AMD Ryzen 9 3900X, NVIDIA Titan RTX (Idle: 87.4 W) | |
| AMD Ryzen 7 3800XT, NVIDIA Titan RTX (Idle: 96.1 W) | |
| Intel Core i5-10600K, NVIDIA Titan RTX (Idle: 52.2 W) | |
| AMD Ryzen 3 3300X, NVIDIA Titan RTX (Idle: 88.8 W) | |
| AMD Ryzen 3 3100, NVIDIA Titan RTX (Idle: 86 W) | |
* ... kleiner is beter
Pro
Contra
Voor het volledige, Engelse testrapport, klik hier.
De AMD Ryzen 7 3800XT is de opvolger van de AMD Ryzen 7 3800X, die vanwege zijn moeilijke plaatsing nog niet in staat is zich te onderscheiden van de massa. De vernieuwing van de Ryzen 7 3800X zal ook met deze vooroordelen moeten leven. In onze test levert de 8-core CPU goede prestaties, die afvlakken tussen de Ryzen 7 3700X en de Ryzen 9 3900X. Dit was te verwachten. Tegelijkertijd is de hogere TDP in vergelijking met de Ryzen 7 3700X nog steeds een punt van kritiek bij het kiezen van een 8-core CPU van AMD. Het hogere TDP (40 Watt) van de Ryzen 7 3800XT van AMD in vergelijking met de Ryzen 7 3700X weerspiegelt geen merkbare prestatiewinst. De toename van de turbo tot 4,7 GHz komt vooral ten goede aan single-thread-toepassingen.
De AMD Ryzen 7 3800XT is een snelle gaming-CPU, die het vanwege de prijs moeilijk zal blijven vinden om kopers aan te trekken.
AMD vraagt 529 euro bij het uitbrengen van deze CPU, wat naar onze mening zeker 100 euro te duur is als je kijkt naar de prestaties in verhouding tot deze prijs. De Ryzen 7 3800X is nu verkrijgbaar voor slechts 310 euro, wat niet bepaald gunstig uitpakt voor de Ryzen 7 3800XT.
Over het geheel genomen doet AMD slechts minimaal productonderhoud met de XT-processors. De vraag rijst waarom deze processors nu worden vrijgegeven, aangezien de lancering van Zen3 naar verwachting dit jaar komt, als je de geruchten mag geloven.