Intel NUC 12 Dragon Canyon review met Intel Core i9-12900
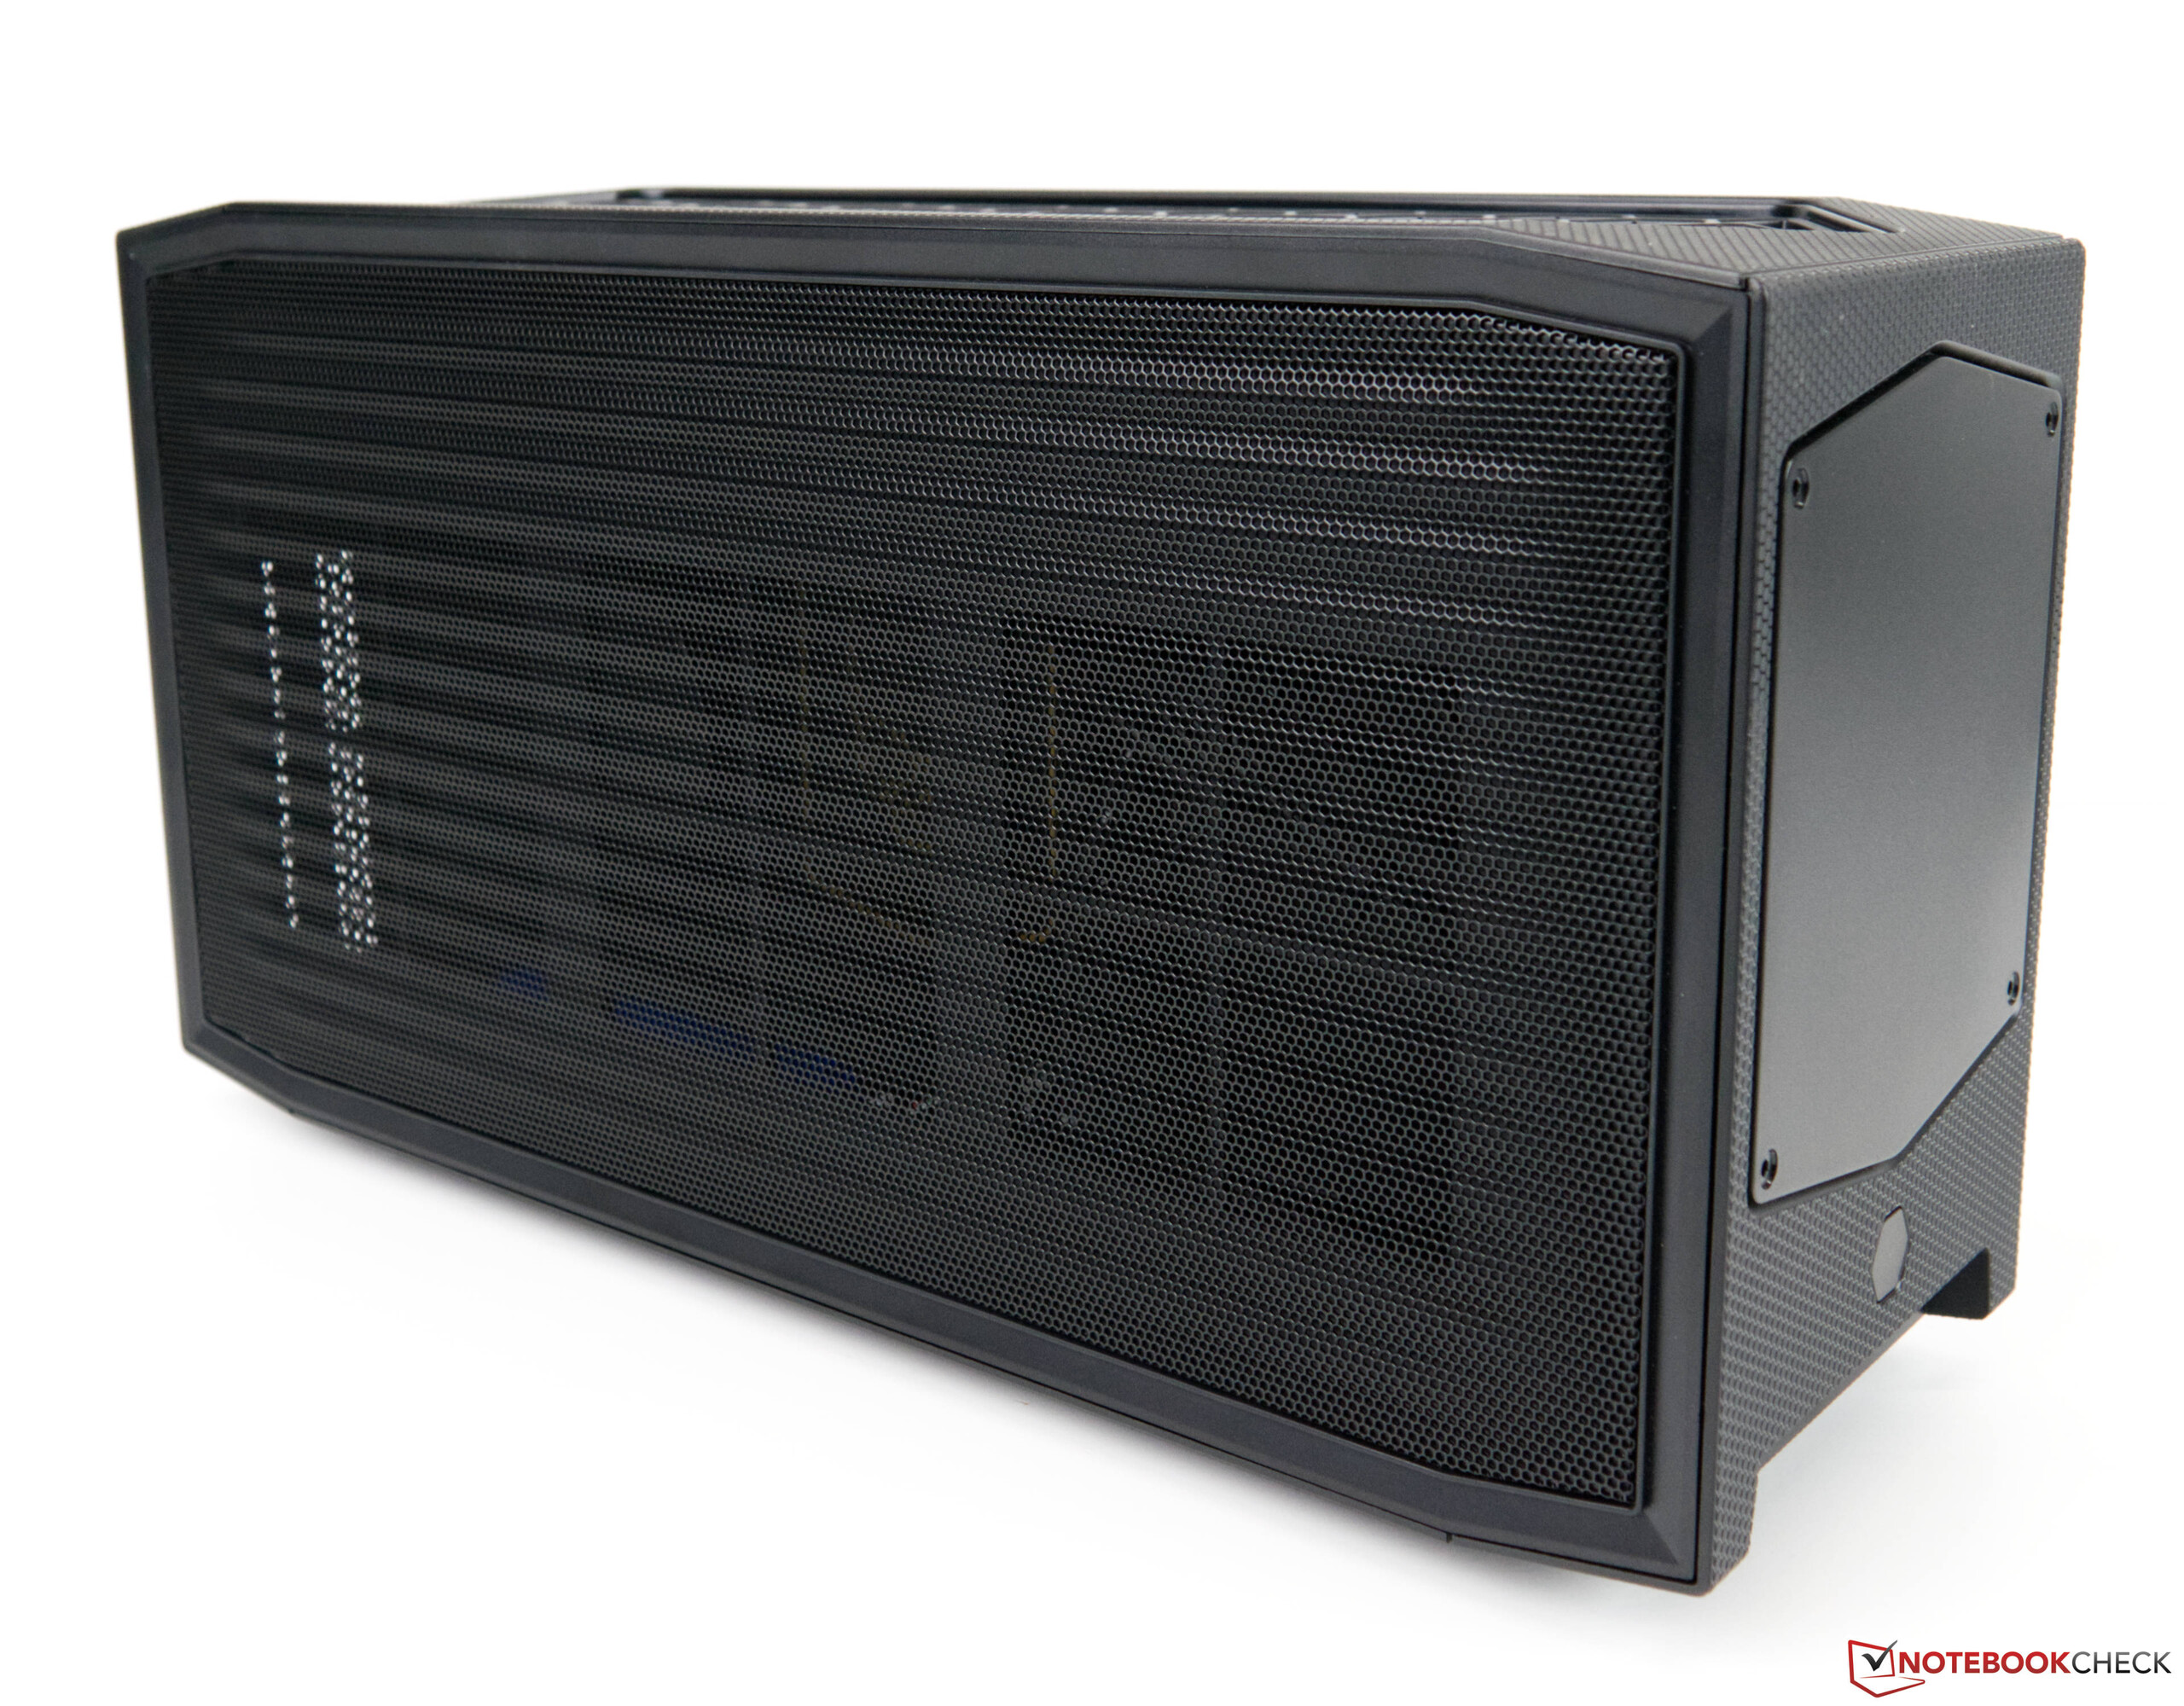
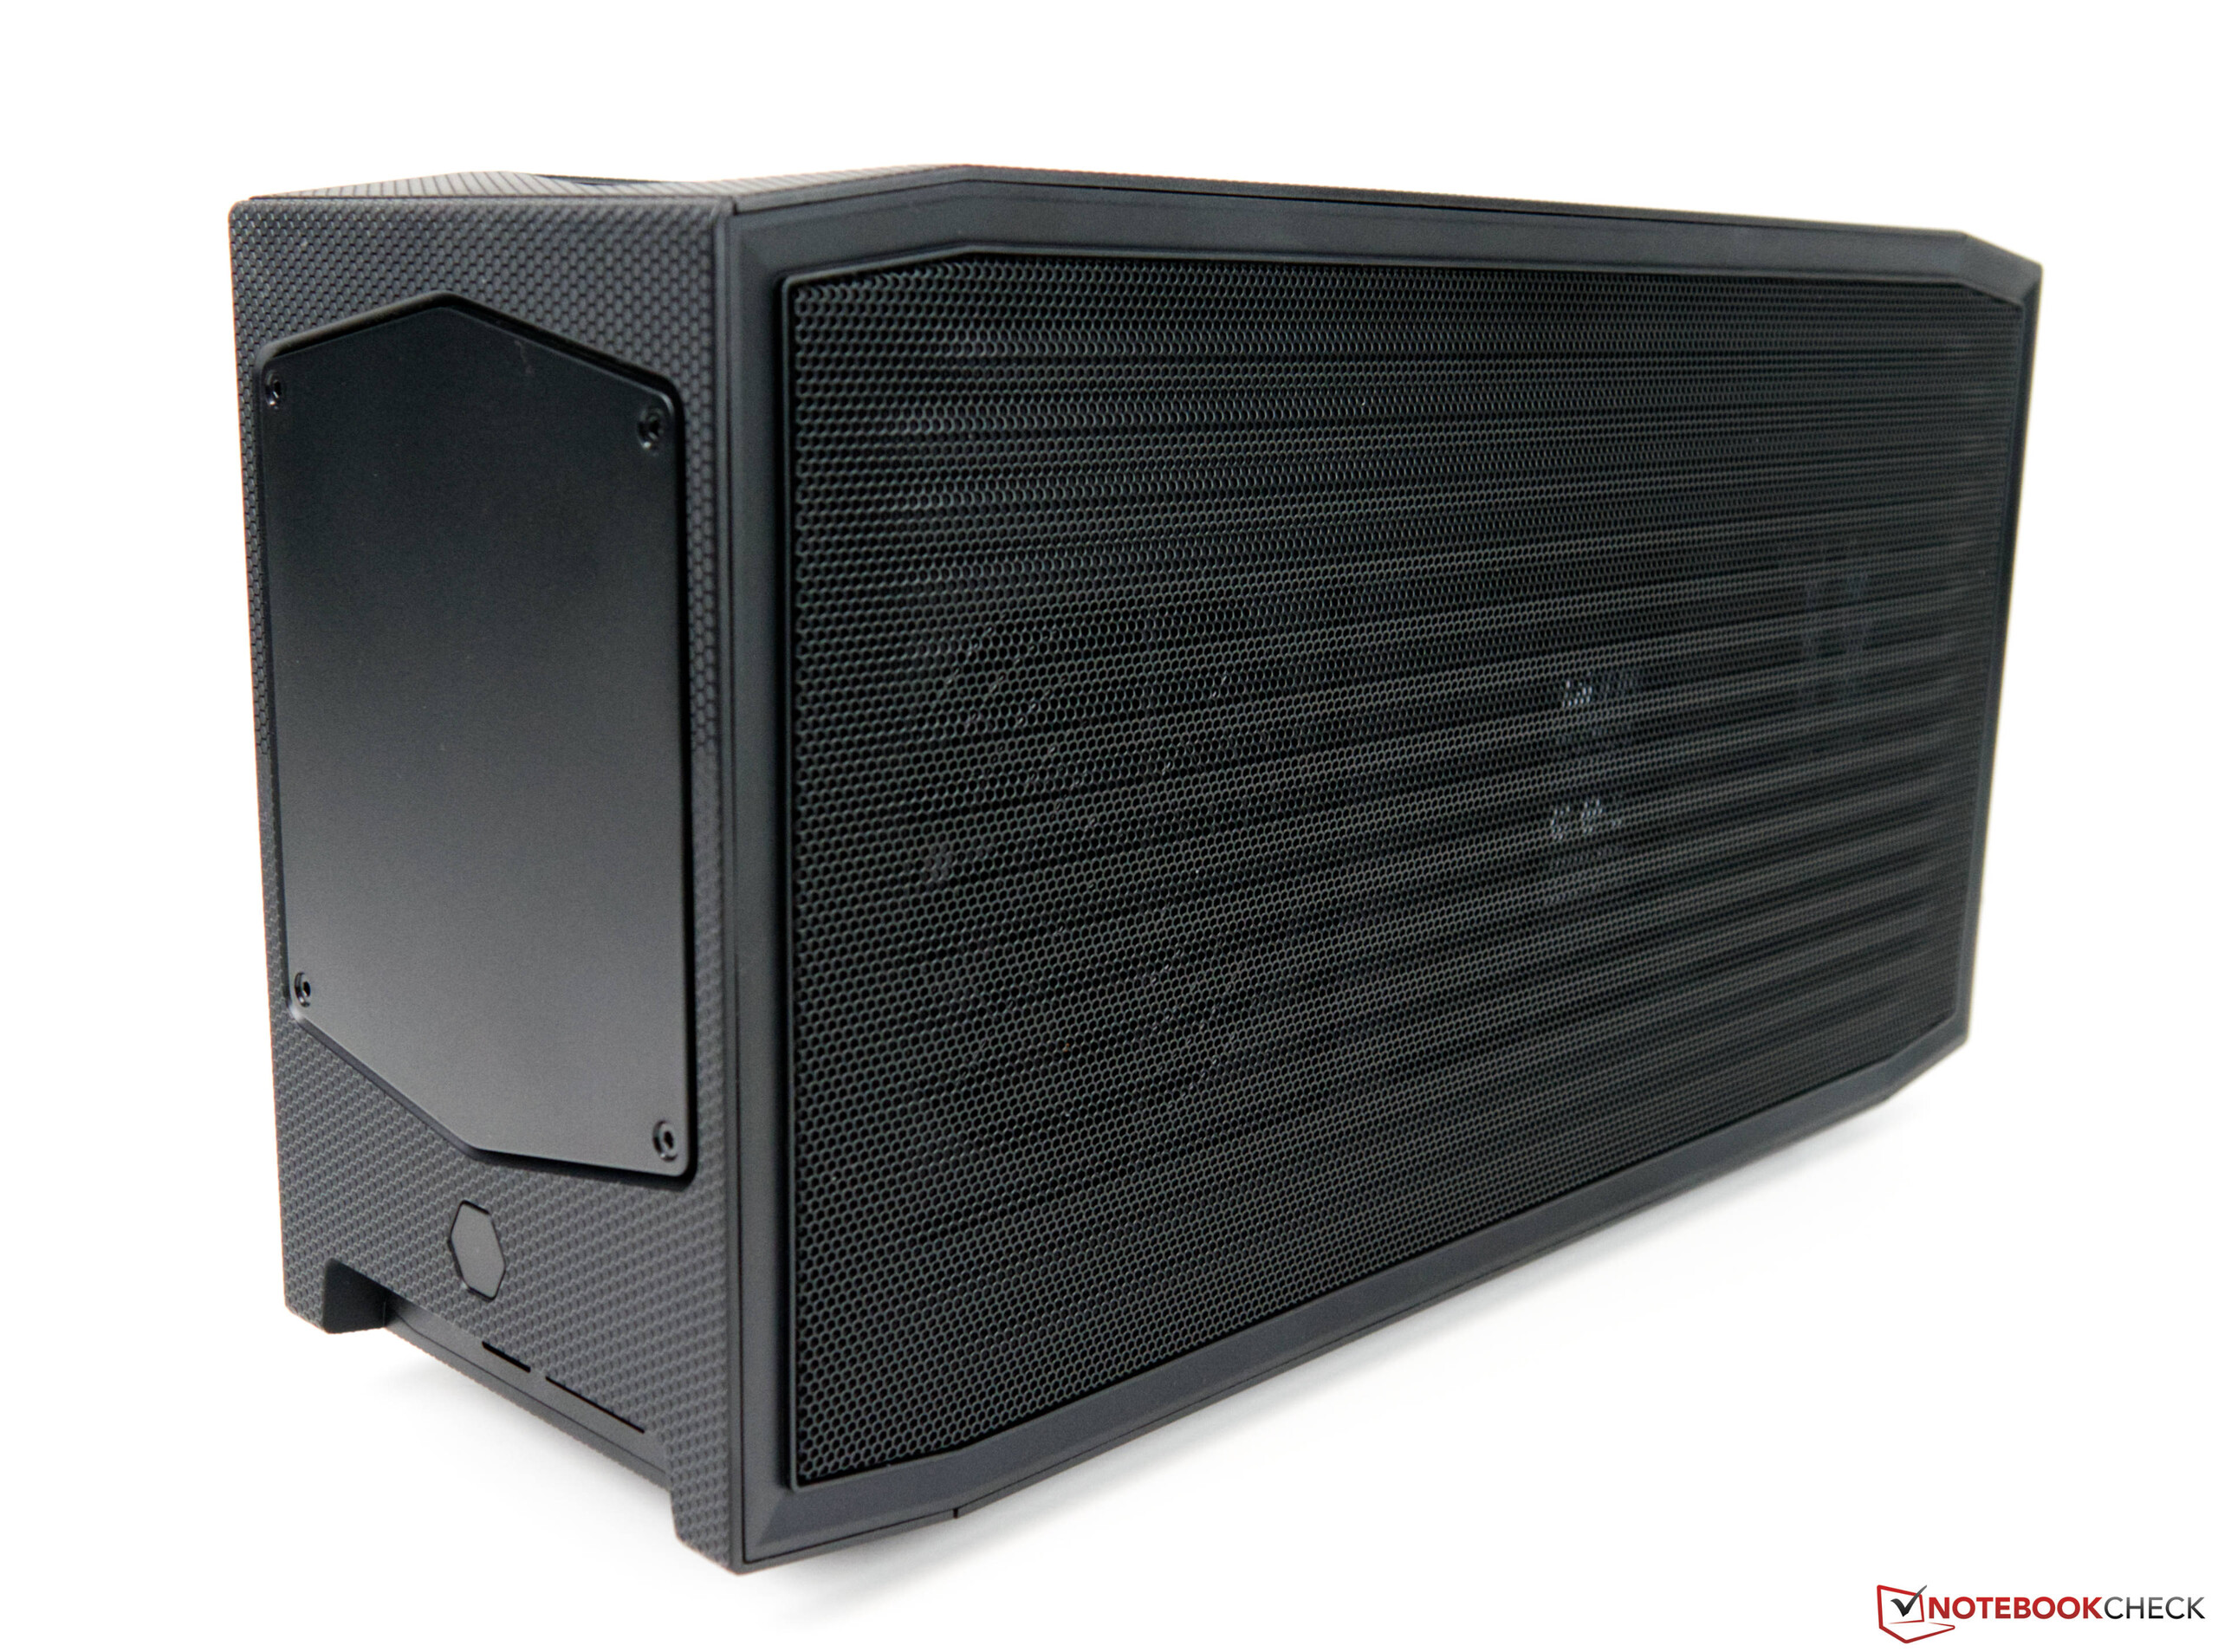
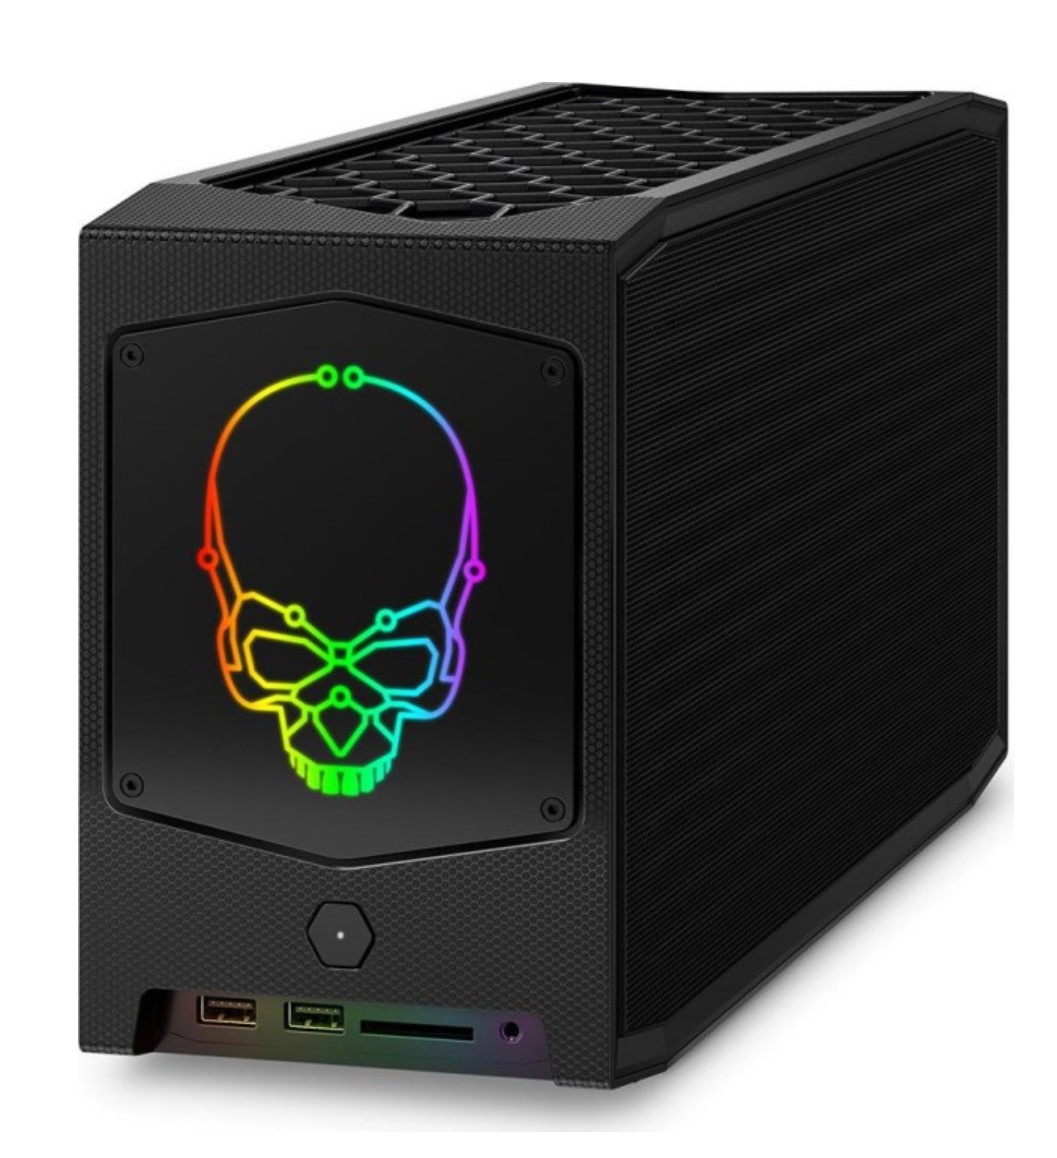
De Intel NUC Extreme Kit is al enige tijd bekend. Met zijn compacte bouw en goede uitrusting onderscheidt hij zich van de massa, en het ontwerp van de compacte desktop computer kanzonder twijfelgemakkelijk worden herkend.
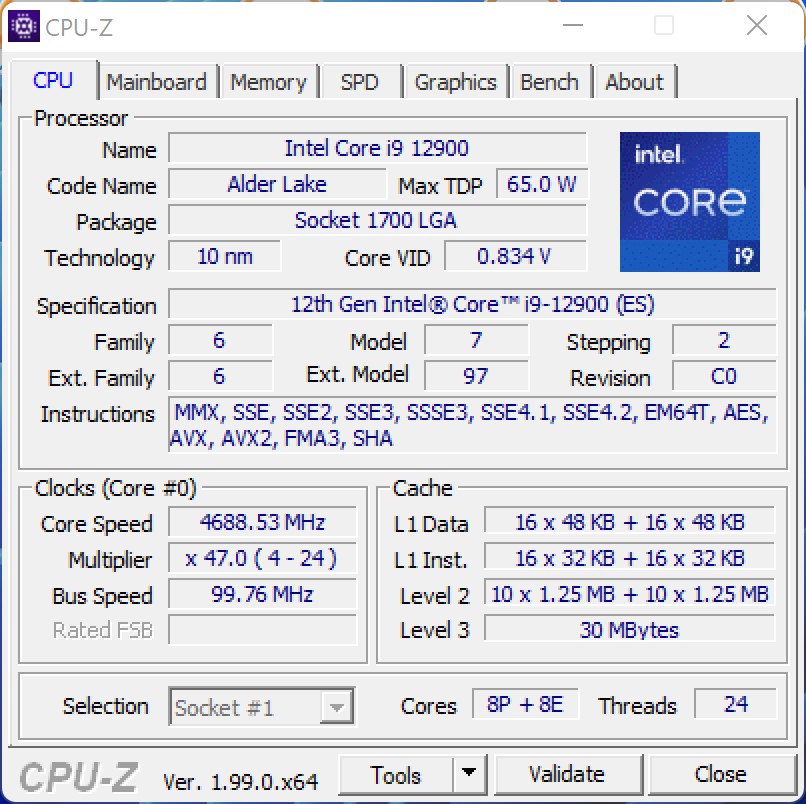
We hebben onlangs een gedetailleerde blik geworpen op de Intel NUC 11 Extreme Kit alias Beast Canyon en waren toen al verrast door zijn krachtige capaciteiten. Met de Intel NUC 12 Extreme Kit alias Dragon Canyon introduceert Intel nu de opvolger en laat zien dat er nu nog meer kracht uit de nieuwe CPU te halen valt. Maar dat was ook te verwachten door de vooruitgang in de chipontwikkeling, want Alder Lake heeft een belangrijk voordeel ten opzichte van het oudere Tiger Lake platform. Het maakt nog steeds gebruik van het Compute Element dat we al kennen en dat alle belangrijke componenten van een pc combineert. Voor het eerst gaat Intel de richting uit van het gebruik van een socketed CPU zoals we die kennen uit het standaard desktopsegment. Hier wordt de Intel Core i9-12900 uit de huidige Alder Lake S serie gebruikt. Net als de Intel Core i9-12900K biedt de processor de ons bekende P- en E-kernen, die in staat zijn om tot 24 threads tegelijk te laten werken. Met een iets lager TDP verwachten we echter ook iets lagere prestaties. Meer details hierover vindt u in het prestatiesegment verderop in dit artikel.
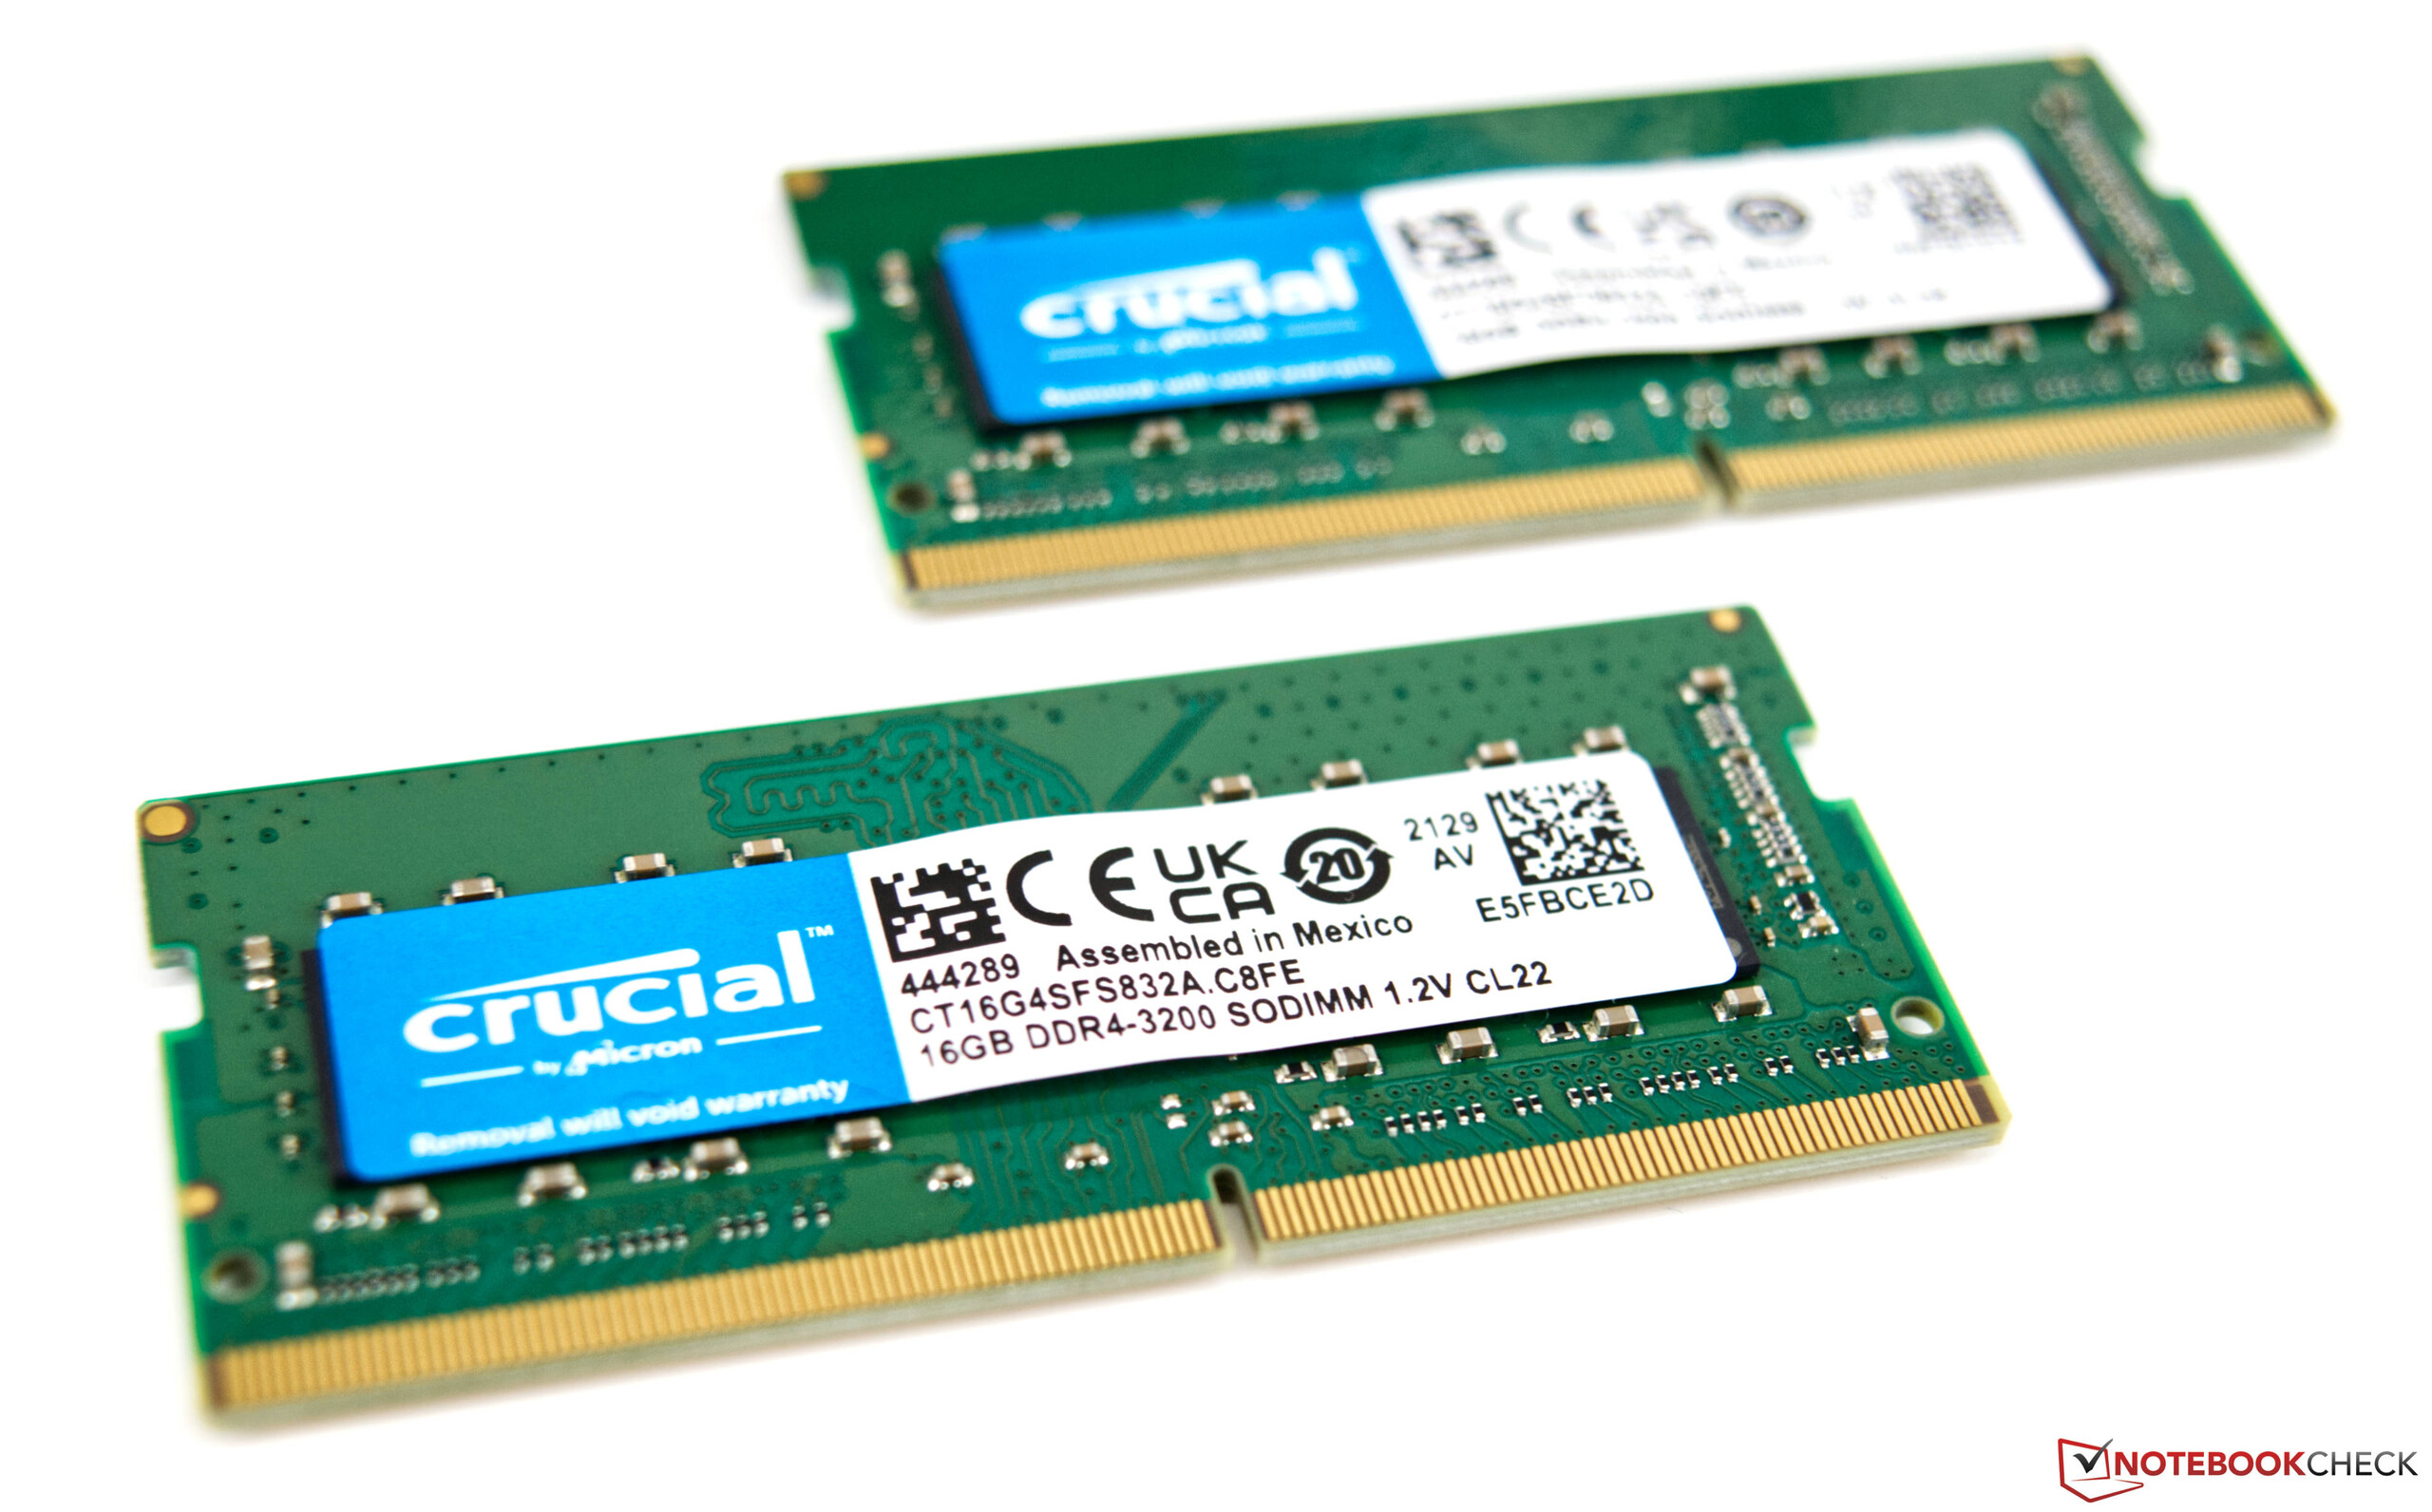
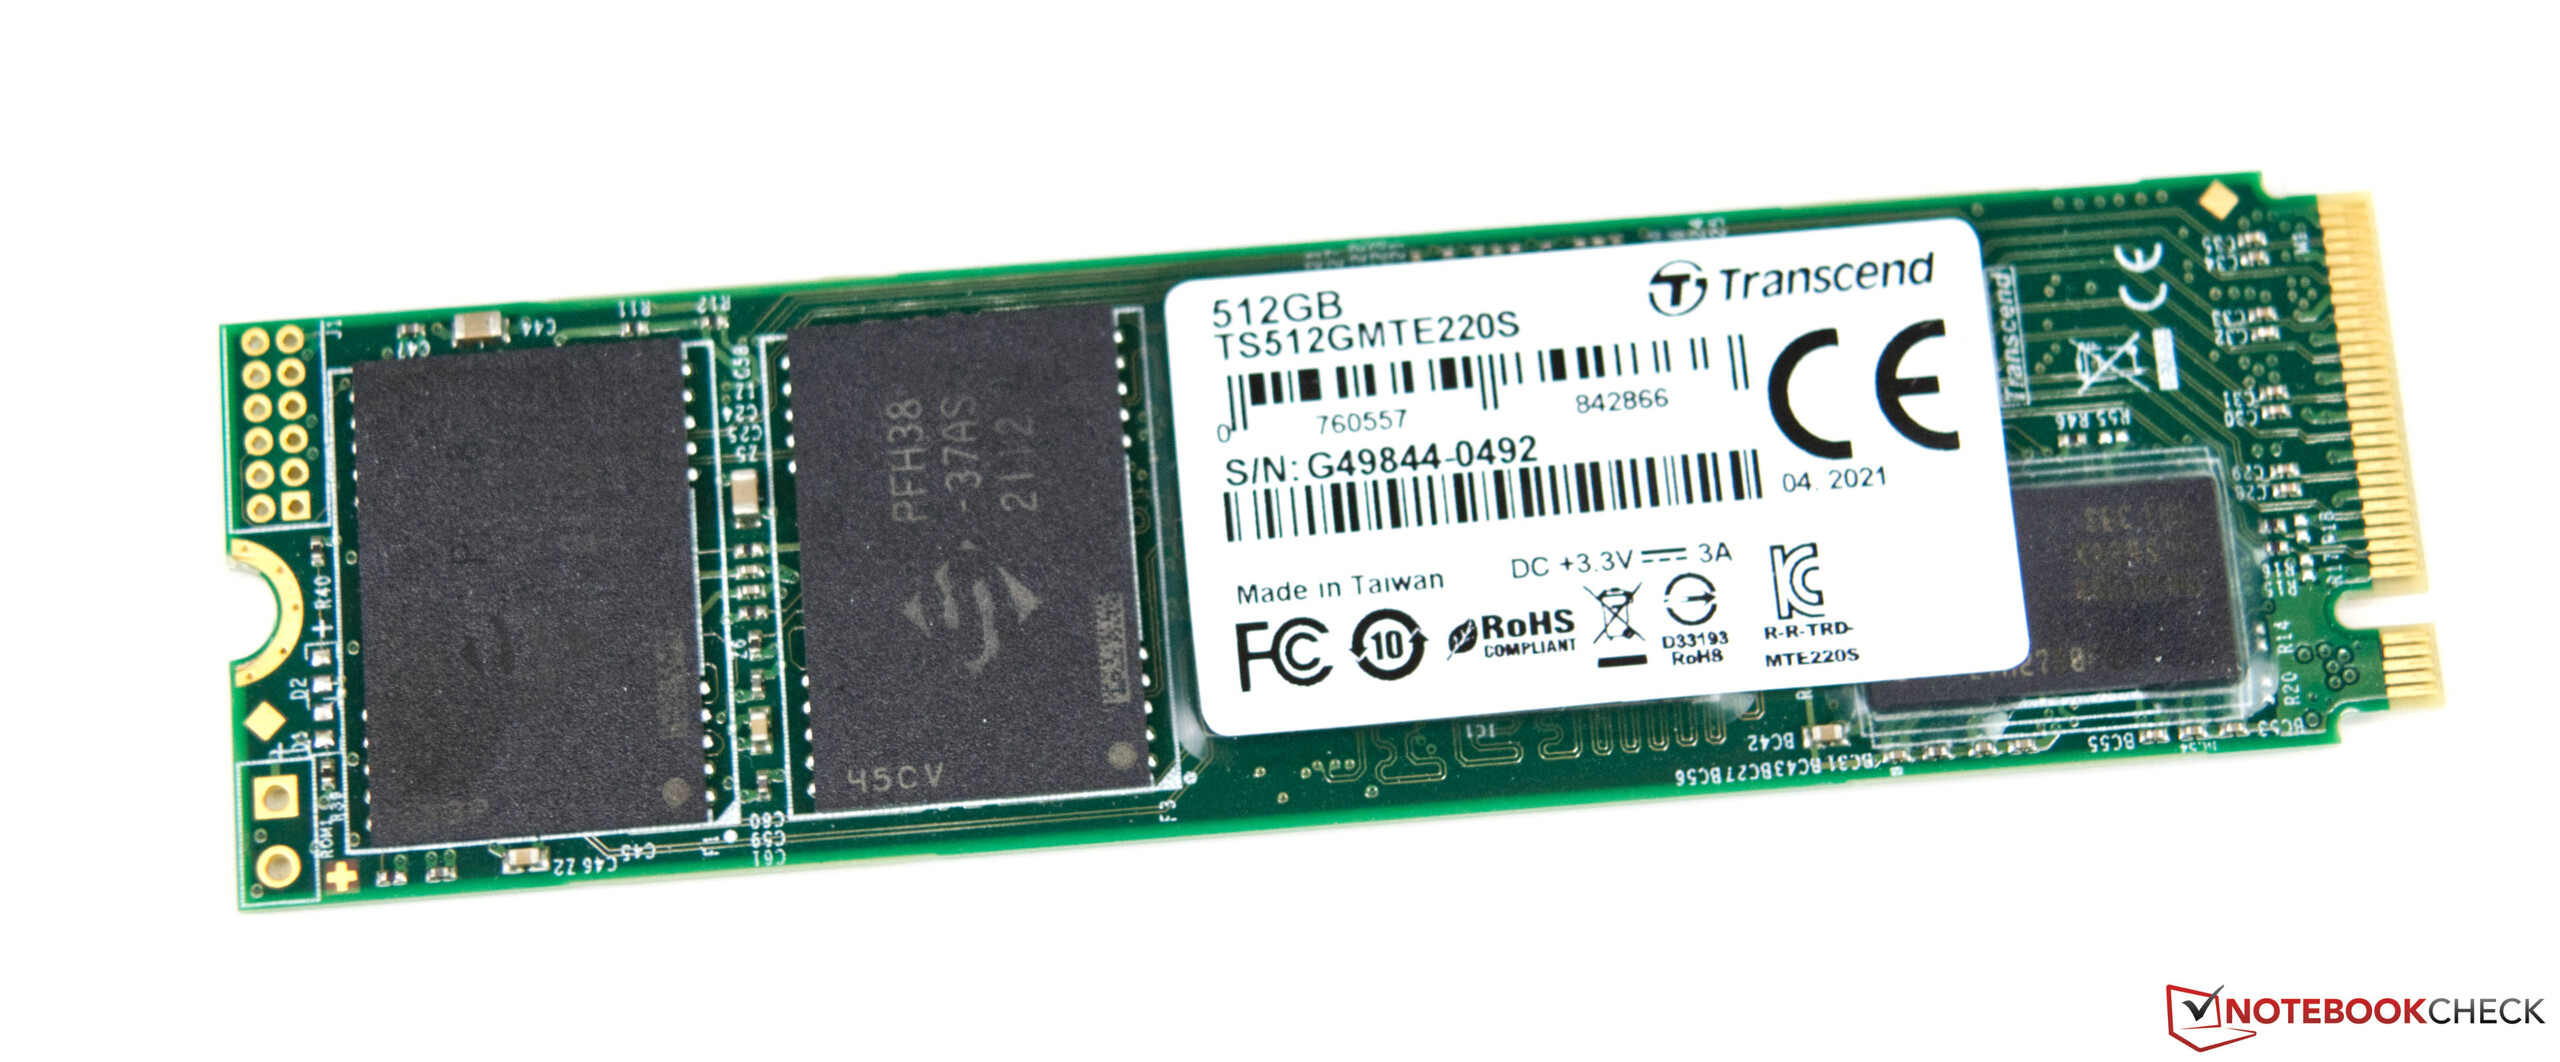
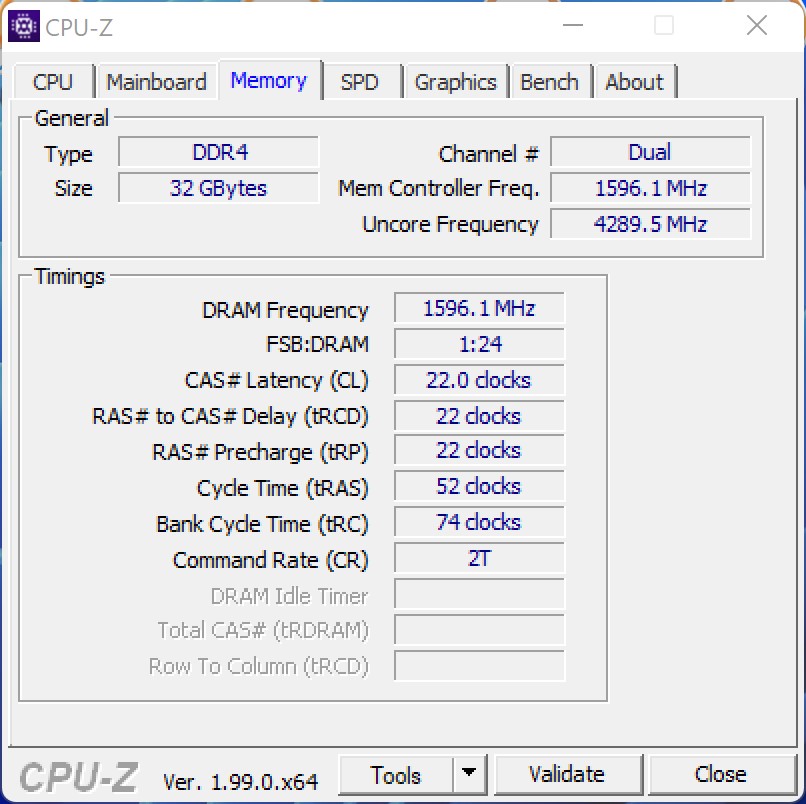
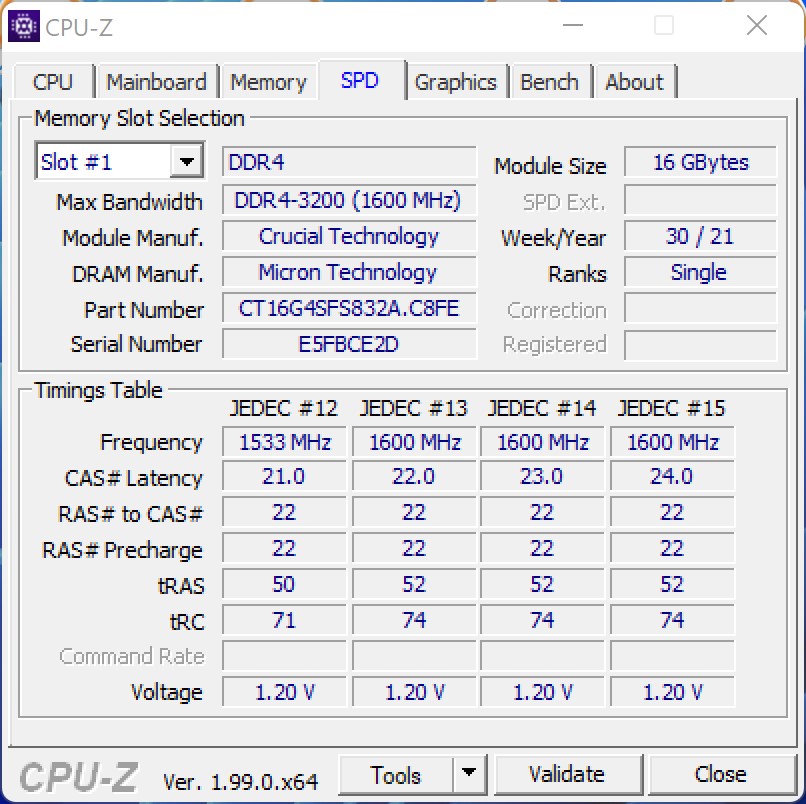
Wanneer u de Intel NUC 12 Extreme Kit aanschaft, moet u er rekening mee houden dat dit een barebone systeem is. De SSD, RAM, en een speciale grafische kaart zijn niet inbegrepen. Voor die, keken we naar onze eigen benodigdheden en rustten het systeem uit met een 512 GB NVME SSD en 32 GB DDR4 RAM. Wat betreft de dedicated grafische kaart, hebben we bewust gekozen voor de Nvidia GeForce RTX 3060, om een eerlijke vergelijking met de Intel NUC 11 Extreme Kit mogelijk te maken.
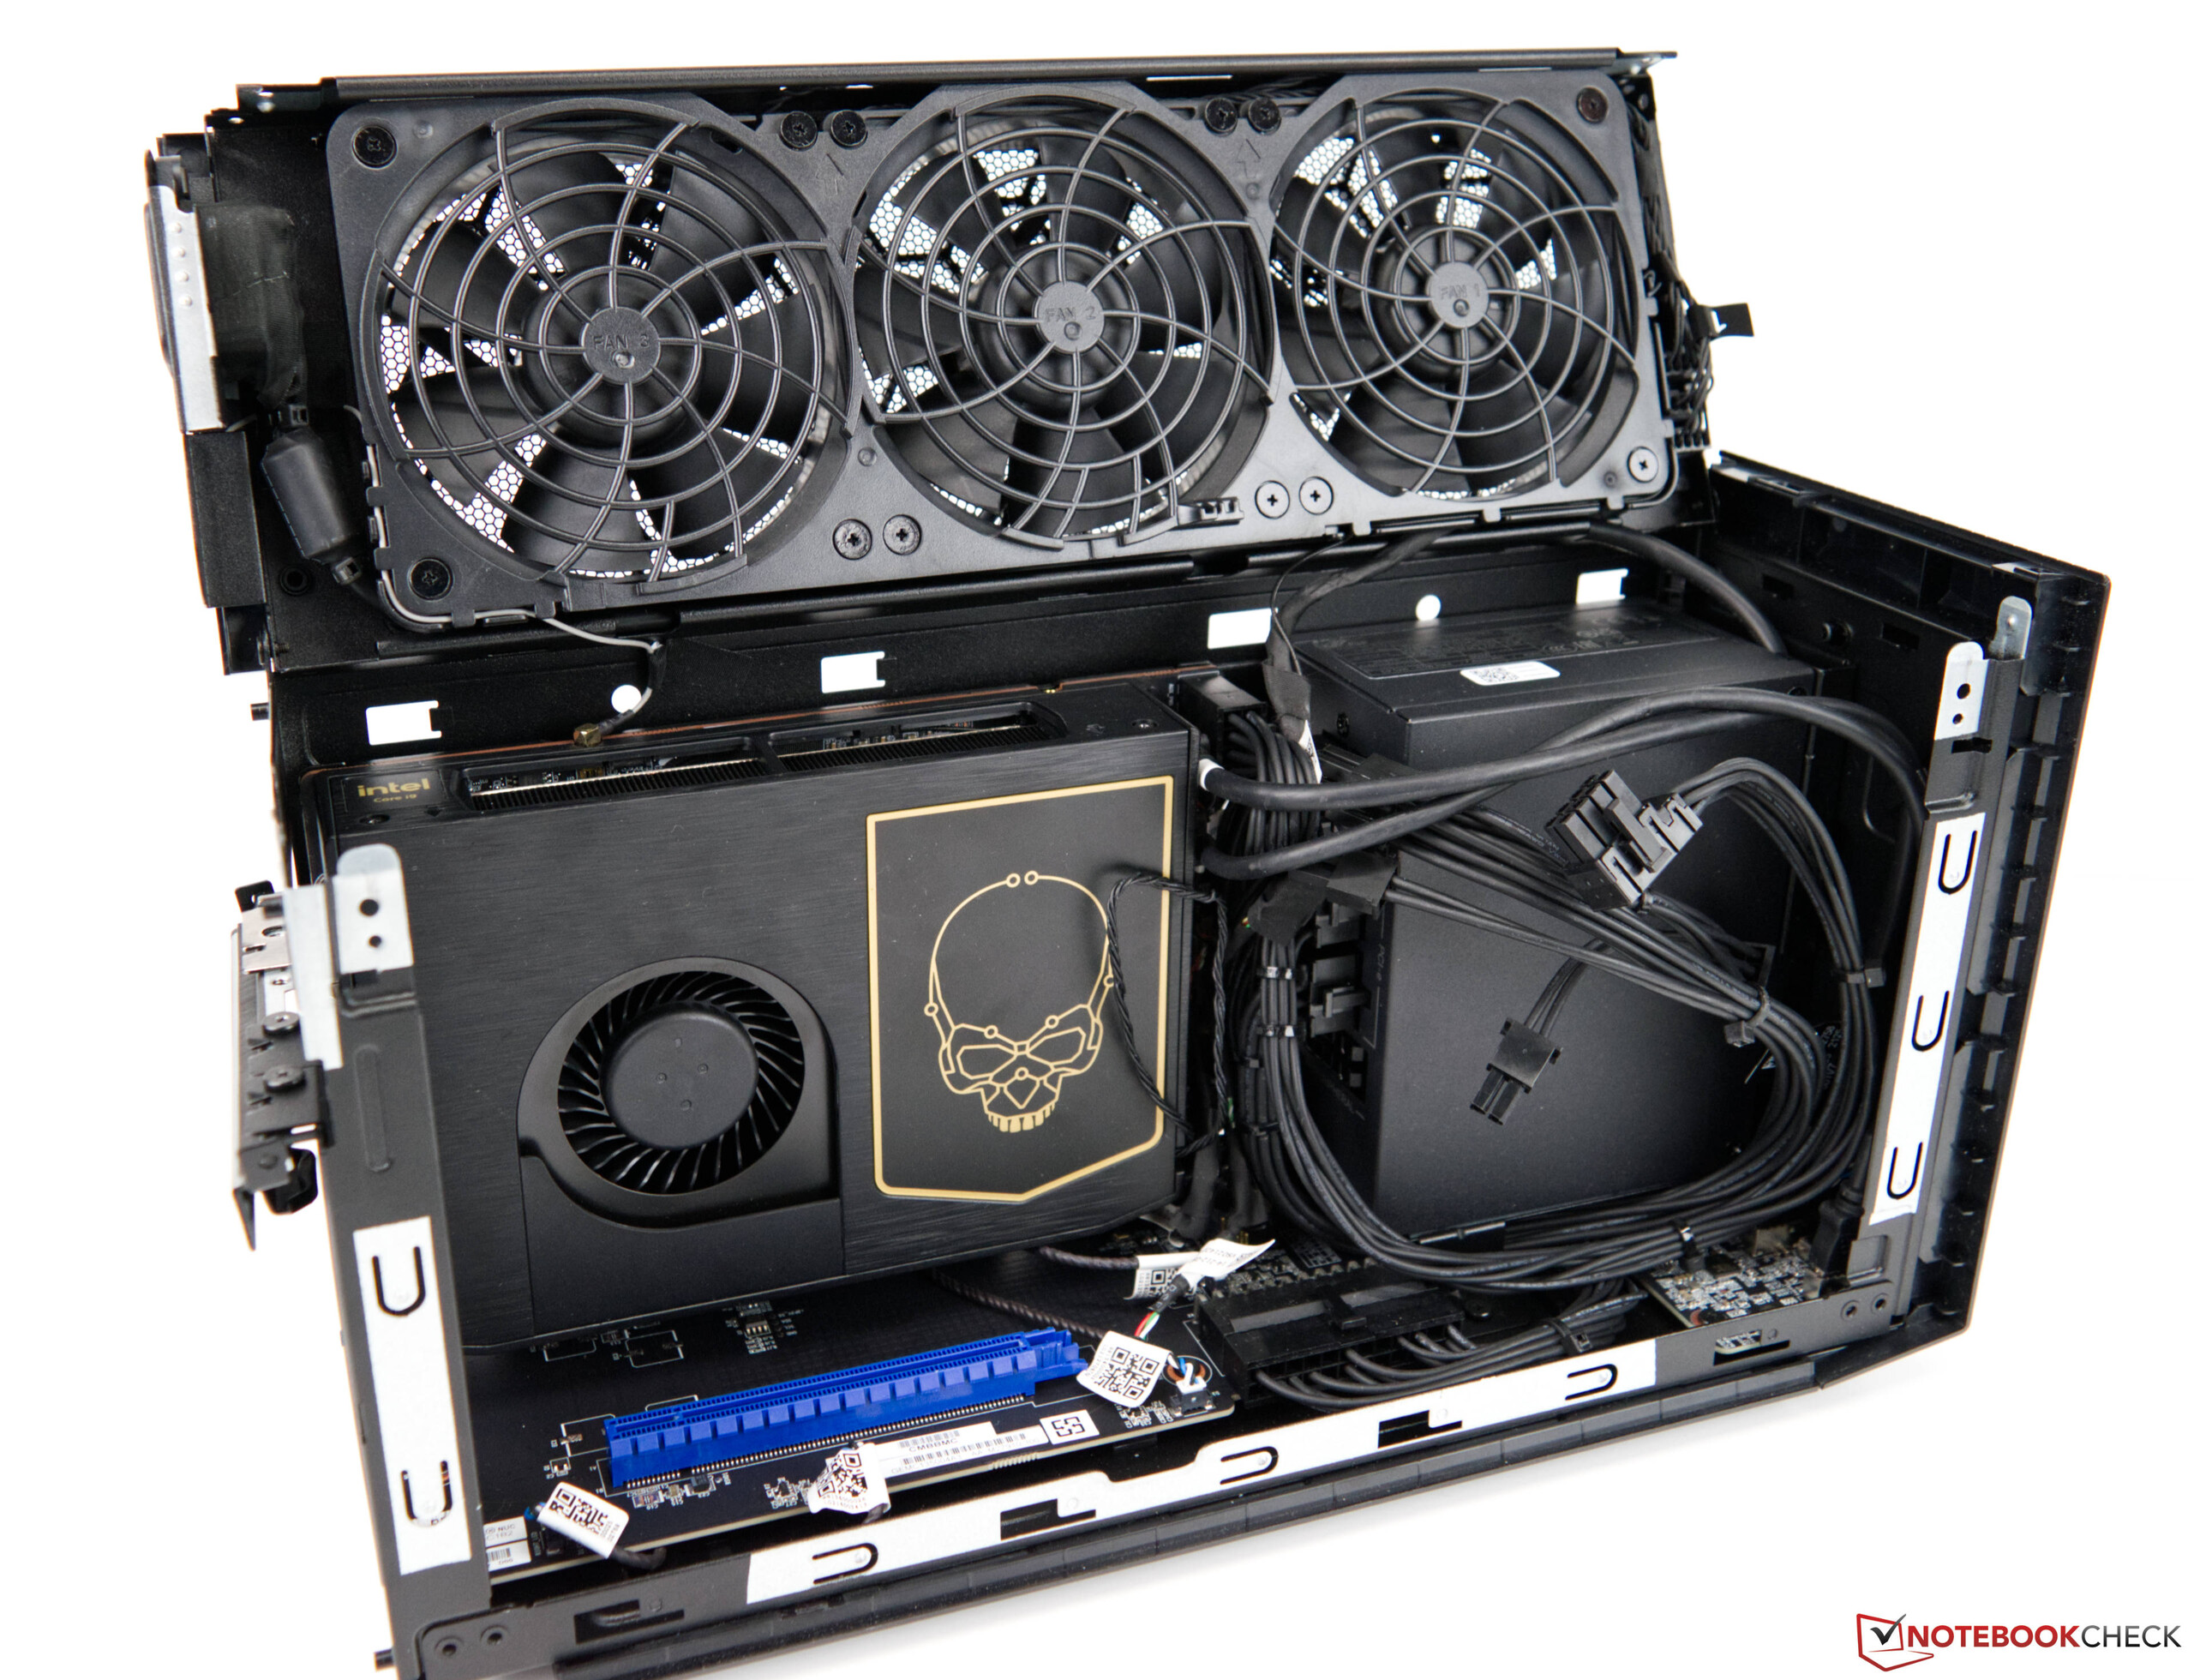
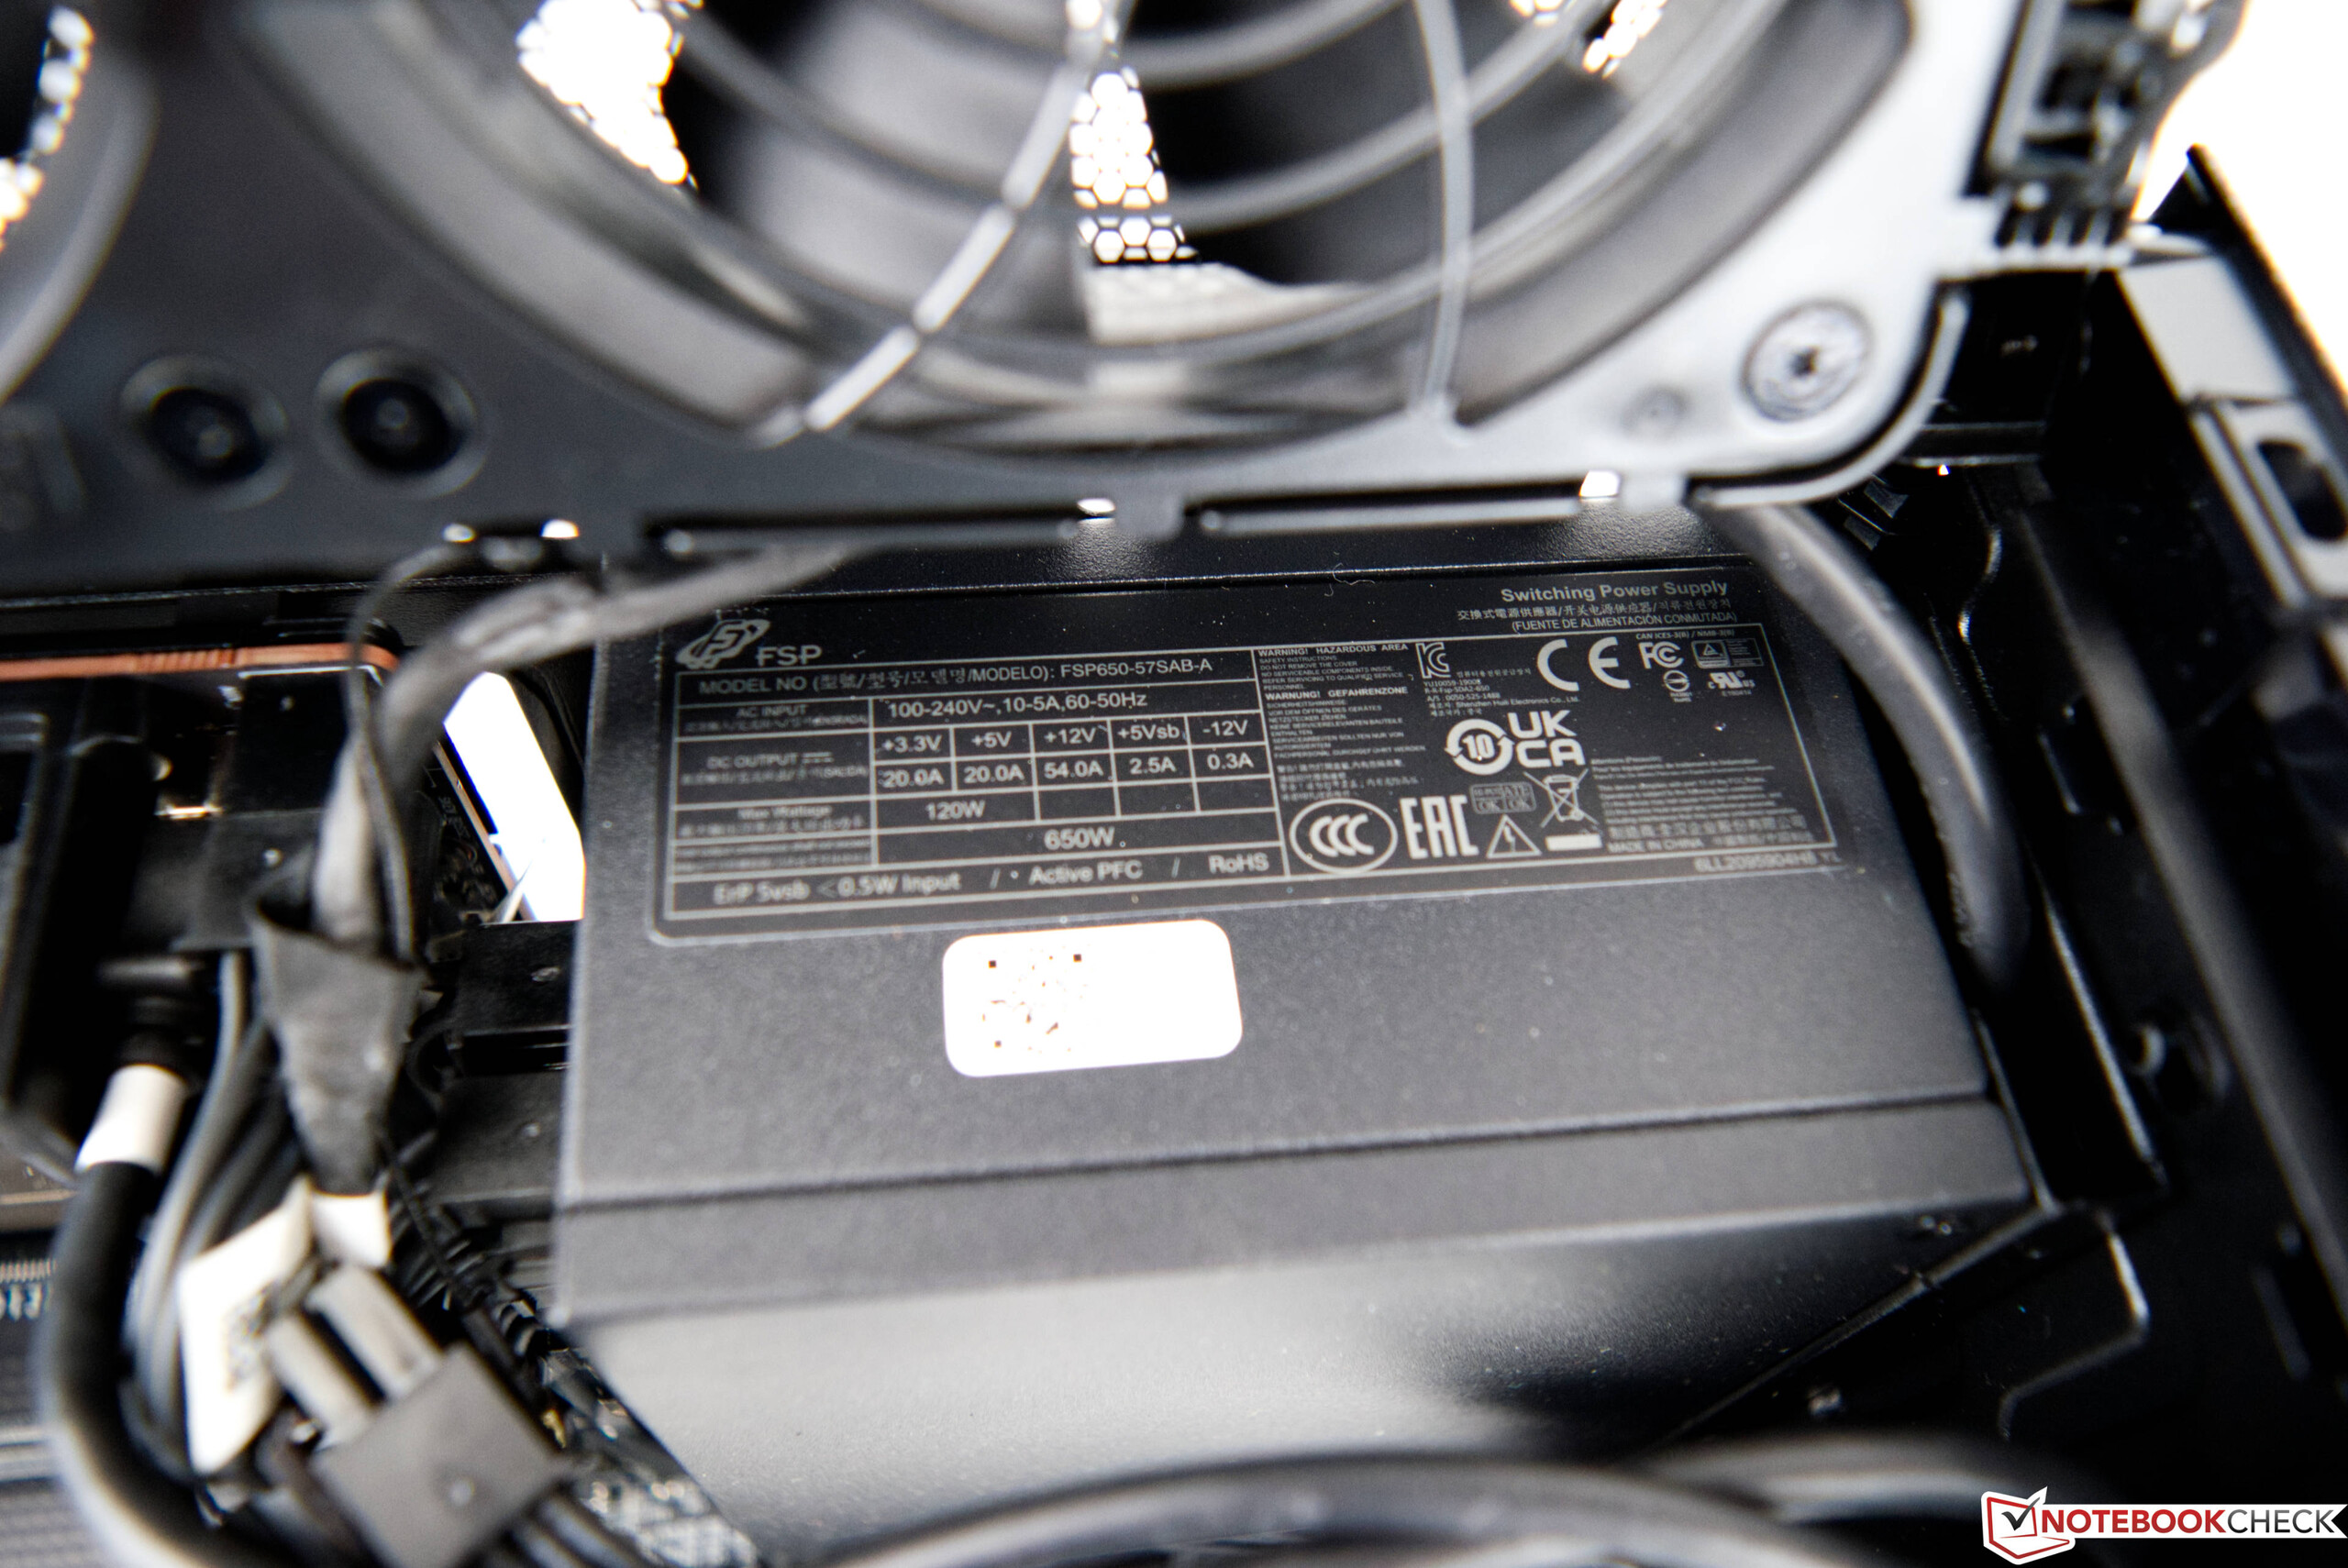
Voor een eigen grafische kaart kunt u modellen gebruiken met een maximale lengte van 30,5 cm (~12 in). De 650-Watt SFX voeding biedt voldoende vermogen om ook de huidige high-end modellen te laten draaien. De koeling van deze pixelversnellers mag echter niet meer dan twee slots in beslag nemen. Je kunt de Intel NUC 12 Extreme Kit momenteel krijgen voor 1450 euro (~$1589).
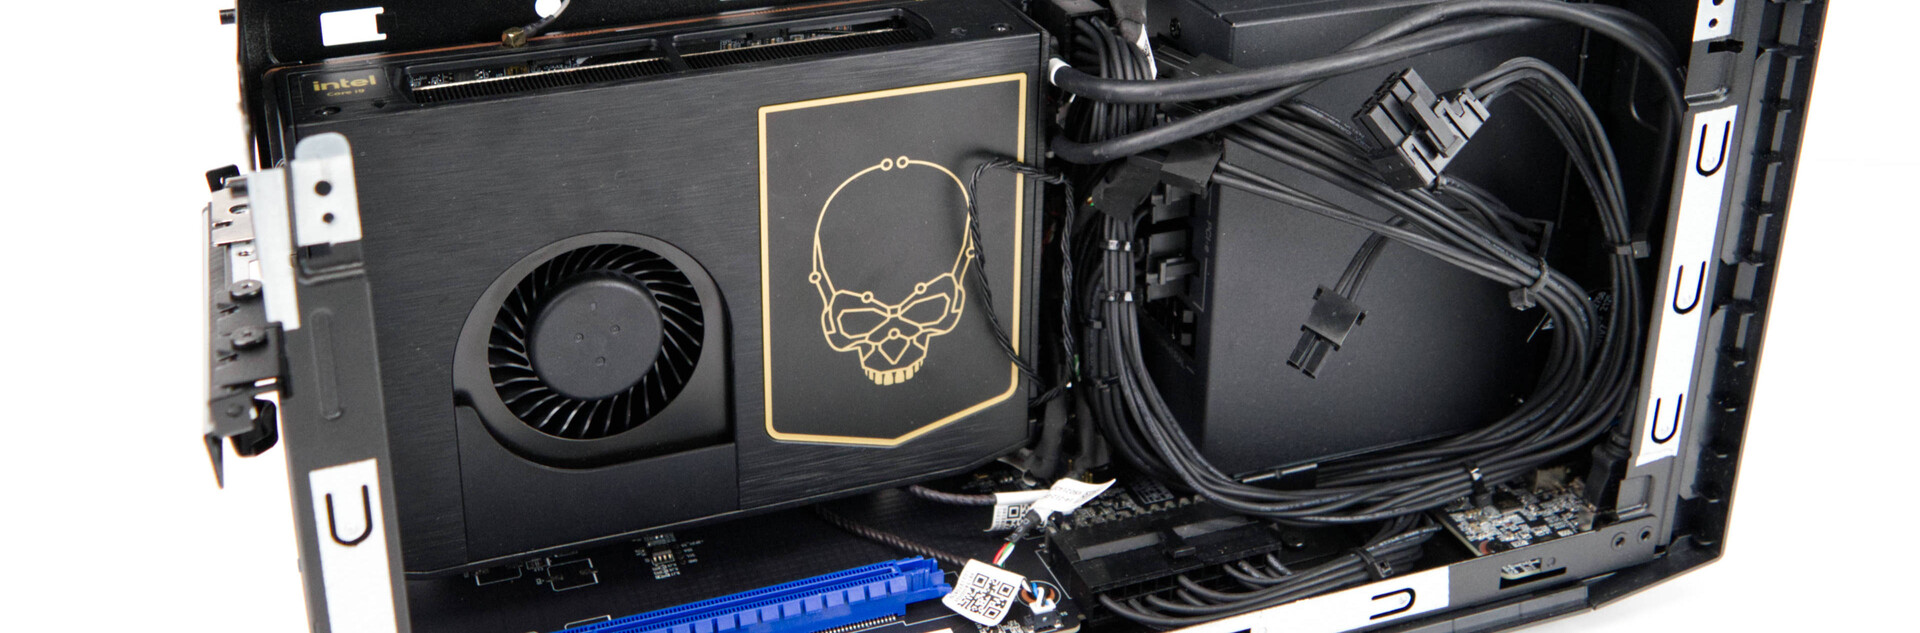
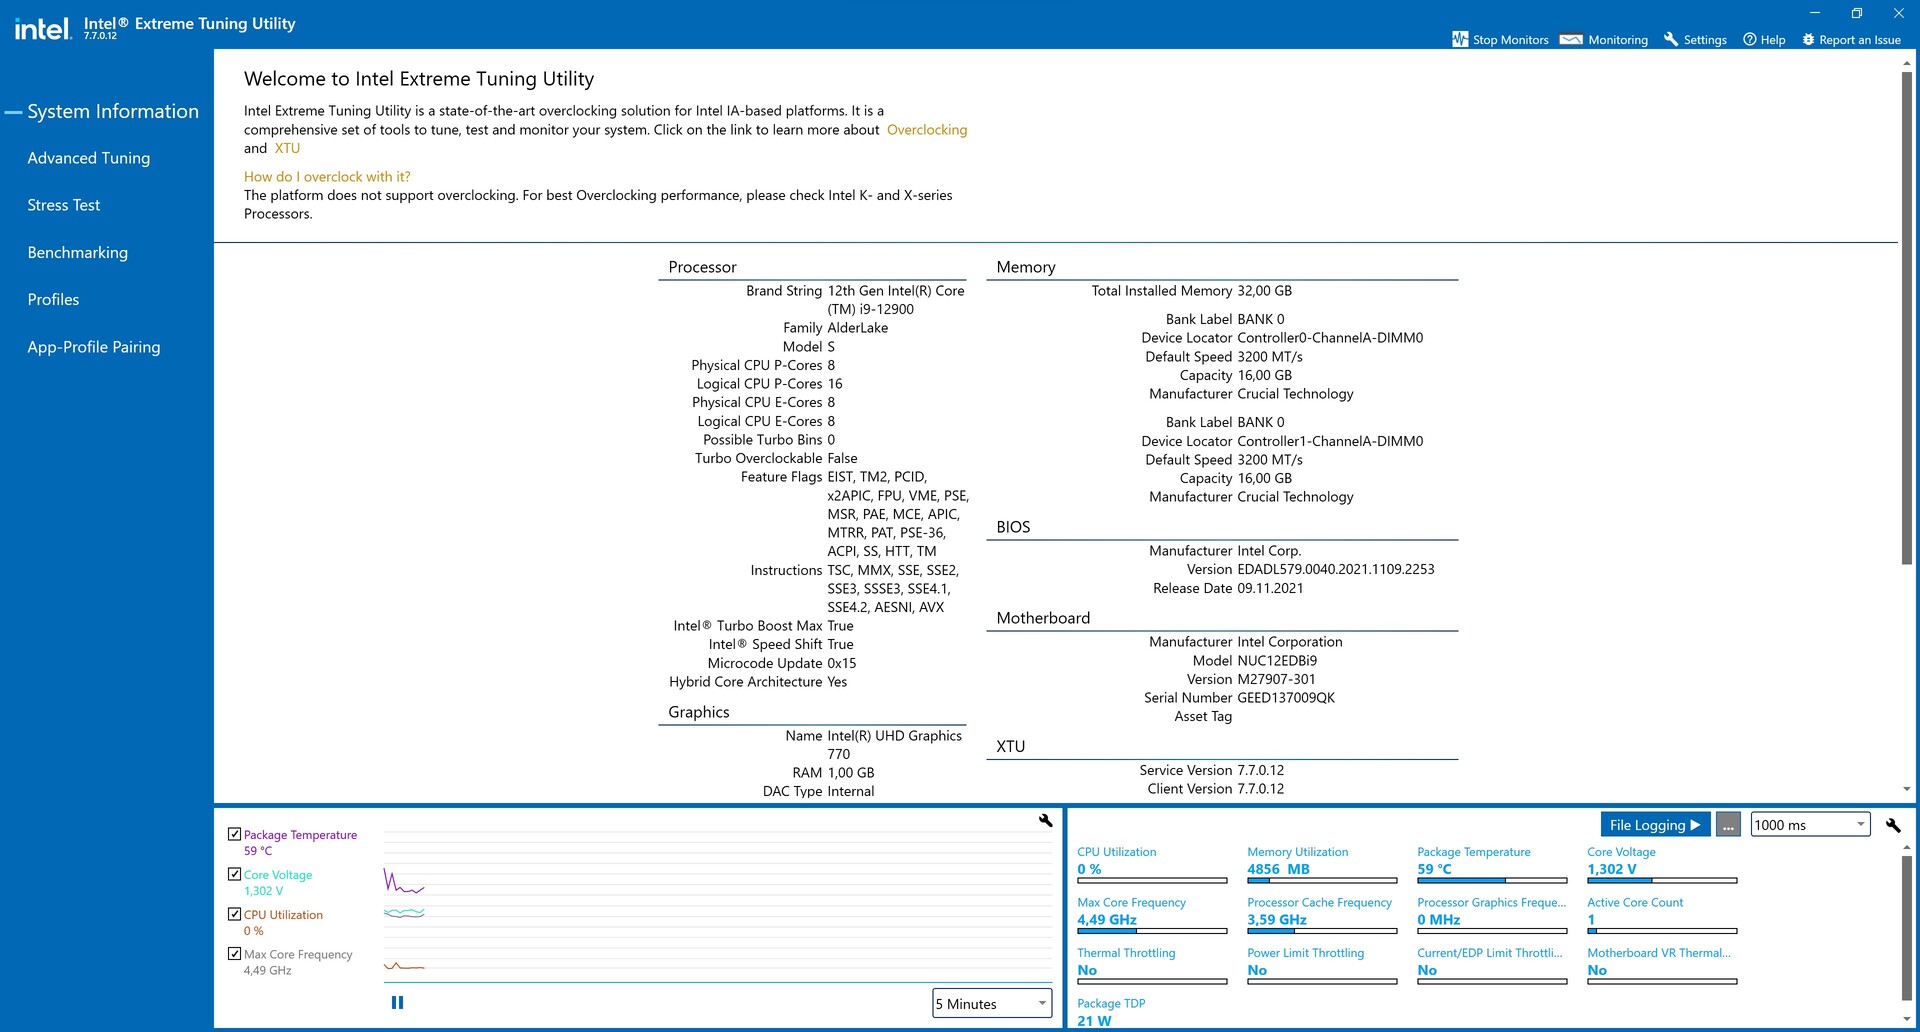
Intel NUC 12 Extreme Compute Element in detail
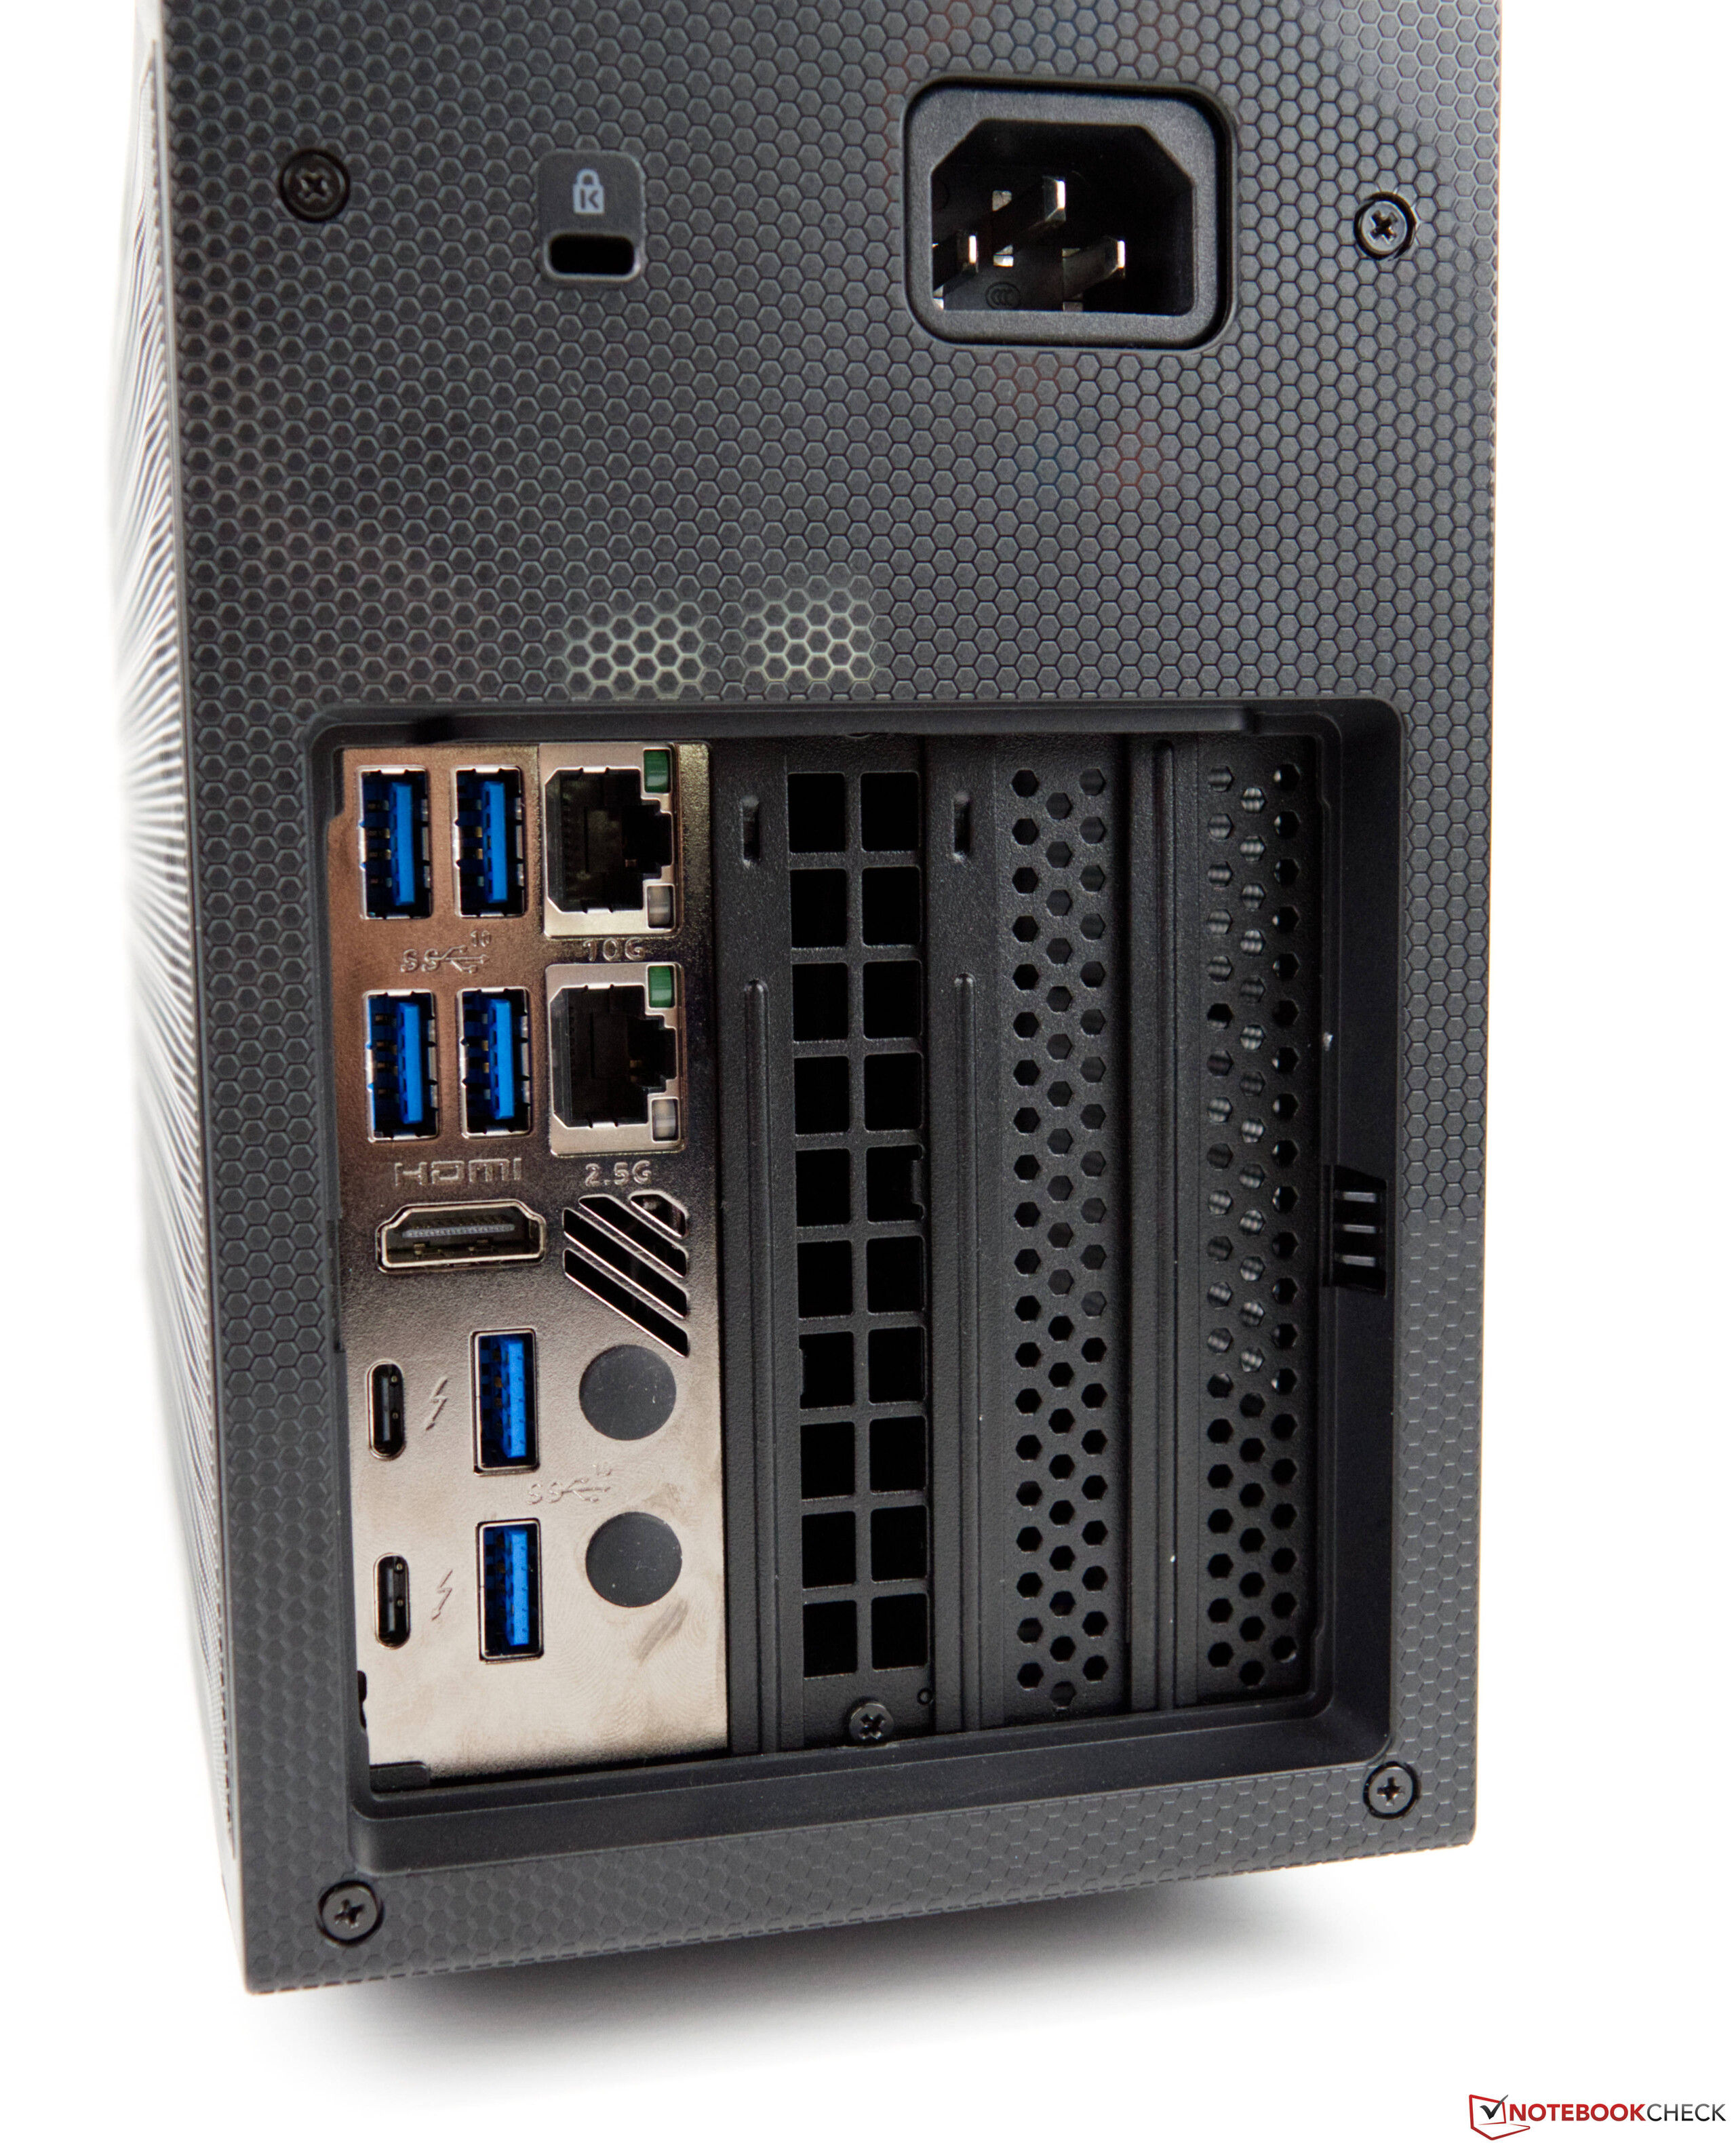
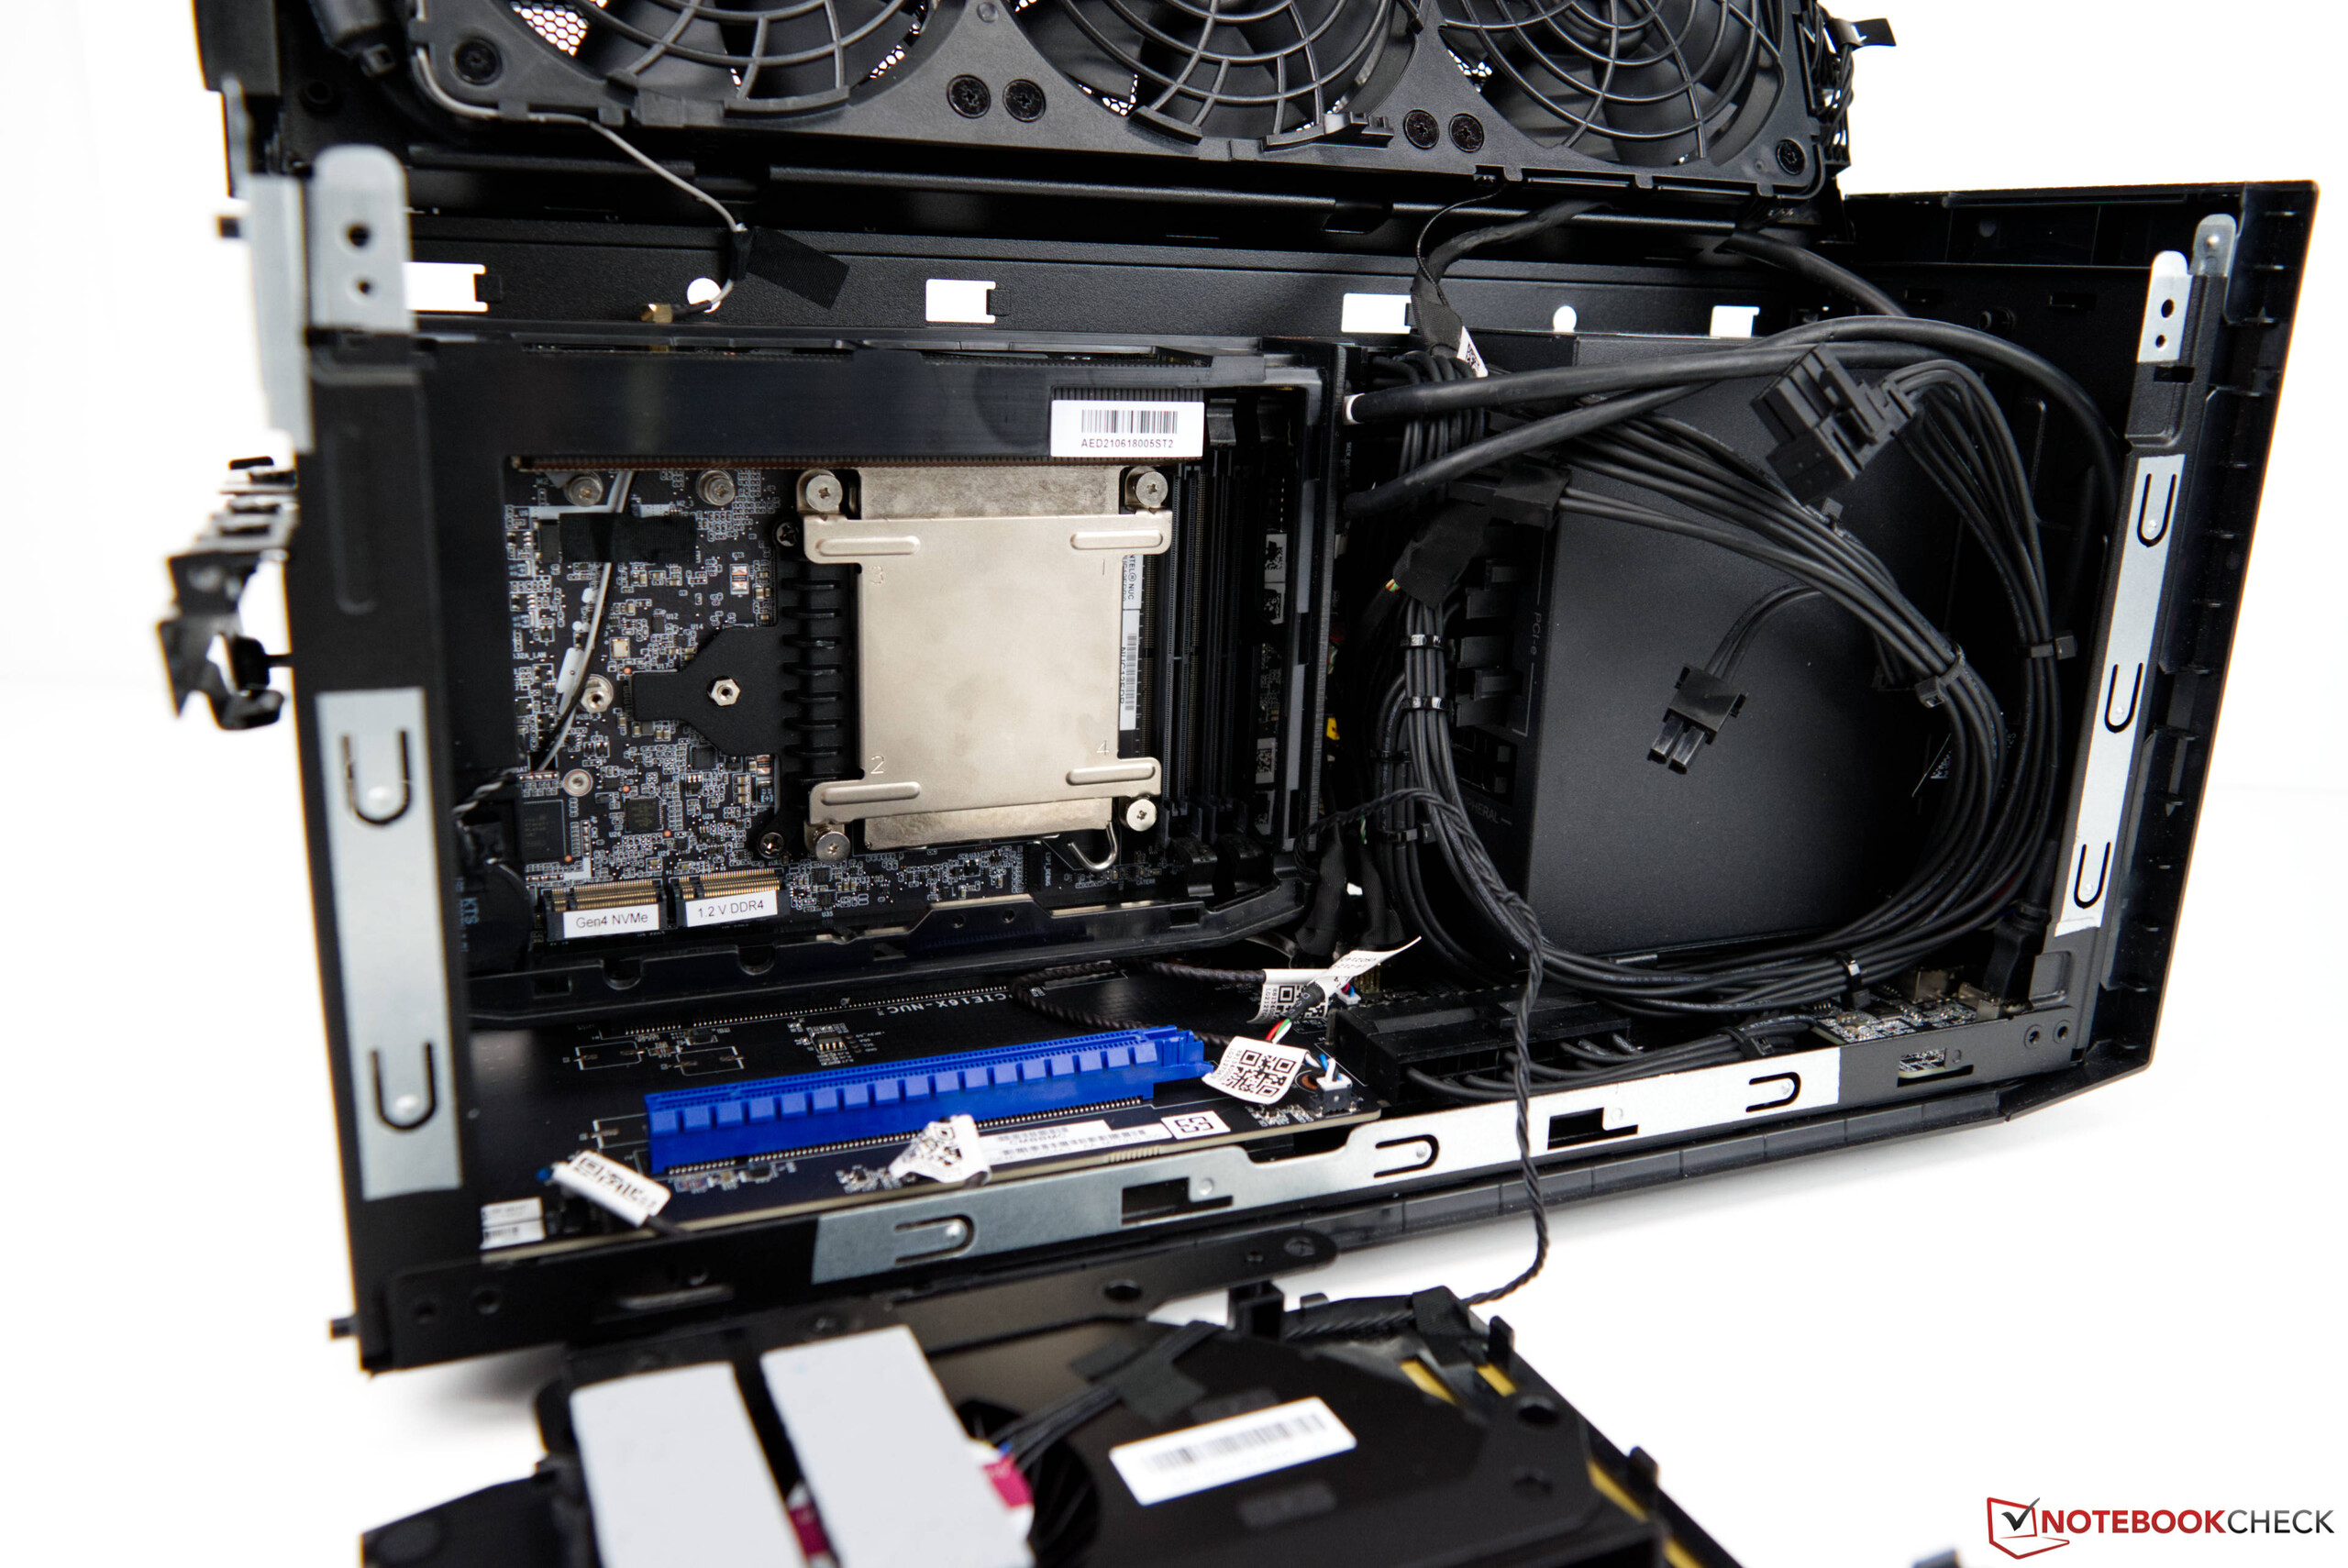
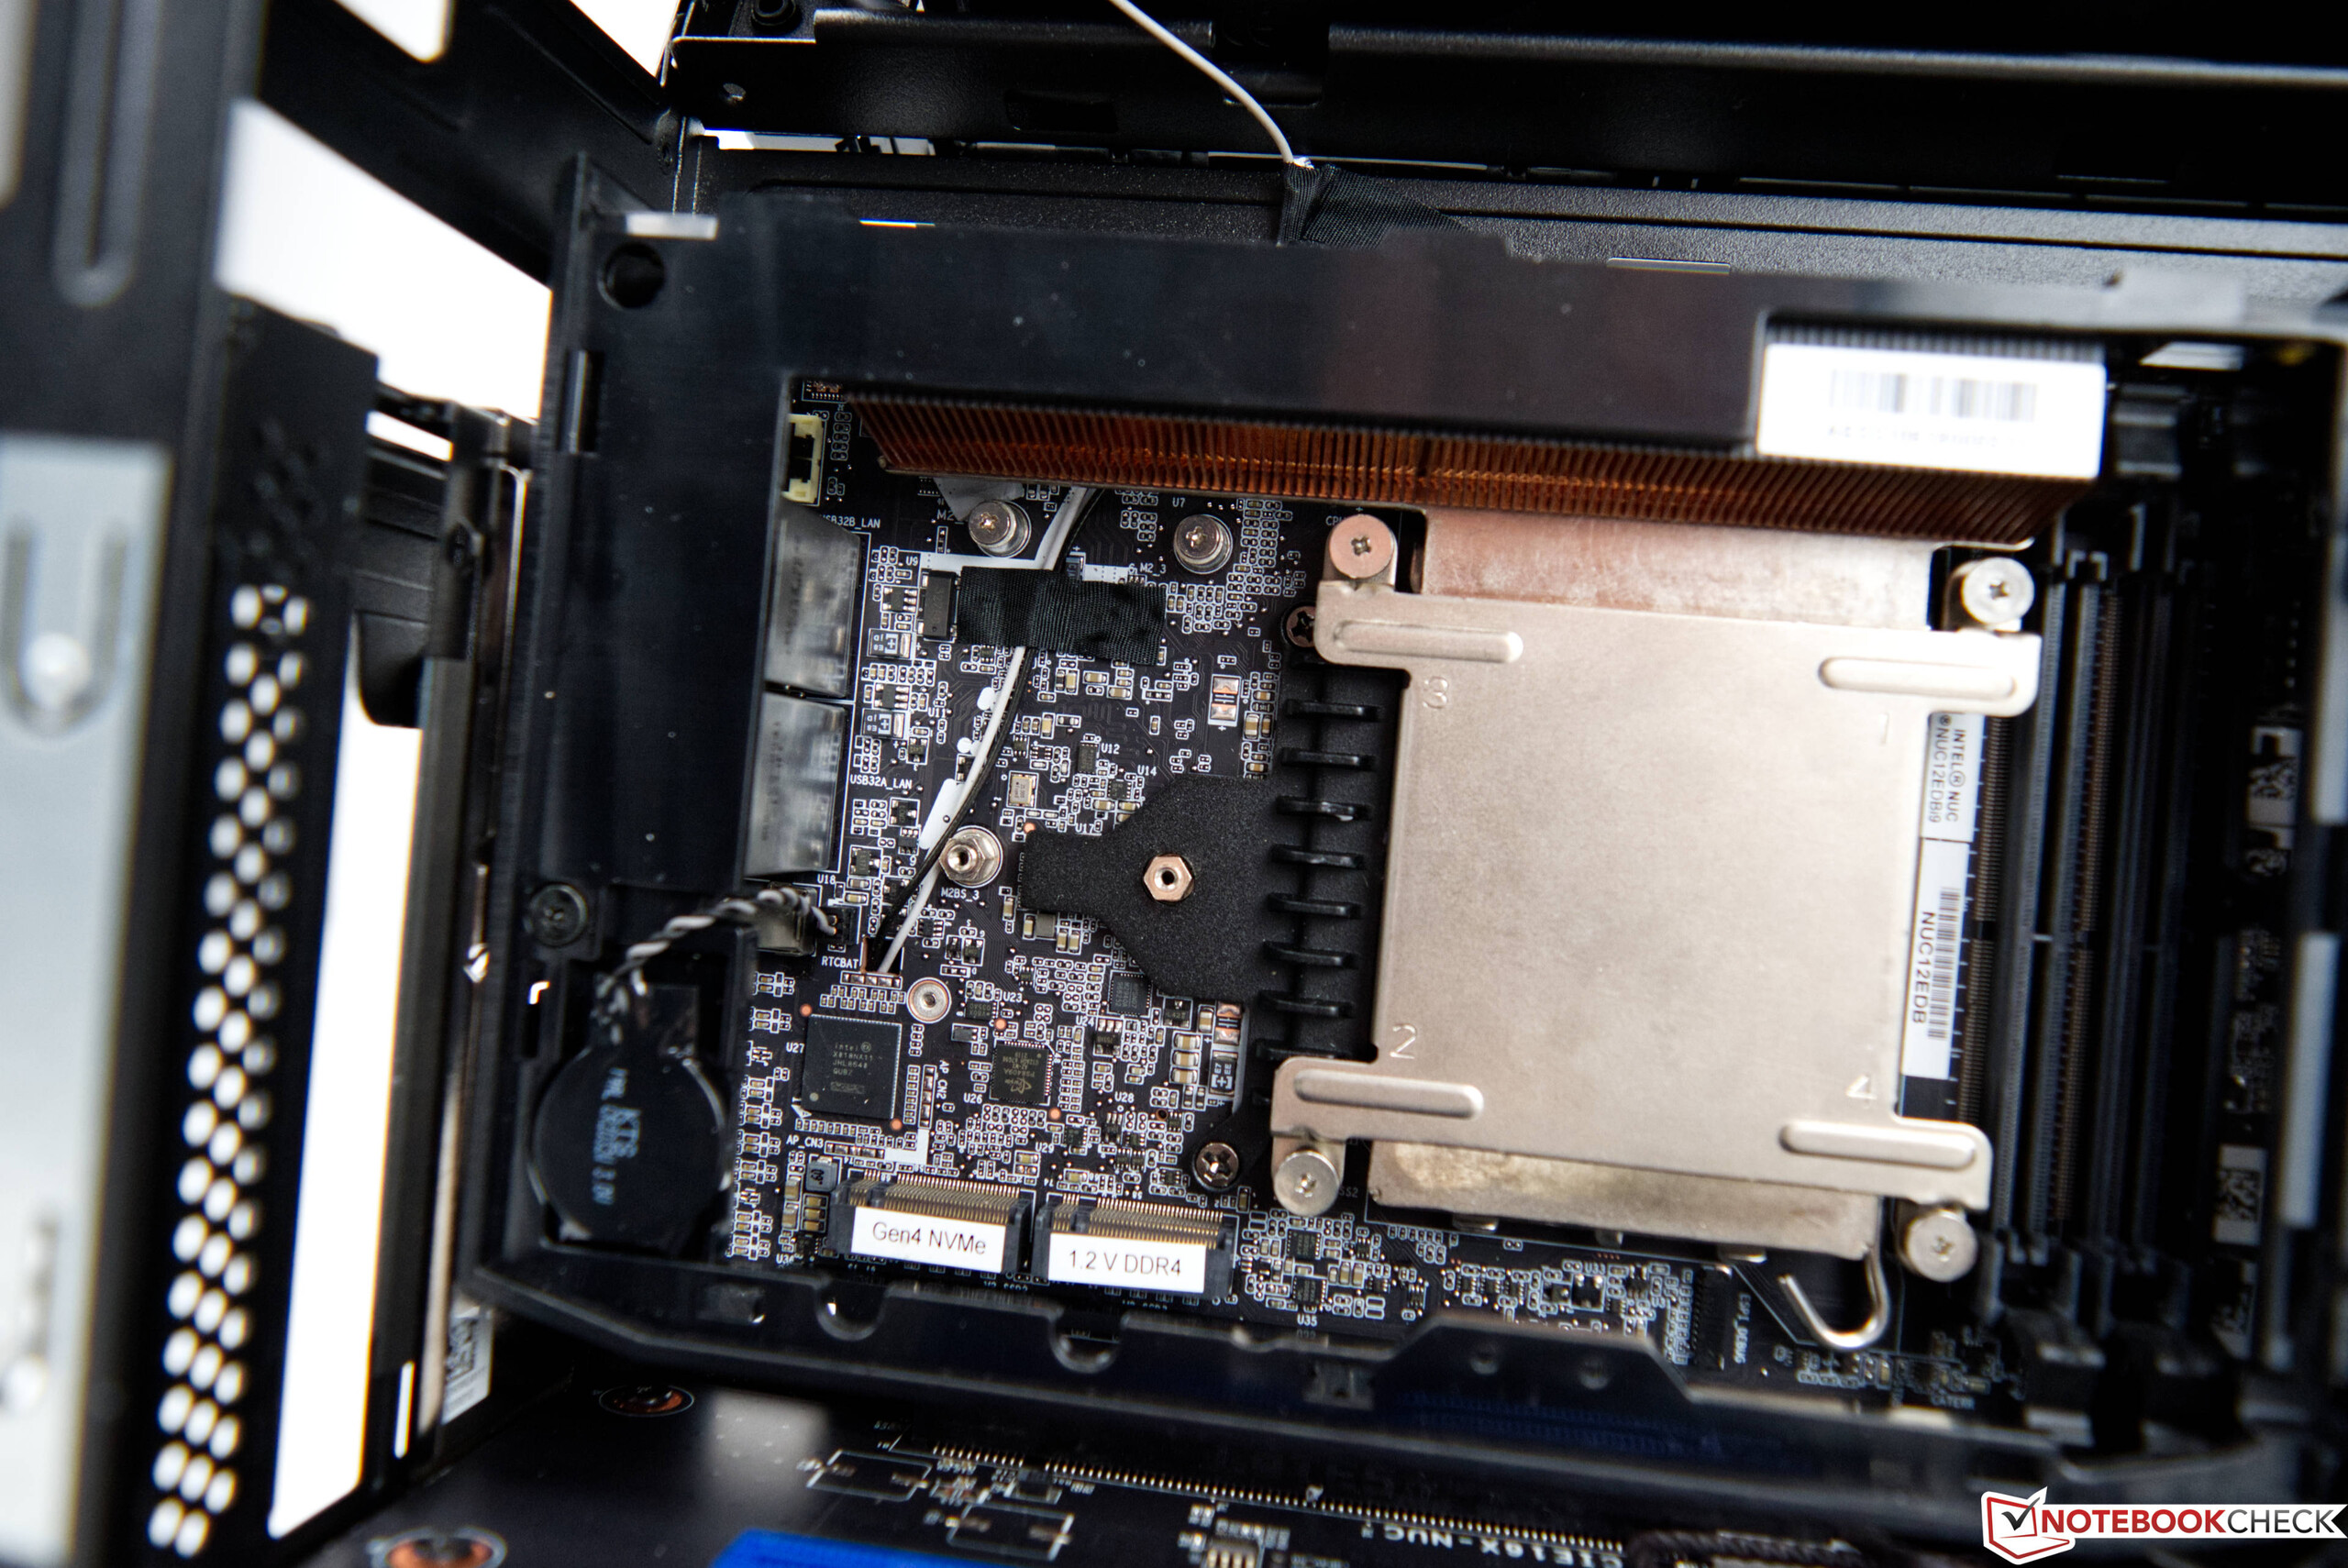
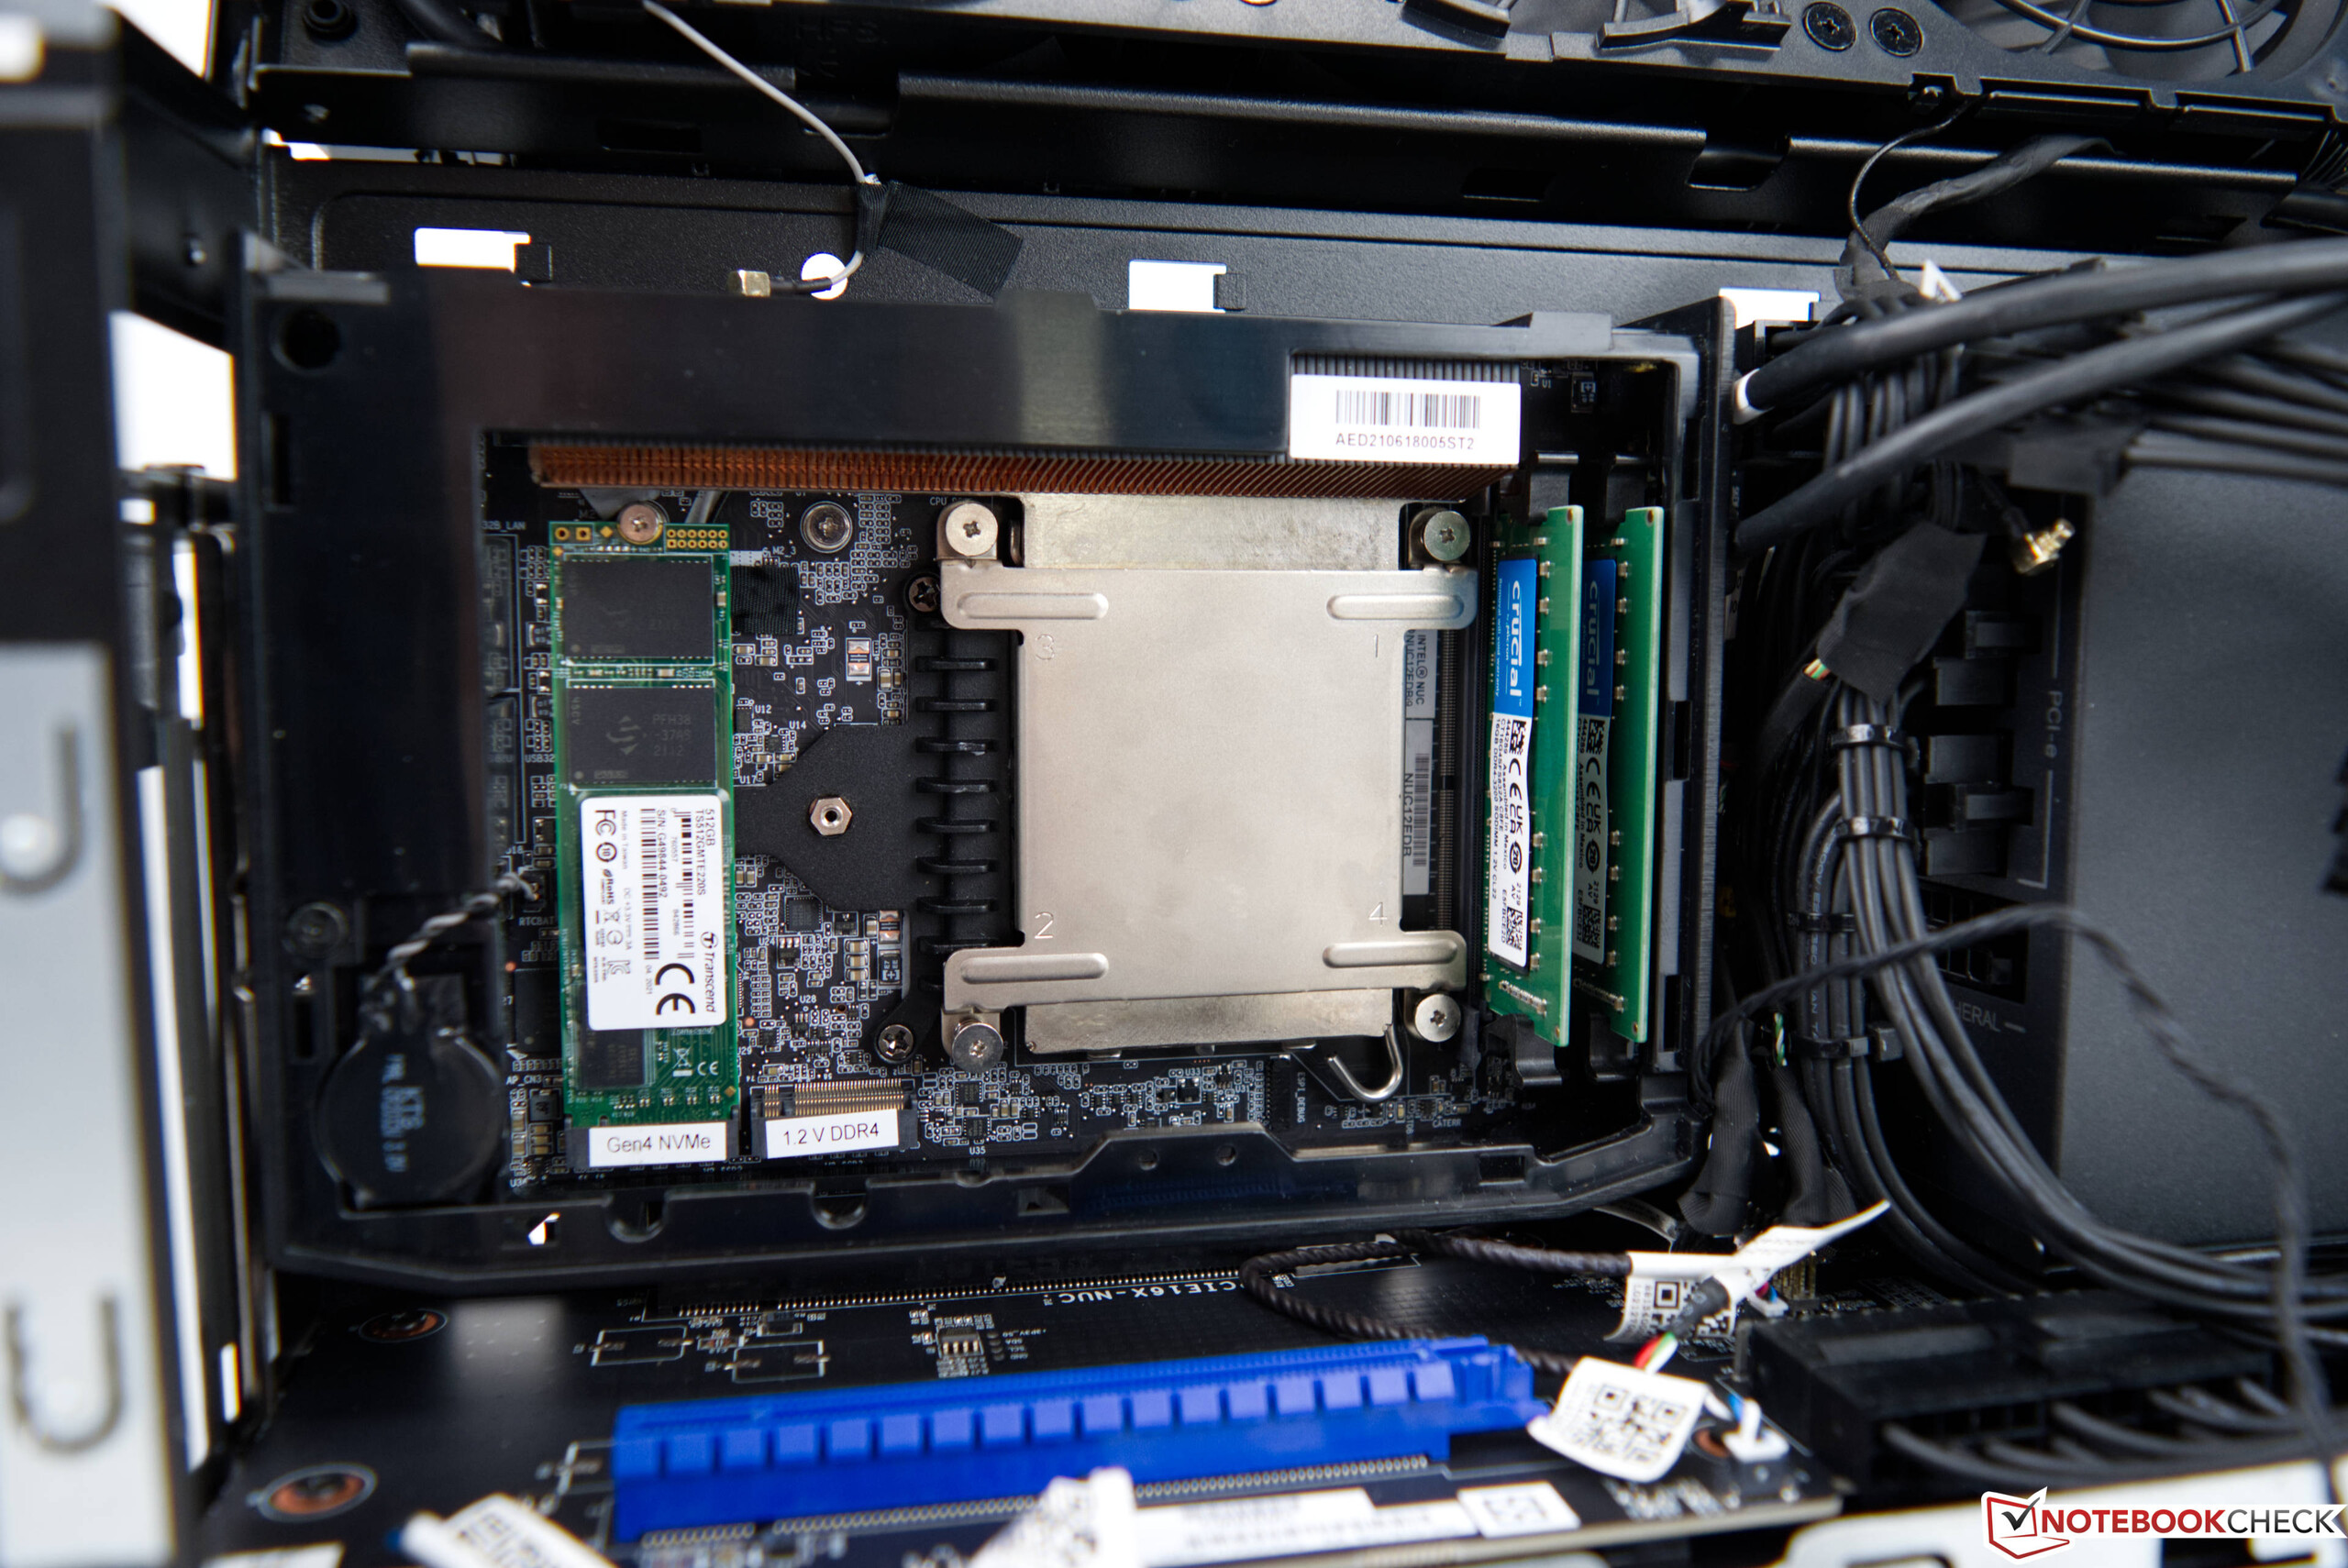
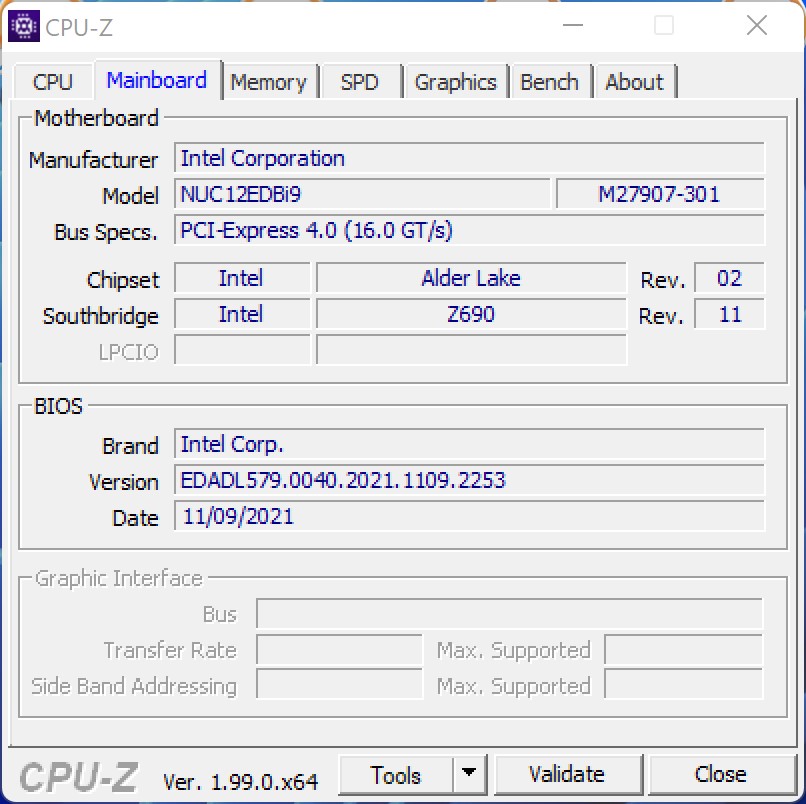
Met de Intel Core i9-12900 biedt deIntel NUC 12 Extreme een 16-core SoC met 24 threads, gebaseerd op de Alder Lake S-serie. Zoals we al hebben vermeld, maakt de Core i9-12900 gebruik van een mix van P- en E-kernen. In tegenstelling tot de Intel NUC 11 Extreme Kitvoorheen, wordt nu een full-size desktop processor gebruikt. Alle externe aansluitingen zijn nog steeds geplaatst op het Compute Element, dat in de bekende vorm van een PCI Express kaart in het systeem is ondergebracht. Aan de achterkant zitten zes USB 3.1 Gen2 Type-A en twee USB-C aansluitingen die Thunderbolt 4 ondersteunen. Met HDMI of Thunderbolt kun je tot drie beeldschermen tegelijk laten werken. Er zijn 10G- en 2,5G-aansluitingen voor bekabelde netwerken. Daarnaast communiceert de Intel WiFi 6E AX211 volgens de nieuwste standaard. Het Compute Element zelf biedt ruimte voor twee SO-DIMM RAM-modules van elk maximaal 64 GB, en er is ook ruimte voor twee M.2 SSD's.
WLAN-prestaties
In de WLAN-test is de Intel WiFi 6E AX211 in staat om zeer goede overdrachtssnelheden te behalen in het 6 GHz bereik in combinatie met onze ASUS GT-AXE11000 testrouter. In onze test meten we gemiddeld een goede 1850 Mbit/s bij het verzenden of ontvangen van gegevens.
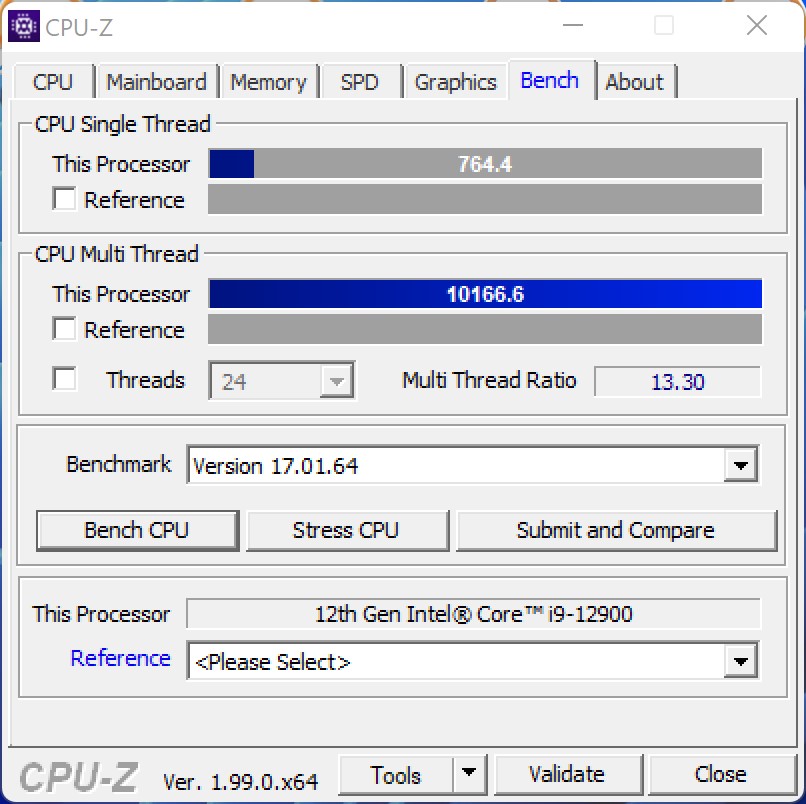
Processor benchmarks
De Intel Core i9-12900 is een desktopmodel uit de huidige Alder Lake S-serie. Het PL1-verbruik bedraagt 65 watt, wat kan worden opgevoerd tot de PL2-waarde van 202 watt.
De Intel Core i9-12900 doet zijn klasse eer aan in de test, en overtreft de prestaties van de Intel Core i9-11900KBmet 15%, als we kijken naar de resultaten over alle benchmarks (prestatiebeoordeling). In vergelijking met standaard desktopsystemen kan de Intel Core i9-12900 in de Intel NUC 12 Extreme Kit ook gelijke tred houden met een AMD Ryzen 7 5800X of Intel Core i9-11900K. Aan de andere kant is de Intel Core i7-12700Kin staat om onze Dragon Canyon NUC te verslaan, en we zien een eerste teken van een lichtelijk vertraagde prestatie als gevolg van het zeer kleine koelsysteem. Het nadeel blijft echter binnen de perken, en de Intel Core i7-12700K was nauwelijks 10% sneller in de test
U kunt aanvullende vergelijkingen en benchmarks vinden in onze CPU vergelijkingstabel.
| Performance rating - Percent | |
| Intel Core i9-12900K, NVIDIA Titan RTX | |
| Intel Core i7-12700K, NVIDIA Titan RTX | |
| Intel Core i9-12900, NVIDIA GeForce RTX 3060 | |
| AMD Ryzen 7 5800X, NVIDIA Titan RTX | |
| AMD Ryzen 9 3950X, NVIDIA Titan RTX | |
| Intel Core i9-11900K, NVIDIA Titan RTX | |
| Intel Core i9-10900K, NVIDIA Titan RTX | |
| Intel Core i9-11900KB, NVIDIA GeForce RTX 3060 | |
| Intel Core i5-11600K, NVIDIA Titan RTX | |
| AMD Ryzen 7 3800XT, NVIDIA Titan RTX | |
| Intel Core i9-9980HK, NVIDIA GeForce RTX 2070 (Desktop) | |
| Intel Core i5-10600K, NVIDIA Titan RTX | |
| Blender - v2.79 BMW27 CPU | |
| Intel Core i9-9980HK, NVIDIA GeForce RTX 2070 (Desktop) | |
| Intel Core i5-10600K, NVIDIA Titan RTX | |
| Intel Core i5-11600K, NVIDIA Titan RTX | |
| Intel Core i9-11900KB, NVIDIA GeForce RTX 3060 | |
| Intel Core i9-12900, NVIDIA GeForce RTX 3060 | |
| AMD Ryzen 7 3800XT, NVIDIA Titan RTX | |
| AMD Ryzen 7 5800X, NVIDIA Titan RTX | |
| Intel Core i9-11900K, NVIDIA Titan RTX | |
| Intel Core i9-10900K, NVIDIA Titan RTX | |
| Intel Core i7-12700K, NVIDIA Titan RTX | |
| AMD Ryzen 9 3950X, NVIDIA Titan RTX | |
| Intel Core i9-12900K, NVIDIA Titan RTX | |
| wPrime 2.10 | |
| 32m | |
| Intel Core i9-12900K, NVIDIA Titan RTX | |
| Intel Core i5-11600K, NVIDIA Titan RTX | |
| Intel Core i5-10600K, NVIDIA Titan RTX | |
| AMD Ryzen 9 3950X, NVIDIA Titan RTX | |
| Intel Core i9-11900K, NVIDIA Titan RTX | |
| Intel Core i9-9980HK, NVIDIA GeForce RTX 2070 (Desktop) | |
| AMD Ryzen 7 3800XT, NVIDIA Titan RTX | |
| Intel Core i9-10900K, NVIDIA Titan RTX | |
| Intel Core i9-11900KB, NVIDIA GeForce RTX 3060 | |
| AMD Ryzen 7 5800X, NVIDIA Titan RTX | |
| Intel Core i9-12900, NVIDIA GeForce RTX 3060 | |
| Intel Core i7-12700K, NVIDIA Titan RTX | |
| 1024m | |
| Intel Core i9-12900, NVIDIA GeForce RTX 3060 | |
| Intel Core i9-12900K, NVIDIA Titan RTX | |
| Intel Core i7-12700K, NVIDIA Titan RTX | |
| Intel Core i9-9980HK, NVIDIA GeForce RTX 2070 (Desktop) | |
| Intel Core i5-10600K, NVIDIA Titan RTX | |
| Intel Core i5-11600K, NVIDIA Titan RTX | |
| Intel Core i9-11900KB, NVIDIA GeForce RTX 3060 | |
| AMD Ryzen 7 5800X, NVIDIA Titan RTX | |
| AMD Ryzen 7 3800XT, NVIDIA Titan RTX | |
| Intel Core i9-11900K, NVIDIA Titan RTX | |
| Intel Core i9-10900K, NVIDIA Titan RTX | |
| AMD Ryzen 9 3950X, NVIDIA Titan RTX | |
| X264 HD Benchmark 4.0 | |
| Pass 1 | |
| Intel Core i9-12900K, NVIDIA Titan RTX | |
| Intel Core i7-12700K, NVIDIA Titan RTX | |
| AMD Ryzen 7 5800X, NVIDIA Titan RTX | |
| Intel Core i9-12900, NVIDIA GeForce RTX 3060 | |
| Intel Core i9-11900K, NVIDIA Titan RTX | |
| Intel Core i5-11600K, NVIDIA Titan RTX | |
| Intel Core i9-10900K, NVIDIA Titan RTX | |
| Intel Core i9-11900KB, NVIDIA GeForce RTX 3060 | |
| AMD Ryzen 7 3800XT, NVIDIA Titan RTX | |
| AMD Ryzen 9 3950X, NVIDIA Titan RTX | |
| Intel Core i5-10600K, NVIDIA Titan RTX | |
| Intel Core i9-9980HK, NVIDIA GeForce RTX 2070 (Desktop) | |
| Pass 2 | |
| Intel Core i9-12900K, NVIDIA Titan RTX | |
| Intel Core i7-12700K, NVIDIA Titan RTX | |
| AMD Ryzen 9 3950X, NVIDIA Titan RTX | |
| AMD Ryzen 7 5800X, NVIDIA Titan RTX | |
| Intel Core i9-10900K, NVIDIA Titan RTX | |
| Intel Core i9-12900, NVIDIA GeForce RTX 3060 | |
| Intel Core i9-11900K, NVIDIA Titan RTX | |
| AMD Ryzen 7 3800XT, NVIDIA Titan RTX | |
| Intel Core i9-11900KB, NVIDIA GeForce RTX 3060 | |
| Intel Core i5-11600K, NVIDIA Titan RTX | |
| Intel Core i9-9980HK, NVIDIA GeForce RTX 2070 (Desktop) | |
| Intel Core i5-10600K, NVIDIA Titan RTX | |
| WinRAR - Result | |
| AMD Ryzen 7 5800X, NVIDIA Titan RTX | |
| Intel Core i9-12900K, NVIDIA Titan RTX | |
| Intel Core i9-12900, NVIDIA GeForce RTX 3060 | |
| Intel Core i7-12700K, NVIDIA Titan RTX | |
| Intel Core i9-10900K, NVIDIA Titan RTX | |
| Intel Core i9-11900KB, NVIDIA GeForce RTX 3060 | |
| Intel Core i9-11900K, NVIDIA Titan RTX | |
| Intel Core i5-11600K, NVIDIA Titan RTX | |
| AMD Ryzen 7 3800XT, NVIDIA Titan RTX | |
| AMD Ryzen 9 3950X, NVIDIA Titan RTX | |
| Intel Core i9-9980HK, NVIDIA GeForce RTX 2070 (Desktop) | |
| Intel Core i5-10600K, NVIDIA Titan RTX | |
| Geekbench 5.5 | |
| Multi-Core | |
| Intel Core i9-12900K, NVIDIA Titan RTX | |
| Intel Core i7-12700K, NVIDIA Titan RTX | |
| AMD Ryzen 9 3950X, NVIDIA Titan RTX | |
| Intel Core i9-10900K, NVIDIA Titan RTX | |
| AMD Ryzen 7 5800X, NVIDIA Titan RTX | |
| Intel Core i9-11900K, NVIDIA Titan RTX | |
| AMD Ryzen 7 3800XT, NVIDIA Titan RTX | |
| Intel Core i9-11900KB, NVIDIA GeForce RTX 3060 | |
| Intel Core i9-12900, NVIDIA GeForce RTX 3060 | |
| Intel Core i5-11600K, NVIDIA Titan RTX | |
| Intel Core i9-9980HK, NVIDIA GeForce RTX 2070 (Desktop) | |
| Intel Core i5-10600K, NVIDIA Titan RTX | |
| Single-Core | |
| Intel Core i9-12900K, NVIDIA Titan RTX | |
| Intel Core i7-12700K, NVIDIA Titan RTX | |
| Intel Core i9-11900K, NVIDIA Titan RTX | |
| Intel Core i5-11600K, NVIDIA Titan RTX | |
| AMD Ryzen 7 5800X, NVIDIA Titan RTX | |
| Intel Core i9-11900KB, NVIDIA GeForce RTX 3060 | |
| Intel Core i9-12900, NVIDIA GeForce RTX 3060 | |
| Intel Core i9-10900K, NVIDIA Titan RTX | |
| Intel Core i9-9980HK, NVIDIA GeForce RTX 2070 (Desktop) | |
| AMD Ryzen 7 3800XT, NVIDIA Titan RTX | |
| AMD Ryzen 9 3950X, NVIDIA Titan RTX | |
| Intel Core i5-10600K, NVIDIA Titan RTX | |
| 3DMark 11 - 1280x720 Performance Physics | |
| Intel Core i9-12900K, NVIDIA Titan RTX | |
| Intel Core i7-12700K, NVIDIA Titan RTX | |
| Intel Core i9-12900, NVIDIA GeForce RTX 3060 | |
| AMD Ryzen 7 5800X, NVIDIA Titan RTX | |
| Intel Core i9-10900K, NVIDIA Titan RTX | |
| Intel Core i9-11900K, NVIDIA Titan RTX | |
| AMD Ryzen 9 3950X, NVIDIA Titan RTX | |
| AMD Ryzen 7 3800XT, NVIDIA Titan RTX | |
| Intel Core i9-11900KB, NVIDIA GeForce RTX 3060 | |
| Intel Core i5-11600K, NVIDIA Titan RTX | |
| Intel Core i9-9980HK, NVIDIA GeForce RTX 2070 (Desktop) | |
| Intel Core i5-10600K, NVIDIA Titan RTX | |
| 7-Zip 18.03 | |
| 7z b 4 | |
| AMD Ryzen 9 3950X, NVIDIA Titan RTX | |
| Intel Core i9-12900K, NVIDIA Titan RTX | |
| Intel Core i7-12700K, NVIDIA Titan RTX | |
| AMD Ryzen 7 5800X, NVIDIA Titan RTX | |
| Intel Core i9-10900K, NVIDIA Titan RTX | |
| Intel Core i9-11900K, NVIDIA Titan RTX | |
| AMD Ryzen 7 3800XT, NVIDIA Titan RTX | |
| Intel Core i9-11900KB, NVIDIA GeForce RTX 3060 | |
| Intel Core i9-12900, NVIDIA GeForce RTX 3060 | |
| Intel Core i5-11600K, NVIDIA Titan RTX | |
| Intel Core i9-9980HK, NVIDIA GeForce RTX 2070 (Desktop) | |
| Intel Core i5-10600K, NVIDIA Titan RTX | |
| 7z b 4 -mmt1 | |
| AMD Ryzen 7 5800X, NVIDIA Titan RTX | |
| Intel Core i9-11900K, NVIDIA Titan RTX | |
| Intel Core i9-12900K, NVIDIA Titan RTX | |
| Intel Core i5-11600K, NVIDIA Titan RTX | |
| Intel Core i7-12700K, NVIDIA Titan RTX | |
| Intel Core i9-11900KB, NVIDIA GeForce RTX 3060 | |
| Intel Core i9-12900, NVIDIA GeForce RTX 3060 | |
| Intel Core i9-10900K, NVIDIA Titan RTX | |
| Intel Core i9-9980HK, NVIDIA GeForce RTX 2070 (Desktop) | |
| AMD Ryzen 7 3800XT, NVIDIA Titan RTX | |
| AMD Ryzen 9 3950X, NVIDIA Titan RTX | |
| Intel Core i5-10600K, NVIDIA Titan RTX | |
| HWBOT x265 Benchmark v2.2 - 4k Preset | |
| Intel Core i9-12900K, NVIDIA Titan RTX | |
| Intel Core i7-12700K, NVIDIA Titan RTX | |
| Intel Core i9-10900K, NVIDIA Titan RTX | |
| AMD Ryzen 7 5800X, NVIDIA Titan RTX | |
| Intel Core i9-11900K, NVIDIA Titan RTX | |
| AMD Ryzen 7 3800XT, NVIDIA Titan RTX | |
| AMD Ryzen 9 3950X, NVIDIA Titan RTX | |
| Intel Core i5-11600K, NVIDIA Titan RTX | |
| Intel Core i9-11900KB, NVIDIA GeForce RTX 3060 | |
| Intel Core i9-12900, NVIDIA GeForce RTX 3060 | |
| Intel Core i5-10600K, NVIDIA Titan RTX | |
| Intel Core i9-9980HK, NVIDIA GeForce RTX 2070 (Desktop) | |
| R Benchmark 2.5 - Overall mean | |
| Intel Core i5-10600K, NVIDIA Titan RTX | |
| Intel Core i9-9980HK, NVIDIA GeForce RTX 2070 (Desktop) | |
| Intel Core i9-11900KB, NVIDIA GeForce RTX 3060 | |
| Intel Core i9-12900, NVIDIA GeForce RTX 3060 | |
| Intel Core i9-10900K, NVIDIA Titan RTX | |
| AMD Ryzen 9 3950X, NVIDIA Titan RTX | |
| AMD Ryzen 7 3800XT, NVIDIA Titan RTX | |
| Intel Core i5-11600K, NVIDIA Titan RTX | |
| Intel Core i9-11900K, NVIDIA Titan RTX | |
| AMD Ryzen 7 5800X, NVIDIA Titan RTX | |
| Intel Core i7-12700K, NVIDIA Titan RTX | |
| Intel Core i9-12900K, NVIDIA Titan RTX | |
| LibreOffice - 20 Documents To PDF | |
| Intel Core i9-10900K, NVIDIA Titan RTX | |
| Intel Core i9-11900K, NVIDIA Titan RTX | |
| AMD Ryzen 9 3950X, NVIDIA Titan RTX | |
| Intel Core i5-10600K, NVIDIA Titan RTX | |
| Intel Core i9-9980HK, NVIDIA GeForce RTX 2070 (Desktop) | |
| Intel Core i9-11900KB, NVIDIA GeForce RTX 3060 | |
| Intel Core i9-12900, NVIDIA GeForce RTX 3060 | |
| AMD Ryzen 7 3800XT, NVIDIA Titan RTX | |
| AMD Ryzen 7 5800X, NVIDIA Titan RTX | |
| Intel Core i9-12900K, NVIDIA Titan RTX | |
| Intel Core i7-12700K, NVIDIA Titan RTX | |
| Intel Core i5-11600K, NVIDIA Titan RTX | |
| WebXPRT 3 - Overall | |
| Intel Core i9-12900K, NVIDIA Titan RTX | |
| Intel Core i7-12700K, NVIDIA Titan RTX | |
| AMD Ryzen 7 5800X, NVIDIA Titan RTX | |
| Intel Core i5-11600K, NVIDIA Titan RTX | |
| Intel Core i9-11900KB, NVIDIA GeForce RTX 3060 | |
| Intel Core i9-12900, NVIDIA GeForce RTX 3060 | |
| Intel Core i9-10900K, NVIDIA Titan RTX | |
| AMD Ryzen 7 3800XT, NVIDIA Titan RTX | |
| AMD Ryzen 9 3950X, NVIDIA Titan RTX | |
| Intel Core i5-10600K, NVIDIA Titan RTX | |
| Intel Core i9-9980HK, NVIDIA GeForce RTX 2070 (Desktop) | |
| Intel Core i9-11900K, NVIDIA Titan RTX | |
| Mozilla Kraken 1.1 - Total | |
| Intel Core i5-10600K, NVIDIA Titan RTX | |
| Intel Core i9-9980HK, NVIDIA GeForce RTX 2070 (Desktop) | |
| Intel Core i9-10900K, NVIDIA Titan RTX | |
| AMD Ryzen 9 3950X, NVIDIA Titan RTX | |
| AMD Ryzen 7 3800XT, NVIDIA Titan RTX | |
| Intel Core i9-11900KB, NVIDIA GeForce RTX 3060 | |
| Intel Core i9-12900, NVIDIA GeForce RTX 3060 | |
| Intel Core i5-11600K, NVIDIA Titan RTX | |
| AMD Ryzen 7 5800X, NVIDIA Titan RTX | |
| Intel Core i9-11900K, NVIDIA Titan RTX | |
| Intel Core i7-12700K, NVIDIA Titan RTX | |
| Intel Core i9-12900K, NVIDIA Titan RTX | |
* ... kleiner is beter
Intel NUC 12 Extreme Kit in de Cinebench R15 Multi loop
In de belastingstest met de Cinebench R15 Mult loop, zien we een aanzienlijke prestatiedaling na de eerste run, voordat hij verder afvlakt bij 2.592 punten. Vergeleken met de twee voorgangers is er echter nog steeds een duidelijk prestatievoordeel, zelfs onder volledige belasting.
Prestaties van de toepassing
In de toepassingsbenchmarks blijkt het pure prestatievoordeel ten opzichte van het voorgangermodel beduidend lager dan verwacht. Echter, als we dit subjectief bekijken, hebben zowel de Beast Canyon NUC van destijds als ook de Dragon Canyon NUC nu een zeer hoge operationele snelheid en laten een zeer goede indruk achter in het dagelijks gebruik. Als je een snelle SSD installeert, is het systeem al na een paar seconden klaar voor gebruik. We zijn geen lange wachttijden tegengekomen in onze testconfiguratie. Maar wanneer we het vergelijken met huidige high-end systemen, zullen deze de Intel NUC 12 Extreme Kit nog steeds overtreffen. De GPU die wordt gebruikt heeft hier een grote invloed. Tegelijkertijd is onze testeenheid nog steeds 14% sneller dan een systeem gebaseerd op een AMD Ryzen 9 5900X met identieke GPU
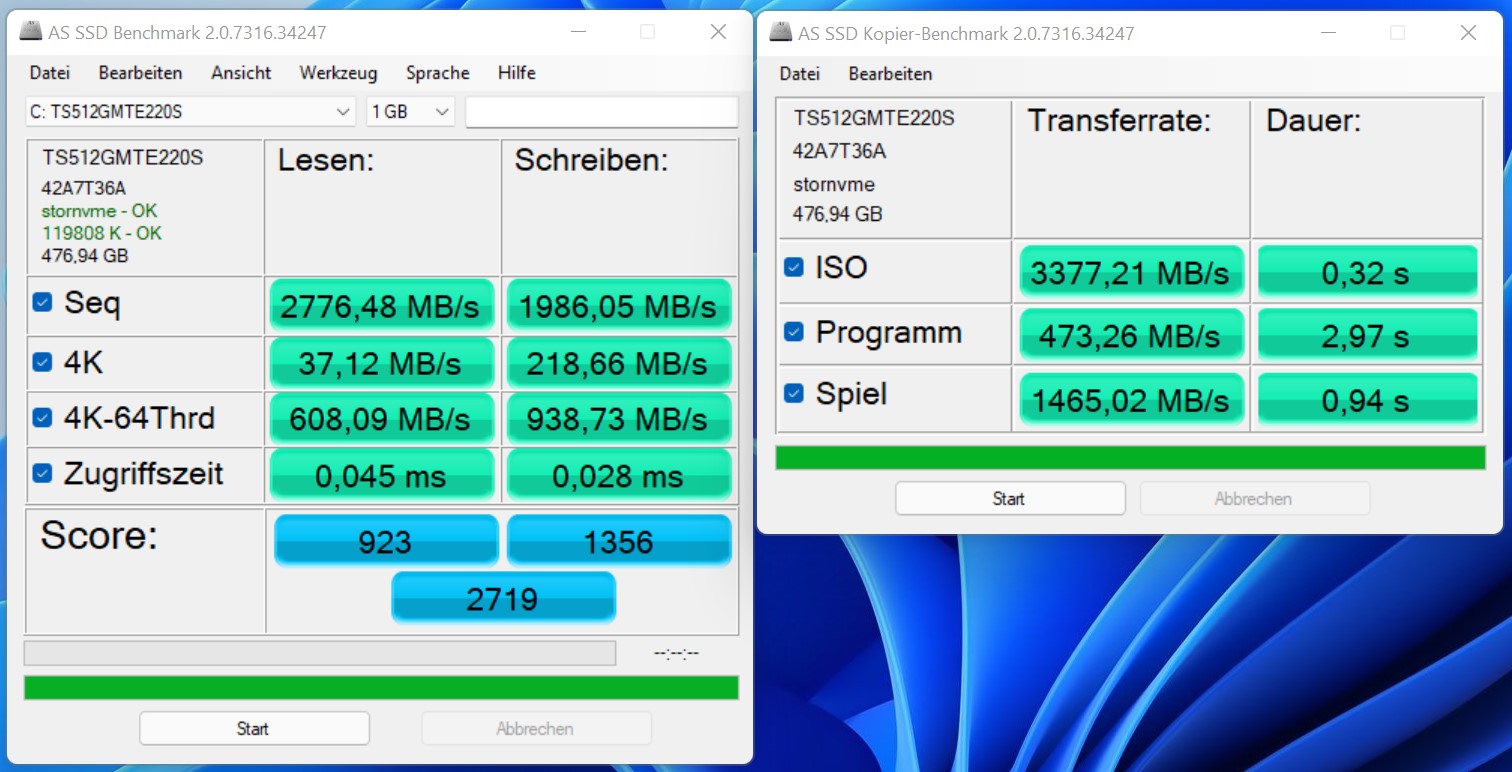
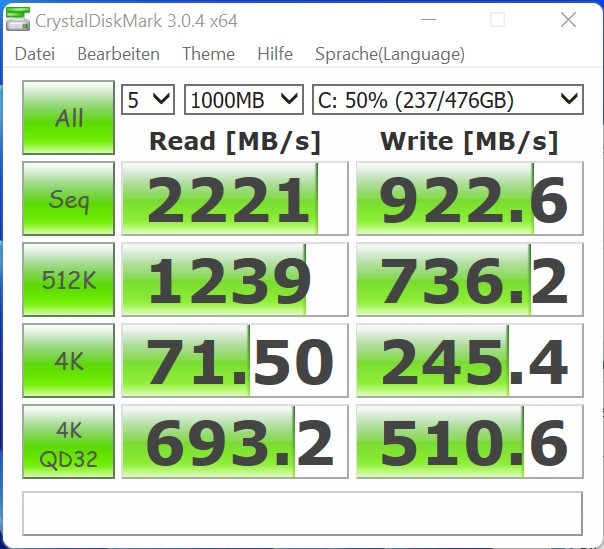
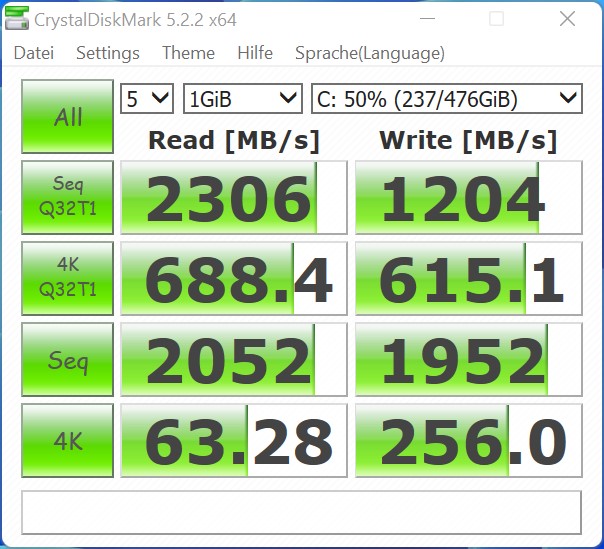
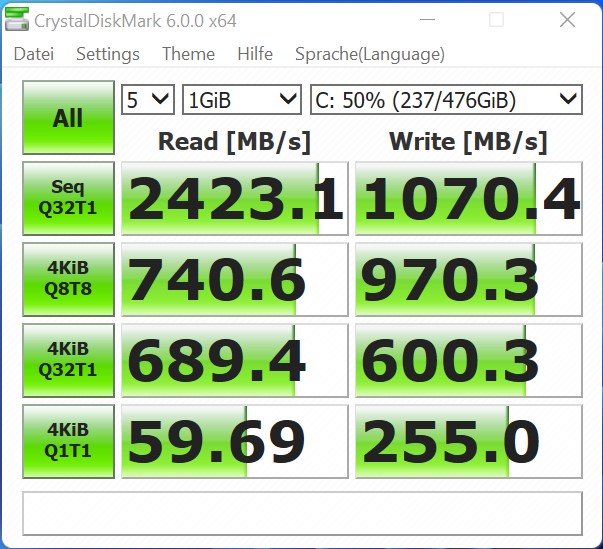
We hebben het barebone systeem uitgerust met een 512-GB NVMe SSD. In onze test leverde het model van Transcend een solide prestatie. Je kunt in totaal twee M.2-2280 SSD's in het Compute Element plaatsen.
| Performance rating - Percent | |
| Intel Core i7-12700K, Intel Core i7-12700K | |
| Intel Core i9-12900K, Intel Core i9-12900K | |
| Intel Core i9-11900K, Intel Core i9-11900K | |
| Intel Core i5-11600K, Intel Core i5-11600K | |
| Intel Core i9-10900K, Intel Core i9-10900K | |
| Intel Core i5-10600K, Intel Core i5-10600K | |
| AMD Ryzen 9 3950X, AMD Ryzen 9 3950X | |
| Corsair One i160, Intel Core i9-9900K | |
| Intel Dragon Canyon NUC - RTX 3060, Intel Core i9-12900 | |
| Intel Beast Canyon NUC, Intel Core i9-11900KB | |
| Intel Ghost Canyon NUC (RTX 2070), Intel Core i9-9980HK | |
| Inno3D GeForce RTX 3060 Twin X2, AMD Ryzen 9 5900X -1! | |
| PCMark 10 - Score | |
| Intel Core i9-12900K, Intel Core i9-12900K | |
| Intel Core i7-12700K, Intel Core i7-12700K | |
| Intel Dragon Canyon NUC - RTX 3060, Intel Core i9-12900 | |
| AMD Ryzen 9 3950X, AMD Ryzen 9 3950X | |
| Intel Core i9-11900K, Intel Core i9-11900K | |
| Intel Core i5-11600K, Intel Core i5-11600K | |
| Intel Core i9-10900K, Intel Core i9-10900K | |
| Corsair One i160, Intel Core i9-9900K | |
| Intel Beast Canyon NUC, Intel Core i9-11900KB | |
| Intel Core i5-10600K, Intel Core i5-10600K | |
| Intel Ghost Canyon NUC (RTX 2070), Intel Core i9-9980HK | |
3D en spelprestaties
Aangezien de Intel Core i9-12900 slechts een eenvoudige iGPU biedt met de Intel UHD Graphics 770, zijn de 3D-prestaties voor veeleisende videogames er gewoon niet. Je kunt echter een speciale grafische kaart in de behuizing installeren, wat de NUC in een zeer compacte gaming PC zal veranderen. Omdat we deBeast Canyon NUCmet een Nvidia GeForce RTX 3060 destijds, hebben we besloten om ook een model van de RTX 3060 te gebruiken voor de Dragon Canyon NUC. In combinatie met de Alder Lake processor nemen de prestaties met ongeveer 4% toe in gaming gebruik. Dit resultaat rechtvaardigt geen upgrade, dus het zou alleen relevant moeten zijn voor een nieuwe aankoop
De samenwerking met de Nvidia GeForce RTX 3060van INNO 3D werkt zeer goed. Alle huidige games kunnen zonder problemen worden genoten met voldoende framerates in 1440 resolutie. Op sommige momenten kun je zelfs veel games in 2160p spelen. Maar omdat een hogere resolutie en hogere detailniveaus meer de GPU limieten betreffen, zijn de prestaties van de CPU slechts van secundair belang, wat de lage prestatietoename ten opzichte van de Beast Canyon NUC verklaart
U kunt meer vergelijkingen en benchmarks vinden in onze GPU vergelijkingstabel.
Wie zijn Dragon Canyon NUC wil uitrusten met een eigen grafische kaart, moet zich van tevoren informeren over de exacte afmetingen van de GPU. De grafische kaart mag geen koeling hebben die meer dan twee sleuven in beslag neemt, en je moet ook rekening houden met de maximale lengte van 30,5 cm (12 in).
| Performance rating - Percent | |
| Zotac Magnus One (ECM73070C) | |
| Inno3D GeForce RTX 3060 Twin X2 | |
| Intel Dragon Canyon NUC - RTX 3060 | |
| Intel Beast Canyon NUC | |
| Intel Ghost Canyon NUC (RTX 2070) | |
| Borderlands 3 | |
| 1280x720 Very Low Overall Quality (DX11) | |
| Intel Dragon Canyon NUC - RTX 3060 | |
| Inno3D GeForce RTX 3060 Twin X2 | |
| Intel Beast Canyon NUC | |
| Intel Ghost Canyon NUC (RTX 2070) | |
| Zotac Magnus One (ECM73070C) | |
| 1920x1080 Badass Overall Quality (DX11) | |
| Intel Beast Canyon NUC | |
| Zotac Magnus One (ECM73070C) | |
| Intel Dragon Canyon NUC - RTX 3060 | |
| Inno3D GeForce RTX 3060 Twin X2 | |
| Intel Ghost Canyon NUC (RTX 2070) | |
| Dota 2 Reborn | |
| 1280x720 min (0/3) fastest | |
| Inno3D GeForce RTX 3060 Twin X2 | |
| Intel Beast Canyon NUC | |
| Intel Dragon Canyon NUC - RTX 3060 | |
| Zotac Magnus One (ECM73070C) | |
| Intel Ghost Canyon NUC (RTX 2070) | |
| 1920x1080 ultra (3/3) best looking | |
| Inno3D GeForce RTX 3060 Twin X2 | |
| Intel Beast Canyon NUC | |
| Intel Dragon Canyon NUC - RTX 3060 | |
| Intel Ghost Canyon NUC (RTX 2070) | |
| Zotac Magnus One (ECM73070C) | |
Intel NUC 12 Dragon Canyon + Nvidia GeForce RTX 3060
| lage | gem. | hoge | ultra | QHD | 4K | |
|---|---|---|---|---|---|---|
| GTA V (2015) | 186 | 181 | 177 | 104 | 81.4 | 82.3 |
| The Witcher 3 (2015) | 462 | 305 | 178 | 91.3 | 62.5 | |
| Dota 2 Reborn (2015) | 178.3 | 161.7 | 155.6 | 147.1 | 116.1 | |
| Final Fantasy XV Benchmark (2018) | 196 | 123 | 88.6 | 64.8 | 38 | |
| X-Plane 11.11 (2018) | 151 | 133 | 105 | 88.5 | ||
| Far Cry 5 (2018) | 193 | 153 | 139 | 132 | 94 | 48 |
| Strange Brigade (2018) | 491 | 230 | 180 | 154 | 116 | 66.8 |
| Far Cry New Dawn (2019) | 161 | 132 | 126 | 113 | 92 | 51 |
| Metro Exodus (2019) | 207 | 113 | 83.7 | 65.3 | 51.7 | 32.2 |
| Borderlands 3 (2019) | 185 | 148 | 104 | 84.7 | 60.3 | 33.3 |
| F1 2020 (2020) | 355 | 259 | 208 | 142 | 106 | 60.2 |
| F1 2021 (2021) | 419 | 261 | 206 | 96.9 | 72 | 40.9 |
| Far Cry 6 (2021) | 167 | 129 | 110 | 96 | 70.5 | 39.3 |
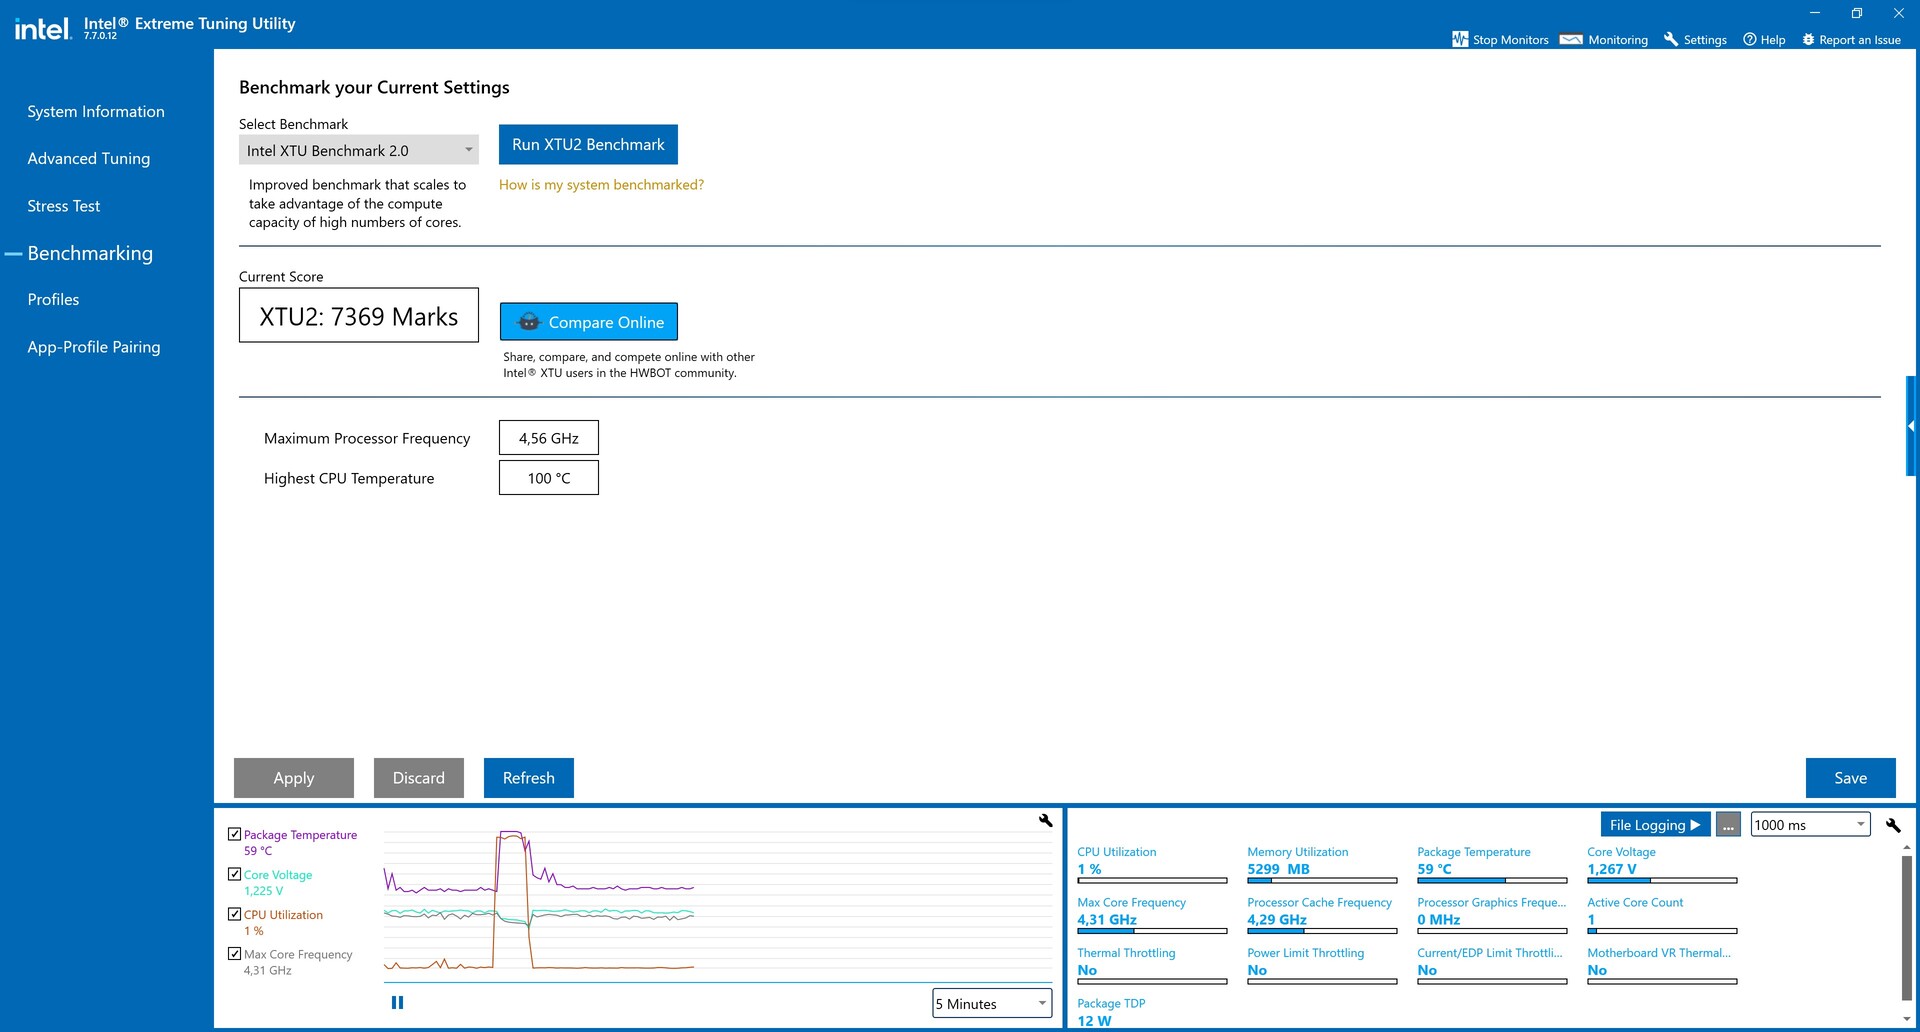
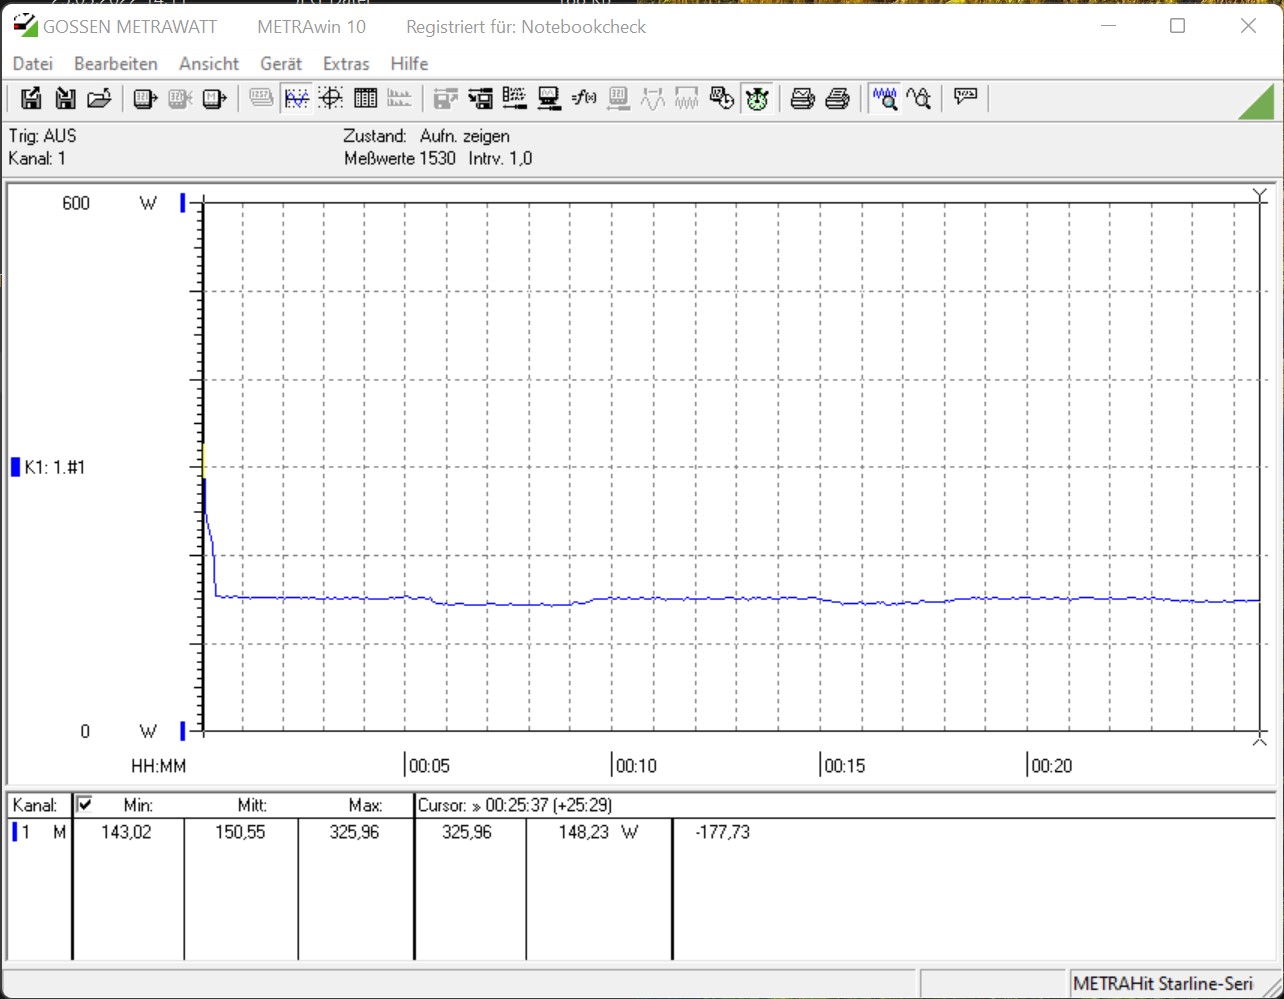
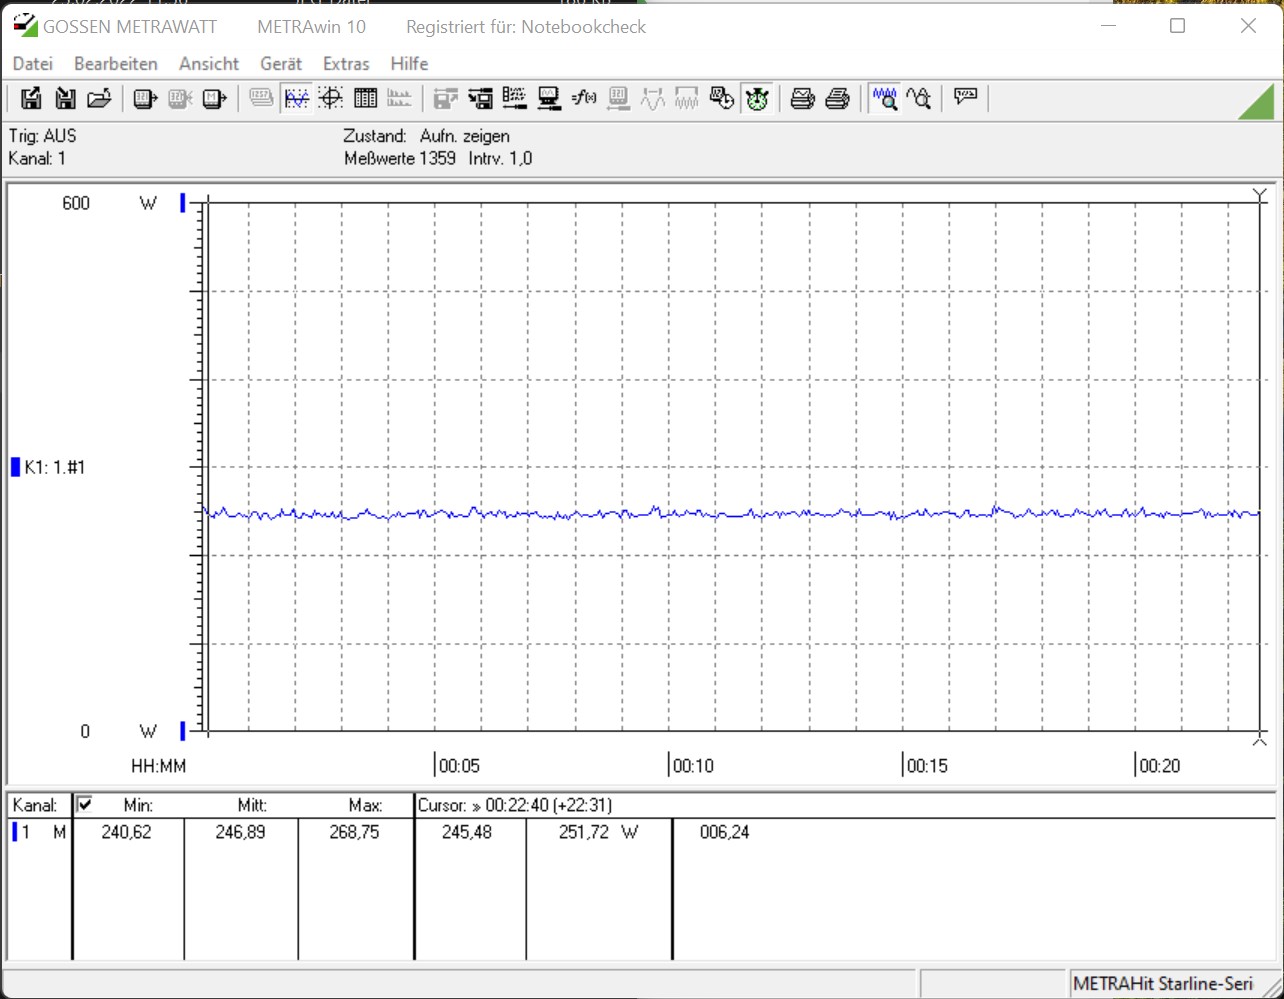
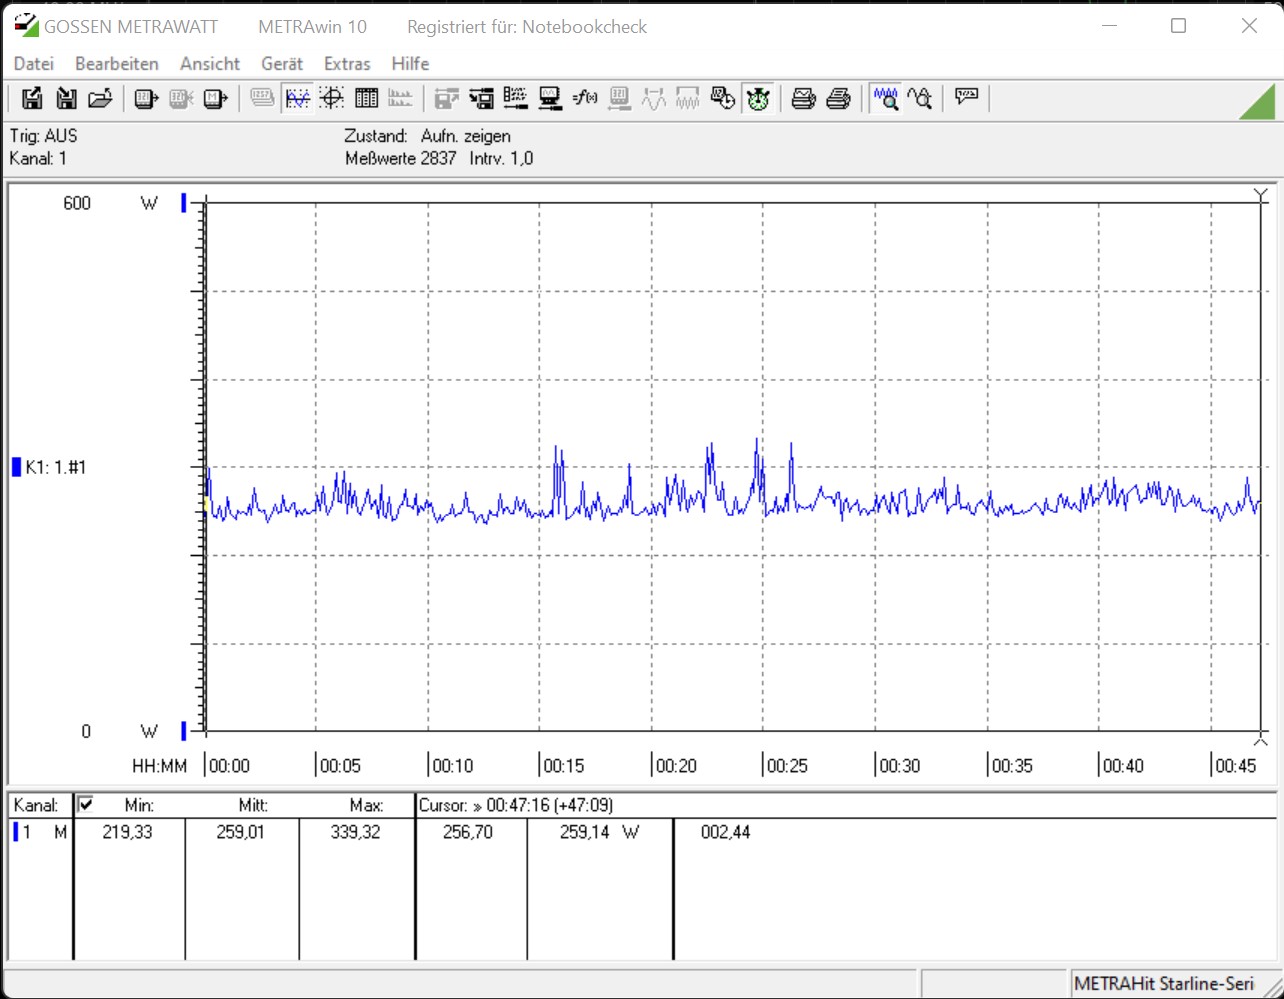
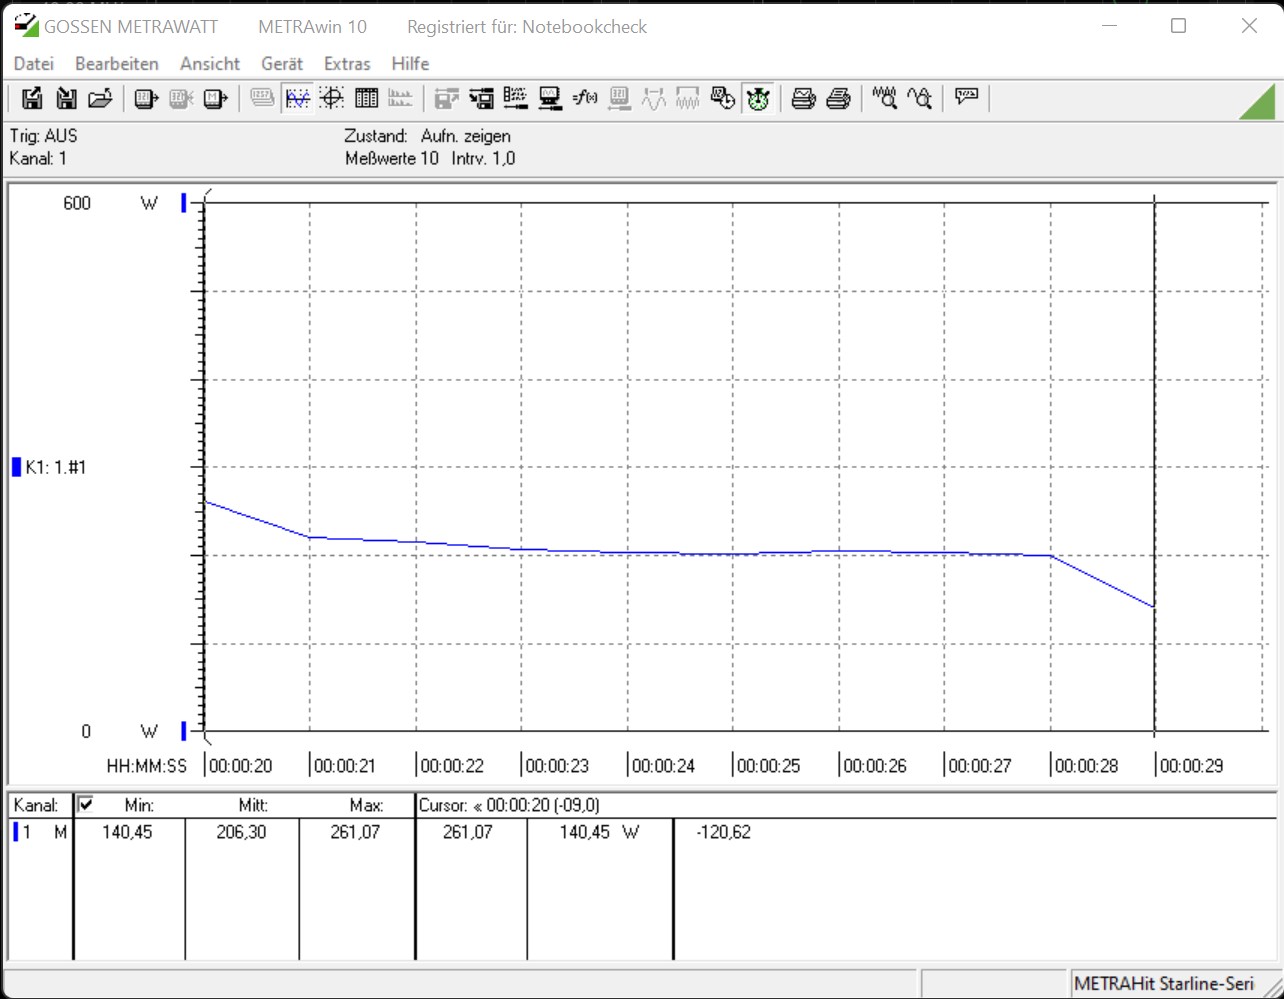
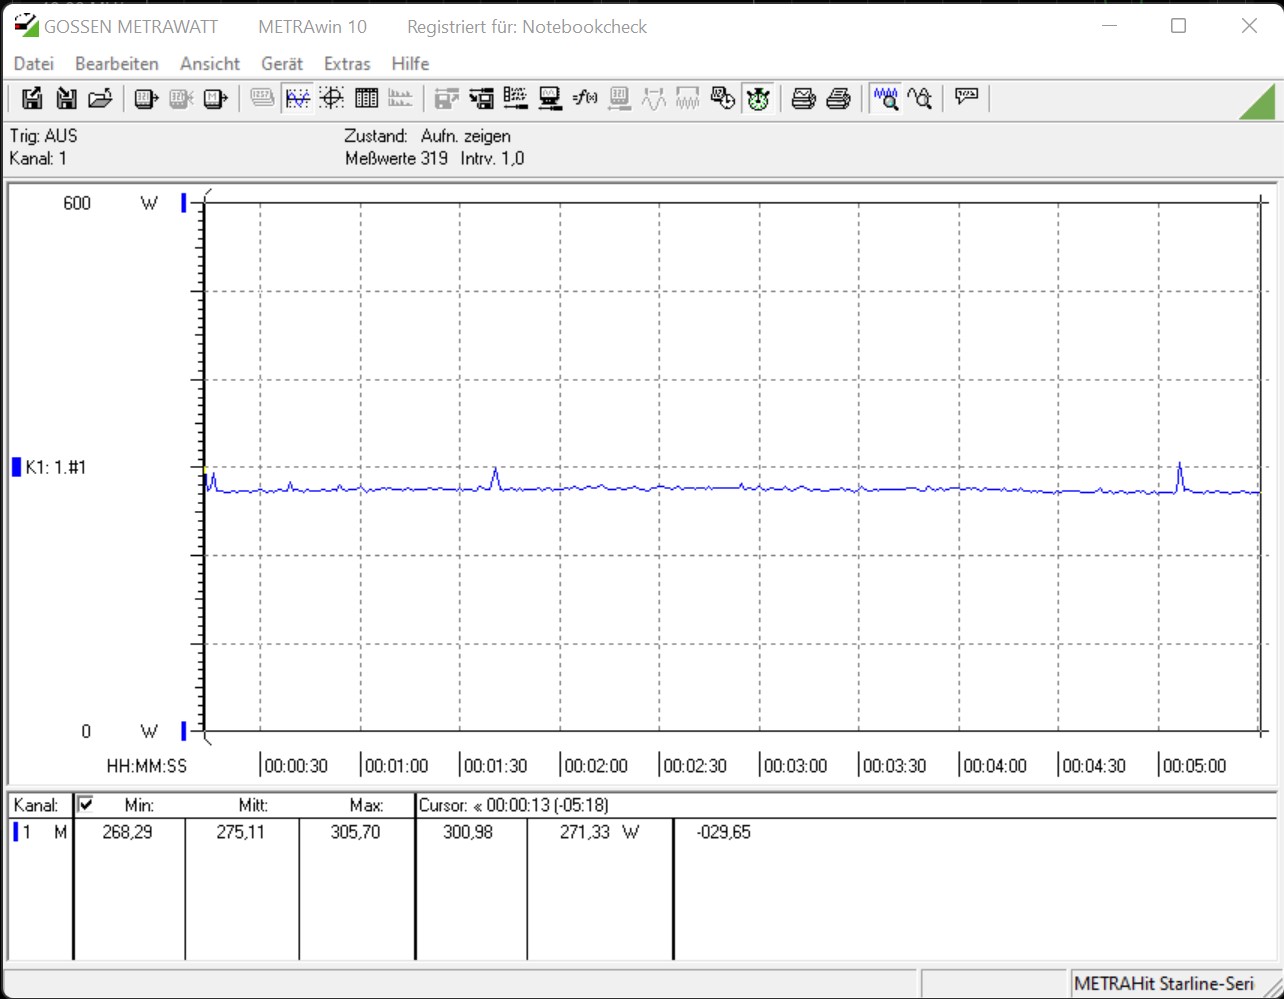
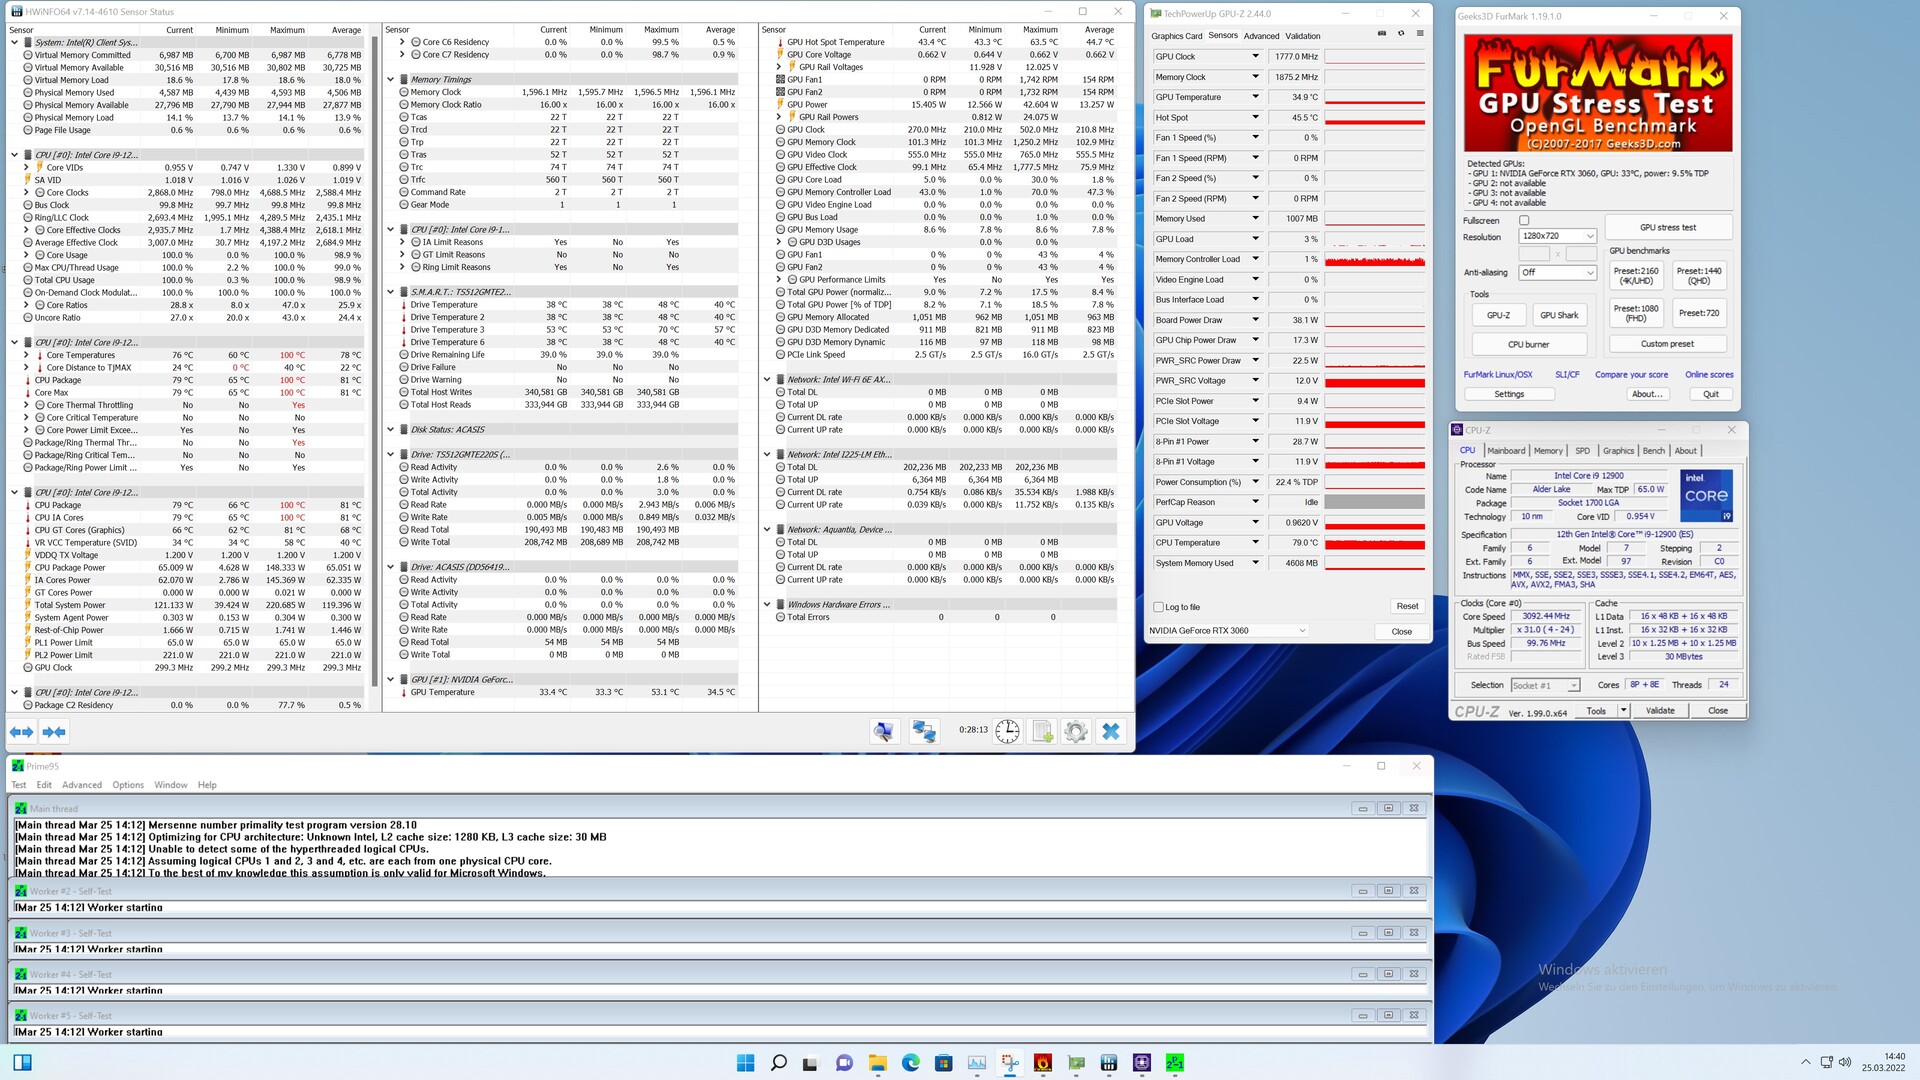
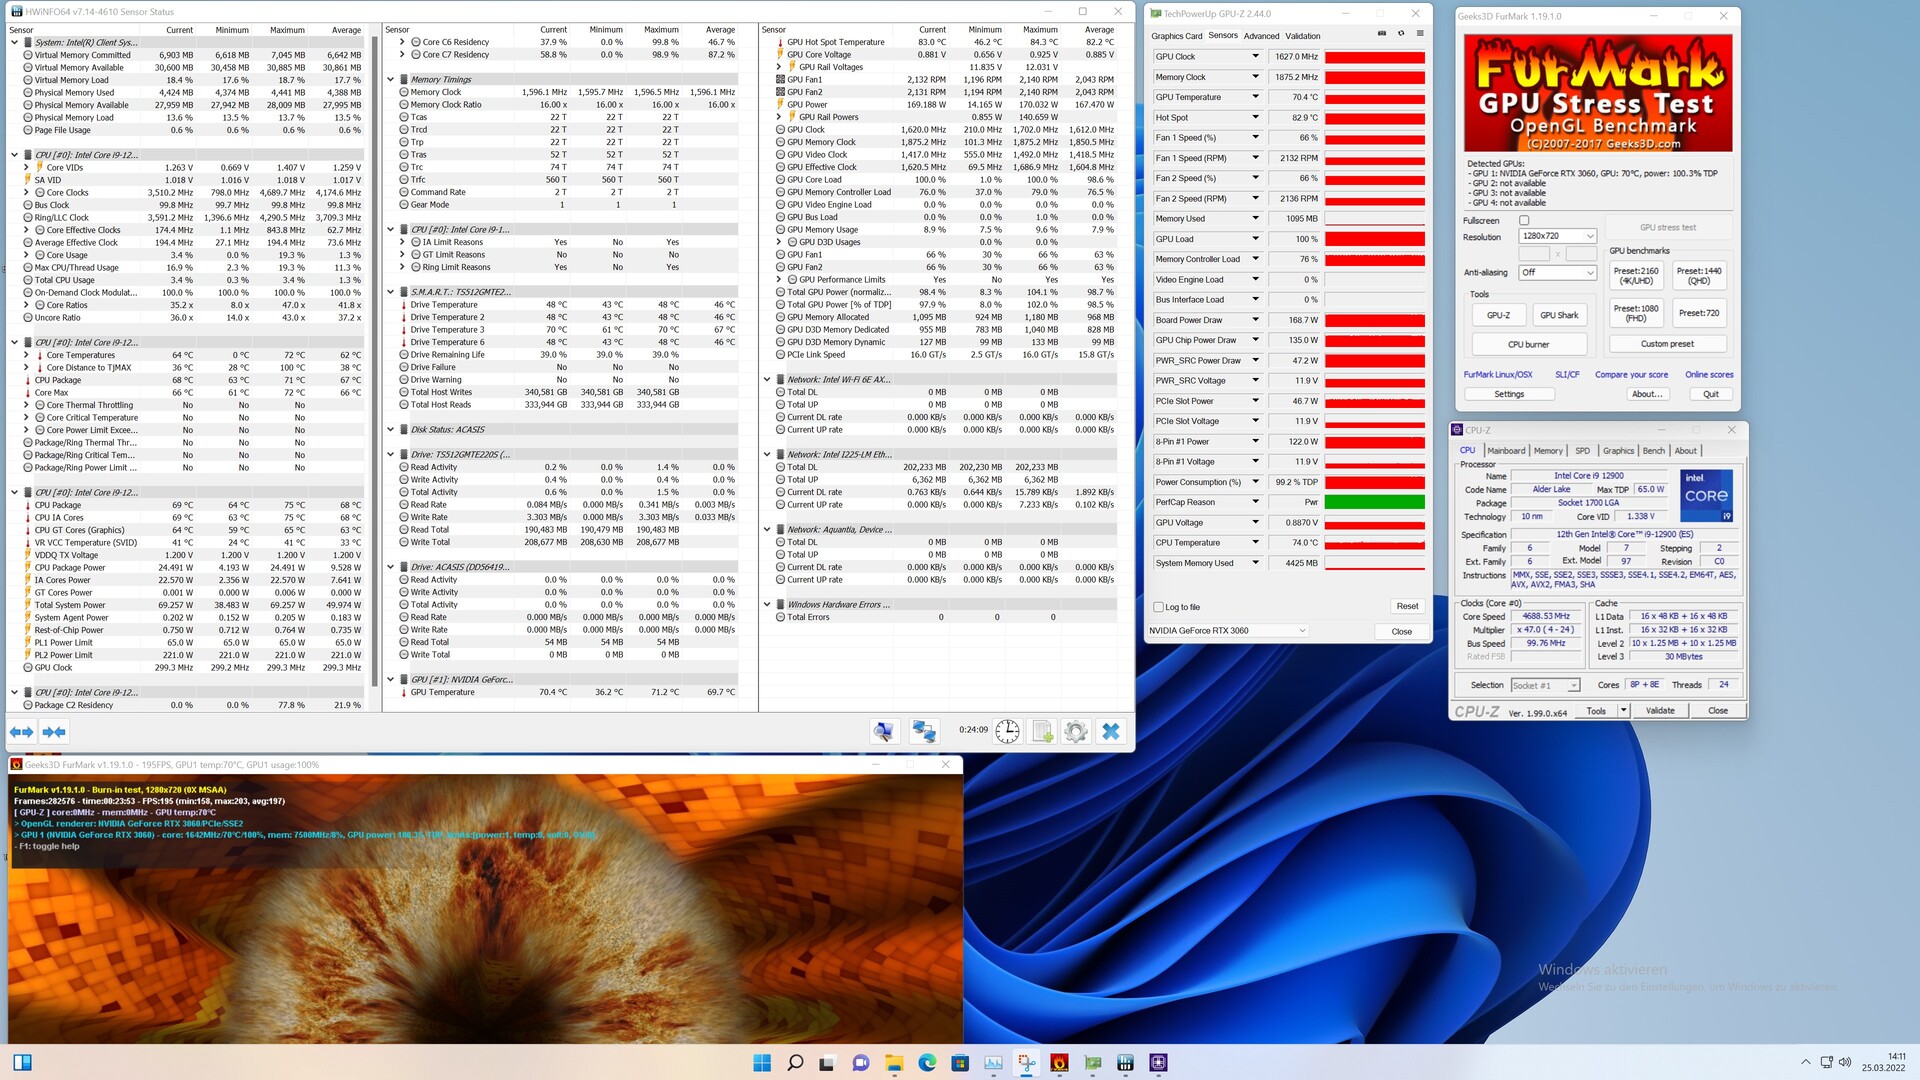
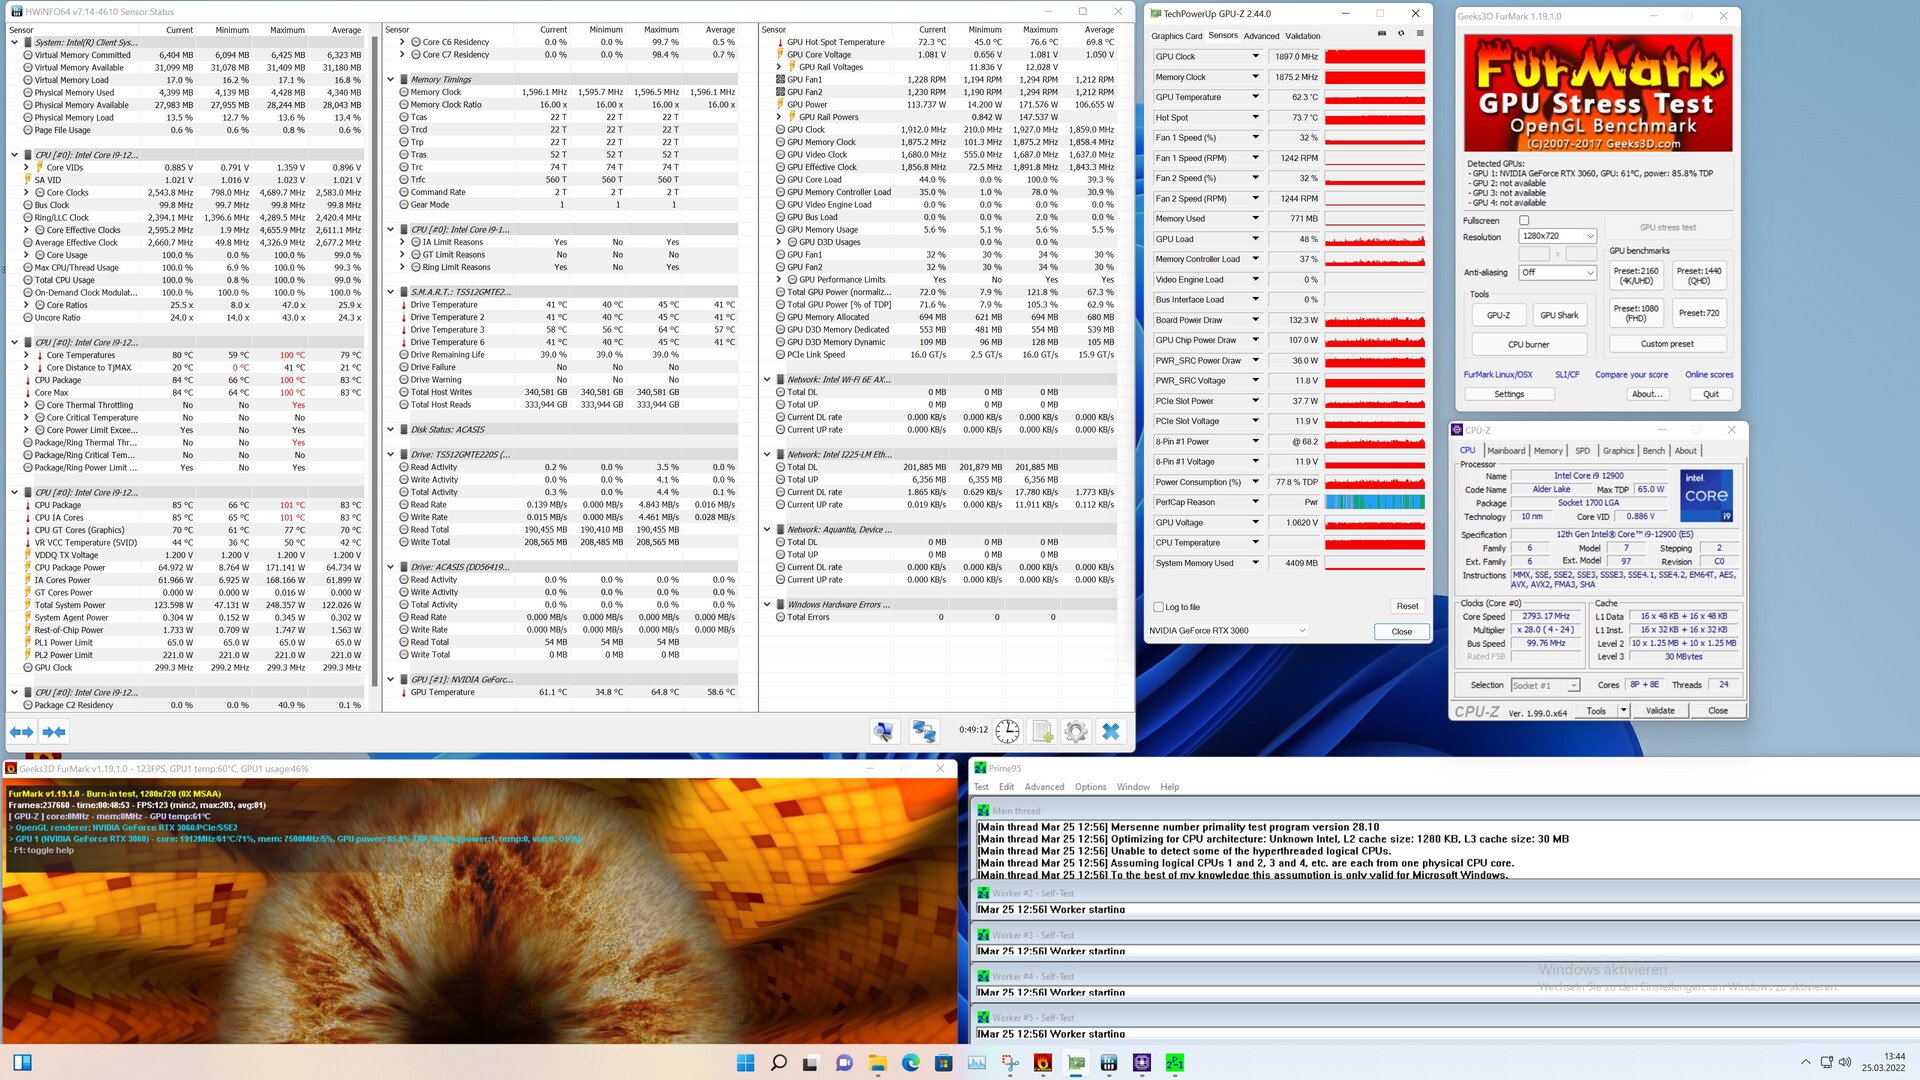
Energieverbruik, warmteontwikkeling en geluidsniveau van de Intel NUC 12 Dragon Canyon
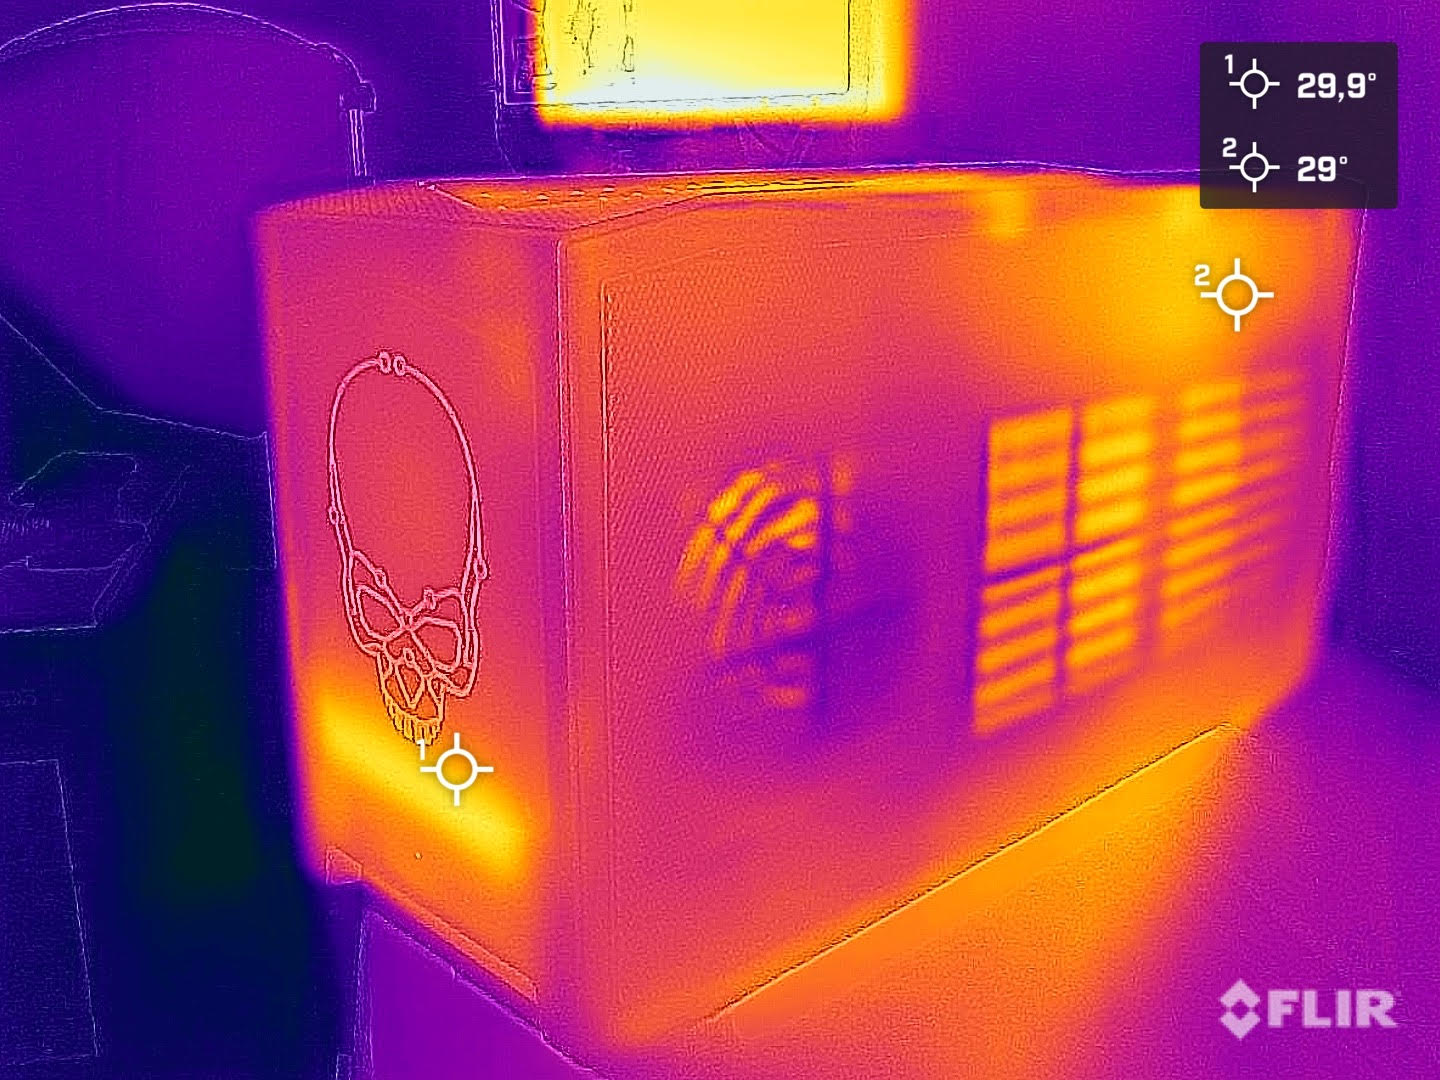
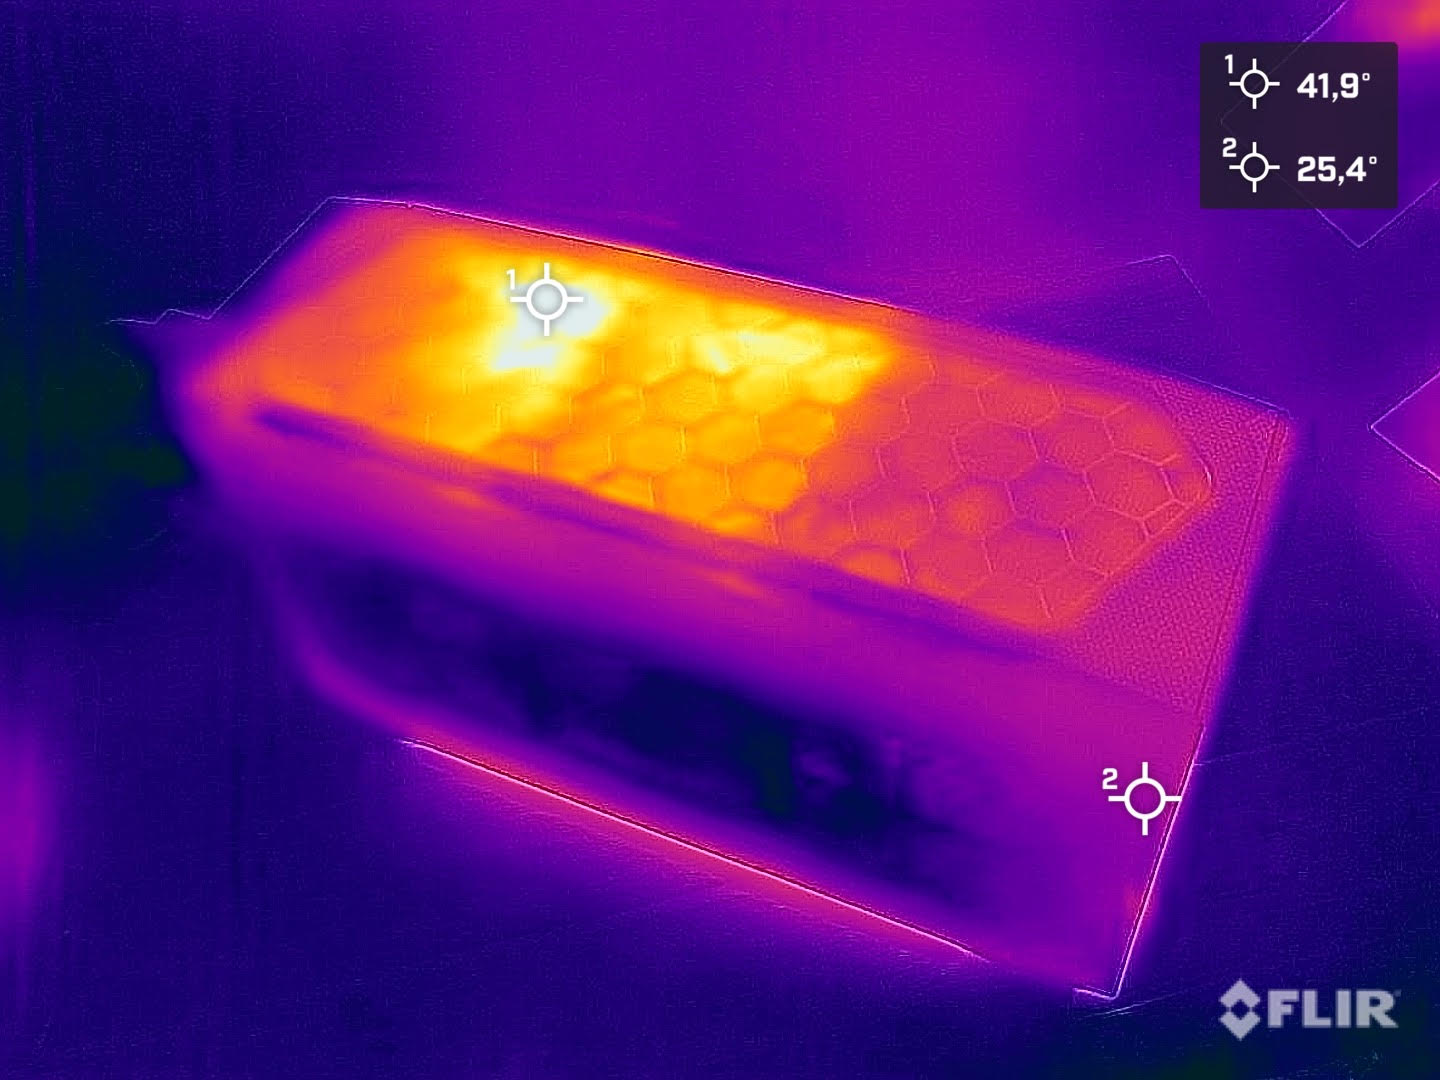
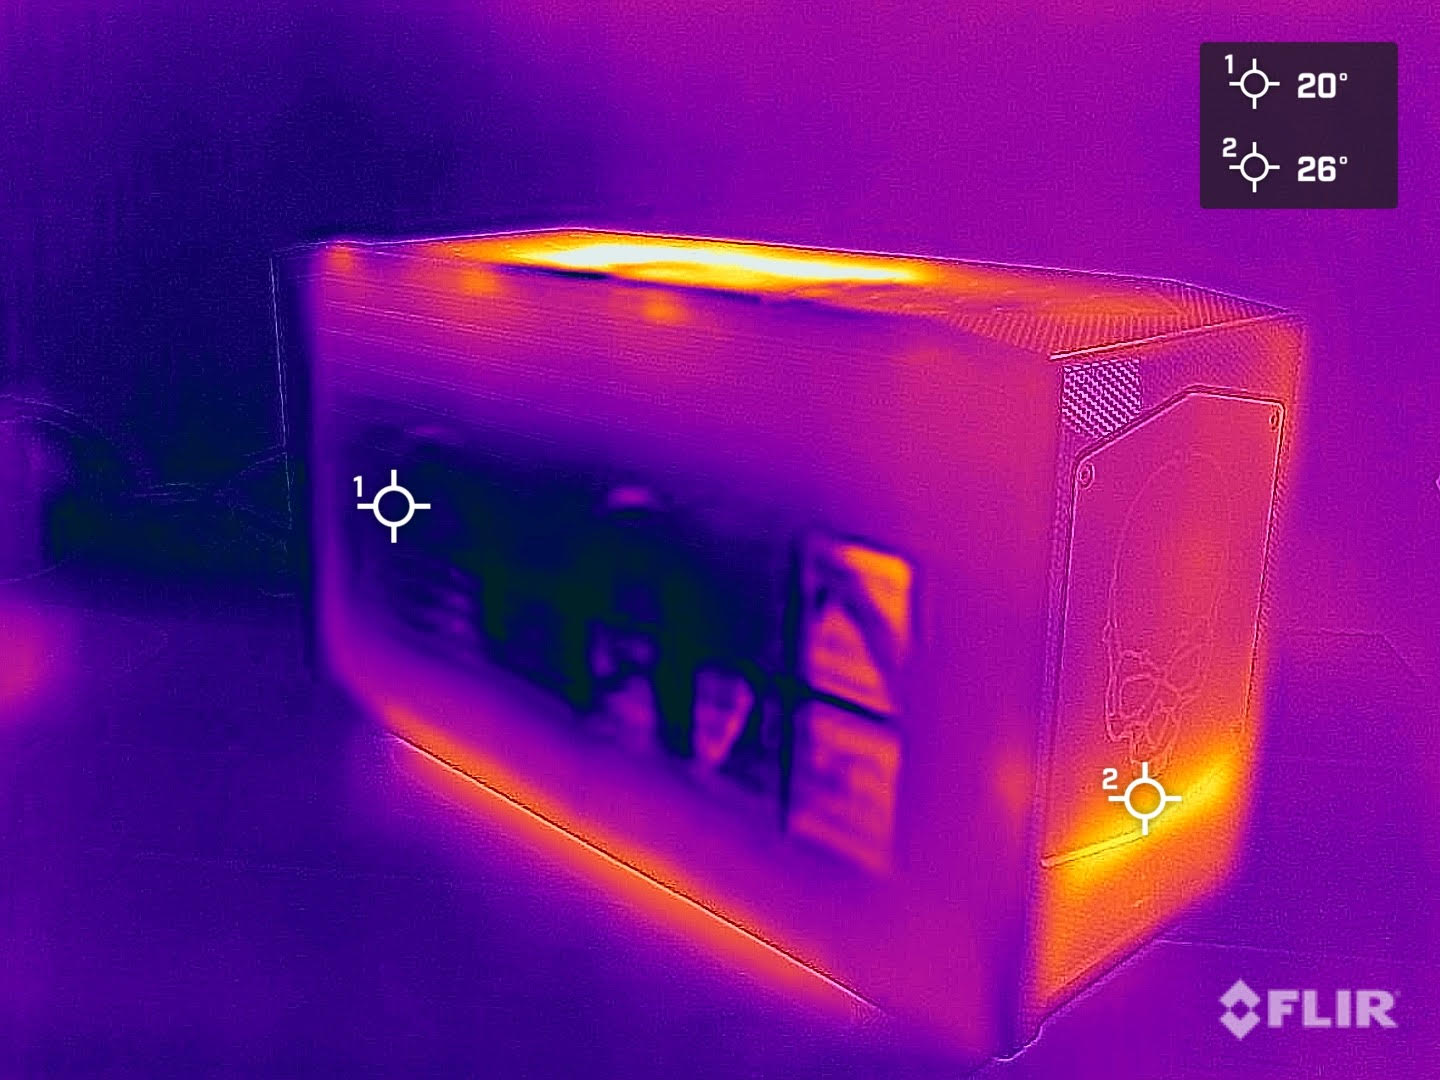
In de Intel NUC 12 Extreme Kit zorgt de Intel Core i9-12900 voor een aanzienlijk hoger stroomverbruik in vergelijking met de Intel NUC 11 Extreme Kit. Door het hogere TDP van de Intel Core i9-12900 in vergelijking met de Intel Core i9-11900KB was dit al te verwachten. In vergelijking met de twee andere Alder Lake systemen die we hier ook op een rijtje hebben gezet, blijkt het stroomverbruik van de Intel Dragon Canyon NUC echter aanzienlijk lager te zijn. De reden hiervoor kan gemakkelijk gevonden worden, aangezien de relatief kleine koeleenheid snel zijn grenzen bereikt met de Intel Core i9-12900 onder belasting, zodat de prestaties van de processor moeten worden teruggeschroefd. Onder belasting wordt de temperatuurlimiet van 100 °C (212°F) bijna altijd snel bereikt. In de stresstest met Prime95 wordt de temperatuurgrens al na een paar seconden bereikt. De Intel Core i9-12900 draait echter nog steeds op gemiddeld bijna 2,6 GHz, wat nog steeds iets meer is dan de basis kloksnelheid (2,4 GHz). We moeten ook vermelden dat de temperatuurlimiet maar heel kort wordt bereikt. Over de hele test ligt de gemiddelde temperatuur op 78 °C (172°F), wat over het algemeen een redelijke waarde is. We zien ook een gelijkaardig beeld tijdens gelijktijdige belasting van de CPU en GPU
De compacte bouw brengt één groot nadeel met zich mee. De Intel Beast Canyon NUC was al duidelijk hoorbaar onder belasting. Intel doet het iets beter met de Dragon Canyon NUC, hoewel die ook nog steeds duidelijk hoorbaar is met 45,1 dB(A) onder volledige belasting. Maar tijdens stationair gebruik of onder lage belasting blijft het systeem grotendeels stil. We horen alleen het toeren van de ventilatoren van tijd tot tijd, maar door de lage frequentie is het ventilatorgeluid relatief aangenaam.
Geluidsniveau
| Onbelast |
| 30.2 / 30.4 / 30.8 dB (A) |
| Belasting |
| / 45.1 dB (A) |
 | ||
30 dB stil 40 dB(A) hoorbaar 50 dB(A) luid |
||
min: | ||
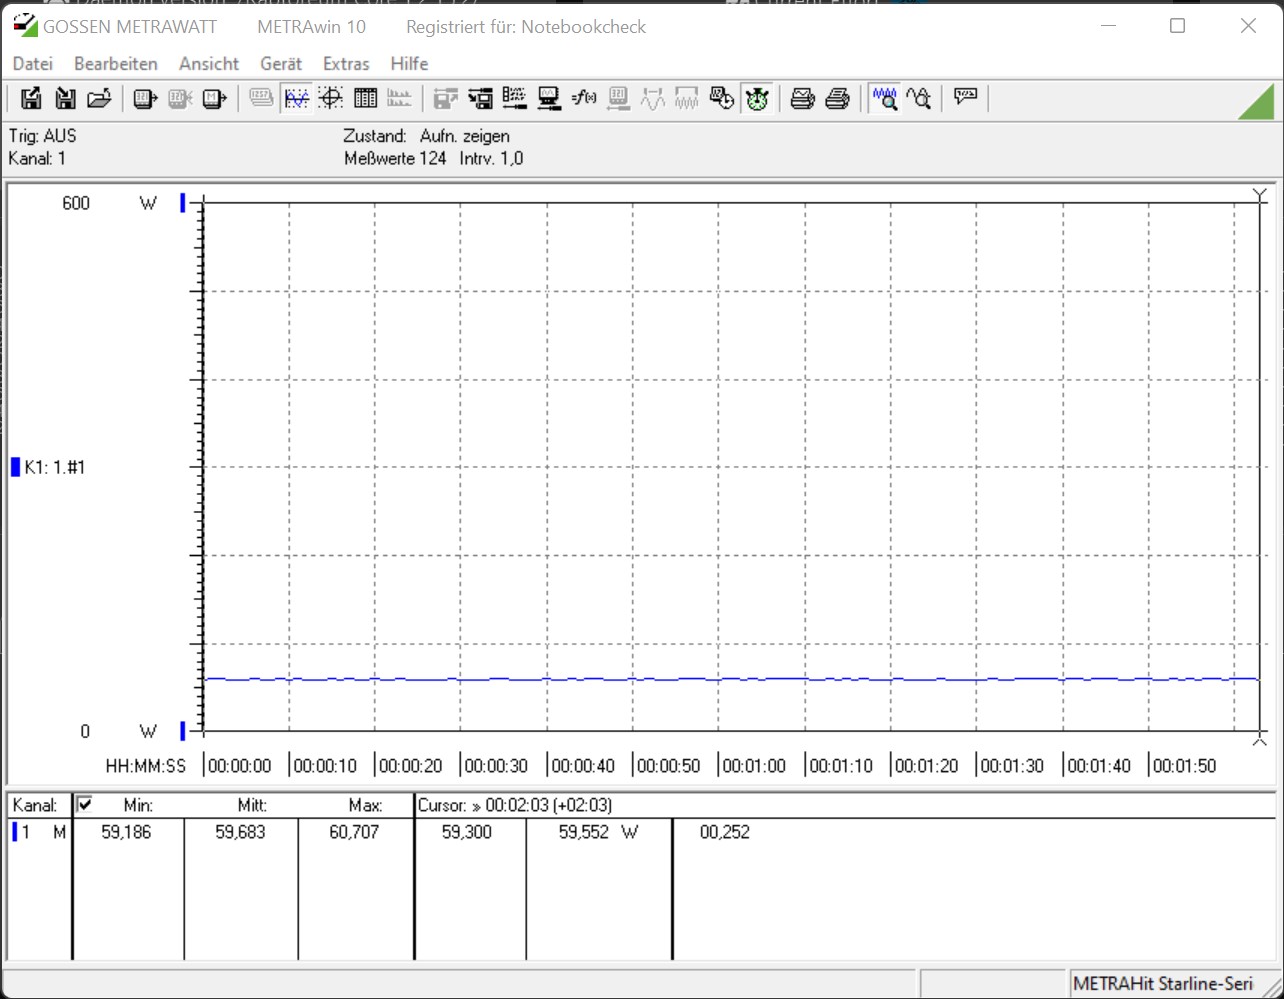
| Power Consumption | |
| 1920x1080 The Witcher 3 ultra (external Monitor) | |
| Intel Core i9-12900K (Idle: 70.5 W) | |
| AMD Ryzen 9 3950X (Idle: 95 W) | |
| Intel Core i7-12700K (Idle: 81 W) | |
| Intel Core i9-10900K (Idle: 52.3 W) | |
| Intel Core i5-10600K (Idle: 52.2 W) | |
| Corsair One i160 (Idle: 51.5 W) | |
| Intel Dragon Canyon NUC - RTX 3060 | |
| Intel Ghost Canyon NUC (RTX 2070) (Idle: 33.1 W) | |
| Intel Beast Canyon NUC (Idle: 32 W) | |
| Prime95 V2810 Stress (external Monitor) | |
| Intel Core i7-12700K (Idle: 81 W) | |
| Intel Core i9-12900K (Idle: 70.5 W) | |
| Intel Core i9-10900K (Idle: 52.3 W) | |
| Intel Core i5-10600K (Idle: 52.2 W) | |
| AMD Ryzen 9 3950X (Idle: 95 W) | |
| Intel Dragon Canyon NUC - RTX 3060 | |
| Intel Beast Canyon NUC (Idle: 34 W) | |
| Intel Ghost Canyon NUC (RTX 2070) (Idle: 33.1 W) | |
| Cinebench R15 Multi (external Monitor) | |
| Intel Core i9-12900K (Idle: 70.5 W) | |
| Intel Core i7-12700K (Idle: 81 W) | |
| Intel Core i9-10900K (Idle: 52.3 W) | |
| AMD Ryzen 9 3950X (Idle: 95 W) | |
| Intel Dragon Canyon NUC - RTX 3060 | |
| Intel Core i5-10600K (Idle: 52.2 W) | |
| Intel Beast Canyon NUC (Idle: 32 W) | |
| Temperatures - CPU Temperature Prime95 | |
| Intel Dragon Canyon NUC - RTX 3060 | |
| Intel Core i9-10900K | |
| AMD Ryzen 9 3950X | |
| Intel Core i5-10600K | |
* ... kleiner is beter
Pro
Contra
Verdict - Een compact werkpaard
De Intel NUC 12 Dragon Canyon is een kleine upgrade van de Intel NUC 11 Extreme Kit alias Beast Canyon. Met de nieuwe Alder Lake CPU voert Intel wat productonderhoud uit, waarbij de oudere Tiger Lake processor met pensioen wordt gestuurd. Daarnaast zit er voor het eerst een socketed CPU in het Compute Element, waardoor het gebruik van verschillende processoren mogelijk is. In termen van pure prestaties is wat de Intel Core i9-12900 weet te leveren iets beter dan de Intel Core i9-11900KB. Tegelijkertijd biedt de compacte bouw slechts beperkte ruimte voor geschikte koeling. Onder belasting loopt dat bij een ongeremde Intel Core i9-12900 zeer snel tegen zijn grenzen aan, waardoor de temperatuurlimiet herhaaldelijk wordt bereikt.
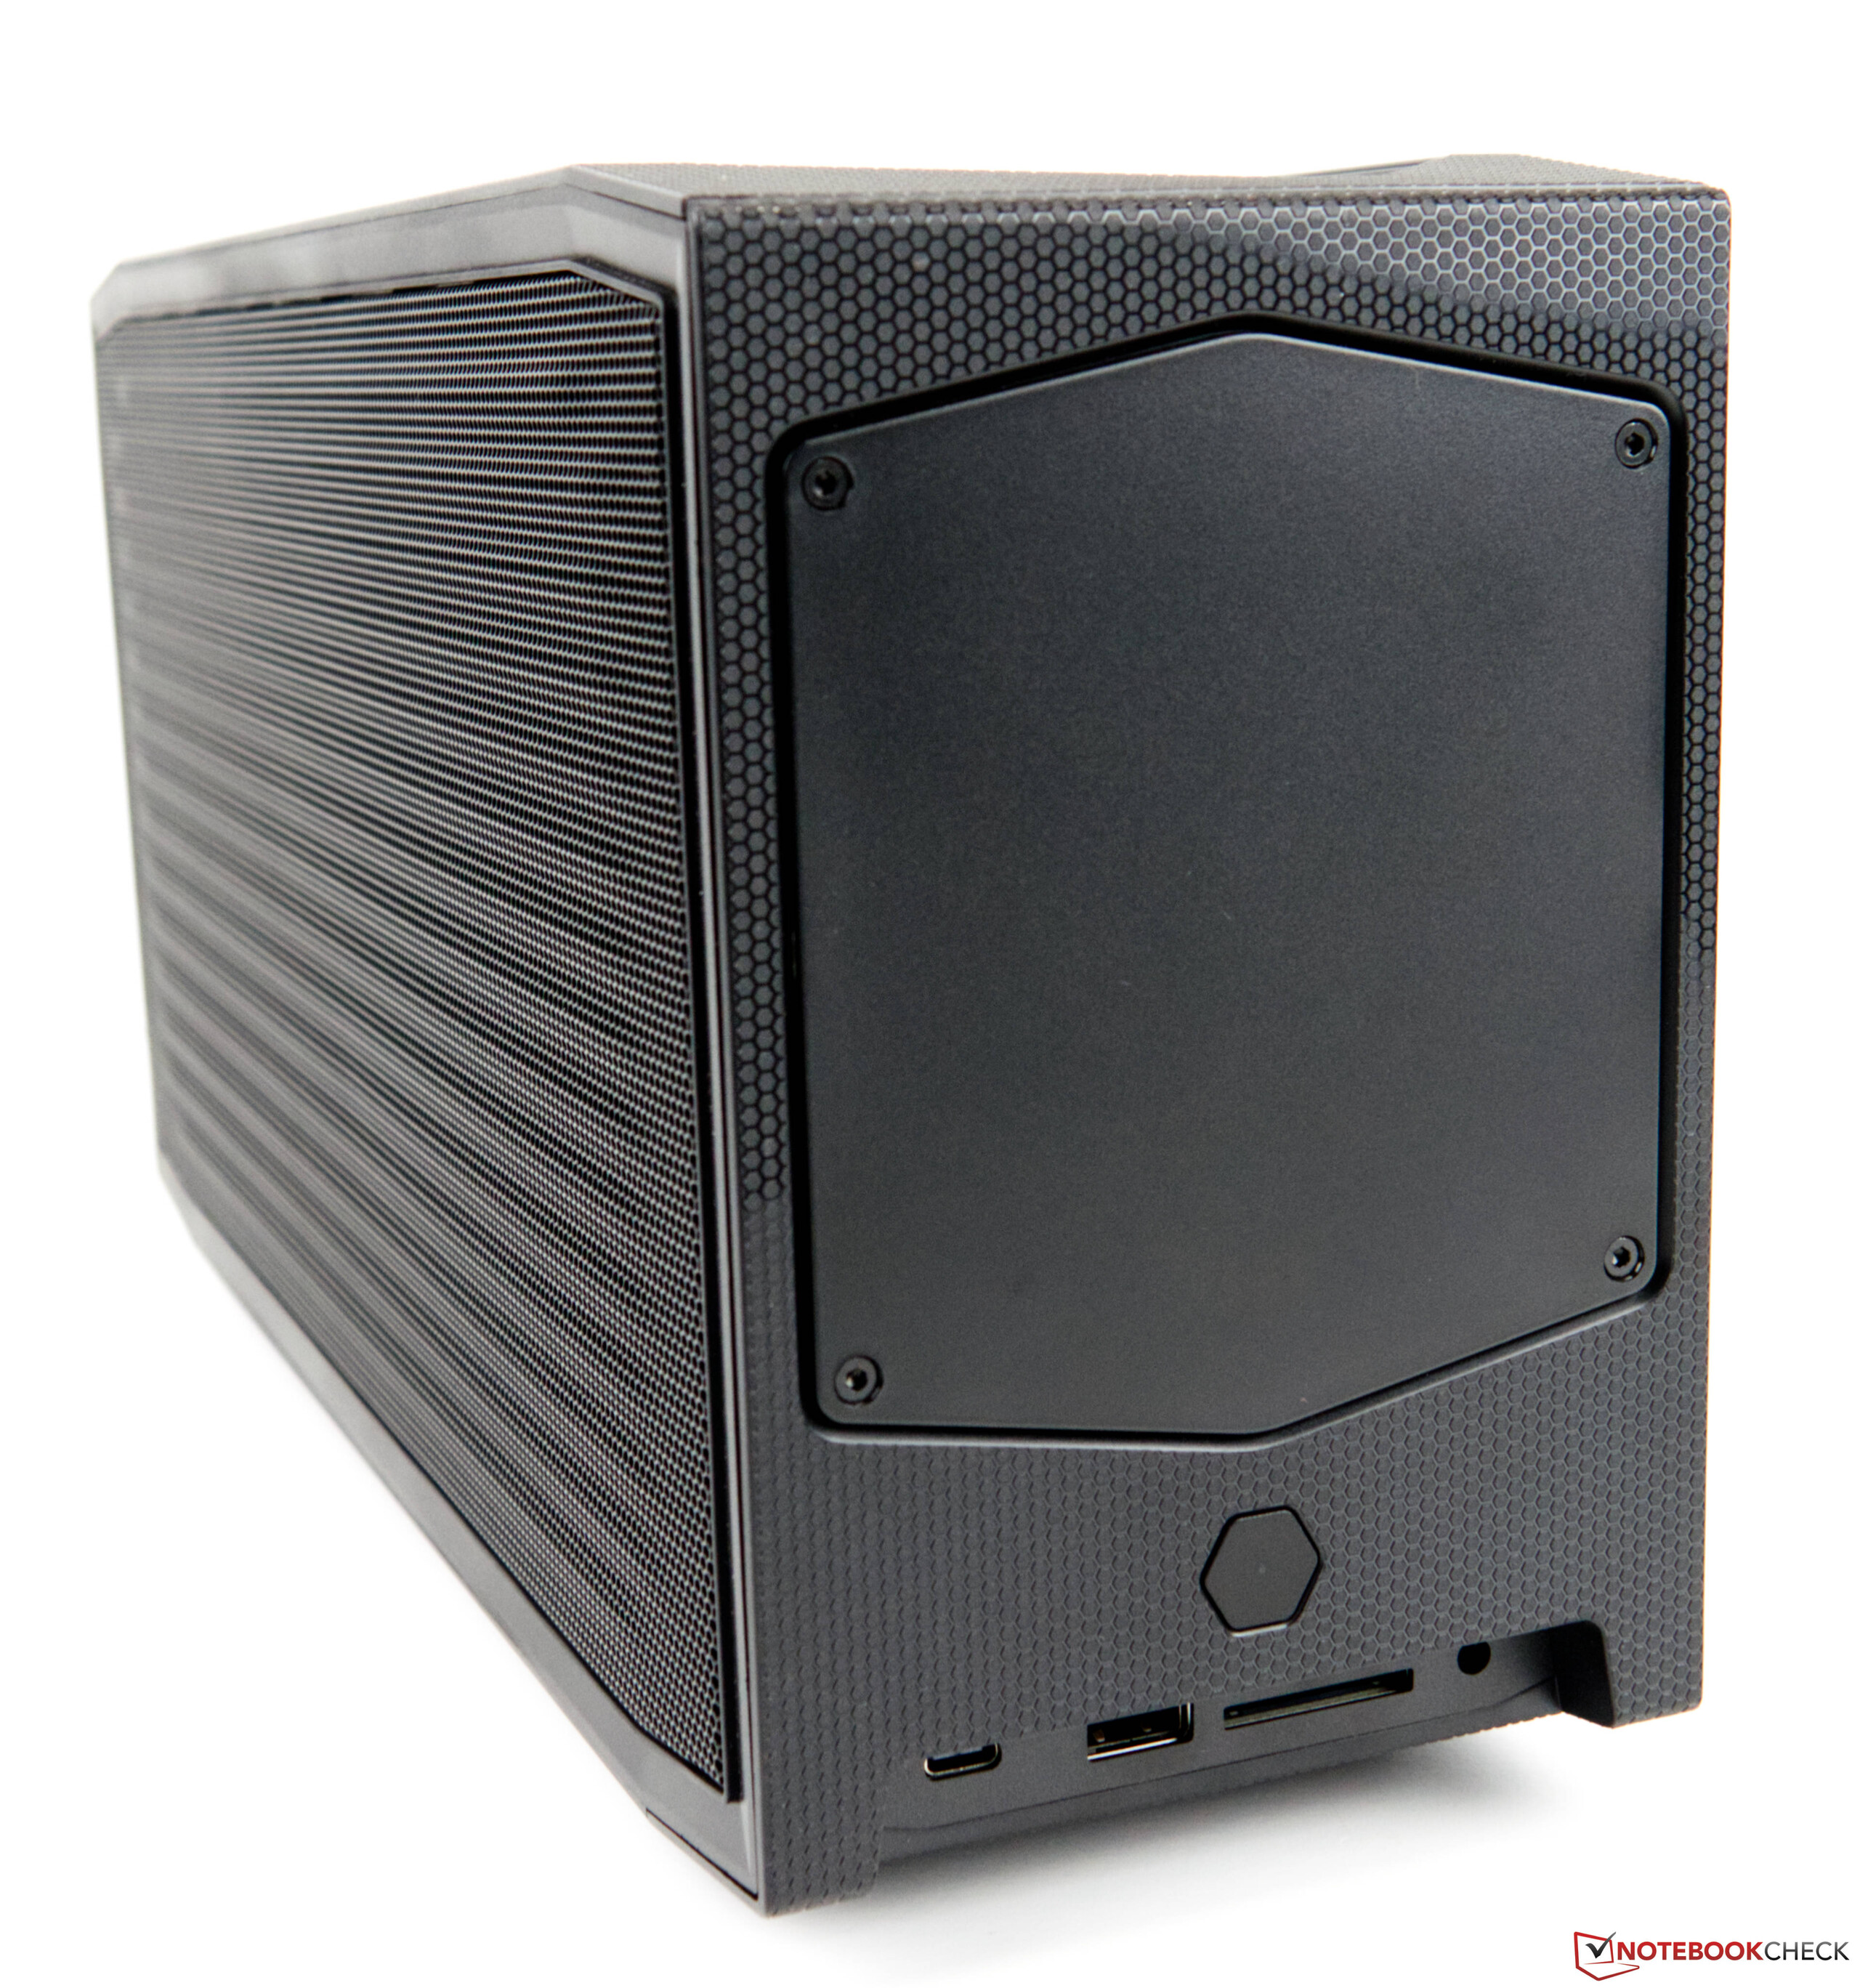
Op dit moment is de aanschafprijs voor het barebone systeem 1450 Euro (~$1585). Als je de rest van de componenten zoals RAM, SSD, en GPU meerekent, is de Intel NUC 12 Dragon Canyon niet veel duurder dan andere complete systemen. Dit legt de last van de keuze bij de klant. Als het ontwerp van de Intel NUC 12 Dragon Canyon je bevalt, kun je hem zonder enig voorbehoud kiezen. De verscheidenheid aan aansluitingen maakt hem toekomstbestendig en hun aantal is ook voldoende. Er is zelfs een snelle SD-kaartlezer die de UHS-II standaard ondersteunt.
Met de Intel NUC 12 Extreme Kit alias Dragon Canyon legt Intel de lat voor zijn compacte apparatenqua prestatiesweer een stukje hoger.
Tot slot moeten we nog steeds de vraag beantwoorden die we aan het begin stelden. Puur afgaande op zijn uiterlijk, zouden we de Intel NUC 12 Dragon Canyon eerder tot het gaming segment rekenen. Door de prestaties van de Alder Lake processor en iGPU is het systeem ook geschikt als high-end kantoor PC. Tegelijkertijd heb je ook de optie om een professionele grafische kaart te plaatsen, waardoor het systeem verandert in een volwaardig werkstation. Je kunt de kleine Intel NUC Dragon Canyon dan ook gemakkelijk gebruiken voor wat beeld- en videobewerking
Het alternatief voor de Intel NUC 12 Extreme Kit Dragon Canyon zou het zelf bouwen van een systeem zijn, wat waarschijnlijk ongeveer evenveel zou kosten. Met deZotac Magnus Oneis er ook een goed alternatief als je een zeer compacte gaming PC wilt.

