Zotac Magnus One desktop PC met Core i7 en GeForce RTX 3070 in review
Met de nieuwe Magnus One serie introduceert Zotac weer een compacte gaming computer in hun portfolio. Wel moet meteen vermeld worden dat de Zotac Magnus One een barebone systeem is. Dit betekent dat het RAM-geheugen, de massaopslag en ook het besturingssysteem afzonderlijk moeten worden aangeschaft. Een soortgelijke aanpak wordt door Zotac gehanteerd met zijn ZBOX Magnus, die echter nog compacter is.
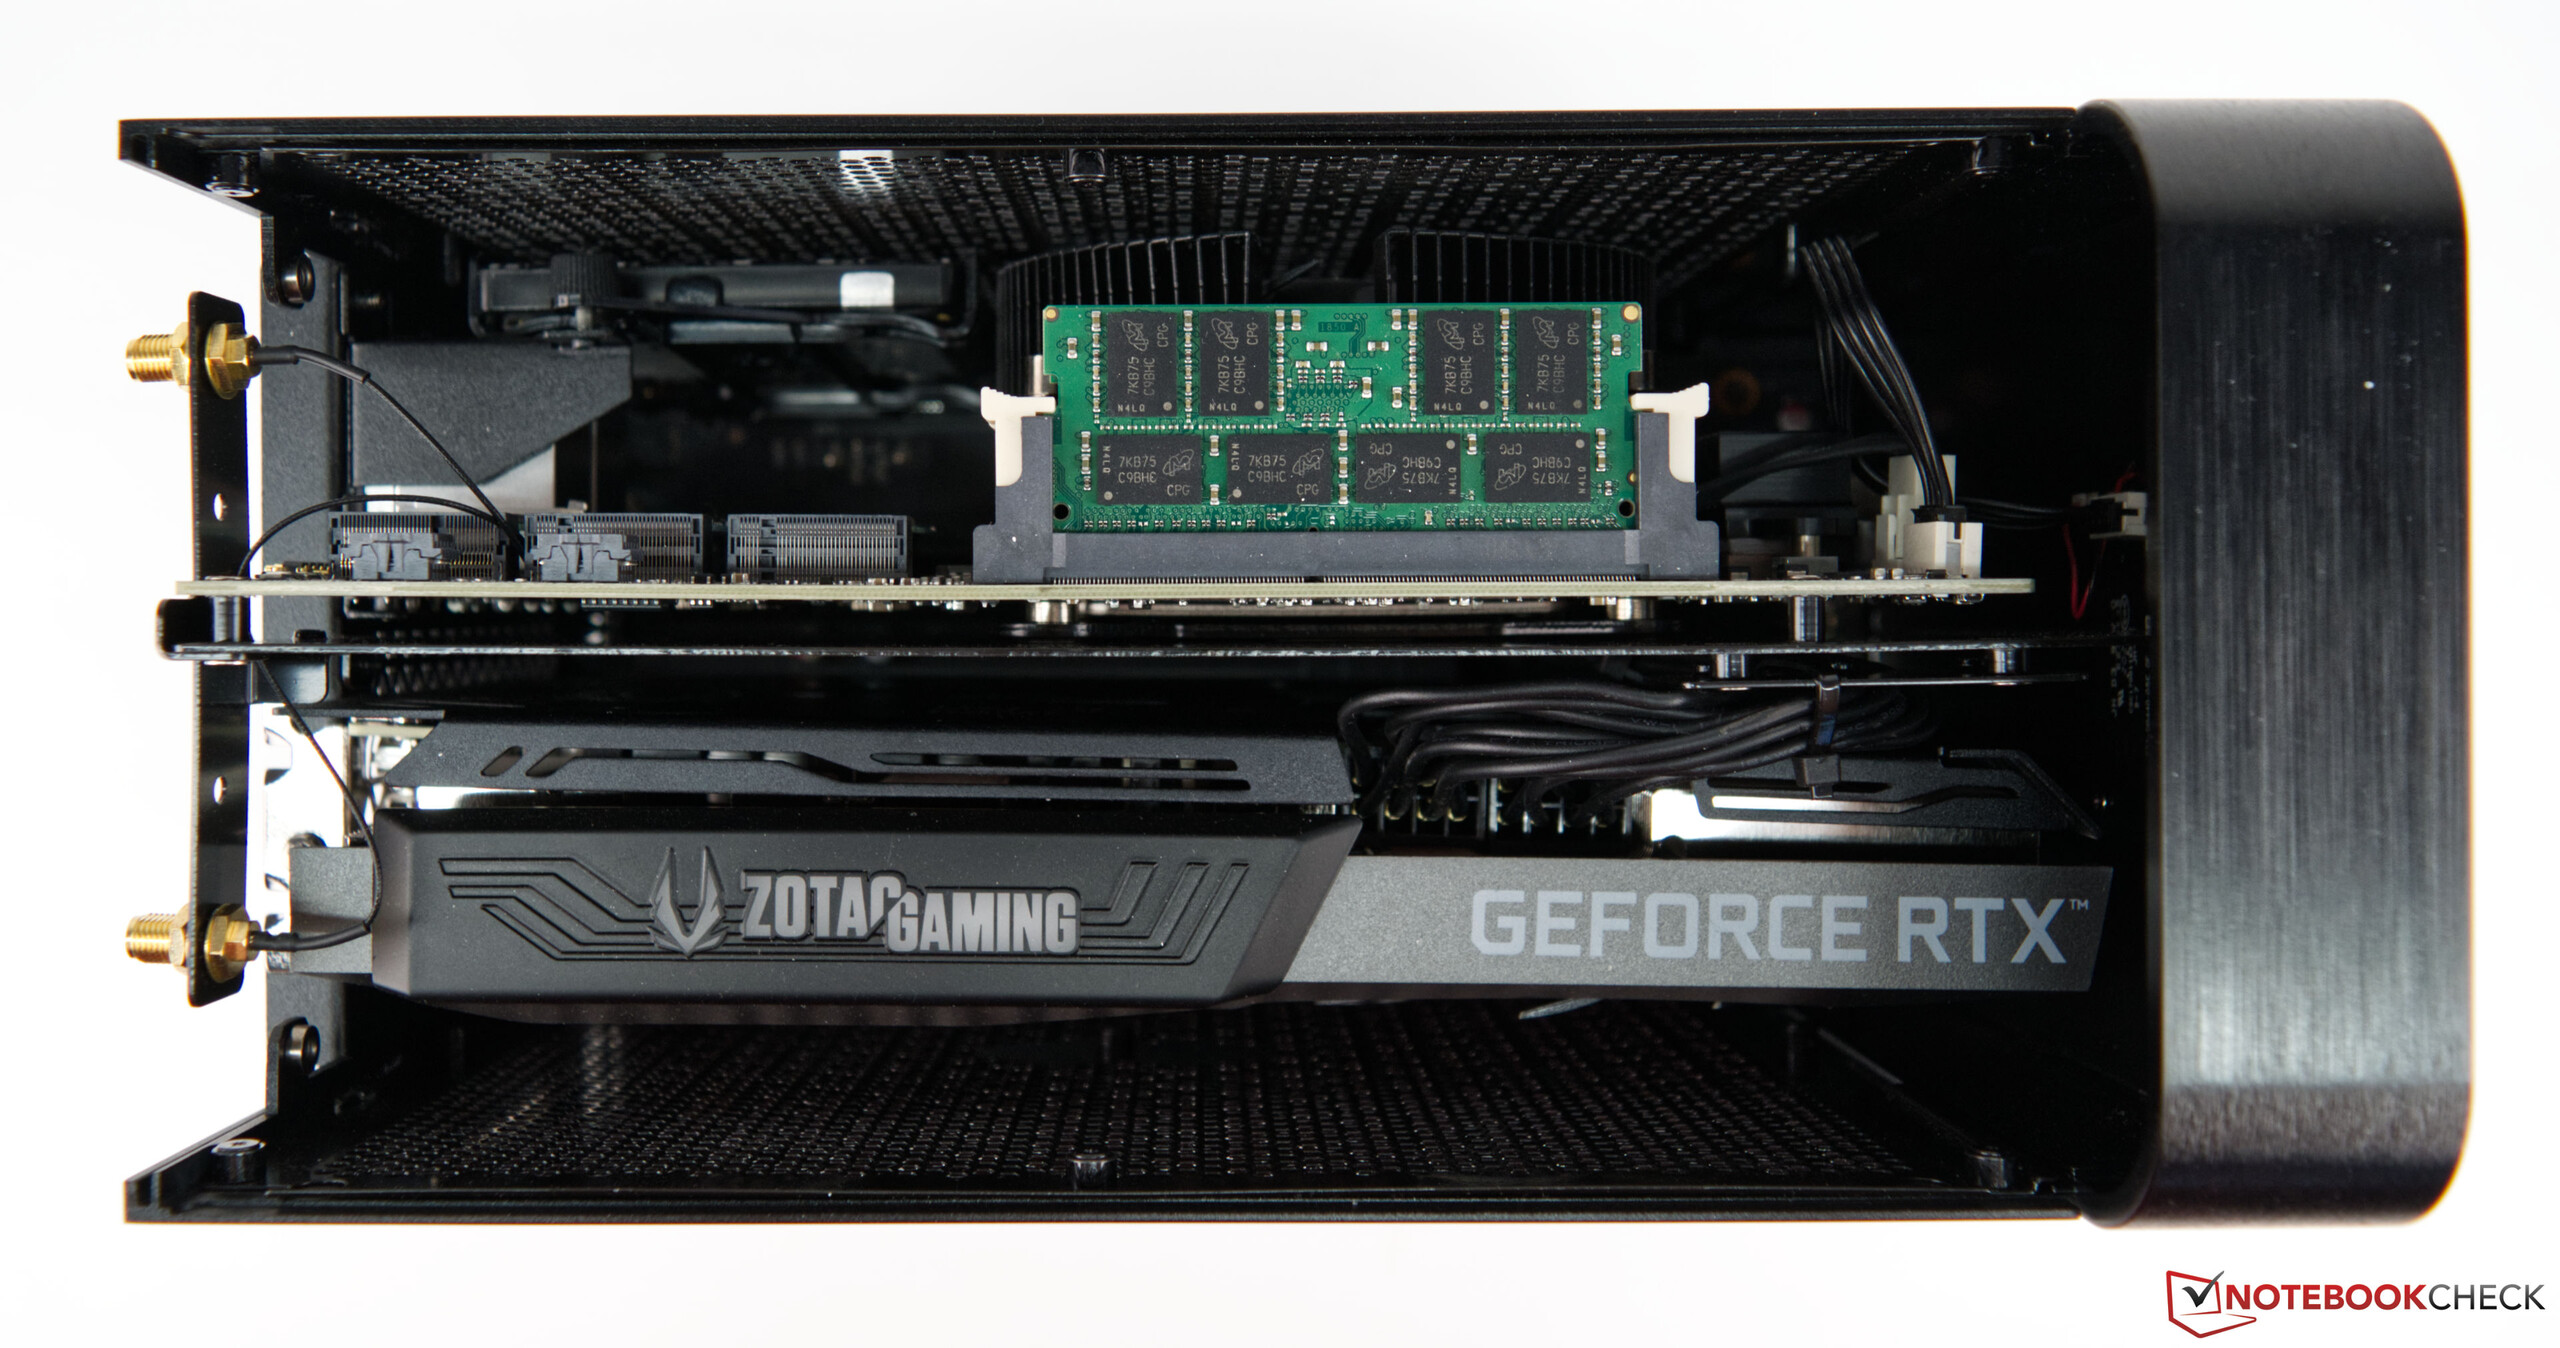
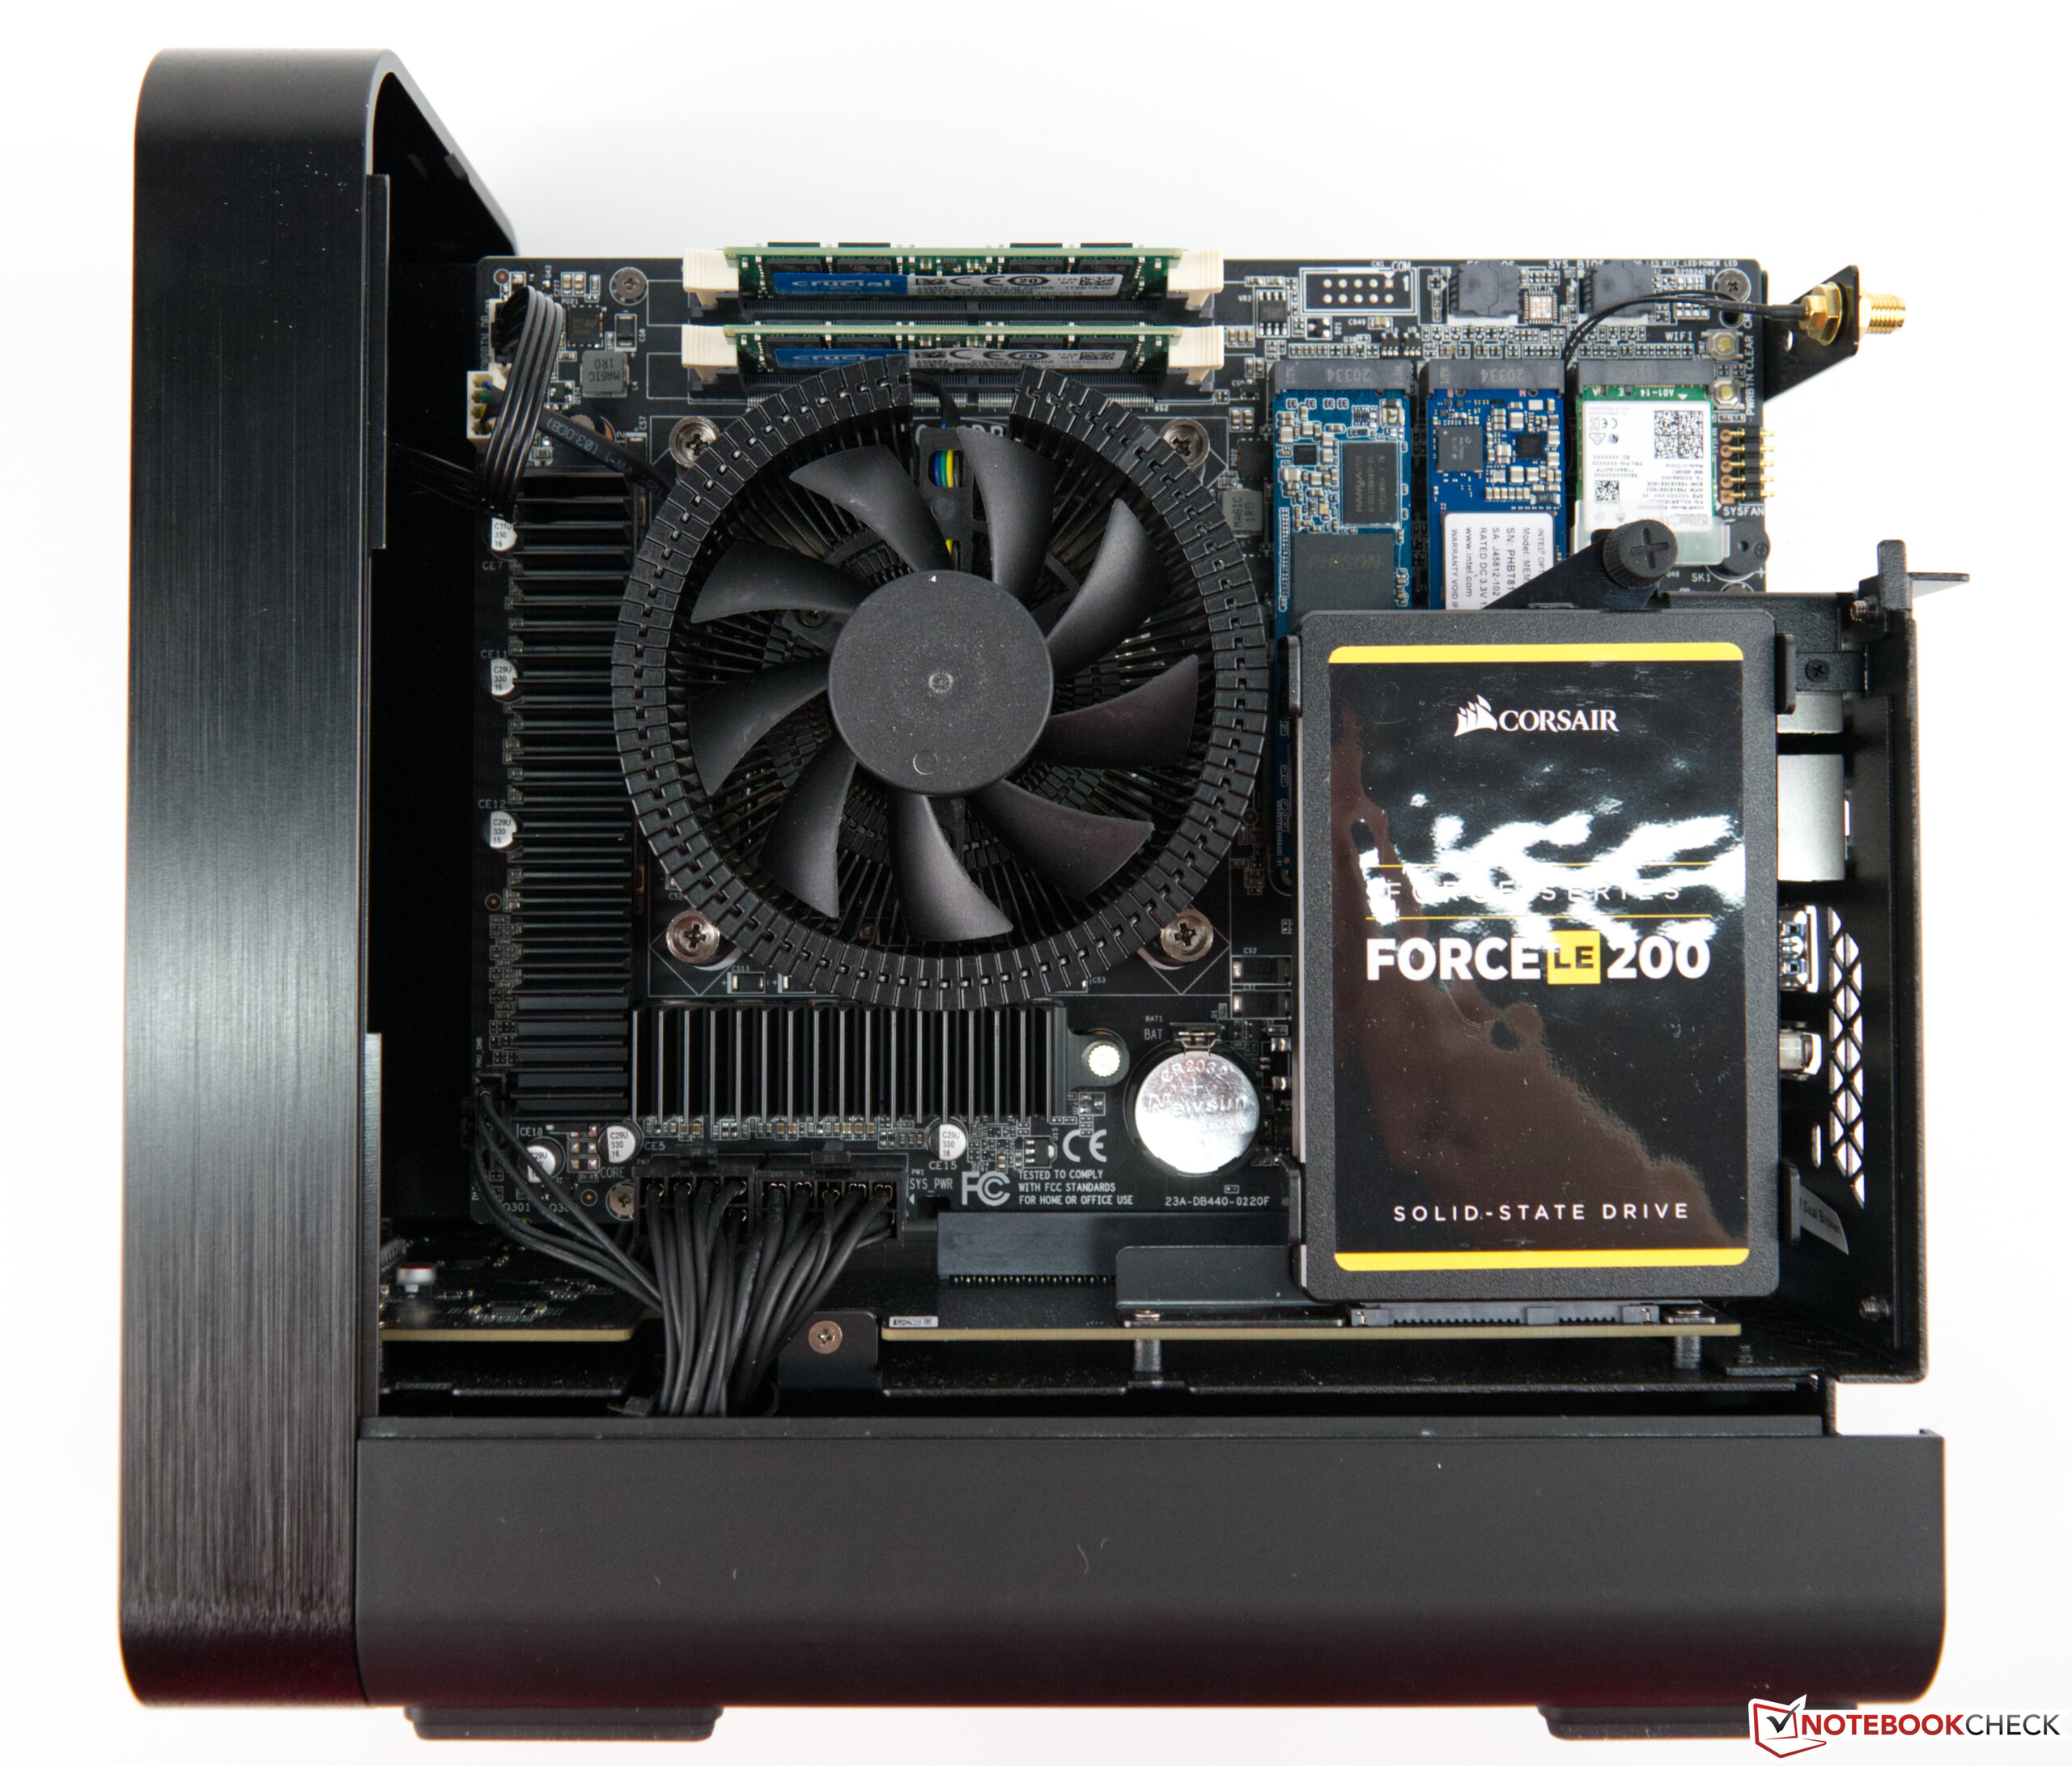
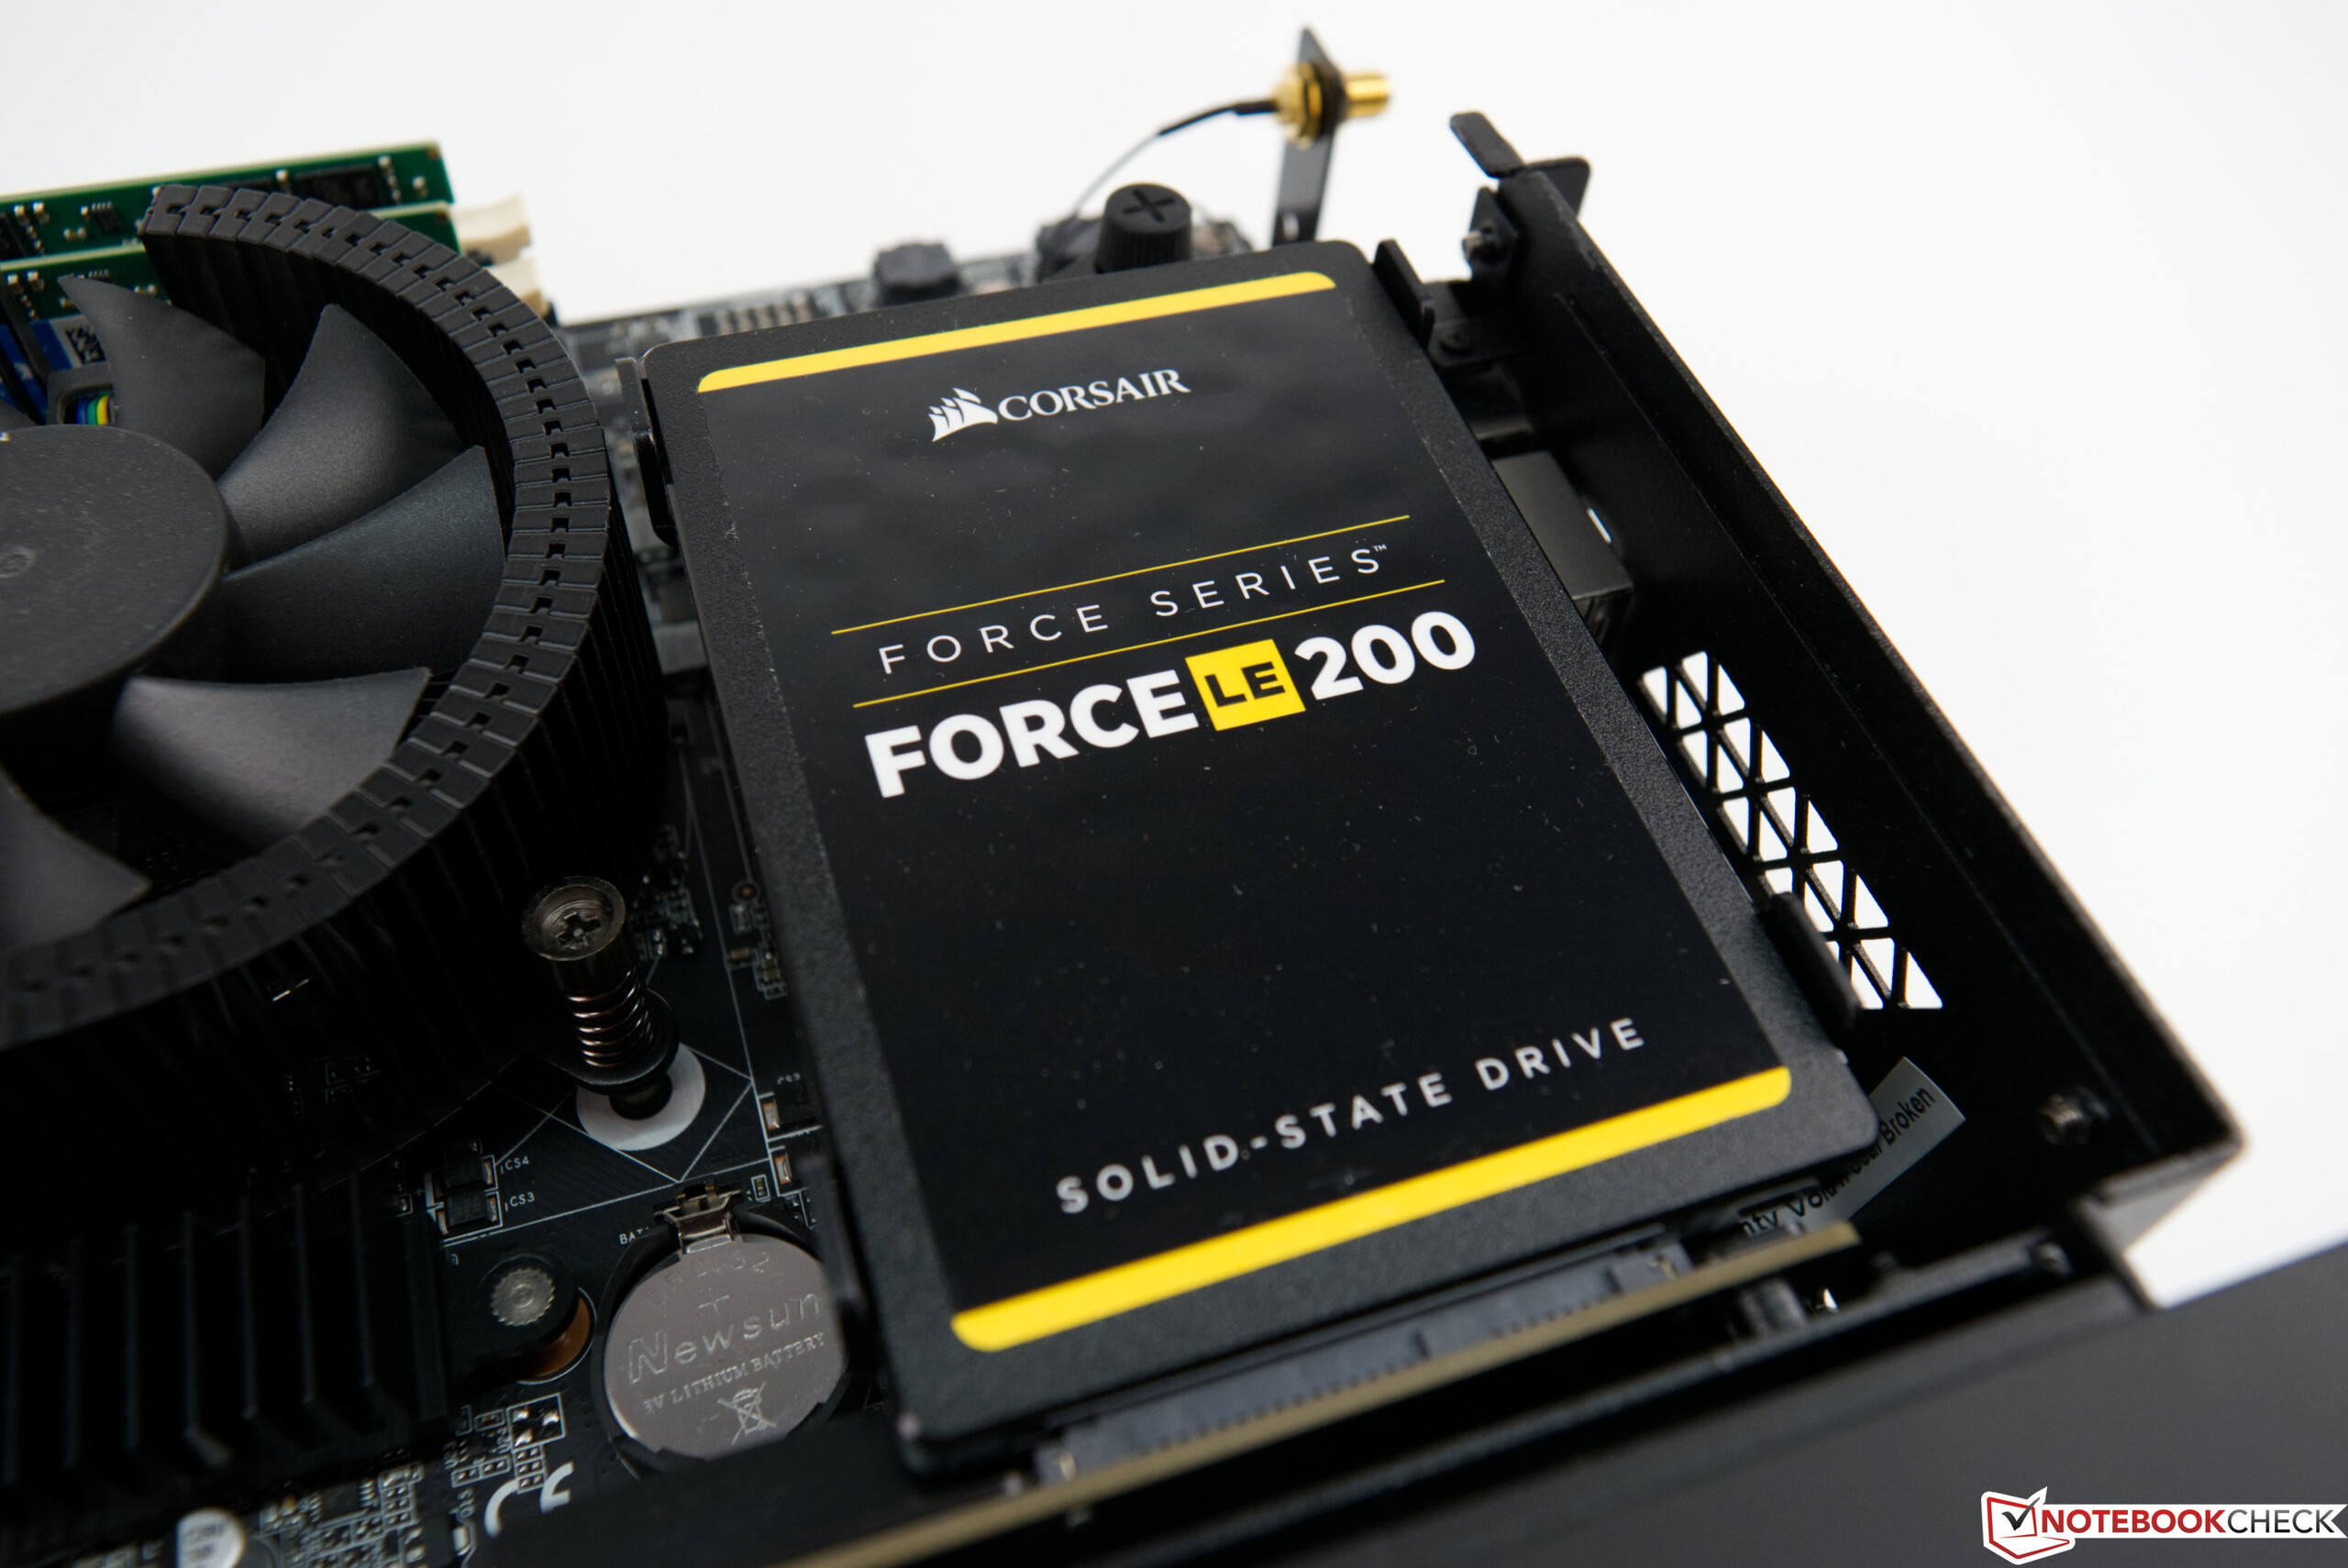
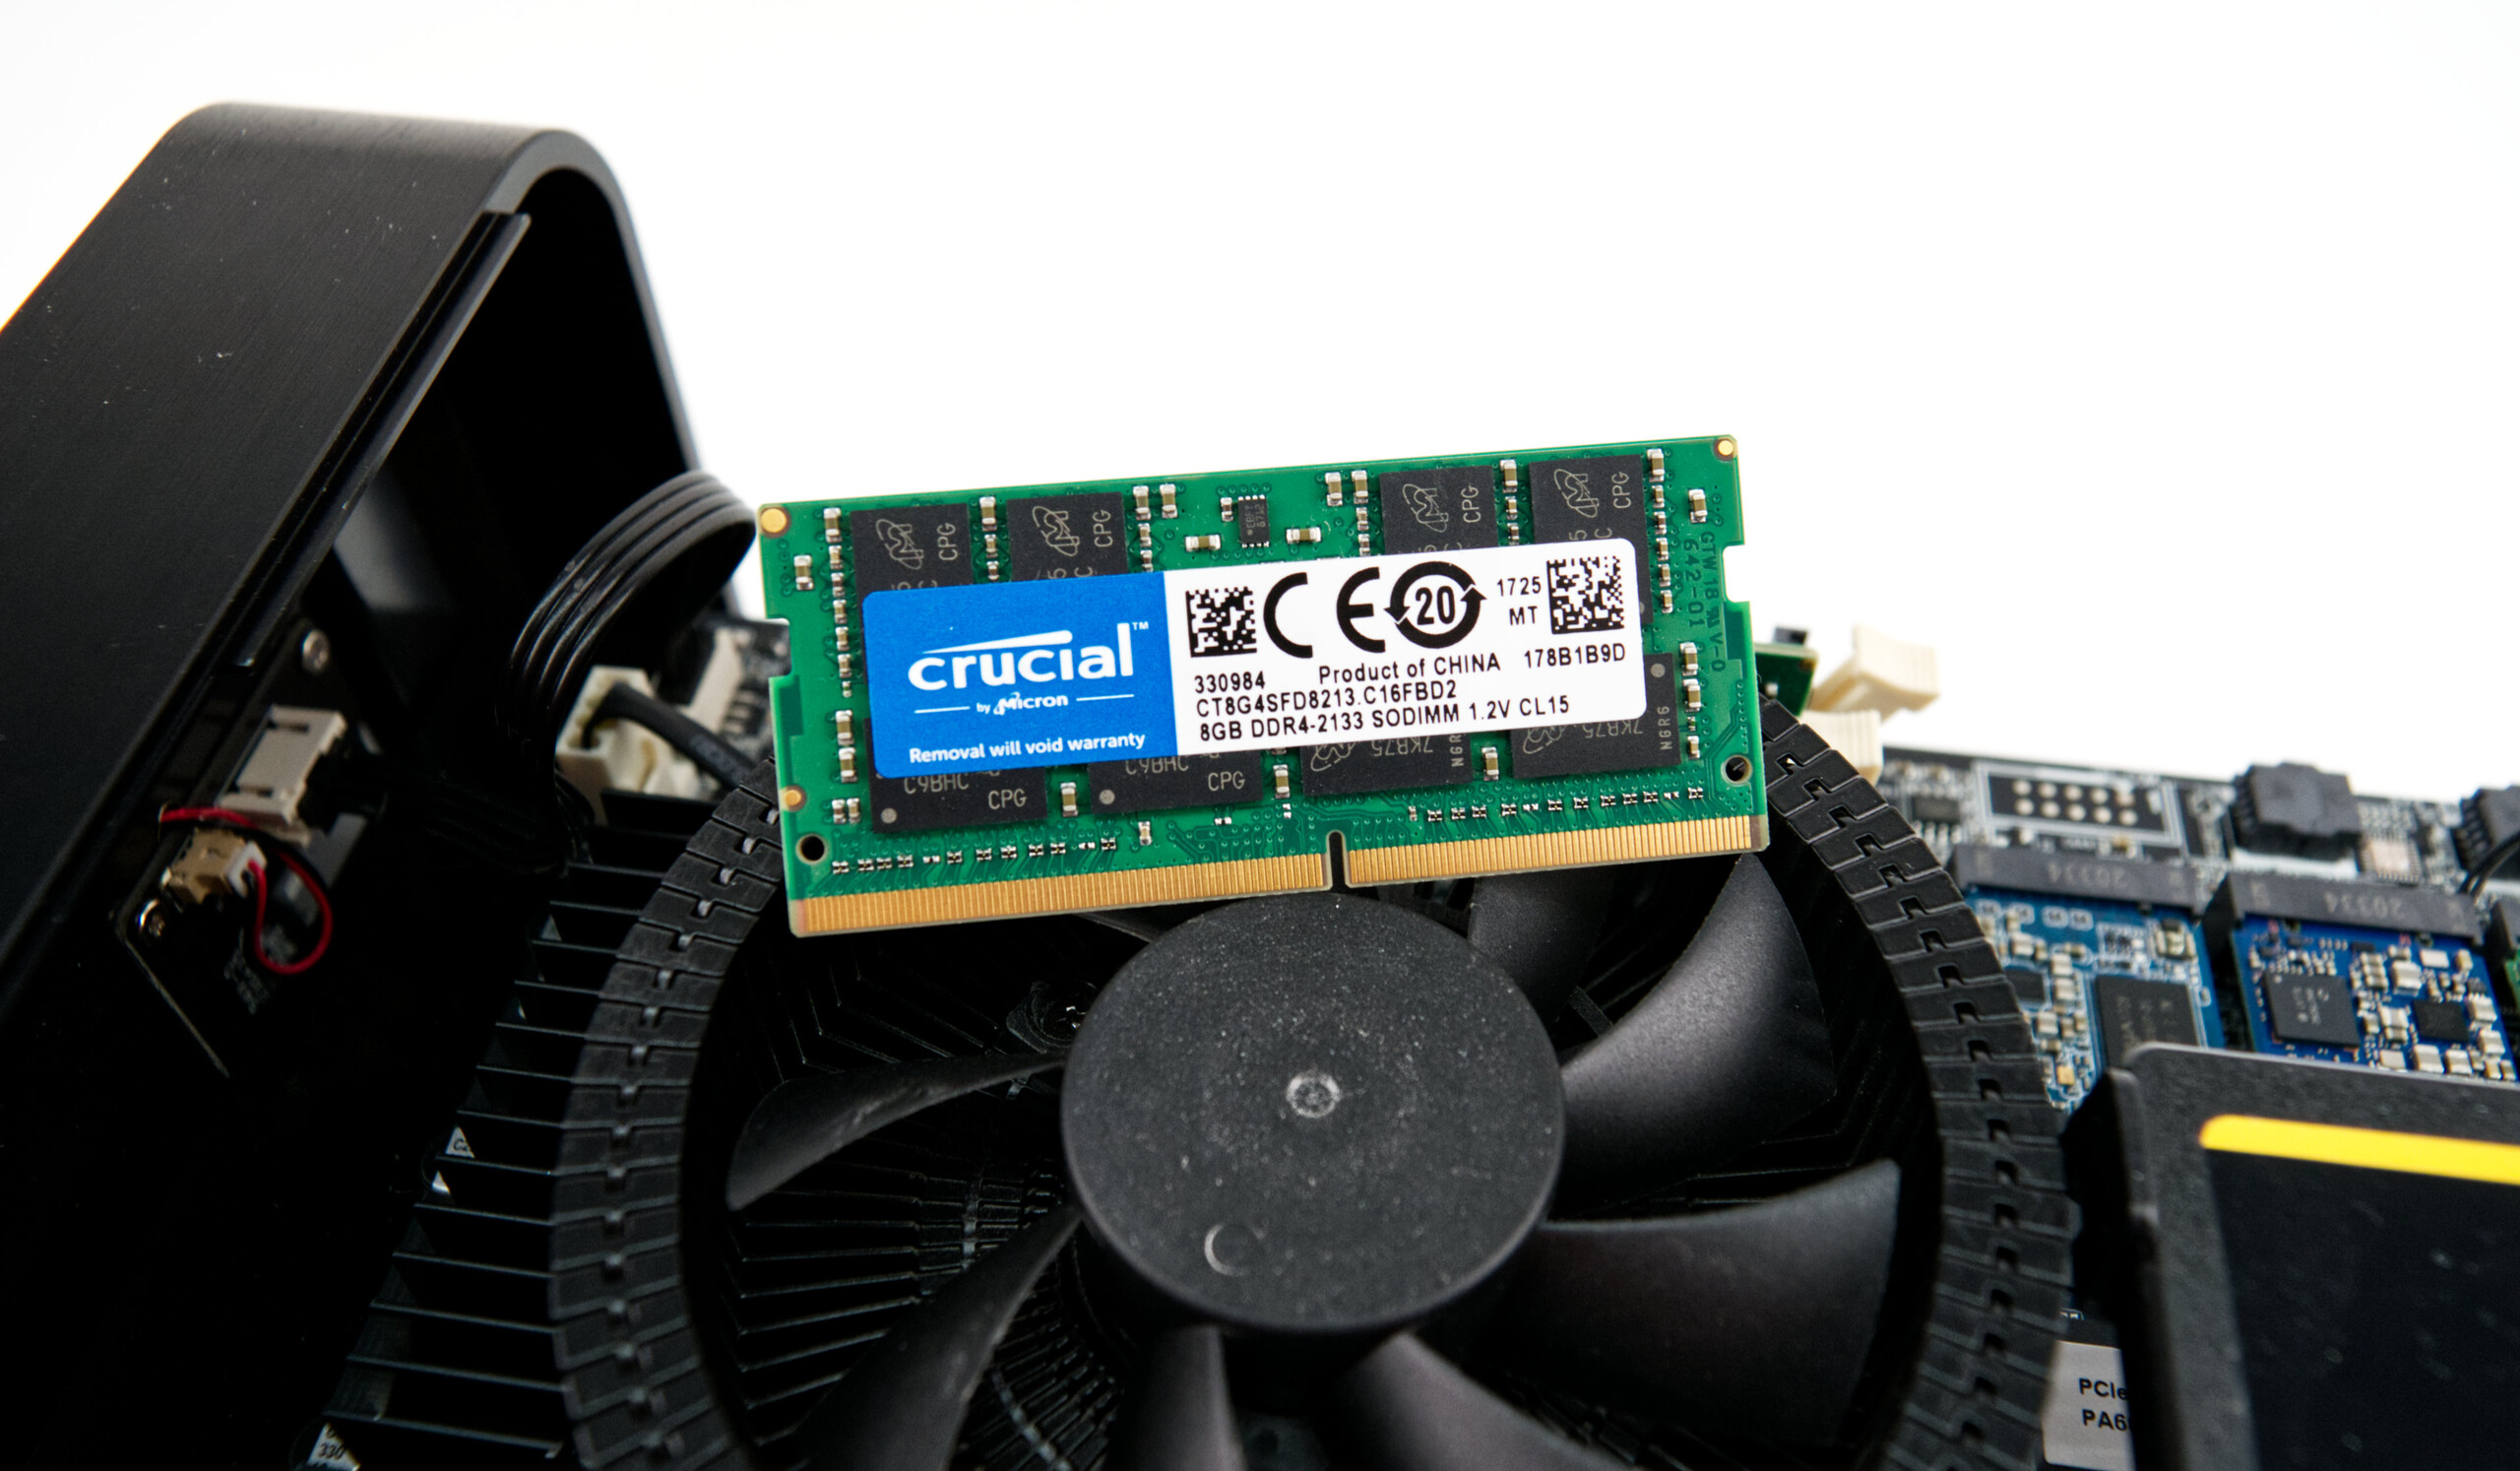
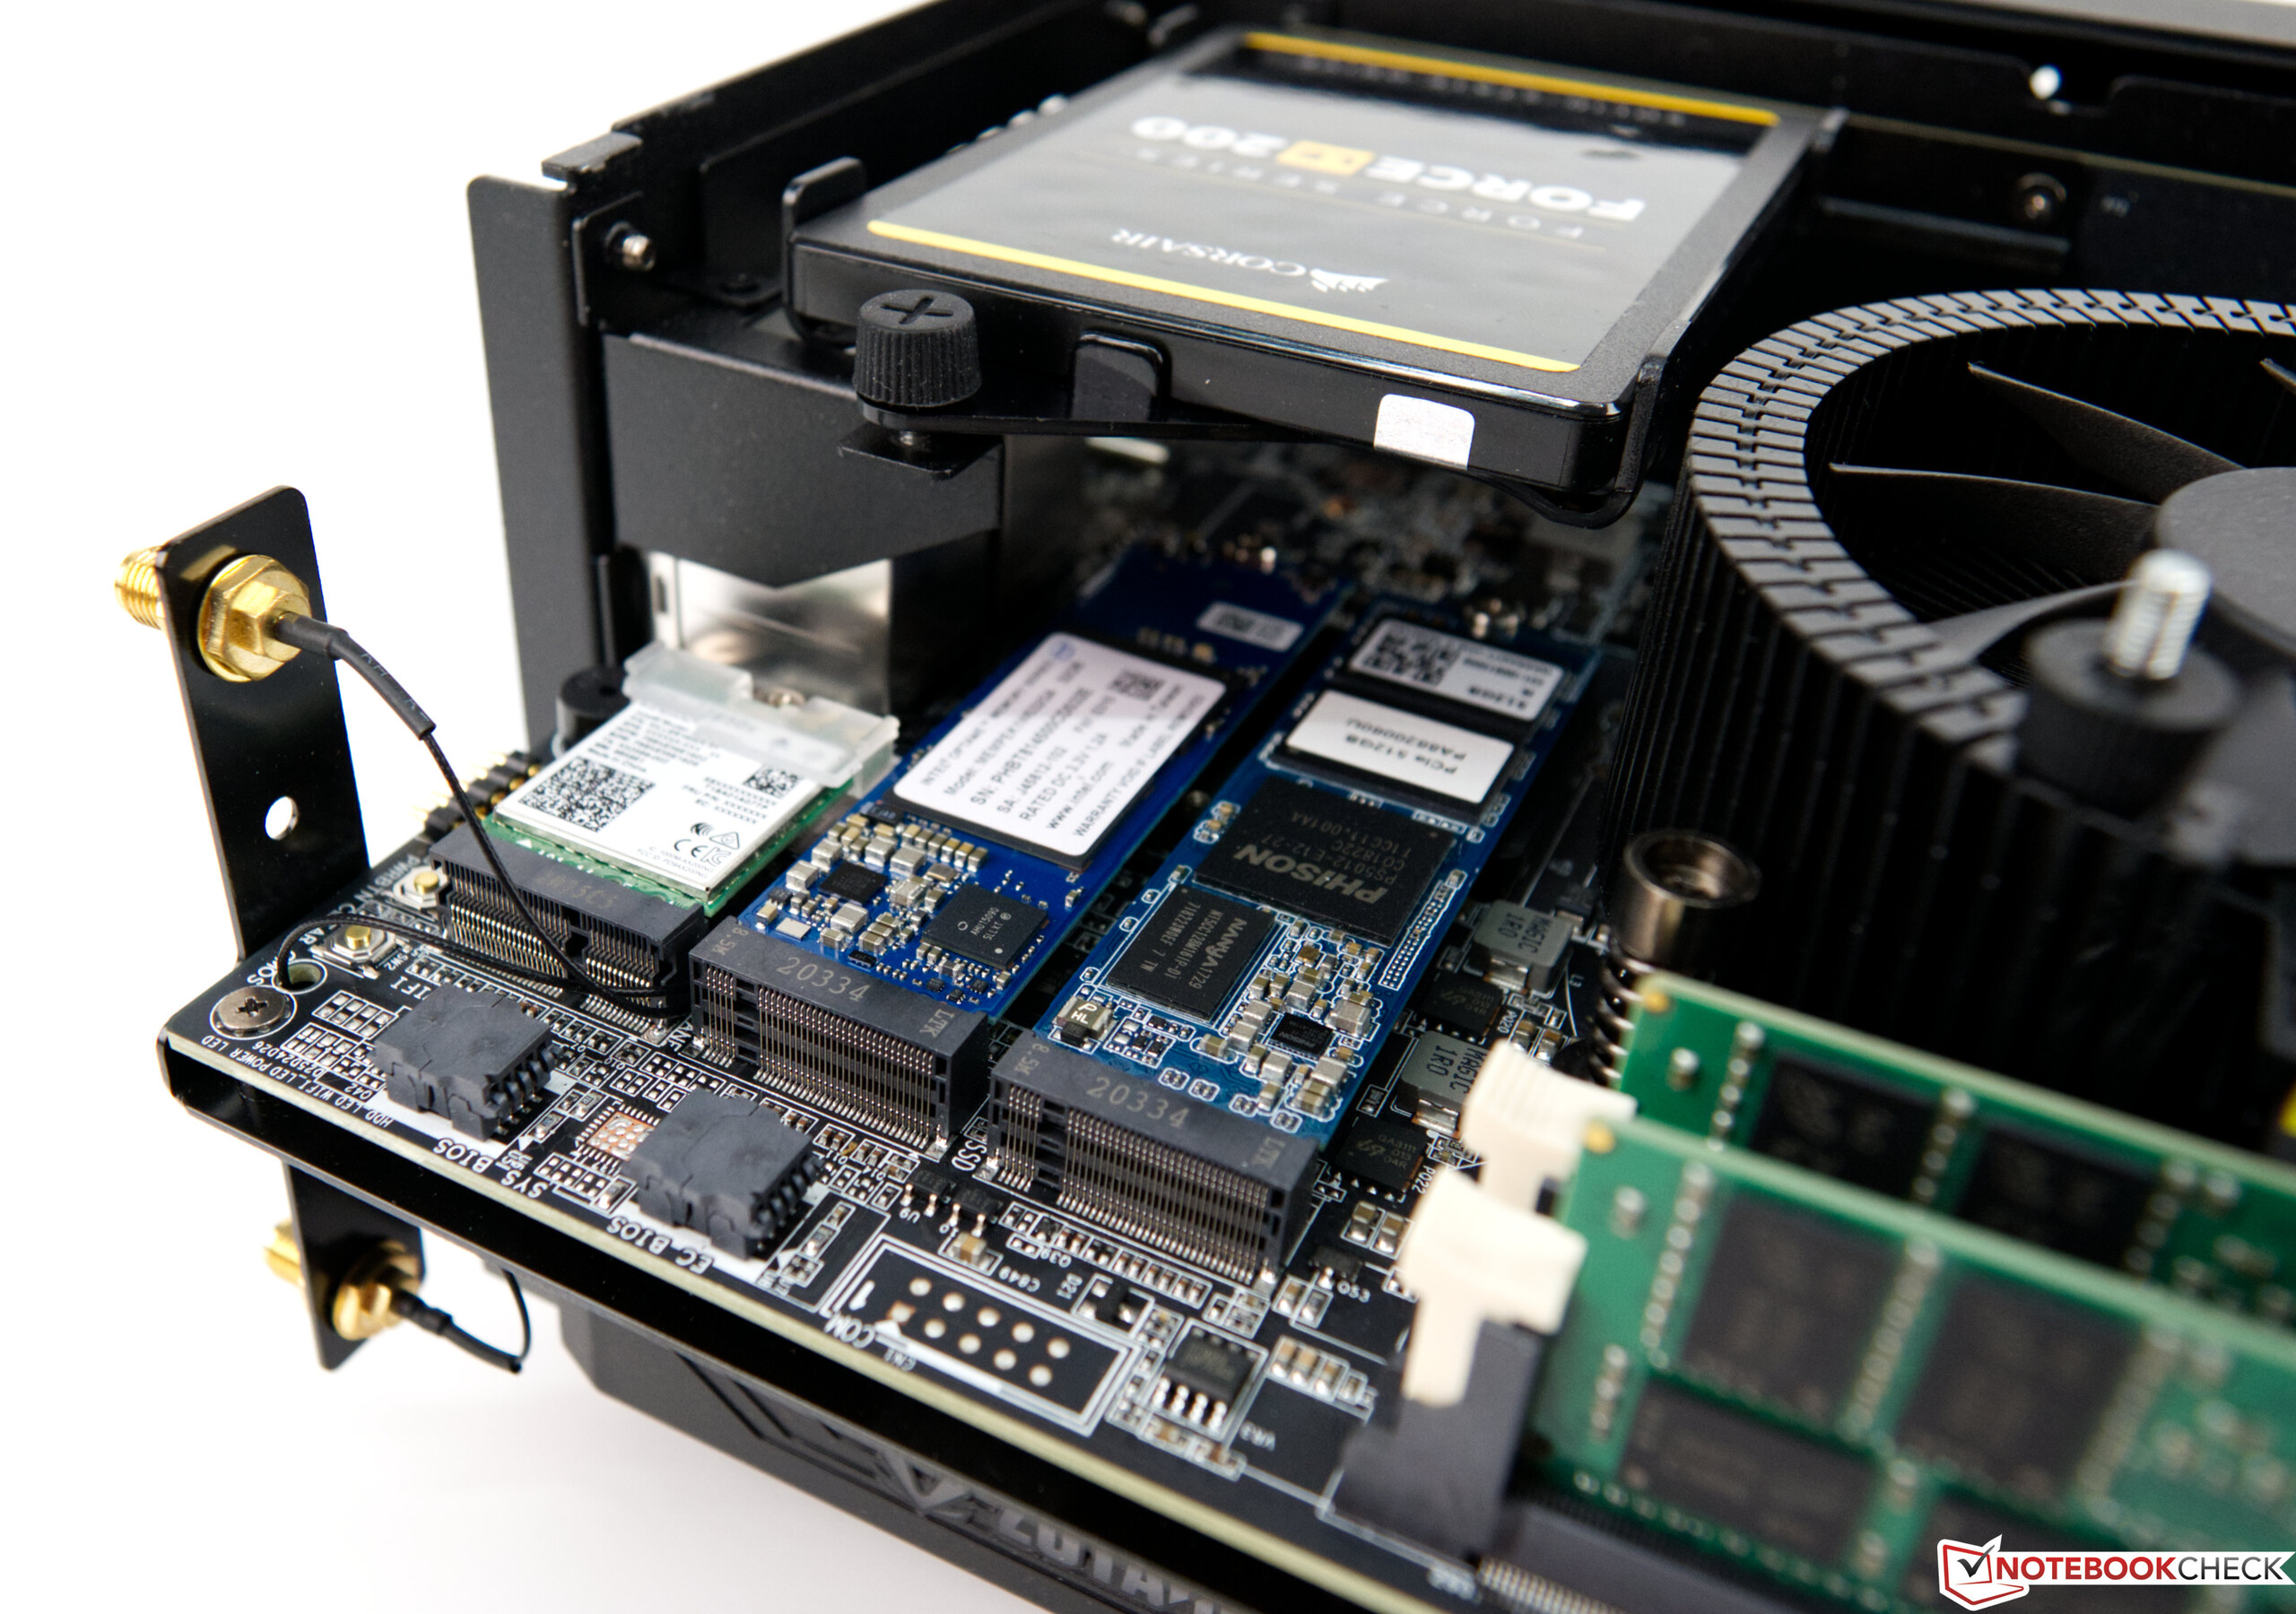
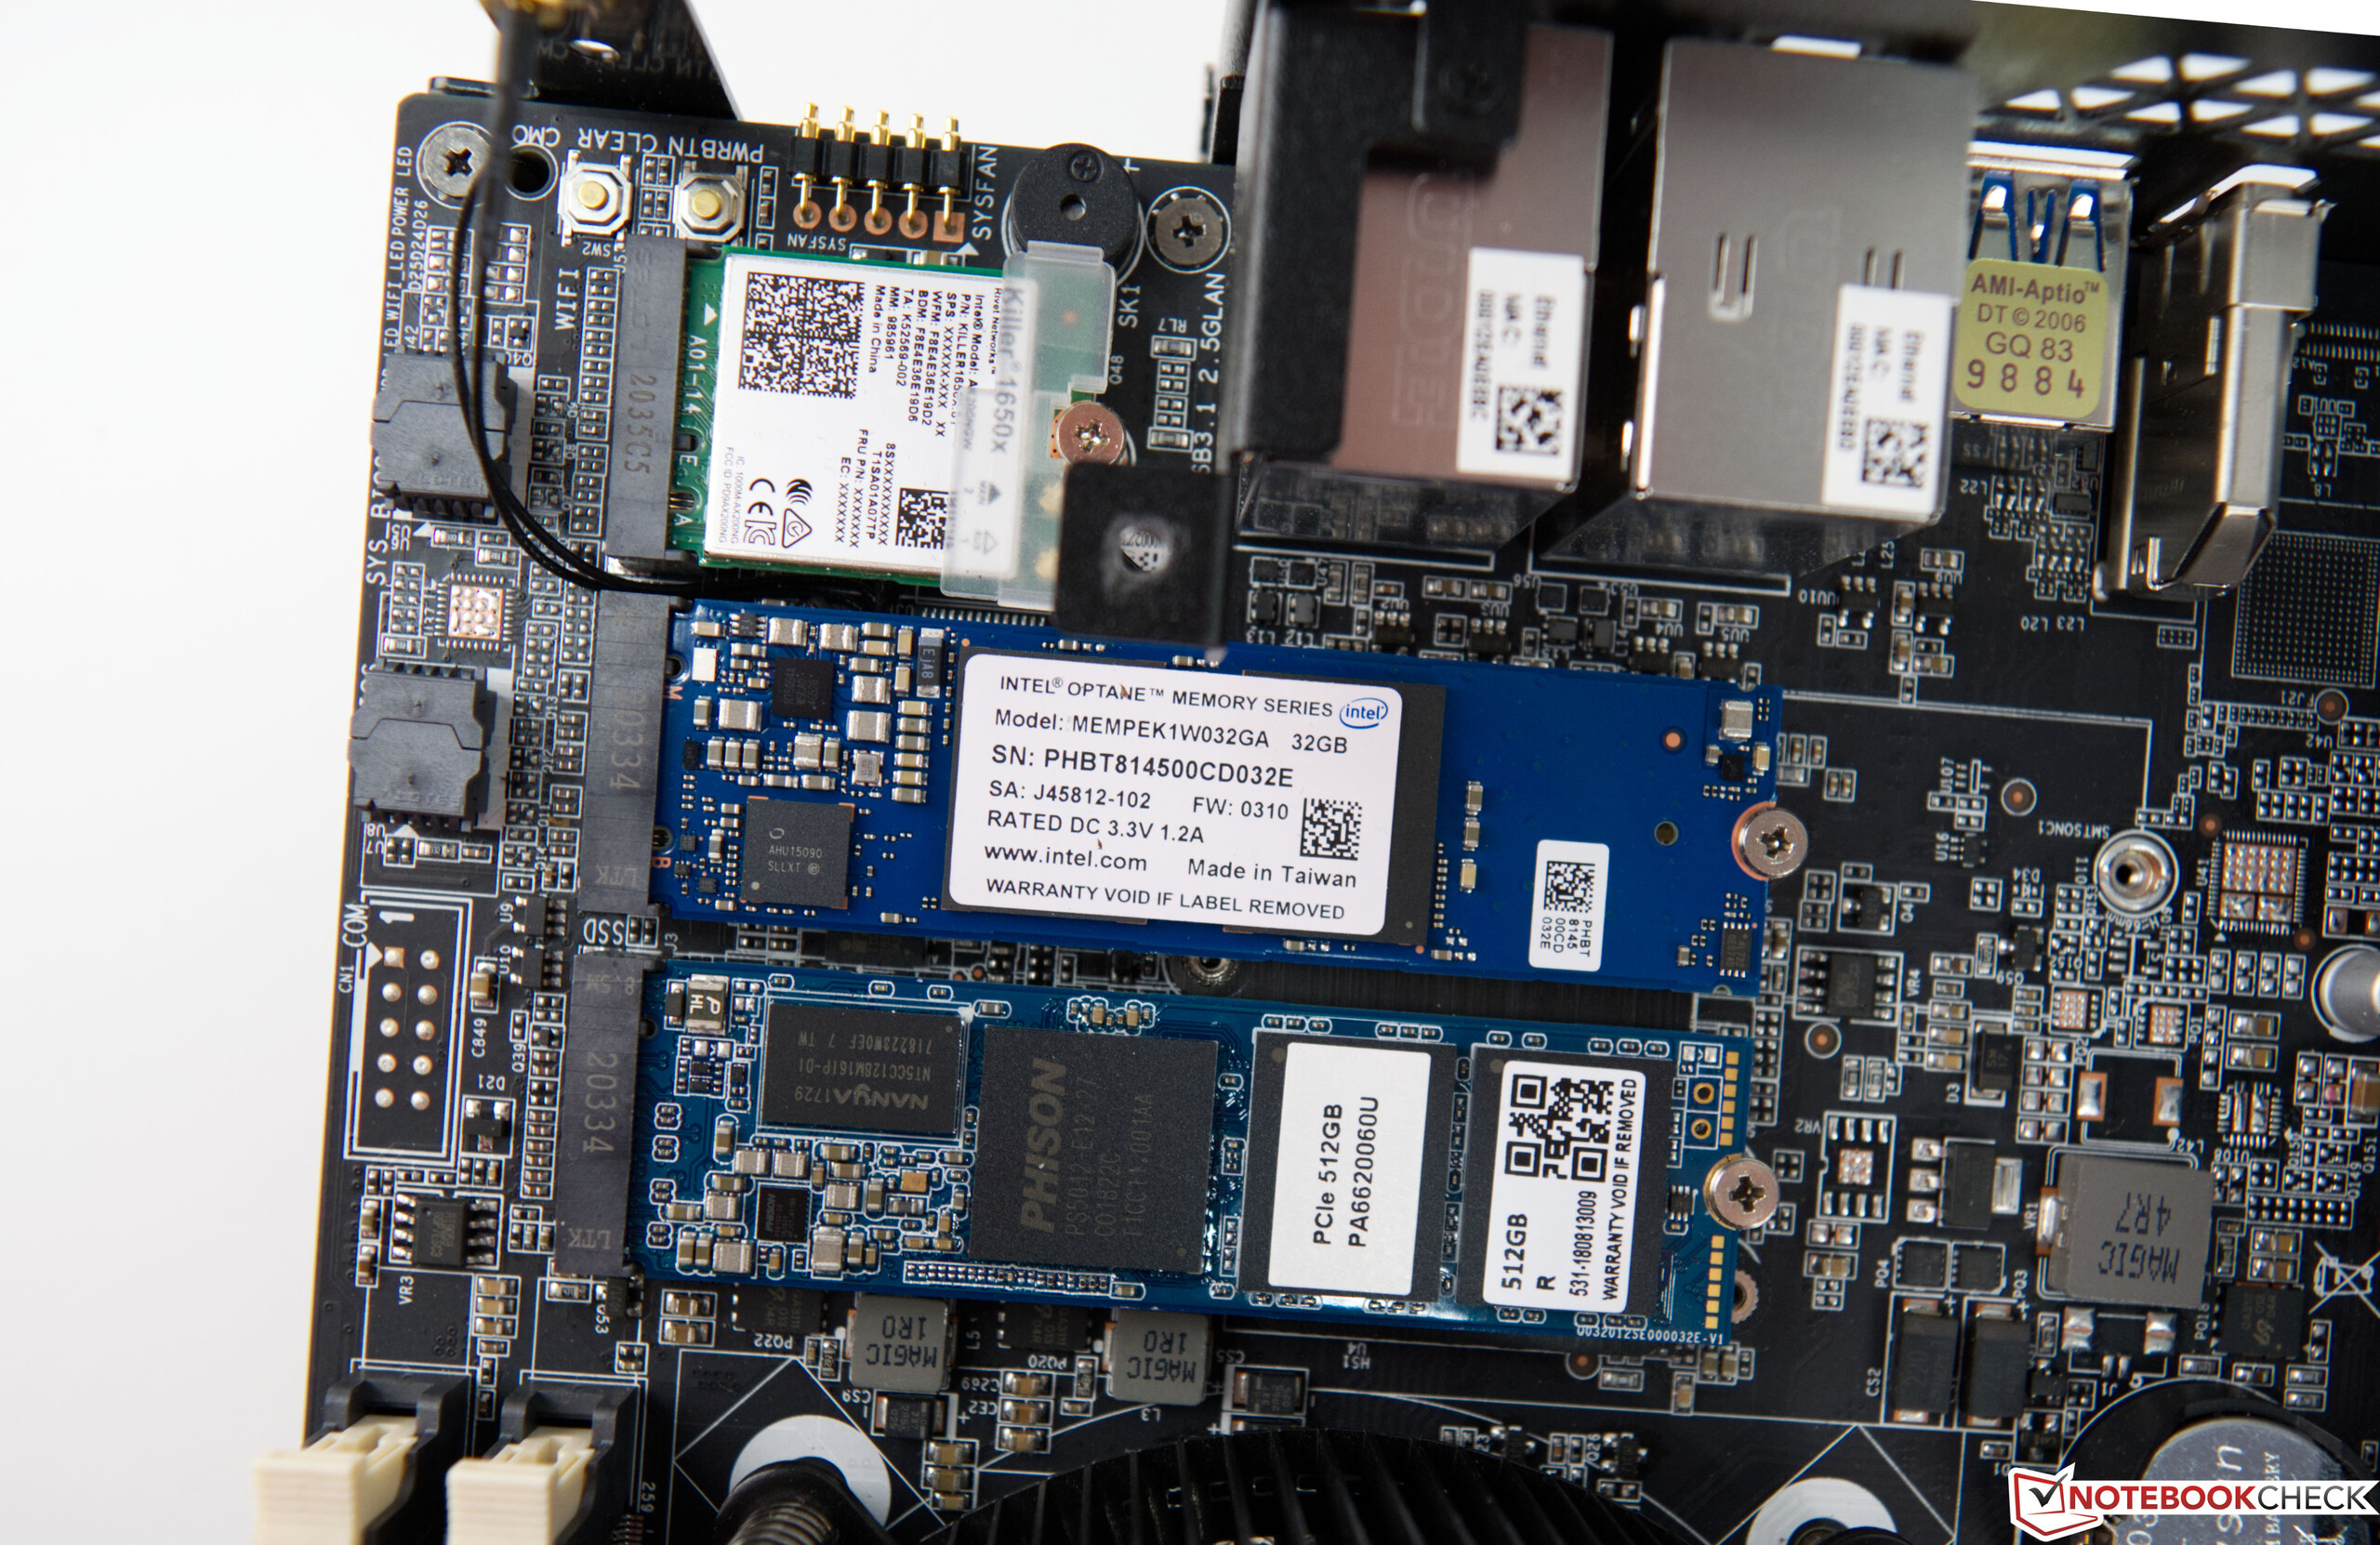
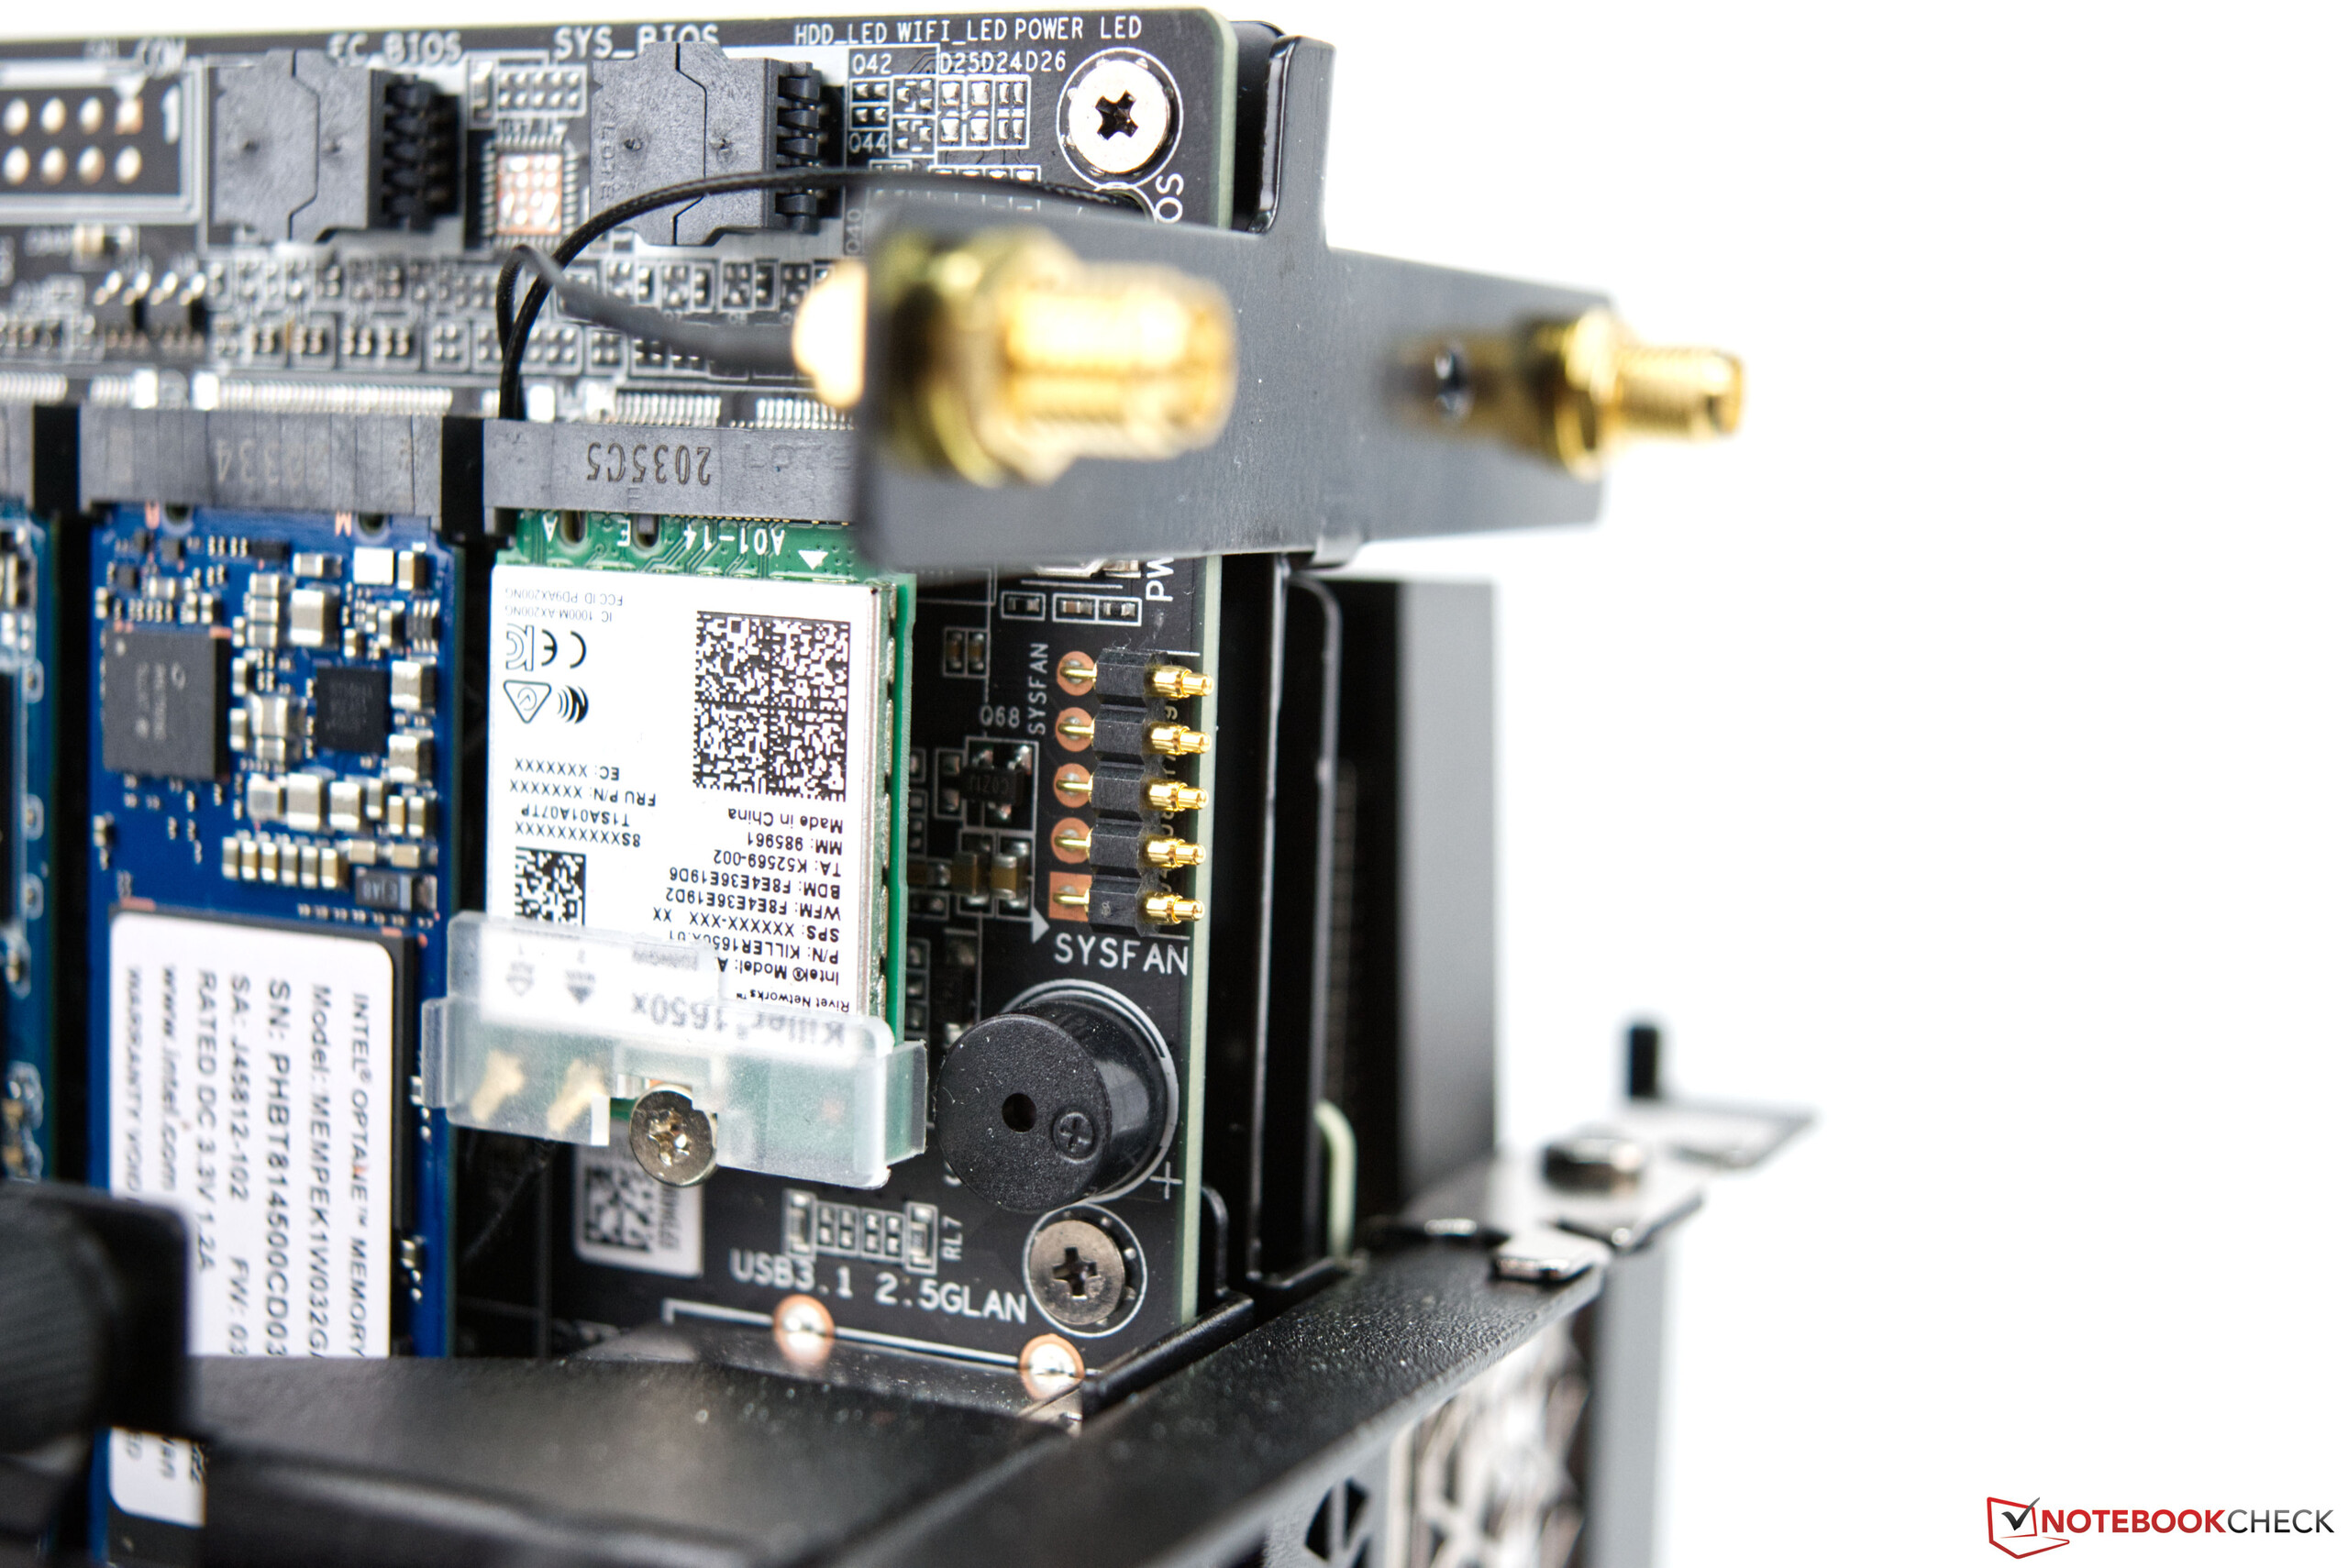
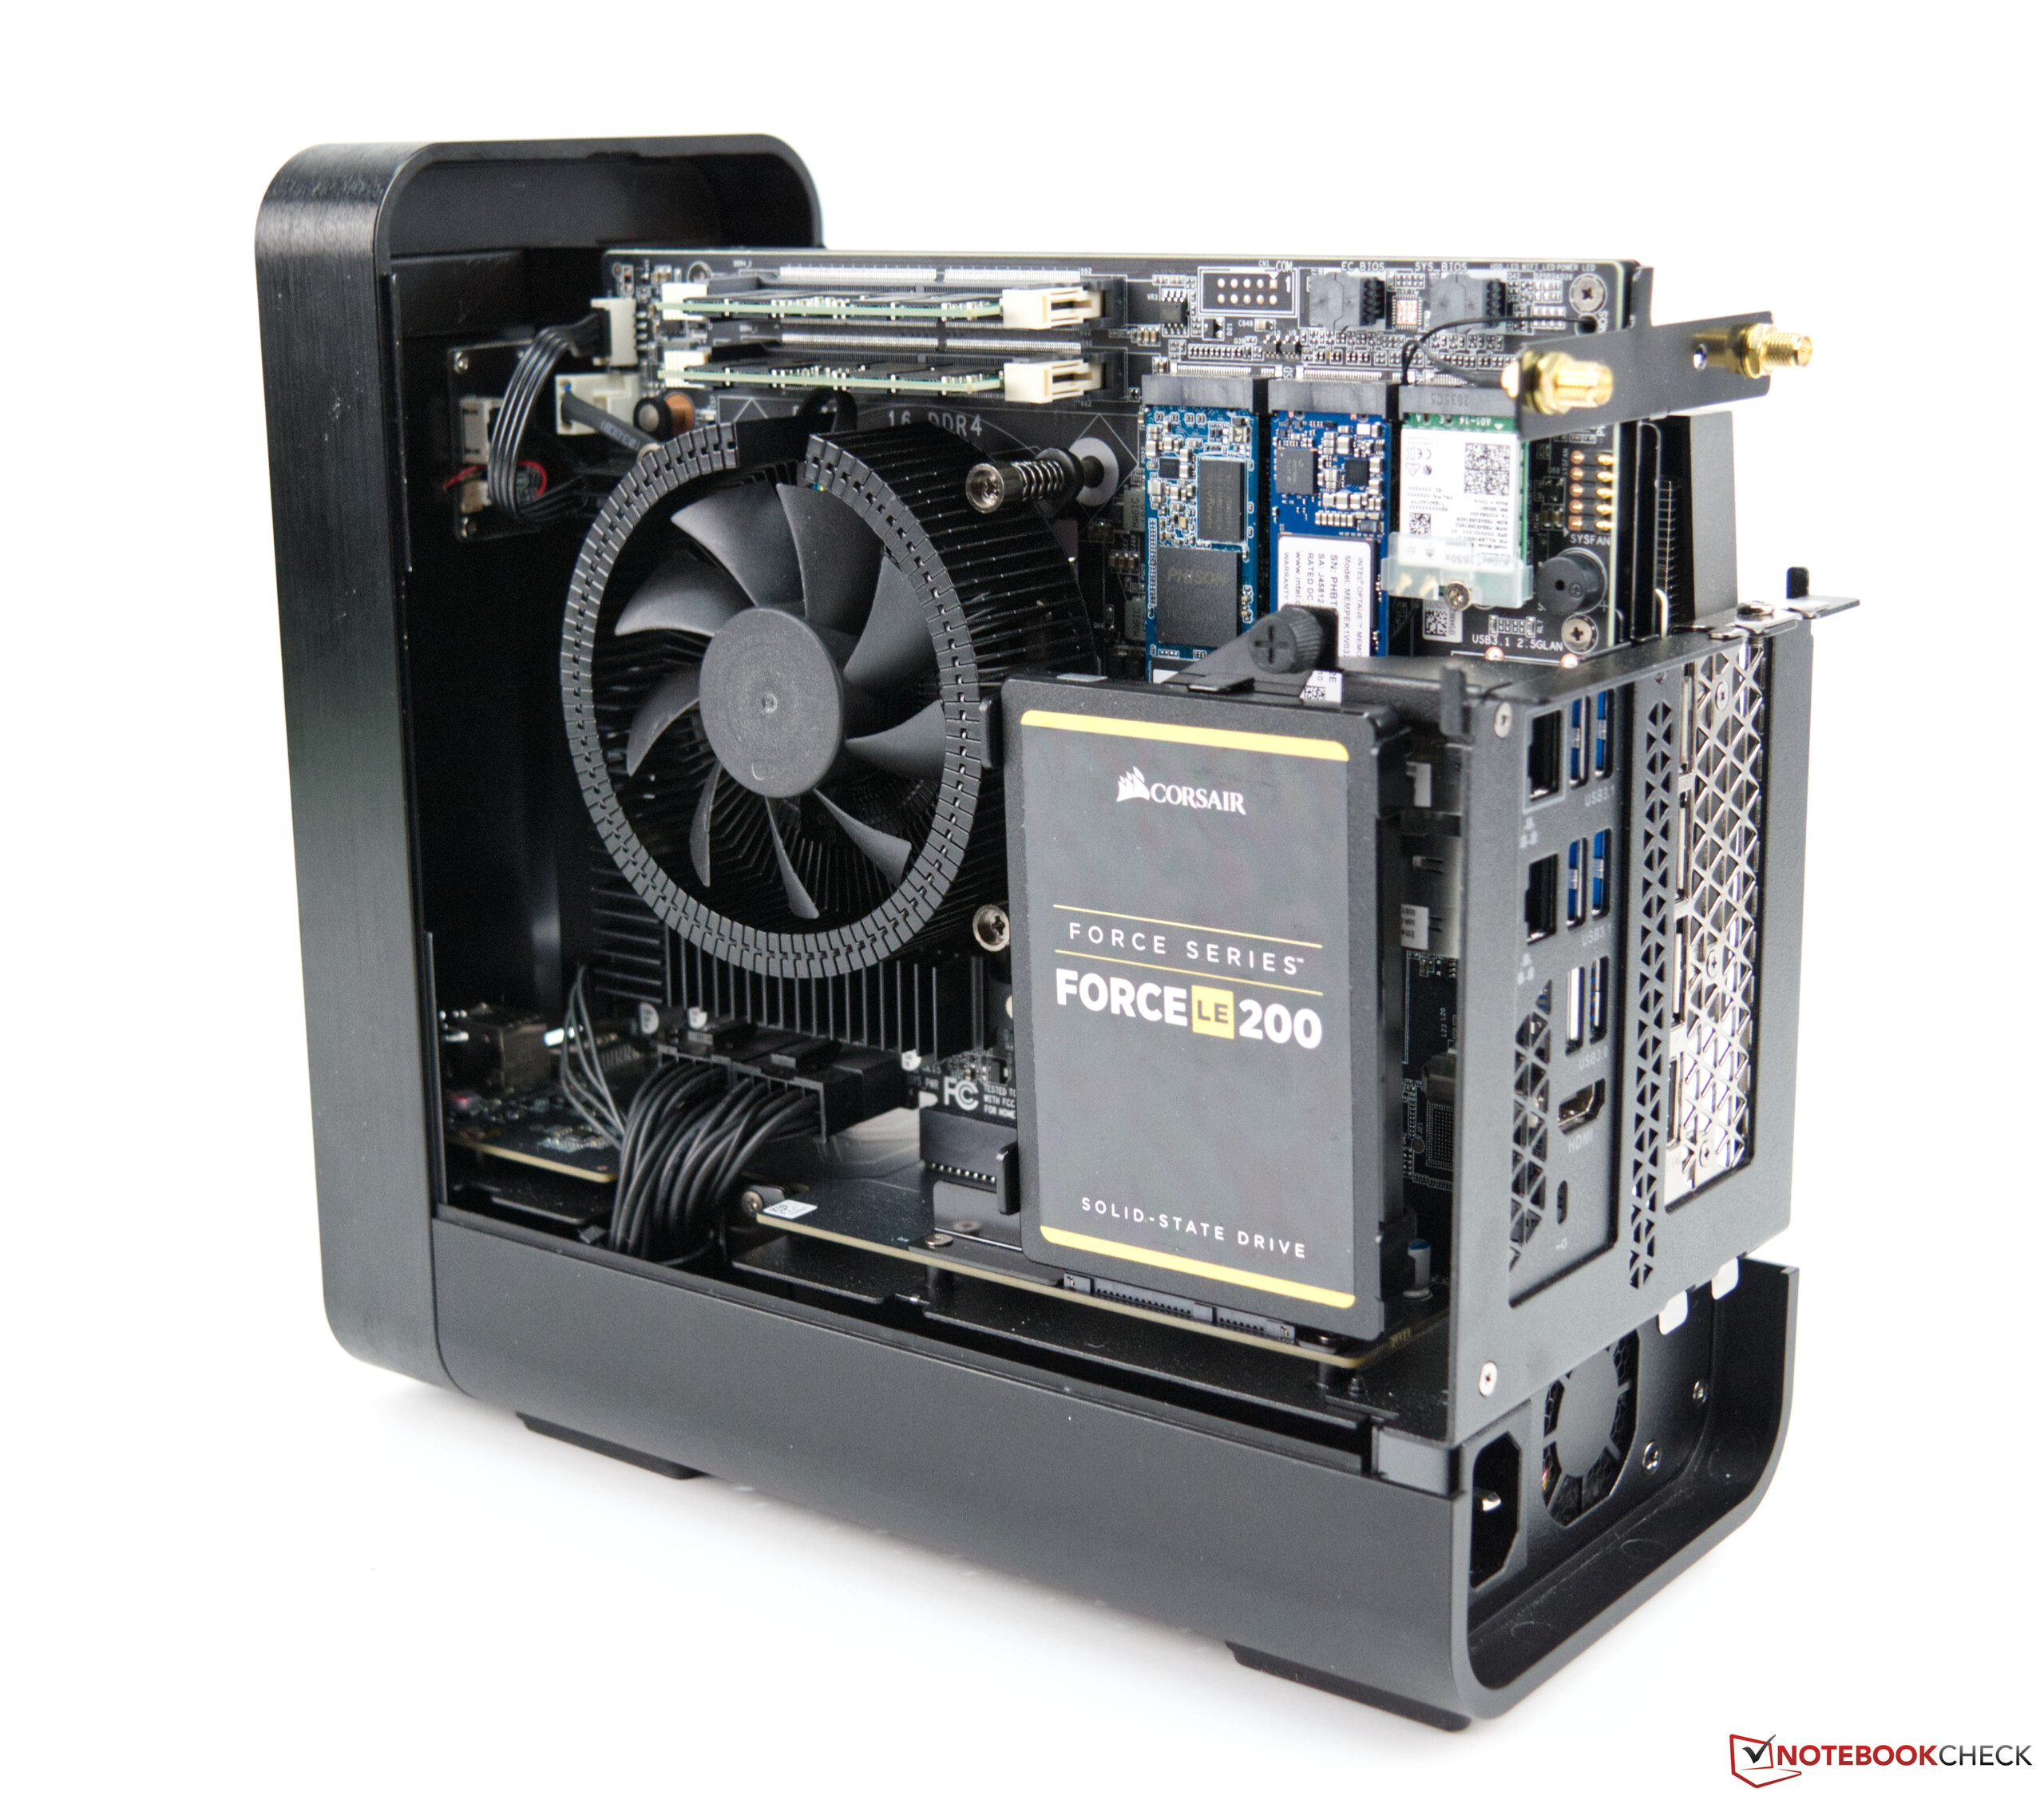
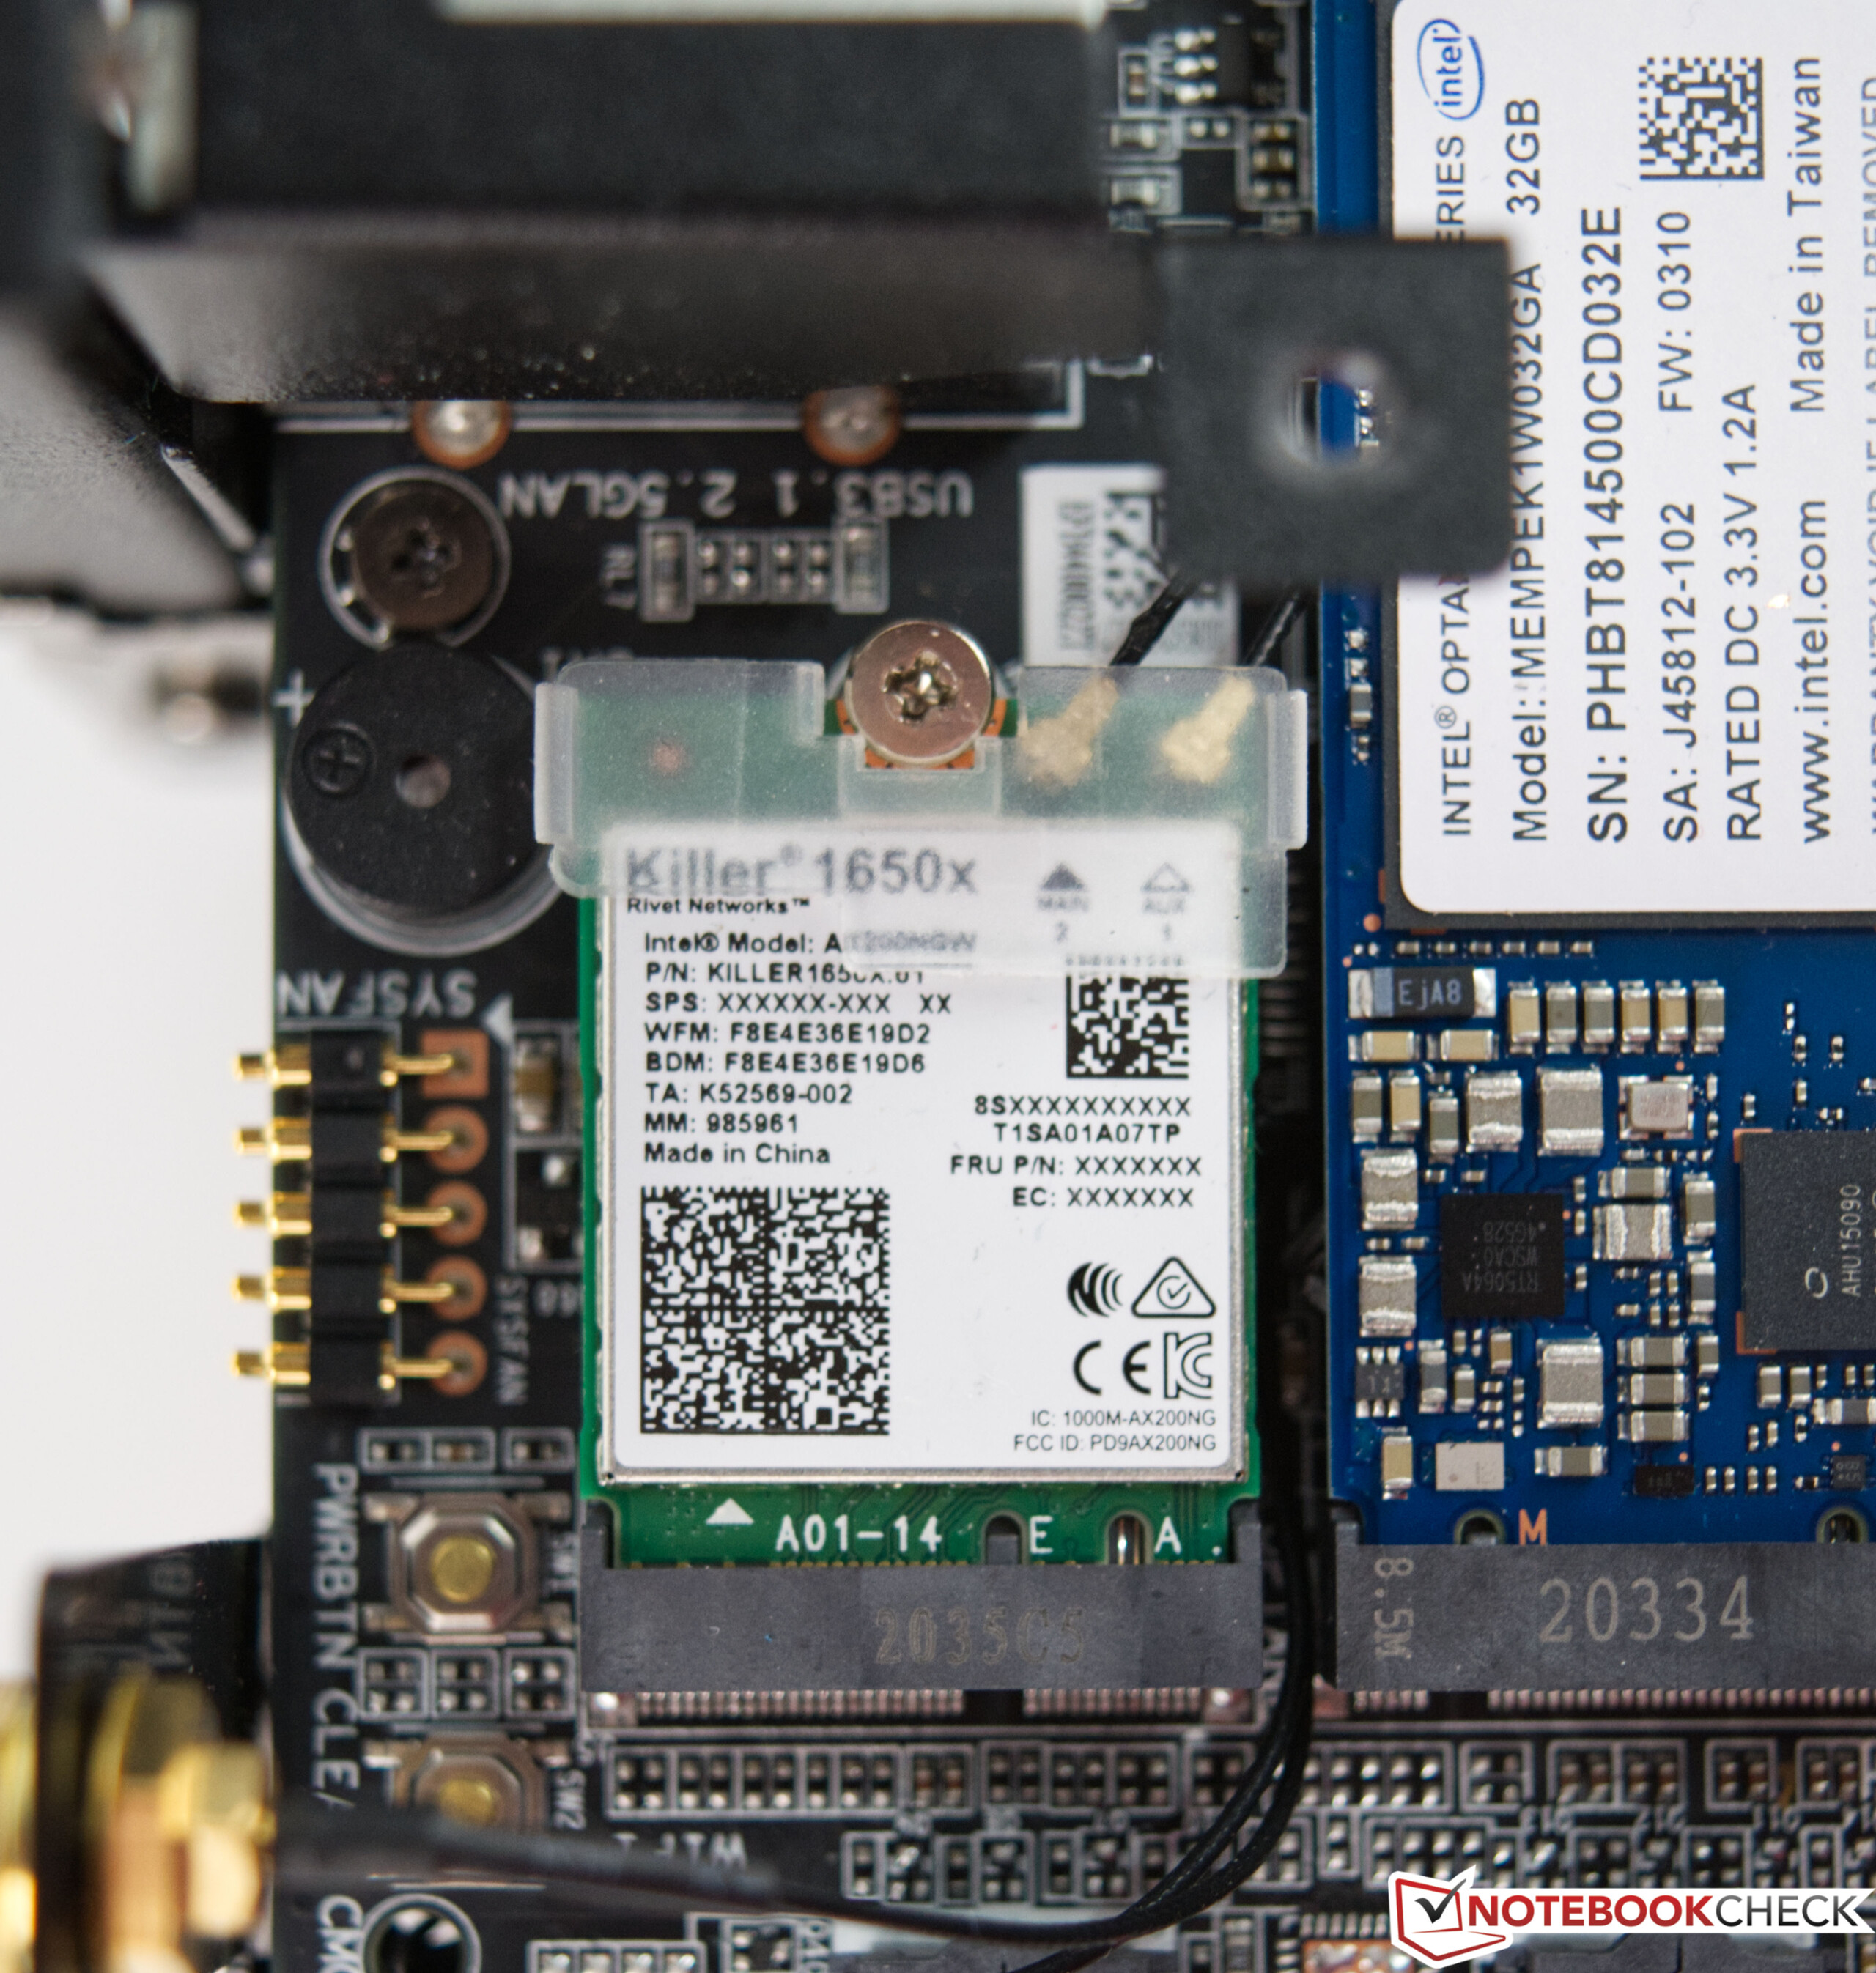
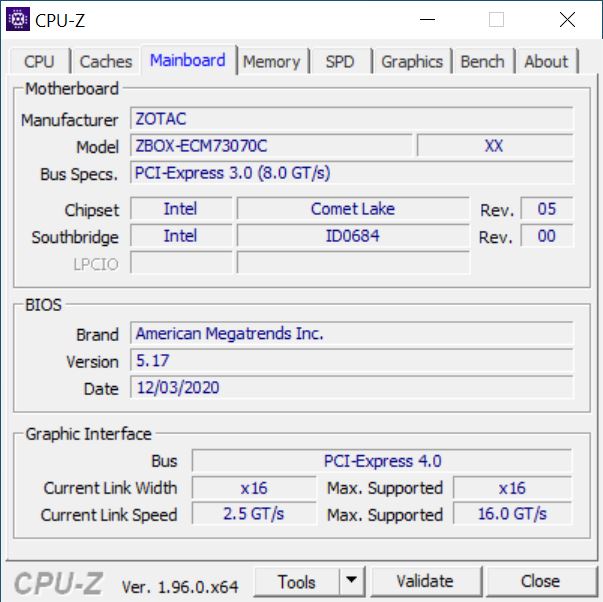
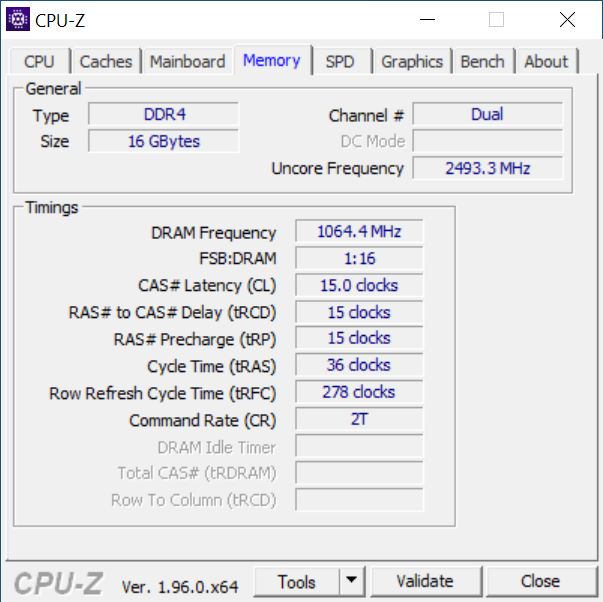
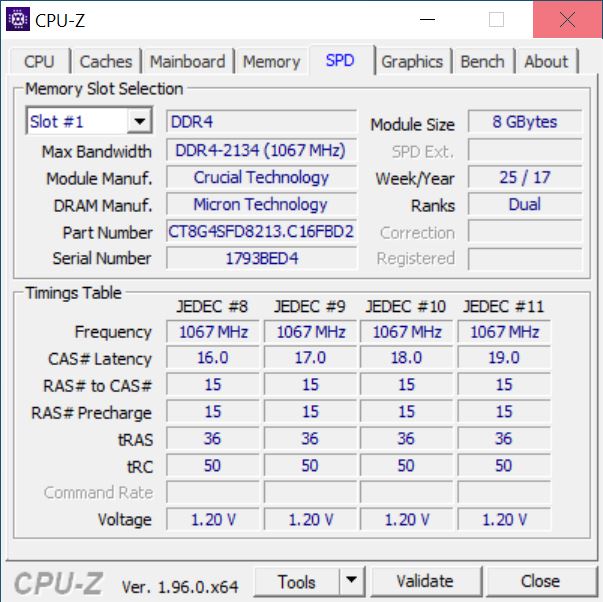
De zeer compacte behuizing bevat alles wat je nodig hebt voor een volwaardige gaming PC. Zelfs de voeding zit in de behuizing, en hoeft niet apart aangesloten te worden zoals bij de MEK Mini. Een speciaal ontwikkeld platform op basis van Intel's 1200 socket dient als basis. Met de Intel Core i7-10700, krijg je een redelijk moderne processor die zijn werk goed doet, omdat zelfs veeleisende taken zeer goed kunnen worden beheerst met zijn 8 kernen en 16 threads. Het 65-watt model is een goede keuze, want warmteontwikkeling mag niet over het hoofd worden gezien. Verder is het systeem uitgerust met een Zotac GeForce RTX 3070. Vanwege de beperkte ruimte heeft Zotac besloten om voor het RAM een SO-DIMM module te gebruiken, die meestal in laptops te vinden is. Je kunt kiezen tussen een conventionele 2,5-inch variant of een M.2 variant voor de massaopslag. Beide combineren is echter ook mogelijk. De slots zitten elkaar niet in de weg
Zotac voorzag ons van een Magnus One met 16 GB DDR4 RAM en SSD's die in totaal 750 GB aan opslagruimte bieden. Het barebone systeem met de GeForce RTX 3070 wordt officieel door Zotac aangeboden voor een MSRP van 1.499 Euro (~$1.825). Desondanks staan de beschikbare modellen aanzienlijk boven de MSRP (vanaf 1.650 euro (~$2.009)) op het moment van testen, wat te maken heeft met de lage voorraden van grafische kaarten.
Processor benchmarks
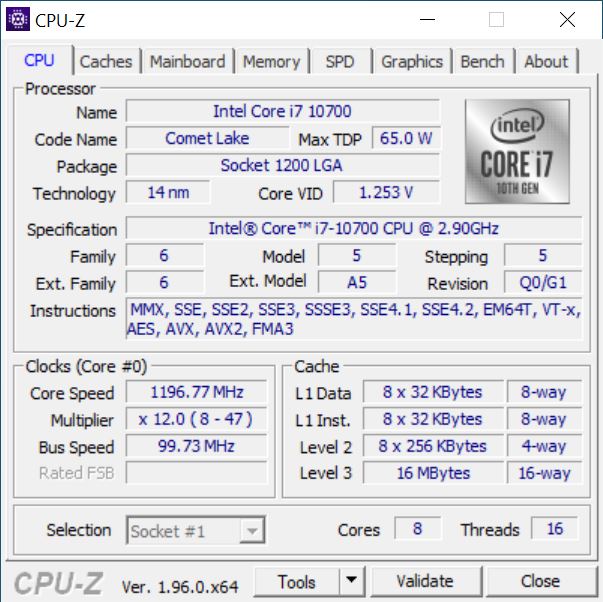
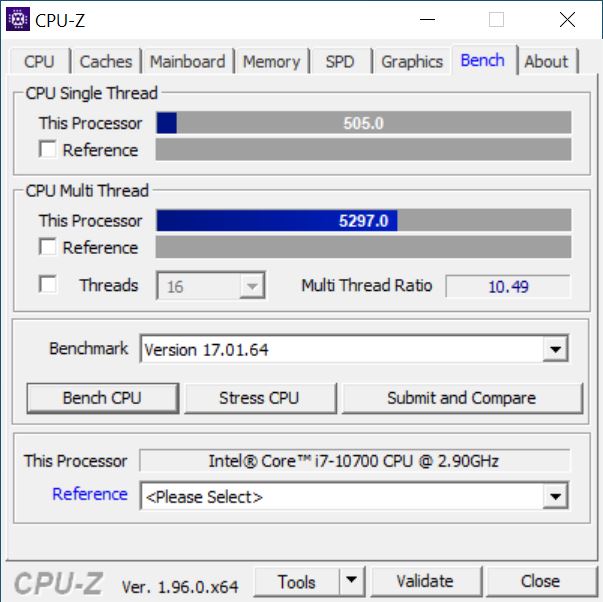
DeIntel Core i7-10700is een octa-core processor met een TDP van 65 watt. De basis kloksnelheid is 2,9 GHz en de maximale boost snelheid wordt gespecificeerd op 4,8 GHz. De Core i7-10700 behaalt een solide resultaat in de Zotac Magnus One, waardoor er geen ruimte overblijft voor meer vanwege de compactheid van de laatste. Desondanks presteert het systeem goed en kan het deIntel Core i7-9700K grotendeels achter zich laten in de multithread tests. In de single-core tests komt de Intel Core i7-10700 in ons testsysteem enigszins overeen met de Intel Core i5-10600K
.Voor verdere vergelijkingen en benchmarks verwijzen we naar onzeCPU vergelijkingstabelhier.
| Cinebench R15 | |
| CPU Single 64Bit | |
| AMD Ryzen 7 5800X, AMD Ryzen 7 5800X | |
| AMD Ryzen 5 5600X, AMD Ryzen 5 5600X | |
| Intel Core i9-10900K, Intel Core i9-10900K | |
| Intel Core i7-9700K, AMD Radeon RX Vega 64, Intel Core i7-9700K | |
| Intel Core i5-10600K, Intel Core i5-10600K | |
| Corsair One i160, Intel Core i9-9900K | |
| Zotac Magnus One (ECM73070C), Intel Core i7-10700 | |
| Intel Core i5-10400F, Intel Core i5-10400F | |
| CPU Multi 64Bit | |
| Intel Core i9-10900K, Intel Core i9-10900K | |
| AMD Ryzen 7 5800X, AMD Ryzen 7 5800X | |
| Corsair One i160, Intel Core i9-9900K | |
| AMD Ryzen 5 5600X, AMD Ryzen 5 5600X | |
| Zotac Magnus One (ECM73070C), Intel Core i7-10700 | |
| Intel Core i5-10600K, Intel Core i5-10600K | |
| Intel Core i7-9700K, AMD Radeon RX Vega 64, Intel Core i7-9700K | |
| Intel Core i5-10400F, Intel Core i5-10400F | |
| Cinebench R20 | |
| CPU (Single Core) | |
| AMD Ryzen 7 5800X, AMD Ryzen 7 5800X | |
| AMD Ryzen 5 5600X, AMD Ryzen 5 5600X | |
| Intel Core i9-10900K, Intel Core i9-10900K | |
| Corsair One i160, Intel Core i9-9900K | |
| Intel Core i7-9700K, AMD Radeon RX Vega 64, Intel Core i7-9700K | |
| Intel Core i5-10600K, Intel Core i5-10600K | |
| Intel Core i5-10400F, Intel Core i5-10400F | |
| CPU (Multi Core) | |
| Intel Core i9-10900K, Intel Core i9-10900K | |
| AMD Ryzen 7 5800X, AMD Ryzen 7 5800X | |
| Corsair One i160, Intel Core i9-9900K | |
| AMD Ryzen 5 5600X, AMD Ryzen 5 5600X | |
| Intel Core i5-10600K, Intel Core i5-10600K | |
| Intel Core i7-9700K, AMD Radeon RX Vega 64, Intel Core i7-9700K | |
| Intel Core i5-10400F, Intel Core i5-10400F | |
| Cinebench R11.5 | |
| CPU Single 64Bit | |
| AMD Ryzen 7 5800X, AMD Ryzen 7 5800X | |
| AMD Ryzen 5 5600X, AMD Ryzen 5 5600X | |
| Intel Core i9-10900K, Intel Core i9-10900K | |
| Intel Core i7-9700K, AMD Radeon RX Vega 64, Intel Core i7-9700K | |
| Corsair One i160, Intel Core i9-9900K | |
| Zotac Magnus One (ECM73070C), Intel Core i7-10700 | |
| Intel Core i5-10600K, Intel Core i5-10600K | |
| Intel Core i5-10400F, Intel Core i5-10400F | |
| CPU Multi 64Bit | |
| AMD Ryzen 7 5800X, AMD Ryzen 7 5800X | |
| Intel Core i9-10900K, Intel Core i9-10900K | |
| Corsair One i160, Intel Core i9-9900K | |
| AMD Ryzen 5 5600X, AMD Ryzen 5 5600X | |
| Zotac Magnus One (ECM73070C), Intel Core i7-10700 | |
| Intel Core i7-9700K, AMD Radeon RX Vega 64, Intel Core i7-9700K | |
| Intel Core i5-10600K, Intel Core i5-10600K | |
| Intel Core i5-10400F, Intel Core i5-10400F | |
| Cinebench R10 | |
| Rendering Single CPUs 64Bit | |
| AMD Ryzen 7 5800X, AMD Ryzen 7 5800X | |
| AMD Ryzen 5 5600X, AMD Ryzen 5 5600X | |
| Intel Core i9-10900K, Intel Core i9-10900K | |
| Corsair One i160, Intel Core i9-9900K | |
| Zotac Magnus One (ECM73070C), Intel Core i7-10700 | |
| Intel Core i7-9700K, AMD Radeon RX Vega 64, Intel Core i7-9700K | |
| Intel Core i5-10600K, Intel Core i5-10600K | |
| Intel Core i5-10400F, Intel Core i5-10400F | |
| Rendering Multiple CPUs 64Bit | |
| AMD Ryzen 7 5800X, AMD Ryzen 7 5800X | |
| Intel Core i9-10900K, Intel Core i9-10900K | |
| AMD Ryzen 5 5600X, AMD Ryzen 5 5600X | |
| Corsair One i160, Intel Core i9-9900K | |
| Intel Core i7-9700K, AMD Radeon RX Vega 64, Intel Core i7-9700K | |
| Zotac Magnus One (ECM73070C), Intel Core i7-10700 | |
| Intel Core i5-10600K, Intel Core i5-10600K | |
| Intel Core i5-10400F, Intel Core i5-10400F | |
| Blender - v2.79 BMW27 CPU | |
| Intel Core i3-10100, Intel Core i3-10100 | |
| Intel Core i5-10400F, Intel Core i5-10400F | |
| Zotac Magnus One (ECM73070C), Intel Core i7-10700 | |
| Intel Core i7-9700K, AMD Radeon RX Vega 64, Intel Core i7-9700K | |
| Intel Core i5-10600K, Intel Core i5-10600K | |
| AMD Ryzen 5 5600X, AMD Ryzen 5 5600X | |
| Corsair One i160, Intel Core i9-9900K | |
| AMD Ryzen 7 5800X, AMD Ryzen 7 5800X | |
| Intel Core i9-10900K, Intel Core i9-10900K | |
| wPrime 2.10 | |
| 32m | |
| Intel Core i5-10400F, Intel Core i5-10400F | |
| Intel Core i5-10600K, Intel Core i5-10600K | |
| Intel Core i7-9700K, AMD Radeon RX Vega 64, Intel Core i7-9700K | |
| AMD Ryzen 5 5600X, AMD Ryzen 5 5600X | |
| Intel Core i9-10900K, Intel Core i9-10900K | |
| Corsair One i160, Intel Core i9-9900K | |
| Zotac Magnus One (ECM73070C), Intel Core i7-10700 | |
| AMD Ryzen 7 5800X, AMD Ryzen 7 5800X | |
| 1024m | |
| Intel Core i5-10400F, Intel Core i5-10400F | |
| Intel Core i7-9700K, AMD Radeon RX Vega 64, Intel Core i7-9700K | |
| Zotac Magnus One (ECM73070C), Intel Core i7-10700 | |
| AMD Ryzen 5 5600X, AMD Ryzen 5 5600X | |
| Intel Core i5-10600K, Intel Core i5-10600K | |
| Corsair One i160, Intel Core i9-9900K | |
| AMD Ryzen 7 5800X, AMD Ryzen 7 5800X | |
| Intel Core i9-10900K, Intel Core i9-10900K | |
| X264 HD Benchmark 4.0 | |
| Pass 1 | |
| AMD Ryzen 7 5800X, AMD Ryzen 7 5800X | |
| AMD Ryzen 5 5600X, AMD Ryzen 5 5600X | |
| Intel Core i9-10900K, Intel Core i9-10900K | |
| Intel Core i7-9700K, AMD Radeon RX Vega 64, Intel Core i7-9700K | |
| Corsair One i160, Intel Core i9-9900K | |
| Intel Core i5-10600K, Intel Core i5-10600K | |
| Zotac Magnus One (ECM73070C), Intel Core i7-10700 | |
| Intel Core i5-10400F, Intel Core i5-10400F | |
| Pass 2 | |
| AMD Ryzen 7 5800X, AMD Ryzen 7 5800X | |
| Intel Core i9-10900K, Intel Core i9-10900K | |
| Corsair One i160, Intel Core i9-9900K | |
| AMD Ryzen 5 5600X, AMD Ryzen 5 5600X | |
| Intel Core i7-9700K, AMD Radeon RX Vega 64, Intel Core i7-9700K | |
| Intel Core i5-10600K, Intel Core i5-10600K | |
| Zotac Magnus One (ECM73070C), Intel Core i7-10700 | |
| Intel Core i5-10400F, Intel Core i5-10400F | |
| WinRAR - Result | |
| AMD Ryzen 7 5800X, AMD Ryzen 7 5800X | |
| AMD Ryzen 5 5600X, AMD Ryzen 5 5600X | |
| Intel Core i9-10900K, Intel Core i9-10900K | |
| Corsair One i160, Intel Core i9-9900K | |
| Intel Core i7-9700K, AMD Radeon RX Vega 64, Intel Core i7-9700K | |
| Zotac Magnus One (ECM73070C), Intel Core i7-10700 | |
| Intel Core i5-10600K, Intel Core i5-10600K | |
| TrueCrypt | |
| AES Mean 100MB | |
| AMD Ryzen 7 5800X, AMD Ryzen 7 5800X | |
| Intel Core i9-10900K, Intel Core i9-10900K | |
| Corsair One i160, Intel Core i9-9900K | |
| AMD Ryzen 5 5600X, AMD Ryzen 5 5600X | |
| Zotac Magnus One (ECM73070C), Intel Core i7-10700 | |
| Intel Core i7-9700K, AMD Radeon RX Vega 64, Intel Core i7-9700K | |
| Intel Core i5-10600K, Intel Core i5-10600K | |
| Twofish Mean 100MB | |
| Intel Core i9-10900K, Intel Core i9-10900K | |
| AMD Ryzen 7 5800X, AMD Ryzen 7 5800X | |
| Corsair One i160, Intel Core i9-9900K | |
| Zotac Magnus One (ECM73070C), Intel Core i7-10700 | |
| AMD Ryzen 5 5600X, AMD Ryzen 5 5600X | |
| Intel Core i5-10600K, Intel Core i5-10600K | |
| Intel Core i7-9700K, AMD Radeon RX Vega 64, Intel Core i7-9700K | |
| Serpent Mean 100MB | |
| Intel Core i9-10900K, Intel Core i9-10900K | |
| AMD Ryzen 7 5800X, AMD Ryzen 7 5800X | |
| Corsair One i160, Intel Core i9-9900K | |
| Zotac Magnus One (ECM73070C), Intel Core i7-10700 | |
| AMD Ryzen 5 5600X, AMD Ryzen 5 5600X | |
| Intel Core i5-10600K, Intel Core i5-10600K | |
| Intel Core i7-9700K, AMD Radeon RX Vega 64, Intel Core i7-9700K | |
| Geekbench 5.5 | |
| Multi-Core | |
| Intel Core i9-10900K, Intel Core i9-10900K | |
| AMD Ryzen 7 5800X, AMD Ryzen 7 5800X | |
| AMD Ryzen 5 5600X, AMD Ryzen 5 5600X | |
| Zotac Magnus One (ECM73070C), Intel Core i7-10700 | |
| Intel Core i7-9700K, AMD Radeon RX Vega 64, Intel Core i7-9700K | |
| Intel Core i5-10600K, Intel Core i5-10600K | |
| Intel Core i5-10400F, Intel Core i5-10400F | |
| Intel Core i5-10400F, Intel Core i5-10400F | |
| Intel Core i3-10100, Intel Core i3-10100 | |
| Single-Core | |
| AMD Ryzen 7 5800X, AMD Ryzen 7 5800X | |
| AMD Ryzen 5 5600X, AMD Ryzen 5 5600X | |
| Intel Core i9-10900K, Intel Core i9-10900K | |
| Intel Core i7-9700K, AMD Radeon RX Vega 64, Intel Core i7-9700K | |
| Zotac Magnus One (ECM73070C), Intel Core i7-10700 | |
| Intel Core i5-10600K, Intel Core i5-10600K | |
| Intel Core i5-10400F, Intel Core i5-10400F | |
| Intel Core i5-10400F, Intel Core i5-10400F | |
| Intel Core i3-10100, Intel Core i3-10100 | |
| Geekbench 5.0 | |
| 5.0 Multi-Core | |
| Intel Core i9-10900K, Intel Core i9-10900K | |
| AMD Ryzen 7 5800X, AMD Ryzen 7 5800X | |
| AMD Ryzen 5 5600X, AMD Ryzen 5 5600X | |
| Zotac Magnus One (ECM73070C), Intel Core i7-10700 | |
| Intel Core i5-10600K, Intel Core i5-10600K | |
| Intel Core i5-10400F, Intel Core i5-10400F | |
| Intel Core i3-10100, Intel Core i3-10100 | |
| 5.0 Single-Core | |
| AMD Ryzen 7 5800X, AMD Ryzen 7 5800X | |
| AMD Ryzen 5 5600X, AMD Ryzen 5 5600X | |
| Intel Core i9-10900K, Intel Core i9-10900K | |
| Zotac Magnus One (ECM73070C), Intel Core i7-10700 | |
| Intel Core i5-10600K, Intel Core i5-10600K | |
| Intel Core i5-10400F, Intel Core i5-10400F | |
| Intel Core i3-10100, Intel Core i3-10100 | |
| Geekbench 4.4 | |
| 64 Bit Single-Core Score | |
| AMD Ryzen 7 5800X, AMD Ryzen 7 5800X | |
| AMD Ryzen 5 5600X, AMD Ryzen 5 5600X | |
| Intel Core i9-10900K, Intel Core i9-10900K | |
| Intel Core i7-9700K, AMD Radeon RX Vega 64, Intel Core i7-9700K | |
| Corsair One i160, Intel Core i9-9900K | |
| Intel Core i5-10600K, Intel Core i5-10600K | |
| Zotac Magnus One (ECM73070C), Intel Core i7-10700 | |
| Intel Core i5-10400F, Intel Core i5-10400F | |
| Intel Core i3-10100, Intel Core i3-10100 | |
| 64 Bit Multi-Core Score | |
| AMD Ryzen 7 5800X, AMD Ryzen 7 5800X | |
| Intel Core i9-10900K, Intel Core i9-10900K | |
| AMD Ryzen 5 5600X, AMD Ryzen 5 5600X | |
| Corsair One i160, Intel Core i9-9900K | |
| Zotac Magnus One (ECM73070C), Intel Core i7-10700 | |
| Intel Core i7-9700K, AMD Radeon RX Vega 64, Intel Core i7-9700K | |
| Intel Core i5-10600K, Intel Core i5-10600K | |
| Intel Core i5-10400F, Intel Core i5-10400F | |
| Intel Core i3-10100, Intel Core i3-10100 | |
| 3DMark 11 - 1280x720 Performance Physics | |
| AMD Ryzen 7 5800X, AMD Ryzen 7 5800X | |
| Intel Core i9-10900K, Intel Core i9-10900K | |
| AMD Ryzen 5 5600X, AMD Ryzen 5 5600X | |
| Corsair One i160, Intel Core i9-9900K | |
| Intel Core i7-9700K, AMD Radeon RX Vega 64, Intel Core i7-9700K | |
| Intel Core i5-10600K, Intel Core i5-10600K | |
| Zotac Magnus One (ECM73070C), Intel Core i7-10700 | |
| Intel Core i5-10400F, Intel Core i5-10400F | |
| 7-Zip 18.03 | |
| 7z b 4 | |
| AMD Ryzen 7 5800X, AMD Ryzen 7 5800X | |
| Intel Core i9-10900K, Intel Core i9-10900K | |
| AMD Ryzen 5 5600X, AMD Ryzen 5 5600X | |
| Corsair One i160, Intel Core i9-9900K | |
| Zotac Magnus One (ECM73070C), Intel Core i7-10700 | |
| Intel Core i5-10600K, Intel Core i5-10600K | |
| Intel Core i5-10400F, Intel Core i5-10400F | |
| Intel Core i3-10100, Intel Core i3-10100 | |
| 7z b 4 -mmt1 | |
| AMD Ryzen 7 5800X, AMD Ryzen 7 5800X | |
| AMD Ryzen 5 5600X, AMD Ryzen 5 5600X | |
| Intel Core i9-10900K, Intel Core i9-10900K | |
| Corsair One i160, Intel Core i9-9900K | |
| Zotac Magnus One (ECM73070C), Intel Core i7-10700 | |
| Intel Core i5-10600K, Intel Core i5-10600K | |
| Intel Core i5-10400F, Intel Core i5-10400F | |
| Intel Core i3-10100, Intel Core i3-10100 | |
| HWBOT x265 Benchmark v2.2 - 4k Preset | |
| Intel Core i9-10900K, Intel Core i9-10900K | |
| AMD Ryzen 7 5800X, AMD Ryzen 7 5800X | |
| Corsair One i160, Intel Core i9-9900K | |
| AMD Ryzen 5 5600X, AMD Ryzen 5 5600X | |
| Intel Core i7-9700K, AMD Radeon RX Vega 64, Intel Core i7-9700K | |
| Intel Core i5-10600K, Intel Core i5-10600K | |
| Zotac Magnus One (ECM73070C), Intel Core i7-10700 | |
| Intel Core i5-10400F, Intel Core i5-10400F | |
| Intel Core i3-10100, Intel Core i3-10100 | |
| R Benchmark 2.5 - Overall mean | |
| Intel Core i3-10100, Intel Core i3-10100 | |
| Intel Core i5-10400F, Intel Core i5-10400F | |
| Intel Core i5-10600K, Intel Core i5-10600K | |
| Zotac Magnus One (ECM73070C), Intel Core i7-10700 | |
| Intel Core i9-10900K, Intel Core i9-10900K | |
| AMD Ryzen 5 5600X, AMD Ryzen 5 5600X | |
| AMD Ryzen 7 5800X, AMD Ryzen 7 5800X | |
| LibreOffice - 20 Documents To PDF | |
| Intel Core i9-10900K, Intel Core i9-10900K | |
| Zotac Magnus One (ECM73070C), Intel Core i7-10700 | |
| Intel Core i3-10100, Intel Core i3-10100 | |
| Intel Core i5-10400F, Intel Core i5-10400F | |
| Intel Core i5-10600K, Intel Core i5-10600K | |
| AMD Ryzen 5 5600X, AMD Ryzen 5 5600X | |
| AMD Ryzen 7 5800X, AMD Ryzen 7 5800X | |
| WebXPRT 3 - Overall | |
| AMD Ryzen 7 5800X, AMD Ryzen 7 5800X | |
| AMD Ryzen 5 5600X, AMD Ryzen 5 5600X | |
| Intel Core i9-10900K, Intel Core i9-10900K | |
| Zotac Magnus One (ECM73070C), Intel Core i7-10700 | |
| Intel Core i5-10600K, Intel Core i5-10600K | |
| Intel Core i5-10400F, Intel Core i5-10400F | |
| Intel Core i3-10100, Intel Core i3-10100 | |
| Mozilla Kraken 1.1 - Total | |
| Intel Core i5-10400F, Intel Core i5-10400F | |
| Intel Core i3-10100, Intel Core i3-10100 | |
| Intel Core i5-10600K, Intel Core i5-10600K | |
| Zotac Magnus One (ECM73070C), Intel Core i7-10700 | |
| Intel Core i9-10900K, Intel Core i9-10900K | |
| AMD Ryzen 5 5600X, AMD Ryzen 5 5600X | |
| AMD Ryzen 7 5800X, AMD Ryzen 7 5800X | |
* ... kleiner is beter
Zotac Magnus One in de Cinebench R15 multi-loop
De Intel Core i7-10700 ervaart een lichte prestatiedaling na de eerste run, maar deze wordt steeds stabieler in het verdere verloop van de test. Desondanks liggen de prestaties op een hoog niveau met een gemiddelde van 1.338 punten
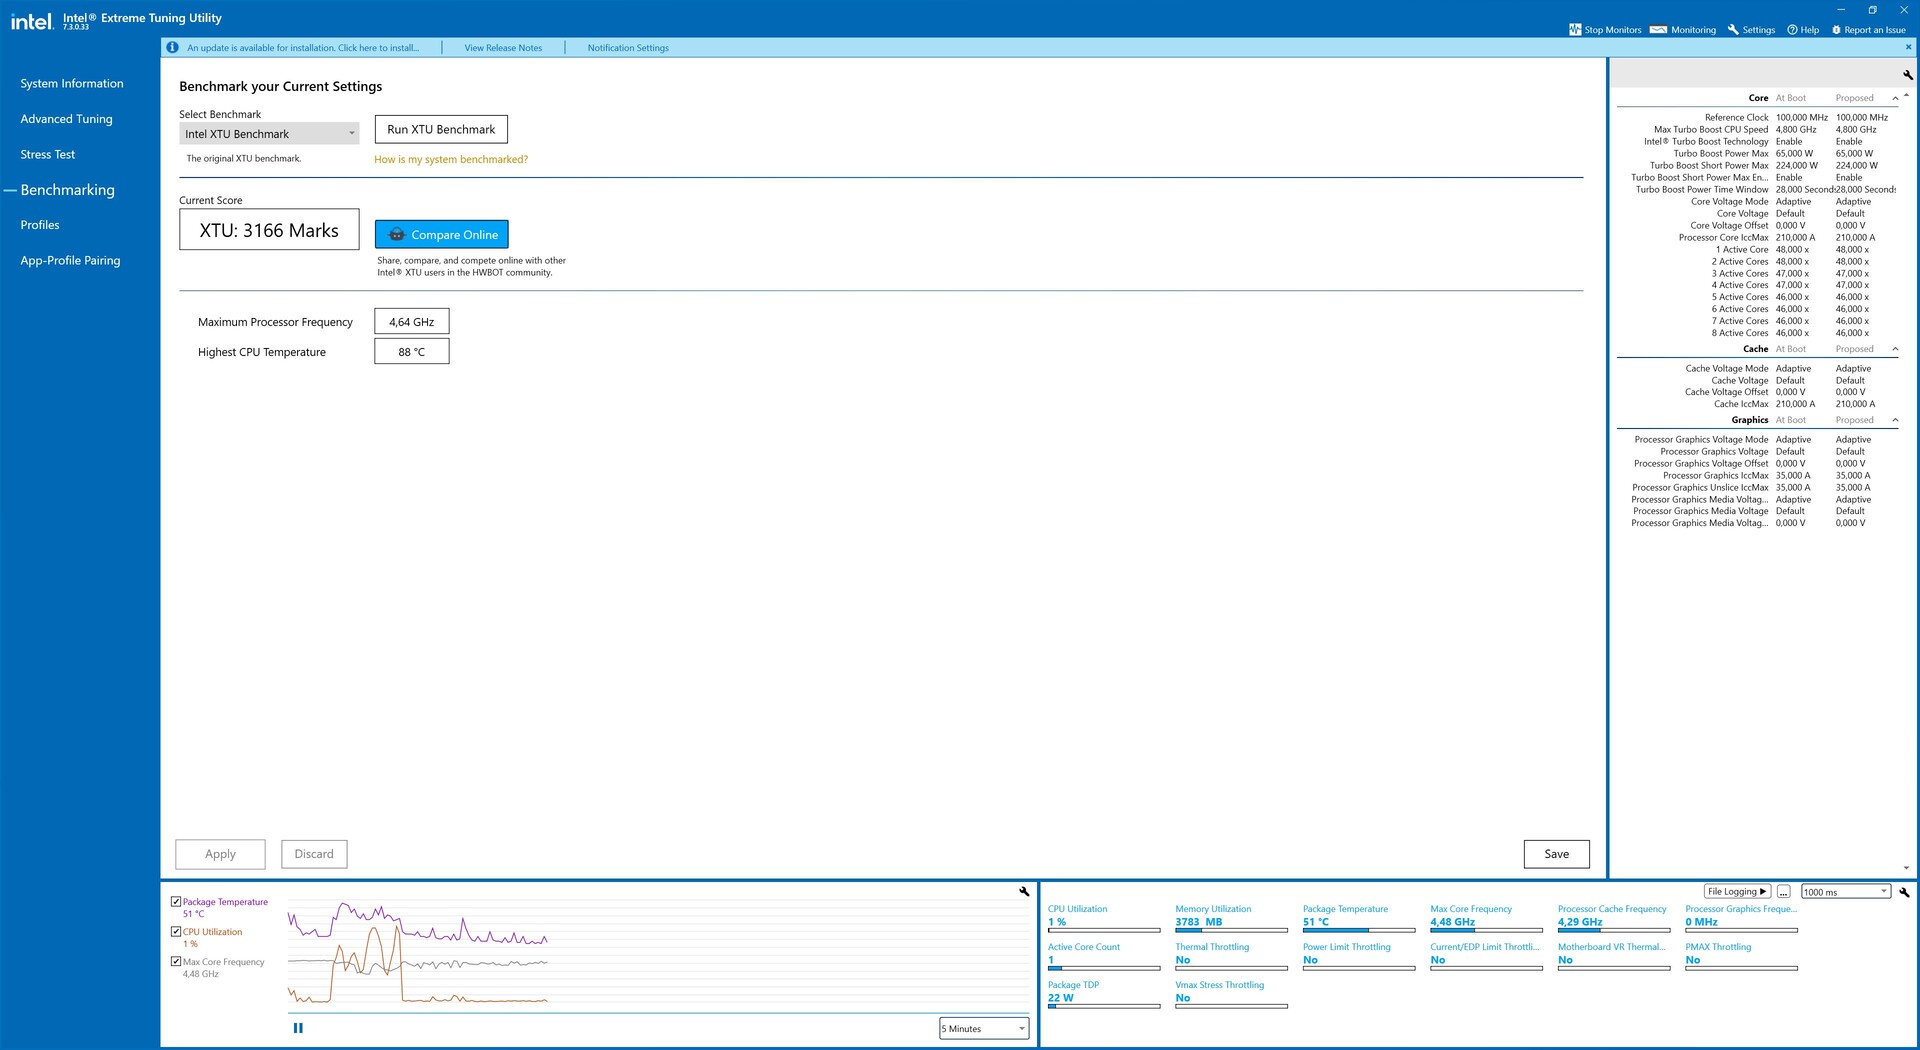
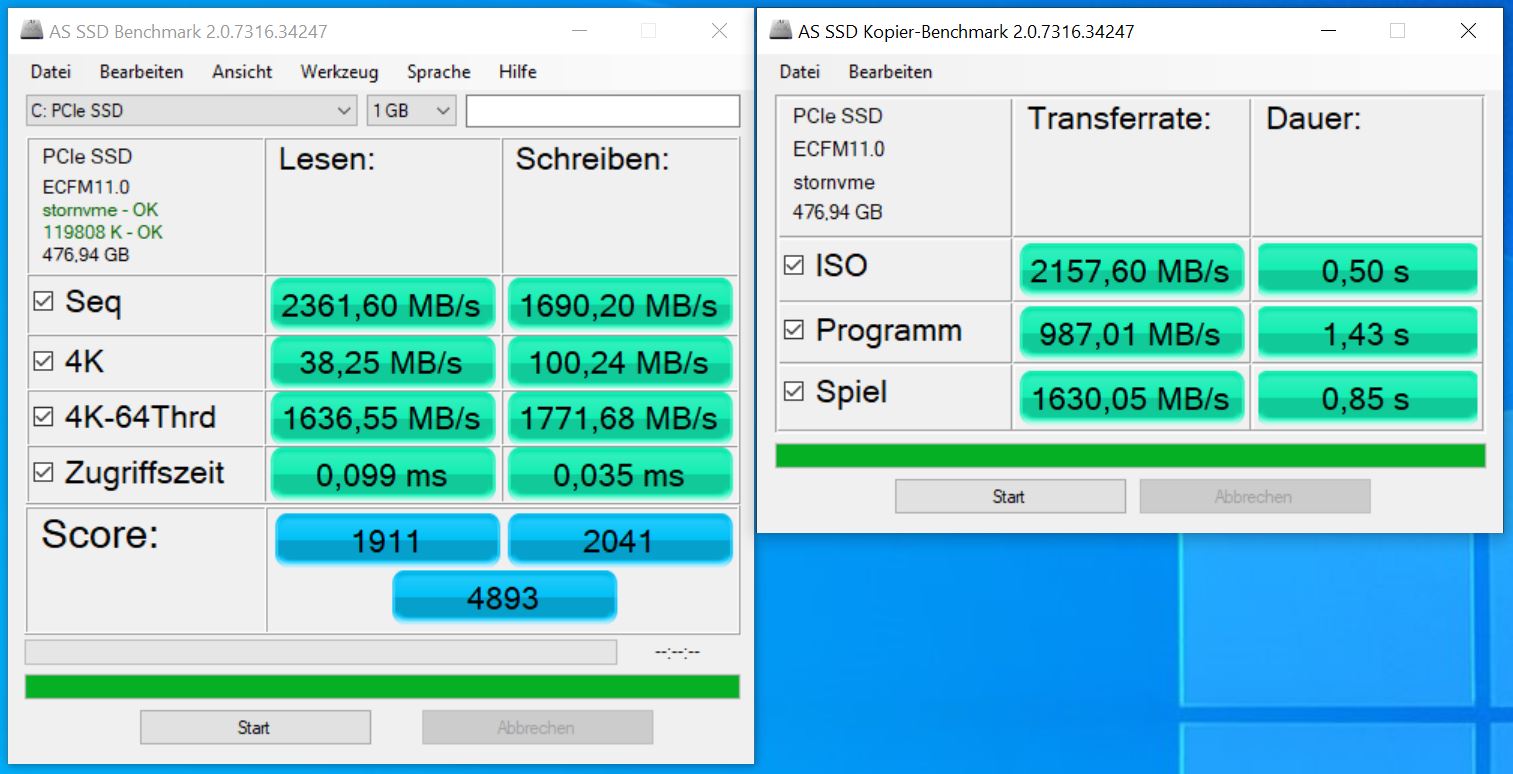
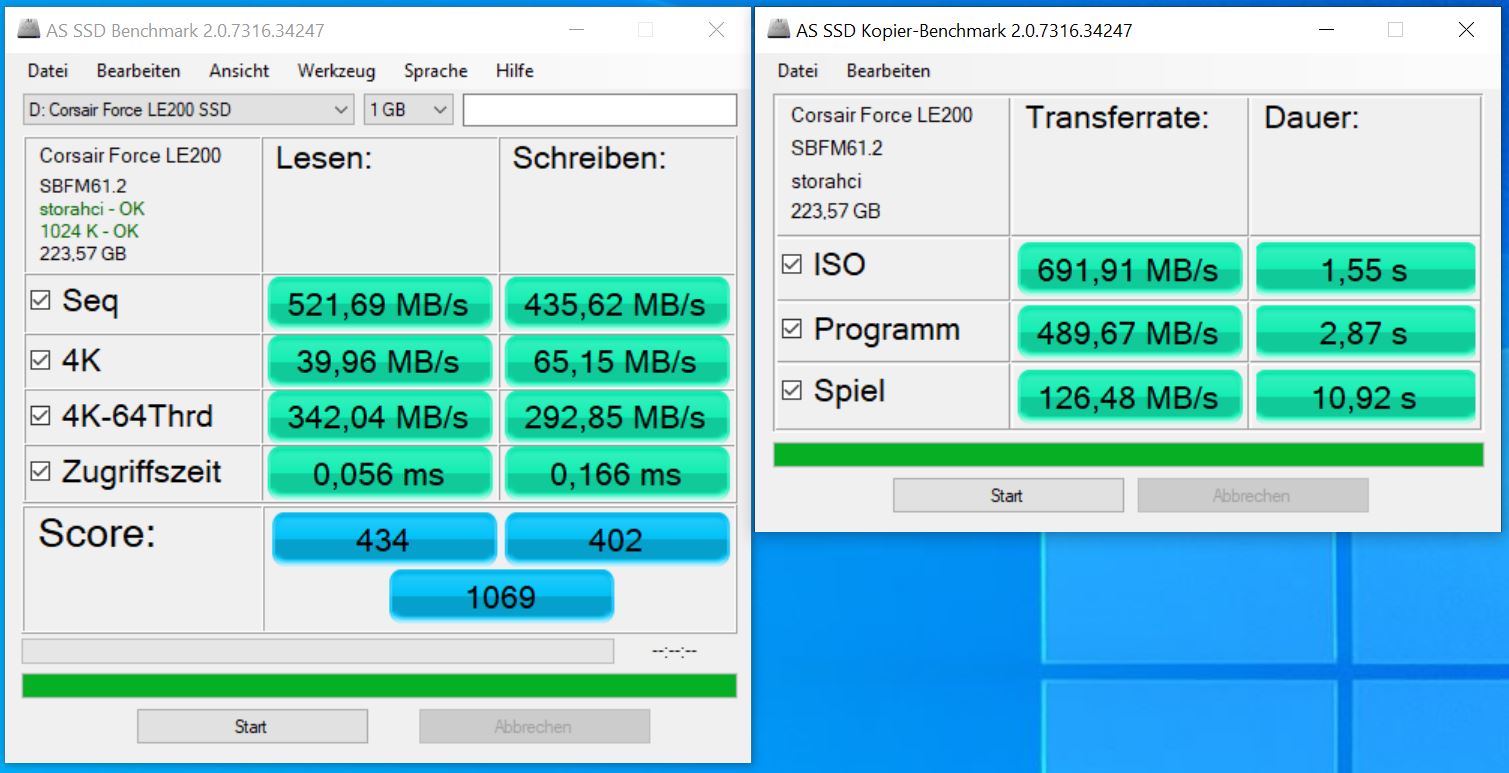
Prestaties van de toepassing
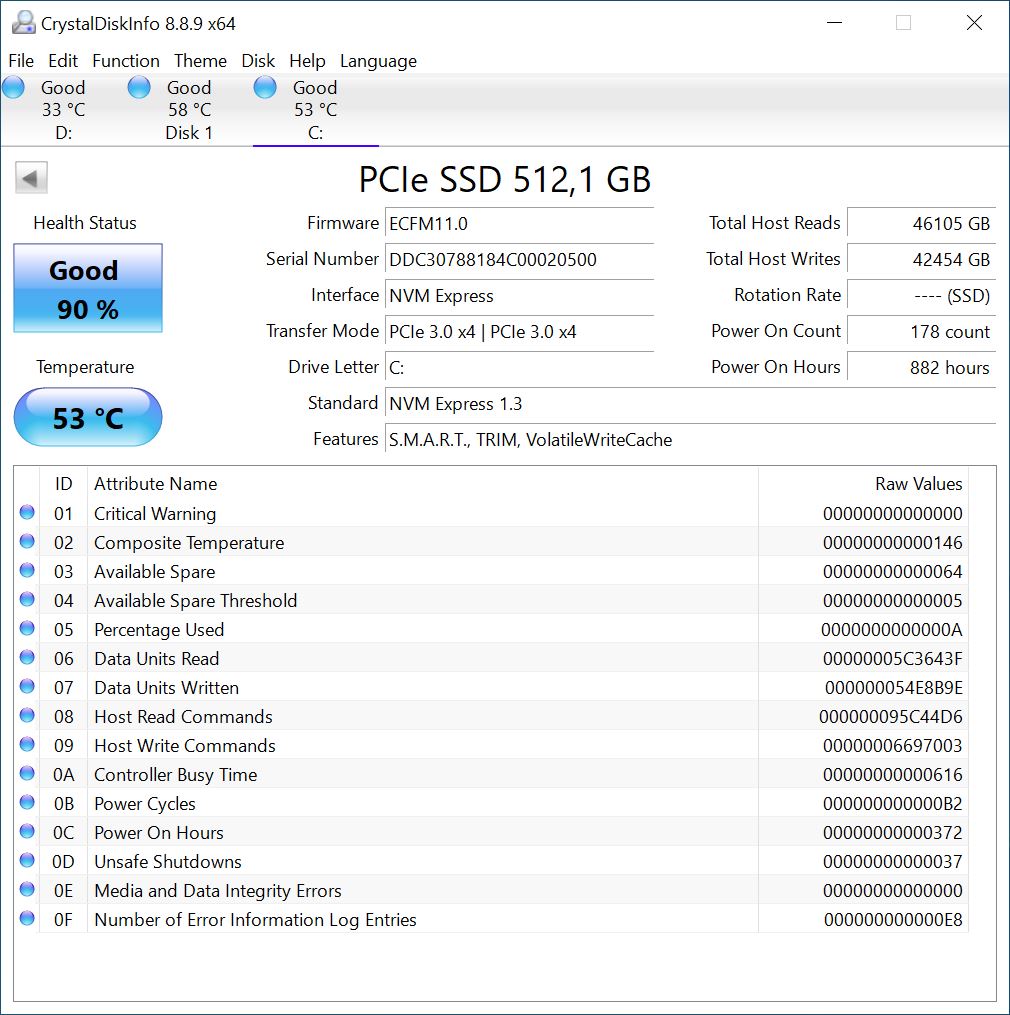
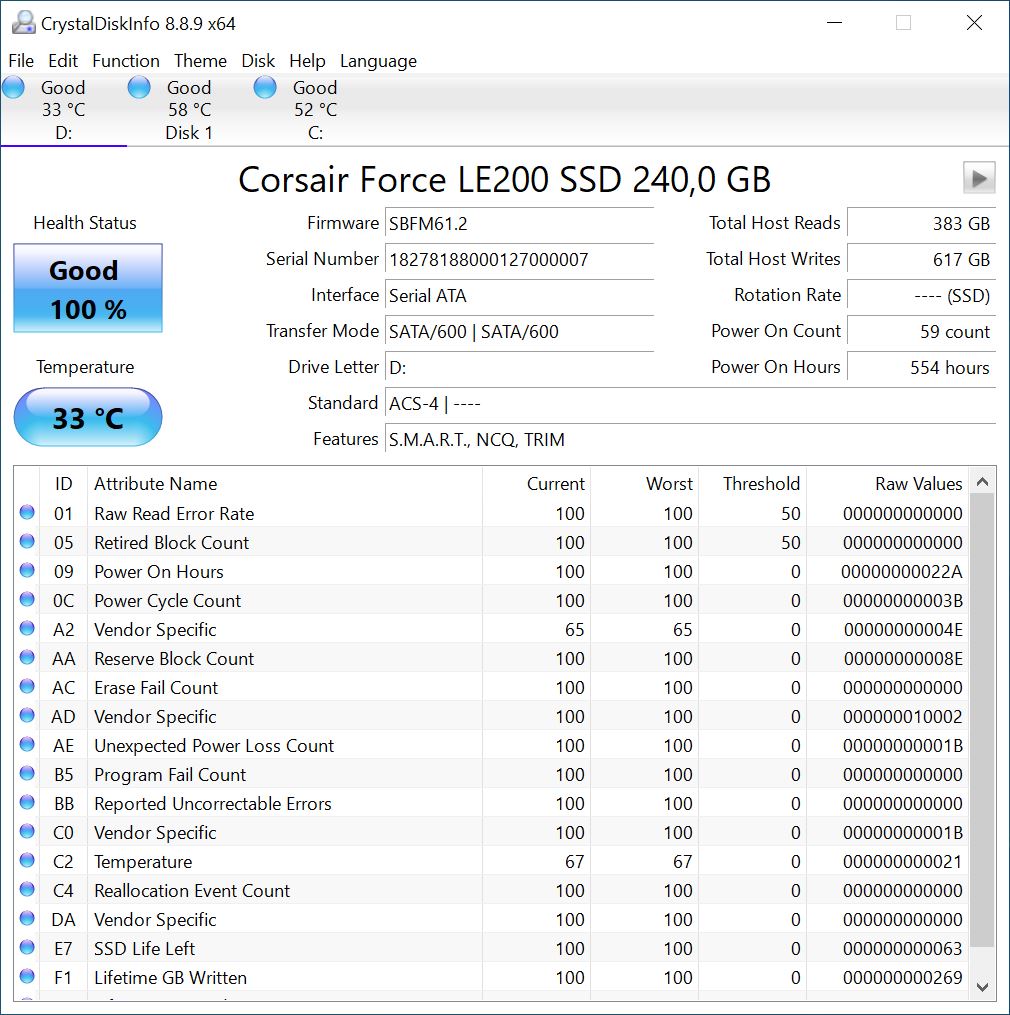
Onze test configuratie van de Magnus One behaalt relatief goede resultaten in onze applicatie benchmarks. Toch hadden we betere prestaties verwacht door de ingebouwde componenten. Vergeleken met onze andere test systemen, blijft de Magnus One vaak achter. We houden wel van het feit dat het geen conventionele harde schijf heeft. Gebruikers hebben echter de vrijheid om het type massa opslag apparaat te kiezen dat ze willen gebruiken. De bijgevoegde screenshots geven een ruw idee van de prestaties die verwacht kunnen worden. In totaal kunnen drie massaopslagapparaten in de behuizing worden ondergebracht
| SPECviewperf 12 | |
| 1900x1060 Solidworks (sw-03) | |
| AMD Ryzen 7 5800X, AMD Ryzen 7 5800X | |
| AMD Ryzen 5 5600X, AMD Ryzen 5 5600X | |
| Intel Core i9-10900K, Intel Core i9-10900K | |
| Intel Core i5-10600K, Intel Core i5-10600K | |
| Intel Core i3-10100, Intel Core i3-10100 | |
| Intel Core i5-10400F, Intel Core i5-10400F | |
| Intel Core i7-9700K, AMD Radeon RX Vega 64, Intel Core i7-9700K | |
| Zotac Magnus One (ECM73070C), Intel Core i7-10700 | |
| 1900x1060 Siemens NX (snx-02) | |
| Intel Core i3-10100, Intel Core i3-10100 | |
| AMD Ryzen 7 5800X, AMD Ryzen 7 5800X | |
| AMD Ryzen 5 5600X, AMD Ryzen 5 5600X | |
| Intel Core i9-10900K, Intel Core i9-10900K | |
| Intel Core i5-10400F, Intel Core i5-10400F | |
| Intel Core i5-10600K, Intel Core i5-10600K | |
| Intel Core i7-9700K, AMD Radeon RX Vega 64, Intel Core i7-9700K | |
| Zotac Magnus One (ECM73070C), Intel Core i7-10700 | |
| 1900x1060 Showcase (showcase-01) | |
| Intel Core i5-10600K, Intel Core i5-10600K | |
| Intel Core i5-10400F, Intel Core i5-10400F | |
| Intel Core i3-10100, Intel Core i3-10100 | |
| Intel Core i9-10900K, Intel Core i9-10900K | |
| AMD Ryzen 5 5600X, AMD Ryzen 5 5600X | |
| AMD Ryzen 7 5800X, AMD Ryzen 7 5800X | |
| Zotac Magnus One (ECM73070C), Intel Core i7-10700 | |
| Intel Core i7-9700K, AMD Radeon RX Vega 64, Intel Core i7-9700K | |
| 1900x1060 Medical (medical-01) | |
| Intel Core i5-10600K, Intel Core i5-10600K | |
| Intel Core i9-10900K, Intel Core i9-10900K | |
| Intel Core i5-10400F, Intel Core i5-10400F | |
| Intel Core i3-10100, Intel Core i3-10100 | |
| AMD Ryzen 7 5800X, AMD Ryzen 7 5800X | |
| AMD Ryzen 5 5600X, AMD Ryzen 5 5600X | |
| Intel Core i7-9700K, AMD Radeon RX Vega 64, Intel Core i7-9700K | |
| Zotac Magnus One (ECM73070C), Intel Core i7-10700 | |
| 1900x1060 Maya (maya-04) | |
| AMD Ryzen 7 5800X, AMD Ryzen 7 5800X | |
| AMD Ryzen 5 5600X, AMD Ryzen 5 5600X | |
| Zotac Magnus One (ECM73070C), Intel Core i7-10700 | |
| Intel Core i9-10900K, Intel Core i9-10900K | |
| Intel Core i5-10600K, Intel Core i5-10600K | |
| Intel Core i3-10100, Intel Core i3-10100 | |
| Intel Core i5-10400F, Intel Core i5-10400F | |
| Intel Core i7-9700K, AMD Radeon RX Vega 64, Intel Core i7-9700K | |
| 1900x1060 Energy (energy-01) | |
| Intel Core i5-10600K, Intel Core i5-10600K | |
| Intel Core i9-10900K, Intel Core i9-10900K | |
| Intel Core i5-10400F, Intel Core i5-10400F | |
| Intel Core i3-10100, Intel Core i3-10100 | |
| AMD Ryzen 7 5800X, AMD Ryzen 7 5800X | |
| AMD Ryzen 5 5600X, AMD Ryzen 5 5600X | |
| Zotac Magnus One (ECM73070C), Intel Core i7-10700 | |
| Intel Core i7-9700K, AMD Radeon RX Vega 64, Intel Core i7-9700K | |
| 1900x1060 Creo (creo-01) | |
| AMD Ryzen 7 5800X, AMD Ryzen 7 5800X | |
| AMD Ryzen 5 5600X, AMD Ryzen 5 5600X | |
| Intel Core i9-10900K, Intel Core i9-10900K | |
| Intel Core i5-10600K, Intel Core i5-10600K | |
| Intel Core i3-10100, Intel Core i3-10100 | |
| Intel Core i5-10400F, Intel Core i5-10400F | |
| Intel Core i7-9700K, AMD Radeon RX Vega 64, Intel Core i7-9700K | |
| Zotac Magnus One (ECM73070C), Intel Core i7-10700 | |
| 1900x1060 Catia (catia-04) | |
| AMD Ryzen 7 5800X, AMD Ryzen 7 5800X | |
| AMD Ryzen 5 5600X, AMD Ryzen 5 5600X | |
| Intel Core i9-10900K, Intel Core i9-10900K | |
| Intel Core i5-10600K, Intel Core i5-10600K | |
| Intel Core i3-10100, Intel Core i3-10100 | |
| Intel Core i5-10400F, Intel Core i5-10400F | |
| Intel Core i7-9700K, AMD Radeon RX Vega 64, Intel Core i7-9700K | |
| Zotac Magnus One (ECM73070C), Intel Core i7-10700 | |
| 1900x1060 3ds Max (3dsmax-05) | |
| AMD Ryzen 5 5600X, AMD Ryzen 5 5600X | |
| Intel Core i9-10900K, Intel Core i9-10900K | |
| Intel Core i5-10600K, Intel Core i5-10600K | |
| AMD Ryzen 7 5800X, AMD Ryzen 7 5800X | |
| Intel Core i5-10400F, Intel Core i5-10400F | |
| Intel Core i3-10100, Intel Core i3-10100 | |
| Zotac Magnus One (ECM73070C), Intel Core i7-10700 | |
| Intel Core i7-9700K, AMD Radeon RX Vega 64, Intel Core i7-9700K | |
| SPECviewperf 13 | |
| Solidworks (sw-04) | |
| AMD Ryzen 7 5800X, AMD Ryzen 7 5800X | |
| AMD Ryzen 5 5600X, AMD Ryzen 5 5600X | |
| Intel Core i9-10900K, Intel Core i9-10900K | |
| Intel Core i5-10600K, Intel Core i5-10600K | |
| Intel Core i3-10100, Intel Core i3-10100 | |
| Intel Core i5-10400F, Intel Core i5-10400F | |
| Zotac Magnus One (ECM73070C), Intel Core i7-10700 | |
| Intel Core i7-9700K, AMD Radeon RX Vega 64, Intel Core i7-9700K | |
| Siemens NX (snx-03) | |
| Intel Core i3-10100, Intel Core i3-10100 | |
| AMD Ryzen 7 5800X, AMD Ryzen 7 5800X | |
| AMD Ryzen 5 5600X, AMD Ryzen 5 5600X | |
| Intel Core i9-10900K, Intel Core i9-10900K | |
| Intel Core i5-10600K, Intel Core i5-10600K | |
| Intel Core i5-10400F, Intel Core i5-10400F | |
| Intel Core i7-9700K, AMD Radeon RX Vega 64, Intel Core i7-9700K | |
| Zotac Magnus One (ECM73070C), Intel Core i7-10700 | |
| Showcase (showcase-02) | |
| Intel Core i5-10600K, Intel Core i5-10600K | |
| Intel Core i9-10900K, Intel Core i9-10900K | |
| Intel Core i5-10400F, Intel Core i5-10400F | |
| Intel Core i3-10100, Intel Core i3-10100 | |
| AMD Ryzen 7 5800X, AMD Ryzen 7 5800X | |
| AMD Ryzen 5 5600X, AMD Ryzen 5 5600X | |
| Zotac Magnus One (ECM73070C), Intel Core i7-10700 | |
| Intel Core i7-9700K, AMD Radeon RX Vega 64, Intel Core i7-9700K | |
| Medical (medical-02) | |
| AMD Ryzen 7 5800X, AMD Ryzen 7 5800X | |
| AMD Ryzen 5 5600X, AMD Ryzen 5 5600X | |
| Intel Core i3-10100, Intel Core i3-10100 | |
| Intel Core i5-10600K, Intel Core i5-10600K | |
| Intel Core i9-10900K, Intel Core i9-10900K | |
| Intel Core i5-10400F, Intel Core i5-10400F | |
| Zotac Magnus One (ECM73070C), Intel Core i7-10700 | |
| Intel Core i7-9700K, AMD Radeon RX Vega 64, Intel Core i7-9700K | |
| Maya (maya-05) | |
| AMD Ryzen 7 5800X, AMD Ryzen 7 5800X | |
| AMD Ryzen 5 5600X, AMD Ryzen 5 5600X | |
| Intel Core i9-10900K, Intel Core i9-10900K | |
| Intel Core i3-10100, Intel Core i3-10100 | |
| Intel Core i5-10600K, Intel Core i5-10600K | |
| Zotac Magnus One (ECM73070C), Intel Core i7-10700 | |
| Intel Core i5-10400F, Intel Core i5-10400F | |
| Intel Core i7-9700K, AMD Radeon RX Vega 64, Intel Core i7-9700K | |
| Energy (energy-02) | |
| Intel Core i5-10600K, Intel Core i5-10600K | |
| Intel Core i9-10900K, Intel Core i9-10900K | |
| Intel Core i5-10400F, Intel Core i5-10400F | |
| AMD Ryzen 7 5800X, AMD Ryzen 7 5800X | |
| AMD Ryzen 5 5600X, AMD Ryzen 5 5600X | |
| Intel Core i3-10100, Intel Core i3-10100 | |
| Zotac Magnus One (ECM73070C), Intel Core i7-10700 | |
| Intel Core i7-9700K, AMD Radeon RX Vega 64, Intel Core i7-9700K | |
| Creo (creo-02) | |
| AMD Ryzen 7 5800X, AMD Ryzen 7 5800X | |
| AMD Ryzen 5 5600X, AMD Ryzen 5 5600X | |
| Intel Core i3-10100, Intel Core i3-10100 | |
| Intel Core i9-10900K, Intel Core i9-10900K | |
| Intel Core i5-10600K, Intel Core i5-10600K | |
| Intel Core i5-10400F, Intel Core i5-10400F | |
| Zotac Magnus One (ECM73070C), Intel Core i7-10700 | |
| Intel Core i7-9700K, AMD Radeon RX Vega 64, Intel Core i7-9700K | |
| Catia (catia-05) | |
| AMD Ryzen 5 5600X, AMD Ryzen 5 5600X | |
| AMD Ryzen 7 5800X, AMD Ryzen 7 5800X | |
| Intel Core i9-10900K, Intel Core i9-10900K | |
| Intel Core i5-10600K, Intel Core i5-10600K | |
| Intel Core i3-10100, Intel Core i3-10100 | |
| Intel Core i5-10400F, Intel Core i5-10400F | |
| Intel Core i7-9700K, AMD Radeon RX Vega 64, Intel Core i7-9700K | |
| Zotac Magnus One (ECM73070C), Intel Core i7-10700 | |
| 3ds Max (3dsmax-06) | |
| AMD Ryzen 5 5600X, AMD Ryzen 5 5600X | |
| AMD Ryzen 7 5800X, AMD Ryzen 7 5800X | |
| Intel Core i5-10600K, Intel Core i5-10600K | |
| Intel Core i9-10900K, Intel Core i9-10900K | |
| Intel Core i5-10400F, Intel Core i5-10400F | |
| Intel Core i3-10100, Intel Core i3-10100 | |
| Zotac Magnus One (ECM73070C), Intel Core i7-10700 | |
| Intel Core i7-9700K, AMD Radeon RX Vega 64, Intel Core i7-9700K | |
3D en spelprestaties
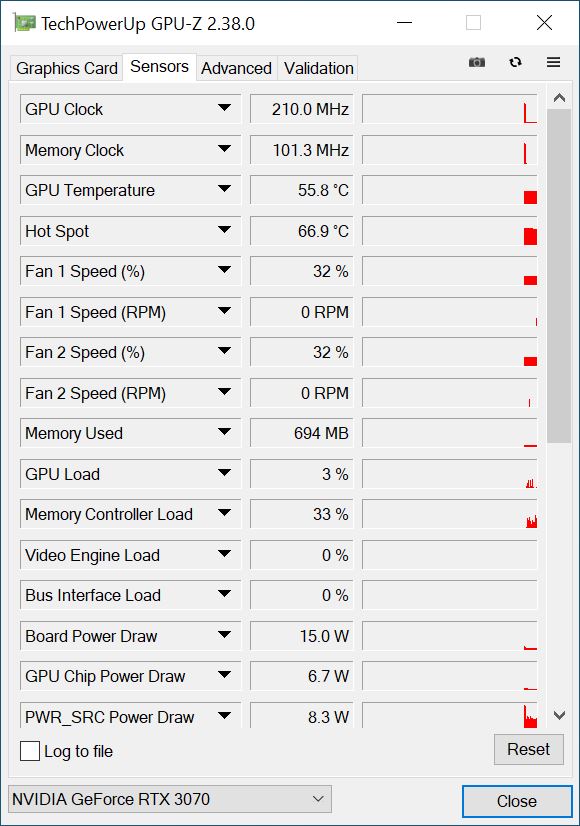
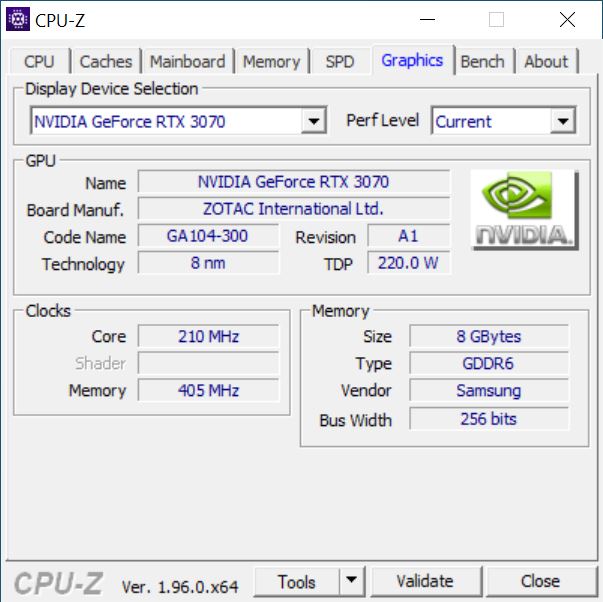
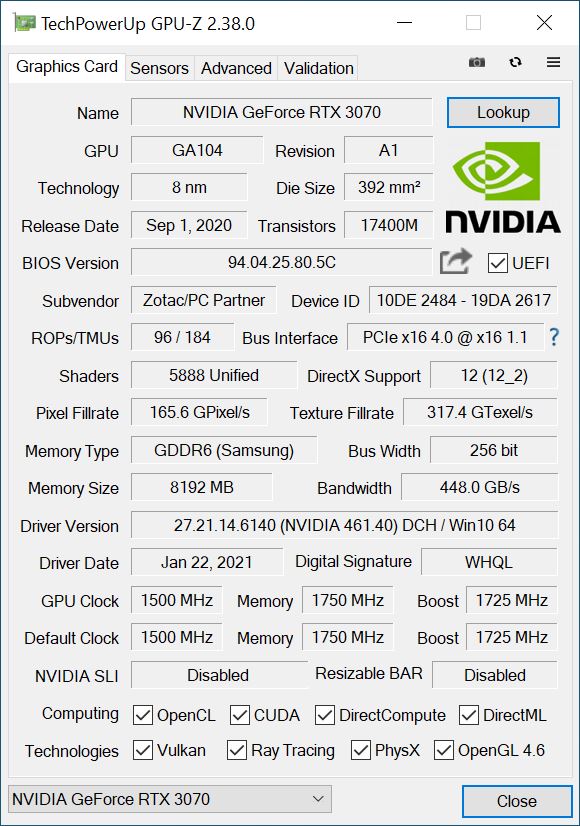
EenNvidia GeForce RTX 3070die rechtstreeks uit Zotac's eigen portfolio komt, is verantwoordelijk voor de goede 3D prestaties. Het systeem leverde een solide prestatie in de test en scoorde over het algemeen iets beter dan in de vorige tests die alleen de CPU onderzochten. In termen van pure prestaties, zit de Magnus One met de GeForce RTX 3070 vlak achter ons test systeem gebaseerd op de iets snellere AMD Ryzen 9 5900X en de MSI GeForce RTX 3070 Ventus 3X. De iets mindere prestaties kunnen echter niet als merkbaar worden omschreven. Desalniettemin heeft de RTX 3070 het gemakkelijk als het gaat om de vorige generatie uitgerust met de RTX 2070 Super. Een verbetering van maximaal 30% in prestaties is mogelijk, en het is zeker waarneembaar tijdens het gamen ook. De uitrusting van de Magnus One maakt het zeker mogelijk om van veel games te genieten in 2160p, hoewel 1440p gaming het hoofddoel zou moeten zijn.
Voor meer vergelijkingen en benchmarks met betrekking tot de prestaties van de RTX 3070, kunt u terecht op onze GPU vergelijkingstabel.
| Borderlands 3 - 1920x1080 Badass Overall Quality (DX11) | |
| Zotac Magnus One (ECM73070C) | |
| MSI GeForce RTX 3070 Ventus 3X | |
| Gemiddeld NVIDIA GeForce RTX 2070 Super (Desktop) (74.3 - 86, n=5) | |
| Nvidia GeForce RTX 2070 Super | |
| KFA2 GeForce RTX 2070 Super Work The Frames | |
| Gemiddeld NVIDIA GeForce RTX 2070 (Desktop) (70.9 - 74.4, n=2) | |
| Gemiddeld NVIDIA GeForce RTX 2060 Super (Desktop) (68.6 - 74.1, n=4) | |
| lage | gem. | hoge | ultra | QHD | 4K | |
|---|---|---|---|---|---|---|
| GTA V (2015) | 180 | 173 | 161 | 95.6 | 91.6 | 110 |
| The Witcher 3 (2015) | 367 | 316 | 235 | 121 | 84 | |
| Dota 2 Reborn (2015) | 164.2 | 143.8 | 138.2 | 129.7 | 127.4 | |
| Final Fantasy XV Benchmark (2018) | 167 | 146 | 112 | 89.2 | 54.8 | |
| X-Plane 11.11 (2018) | 124 | 110 | 91 | 78.8 | ||
| Far Cry 5 (2018) | 150 | 133 | 126 | 117 | 112 | 70 |
| Strange Brigade (2018) | 430 | 311 | 253 | 222 | 165 | 97.1 |
| Far Cry New Dawn (2019) | 126 | 110 | 106 | 95 | 92 | 70 |
| Metro Exodus (2019) | 166 | 136 | 116 | 93.1 | 76.1 | 49 |
| Borderlands 3 (2019) | 149 | 132 | 118 | 98.8 | 75.5 | 42.7 |
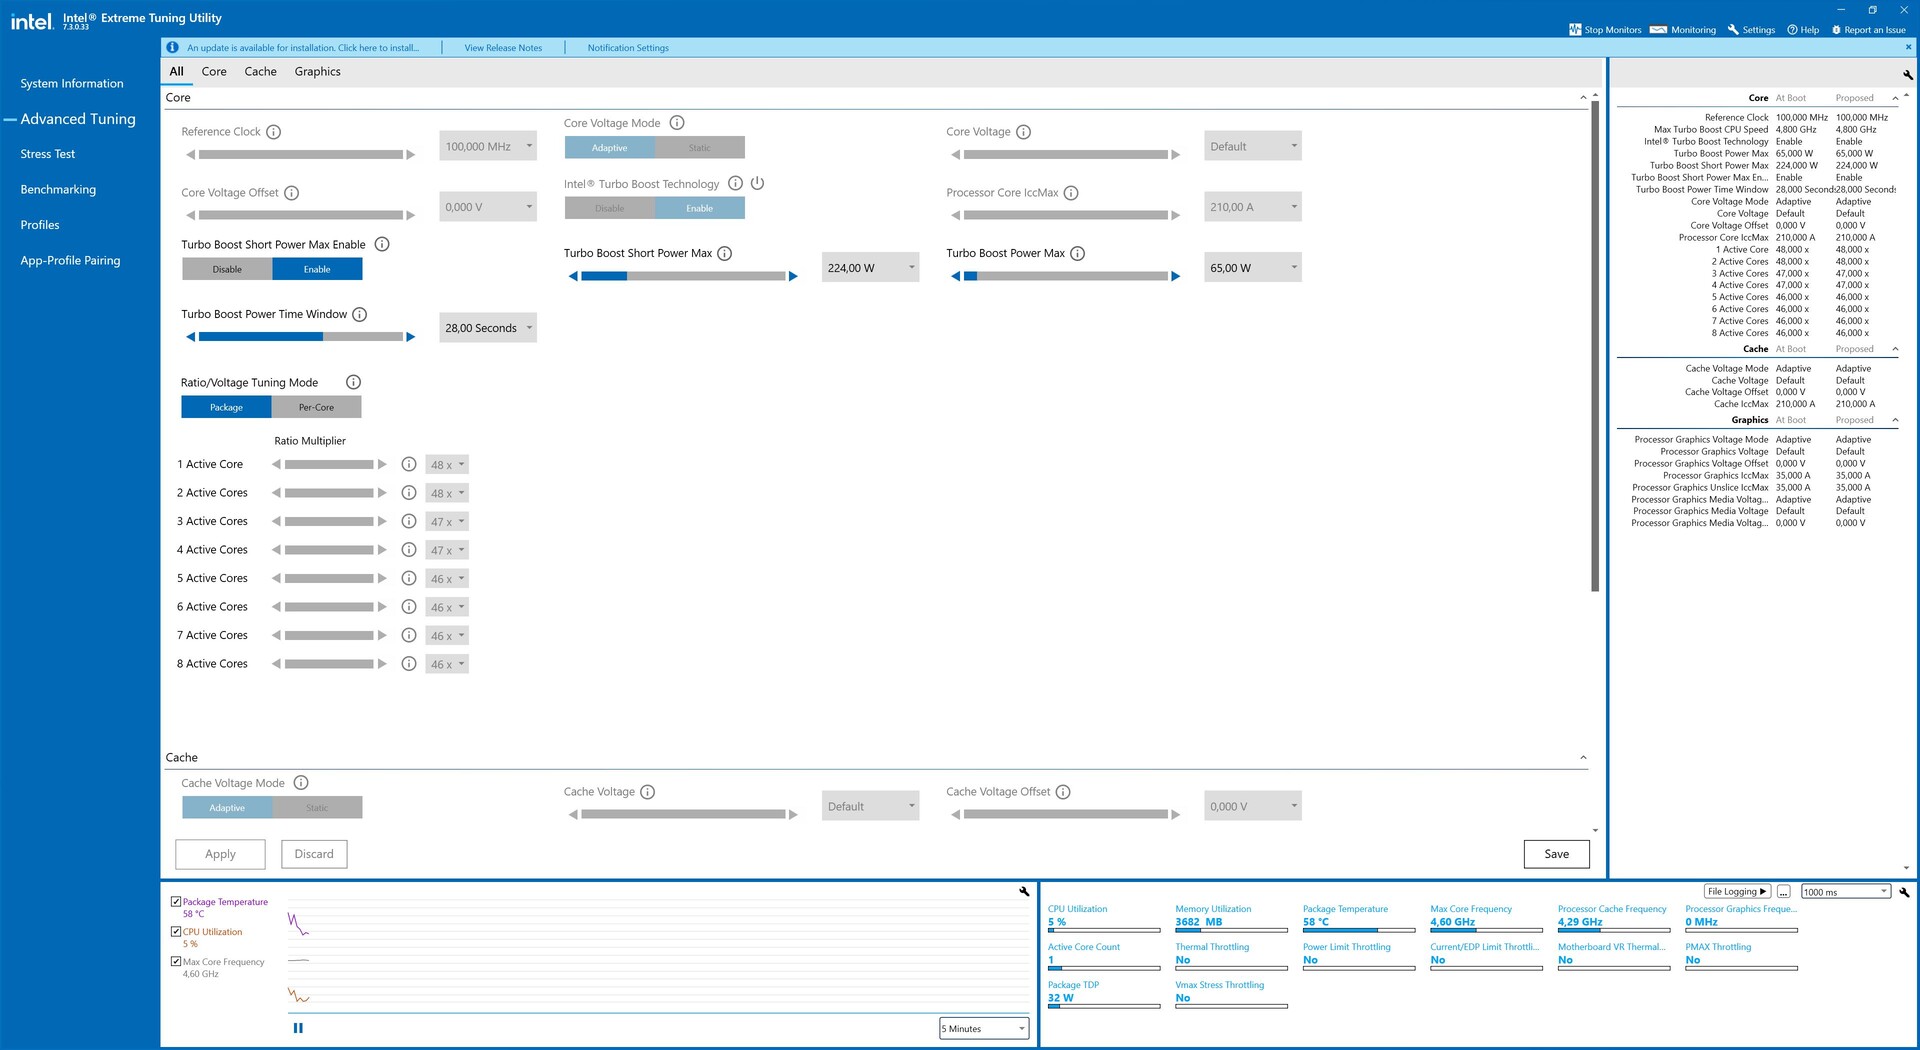
Emissies
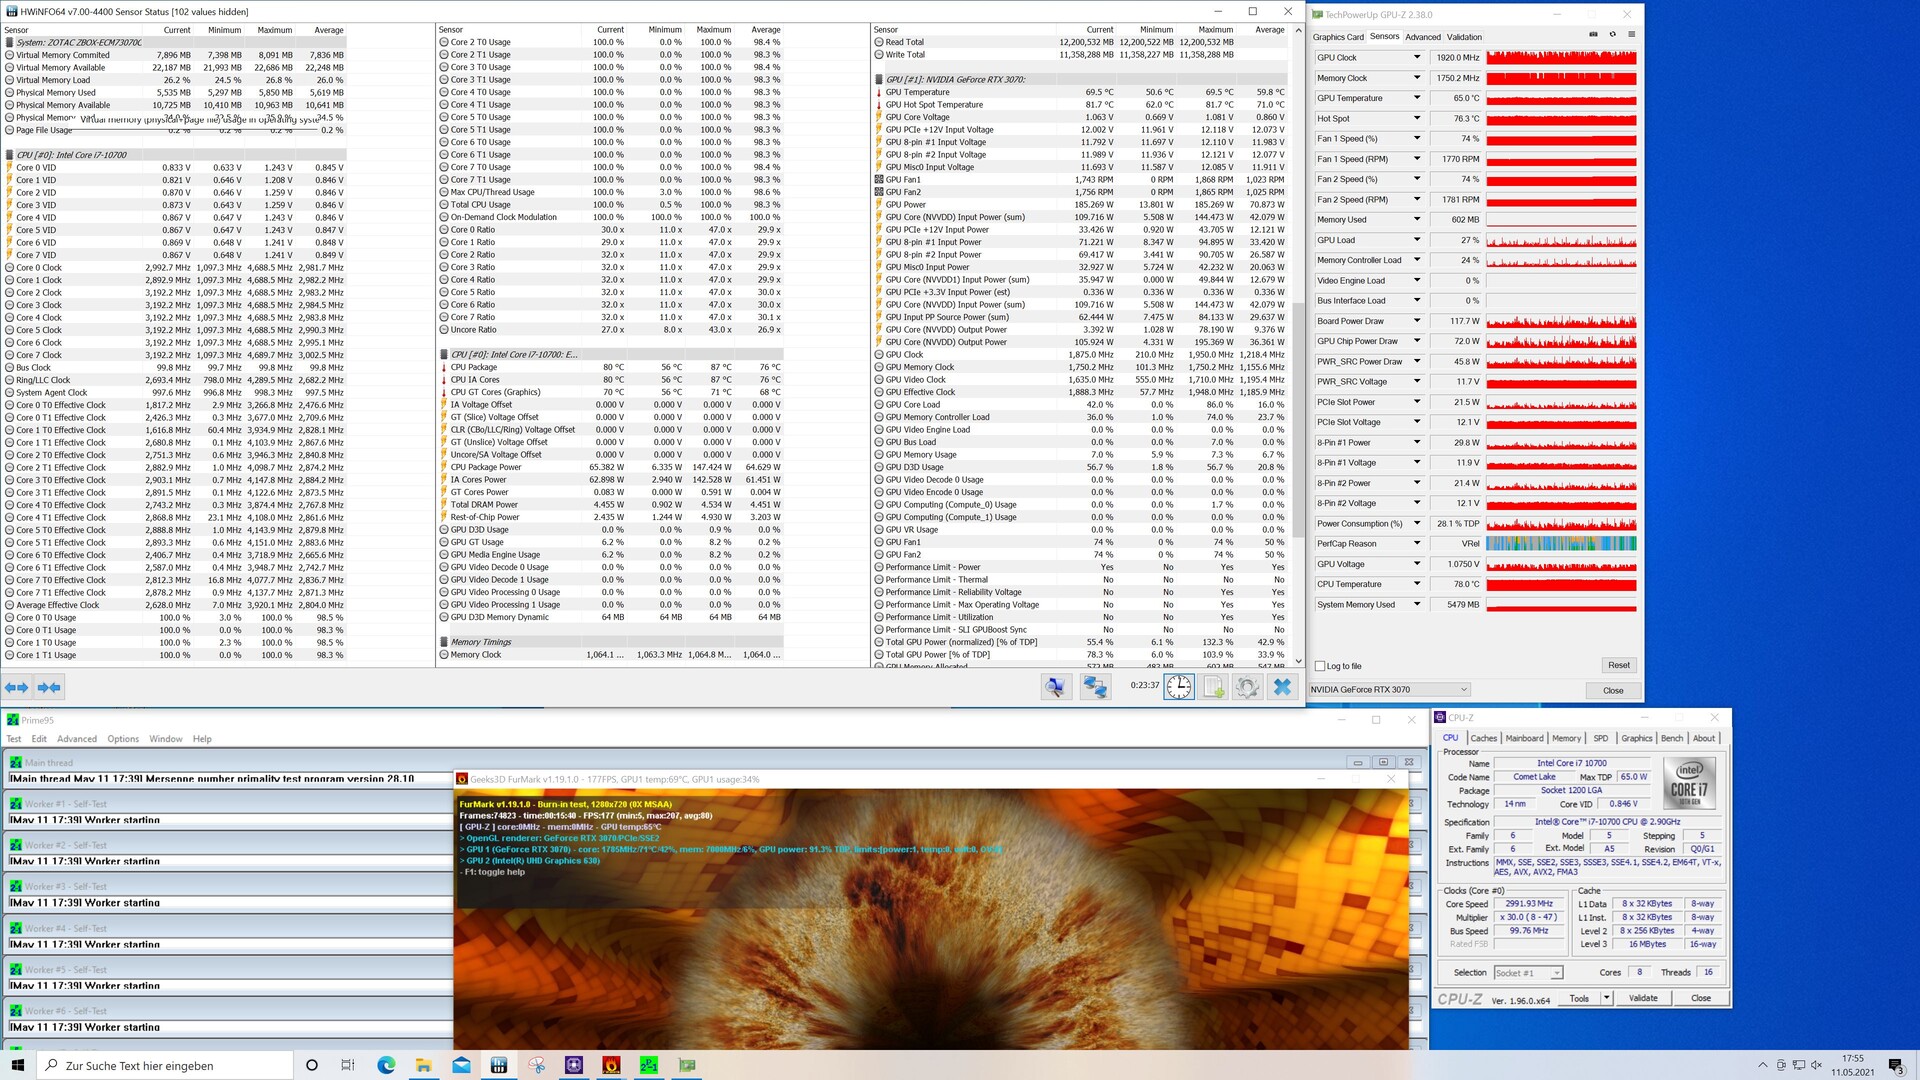
De Zotac Magnus One in de stresstest
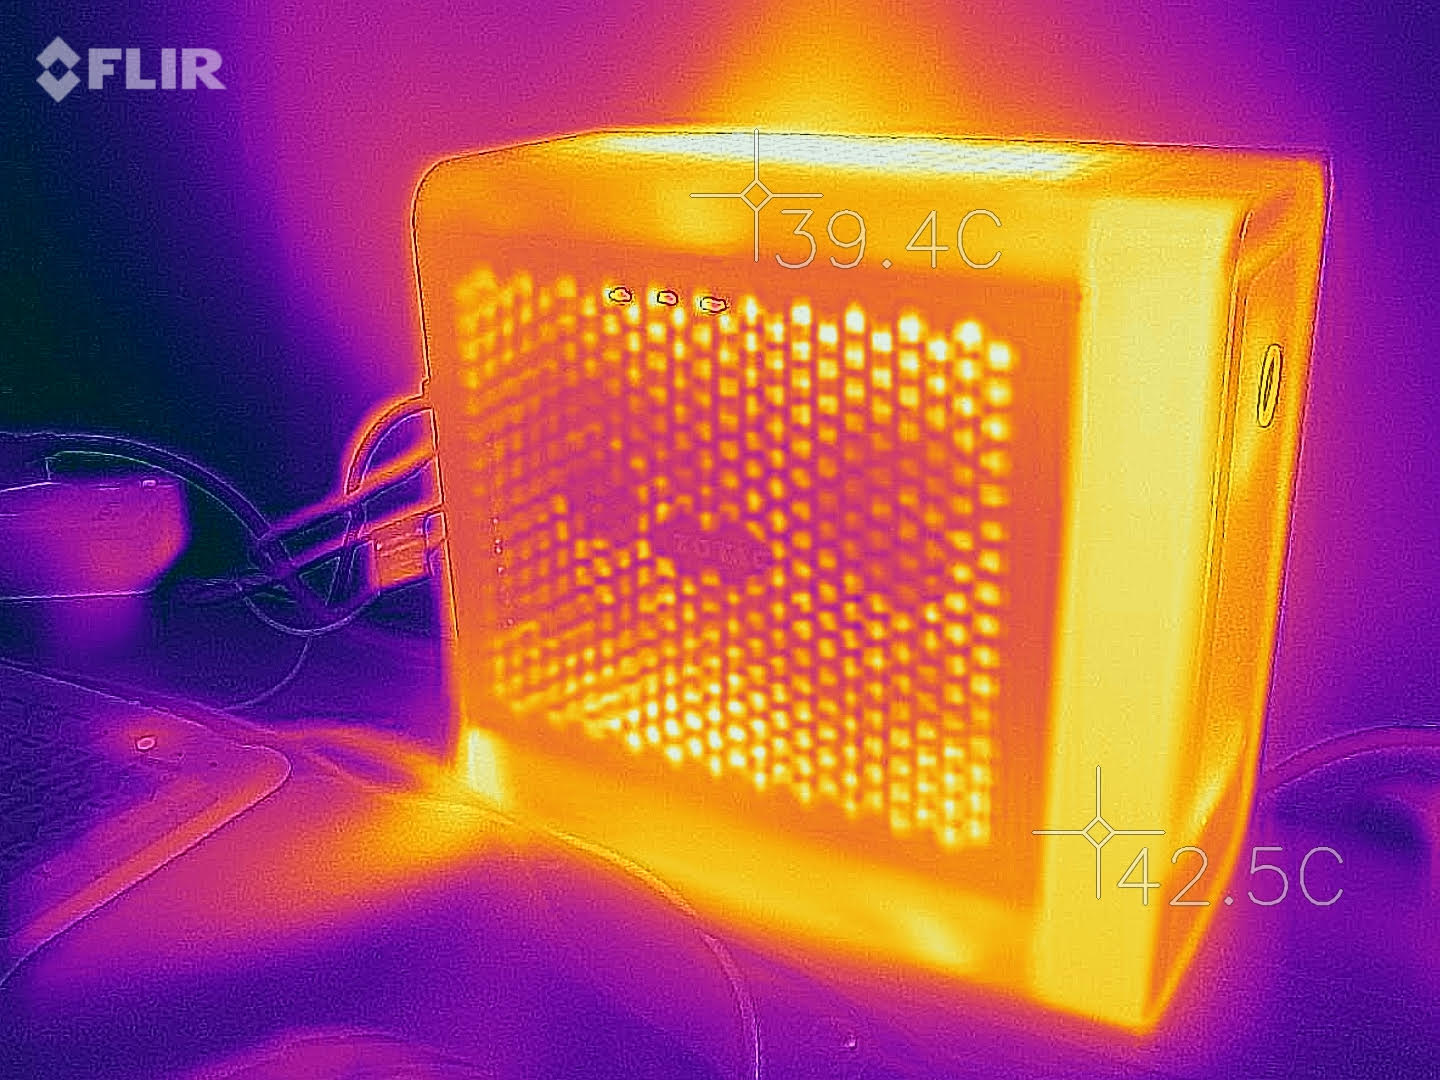
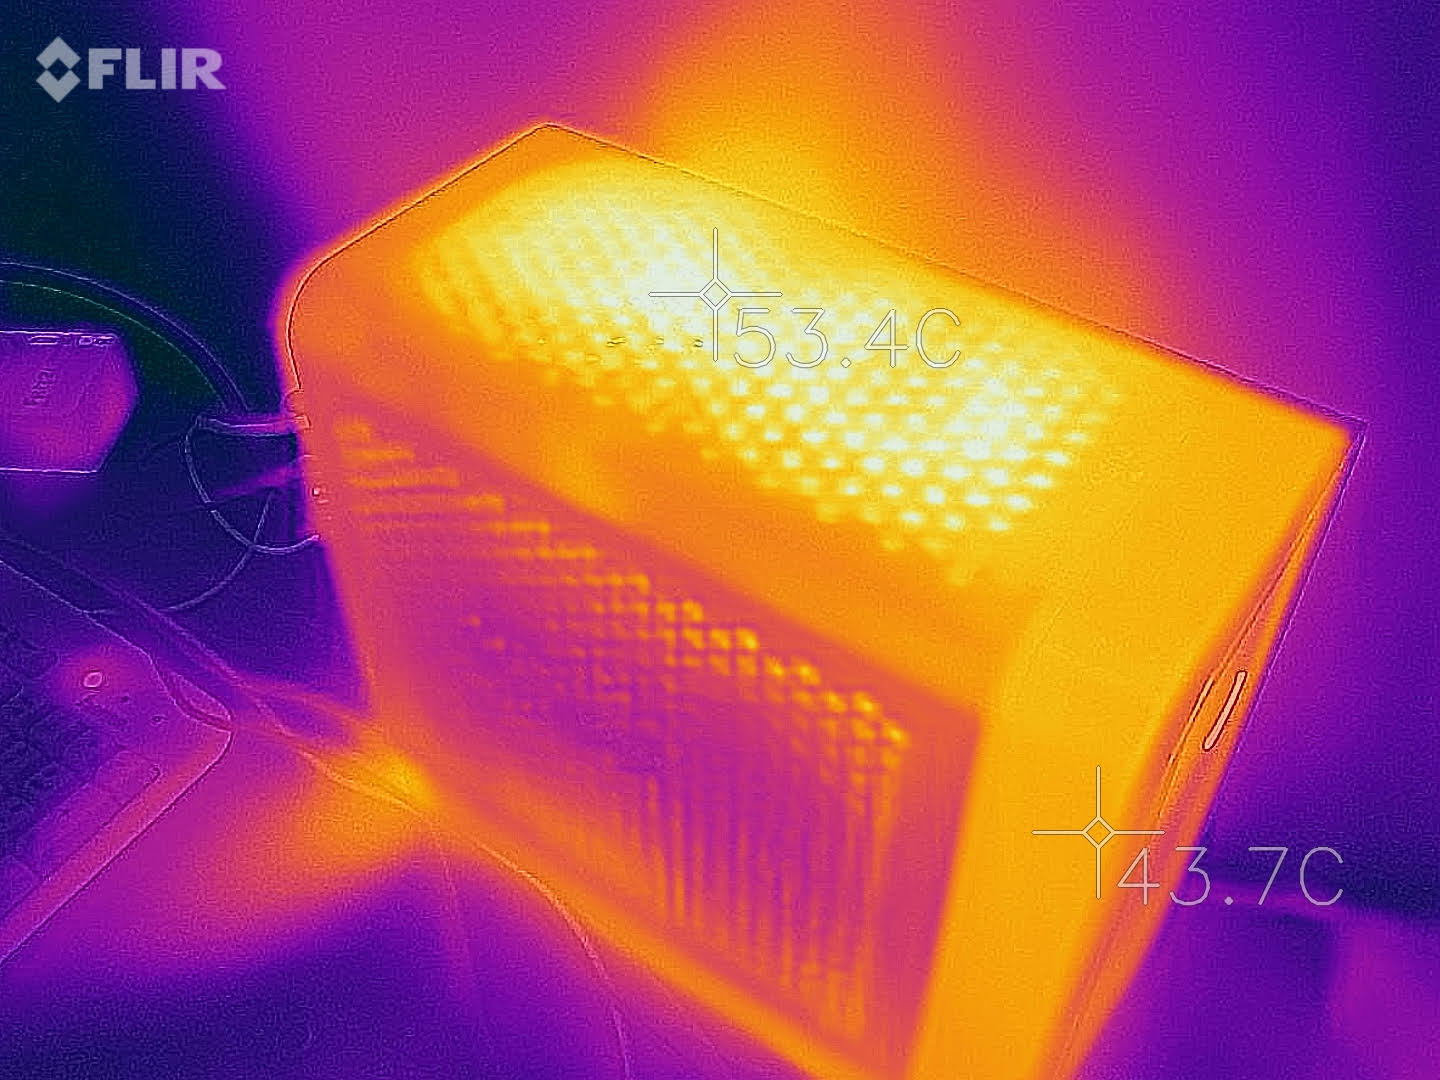
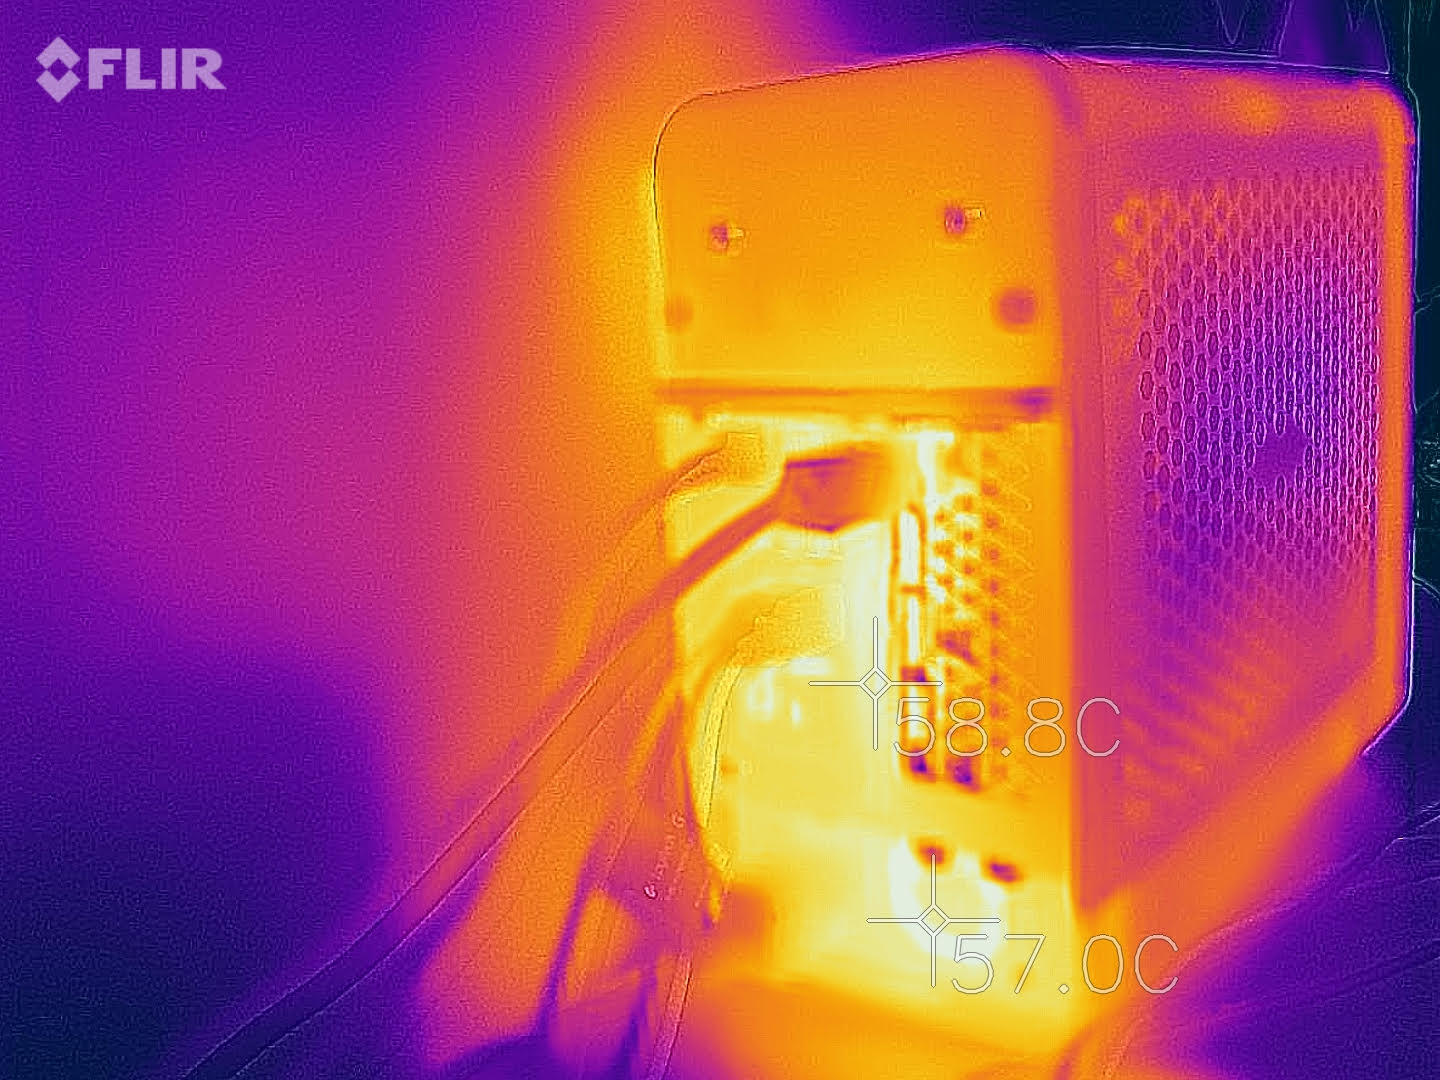
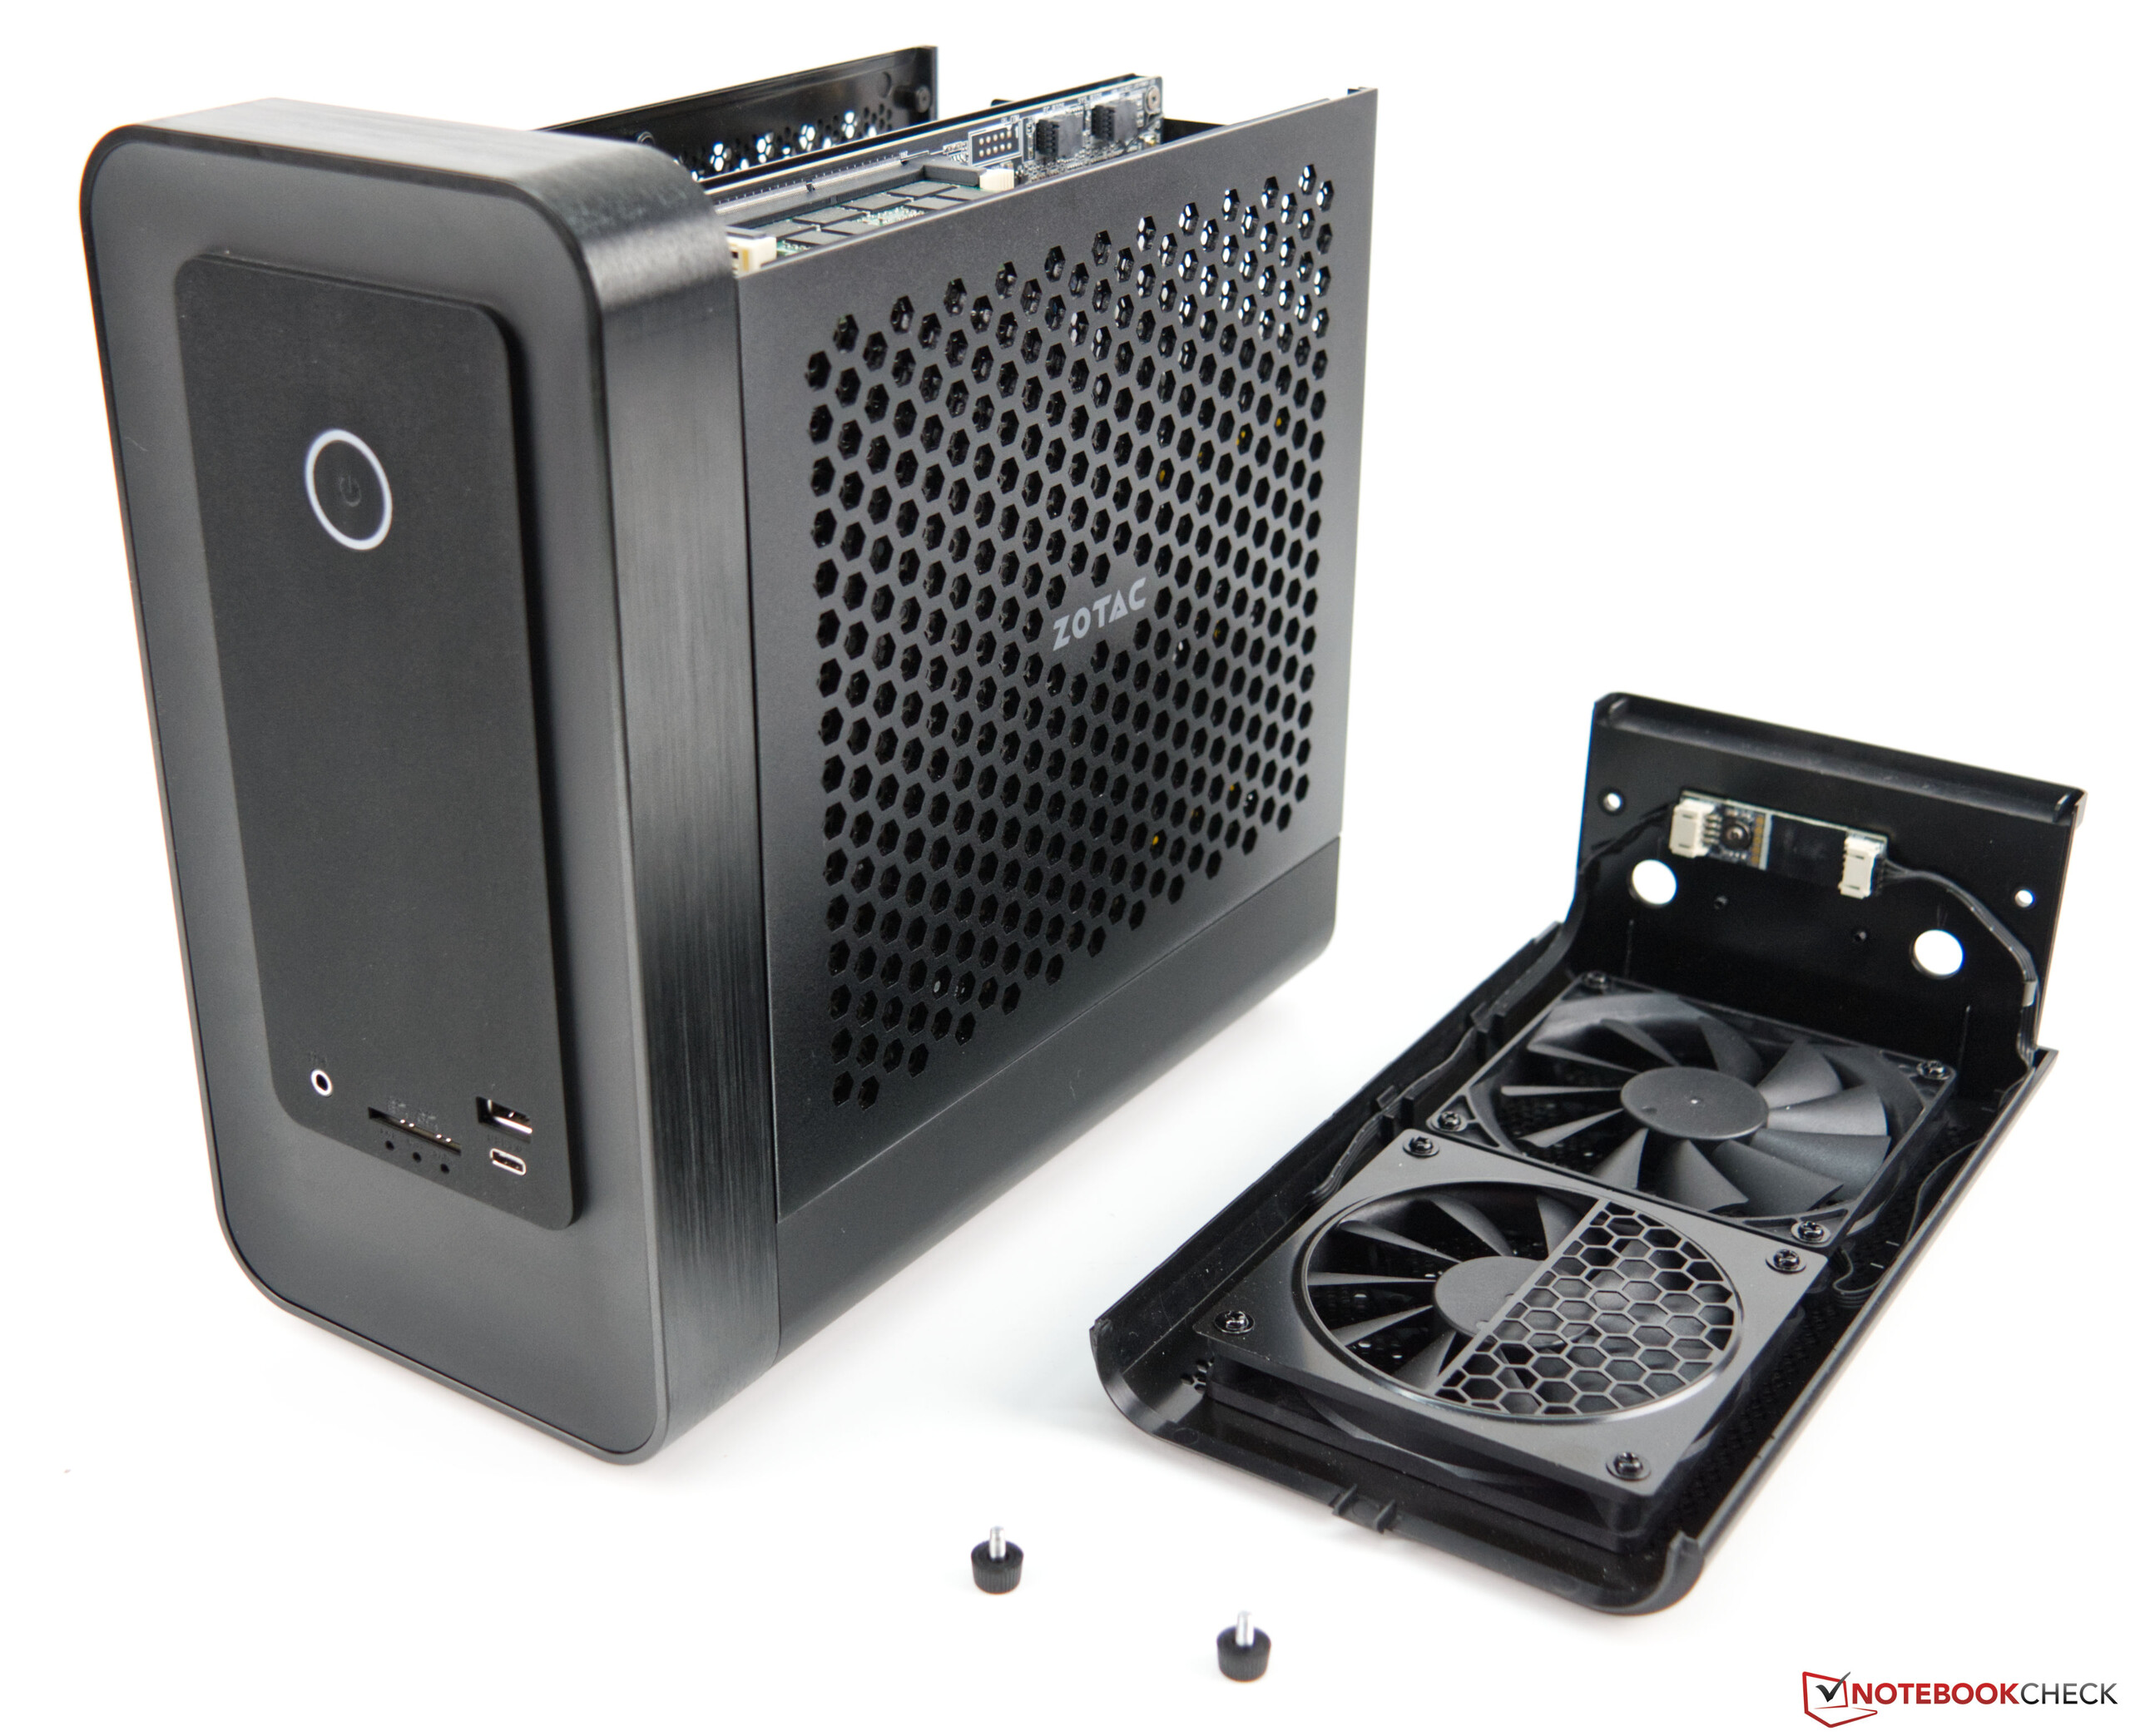
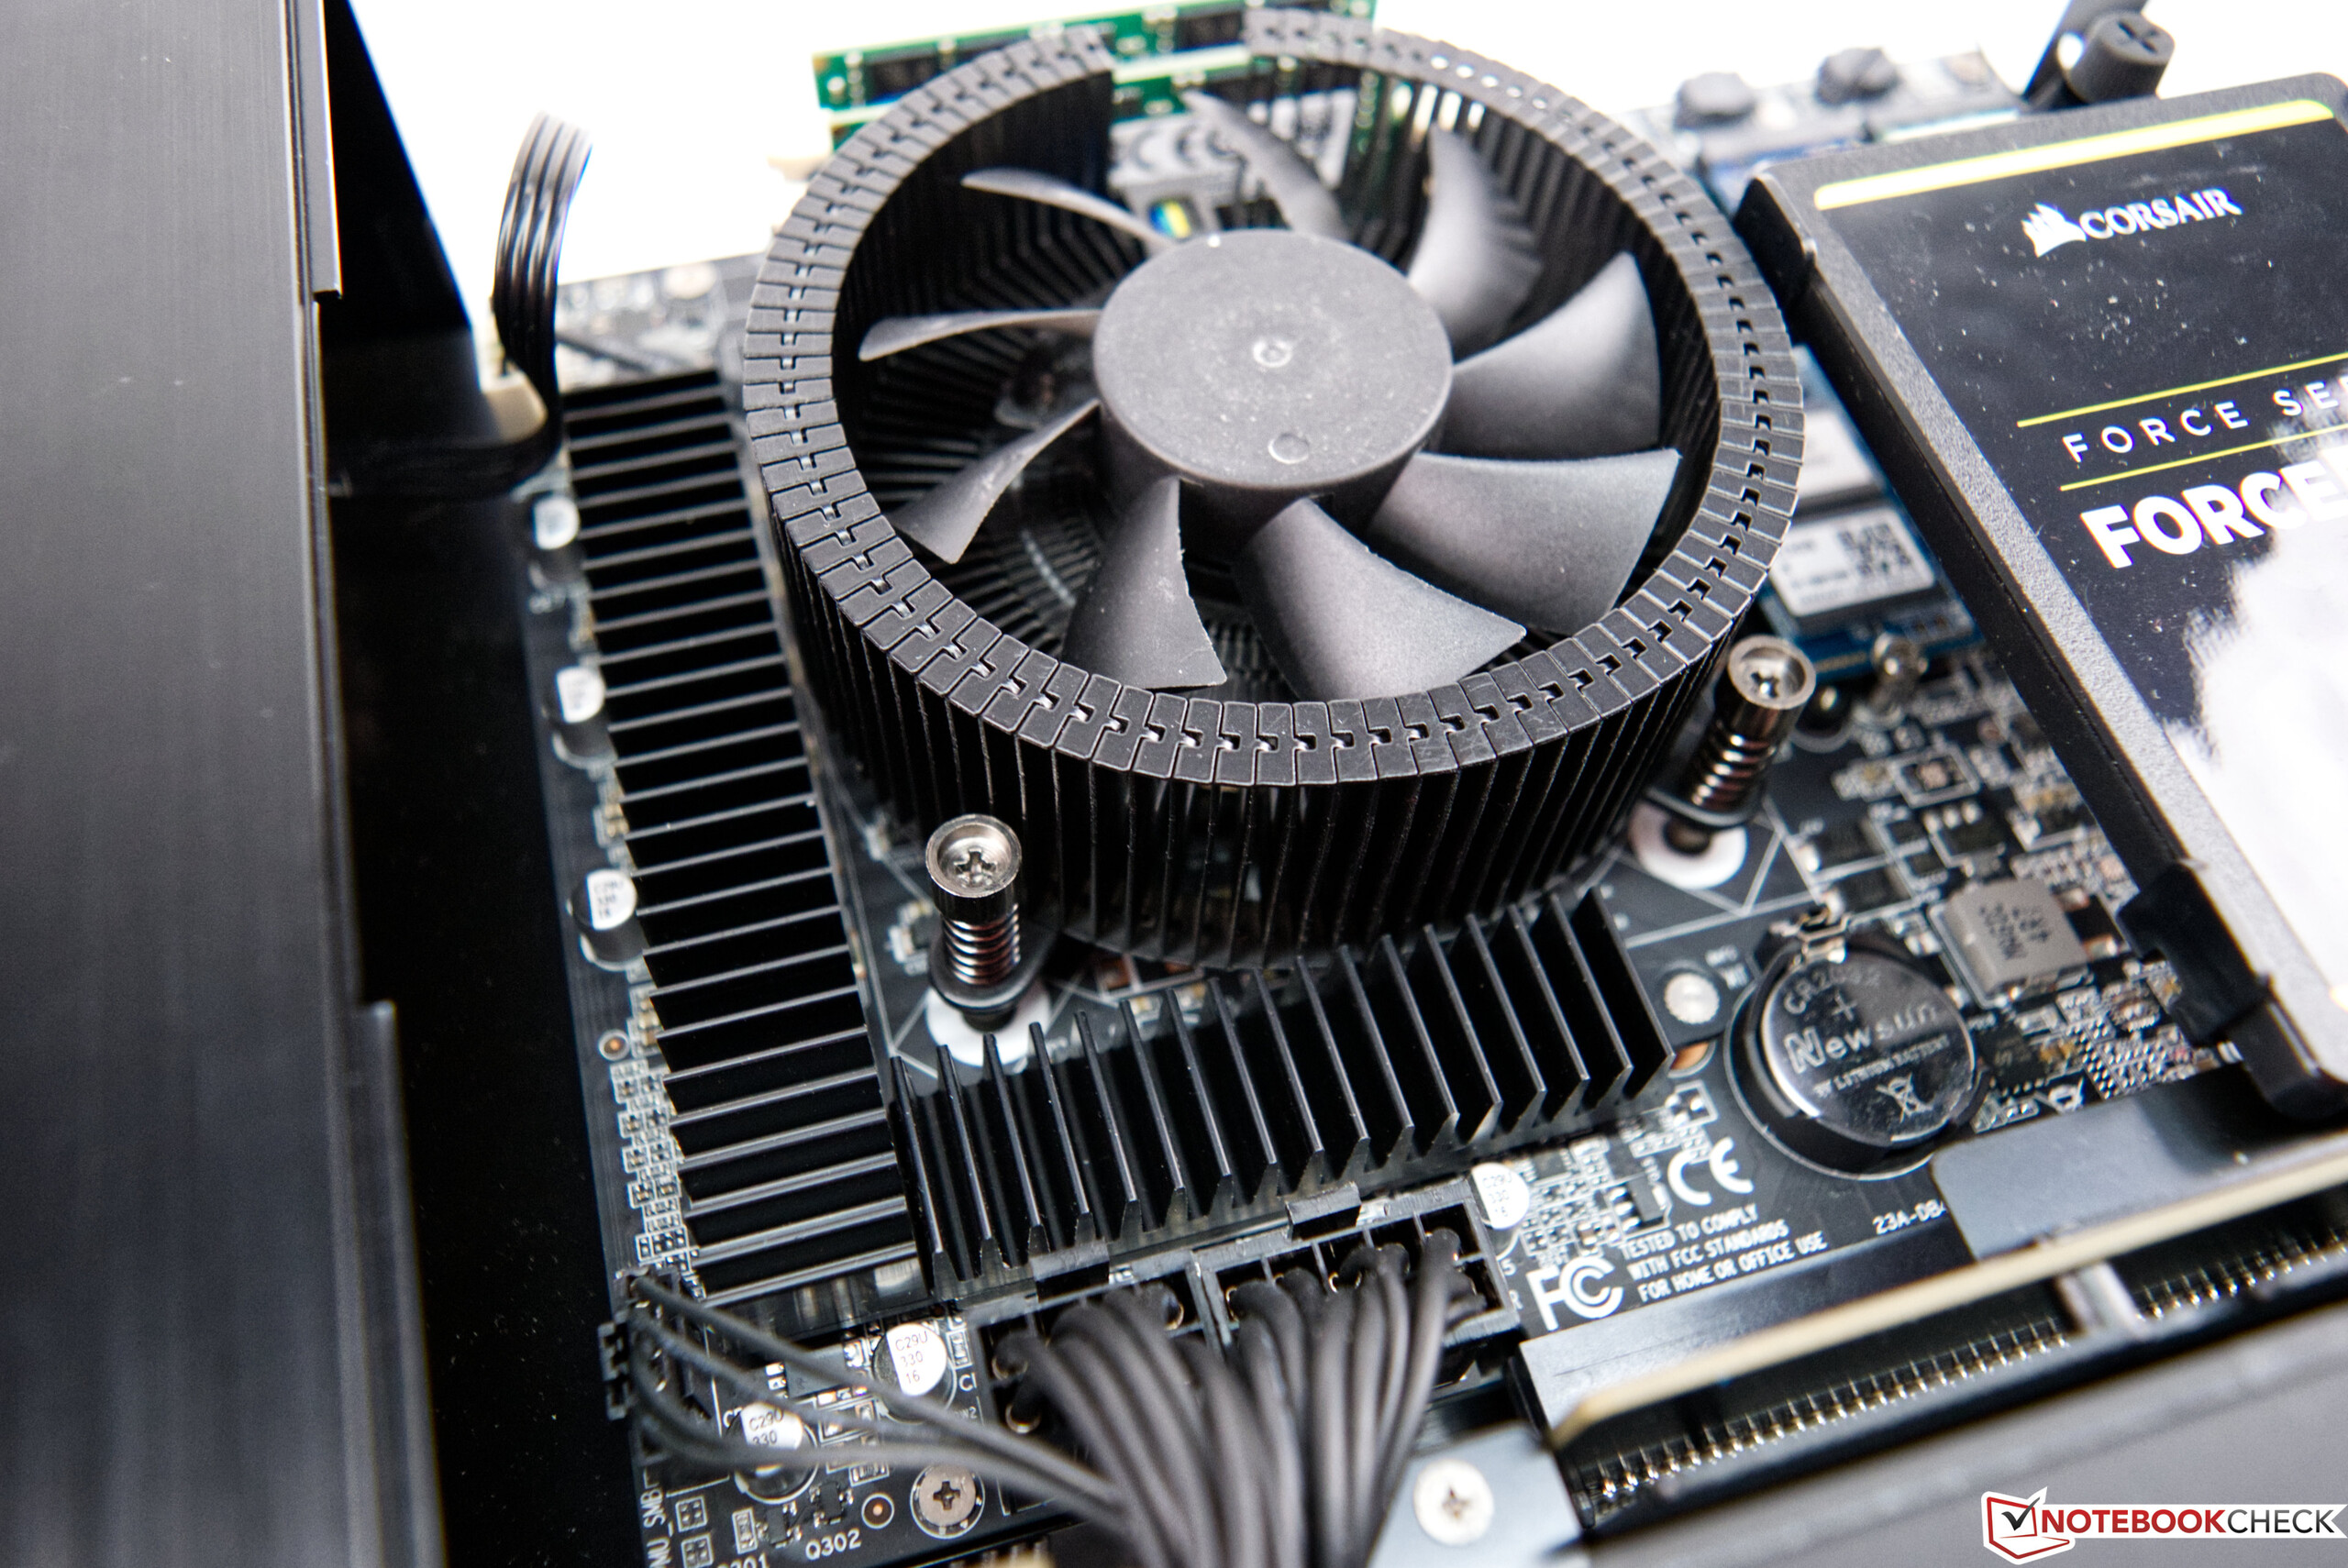
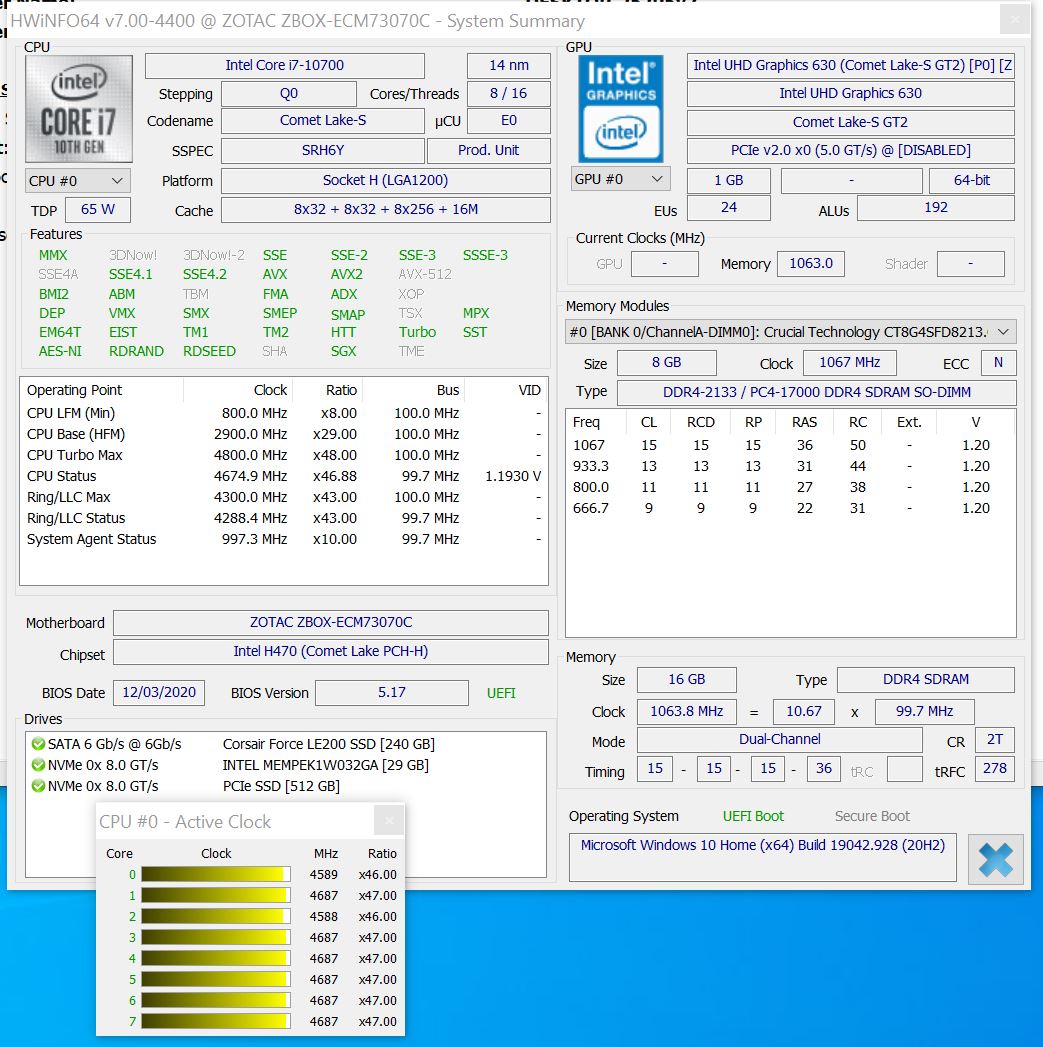
Het compacte ontwerp vraagt om een slim koelsysteem. Zotac maakt hier gebruik van het zogenaamde "schoorsteeneffect" en installeert twee ventilatoren aan de bovenkant die de resulterende afvalwarmte goed uit de behuizing transporteren. Desondanks warmt de Intel Core i7-10700 op tot een maximum van 87 °C (~187 °F) tijdens de stresstest. Bovendien liepde temperatuur van de GeForce RTX 3070 optot bijna 81 °C (~178 °F) tijdensde stresstest.
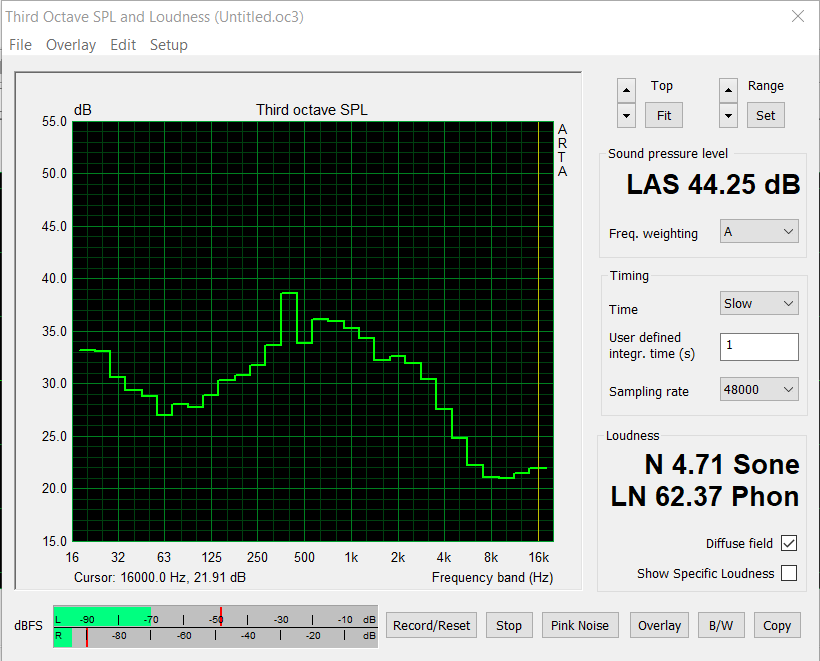
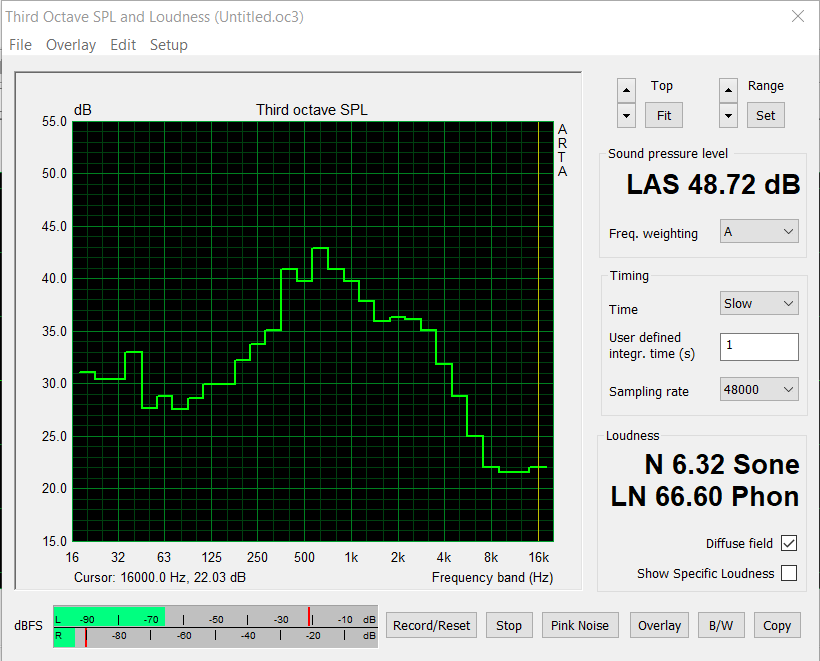
Dit valt allemaal nog binnen acceptabele grenzen, en er is geen reden tot zorg. Zelfs tijdens lange spelsessies waren er geen merkbare prestatiedalingen die erop zouden wijzen dat de temperaturen te hoog waren.Voor een desktop systeem is de Magnus One echter duidelijk hoorbaar onder belasting als gevolg van de koelsituatie. We maten slechts 33,5 dB(A) in idle gebruik, hoewel het aanzienlijk luider werd op 48,7 dB(A) tijdens het gamen. Het geluidsniveau was iets lager in de stresstest met 44,2 dB(A). Op dit punt willen we graag een positieve opmerking maken over het feit dat we geen hoogfrequent ventilator geluid of spoelgejank hebben opgemerkt
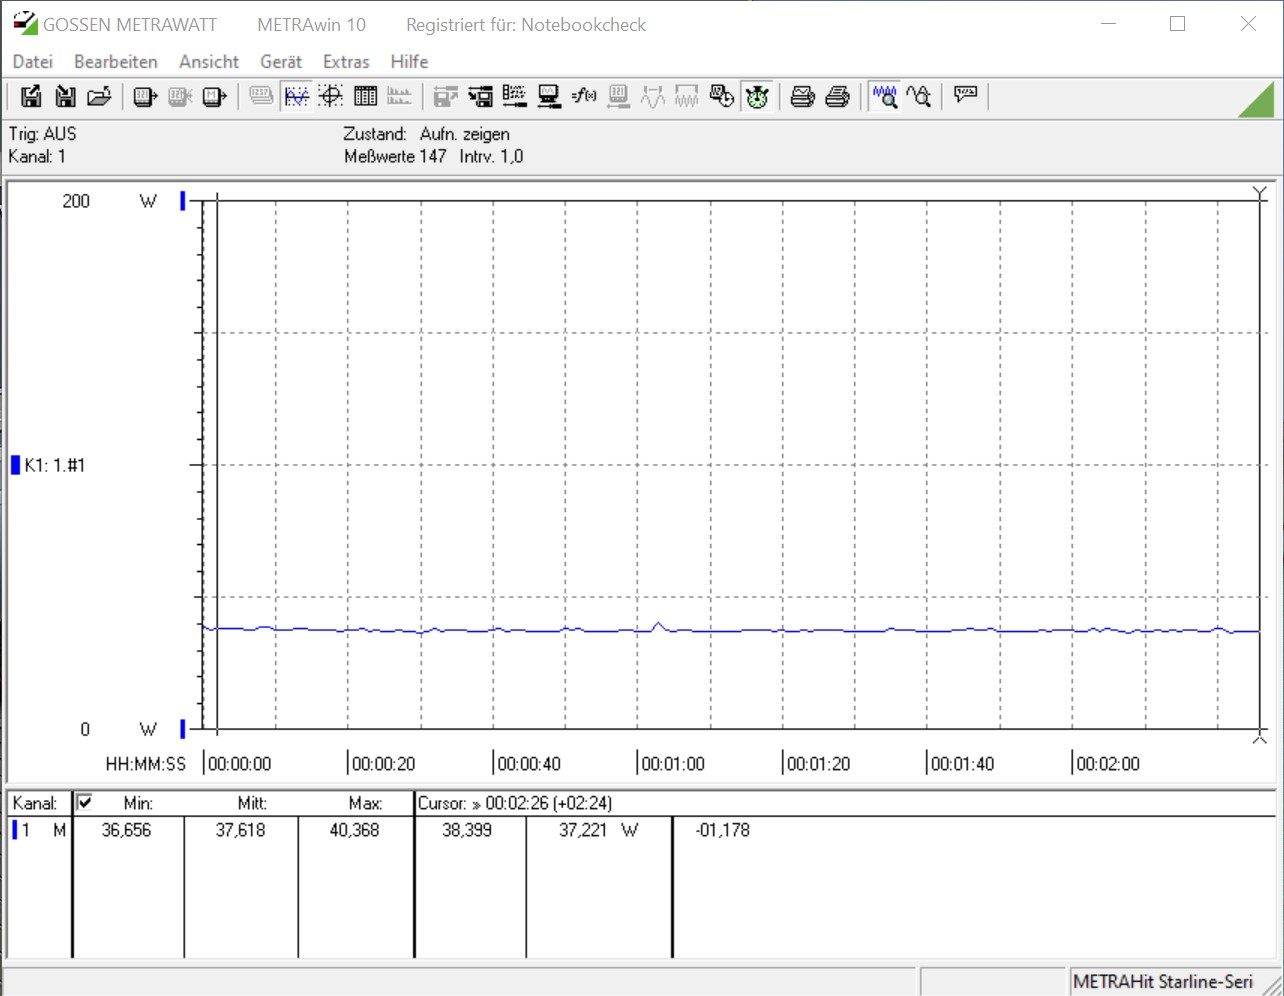
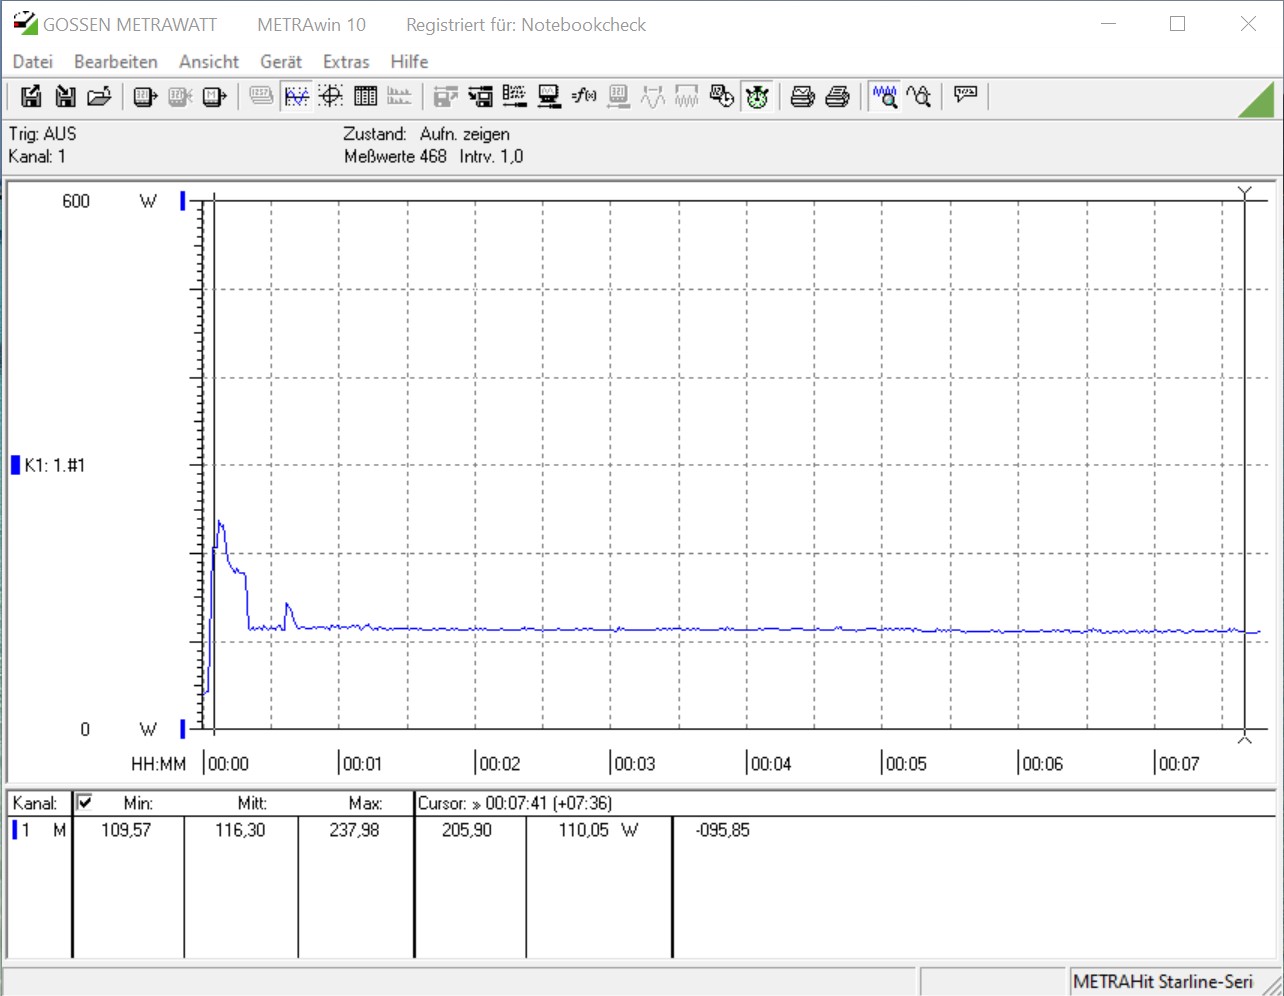
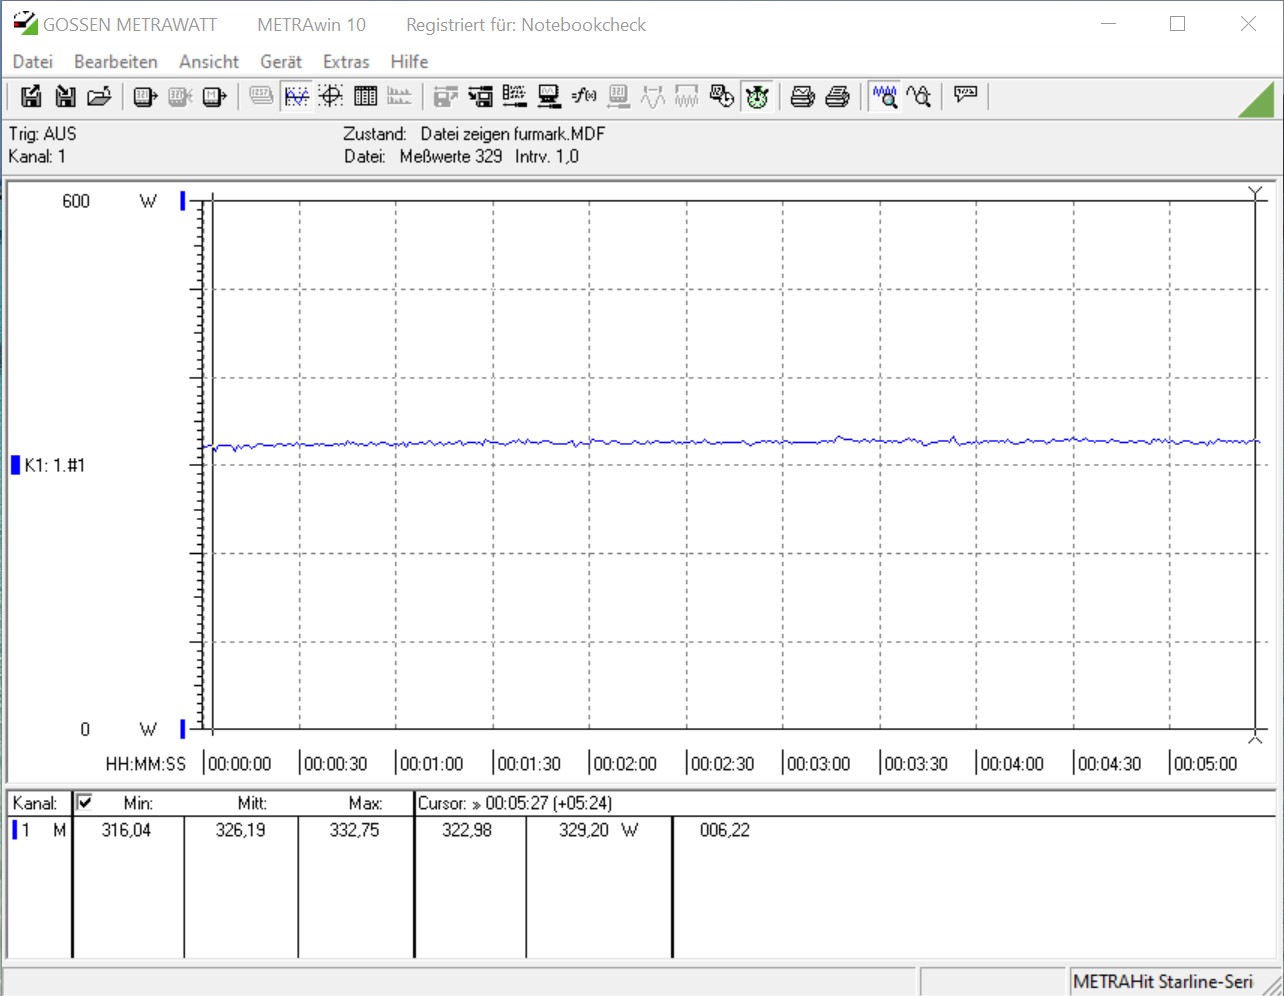
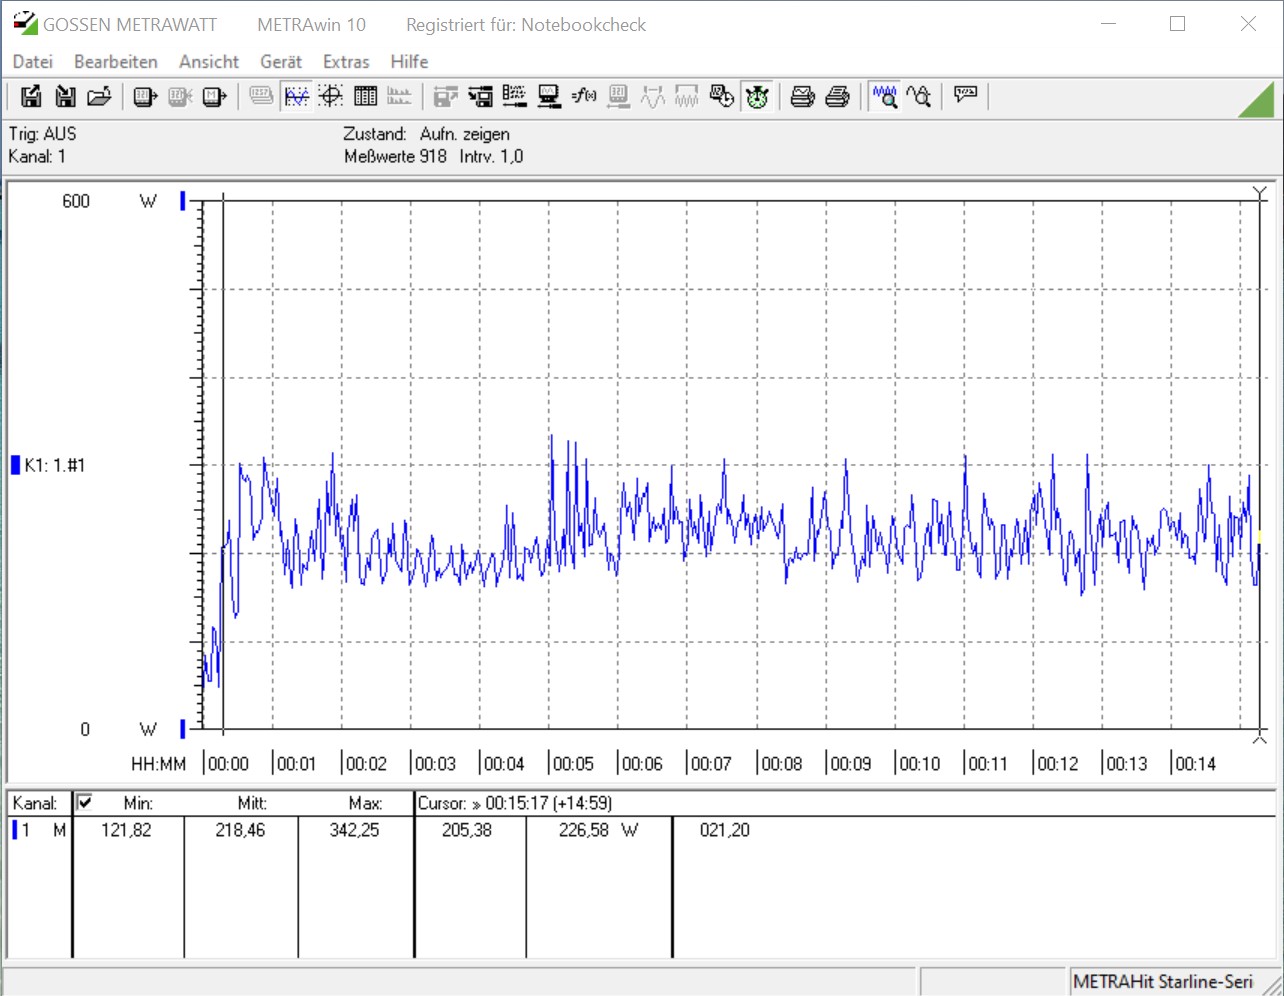
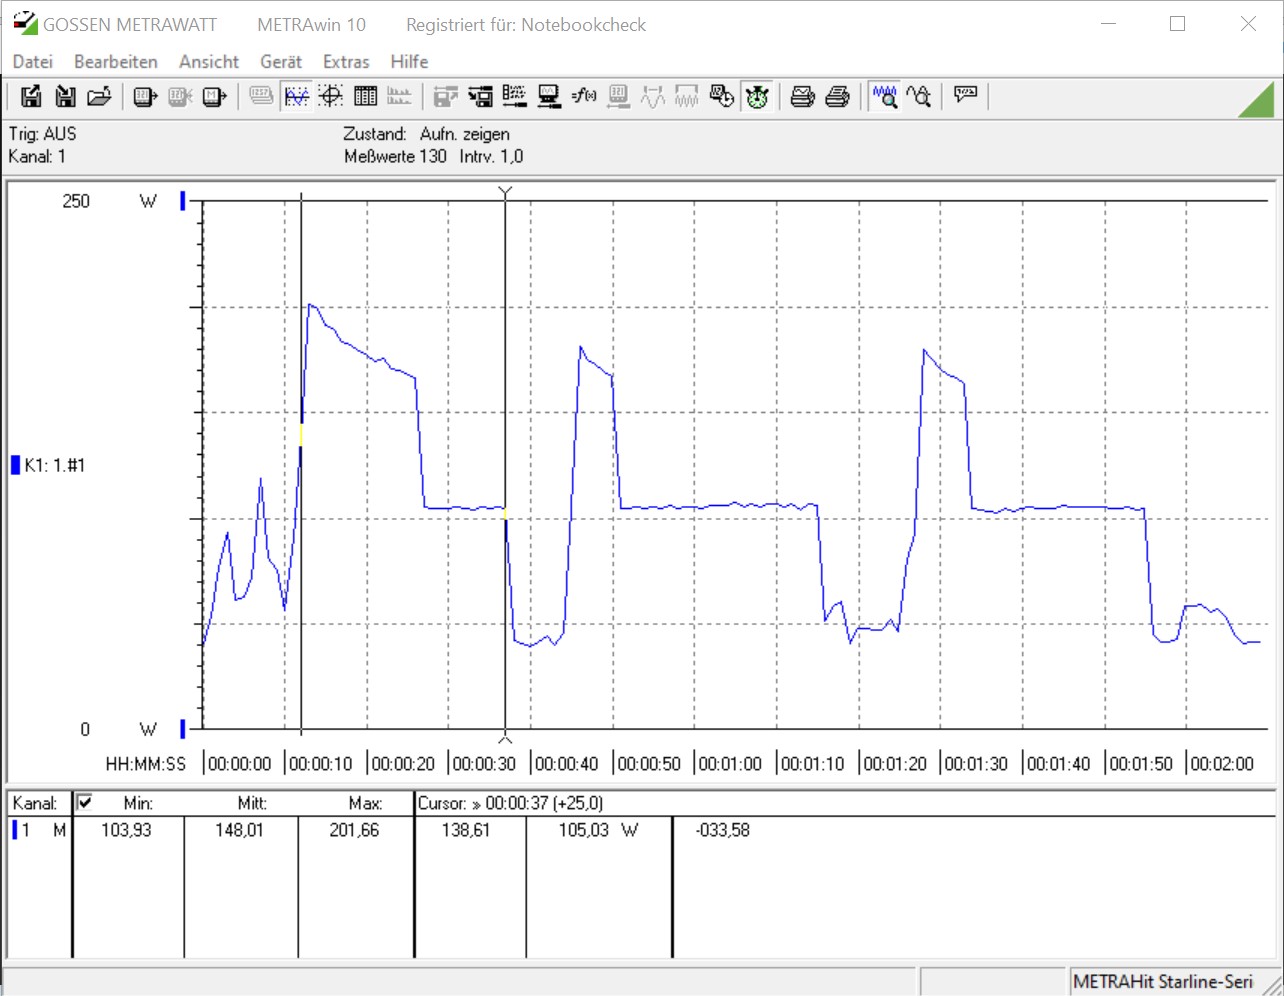
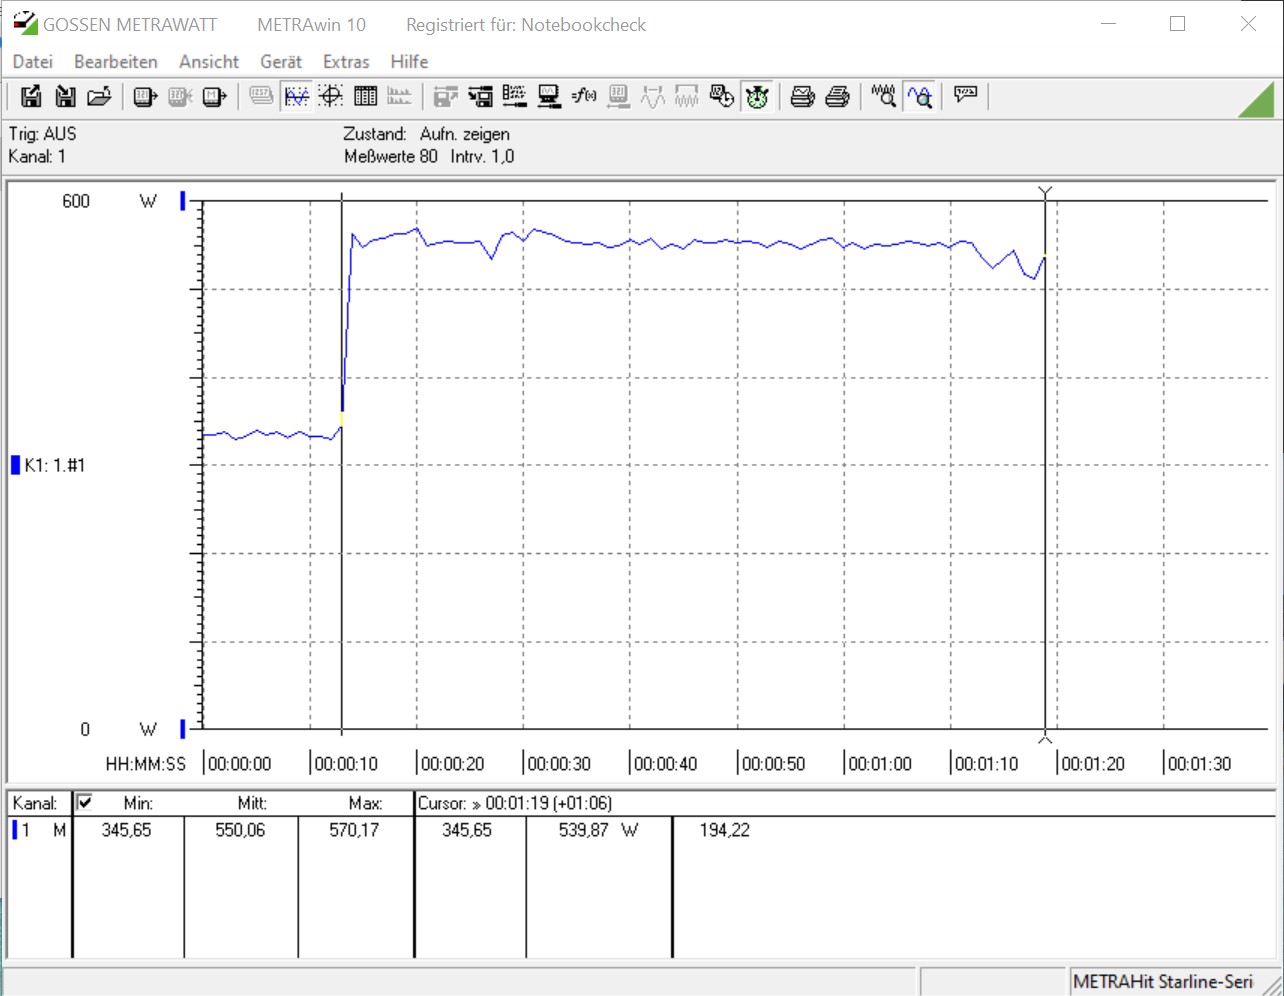
Aan de ene kant is de Magnus One relatief zuinig in termen van stroomverbruik, maar aan de andere kant is hij ook zeer energieverslindend als het gaat om gaming. Ons meetapparaat toonde een gemiddelde van 550 watt in de gaming test. De geïnstalleerde voeding is gespecificeerd op 500 watt. Desondanks waren er geen crashes tijdens de test die zouden wijzen op overbelasting.
| Power Consumption | |
| 1920x1080 The Witcher 3 ultra (external Monitor) | |
| Zotac Magnus One (ECM73070C) (Idle: 37.6 W) | |
| AMD Ryzen 7 5800X (Idle: 77.5 W) | |
| AMD Ryzen 5 5600X (Idle: 79.23 W) | |
| Intel Core i5-10600K (Idle: 52.2 W) | |
| Intel Core i7-9700K, AMD Radeon RX Vega 64 | |
| MSI GeForce RTX 3070 Ventus 3X (Idle: 91.46 W) | |
| Prime95 V2810 Stress (external Monitor) | |
| AMD Ryzen 7 5800X (Idle: 77.5 W) | |
| Intel Core i7-9700K, AMD Radeon RX Vega 64 | |
| Intel Core i5-10600K (Idle: 52.2 W) | |
| AMD Ryzen 5 5600X (Idle: 79.23 W) | |
| Zotac Magnus One (ECM73070C) (Idle: 37.6 W) | |
| Cinebench R15 Multi (external Monitor) | |
| AMD Ryzen 7 5800X (Idle: 77.5 W) | |
| Intel Core i7-9700K, AMD Radeon RX Vega 64 | |
| Intel Core i5-10600K (Idle: 52.2 W) | |
| AMD Ryzen 5 5600X (Idle: 79.23 W) | |
| Zotac Magnus One (ECM73070C) (Idle: 37.6 W) | |
| Temperatures - CPU Temperature Prime95 | |
| AMD Ryzen 7 5800X | |
| Intel Core i5-10600K | |
* ... kleiner is beter
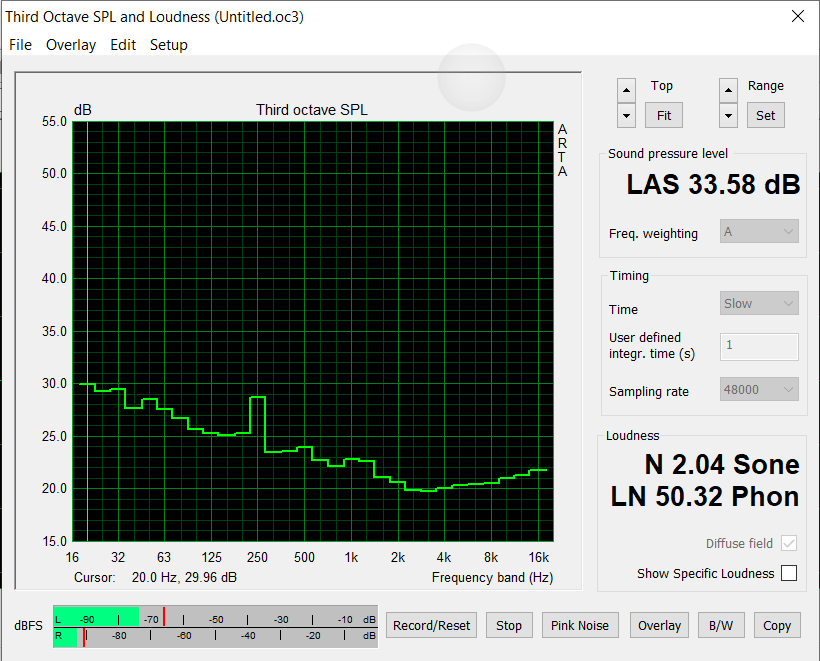
Geluidsniveau
| Onbelast |
| 33.58 / / dB (A) |
| Belasting |
| 44.25 / 48.72 dB (A) |
 | ||
30 dB stil 40 dB(A) hoorbaar 50 dB(A) luid |
||
min: | ||
Pro
Contra
Verdict - Goede prestaties en goede connectiviteit
Zotac's Magnus One is een compact apparaat dat zeer goede prestaties biedt in de kleinste ruimtes. Merk op dat dit een barebone systeem is waarbij het RAM, de massaopslag, en ook het besturingssysteem geen deel uitmaken van de MSRP van 1.499 Euro (~$1.825). Echter, op het moment van testen, beginnen realistische straatprijzen bij 1.650 Euro (~$2.009) en hoger. Gebruikers die de Magnus One voor een goede prijs kunnen bemachtigen zouden zelfs een koopje kunnen krijgen, aangezien de GeForce RTX 3070 alleen al aanzienlijk meer kost dan 1.000 Euro (~$1,218). De Intel Core i7-10700 is niet de nieuwste versie van de Core processoren, maar dit is geen probleem bij dagelijks gebruik. Al met al past de kleine Core i7-10700, die niet is beperkt in termen van TDP, goed in het totale systeem. Echter, de Magnus One scoort beter in onze 3D en gaming benchmarks dan in de dedicated CPU tests. AMD is hier iets beter gepositioneerd met de Ryzen 5000 serie. Misschien overweegt Zotac om ook een systeem op basis van AMD te ontwikkelen.
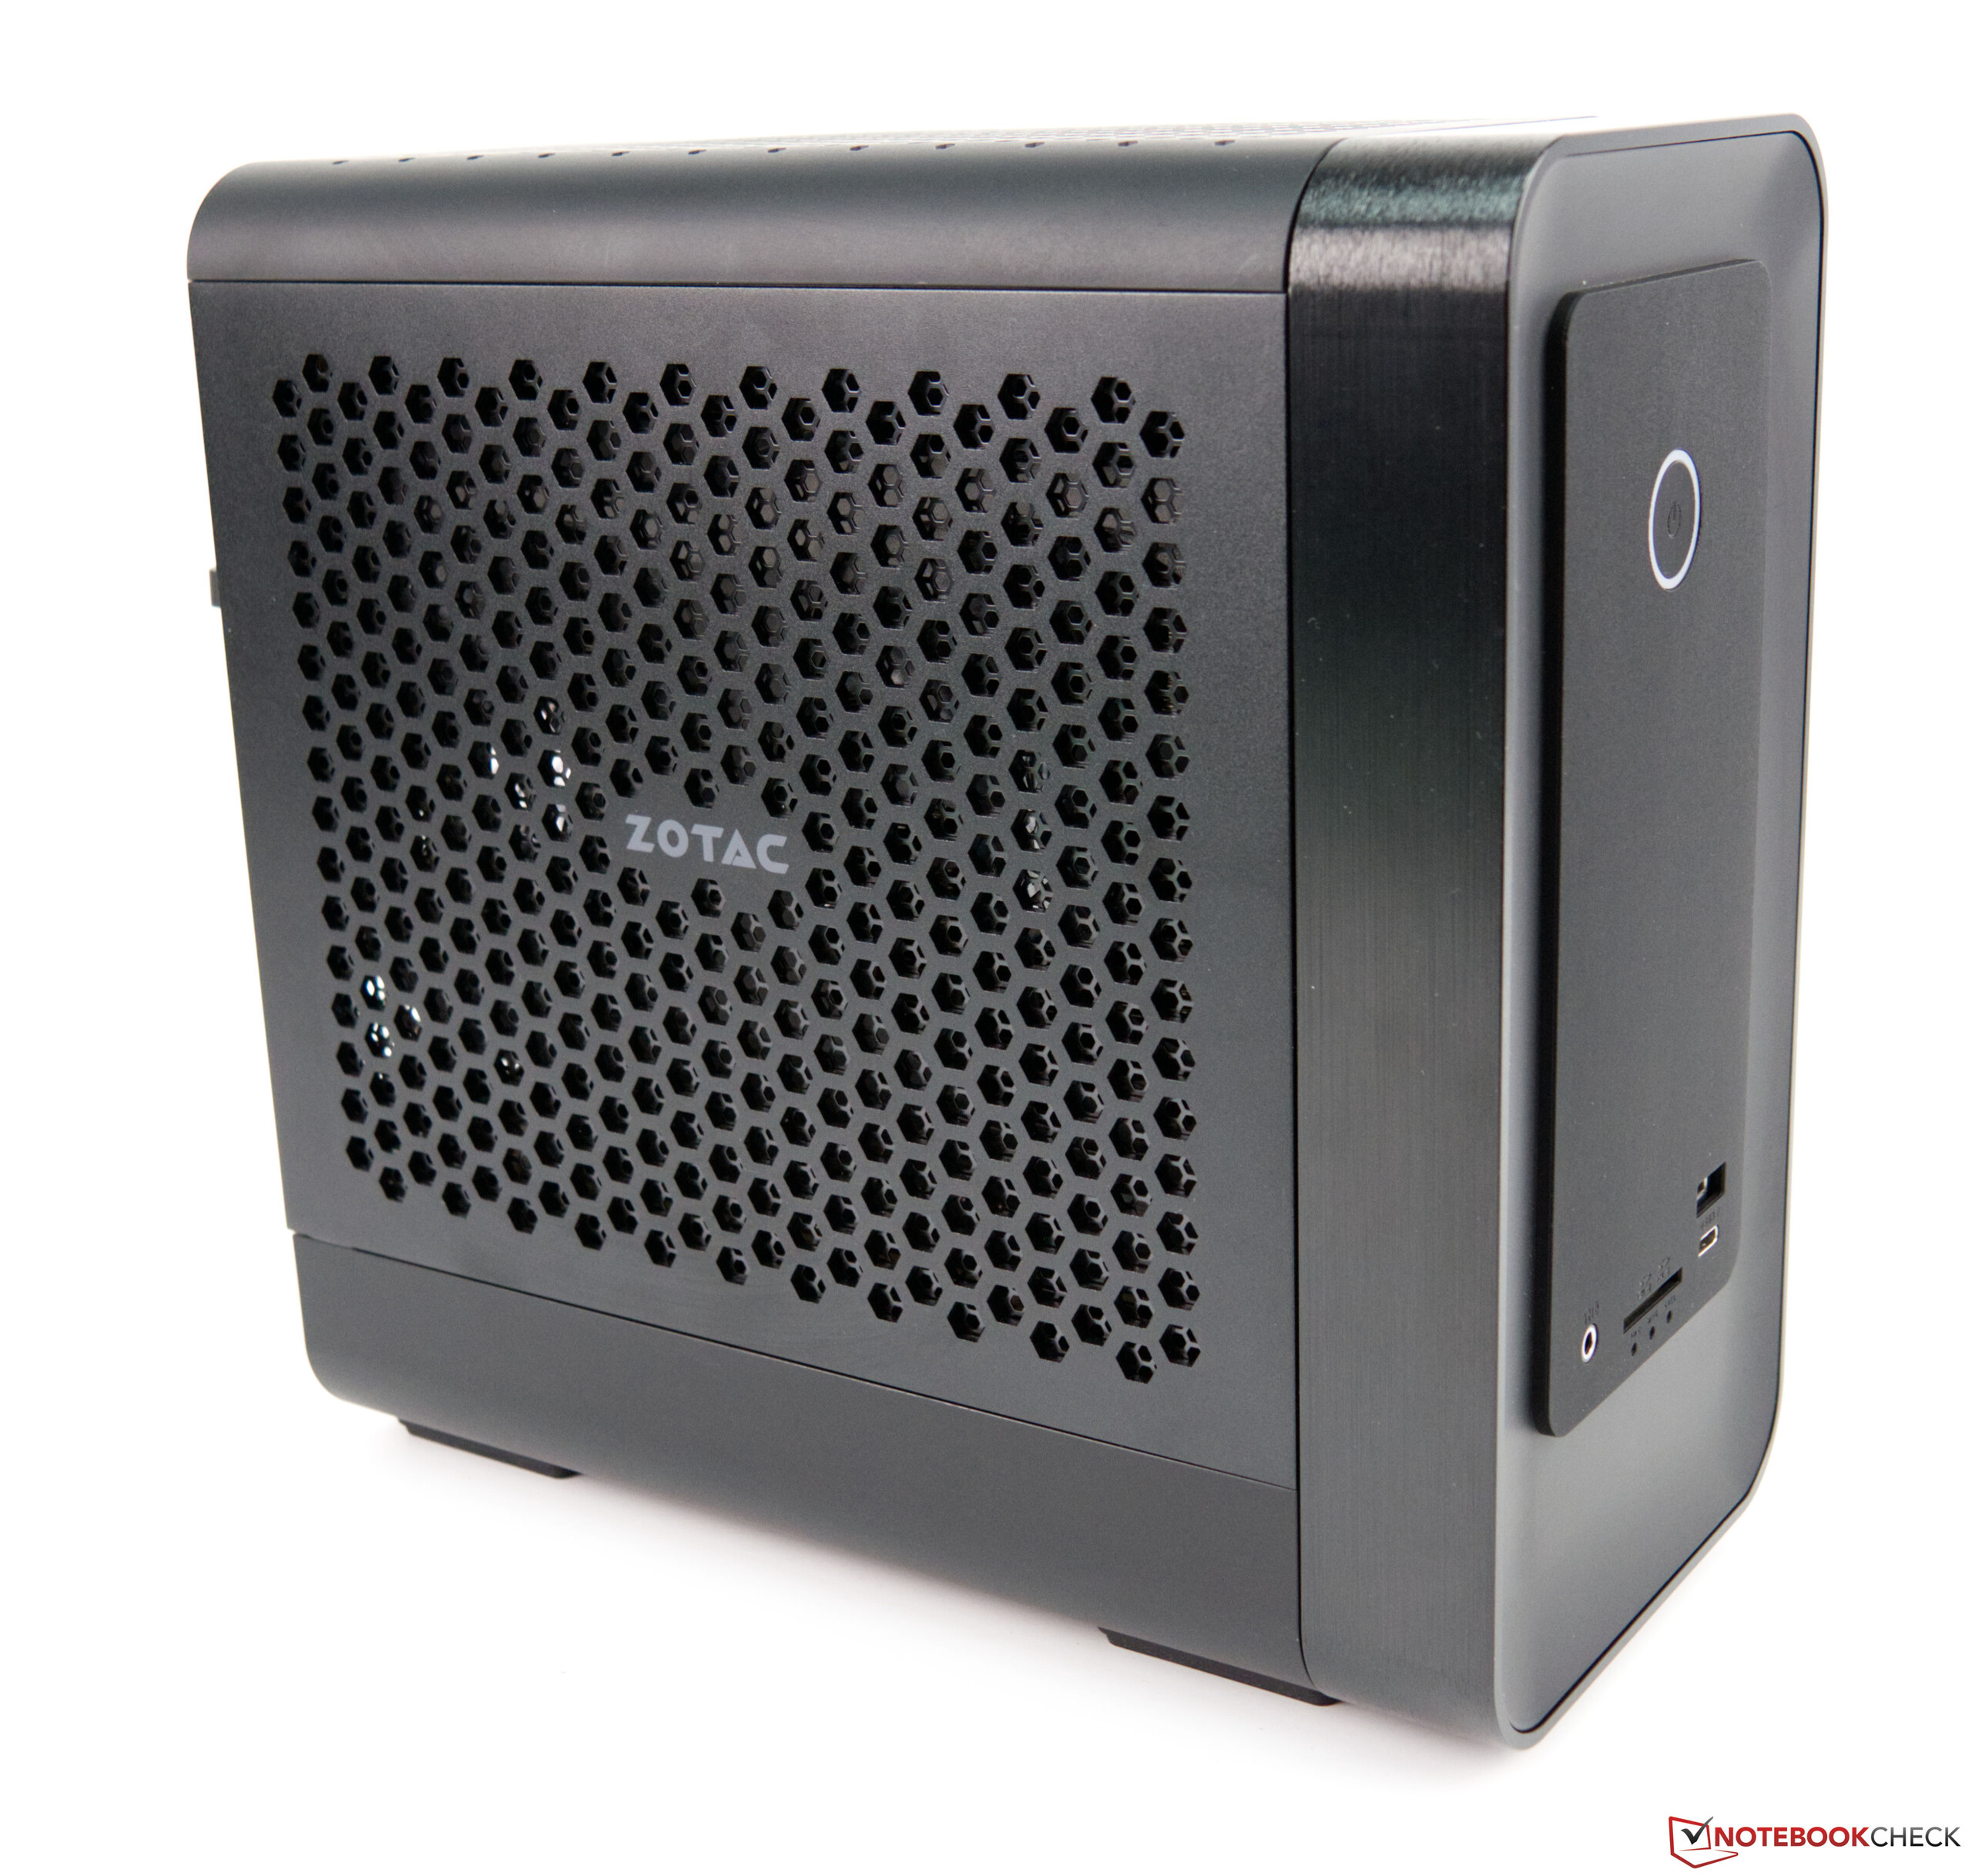
De Magnus One is een krachtig en compact systeem dat zelfs zonder RGB een blikvanger is.
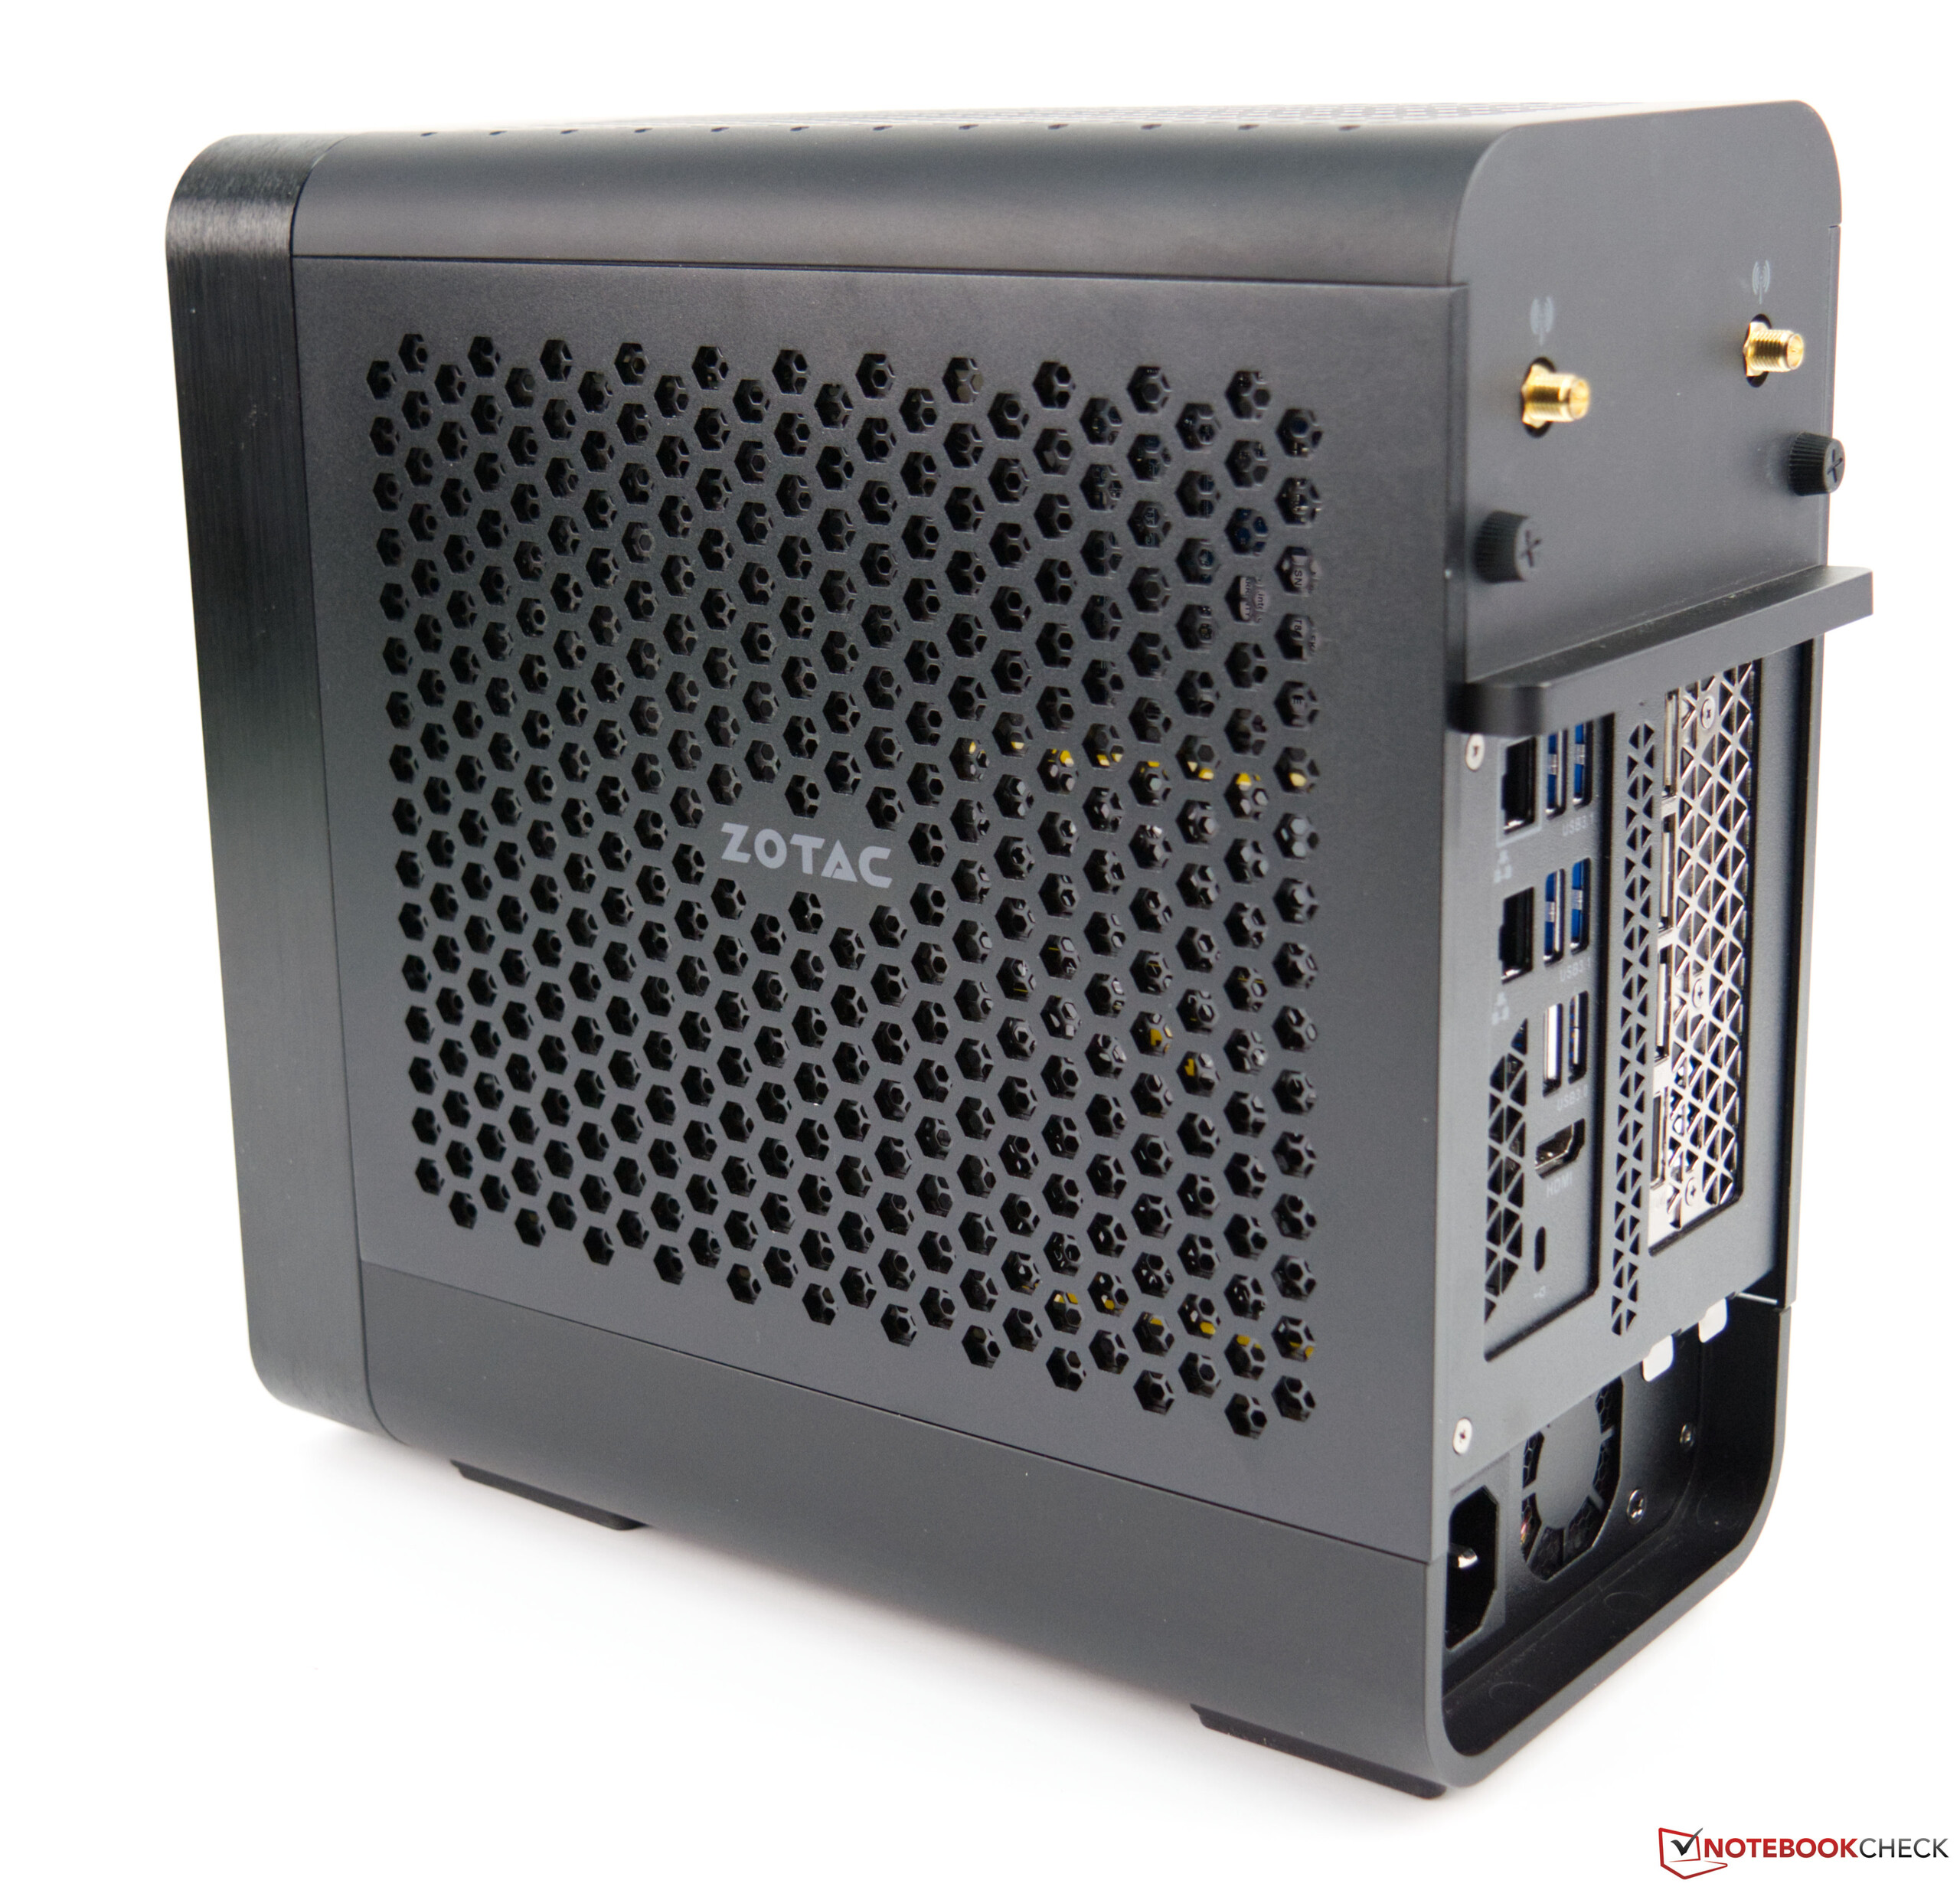
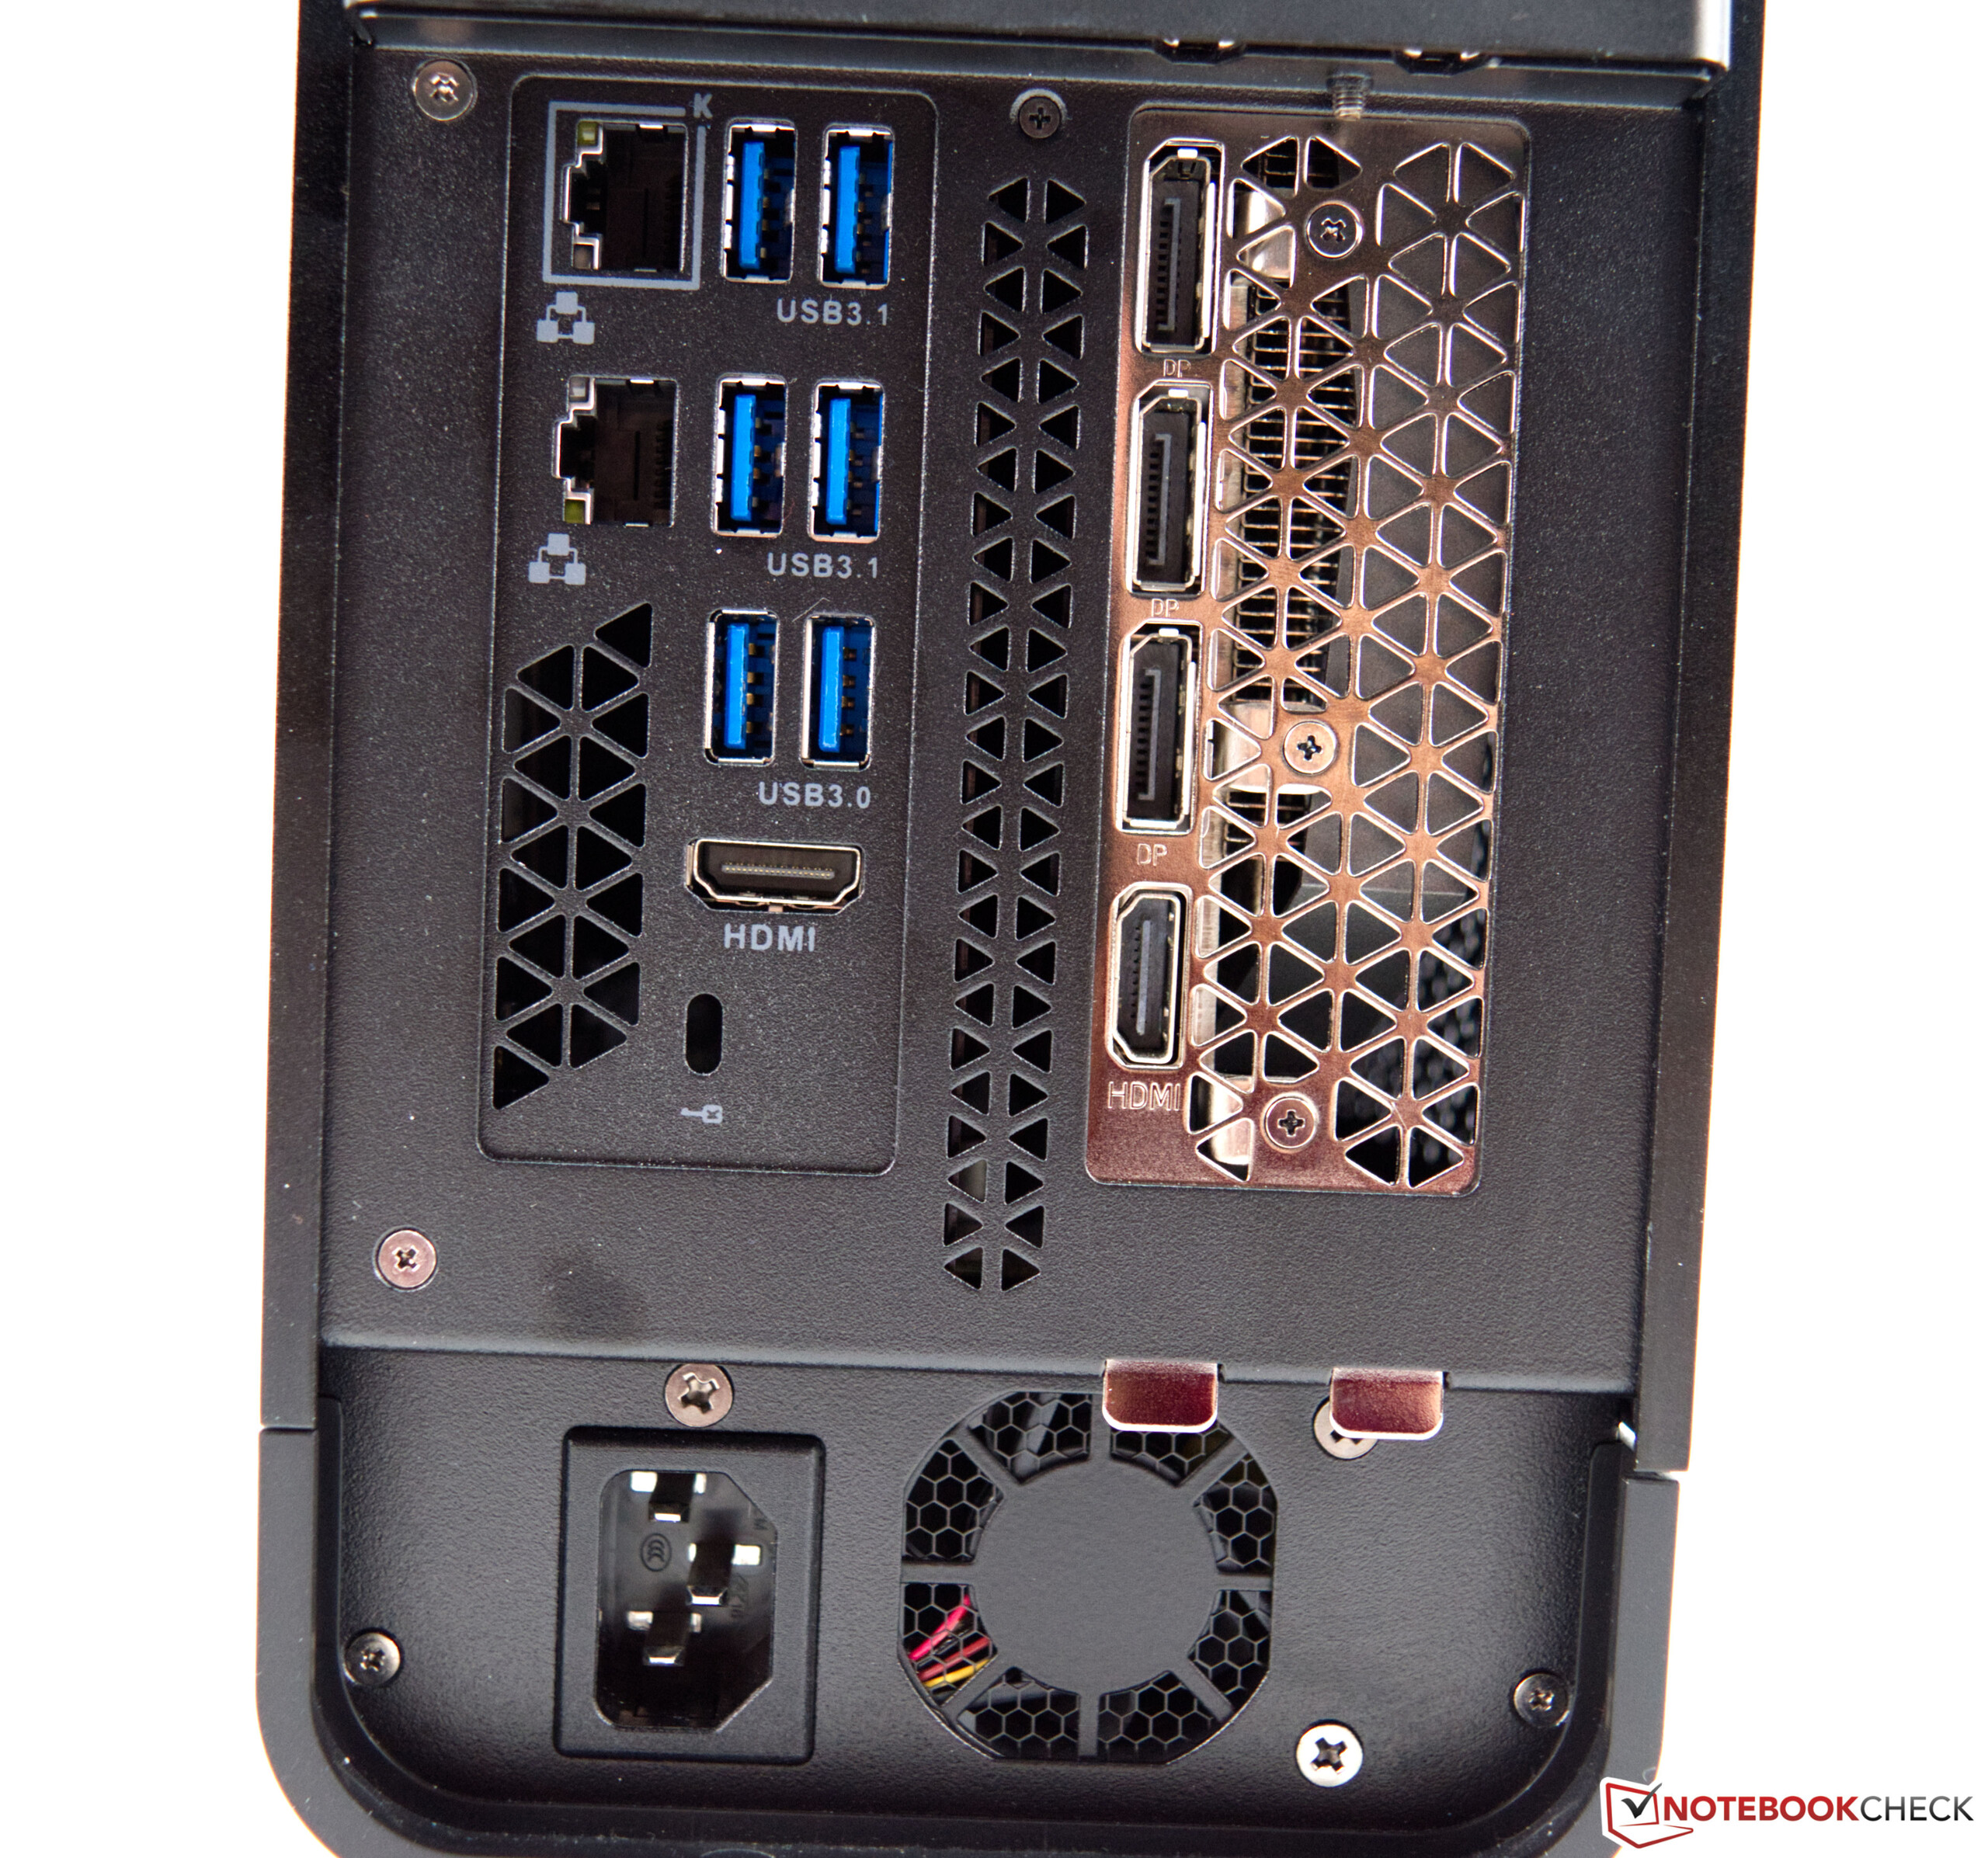
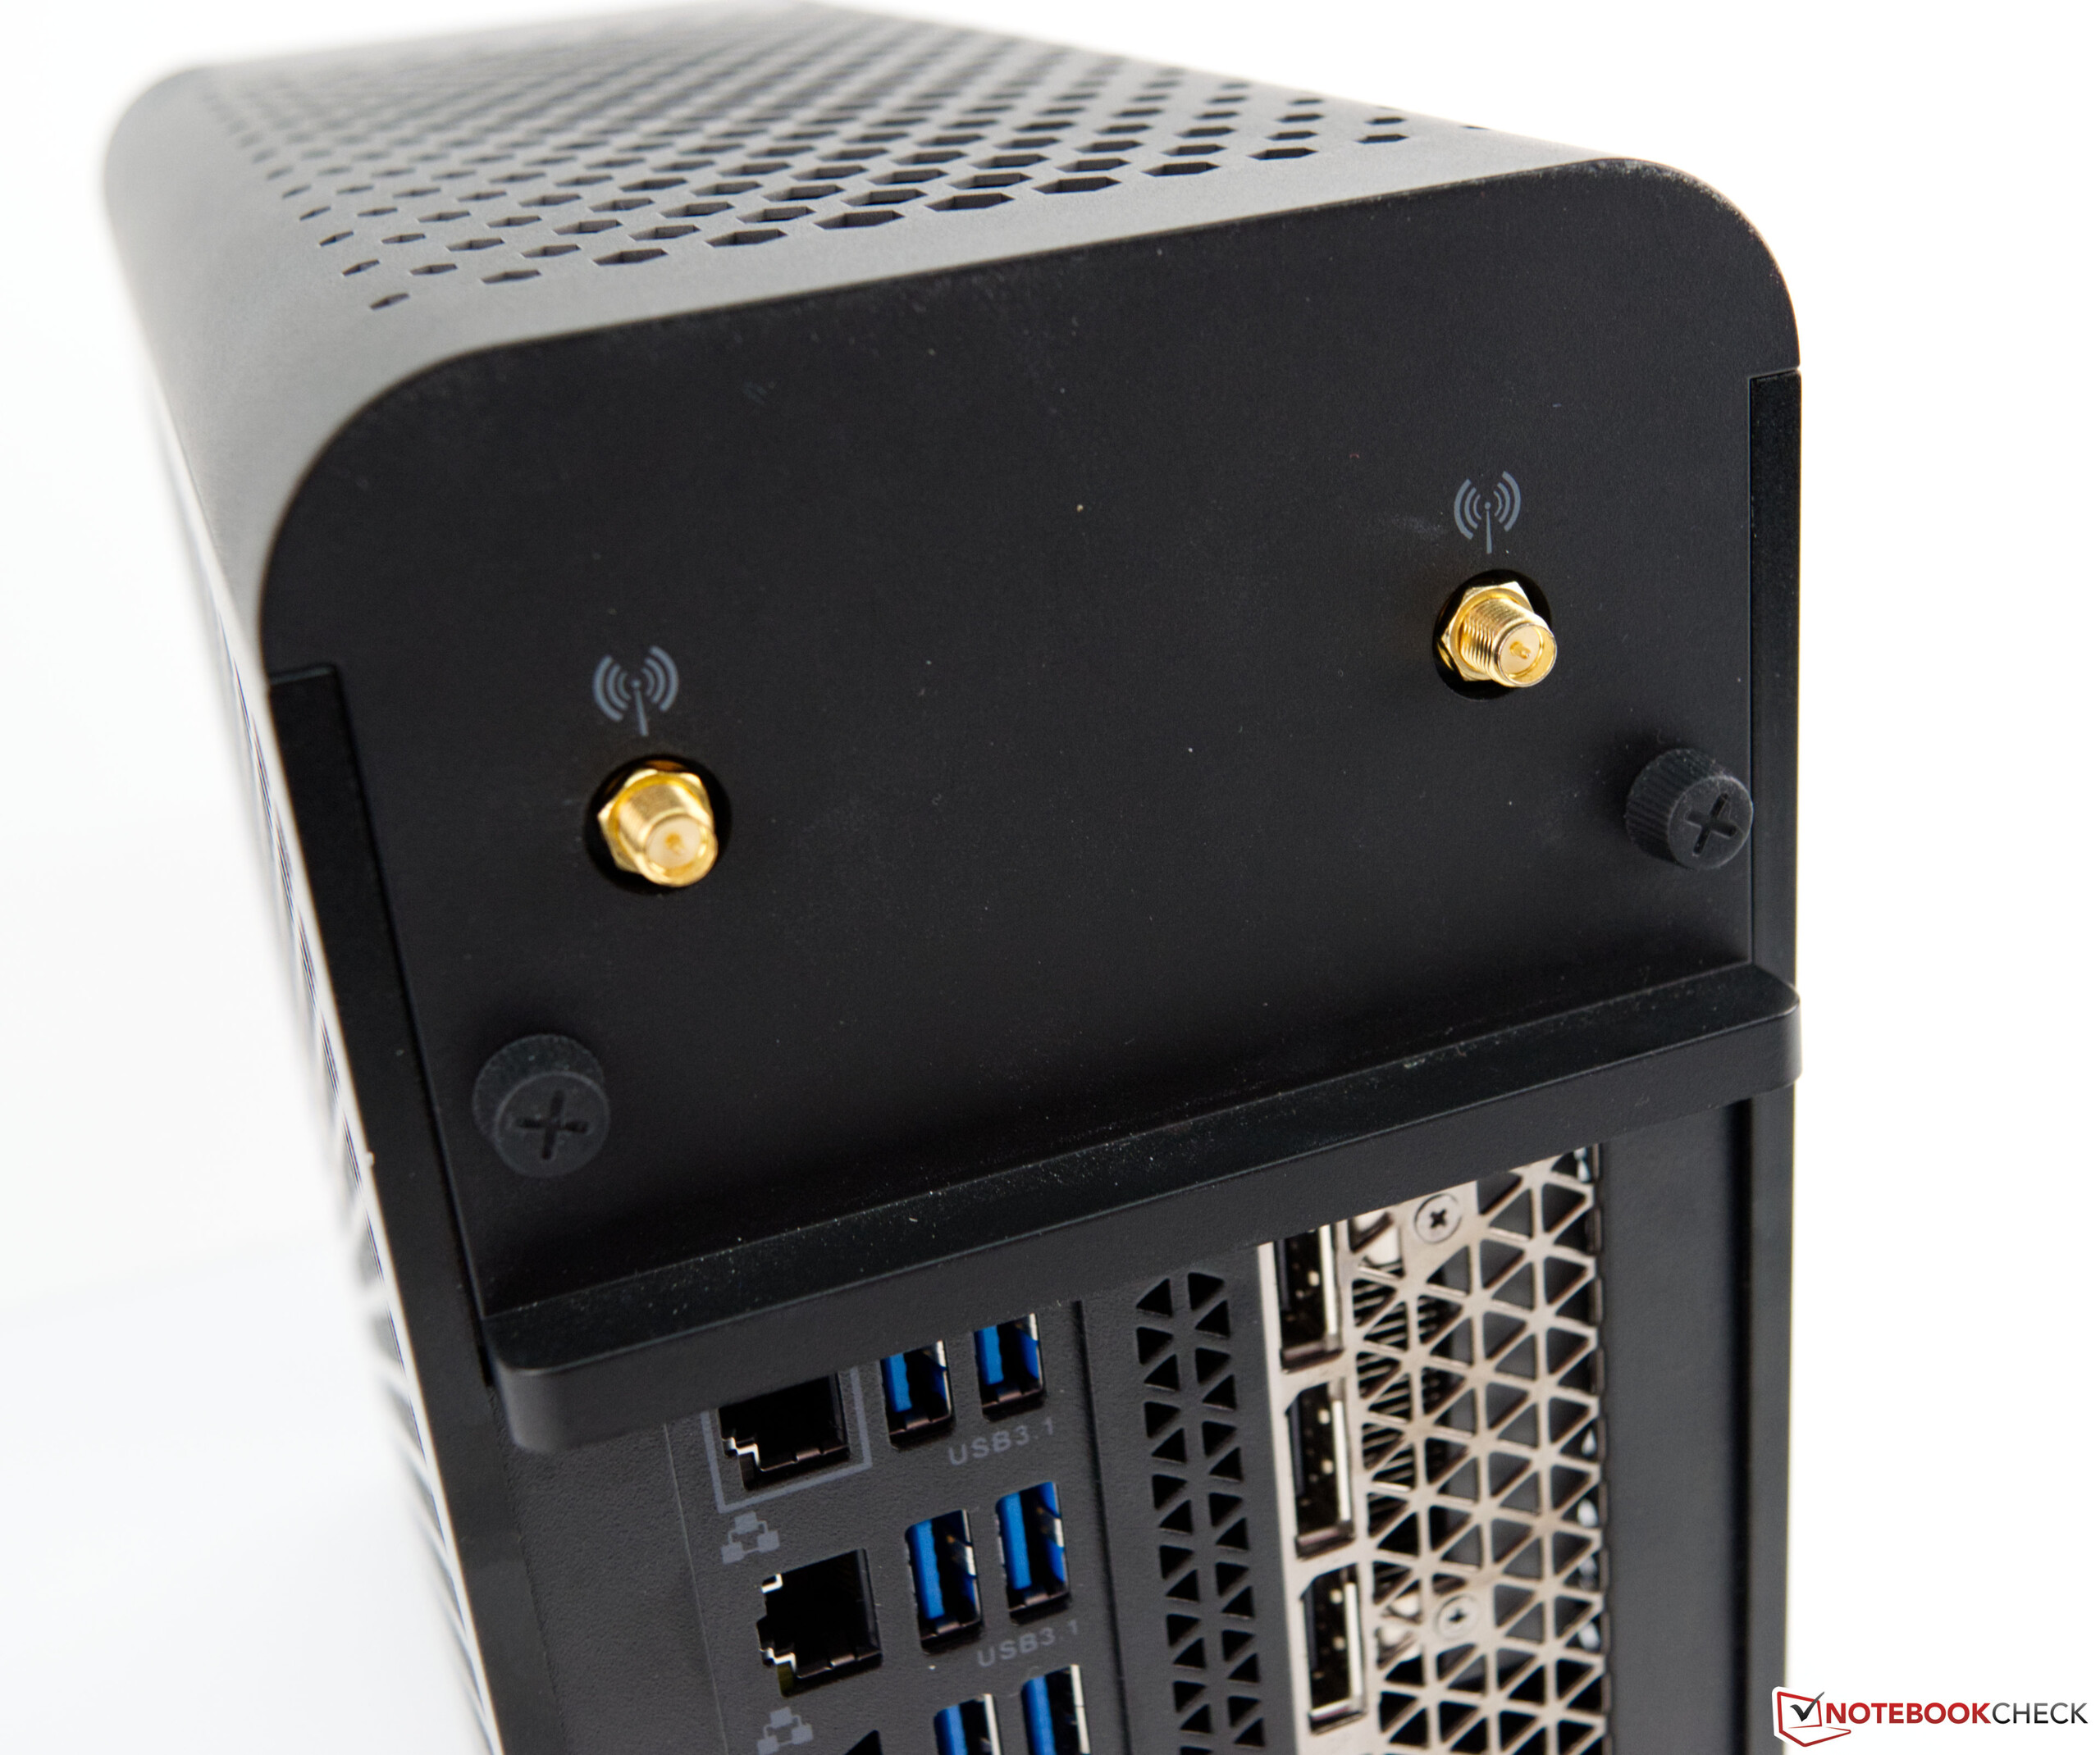
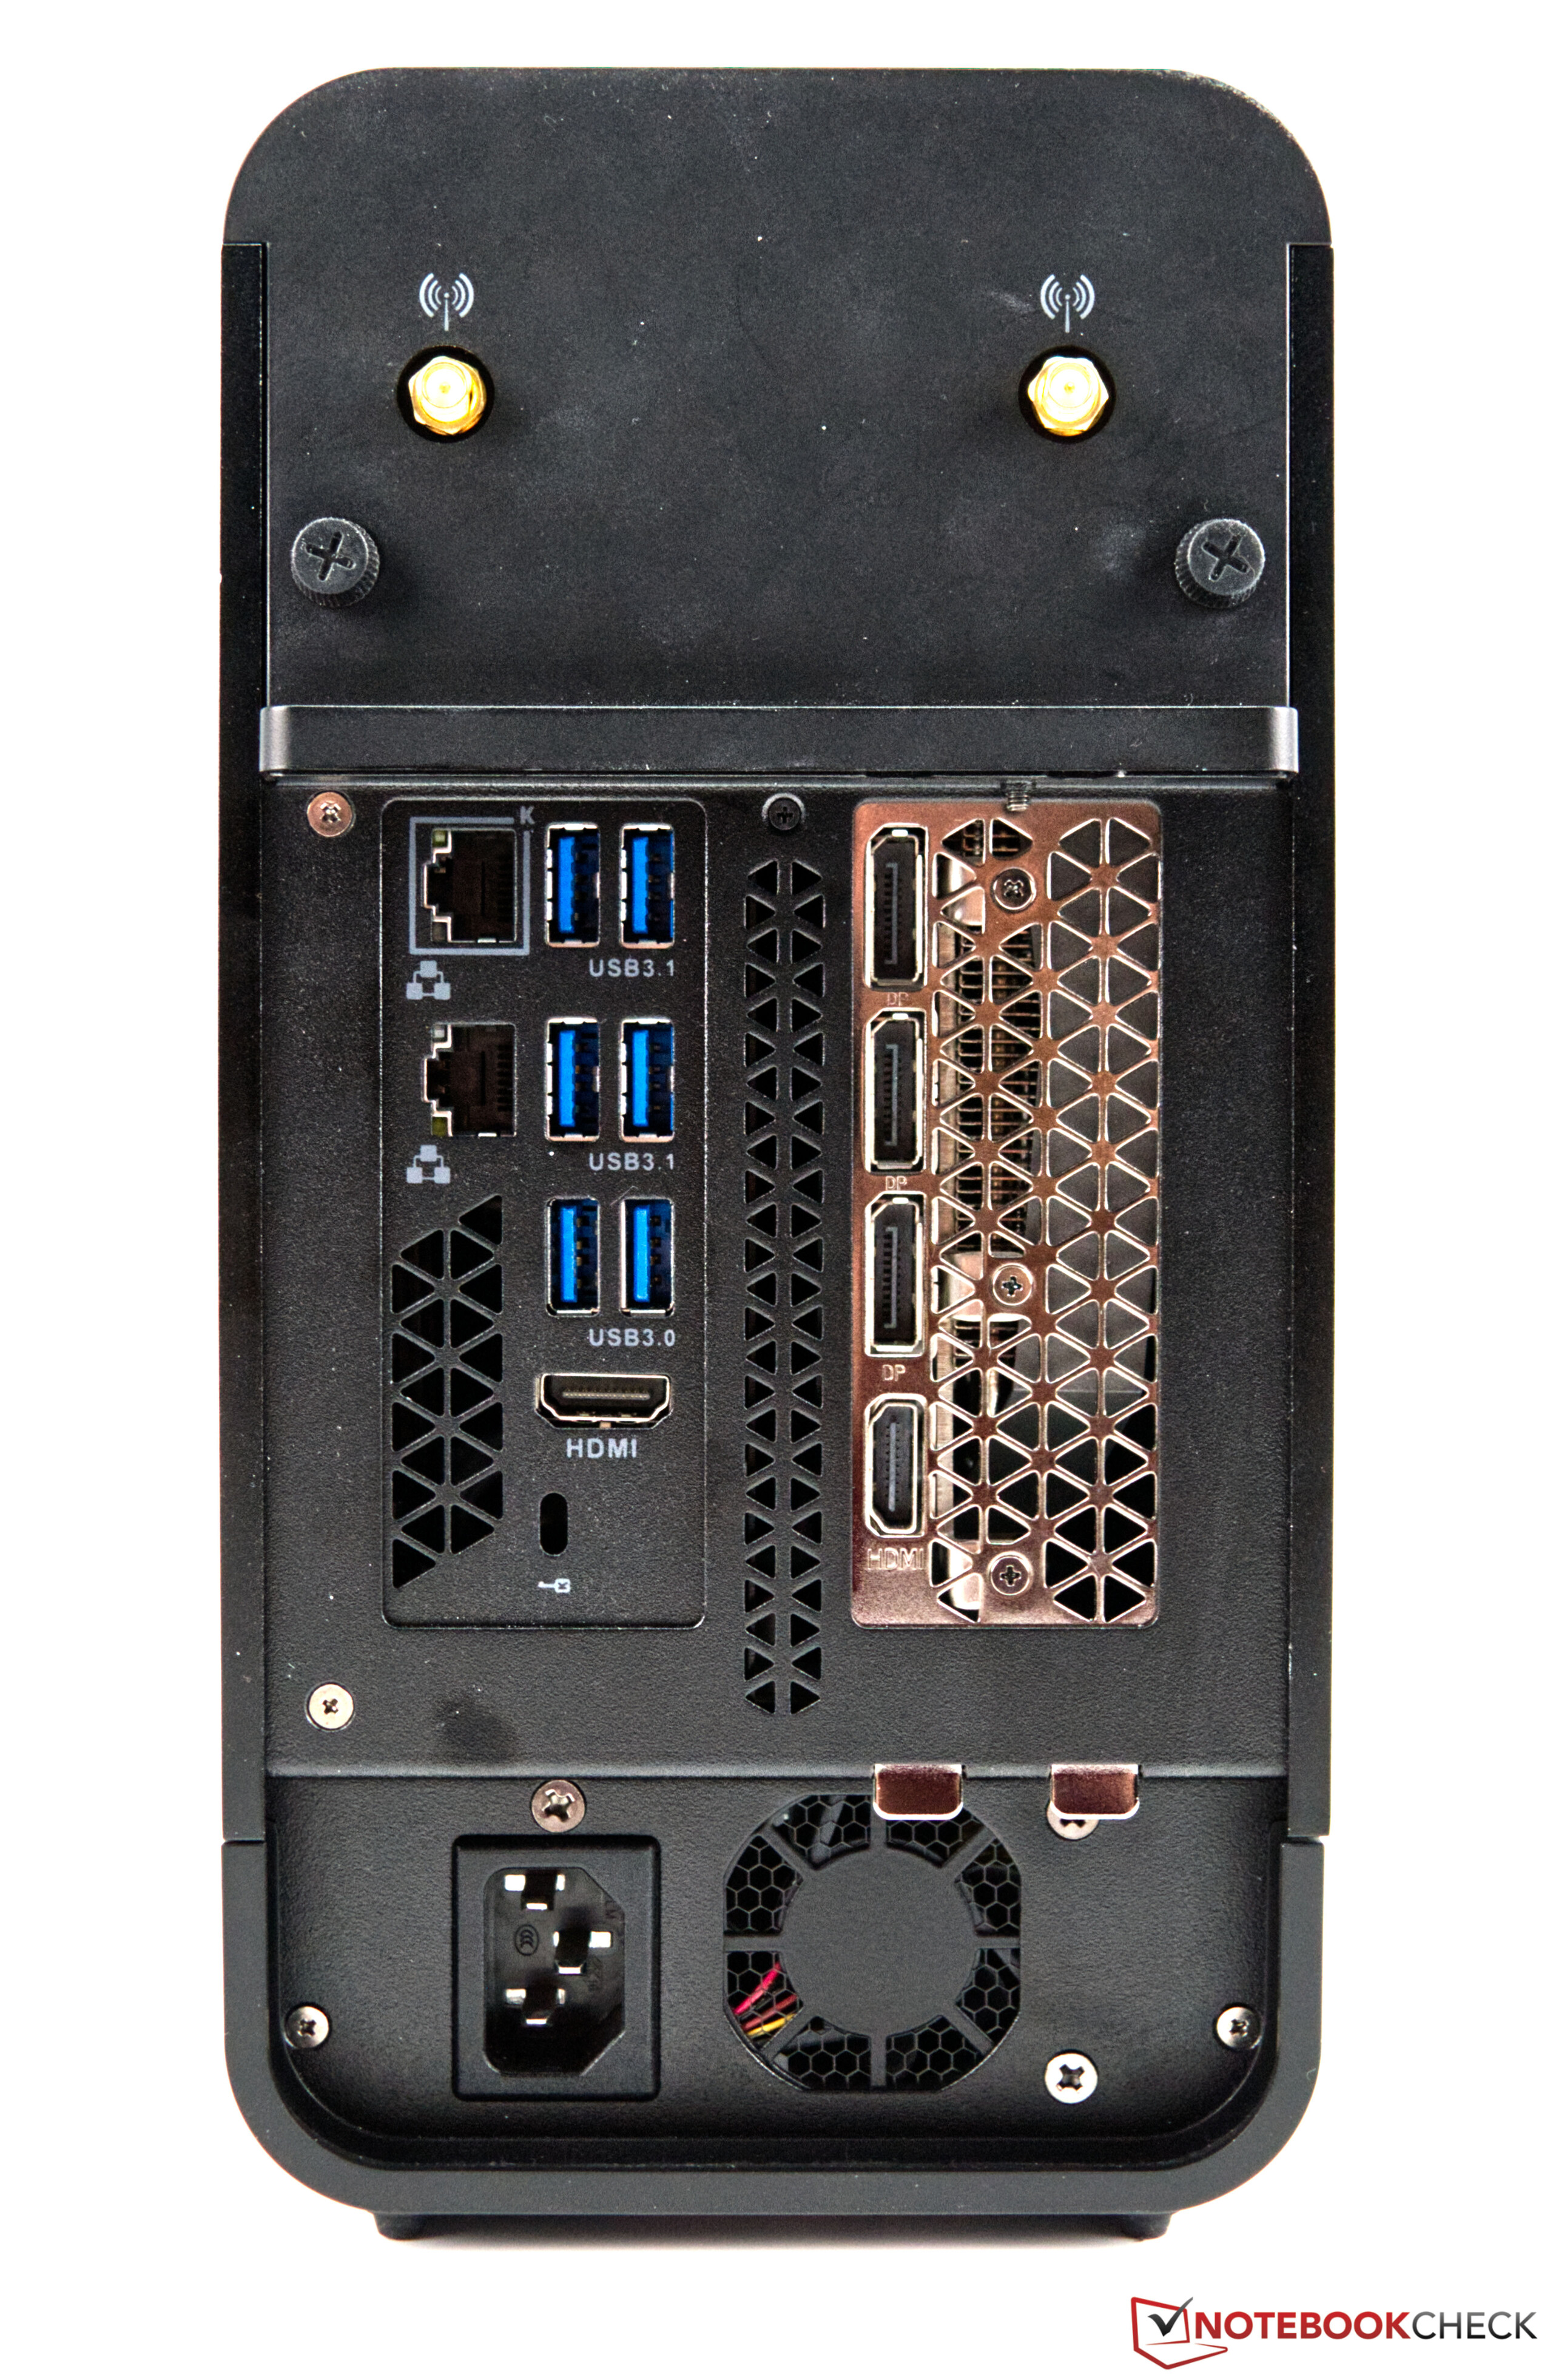
De behuizing van de PC ziet er goed uit zonder veel toeters en bellen, en ook de RGB bril is volledig achterwege gelaten. Dit is niet per se een slechte zaak, want veel gebruikers zijn op zoek naar een sobere case, en Zotac is er met de Magnus One in geslaagd om dit te creëren. Daarnaast is de materiaalkeuze erg goed, aangezien de case grotendeels van metaal is gemaakt. Ook de poortkeuze is veelzijdig, en laat nauwelijks iets te wensen over. Toch moeten we de ietwat opdringerige koeling onder belasting bekritiseren.
Er zijn echter niet veel alternatieven voor de Zotac Magnus One, aangezien populaire fabrikanten zich meestal richten op complete systemen. Ter vergelijking kunt u echter kijken naar de MSI MEG Trident X serie. Deze biedt een vergelijkbare configuratie in een aantrekkelijke en compacte behuizing.

