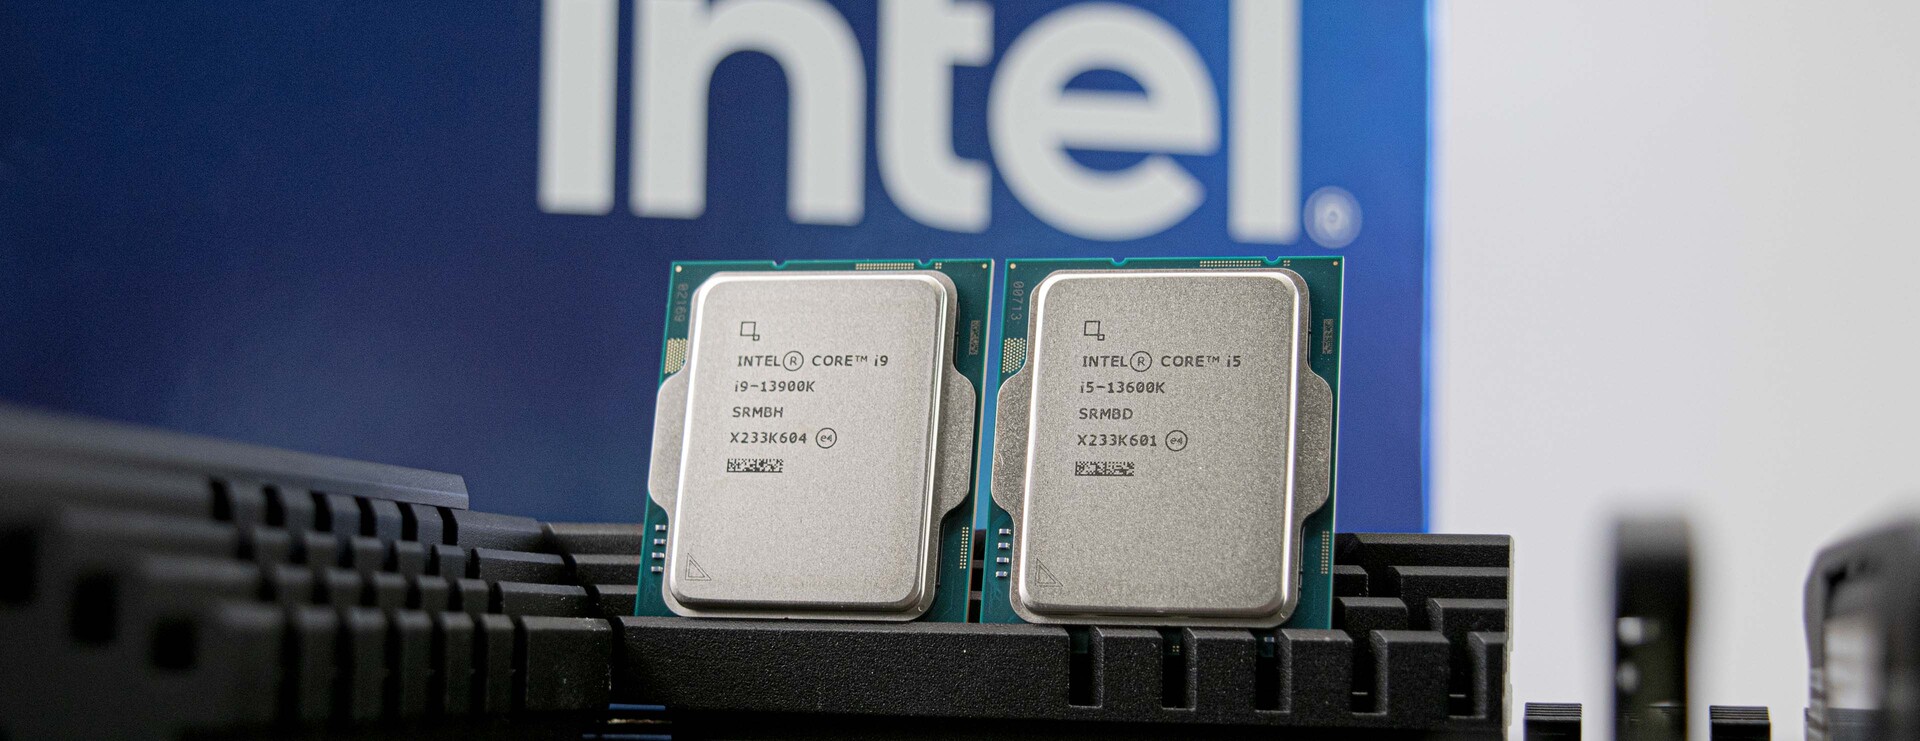
Intel Core i9-13900K en Intel Core i5-13600K review: Meer cores en een hogere kloksnelheid met Raptor Lake
Met de introductie van hybride CPU's in de desktop arena, kon Intel vorig jaar scoren met een aanzienlijke prestatiesprong. Voor het eerst heeft hetAlder Lake platformp- en E-kernen gebruikt om de prestatieverdeling te verbeteren. AMD volgt een andere aanpak met zijn chiplet architectuur en weet op dit punt ook zeer goede prestaties neer te zetten. Met de onlangs geïntroduceerde Zen 4-processoren wist AMD opnieuw een aanzienlijke prestatieverhoging te realiseren. Raptor Lake moet dit nu goedmaken en Intel in staat stellen de prestatiekroon terug te winnen.
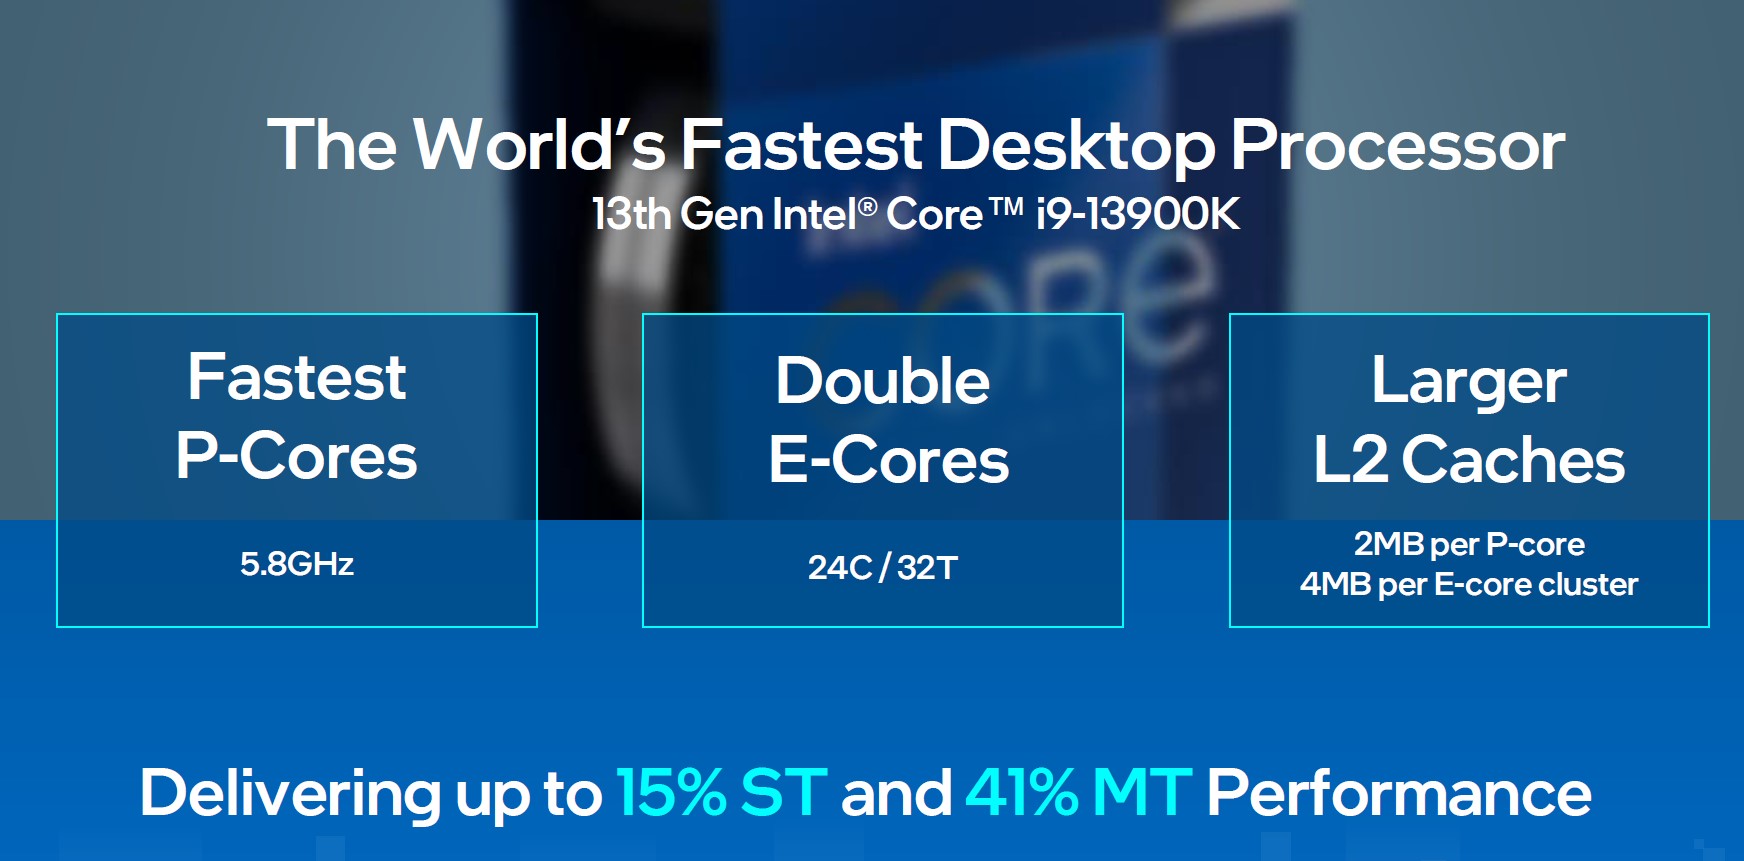
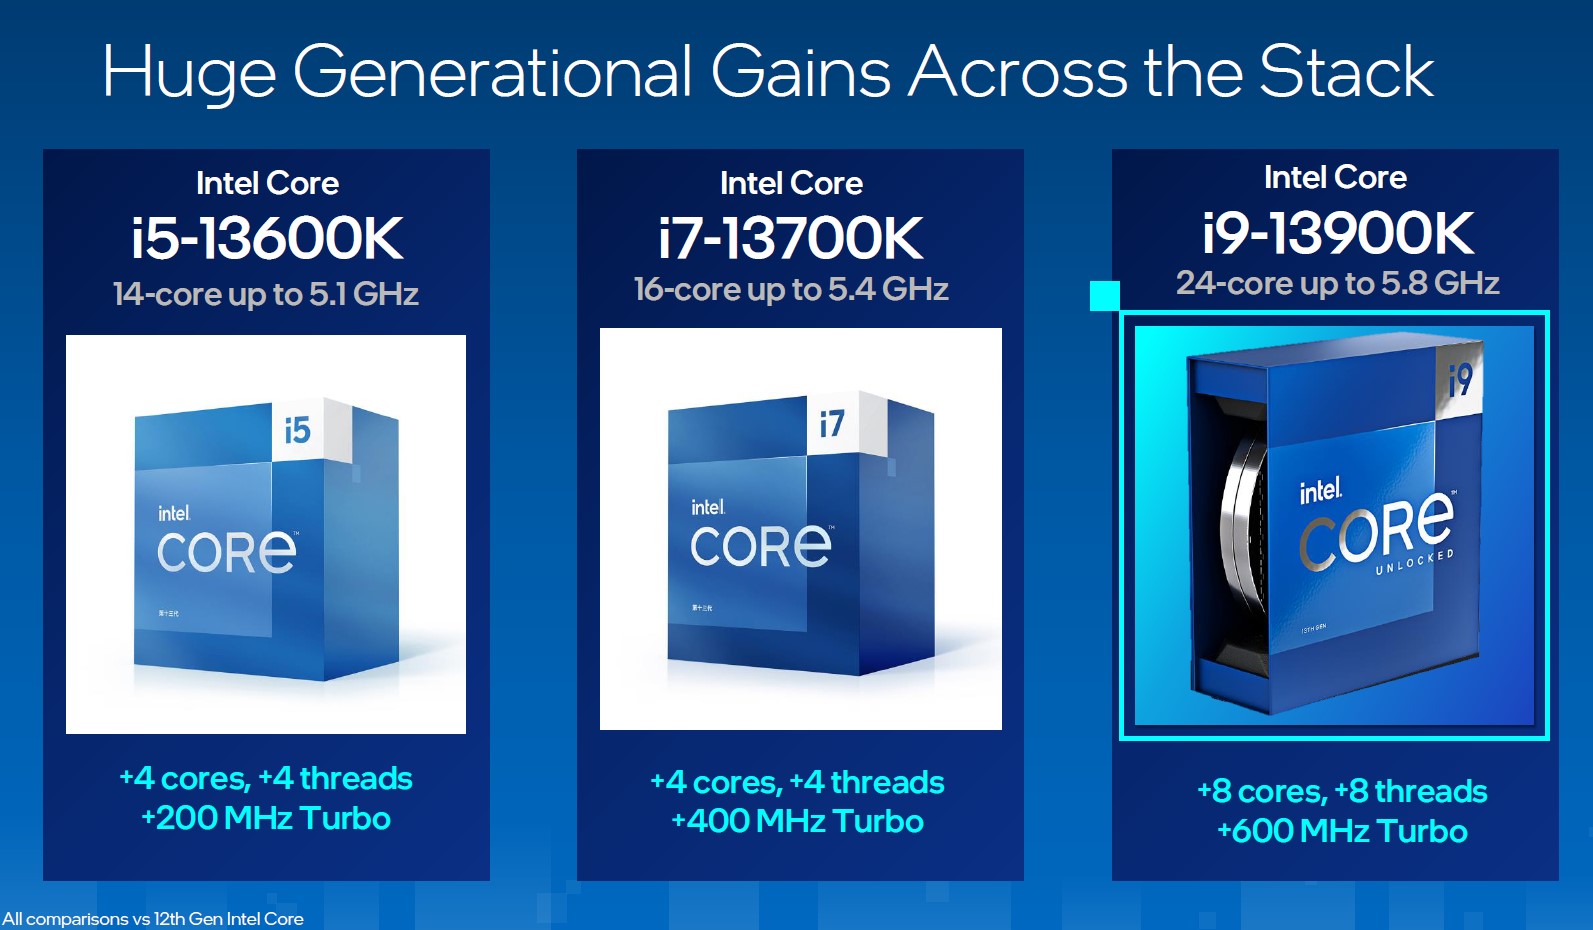
Intel blijft in deze generatie in principe trouw aan de 1700 socket. Er zijn echter nog tal van veranderingen die bij elkaar opgeteld resulteren in een head-to-head race met AMD's Ryzen 9 7950X. Zo is er een aanzienlijk grotere cache en zijn er in totaal meer threads en opnieuw ontworpen P-kernen met een hogere IPC. Daarnaast heeft Intel de Turbo met maximaal 600 MHz verhoogd tot een maximum van 5,8 GHz. Die veranderingen gelden voor de hele line-up van de nieuwe Raptor Lake-serie.
We zetten de belangrijkste vertegenwoordigers van de nieuwe Raptor Lake S familie voor je op een rijtje in de onderstaande grafiek.
Hoewel Intel qua prijs de Alder Lake serie volgt, zullen de prijzen van de nieuwe processoren door de huidige zwakke Euro-to-US Dollar wisselkoers subjectief duurder lijken.
13e generatie Intel Core-processoren in één oogopslag
| Model | Kernen / Threads |
Kloksnelheid P Core / Turbo | Kloksnelheid E Core / Turbo | Cache L2 + L3 | Graphics | PBP | MTB | Prijs (MSRP) |
| Core i9-13900K | 16 (8P + 16E) /32 | 3,0 GHz / 5,8 GHz | 2,2 GHz / 4,3 GHz | 32 + 36 MB | UHD 770 | 125 Watt | 253 Watt | $589 |
| Core i9-13900KF | 16 (8P + 16E) /32 | 3,0 GHz / 5,8 GHz | 2,2 GHz / 4,3 GHz | 32 + 36 MB | - | 125 Watt | 253 Watt | $564 |
| Core i9-12900K | 16 (8P + 8E) /24 | 3,2 GHz / 5,1 GHz | 2,4 GHz / 3,9 GHz | 14 + 30 MB | UHD 770 | 125 Watt | 241 Watt | $589 |
| Core i9-12900KF | 16 (8P + 8E) /24 | 3,2 GHz / 5,1 GHz | 2,4 GHz / 3,9 GHz | 14 + 30 MB | - | 125 Watt | 241 Watt | $564 |
| Core i7-13700K | 16 (8P + 8E) /24 | 3,4 GHz / 5,4 GHz | 2,5 GHz / 4,2 GHz | 24 + 30 MB | UHD 770 | 125 Watt | 253 Watt | $409 |
| Core i7-13700KF | 16 (8P + 8E) /24 | 3,4 GHz / 5,4 GHz | 2,5 GHz / 4,2 GHz | 24 + 30 MB | - | 125 Watt | 253 Watt | $384 |
| Core i7-12700K | 12 (8P + 4E) /20 | 3,6 GHz / 4,9 GHz | 2,7 GHz / 3,8 GHz | 12 + 25 MB | UHD 770 | 125 Watt | 190 Watt | $409 |
| Core i7-12700KF | 12 (8P + 4E) /20 | 3,6 GHz / 4,9 GHz | 2,7 GHz / 3,8 GHz | 12 + 25 MB | - | 125 Watt | 190 Watt | $384 |
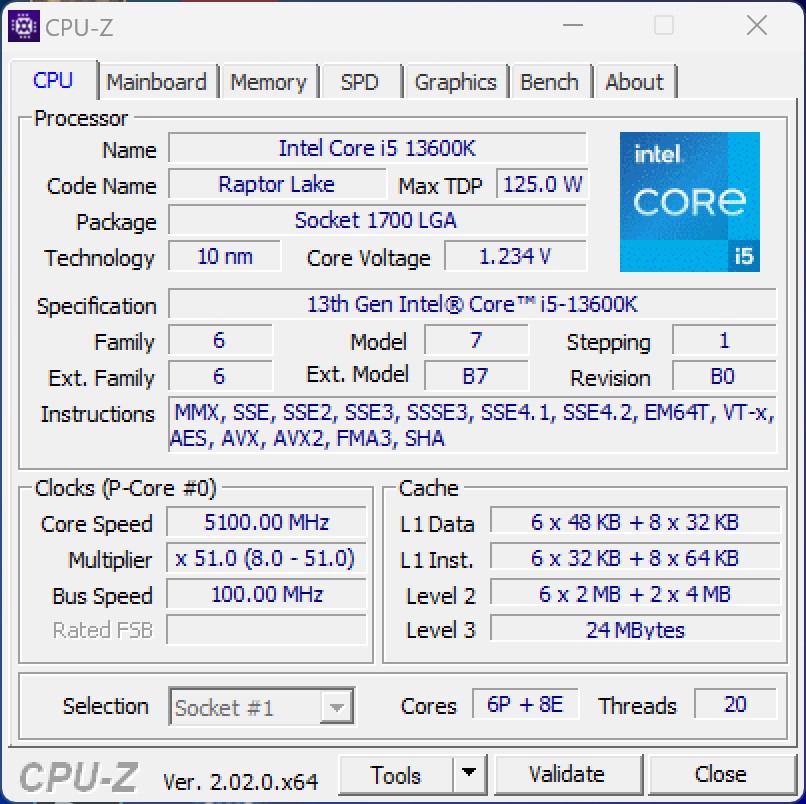
| Core i5-13600K | 14 (6P + 8E) /20 | 3,5 GHz / 5,1 GHz | 2,6 GHz / 3,9 GHz | 20 + 24 MB | UHD 770 | 125 Watt | 181 Watt | $319 |
| Core i5-13600KF | 14 (6P + 8E) /20 | 3,5 GHz / 5,1 GHz | 2,6 GHz / 3,9 GHz | 20 + 24 MB | - | 125 Watt | 181 Watt | $294 |
| Core i5-12600K | 10 (6P + 4E) /16 | 3,7 GHz / 4,9 GHz | 2,8 GHz / 3,6 GHz | 9,5 + 20 MB | UHD 770 | 125 Watt | 150 Watt | $289 |
| Core i5-12600KF | 10 (6P + 4E) /16 | 3,7 GHz / 4,9 GHz | 2,8 GHz / 3,6 GHz | 9,5 + 20 MB | - | 125 Watt | 150 Watt | $264 |
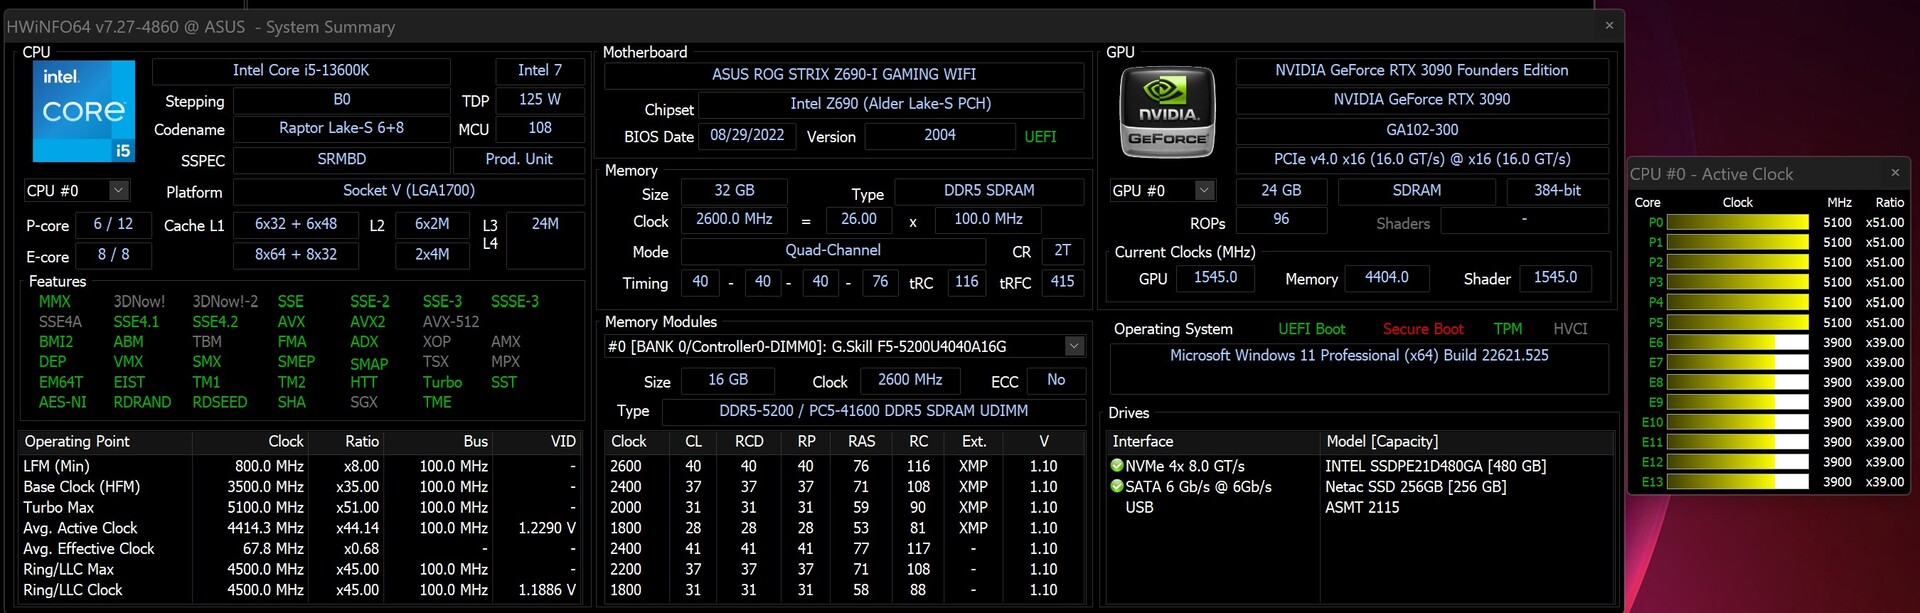
Details van ons testsysteem
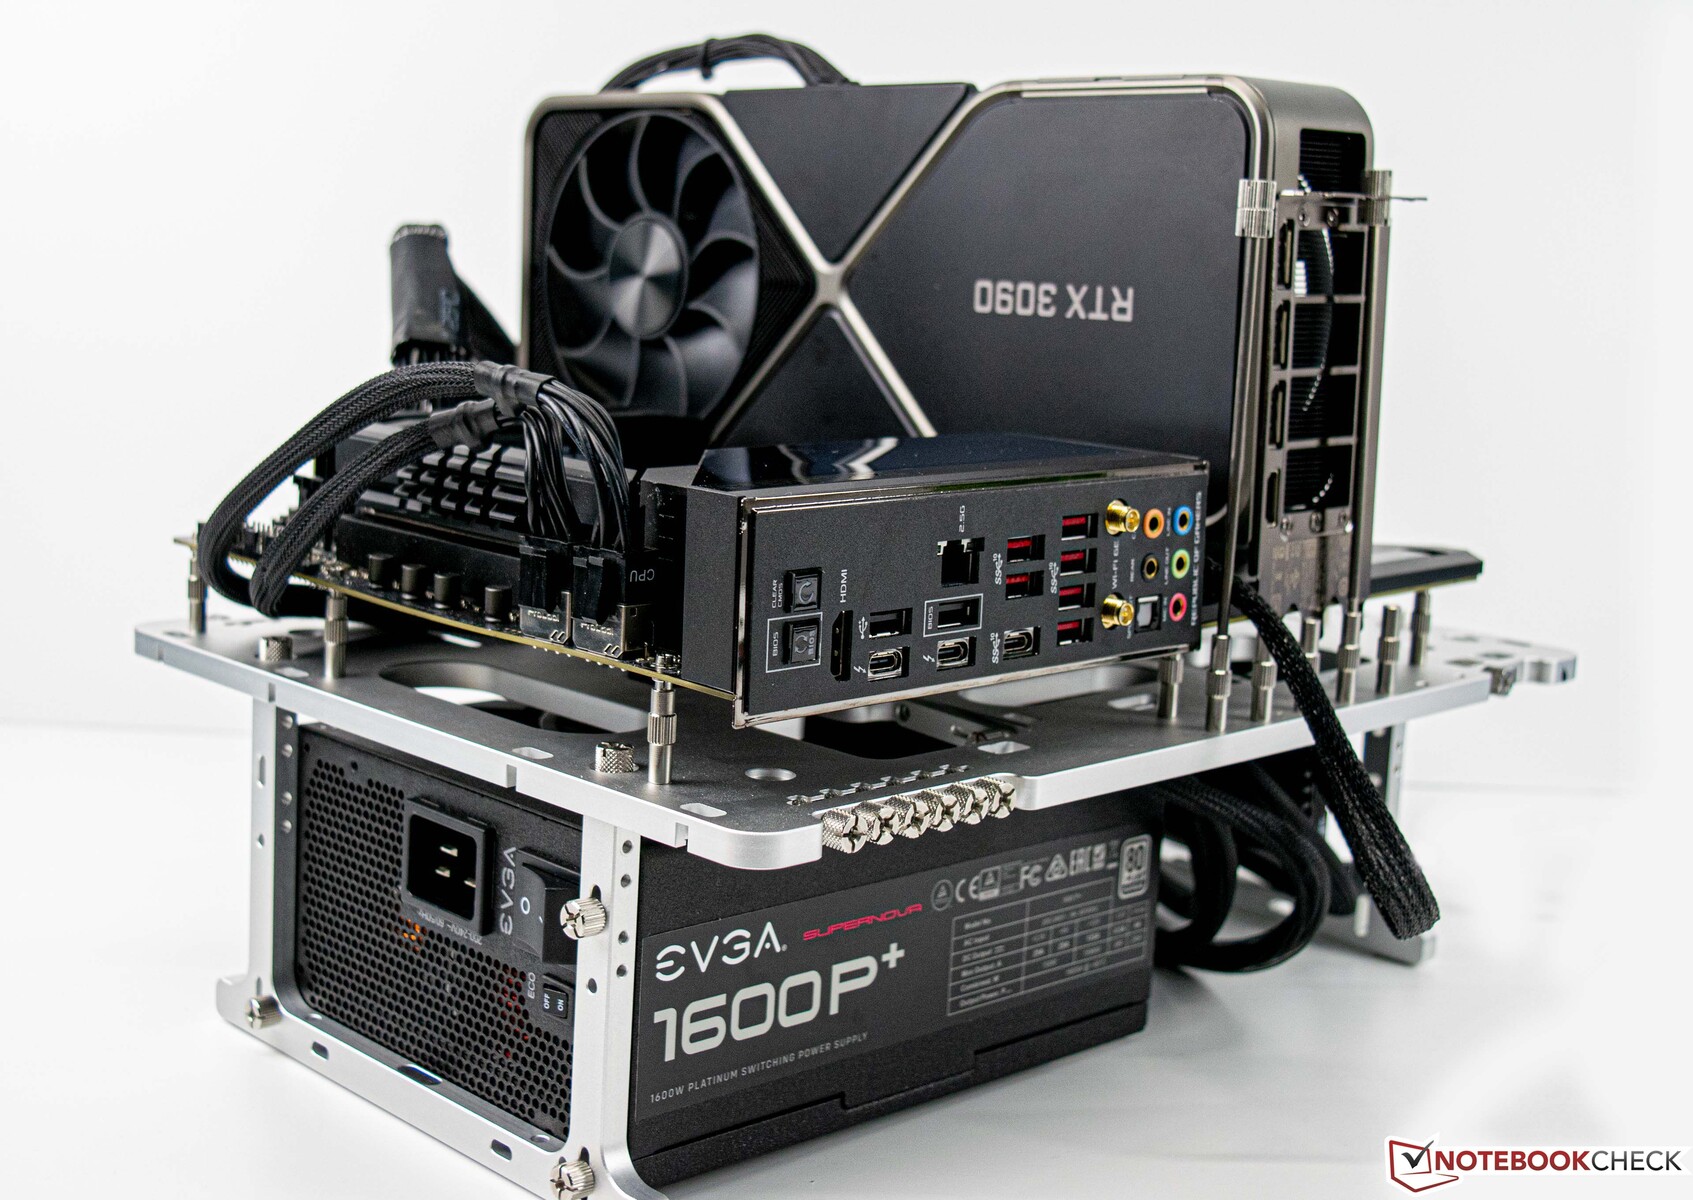
We gebruiken het volgende systeem voor de onderstaande benchmarks en tests:
- Streacom BC1 V2 Open Benchtafel
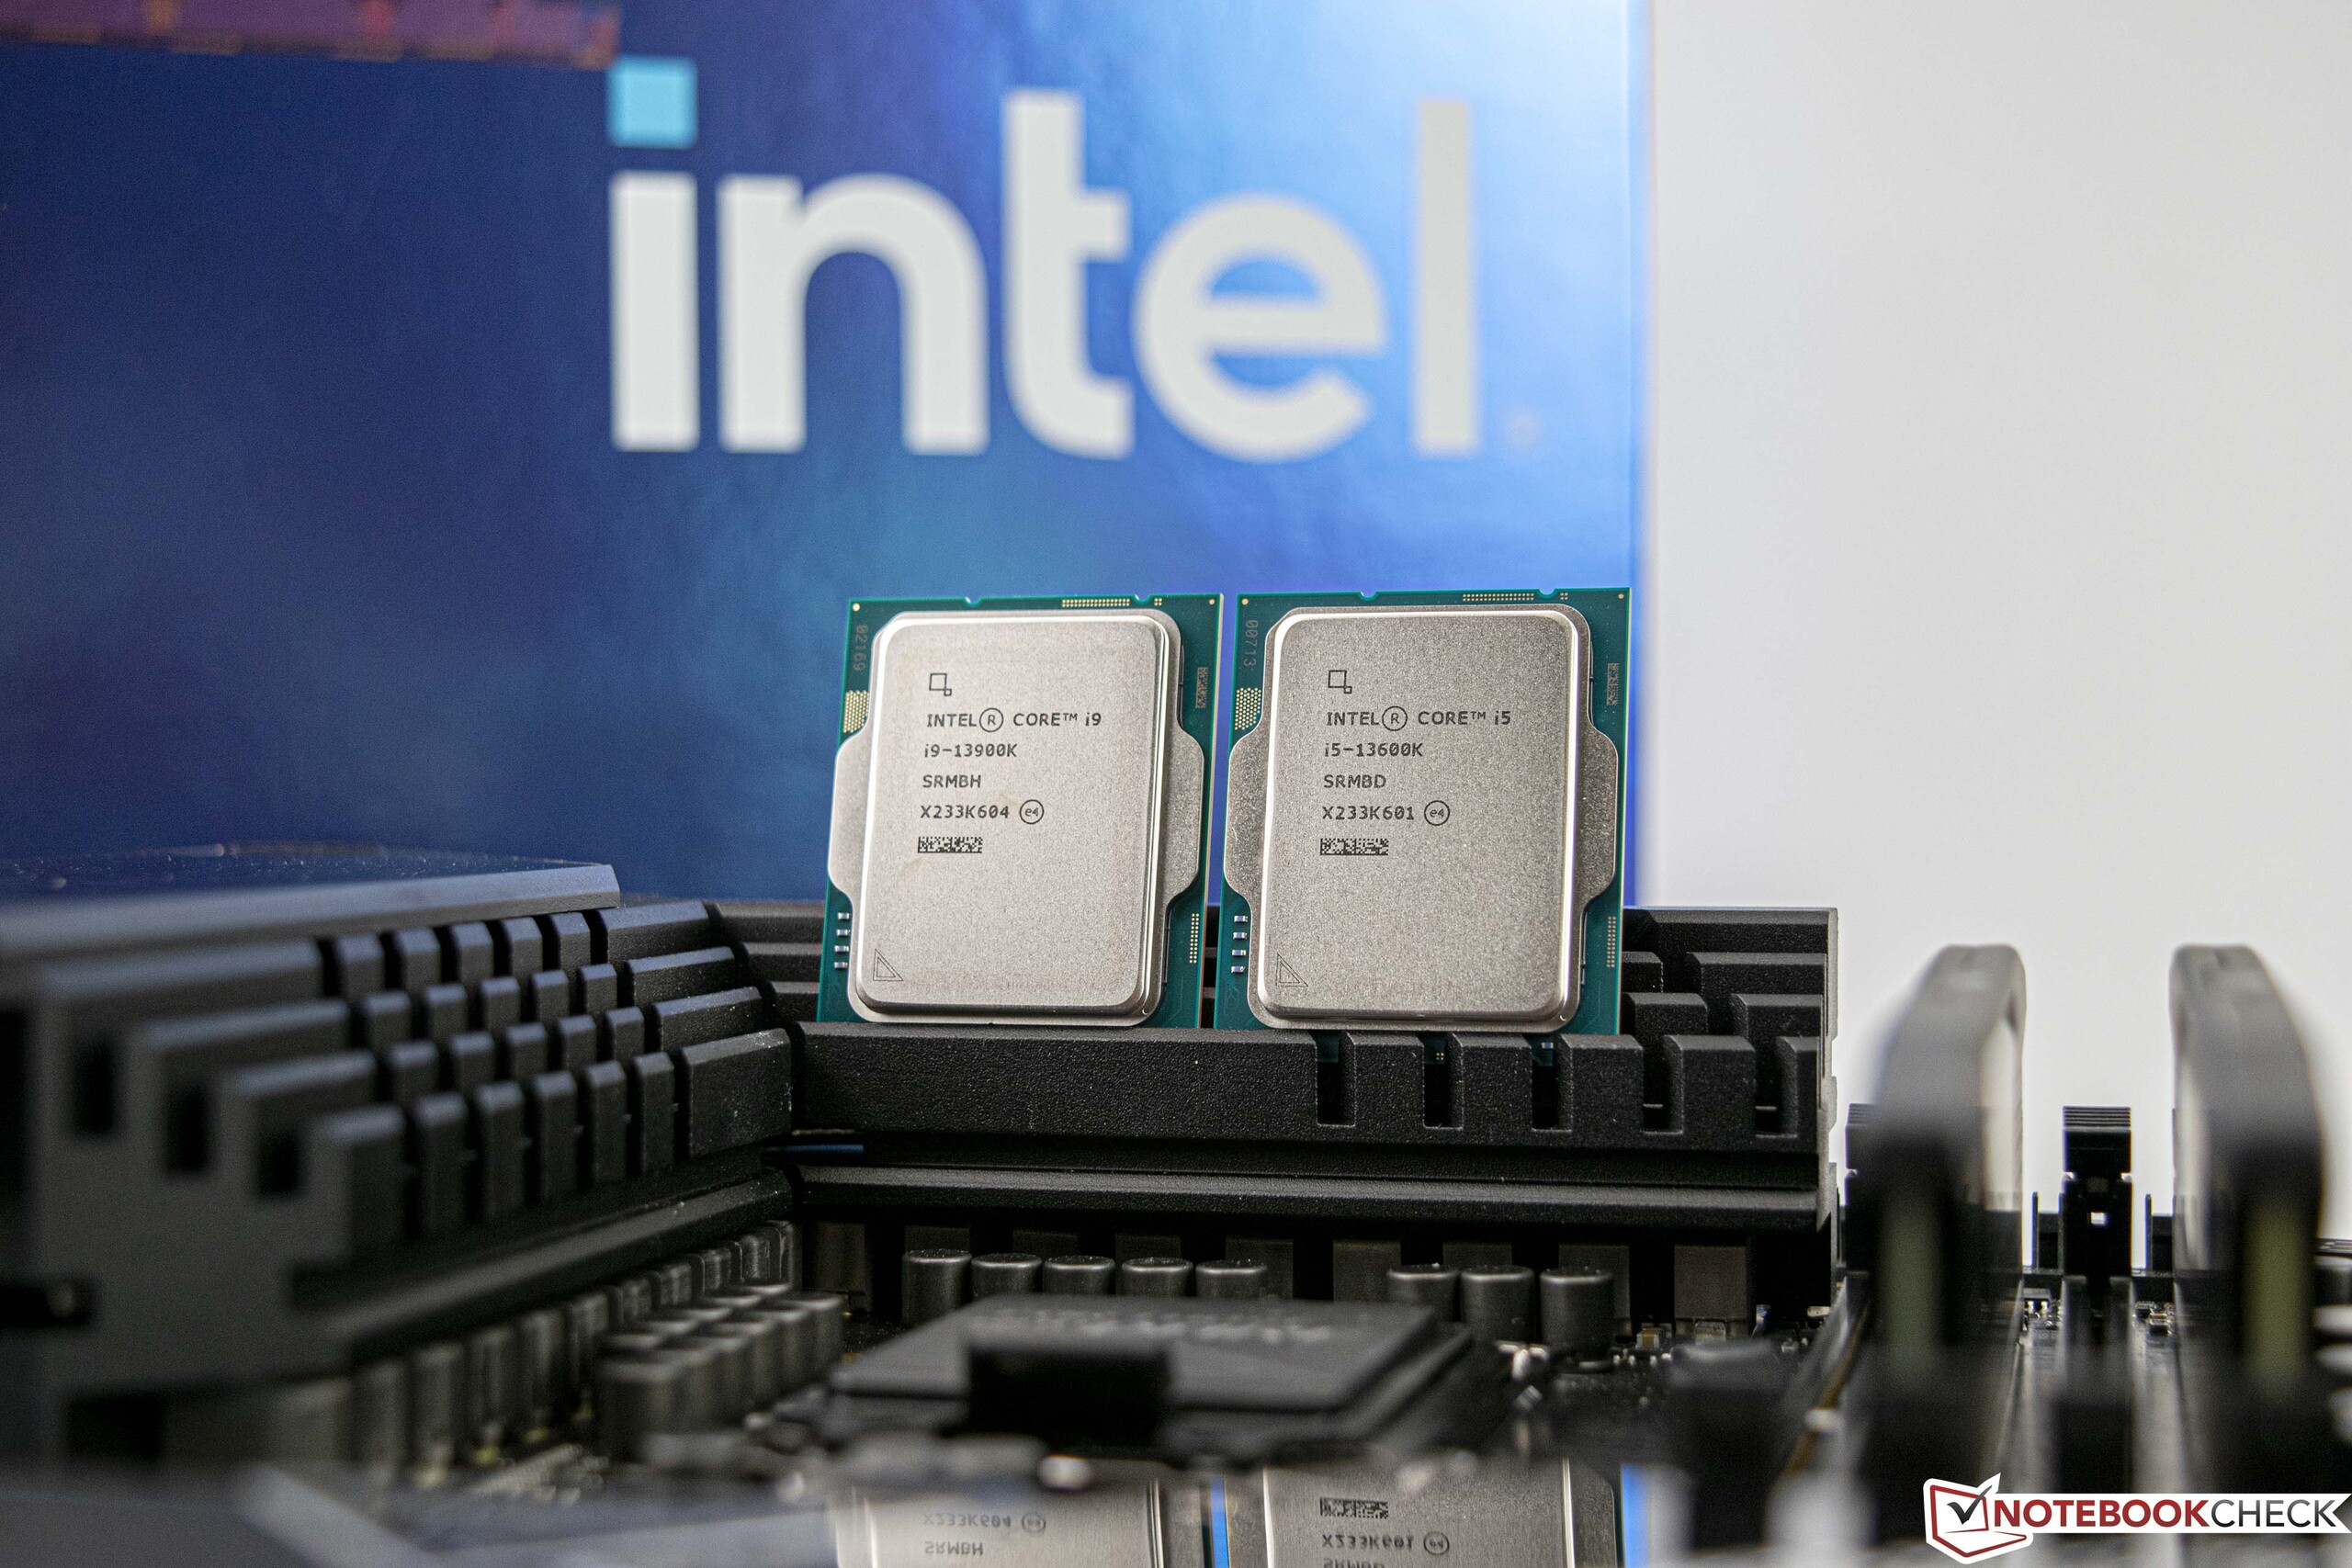
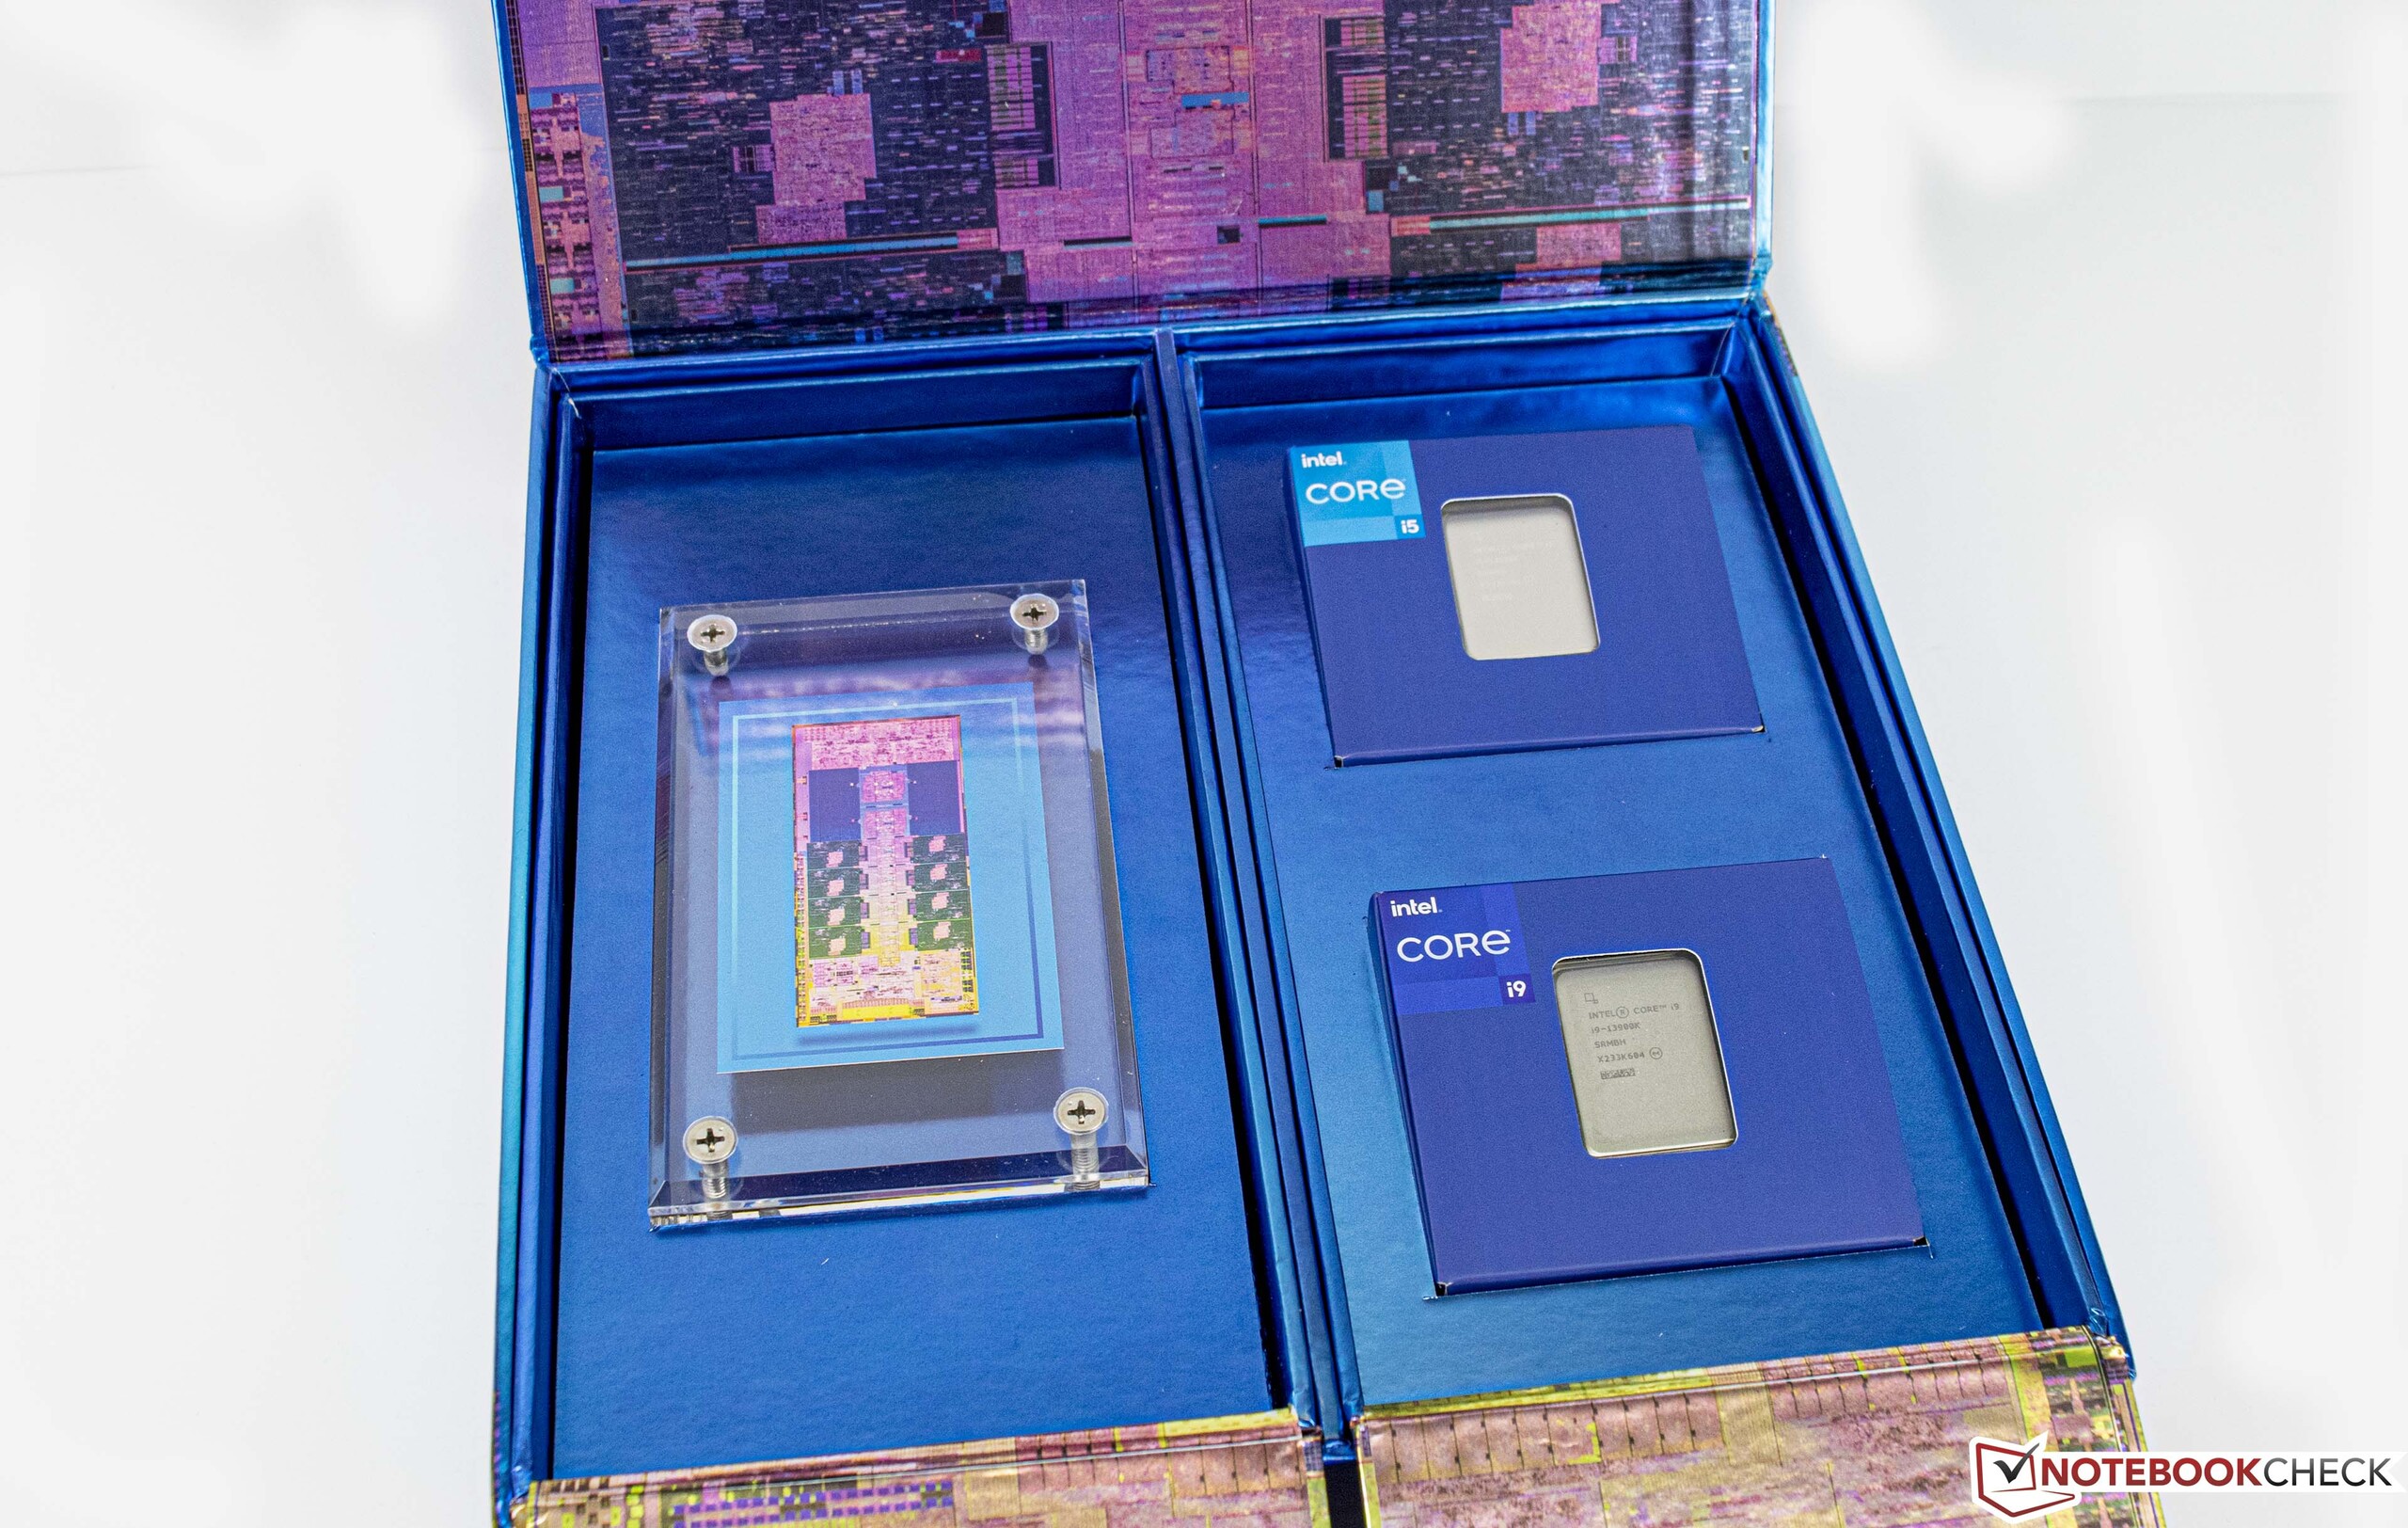
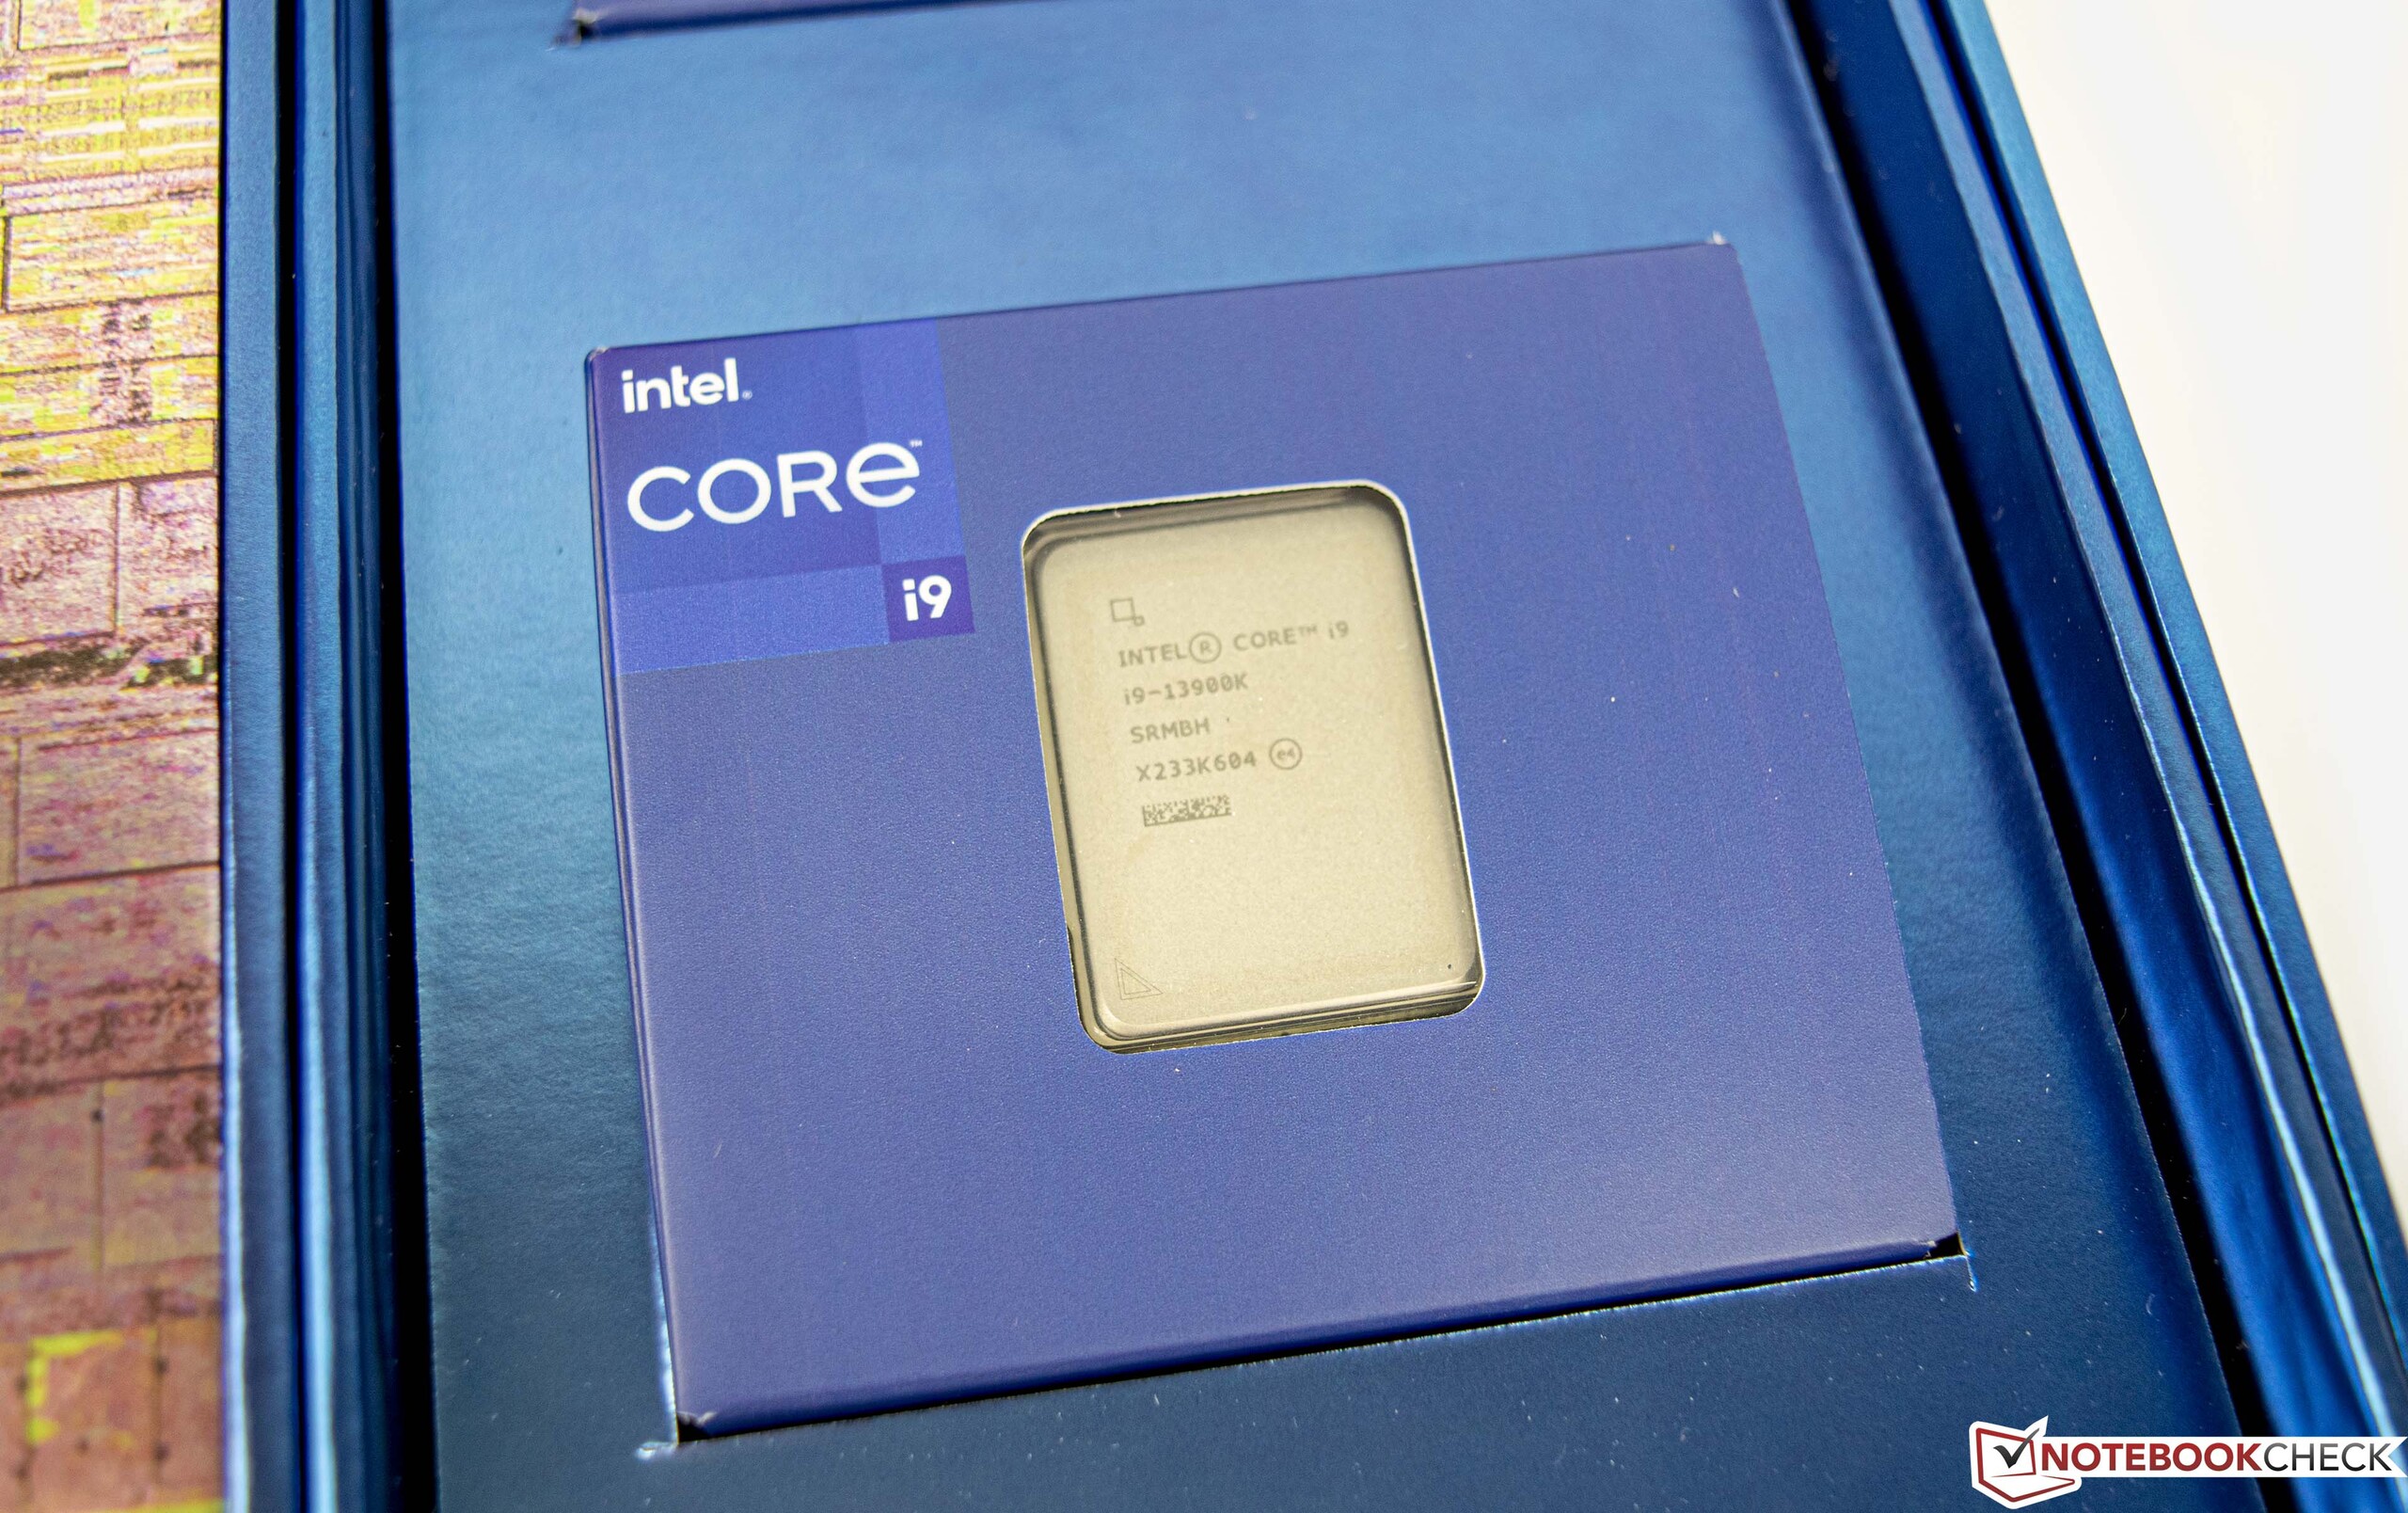
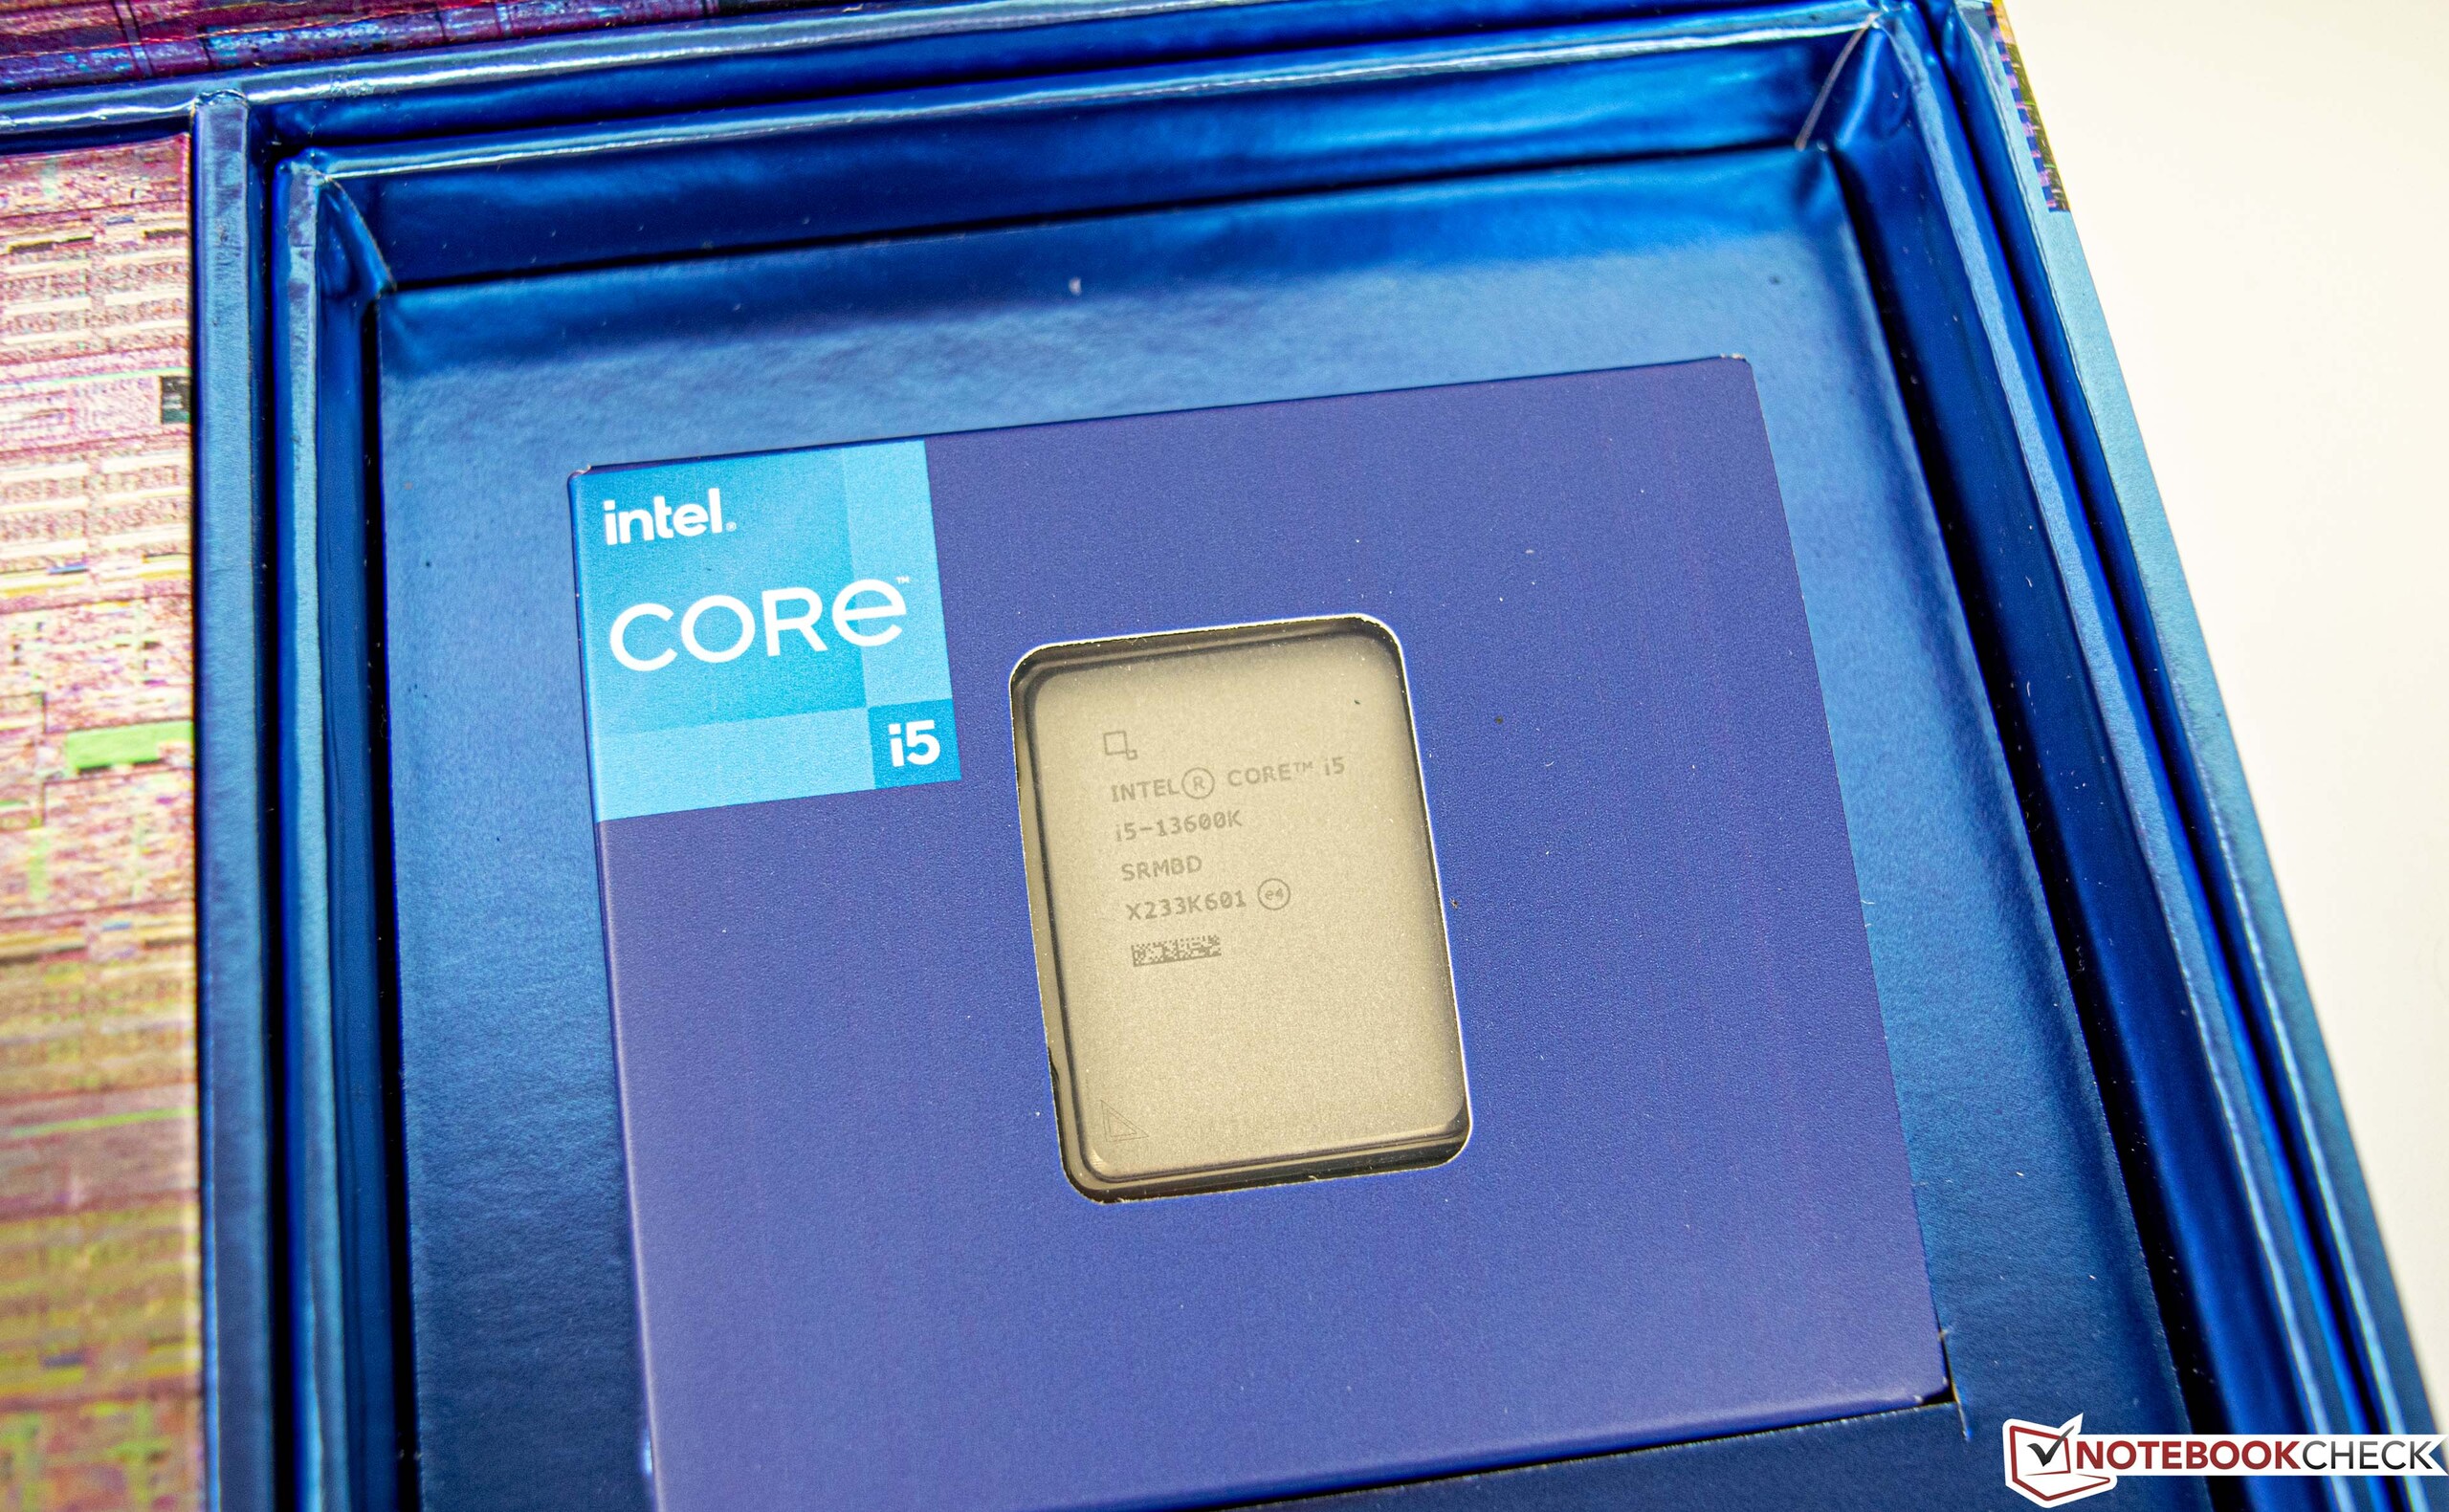
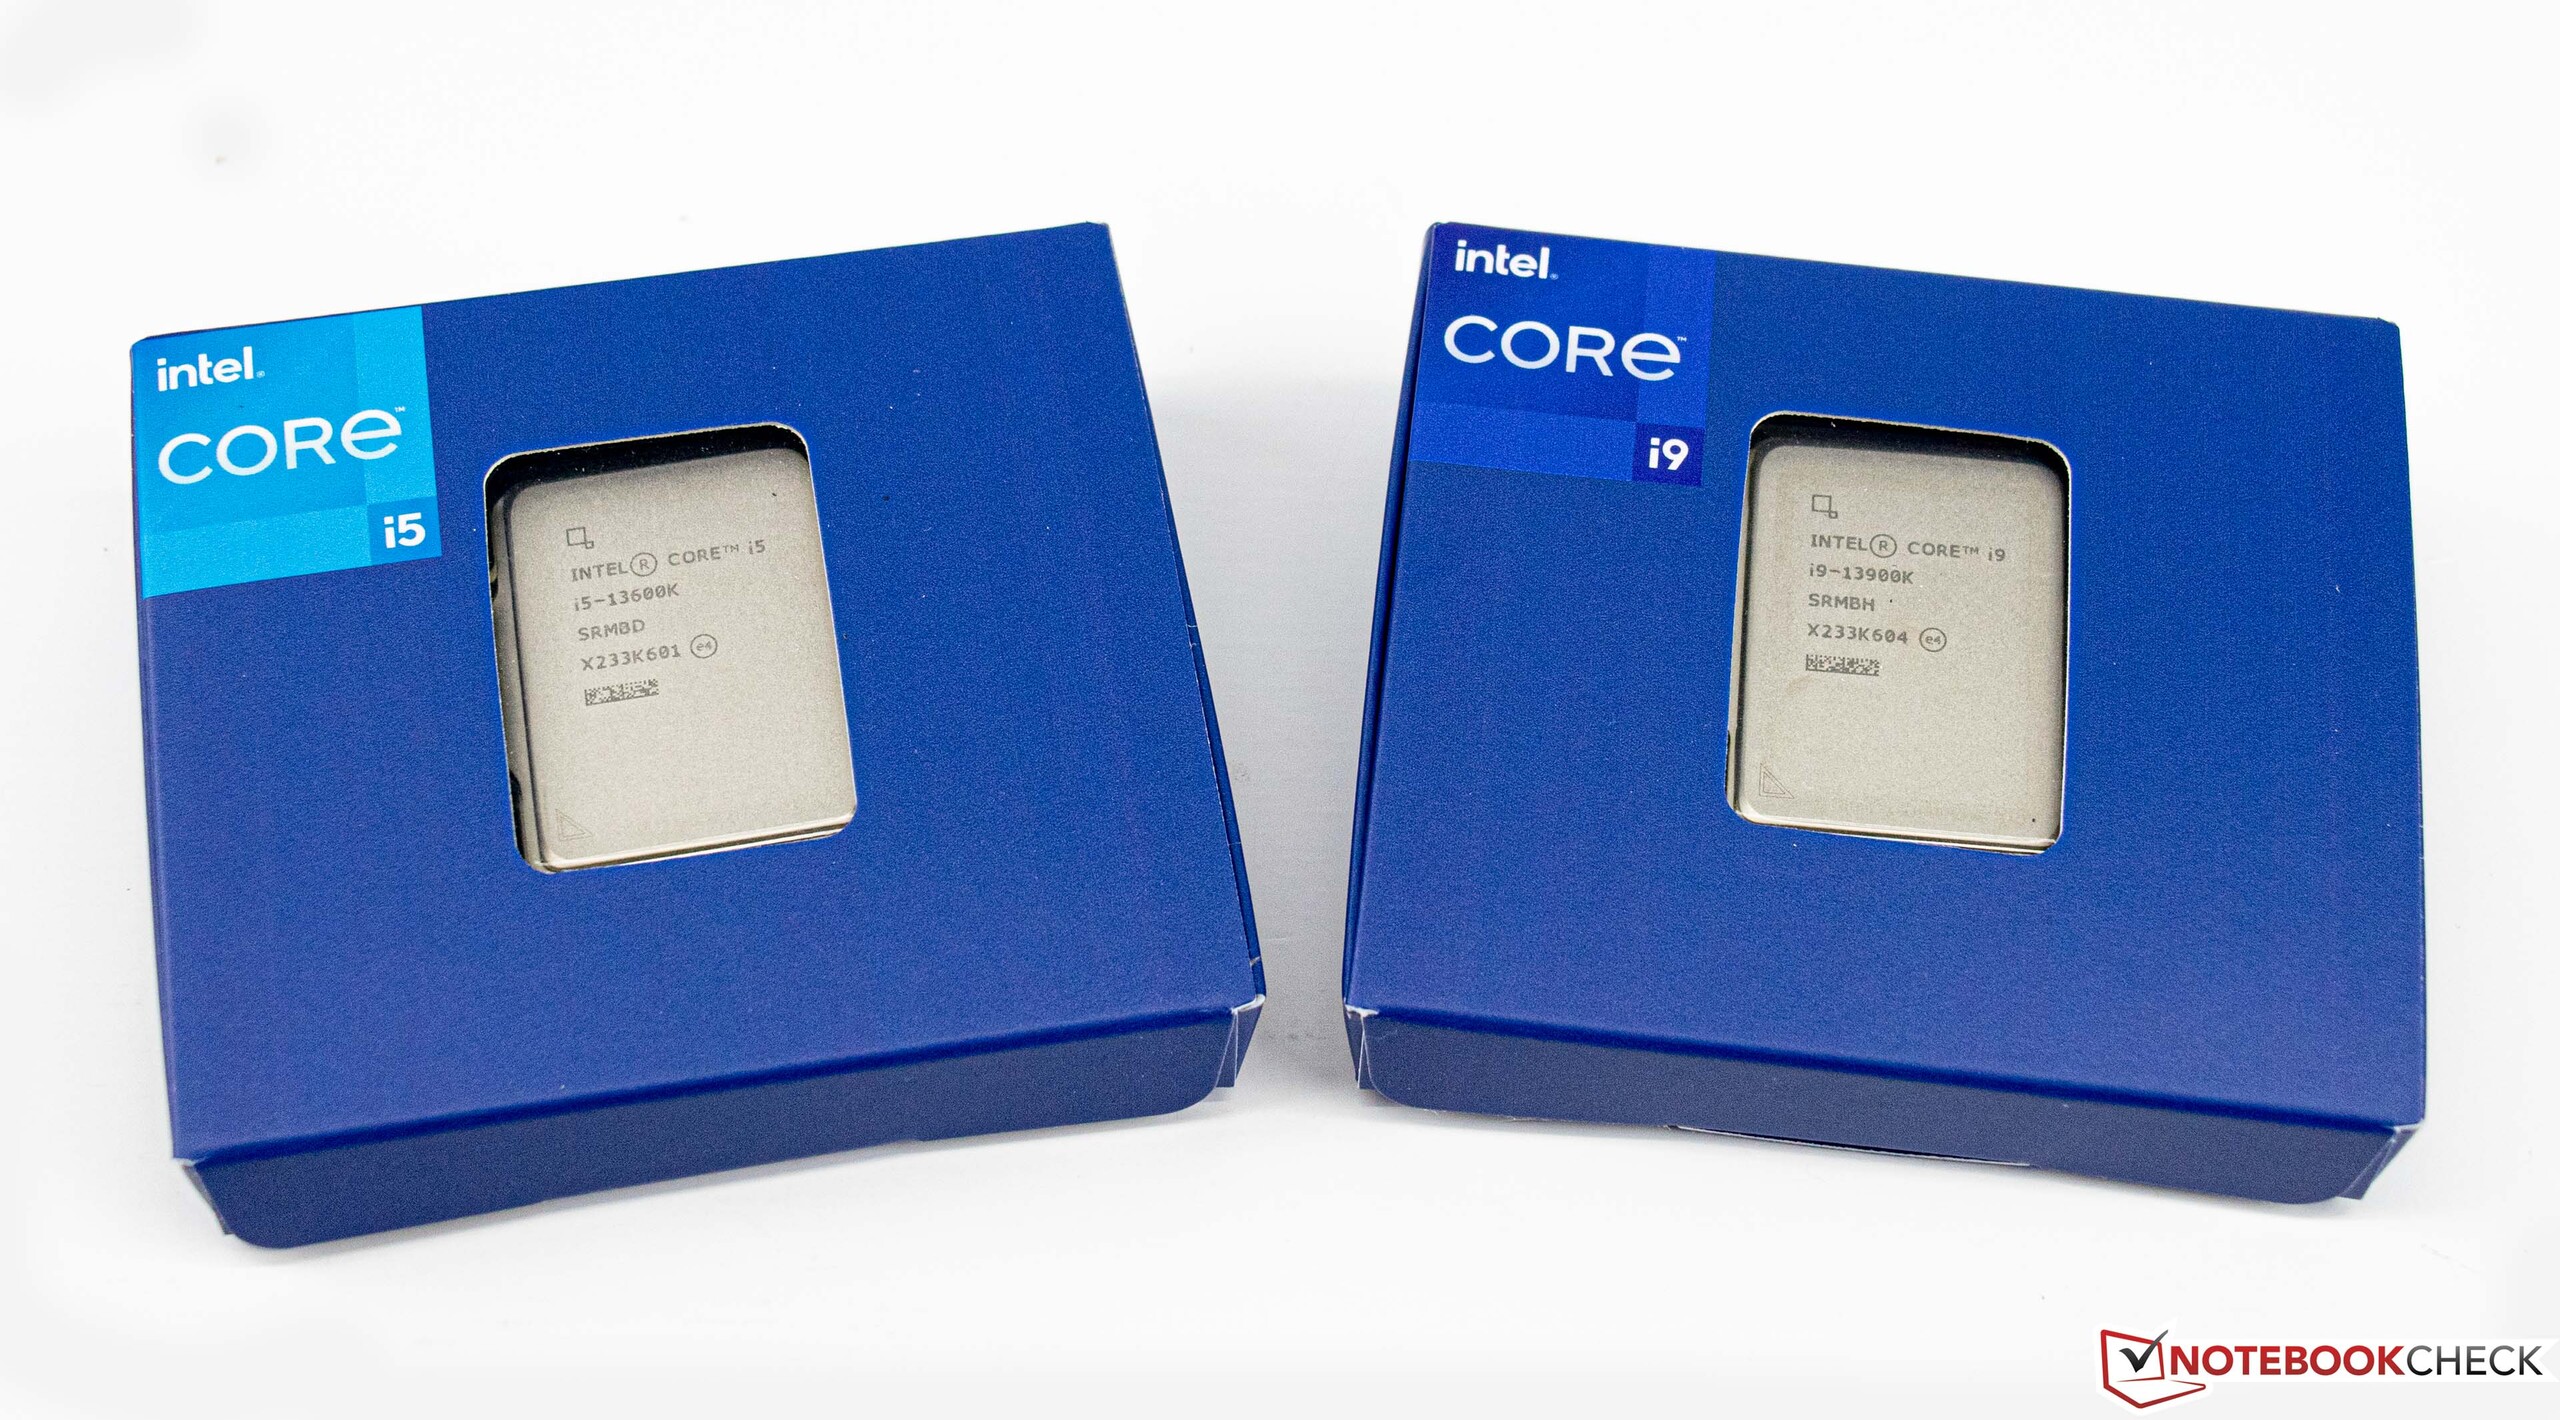
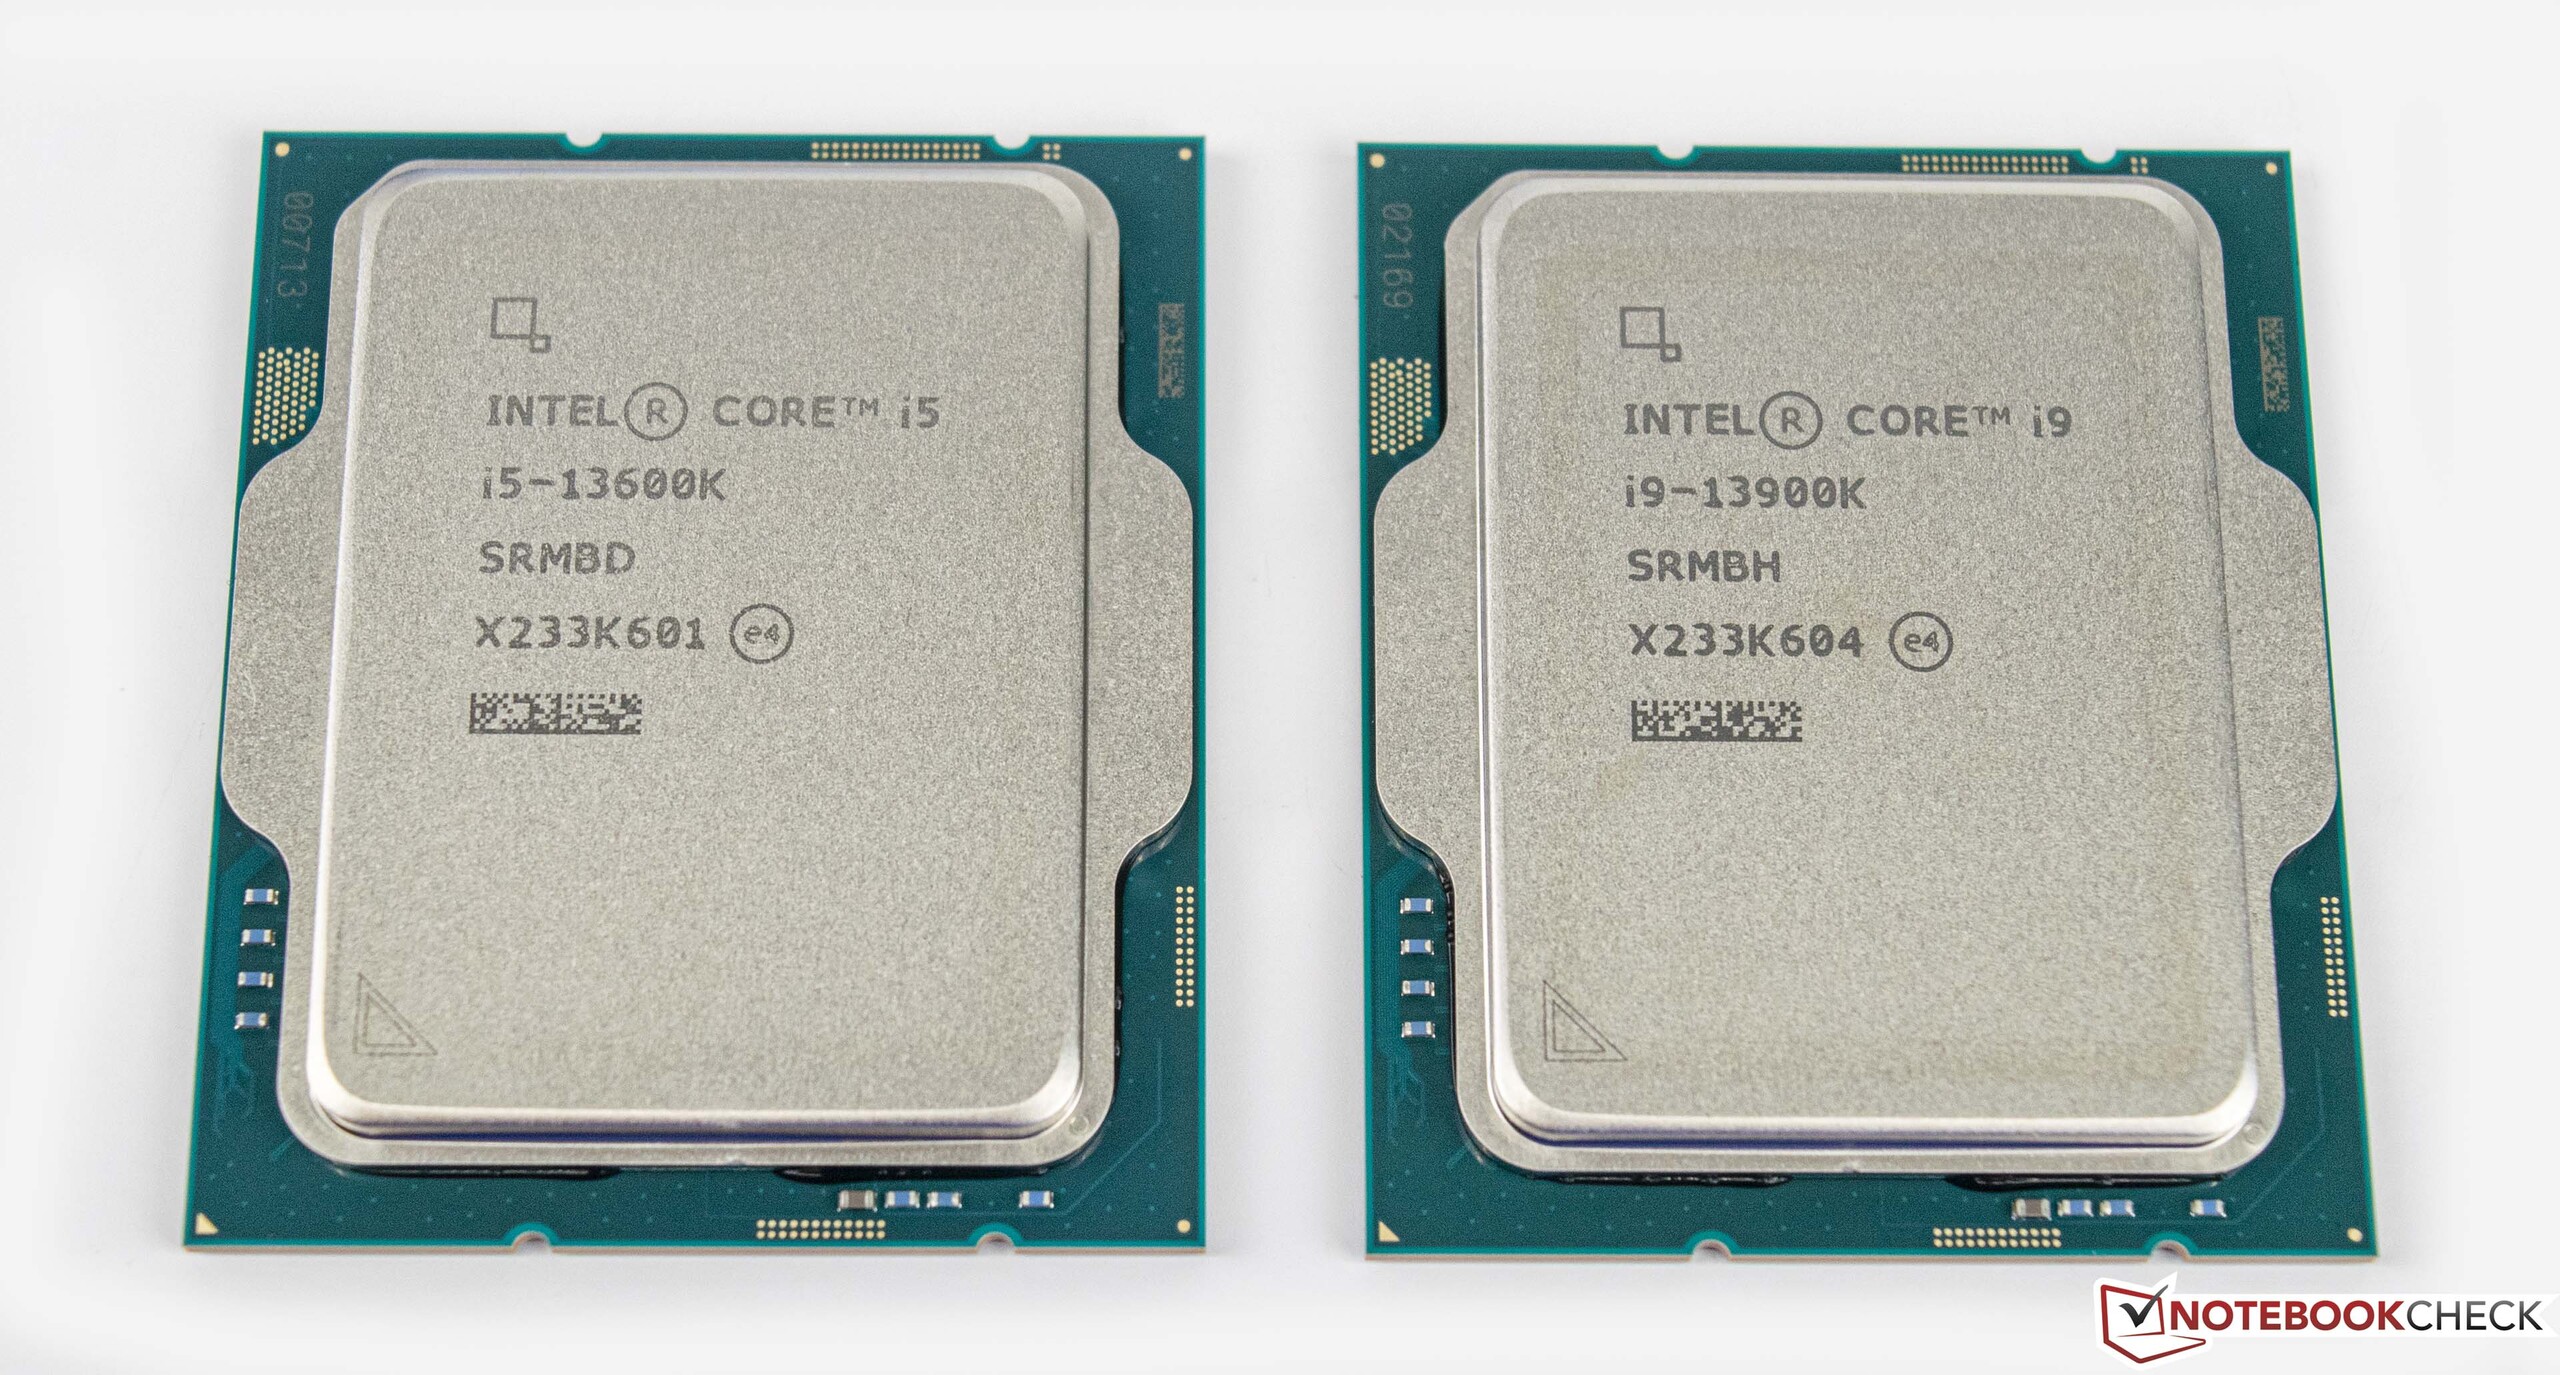
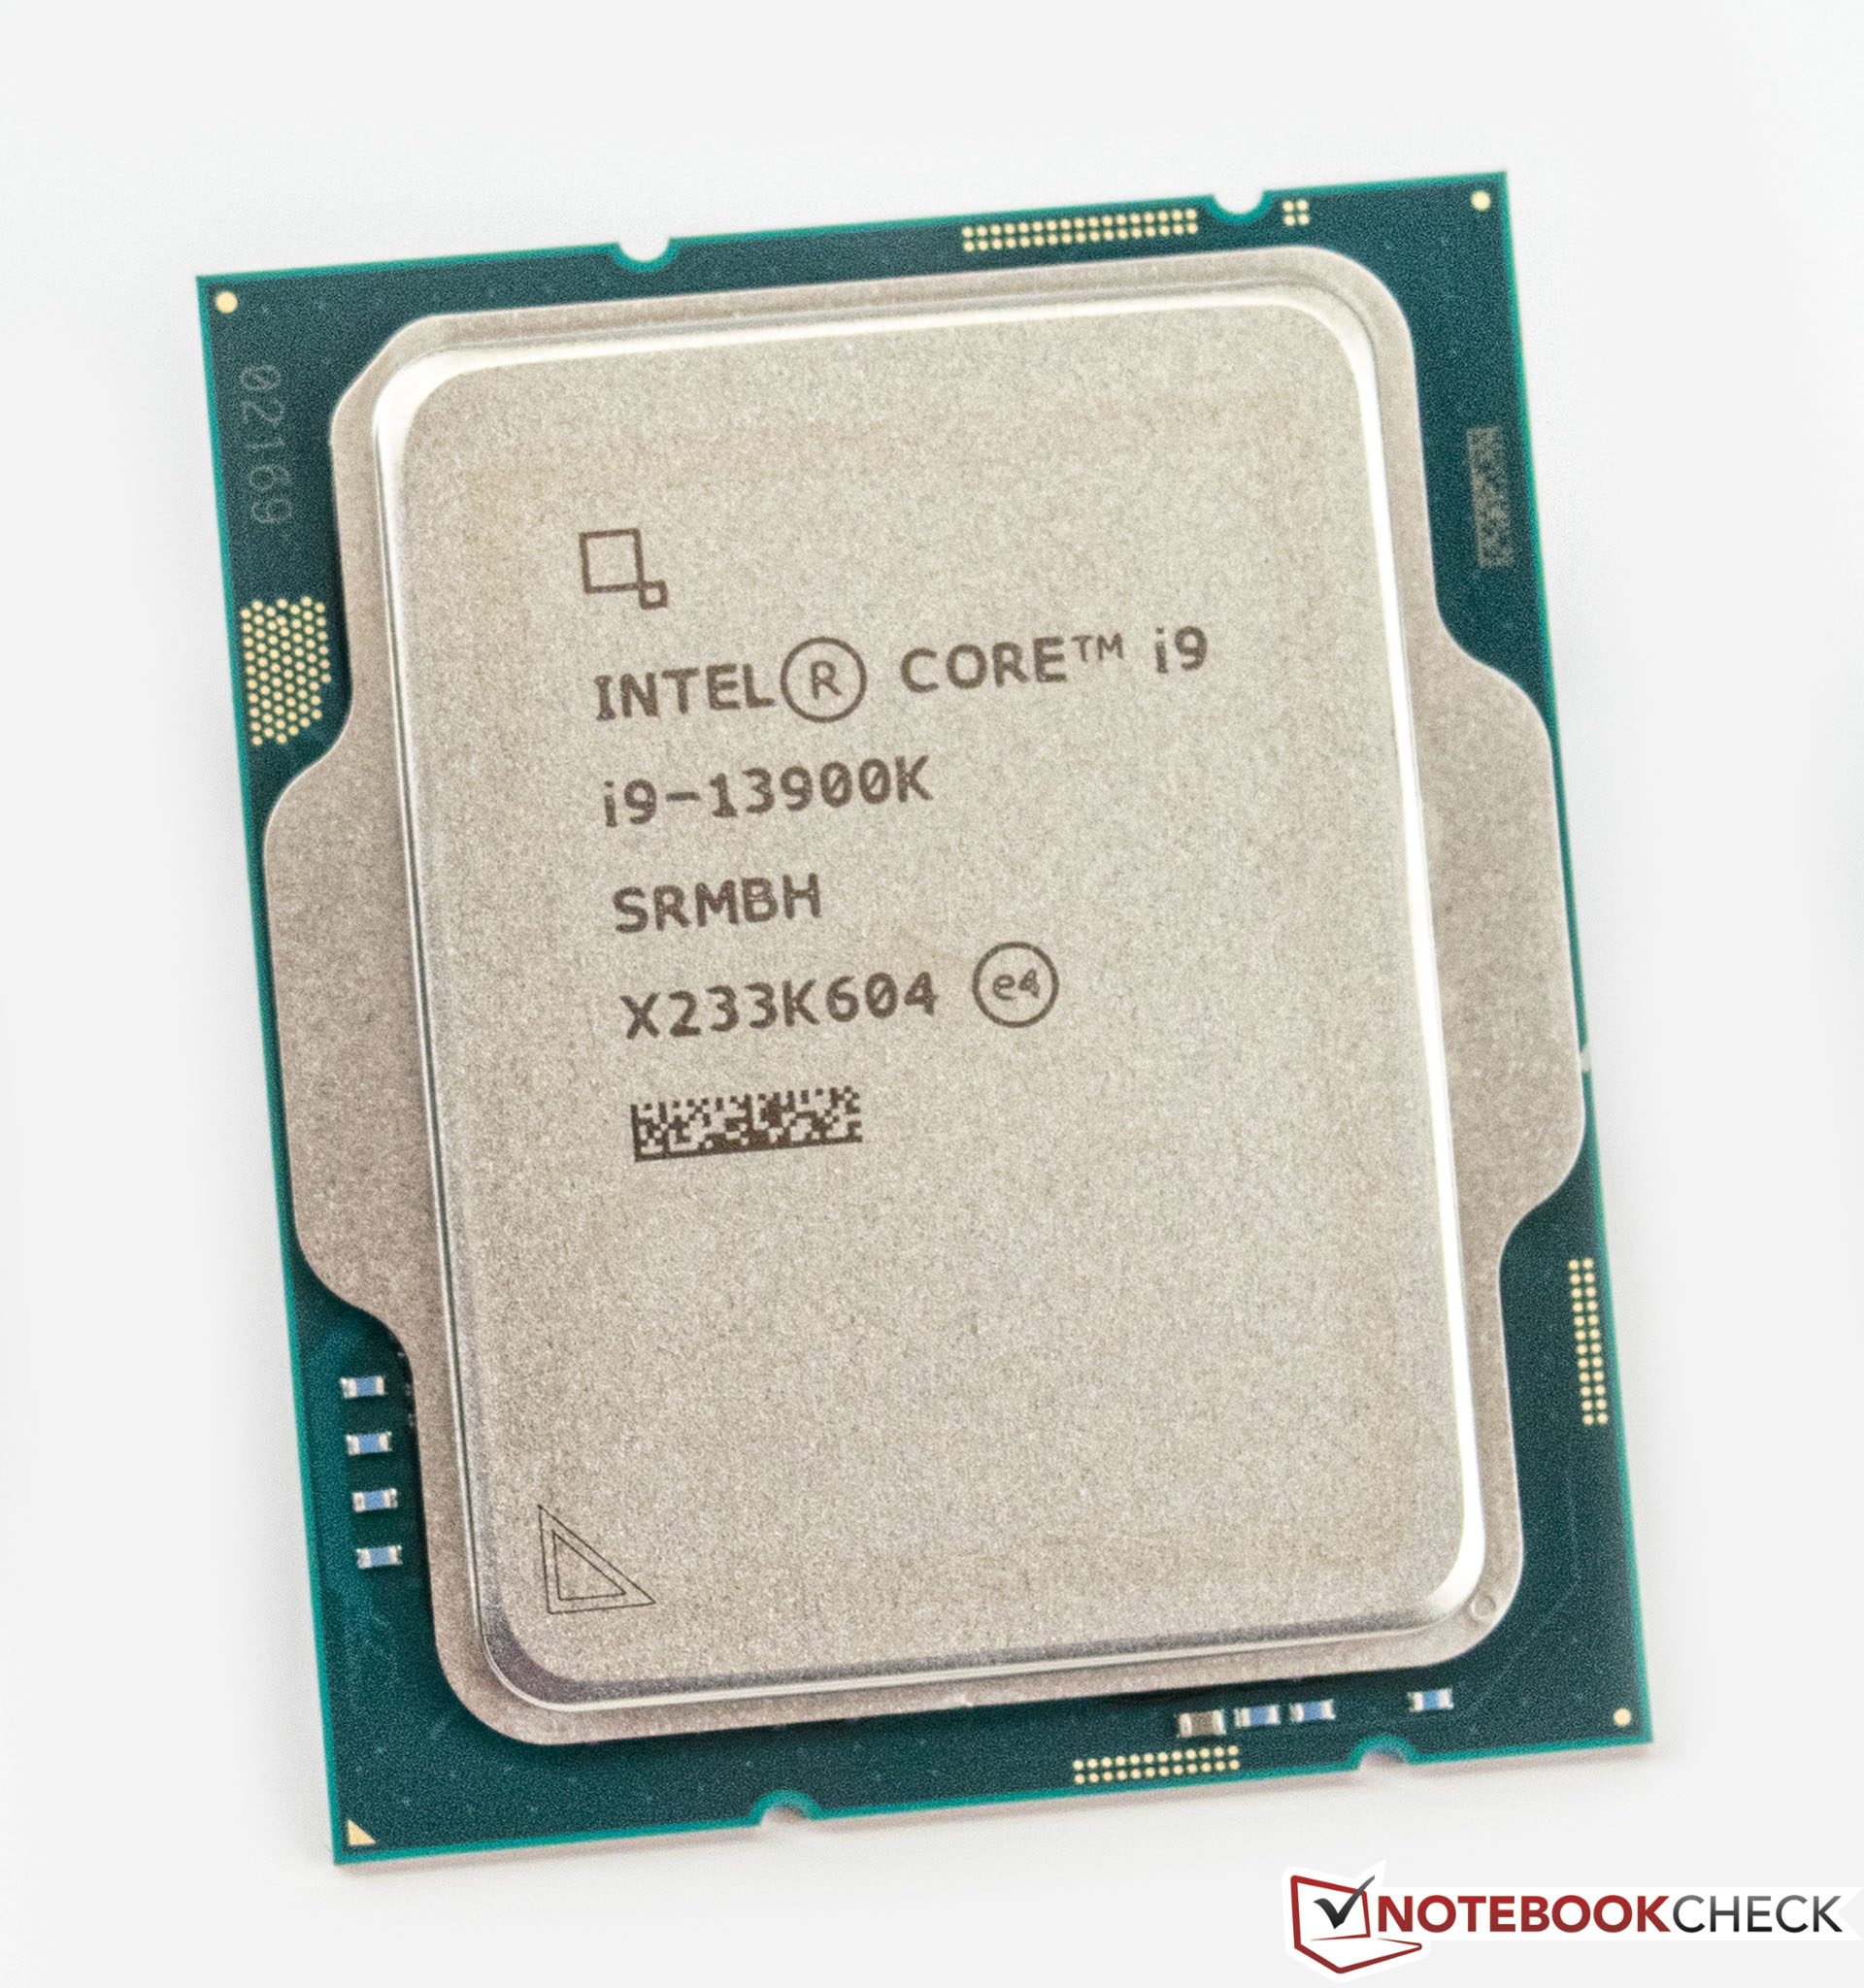
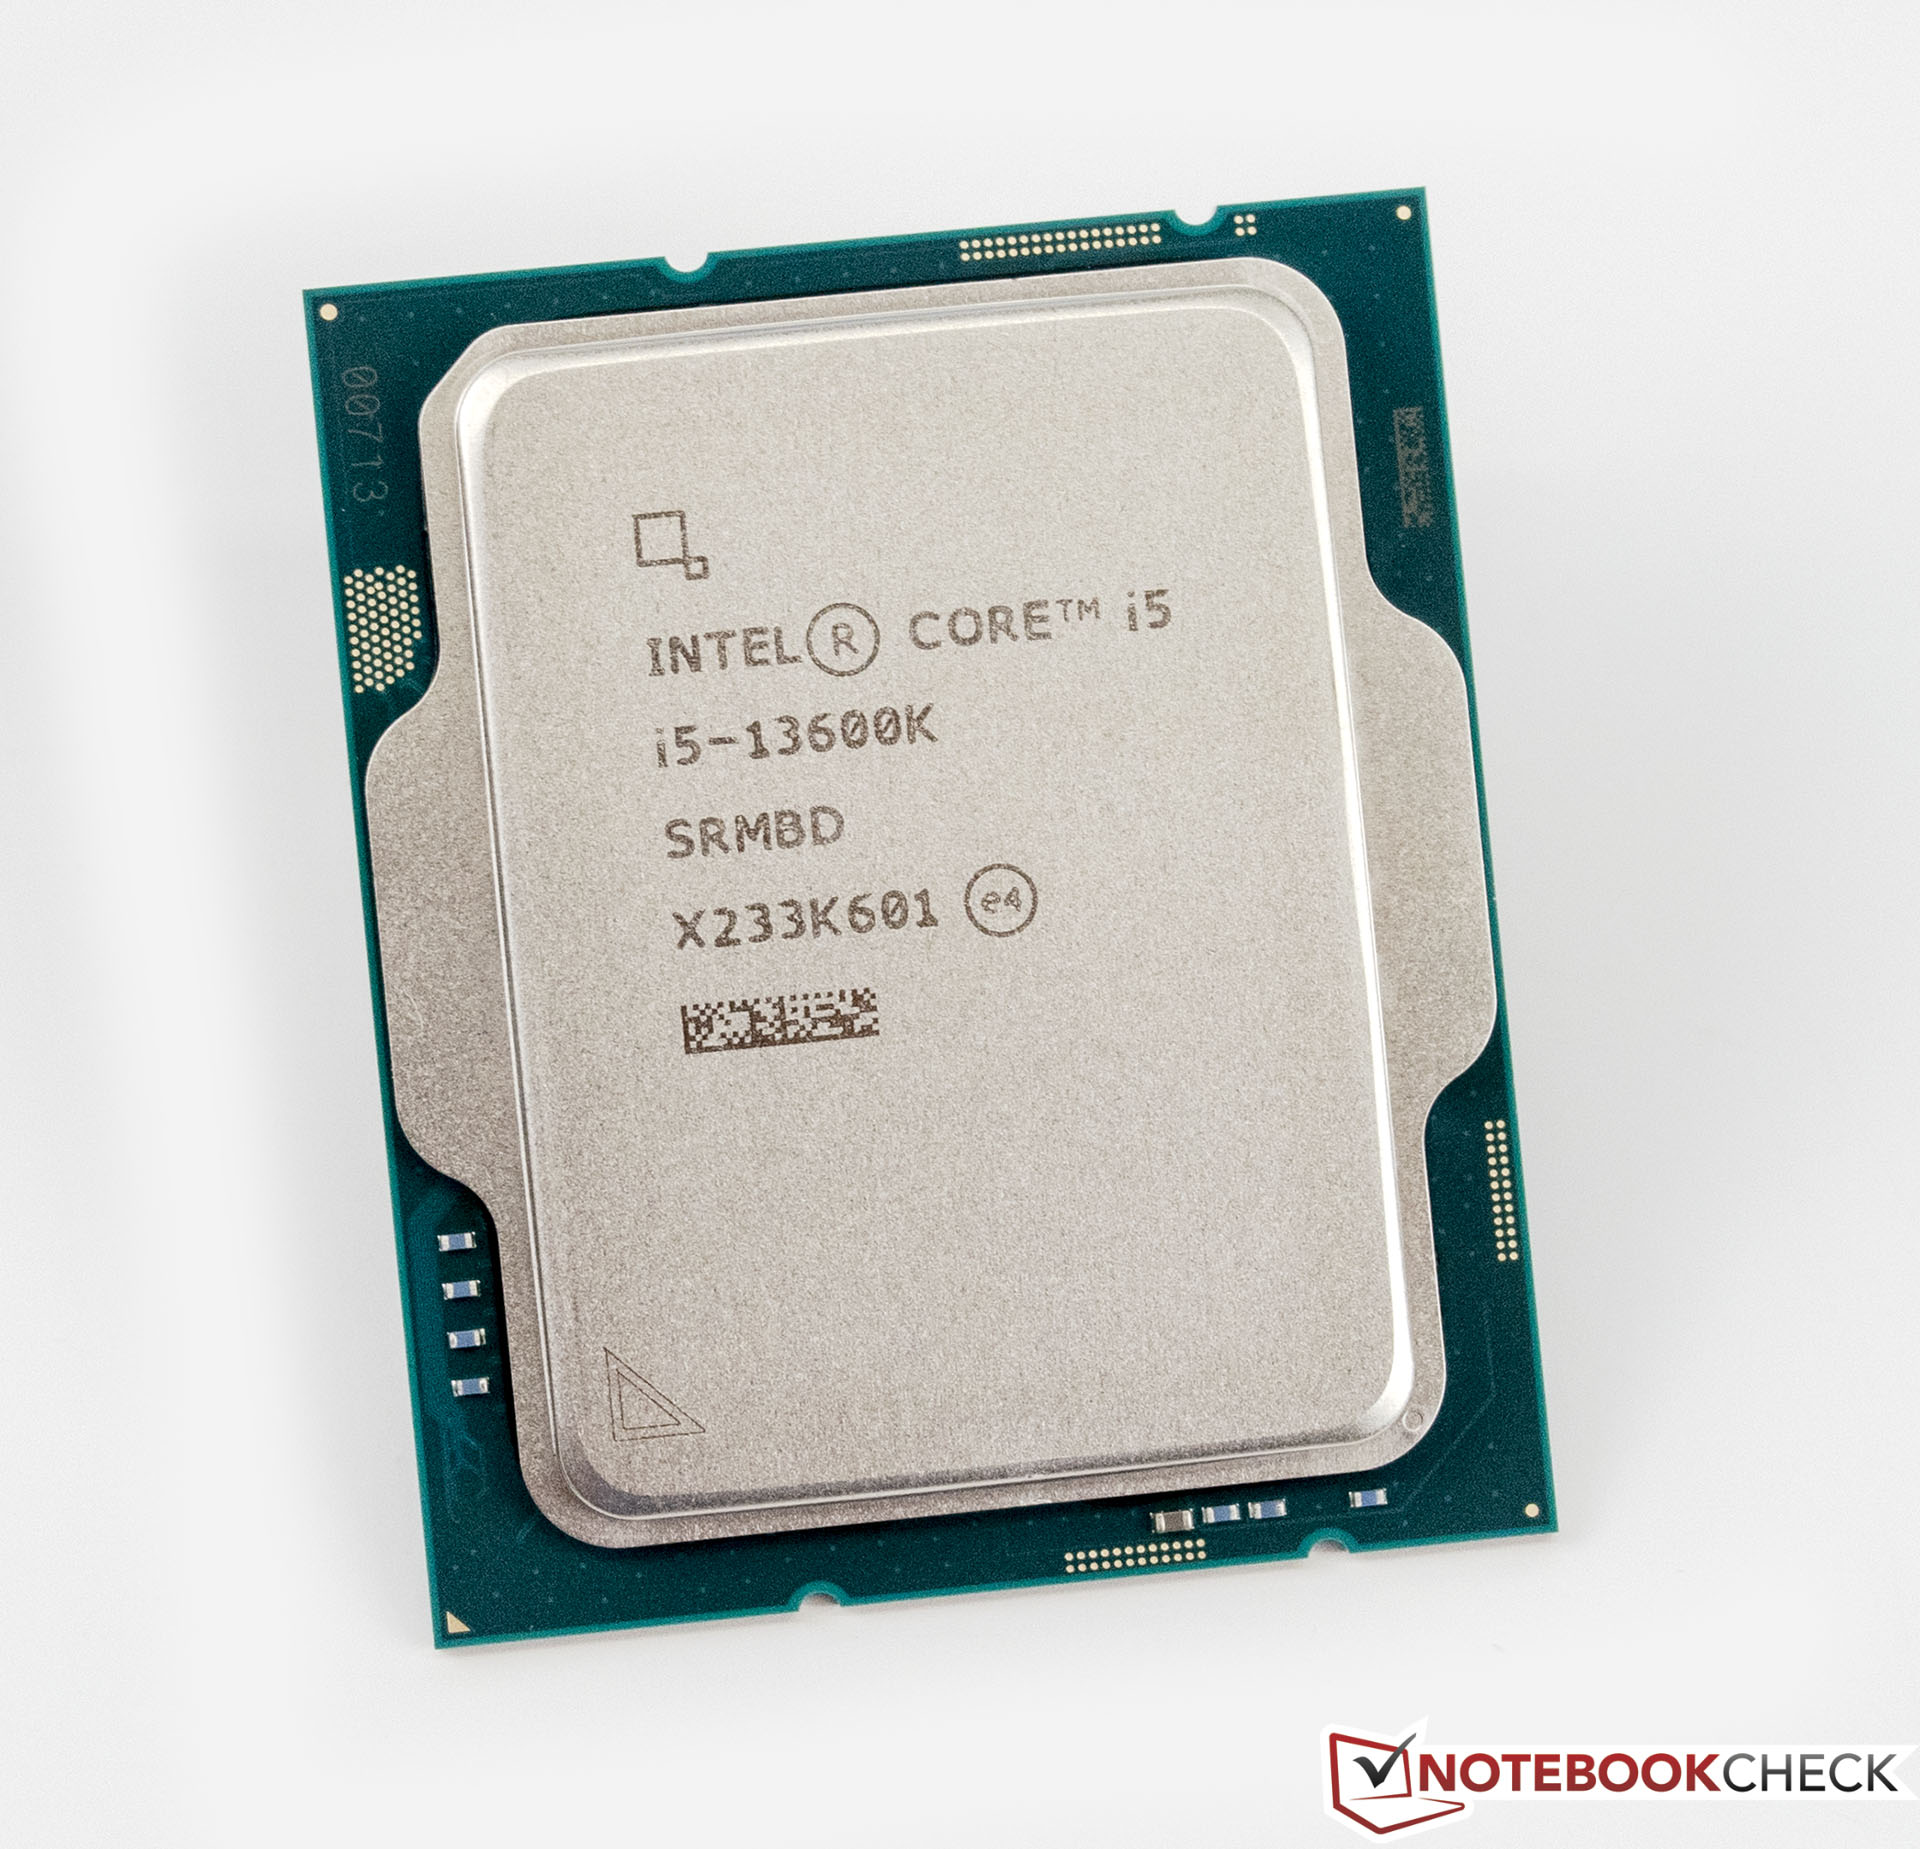
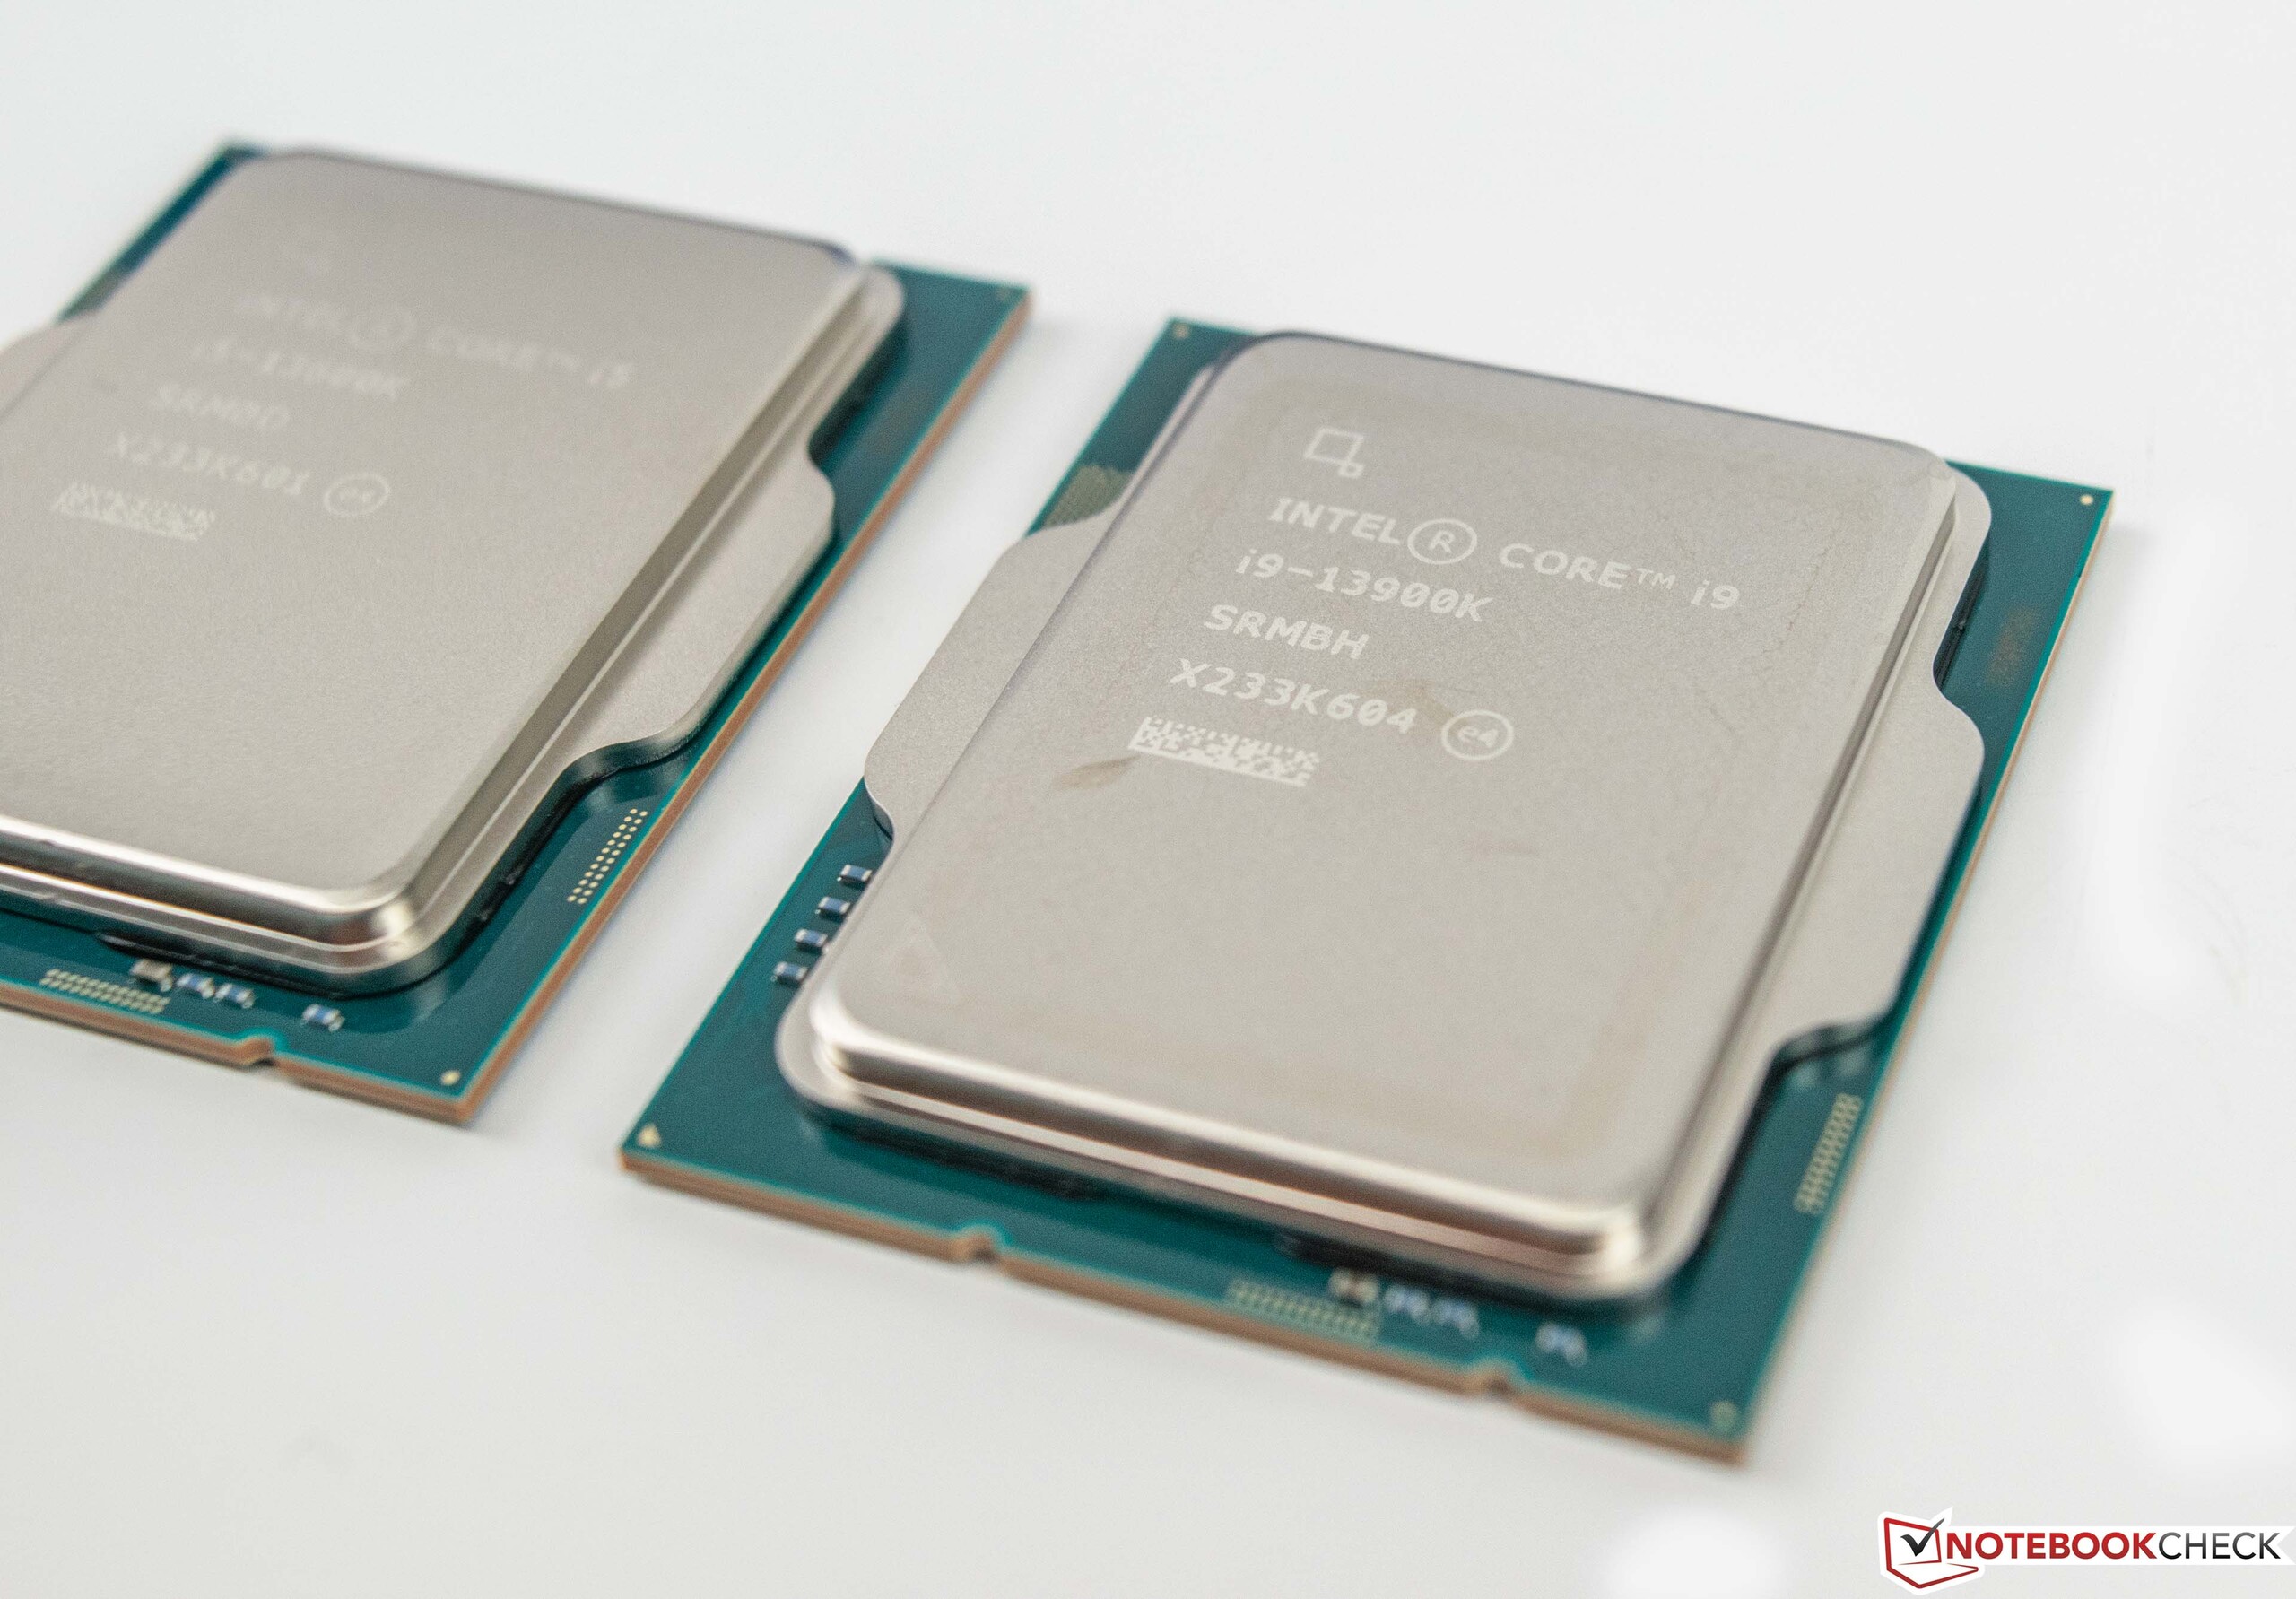
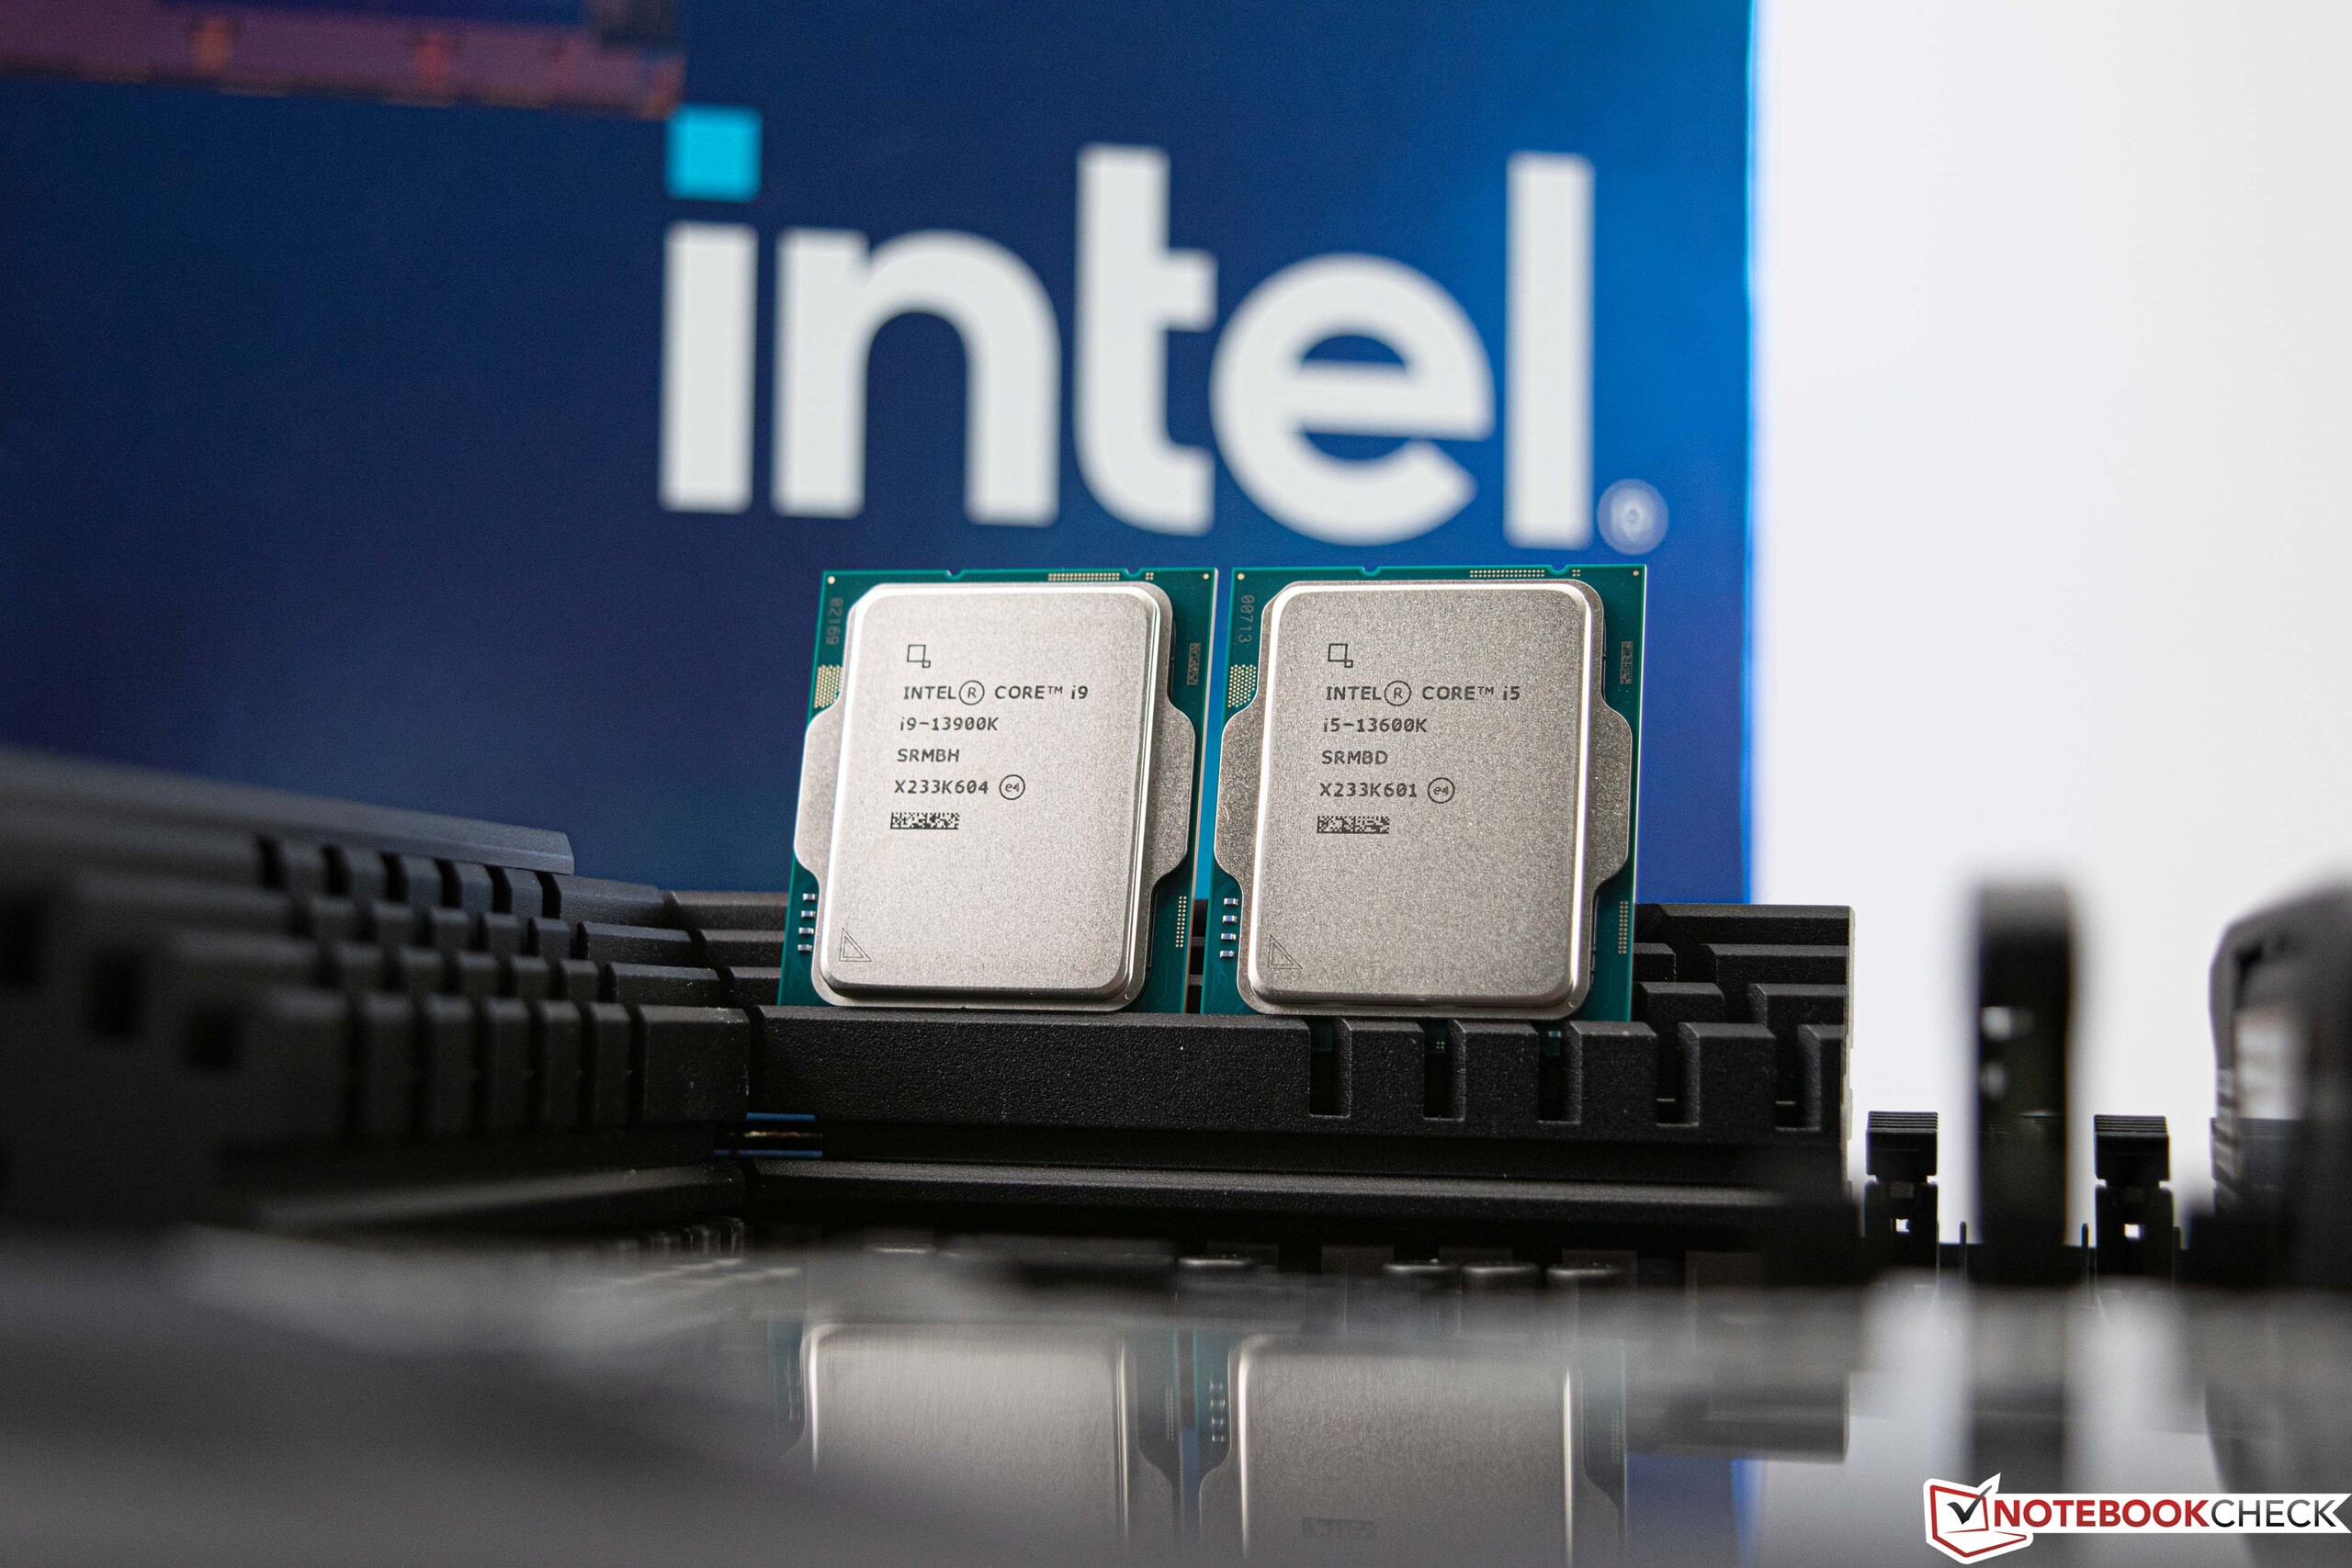
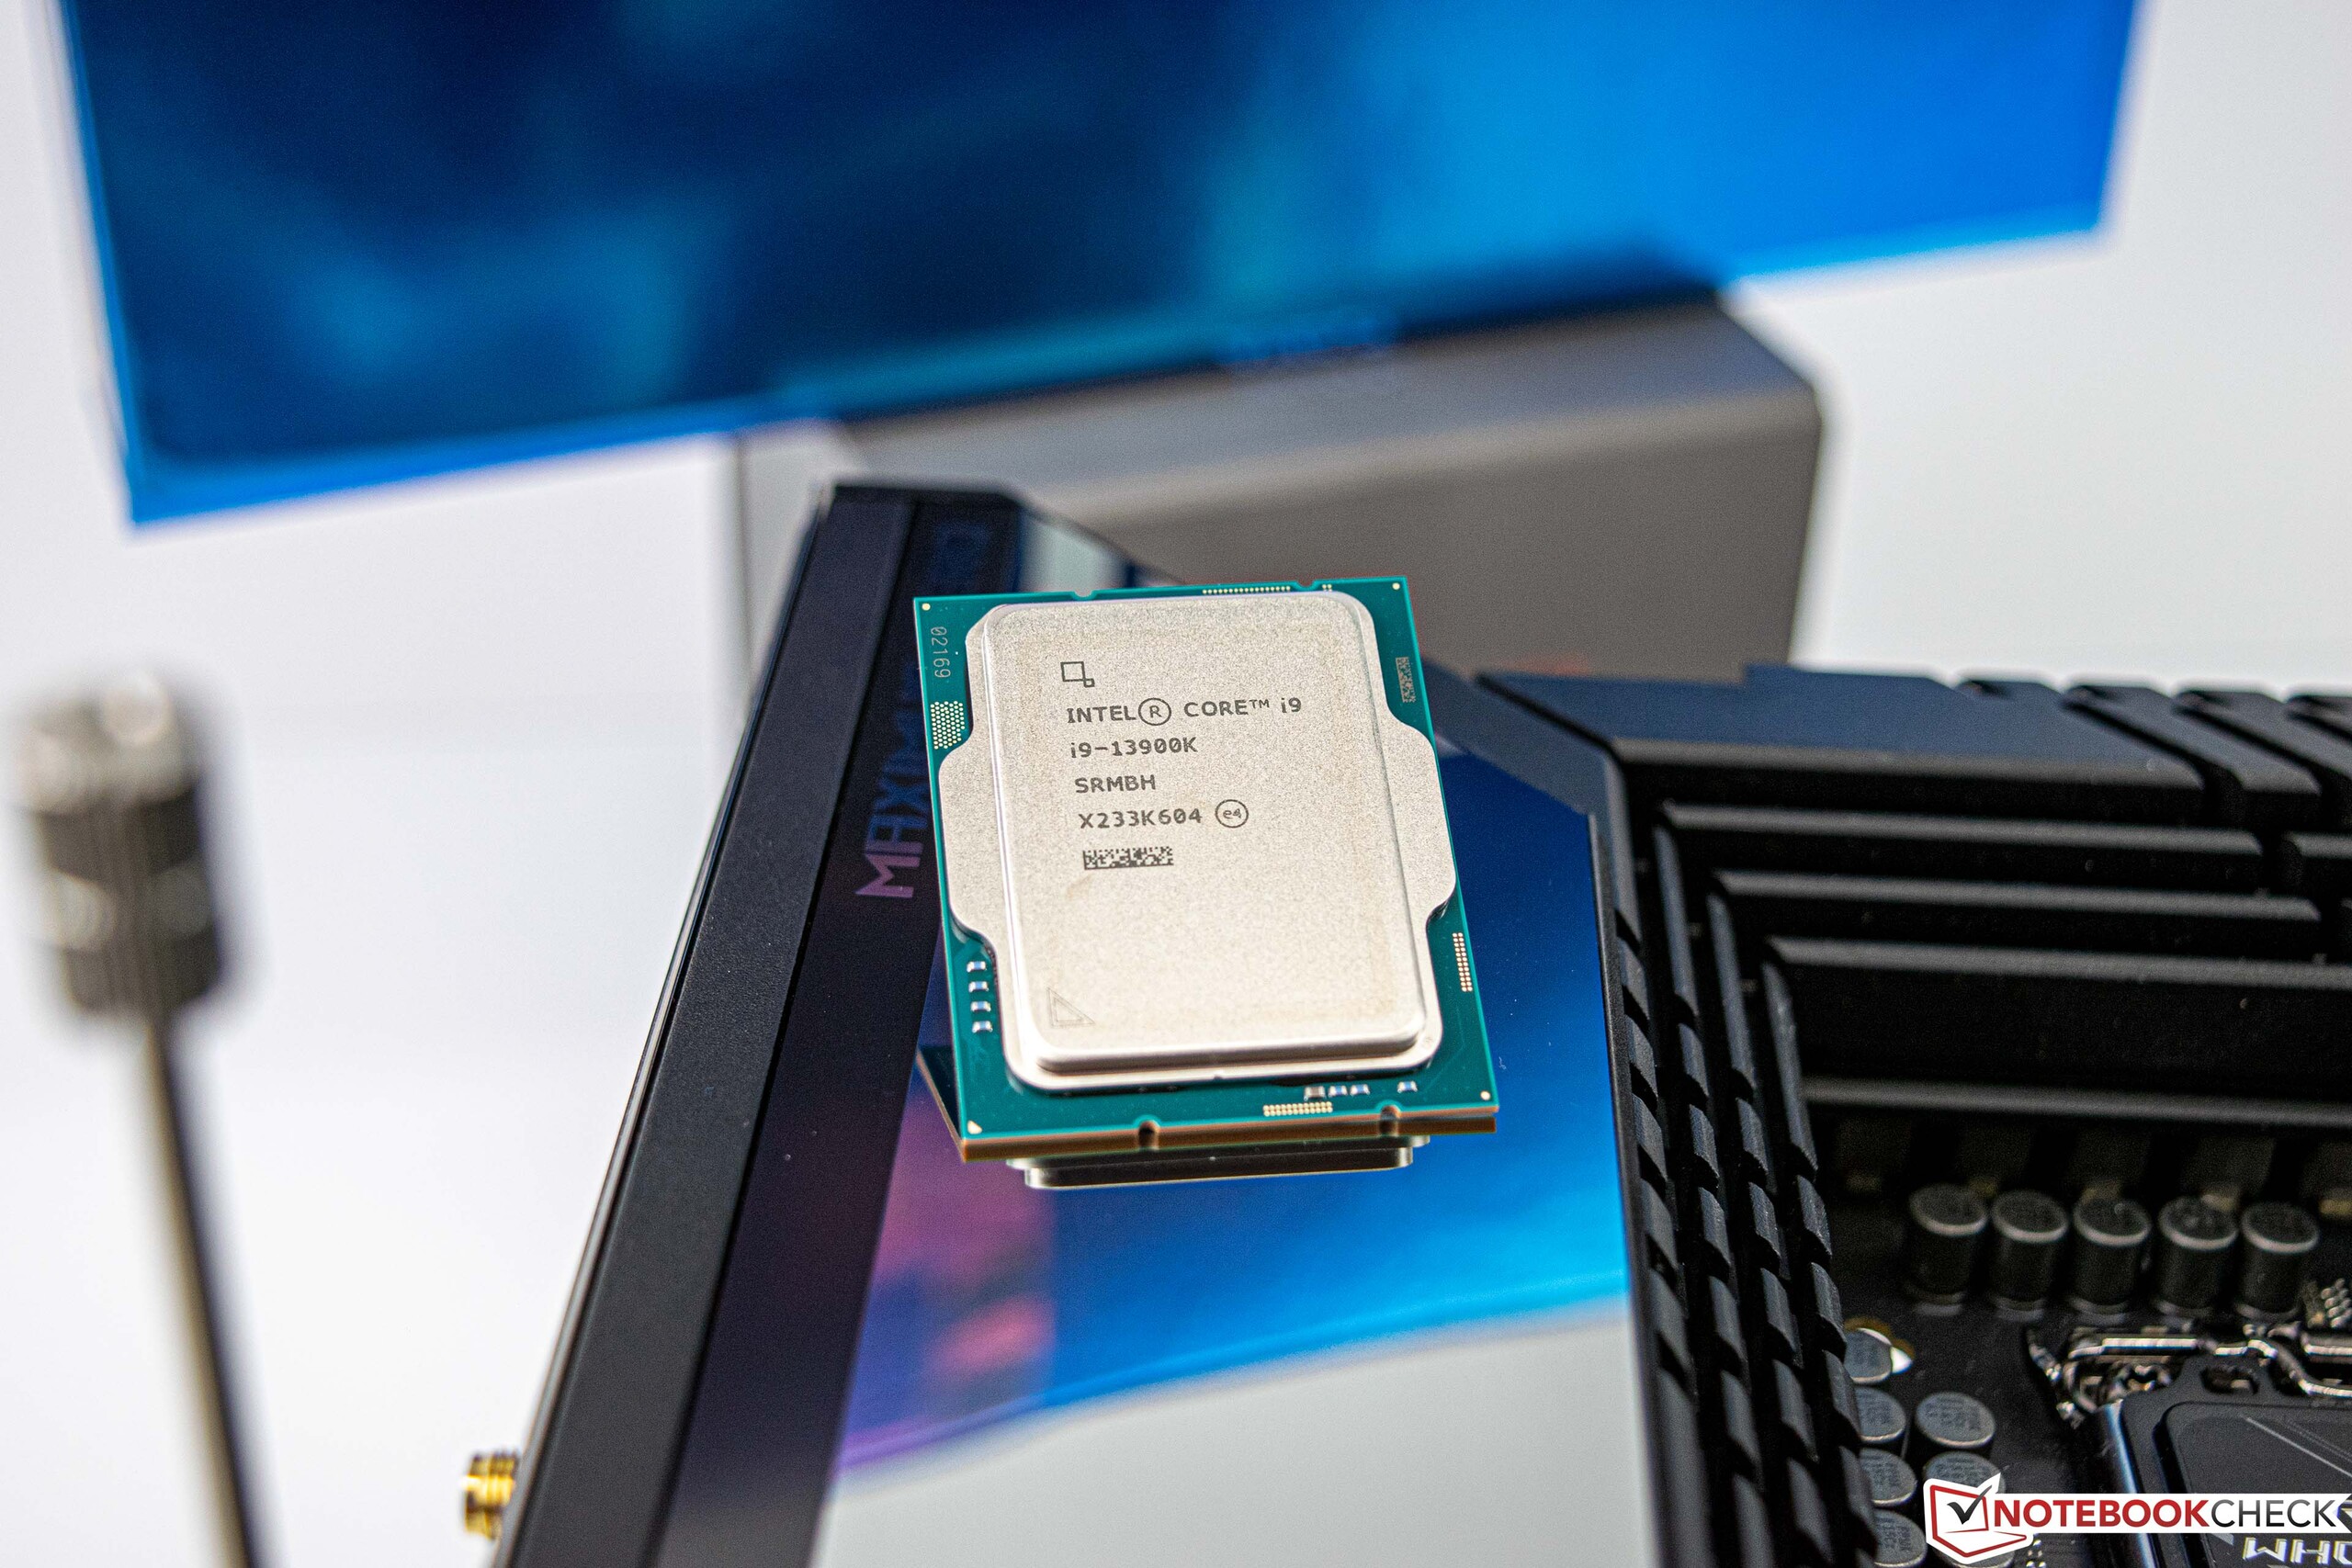
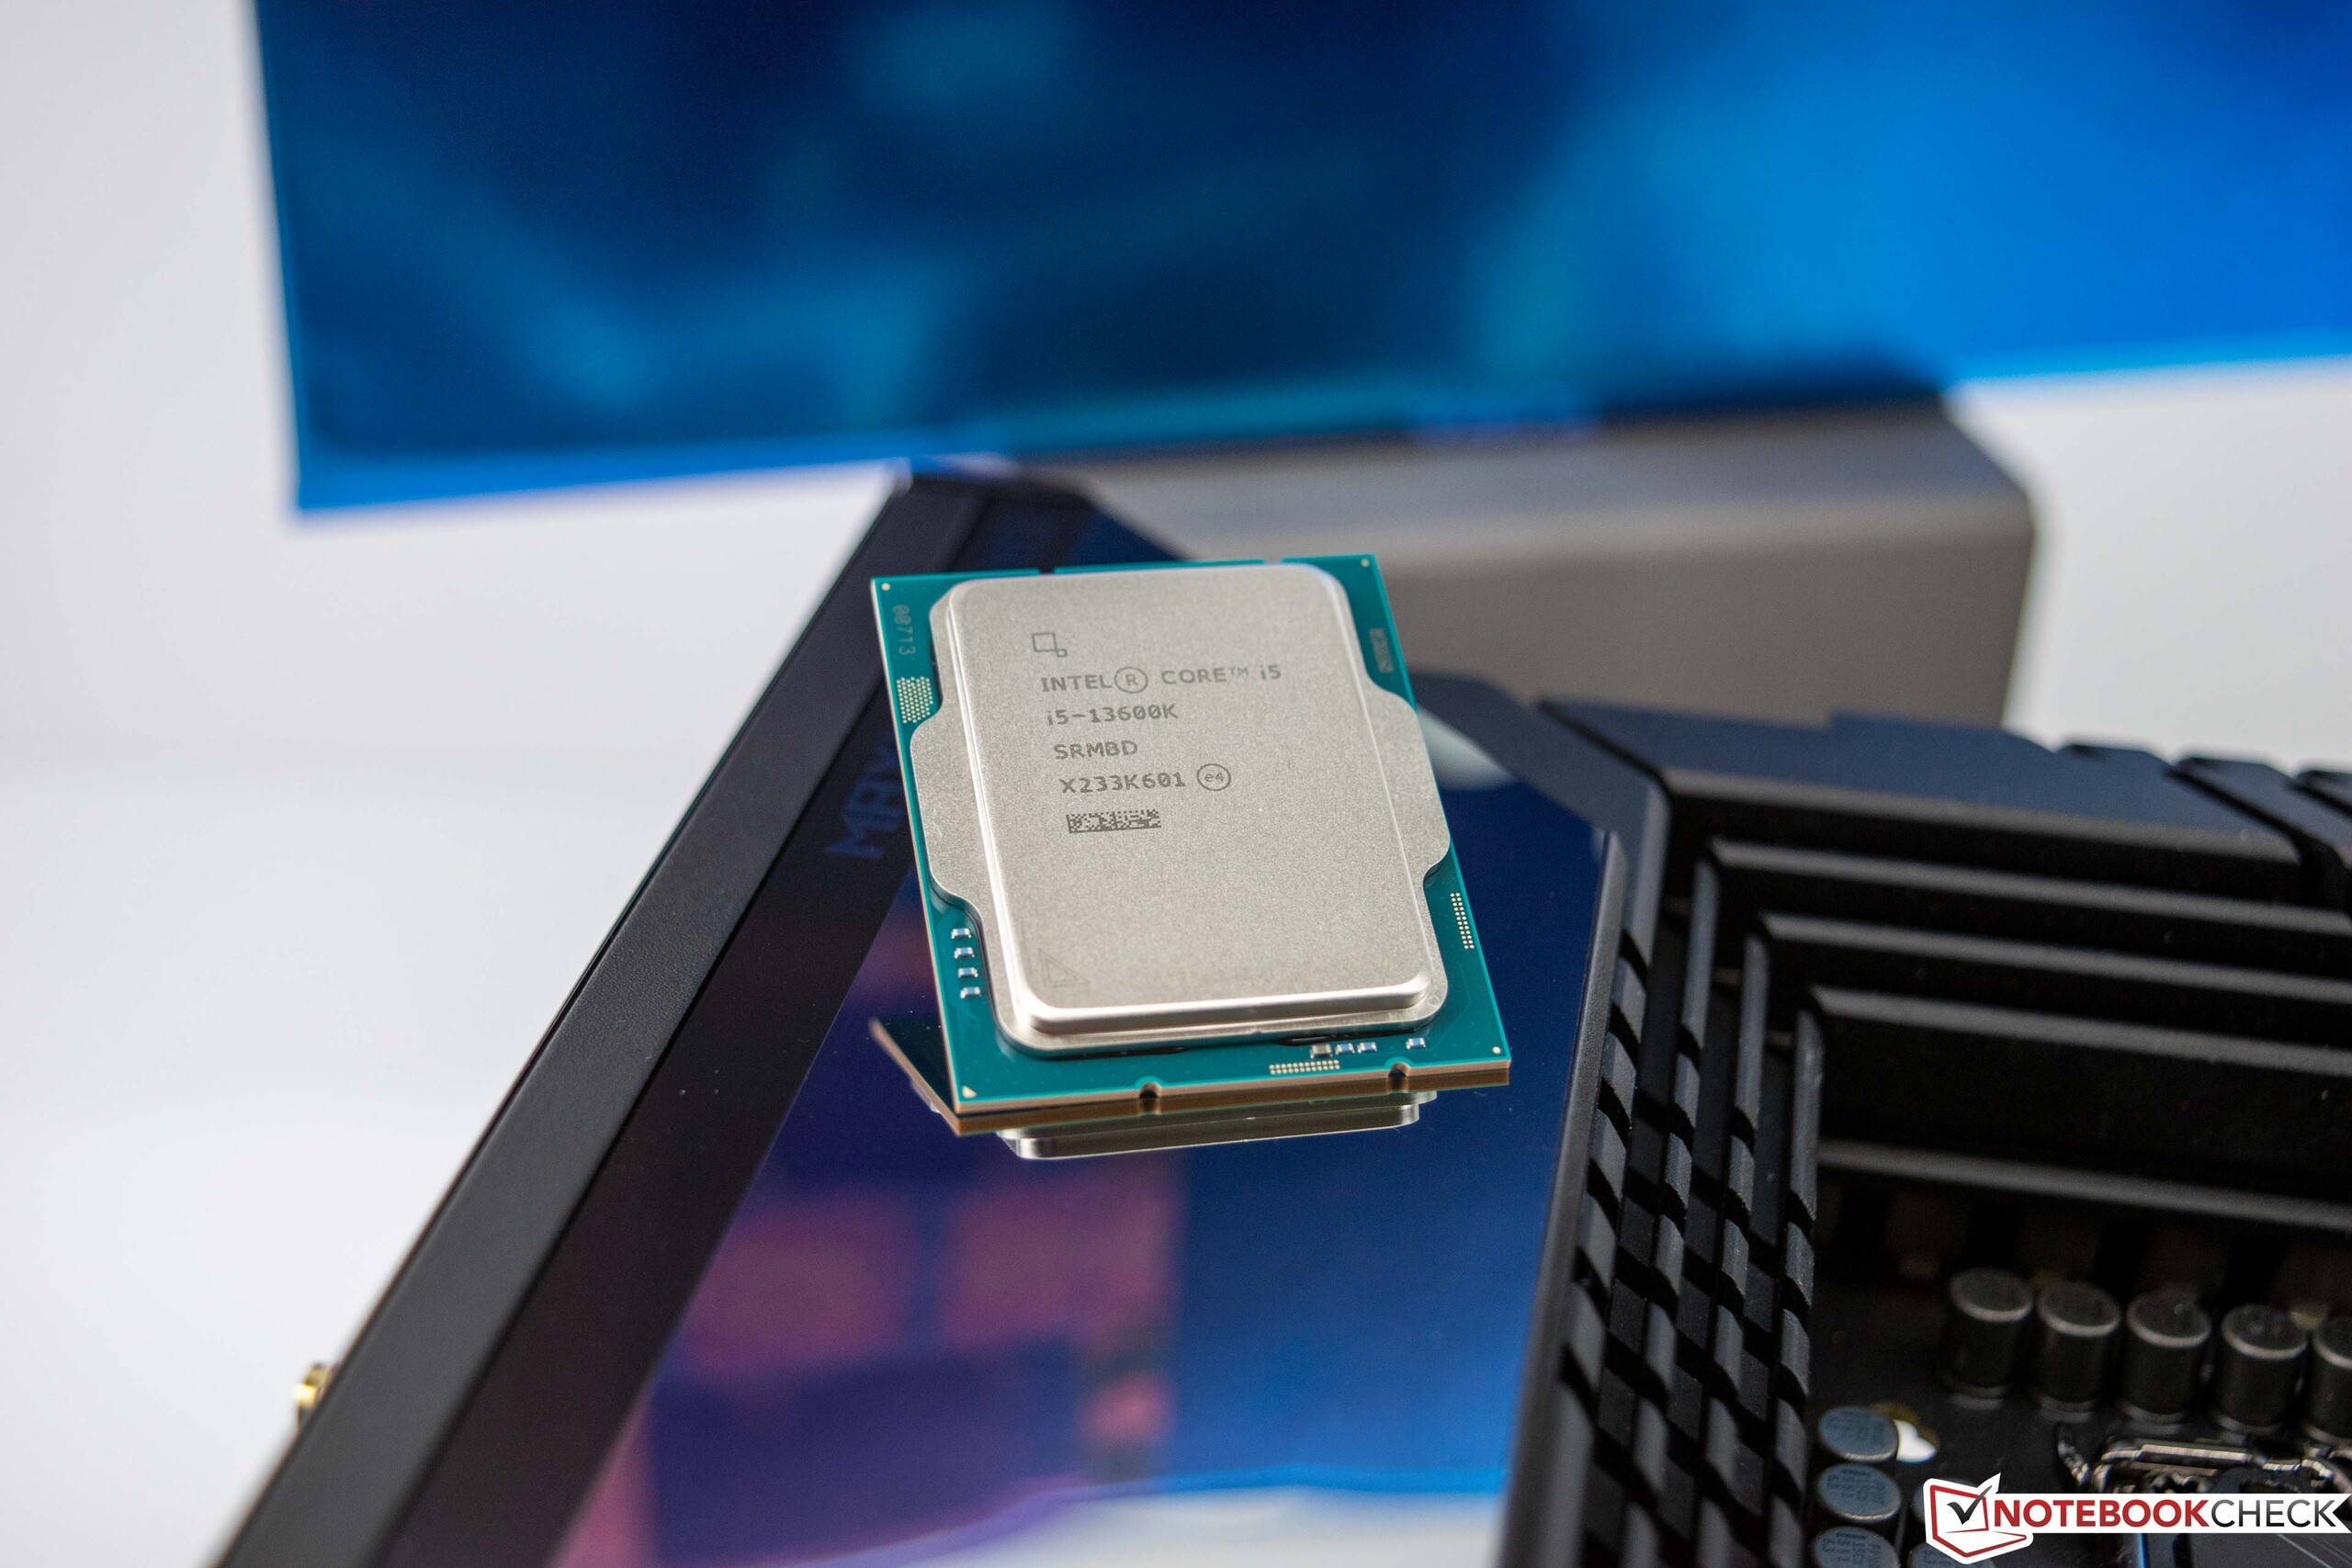
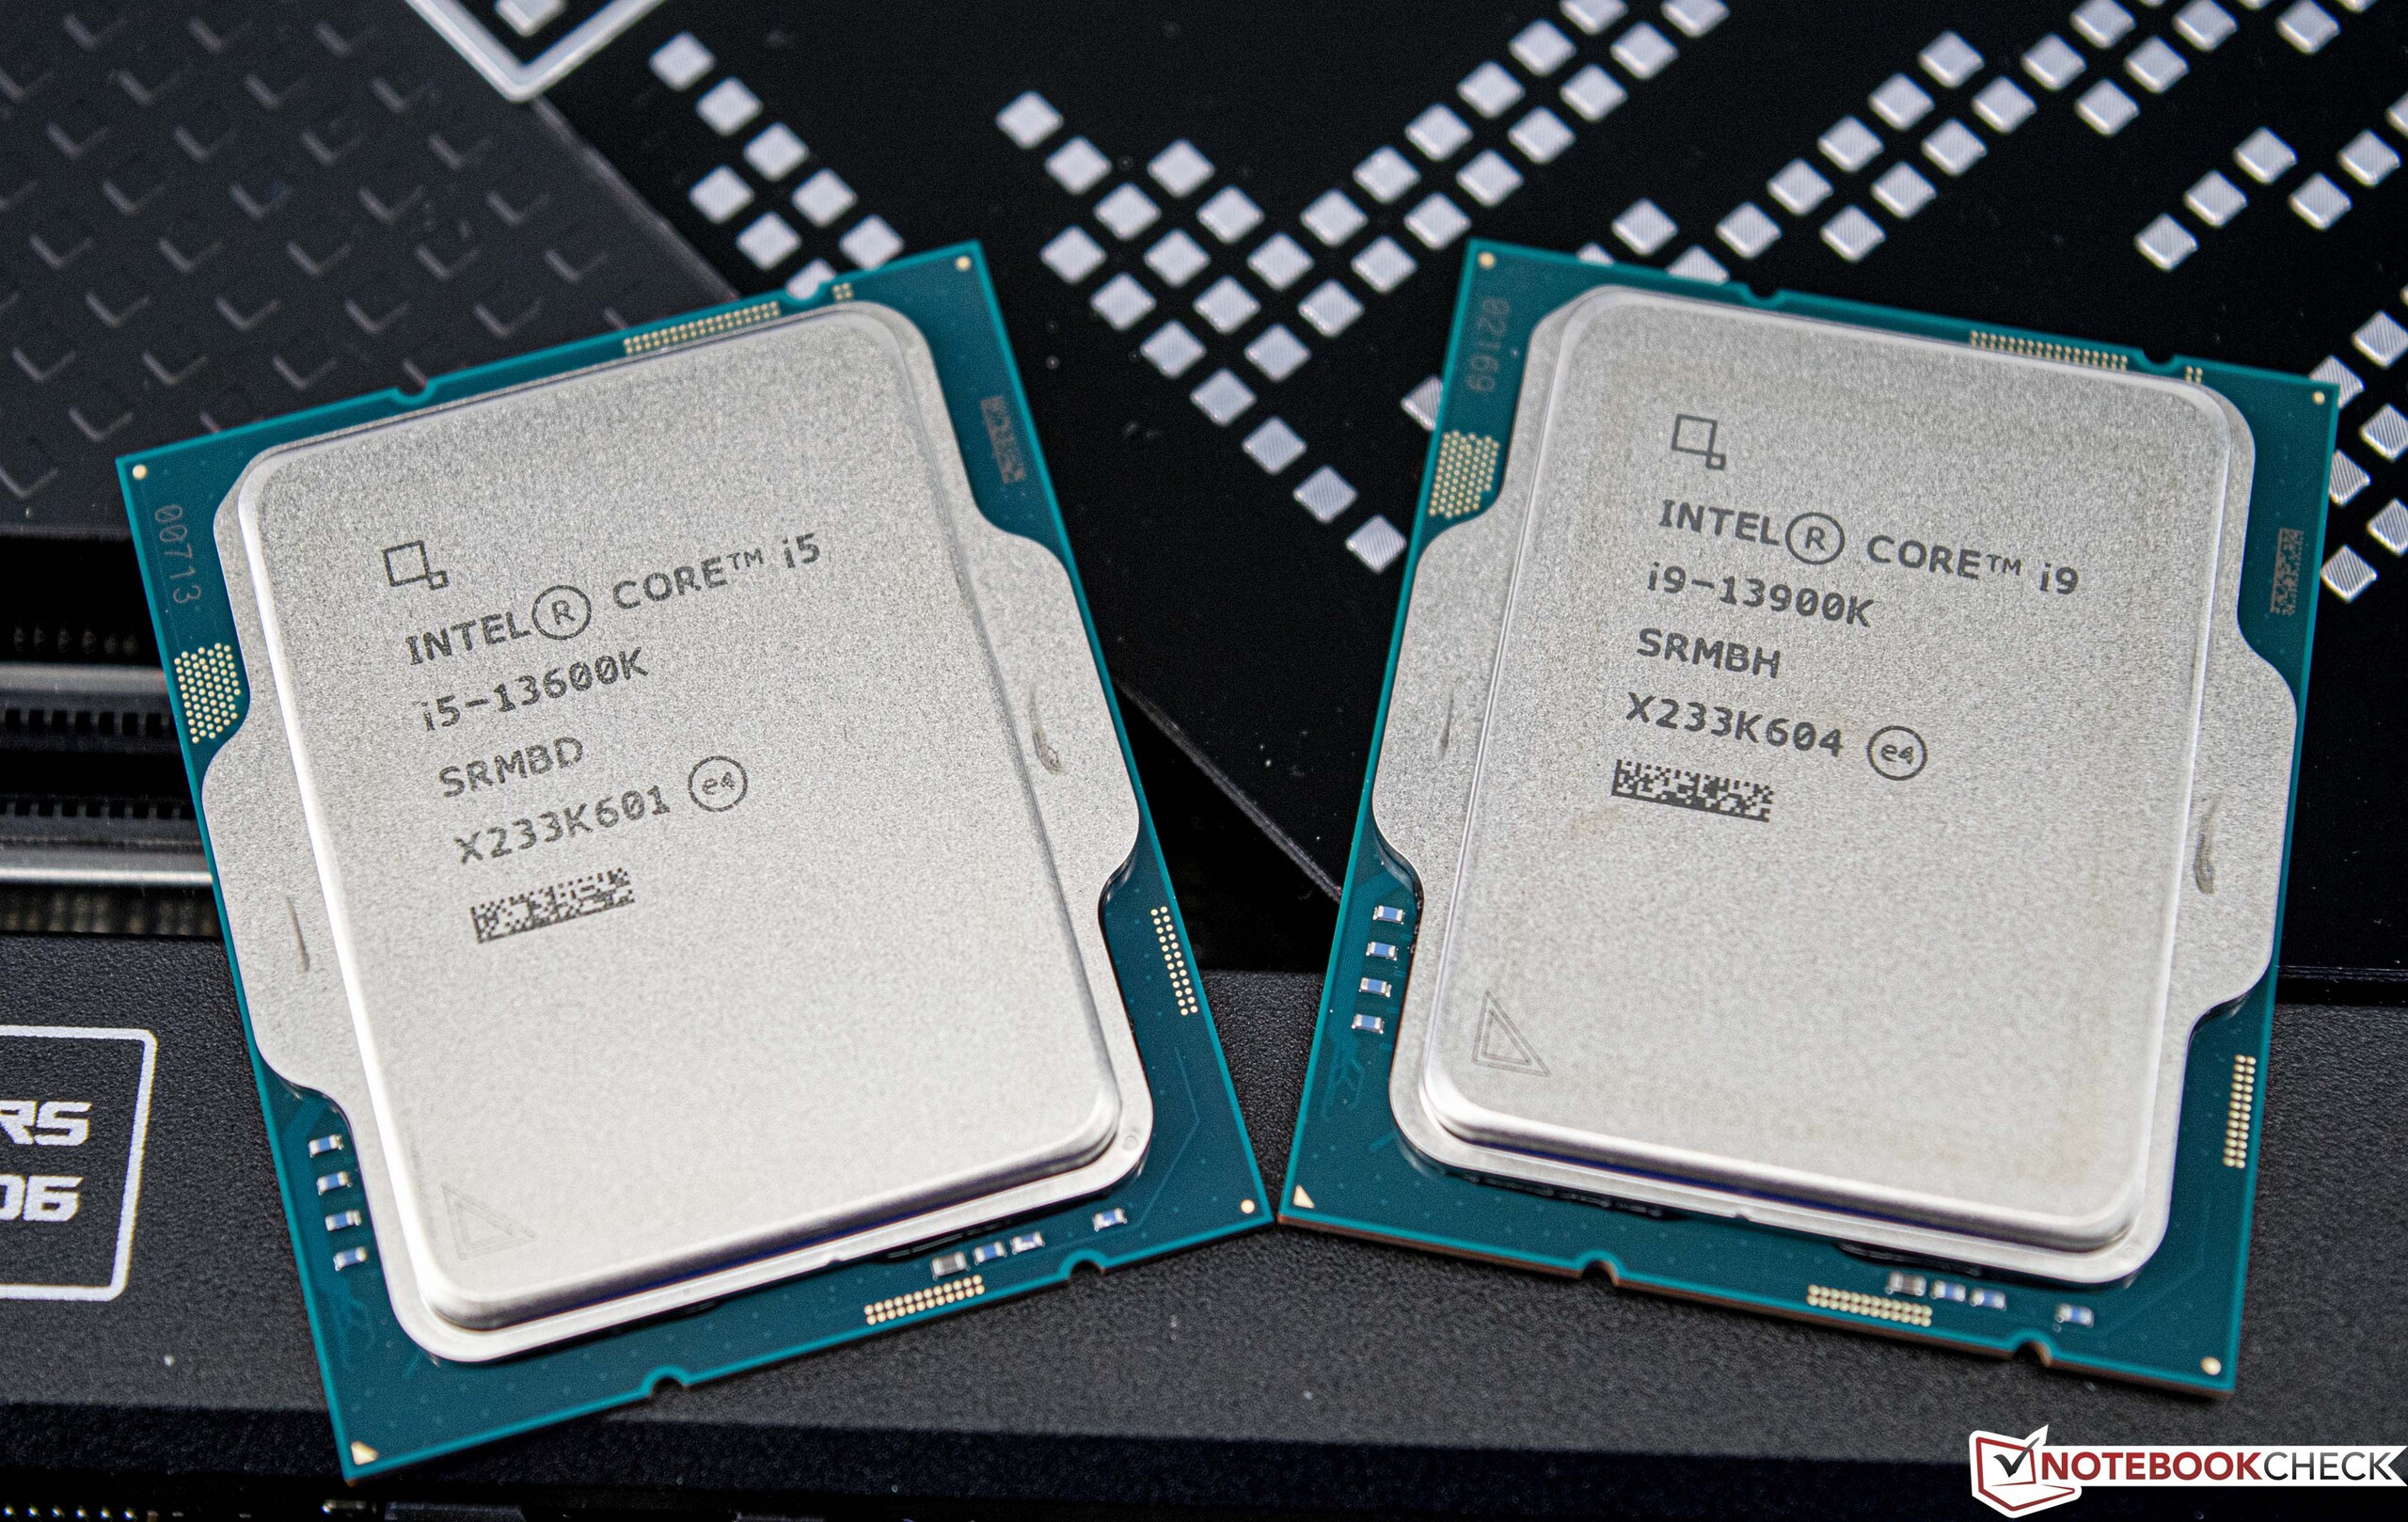
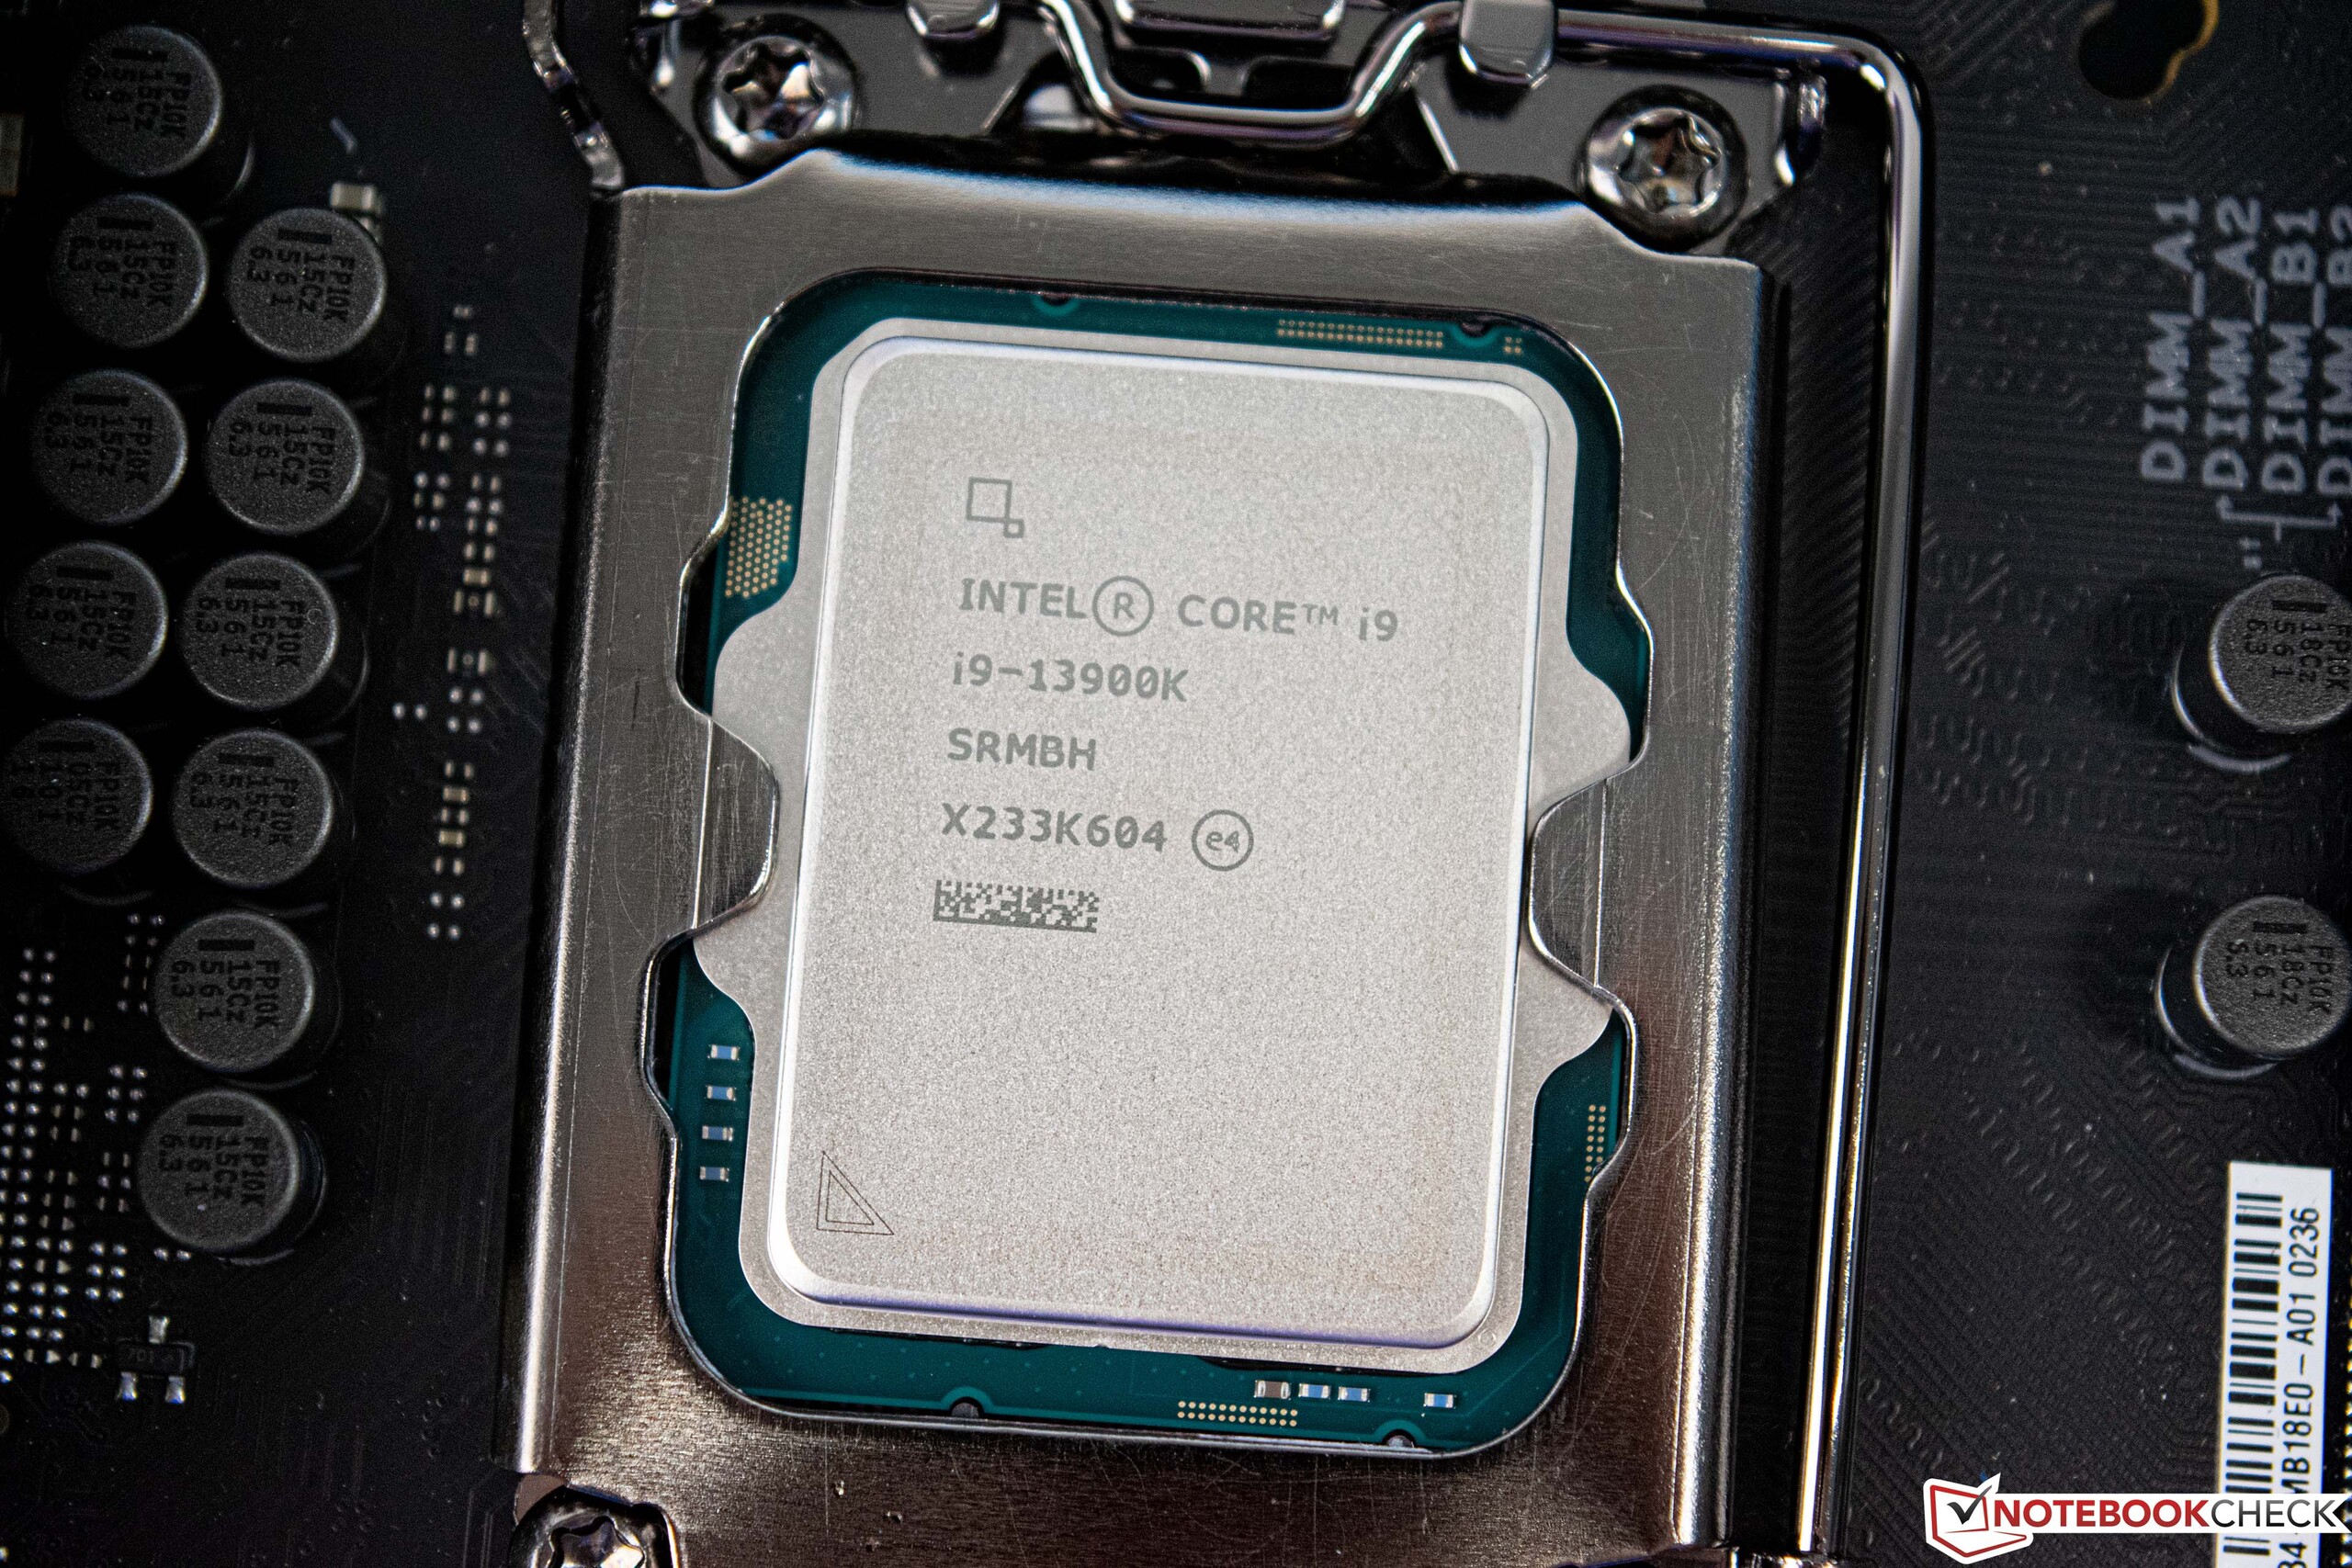
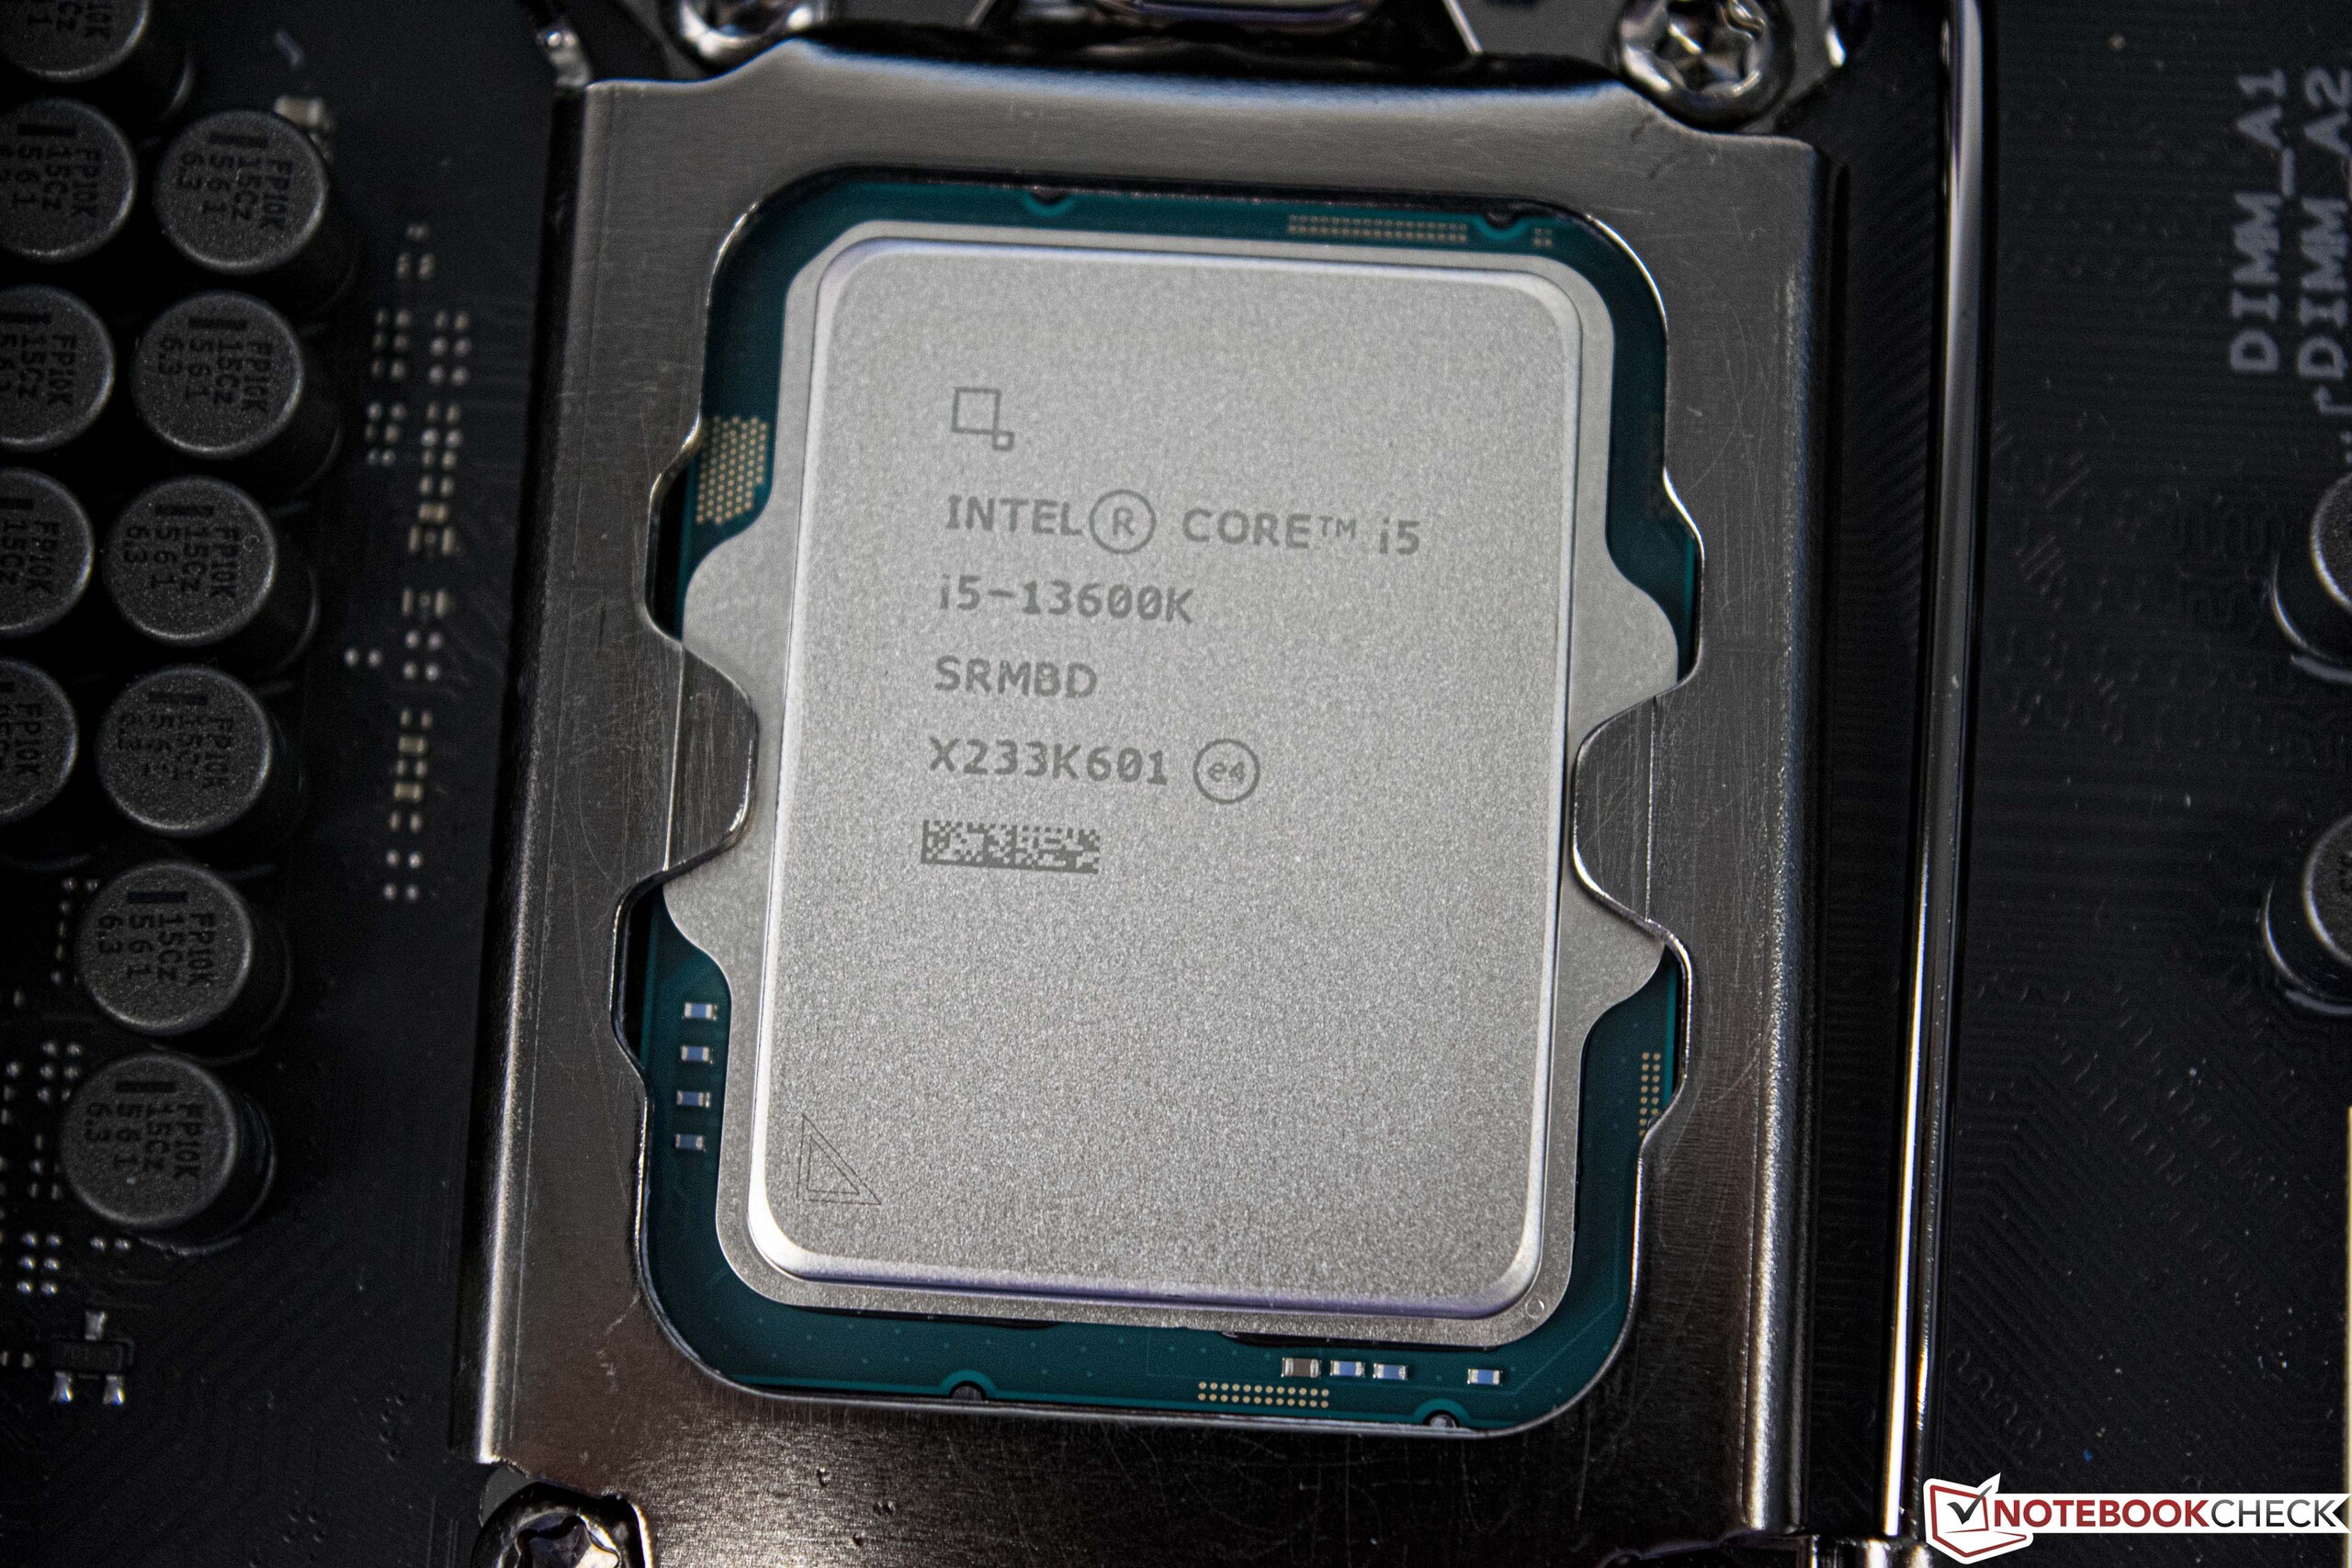
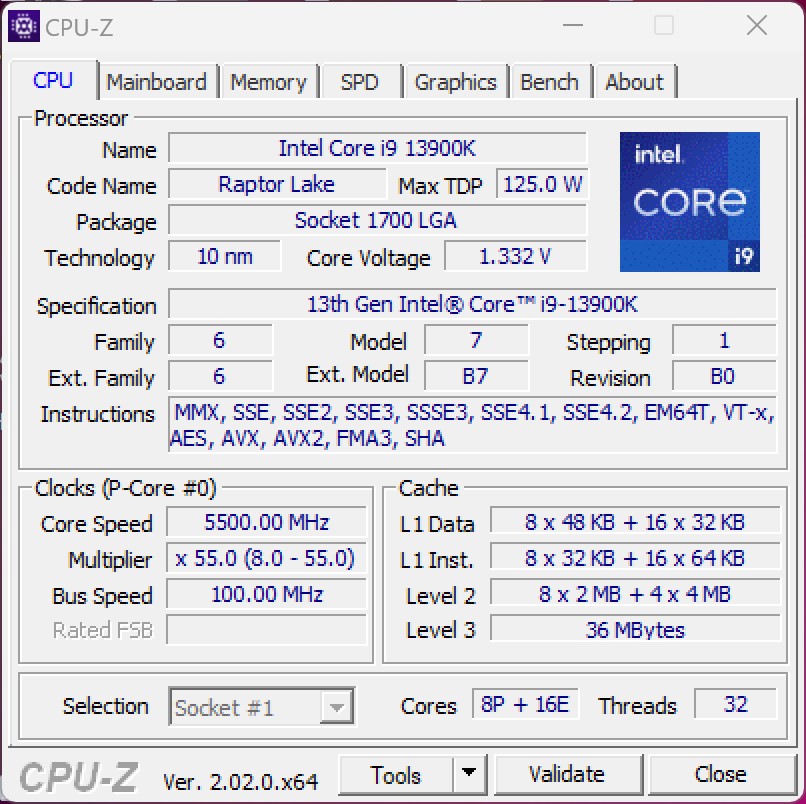
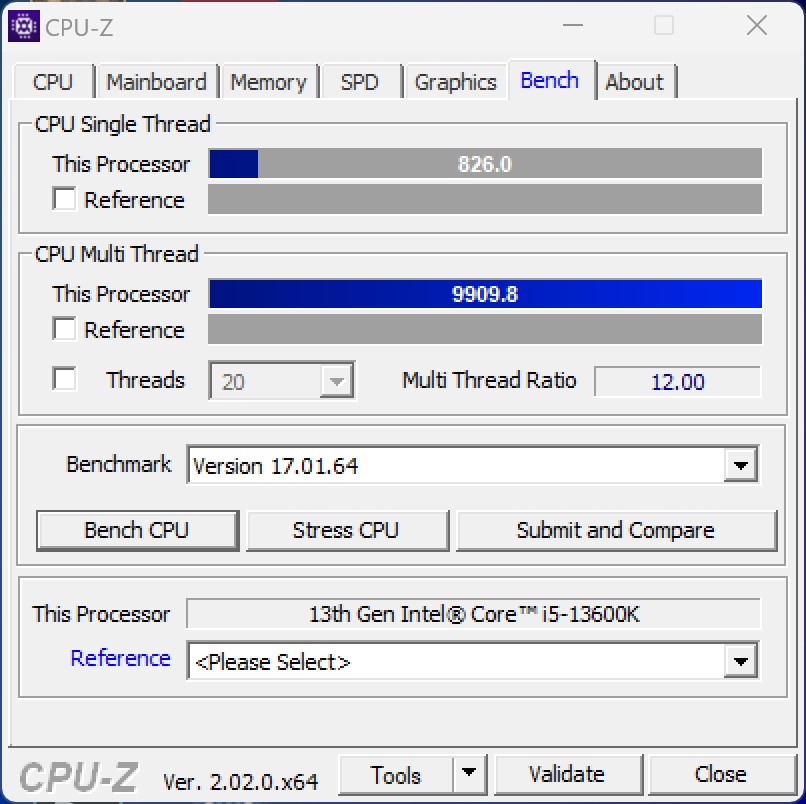
- Intel Core i9-13900K, Intel Core i5-13600K
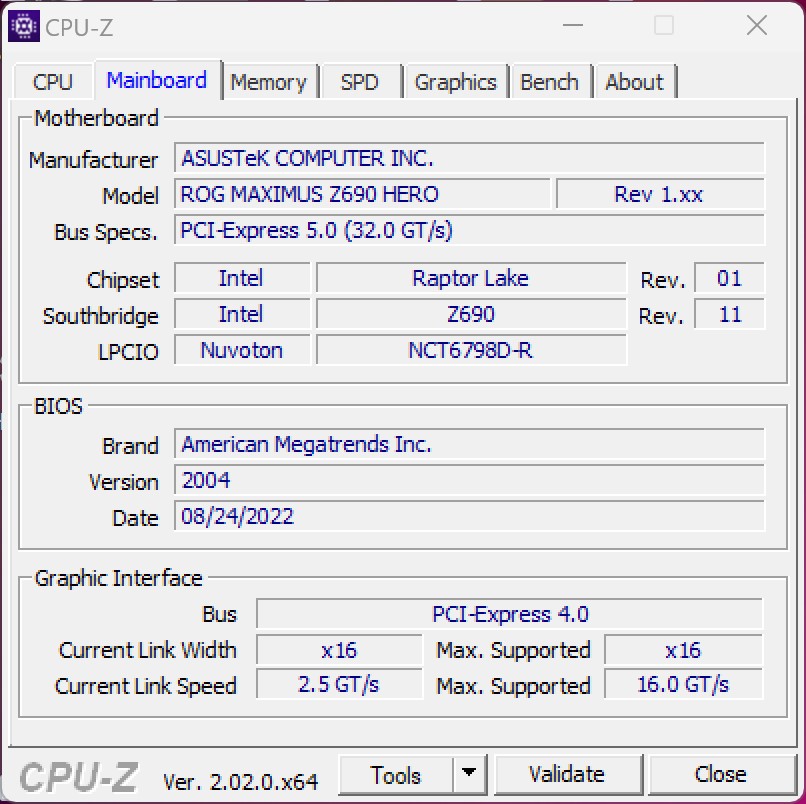
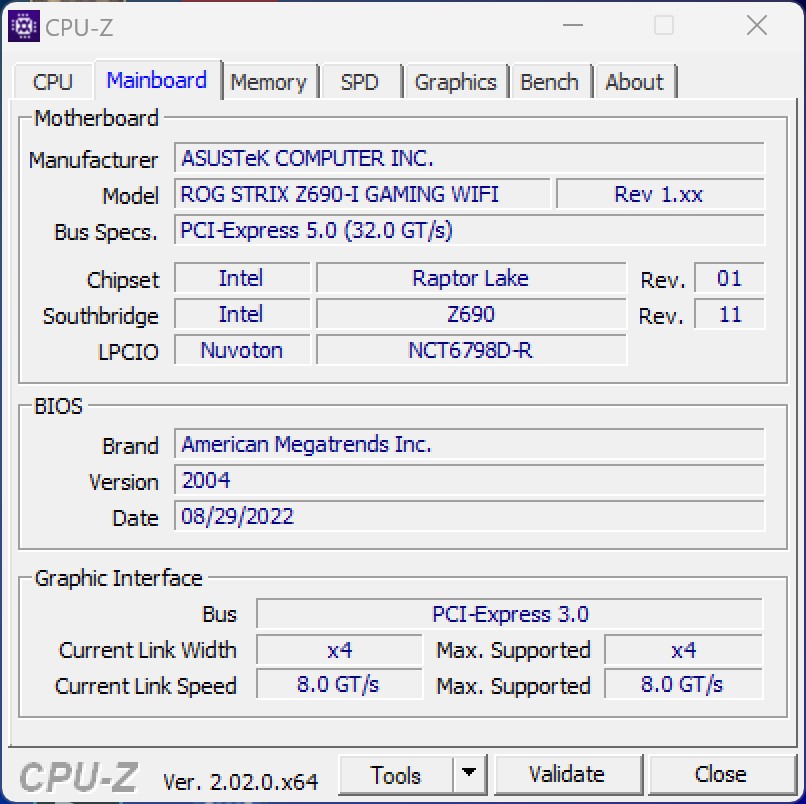
- Asus ROG Maximus Z690 Hero (BIOS v2004) / Asus ROG Strix Z690-I Gaming WiFi (BIOS v2004)
- Custom loop waterkoeling (Pomp: Alphacool Aquastream XT Ultra, Radiator: EK MO-RA3 420 LT BLACK)
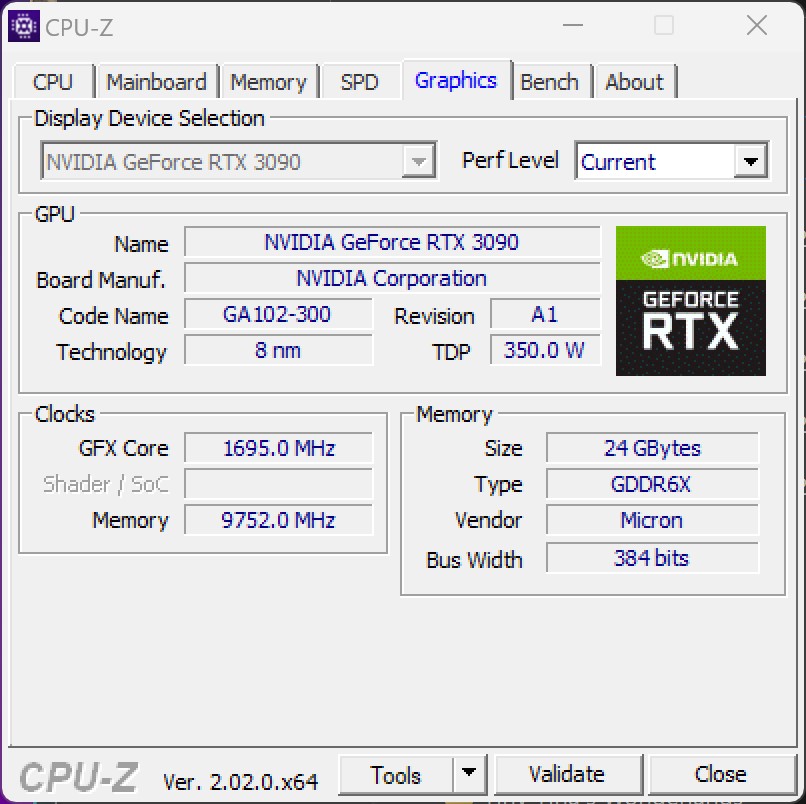
- Nvidia GeForce RTX 3090 Founders Edition (driver: 517.48)
- EVGA SuperNOVA P+ 1600W
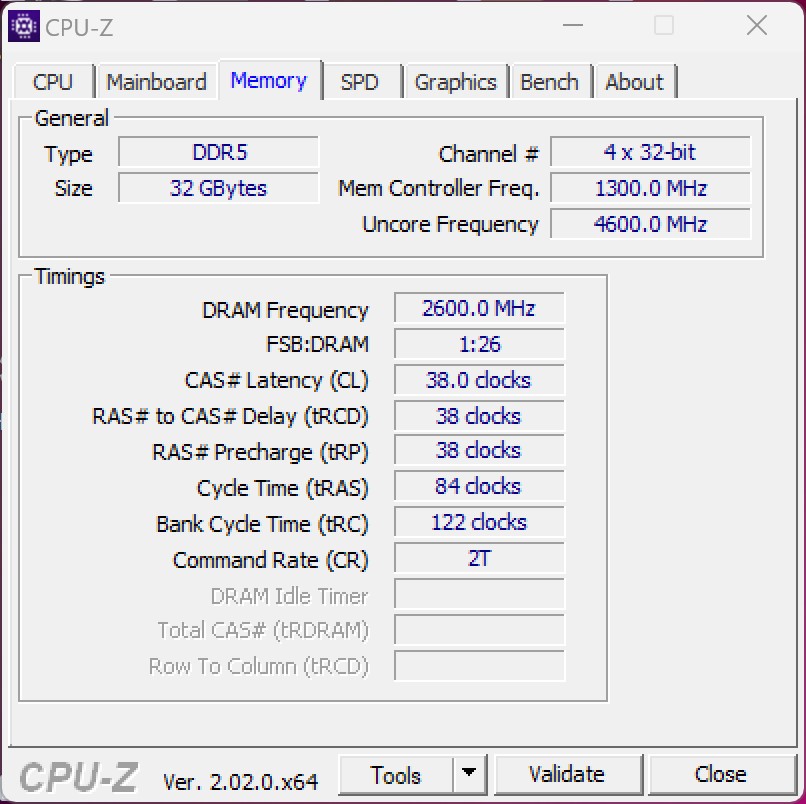
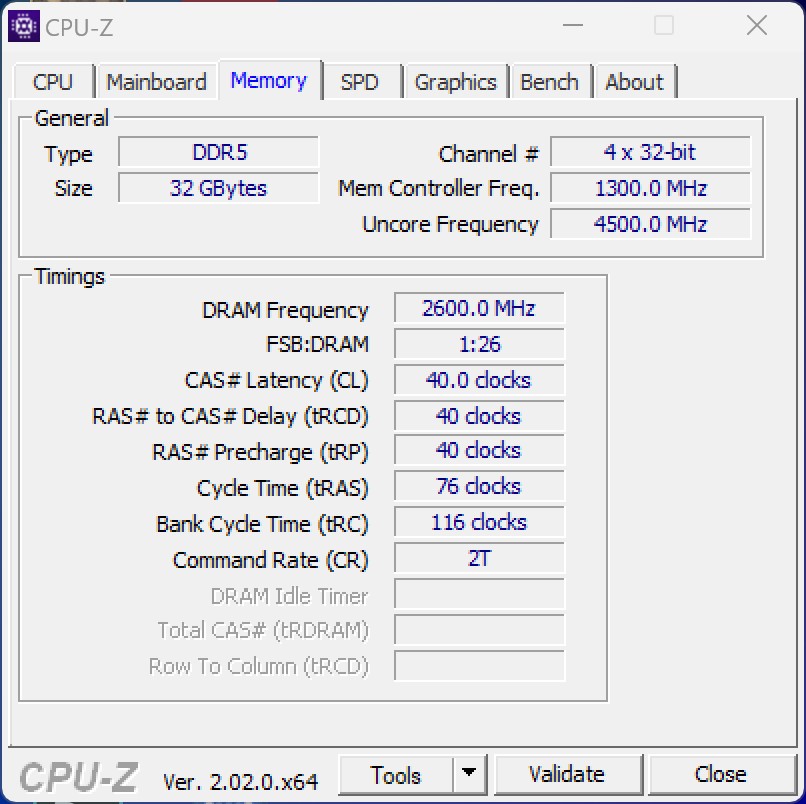
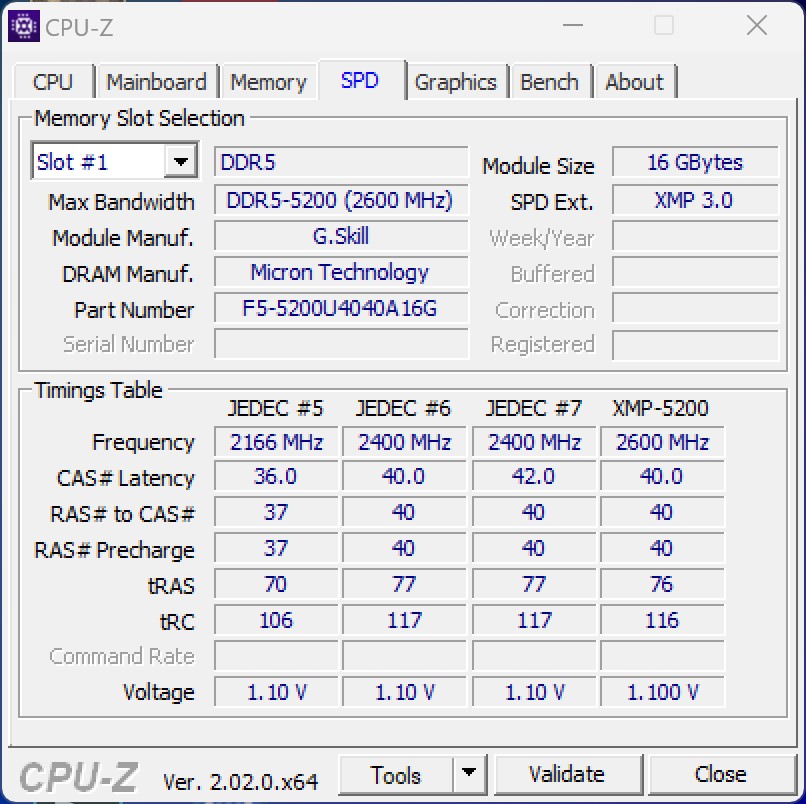
- G.Skill Ripjaws S5 (2x 16 GB - DDR5-5200)
- Intel Optane 905p (480 GB systeem + benchmarks)
- Microsoft Windows 11 Professional 64 Bit (versie 22H2)
Testomstandigheden - Z690 bruikbaar na BIOS-update
Voor deze test gebruiken we de Asus ROG Maximus Z690 Hero, die al werd gebruikt tijdens de Alder Lake S lancering. Niettemin zullen er met de nieuwe Z790-chipset bijgewerkte moederborden komen die zowel de 12e als de 13e generatie van de Intel-processoren ondersteunen. Je moet er echter nog steeds rekening mee houden dat de Intel Rocket Lake serie waarschijnlijk de laatste generatie zal zijn die de 1700 socket gebruikt.
Alle tests zijn uitgevoerd met het meest actuele BIOS en XMP-profiel geactiveerd. Daarnaast zijn alle stroombeperkingen uitgeschakeld om de volledige prestaties van de processoren te krijgen.
Opmerking:
Vanwege enkele problemen met de Asus ROG Maximus Z690 Hero tijdens onze tests, moesten we in plaats daarvan de Asus ROG Strix Z690-I Gaming WiFi gebruiken voor alle benchmarks met de Intel Core i5-13600K. Een korte prestatievergelijking met de Asus ROG Maximus Z690 Hero liet geen significante prestatieverschillen zien. Na een gesprek met Asus konden we vaststellen dat er een probleem was met het BIOS van de tot dan toe gebruikte versie. Asus reageerde onmiddellijk en herstelde de problemen met de versie 2103.
Processor benchmarks
In vergelijking met de oudere Alder Lake S-processoren is de prestatieverhoging op alle gebieden enorm. De verhoogde IPC gaat gepaard met een aanzienlijk hogere Boost-snelheid, die bij implicatie ook voldoende is voor een prestatieverhoging van 19% in de Intel Core i9-13900K ten opzichte van de Intel Core i9-12900K. In de afzonderlijke vergelijkingen zijn zelfs prestatiesprongen tot 49% mogelijk. Bij het kleinere Core-i5 model meten we een prestatieverhoging van 14% ten opzichte van het oudere Alder Lake monster
In het duel van de topmodellen weet de Intel Core i9-13900K de AMD Ryzen 9 7950X net voor te blijven. Subjectief gezien opereren beide topmodellen op ooghoogte. Toch zien we dat in sommige tests Intel voor ligt en in andere AMD. Als voorbeeld kunnen we de 3DMark nemen, waar de Intel-processor de AMD-modellen beduidend voorblijft wat betreft de CPU-benchmarks. Aan de andere kant weet AMD te scoren in de wPrime test, waar Intel duidelijk achterblijft.
De kleinere Intel Core i5-13600K concurreert met de AMD Ryzen 5 7600X. Hier is het aanzienlijk hogere aantal threads (20 vs. 12) de sleutel tot zijn succes. Een voordeel van 7% in de prestatiebeoordeling is echter niet erg significant. Maar de twee processoren zijn nog steeds vergelijkbaar, omdat ze allebei tot dezelfde prijsklasse behoren.
Voor de volledigheid hebben we alle CPU-tests ook uitgevoerd met de PL2 geactiveerd. Zoals u aan de resultaten kunt zien, is er geen nadeel als u de vermogenslimiet instelt. In delen zijn zelfs betere waarden mogelijk, omdat de CPU's hier geen kritische temperaturen bereiken.
Extra benchmarks over de processoren kunt u hier
Intel Core i9-13900K


Intel Core i5-13600K
| Performance rating - Percent | |
| Intel Core i9-13900K | |
| Intel Core i9-13900K @253W | |
| NVIDIA GeForce RTX 3090 Founders Edition | |
| AMD Ryzen 9 7900X | |
| Intel Core i9-12900K | |
| Intel Core i5-13600K | |
| Intel Core i5-13600K @181W | |
| AMD Ryzen 5 7600X | |
| Intel Core i5-12600K | |
| Cinebench R15 | |
| CPU Single 64Bit | |
| NVIDIA GeForce RTX 3090 Founders Edition | |
| Intel Core i9-13900K @253W | |
| Intel Core i9-13900K | |
| AMD Ryzen 9 7900X | |
| AMD Ryzen 5 7600X | |
| Intel Core i5-13600K | |
| Intel Core i9-12900K | |
| Intel Core i5-13600K @181W | |
| Intel Core i5-12600K | |
| CPU Multi 64Bit | |
| NVIDIA GeForce RTX 3090 Founders Edition | |
| Intel Core i9-13900K | |
| Intel Core i9-13900K @253W | |
| AMD Ryzen 9 7900X | |
| Intel Core i9-12900K | |
| Intel Core i5-13600K | |
| Intel Core i5-13600K @181W | |
| Intel Core i5-12600K | |
| AMD Ryzen 5 7600X | |
| Cinebench R20 | |
| CPU (Single Core) | |
| Intel Core i9-13900K @253W | |
| Intel Core i9-13900K | |
| NVIDIA GeForce RTX 3090 Founders Edition | |
| AMD Ryzen 9 7900X | |
| Intel Core i5-13600K | |
| Intel Core i9-12900K | |
| Intel Core i5-13600K @181W | |
| AMD Ryzen 5 7600X | |
| Intel Core i5-12600K | |
| CPU (Multi Core) | |
| Intel Core i9-13900K | |
| NVIDIA GeForce RTX 3090 Founders Edition | |
| Intel Core i9-13900K @253W | |
| AMD Ryzen 9 7900X | |
| Intel Core i9-12900K | |
| Intel Core i5-13600K | |
| Intel Core i5-13600K @181W | |
| Intel Core i5-12600K | |
| AMD Ryzen 5 7600X | |
| Cinebench R23 | |
| Single Core | |
| Intel Core i9-13900K @253W | |
| Intel Core i9-13900K | |
| NVIDIA GeForce RTX 3090 Founders Edition | |
| AMD Ryzen 9 7900X | |
| Intel Core i5-13600K | |
| Intel Core i9-12900K | |
| Intel Core i5-13600K @181W | |
| AMD Ryzen 5 7600X | |
| Intel Core i5-12600K | |
| Multi Core | |
| Intel Core i9-13900K | |
| Intel Core i9-13900K @253W | |
| NVIDIA GeForce RTX 3090 Founders Edition | |
| AMD Ryzen 9 7900X | |
| Intel Core i9-12900K | |
| Intel Core i5-13600K | |
| Intel Core i5-13600K @181W | |
| Intel Core i5-12600K | |
| AMD Ryzen 5 7600X | |
| Cinebench R11.5 | |
| CPU Single 64Bit | |
| Intel Core i9-13900K @253W | |
| Intel Core i9-13900K | |
| NVIDIA GeForce RTX 3090 Founders Edition | |
| AMD Ryzen 9 7900X | |
| AMD Ryzen 5 7600X | |
| Intel Core i9-12900K | |
| Intel Core i5-13600K | |
| Intel Core i5-13600K @181W | |
| Intel Core i5-12600K | |
| CPU Multi 64Bit | |
| Intel Core i9-13900K | |
| NVIDIA GeForce RTX 3090 Founders Edition | |
| Intel Core i9-13900K @253W | |
| AMD Ryzen 9 7900X | |
| Intel Core i9-12900K | |
| Intel Core i5-13600K | |
| Intel Core i5-13600K @181W | |
| Intel Core i5-12600K | |
| AMD Ryzen 5 7600X | |
| Cinebench R10 | |
| Rendering Single CPUs 64Bit | |
| Intel Core i9-13900K @253W | |
| Intel Core i9-13900K | |
| AMD Ryzen 9 7900X | |
| NVIDIA GeForce RTX 3090 Founders Edition | |
| Intel Core i5-13600K | |
| Intel Core i9-12900K | |
| Intel Core i5-13600K @181W | |
| AMD Ryzen 5 7600X | |
| Intel Core i5-12600K | |
| Rendering Multiple CPUs 64Bit | |
| Intel Core i9-13900K @253W | |
| Intel Core i9-13900K | |
| NVIDIA GeForce RTX 3090 Founders Edition | |
| AMD Ryzen 9 7900X | |
| Intel Core i9-12900K | |
| Intel Core i5-13600K @181W | |
| Intel Core i5-13600K | |
| AMD Ryzen 5 7600X | |
| Intel Core i5-12600K | |
| Blender - v2.79 BMW27 CPU | |
| AMD Ryzen 5 7600X | |
| Intel Core i5-12600K | |
| Intel Core i5-13600K | |
| Intel Core i5-13600K @181W | |
| Intel Core i9-12900K | |
| AMD Ryzen 9 7900X | |
| NVIDIA GeForce RTX 3090 Founders Edition | |
| Intel Core i9-13900K @253W | |
| Intel Core i9-13900K | |
| wPrime 2.10 | |
| 32m | |
| Intel Core i9-12900K | |
| Intel Core i5-12600K | |
| AMD Ryzen 5 7600X | |
| Intel Core i5-13600K | |
| Intel Core i5-13600K @181W | |
| Intel Core i9-13900K @253W | |
| Intel Core i9-13900K | |
| AMD Ryzen 9 7900X | |
| NVIDIA GeForce RTX 3090 Founders Edition | |
| 1024m | |
| Intel Core i5-12600K | |
| Intel Core i9-12900K | |
| Intel Core i5-13600K | |
| Intel Core i5-13600K @181W | |
| Intel Core i9-13900K @253W | |
| Intel Core i9-13900K | |
| AMD Ryzen 5 7600X | |
| AMD Ryzen 9 7900X | |
| NVIDIA GeForce RTX 3090 Founders Edition | |
| X264 HD Benchmark 4.0 | |
| Pass 1 | |
| Intel Core i9-13900K @253W | |
| Intel Core i9-13900K | |
| Intel Core i5-13600K | |
| Intel Core i5-13600K @181W | |
| NVIDIA GeForce RTX 3090 Founders Edition | |
| AMD Ryzen 9 7900X | |
| Intel Core i9-12900K | |
| AMD Ryzen 5 7600X | |
| Intel Core i5-12600K | |
| Pass 2 | |
| Intel Core i9-13900K | |
| NVIDIA GeForce RTX 3090 Founders Edition | |
| Intel Core i9-13900K @253W | |
| AMD Ryzen 9 7900X | |
| Intel Core i9-12900K | |
| Intel Core i5-13600K | |
| Intel Core i5-13600K @181W | |
| Intel Core i5-12600K | |
| AMD Ryzen 5 7600X | |
| WinRAR - Result | |
| AMD Ryzen 9 7900X | |
| NVIDIA GeForce RTX 3090 Founders Edition | |
| AMD Ryzen 5 7600X | |
| Intel Core i9-13900K @253W | |
| Intel Core i9-13900K | |
| Intel Core i5-13600K @181W | |
| Intel Core i5-13600K | |
| Intel Core i9-12900K | |
| Intel Core i5-12600K | |
| TrueCrypt | |
| AES Mean 100MB | |
| NVIDIA GeForce RTX 3090 Founders Edition | |
| Intel Core i9-13900K | |
| Intel Core i9-13900K @253W | |
| Intel Core i5-13600K @181W | |
| Intel Core i5-13600K | |
| Intel Core i9-12900K | |
| AMD Ryzen 9 7900X | |
| AMD Ryzen 5 7600X | |
| Intel Core i5-12600K | |
| Twofish Mean 100MB | |
| Intel Core i9-13900K | |
| Intel Core i9-13900K @253W | |
| NVIDIA GeForce RTX 3090 Founders Edition | |
| Intel Core i9-12900K | |
| Intel Core i5-13600K @181W | |
| Intel Core i5-13600K | |
| AMD Ryzen 9 7900X | |
| Intel Core i5-12600K | |
| AMD Ryzen 5 7600X | |
| Serpent Mean 100MB | |
| Intel Core i9-13900K | |
| Intel Core i9-13900K @253W | |
| NVIDIA GeForce RTX 3090 Founders Edition | |
| Intel Core i9-12900K | |
| Intel Core i5-13600K | |
| Intel Core i5-13600K @181W | |
| AMD Ryzen 9 7900X | |
| Intel Core i5-12600K | |
| AMD Ryzen 5 7600X | |
| Geekbench 5.5 | |
| Multi-Core | |
| NVIDIA GeForce RTX 3090 Founders Edition | |
| Intel Core i9-13900K | |
| Intel Core i9-13900K @253W | |
| AMD Ryzen 9 7900X | |
| Intel Core i9-12900K | |
| Intel Core i5-13600K @181W | |
| Intel Core i5-13600K | |
| Intel Core i5-12600K | |
| AMD Ryzen 5 7600X | |
| Single-Core | |
| NVIDIA GeForce RTX 3090 Founders Edition | |
| Intel Core i9-13900K | |
| Intel Core i9-13900K @253W | |
| AMD Ryzen 9 7900X | |
| AMD Ryzen 5 7600X | |
| Intel Core i9-12900K | |
| Intel Core i5-13600K @181W | |
| Intel Core i5-13600K | |
| Intel Core i5-12600K | |
| Geekbench 5.0 | |
| 5.0 Multi-Core | |
| NVIDIA GeForce RTX 3090 Founders Edition | |
| Intel Core i9-13900K | |
| Intel Core i9-13900K @253W | |
| AMD Ryzen 9 7900X | |
| Intel Core i9-12900K | |
| Intel Core i5-13600K | |
| Intel Core i5-13600K @181W | |
| Intel Core i5-12600K | |
| AMD Ryzen 5 7600X | |
| 5.0 Single-Core | |
| Intel Core i9-13900K @253W | |
| NVIDIA GeForce RTX 3090 Founders Edition | |
| Intel Core i9-13900K | |
| AMD Ryzen 9 7900X | |
| AMD Ryzen 5 7600X | |
| Intel Core i9-12900K | |
| Intel Core i5-13600K @181W | |
| Intel Core i5-13600K | |
| Intel Core i5-12600K | |
| Geekbench 4.4 | |
| 64 Bit Single-Core Score | |
| Intel Core i9-13900K @253W | |
| Intel Core i9-13900K | |
| NVIDIA GeForce RTX 3090 Founders Edition | |
| AMD Ryzen 9 7900X | |
| AMD Ryzen 5 7600X | |
| Intel Core i9-12900K | |
| Intel Core i5-13600K @181W | |
| Intel Core i5-13600K | |
| Intel Core i5-12600K | |
| 64 Bit Multi-Core Score | |
| NVIDIA GeForce RTX 3090 Founders Edition | |
| Intel Core i9-13900K | |
| Intel Core i9-13900K @253W | |
| AMD Ryzen 9 7900X | |
| Intel Core i9-12900K | |
| Intel Core i5-13600K @181W | |
| Intel Core i5-13600K | |
| AMD Ryzen 5 7600X | |
| Intel Core i5-12600K | |
| 3DMark 11 - 1280x720 Performance Physics | |
| Intel Core i9-13900K | |
| Intel Core i9-13900K @253W | |
| Intel Core i5-13600K | |
| Intel Core i5-13600K @181W | |
| AMD Ryzen 9 7900X | |
| NVIDIA GeForce RTX 3090 Founders Edition | |
| Intel Core i9-12900K | |
| AMD Ryzen 5 7600X | |
| Intel Core i5-12600K | |
| 7-Zip 18.03 | |
| 7z b 4 | |
| NVIDIA GeForce RTX 3090 Founders Edition | |
| Intel Core i9-13900K | |
| Intel Core i9-13900K @253W | |
| AMD Ryzen 9 7900X | |
| Intel Core i9-12900K | |
| Intel Core i5-13600K | |
| Intel Core i5-13600K @181W | |
| AMD Ryzen 5 7600X | |
| Intel Core i5-12600K | |
| 7z b 4 -mmt1 | |
| NVIDIA GeForce RTX 3090 Founders Edition | |
| AMD Ryzen 9 7900X | |
| AMD Ryzen 5 7600X | |
| Intel Core i9-13900K @253W | |
| Intel Core i9-13900K | |
| Intel Core i9-12900K | |
| Intel Core i5-13600K | |
| Intel Core i5-13600K @181W | |
| Intel Core i5-12600K | |
| HWBOT x265 Benchmark v2.2 - 4k Preset | |
| NVIDIA GeForce RTX 3090 Founders Edition | |
| Intel Core i9-13900K | |
| Intel Core i9-13900K @253W | |
| AMD Ryzen 9 7900X | |
| Intel Core i5-12600K | |
| Intel Core i9-12900K | |
| Intel Core i5-13600K | |
| Intel Core i5-13600K @181W | |
| AMD Ryzen 5 7600X | |
| R Benchmark 2.5 - Overall mean | |
| Intel Core i5-12600K | |
| Intel Core i9-12900K | |
| Intel Core i5-13600K | |
| Intel Core i5-13600K @181W | |
| AMD Ryzen 5 7600X | |
| AMD Ryzen 9 7900X | |
| NVIDIA GeForce RTX 3090 Founders Edition | |
| Intel Core i9-13900K | |
| Intel Core i9-13900K @253W | |
| LibreOffice - 20 Documents To PDF | |
| Intel Core i5-12600K | |
| Intel Core i9-12900K | |
| AMD Ryzen 5 7600X | |
| Intel Core i9-13900K | |
| Intel Core i5-13600K @181W | |
| NVIDIA GeForce RTX 3090 Founders Edition | |
| Intel Core i5-13600K | |
| AMD Ryzen 9 7900X | |
| Intel Core i9-13900K @253W | |
| WebXPRT 3 - Overall | |
| AMD Ryzen 9 7900X | |
| Intel Core i9-13900K @253W | |
| NVIDIA GeForce RTX 3090 Founders Edition | |
| AMD Ryzen 5 7600X | |
| Intel Core i9-13900K | |
| Intel Core i5-13600K | |
| Intel Core i5-13600K @181W | |
| Intel Core i9-12900K | |
| Intel Core i5-12600K | |
| Mozilla Kraken 1.1 - Total | |
| Intel Core i5-12600K | |
| Intel Core i9-12900K | |
| Intel Core i5-13600K | |
| Intel Core i5-13600K @181W | |
| AMD Ryzen 5 7600X | |
| NVIDIA GeForce RTX 3090 Founders Edition | |
| Intel Core i9-13900K | |
| AMD Ryzen 9 7900X | |
| Intel Core i9-13900K @253W | |
| 3DMark | |
| 3840x2160 Fire Strike Ultra Physics | |
| Intel Core i9-13900K @253W | |
| Intel Core i9-13900K | |
| AMD Ryzen 9 7900X | |
| NVIDIA GeForce RTX 3090 Founders Edition | |
| Intel Core i9-12900K | |
| Intel Core i5-13600K @181W | |
| Intel Core i5-13600K | |
| AMD Ryzen 5 7600X | |
| Intel Core i5-12600K | |
| 1920x1080 Fire Strike Physics | |
| Intel Core i9-13900K @253W | |
| Intel Core i9-13900K | |
| AMD Ryzen 9 7900X | |
| NVIDIA GeForce RTX 3090 Founders Edition | |
| Intel Core i9-12900K | |
| Intel Core i5-13600K @181W | |
| Intel Core i5-13600K | |
| AMD Ryzen 5 7600X | |
| Intel Core i5-12600K | |
| 2560x1440 Time Spy CPU | |
| Intel Core i9-13900K @253W | |
| Intel Core i9-13900K | |
| Intel Core i9-12900K | |
| Intel Core i5-13600K | |
| Intel Core i5-13600K @181W | |
| AMD Ryzen 9 7900X | |
| NVIDIA GeForce RTX 3090 Founders Edition | |
| Intel Core i5-12600K | |
| AMD Ryzen 5 7600X | |
* ... kleiner is beter
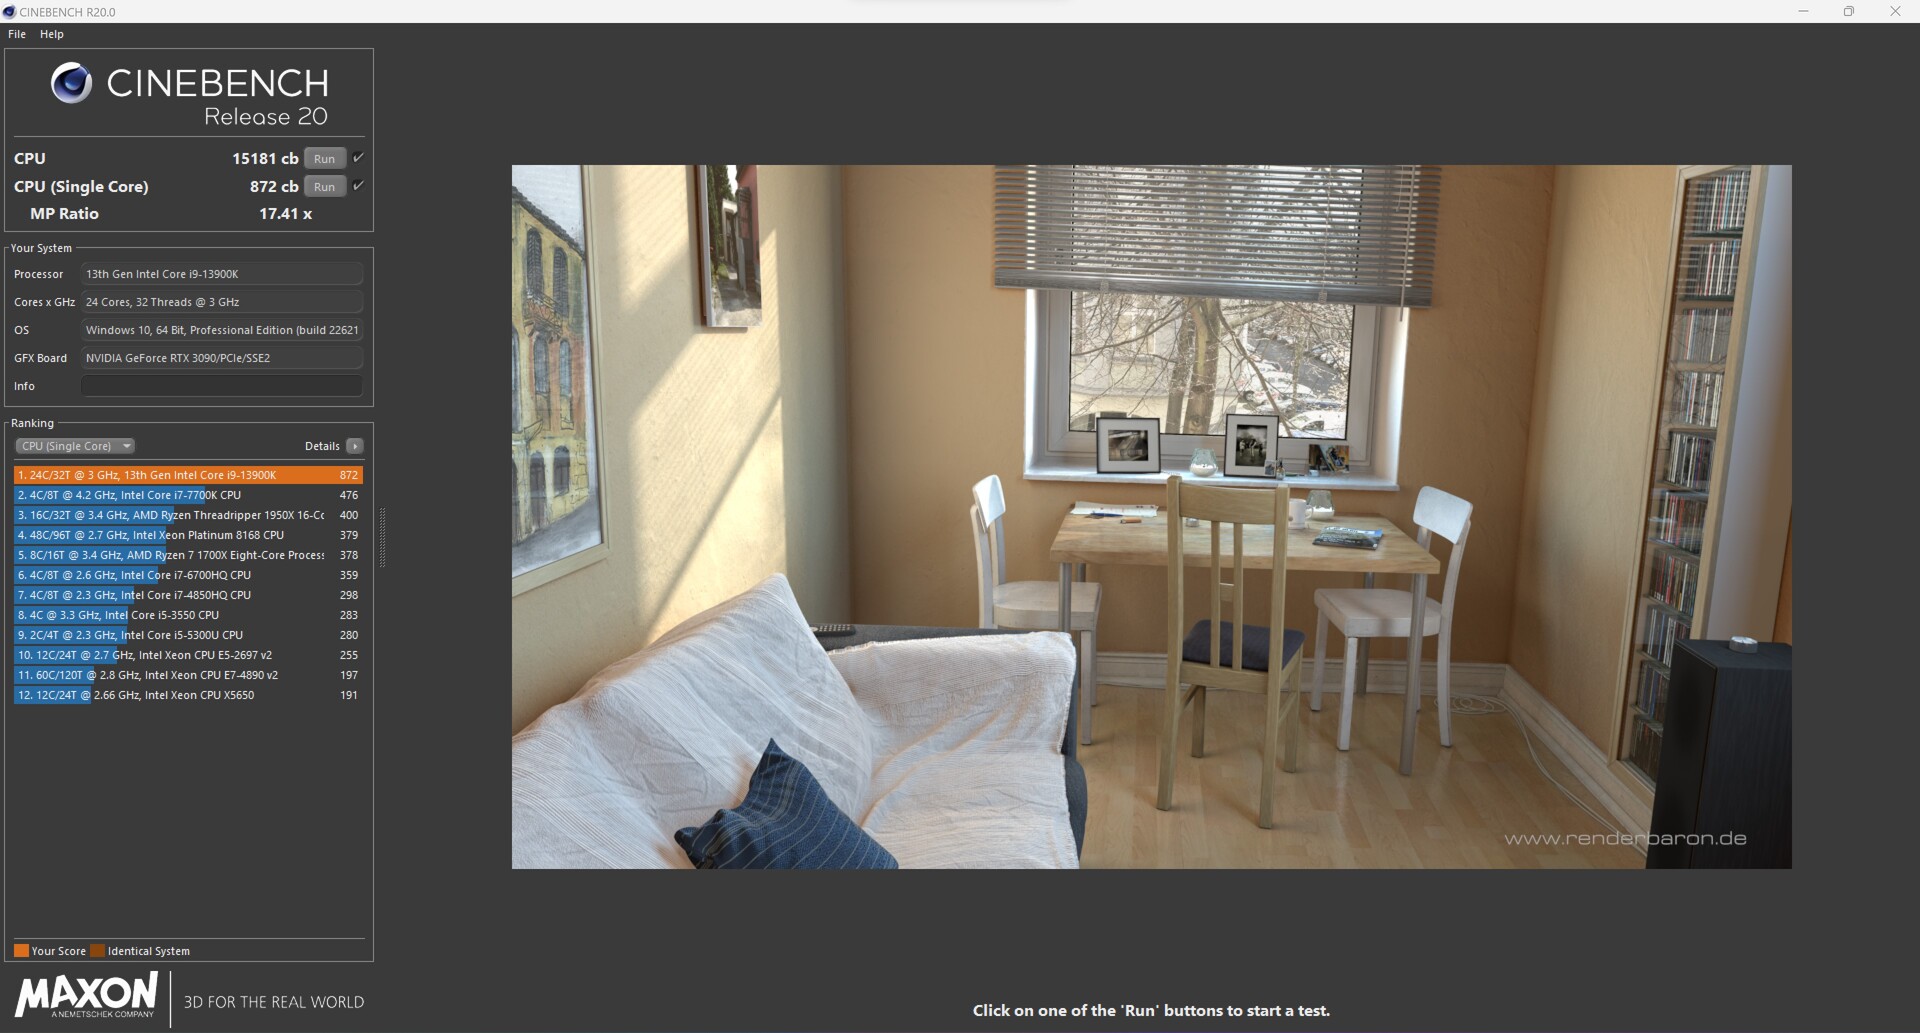
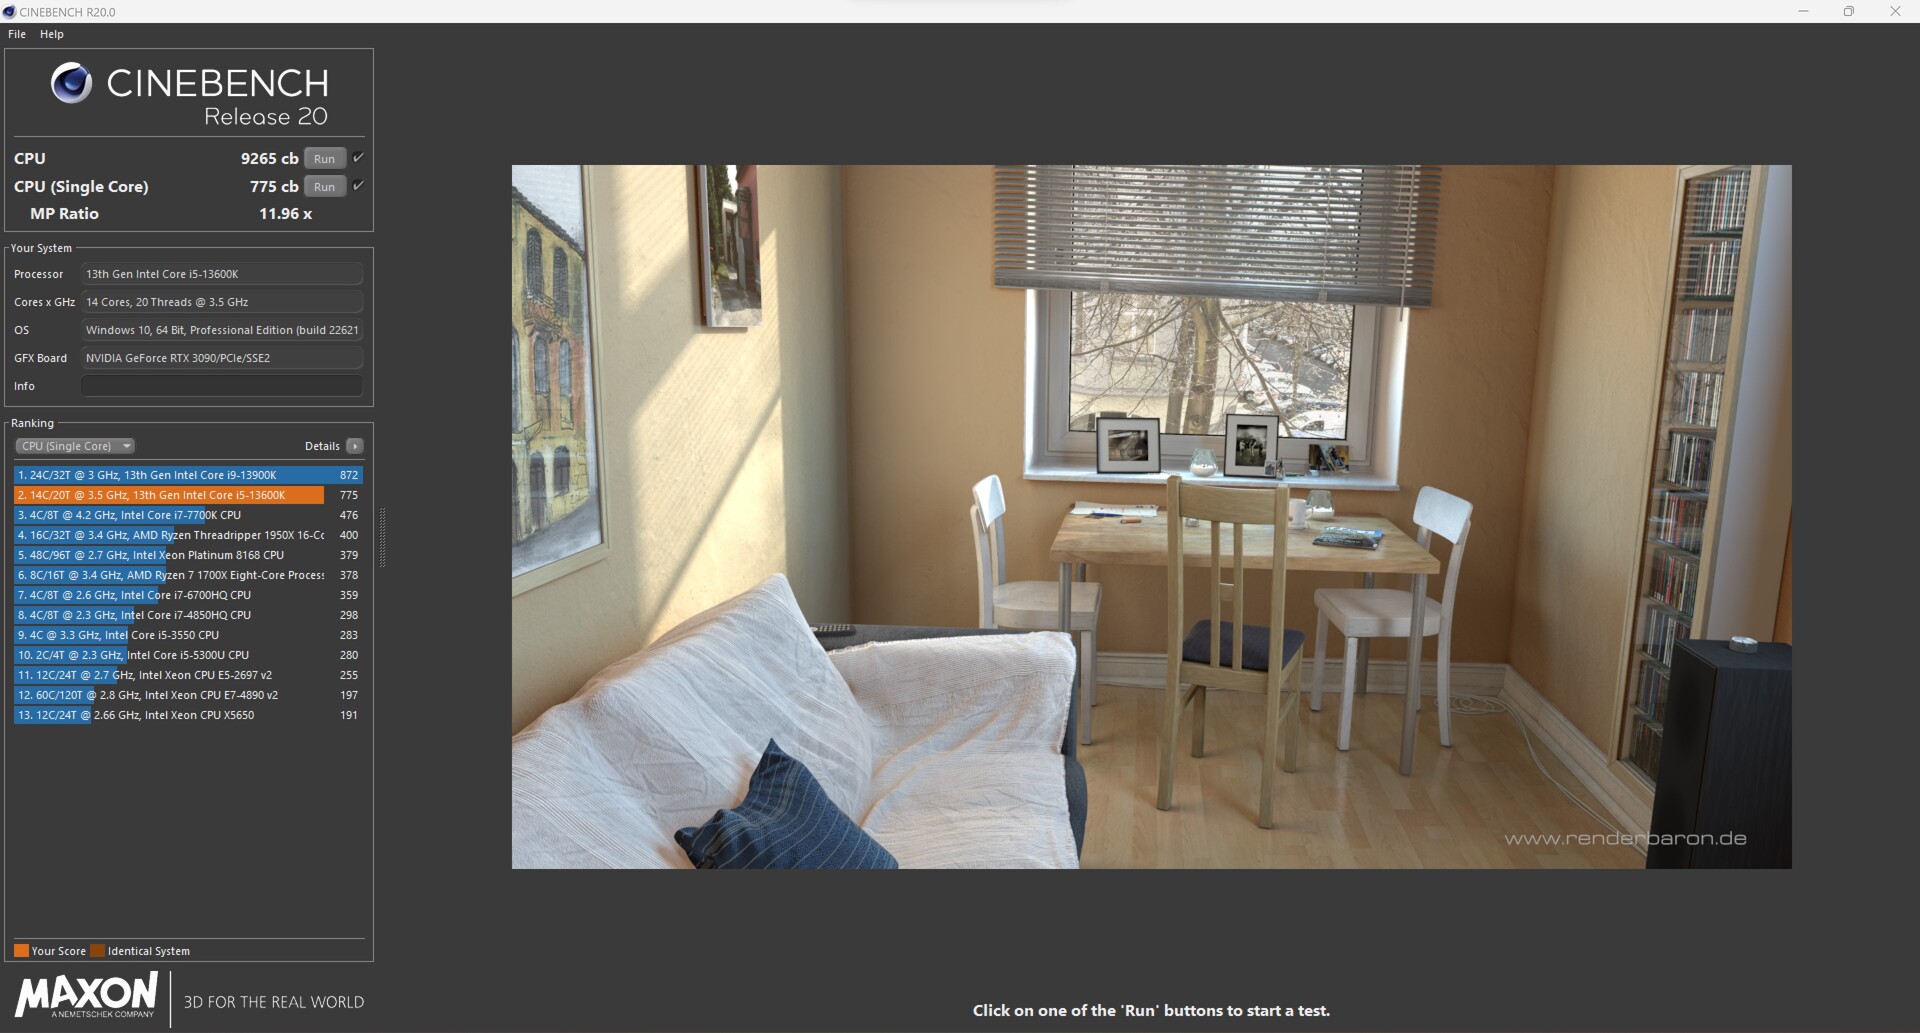
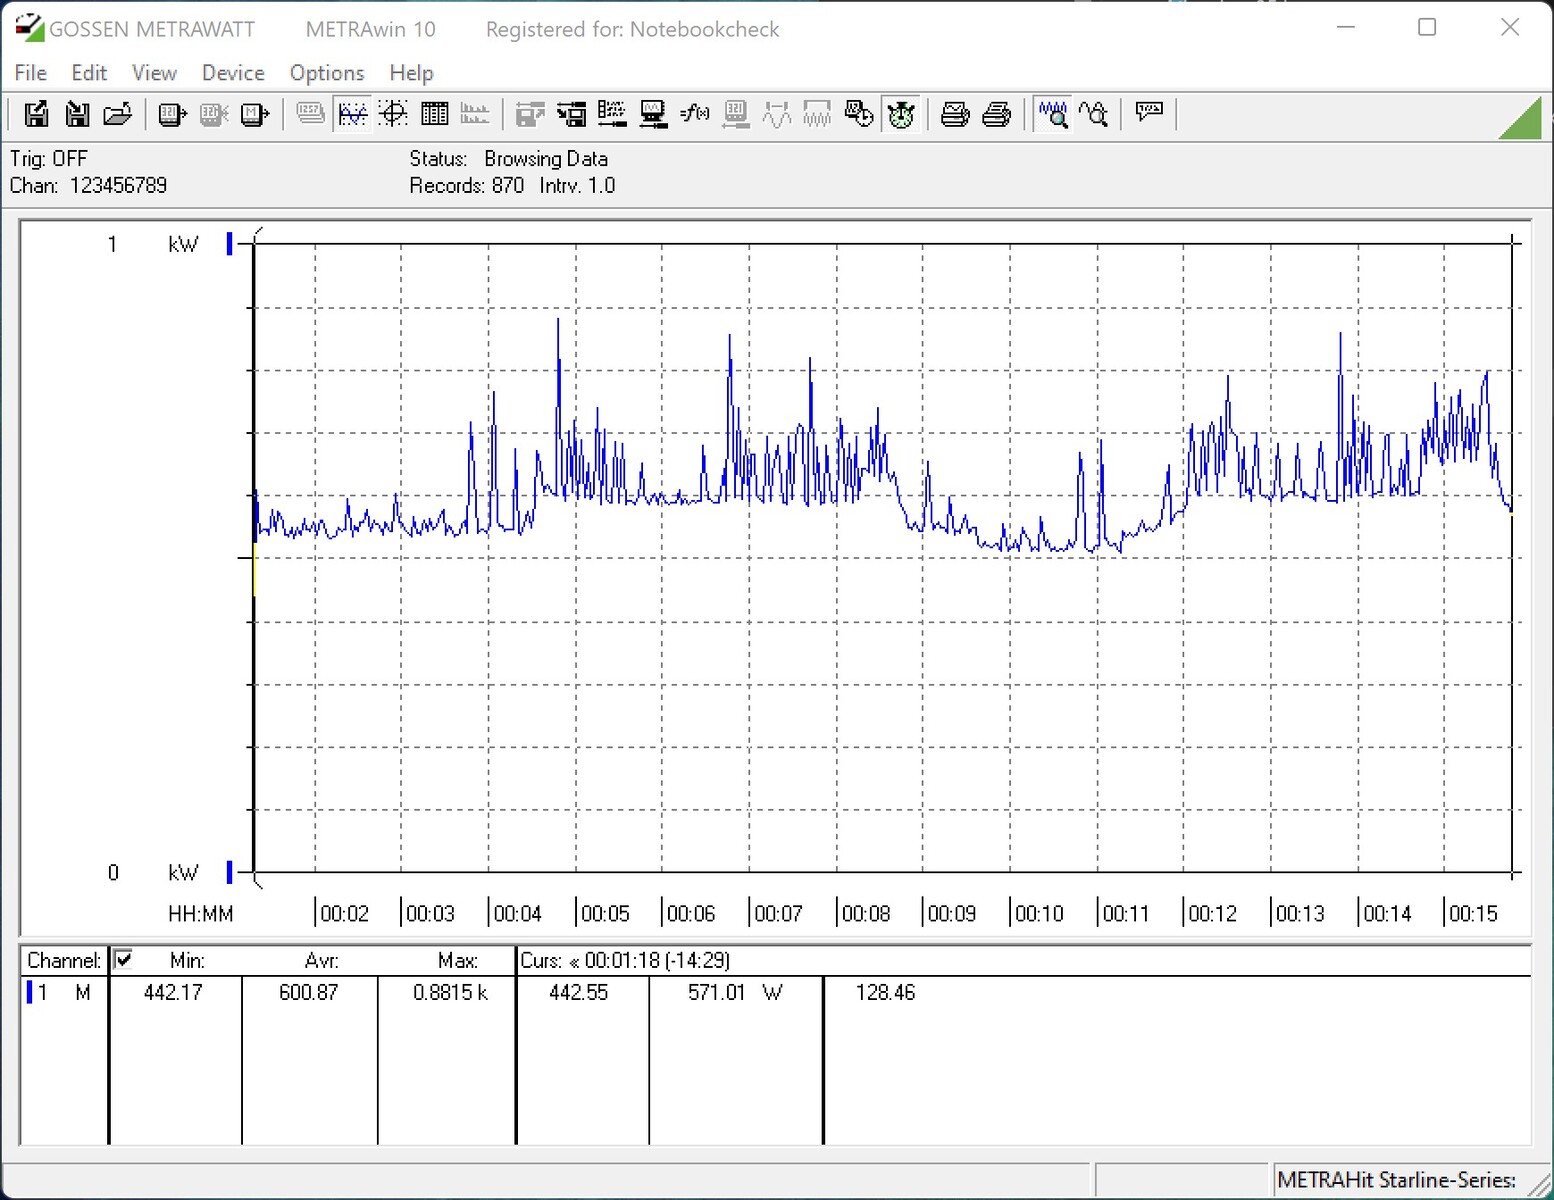
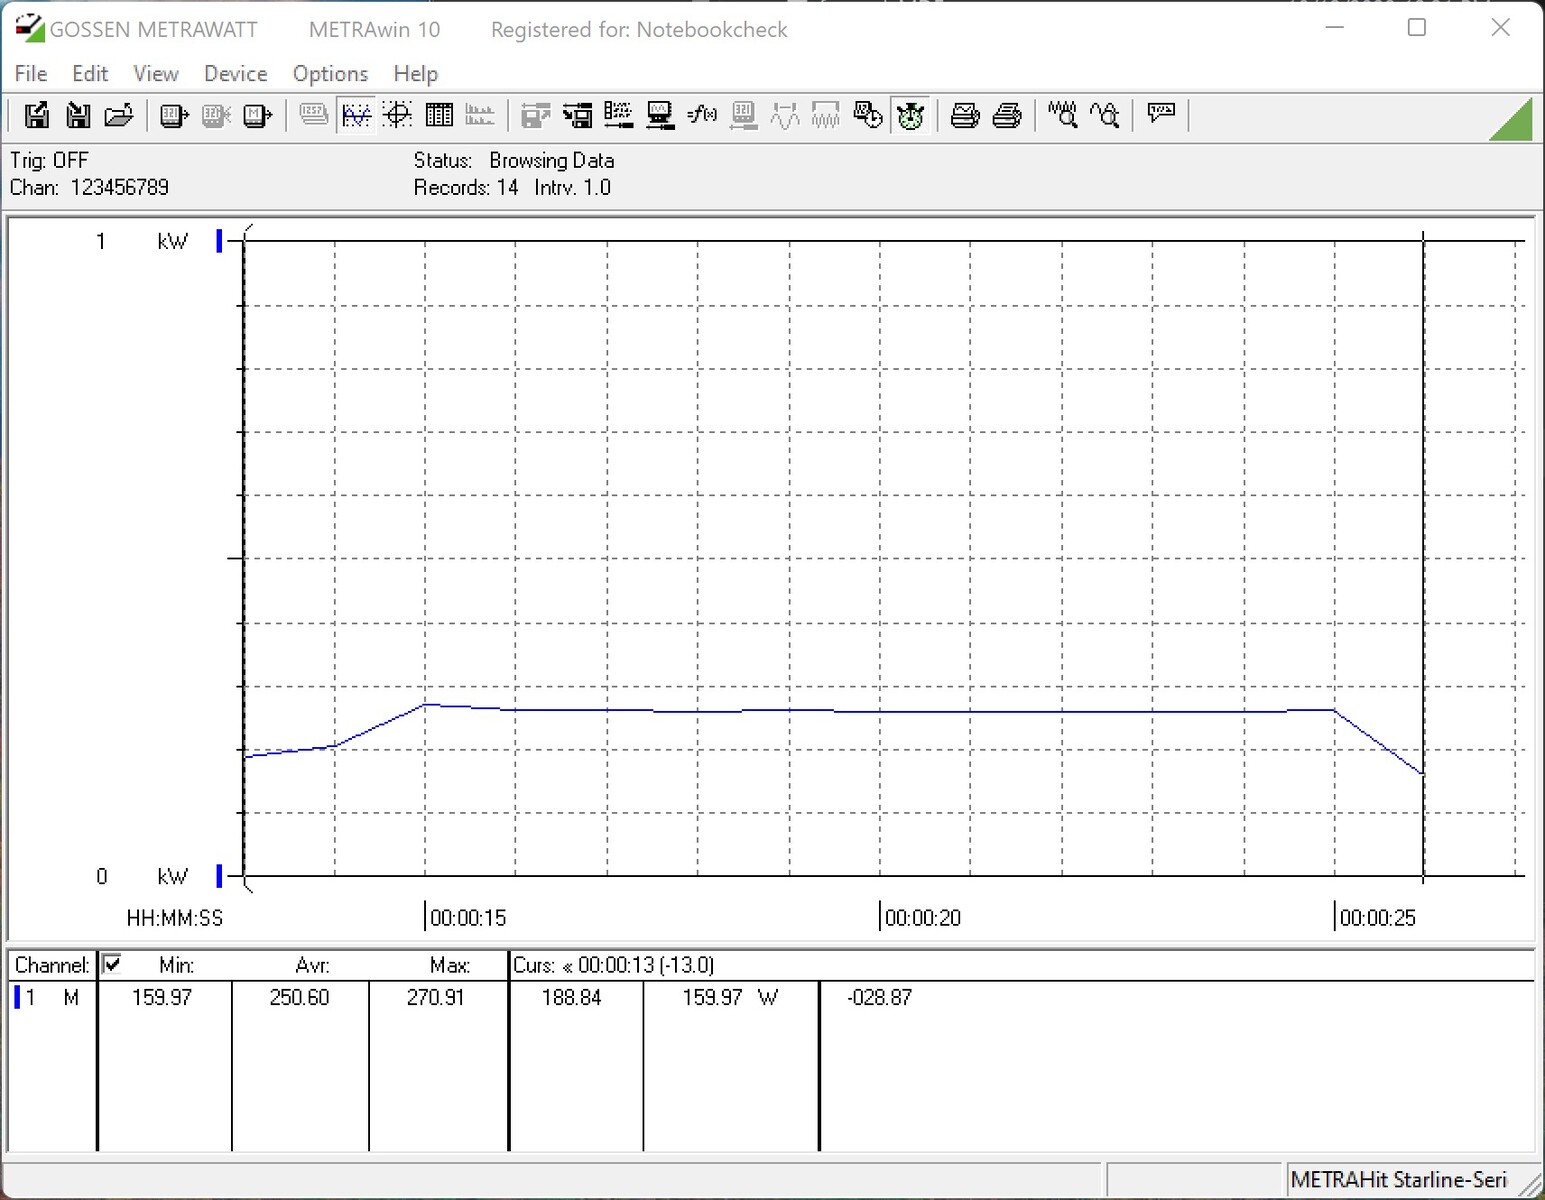
Intel Core i9-13900K + Intel Core i5-13600K vs. Cinebench R15 multi loop
In de belastingstest, waarbij we de Cinebench R15 constante loop draaien, laten beide testunits een zeer stabiele prestatie zien. Wel moeten we nog vermelden dat de Intel Core i9-13900K constant op de temperatuurgrens draait. Maar bij meer dan 2.000 punten is de prestatieverhoging ten opzichte van de Intel Core i9-12900Knog steeds enorm. Met een gemiddelde van 3.620 punten over alle 50 runs is de Intel Core i5-13600K ook het vermelden waard.
Synthetische benchmarks en toepassingsprestaties
Terwijl de synthetische benchmarks vorig jaar bij de Alder Lake release nog duidelijk Intels domein waren, ziet het er dit jaar niet zo duidelijk uit. AMD is in staat om zijn Ryzen 9-processoren bij te houden, en Intel behaalt slechts de derde plaats in de PCMark 10 benchmark. In vergelijking met Alder Lake is Raptor Lake echter in staat om overal een voorsprong op te bouwen en goede prestaties neer te zetten.
| PCMark 10 - Score | |
| AMD Ryzen 9 7900X, NVIDIA GeForce RTX 3090 | |
| NVIDIA GeForce RTX 3090 Founders Edition, NVIDIA GeForce RTX 3090 | |
| Intel Core i9-13900K, NVIDIA GeForce RTX 3090 | |
| AMD Ryzen 5 7600X, NVIDIA GeForce RTX 3090 | |
| Intel Core i5-13600K, NVIDIA GeForce RTX 3090 | |
| Intel Core i9-12900K, NVIDIA Titan RTX | |
| Intel Core i5-12600K, NVIDIA Titan RTX | |
| 3DMark | |
| 1920x1080 Fire Strike Physics | |
| Intel Core i9-13900K @253W, NVIDIA GeForce RTX 3090 | |
| Intel Core i9-13900K, NVIDIA GeForce RTX 3090 | |
| AMD Ryzen 9 7900X, NVIDIA GeForce RTX 3090 | |
| NVIDIA GeForce RTX 3090 Founders Edition, NVIDIA GeForce RTX 3090 | |
| Intel Core i9-12900K, NVIDIA Titan RTX | |
| Intel Core i5-13600K @181W, NVIDIA GeForce RTX 3090 | |
| Intel Core i5-13600K, NVIDIA GeForce RTX 3090 | |
| AMD Ryzen 5 7600X, NVIDIA GeForce RTX 3090 | |
| Intel Core i5-12600K, NVIDIA Titan RTX | |
| 2560x1440 Time Spy CPU | |
| Intel Core i9-13900K @253W, NVIDIA GeForce RTX 3090 | |
| Intel Core i9-13900K, NVIDIA GeForce RTX 3090 | |
| Intel Core i9-12900K, NVIDIA Titan RTX | |
| Intel Core i5-13600K, NVIDIA GeForce RTX 3090 | |
| Intel Core i5-13600K @181W, NVIDIA GeForce RTX 3090 | |
| AMD Ryzen 9 7900X, NVIDIA GeForce RTX 3090 | |
| NVIDIA GeForce RTX 3090 Founders Edition, NVIDIA GeForce RTX 3090 | |
| Intel Core i5-12600K, NVIDIA Titan RTX | |
| AMD Ryzen 5 7600X, NVIDIA GeForce RTX 3090 | |
| 3DMark 11 - 1280x720 Performance Physics | |
| Intel Core i9-13900K, NVIDIA GeForce RTX 3090 | |
| Intel Core i9-13900K @253W, NVIDIA GeForce RTX 3090 | |
| Intel Core i5-13600K, NVIDIA GeForce RTX 3090 | |
| Intel Core i5-13600K @181W, NVIDIA GeForce RTX 3090 | |
| AMD Ryzen 9 7900X, NVIDIA GeForce RTX 3090 | |
| NVIDIA GeForce RTX 3090 Founders Edition, NVIDIA GeForce RTX 3090 | |
| Intel Core i9-12900K, NVIDIA Titan RTX | |
| AMD Ryzen 5 7600X, NVIDIA GeForce RTX 3090 | |
| Intel Core i5-12600K, NVIDIA Titan RTX | |
| Desktop-PC, NVIDIA GeForce RTX 3090 | |
| CrossMark - Overall | |
| Intel Core i9-13900K, NVIDIA GeForce RTX 3090 | |
| Intel Core i9-13900K @253W, NVIDIA GeForce RTX 3090 | |
| NVIDIA GeForce RTX 3090 Founders Edition, NVIDIA GeForce RTX 3090 | |
| AMD Ryzen 9 7900X, NVIDIA GeForce RTX 3090 | |
| Intel Core i5-13600K, NVIDIA GeForce RTX 3090 | |
| Intel Core i5-13600K @181W, NVIDIA GeForce RTX 3090 | |
| AMD Ryzen 5 7600X, NVIDIA GeForce RTX 3090 | |
| Intel Core i5-12600K, NVIDIA GeForce RTX 3090 | |
| AIDA64 / Memory Copy | |
| Intel Core i9-13900K @253W | |
| Intel Core i9-13900K | |
| Intel Core i5-13600K @181W | |
| Intel Core i9-12900K | |
| NVIDIA GeForce RTX 3090 Founders Edition | |
| Intel Core i5-13600K | |
| Intel Core i5-12600K | |
| AMD Ryzen 9 7900X | |
| AMD Ryzen 5 7600X | |
| Gemiddelde van klas (4514 - 234662, n=2224) | |
| AIDA64 / Memory Read | |
| Intel Core i9-13900K | |
| Intel Core i9-13900K @253W | |
| Intel Core i9-12900K | |
| NVIDIA GeForce RTX 3090 Founders Edition | |
| Intel Core i5-13600K @181W | |
| Intel Core i5-12600K | |
| Intel Core i5-13600K | |
| AMD Ryzen 9 7900X | |
| AMD Ryzen 5 7600X | |
| Gemiddelde van klas (4031 - 271066, n=2186) | |
| AIDA64 / Memory Write | |
| AMD Ryzen 5 7600X | |
| NVIDIA GeForce RTX 3090 Founders Edition | |
| AMD Ryzen 9 7900X | |
| Intel Core i9-13900K | |
| Intel Core i5-13600K @181W | |
| Intel Core i9-13900K @253W | |
| Intel Core i5-12600K | |
| Intel Core i9-12900K | |
| Intel Core i5-13600K | |
| Gemiddelde van klas (3506 - 242868, n=2191) | |
| AIDA64 / Memory Latency | |
| Gemiddelde van klas (6.1 - 536, n=2252) | |
| Intel Core i5-13600K | |
| Intel Core i9-13900K @253W | |
| Intel Core i9-13900K | |
| Intel Core i5-13600K @181W | |
| AMD Ryzen 5 7600X | |
| AMD Ryzen 9 7900X | |
| NVIDIA GeForce RTX 3090 Founders Edition | |
* ... kleiner is beter
Spelprestaties
Als het ging om de snelste gaming CPU in voorgaande jaren, kon je altijd rekenen op Intel. AMD wist toen echter met zijn Zen 4-processoren de zaken door elkaar te gooien, zodat er hier geen duidelijke winnaar is. In de gecumuleerde vergelijking van de elf games plaatst de Intel Core i9-13900K zich nauwelijks achter de AMD Ryzen 9 7950X. Als we echter ook naar de prijsklasse van de processoren kijken, weet Intels Core i9-13900K zich net voor de AMD Ryzen 9 7900X te plaatsen. Maar we moeten niet vergeten dat sommige games beter draaien met Intel-processoren, en andere, waarbij AMD-processoren de betere prestaties leveren. In de interne vergelijking tussen de twee Raptor Lake S-processoren is de Intel Core i5-13600Kverliest met slechts 7% ten opzichte van het vlaggenschip. Wie nog een AM4 moederbord gebruikt, kan ook kijken naar de AMD Ryzen 7 5800X3D, aangezien die CPU ook zeer goede gaming prestaties levert.
Zowel de Intel Core i9-13900K als de Intel Core i5-13600K processor leveren zeer goede gaming prestaties. In de CPU-limiet meten we enkele significante prestatieverschillen tussen de twee concurrenten, maar met toenemende resolutie en details wordt dit steeds minder significant. We kunnen Intel niet de kroon van de snelste gaming CPU van dit jaar geven, aangezien AMD een tikkeltje sneller is met de Ryzen 9 7950X. Alle concurrenten scoren weer dichter bij elkaar. Wie naast gamen ook streamt en het publiek erbij wil betrekken, heeft baat bij het hogere aantal threads, wat de huidige Raptor Lake-processoren ook erg interessant maakt voor content creators.
Gaming Performance - Raptor Lake vs. Alder Lake
| Performance rating - Percent | |
| Intel Core i9-13900K | |
| Intel Core i9-12900K | |
| Intel Core i5-13600K | |
| Intel Core i5-12600K -2! | |
| F1 22 | |
| 1920x1080 Low Preset AA:T AF:16x | |
| Intel Core i5-13600K | |
| Intel Core i9-13900K | |
| Intel Core i9-12900K | |
| Intel Core i5-12600K | |
| 1920x1080 Ultra High Preset AA:T AF:16x | |
| Intel Core i9-12900K | |
| Intel Core i5-12600K | |
| Intel Core i5-13600K | |
| Intel Core i9-13900K | |
| Far Cry 5 | |
| 1920x1080 Ultra Preset AA:T | |
| Intel Core i9-13900K | |
| Intel Core i5-13600K | |
| Intel Core i9-12900K | |
| Intel Core i5-12600K | |
| 1280x720 Low Preset AA:T | |
| Intel Core i9-13900K | |
| Intel Core i5-13600K | |
| Intel Core i9-12900K | |
| Intel Core i5-12600K | |
| X-Plane 11.11 | |
| 1920x1080 high (fps_test=3) | |
| Intel Core i9-13900K | |
| Intel Core i9-12900K | |
| Intel Core i5-13600K | |
| Intel Core i5-12600K | |
| 1280x720 low (fps_test=1) | |
| Intel Core i9-13900K | |
| Intel Core i9-12900K | |
| Intel Core i5-13600K | |
| Intel Core i5-12600K | |
| Final Fantasy XV Benchmark | |
| 1920x1080 High Quality | |
| Intel Core i5-13600K | |
| Intel Core i9-13900K | |
| Intel Core i9-12900K | |
| Intel Core i5-12600K | |
| 1280x720 Lite Quality | |
| Intel Core i5-13600K | |
| Intel Core i9-13900K | |
| Intel Core i9-12900K | |
| Intel Core i5-12600K | |
| Dota 2 Reborn | |
| 1920x1080 ultra (3/3) best looking | |
| Intel Core i9-13900K | |
| Intel Core i5-13600K | |
| Intel Core i9-12900K | |
| Intel Core i5-12600K | |
| 1280x720 min (0/3) fastest | |
| Intel Core i9-13900K | |
| Intel Core i5-13600K | |
| Intel Core i9-12900K | |
| Intel Core i5-12600K | |
| The Witcher 3 | |
| 1920x1080 Ultra Graphics & Postprocessing (HBAO+) | |
| Intel Core i5-13600K | |
| Intel Core i9-12900K | |
| Intel Core i9-13900K | |
| 1024x768 Low Graphics & Postprocessing | |
| Intel Core i9-13900K | |
| Intel Core i9-12900K | |
| Intel Core i5-13600K | |
| GTA V | |
| 1920x1080 Highest AA:4xMSAA + FX AF:16x | |
| Intel Core i9-13900K | |
| Intel Core i5-13600K | |
| Intel Core i9-12900K | |
| Intel Core i5-12600K | |
| 1024x768 Lowest Settings possible | |
| Intel Core i9-13900K | |
| Intel Core i5-13600K | |
| Intel Core i9-12900K | |
| Intel Core i5-12600K | |
Gaming Performance in Direct Comparison with AMD
| Performance rating - Percent | |
| AMD Ryzen 9 7950X | |
| Intel Core i9-13900K | |
| AMD Ryzen 9 7900X | |
| AMD Ryzen 5 7600X | |
| Intel Core i5-13600K | |
| F1 22 | |
| 1920x1080 Low Preset AA:T AF:16x | |
| AMD Ryzen 9 7950X | |
| AMD Ryzen 9 7900X | |
| AMD Ryzen 5 7600X | |
| Intel Core i5-13600K | |
| Intel Core i9-13900K | |
| 1920x1080 Ultra High Preset AA:T AF:16x | |
| AMD Ryzen 9 7950X | |
| Intel Core i5-13600K | |
| AMD Ryzen 5 7600X | |
| AMD Ryzen 9 7900X | |
| Intel Core i9-13900K | |
| Far Cry 5 | |
| 1920x1080 Ultra Preset AA:T | |
| Intel Core i9-13900K | |
| AMD Ryzen 9 7950X | |
| Intel Core i5-13600K | |
| AMD Ryzen 9 7900X | |
| AMD Ryzen 5 7600X | |
| 1280x720 Low Preset AA:T | |
| Intel Core i9-13900K | |
| AMD Ryzen 9 7900X | |
| Intel Core i5-13600K | |
| AMD Ryzen 9 7950X | |
| AMD Ryzen 5 7600X | |
| X-Plane 11.11 | |
| 1920x1080 high (fps_test=3) | |
| AMD Ryzen 9 7900X | |
| AMD Ryzen 9 7950X | |
| AMD Ryzen 5 7600X | |
| Intel Core i9-13900K | |
| Intel Core i5-13600K | |
| 1280x720 low (fps_test=1) | |
| Intel Core i9-13900K | |
| AMD Ryzen 5 7600X | |
| AMD Ryzen 9 7900X | |
| AMD Ryzen 9 7950X | |
| Intel Core i5-13600K | |
| Final Fantasy XV Benchmark | |
| 1920x1080 High Quality | |
| AMD Ryzen 9 7900X | |
| Intel Core i5-13600K | |
| Intel Core i9-13900K | |
| AMD Ryzen 9 7950X | |
| AMD Ryzen 5 7600X | |
| 1280x720 Lite Quality | |
| AMD Ryzen 9 7900X | |
| Intel Core i5-13600K | |
| AMD Ryzen 9 7950X | |
| Intel Core i9-13900K | |
| AMD Ryzen 5 7600X | |
| Dota 2 Reborn | |
| 1920x1080 ultra (3/3) best looking | |
| AMD Ryzen 9 7950X | |
| AMD Ryzen 9 7900X | |
| Intel Core i9-13900K | |
| AMD Ryzen 5 7600X | |
| Intel Core i5-13600K | |
| 1280x720 min (0/3) fastest | |
| AMD Ryzen 5 7600X | |
| AMD Ryzen 9 7900X | |
| AMD Ryzen 9 7950X | |
| Intel Core i9-13900K | |
| Intel Core i5-13600K | |
| The Witcher 3 | |
| 1920x1080 Ultra Graphics & Postprocessing (HBAO+) | |
| AMD Ryzen 9 7950X | |
| AMD Ryzen 9 7900X | |
| AMD Ryzen 5 7600X | |
| Intel Core i5-13600K | |
| Intel Core i9-13900K | |
| 1024x768 Low Graphics & Postprocessing | |
| AMD Ryzen 9 7950X | |
| AMD Ryzen 9 7900X | |
| Intel Core i9-13900K | |
| AMD Ryzen 5 7600X | |
| Intel Core i5-13600K | |
| GTA V | |
| 1920x1080 Highest AA:4xMSAA + FX AF:16x | |
| Intel Core i9-13900K | |
| AMD Ryzen 9 7950X | |
| AMD Ryzen 9 7900X | |
| AMD Ryzen 5 7600X | |
| Intel Core i5-13600K | |
| 1024x768 Lowest Settings possible | |
| Intel Core i9-13900K | |
| AMD Ryzen 9 7900X | |
| AMD Ryzen 5 7600X | |
| Intel Core i5-13600K | |
| AMD Ryzen 9 7950X | |
| Borderlands 3 | |
| 1280x720 Very Low Overall Quality (DX11) | |
| AMD Ryzen 9 7900X | |
| Intel Core i9-13900K | |
| AMD Ryzen 9 7950X | |
| AMD Ryzen 5 7600X | |
| Intel Core i5-13600K | |
| 1920x1080 Badass Overall Quality (DX11) | |
| AMD Ryzen 9 7950X | |
| AMD Ryzen 9 7900X | |
| Intel Core i9-13900K | |
| AMD Ryzen 5 7600X | |
| Intel Core i5-13600K | |
| Far Cry New Dawn | |
| 1280x720 Low Preset | |
| Intel Core i9-13900K | |
| AMD Ryzen 9 7950X | |
| Intel Core i5-13600K | |
| AMD Ryzen 9 7900X | |
| AMD Ryzen 5 7600X | |
| 1920x1080 Ultra Preset | |
| Intel Core i9-13900K | |
| AMD Ryzen 9 7950X | |
| Intel Core i5-13600K | |
| AMD Ryzen 9 7900X | |
| AMD Ryzen 5 7600X | |
| Shadow of the Tomb Raider | |
| 1280x720 Lowest Preset | |
| AMD Ryzen 9 7950X | |
| AMD Ryzen 9 7900X | |
| Intel Core i9-13900K | |
| AMD Ryzen 5 7600X | |
| Intel Core i5-13600K | |
| 1920x1080 Highest Preset AA:T | |
| AMD Ryzen 9 7900X | |
| AMD Ryzen 9 7950X | |
| Intel Core i9-13900K | |
| AMD Ryzen 5 7600X | |
| Intel Core i5-13600K | |
| Tiny Tina's Wonderlands | |
| 1920x1080 Low Preset (DX12) | |
| AMD Ryzen 9 7950X | |
| Intel Core i9-13900K | |
| AMD Ryzen 5 7600X | |
| AMD Ryzen 9 7900X | |
| Intel Core i5-13600K | |
| 1920x1080 Badass Preset (DX12) | |
| AMD Ryzen 9 7900X | |
| AMD Ryzen 5 7600X | |
| AMD Ryzen 9 7950X | |
| Intel Core i9-13900K | |
| Intel Core i5-13600K | |
Intel Core i9-13900K with Nvidia GeForce RTX 3090
| lage | gem. | hoge | ultra | QHD | 4K | |
|---|---|---|---|---|---|---|
| GTA V (2015) | 187.7 | 187.7 | 187.4 | 165.6 | 156.7 | 182.5 |
| The Witcher 3 (2015) | 752 | 584 | 368 | 179.8 | 151.6 | |
| Dota 2 Reborn (2015) | 285.3 | 256.1 | 243.7 | 229.2 | 215.9 | |
| Final Fantasy XV Benchmark (2018) | 234 | 233 | 188.9 | 148.2 | 88.5 | |
| X-Plane 11.11 (2018) | 234 | 202 | 148.4 | 128.4 | ||
| Far Cry 5 (2018) | 263 | 232 | 220 | 205 | 186 | 110 |
| Strange Brigade (2018) | 749 | 506 | 402 | 350 | 266 | 159 |
| Shadow of the Tomb Raider (2018) | 314 | 265 | 250 | 230 | 167.4 | 97.1 |
| Far Cry New Dawn (2019) | 221 | 191 | 183 | 166 | 156 | 111 |
| Metro Exodus (2019) | 285 | 217 | 173.9 | 141.3 | 116.4 | 76.2 |
| Borderlands 3 (2019) | 243 | 215 | 190.3 | 163 | 128.3 | 73.1 |
| F1 2020 (2020) | 515 | 438 | 407 | 297 | 233 | 142.4 |
| F1 2021 (2021) | 590 | 520 | 435 | 224 | 171.8 | 103.4 |
| Far Cry 6 (2021) | 226 | 192.3 | 169.2 | 159.1 | 133.5 | 84.5 |
| Forza Horizon 5 (2021) | 334 | 214 | 196 | 127 | 113 | 85 |
| God of War (2022) | 240 | 204 | 170.8 | 121.9 | 108.4 | 77.1 |
| Tiny Tina's Wonderlands (2022) | 368 | 297 | 209 | 165.8 | 121.7 | 69.2 |
| F1 22 (2022) | 320 | 338 | 308 | 122.6 | 82.5 | 41.8 |
| The Quarry (2022) | 279 | 217 | 177.3 | 146.1 | 104.6 | 59 |
Intel Core i5-13600K with Nvidia GeForce RTX 3090
| lage | gem. | hoge | ultra | QHD | 4K | |
|---|---|---|---|---|---|---|
| GTA V (2015) | 187.5 | 187.5 | 186.7 | 154.9 | 148.5 | 180.7 |
| The Witcher 3 (2015) | 611 | 551 | 369 | 183.2 | 152.8 | |
| Dota 2 Reborn (2015) | 246.2 | 224.6 | 216.8 | 205.4 | 200.4 | |
| Final Fantasy XV Benchmark (2018) | 235 | 230 | 189.7 | 145.6 | 86.8 | |
| X-Plane 11.11 (2018) | 200 | 175.3 | 131.4 | 112.7 | ||
| Far Cry 5 (2018) | 240 | 212 | 201 | 188 | 177 | 108 |
| Strange Brigade (2018) | 679 | 487 | 398 | 348 | 265 | 158.4 |
| Shadow of the Tomb Raider (2018) | 269 | 240 | 234 | 220 | 167.1 | 96.4 |
| Far Cry New Dawn (2019) | 201 | 176 | 170 | 153 | 146 | 108 |
| Metro Exodus (2019) | 272 | 218 | 173 | 140.8 | 115.5 | 75.7 |
| Borderlands 3 (2019) | 223 | 195.3 | 176.3 | 156.3 | 128.3 | 73.2 |
| F1 2020 (2020) | 456 | 383 | 376 | 295 | 233 | 142.1 |
| F1 2021 (2021) | 512 | 474 | 399 | 223 | 171.8 | 101.8 |
| Far Cry 6 (2021) | 195.3 | 183.1 | 170.8 | 151.2 | 132.4 | 84.1 |
| God of War (2022) | 228 | 205 | 168.9 | 122 | 106.5 | 76.5 |
| GRID Legends (2022) | 287 | 261 | 232 | 156 | 177.8 | 115.1 |
| Tiny Tina's Wonderlands (2022) | 358 | 290 | 208 | 165.1 | 120.8 | 68.8 |
| F1 22 (2022) | 322 | 373 | 432 | 128.1 | 84.1 | 42.4 |
| The Quarry (2022) | 270 | 213 | 177.9 | 145.9 | 105 | 59.4 |
Stroomverbruik
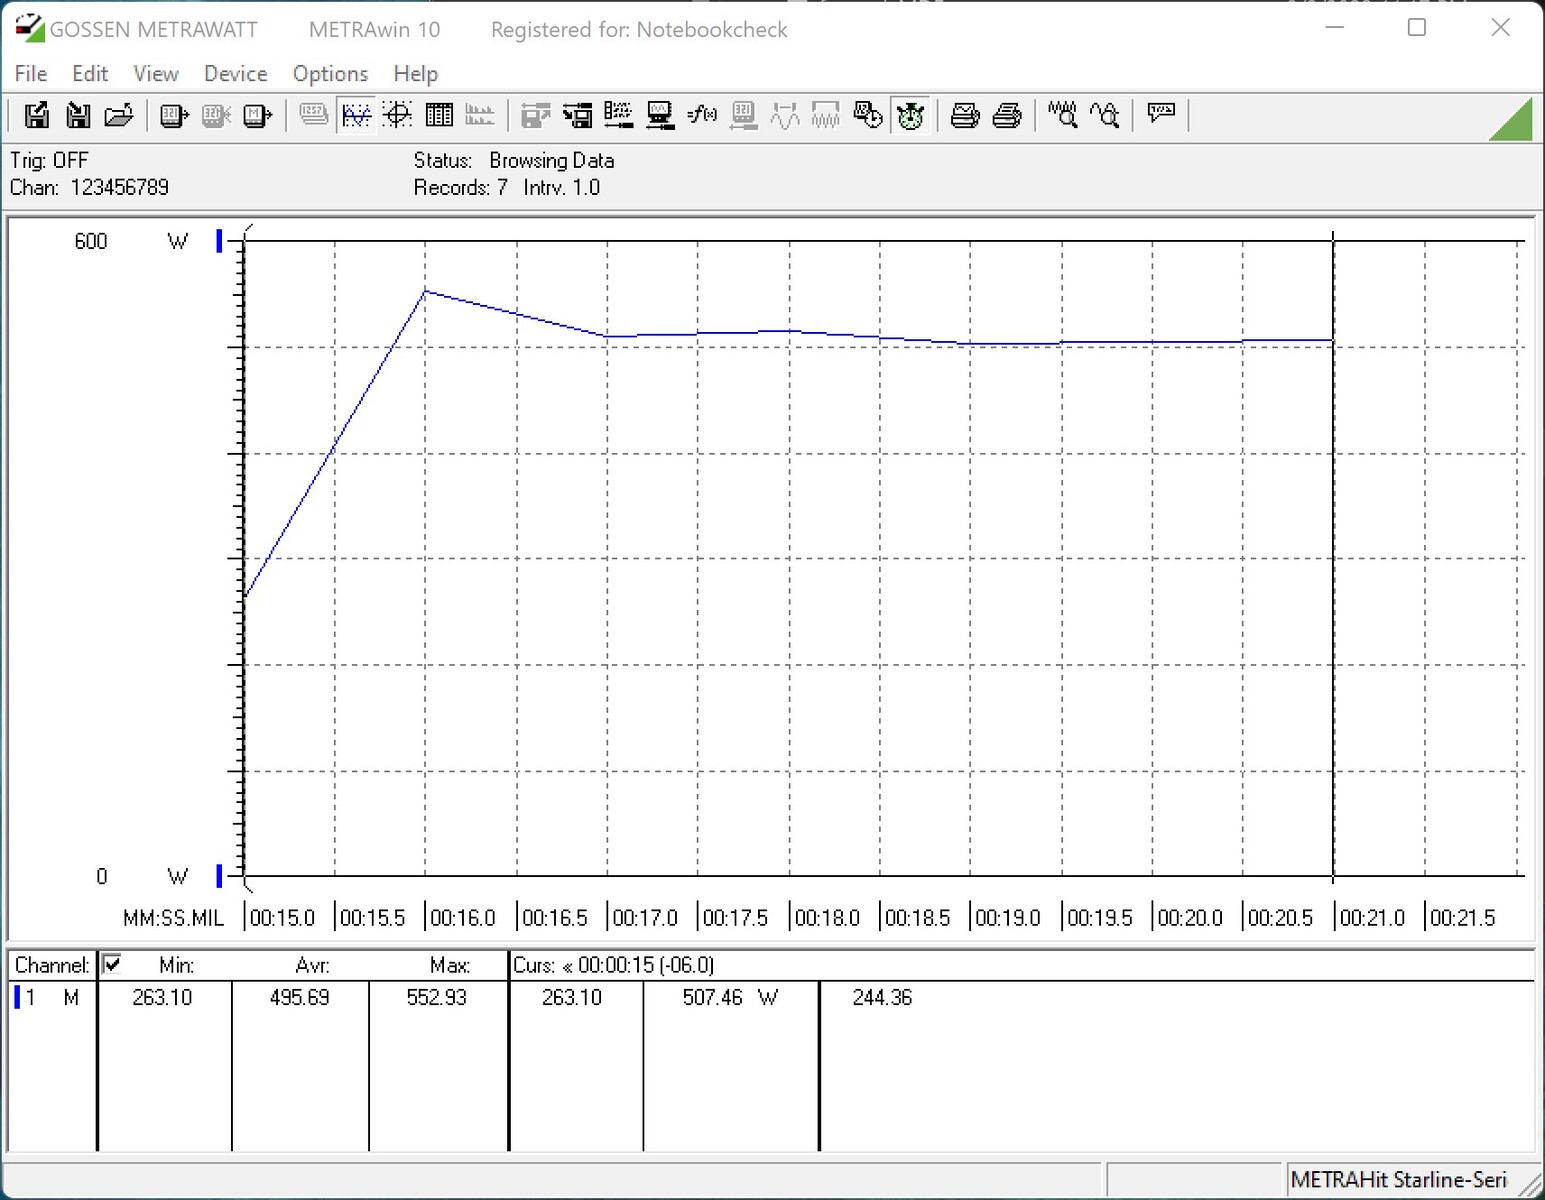
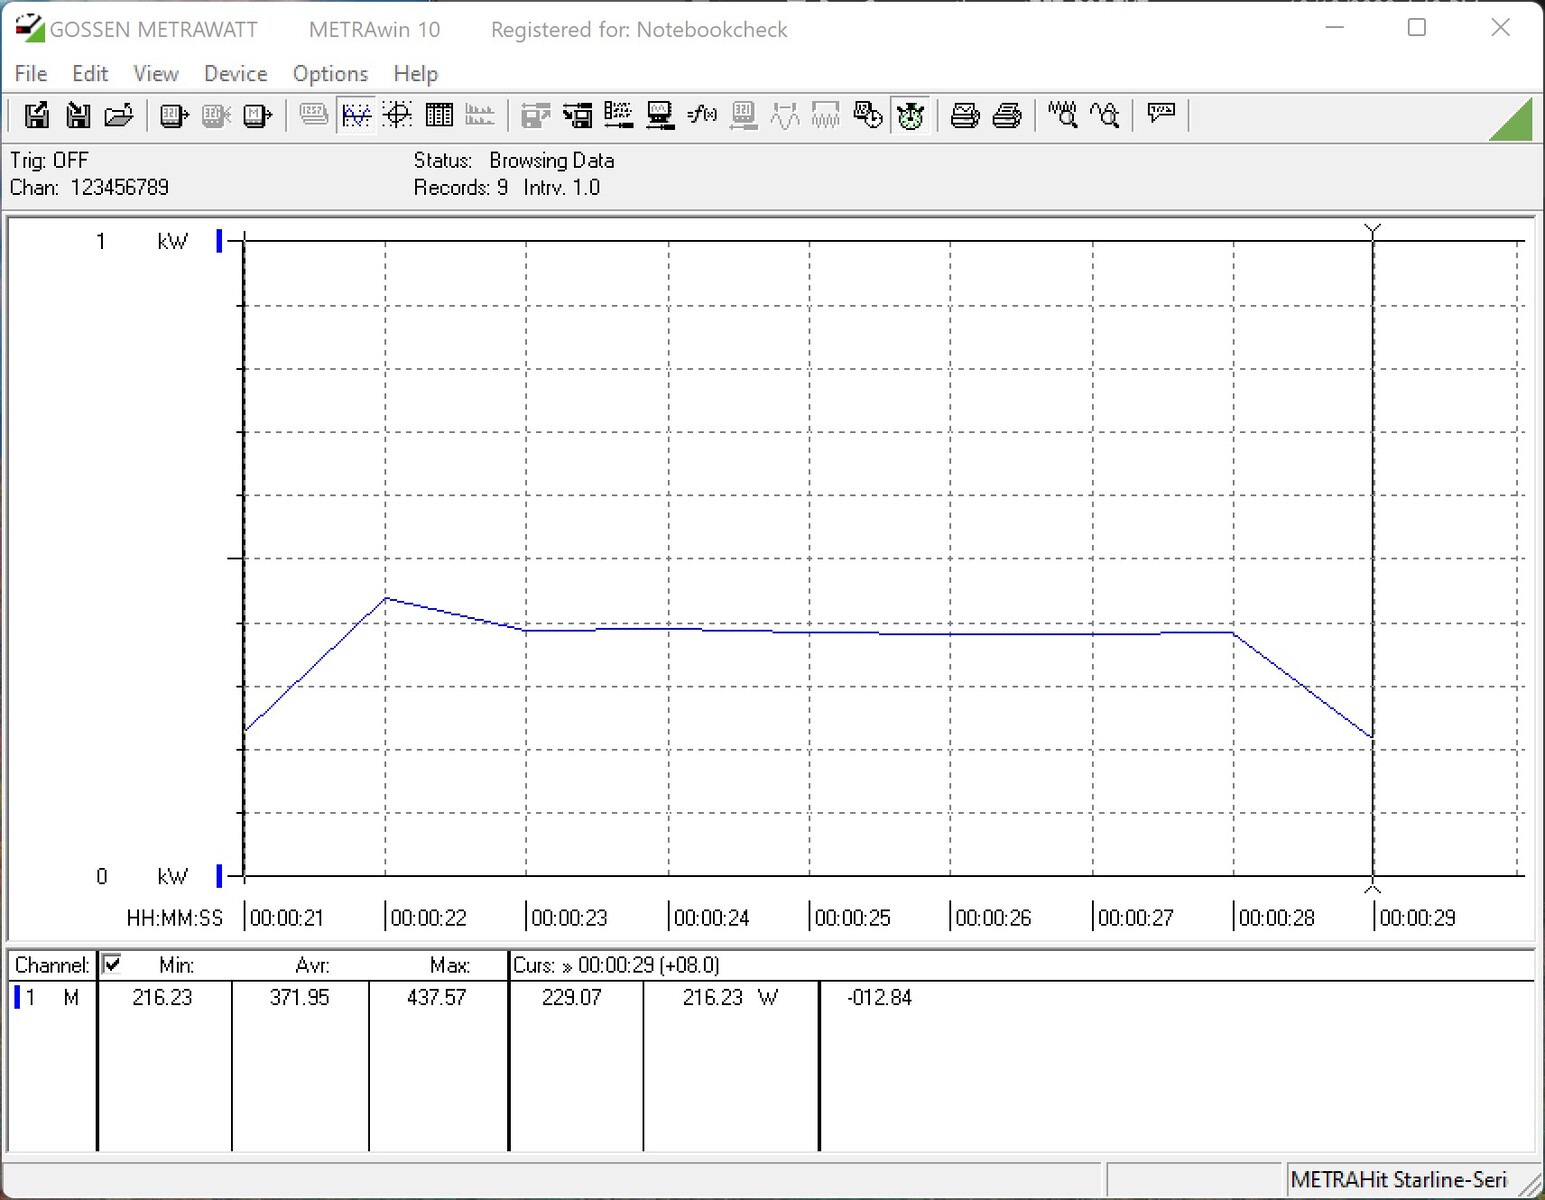
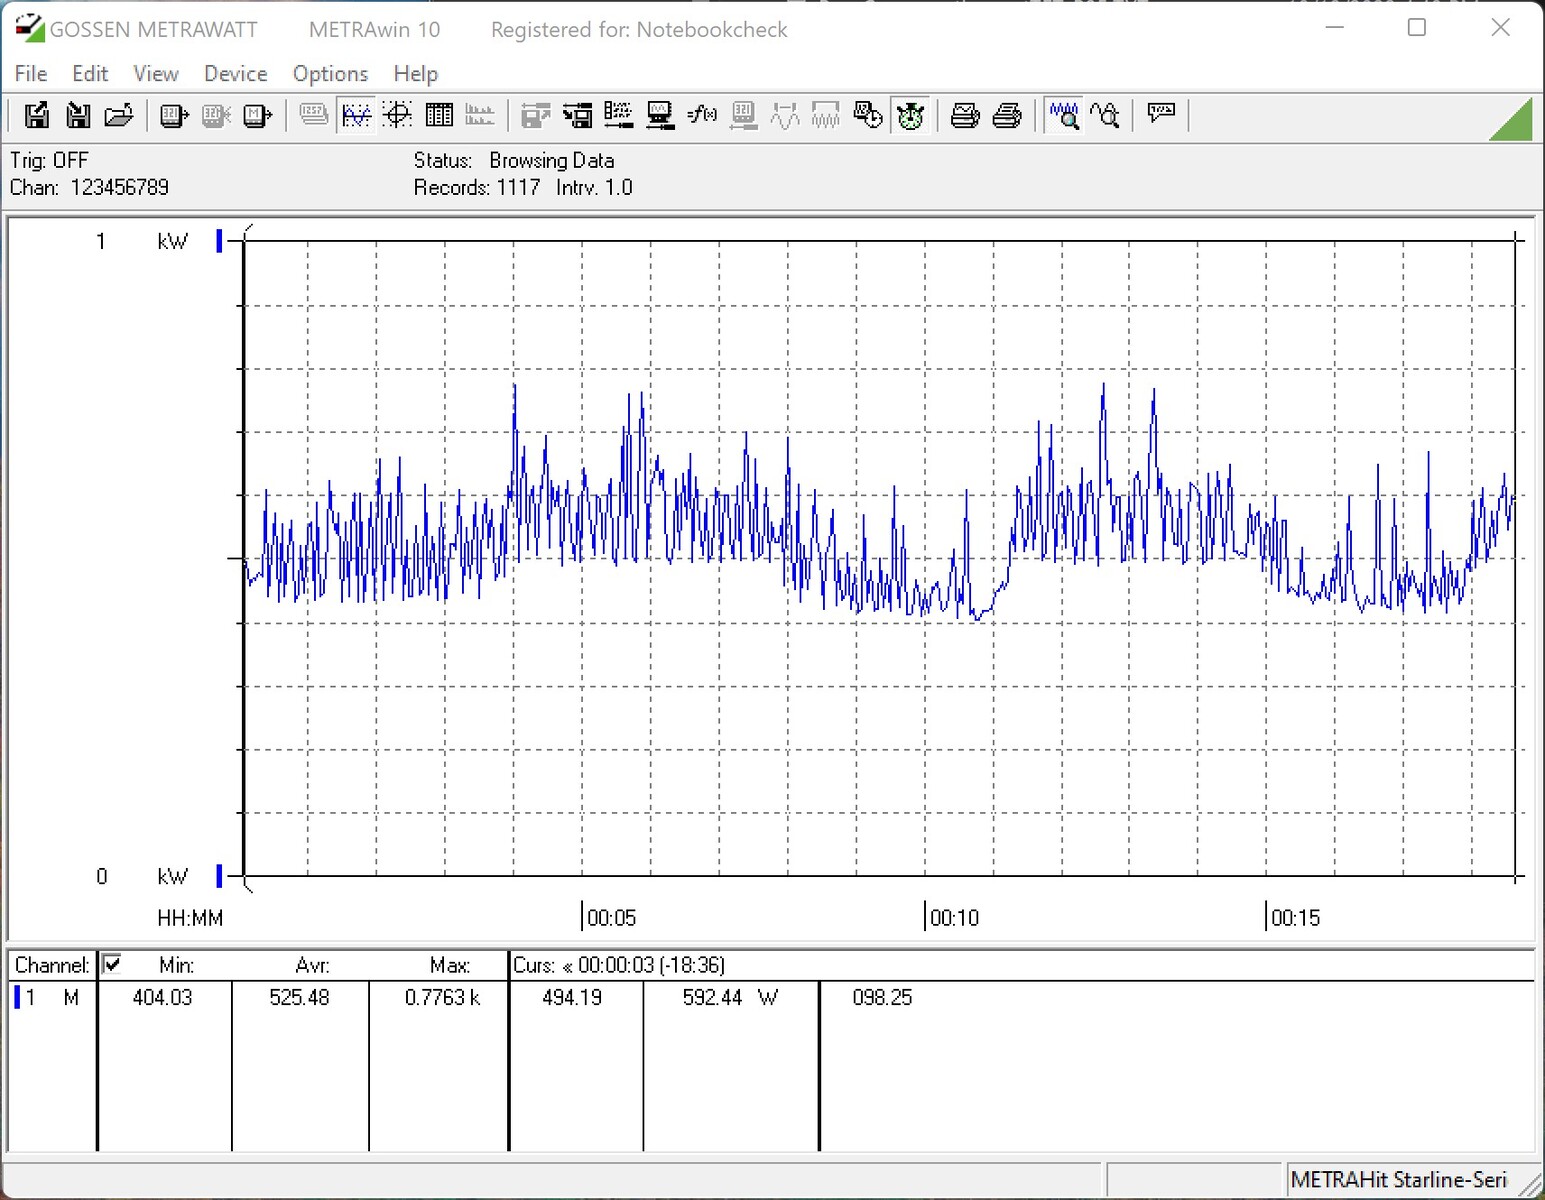
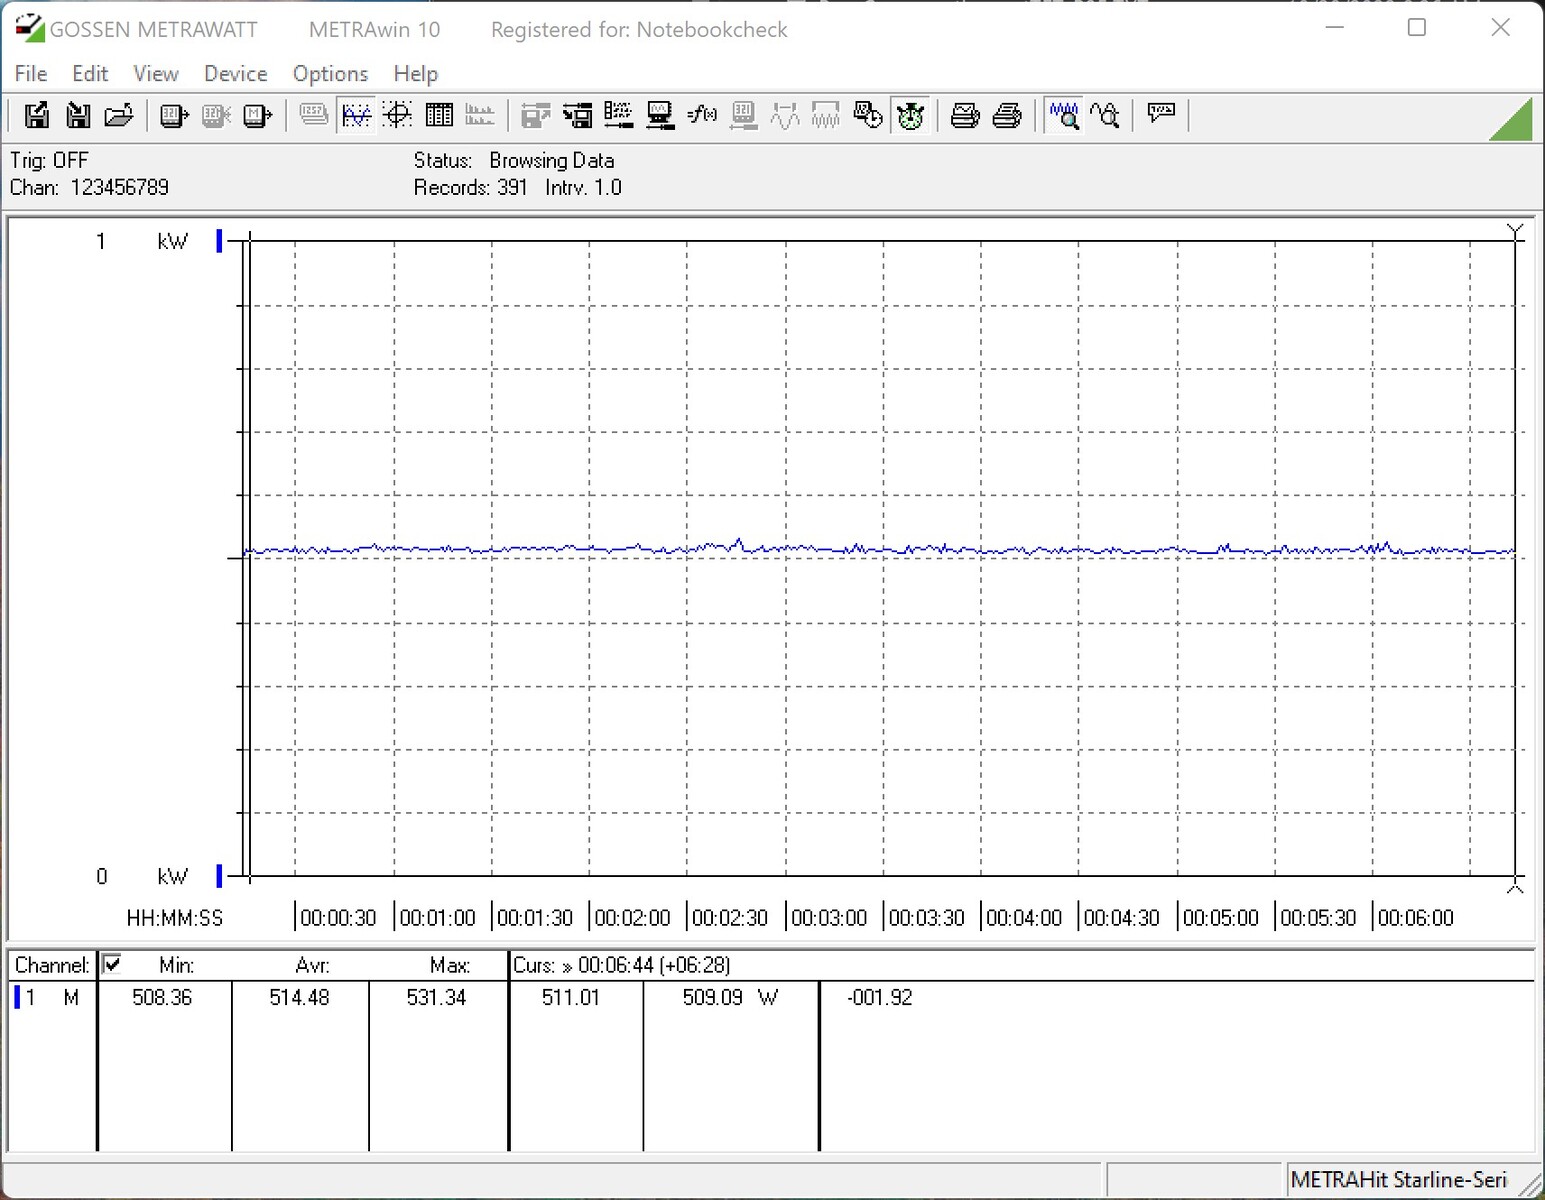
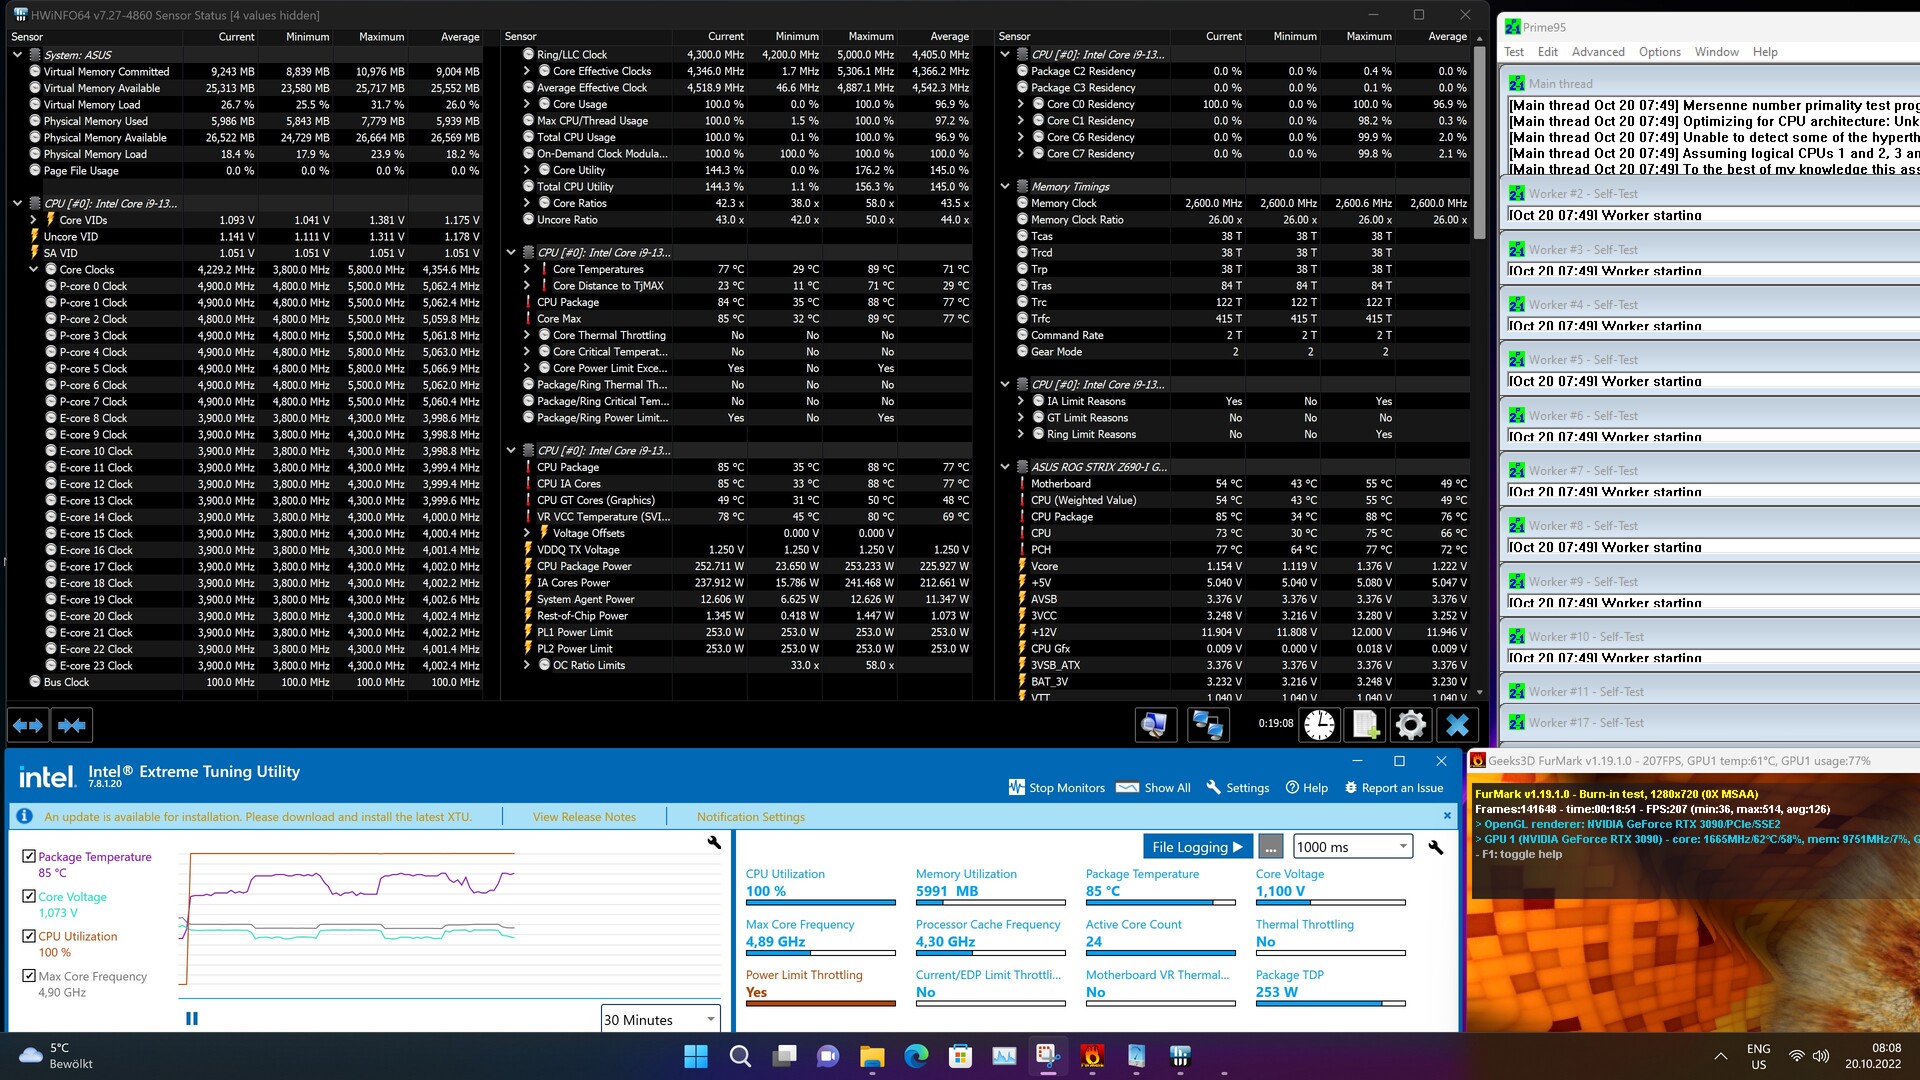
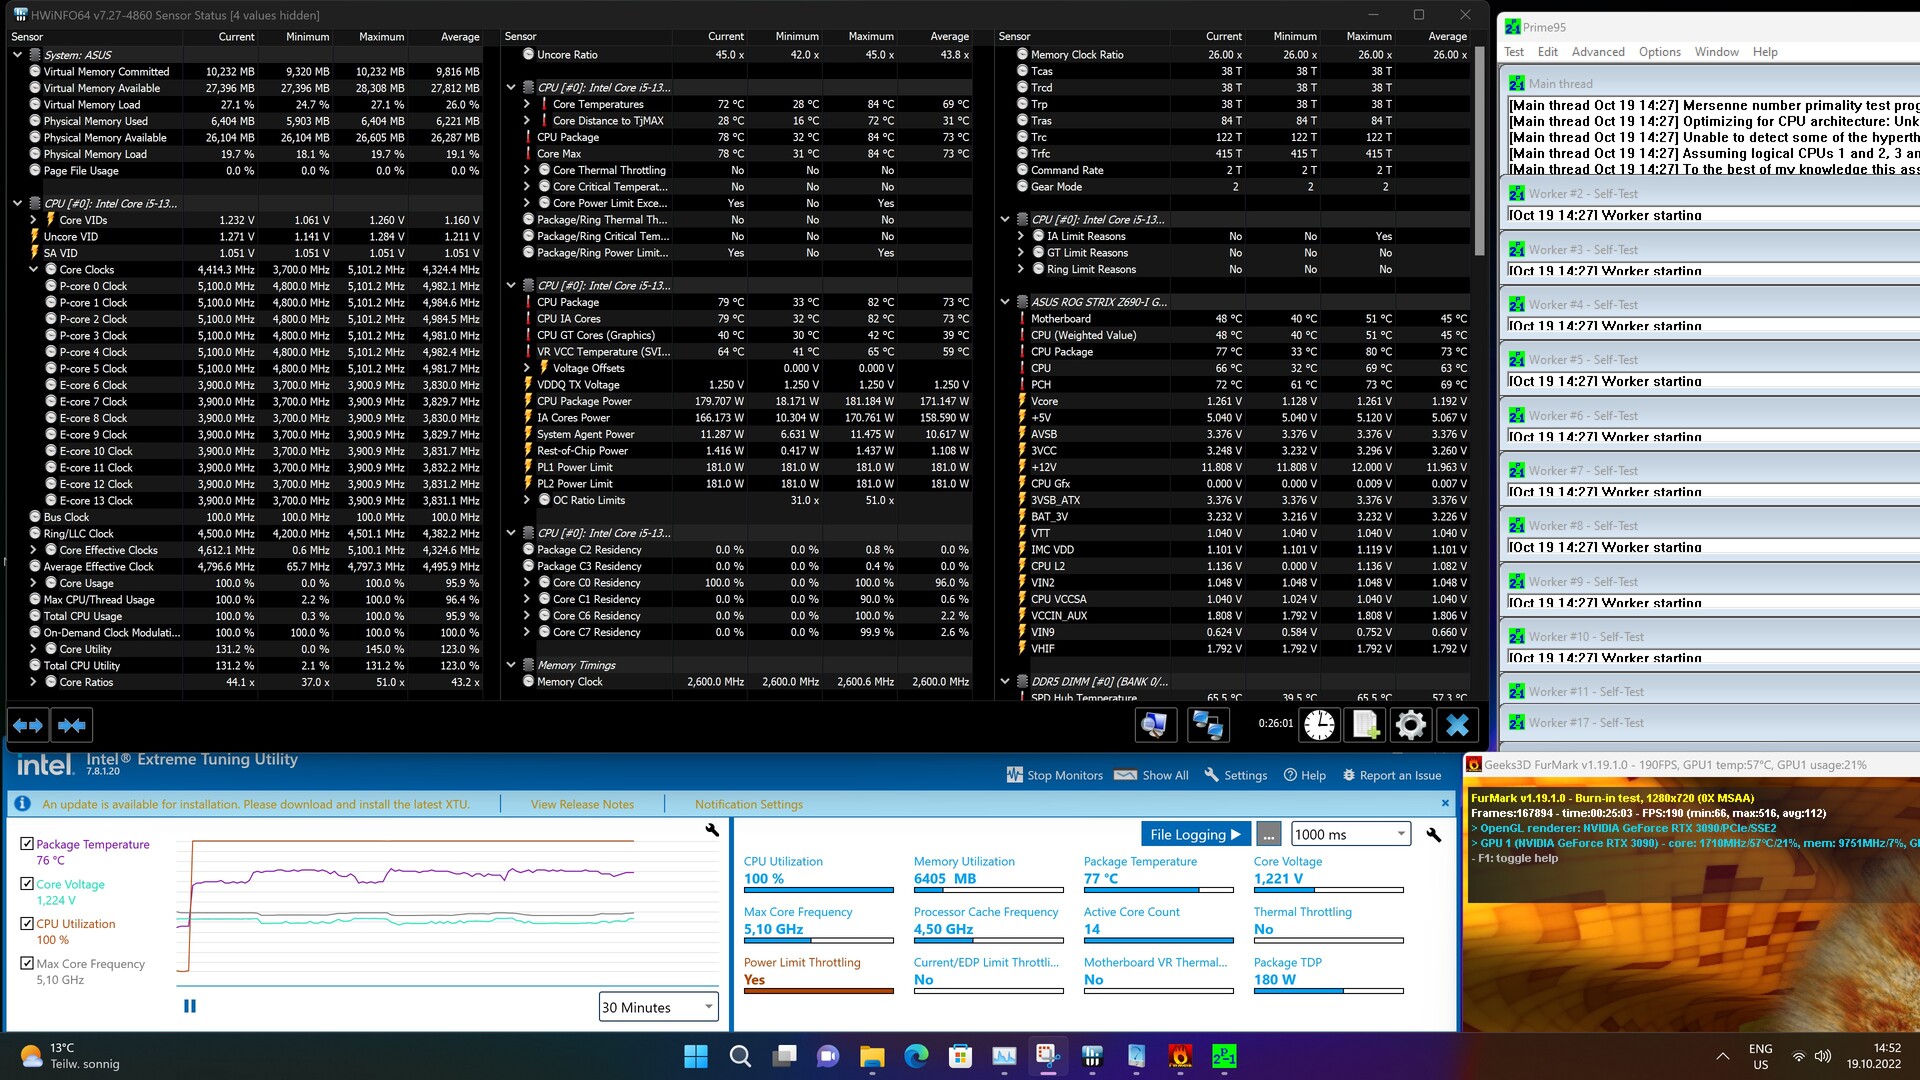
Volgens de technische specificaties blijven de processoren een TDP van 125 watt bieden. Dit verwijst naar de PL1-waarde. De PL2 waarde geeft aan hoeveel watt de processor mag verbruiken onder volledige belasting, als aan alle eisen is voldaan. Als alle beperkingen in het BIOS zijn geactiveerd, mag de Intel Core i9-13900K maximaal 253 watt verbruiken. Voor de Intel Core i5-13600K is dat nog 181 watt. Als alle beperkingen zijn uitgeschakeld, is er geen directe beperking van het stroomverbruik, wat impliciet betekent dat alleen de temperatuurslimiet de CPU kan vertragen. Het is dus niet verwonderlijk dat we tijdens onze stresstests steeds de 100 °C (212 °F) bereiken. Op dat punt meten we 345 watt voor de Core i9-13900K en 240 watt voor de Core i5-13600K. Hiermee zal het gebruik van een goed koelsysteem het stroomverbruik flink doen toenemen
We meten een stroomverbruik van 480 watt voor ons testsysteem tijdens de Cinebench R15 multitest. Dit is 48% of bijna 160 watt meer voor de voeding te leveren in vergelijking met de Intel Core i9-12900K. Voor de Intel Core i5-13600K is de toename ook niet onbelangrijk met 39% of een extra 80 watt. Tijdens het gamen is het stroomverbruik iets lager. We meten echter nog steeds gemiddeld minstens 500 watt.
Je hebt een zeer goed koelsysteem nodig om de Raptor Lake processoren aan te kunnen. Met een aangepast waterkoelsysteem kun je de nieuwe Raptors ook onbeperkt laten draaien, mits je geen probleem hebt met hoge temperaturen. Wie aan de veilige kant wil zitten, moet de PL2 beperking activeren. Dan is een maximum van respectievelijk 253 of 181 watt de limiet. We raden zeker aan om binnen de vermogensgrenzen van de Raptor Lake processoren te blijven. Een aanzienlijk lager stroomverbruik en lage temperaturen zijn daar goede redenen voor. Ook wat betreft de pure prestaties is er geen nadeel, zoals we hierboven al aangaven.
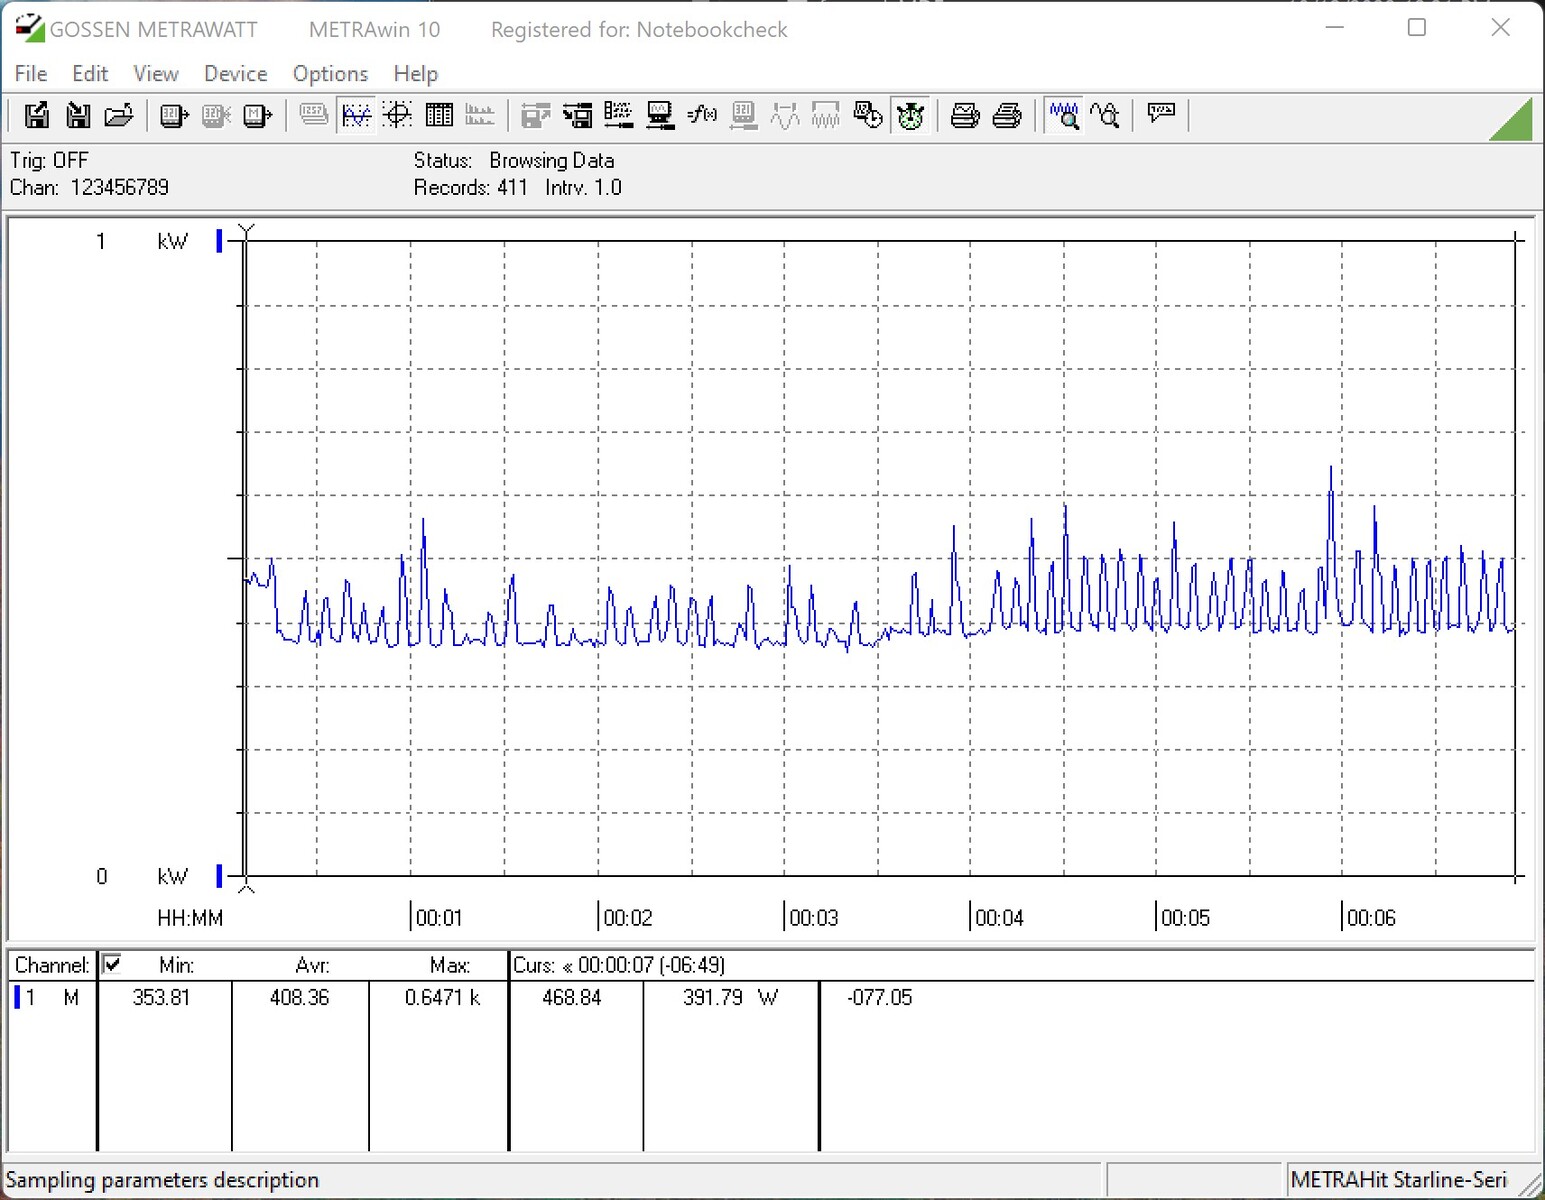
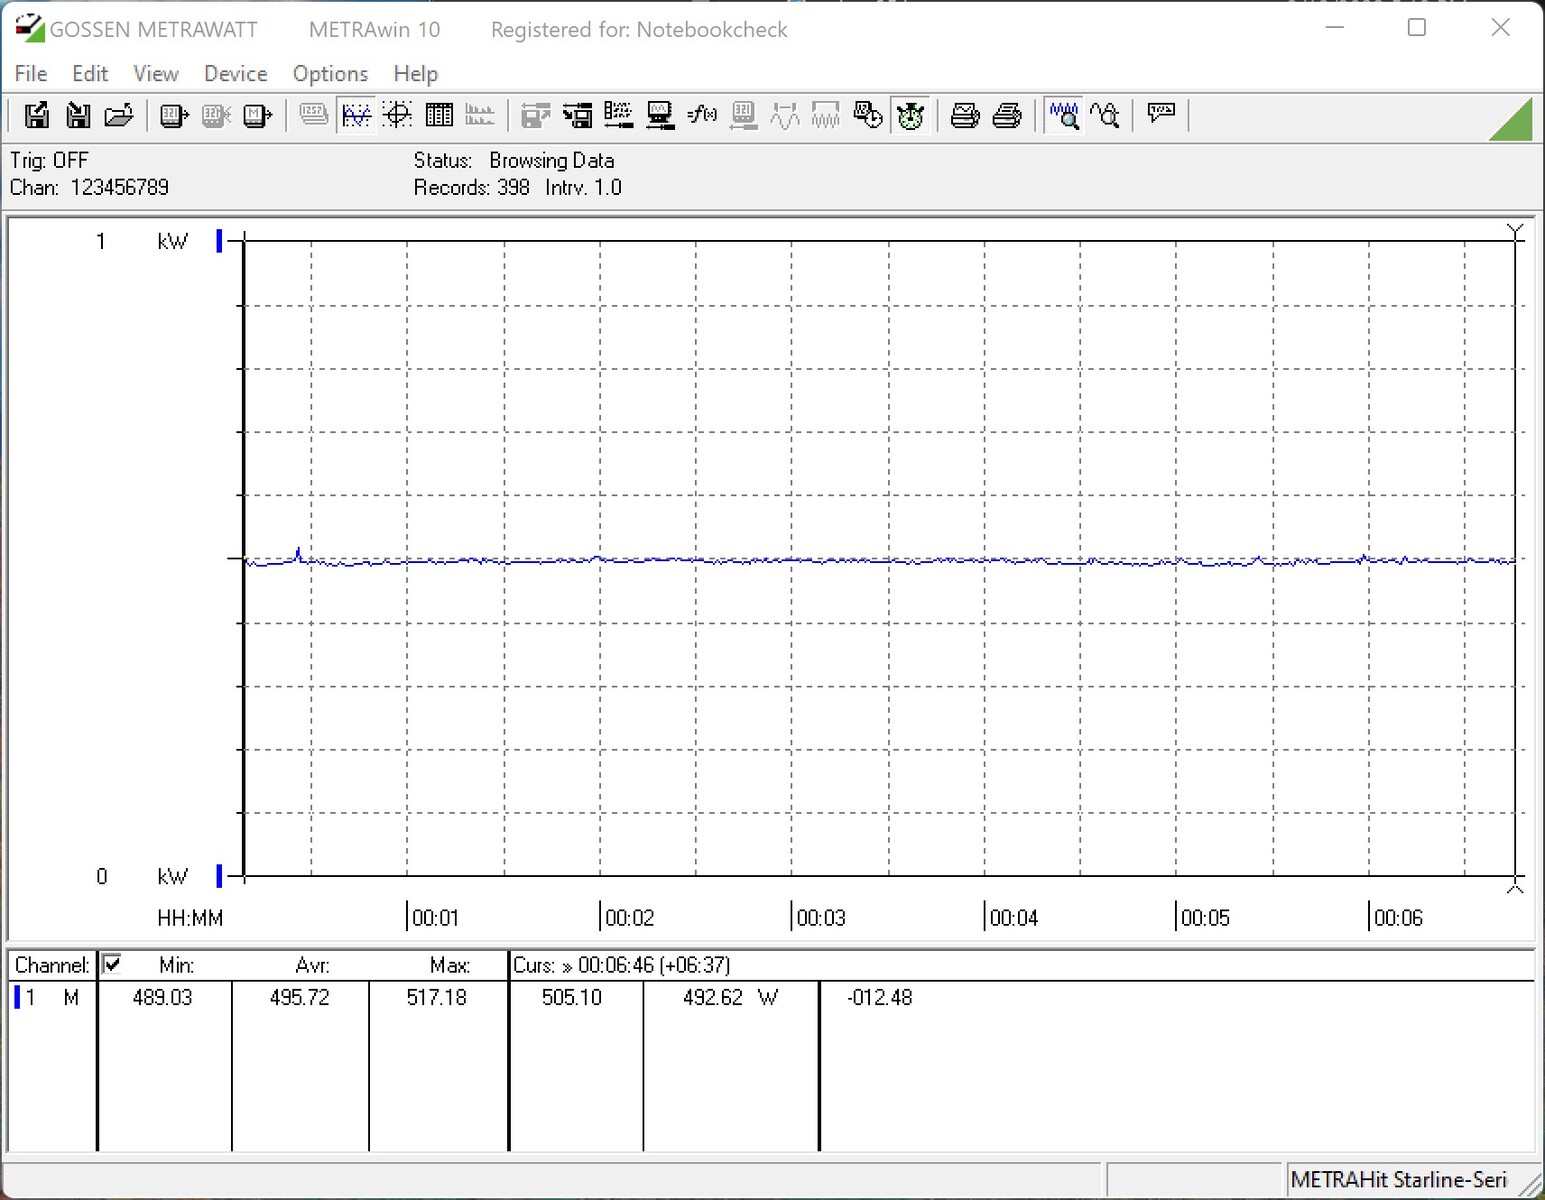
Intel Core i9-13900K - Open Vermogenslimiet

Intel Core i9-13900K - 253 Watt vermogenslimiet
Intel Core i5-13600K - Open Vermogenslimiet


Intel Core i5-13600K - 181 Watt vermogenslimiet
| Power Consumption / Cinebench R15 Multi (external Monitor) | |
| Intel Core i9-13900K | |
| Intel Core i9-13900K @253W | |
| Intel Core i9-12900K (Idle: 70.5 W) | |
| NVIDIA GeForce RTX 3090 Founders Edition | |
| AMD Ryzen 9 7900X | |
| Intel Core i5-13600K | |
| Intel Core i5-13600K @181W | |
| AMD Ryzen 5 7600X | |
| Intel Core i5-12600K (Idle: 70.45 W) | |
| Power Consumption / Prime95 V2810 Stress (external Monitor) | |
| Intel Core i9-13900K | |
| Intel Core i9-13900K @253W | |
| Intel Core i5-13600K | |
| NVIDIA GeForce RTX 3090 Founders Edition | |
| AMD Ryzen 9 7900X | |
| Intel Core i9-12900K (Idle: 70.5 W) | |
| Intel Core i5-13600K @181W | |
| Intel Core i5-12600K (Idle: 70.45 W) | |
| AMD Ryzen 5 7600X | |
| Power Consumption / The Witcher 3 ultra (external Monitor) | |
| AMD Ryzen 9 7900X | |
| NVIDIA GeForce RTX 3090 Founders Edition | |
| Intel Core i9-13900K | |
| AMD Ryzen 5 7600X | |
| Intel Core i9-13900K @253W | |
| Intel Core i5-13600K | |
| Intel Core i5-13600K @181W | |
| Intel Core i9-12900K (Idle: 70.5 W) | |
| Intel Core i5-12600K (Idle: 70.45 W) | |
* ... kleiner is beter
Pro
Contra
Verdict - Extreem stroomverbruik

Met Raptor Lake stuurt Intel een waardige opvolger van de Alder Lake-generatie de ring in. Dat werd ook tijd, aangezien AMD met zijn huidige line-up de Alder Lake-processoren voor is geweest. Intel is met zijn huidige processoren echter niet in staat om de concurrenten volledig voor te blijven. Wel weet het de concurrenten in te halen en soms zelfs iets te overtreffen. De verschillen tussen de twee topmodellen zijn erg klein en niet echt merkbaar. Als we onze prestatievergelijking echter baseren op de huidige MSRP's, ligt de Intel Core i9-13900K voor op de AMD Ryzen 9 7900X in veel benchmarks.
Intel vecht voor deze positie met een hogere kloksnelheid, meer kernen en een hoger stroomverbruik. Dat laatste is ook een aanpak die AMD nastreeft, hoewel de TDP van de Intel Core i9-13900K met 253 watt (PL2) een nieuwe topwaarde bereikt. Bij de kleinere Intel Core i5-13600K is dat nog 181 watt onder volle belasting. Dit betekent dat een zeer goede koeling een vereiste is, als het topmodel op uw verlanglijstje staat.
De huidige Intel Raptor Lake processoren bieden zeer goede gaming en applicatie prestaties. De zeer hoge prestaties maken de Intel Core i9-13900K de optimale CPU voor content creators
Voor de basis kun je veilig een 600-chipset gebruiken, aangezien Raptor Lake compatibel is na een BIOS-update. Dit zal niet te veel beslag leggen op je budget voor een upgrade. Er komen echter ook nieuwe moederborden met de nieuwe 700-chipset. Maar je moet ook weten dat er geen nieuwe CPU-generatie komt voor de huidige 1700-socket. Huidige geruchten zeggen dat de 1851 socket zal worden geïntroduceerd met Meteor Lake, die niet meer compatibel is met de huidige sockets.
Prijs en beschikbaarheid
Sommige winkels zetten de nieuwe Raptor Lake-processoren al in de lijst. Zo is de Intel Core i5-13600K bij Amazon verkrijgbaar voor 340 dollaren het topmodel, de Intel Core i9-13900K, staat daar voor 750 dollar.

