AMD Ryzen 7 5800X3D Review: Betere gaming CPU dan Core i9-12900K voor 120 dollar minder
AMD is eindelijk overgestapt op een nieuwe socket en chipset platform met de Ryzen 7000 serie, maar het bedrijf is nog steeds op zoek om het maximale uit socket AM4 te halen. AMD kondigde eerst zijn 3D V-cache ontwerp op basis van TSMC's 3DFabric verpakkingstechnologie tijdens Computex 2021, en toonde enorme verbeteringen in gamingprestaties bij 1080p
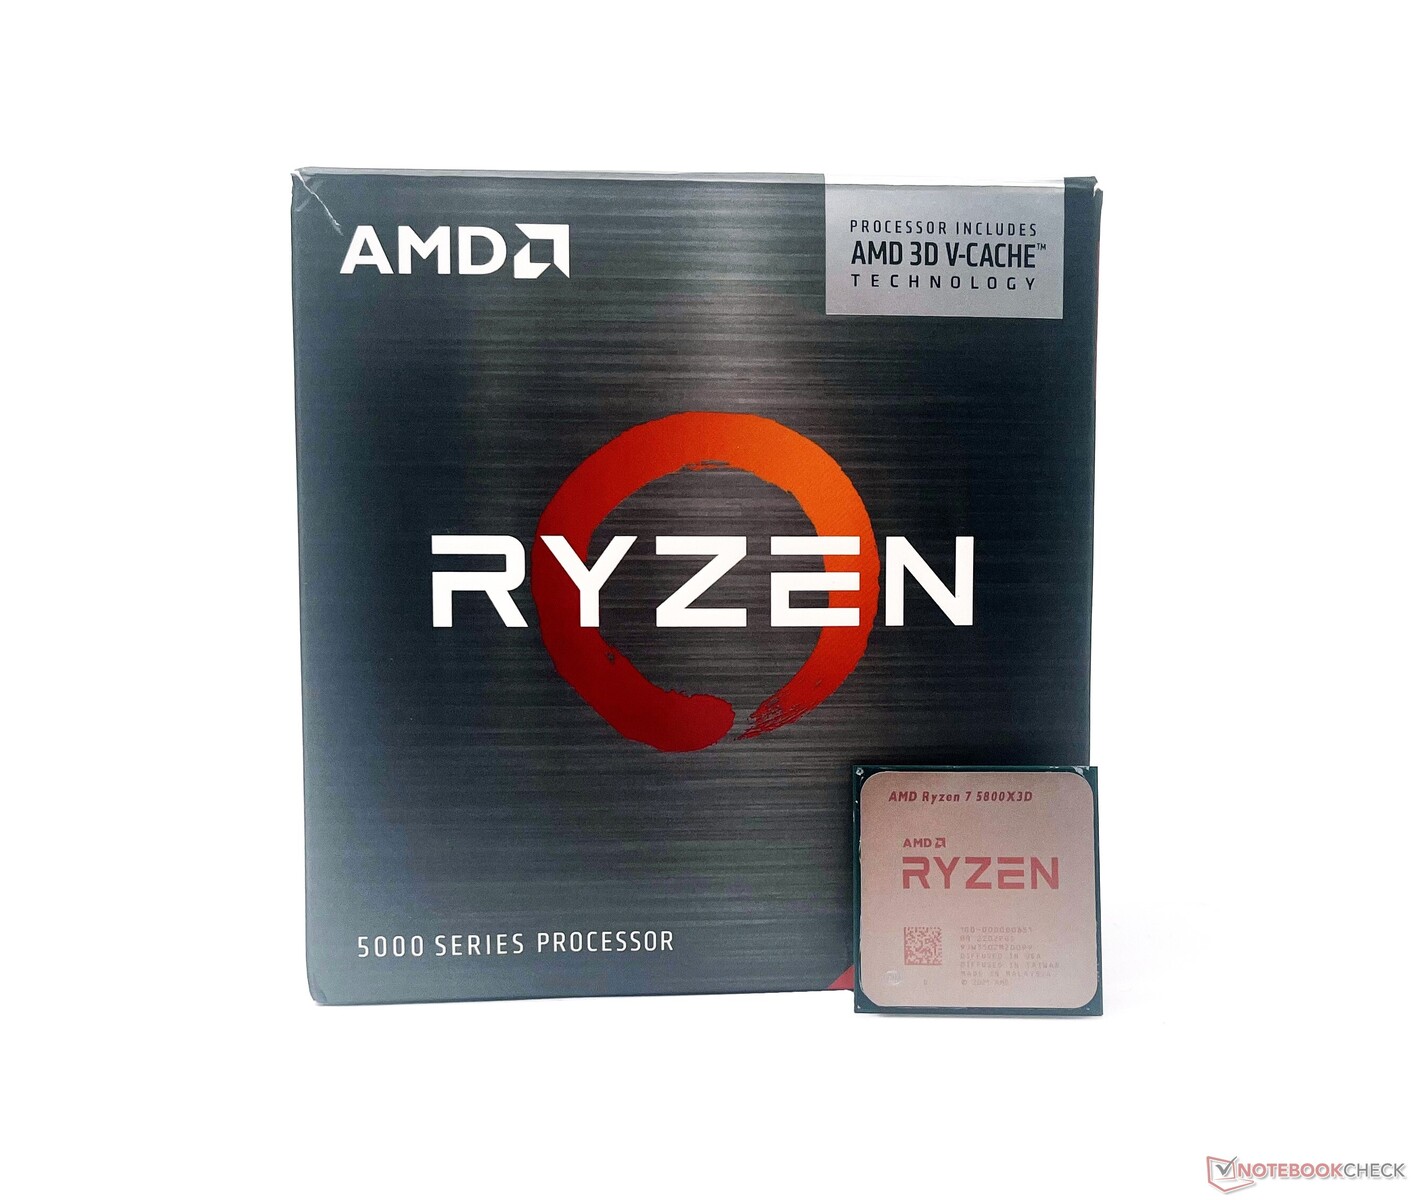
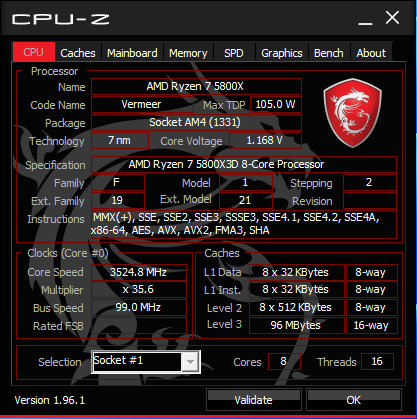
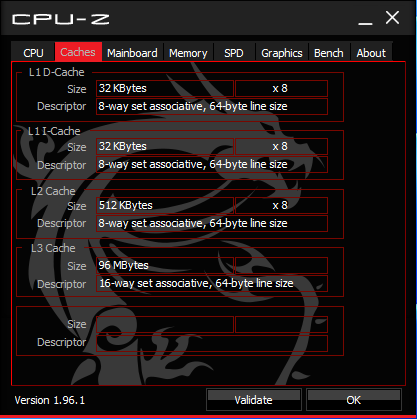
Snel door naar CES 2022, en AMD onthulde de Ryzen 7 5800X3D - een 8-core 16-thread 105 W processor met een toegevoegde 64 MB 3D V-cache naast de 32 MB van de bestaande 2D-cache.
Terwijl AMD met de Zen 3 Vermeer line-up voor het grootste deel een thuiswedstrijd heeft gehad, heeft Intel al snel de sprong gewaagd met de Alder Lake hybride Core architectuur geleid door de Core i9-12900K en later, de Core i9-12900KS.
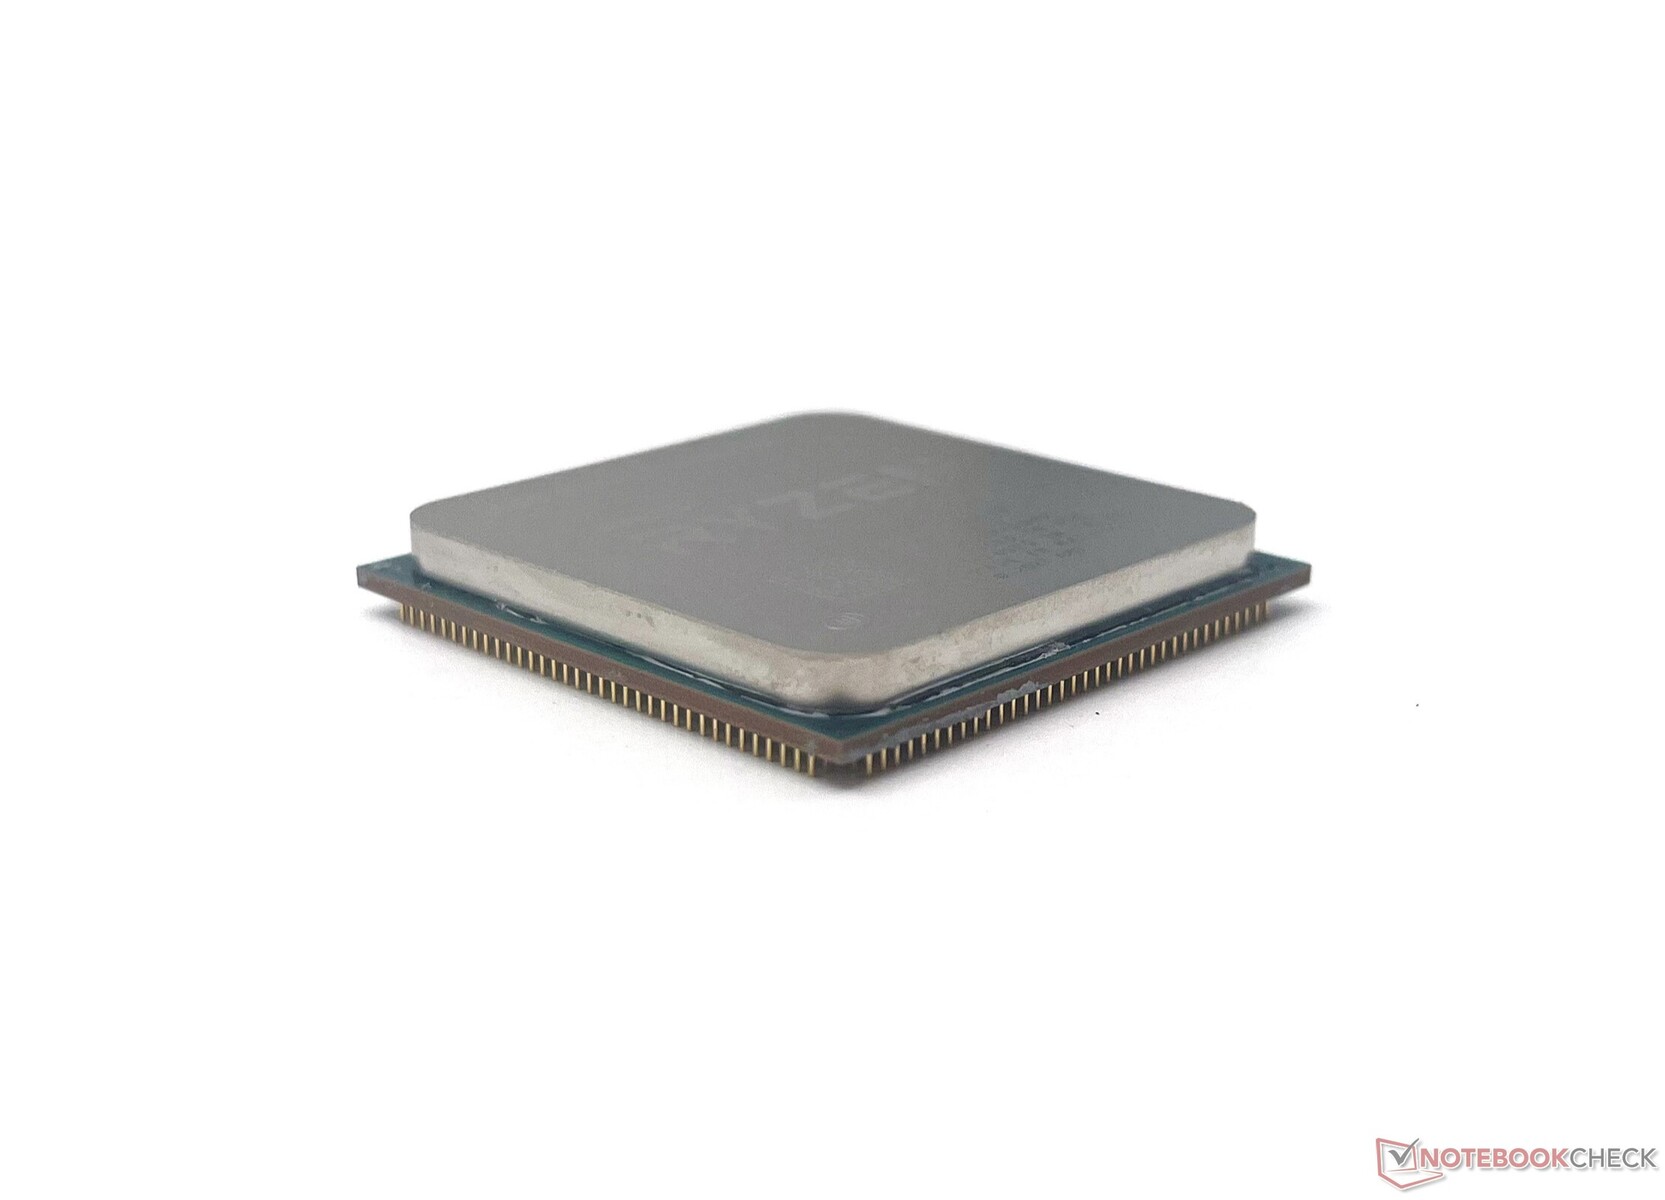
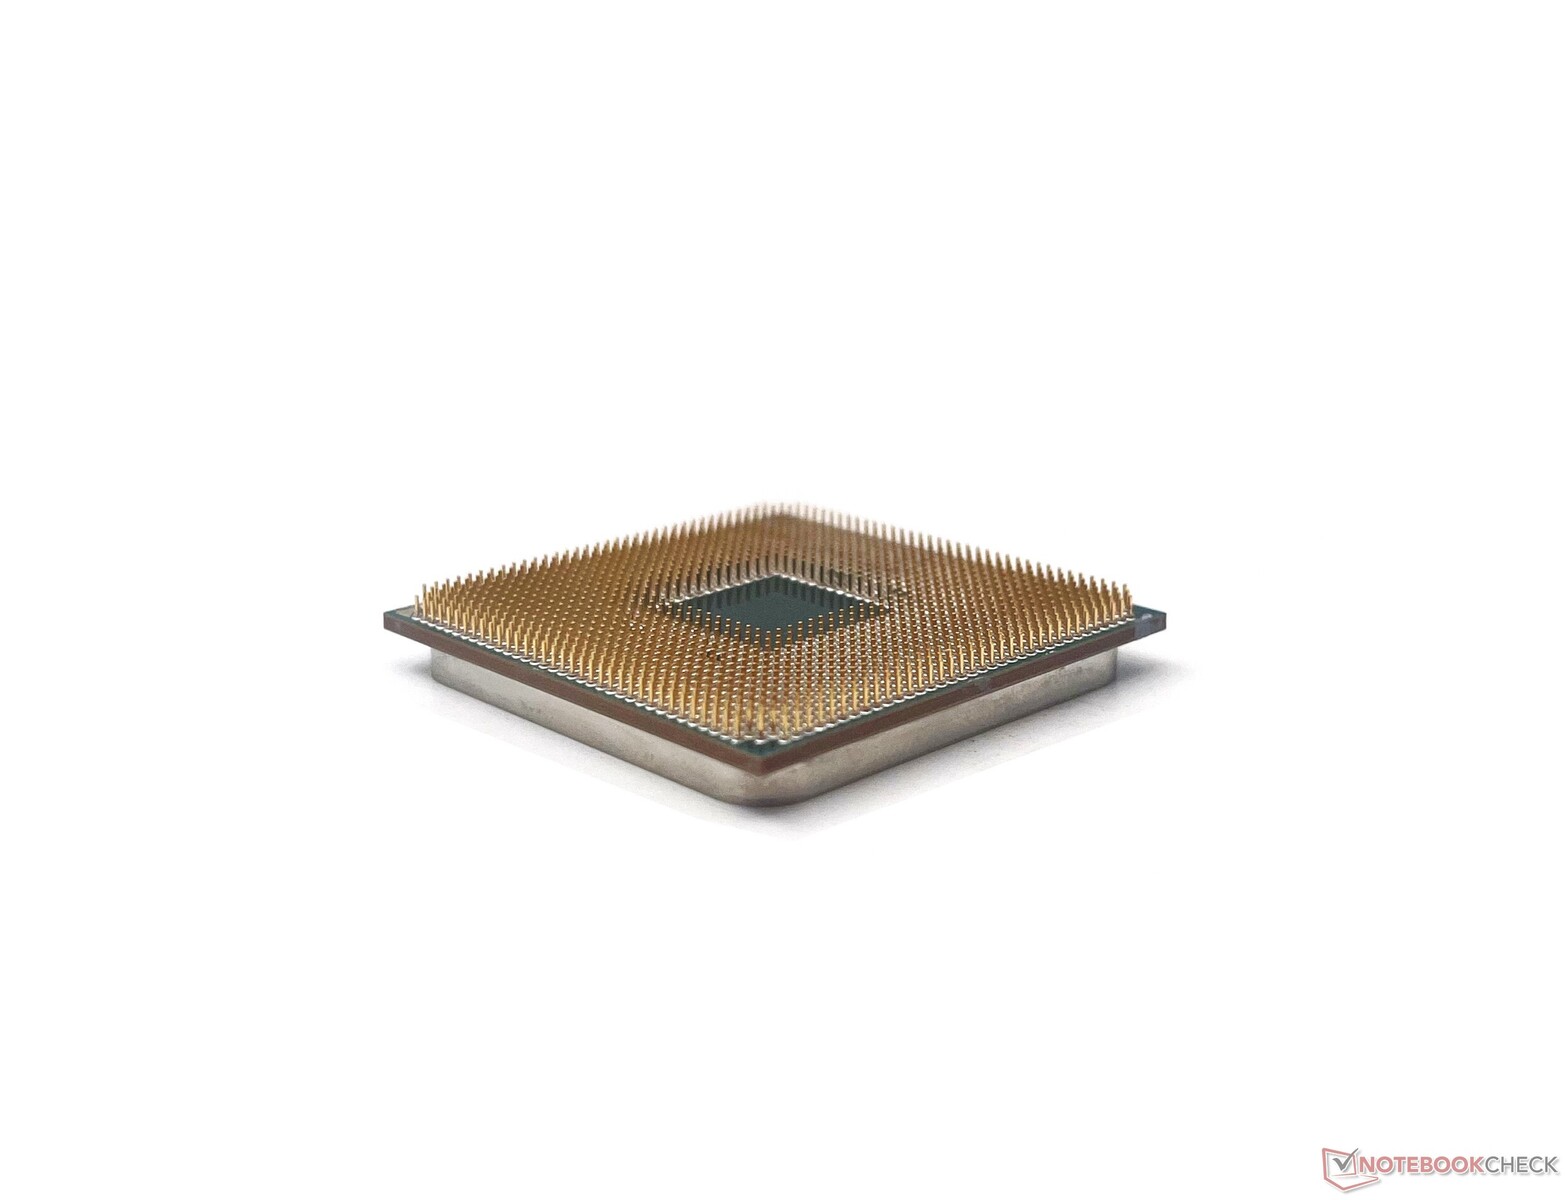
Ondanks de nieuwe cache-technologie ziet de Ryzen 7 5800X3D er precies hetzelfde uit als andere Zen 3 processoren, inclusief dezelfde Z-hoogte. Daarom werken bestaande socket AM4 koelers prima met deze CPU.
In deze review bekijken we de AMD Ryzen 7 5800X3D, zien we hoe goed hij het doet in vergelijking met de huidige Alder Lake concurrentie van Intel, en of dit een investering is die je zou moeten overwegen in 2022.
De AMD Ryzen Zen 3 Vermeer desktop CPU line-up
| SKU | Cores/Threads | Basisklok (GHz) | Turoklok (GHz) | L3-cache (MB) | TDP (W) | MSRP bij lancering (US$) |
|---|---|---|---|---|---|---|
| Ryzen 9 5950X | 16/32 | 3.4 | 4.9 | 64 | 105 | 799 |
| Ryzen 9 5900X | 12/24 | 3.7 | 4.8 | 64 | 105 | 549 |
| Ryzen 7 5800X3D | 8/16 | 3.4 | 4.5 | 32+64 | 105 | 449 |
| Ryzen 7 5800X | 8/16 | 3.8 | 4.7 | 32 | 105 | 449 |
| Ryzen 7 5700X | 8/16 | 3.4 | 4.6 | 32 | 65 | 299 |
| Ryzen 5 5600X | 6/12 | 3.7 | 4.6 | 32 | 65 | 299 |
| Ryzen 5 5600 | 6/12 | 3.5 | 4.4 | 32 | 65 | 199 |
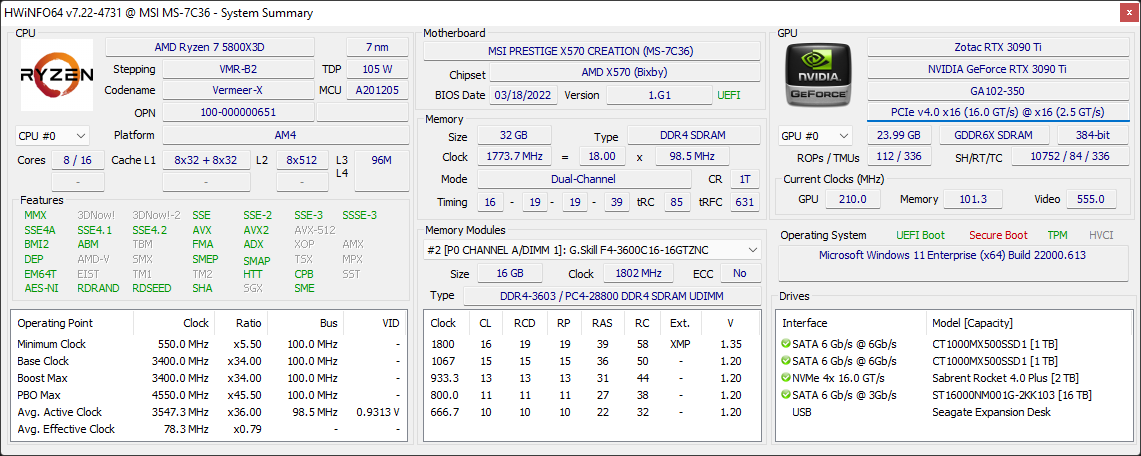
De testbank: Ryzen 7 5800X3D ontmoet de RTX 3090 Ti
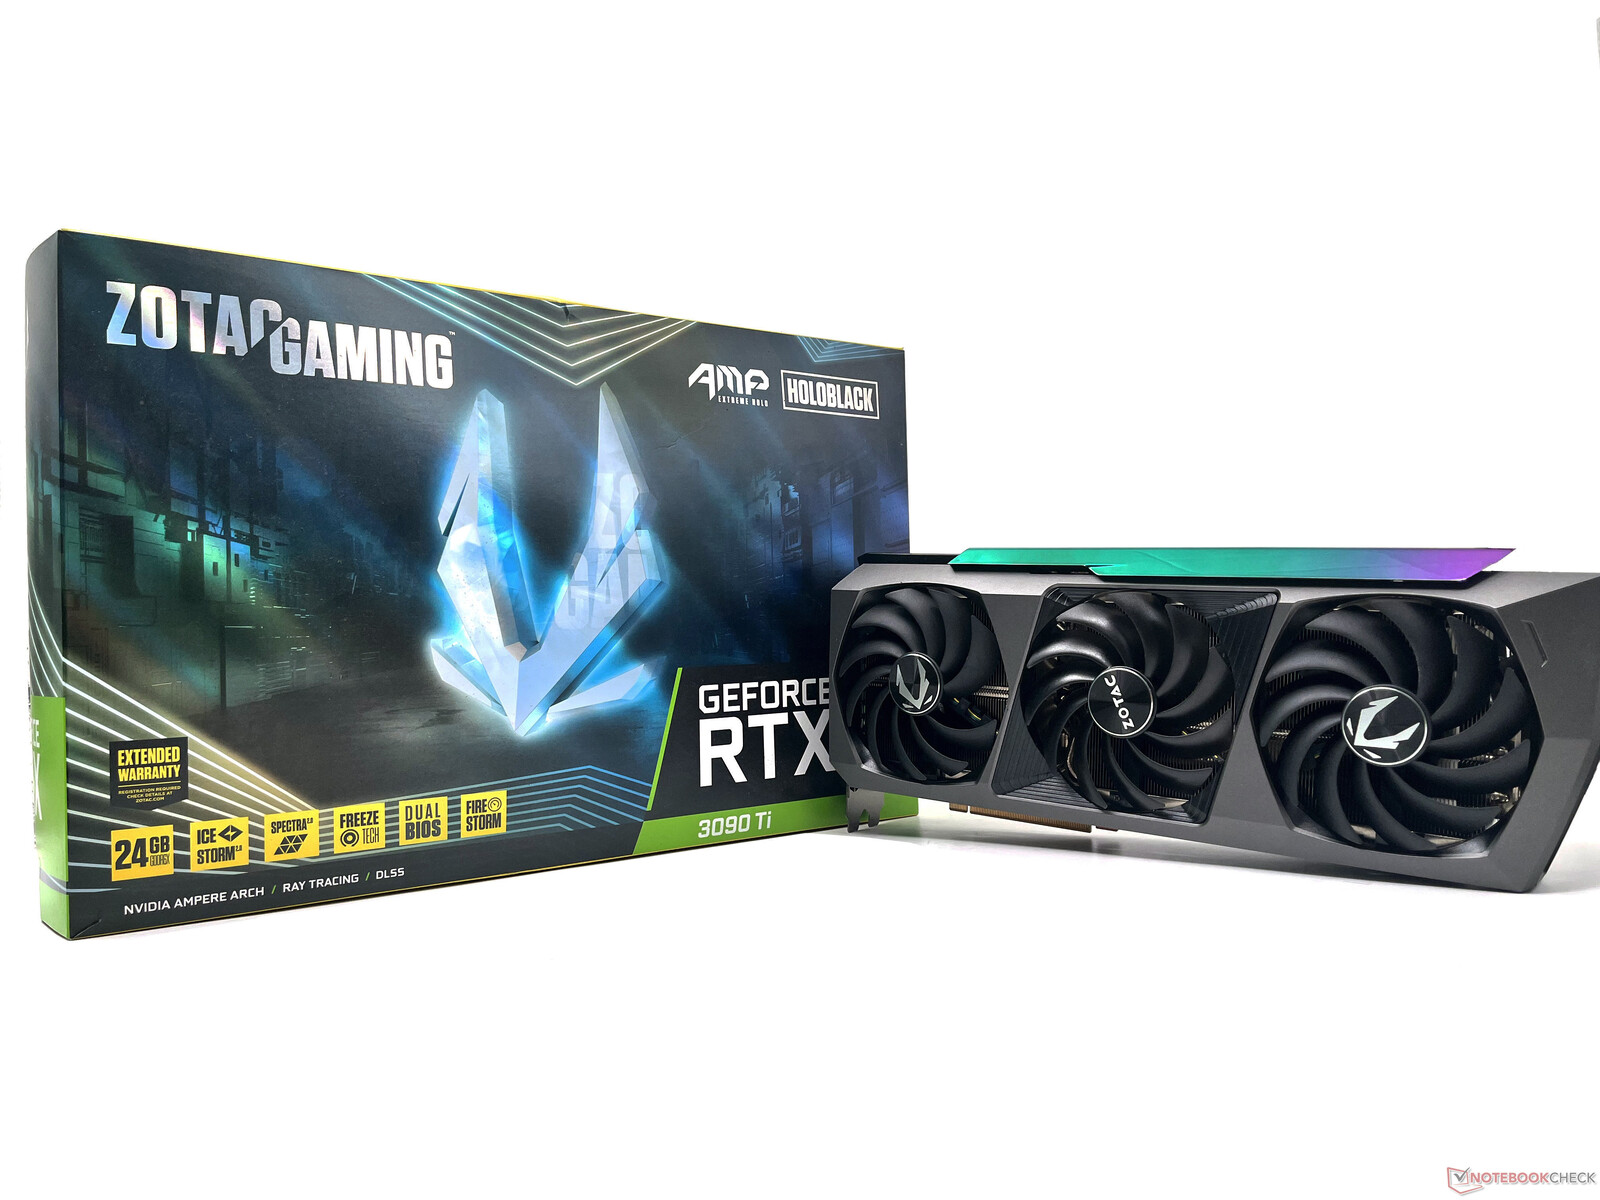
Onze testbank is gebaseerd op wat we eerder hadden gebruikt voor de Zotac Gaming GeForce RTX 3090 Ti AMP Extreme Holo GPU review. Dit omvat het volgende:
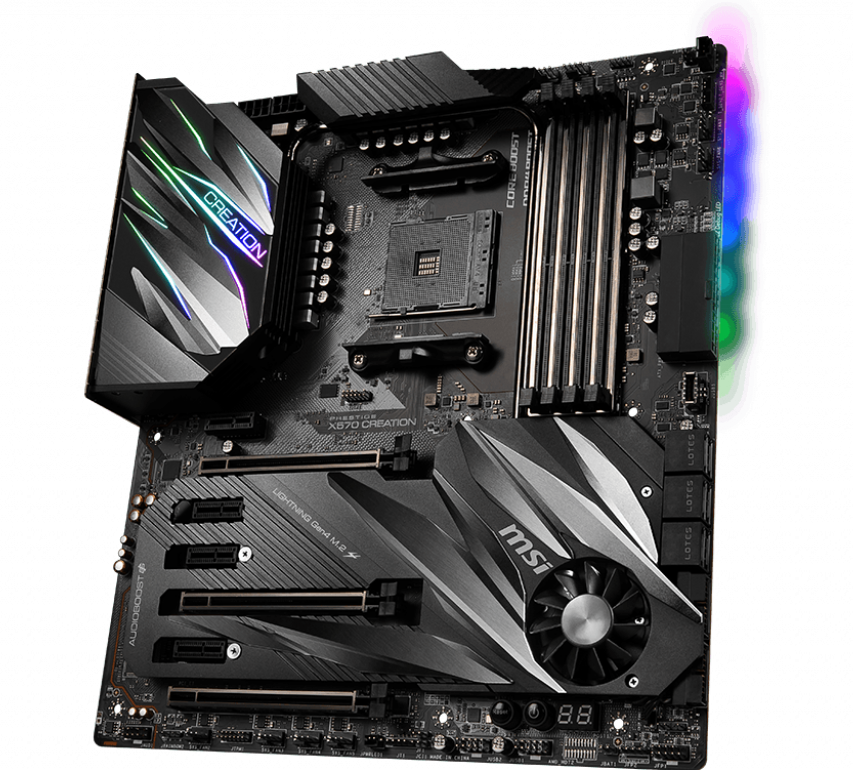
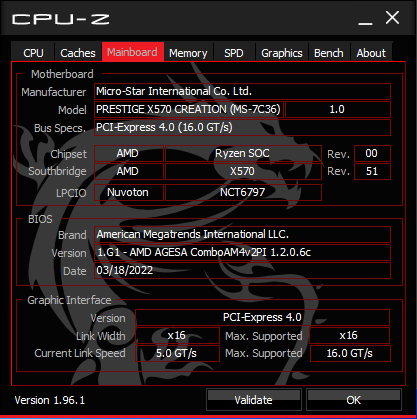
- MSI Prestige X570 Creation moederbord met AGESA 1.2.0.6c
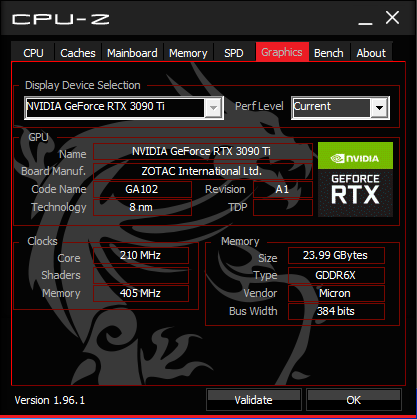
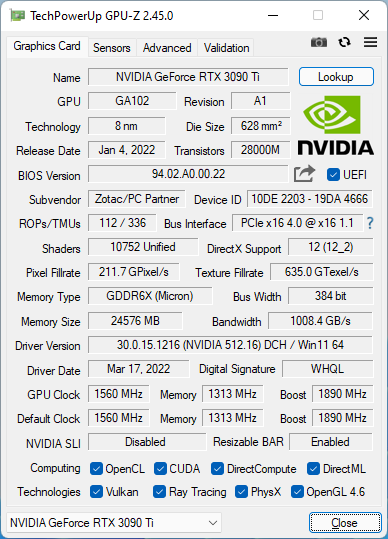
- Zotac Gaming GeForce RTX 3090 Ti AMP Extreme Holo GPU
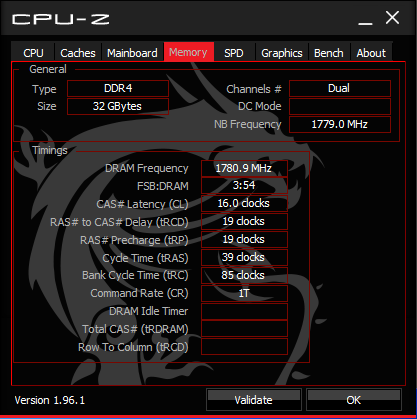
- 2x 16 GB G.SKILL Trident Z Neo DDR4-3600 RAM met timings 16-19-19-39
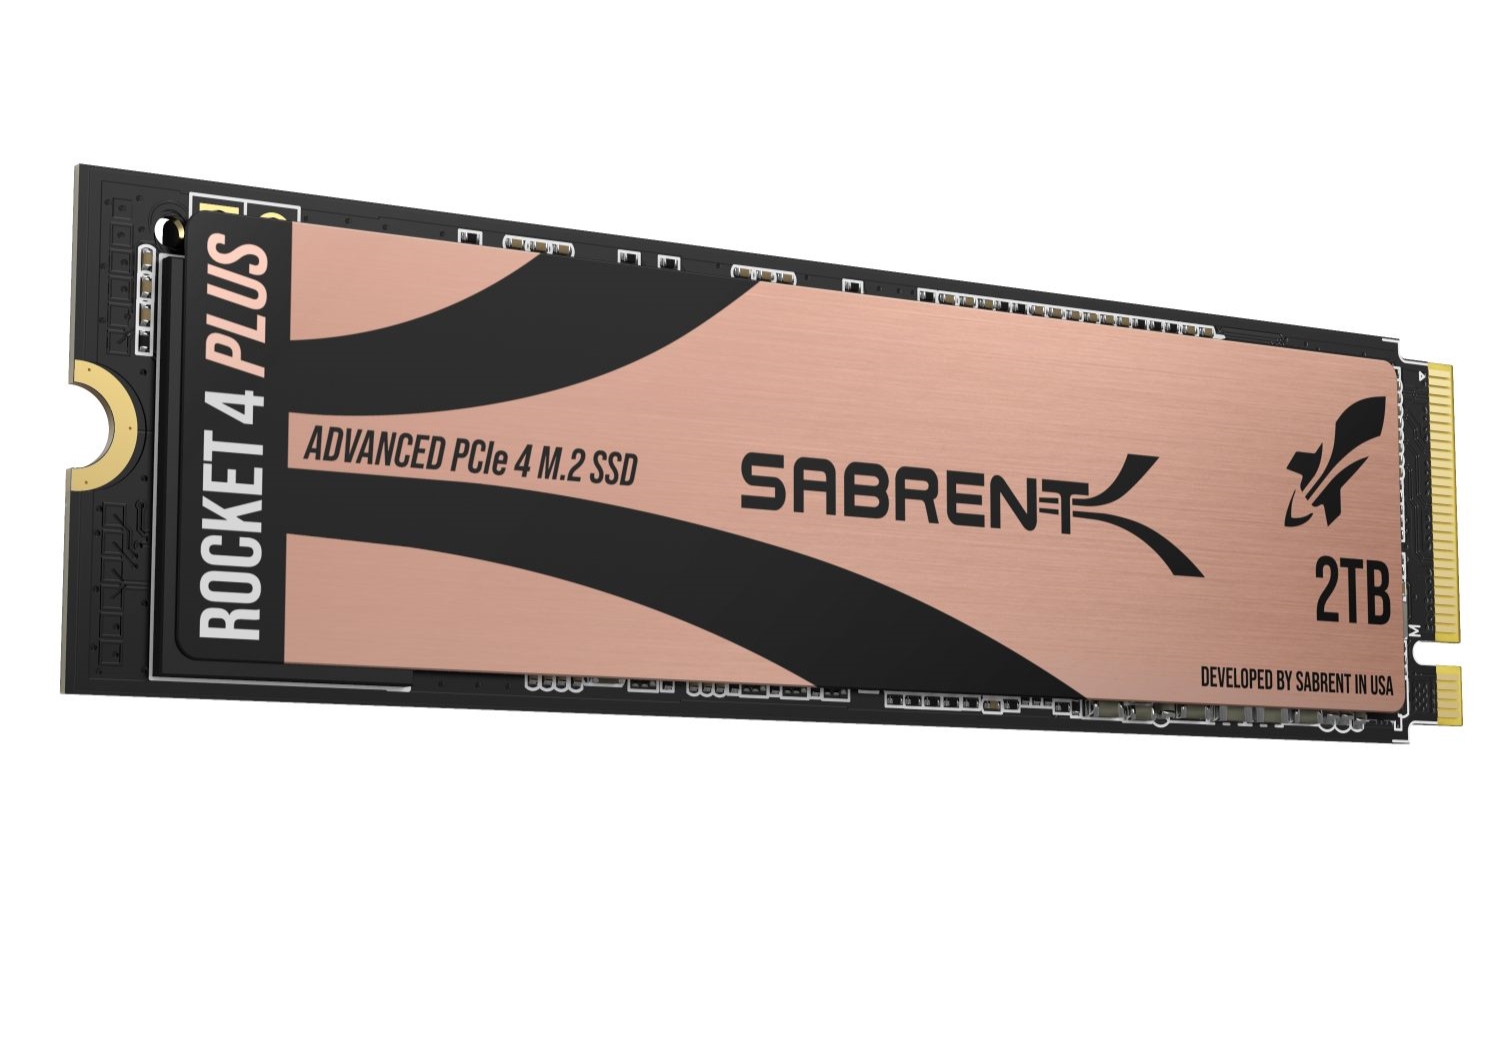
- 2 TB Sabrent Rocket 4 Plus Gen4 NVMe SSD
- 2x 1 TB Crucial MX500 SATA SSD's
- Thermaltake Toughpower 850 W Plus Gold PSU
- Corsair iCUE H115i Elite Capellix AIO koeler
- Corsair iCUE 4000X RGB-behuizing
- Gigabyte M28U 4K 144 Hz AMD FreeSync Premium Pro-monitor
We willen AMD bedanken voor het ter beschikking stellen van het Ryzen 7 5800X3D review sample, Nvidia voor de Zotac RTX 3090 Ti GPU, Sabrent voor de Rocket 4 Plus Gen4 SSD, Corsair voor de iCUE H115i Elite Capellix Cooler en 4000X case, en Gigabyte voor de M28U gaming monitor.
Synthetische benchmarks: Ryzen 7 5800X3D neemt een achterstand in
Ruwe CPU prestaties zijn zeker niet de sterke punten van de Ryzen 7 5800X3D. Dit is voornamelijk te wijten aan een paar redenen:
- De Ryzen 7 5800X3D is lager geklokt - 400 MHz lager in basis en 200 MHz lager in boost - dan de Ryzen 7 5800X
- Hoewel de 5800X3D geheugen en Infinity Fabric overklokken ondersteunt, verhindert de toegevoegde 3D V-Cache elke vorm van core overklokken, inclusief Precision Boost Overdrive
Daarom zijn de multi-core prestaties in Cinebench R15, R20, en R23 ongeveer 6-10% langzamer in vergelijking met een Ryzen 7 5800X. In single-core is zelfs de Ryzen 5 5600X ongeveer 6% sneller in vergelijking met de 5800X3D.
Een soortgelijke trend wordt weerspiegeld in andere synthetische CPU benchmarks, waar de Ryzen 7 5800X een comfortabele voorsprong heeft op de Ryzen 7 5800X3D, met uitzondering van de wPrime, 3DMark 11 Physics, en 3DMark Time Spy CPU tests.
De Intel Core i9-12900K behoudt, dankzij zijn 16-core 24-thread configuratie en een 5,1 GHz boost klok, een comfortabele voorsprong in onze tests zonder dat het zweet uitbreekt.
| Blender - v2.79 BMW27 CPU | |
| AMD Ryzen 5 5600X | |
| AMD Ryzen 7 5800X3D | |
| AMD Ryzen 7 5800X | |
| Intel Core i5-12600K | |
| AMD Ryzen 9 5900X | |
| Intel Core i9-12900K | |
| AMD Ryzen 9 5950X | |
| WinRAR - Result | |
| AMD Ryzen 7 5800X | |
| AMD Ryzen 7 5800X3D | |
| AMD Ryzen 9 5900X | |
| AMD Ryzen 5 5600X | |
| AMD Ryzen 9 5950X | |
| Intel Core i9-12900K | |
| Intel Core i5-12600K | |
| HWBOT x265 Benchmark v2.2 - 4k Preset | |
| AMD Ryzen 9 5950X | |
| Intel Core i5-12600K | |
| Intel Core i9-12900K | |
| AMD Ryzen 9 5900X | |
| AMD Ryzen 7 5800X | |
| AMD Ryzen 7 5800X3D | |
| AMD Ryzen 5 5600X | |
| R Benchmark 2.5 - Overall mean | |
| AMD Ryzen 7 5800X3D | |
| AMD Ryzen 5 5600X | |
| AMD Ryzen 9 5950X | |
| AMD Ryzen 9 5900X | |
| AMD Ryzen 7 5800X | |
| Intel Core i5-12600K | |
| Intel Core i9-12900K | |
| LibreOffice - 20 Documents To PDF | |
| Intel Core i5-12600K | |
| AMD Ryzen 7 5800X3D | |
| AMD Ryzen 9 5900X | |
| AMD Ryzen 9 5950X | |
| AMD Ryzen 5 5600X | |
| AMD Ryzen 7 5800X | |
| Intel Core i9-12900K | |
| 3DMark 11 - 1280x720 Performance Physics | |
| Intel Core i9-12900K | |
| AMD Ryzen 7 5800X3D | |
| AMD Ryzen 9 5950X | |
| Intel Core i5-12600K | |
| AMD Ryzen 9 5900X | |
| AMD Ryzen 7 5800X | |
| AMD Ryzen 5 5600X | |
* ... kleiner is beter
De Corsair H115i Elite Capellix AIO koeler in combinatie met de 280 mm radiator is in staat om de Ryzen 7 5800X3D prima koel te houden. We merkten geen throttling in onze aanhoudende Cinebench R15 multi-core loop test.
Prestaties van de toepassing: Geen grote problemen bij de dagelijkse productiviteit en bepaalde creatieve workflows
De Ryzen 7 5800X3D kan behendig omgaan met dagelijkse productiviteitstaken, zoals blijkt uit de PCMark 10 resultaten. Zijn positie onderaan de grafiek kan worden toegeschreven aan lagere kloksnelheden, maar we zien slechts een prestatieachterstand van ongeveer 8% ten opzichte van de Ryzen 7 5800X.
Aangezien we geen Titan RTX hadden voor deze vergelijking, moesten we het doen met de RTX 3090 Ti als de GPU van keuze. Hoewel het op papier een Titan-klasse kaart is, maakt de RTX 3090 Ti gebruik van conventionele GeForce drivers, wat leidt tot kunstmatige prestatievermindering in sommige professionele toepassingen.
Desondanks zorgt de Ryzen 7 5800X3D en RTX 3090 Ti combinatie voor een aantal goede scores in bepaalde subsets van de SPECviewperf tests, zoals 3ds Max, Maya, Showcase, en Medical.
| PCMark 10 Score | 7607 punten | |
Help | ||
3D en gaming prestaties: Ryzen 7 5800X3D raast voorbij de Core i9-12900K op 1080p
AMD zet de Ryzen 7 5800X3D vooral in de markt als een gaming processor. Terwijl de 5800X3D duidelijk worstelt met ruwe CPU prestaties, draaien de rollen om als het aankomt op gaming toepassingen. We zien dit vooral bij lagere resoluties zoals 1080p.
De Ryzen 7 5800X3D+RTX 3090 Ti combo leidt duidelijk het peloton en slaagt er zelfs in om de Core i9-12900K+Titan RTX configuratie overtuigend te verslaan in een ruime meerderheid van 3DMark en Unigine tests met een aanzienlijke marge. Merk op dat de Ryzen 7 5800X3D het nog steeds verliest van Intel Alder Lake aanbiedingen en de meeste van zijn Zen 3 neven in CPU-only aspecten van deze benchmarks, zoals eerder getoond. De RTX 3090 Ti lijkt zijn spierballen te hebben bijgedragen in deze tests, aangezien het duidelijk een veel krachtigere kaart is dan de Titan RTX die we in eerdere reviews hadden gebruikt.
Voor een meer gedetailleerde analyse van synthetische 3D benchmark resultaten, verwijzen we naar onze review van de Zotac GeForce RTX 3090 Ti AMP Extreme Holo GPU.
| 3DMark 11 Performance | 49471 punten | |
| 3DMark Ice Storm Standard Score | 233264 punten | |
| 3DMark Cloud Gate Standard Score | 75753 punten | |
| 3DMark Fire Strike Score | 36563 punten | |
| 3DMark Fire Strike Extreme Score | 24198 punten | |
| 3DMark Time Spy Score | 19241 punten | |
Help | ||
De Ryzen 7 5800X3D is de duidelijke winnaar als je op zoek bent naar een van de snelste gaming CPU's die momenteel verkrijgbaar zijn. Helaas konden we nog geen Core i9-12900KS sample bemachtigen, dus de onderstaande vergelijking is beperkt tot de Core i9-12900K en de Core i5-12600K uit de stal van Team Blue.
Resoluties op 1080p zullen het meest profiteren van de verhoogde cache, aangezien deze instellingen meer CPU-beperkt zijn in vergelijking met 2K en hoger. Dienovereenkomstig lijkt de Ryzen 7 5800X3D een ideale match te zijn voor de RTX 3090 Ti om zoveel mogelijk frames te pushen bij deze resolutie. De uplift van de Core i9-12900K kan oplopen tot 40% (Borderlands 3, 1080p Badass Quality), afhankelijk van het spel en de gekozen kwaliteitsinstellingen.
| F1 2021 | |
| 1920x1080 Medium Preset AA:T AF:16x | |
| AMD Ryzen 7 5800X3D, NVIDIA GeForce RTX 3090 Ti | |
| AMD Ryzen 9 5900X, NVIDIA Titan RTX | |
| Intel Core i9-12900K, NVIDIA Titan RTX | |
| Intel Core i5-12600K, NVIDIA Titan RTX | |
| 1920x1080 High Preset AA:T AF:16x | |
| AMD Ryzen 7 5800X3D, NVIDIA GeForce RTX 3090 Ti | |
| AMD Ryzen 9 5900X, NVIDIA Titan RTX | |
| Intel Core i9-12900K, NVIDIA Titan RTX | |
| Intel Core i5-12600K, NVIDIA Titan RTX | |
| 1920x1080 Ultra High Preset + Raytracing AA:T AF:16x | |
| AMD Ryzen 7 5800X3D, NVIDIA GeForce RTX 3090 Ti | |
| AMD Ryzen 9 5900X, NVIDIA Titan RTX | |
| Intel Core i9-12900K, NVIDIA Titan RTX | |
| Intel Core i5-12600K, NVIDIA Titan RTX | |
| lage | gem. | hoge | ultra | QHD | 4K | |
|---|---|---|---|---|---|---|
| GTA V (2015) | 185.59 | 160.67 | 155.26 | 182.63 | ||
| The Witcher 3 (2015) | 394 | 193.4 | 172.9 | |||
| Dota 2 Reborn (2015) | 257.7 | 231.2 | 217.1 | 195.8 | 184.2 | |
| Final Fantasy XV Benchmark (2018) | 222 | 226 | 186.1 | 151.6 | 96.3 | |
| X-Plane 11.11 (2018) | 169.1 | 158.1 | 135.9 | 115.7 | ||
| Shadow of the Tomb Raider (2018) | 265 | 257 | 244 | 184 | 106 | |
| Metro Exodus (2019) | 213 | 175.2 | 145.9 | 125.3 | 84.3 | |
| Total War: Three Kingdoms (2019) | 342.6 | 248.9 | 176.6 | 117.9 | 59.9 | |
| Control (2019) | 240 | 209 | 142.5 | 73.9 | ||
| Borderlands 3 (2019) | 204 | 187.6 | 173.3 | 143.1 | 83.8 | |
| Mafia Definitive Edition (2020) | 240 | 231 | 173.9 | 99.2 | ||
| Watch Dogs Legion (2020) | 171.4 | 154.2 | 130.2 | 107.8 | 70.1 | |
| Assassin´s Creed Valhalla (2020) | 160 | 138 | 123 | 108 | 73 | |
| F1 2021 (2021) | 537 | 470 | 242 | 189.3 | 114.9 | |
| Far Cry 6 (2021) | 179 | 161.6 | 142 | 132.9 | 89.9 | |
| Call of Duty Vanguard (2021) | 195.5 | 207 | 191.2 | 149.9 | 93.7 | |
| Forza Horizon 5 (2021) | 231 | 200 | 188 | 127 | 114 | 89 |
| Rainbow Six Extraction (2022) | 411 | 347 | 315 | 290 | 208 | 116 |
| Dying Light 2 (2022) | 202 | 171.4 | 153 | 113.2 | 64.3 | |
| GRID Legends (2022) | 228 | 202 | 173.4 | 156.6 | 153.2 | 120.5 |
| Elden Ring (2022) | 60 | 60 | 60 | 60 | 60 | 60 |
| Cyberpunk 2077 1.6 (2022) | 219 | 201 | 172.8 | 151.8 | 103.9 | 53.3 |
| Ghostwire Tokyo (2022) | 263 | 260 | 261 | 261 | 210 | 113.2 |
| Tiny Tina's Wonderlands (2022) | 324 | 277 | 231 | 190.2 | 142.6 | 81.1 |
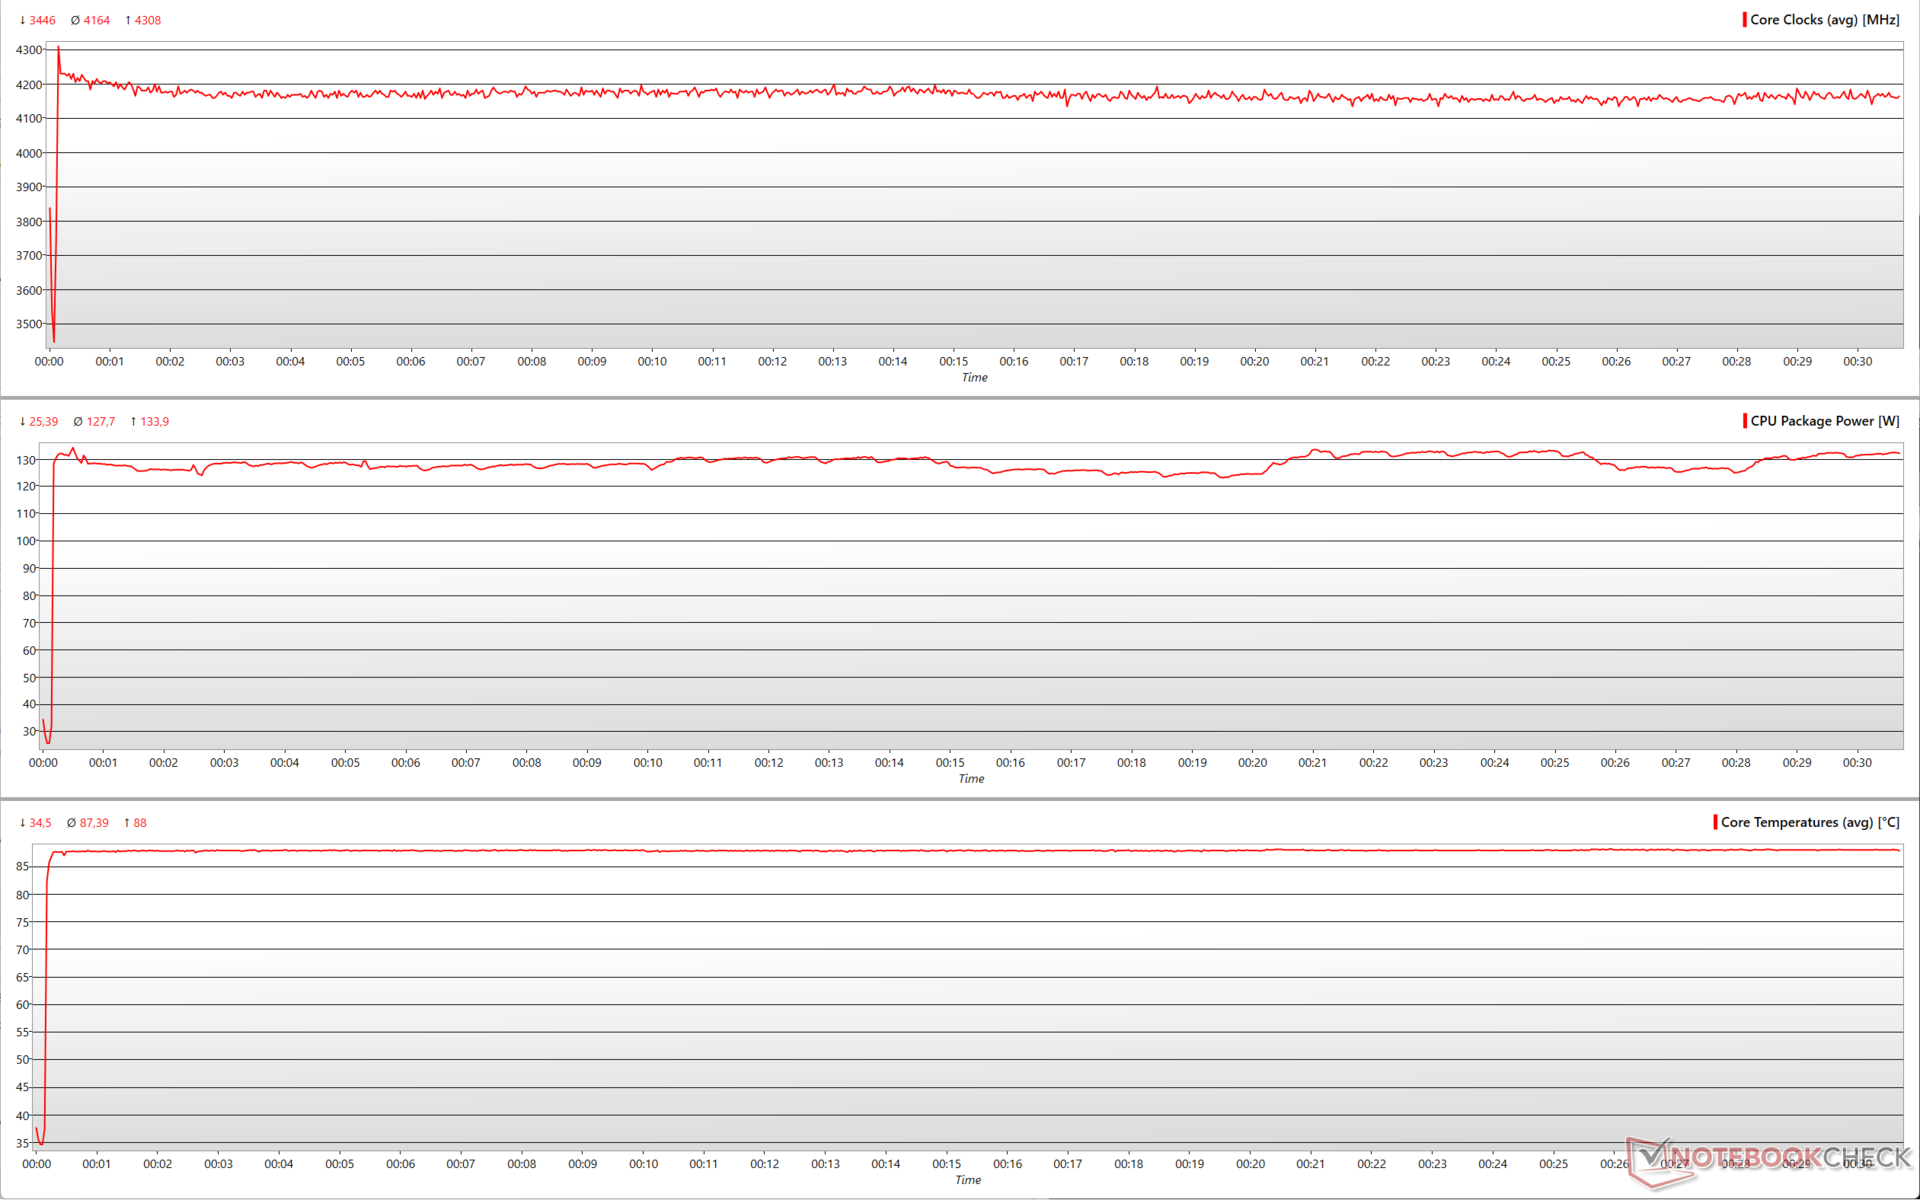
Stress test en temperaturen: Geen throttling problemen
Door de Ryzen 7 5800X3D te belasten met Prime95 komt het vermogen van het CPU-pakket net boven de 130 W uit en blijven de kloksnelheden redelijk consistent dicht bij 4,2 GHz. CPU temperaturen schommelen rond de 90 °C markering zonder throttling.
Deze consistentie in prestaties werd eerder ook gezien in de Cinebench R15 multi-core loop test hierboven. Dit kan deels worden toegeschreven aan de Ryzen 7 5800X3D en ook deels aan de uitstekende koelprestaties van de Corsair H115i Elite Capellix AIO koeler.
Energieverbruik: Minder zuinig dan Core i5-12600K ondanks lagere prestaties
Ons testsysteem verbruikt ongeveer 102 W in ruststand met in totaal vijf casefans (drie Corsair SP 120 mm casefans en twee Corsair ML 120 mm radiator fans) en de Elite Capellix koeler werkend in het Balanced profiel. Alle RGB-verlichting was uitgeschakeld.
Het stroomverbruik is min of meer vergelijkbaar met de Ryzen 9 5900X en ongeveer 29% hoger dan de Ryzen 5 5600X in Prime95 in-place FFT stress. Cinebench R15 multi-core ziet de Ryzen 7 5800X3D iets minder zuinig zijn dan de Core i5-12600K ook al laat AMD's chip een prestatieachterstand van 6% zien. Een soortgelijk profiel zien we ook bij Cinebench R20 multi, ditmaal met een nog groter prestatieverschil van 18% ten opzichte van de Core i5-12600K.
De Ryzen 7 5800X3D blijft achter op de Core i9-12900K met 26% in Cinebench R20 single-core, maar lijkt iets meer stroom te verbruiken. In het algemeen is het totale systeemverbruik met de Ryzen 7 5800X3D echter nog steeds beperkt tot rond de 230 W, terwijl de Core i9-12900K aangedreven PC bijna 57% meer energie kan spuwen in multi-core CPU tests.
Power Consumption: External Monitor
* ... kleiner is beter
Pro
Contra
Verdict: Uitsluitend voor gamers en OG Zen-gebruikers
AMD heeft lang vastgehouden aan socket AM4. Zelfs met de lancering van de Ryzen 7000-serie op socket AM5, verwacht het bedrijf dat de oudere socket voor het grootste deel goed zal presteren. De Ryzen 7 5800X3D is meer een testbed voor AMD, waarvan de lessen zullen worden verwerkt in toekomstige iteraties. Dat gezegd zijnde, lijkt de Ryzen 7 5800X3D duidelijk een goede keuze als je primaire use case gaming is, vooral bij lagere resoluties.
Het gebruik van een 3D stacked-cache geeft games aanzienlijke speelruimte. Het brengt echter een aantal valkuilen met zich mee, waaronder het niet kunnen overklokken van de kernen zelf en lagere base/boost klokken om ervoor te zorgen dat het TDP niet boven de 105 W komt
3D V-cache is een ingenieuze manier om de gaming prestaties te verbeteren zonder het TDP te verhogen. Gamers zullen 3D V-cache nuttig vinden om hogere frames te pushen dan de Core i9-12900K voor ongeveer 120 US$ minder. Voor alle andere taken blijken de lagere kloksnelheden en het gebrek aan overklokken grote beperkingen te zijn.
De Ryzen 7 5800X3D lijdt als het gaat om ruwe CPU prestaties in vergelijking met zijn broers en zussen uit de Zen 3 familie, en verliest zeker van de Alder Lake Core i5-12600K en Core i9-12900K processoren. De keerzijde is dat dit prestatieverlies niet gepaard gaat met een lager stroomverbruik
Hoewel we de Ryzen 7 5800X3D zien achterblijven als het gaat om de Physics component van synthetische 3D benchmarks, begint de processor zijn waarde te tonen in de grafische componenten van deze tests. Gamen op 1080p of QHD is de beste use case voor deze processor. Gekoppeld aan de juiste GPU, kan de Ryzen 7 5800X3D frames veel meer pushen dan mogelijk is met de Core i9-12900K.
Dit roept de vraag op. Is deze CPU het waard om naar te upgraden?
Socket AM4 is nu een zeer stabiel platform. Het is nog vroeg voor socket AM5 en gebruikers zouden willen afwachten hoe de nieuwe Ryzen 7000 CPU's presteren in praktijktests en ook de best mogelijke DDR5 geheugencombinaties willen ontdekken voordat ze de sprong wagen.
Gamers die nog op oudere generatie Zen processoren zitten, zoals een Ryzen 7 2700Xbijvoorbeeld, zullen de Ryzen 7 5800X3D een waardige upgrade vinden en zullen de 120 US$ die ze besparen in vergelijking met de Core i9-12900K graag in hun zak steken, naast het besparen op moederbord upgrades (ervan uitgaande dat je huidige bord nog steeds fatsoenlijke stroomlevering biedt). Scheppers van inhoud en degenen die een betere all-round presteerder nodig hebben, kunnen echter beter andere opties zoeken, zoals de Ryzen 7 5800X voor dezelfde MSRP van US$449.
De Core i5-12600K is een nog beter koopje voor slechts US$289 MSRP, mits extra investeren in Intels ecosysteem geen beperking is.
Prijs en beschikbaarheid
Price comparison

