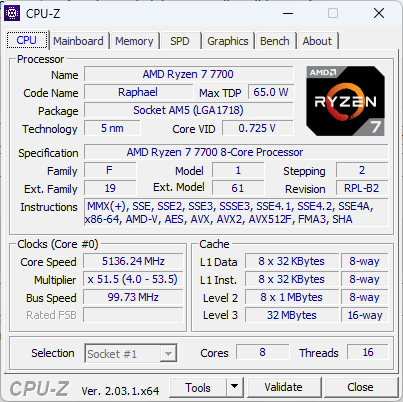
AMD Ryzen 7 7700 65 W Ryzen 7000 Review: Able Core i9-12900K en Core i5-13600K uitdager die US$70 minder is dan Ryzen 7 7700X

Na eind vorig jaar de Ryzen 7000 line-up te hebben geïntroduceerd, heeft AMD op CES 2023 enkele toevoegingen aan de Raphael Zen 4 familie geïntroduceerd. De oorspronkelijke lancering omvatte vier processoren geleid door de 16C/32T Ryzen 9 7950X.
De Ryzen 7x0X line-up zijn gewaardeerd op 105 W TDP, met de 12C/24T Ryzen 9 7900X en de 16C/32T Ryzen 9 7950X gaan tot 170 W. Gebruikers kunnen deze CPU's op lagere TDP's van 105 W en 65 W draaien, wat resulteert in aanzienlijke energiebesparingen met verwaarloosbaar prestatieverlies.
Vandaag stelt AMD de nieuwe 65 W Ryzen 7000 CPU's beschikbaar die op de CES zijn onthuld. Deze non-X CPU's zijn gebaseerd op het nieuwe AM5-platform en zijn gericht op budgetprijzen. Ook al zijn dit non-X processors, ze zijn volledig unlocked, ondersteunen overklokken, en worden zelfs geleverd met een Wraith koeler in de doos.
Een overzicht van AMD 'Raphael' Zen 4 Ryzen 7000 desktop processors
| AMD Ryzen 7000 SKU | Kernen / Threads | Basisklok | Turboklok | L2 Cache | L3 Cache | TDP | PPT | Lanceerprijs |
|---|---|---|---|---|---|---|---|---|
| AMD Ryzen 9 7950X | 16 / 32 | 4,5 GHz | 5,7 GHz | 16x 1 MB | 64 MB | 170 W | 230 W | US$699 |
| AMD Ryzen 9 7900X | 12 / 24 | 4,7 GHz | 5,6 GHz | 12x 1 MB | 64 MB | 170 W | 230 W | US$549 |
| AMD Ryzen 9 7900 | 12 / 24 | 3,7 GHz | 5,4 GHz | 12x 1 MB | 64 MB | 65 W | 88 W | US$429 |
| AMD Ryzen 7 7700X | 8 / 16 | 4,5 GHz | 5,4 GHz | 8x 1 MB | 32 MB | 105 W | 142 W | US$399 |
| AMD Ryzen 7 7700 | 8 / 16 | 3,8 GHz | 5,3 GHz | 8x 1 MB | 32 MB | 65 W | 88 W | US$329 |
| AMD Ryzen 5 7600X | 6 / 12 | 4,7 GHz | 5,3 GHz | 6x 1 MB | 32 MB | 105 W | 142 W | US$299 |
| AMD Ryzen 5 7600 | 6 / 12 | 3,8 GHz | 5,1 GHz | 6x 1 MB | 32 MB | 65 W | 88 W | US$229 |
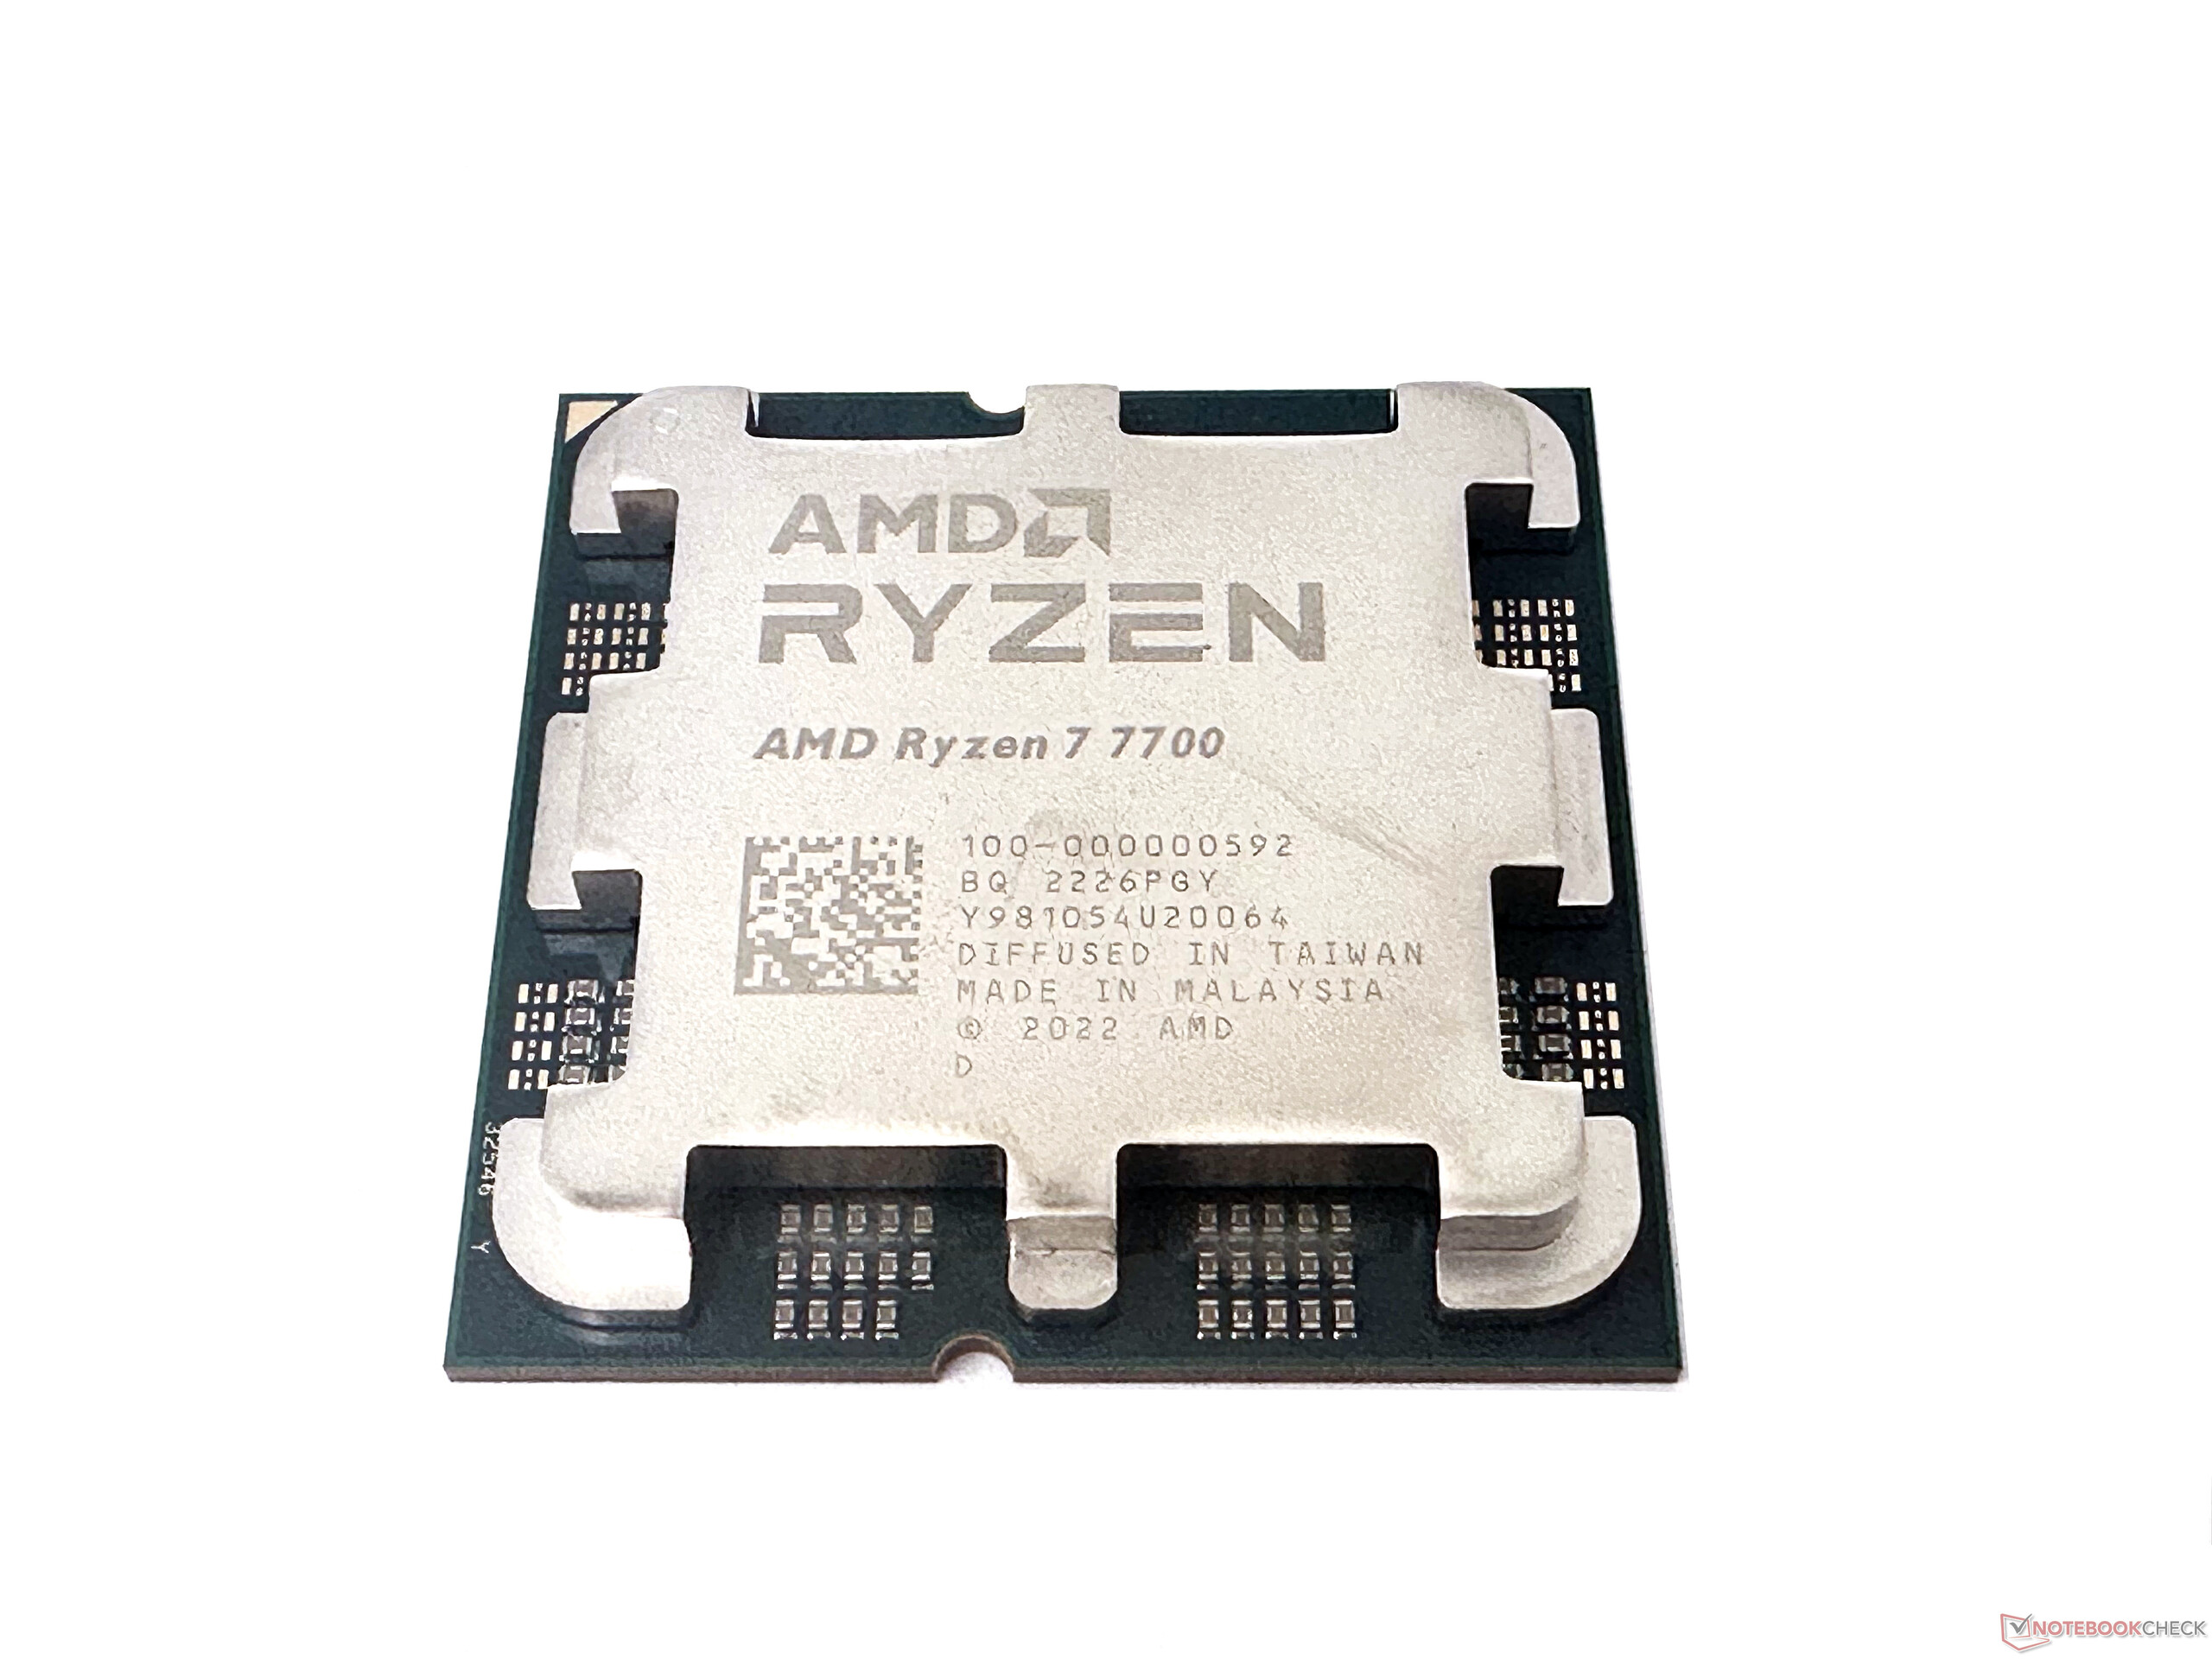
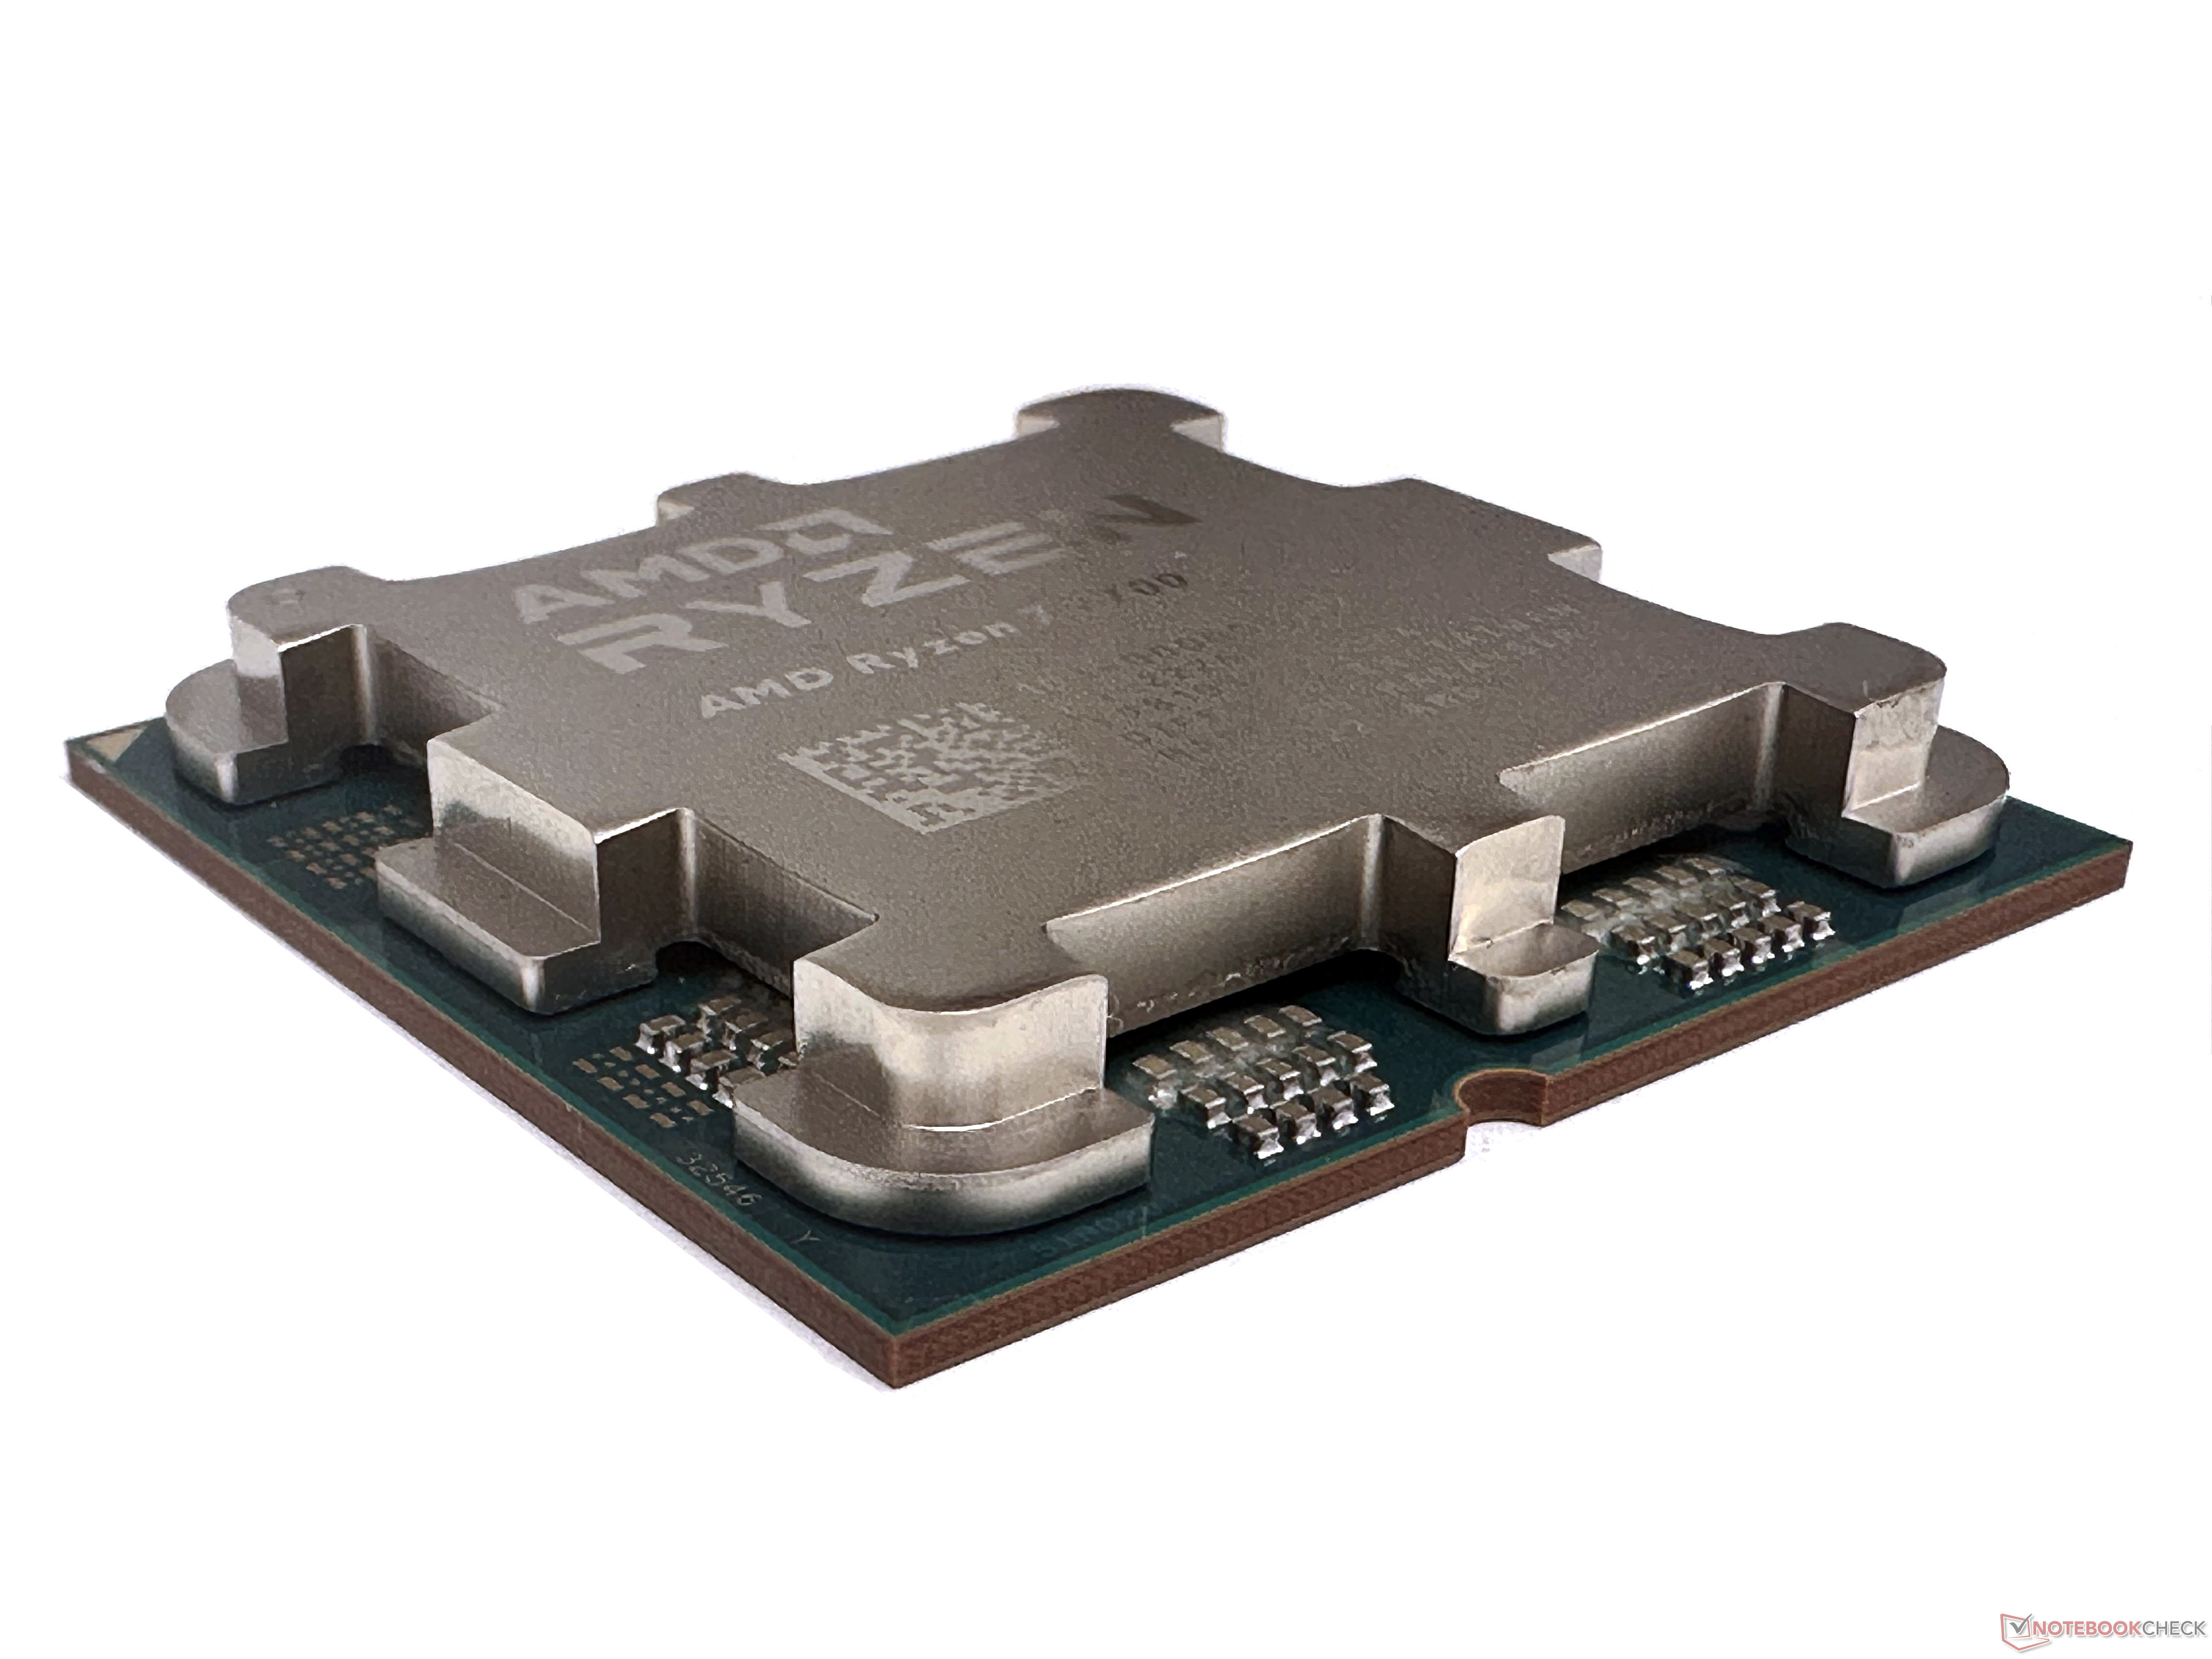
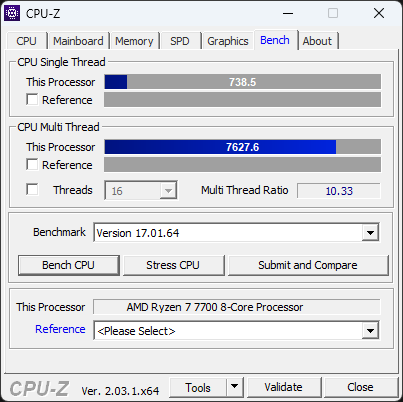
We hebben hier de AMD Ryzen 7 7700. De Ryzen 7 7700 is in veel opzichten verwant aan deRyzen 7 7700Xmaar draait standaard op lagere basis- en boost klokken, wat een lagere TDP vereist. De processor is ook ongeveer 70 dollar goedkoper dan zijn X neefje.
In deze review kijken we naar de AMD Ryzen 7 7700 en zien we hoe goed de vraagprijs van US$329 zich verhoudt tot zijn duurdere neven.
De testbank: Ryzen 7 7700 wordt gekoppeld aan de RTX 3090
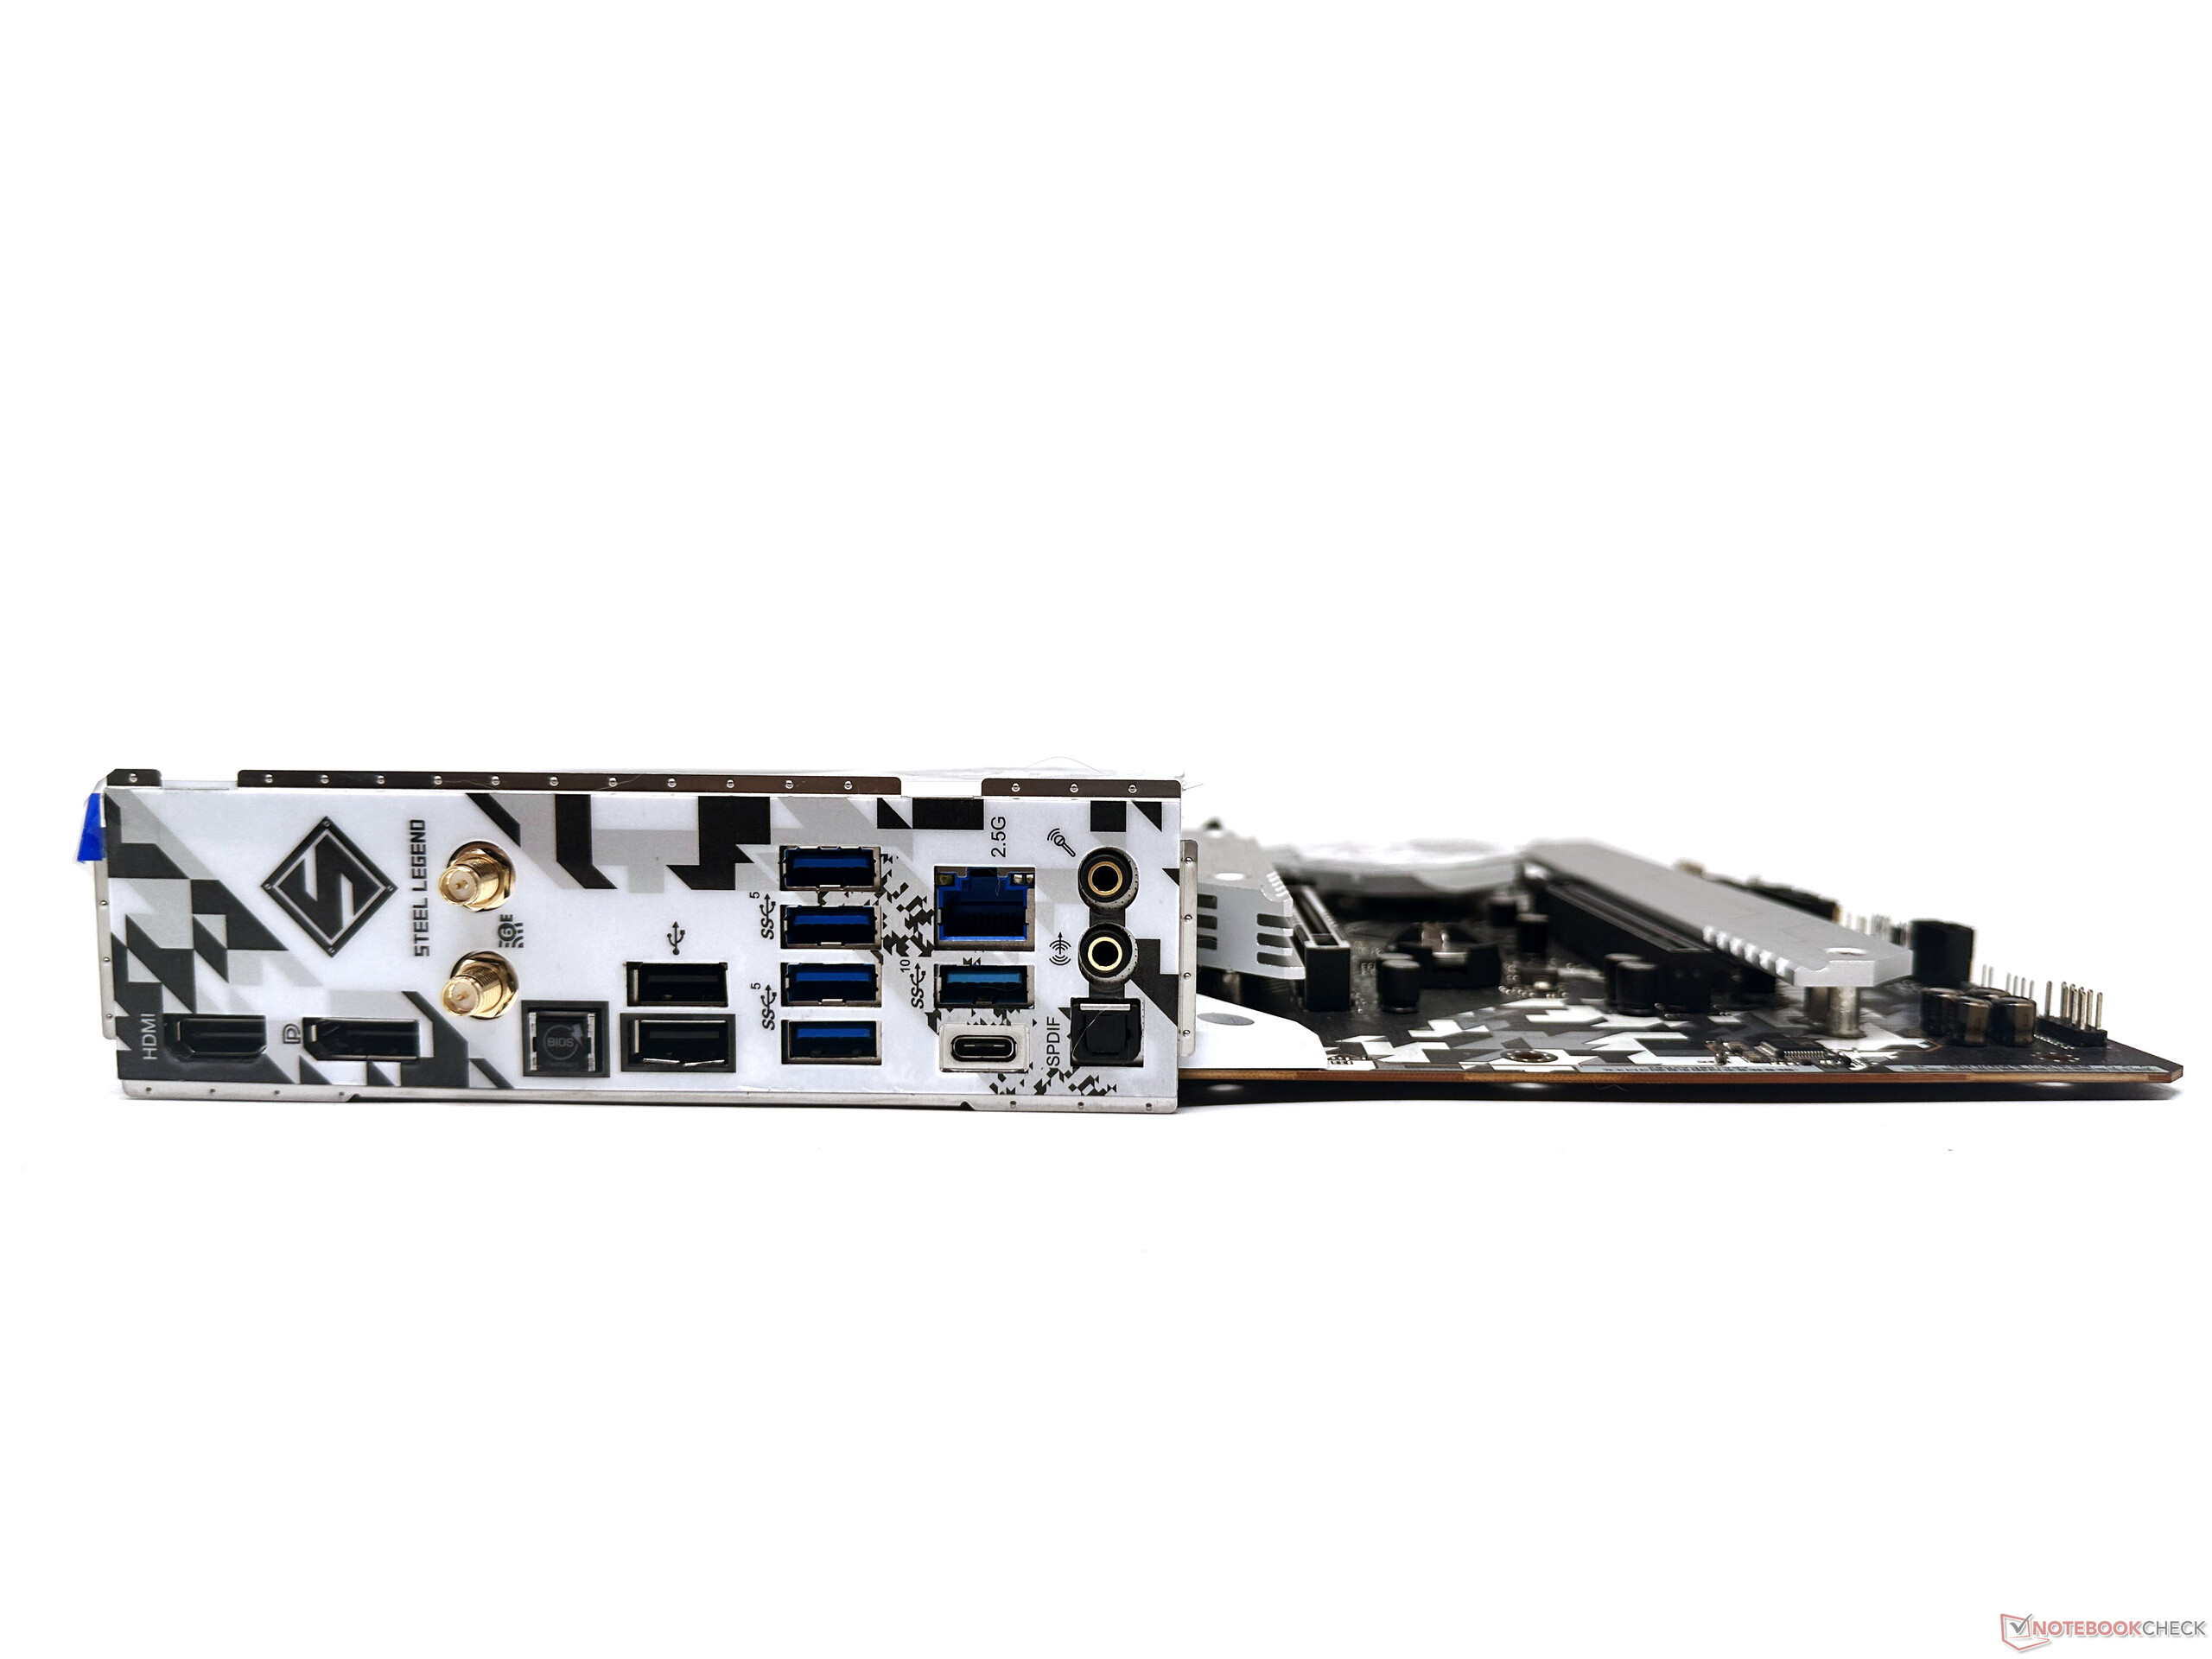
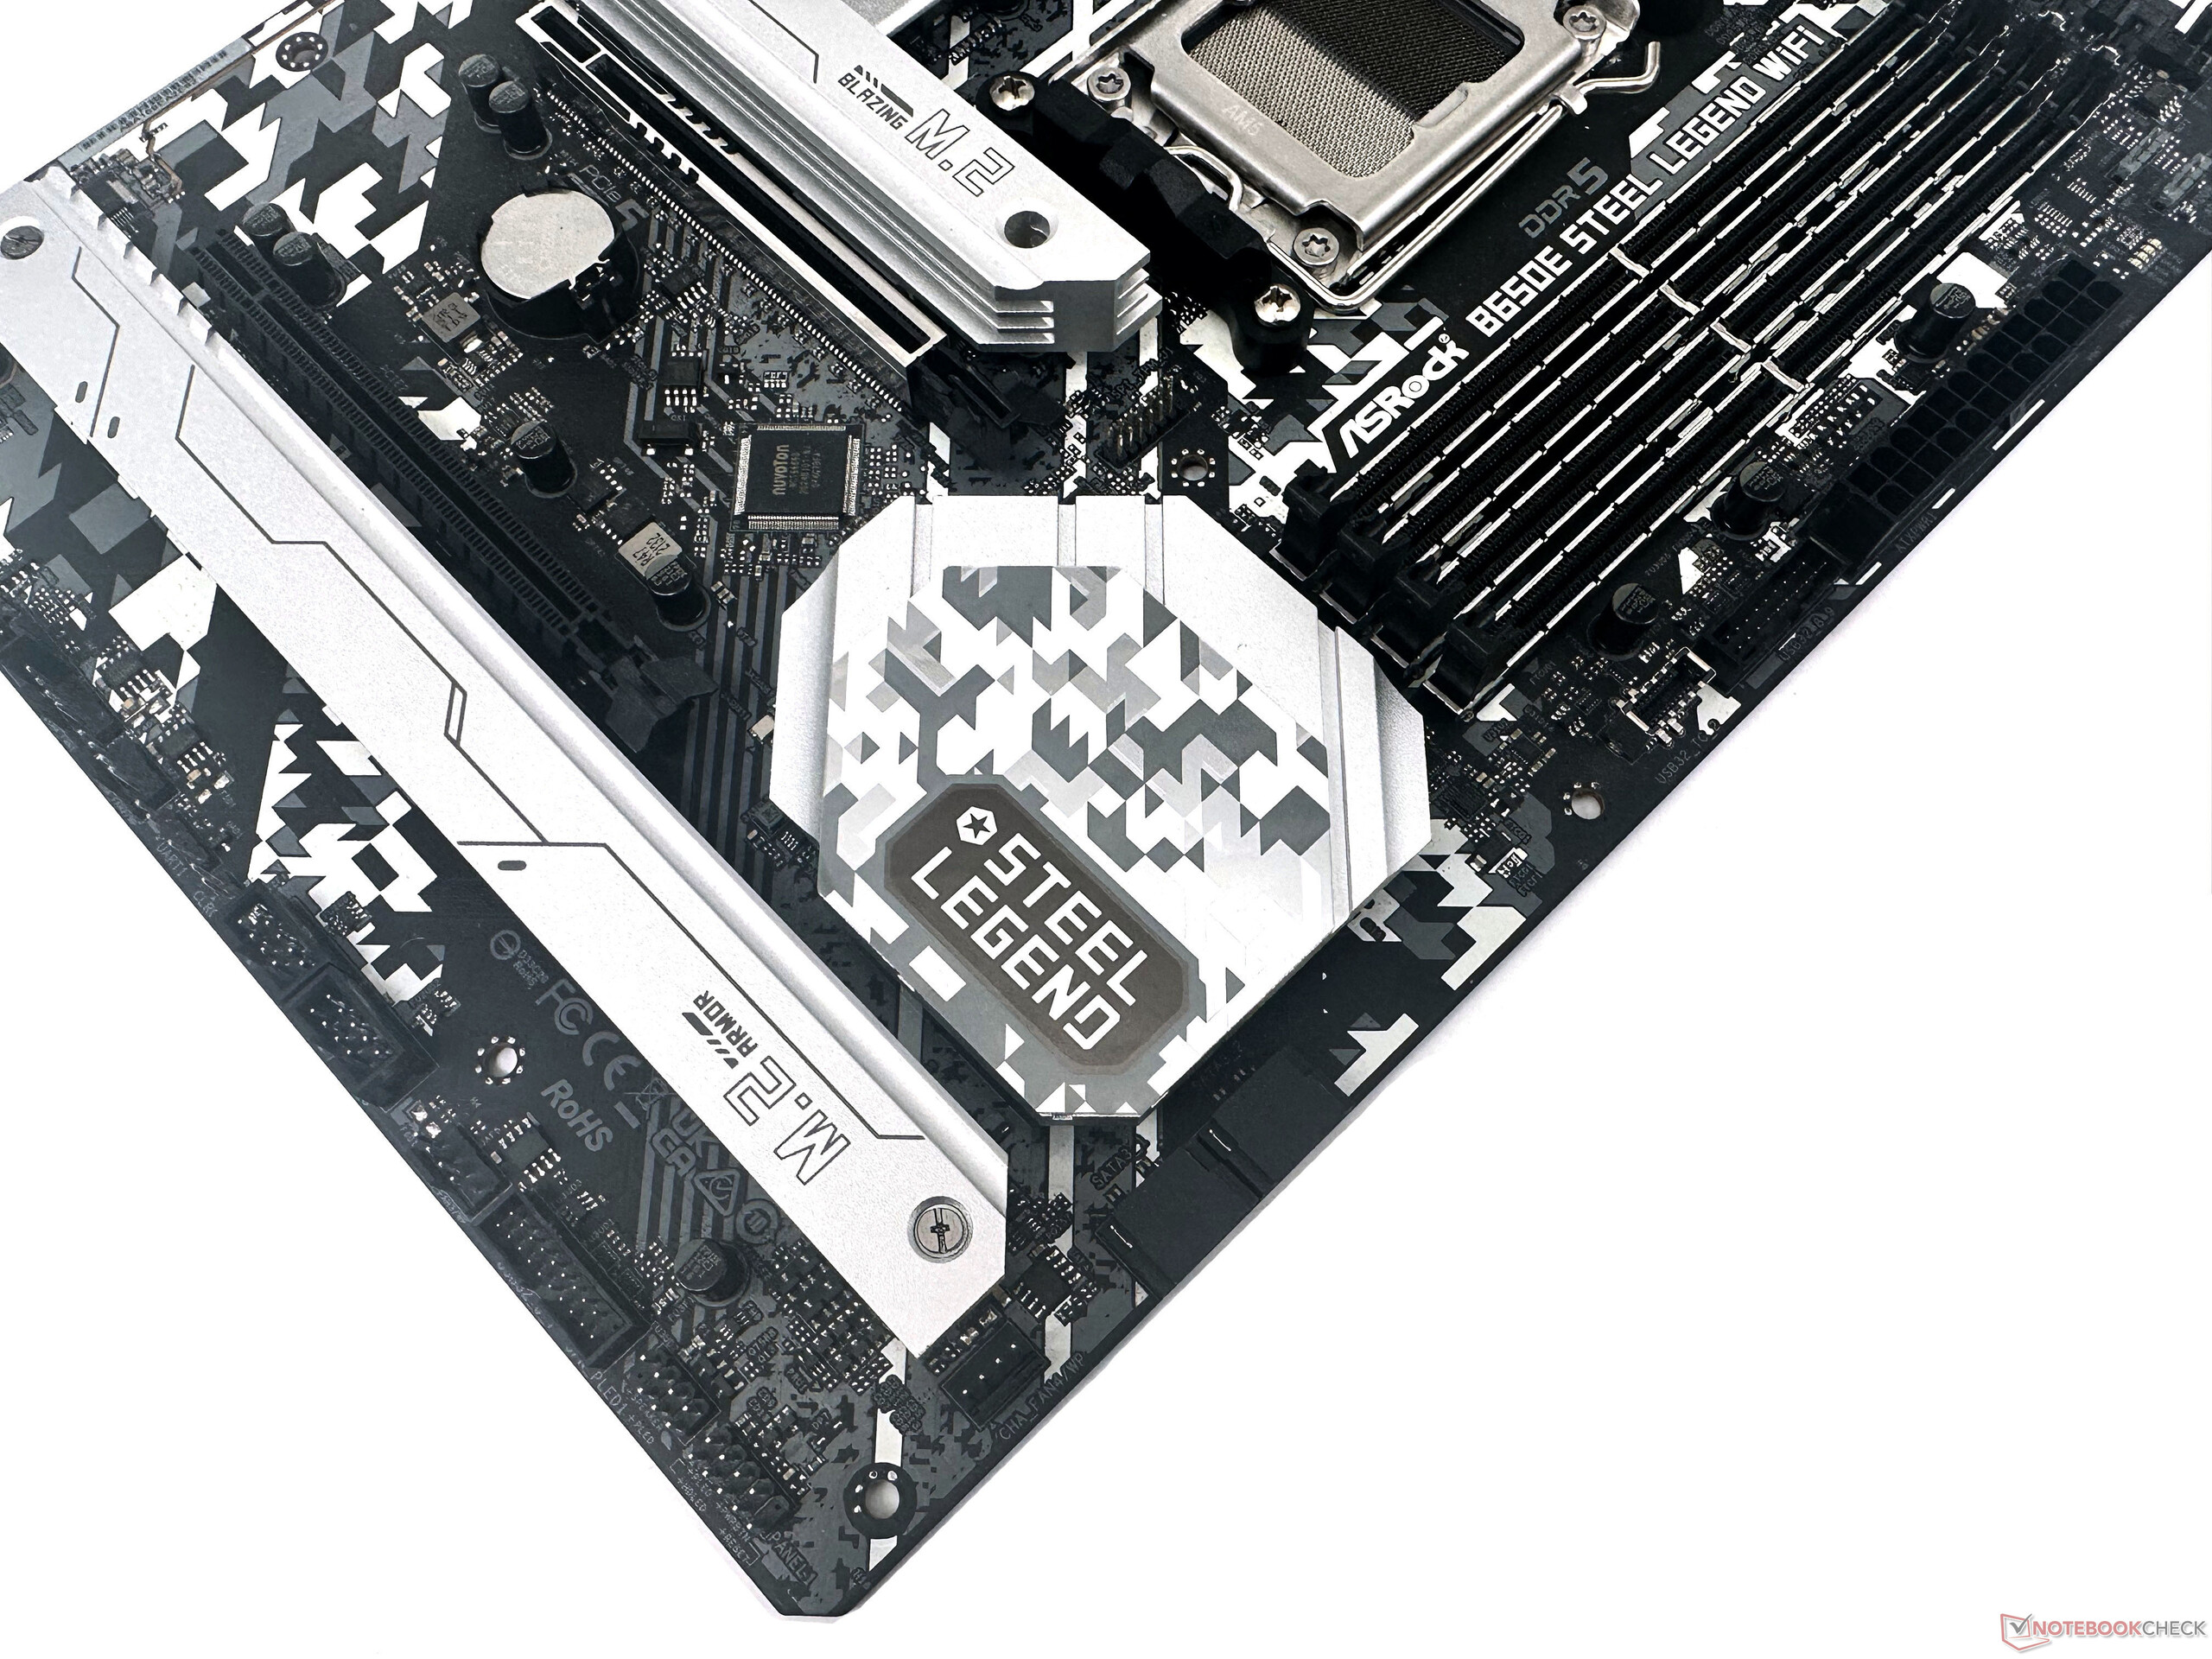
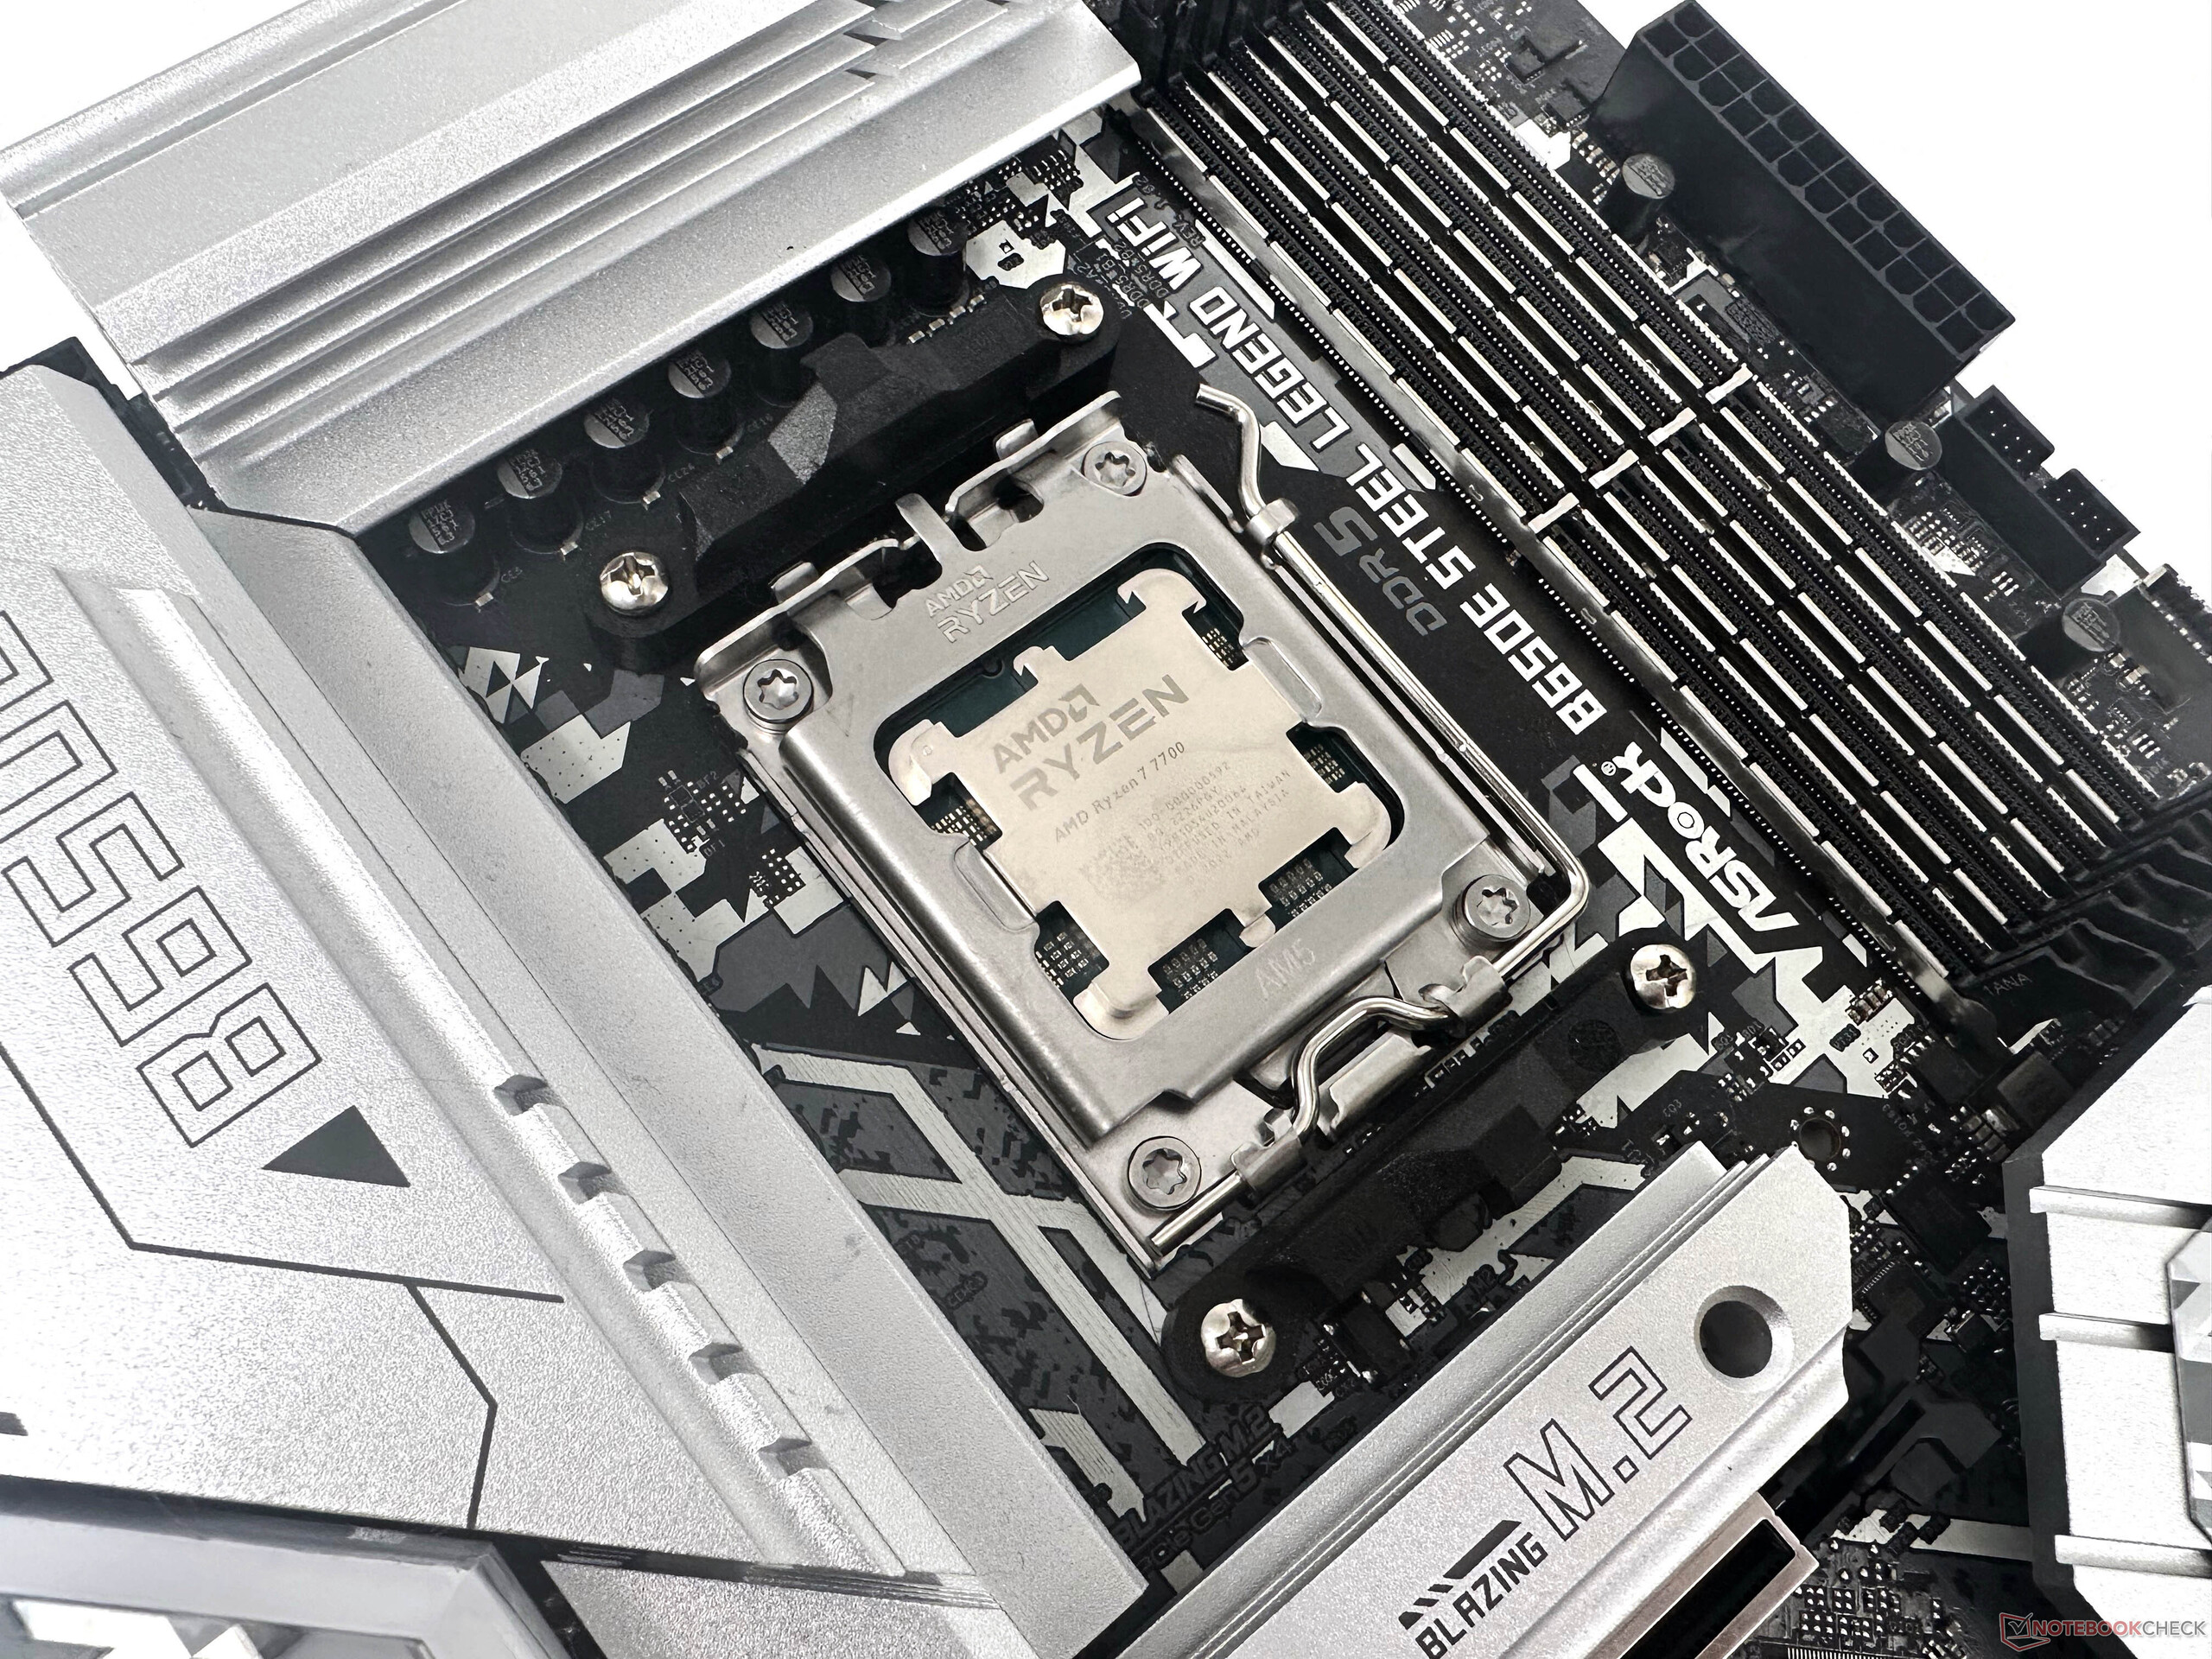
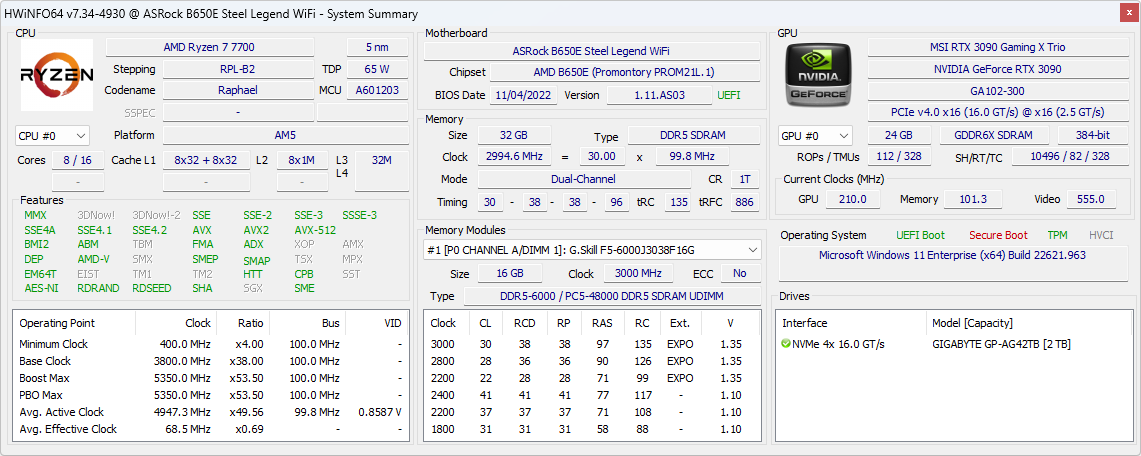
Onze testbank voor de AMD Ryzen 7 7700 is gebaseerd op de nieuwe B650E chipset. Deze bevat de volgende componenten:
- Cooler Master MasterFrame 700 testbank
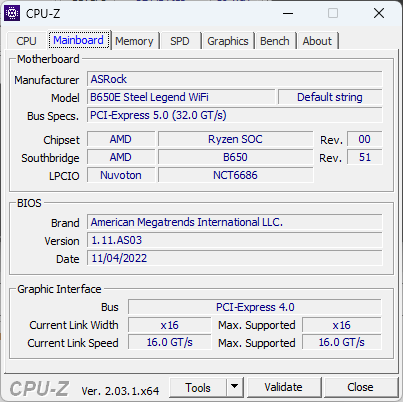
- ASRock B650E Steel Legend Wi-Fi met BIOS 1.11.AS03
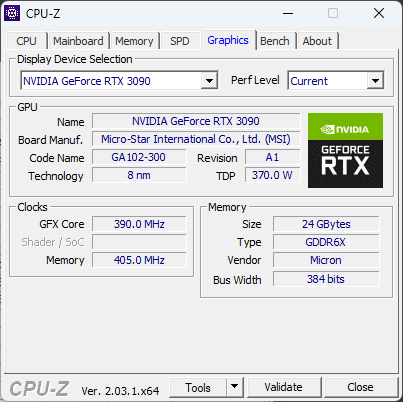
- MSI Gaming X Trio GeForce RTX 3090 GPU
- Gigabyte Aorus Gen 4 2 TB NVMe SSD voor benchmarks en games
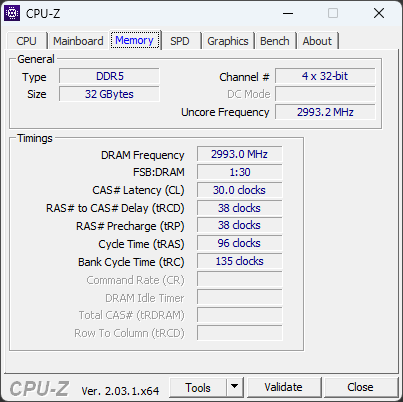
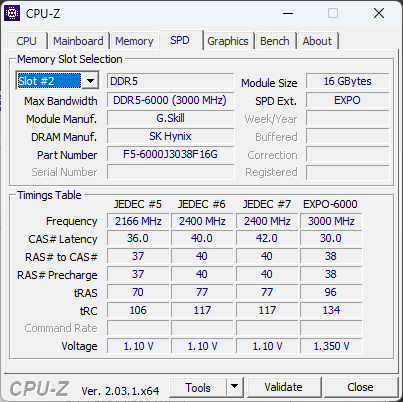
- 2x 16 GB G.SKILL Trident Z5 Neo DDR5-6000 RAM met timings 30-38-38-96 bij 1,35 V
- Gigabyte M28U 4K 144 Hz monitor
- Cooler Master MasterLiquid ML360L V2 ARGB AIO-koeler
- Thermaltake ToughPower Grand RGB 850 W PSU
We willen AMD bedanken voor het leveren van de Ryzen 7 7700 CPU, het ASRock B650E moederbord, en de G.SKILL DDR5 geheugen kit. We willen ook MSI bedanken voor de Gaming X Trio RTX 3090 GPU, Gigabyte voor de M28U monitor en Aorus NVMe SSD, en tot slot Cooler Master voor de testbank en AIO koeler.
CPU benchmarks: Recht op de hielen van de Core i9-12900K in single-core
Cumulatieve CPU benchmarks laten zien dat de Ryzen 7 7700 knaagt aan de hellen van de Intel Alder Lake Core i9-12900K terwijl hij slechts 4% achter ligt op de Ryzen 7 7700X. Hoewel dit een geweldige show is, helpen individuele benchmarks een duidelijker beeld te schetsen.
In Cinebench R23, R20 en R15 laat de Ryzen 7 7700 zeer goede single-core prestaties zien die op gelijke voet staan met de rest van de Ryzen 7000-stapel. De nieuwste Zen 4 CPU blijft achter bij de Intel Raptor Lake Core i9-13900K met maximaal 15% in deze tests. In Cinebench multi-core tests kan de Ryzen 7 7700 niet tippen aan de Core i9-12900K of zelfs de Core i5-13600K vanwege het verminderde aantal threads.
De lagere boost klokken in vergelijking met de Ryzen 7 7700X zet de niet-X versie op een lichte 5% achterstand in Cinebench multi-core tests.
Vergelijkbare trends worden ook gezien in Geekbench, maar de delta tussen de Core i9-13900K en de Ryzen 7 7700 is veel lager in single-core tests in vergelijking met wat we hebben gezien met Cinebench.
De Ryzen 7 7700 probeert het gat met de Core i9-12900K te dichten in tests zoals wPrime, R Benchmark en LibreOffice. Hij kan het Intel-vlaggenschip van de vorige generatie niet helemaal overtreffen, maar komt wel aardig in de buurt.
In wezen zijn de prestaties van de Ryzen 7 7700 precies hetzelfde als die van een 65 W TDP-gelimiteerde Ryzen 7 7700X, met als voordeel dat gebruikers die single-threaded workloads uitvoeren, Ryzen 9 7950X-prestatieniveaus krijgen terwijl ze aanzienlijk geld besparen.
| Performance rating - Percent | |
| AMD Ryzen 9 7950X | |
| Intel Core i9-13900K | |
| AMD Ryzen 9 7950X ECO 105 W -12! | |
| AMD Ryzen 9 7900X | |
| AMD Ryzen 9 7950X ECO 65 W -14! | |
| AMD Ryzen 9 5950X | |
| AMD Ryzen 7 7700X | |
| Intel Core i5-13600K | |
| Intel Core i9-12900K | |
| AMD Ryzen 7 7700 | |
| AMD Ryzen 7 7700X ECO 65 W -12! | |
| AMD Ryzen 9 5900X -2! | |
| AMD Ryzen 5 7600X | |
| AMD Ryzen 7 5800X | |
| Intel Core i5-12600K | |
| AMD Ryzen 7 5800X3D | |
| AMD Ryzen 5 5600X | |
| Cinebench R23 | |
| Single Core | |
| Intel Core i9-13900K | |
| AMD Ryzen 9 7900X | |
| AMD Ryzen 9 7950X | |
| Intel Core i5-13600K | |
| AMD Ryzen 9 7950X ECO 65 W | |
| AMD Ryzen 9 7950X ECO 105 W | |
| Intel Core i9-12900K | |
| AMD Ryzen 7 7700X ECO 65 W | |
| AMD Ryzen 7 7700X | |
| AMD Ryzen 5 7600X | |
| AMD Ryzen 7 7700 | |
| Intel Core i5-12600K | |
| AMD Ryzen 9 5950X | |
| AMD Ryzen 9 5900X | |
| AMD Ryzen 7 5800X | |
| AMD Ryzen 5 5600X | |
| AMD Ryzen 7 5800X3D | |
| Multi Core | |
| Intel Core i9-13900K | |
| AMD Ryzen 9 7950X | |
| AMD Ryzen 9 7950X ECO 105 W | |
| AMD Ryzen 9 7950X ECO 65 W | |
| AMD Ryzen 9 7900X | |
| AMD Ryzen 9 5950X | |
| Intel Core i9-12900K | |
| Intel Core i5-13600K | |
| AMD Ryzen 9 5900X | |
| AMD Ryzen 7 7700X | |
| AMD Ryzen 7 7700 | |
| AMD Ryzen 7 7700X ECO 65 W | |
| Intel Core i5-12600K | |
| AMD Ryzen 5 7600X | |
| AMD Ryzen 7 5800X | |
| AMD Ryzen 7 5800X3D | |
| AMD Ryzen 5 5600X | |
| Cinebench R20 | |
| CPU (Single Core) | |
| Intel Core i9-13900K | |
| AMD Ryzen 9 7900X | |
| AMD Ryzen 9 7950X | |
| AMD Ryzen 9 7950X ECO 65 W | |
| AMD Ryzen 9 7950X ECO 105 W | |
| Intel Core i5-13600K | |
| AMD Ryzen 7 7700X ECO 65 W | |
| AMD Ryzen 7 7700X | |
| Intel Core i9-12900K | |
| AMD Ryzen 5 7600X | |
| AMD Ryzen 7 7700 | |
| Intel Core i5-12600K | |
| AMD Ryzen 9 5950X | |
| AMD Ryzen 9 5900X | |
| AMD Ryzen 7 5800X | |
| AMD Ryzen 5 5600X | |
| AMD Ryzen 7 5800X3D | |
| CPU (Multi Core) | |
| Intel Core i9-13900K | |
| AMD Ryzen 9 7950X | |
| AMD Ryzen 9 7950X ECO 105 W | |
| AMD Ryzen 9 7950X ECO 65 W | |
| AMD Ryzen 9 7900X | |
| AMD Ryzen 9 5950X | |
| Intel Core i9-12900K | |
| Intel Core i5-13600K | |
| AMD Ryzen 9 5900X | |
| AMD Ryzen 7 7700X | |
| AMD Ryzen 7 7700X ECO 65 W | |
| AMD Ryzen 7 7700 | |
| Intel Core i5-12600K | |
| AMD Ryzen 7 5800X | |
| AMD Ryzen 5 7600X | |
| AMD Ryzen 7 5800X3D | |
| AMD Ryzen 5 5600X | |
| Cinebench R15 | |
| CPU Single 64Bit | |
| Intel Core i9-13900K | |
| AMD Ryzen 9 7900X | |
| AMD Ryzen 9 7950X | |
| AMD Ryzen 9 7950X ECO 105 W | |
| AMD Ryzen 7 7700X ECO 65 W | |
| AMD Ryzen 5 7600X | |
| AMD Ryzen 9 7950X ECO 65 W | |
| AMD Ryzen 7 7700X | |
| AMD Ryzen 7 7700 | |
| Intel Core i5-13600K | |
| Intel Core i9-12900K | |
| Intel Core i5-12600K | |
| AMD Ryzen 9 5950X | |
| AMD Ryzen 9 5900X | |
| AMD Ryzen 7 5800X | |
| AMD Ryzen 5 5600X | |
| AMD Ryzen 7 5800X3D | |
| CPU Multi 64Bit | |
| AMD Ryzen 9 7950X | |
| Intel Core i9-13900K | |
| AMD Ryzen 9 7950X ECO 105 W | |
| AMD Ryzen 9 7900X | |
| AMD Ryzen 9 7950X ECO 65 W | |
| AMD Ryzen 9 5950X | |
| Intel Core i9-12900K | |
| AMD Ryzen 9 5900X | |
| Intel Core i5-13600K | |
| AMD Ryzen 7 7700X | |
| AMD Ryzen 7 7700 | |
| AMD Ryzen 7 7700X ECO 65 W | |
| AMD Ryzen 7 5800X | |
| Intel Core i5-12600K | |
| AMD Ryzen 5 7600X | |
| AMD Ryzen 7 5800X3D | |
| AMD Ryzen 5 5600X | |
| Blender - v2.79 BMW27 CPU | |
| AMD Ryzen 5 5600X | |
| AMD Ryzen 7 5800X3D | |
| AMD Ryzen 5 7600X | |
| AMD Ryzen 7 5800X | |
| Intel Core i5-12600K | |
| AMD Ryzen 7 7700X ECO 65 W | |
| AMD Ryzen 7 7700 | |
| AMD Ryzen 7 7700X | |
| AMD Ryzen 9 5900X | |
| Intel Core i5-13600K | |
| Intel Core i9-12900K | |
| AMD Ryzen 9 5950X | |
| AMD Ryzen 9 7900X | |
| AMD Ryzen 9 7950X ECO 65 W | |
| AMD Ryzen 9 7950X ECO 105 W | |
| AMD Ryzen 9 7950X | |
| Intel Core i9-13900K | |
| Geekbench 5.5 | |
| Single-Core | |
| Intel Core i9-13900K | |
| AMD Ryzen 9 7900X | |
| AMD Ryzen 9 7950X ECO 65 W | |
| AMD Ryzen 9 7950X ECO 105 W | |
| AMD Ryzen 9 7950X | |
| AMD Ryzen 7 7700X | |
| AMD Ryzen 7 7700X ECO 65 W | |
| AMD Ryzen 5 7600X | |
| AMD Ryzen 7 7700 | |
| Intel Core i9-12900K | |
| Intel Core i5-13600K | |
| Intel Core i5-12600K | |
| AMD Ryzen 9 5950X | |
| AMD Ryzen 9 5900X | |
| AMD Ryzen 7 5800X | |
| AMD Ryzen 5 5600X | |
| AMD Ryzen 7 5800X3D | |
| Multi-Core | |
| Intel Core i9-13900K | |
| AMD Ryzen 9 7950X | |
| AMD Ryzen 9 7950X ECO 105 W | |
| AMD Ryzen 9 7950X ECO 65 W | |
| AMD Ryzen 9 7900X | |
| Intel Core i9-12900K | |
| AMD Ryzen 9 5950X | |
| Intel Core i5-13600K | |
| AMD Ryzen 7 7700X | |
| AMD Ryzen 7 7700 | |
| AMD Ryzen 7 7700X ECO 65 W | |
| AMD Ryzen 9 5900X | |
| Intel Core i5-12600K | |
| AMD Ryzen 5 7600X | |
| AMD Ryzen 7 5800X | |
| AMD Ryzen 7 5800X3D | |
| AMD Ryzen 5 5600X | |
| 7-Zip 18.03 | |
| 7z b 4 | |
| AMD Ryzen 9 7950X | |
| AMD Ryzen 9 7950X ECO 105 W | |
| Intel Core i9-13900K | |
| AMD Ryzen 9 5950X | |
| AMD Ryzen 9 7900X | |
| Intel Core i9-12900K | |
| AMD Ryzen 9 5900X | |
| Intel Core i5-13600K | |
| AMD Ryzen 7 7700X | |
| AMD Ryzen 7 7700X ECO 65 W | |
| AMD Ryzen 7 7700 | |
| AMD Ryzen 7 5800X | |
| AMD Ryzen 7 5800X3D | |
| AMD Ryzen 5 7600X | |
| Intel Core i5-12600K | |
| AMD Ryzen 5 5600X | |
| 7z b 4 -mmt1 | |
| AMD Ryzen 9 7900X | |
| AMD Ryzen 9 7950X | |
| AMD Ryzen 9 7950X ECO 105 W | |
| AMD Ryzen 7 7700X | |
| AMD Ryzen 5 7600X | |
| AMD Ryzen 7 7700X ECO 65 W | |
| AMD Ryzen 7 7700 | |
| Intel Core i9-13900K | |
| AMD Ryzen 9 5950X | |
| AMD Ryzen 7 5800X | |
| AMD Ryzen 7 5800X3D | |
| AMD Ryzen 9 5900X | |
| AMD Ryzen 5 5600X | |
| Intel Core i9-12900K | |
| Intel Core i5-13600K | |
| Intel Core i5-12600K | |
| HWBOT x265 Benchmark v2.2 - 4k Preset | |
| AMD Ryzen 9 7950X | |
| Intel Core i9-13900K | |
| AMD Ryzen 9 7950X ECO 105 W | |
| AMD Ryzen 9 7900X | |
| AMD Ryzen 9 7950X ECO 65 W | |
| AMD Ryzen 9 5950X | |
| Intel Core i5-12600K | |
| Intel Core i9-12900K | |
| Intel Core i5-13600K | |
| AMD Ryzen 7 7700X | |
| AMD Ryzen 9 5900X | |
| AMD Ryzen 7 7700 | |
| AMD Ryzen 7 7700X ECO 65 W | |
| AMD Ryzen 5 7600X | |
| AMD Ryzen 7 5800X | |
| AMD Ryzen 7 5800X3D | |
| AMD Ryzen 5 5600X | |
| R Benchmark 2.5 - Overall mean | |
| AMD Ryzen 7 5800X3D | |
| AMD Ryzen 5 5600X | |
| AMD Ryzen 9 5950X | |
| AMD Ryzen 9 5900X | |
| AMD Ryzen 7 5800X | |
| Intel Core i5-12600K | |
| Intel Core i9-12900K | |
| Intel Core i5-13600K | |
| AMD Ryzen 7 7700 | |
| AMD Ryzen 7 7700X ECO 65 W | |
| AMD Ryzen 9 7950X | |
| AMD Ryzen 9 7950X ECO 65 W | |
| AMD Ryzen 9 7950X ECO 105 W | |
| AMD Ryzen 7 7700X | |
| AMD Ryzen 5 7600X | |
| AMD Ryzen 9 7900X | |
| Intel Core i9-13900K | |
| LibreOffice - 20 Documents To PDF | |
| Intel Core i5-12600K | |
| AMD Ryzen 7 5800X3D | |
| AMD Ryzen 9 5900X | |
| AMD Ryzen 9 5950X | |
| AMD Ryzen 5 5600X | |
| AMD Ryzen 7 5800X | |
| Intel Core i9-12900K | |
| AMD Ryzen 7 7700 | |
| AMD Ryzen 5 7600X | |
| Intel Core i9-13900K | |
| AMD Ryzen 9 7950X | |
| Intel Core i5-13600K | |
| AMD Ryzen 9 7900X | |
| AMD Ryzen 7 7700X ECO 65 W | |
| AMD Ryzen 7 7700X | |
| AMD Ryzen 9 7950X ECO 65 W | |
| AMD Ryzen 9 7950X ECO 105 W | |
* ... kleiner is beter
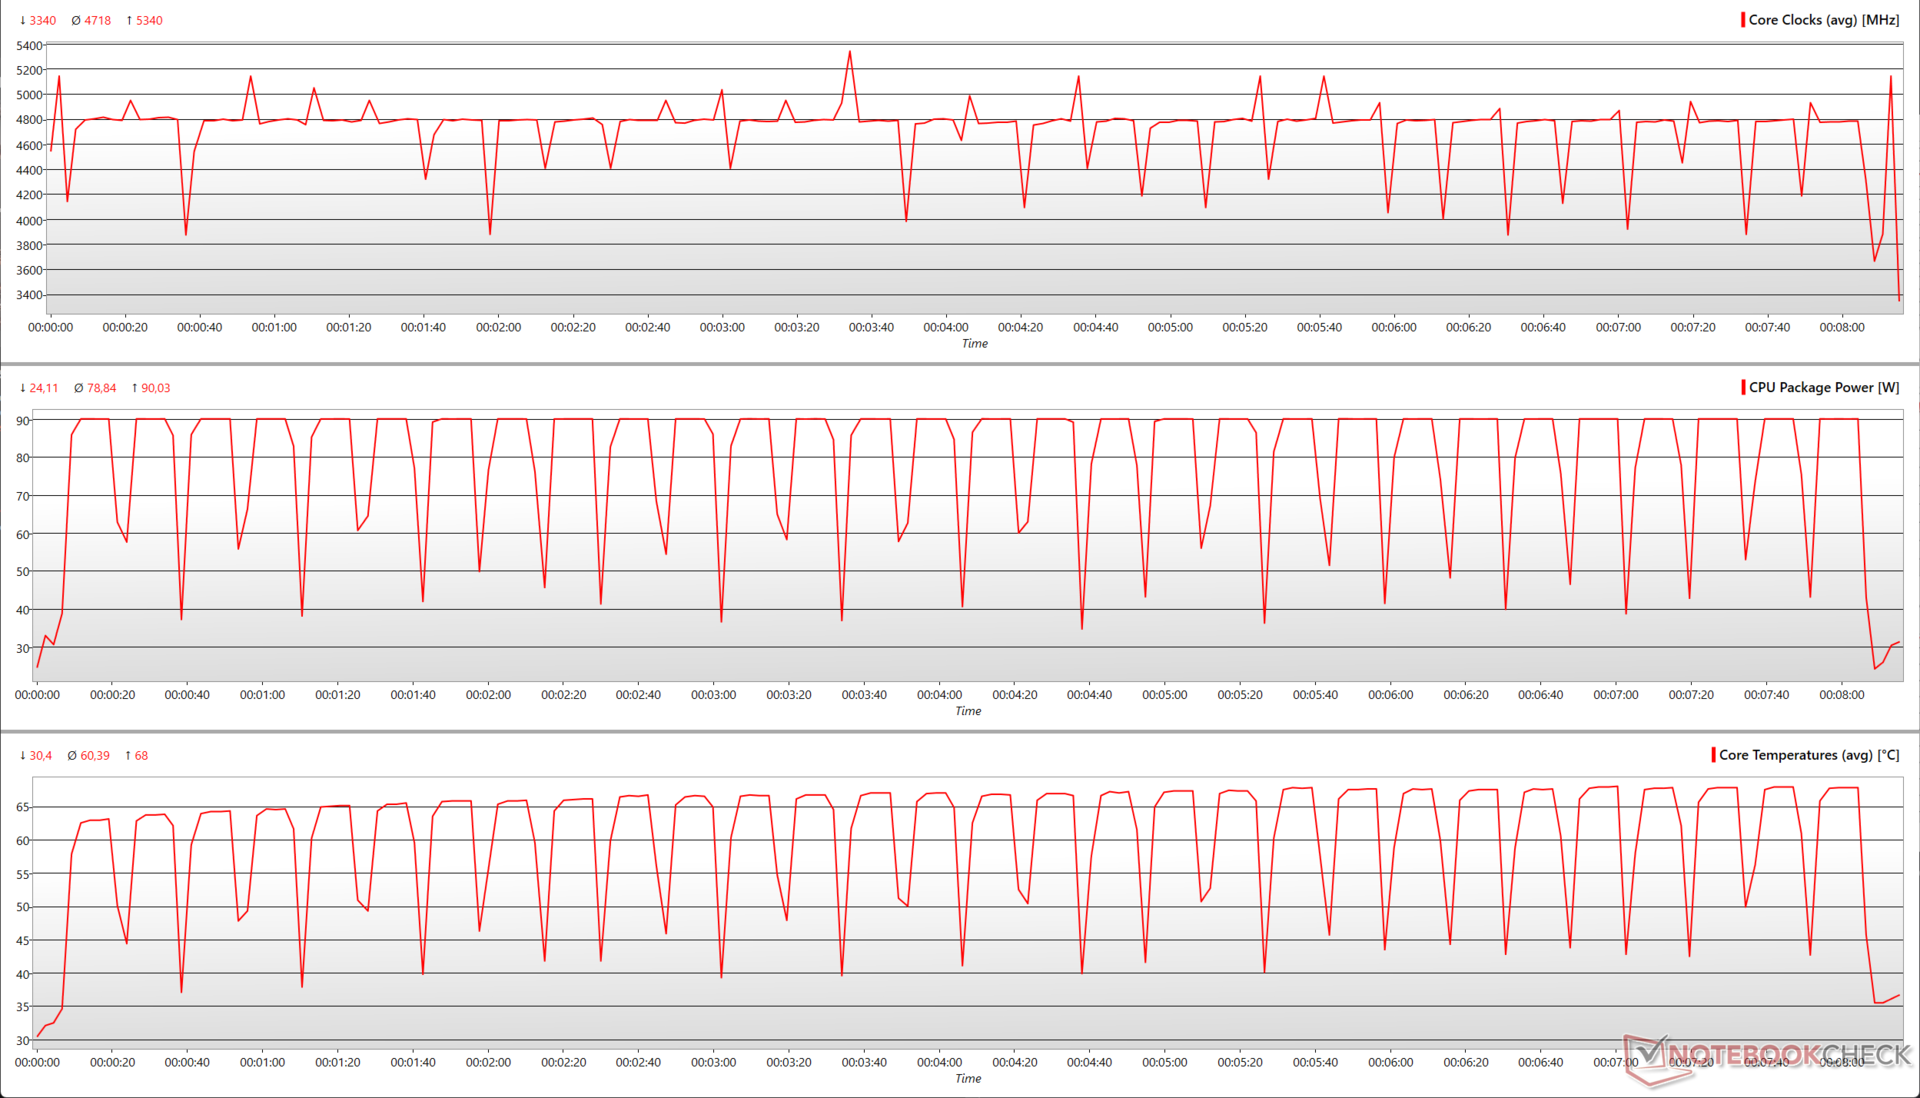
Cinebench R15 Multi Loop
In tegenstelling tot de Ryzen 7000X serie, levert AMD een koeler in de doos voor de 65 W non-X processoren. De Ryzen 9 7900 en de Ryzen 7 7700 worden geleverd met een Wraith Prism koeler (ah, Zen 2 nostalgie!), terwijl de Ryzen 5 7600 wordt geleverd met een Wraith Stealth low-profile koeler.
De Wraith koelers zijn niet de beste die er zijn, maar ze kunnen erg handig zijn en kunnen de klus klaren voor niet-intensief computergebruik. De Ryzen 7 7700 biedt een goed onderhouden prestatie in onze Cinebench R15 multi-core loop test zonder tekenen van throttling in combinatie met onze Cooler Master MasterLiquid ML360L V2 ARGB AIO.
We raden aan te kiezen voor een capabele AIO-oplossing als je van plan bent de Ryzen 7 7700 tot het uiterste te drijven.
Tijdens de loop zien we dat de Ryzen 7 7700 in staat is om de 5,3 GHz grens te bereiken, zij het slechts één keer - de processor lijkt comfortabel rond de 5,1 GHz grens in deze test. Het pakketvermogen wordt gehandhaafd op een constante 90 W tijdens elke lus - dit is hoger dan de nominale 65 W TDP, maar de kerntemperaturen bereiken slechts een maximum van 68 °C.
Net als de X-serie chips, vermeldt AMD dat de niet-X tegenhangers ook een TjMax van 95 °C hebben, maar deze limiet wordt meestal niet bereikt tijdens stress vanwege het lagere TDP. Toch stelt de hogere TjMax-limiet Precision Boost 2 in staat om de maximale prestaties uit deze chip te halen.
Systeemprestaties: Binnen het bereik van een Ryzen 9 7900X
Er zijn geen haperingen in de reguliere systeemprestaties met de Ryzen 7 7700. CrossMark zet de Ryzen 7 7700 op één lijn met de Core i5-13600K en de Ryzen 5 7600X terwijl de onderdelen Productiviteit en Creativiteit van de test de Ryzen 9 7900X naar de kroon steken.
Verschillende AIDA64-tests laten zelfs zien dat de Ryzen 7 7700 de Core i9-12900K ruimschoots verslaat. Intel-processoren daarentegen lijken een aanzienlijke voorsprong te hebben in 3DMark Time Spy CPU.
* ... kleiner is beter
3D en gaming prestaties: Op gelijke voet met de Ryzen 9 7900X en Core i9-13900K
De Ryzen 7 7700 komt over als een zeer capabele gaming CPU die zich kan meten met het beste wat Intel en AMD in deze generatie te bieden hebben.
De Ryzen 7 7700 komt overeen met de Core i9-13900K, Ryzen 9 7900X, en de Ryzen 5 7600X in algemene gaming prestaties. De resultaten kunnen echter per game verschillen.
Bijvoorbeeld, F1 22 lijkt AMD CPU's veel meer te bevoordelen dan Intel, terwijl het omgekeerde waar is in het geval van Far Cry 5. AMD's nieuwste 8-core 65W CPU slaagt er ook in om de Ryzen 9 7900X met een kleine voorsprong te overtreffen in The Witcher 3 bij 1080p Ultra, terwijl hij vrijwel gelijk komt met de Core i9-13900K bij een zeer lage resolutie van 1024 x 768 bij de laagst mogelijke grafische instellingen.
In ieder geval is de Ryzen 7 7700 een uitstekende gaming CPU, vooral als je op zoek bent naar de maximaal mogelijke frames op 1080p of QHD.
| Performance rating - Percent | |
| AMD Ryzen 7 7700 | |
| AMD Ryzen 5 7600X | |
| AMD Ryzen 9 7900X | |
| Intel Core i5-13600K | |
| Intel Core i9-13900K | |
| AMD Ryzen 9 7950X | |
| 3DMark - 2560x1440 Time Spy Graphics | |
| AMD Ryzen 7 7700 | |
| AMD Ryzen 9 7900X | |
| AMD Ryzen 5 7600X | |
| Intel Core i9-13900K | |
| Intel Core i5-13600K | |
| AMD Ryzen 9 7950X | |
| 3DMark 11 - 1280x720 Performance GPU | |
| AMD Ryzen 7 7700 | |
| AMD Ryzen 5 7600X | |
| AMD Ryzen 9 7900X | |
| Intel Core i5-13600K | |
| Intel Core i9-13900K | |
| AMD Ryzen 9 7950X | |
| 3DMark 11 Performance | 50542 punten | |
| 3DMark Time Spy Score | 19092 punten | |
Help | ||
| Performance rating - Percent | |
| Gemiddelde van klas Desktop | |
| AMD Ryzen 7 7700 | |
| Intel Core i9-13900K | |
| AMD Ryzen 9 7900X | |
| AMD Ryzen 5 7600X | |
| AMD Ryzen 9 7950X | |
| Intel Core i5-13600K | |
| F1 22 | |
| 1920x1080 Ultra High Preset AA:T AF:16x | |
| Gemiddelde van klas Desktop (100.2 - 219, n=14, laatste 2 jaar) | |
| AMD Ryzen 7 7700 | |
| Intel Core i5-13600K | |
| AMD Ryzen 9 7950X | |
| AMD Ryzen 5 7600X | |
| AMD Ryzen 9 7900X | |
| Intel Core i9-13900K | |
| 1920x1080 Low Preset AA:T AF:16x | |
| AMD Ryzen 9 7950X | |
| AMD Ryzen 7 7700 | |
| Gemiddelde van klas Desktop (292 - 498, n=12, laatste 2 jaar) | |
| AMD Ryzen 9 7900X | |
| AMD Ryzen 5 7600X | |
| Intel Core i5-13600K | |
| Intel Core i9-13900K | |
| The Witcher 3 | |
| 1920x1080 Ultra Graphics & Postprocessing (HBAO+) | |
| Gemiddelde van klas Desktop (7.8 - 369, n=48, laatste 2 jaar) | |
| AMD Ryzen 7 7700 | |
| AMD Ryzen 9 7900X | |
| AMD Ryzen 5 7600X | |
| Intel Core i5-13600K | |
| Intel Core i9-13900K | |
| AMD Ryzen 9 7950X | |
| 1024x768 Low Graphics & Postprocessing | |
| AMD Ryzen 9 7900X | |
| AMD Ryzen 7 7700 | |
| Intel Core i9-13900K | |
| AMD Ryzen 5 7600X | |
| AMD Ryzen 9 7950X | |
| Gemiddelde van klas Desktop (39.3 - 841, n=30, laatste 2 jaar) | |
| Intel Core i5-13600K | |
| GTA V | |
| 1920x1080 Highest AA:4xMSAA + FX AF:16x | |
| Intel Core i9-13900K | |
| AMD Ryzen 9 7900X | |
| AMD Ryzen 7 7700 | |
| AMD Ryzen 9 7950X | |
| AMD Ryzen 5 7600X | |
| Intel Core i5-13600K | |
| Gemiddelde van klas Desktop (9.61 - 172.5, n=13, laatste 2 jaar) | |
| 1920x1080 Lowest Settings possible | |
| AMD Ryzen 9 7950X | |
| Intel Core i9-13900K | |
| AMD Ryzen 7 7700 | |
| Intel Core i5-13600K | |
| AMD Ryzen 9 7900X | |
| AMD Ryzen 5 7600X | |
| Gemiddelde van klas Desktop (61.3 - 188.2, n=13, laatste 2 jaar) | |
AMD Ryzen 7 7700 with Nvidia GeForce RTX 3090
| lage | gem. | hoge | ultra | QHD | 4K | |
|---|---|---|---|---|---|---|
| GTA V (2015) | 187 | 187.6 | 187.2 | 155.7 | 150.5 | 184.2 |
| The Witcher 3 (2015) | 756 | 591 | 379 | 192 | 160.2 | |
| Dota 2 Reborn (2015) | 292.6 | 242.3 | 233.2 | 219.9 | 211.3 | |
| Final Fantasy XV Benchmark (2018) | 235 | 196.1 | 153 | 92.4 | ||
| X-Plane 11.11 (2018) | 218 | 196.3 | 147.5 | 120.5 | ||
| Far Cry 5 (2018) | 226 | 202 | 194 | 177 | 171 | 115 |
| Strange Brigade (2018) | 756 | 542 | 433 | 378 | 282 | 169 |
| F1 2021 (2021) | 658 | 565 | 463 | 244 | 186.2 | 110 |
| F1 22 (2022) | 399 | 427 | 361 | 136.9 | 89.9 | 45.7 |
Energiebeheer: Efficiënter dan een 65 W Ryzen 7 7700X
De AMD Ryzen 7 7700 heeft een zeer zuinige energiebehoefte ten opzichte van de concurrentie. In Cinebench R15 multi verbruikt de Ryzen 7 7700 24% minder stroom dan een TDP-gelimiteerde 65 W Ryzen 7 7700X, waardoor AMD's nieuwe 65 W-chip tot 32% efficiënter presteert.
De Witcher 3 op 1080p Ultra ziet het totale stroomverbruik met het Ryzen 7 7700 systeem min of meer in lijn met de Core i9-13900K en Ryzen 9 7950X systemen, zelfs wanneer deze laatste TDP-gelimiteerd zijn.
Dat gezegd hebbende, is de Ryzen 7 7700 in staat om extra frames te bieden in vergelijking met zijn rivalen, waardoor de processor opschuift in de energie-efficiëntie rankings voor dit spel.
Power Consumption: External Monitor
| Power Consumption / Cinebench R15 Multi Efficiency (external Monitor) | |
| AMD Ryzen 9 7950X ECO 65 W, NVIDIA GeForce RTX 3090 | |
| Gemiddelde van klas Desktop (13.7 - 41.2, n=14, laatste 2 jaar) | |
| AMD Ryzen 9 7950X ECO 105 W, NVIDIA GeForce RTX 3090 | |
| AMD Ryzen 7 7700, NVIDIA GeForce RTX 3090 | |
| AMD Ryzen 9 5950X, NVIDIA Titan RTX | |
| AMD Ryzen 9 7950X, NVIDIA GeForce RTX 3090 | |
| Gemiddeld NVIDIA GeForce RTX 3090 (11.7 - 25.2, n=13) | |
| AMD Ryzen 9 5900X, NVIDIA Titan RTX | |
| AMD Ryzen 9 7900X, NVIDIA GeForce RTX 3090 | |
| AMD Ryzen 7 7700X ECO 65 W, NVIDIA GeForce RTX 3090 | |
| AMD Ryzen 7 7700X, NVIDIA GeForce RTX 3090 | |
| Intel Core i9-13900K, NVIDIA GeForce RTX 3090 | |
| Intel Core i5-13600K, NVIDIA GeForce RTX 3090 | |
| Intel Core i9-12900K, NVIDIA Titan RTX | |
| Intel Core i5-12600K, NVIDIA Titan RTX | |
| AMD Ryzen 7 5800X, NVIDIA Titan RTX | |
| AMD Ryzen 5 7600X, NVIDIA GeForce RTX 3090 | |
| AMD Ryzen 5 5600X, NVIDIA Titan RTX | |
| AMD Ryzen 7 5800X3D, NVIDIA GeForce RTX 3090 Ti | |
| Power Consumption / Witcher 3 ultra Efficiency (external Monitor) | |
| Gemiddelde van klas Desktop (0.113 - 0.653, n=44, laatste 2 jaar) | |
| AMD Ryzen 7 7700, NVIDIA GeForce RTX 3090 | |
| Intel Core i5-13600K, NVIDIA GeForce RTX 3090 | |
| AMD Ryzen 5 7600X, NVIDIA GeForce RTX 3090 | |
| Intel Core i5-12600K, NVIDIA Titan RTX | |
| Gemiddeld NVIDIA GeForce RTX 3090 (0.268 - 0.3954, n=15) | |
| AMD Ryzen 7 5800X3D, NVIDIA GeForce RTX 3090 Ti | |
| AMD Ryzen 5 5600X, NVIDIA Titan RTX | |
| AMD Ryzen 9 7900X, NVIDIA GeForce RTX 3090 | |
| Intel Core i9-13900K, NVIDIA GeForce RTX 3090 | |
| AMD Ryzen 7 7700X, NVIDIA GeForce RTX 3090 | |
| AMD Ryzen 7 5800X, NVIDIA Titan RTX | |
| AMD Ryzen 9 7950X ECO 105 W, NVIDIA GeForce RTX 3090 | |
| AMD Ryzen 9 7950X ECO 65 W, NVIDIA GeForce RTX 3090 | |
| AMD Ryzen 9 7950X, NVIDIA GeForce RTX 3090 | |
| AMD Ryzen 7 7700X ECO 65 W, NVIDIA GeForce RTX 3090 | |
| AMD Ryzen 9 5900X, NVIDIA Titan RTX | |
| AMD Ryzen 9 5950X, NVIDIA Titan RTX | |
| Intel Core i9-12900K, NVIDIA Titan RTX | |
* ... kleiner is beter
Pro
Contra
Verdict: Zen 4 voor de massa, maar met voorbehoud

We zouden het u niet kwalijk nemen als u niet op de hoogte was van de nieuwe 65 W Ryzen 7000 processoren die vandaag in de schappen liggen, aangezien de meeste aandacht werd opgeëist door de Ryzen 7000X3D en Dragon Range-HX mobiele processoren tijdens AMD's CES 2023 keynote. De nieuwe 65 W Zen 4 reeks kan op het eerste gezicht overbodig lijken - ze bieden dezelfde prestatieniveaus als hun niet-X tegenhangers met onbeduidende trade-offs. Deze nieuwe Raphael-processoren vullen echter een belangrijk gat in de line-up.
De 65 W Ryzen 7000-processoren verlagen de instapdrempel voor Zen 4 aanzienlijk. De Ryzen 7 7700 in kwestie wordt verkocht voor US$329, wat US$70 minder is dan de MSRP van de Ryzen 7 7700X. In onze tests biedt de AMD Ryzen 7 7700 uitstekende single-core prestaties die vergelijkbaar zijn met de rest van de Zen 4 line-up, zelfs beter dan de 241 W Core i9-12900K in veel benchmarks.
In feite zijn alle Zen 4 chips vanaf het instapmodel Ryzen 5 7600X tot het vlaggenschip Ryzen 9 7950X lijken met elkaar te wedijveren voor single-core winst. Dat gezegd zijnde, Intel Raptor Lake heeft de overhand in multi-core en de Core i9-13900K kan het de Ryzen 9 7950X nog steeds moeilijk maken.
De belangrijkste concurrent van de Ryzen 7 7700 is de Core i5-13600K. Terwijl de Ryzen 7 7700 de Core i5-13600K kan overtreffen in single-core prestaties en gaming, is de laatste inherent goed voor multi-core, single-core en gaming samen. Ook is de Core i5-13600K ongeveer 10 dollar goedkoper dan de Ryzen 7 7700 op dit moment, dus het is een goede optie als je al een compatibel Intel-platform hebt.
Met een aanzienlijk lagere instapdrempel in combinatie met betaalbare B650E-chipset moederborden en mogelijkheden voor overklokken, is Zen 4 65 W, in het bijzonder de AMD Ryzen 7 7700, een geweldige keuze voor zuinige prestatieliefhebbers die AM5-wateren willen testen."
De Ryzen 7 7700 presteert precies hetzelfde als een TDP-gelimiteerde 65 W Ryzen 7 7700X. De consequentie is dat je Precision Boost Overdrive en ondersteuning voor EXPO geheugenprofielen kunt gebruiken om de prestatiekloof met een Ryzen 7 7700X te verkleinen en toch 70 dollar te besparen. Niet alles is echter rooskleurig.
AMD's AM5 platform is nog vrij nieuw en de prijzen van DDR5 geheugen zijn nog steeds aan de hogere kant, waardoor elk besparingsvoordeel met de nieuwe 65 W Ryzens teniet wordt gedaan. Een van de pijnpunten van innoveren op een nieuw platform is het afstaan van potentieel terrein aan je concurrent.
Op dit moment heeft Intel de overhand als het gaat om achterwaartse compatibiliteit - je kunt een Raptor Lake CPU in een moederbord van de vorige generatie met DDR4-geheugen plaatsen en nog steeds vergelijkbare prestatieniveaus krijgen voor veel minder geld.
Dat gezegd hebbende, kan van AMD worden verwacht dat het AM5 ten minste tot 2025 ondersteunt. Dus, elke investering die u nu doet, kan naar verwachting een hele tijd meegaan.
We hebben uitstekende energie-efficiëntie gezien met TDP-gelimiteerde Ryzen 7 7700X en de Ryzen 9 7950X, en de nieuwe Ryzen 7 7700 zet de trend voort met nog betere cijfers. We zullen een beter perspectief hebben zodra we Intels nieuwe 65 W Rocket Lake onderdelen mogen testen die werden aangekondigd op CES 2023, maar voor nu lijkt 65 W Ryzen het uitstekend te doen.
De AMD Ryzen 7 7700, met een Wraith Prism-koeler in de doos, verhoogt zonder twijfel de waardepropositie van Zen 4, maar we raden aan de prijzen van moederborden en DDR5 RAM in de gaten te houden voordat we het geld uitgeven.
Prijs en beschikbaarheid
De AMD Ryzen 7 7700 en de rest van de Ryzen 65 W line-up zijn vanaf vandaag beschikbaar, maar zijn nog niet online op voorraad. We zullen deze sectie updaten met aankoop links zodra de voorraden live gaan.
Price comparison

