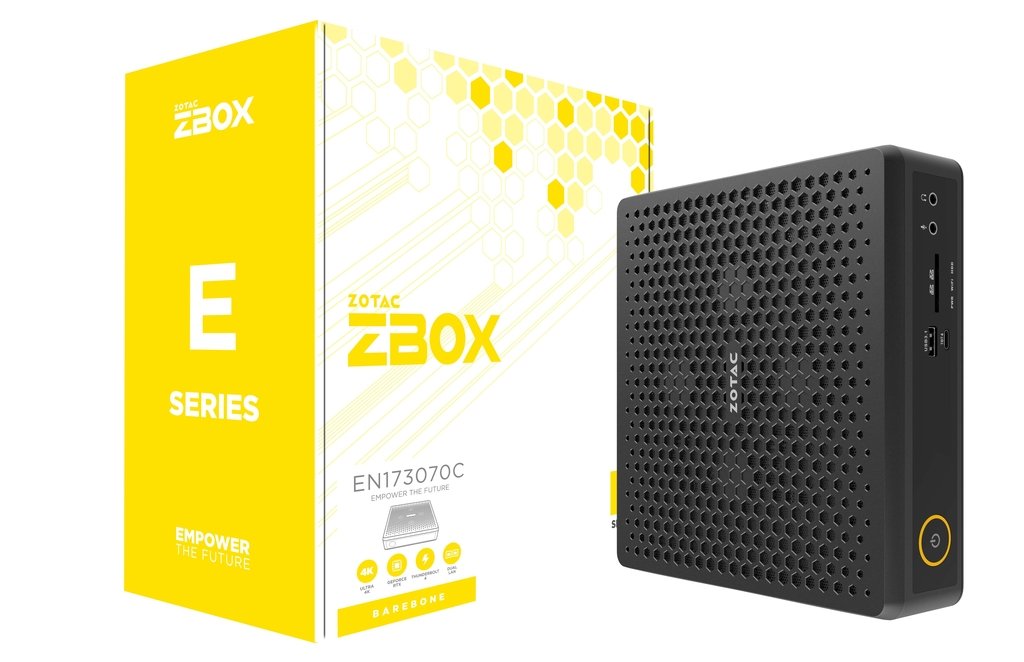
Zotac ZBOX Magnus review: GeForce RTX 3070 Mobile en Tiger Lake SoC in een behuizing van 2,65 liter
Onder het Zotac ZBOX label biedt de fabrikant een aantal compacte PC's aan die bedoeld zijn voor verschillende individuele gebruiksscenario's. In combinatie met de toevoeging van het Magnus label is de richting die van een gaming PC, wat ook terug te zien is in de ingebouwde componenten. De huidige versie van de Magnus EN173070C bevat een Intel Core i7-11800H, die moet zorgen voor een snelle gaming werking in combinatie met de Nvidia GeForce RTX 3070 Laptopgraphics. Deze combinatie is niet nieuw voor ons als laptop review platform, en we kunnen al een ruwe schatting geven over welke prestaties we kunnen verwachten
In onze apparatuur configuratie kost de Magnus EN173070C bijna 1650 Euro (~$1743). Echter, omdat dit altijd een barebone systeem is, moet je ook rekenen voor de SSD, het RAM, en de Windows licentie. Afhankelijk van de componenten die je kiest, kan de totale rekening gemakkelijk de 2000 Euro (~$2113) overschrijden. Degenen voor wie de prestaties van de Nvidia GeForce RTX 3070 LaptopgPU niet genoeg is, kan ook de EN173080C versie van de Magnus krijgen, die een snellere GPU bevat met de Nvidia GeForce RTX 3080 Laptopgraphics. De CPU blijft hetzelfde met de Intel Core i7-11800H. U kunt ook de Magnus EN153060C krijgen, die iets minder prestaties biedt en deIntel Core i5-11400HcPU en Nvidia GeForce RTX 3060 LaptopgPU.

Zotac ZBOX Magnus EN173070C in detail
Zaak
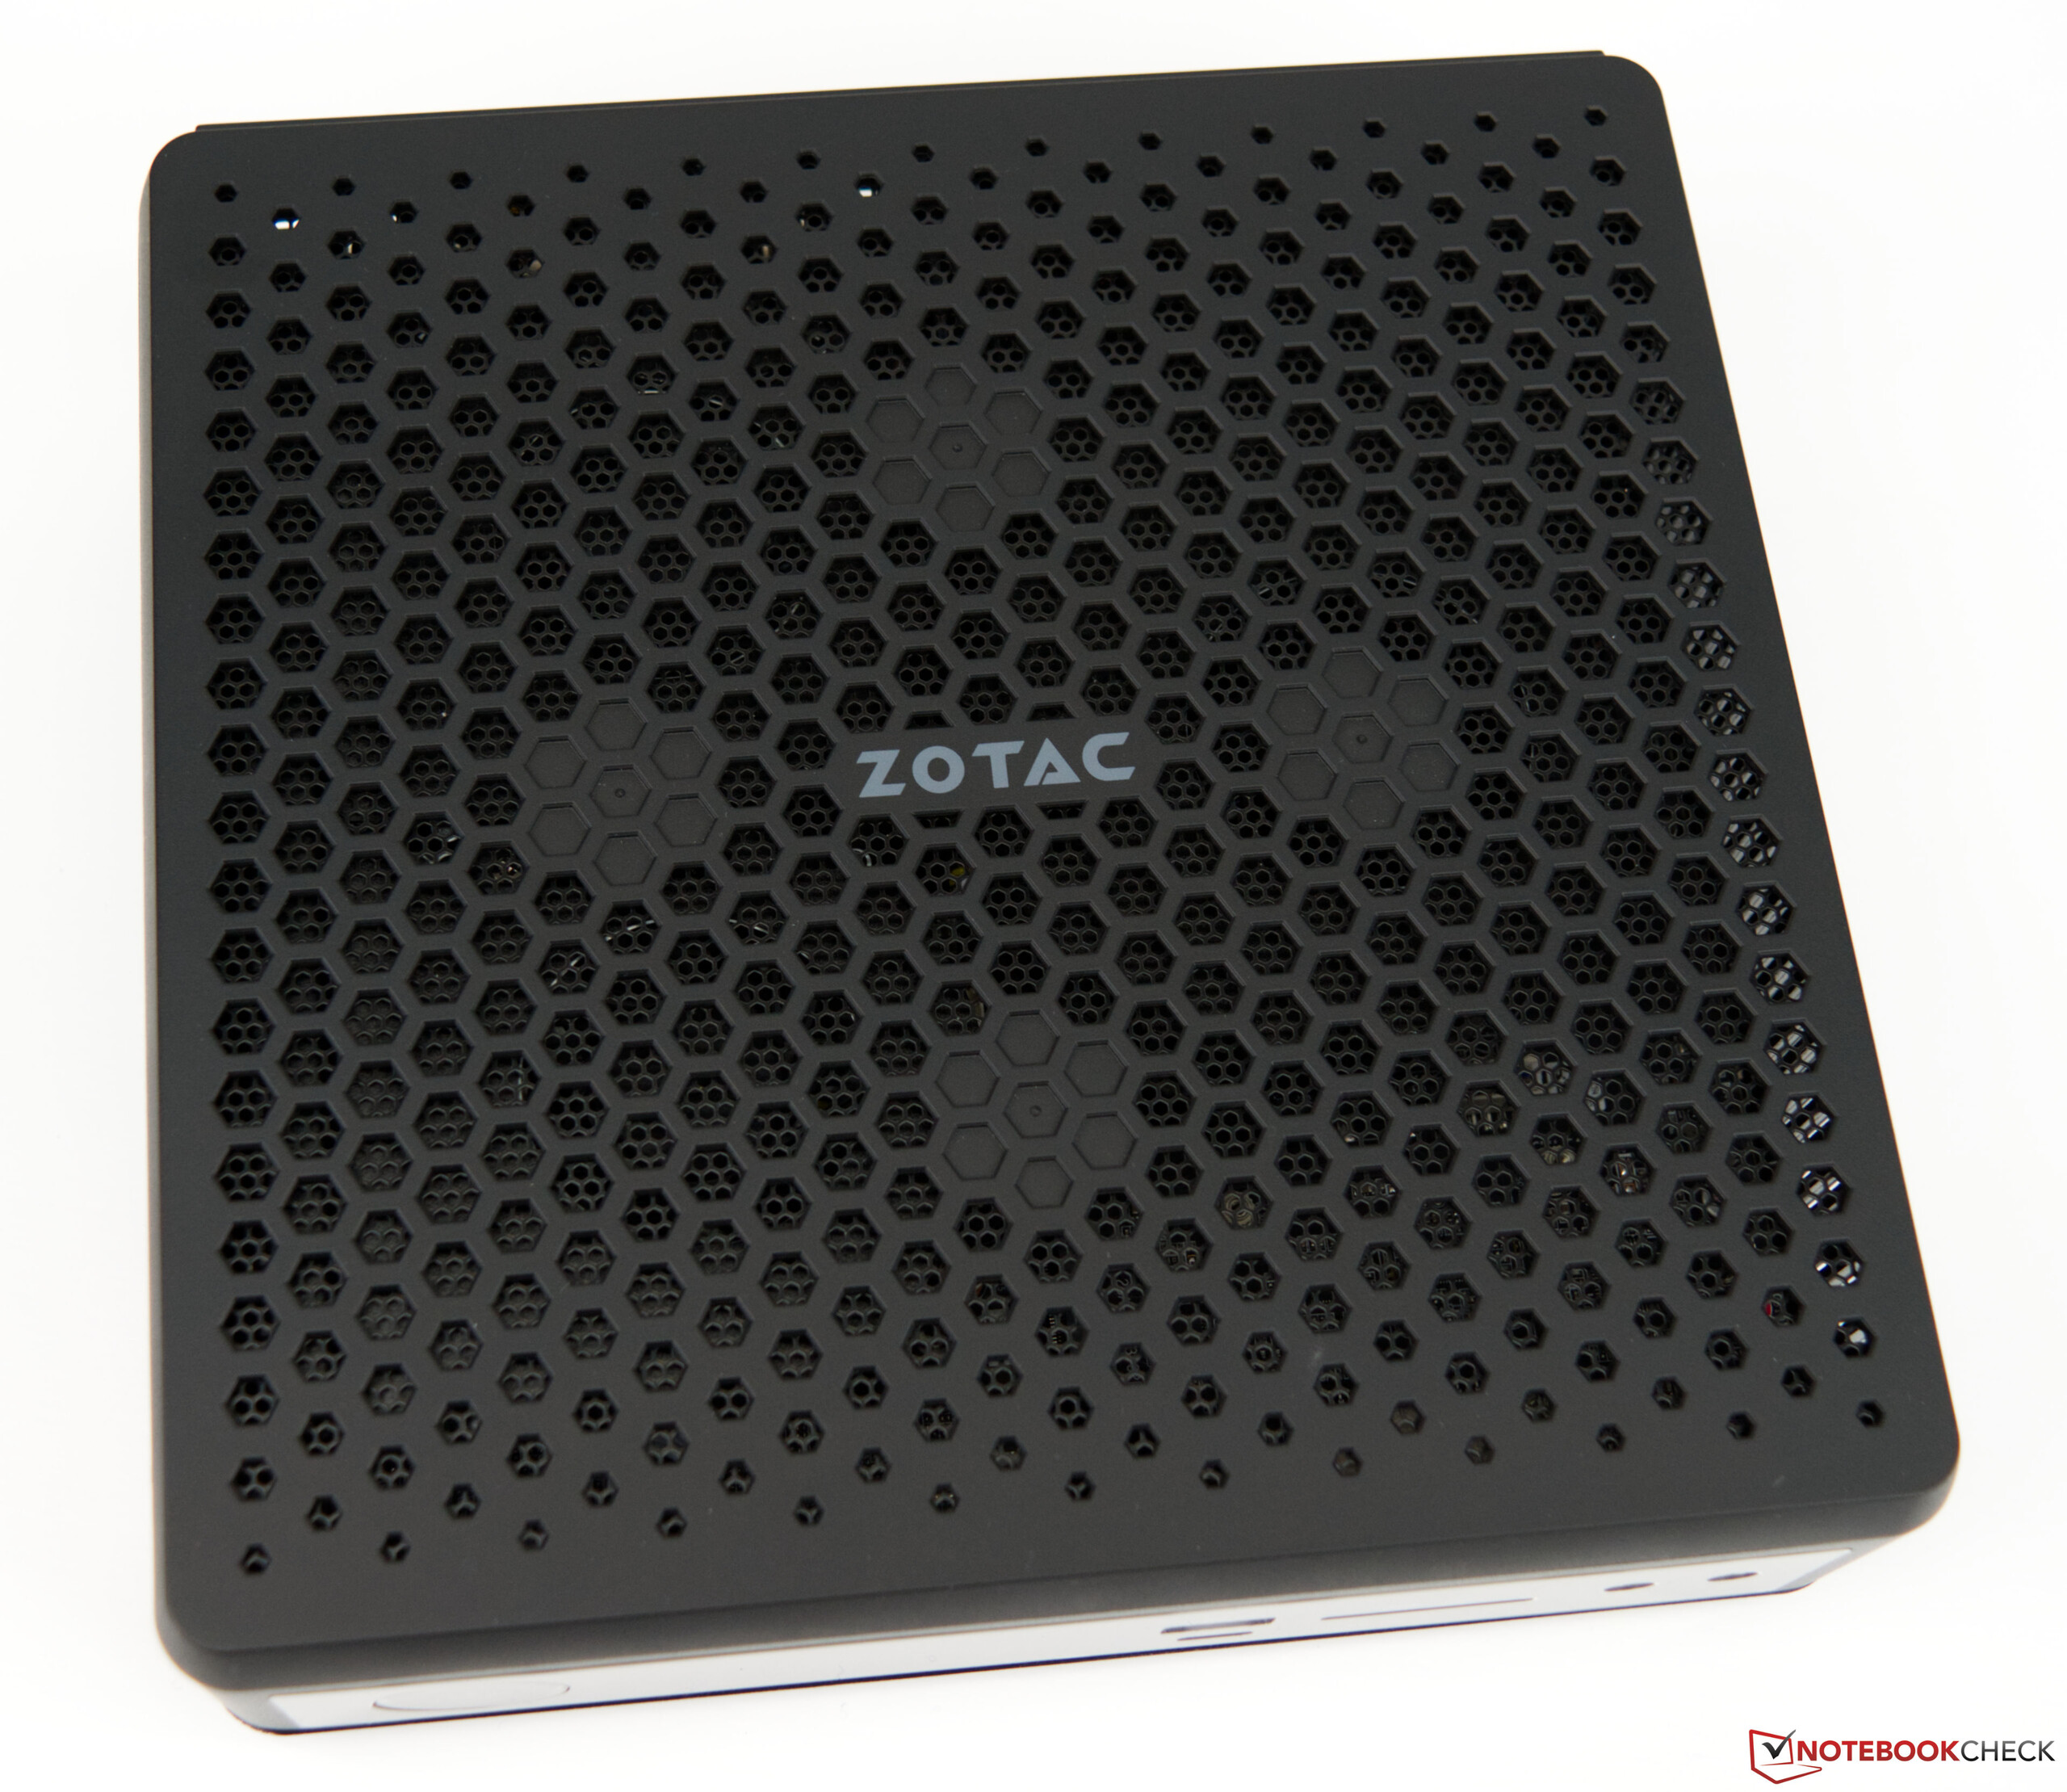
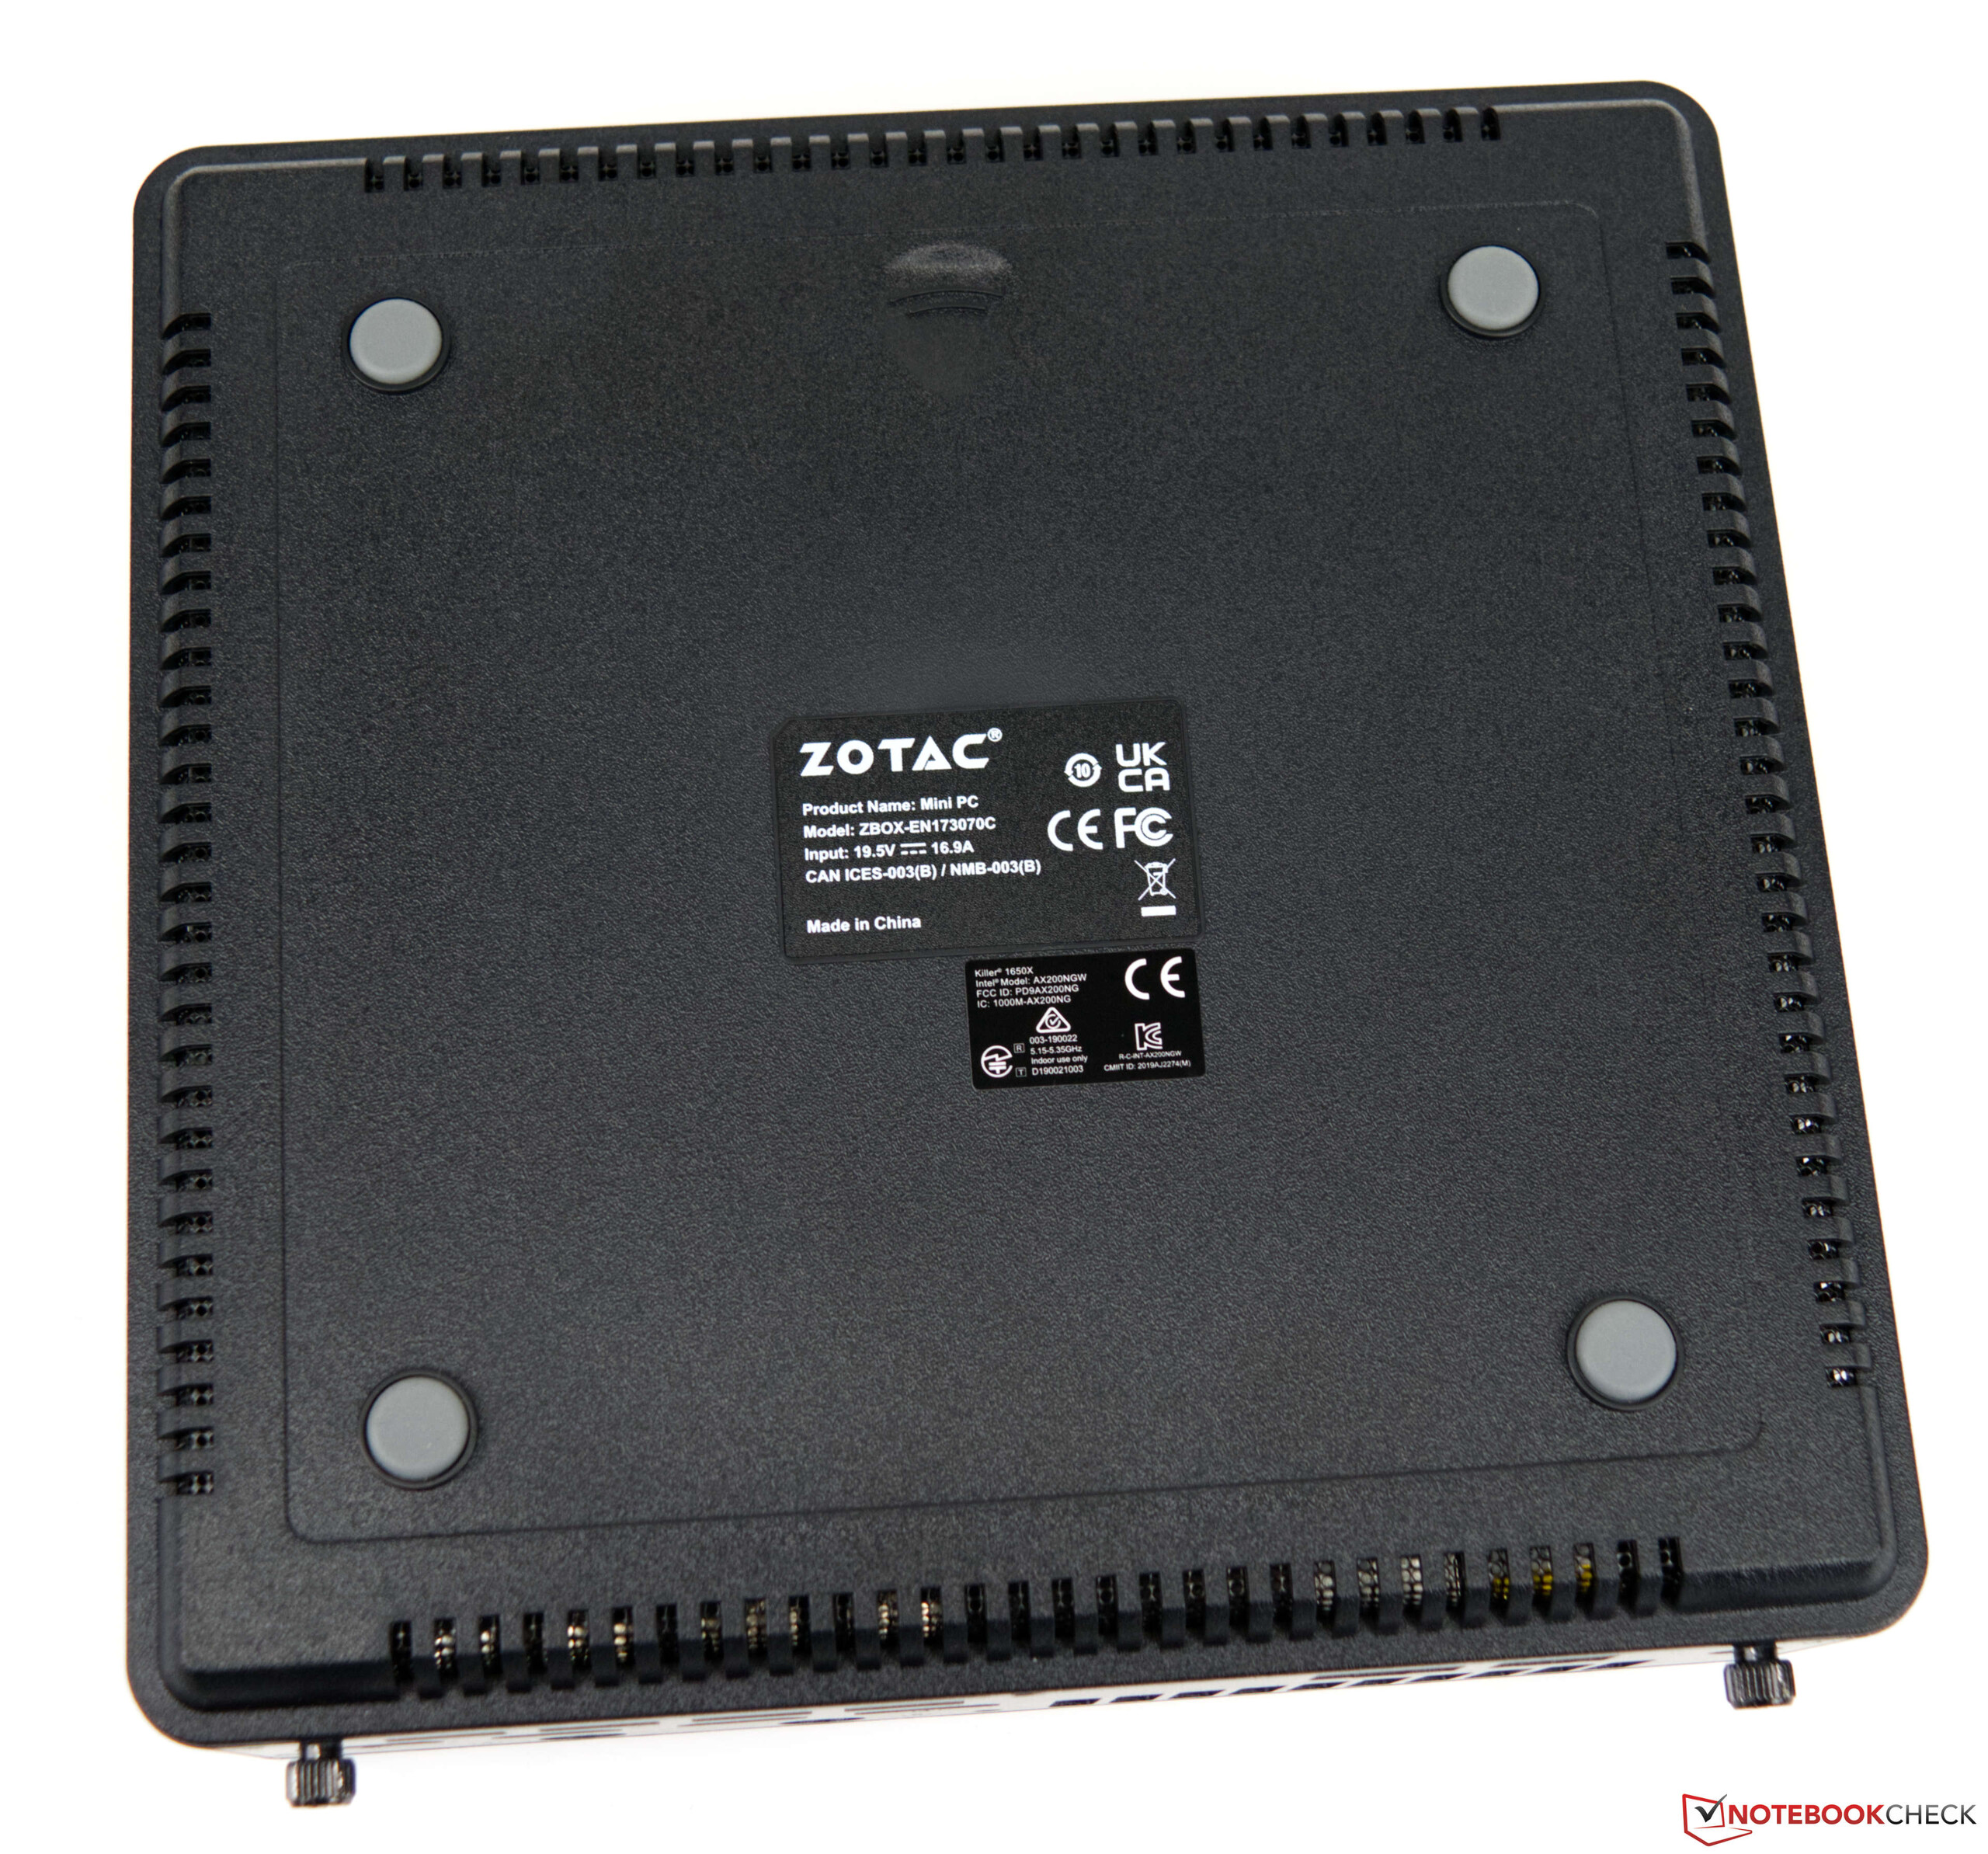
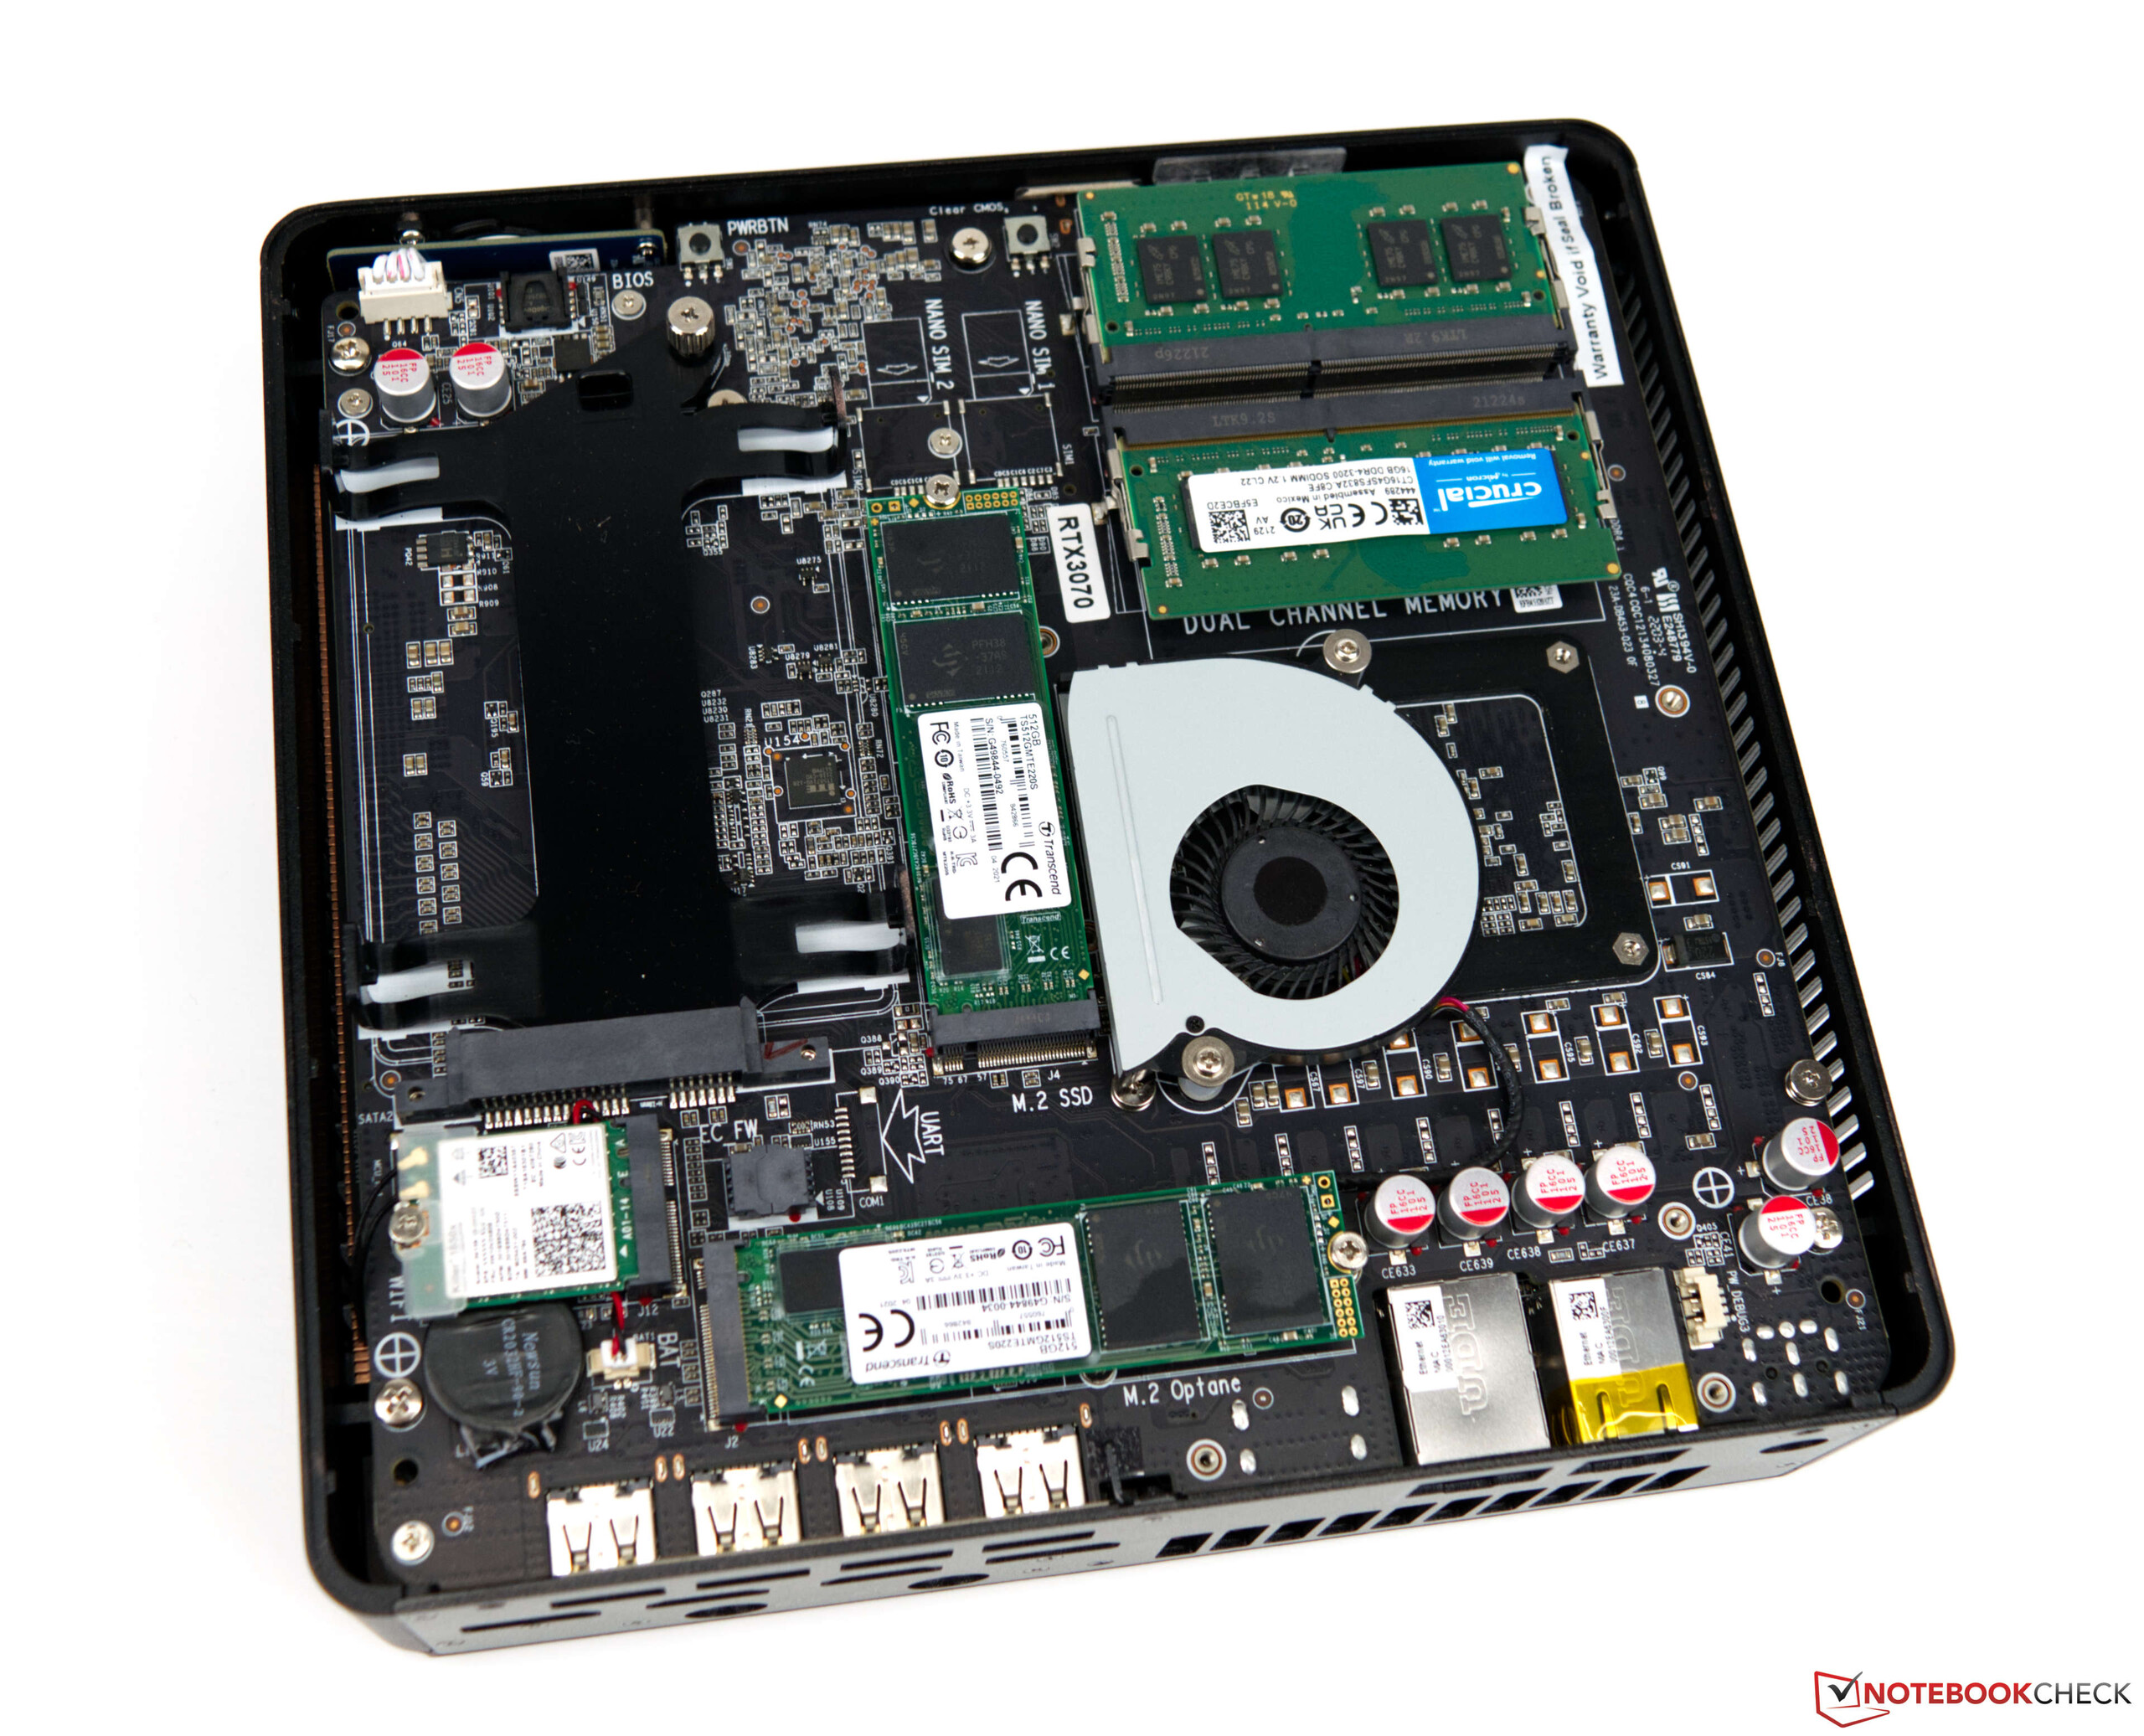
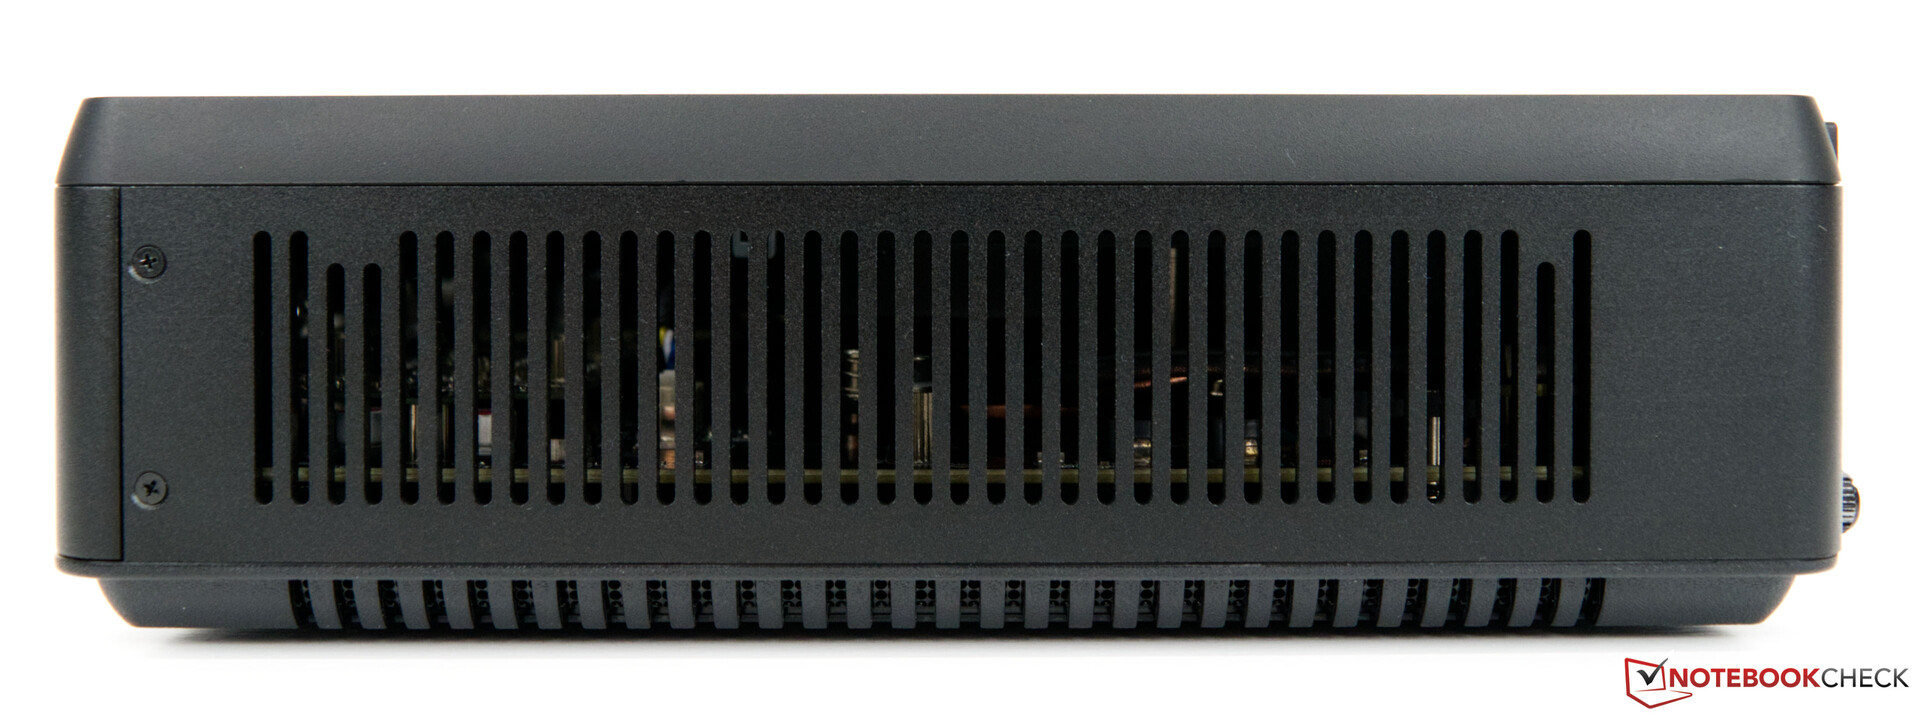
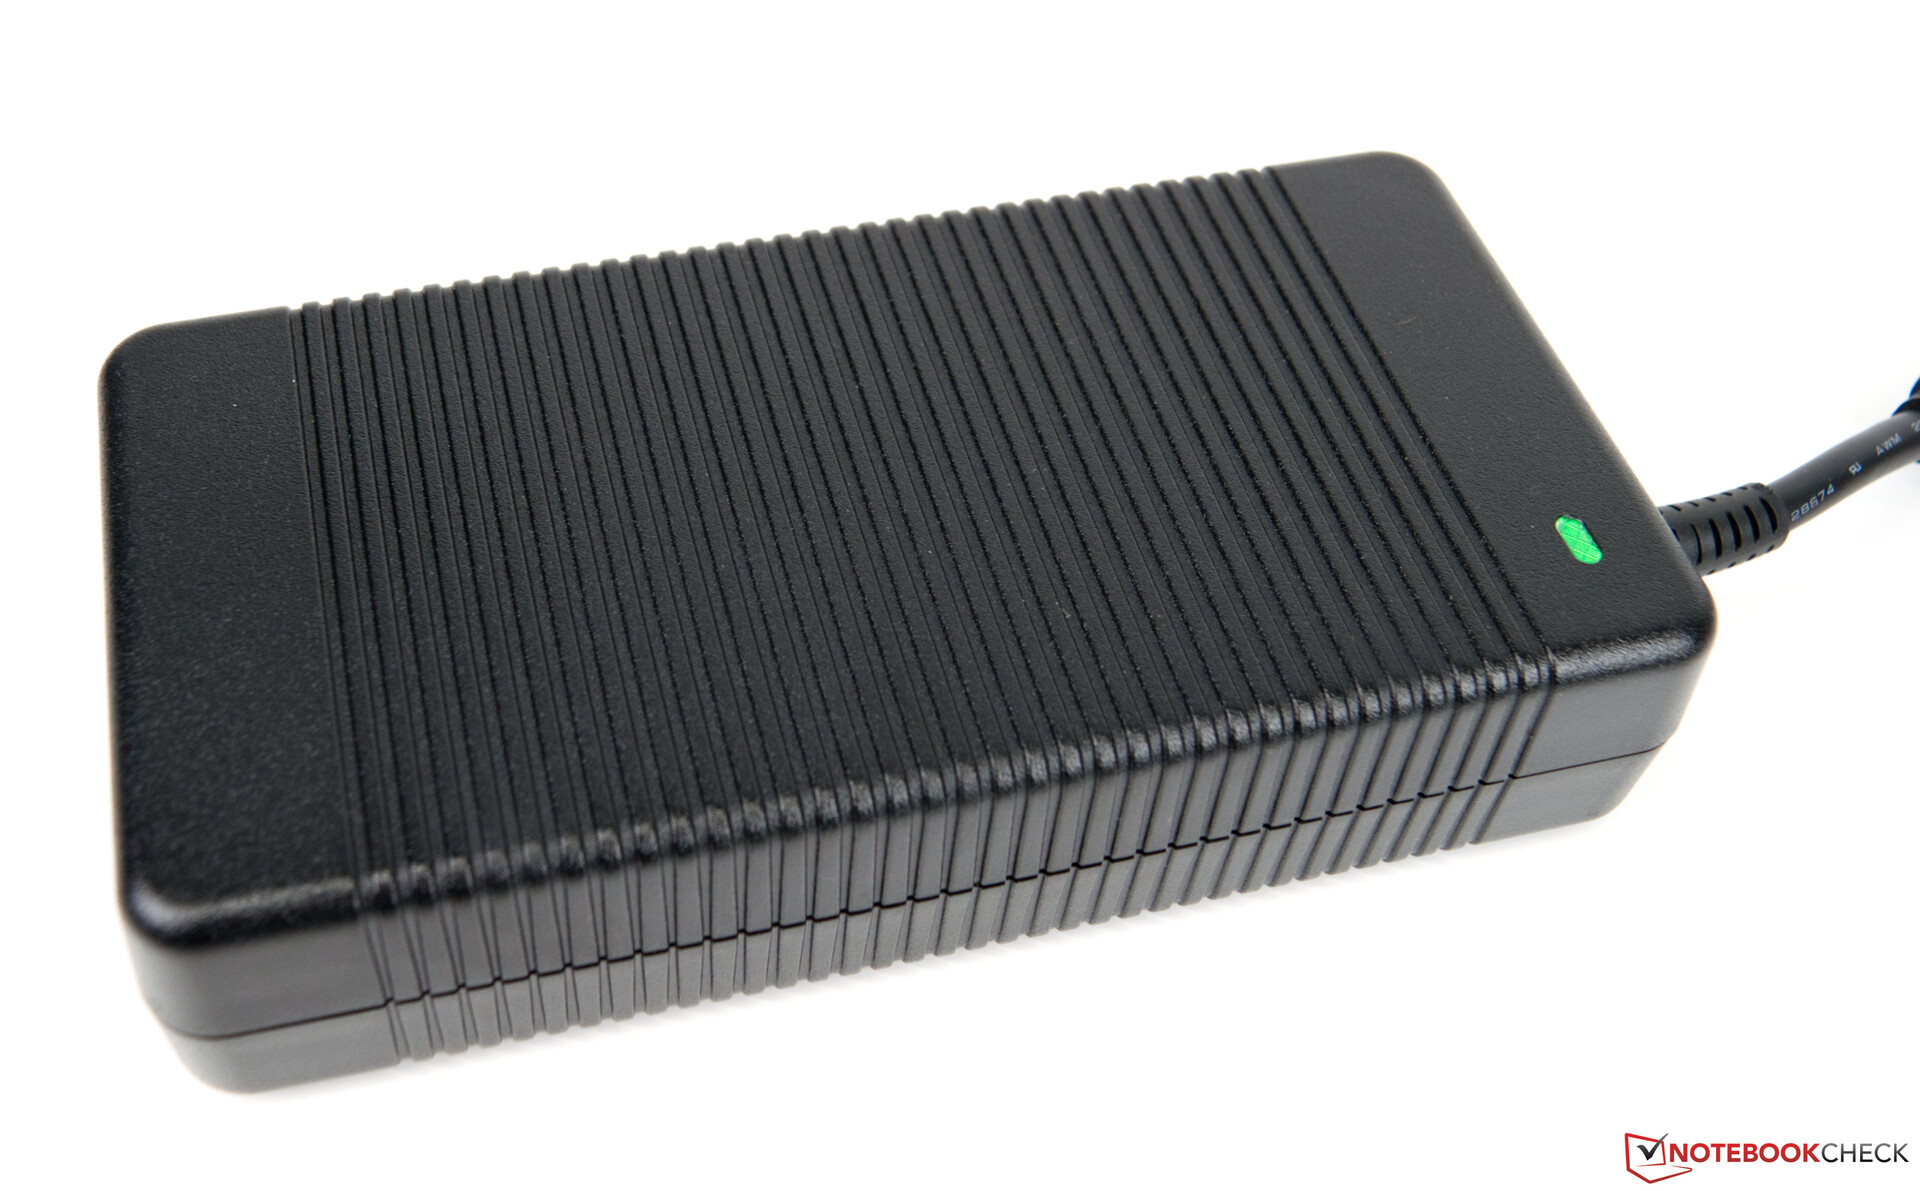
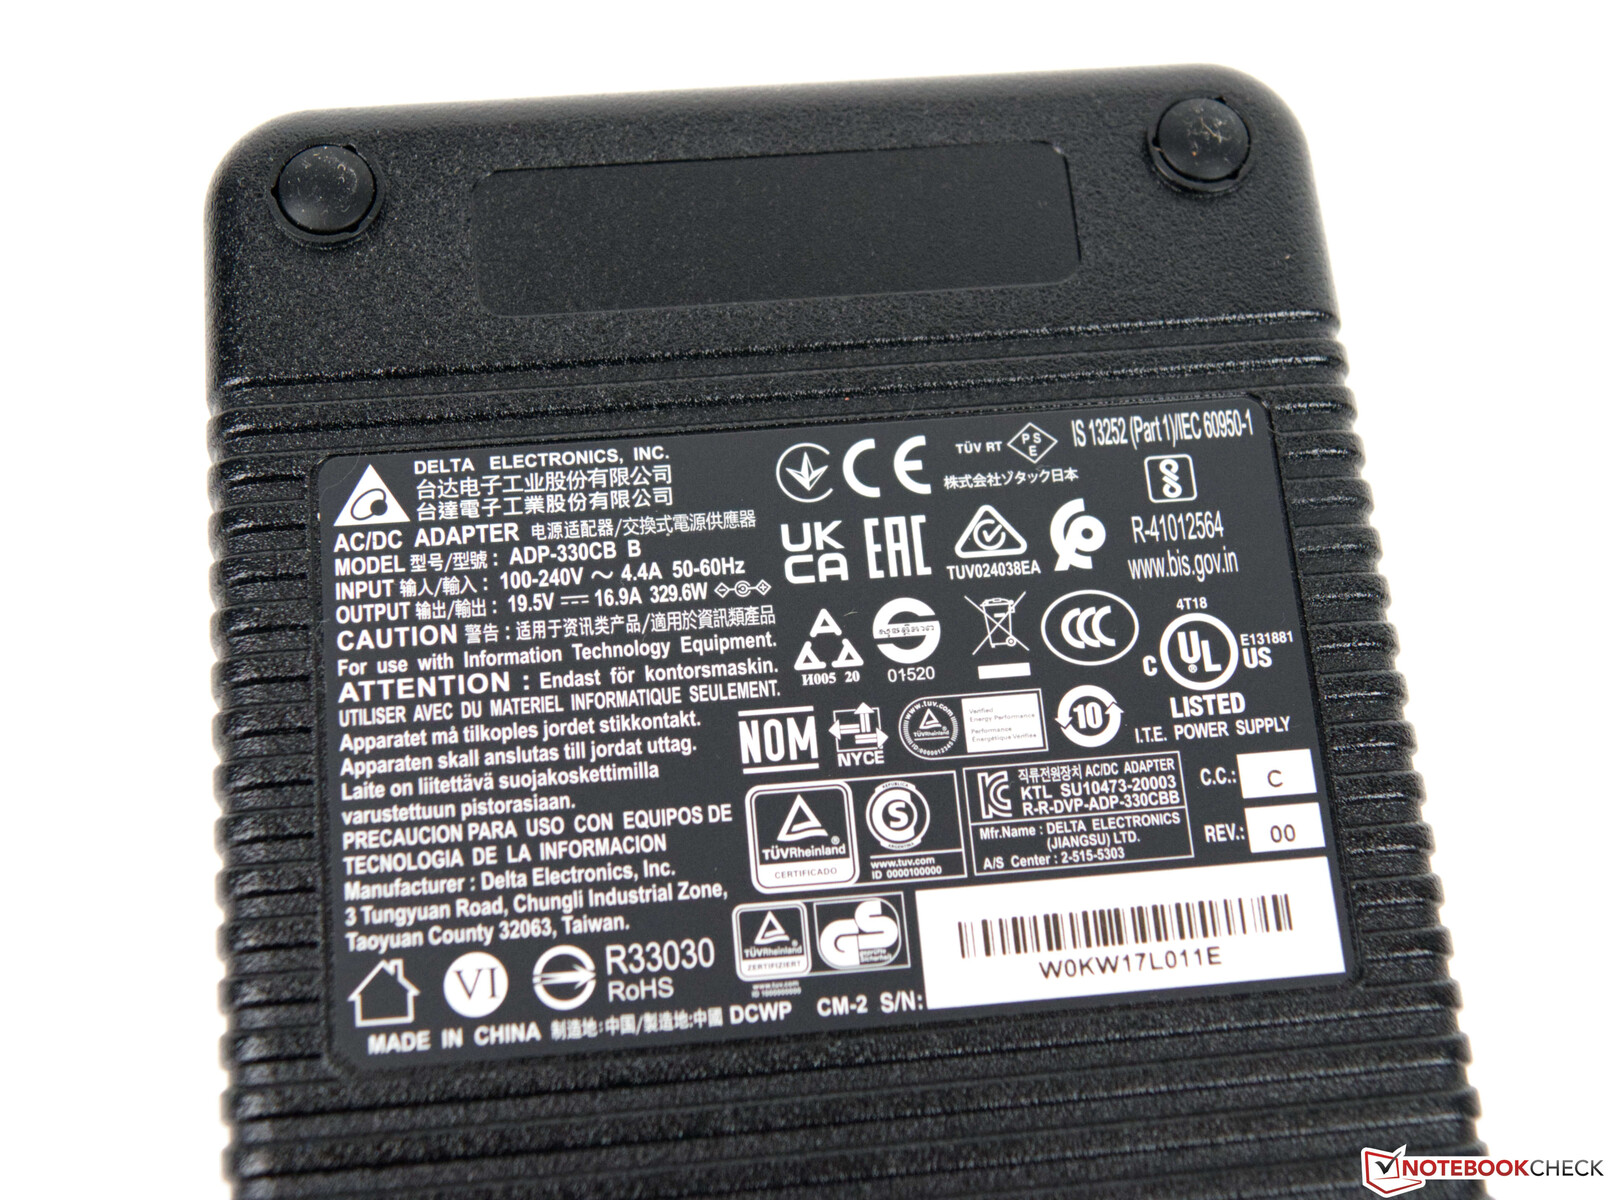
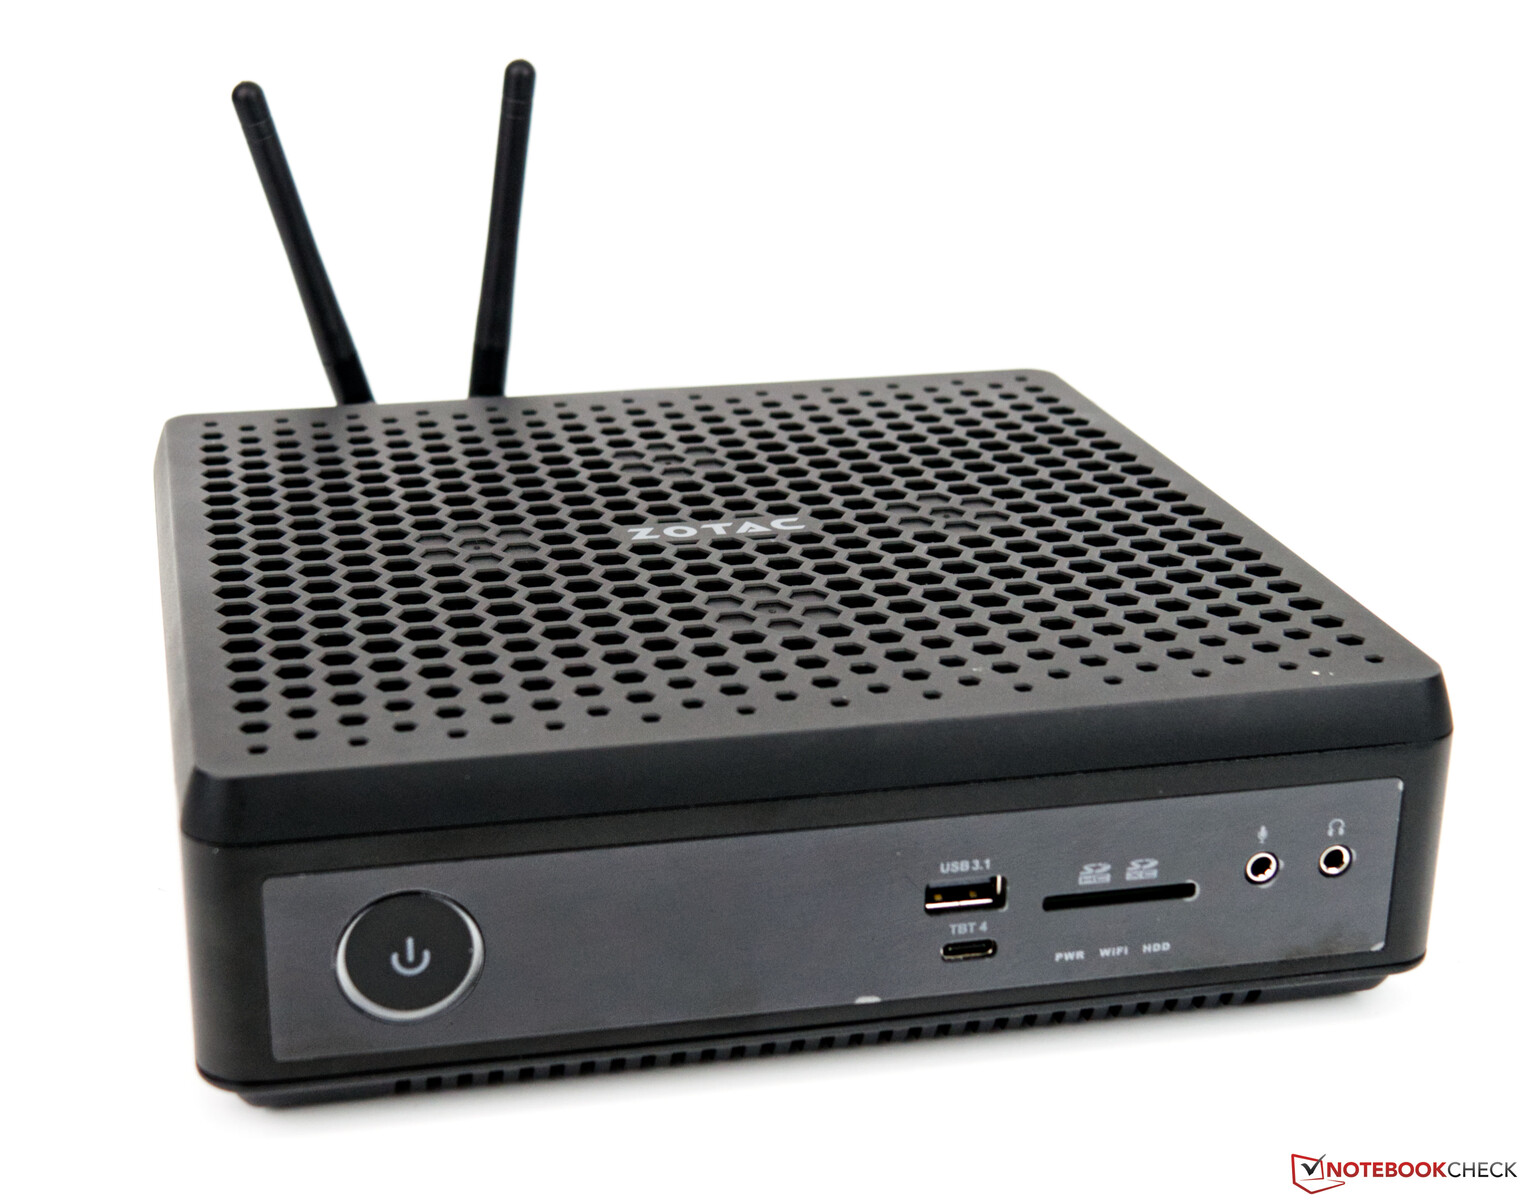
Visueel is de Zotac ZBOX Magnus EN173070C duidelijk te onderscheiden. De Zotac ZBOX Magnus EN72080V was al gebaseerd op de compacte behuizing, die alleen aan de voorkant minimaal is veranderd. Het kan ook helemaal zonder RGB, zoals Zotac hier laat zien. Degenen die van een eenvoudig en compact ontwerp houden, zullen tevreden zijn. De behuizing is gemaakt van plastic en liet een zeer goede haptische indruk achter in onze gedachten. Samen met het toegevoegde RAM en de twee M.2 SSD's weegt het systeem iets minder dan 1,8 kilogram (~4 lb). Toegevoegd is de forse 330-Watt voeding, die 1,3 kilogram weegt (~2,9 lb). In termen van grootte, is de voeding ongeveer half zo groot als de Magnus EN173070C zelf, die niet veel ruimte nodig heeft met een voetafdruk van 21 x 20,3 cm (~8,3 x 8 in). Met een hoogte van slechts 6,22 cm (~2,45 in), is het apparaat ook relatief slank.
Aansluitapparatuur
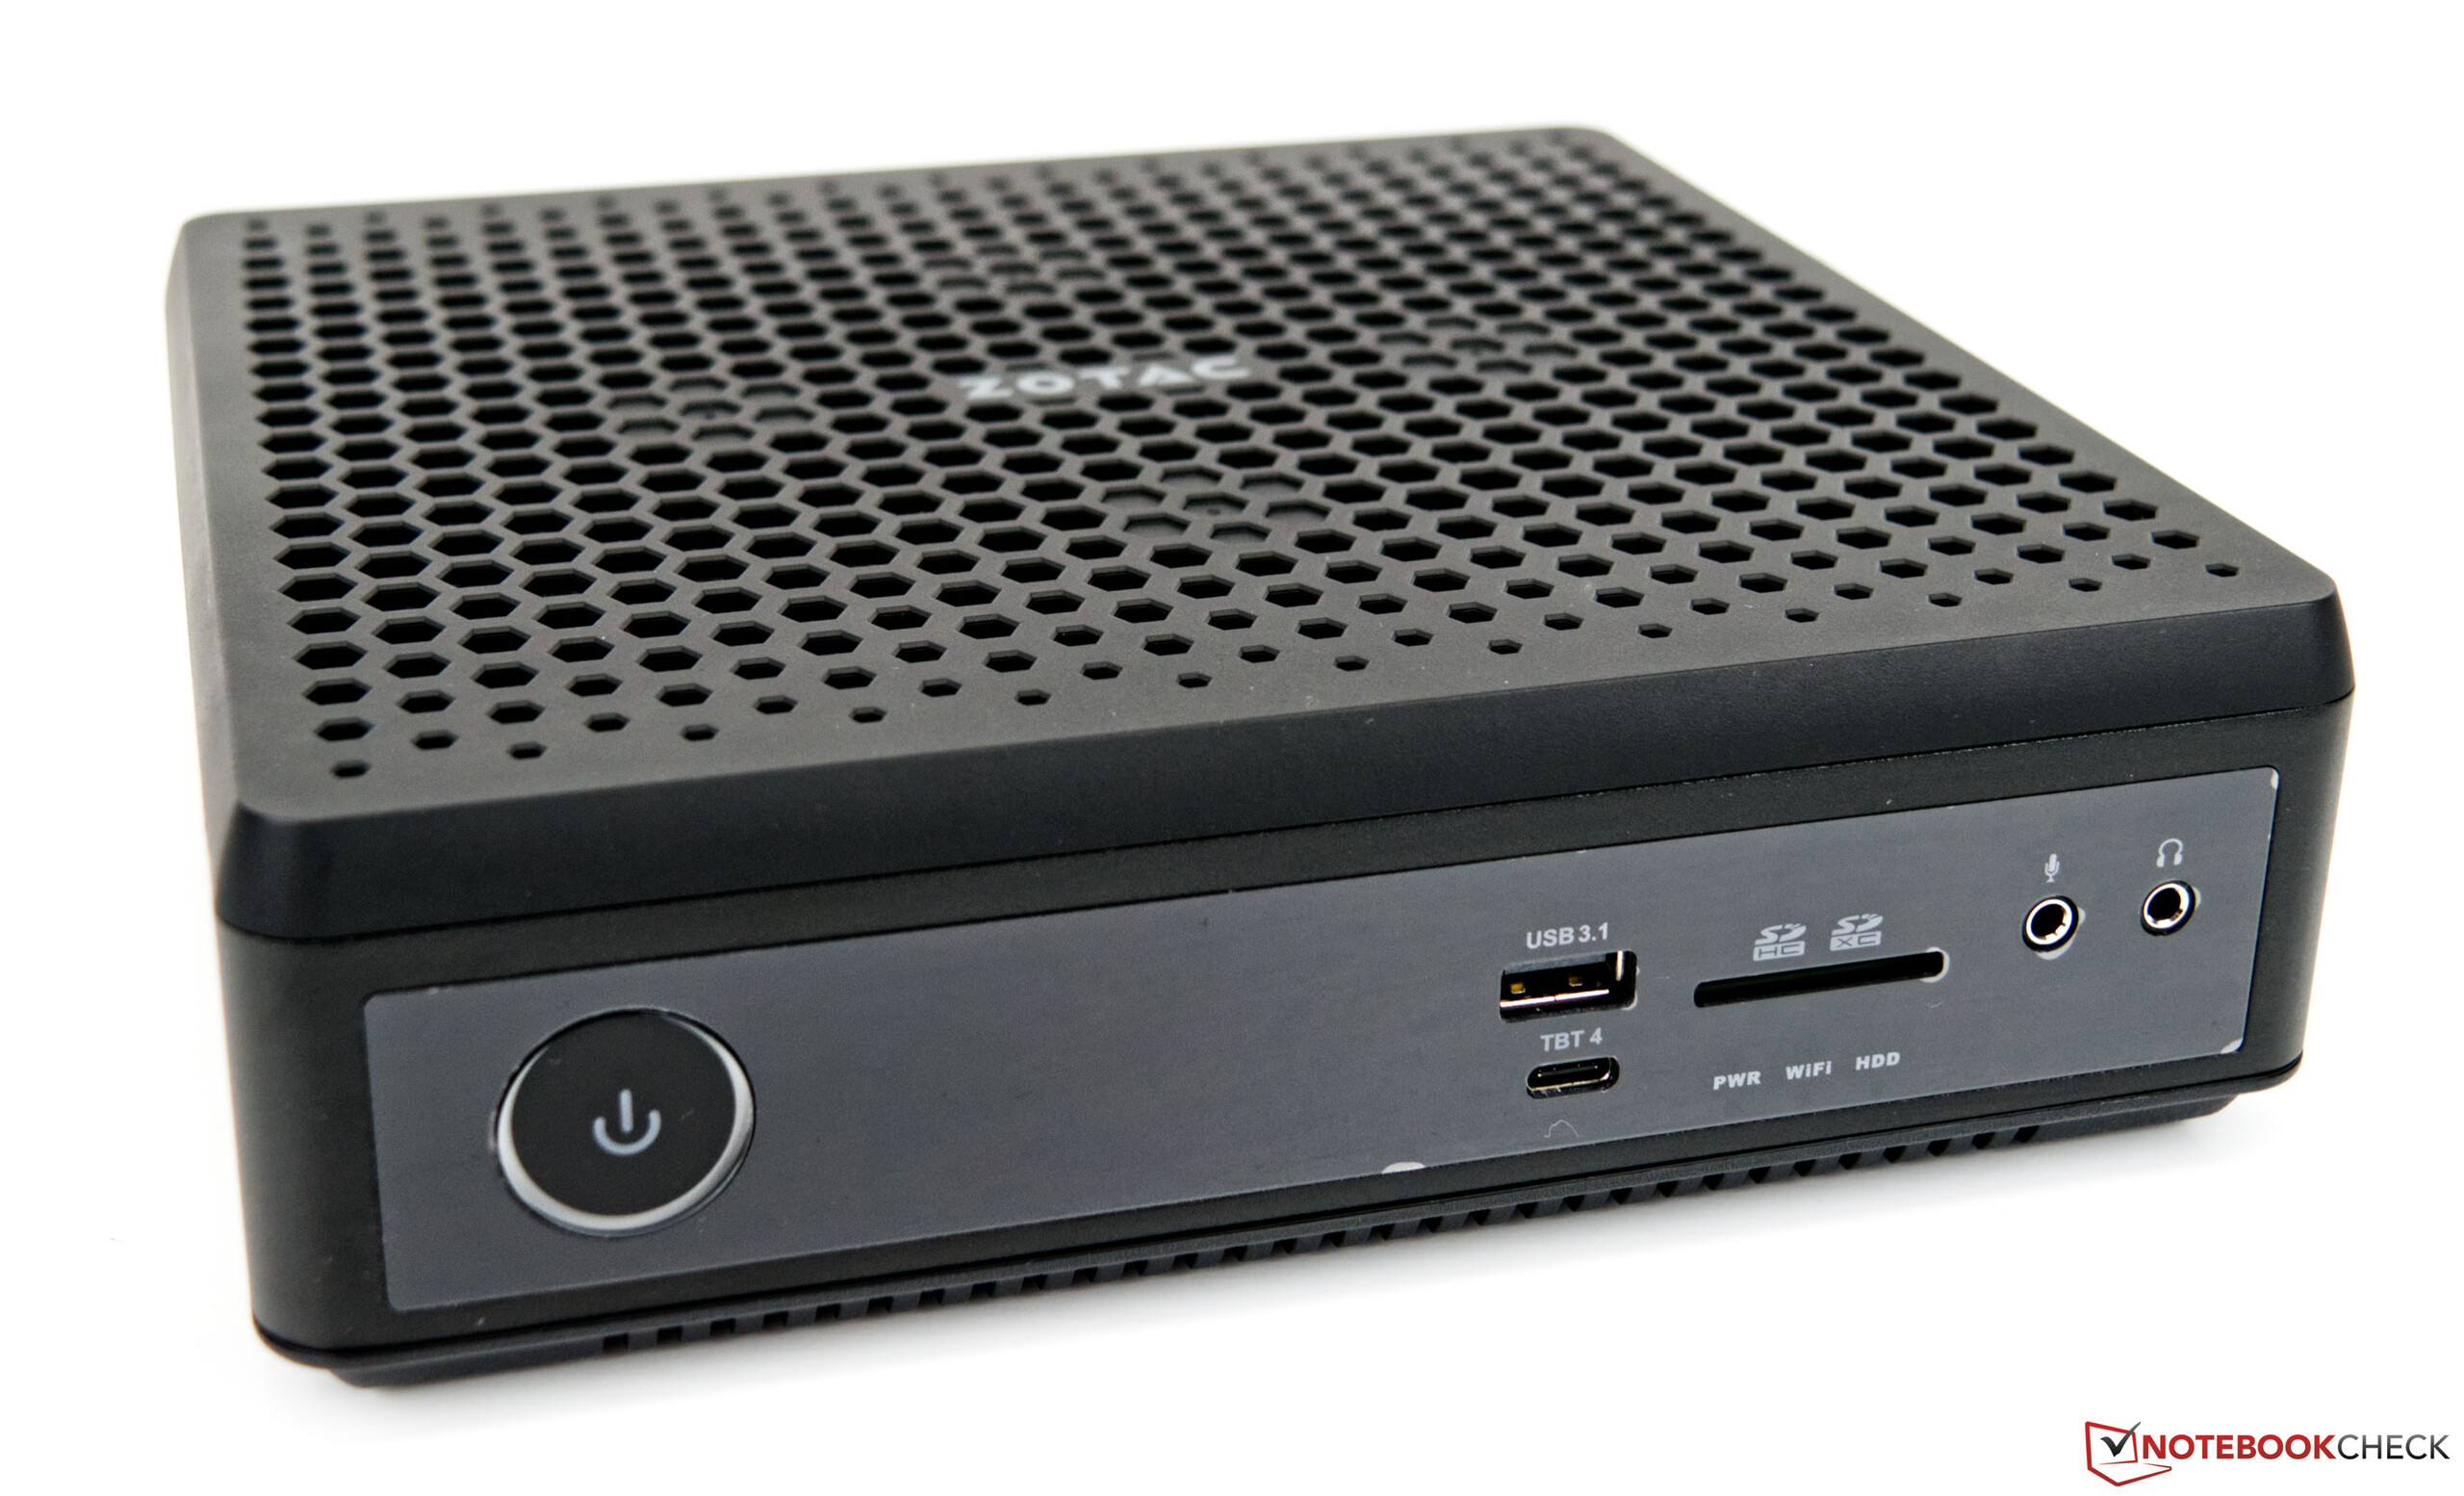
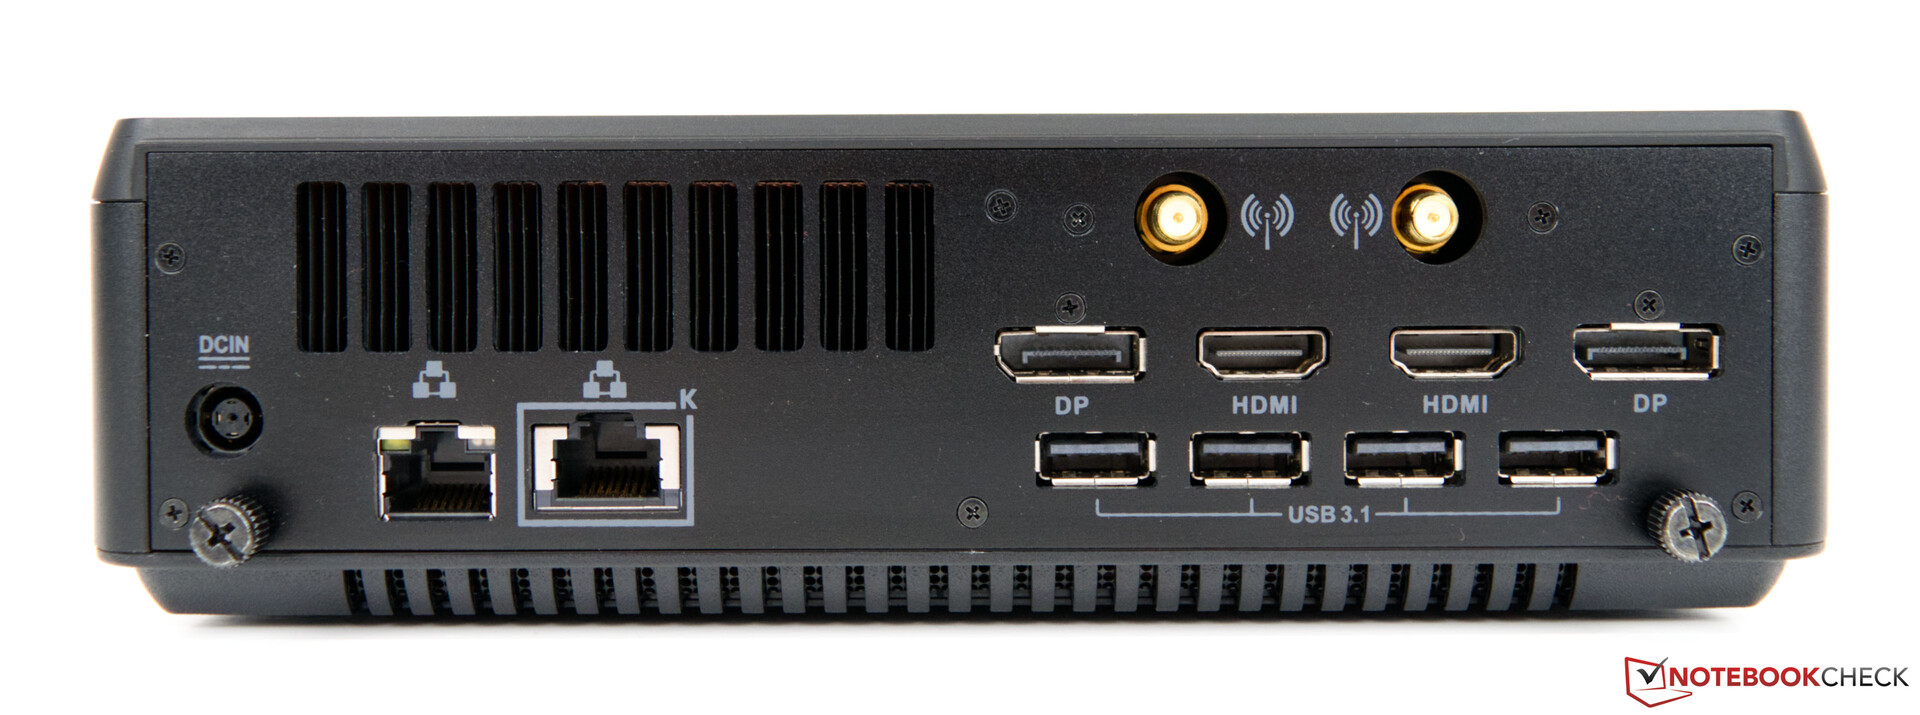
De Zotac ZBOX Magnus EN173070C biedt een grote verscheidenheid aan externe aansluitingen, maar dat mag ook verwacht worden van een desktop PC. Er zijn in totaal vijf USB Type-A poorten en een enkele Type-C aansluiting, die Thunderbolt 4 ondersteunt. Deze laatste heeft echter een beperking in die zin dat hij alleen bedoeld is voor data. Daarnaast kun je tot vier externe beeldschermen tegelijk laten werken. Om die aan te sluiten, zijn er twee DisplayPort- en twee HDMI-poorten. Daarnaast hoeven de gebruikers ook niet meer zonder een SD-kaartlezer te leven.

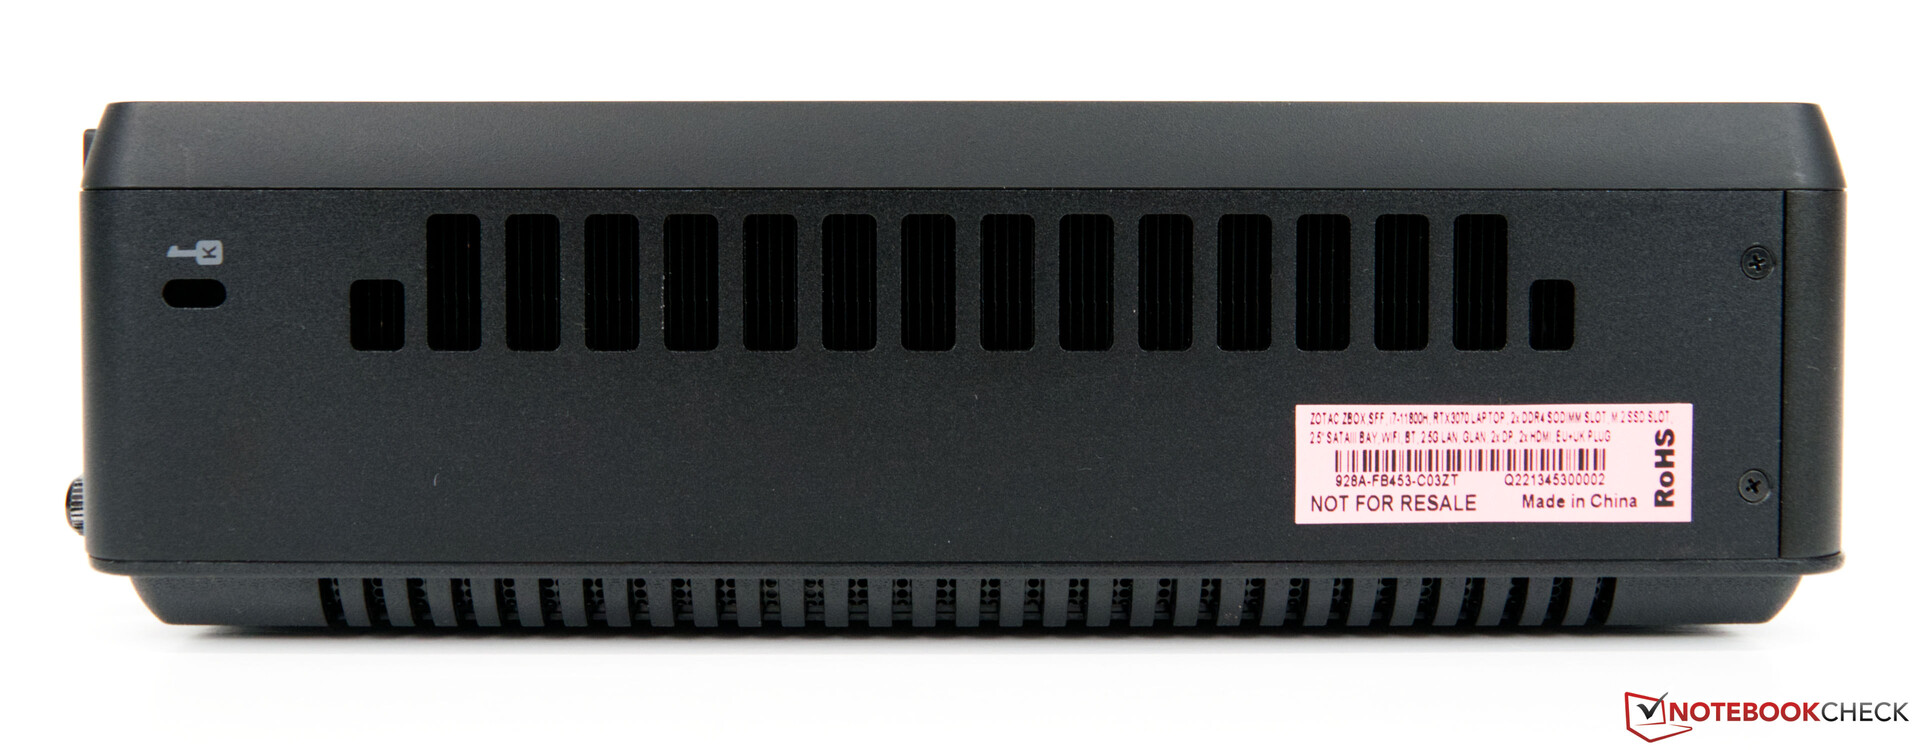
SD-kaartlezer
De SD-kaartlezer binnenin biedt USB-3 snelheden en is niet in staat om de volledige prestaties van onze testkaart (AV Pro SD microSD 128 GB V60) te benutten. In tegenstelling, de Intel Dragon Canyon NUClaat zien wat er mogelijk is met UHS II ondersteuning.
| SD Card Reader | |
| average JPG Copy Test (av. of 3 runs) | |
| Intel Dragon Canyon NUC | |
| Zotac ZBOX Magnus EN173070C (AV Pro SD microSD 128 GB V60) | |
| maximum AS SSD Seq Read Test (1GB) | |
| Intel Dragon Canyon NUC | |
| Zotac ZBOX Magnus EN173070C (AV Pro SD microSD 128 GB V60) | |
Communicatie
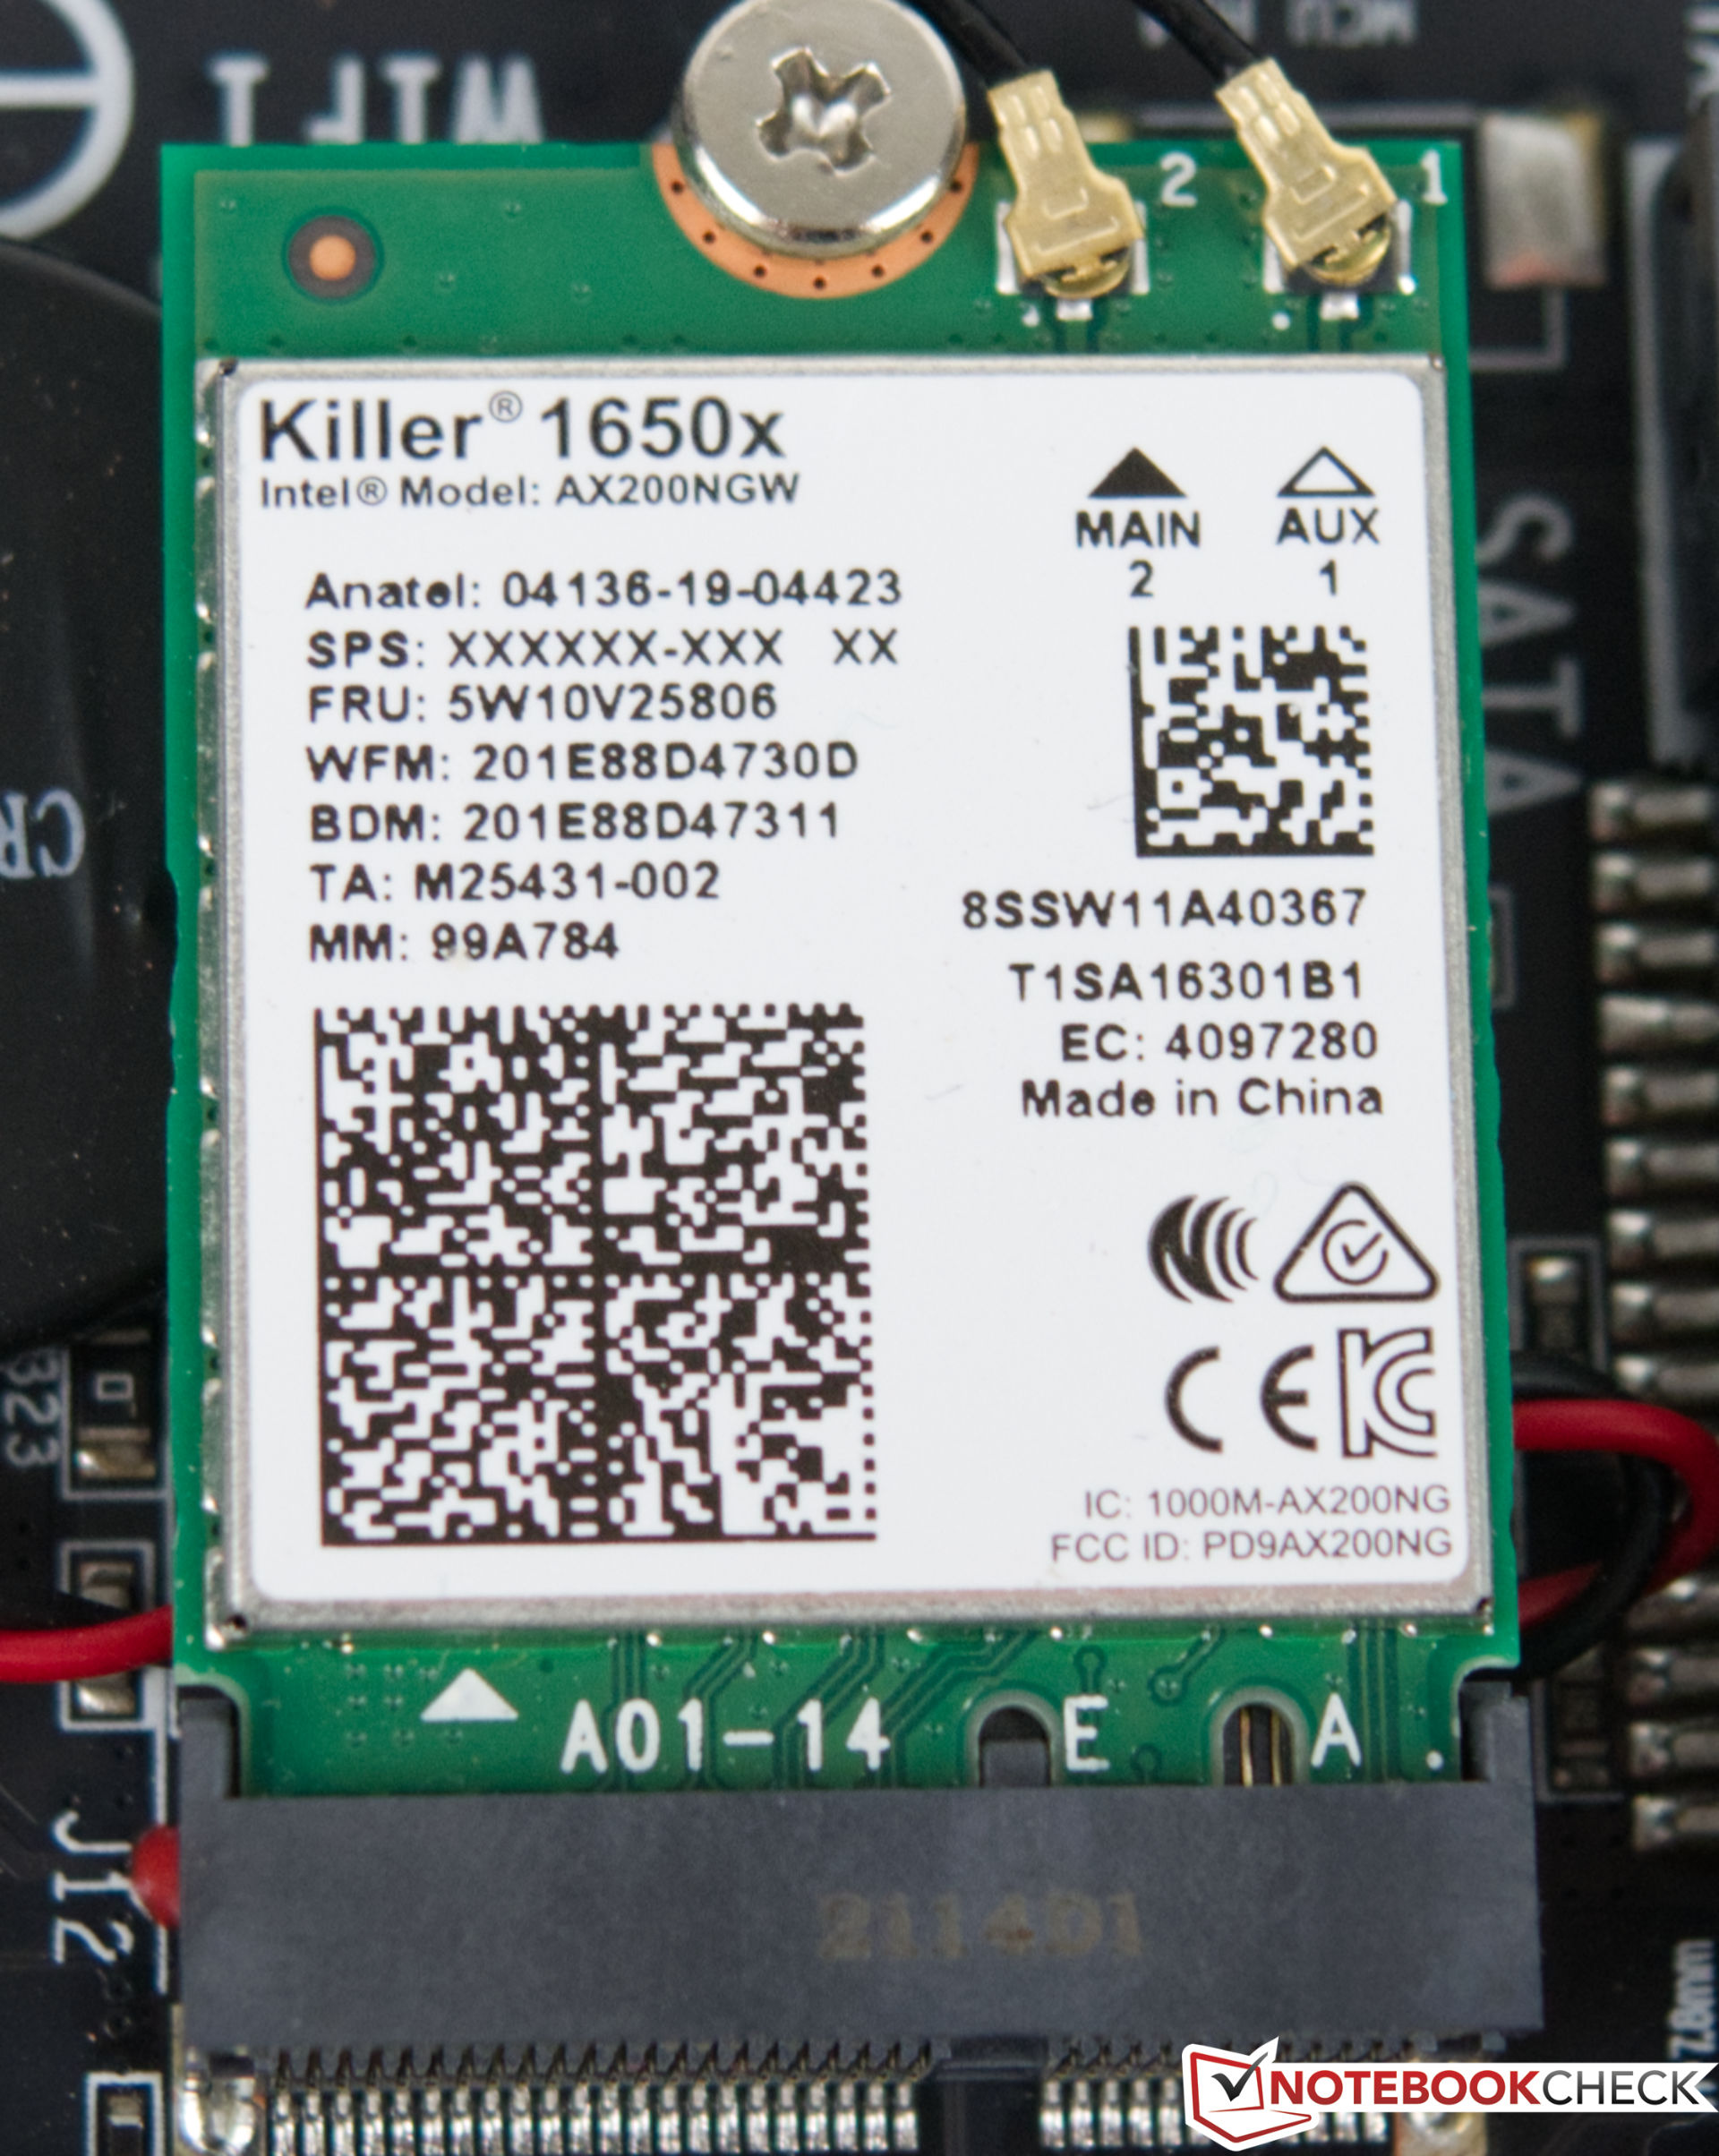
Zotac gebruikt een WLAN module van Killer in de Magnus EN173070C. De AX1650x biedt Wi-Fi 6 en doet het erg goed in onze test. De prestaties blijven stabiel, zelfs over een langere periode en er zijn geen significante variaties. Echter, in de directe vergelijking, de Intel Dragon Canyon NUCmet de Intel Wi-Fi 6E AX211 in staat om betere waarden te leveren. We hebben de test uitgevoerd onder optimale omstandigheden met behulp van de Asus GT-AXE1000WiFi-6E WLAN gaming router.
Prestaties
Processor
De Zotac ZBOX Magnus EN173070C maakt gebruik van eenIntel Core i7-11800HcPU. Deze processor is echt bedoeld voor laptops en biedt 8 kernen en 16 threads bij een maximale kloksnelheid tot 4,6 GHz. De SoC, die behoort tot de Tiger Lake serie, doet zijn werk goed in het compacte systeem. Zotac definieert de PL1 waarde op 55 watt, en het systeem is in staat om tot 69 watt te verbruiken voor een korte periode. Hoewel de prestaties niet echt tot uiting komen in de resultaten, draait de SoC van onze testeenheid op het niveau van een Intel Core i9-10900Ktijdens de single core belasting, en is op sommige momenten zelfs in staat om dat te overtreffen. Aan de andere kant wordt de Intel Core i7-11800H overtroffen door deAMD Ryzen 9 5900HXin veel tests. We verwachten alleen een merkbare prestatie sprong met Intel's Alder Lake P SoC's. Misschien plant Zotac hier al een kleine upgrade in de nabije toekomst, die de prestaties op alle vlakken zou moeten verbeteren.
| Cinebench R15 | |
| CPU Single 64Bit | |
| Intel Core i5-12600K, NVIDIA Titan RTX | |
| AMD Ryzen 7 5800X, NVIDIA Titan RTX | |
| AMD Ryzen 9 5900HX, AMD Radeon RX Vega 8 (Ryzen 4000/5000) | |
| Gemiddeld Intel Core i7-11800H (201 - 231, n=46) | |
| Intel Core i9-10900K, NVIDIA Titan RTX | |
| Intel Core i7-11800H, NVIDIA GeForce RTX 3070 Laptop GPU | |
| Intel Core i9-9980HK, NVIDIA GeForce RTX 2070 (Desktop) | |
| Intel Core i5-10600K, NVIDIA Titan RTX | |
| Intel Core i7-10700, NVIDIA GeForce RTX 3070 | |
| CPU Multi 64Bit | |
| Intel Core i9-10900K, NVIDIA Titan RTX | |
| AMD Ryzen 7 5800X, NVIDIA Titan RTX | |
| Intel Core i5-12600K, NVIDIA Titan RTX | |
| AMD Ryzen 9 5900HX, AMD Radeon RX Vega 8 (Ryzen 4000/5000) | |
| Gemiddeld Intel Core i7-11800H (1342 - 2173, n=50) | |
| Intel Core i7-11800H, NVIDIA GeForce RTX 3070 Laptop GPU | |
| Intel Core i9-9980HK, NVIDIA GeForce RTX 2070 (Desktop) | |
| Intel Core i7-10700, NVIDIA GeForce RTX 3070 | |
| Intel Core i5-10600K, NVIDIA Titan RTX | |
| Cinebench R20 | |
| CPU (Single Core) | |
| Intel Core i5-12600K, NVIDIA Titan RTX | |
| AMD Ryzen 7 5800X, NVIDIA Titan RTX | |
| AMD Ryzen 9 5900HX, AMD Radeon RX Vega 8 (Ryzen 4000/5000) | |
| Gemiddeld Intel Core i7-11800H (520 - 586, n=47) | |
| Intel Core i7-11800H, NVIDIA GeForce RTX 3070 Laptop GPU | |
| Intel Core i9-10900K, NVIDIA Titan RTX | |
| Intel Core i9-9980HK, NVIDIA GeForce RTX 2070 (Desktop) | |
| Intel Core i5-10600K, NVIDIA Titan RTX | |
| CPU (Multi Core) | |
| Intel Core i5-12600K, NVIDIA Titan RTX | |
| Intel Core i9-10900K, NVIDIA Titan RTX | |
| AMD Ryzen 7 5800X, NVIDIA Titan RTX | |
| AMD Ryzen 9 5900HX, AMD Radeon RX Vega 8 (Ryzen 4000/5000) | |
| Gemiddeld Intel Core i7-11800H (2498 - 5408, n=50) | |
| Intel Core i7-11800H, NVIDIA GeForce RTX 3070 Laptop GPU | |
| Intel Core i5-10600K, NVIDIA Titan RTX | |
| Intel Core i9-9980HK, NVIDIA GeForce RTX 2070 (Desktop) | |
| Cinebench R11.5 | |
| CPU Single 64Bit | |
| Intel Core i5-12600K, NVIDIA Titan RTX | |
| AMD Ryzen 7 5800X, NVIDIA Titan RTX | |
| AMD Ryzen 9 5900HX, AMD Radeon RX Vega 8 (Ryzen 4000/5000) | |
| Intel Core i7-11800H, NVIDIA GeForce RTX 3070 Laptop GPU | |
| Gemiddeld Intel Core i7-11800H (2.45 - 2.62, n=4) | |
| Intel Core i9-10900K, NVIDIA Titan RTX | |
| Intel Core i9-9980HK, NVIDIA GeForce RTX 2070 (Desktop) | |
| Intel Core i7-10700, NVIDIA GeForce RTX 3070 | |
| Intel Core i5-10600K, NVIDIA Titan RTX | |
| CPU Multi 64Bit | |
| Intel Core i5-12600K, NVIDIA Titan RTX | |
| AMD Ryzen 7 5800X, NVIDIA Titan RTX | |
| Intel Core i9-10900K, NVIDIA Titan RTX | |
| AMD Ryzen 9 5900HX, AMD Radeon RX Vega 8 (Ryzen 4000/5000) | |
| Intel Core i7-11800H, NVIDIA GeForce RTX 3070 Laptop GPU | |
| Gemiddeld Intel Core i7-11800H (16 - 21.9, n=4) | |
| Intel Core i9-9980HK, NVIDIA GeForce RTX 2070 (Desktop) | |
| Intel Core i7-10700, NVIDIA GeForce RTX 3070 | |
| Intel Core i5-10600K, NVIDIA Titan RTX | |
| Cinebench R10 | |
| Rendering Single CPUs 64Bit | |
| Intel Core i5-12600K, NVIDIA Titan RTX | |
| AMD Ryzen 7 5800X, NVIDIA Titan RTX | |
| AMD Ryzen 9 5900HX, AMD Radeon RX Vega 8 (Ryzen 4000/5000) | |
| Intel Core i7-11800H, NVIDIA GeForce RTX 3070 Laptop GPU | |
| Gemiddeld Intel Core i7-11800H (10903 - 11957, n=4) | |
| Intel Core i9-10900K, NVIDIA Titan RTX | |
| Intel Core i9-9980HK, NVIDIA GeForce RTX 2070 (Desktop) | |
| Intel Core i7-10700, NVIDIA GeForce RTX 3070 | |
| Intel Core i5-10600K, NVIDIA Titan RTX | |
| Rendering Multiple CPUs 64Bit | |
| Intel Core i5-12600K, NVIDIA Titan RTX | |
| AMD Ryzen 7 5800X, NVIDIA Titan RTX | |
| Intel Core i9-10900K, NVIDIA Titan RTX | |
| AMD Ryzen 9 5900HX, AMD Radeon RX Vega 8 (Ryzen 4000/5000) | |
| Intel Core i7-11800H, NVIDIA GeForce RTX 3070 Laptop GPU | |
| Gemiddeld Intel Core i7-11800H (49232 - 67486, n=4) | |
| Intel Core i9-9980HK, NVIDIA GeForce RTX 2070 (Desktop) | |
| Intel Core i7-10700, NVIDIA GeForce RTX 3070 | |
| Intel Core i5-10600K, NVIDIA Titan RTX | |
| Blender - v2.79 BMW27 CPU | |
| Intel Core i9-9980HK, NVIDIA GeForce RTX 2070 (Desktop) | |
| Intel Core i7-10700, NVIDIA GeForce RTX 3070 | |
| Intel Core i5-10600K, NVIDIA Titan RTX | |
| Intel Core i7-11800H, NVIDIA GeForce RTX 3070 Laptop GPU | |
| Gemiddeld Intel Core i7-11800H (217 - 454, n=46) | |
| AMD Ryzen 9 5900HX, AMD Radeon RX Vega 8 (Ryzen 4000/5000) | |
| AMD Ryzen 7 5800X, NVIDIA Titan RTX | |
| Intel Core i5-12600K, NVIDIA Titan RTX | |
| Intel Core i9-10900K, NVIDIA Titan RTX | |
| wPrime 2.10 | |
| 32m | |
| Intel Core i5-12600K, NVIDIA Titan RTX | |
| Intel Core i5-10600K, NVIDIA Titan RTX | |
| Intel Core i7-11800H, NVIDIA GeForce RTX 3070 Laptop GPU | |
| Gemiddeld Intel Core i7-11800H (3.41 - 4.19, n=3) | |
| Intel Core i9-9980HK, NVIDIA GeForce RTX 2070 (Desktop) | |
| Intel Core i9-10900K, NVIDIA Titan RTX | |
| AMD Ryzen 9 5900HX, AMD Radeon RX Vega 8 (Ryzen 4000/5000) | |
| Intel Core i7-10700, NVIDIA GeForce RTX 3070 | |
| AMD Ryzen 7 5800X, NVIDIA Titan RTX | |
| 1024m | |
| Intel Core i5-12600K, NVIDIA Titan RTX | |
| Intel Core i7-11800H, NVIDIA GeForce RTX 3070 Laptop GPU | |
| Intel Core i9-9980HK, NVIDIA GeForce RTX 2070 (Desktop) | |
| Intel Core i7-10700, NVIDIA GeForce RTX 3070 | |
| Gemiddeld Intel Core i7-11800H (98.3 - 121.1, n=3) | |
| Intel Core i5-10600K, NVIDIA Titan RTX | |
| AMD Ryzen 9 5900HX, AMD Radeon RX Vega 8 (Ryzen 4000/5000) | |
| AMD Ryzen 7 5800X, NVIDIA Titan RTX | |
| Intel Core i9-10900K, NVIDIA Titan RTX | |
| X264 HD Benchmark 4.0 | |
| Pass 1 | |
| AMD Ryzen 7 5800X, NVIDIA Titan RTX | |
| Intel Core i5-12600K, NVIDIA Titan RTX | |
| Intel Core i9-10900K, NVIDIA Titan RTX | |
| AMD Ryzen 9 5900HX, AMD Radeon RX Vega 8 (Ryzen 4000/5000) | |
| Intel Core i5-10600K, NVIDIA Titan RTX | |
| Gemiddeld Intel Core i7-11800H (242 - 258, n=3) | |
| Intel Core i7-11800H, NVIDIA GeForce RTX 3070 Laptop GPU | |
| Intel Core i9-9980HK, NVIDIA GeForce RTX 2070 (Desktop) | |
| Intel Core i7-10700, NVIDIA GeForce RTX 3070 | |
| Pass 2 | |
| AMD Ryzen 7 5800X, NVIDIA Titan RTX | |
| Intel Core i9-10900K, NVIDIA Titan RTX | |
| Intel Core i5-12600K, NVIDIA Titan RTX | |
| AMD Ryzen 9 5900HX, AMD Radeon RX Vega 8 (Ryzen 4000/5000) | |
| Gemiddeld Intel Core i7-11800H (86.3 - 109.3, n=3) | |
| Intel Core i7-11800H, NVIDIA GeForce RTX 3070 Laptop GPU | |
| Intel Core i9-9980HK, NVIDIA GeForce RTX 2070 (Desktop) | |
| Intel Core i5-10600K, NVIDIA Titan RTX | |
| Intel Core i7-10700, NVIDIA GeForce RTX 3070 | |
| WinRAR - Result | |
| AMD Ryzen 7 5800X, NVIDIA Titan RTX | |
| Intel Core i9-10900K, NVIDIA Titan RTX | |
| Gemiddeld Intel Core i7-11800H (7925 - 8569, n=3) | |
| Intel Core i7-11800H, NVIDIA GeForce RTX 3070 Laptop GPU | |
| Intel Core i9-9980HK, NVIDIA GeForce RTX 2070 (Desktop) | |
| Intel Core i7-10700, NVIDIA GeForce RTX 3070 | |
| Intel Core i5-10600K, NVIDIA Titan RTX | |
| Intel Core i5-12600K, NVIDIA Titan RTX | |
| AMD Ryzen 9 5900HX, AMD Radeon RX Vega 8 (Ryzen 4000/5000) | |
| Geekbench 5.5 | |
| Multi-Core | |
| Intel Core i5-12600K, NVIDIA Titan RTX | |
| Intel Core i9-10900K, NVIDIA Titan RTX | |
| AMD Ryzen 7 5800X, NVIDIA Titan RTX | |
| Gemiddeld Intel Core i7-11800H (4655 - 9851, n=40) | |
| Intel Core i7-11800H, NVIDIA GeForce RTX 3070 Laptop GPU | |
| Intel Core i7-10700, NVIDIA GeForce RTX 3070 | |
| AMD Ryzen 9 5900HX, AMD Radeon RX Vega 8 (Ryzen 4000/5000) | |
| Intel Core i9-9980HK, NVIDIA GeForce RTX 2070 (Desktop) | |
| Intel Core i5-10600K, NVIDIA Titan RTX | |
| Single-Core | |
| Intel Core i5-12600K, NVIDIA Titan RTX | |
| AMD Ryzen 7 5800X, NVIDIA Titan RTX | |
| Intel Core i7-11800H, NVIDIA GeForce RTX 3070 Laptop GPU | |
| Gemiddeld Intel Core i7-11800H (1429 - 1625, n=40) | |
| AMD Ryzen 9 5900HX, AMD Radeon RX Vega 8 (Ryzen 4000/5000) | |
| Intel Core i9-10900K, NVIDIA Titan RTX | |
| Intel Core i9-9980HK, NVIDIA GeForce RTX 2070 (Desktop) | |
| Intel Core i7-10700, NVIDIA GeForce RTX 3070 | |
| Intel Core i5-10600K, NVIDIA Titan RTX | |
| Geekbench 5.0 | |
| 5.0 Multi-Core | |
| Intel Core i5-12600K, NVIDIA Titan RTX | |
| Intel Core i9-10900K, NVIDIA Titan RTX | |
| AMD Ryzen 7 5800X, NVIDIA Titan RTX | |
| Intel Core i7-10700, NVIDIA GeForce RTX 3070 | |
| Intel Core i7-11800H, NVIDIA GeForce RTX 3070 Laptop GPU | |
| AMD Ryzen 9 5900HX, AMD Radeon RX Vega 8 (Ryzen 4000/5000) | |
| Gemiddeld Intel Core i7-11800H (6340 - 9103, n=8) | |
| Intel Core i9-9980HK, NVIDIA GeForce RTX 2070 (Desktop) | |
| Intel Core i5-10600K, NVIDIA Titan RTX | |
| 5.0 Single-Core | |
| Intel Core i5-12600K, NVIDIA Titan RTX | |
| AMD Ryzen 7 5800X, NVIDIA Titan RTX | |
| Intel Core i7-11800H, NVIDIA GeForce RTX 3070 Laptop GPU | |
| Gemiddeld Intel Core i7-11800H (1436 - 1571, n=8) | |
| AMD Ryzen 9 5900HX, AMD Radeon RX Vega 8 (Ryzen 4000/5000) | |
| Intel Core i9-10900K, NVIDIA Titan RTX | |
| Intel Core i9-9980HK, NVIDIA GeForce RTX 2070 (Desktop) | |
| Intel Core i7-10700, NVIDIA GeForce RTX 3070 | |
| Intel Core i5-10600K, NVIDIA Titan RTX | |
| Geekbench 4.4 | |
| 64 Bit Single-Core Score | |
| Intel Core i5-12600K, NVIDIA Titan RTX | |
| AMD Ryzen 7 5800X, NVIDIA Titan RTX | |
| Intel Core i7-11800H, NVIDIA GeForce RTX 3070 Laptop GPU | |
| Gemiddeld Intel Core i7-11800H (6104 - 6747, n=7) | |
| AMD Ryzen 9 5900HX, AMD Radeon RX Vega 8 (Ryzen 4000/5000) | |
| Intel Core i9-10900K, NVIDIA Titan RTX | |
| Intel Core i9-9980HK, NVIDIA GeForce RTX 2070 (Desktop) | |
| Intel Core i5-10600K, NVIDIA Titan RTX | |
| Intel Core i7-10700, NVIDIA GeForce RTX 3070 | |
| 64 Bit Multi-Core Score | |
| Intel Core i5-12600K, NVIDIA Titan RTX | |
| AMD Ryzen 7 5800X, NVIDIA Titan RTX | |
| Intel Core i9-10900K, NVIDIA Titan RTX | |
| Gemiddeld Intel Core i7-11800H (27454 - 36706, n=7) | |
| Intel Core i7-11800H, NVIDIA GeForce RTX 3070 Laptop GPU | |
| AMD Ryzen 9 5900HX, AMD Radeon RX Vega 8 (Ryzen 4000/5000) | |
| Intel Core i7-10700, NVIDIA GeForce RTX 3070 | |
| Intel Core i9-9980HK, NVIDIA GeForce RTX 2070 (Desktop) | |
| Intel Core i5-10600K, NVIDIA Titan RTX | |
| 3DMark 11 - 1280x720 Performance Physics | |
| Intel Core i5-12600K, NVIDIA Titan RTX | |
| AMD Ryzen 7 5800X, NVIDIA Titan RTX | |
| Intel Core i9-10900K, NVIDIA Titan RTX | |
| Intel Core i9-9980HK, NVIDIA GeForce RTX 2070 (Desktop) | |
| Gemiddeld Intel Core i7-11800H (10590 - 19167, n=46) | |
| Intel Core i5-10600K, NVIDIA Titan RTX | |
| Intel Core i7-11800H, NVIDIA GeForce RTX 3070 Laptop GPU | |
| Intel Core i7-10700, NVIDIA GeForce RTX 3070 | |
| AMD Ryzen 9 5900HX, AMD Radeon RX Vega 8 (Ryzen 4000/5000) | |
| 7-Zip 18.03 | |
| 7z b 4 | |
| AMD Ryzen 7 5800X, NVIDIA Titan RTX | |
| Intel Core i9-10900K, NVIDIA Titan RTX | |
| Intel Core i5-12600K, NVIDIA Titan RTX | |
| AMD Ryzen 9 5900HX, AMD Radeon RX Vega 8 (Ryzen 4000/5000) | |
| Gemiddeld Intel Core i7-11800H (33718 - 56758, n=46) | |
| Intel Core i7-11800H, NVIDIA GeForce RTX 3070 Laptop GPU | |
| Intel Core i9-9980HK, NVIDIA GeForce RTX 2070 (Desktop) | |
| Intel Core i7-10700, NVIDIA GeForce RTX 3070 | |
| Intel Core i5-10600K, NVIDIA Titan RTX | |
| 7z b 4 -mmt1 | |
| AMD Ryzen 7 5800X, NVIDIA Titan RTX | |
| Intel Core i9-10900K, NVIDIA Titan RTX | |
| Intel Core i5-12600K, NVIDIA Titan RTX | |
| AMD Ryzen 9 5900HX, AMD Radeon RX Vega 8 (Ryzen 4000/5000) | |
| Intel Core i9-9980HK, NVIDIA GeForce RTX 2070 (Desktop) | |
| Intel Core i7-11800H, NVIDIA GeForce RTX 3070 Laptop GPU | |
| Gemiddeld Intel Core i7-11800H (5138 - 5732, n=46) | |
| Intel Core i7-10700, NVIDIA GeForce RTX 3070 | |
| Intel Core i5-10600K, NVIDIA Titan RTX | |
| HWBOT x265 Benchmark v2.2 - 4k Preset | |
| Intel Core i5-12600K, NVIDIA Titan RTX | |
| Intel Core i9-10900K, NVIDIA Titan RTX | |
| AMD Ryzen 7 5800X, NVIDIA Titan RTX | |
| AMD Ryzen 9 5900HX, AMD Radeon RX Vega 8 (Ryzen 4000/5000) | |
| Gemiddeld Intel Core i7-11800H (7.38 - 17.4, n=46) | |
| Intel Core i7-11800H, NVIDIA GeForce RTX 3070 Laptop GPU | |
| Intel Core i5-10600K, NVIDIA Titan RTX | |
| Intel Core i7-10700, NVIDIA GeForce RTX 3070 | |
| Intel Core i9-9980HK, NVIDIA GeForce RTX 2070 (Desktop) | |
| R Benchmark 2.5 - Overall mean | |
| Intel Core i5-10600K, NVIDIA Titan RTX | |
| Intel Core i7-10700, NVIDIA GeForce RTX 3070 | |
| Gemiddeld Intel Core i7-11800H (0.548 - 0.615, n=46) | |
| Intel Core i7-11800H, NVIDIA GeForce RTX 3070 Laptop GPU | |
| Intel Core i9-9980HK, NVIDIA GeForce RTX 2070 (Desktop) | |
| Intel Core i9-10900K, NVIDIA Titan RTX | |
| AMD Ryzen 9 5900HX, AMD Radeon RX Vega 8 (Ryzen 4000/5000) | |
| AMD Ryzen 7 5800X, NVIDIA Titan RTX | |
| Intel Core i5-12600K, NVIDIA Titan RTX | |
| LibreOffice - 20 Documents To PDF | |
| Intel Core i9-10900K, NVIDIA Titan RTX | |
| Intel Core i5-12600K, NVIDIA Titan RTX | |
| Intel Core i7-10700, NVIDIA GeForce RTX 3070 | |
| AMD Ryzen 9 5900HX, AMD Radeon RX Vega 8 (Ryzen 4000/5000) | |
| Intel Core i7-11800H, NVIDIA GeForce RTX 3070 Laptop GPU | |
| Gemiddeld Intel Core i7-11800H (38.6 - 59.9, n=45) | |
| Intel Core i5-10600K, NVIDIA Titan RTX | |
| Intel Core i9-9980HK, NVIDIA GeForce RTX 2070 (Desktop) | |
| AMD Ryzen 7 5800X, NVIDIA Titan RTX | |
| WebXPRT 3 - Overall | |
| AMD Ryzen 7 5800X, NVIDIA Titan RTX | |
| Intel Core i5-12600K, NVIDIA Titan RTX | |
| AMD Ryzen 9 5900HX, AMD Radeon RX Vega 8 (Ryzen 4000/5000) | |
| Intel Core i7-11800H, NVIDIA GeForce RTX 3070 Laptop GPU | |
| Gemiddeld Intel Core i7-11800H (251 - 280, n=40) | |
| Intel Core i9-10900K, NVIDIA Titan RTX | |
| Intel Core i7-10700, NVIDIA GeForce RTX 3070 | |
| Intel Core i5-10600K, NVIDIA Titan RTX | |
| Intel Core i9-9980HK, NVIDIA GeForce RTX 2070 (Desktop) | |
| Mozilla Kraken 1.1 - Total | |
| Intel Core i5-10600K, NVIDIA Titan RTX | |
| Intel Core i9-9980HK, NVIDIA GeForce RTX 2070 (Desktop) | |
| Intel Core i7-10700, NVIDIA GeForce RTX 3070 | |
| Intel Core i9-10900K, NVIDIA Titan RTX | |
| Gemiddeld Intel Core i7-11800H (600 - 690, n=45) | |
| Intel Core i7-11800H, NVIDIA GeForce RTX 3070 Laptop GPU | |
| AMD Ryzen 9 5900HX, AMD Radeon RX Vega 8 (Ryzen 4000/5000) | |
| AMD Ryzen 7 5800X, NVIDIA Titan RTX | |
| Intel Core i5-12600K, NVIDIA Titan RTX | |
* ... kleiner is beter
AIDA64: FP32 Ray-Trace | FPU Julia | CPU SHA3 | CPU Queen | FPU SinJulia | FPU Mandel | CPU AES | CPU ZLib | FP64 Ray-Trace | CPU PhotoWorxx
| Performance rating | |
| Gemiddelde van klas Desktop | |
| Minisforum EliteMini HX90 | |
| AMD Ryzen 7 5800X | |
| Zotac ZBOX Magnus EN173070C | |
| Gemiddeld Intel Core i7-11800H | |
| Intel Core i5-12600K | |
| Intel Ghost Canyon NUC (RTX 2070) -1! | |
| AIDA64 / FP32 Ray-Trace | |
| Gemiddelde van klas Desktop (12248 - 84577, n=21, laatste 2 jaar) | |
| AMD Ryzen 7 5800X | |
| Minisforum EliteMini HX90 | |
| Gemiddeld Intel Core i7-11800H (8772 - 15961, n=20) | |
| Zotac ZBOX Magnus EN173070C | |
| Intel Ghost Canyon NUC (RTX 2070) | |
| Intel Core i5-12600K | |
| AIDA64 / FPU Julia | |
| Gemiddelde van klas Desktop (65152 - 246125, n=21, laatste 2 jaar) | |
| Minisforum EliteMini HX90 | |
| AMD Ryzen 7 5800X | |
| Gemiddeld Intel Core i7-11800H (39404 - 65636, n=20) | |
| Zotac ZBOX Magnus EN173070C | |
| Intel Ghost Canyon NUC (RTX 2070) | |
| Intel Core i5-12600K | |
| AIDA64 / CPU SHA3 | |
| Gemiddelde van klas Desktop (2982 - 10804, n=21, laatste 2 jaar) | |
| Gemiddeld Intel Core i7-11800H (2599 - 4439, n=20) | |
| Zotac ZBOX Magnus EN173070C | |
| Minisforum EliteMini HX90 | |
| Intel Core i5-12600K | |
| Intel Ghost Canyon NUC (RTX 2070) | |
| AMD Ryzen 7 5800X | |
| AIDA64 / CPU Queen | |
| Gemiddelde van klas Desktop (76512 - 187912, n=18, laatste 2 jaar) | |
| AMD Ryzen 7 5800X | |
| Minisforum EliteMini HX90 | |
| Gemiddeld Intel Core i7-11800H (85233 - 91941, n=20) | |
| Zotac ZBOX Magnus EN173070C | |
| Intel Core i5-12600K | |
| AIDA64 / FPU SinJulia | |
| Gemiddelde van klas Desktop (6443 - 35251, n=21, laatste 2 jaar) | |
| AMD Ryzen 7 5800X | |
| Minisforum EliteMini HX90 | |
| Intel Core i5-12600K | |
| Zotac ZBOX Magnus EN173070C | |
| Intel Ghost Canyon NUC (RTX 2070) | |
| Gemiddeld Intel Core i7-11800H (6420 - 9792, n=20) | |
| AIDA64 / FPU Mandel | |
| Gemiddelde van klas Desktop (31697 - 129745, n=21, laatste 2 jaar) | |
| Minisforum EliteMini HX90 | |
| AMD Ryzen 7 5800X | |
| Gemiddeld Intel Core i7-11800H (23365 - 39464, n=20) | |
| Zotac ZBOX Magnus EN173070C | |
| Intel Ghost Canyon NUC (RTX 2070) | |
| Intel Core i5-12600K | |
| AIDA64 / CPU AES | |
| Gemiddelde van klas Desktop (57777 - 513073, n=21, laatste 2 jaar) | |
| Minisforum EliteMini HX90 | |
| Zotac ZBOX Magnus EN173070C | |
| Gemiddeld Intel Core i7-11800H (74617 - 149388, n=20) | |
| AMD Ryzen 7 5800X | |
| Intel Core i5-12600K | |
| Intel Ghost Canyon NUC (RTX 2070) | |
| AIDA64 / CPU ZLib | |
| Gemiddelde van klas Desktop (887 - 2674, n=21, laatste 2 jaar) | |
| Intel Core i5-12600K | |
| AMD Ryzen 7 5800X | |
| Minisforum EliteMini HX90 | |
| Zotac ZBOX Magnus EN173070C | |
| Intel Ghost Canyon NUC (RTX 2070) | |
| Gemiddeld Intel Core i7-11800H (461 - 830, n=43) | |
| AIDA64 / FP64 Ray-Trace | |
| Gemiddelde van klas Desktop (6471 - 44013, n=21, laatste 2 jaar) | |
| AMD Ryzen 7 5800X | |
| Minisforum EliteMini HX90 | |
| Gemiddeld Intel Core i7-11800H (4545 - 8717, n=21) | |
| Zotac ZBOX Magnus EN173070C | |
| Intel Ghost Canyon NUC (RTX 2070) | |
| Intel Core i5-12600K | |
| AIDA64 / CPU PhotoWorxx | |
| Intel Core i5-12600K | |
| Gemiddelde van klas Desktop (38071 - 63949, n=21, laatste 2 jaar) | |
| AMD Ryzen 7 5800X | |
| Zotac ZBOX Magnus EN173070C | |
| Intel Ghost Canyon NUC (RTX 2070) | |
| Gemiddeld Intel Core i7-11800H (11898 - 26757, n=21) | |
| Minisforum EliteMini HX90 | |
Zotac ZBOX Magnus tijdens de Cinebench R15 Multi Loop
De compacte bouw vereist een goed ontworpen en effectief koelsysteem. Zotac biedt precies dat hier, aangezien we geen sterk prestatieverlies meten onder constante belasting tijdens de herhaalde Cinebench R15 laadlus.
Oplossing voor applicatieprestaties en opslag
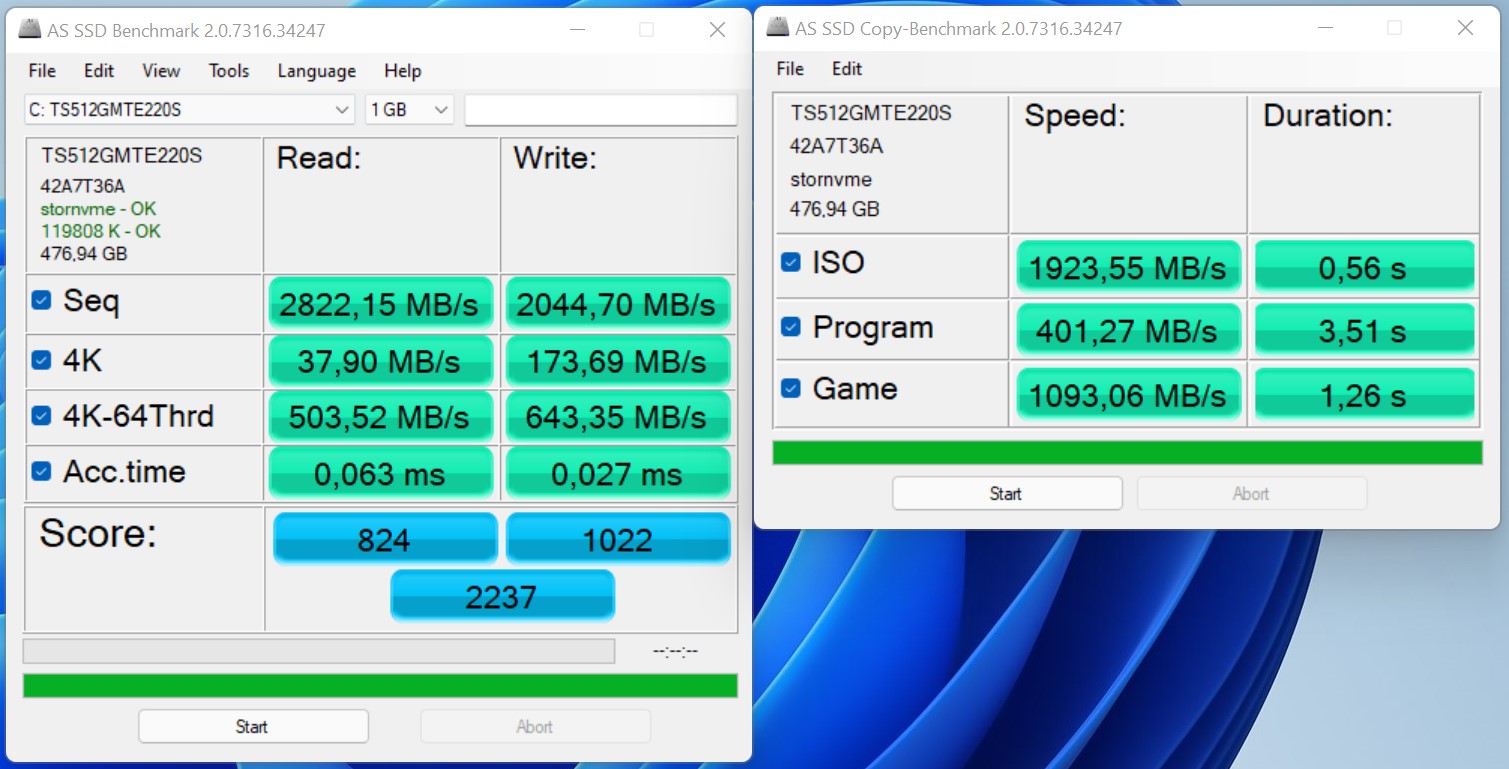
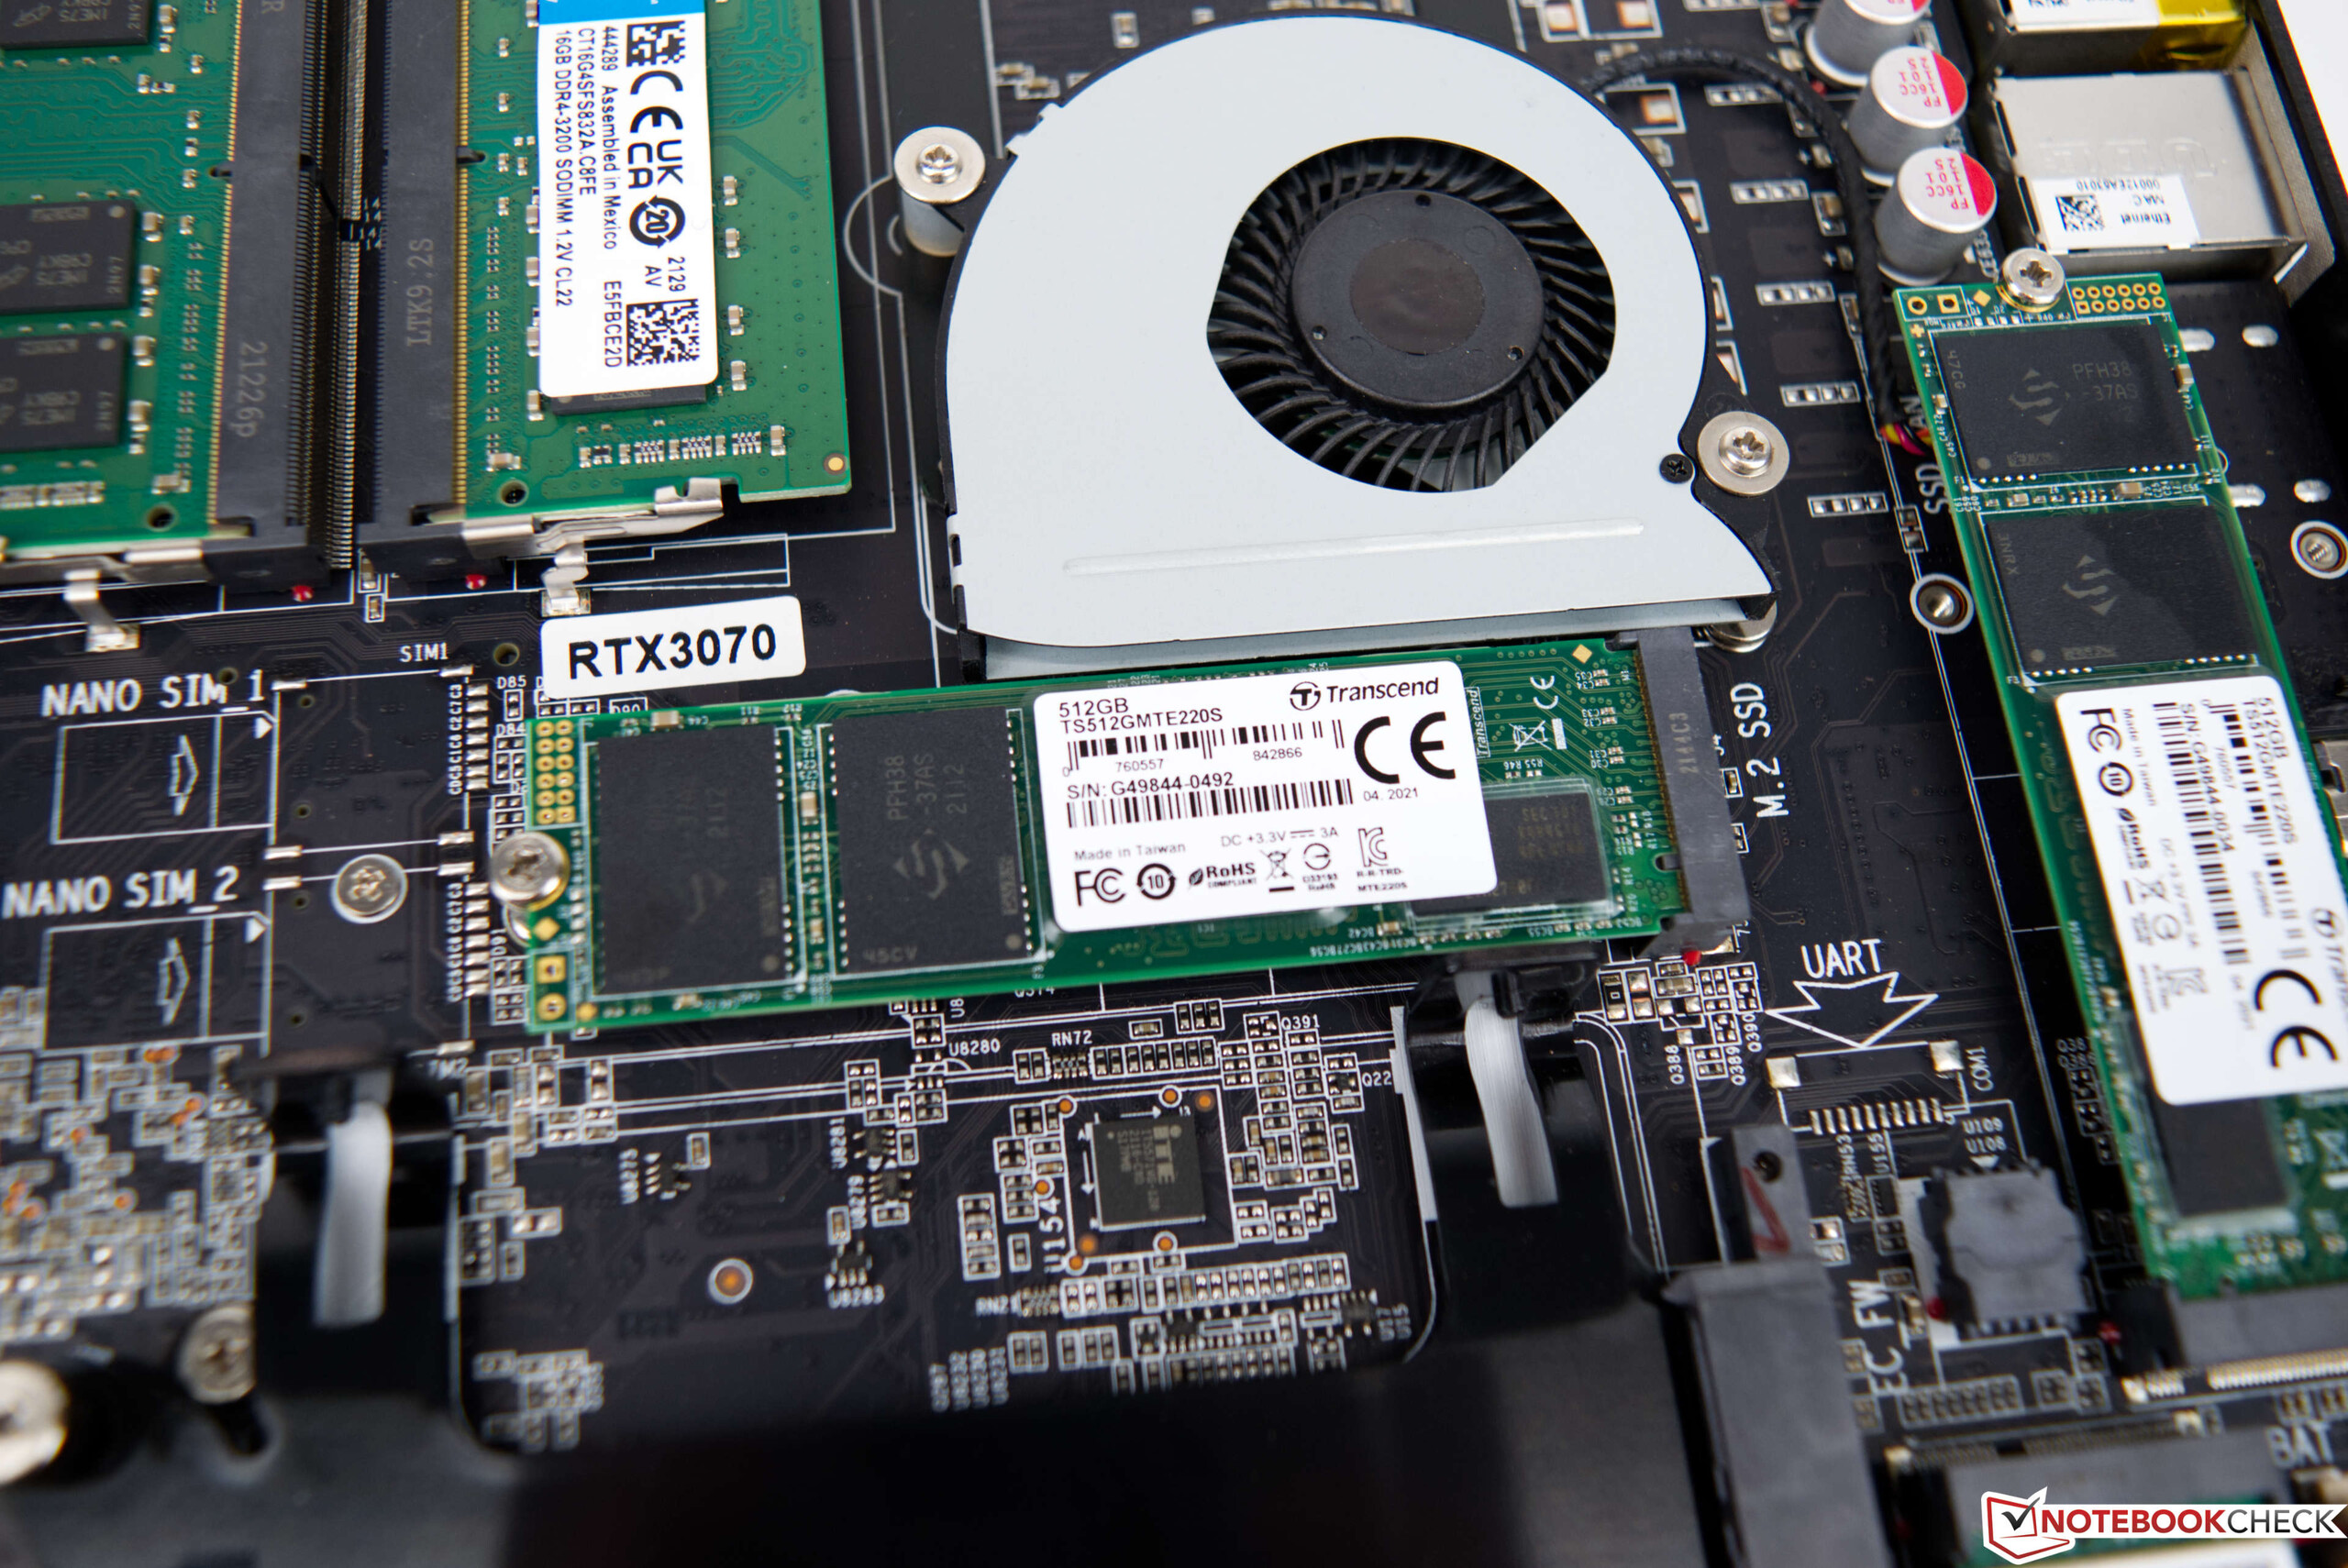
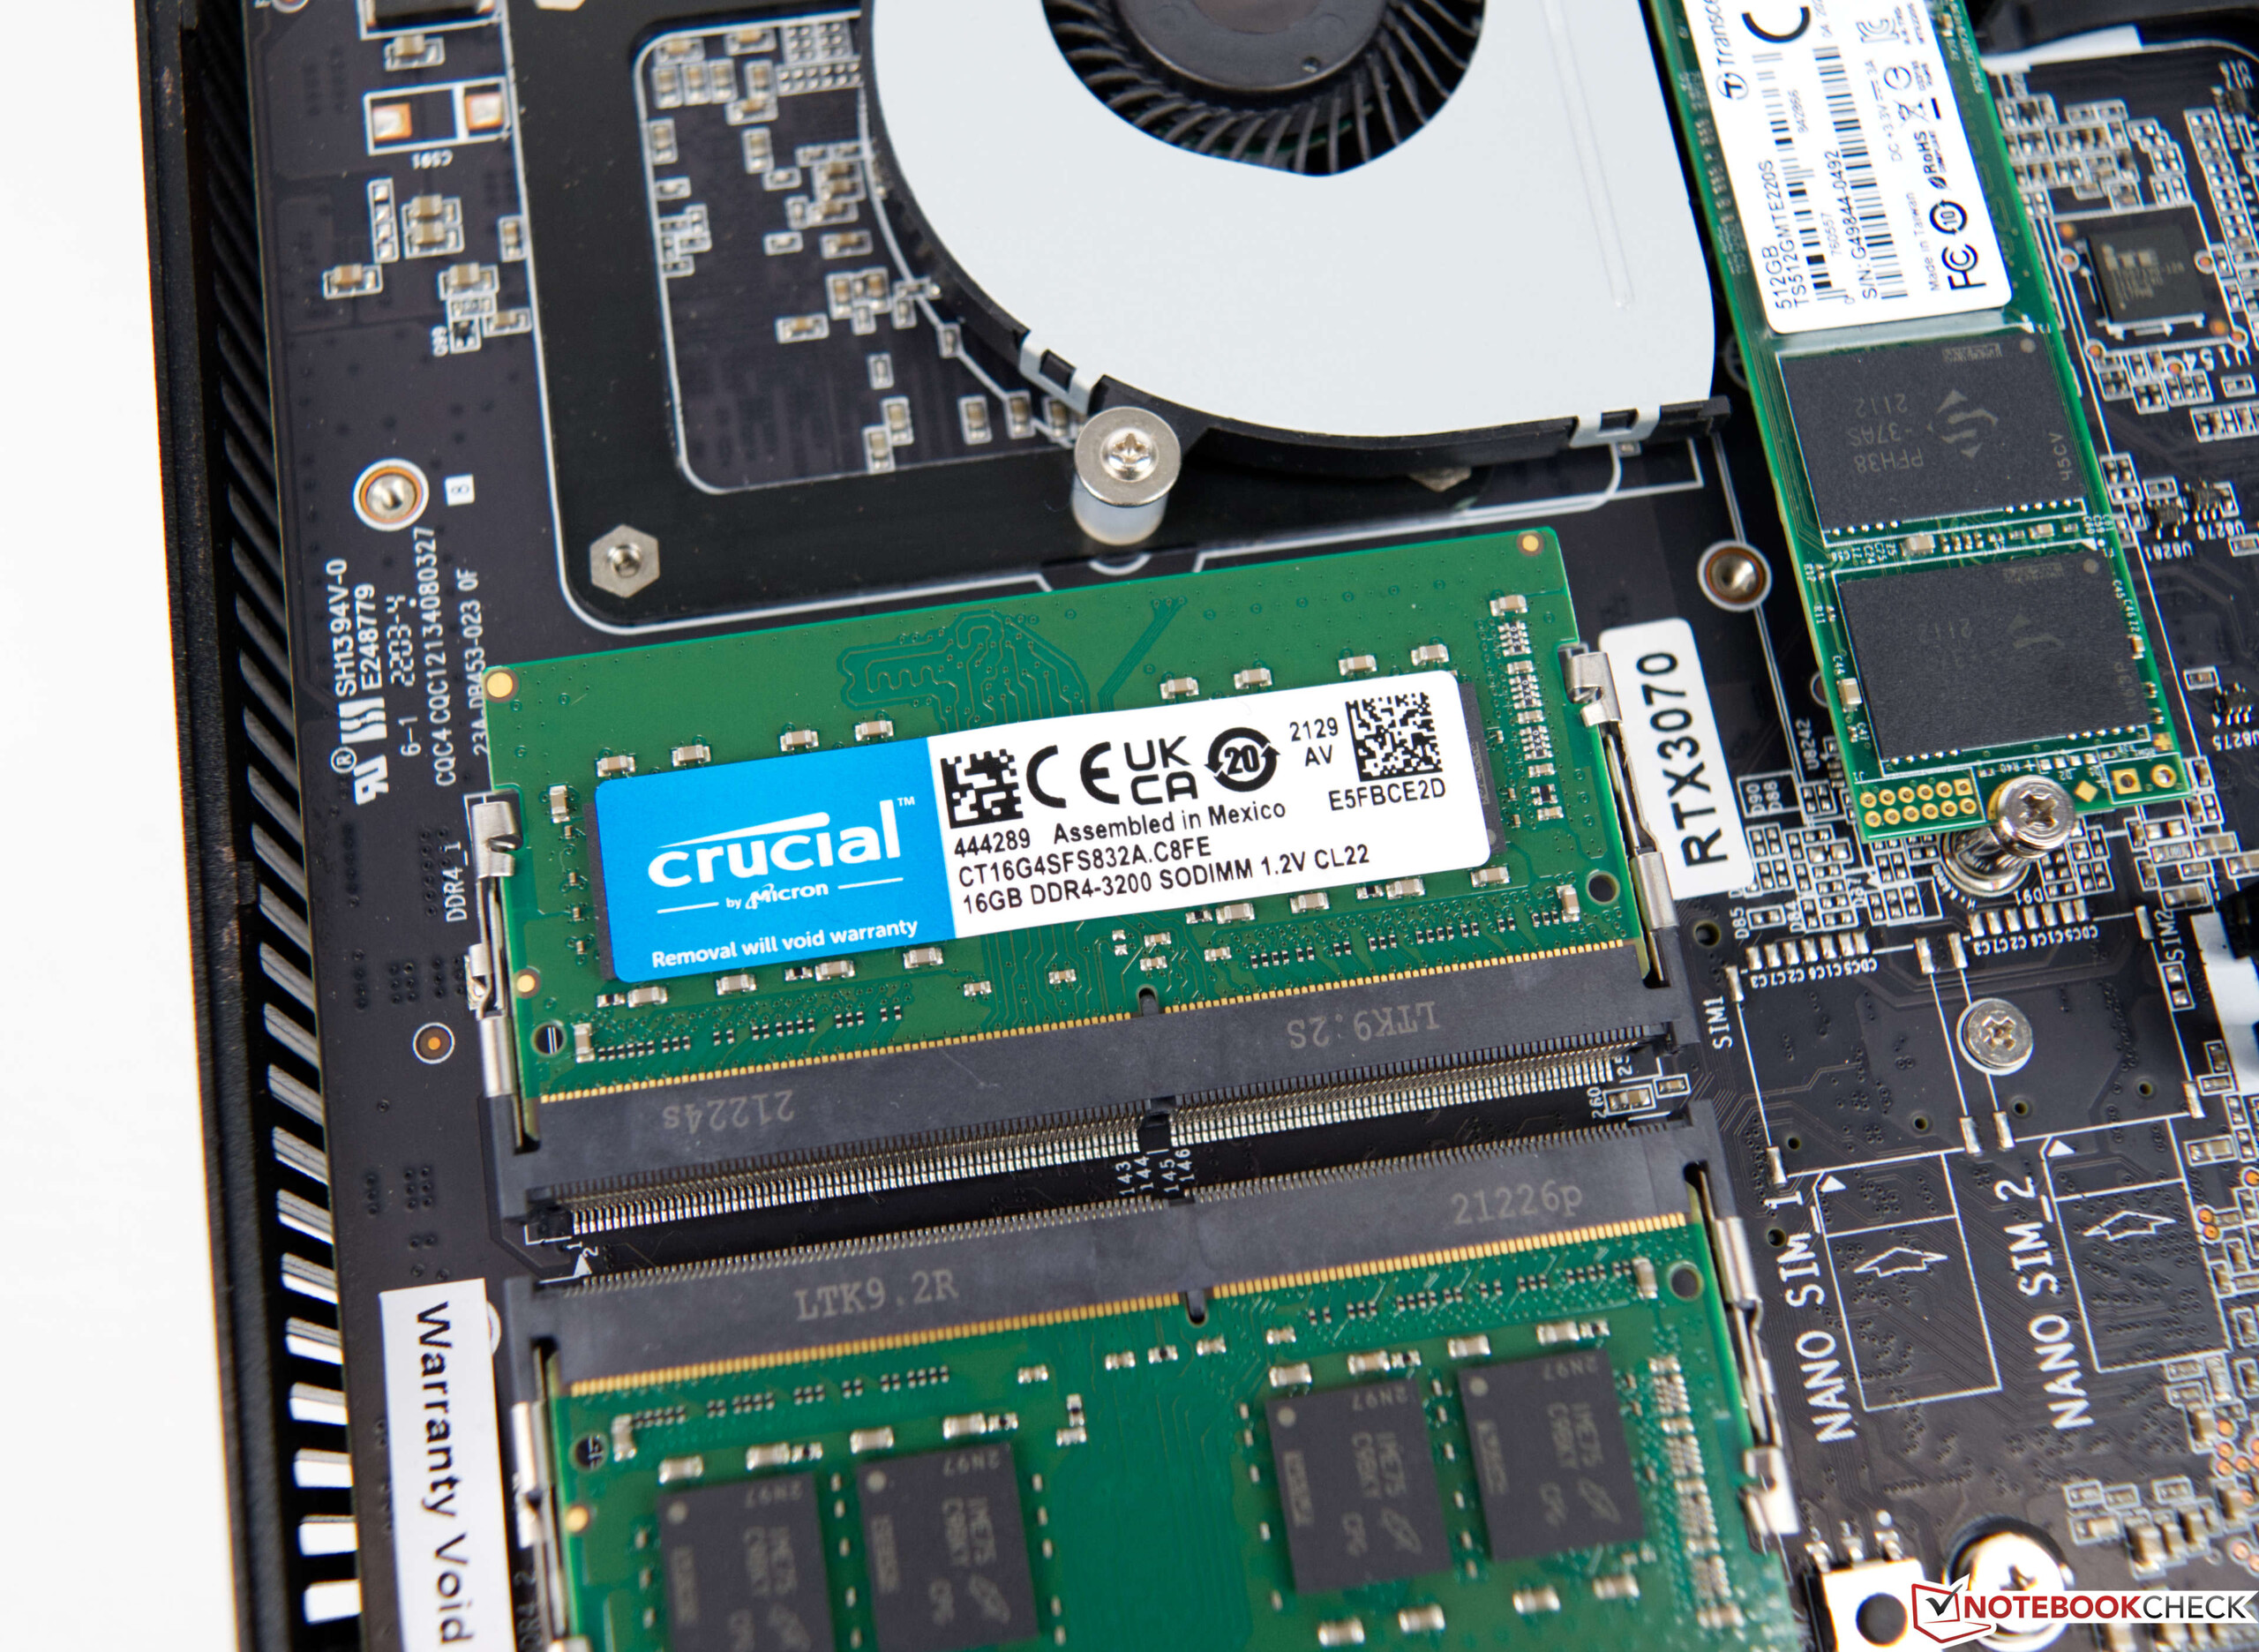
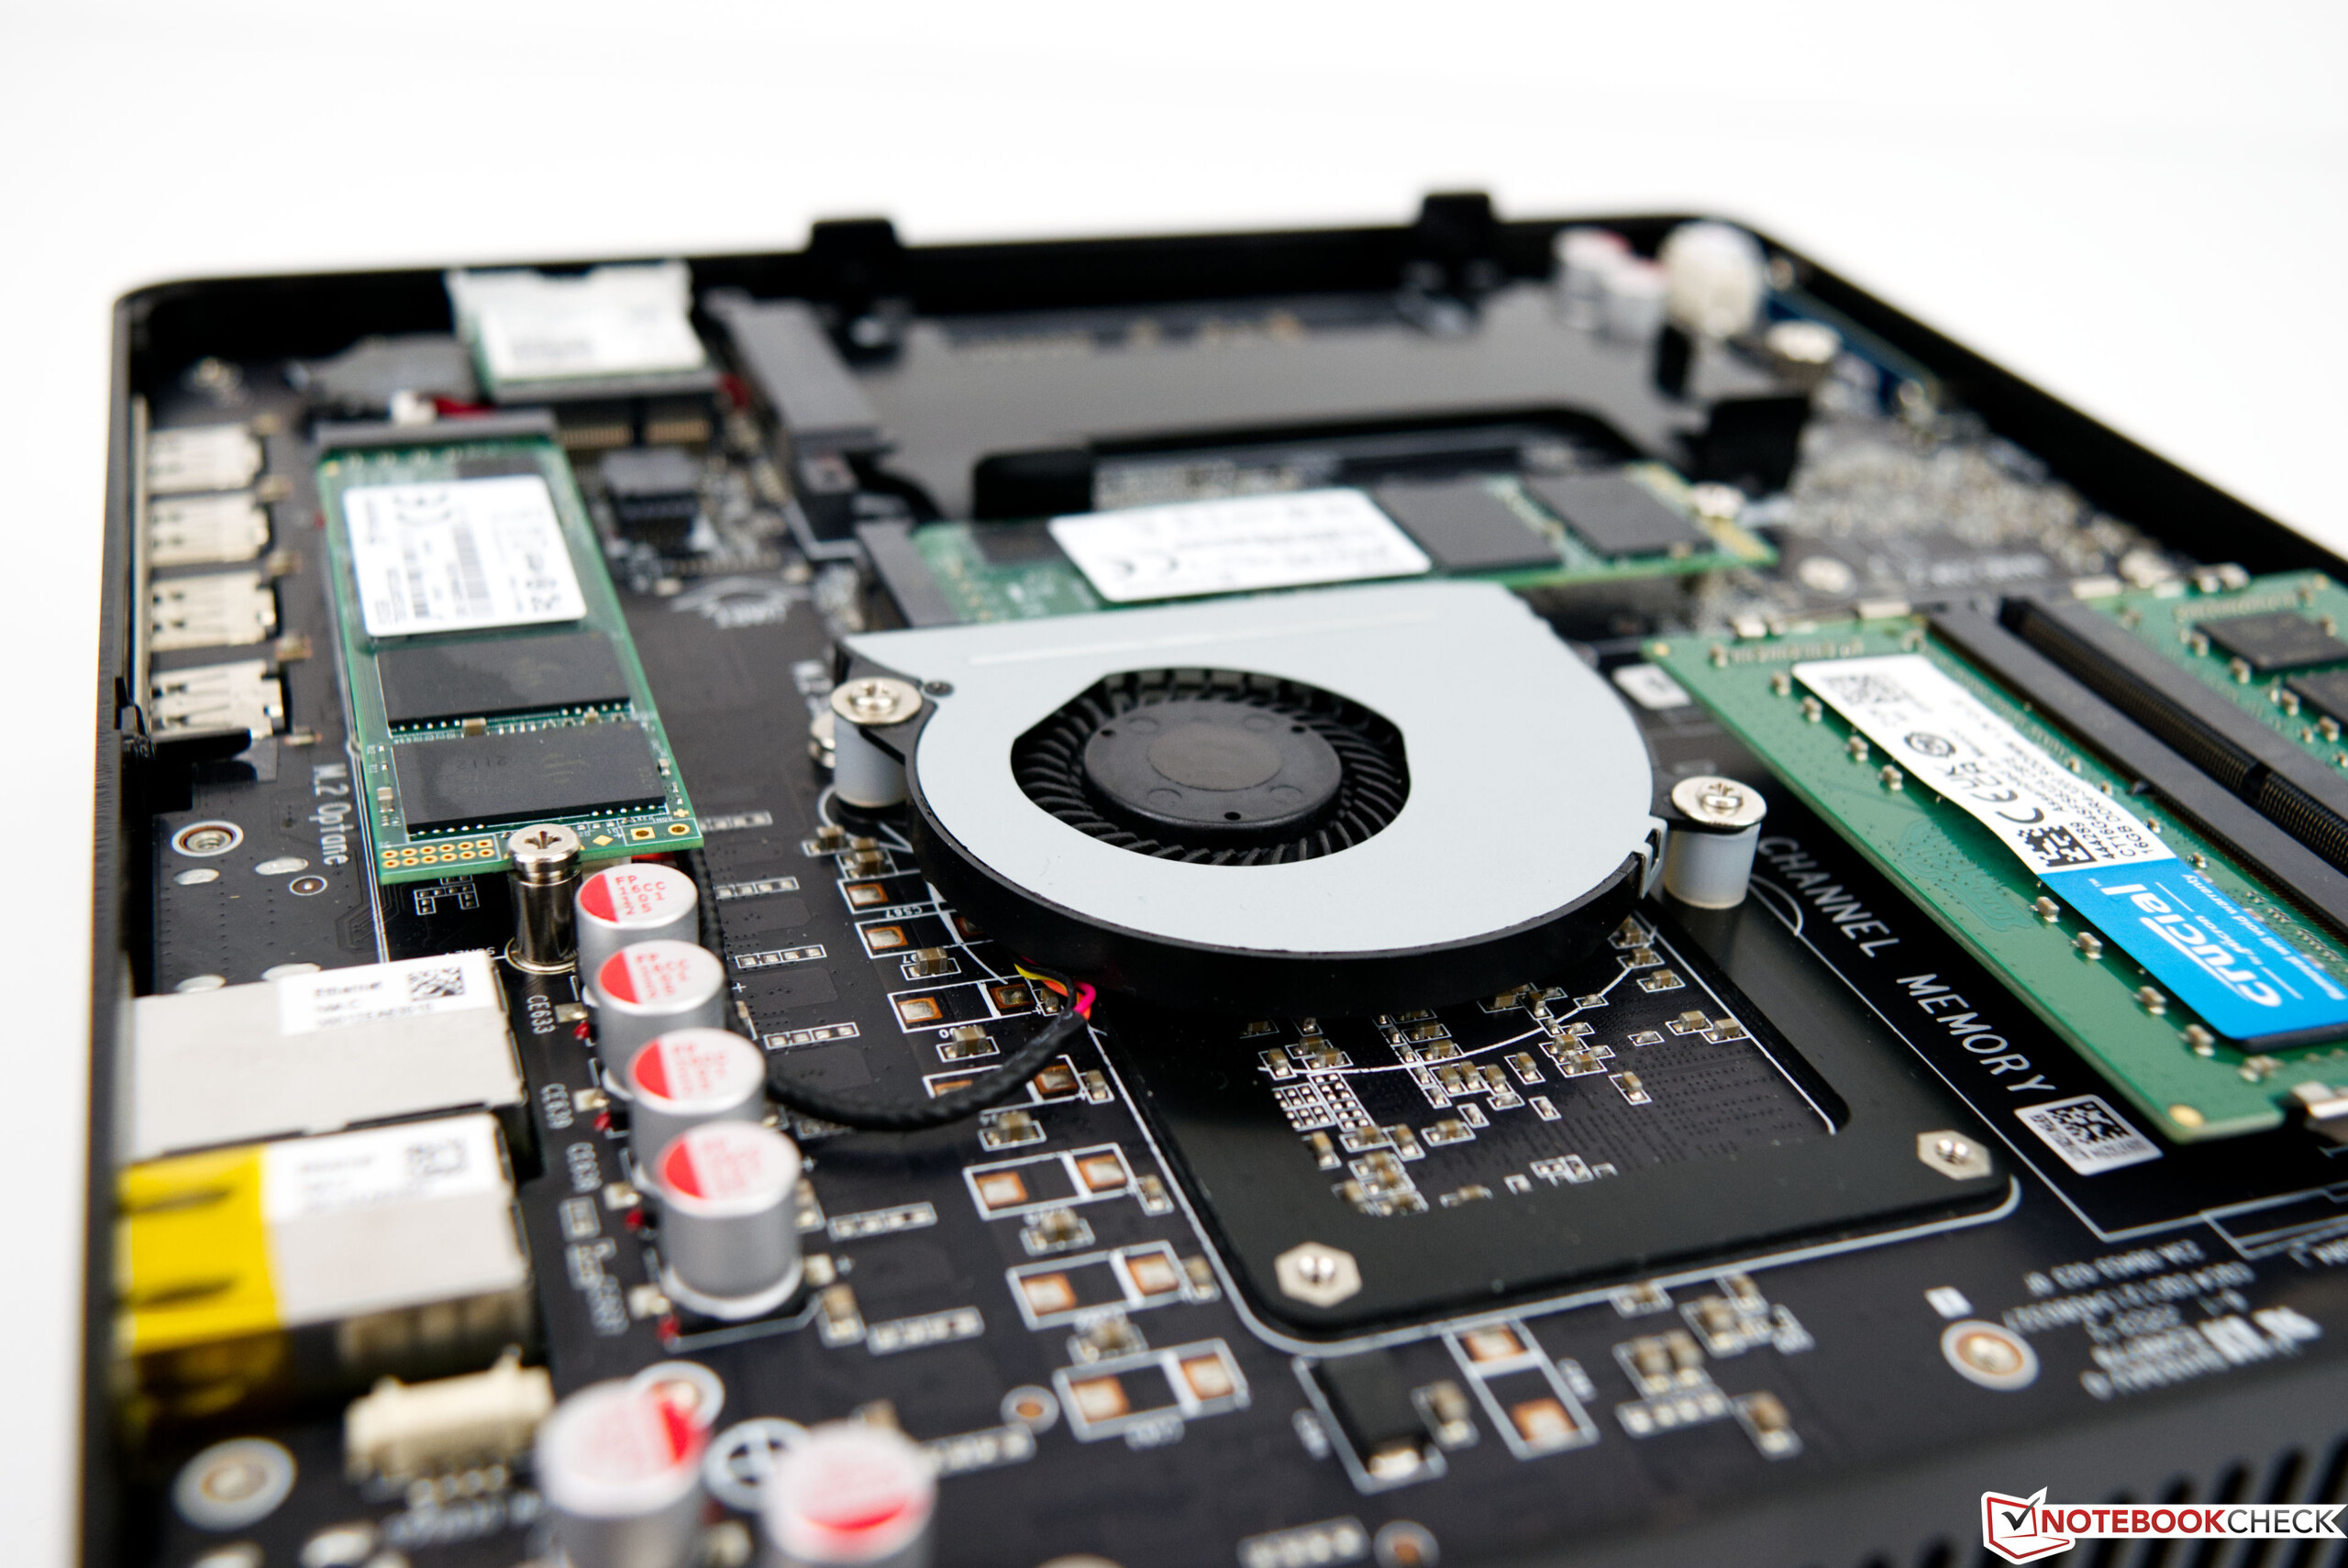
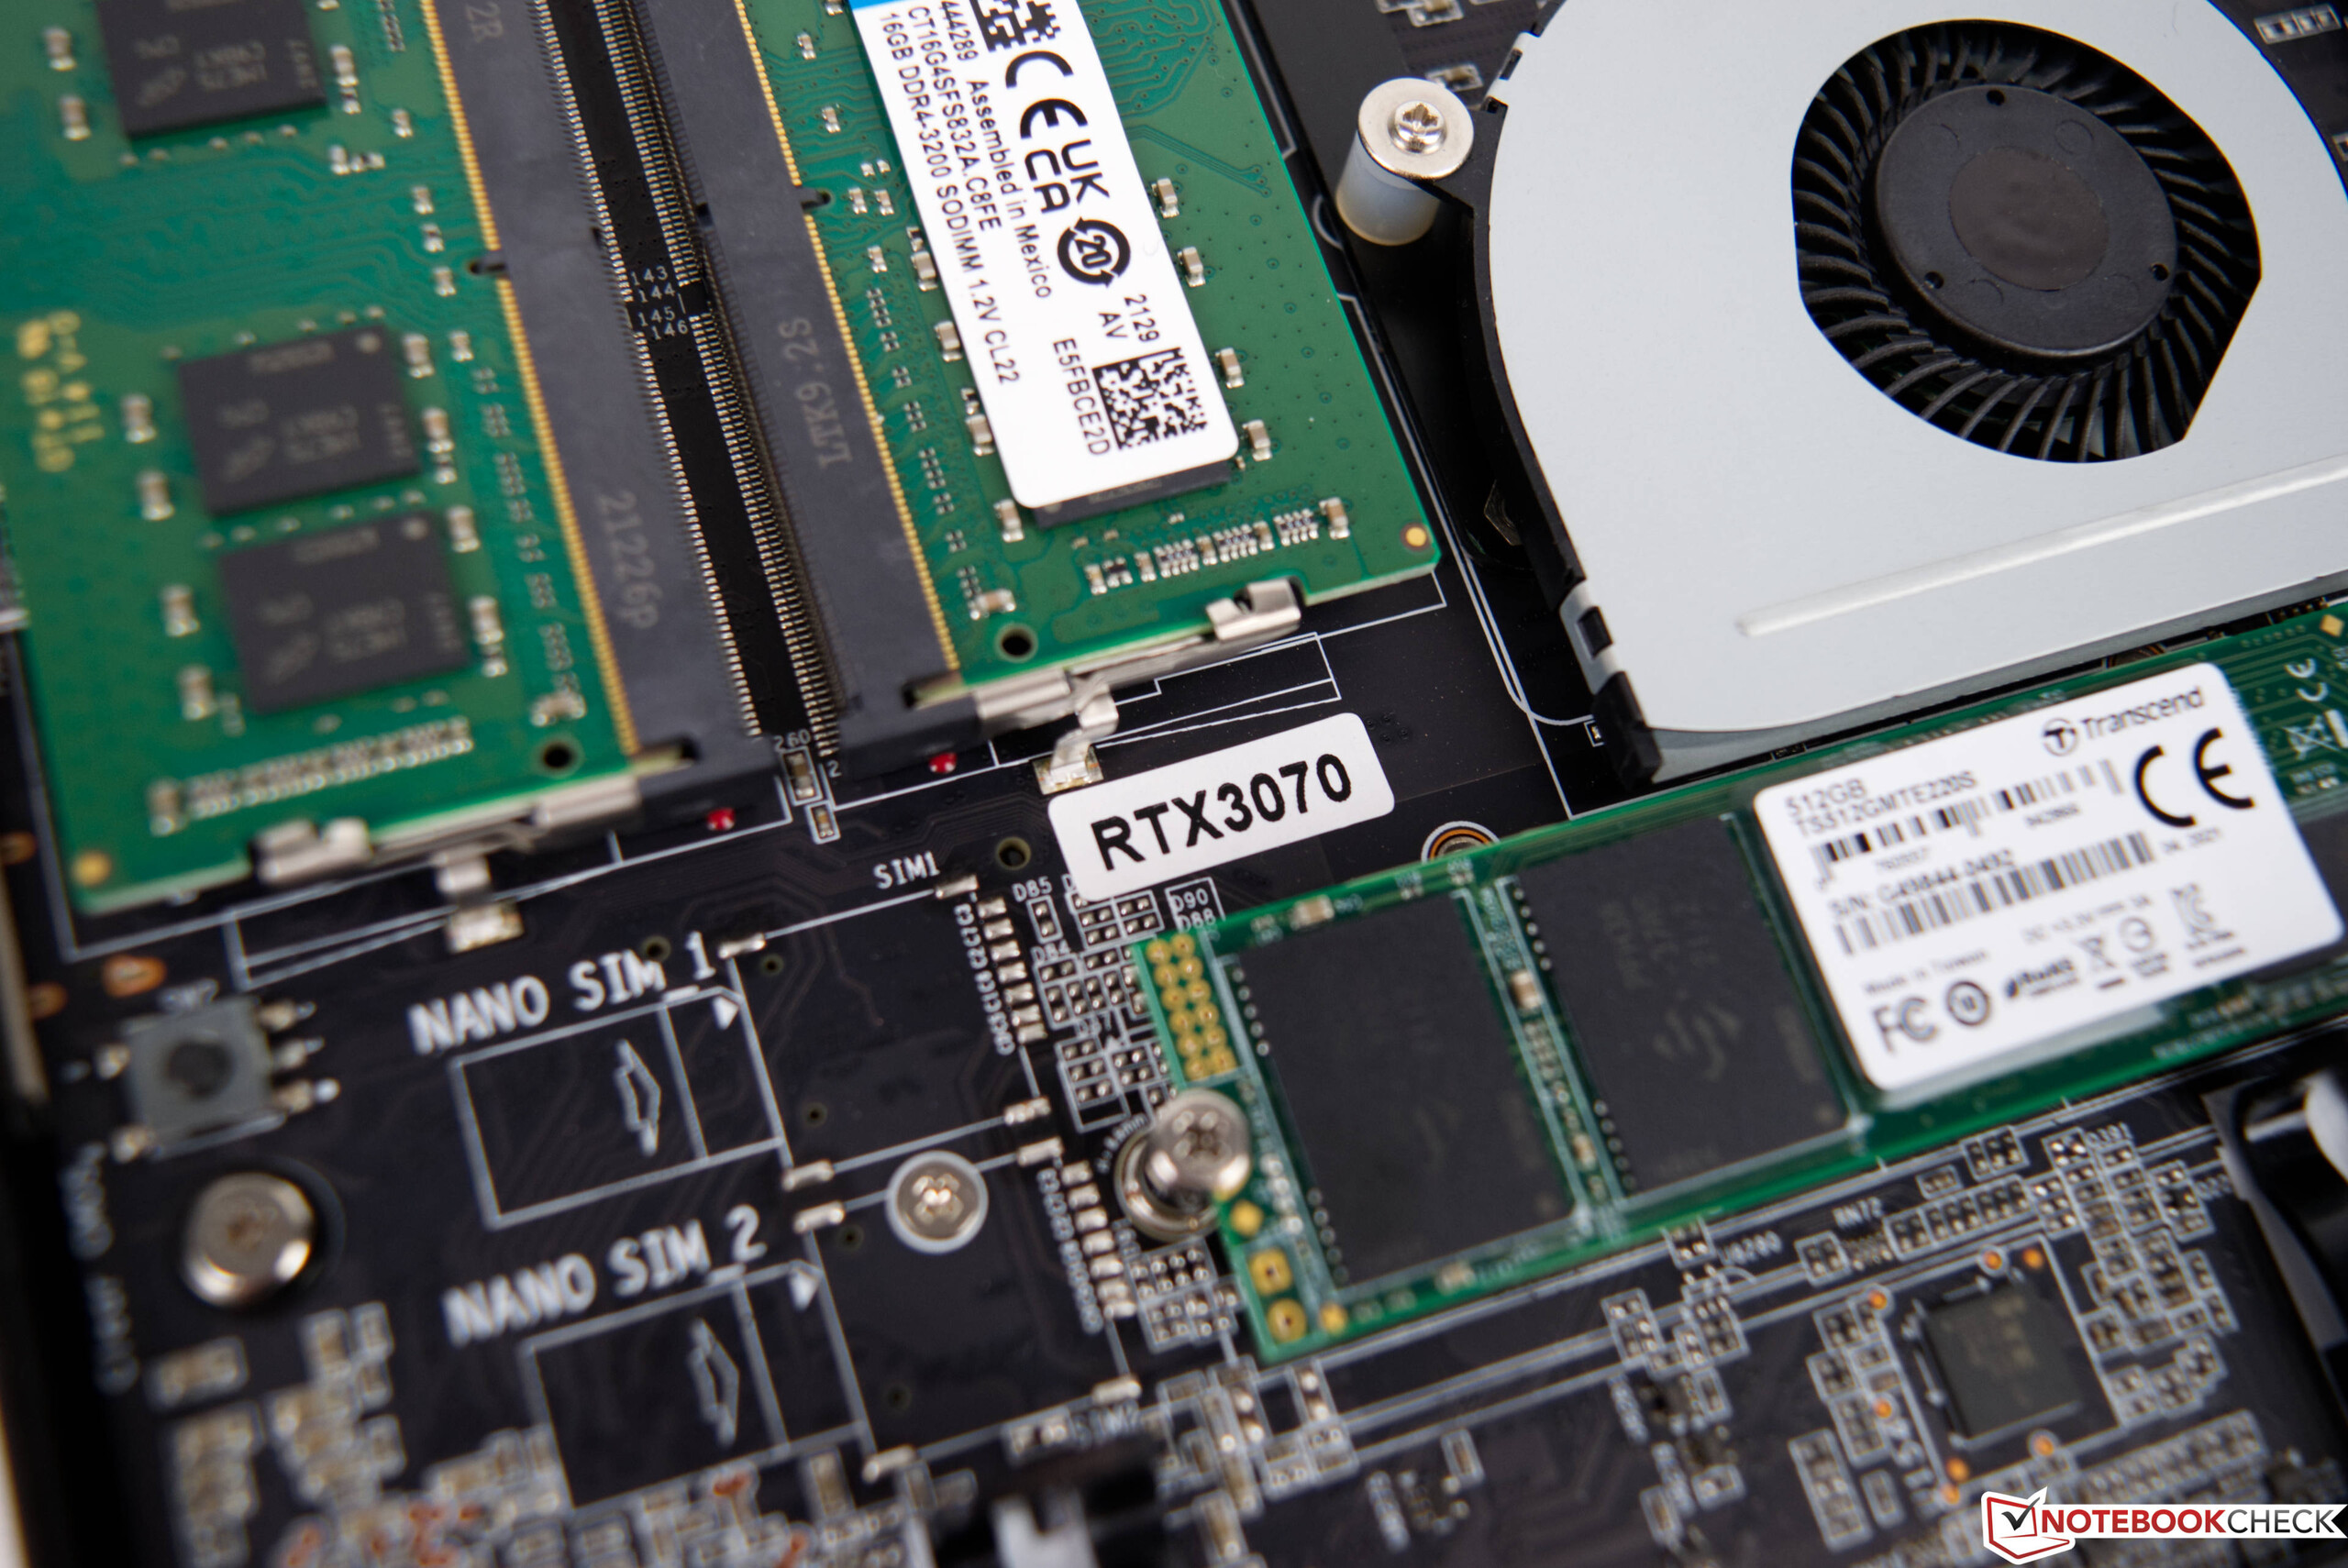
In de applicatie benchmarks zien we een duidelijke prestatieverhoging ten opzichte van de Zotac ZBOX Magus EN72080V. De nieuwere SoC en de aanzienlijk snellere grafische kaart zorgen samen voor het goede resultaat. Over het geheel genomen is de Zotac ZBOX Magnus EN173070C zelfs iets sneller dan de Intel Dragon Canyon NUC met zijn volwaardige desktop GPU en meer actuele Alder Lake CPU. In de rendertests weet de GeForce RTX 3070 Mobile de beslissende punten te behalen ten opzichte van de GeForce RTX 3060. Als je er subjectief naar kijkt, zijn de snelheden in het dagelijks gebruik erg goed. Of je nu op het internet surft, video's bekijkt of games speelt, de Zotac ZBOX Magnus EN173070C beheerst al deze taken zonder problemen. Voor deze review hebben we de mini PC uitgerust met 32 GB DDR4-RAM en twee 512-GB SSD's. De modellen van Transcend leveren een solide prestatie. Je kunt er echter nog een paar procentpunten uitpersen wat betreft de prestaties door nog snellere SSD's te gebruiken. In de behuizing passen maximaal drie opslagoplossingen. Naast de twee M.2-aansluitingen die niet alleen beperkt zijn tot 80 mm lengte, kun je ook een 2,5-inch schijf installeren.
| DPC Latencies / LatencyMon - interrupt to process latency (max), Web, Youtube, Prime95 | |
| Zotac ZBOX Magnus EN173070C, Intel Core i7-11800H | |
| Minisforum EliteMini HX90, AMD Ryzen 9 5900HX | |
* ... kleiner is beter
3D en spelprestaties
Voor een gaming PC is een snelle grafische kaart onontbeerlijk om vloeiende framerates te bereiken. In ons geval is er een snelle grafische kaart met 8 GB VRAM met de Nvidia GeForce RTX 3070 Mobile. Tegelijkertijd kun je dit niet echt vergelijken met de desktopversies van dezelfde nomenclatuur. In plaats daarvan is de mobiele versie van de GeForce RTX 3070bereikt een vergelijkbare prestatie als een Nvidia GeForce RTX 3060. De directe vergelijking met de Intel Beast Canyon NUC illustreert dit zeer goed.
In de TDP classificatie gaat Zotac er vol voor, door tot 125 watt onder belasting toe te staan. Hiermee worden de prestaties van de dedicated grafische kaart niet kunstmatig beperkt, zoals vaak het geval is bij compacte laptops. Dit leidt ook tot het bij vlagen goede resultaat in vergelijking met de gemiddelde prestaties van de grafische adapter. De games die we hebben getest kunnen zonder problemen worden gereproduceerd op maximale detailniveaus in FHD en QHD resolutie. Echter, wanneer de resolutie richting 4K gaat, kan het soms krap worden. Maar er zijn nog steeds veel games die ook in die hoge resolutie probleemloos kunnen worden gereproduceerd
U kunt meer vergelijkingen en benchmarks vinden in onze GPU-vergelijkingstabel.
| lage | gem. | hoge | ultra | QHD | 4K | |
|---|---|---|---|---|---|---|
| GTA V (2015) | 182.7 | 177.1 | 167.5 | 104.9 | 94.4 | 100.8 |
| The Witcher 3 (2015) | 435 | 331 | 190.1 | 105.5 | 70.7 | |
| Dota 2 Reborn (2015) | 164.4 | 148.3 | 142.9 | 133.9 | 127.7 | |
| Rise of the Tomb Raider (2016) | 302 | 216 | 141.9 | 116.2 | 55.4 | |
| Final Fantasy XV Benchmark (2018) | 190.1 | 139 | 101 | 75.3 | 43.5 | |
| X-Plane 11.11 (2018) | 136.6 | 121.2 | 95.7 | 82.3 | ||
| Far Cry 5 (2018) | 159 | 136 | 129 | 120 | 101 | 55 |
| Strange Brigade (2018) | 437 | 267 | 216 | 186.7 | 137.3 | 78.1 |
| Shadow of the Tomb Raider (2018) | 169.6 | 146.4 | 142.5 | 133.7 | 95.1 | 50.8 |
| Far Cry New Dawn (2019) | 134 | 116 | 112 | 100 | 91 | 57 |
| Metro Exodus (2019) | 177.1 | 123 | 94 | 74.6 | 58.7 | 36.6 |
| Control (2019) | 240 | 128 | 93.7 | 60.9 | 30.3 | |
| Borderlands 3 (2019) | 135.5 | 117.3 | 101 | 84.6 | 62.2 | 34.2 |
| F1 2020 (2020) | 315 | 267 | 238 | 165.8 | 123.6 | 68.3 |
| Dirt 5 (2020) | 227 | 153 | 123 | 96 | 75 | 49 |
| F1 2021 (2021) | 367 | 309 | 246 | 122.7 | 88.3 | 49.8 |
| Alan Wake Remastered (2021) | 119.2 | 118.2 | 118.2 | 113.1 | ||
| Far Cry 6 (2021) | 127.5 | 109.5 | 99 | 99.8 | 79.2 | 41 |
| Guardians of the Galaxy (2021) | 123 | 124 | 122 | 120 | 102 | 55 |
| Riders Republic (2021) | 174 | 144 | 118 | 107 | 77 | 40 |
| Forza Horizon 5 (2021) | 213 | 141 | 129 | 82 | 70 | 48 |
| Farming Simulator 22 (2021) | 205 | 161.1 | 138.8 | 132.8 | 124.8 | 79.2 |
| God of War (2022) | 122.2 | 109.4 | 88.1 | 61.7 | 50.7 | 33.8 |
| Rainbow Six Extraction (2022) | 241 | 182 | 181 | 149 | 97 | 49 |
| GRID Legends (2022) | 194 | 189 | 158 | 123 | 95 | 62 |
| Cyberpunk 2077 1.6 (2022) | 139 | 116 | 92 | 76 | 47 | 22 |
| Elex 2 (2022) | 98.4 | 95.1 | 87.3 | 79.5 | 61.8 | 34.5 |
Emissies
Geluidsemissies
Wanneer je een gaming laptop aanschaft, ben je je meestal wel bewust van het verhoogde geluidsniveau dat dit met zich meebrengt. Bij een desktop PC ligt dit echter vaak anders, aangezien grotere koelsystemen de warmte effectiever en stiller kunnen afvoeren. Maar omdat Zotac hier een zeer compacte behuizing gebruikt, moeten de ingebouwde ventilatoren behoorlijk hard werken onder belasting. De geluidsniveaus onder belasting doen ons denken aan een gemiddelde gaming laptop. Bij 45 dB(A) is het apparaat duidelijk hoorbaar. Onder lage belasting meten we nog 41 dB(A). In 2D-bedrijf dwarrelen de ventilatoren rustig mee en zijn ze nauwelijks waarneembaar.
Geluidsniveau
| Onbelast |
| 32.7 / 32.8 / 32.8 dB (A) |
| Belasting |
| 41.7 / 45.4 dB (A) |
 | ||
30 dB stil 40 dB(A) hoorbaar 50 dB(A) luid |
||
min: | ||
| Zotac ZBOX Magnus EN173070C GeForce RTX 3070 Laptop GPU, i7-11800H, Transcend M.2 SSD 2200S TS512GMTE220S | Zotac Magnus One (ECM73070C) GeForce RTX 3070, i7-10700, Phison 512GB PA6620060U | Minisforum EliteMini HX90 Vega 8, R9 5900HX, Kingston OM8PCP3512F-AB | |
|---|---|---|---|
| Noise | -4% | 10% | |
| uit / omgeving * (dB) | 30.7 | 30 2% | 30.8 -0% |
| Idle Minimum * (dB) | 32.7 | 33.58 -3% | |
| Idle Average * (dB) | 32.8 | 31.6 4% | |
| Idle Maximum * (dB) | 32.8 | ||
| Load Average * (dB) | 41.7 | 44.25 -6% | |
| Load Maximum * (dB) | 45.4 | 48.72 -7% | 33.4 26% |
* ... kleiner is beter
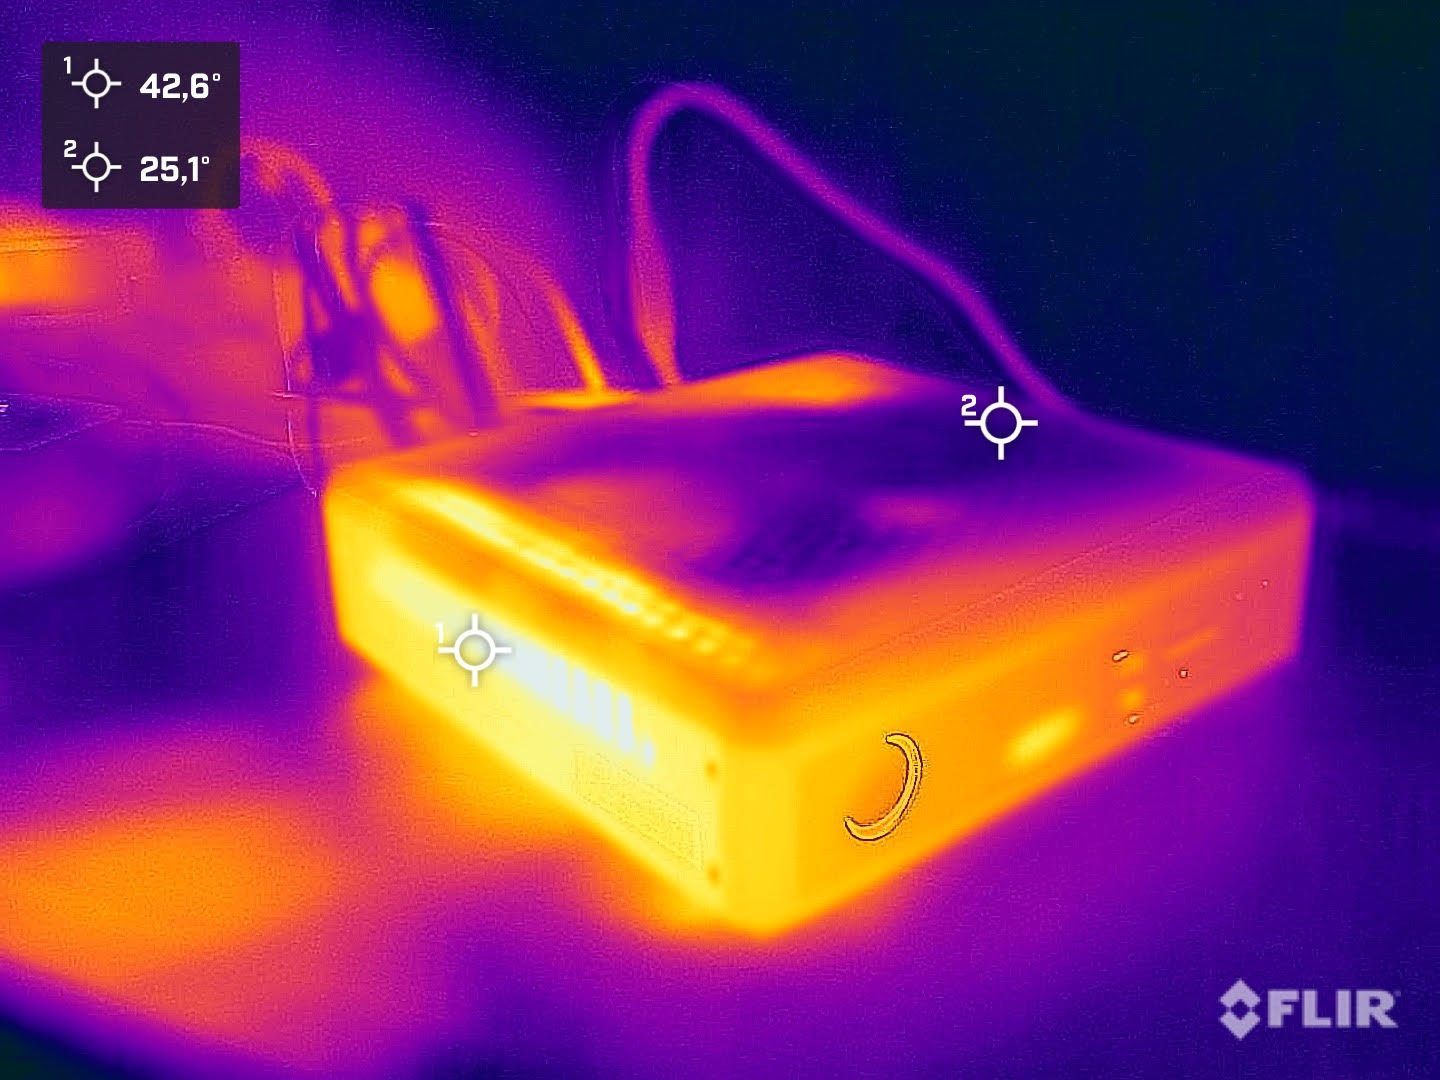
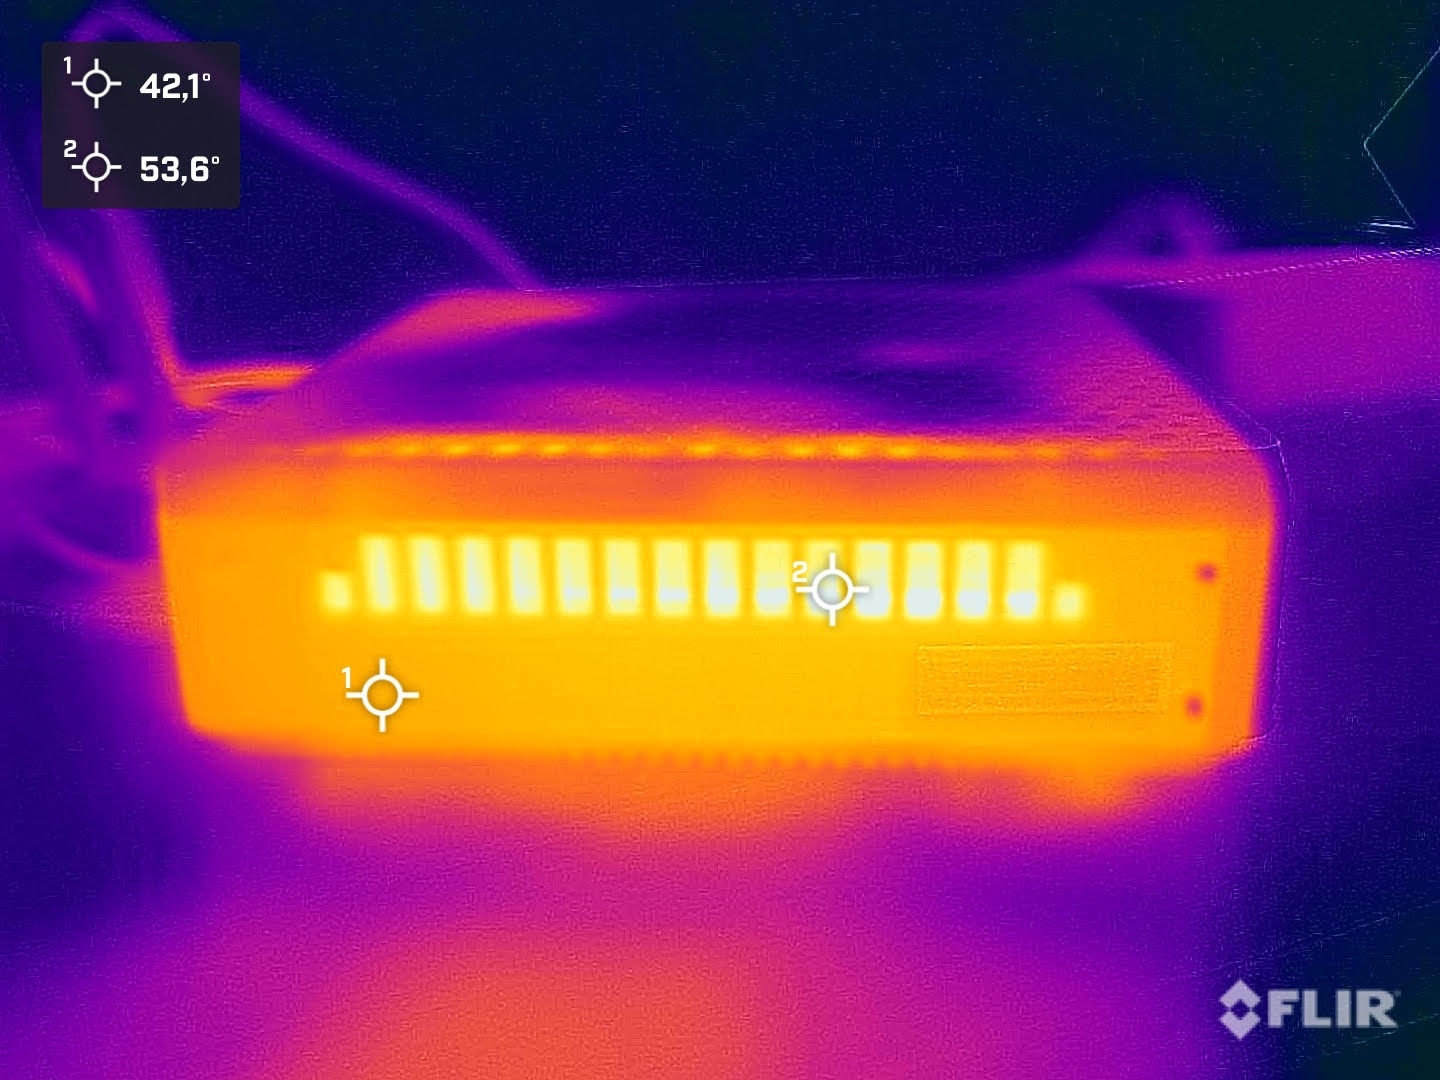
Temperaturen
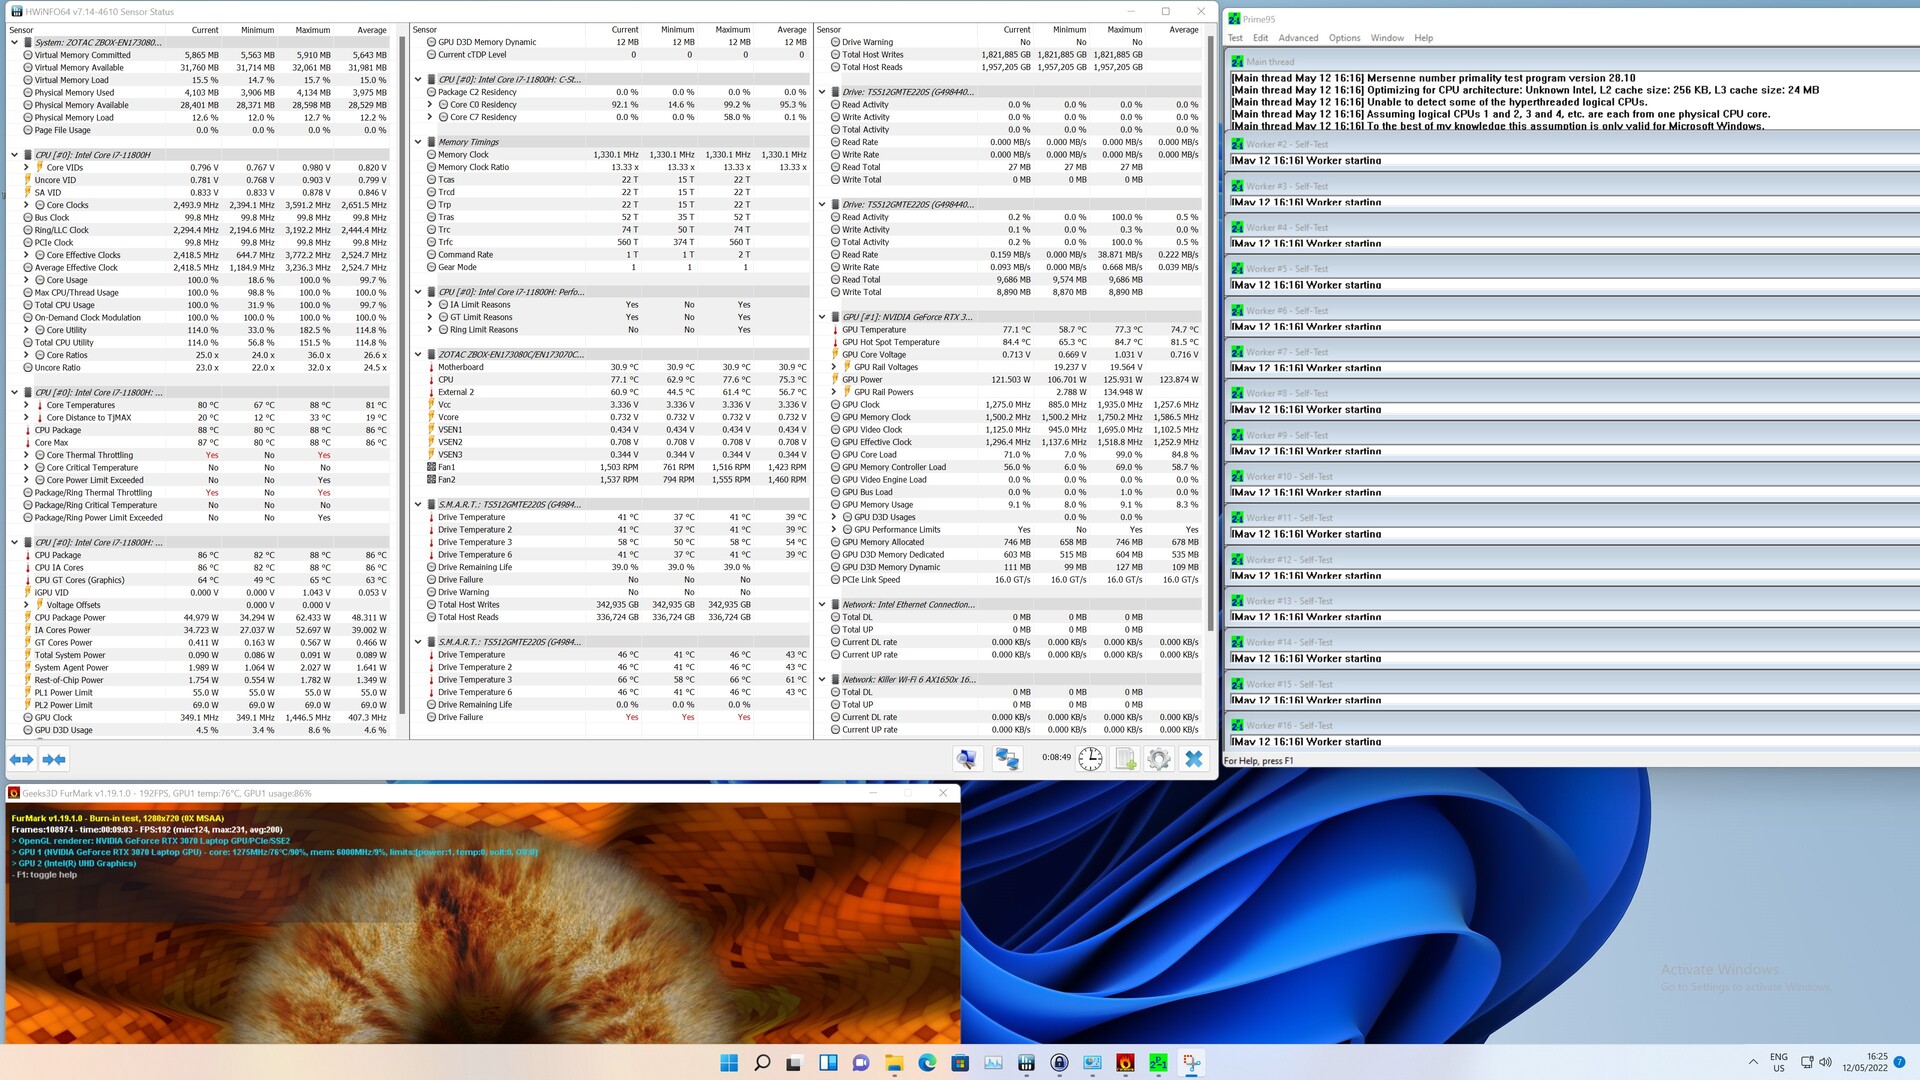
Tijdens de stresstest hebben we het systeem het zwaarst belast met Prime95 en FurMark. Tijdens dit slechtst denkbare scenario, heeft de Intel Core i7-11800Heen maximale temperatuur van 88 °C (190 °F). In de grafische kaart meten we een iets lagere waarde van 77 °C (171 °F). De kloksnelheid van de CPU is 2,6 GHz, wat hoger is dan de basiskloksnelheid van 2,3 GHz. De constante belasting van alle componenten heeft geen negatief effect, en een 3D benchmark direct daarna levert een identiek resultaat op vergeleken met de koude start.
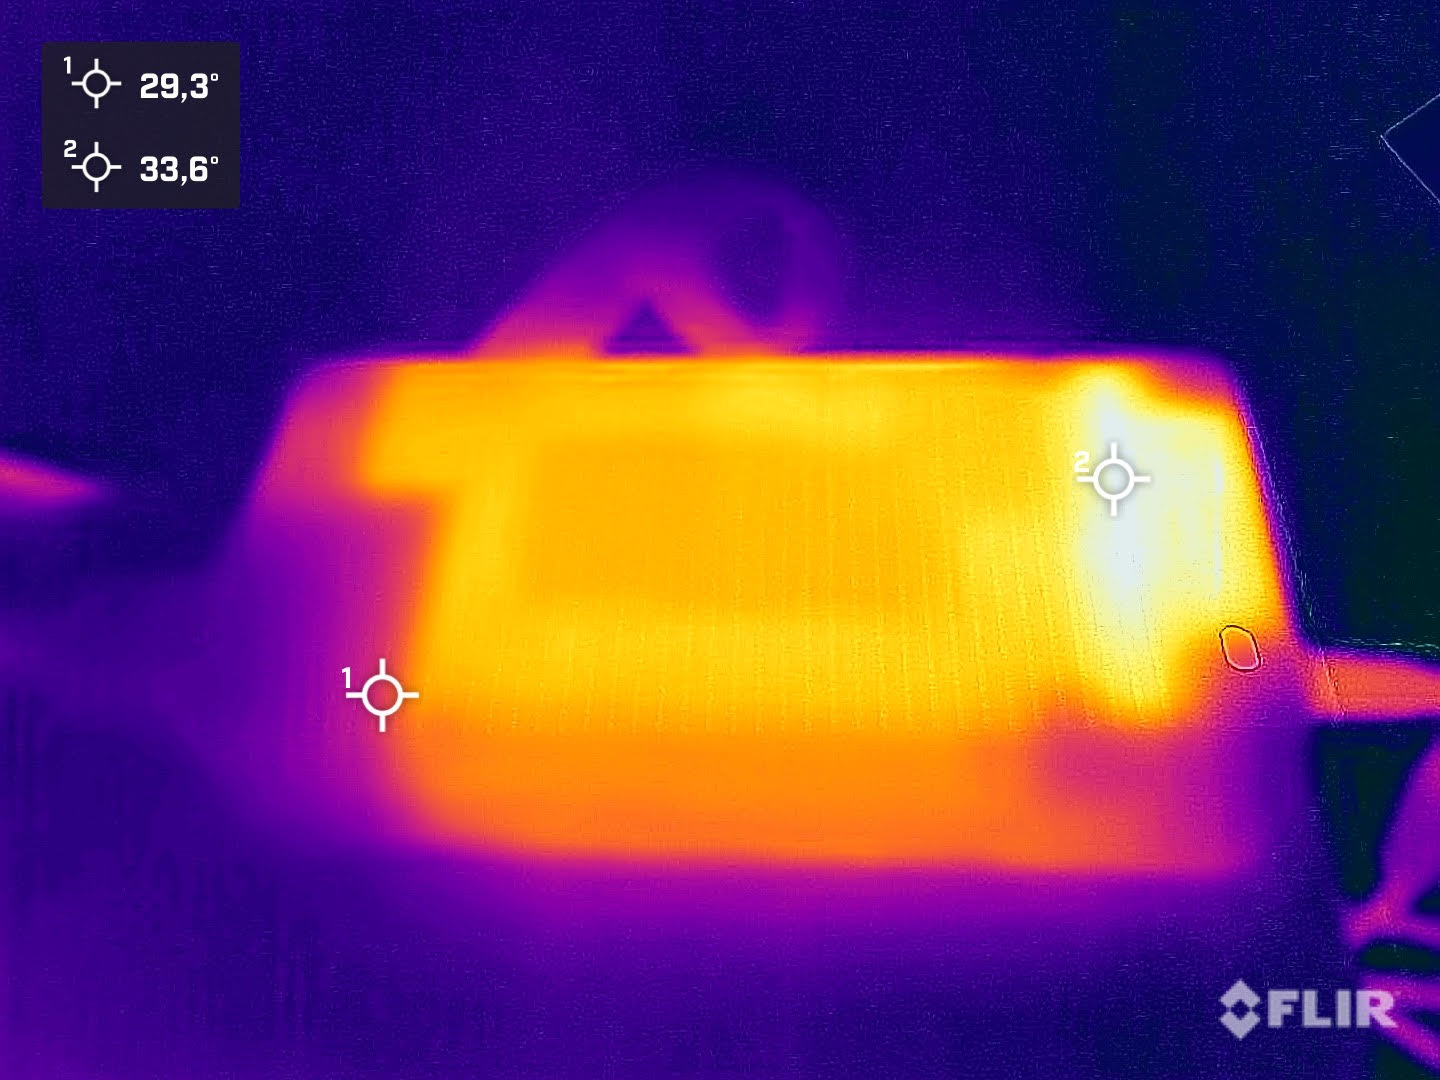
Stroomverbruik
Tijdens inactieve werking ligt het stroomverbruik van de Zotac ZBOX Magnus EN173070C tussen de 31 en 41 watt. Voor een desktop systeem zijn dit zeer goede waarden. In vergelijking met vergelijkbaar uitgeruste laptops zijn deze waarden echter veel te hoog. Onder belasting hebben we gemiddeld 214 watt gemeten. Tegelijkertijd is de forse voeding in staat om het piekverbruik van slechts 231 watt dat we hebben gemeten gemakkelijk aan te kunnen.
| Inactief | |
| Belasting |
|
Key:
min: | |
Power Consumption With External Monitor
Pro
Contra
Verdict - Een ultracompacte gaming PC
Met de ZBOX Magnus EN173070C biedt Zotac een goede productupgrade. De snelleIntel Core i7-11800Hbiedt een zeer goede werksnelheid, en de Nvidia GeForce RTX 3070 Mobileis op dezelfde manier in staat om goede prestaties te leveren zonder kunstmatig te worden gesmoord. De volledige 125 watt is hier beschikbaar, wat betekent dat zelfs de Nvidia GeForce RTX 3080 Mobile vaak wordt overtroffen. We moeten echter nog steeds overwegen dat de prestatieniveaus in het bereik liggen van eenNvidia GeForce RTX 3060 DesktopgPU. Maar gezien de compactheid van de slechts 2,65-Liter behuizing, is het verbazingwekkend wat Zotac hier met zijn ZBOXen kan bieden.
Dat alles heeft natuurlijk ook zijn prijs. Vergeleken met betaalbare gaming laptops zoals de Acer Nitro5 AN515, ligt de prijs op een vergelijkbaar niveau. Soms moet je zelfs meer betalen, aangezien een SSD en het RAM niet bij de basisuitrusting zijn inbegrepen. Met 1650 euro (~$1743) vraagt Zotac een forse prijs. Aan de andere kant krijg je ook een ultracompacte gaming PC die je net zo makkelijk kunt opbergen of meenemen als een laptop.
De gaming prestaties konden ons overtuigen, en de verscheidenheid aan aansluitingen is ook voldoende. Tegelijkertijd moet je er ook rekening mee houden dat je alleen gegevens kunt overdragen via Thunderbolt 4, maar het niet kunt gebruiken om een externe grafische kaart te laten draaien. Dit is jammer naar onze mening, aangezien je anders de 3D prestaties zou kunnen verhogen zonder een volledig nieuw apparaat te moeten kopen.
De Zotac ZBOX Magnus EN173070C is een zeer snelle gaming PC gebaseerd op mobiele componenten. Voordat je hem aanschaft, moet je echter wel bekend zijn met de kenmerken van een barebone systeem.
Wat betreft het geluidsniveau verliest de Zotac ZBOX Magnus EN173070C ten opzichte van conventionele desktop PC's. Onder belasting moeten de ventilatoren flink toeren maken, maar het ventilatorgeluid is nog steeds relatief comfortabel en niet te hoog. Een alternatief wordt geboden door Intel met de Dragon Canyon NUC, wat ook een barebone systeem is, net als de ZBOX Magnus EN173070C. Hoewel het apparaat niet zo compact is, kan het ook worden uitgerust met conventionele desktop grafische kaarten. Zoals gewoonlijk heeft de klant de keuze en moet hij beslissen welke parameters het belangrijkst zijn bij zijn aankoop.
Prijs en beschikbaarheid
Hoewel de Zotac ZBOX Magnus EN173070C wordt vermeld op de Zotac US siteen op vele andere van hun land-specifieke sites, lijkt hij moeilijk te vinden voor aankoop in de VS. Het model dat het meest voorkomt in de VS lijkt deZOTAC Magnus ONE ECM7307LH Mini PCte zijn, die een andere behuizing gebruikt en al RAM, SSD en HDD bevat voor $2130 bij Amazon.

