Kort testrapport: Zotac ZBOX Magnus mini-PC met GeForce RTX 2080
| Cinebench R15 | |
| CPU Single 64Bit | |
| Intel Core i9-10900K, NVIDIA Titan RTX | |
| Intel Core i9-9980HK, NVIDIA GeForce RTX 2070 (Desktop) | |
| Intel Core i5-10600K, NVIDIA Titan RTX | |
| Gemiddeld Intel Core i9-9980HK (181 - 215, n=13) | |
| Intel Core i7-9750H, NVIDIA GeForce RTX 2080 Mobile | |
| Gemiddeld Intel Core i7-9750H (170 - 194, n=82) | |
| Intel Core i5-9400F, NVIDIA Titan RTX | |
| Gemiddeld Intel Core i5-9300H (169 - 176, n=11) | |
| CPU Multi 64Bit | |
| Intel Core i9-10900K, NVIDIA Titan RTX | |
| Gemiddeld Intel Core i9-9980HK (1327 - 1930, n=14) | |
| Intel Core i9-9980HK, NVIDIA GeForce RTX 2070 (Desktop) | |
| Intel Core i5-10600K, NVIDIA Titan RTX | |
| Gemiddeld Intel Core i7-9750H (952 - 1306, n=85) | |
| Intel Core i7-9750H, NVIDIA GeForce RTX 2080 Mobile | |
| Intel Core i5-9400F, NVIDIA Titan RTX | |
| Gemiddeld Intel Core i5-9300H (717 - 850, n=11) | |
| Cinebench R20 | |
| CPU (Single Core) | |
| Intel Core i9-10900K, NVIDIA Titan RTX | |
| Intel Core i9-9980HK, NVIDIA GeForce RTX 2070 (Desktop) | |
| Intel Core i7-9750H, NVIDIA GeForce RTX 2080 Mobile | |
| Gemiddeld Intel Core i9-9980HK (431 - 505, n=10) | |
| Intel Core i5-10600K, NVIDIA Titan RTX | |
| Gemiddeld Intel Core i7-9750H (416 - 486, n=55) | |
| Intel Core i5-9400F, NVIDIA Titan RTX | |
| Gemiddeld Intel Core i5-9300H (398 - 427, n=9) | |
| CPU (Multi Core) | |
| Intel Core i9-10900K, NVIDIA Titan RTX | |
| Gemiddeld Intel Core i9-9980HK (2974 - 4150, n=10) | |
| Intel Core i5-10600K, NVIDIA Titan RTX | |
| Intel Core i9-9980HK, NVIDIA GeForce RTX 2070 (Desktop) | |
| Intel Core i7-9750H, NVIDIA GeForce RTX 2080 Mobile | |
| Gemiddeld Intel Core i7-9750H (2017 - 3133, n=55) | |
| Intel Core i5-9400F, NVIDIA Titan RTX | |
| Gemiddeld Intel Core i5-9300H (1530 - 1877, n=9) | |
| Cinebench R11.5 | |
| CPU Single 64Bit | |
| Intel Core i9-10900K, NVIDIA Titan RTX | |
| Intel Core i9-9980HK, NVIDIA GeForce RTX 2070 (Desktop) | |
| Gemiddeld Intel Core i9-9980HK (2.25 - 2.4, n=3) | |
| Intel Core i5-10600K, NVIDIA Titan RTX | |
| Intel Core i7-9750H, NVIDIA GeForce RTX 2080 Mobile | |
| Gemiddeld Intel Core i7-9750H (1.96 - 2.19, n=10) | |
| Intel Core i5-9400F, NVIDIA Titan RTX | |
| CPU Multi 64Bit | |
| Intel Core i9-10900K, NVIDIA Titan RTX | |
| Intel Core i9-9980HK, NVIDIA GeForce RTX 2070 (Desktop) | |
| Gemiddeld Intel Core i9-9980HK (14.8 - 18, n=3) | |
| Intel Core i5-10600K, NVIDIA Titan RTX | |
| Gemiddeld Intel Core i7-9750H (11.3 - 14.1, n=10) | |
| Intel Core i7-9750H, NVIDIA GeForce RTX 2080 Mobile | |
| Intel Core i5-9400F, NVIDIA Titan RTX | |
| Cinebench R10 | |
| Rendering Single CPUs 64Bit | |
| Intel Core i9-10900K, NVIDIA Titan RTX | |
| Intel Core i9-9980HK, NVIDIA GeForce RTX 2070 (Desktop) | |
| Gemiddeld Intel Core i9-9980HK (n=1) | |
| Intel Core i5-10600K, NVIDIA Titan RTX | |
| Intel Core i7-9750H, NVIDIA GeForce RTX 2080 Mobile | |
| Gemiddeld Intel Core i7-9750H (9069 - 9346, n=3) | |
| Intel Core i5-9400F, NVIDIA Titan RTX | |
| Rendering Multiple CPUs 64Bit | |
| Intel Core i9-10900K, NVIDIA Titan RTX | |
| Intel Core i9-9980HK, NVIDIA GeForce RTX 2070 (Desktop) | |
| Gemiddeld Intel Core i9-9980HK (n=1) | |
| Intel Core i5-10600K, NVIDIA Titan RTX | |
| Intel Core i7-9750H, NVIDIA GeForce RTX 2080 Mobile | |
| Gemiddeld Intel Core i7-9750H (37188 - 44238, n=3) | |
| Intel Core i5-9400F, NVIDIA Titan RTX | |
| Blender - v2.79 BMW27 CPU | |
| Gemiddeld Intel Core i5-9300H (588 - 643, n=3) | |
| Intel Core i5-9400F, NVIDIA Titan RTX | |
| Gemiddeld Intel Core i7-9750H (342 - 495, n=21) | |
| Intel Core i7-9750H, NVIDIA GeForce RTX 2080 Mobile | |
| Gemiddeld Intel Core i9-9980HK (317 - 527, n=3) | |
| Intel Core i9-9980HK, NVIDIA GeForce RTX 2070 (Desktop) | |
| Intel Core i5-10600K, NVIDIA Titan RTX | |
| Intel Core i9-10900K, NVIDIA Titan RTX | |
| wPrime 2.10 | |
| 32m | |
| Intel Core i5-9400F, NVIDIA Titan RTX | |
| Intel Core i7-9750H, NVIDIA GeForce RTX 2080 Mobile | |
| Gemiddeld Intel Core i7-9750H (n=1) | |
| Intel Core i5-10600K, NVIDIA Titan RTX | |
| Gemiddeld Intel Core i9-9980HK (3.79 - 4.94, n=2) | |
| Intel Core i9-9980HK, NVIDIA GeForce RTX 2070 (Desktop) | |
| Intel Core i9-10900K, NVIDIA Titan RTX | |
| 1024m | |
| Intel Core i5-9400F, NVIDIA Titan RTX | |
| Intel Core i7-9750H, NVIDIA GeForce RTX 2080 Mobile | |
| Gemiddeld Intel Core i7-9750H (n=1) | |
| Intel Core i9-9980HK, NVIDIA GeForce RTX 2070 (Desktop) | |
| Gemiddeld Intel Core i9-9980HK (110.4 - 120.2, n=2) | |
| Intel Core i5-10600K, NVIDIA Titan RTX | |
| Intel Core i9-10900K, NVIDIA Titan RTX | |
| X264 HD Benchmark 4.0 | |
| Pass 1 | |
| Intel Core i9-10900K, NVIDIA Titan RTX | |
| Intel Core i5-10600K, NVIDIA Titan RTX | |
| Gemiddeld Intel Core i9-9980HK (238 - 239, n=2) | |
| Intel Core i9-9980HK, NVIDIA GeForce RTX 2070 (Desktop) | |
| Intel Core i5-9400F, NVIDIA Titan RTX | |
| Gemiddeld Intel Core i7-9750H (211 - 219, n=2) | |
| Intel Core i7-9750H, NVIDIA GeForce RTX 2080 Mobile | |
| Gemiddeld Intel Core i5-9300H (n=1) | |
| Pass 2 | |
| Intel Core i9-10900K, NVIDIA Titan RTX | |
| Gemiddeld Intel Core i9-9980HK (92.8 - 94.8, n=2) | |
| Intel Core i9-9980HK, NVIDIA GeForce RTX 2070 (Desktop) | |
| Intel Core i5-10600K, NVIDIA Titan RTX | |
| Intel Core i7-9750H, NVIDIA GeForce RTX 2080 Mobile | |
| Gemiddeld Intel Core i7-9750H (69.6 - 70.9, n=2) | |
| Intel Core i5-9400F, NVIDIA Titan RTX | |
| Gemiddeld Intel Core i5-9300H (n=1) | |
| WinRAR - Result | |
| Intel Core i9-10900K, NVIDIA Titan RTX | |
| Gemiddeld Intel Core i9-9980HK (7266 - 7436, n=2) | |
| Intel Core i9-9980HK, NVIDIA GeForce RTX 2070 (Desktop) | |
| Intel Core i5-10600K, NVIDIA Titan RTX | |
| Gemiddeld Intel Core i7-9750H (6160 - 6631, n=2) | |
| Intel Core i7-9750H, NVIDIA GeForce RTX 2080 Mobile | |
| Intel Core i5-9400F, NVIDIA Titan RTX | |
| Gemiddeld Intel Core i5-9300H (n=1) | |
| Geekbench 5.5 | |
| Multi-Core | |
| Intel Core i9-10900K, NVIDIA Titan RTX | |
| Intel Core i9-9980HK, NVIDIA GeForce RTX 2070 (Desktop) | |
| Gemiddeld Intel Core i9-9980HK (6945 - 7703, n=3) | |
| Intel Core i5-10600K, NVIDIA Titan RTX | |
| Intel Core i7-9750H, NVIDIA GeForce RTX 2080 Mobile | |
| Intel Core i5-9400F, NVIDIA Titan RTX | |
| Gemiddeld Intel Core i7-9750H (4859 - 6262, n=13) | |
| Single-Core | |
| Intel Core i9-10900K, NVIDIA Titan RTX | |
| Intel Core i9-9980HK, NVIDIA GeForce RTX 2070 (Desktop) | |
| Gemiddeld Intel Core i9-9980HK (1314 - 1378, n=2) | |
| Intel Core i5-10600K, NVIDIA Titan RTX | |
| Intel Core i7-9750H, NVIDIA GeForce RTX 2080 Mobile | |
| Gemiddeld Intel Core i7-9750H (1117 - 1251, n=13) | |
| Intel Core i5-9400F, NVIDIA Titan RTX | |
| Geekbench 5.0 | |
| 5.0 Multi-Core | |
| Intel Core i9-10900K, NVIDIA Titan RTX | |
| Intel Core i9-9980HK, NVIDIA GeForce RTX 2070 (Desktop) | |
| Gemiddeld Intel Core i9-9980HK (7072 - 7805, n=4) | |
| Intel Core i5-10600K, NVIDIA Titan RTX | |
| Intel Core i7-9750H, NVIDIA GeForce RTX 2080 Mobile | |
| Intel Core i5-9400F, NVIDIA Titan RTX | |
| Gemiddeld Intel Core i7-9750H (4812 - 6230, n=15) | |
| Gemiddeld Intel Core i5-9300H (3697 - 4200, n=3) | |
| 5.0 Single-Core | |
| Intel Core i9-10900K, NVIDIA Titan RTX | |
| Intel Core i9-9980HK, NVIDIA GeForce RTX 2070 (Desktop) | |
| Intel Core i5-10600K, NVIDIA Titan RTX | |
| Gemiddeld Intel Core i9-9980HK (1171 - 1355, n=4) | |
| Intel Core i7-9750H, NVIDIA GeForce RTX 2080 Mobile | |
| Gemiddeld Intel Core i7-9750H (1105 - 1248, n=15) | |
| Intel Core i5-9400F, NVIDIA Titan RTX | |
| Gemiddeld Intel Core i5-9300H (1095 - 1137, n=3) | |
| Geekbench 4.4 | |
| 64 Bit Single-Core Score | |
| Intel Core i9-10900K, NVIDIA Titan RTX | |
| Intel Core i9-9980HK, NVIDIA GeForce RTX 2070 (Desktop) | |
| Gemiddeld Intel Core i9-9980HK (5617 - 5972, n=3) | |
| Intel Core i5-10600K, NVIDIA Titan RTX | |
| Intel Core i7-9750H, NVIDIA GeForce RTX 2080 Mobile | |
| Intel Core i5-9400F, NVIDIA Titan RTX | |
| Gemiddeld Intel Core i7-9750H (4440 - 5511, n=27) | |
| Gemiddeld Intel Core i5-9300H (4704 - 5089, n=7) | |
| 64 Bit Multi-Core Score | |
| Intel Core i9-10900K, NVIDIA Titan RTX | |
| Gemiddeld Intel Core i9-9980HK (28625 - 30849, n=3) | |
| Intel Core i9-9980HK, NVIDIA GeForce RTX 2070 (Desktop) | |
| Intel Core i5-10600K, NVIDIA Titan RTX | |
| Intel Core i7-9750H, NVIDIA GeForce RTX 2080 Mobile | |
| Gemiddeld Intel Core i7-9750H (17054 - 25043, n=27) | |
| Intel Core i5-9400F, NVIDIA Titan RTX | |
| Gemiddeld Intel Core i5-9300H (14853 - 17684, n=7) | |
| 3DMark 11 - 1280x720 Performance Physics | |
| Intel Core i9-10900K, NVIDIA Titan RTX | |
| Intel Core i9-9980HK, NVIDIA GeForce RTX 2070 (Desktop) | |
| Intel Core i5-10600K, NVIDIA Titan RTX | |
| Gemiddeld Intel Core i9-9980HK (9056 - 18260, n=12) | |
| Intel Core i7-9750H, NVIDIA GeForce RTX 2080 Mobile | |
| Gemiddeld Intel Core i7-9750H (9704 - 14337, n=80) | |
| Intel Core i5-9400F, NVIDIA Titan RTX | |
| Gemiddeld Intel Core i5-9300H (7499 - 10557, n=12) | |
| 7-Zip 18.03 | |
| 7z b 4 | |
| Intel Core i9-10900K, NVIDIA Titan RTX | |
| Intel Core i9-9980HK, NVIDIA GeForce RTX 2070 (Desktop) | |
| Gemiddeld Intel Core i9-9980HK (39566 - 44081, n=4) | |
| Intel Core i5-10600K, NVIDIA Titan RTX | |
| Intel Core i7-9750H, NVIDIA GeForce RTX 2080 Mobile | |
| Gemiddeld Intel Core i7-9750H (28512 - 35174, n=21) | |
| Intel Core i5-9400F, NVIDIA Titan RTX | |
| Gemiddeld Intel Core i5-9300H (20736 - 23155, n=3) | |
| 7z b 4 -mmt1 | |
| Intel Core i9-10900K, NVIDIA Titan RTX | |
| Intel Core i9-9980HK, NVIDIA GeForce RTX 2070 (Desktop) | |
| Gemiddeld Intel Core i9-9980HK (5283 - 5642, n=4) | |
| Intel Core i5-10600K, NVIDIA Titan RTX | |
| Intel Core i7-9750H, NVIDIA GeForce RTX 2080 Mobile | |
| Gemiddeld Intel Core i7-9750H (4580 - 5090, n=21) | |
| Intel Core i5-9400F, NVIDIA Titan RTX | |
| Gemiddeld Intel Core i5-9300H (4542 - 4626, n=3) | |
| HWBOT x265 Benchmark v2.2 - 4k Preset | |
| Intel Core i9-10900K, NVIDIA Titan RTX | |
| Intel Core i5-10600K, NVIDIA Titan RTX | |
| Gemiddeld Intel Core i9-9980HK (10.8 - 12.4, n=3) | |
| Intel Core i9-9980HK, NVIDIA GeForce RTX 2070 (Desktop) | |
| Intel Core i5-9400F, NVIDIA Titan RTX | |
| Intel Core i7-9750H, NVIDIA GeForce RTX 2080 Mobile | |
| Gemiddeld Intel Core i7-9750H (7.1 - 10.7, n=21) | |
| Gemiddeld Intel Core i5-9300H (5.7 - 6.5, n=3) | |
| R Benchmark 2.5 - Overall mean | |
| Intel Core i5-9400F, NVIDIA Titan RTX | |
| Gemiddeld Intel Core i7-9750H (0.608 - 0.695, n=14) | |
| Intel Core i7-9750H, NVIDIA GeForce RTX 2080 Mobile | |
| Intel Core i5-10600K, NVIDIA Titan RTX | |
| Intel Core i9-9980HK, NVIDIA GeForce RTX 2070 (Desktop) | |
| Gemiddeld Intel Core i9-9980HK (n=1) | |
| Intel Core i9-10900K, NVIDIA Titan RTX | |
| LibreOffice - 20 Documents To PDF | |
| Intel Core i9-10900K, NVIDIA Titan RTX | |
| Gemiddeld Intel Core i7-9750H (54.5 - 64.7, n=9) | |
| Intel Core i5-9400F, NVIDIA Titan RTX | |
| Intel Core i7-9750H, NVIDIA GeForce RTX 2080 Mobile | |
| Gemiddeld Intel Core i9-9980HK (45.2 - 57.5, n=2) | |
| Intel Core i5-10600K, NVIDIA Titan RTX | |
| Intel Core i9-9980HK, NVIDIA GeForce RTX 2070 (Desktop) | |
| WebXPRT 3 - Overall | |
| Intel Core i9-10900K, NVIDIA Titan RTX | |
| Intel Core i5-10600K, NVIDIA Titan RTX | |
| Intel Core i9-9980HK, NVIDIA GeForce RTX 2070 (Desktop) | |
| Gemiddeld Intel Core i9-9980HK (n=1) | |
| Gemiddeld Intel Core i5-9300H (n=1) | |
| Intel Core i7-9750H, NVIDIA GeForce RTX 2080 Mobile | |
| Intel Core i5-9400F, NVIDIA Titan RTX | |
| Gemiddeld Intel Core i7-9750H (199 - 231, n=10) | |
| Mozilla Kraken 1.1 - Total | |
| Gemiddeld Intel Core i5-9300H (1079 - 1349, n=8) | |
| Gemiddeld Intel Core i7-9750H (845 - 1713, n=54) | |
| Gemiddeld Intel Core i9-9980HK (705 - 999, n=9) | |
| Intel Core i5-9400F, NVIDIA Titan RTX | |
| Intel Core i7-9750H, NVIDIA GeForce RTX 2080 Mobile | |
| Intel Core i5-10600K, NVIDIA Titan RTX | |
| Intel Core i9-9980HK, NVIDIA GeForce RTX 2070 (Desktop) | |
| Intel Core i9-10900K, NVIDIA Titan RTX | |
* ... kleiner is beter
| PCMark 10 - Score | |
| AMD Ryzen 9 3950X, AMD Ryzen 9 3950X | |
| Intel Core i9-10900K, Intel Core i9-10900K | |
| Corsair One i160, Intel Core i9-9900K | |
| Intel Core i5-10600K, Intel Core i5-10600K | |
| Intel Ghost Canyon NUC (RTX 2070), Intel Core i9-9980HK | |
| Zotac ZBOX Magnus EN72070V, Intel Core i7-9750H | |
| Gemiddeld Intel Core i7-9750H (4395 - 6453, n=72) | |
| Borderlands 3 | |
| 1280x720 Very Low Overall Quality (DX11) | |
| Intel Ghost Canyon NUC (RTX 2070) | |
| Gemiddeld NVIDIA GeForce RTX 2080 Mobile (128 - 150, n=2) | |
| Zotac ZBOX Magnus EN72070V | |
| 1920x1080 Badass Overall Quality (DX11) | |
| Zotac ZBOX Magnus EN72070V | |
| Gemiddeld NVIDIA GeForce RTX 2080 Mobile (79.4 - 89.4, n=4) | |
| Intel Ghost Canyon NUC (RTX 2070) | |
| Metro Exodus | |
| 1280x720 Low Quality AF:4x | |
| Intel Ghost Canyon NUC (RTX 2070) | |
| Gemiddeld NVIDIA GeForce RTX 2080 Mobile (149 - 165, n=2) | |
| Zotac ZBOX Magnus EN72070V | |
| 1920x1080 Ultra Quality AF:16x | |
| Gemiddeld NVIDIA GeForce RTX 2080 Mobile (67.7 - 77.4, n=5) | |
| Zotac ZBOX Magnus EN72070V | |
| Intel Ghost Canyon NUC (RTX 2070) | |
| Far Cry New Dawn | |
| 1280x720 Low Preset | |
| Intel Ghost Canyon NUC (RTX 2070) | |
| Zotac ZBOX Magnus EN72070V | |
| Gemiddeld NVIDIA GeForce RTX 2080 Mobile (109 - 117, n=2) | |
| 1920x1080 Ultra Preset | |
| Gemiddeld NVIDIA GeForce RTX 2080 Mobile (82 - 108, n=5) | |
| Zotac ZBOX Magnus EN72070V | |
| Intel Ghost Canyon NUC (RTX 2070) | |
| Forza Horizon 4 | |
| 1280x720 Very Low Preset | |
| Intel Ghost Canyon NUC (RTX 2070) | |
| Zotac ZBOX Magnus EN72070V | |
| Gemiddeld NVIDIA GeForce RTX 2080 Mobile (n=1) | |
| 1920x1080 Ultra Preset AA:2xMS | |
| Zotac ZBOX Magnus EN72070V | |
| Gemiddeld NVIDIA GeForce RTX 2080 Mobile (n=1) | |
| Intel Ghost Canyon NUC (RTX 2070) | |
| Far Cry 5 | |
| 1280x720 Low Preset AA:T | |
| Intel Ghost Canyon NUC (RTX 2070) | |
| Zotac ZBOX Magnus EN72070V | |
| Gemiddeld NVIDIA GeForce RTX 2080 Mobile (123 - 123, n=2) | |
| 1920x1080 Ultra Preset AA:T | |
| Gemiddeld NVIDIA GeForce RTX 2080 Mobile (73 - 115, n=3) | |
| Intel Ghost Canyon NUC (RTX 2070) | |
| Zotac ZBOX Magnus EN72070V | |
| X-Plane 11.11 | |
| 1280x720 low (fps_test=1) | |
| Intel Ghost Canyon NUC (RTX 2070) | |
| Zotac ZBOX Magnus EN72070V | |
| Gemiddeld NVIDIA GeForce RTX 2080 Mobile (98.2 - 114, n=3) | |
| 1920x1080 high (fps_test=3) | |
| Intel Ghost Canyon NUC (RTX 2070) | |
| Zotac ZBOX Magnus EN72070V | |
| Gemiddeld NVIDIA GeForce RTX 2080 Mobile (73.1 - 84.7, n=3) | |
| Final Fantasy XV Benchmark | |
| 1280x720 Lite Quality | |
| Intel Ghost Canyon NUC (RTX 2070) | |
| Zotac ZBOX Magnus EN72070V | |
| Gemiddeld NVIDIA GeForce RTX 2080 Mobile (n=1) | |
| 1920x1080 High Quality | |
| Gemiddeld NVIDIA GeForce RTX 2080 Mobile (90.6 - 108, n=3) | |
| Intel Ghost Canyon NUC (RTX 2070) | |
| Zotac ZBOX Magnus EN72070V | |
| Dota 2 Reborn | |
| 1280x720 min (0/3) fastest | |
| Intel Ghost Canyon NUC (RTX 2070) | |
| Zotac ZBOX Magnus EN72070V | |
| Gemiddeld NVIDIA GeForce RTX 2080 Mobile (134.8 - 152.8, n=3) | |
| 1920x1080 ultra (3/3) best looking | |
| Intel Ghost Canyon NUC (RTX 2070) | |
| Zotac ZBOX Magnus EN72070V | |
| Gemiddeld NVIDIA GeForce RTX 2080 Mobile (103.9 - 133.8, n=3) | |
| The Witcher 3 | |
| 1024x768 Low Graphics & Postprocessing | |
| Zotac ZBOX Magnus EN72070V | |
| Gemiddeld NVIDIA GeForce RTX 2080 Mobile (195.8 - 414, n=9) | |
| Intel Ghost Canyon NUC (RTX 2070) | |
| 1920x1080 Ultra Graphics & Postprocessing (HBAO+) | |
| Zotac ZBOX Magnus EN72070V | |
| Gemiddeld NVIDIA GeForce RTX 2080 Mobile (82.2 - 105, n=16) | |
| Intel Ghost Canyon NUC (RTX 2070) | |
| 3DMark | |
| Fire Strike Extreme Graphics | |
| Gemiddeld NVIDIA GeForce RTX 2080 Mobile (11133 - 12514, n=2) | |
| Zotac ZBOX Magnus EN72070V | |
| Intel Ghost Canyon NUC (RTX 2070) | |
| 1920x1080 Fire Strike Graphics | |
| Gemiddeld NVIDIA GeForce RTX 2080 Mobile (22504 - 27319, n=16) | |
| Zotac ZBOX Magnus EN72070V | |
| Intel Ghost Canyon NUC (RTX 2070) | |
| 2560x1440 Time Spy Graphics | |
| Gemiddeld NVIDIA GeForce RTX 2080 Mobile (9411 - 10992, n=15) | |
| Zotac ZBOX Magnus EN72070V | |
| Intel Ghost Canyon NUC (RTX 2070) | |
| 3DMark 11 | |
| 1280x720 Performance GPU | |
| Gemiddeld NVIDIA GeForce RTX 2080 Mobile (31826 - 38809, n=17) | |
| Zotac ZBOX Magnus EN72070V | |
| Intel Ghost Canyon NUC (RTX 2070) | |
| 1280x720 Performance | |
| Gemiddeld NVIDIA GeForce RTX 2080 Mobile (20224 - 29759, n=19) | |
| Intel Ghost Canyon NUC (RTX 2070) | |
| Zotac ZBOX Magnus EN72070V | |
| lage | gem. | hoge | ultra | QHD | 4K | |
|---|---|---|---|---|---|---|
| The Witcher 3 (2015) | 338 | 279 | 175 | 95.9 | 63.9 | |
| Dota 2 Reborn (2015) | 145.2 | 135.5 | 130.5 | 124.6 | 119 | |
| Final Fantasy XV Benchmark (2018) | 150 | 117 | 90.6 | 67.7 | 39.5 | |
| X-Plane 11.11 (2018) | 114 | 102 | 84.7 | 73 | ||
| Far Cry 5 (2018) | 123 | 72 | 84 | 73 | 67 | 52 |
| Forza Horizon 4 (2018) | 169 | 147 | 145 | 139 | 122 | 82 |
| Far Cry New Dawn (2019) | 117 | 102 | 97 | 88 | 82 | 54 |
| Metro Exodus (2019) | 149 | 112 | 88.1 | 69.5 | 54.8 | 35.1 |
| Borderlands 3 (2019) | 128 | 117 | 93.4 | 84.3 | 61.4 | 33.2 |
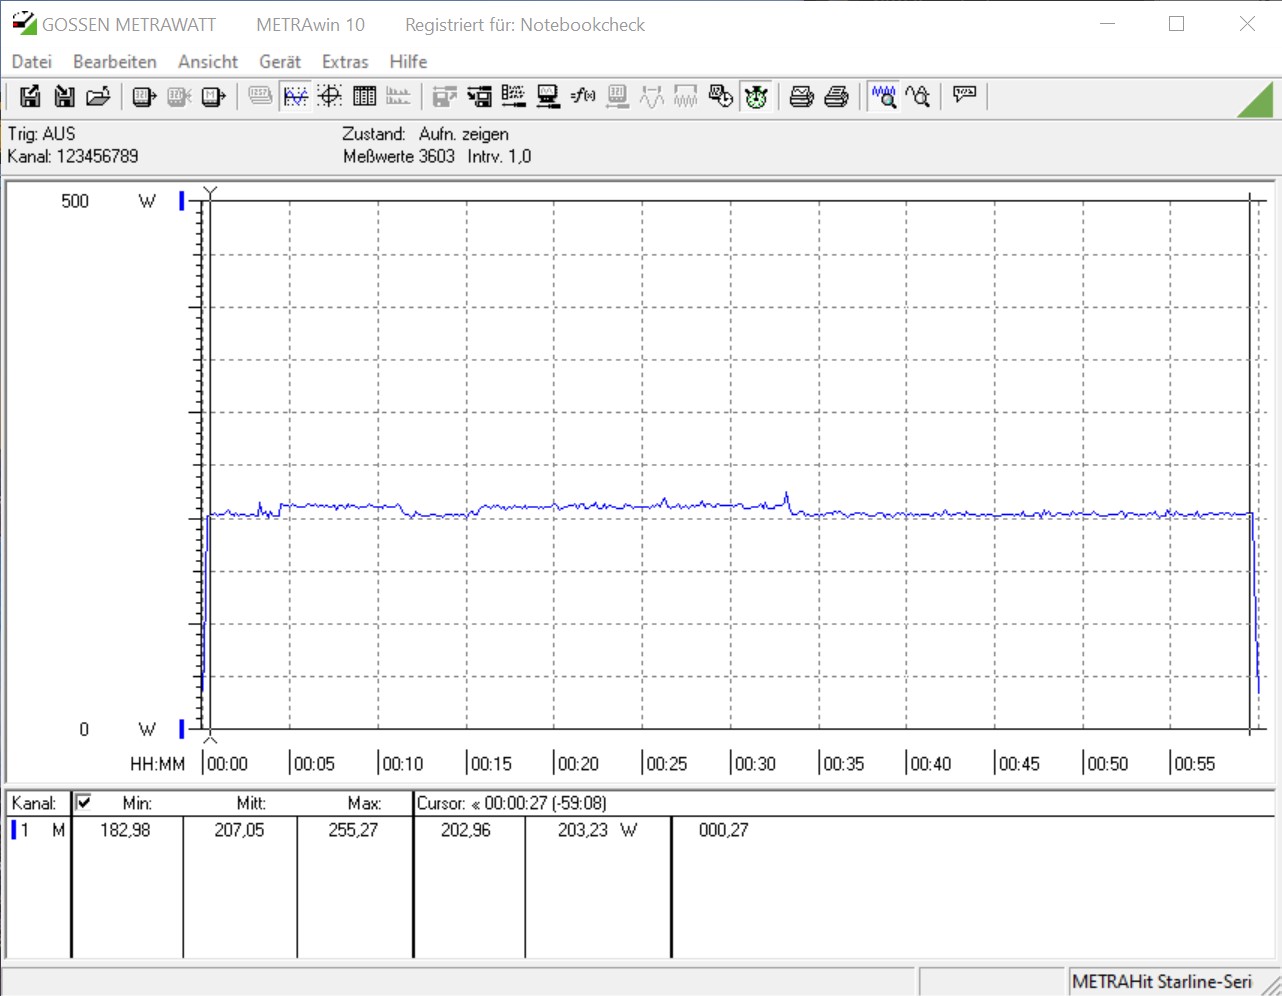
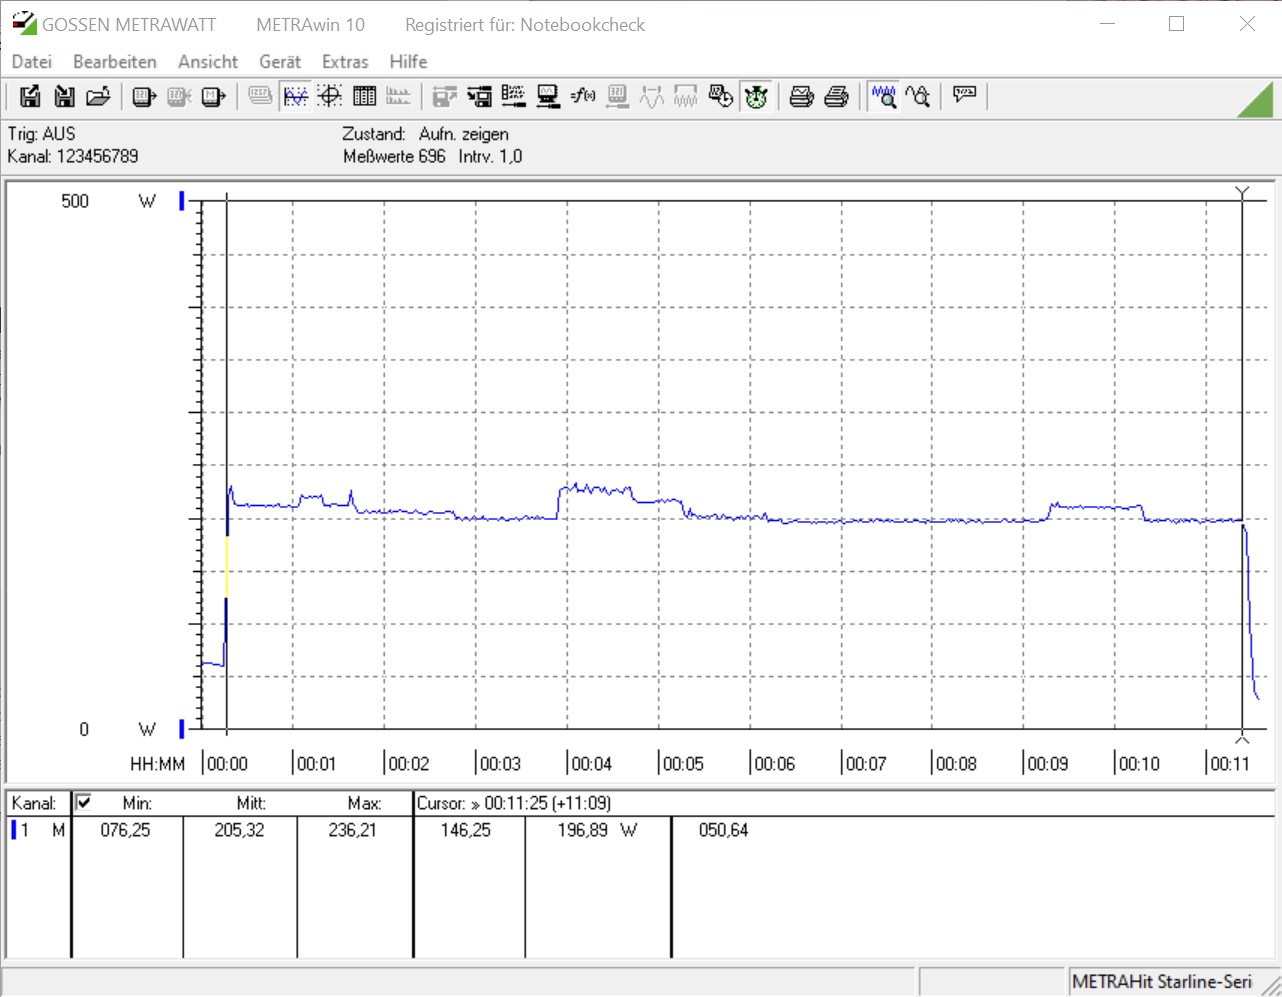
| Power Consumption | |
| 1920x1080 The Witcher 3 ultra (external Monitor) | |
| AMD Ryzen 9 3950X (Idle: 95 W) | |
| Intel Core i9-10900K (Idle: 52.3 W) | |
| Intel Core i5-10600K (Idle: 52.2 W) | |
| Intel Core i5 9400F (Idle: 57 W) | |
| Intel Ghost Canyon NUC (RTX 2070) (Idle: 33.1 W) | |
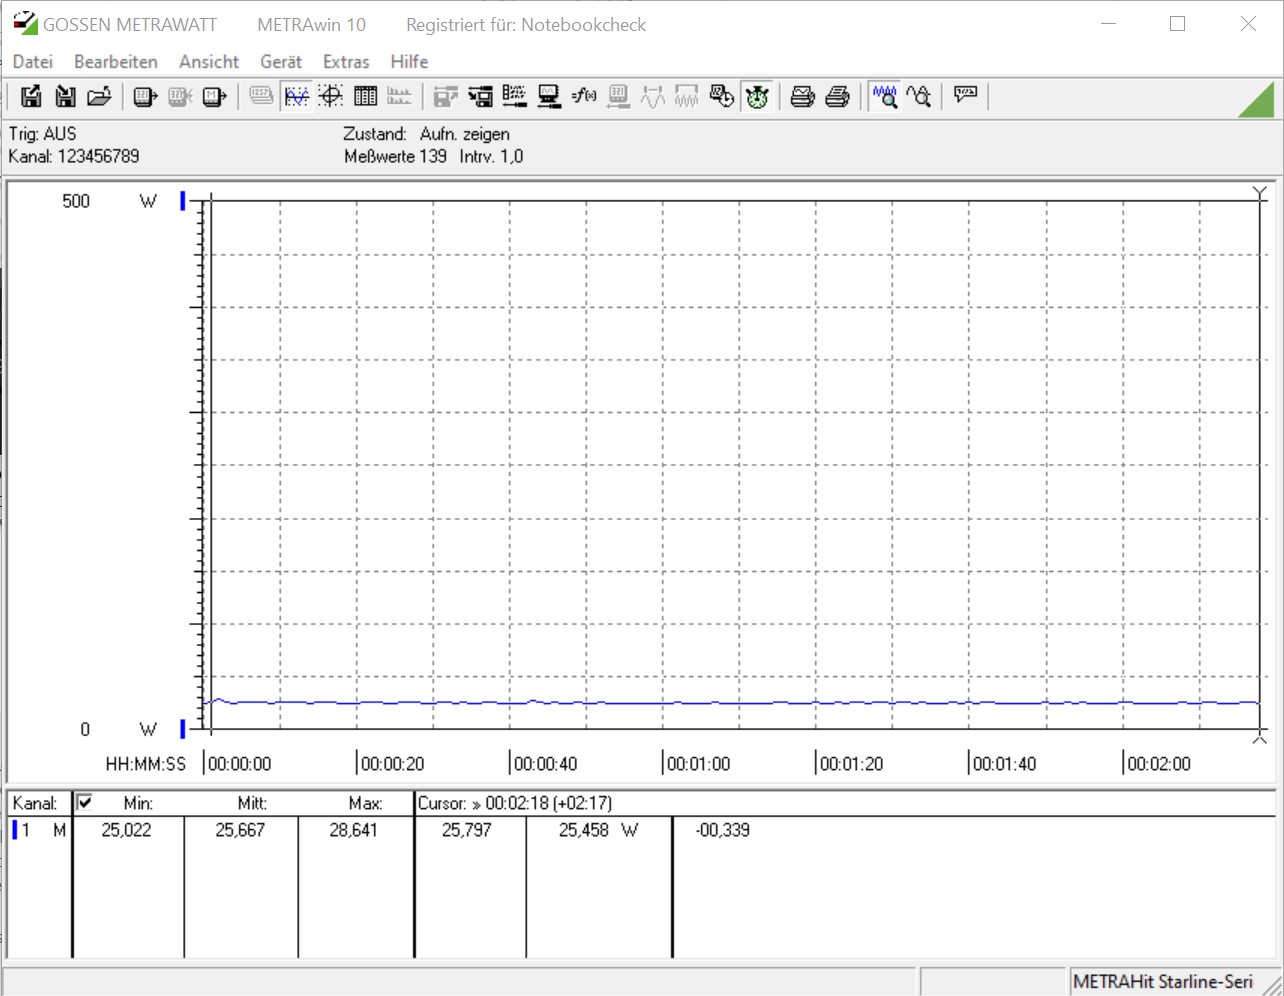
| Zotac ZBOX Magnus EN72070V (Idle: 25.7 W) | |
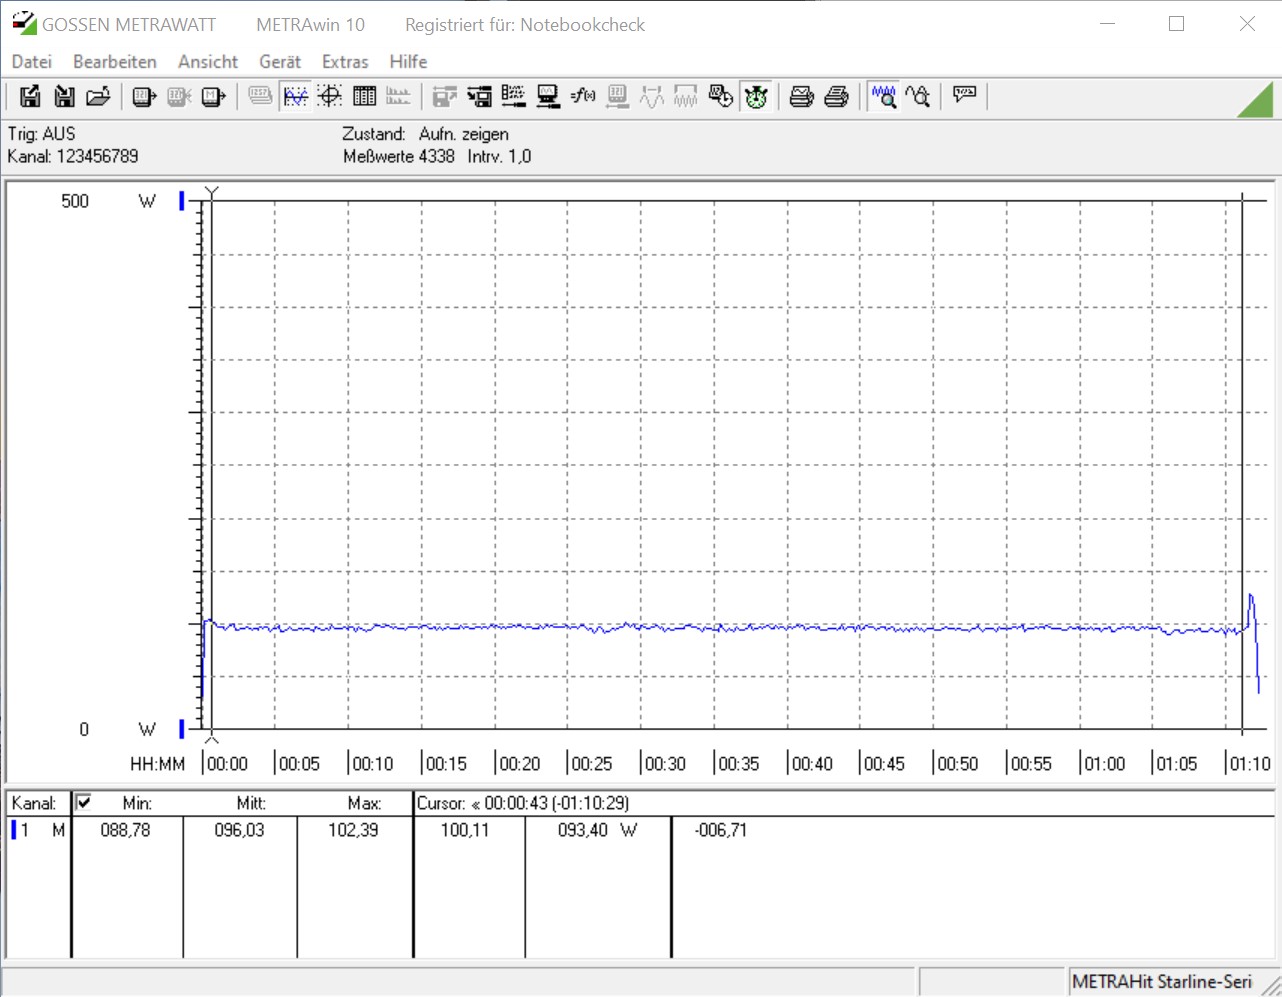
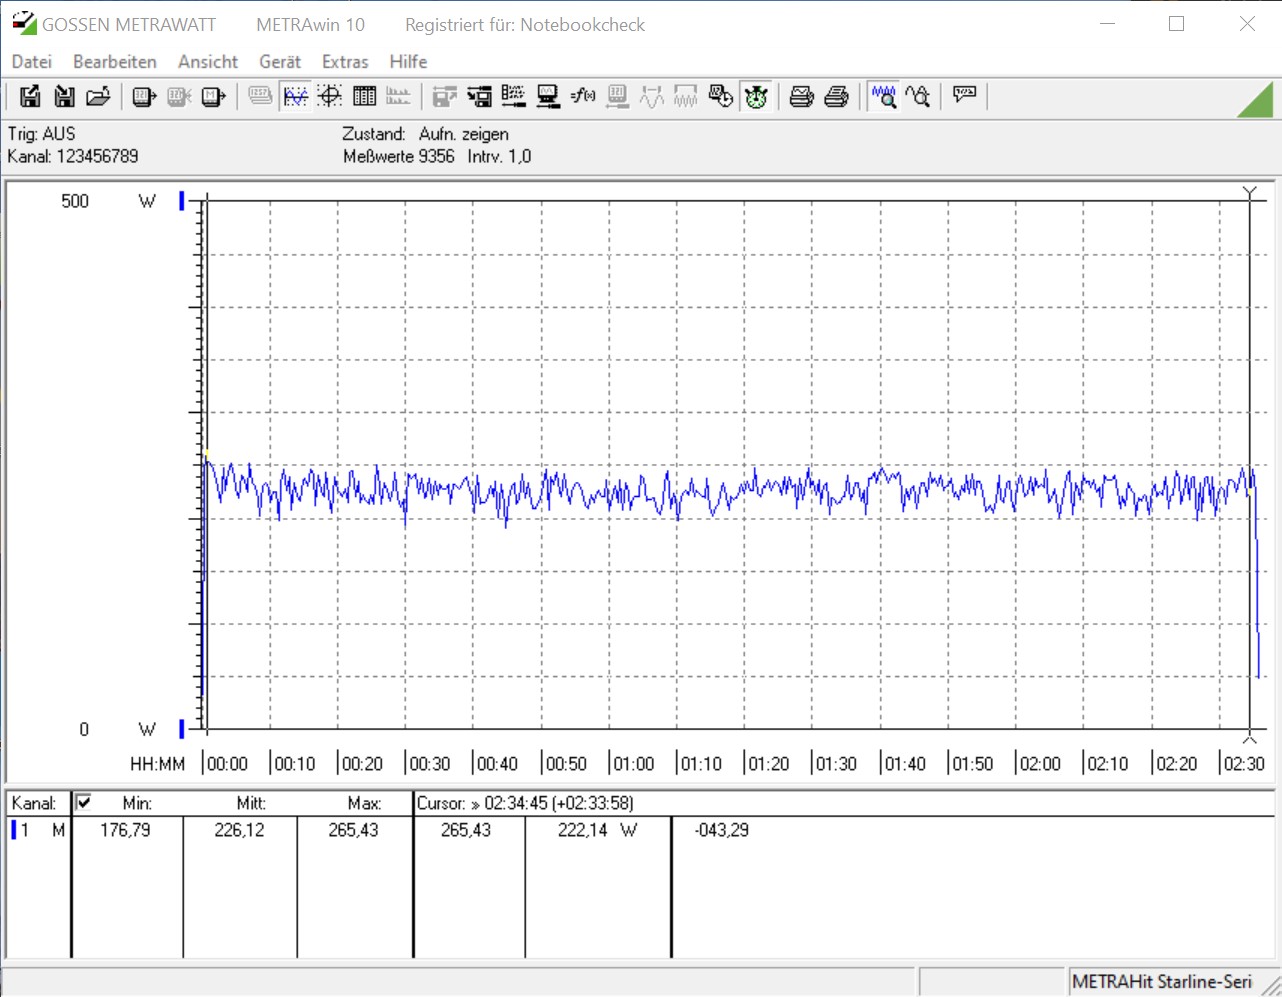
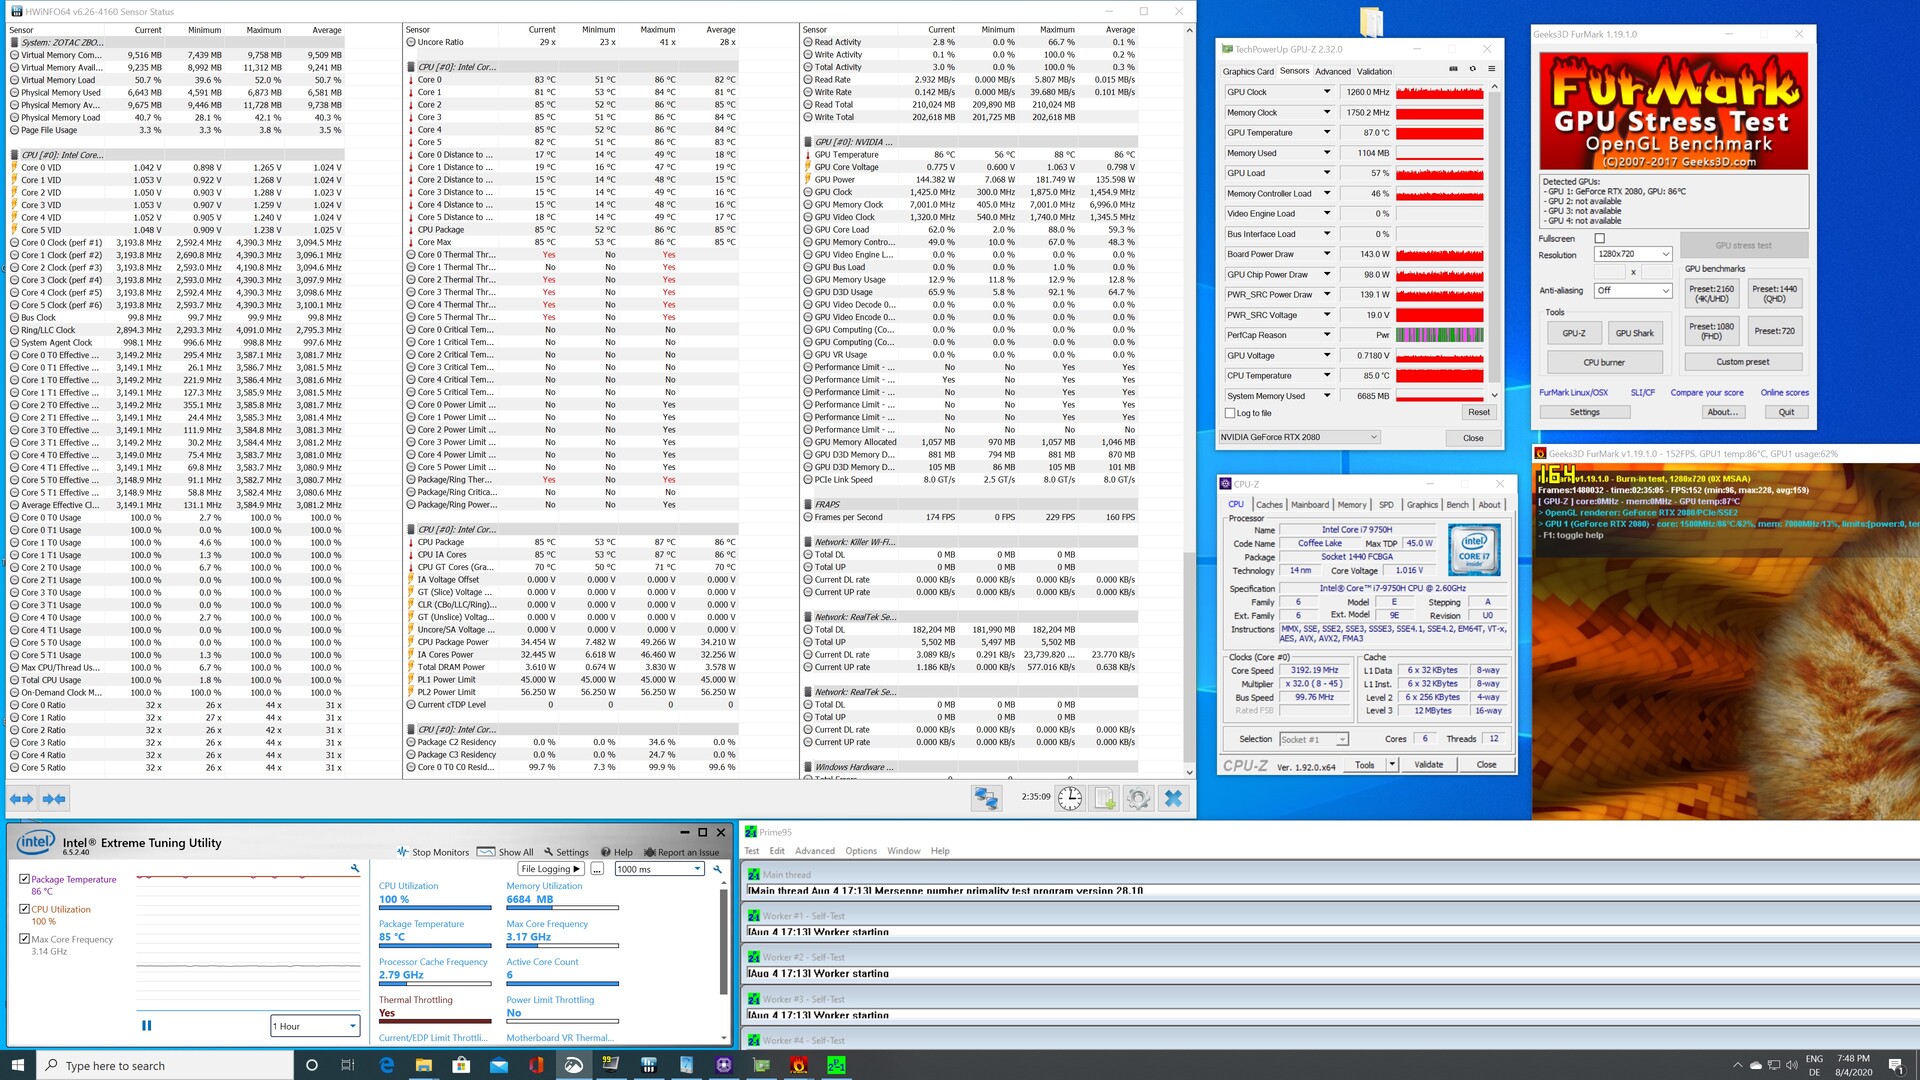
| Prime95 V2810 Stress (external Monitor) | |
| Intel Core i9-10900K (Idle: 52.3 W) | |
| Intel Core i5-10600K (Idle: 52.2 W) | |
| AMD Ryzen 9 3950X (Idle: 95 W) | |
| Intel Core i5 9400F (Idle: 57 W) | |
| Intel Ghost Canyon NUC (RTX 2070) (Idle: 33.1 W) | |
| Zotac ZBOX Magnus EN72070V (Idle: 25.7 W) | |
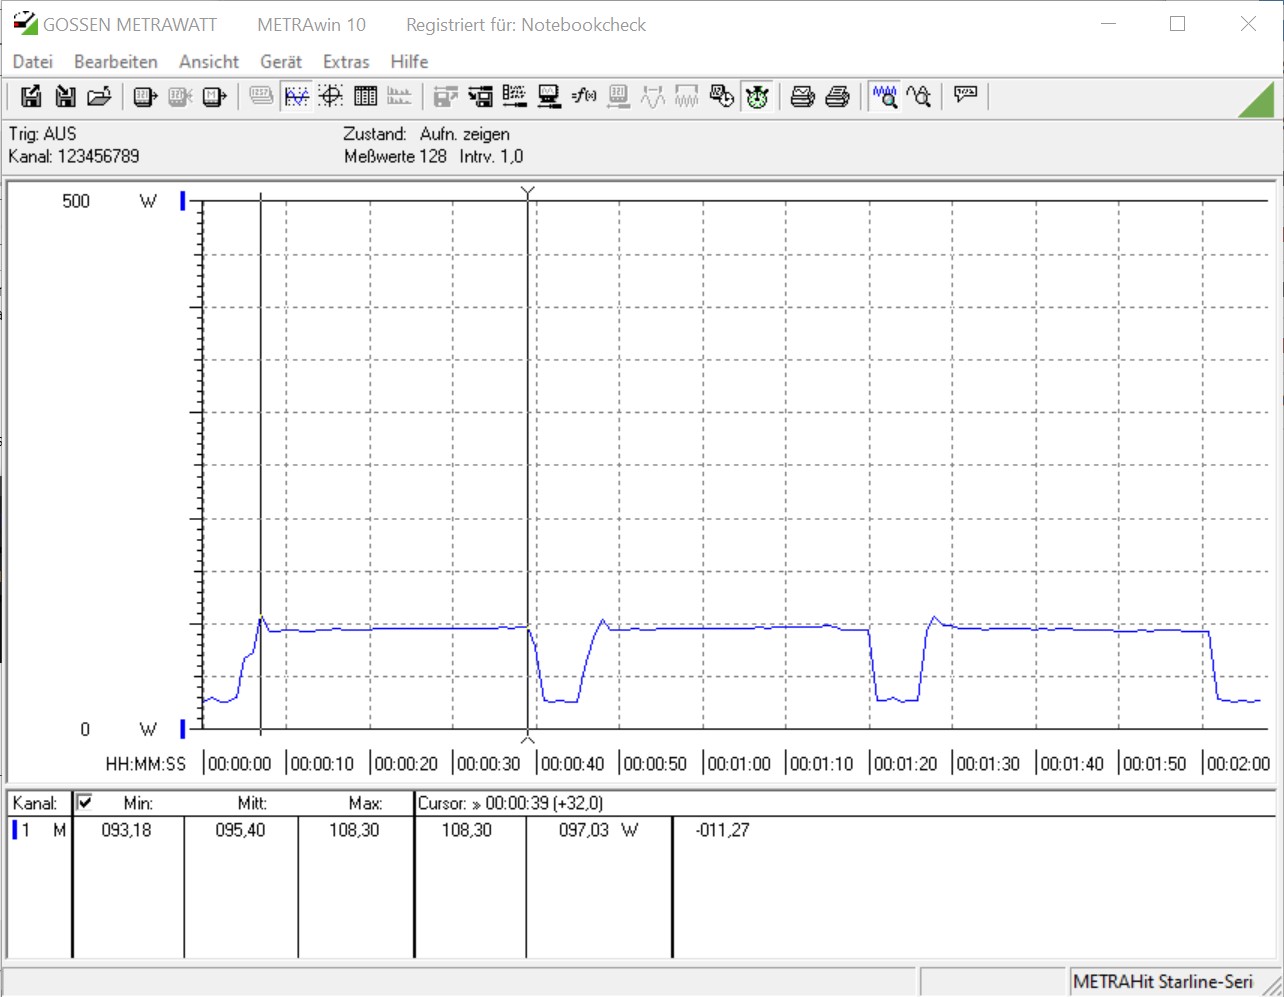
| Cinebench R15 Multi (external Monitor) | |
| Intel Core i9-10900K (Idle: 52.3 W) | |
| AMD Ryzen 9 3950X (Idle: 95 W) | |
| Intel Core i5-10600K (Idle: 52.2 W) | |
| Intel Core i5 9400F (Idle: 57 W) | |
| Zotac ZBOX Magnus EN72070V (Idle: 25.7 W) | |
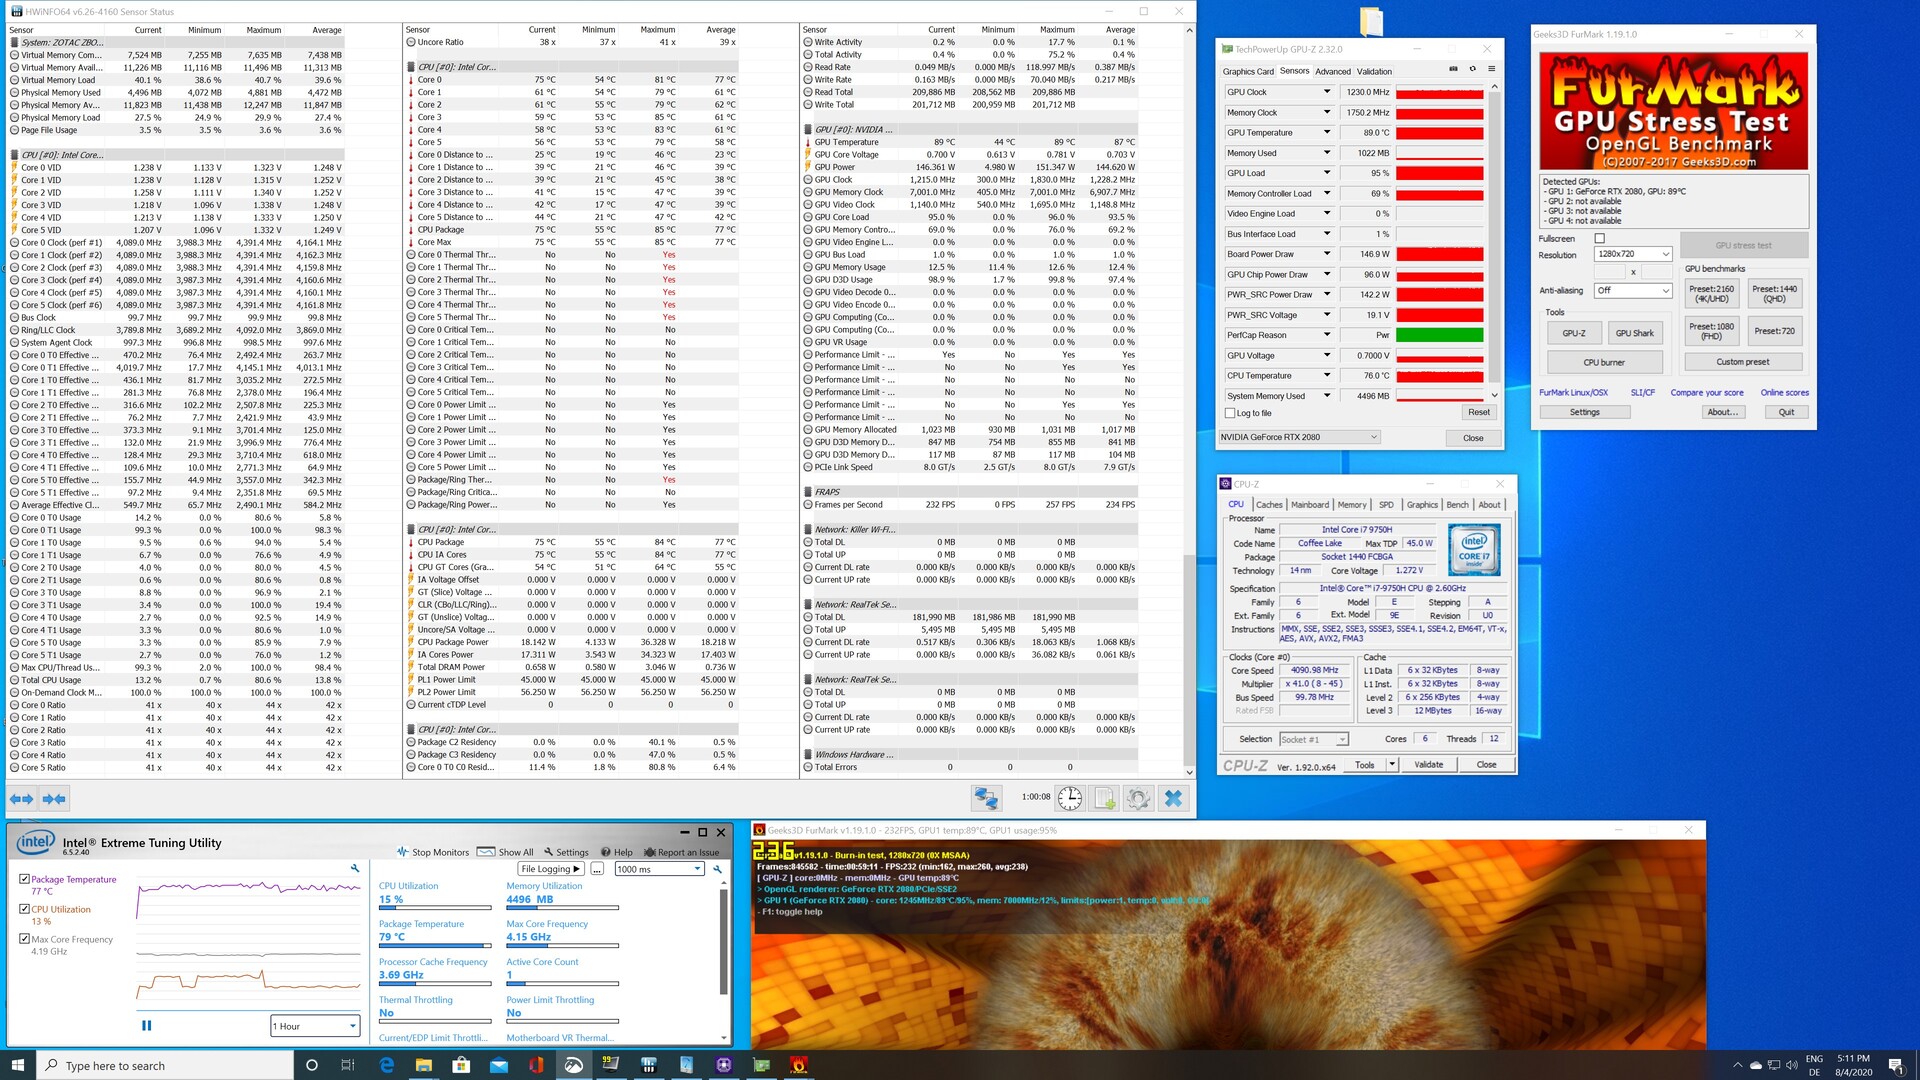
| Temperatures - CPU Temperature Prime95 | |
| Intel Core i9-10900K | |
| Zotac ZBOX Magnus EN72070V | |
| AMD Ryzen 9 3950X | |
| Intel Core i5-10600K | |
| Intel Core i5 9400F | |
* ... kleiner is beter

Pro
Contra
Dit is de verkorte versie van het originele artikel. Het volledige, Engelse testrapport vind je hier.
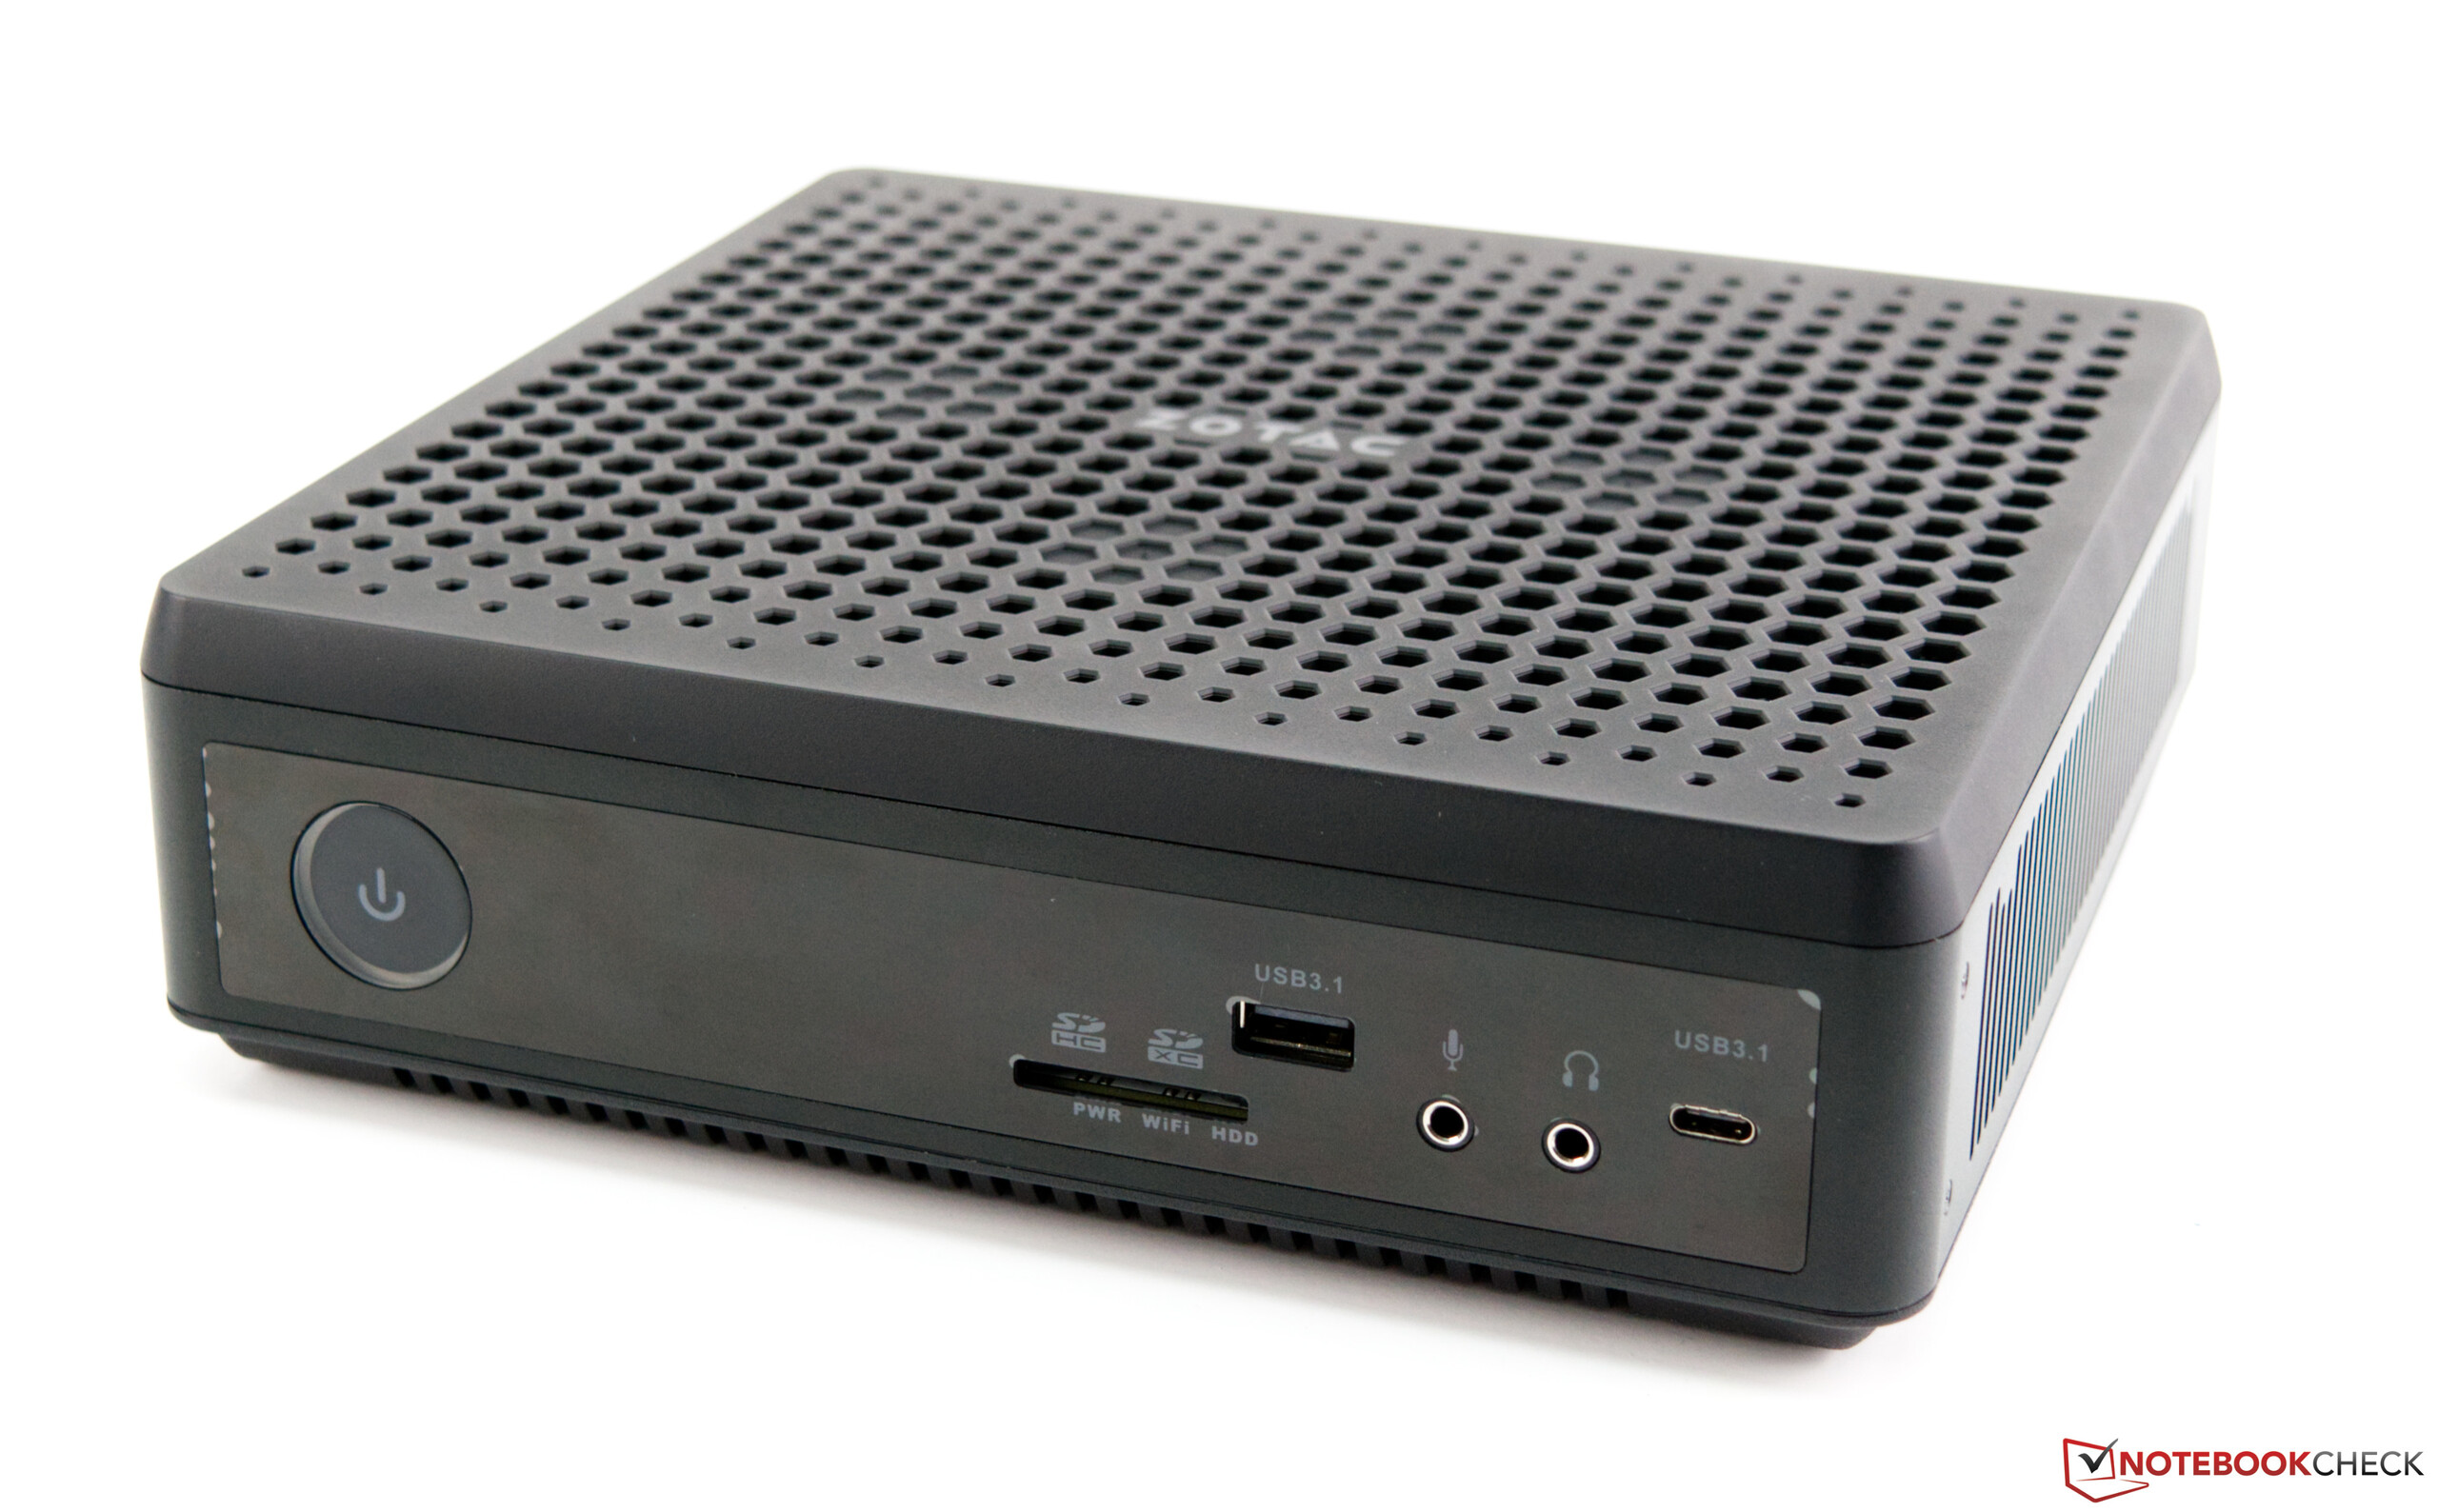
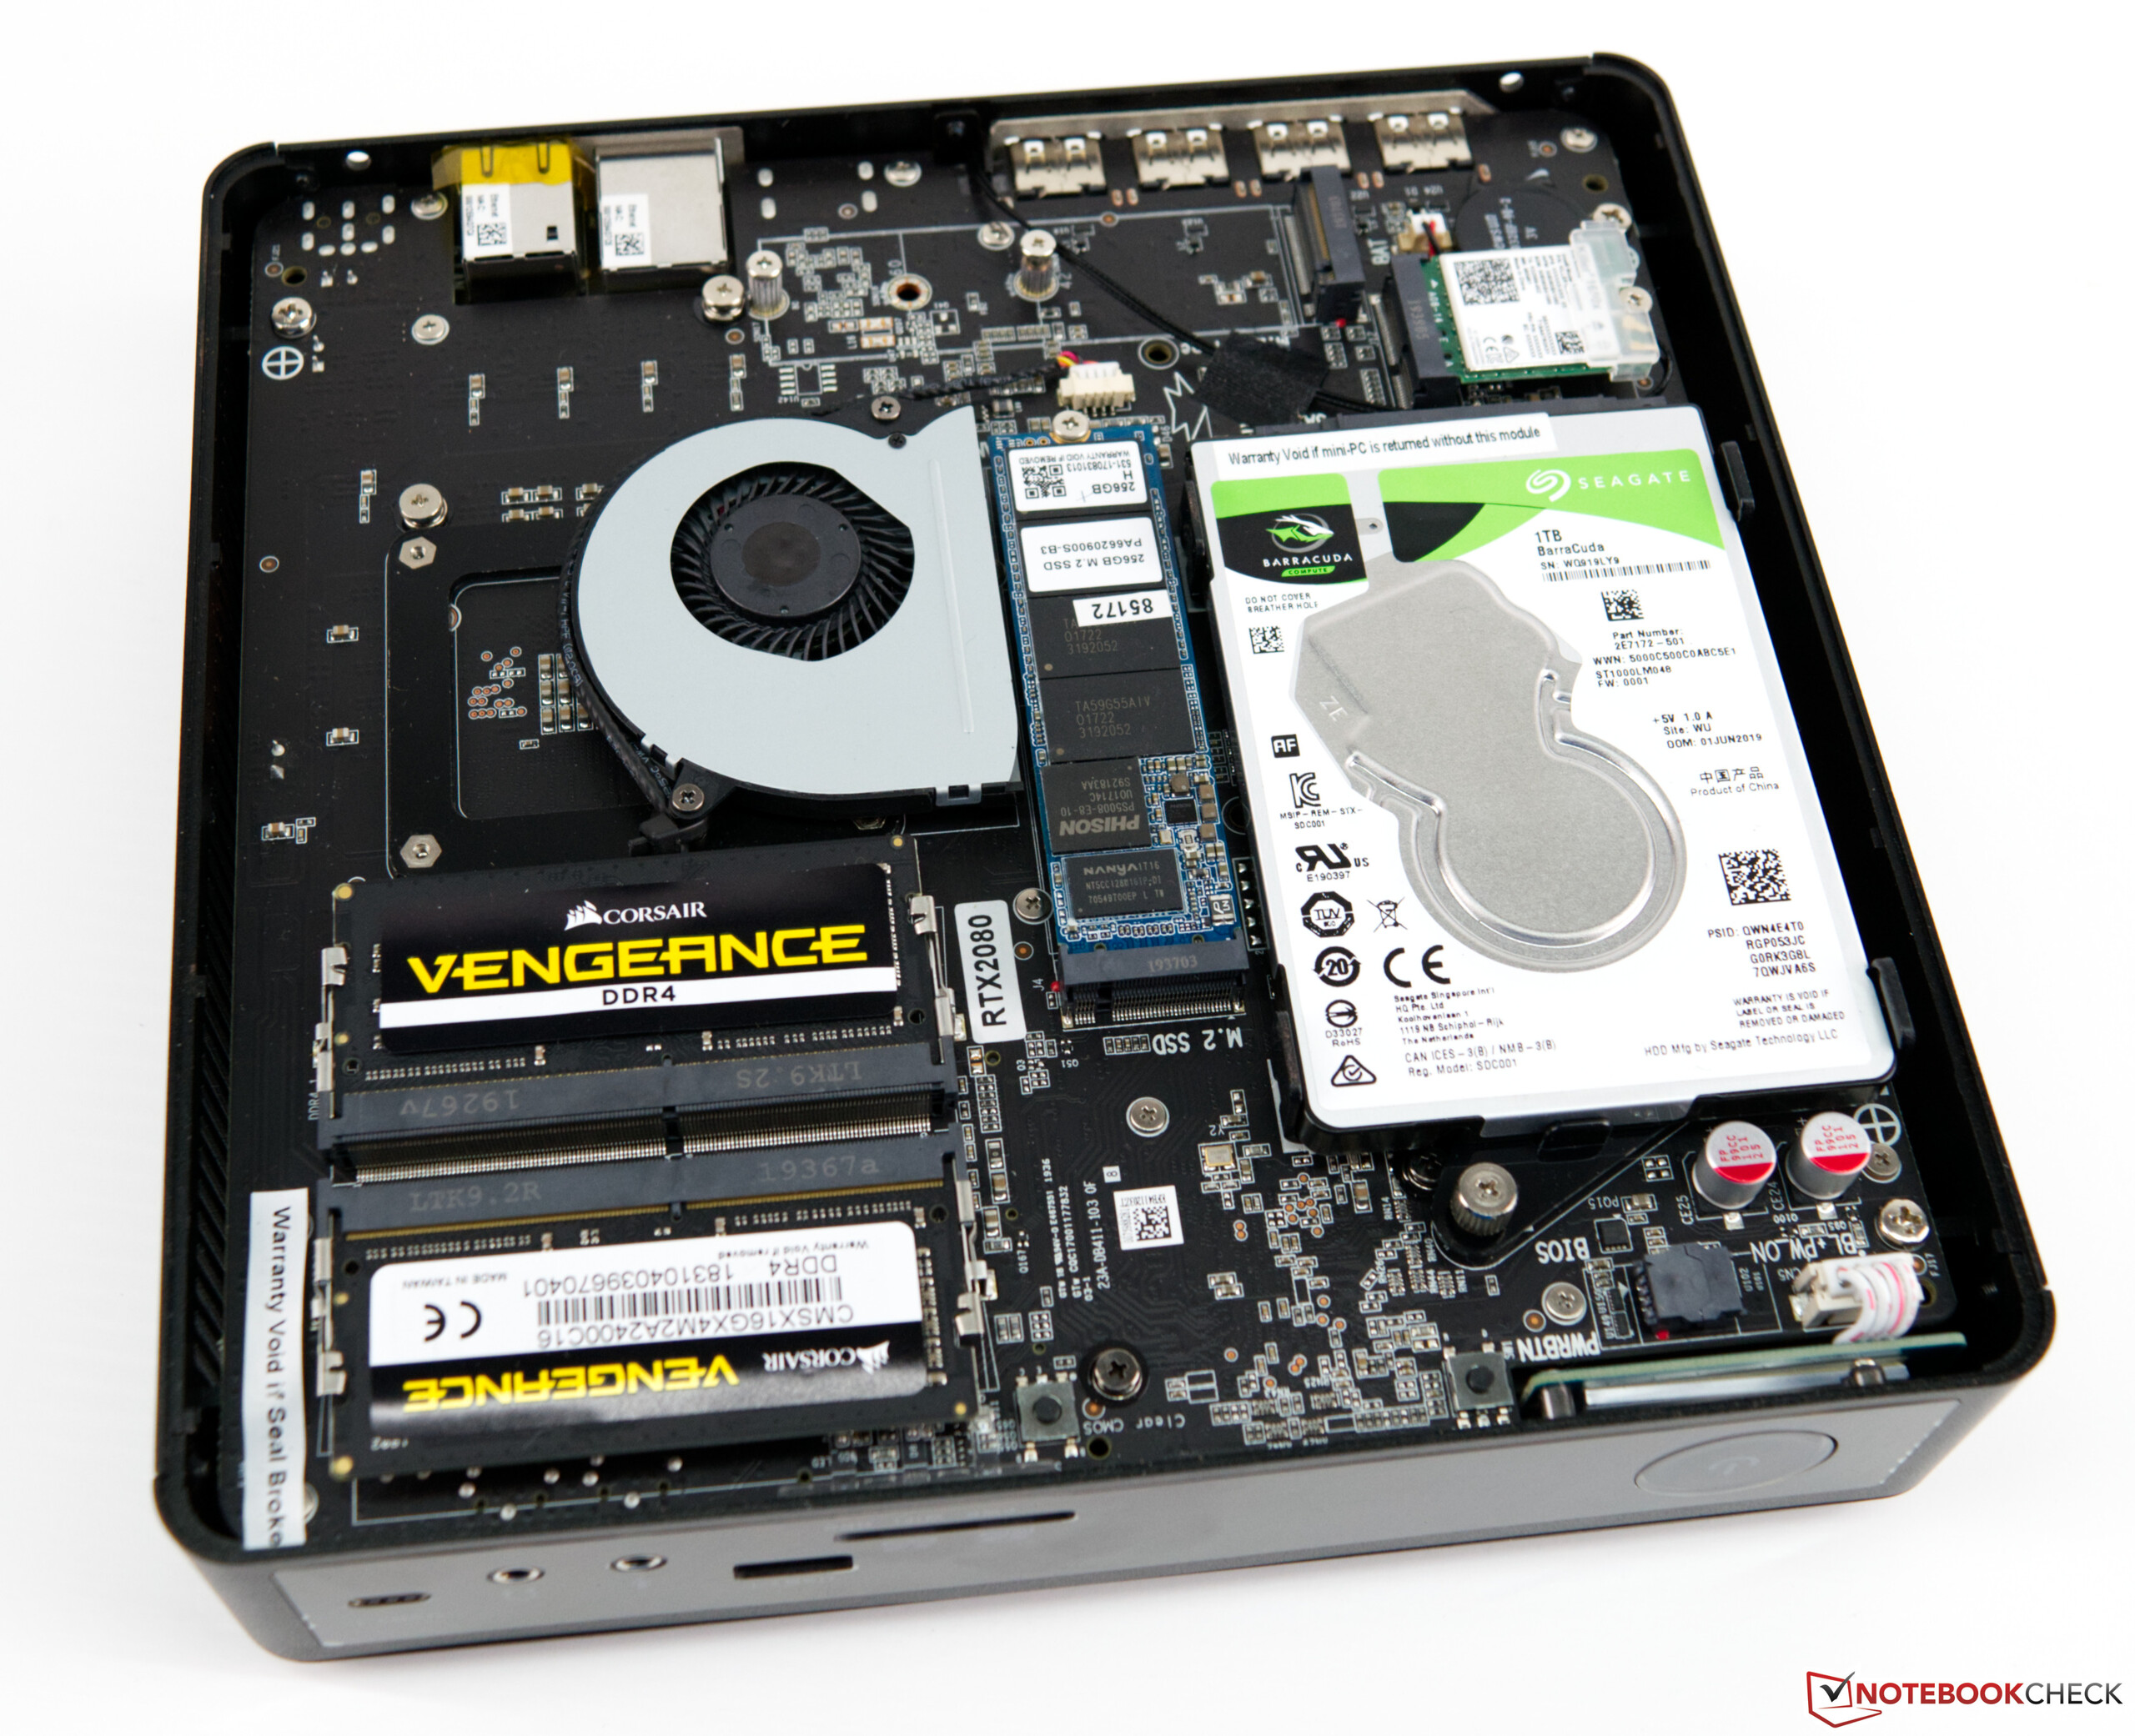
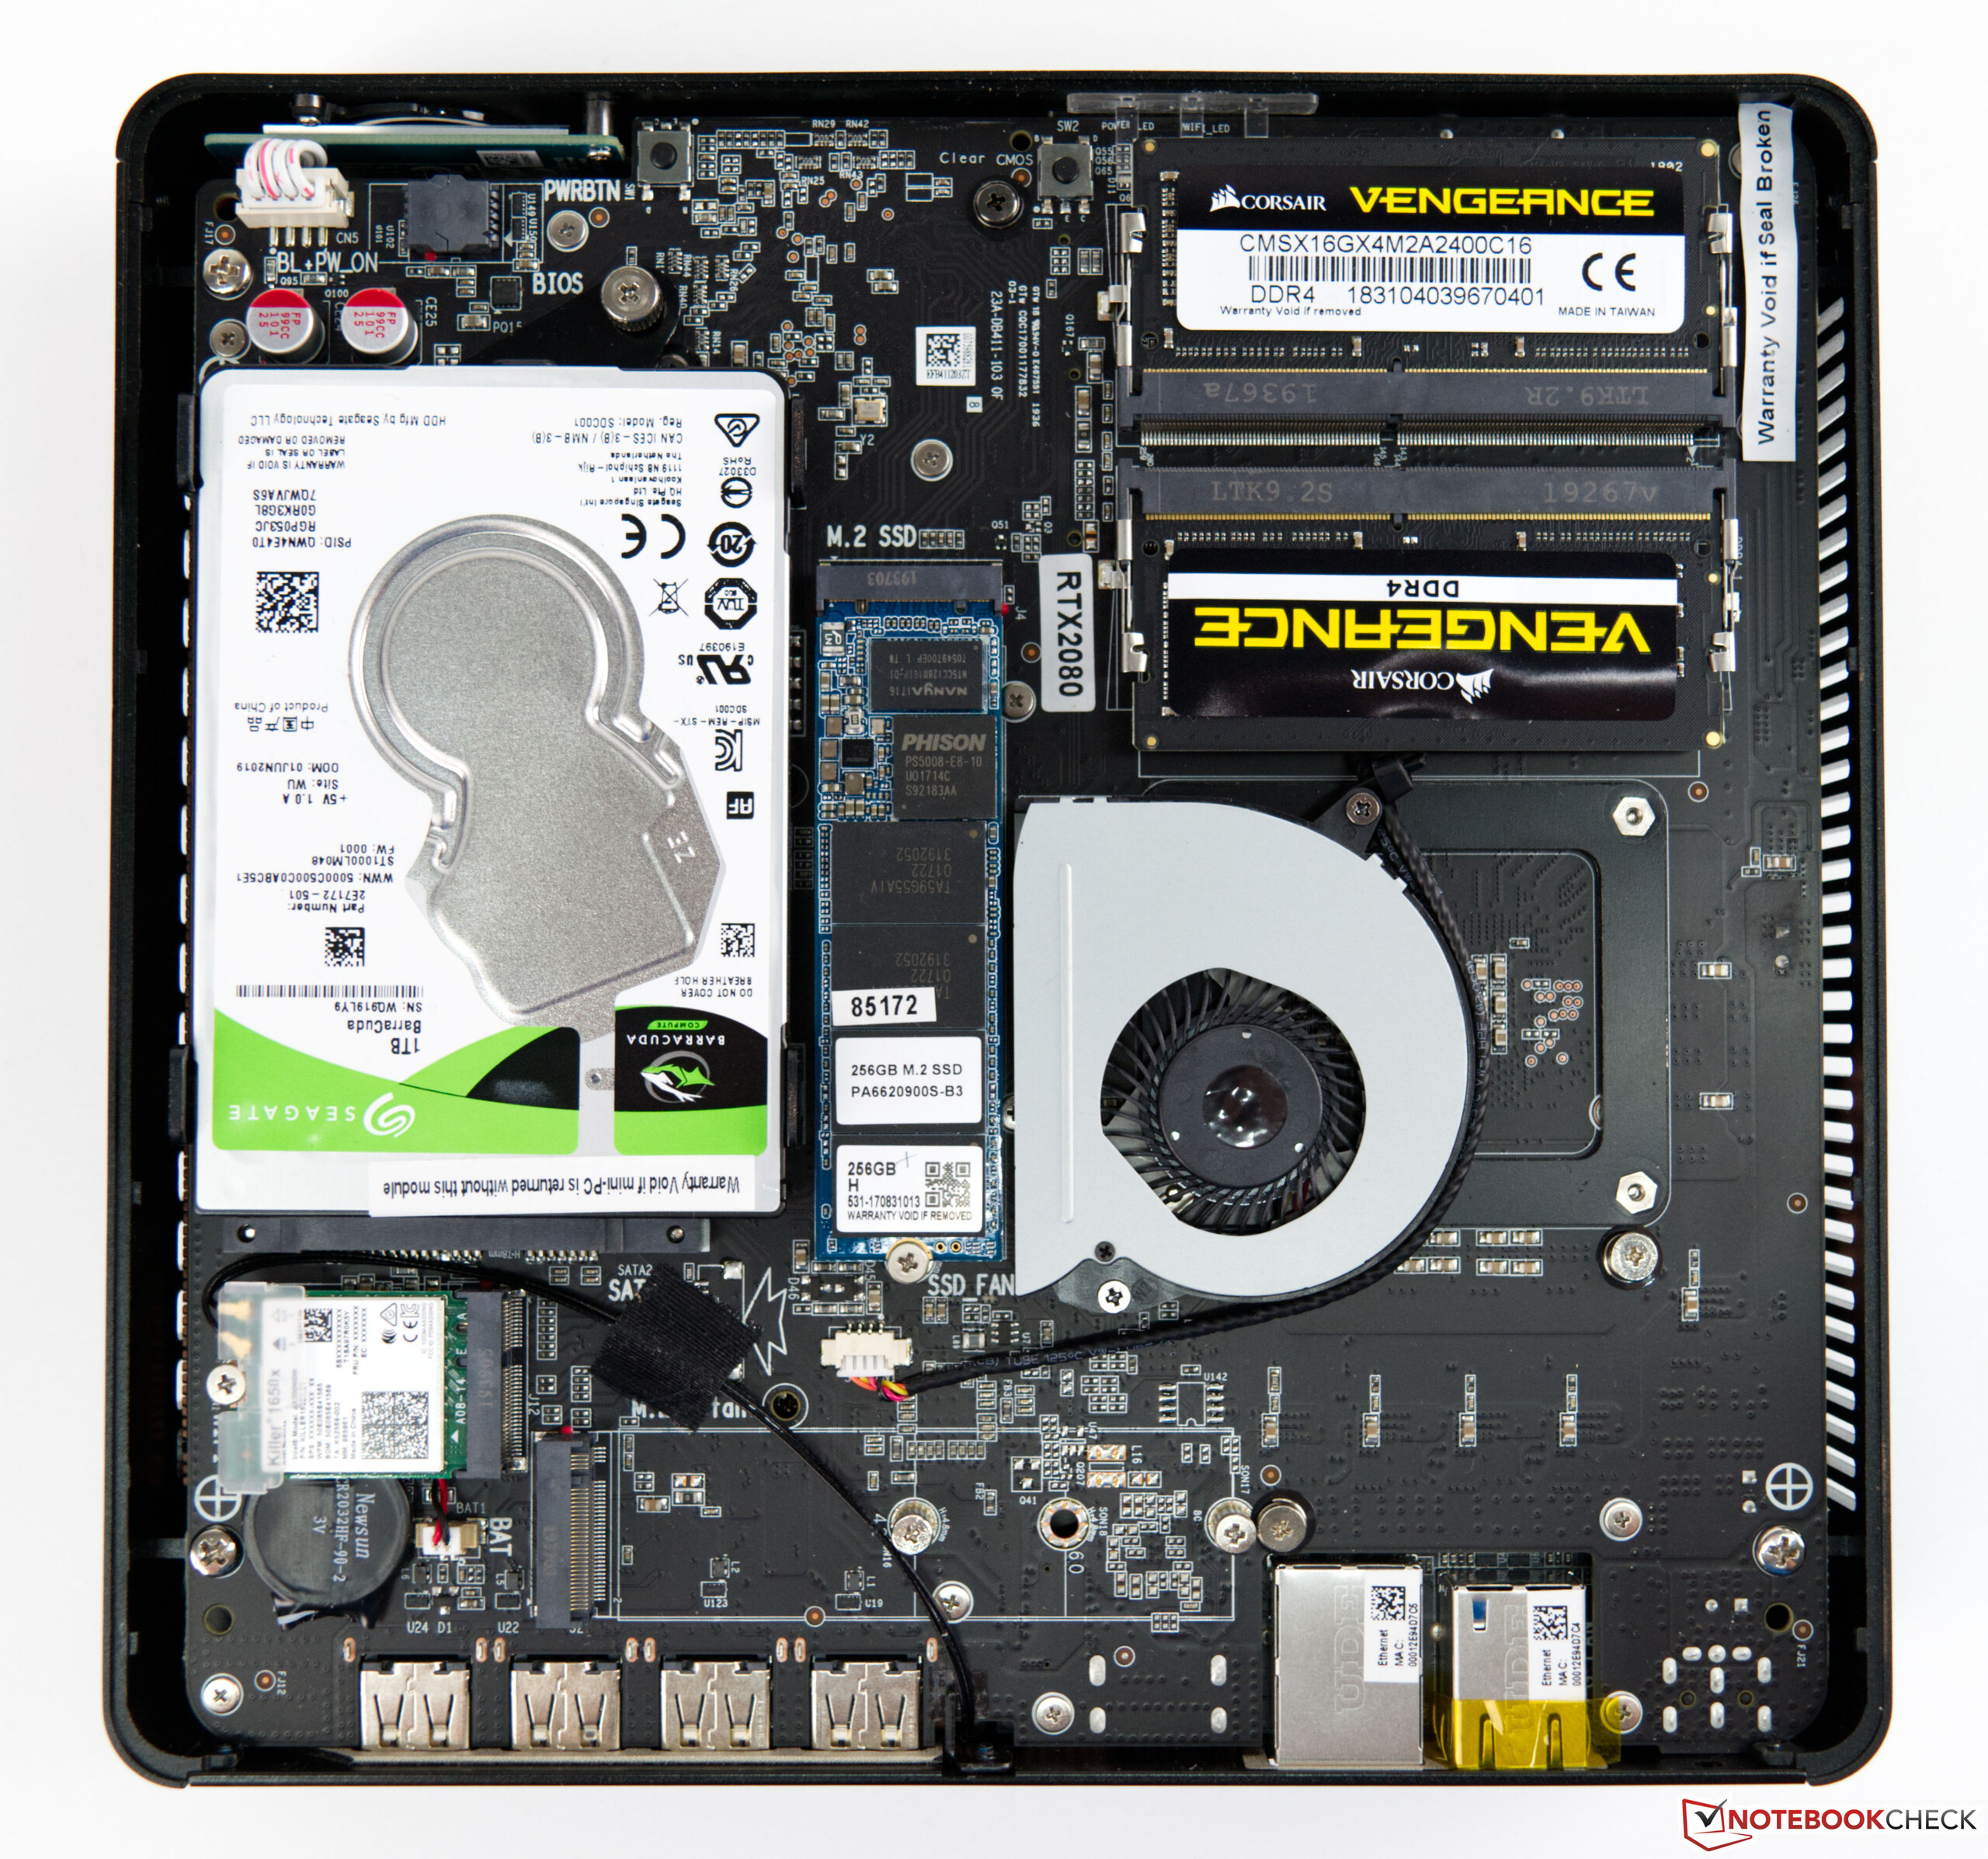
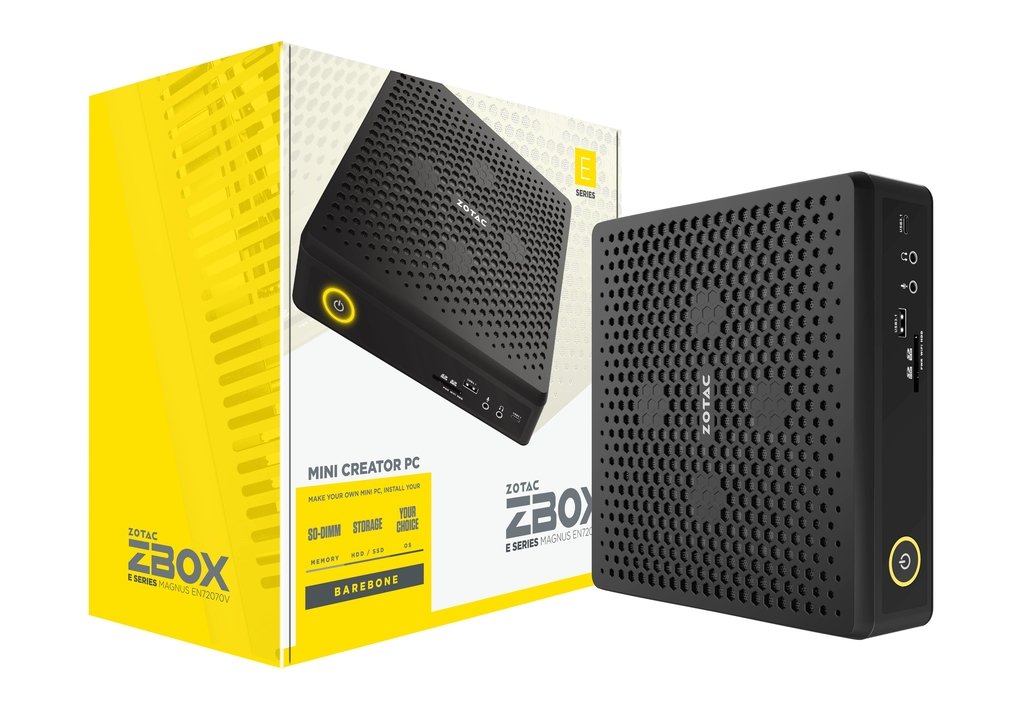
De Zotac ZBOX Magnus is niet zomaar een voorgebouwde pc, maar biedt als barebone-systeem de gebruiker de mogelijkheid om het apparaat naar eigen behoefte aan te vullen. U kunt de opslagapparaten en het type geheugen vrij kiezen. Helaas zijn gebruikers beperkt als het gaat om de processor en de grafische kaart, omdat het achteraf upgraden van deze componenten niet mogelijk is.
We hebben de ZBOX Magnus getest met de Intel Core i7-9750H in combinatie met de Nvidia GeForce RTX 2080 Mobile. Qua pure prestaties draai je alle moderne games soepel met de kleine PC zonder in te boeten aan details. Een WQHD-resolutie is echter vereist. De ZBOX kan ook veel titels in UHD aan, al moet je hier vaak details opofferen. De GeForce RTX 2080 Mobile levert ongeveer dezelfde prestaties als de GeForce RTX 2070 Desktop.
De Zotac ZBOX Magnus is een krachtige gaming-PC in het mini-formaat. Voordat je het koopt, moet je je echter vertrouwd maken met de eigenaardigheden van een barebonesysteem.
Het systeem is zeer voordelig qua volume. Zeer compacte apparaten zijn vaak erg luidruchtig en hebben last van een sterke warmteontwikkeling. Over het geheel genomen heeft Zotac zijn warmteontwikkeling goed onder controle, en ook het geluidsniveau onder belasting is goed met net geen 39 dB (A).
Wie 1.700 euro in het barebone-systeem wilt investeren, kent nu de voor- en nadelen die de ZBOX Magnus biedt. Qua prijs geven zowel Intel met de Ghost Canyon NUC als Zotac met de ZBOX Magnus niet gemakkelijk toe. Houd er echter rekening mee dat de Ghost Canyon NUC geen discrete grafische kaart inbegrepen heeft in de aankoopprijs. Bijgevolg gaat dit punt duidelijk naar Zotac.
