Schenker Vision 16 Pro 2023 review: 1.6 kg licht en krachtig pakket met RTX 4070 Laptop
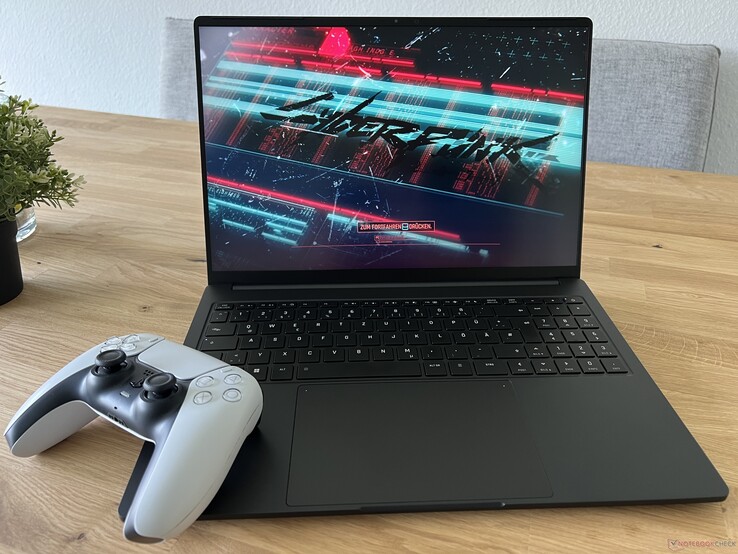
Schenker heeft de Vision 16 Pro geüpdatet voor 2023 en biedt opnieuw een extreem lichte 16-inch laptop met zeer hoge prestaties. De processor is geüpgraded naar Intel's huidige Core i7-13700H Raptor Lake chip, en als grafische kaart kun je kiezen voor de nieuwe GeForce RTX 4060 laptop of deRTX 4070 Laptopelk met een maximale TGP van 95 watt. Naast deze twee updates zijn er ook enkele verbeteringen in het koelsysteem (nieuwe ventilatoren), en naast de processor maakt nu ook de GPU gebruik van liquid metal koeling voor optimale warmteoverdracht.
De prijs van het nieuwe model met de Core i7-13700H, GeForce RTX 4060 Laptop, 16 GB RAM en een 500-GB SSD begint vanaf 2.099 euro (~$2361). Onze testconfiguratie met de snellere RTX 4070 laptop, 32 GB RAM, een SSD van 1 TB en Windows 11 voorgeïnstalleerd kost ongeveer 2.600 euro (~$2.924), wat ook overeenkomt met de prijs van de voorganger.
Potentiële concurrenten in vergelijking
Evaluatie | Datum | Model | Gewicht | Hoogte | Formaat | Resolutie | Beste prijs |
|---|---|---|---|---|---|---|---|
| 88.6 % v7 (old) | 07-2023 | Schenker VISION 16 Pro (M23) i7-13700H, GeForce RTX 4070 Laptop GPU | 1.6 kg | 17.1 mm | 16.00" | 2560x1600 | |
| 88.8 % v7 (old) | 05-2023 | Samsung Galaxy Book3 Ultra 16, i9-13900H RTX 4070 i9-13900H, GeForce RTX 4070 Laptop GPU | 1.8 kg | 16.8 mm | 16.00" | 2880x1800 | |
| 88.8 % v7 (old) | 07-2023 | MSI Stealth 16 Studio A13VG i7-13700H, GeForce RTX 4070 Laptop GPU | 2 kg | 19.95 mm | 16.00" | 2560x1600 | |
| 90.3 % v7 (old) | 04-2023 | Dell XPS 15 9530 RTX 4070 i7-13700H, GeForce RTX 4070 Laptop GPU | 1.9 kg | 18 mm | 15.60" | 3456x2160 | |
| 86.1 % v7 (old) | 06-2023 | Asus ProArt Studiobook 16 OLED H7604 i9-13980HX, GeForce RTX 4070 Laptop GPU | 2.4 kg | 23.9 mm | 16.00" | 3200x2000 | |
| 93.7 % v7 (old) | 03-2023 | Apple MacBook Pro 16 2023 M2 Max M2 Max, M2 Max 38-Core GPU | 2.2 kg | 16.8 mm | 16.20" | 3456x2234 |
Top 10 Testrapporten
» Top 10 Multimedia Notebooks
» Top 10 Gaming-Notebooks
» Top 10 Budget Gaming Laptops
» Top 10 Lichtgewicht Gaming-Notebooks
» Top 10 Premium Office/Business-Notebooks
» Top 10 Budget Office/Business-Notebooks
» Top 10 Workstation-Laptops
» Top 10 Subnotebooks
» Top 10 Ultrabooks
» Top 10 Notebooks tot €300
» Top 10 Notebooks tot €500
» Top 10 Notebooks tot € 1.000De beste notebookbeeldschermen zoals getest door Notebookcheck
» De beste notebookbeeldschermen
» Top Windows Alternatieven voor de MacBook Pro 13
» Top Windows Alternatieven voor de MacBook Pro 15
» Top Windows alternatieven voor de MacBook 12 en Air
» Top 10 best verkopende notebooks op Amazon
» Top 10 Convertible Notebooks
» Top 10 Tablets
» Top 10 Tablets tot € 250
» Top 10 Smartphones
» Top 10 Phablets (>90cm²)
» Top 10 Camera Smartphones
» Top 10 Smartphones tot €500
» Top 10 best verkopende smartphones op Amazon
Behuizing - Lichte magnesiumbehuizing van 1,6 kg (~3,5 lb)
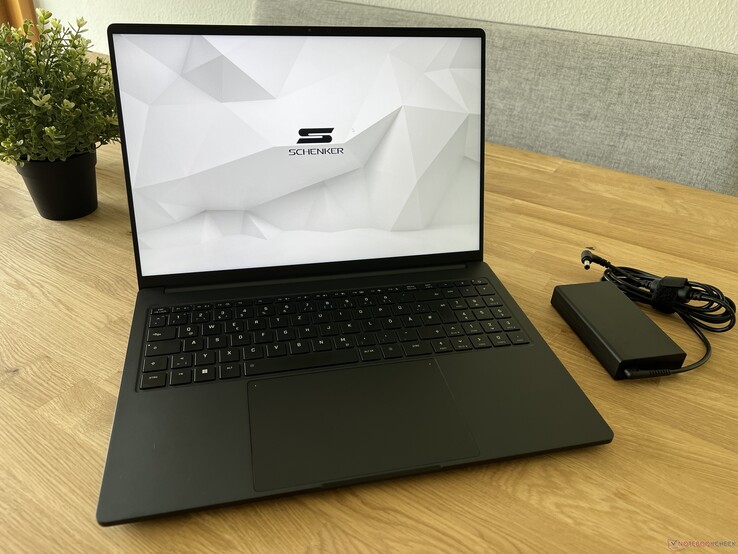
Sinds vorig jaar heeft Schenker niets veranderd aan de behuizing, en deze keer hebben we de zwarte versie in onze test. Zonder contrasten ziet hij er veel onopvallender uit dan de zilveren versie. Met slechts 1,6 kg (~3,5 lb) blijft de magnesium behuizing (basiseenheid en schermdeksel) extreem licht voor een snelle 16-inch laptop. De basiseenheid is zeer robuust en alleen het midden van het toetsenbord kan minimaal worden ingedrukt, zonder dat dit problemen oplevert bij dagelijks gebruik. Het dunne beeldschermdeksel is iets flexibeler en de scharnieren laten nog steeds zichtbaar wiebelen toe.
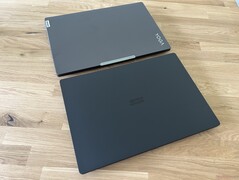
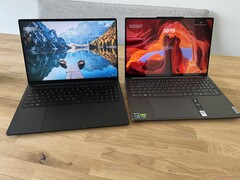
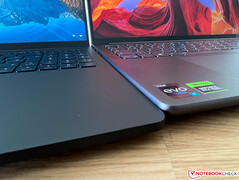
In de groottevergelijking is de Vision 16 Pro ook veruit de meest compacte en tegelijkertijd lichtste laptop. We hebben ook een paar vergelijkende foto's gemaakt met de nieuwe Lenovo Yoga Pro 9 16, die we momenteel ook aan het testen zijn. Hun voetafdrukken zijn vrijwel identiek, maar je kunt het verschil zien in de hoogte van met name de basiseenheid.
Uitrusting - Thunderbolt en kaartlezer
Ondanks de slanke behuizing biedt de Vision 16 Pro alle belangrijke aansluitingen, waaronder Thunderbolt 4 en 2x USB-A, waardoor adapters in de praktijk overbodig zijn. De aansluitingen zijn verdeeld over beide zijden en bevinden zich aan de achterkant. Onderweg kun je de laptop ook opladen via USB-C (min. 65 watt, max. 100 watt). Vergeleken met het model van vorig jaar is de kaartlezer aanzienlijk trager geworden, wat we hebben getest met twee SD-kaarten. Je moet ook enkele kleine compromissen accepteren in de WLAN module, aangezien de antenneconfiguratie van de Vision 16 Pro geen 6-GHz netwerken (Wi-Fi 6E) ondersteunt. De AX201 module van Intel wordt nog steeds gebruikt (Wi-Fi 6) en de overdrachtssnelheden zijn erg goed. De 1080p webcam maakt fatsoenlijke opnames in redelijke lichtomstandigheden. Daarnaast is er ook een IR-module voor gezichtsherkenning via Windows Hello.
| SD Card Reader | |
| average JPG Copy Test (av. of 3 runs) | |
| Apple MacBook Pro 16 2023 M2 Max (Angelbird AV Pro V60) | |
| MSI Stealth 16 Studio A13VG | |
| Dell XPS 15 9530 RTX 4070 (Toshiba Exceria Pro SDXC 64 GB UHS-II) | |
| Gemiddelde van klas Multimedia (21.1 - 198, n=43, laatste 2 jaar) | |
| Schenker Vision 16 Pro RTX 3070 Ti (AV Pro V60) | |
| Samsung Galaxy Book3 Ultra 16, i9-13900H RTX 4070 (AV Pro SD microSD 128 GB V60) | |
| Asus ProArt Studiobook 16 OLED H7604 (Angelibird AV Pro V60) | |
| Schenker VISION 16 Pro (M23) (Angelbird AV Pro V60) | |
| maximum AS SSD Seq Read Test (1GB) | |
| Apple MacBook Pro 16 2023 M2 Max (Angelbird AV Pro V60) | |
| Dell XPS 15 9530 RTX 4070 (Toshiba Exceria Pro SDXC 64 GB UHS-II) | |
| MSI Stealth 16 Studio A13VG | |
| Gemiddelde van klas Multimedia (27.4 - 262, n=43, laatste 2 jaar) | |
| Samsung Galaxy Book3 Ultra 16, i9-13900H RTX 4070 (AV Pro SD microSD 128 GB V60) | |
| Asus ProArt Studiobook 16 OLED H7604 (Angelibird AV Pro V60) | |
| Schenker Vision 16 Pro RTX 3070 Ti (AV Pro V60) | |
| Schenker VISION 16 Pro (M23) (Angelbird AV Pro V60) | |
| Networking | |
| Schenker VISION 16 Pro (M23) | |
| iperf3 transmit AXE11000 | |
| iperf3 receive AXE11000 | |
| Samsung Galaxy Book3 Ultra 16, i9-13900H RTX 4070 | |
| iperf3 transmit AXE11000 | |
| iperf3 receive AXE11000 | |
| iperf3 transmit AXE11000 6GHz | |
| iperf3 receive AXE11000 6GHz | |
| MSI Stealth 16 Studio A13VG | |
| iperf3 transmit AXE11000 | |
| iperf3 receive AXE11000 | |
| iperf3 transmit AXE11000 6GHz | |
| iperf3 receive AXE11000 6GHz | |
| Dell XPS 15 9530 RTX 4070 | |
| iperf3 transmit AXE11000 | |
| iperf3 receive AXE11000 | |
| Asus ProArt Studiobook 16 OLED H7604 | |
| iperf3 transmit AXE11000 | |
| iperf3 receive AXE11000 | |
| Apple MacBook Pro 16 2023 M2 Max | |
| iperf3 transmit AXE11000 6GHz | |
| iperf3 receive AXE11000 6GHz | |
| Schenker Vision 16 Pro RTX 3070 Ti | |
| iperf3 transmit AXE11000 | |
| iperf3 receive AXE11000 | |
Onderhoud
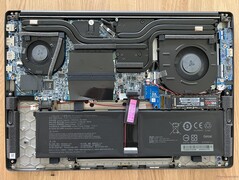
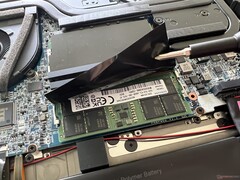
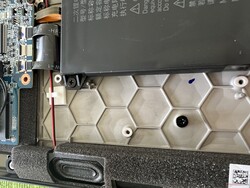
De onderkant van de behuizing zit vast met een paar gewone kruiskopschroeven en kan gemakkelijk worden verwijderd. Binnenin kun je zien dat afgezien van een kleine verandering in de plaatsing van de heat pipes, de configuratie in principe identiek is. De gebruikers hebben toegang tot de twee ventilatoren, de SO-DIMM slots en de twee slots voor de M.2 2280 SSD's, waarbij alleen een enkelzijdige tweede SSD wordt ondersteund.
Invoerapparaten - Groot ClickPad en cijferblok
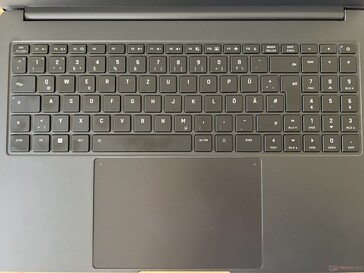
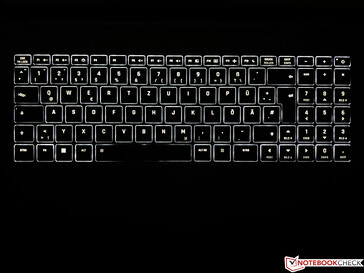
Het full-size toetsenbord biedt een speciaal cijferblok inclusief grote pijltjestoetsen, maar dat betekent ook dat er geen extra Enter-toets is en dat de grootte van de Shift-toets is verkleind. Over het geheel genomen is het toetsenbord zeer nauwkeurig en comfortabel en de toetsaanslagen zijn ook aangenaam stil, waarbij alleen de spatie- en entertoetsen iets luider zijn. In donkere omgevingen is de witte, tweestaps toetsenbordverlichting handig. Het enorme ClickPad van glas (15,4 x 10 cm) kan gemakkelijk worden bediend en biedt veel ruimte voor gebaren en cursorbewegingen. Alleen de klikgeluiden zijn een beetje hard.
Beeldscherm - WQHD-paneel met 240 Hz
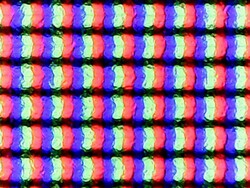
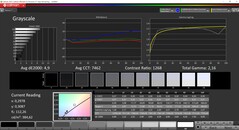
Het beeldscherm is ongewijzigd gebleven en is nog steeds een mat WQHD-paneel met een resolutie van 2.560 x 1.600 pixels en een verversingssnelheid van 240 Hz. De subjectieve beeldindruk is erg goed, omdat zelfs heldere gebieden zonder korreligheid worden weergegeven. De helderheid van het paneel (NE160QDM-NZ1) wordt opgegeven als 350 cd/m² en ons paneel overtreft dit zelfs lichtjes met een gemiddelde van 370 cd/m². De zwartwaarde is een fatsoenlijke 0,3 cd/m², wat leidt tot een goede contrastverhouding van meer dan 1.200:1.
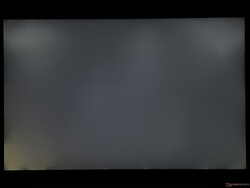
De 240 Hz verversingssnelheid zorgt voor een zeer vloeiende indruk bij bewegingen en de responstijden zijn ook snel. Lichthalo's zijn alleen zichtbaar in donkere beelden bij volledige helderheid, maar dit zal in de praktijk geen probleem zijn. PWM wordt niet gebruikt.
| |||||||||||||||||||||||||
Helderheidsverdeling: 88 %
Helderheid in Batterij-modus: 384 cd/m²
Contrast: 1280:1 (Zwart: 0.3 cd/m²)
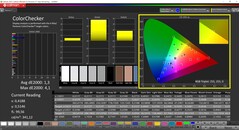
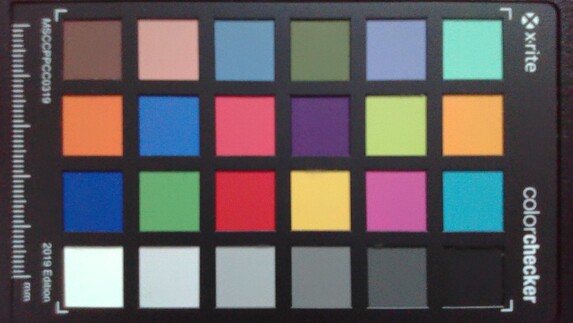
ΔE ColorChecker Calman: 3.4 | ∀{0.5-29.43 Ø4.77}
calibrated: 1.3
ΔE Greyscale Calman: 3.4 | ∀{0.09-98 Ø5}
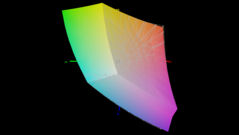
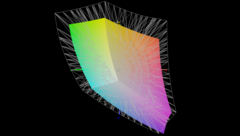
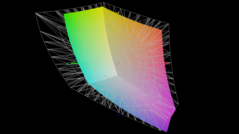
70% AdobeRGB 1998 (Argyll 3D)
98.8% sRGB (Argyll 3D)
68.8% Display P3 (Argyll 3D)
Gamma: 2.16
CCT: 7462 K
| Schenker VISION 16 Pro (M23) NE160QDM-NZ1, IPS, 2560x1600, 16" | Samsung Galaxy Book3 Ultra 16, i9-13900H RTX 4070 Samsung SDC4185 ATNA60CL03-0, OLED / AMOLED, 2880x1800, 16" | MSI Stealth 16 Studio A13VG AUO26A9, IPS, 2560x1600, 16" | Dell XPS 15 9530 RTX 4070 Samsung 156XG01, OLED, 3456x2160, 15.6" | Asus ProArt Studiobook 16 OLED H7604 ATNA60BX01-1, OLED, 3200x2000, 16" | Apple MacBook Pro 16 2023 M2 Max Mini-LED, 3456x2234, 16.2" | Schenker Vision 16 Pro RTX 3070 Ti N160QDM-NZ1, IPS, 2560x1600, 16" | |
|---|---|---|---|---|---|---|---|
| Display | 26% | 21% | 29% | 25% | 24% | -1% | |
| Display P3 Coverage (%) | 68.8 | 95.3 39% | 96.4 40% | 99.8 45% | 99.6 45% | 99 44% | 68.7 0% |
| sRGB Coverage (%) | 98.8 | 99.1 0% | 99.7 1% | 100 1% | 100 1% | 100 1% | 96.7 -2% |
| AdobeRGB 1998 Coverage (%) | 70 | 97.4 39% | 84.8 21% | 98.4 41% | 89.4 28% | 88.5 26% | 70 0% |
| Response Times | 80% | 50% | 82% | 93% | -486% | -5% | |
| Response Time Grey 50% / Grey 80% * (ms) | 13.7 ? | 2 ? 85% | 4.4 ? 68% | 1.68 ? 88% | 0.59 ? 96% | 80.5 ? -488% | 14.3 ? -4% |
| Response Time Black / White * (ms) | 8.1 ? | 2 ? 75% | 5.6 ? 31% | 1.94 ? 76% | 0.79 ? 90% | 47.2 ? -483% | 8.6 ? -6% |
| PWM Frequency (Hz) | 250 ? | 239 | 240 ? | 14880 ? | |||
| Screen | 21% | -16% | 0% | 159% | 4950% | -14% | |
| Brightness middle (cd/m²) | 384 | 403 5% | 424 10% | 389.5 1% | 349 -9% | 504 31% | 364 -5% |
| Brightness (cd/m²) | 371 | 408 10% | 411 11% | 392 6% | 350 -6% | 487 31% | 347 -6% |
| Brightness Distribution (%) | 88 | 98 11% | 88 0% | 98 11% | 95 8% | 94 7% | 89 1% |
| Black Level * (cd/m²) | 0.3 | 0.37 -23% | 0.02 93% | 0.001 100% | 0.3 -0% | ||
| Contrast (:1) | 1280 | 1146 -10% | 17450 1263% | 504000 39275% | 1213 -5% | ||
| Colorchecker dE 2000 * | 3.4 | 2.63 23% | 3.04 11% | 4.95 -46% | 2.1 38% | 1.5 56% | 3.3 3% |
| Colorchecker dE 2000 max. * | 9.2 | 4.07 56% | 7.5 18% | 8.65 6% | 5.5 40% | 3.3 64% | 6.6 28% |
| Colorchecker dE 2000 calibrated * | 1.3 | 3.04 -134% | 1.53 -18% | 2.1 -62% | 2.5 -92% | ||
| Greyscale dE 2000 * | 3.4 | 2.69 21% | 4.34 -28% | 2 41% | 1.2 65% | 2.1 38% | 5.2 -53% |
| Gamma | 2.16 102% | 2.48 89% | 2.32 95% | 2.27 97% | 2.19 100% | 2.25 98% | 2.14 103% |
| CCT | 7462 87% | 6907 94% | 6952 93% | 6265 104% | 6545 99% | 6882 94% | 6331 103% |
| Totaal Gemiddelde (Programma / Instellingen) | 42% /
33% | 18% /
1% | 37% /
21% | 92% /
121% | 1496% /
2977% | -7% /
-10% |
* ... kleiner is beter
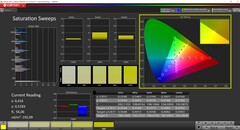
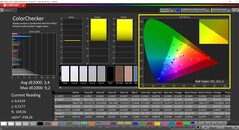
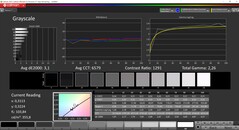
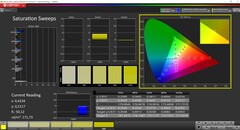
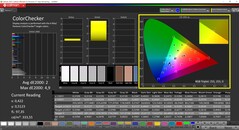
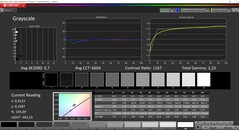
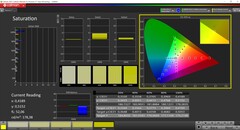
We meten het paneel bij levering met de professionele CalMAN software. Het heeft een aanzienlijke blauwe tint en de kleurtemperatuur is ook te koel. Schenker biedt de mogelijkheid om een gekalibreerd profiel te downloaden in het Control Center, waarna het automatisch wordt gedownload met behulp van het serienummer. Hoewel dit de situatie verbetert en ook de kleurtint wegneemt, verlaagt het ook de maximale helderheid een beetje met ongeveer 30 cd/m². Dit is niet echt een perfecte oplossing, zoals we binnenkort zullen zien, maar degenen die niet in staat zijn om hun paneel te kalibreren (of ons gekalibreerde profiel te downloaden via de bovenstaande link) zullen hier toch een merkbare verbetering krijgen.
Met behulp van onze eigen kalibratie zijn we in staat de weergave verder te verbeteren, waarbij de grijstinten nu op referentieniveau liggen en vooral de kleurafwijkingen nog lager zijn. Er zijn echter nog steeds enkele uitschieters in de blauwe kleurtonen waar de afwijkingen minimaal boven de belangrijke streefwaarde van 3 liggen. Maar over het algemeen is het paneel nog steeds heel geschikt voor beeldverwerking in de kleine sRGB-kleurruimte die praktisch volledig wordt gedekt.
Responstijd Scherm
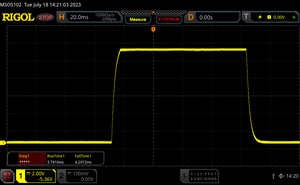
| ↔ Responstijd Zwart naar Wit | ||
|---|---|---|
| 8.1 ms ... stijging ↗ en daling ↘ gecombineerd | ↗ 3.8 ms stijging | |
| ↘ 4.3 ms daling | ||
| Het scherm vertoonde snelle responstijden in onze tests en zou geschikt moeten zijn voor games. Ter vergelijking: alle testtoestellen variëren van 0.1 (minimum) tot 240 (maximum) ms. » 22 % van alle toestellen zijn beter. Dit betekent dat de gemeten responstijd beter is dan het gemiddelde (20.2 ms) van alle geteste toestellen. | ||
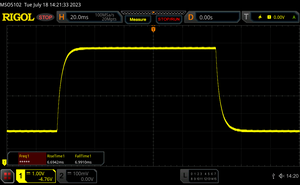
| ↔ Responstijd 50% Grijs naar 80% Grijs | ||
| 13.7 ms ... stijging ↗ en daling ↘ gecombineerd | ↗ 6.7 ms stijging | |
| ↘ 7 ms daling | ||
| Het scherm vertoonde prima responstijden in onze tests maar is misschien wat te traag voor competitieve games. Ter vergelijking: alle testtoestellen variëren van 0.165 (minimum) tot 636 (maximum) ms. » 26 % van alle toestellen zijn beter. Dit betekent dat de gemeten responstijd beter is dan het gemiddelde (31.5 ms) van alle geteste toestellen. | ||
Screen Flickering / PWM (Pulse-Width Modulation)
| Screen flickering / PWM niet waargenomen | |||
Ter vergelijking: 53 % van alle geteste toestellen maakten geen gebruik van PWM om de schermhelderheid te verlagen. Als het wel werd gebruikt, werd een gemiddelde van 8070 (minimum: 5 - maximum: 343500) Hz waargenomen. | |||
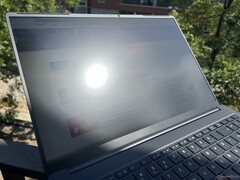
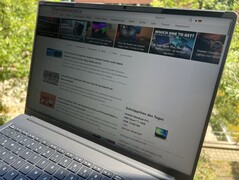
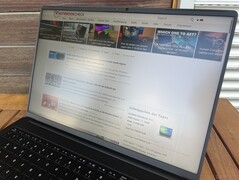
Zolang je reflecties van directe lichtbronnen vermijdt, kan de Vision 16 Pro ook zonder problemen in een heldere omgeving worden gebruikt. De stabiliteit van de kijkhoek is over het algemeen goed, maar er is zichtbare helderheid en verminderd contrast wanneer je vanuit een hoek boven je kijkt.
Prestaties - RTX 4070 Laptop met 95 watt
Testomstandigheden
Schenker biedt verschillende energieprofielen in het Control Center, maar in tegenstelling tot de voorganger is er geen handmatig profiel meer waarmee je de TDP-limieten van de processor kunt instellen. We hebben de benchmarks en metingen opnieuw uitgevoerd in de Enthusiast Performance-modus, die de TDP-waarden van de processor instelt op 60/45 watt (of 55/35 watt als de dGPU is geactiveerd). De GPU verbruikt hier 95 watt (70W TGP + 25W Dynamic Boost), en in de Enthusiast Balanced modus is dat 85 watt (60 + 25W).
Processor - Core i7-13700H
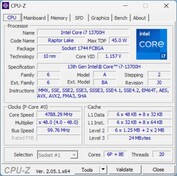
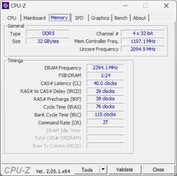
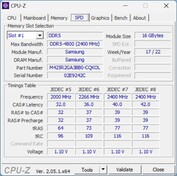
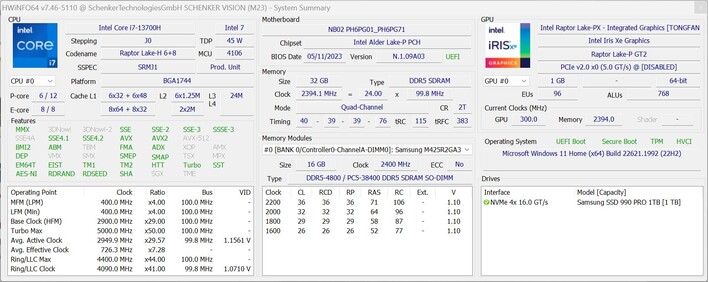
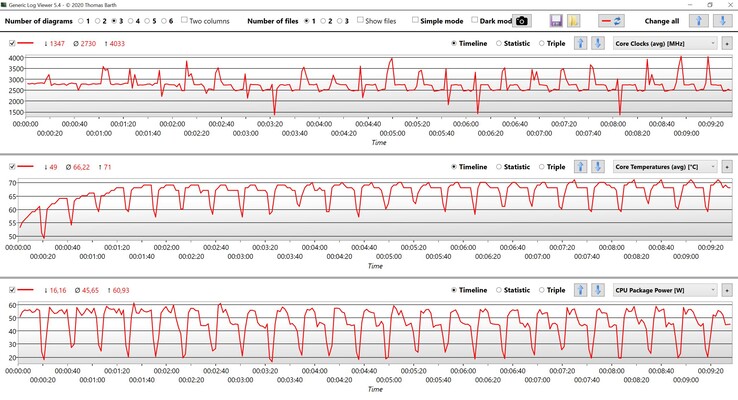
De Core i7-13700H van Intels huidige Raptor Lake generatie is de directe opvolger van de Core i7-12700H, en er zijn geen veranderingen behalve een paar kleine verhogingen in de maximale kloksnelheden. De Vision 16 Pro is een van de weinige apparaten zonder extreem hoge vermogenslimieten van meer dan 100 watt. Dit heeft enkele voordelen bij dagelijks gebruik, omdat de temperaturen niet zo snel omhoog schieten en er ook niet zo'n sterke prestatiedaling is onder constante belasting. Aan de andere kant zijn de multi-core prestaties onder korte belasting ook lager dan die van de concurrenten en slechts iets hoger dan in het oudere model. In turbomodus was het oude model zelfs aanzienlijk sneller. In batterijmodus is het stroomverbruik beperkt tot 36 watt, waardoor de multi-core prestaties zonder oplader met 20% afnemen. Je kunt meer CPU benchmarks vinden in onze technische sectie.
Cinebench R15 Multi Constant Load Test
Cinebench R23: Multi Core | Single Core
Cinebench R20: CPU (Multi Core) | CPU (Single Core)
Cinebench R15: CPU Multi 64Bit | CPU Single 64Bit
Blender: v2.79 BMW27 CPU
7-Zip 18.03: 7z b 4 | 7z b 4 -mmt1
Geekbench 5.5: Multi-Core | Single-Core
HWBOT x265 Benchmark v2.2: 4k Preset
LibreOffice : 20 Documents To PDF
R Benchmark 2.5: Overall mean
| CPU Performance rating | |
| Asus ProArt Studiobook 16 OLED H7604 | |
| MSI Stealth 16 Studio A13VG | |
| Apple MacBook Pro 16 2023 M2 Max -6! | |
| Dell XPS 15 9530 RTX 4070 | |
| Schenker VISION 16 Pro (M23) | |
| Gemiddelde van klas Multimedia | |
| Gemiddeld Intel Core i7-13700H | |
| Schenker Vision 16 Pro RTX 3070 Ti | |
| Samsung Galaxy Book3 Ultra 16, i9-13900H RTX 4070 | |
| Cinebench R23 / Multi Core | |
| Asus ProArt Studiobook 16 OLED H7604 | |
| MSI Stealth 16 Studio A13VG | |
| Gemiddelde van klas Multimedia (4861 - 33362, n=78, laatste 2 jaar) | |
| Dell XPS 15 9530 RTX 4070 | |
| Gemiddeld Intel Core i7-13700H (5890 - 20034, n=29) | |
| Apple MacBook Pro 16 2023 M2 Max | |
| Schenker VISION 16 Pro (M23) | |
| Samsung Galaxy Book3 Ultra 16, i9-13900H RTX 4070 | |
| Schenker Vision 16 Pro RTX 3070 Ti | |
| Cinebench R23 / Single Core | |
| Asus ProArt Studiobook 16 OLED H7604 | |
| Schenker VISION 16 Pro (M23) | |
| Gemiddelde van klas Multimedia (1128 - 2459, n=70, laatste 2 jaar) | |
| MSI Stealth 16 Studio A13VG | |
| Dell XPS 15 9530 RTX 4070 | |
| Schenker Vision 16 Pro RTX 3070 Ti | |
| Gemiddeld Intel Core i7-13700H (1323 - 1914, n=29) | |
| Apple MacBook Pro 16 2023 M2 Max | |
| Samsung Galaxy Book3 Ultra 16, i9-13900H RTX 4070 | |
| Cinebench R20 / CPU (Multi Core) | |
| Asus ProArt Studiobook 16 OLED H7604 | |
| MSI Stealth 16 Studio A13VG | |
| Gemiddelde van klas Multimedia (1887 - 12912, n=61, laatste 2 jaar) | |
| Dell XPS 15 9530 RTX 4070 | |
| Gemiddeld Intel Core i7-13700H (2322 - 7674, n=29) | |
| Schenker VISION 16 Pro (M23) | |
| Schenker Vision 16 Pro RTX 3070 Ti | |
| Samsung Galaxy Book3 Ultra 16, i9-13900H RTX 4070 | |
| Apple MacBook Pro 16 2023 M2 Max | |
| Cinebench R20 / CPU (Single Core) | |
| Asus ProArt Studiobook 16 OLED H7604 | |
| Schenker VISION 16 Pro (M23) | |
| MSI Stealth 16 Studio A13VG | |
| Schenker Vision 16 Pro RTX 3070 Ti | |
| Gemiddelde van klas Multimedia (420 - 853, n=61, laatste 2 jaar) | |
| Dell XPS 15 9530 RTX 4070 | |
| Gemiddeld Intel Core i7-13700H (508 - 741, n=29) | |
| Apple MacBook Pro 16 2023 M2 Max | |
| Samsung Galaxy Book3 Ultra 16, i9-13900H RTX 4070 | |
| Cinebench R15 / CPU Multi 64Bit | |
| Asus ProArt Studiobook 16 OLED H7604 | |
| MSI Stealth 16 Studio A13VG | |
| Schenker Vision 16 Pro RTX 3070 Ti | |
| Schenker Vision 16 Pro RTX 3070 Ti | |
| Dell XPS 15 9530 RTX 4070 | |
| Gemiddelde van klas Multimedia (856 - 5224, n=67, laatste 2 jaar) | |
| Gemiddeld Intel Core i7-13700H (905 - 2982, n=29) | |
| Schenker VISION 16 Pro (M23) | |
| Samsung Galaxy Book3 Ultra 16, i9-13900H RTX 4070 | |
| Apple MacBook Pro 16 2023 M2 Max | |
| Cinebench R15 / CPU Single 64Bit | |
| Asus ProArt Studiobook 16 OLED H7604 | |
| Schenker VISION 16 Pro (M23) | |
| MSI Stealth 16 Studio A13VG | |
| Dell XPS 15 9530 RTX 4070 | |
| Gemiddelde van klas Multimedia (99.6 - 326, n=64, laatste 2 jaar) | |
| Schenker Vision 16 Pro RTX 3070 Ti | |
| Gemiddeld Intel Core i7-13700H (213 - 278, n=29) | |
| Apple MacBook Pro 16 2023 M2 Max | |
| Samsung Galaxy Book3 Ultra 16, i9-13900H RTX 4070 | |
| Blender / v2.79 BMW27 CPU | |
| Schenker Vision 16 Pro RTX 3070 Ti | |
| Gemiddelde van klas Multimedia (100 - 557, n=62, laatste 2 jaar) | |
| Samsung Galaxy Book3 Ultra 16, i9-13900H RTX 4070 | |
| Gemiddeld Intel Core i7-13700H (169 - 555, n=29) | |
| Schenker VISION 16 Pro (M23) | |
| Dell XPS 15 9530 RTX 4070 | |
| MSI Stealth 16 Studio A13VG | |
| Asus ProArt Studiobook 16 OLED H7604 | |
| 7-Zip 18.03 / 7z b 4 | |
| Asus ProArt Studiobook 16 OLED H7604 | |
| MSI Stealth 16 Studio A13VG | |
| Schenker VISION 16 Pro (M23) | |
| Gemiddeld Intel Core i7-13700H (27322 - 76344, n=29) | |
| Gemiddelde van klas Multimedia (29095 - 130368, n=60, laatste 2 jaar) | |
| Dell XPS 15 9530 RTX 4070 | |
| Schenker Vision 16 Pro RTX 3070 Ti | |
| Samsung Galaxy Book3 Ultra 16, i9-13900H RTX 4070 | |
| 7-Zip 18.03 / 7z b 4 -mmt1 | |
| Asus ProArt Studiobook 16 OLED H7604 | |
| Schenker VISION 16 Pro (M23) | |
| MSI Stealth 16 Studio A13VG | |
| Dell XPS 15 9530 RTX 4070 | |
| Gemiddeld Intel Core i7-13700H (4825 - 6238, n=29) | |
| Schenker Vision 16 Pro RTX 3070 Ti | |
| Gemiddelde van klas Multimedia (3666 - 7545, n=60, laatste 2 jaar) | |
| Samsung Galaxy Book3 Ultra 16, i9-13900H RTX 4070 | |
| Geekbench 5.5 / Multi-Core | |
| Asus ProArt Studiobook 16 OLED H7604 | |
| Apple MacBook Pro 16 2023 M2 Max | |
| Dell XPS 15 9530 RTX 4070 | |
| MSI Stealth 16 Studio A13VG | |
| Gemiddelde van klas Multimedia (4652 - 20422, n=61, laatste 2 jaar) | |
| Schenker VISION 16 Pro (M23) | |
| Gemiddeld Intel Core i7-13700H (6165 - 14215, n=29) | |
| Schenker Vision 16 Pro RTX 3070 Ti | |
| Samsung Galaxy Book3 Ultra 16, i9-13900H RTX 4070 | |
| Geekbench 5.5 / Single-Core | |
| Asus ProArt Studiobook 16 OLED H7604 | |
| Apple MacBook Pro 16 2023 M2 Max | |
| Dell XPS 15 9530 RTX 4070 | |
| Schenker VISION 16 Pro (M23) | |
| Gemiddelde van klas Multimedia (805 - 2974, n=61, laatste 2 jaar) | |
| MSI Stealth 16 Studio A13VG | |
| Schenker Vision 16 Pro RTX 3070 Ti | |
| Gemiddeld Intel Core i7-13700H (1362 - 1919, n=29) | |
| Samsung Galaxy Book3 Ultra 16, i9-13900H RTX 4070 | |
| HWBOT x265 Benchmark v2.2 / 4k Preset | |
| Asus ProArt Studiobook 16 OLED H7604 | |
| MSI Stealth 16 Studio A13VG | |
| Gemiddelde van klas Multimedia (5.26 - 36.1, n=60, laatste 2 jaar) | |
| Dell XPS 15 9530 RTX 4070 | |
| Schenker VISION 16 Pro (M23) | |
| Gemiddeld Intel Core i7-13700H (6.72 - 21.2, n=29) | |
| Samsung Galaxy Book3 Ultra 16, i9-13900H RTX 4070 | |
| Schenker Vision 16 Pro RTX 3070 Ti | |
| LibreOffice / 20 Documents To PDF | |
| Samsung Galaxy Book3 Ultra 16, i9-13900H RTX 4070 | |
| MSI Stealth 16 Studio A13VG | |
| Gemiddelde van klas Multimedia (23.9 - 146.7, n=61, laatste 2 jaar) | |
| Gemiddeld Intel Core i7-13700H (31.3 - 62.4, n=29) | |
| Schenker VISION 16 Pro (M23) | |
| Asus ProArt Studiobook 16 OLED H7604 | |
| Dell XPS 15 9530 RTX 4070 | |
| Schenker Vision 16 Pro RTX 3070 Ti | |
| R Benchmark 2.5 / Overall mean | |
| Samsung Galaxy Book3 Ultra 16, i9-13900H RTX 4070 | |
| Gemiddelde van klas Multimedia (0.3604 - 0.947, n=60, laatste 2 jaar) | |
| Gemiddeld Intel Core i7-13700H (0.4308 - 0.607, n=29) | |
| Schenker Vision 16 Pro RTX 3070 Ti | |
| MSI Stealth 16 Studio A13VG | |
| Dell XPS 15 9530 RTX 4070 | |
| Schenker VISION 16 Pro (M23) | |
| Asus ProArt Studiobook 16 OLED H7604 | |
* ... kleiner is beter
AIDA64: FP32 Ray-Trace | FPU Julia | CPU SHA3 | CPU Queen | FPU SinJulia | FPU Mandel | CPU AES | CPU ZLib | FP64 Ray-Trace | CPU PhotoWorxx
| Performance rating | |
| Asus ProArt Studiobook 16 OLED H7604 | |
| MSI Stealth 16 Studio A13VG | |
| Gemiddelde van klas Multimedia | |
| Schenker VISION 16 Pro (M23) | |
| Dell XPS 15 9530 RTX 4070 | |
| Gemiddeld Intel Core i7-13700H | |
| Samsung Galaxy Book3 Ultra 16, i9-13900H RTX 4070 | |
| Schenker Vision 16 Pro RTX 3070 Ti | |
| AIDA64 / FP32 Ray-Trace | |
| Asus ProArt Studiobook 16 OLED H7604 | |
| MSI Stealth 16 Studio A13VG | |
| Gemiddelde van klas Multimedia (2214 - 50388, n=58, laatste 2 jaar) | |
| Samsung Galaxy Book3 Ultra 16, i9-13900H RTX 4070 | |
| Dell XPS 15 9530 RTX 4070 | |
| Gemiddeld Intel Core i7-13700H (4986 - 18908, n=29) | |
| Schenker VISION 16 Pro (M23) | |
| Schenker Vision 16 Pro RTX 3070 Ti | |
| AIDA64 / FPU Julia | |
| Asus ProArt Studiobook 16 OLED H7604 | |
| MSI Stealth 16 Studio A13VG | |
| Gemiddelde van klas Multimedia (12867 - 201874, n=59, laatste 2 jaar) | |
| Schenker VISION 16 Pro (M23) | |
| Gemiddeld Intel Core i7-13700H (25360 - 92359, n=29) | |
| Dell XPS 15 9530 RTX 4070 | |
| Schenker Vision 16 Pro RTX 3070 Ti | |
| Samsung Galaxy Book3 Ultra 16, i9-13900H RTX 4070 | |
| AIDA64 / CPU SHA3 | |
| Asus ProArt Studiobook 16 OLED H7604 | |
| MSI Stealth 16 Studio A13VG | |
| Gemiddelde van klas Multimedia (653 - 8623, n=59, laatste 2 jaar) | |
| Samsung Galaxy Book3 Ultra 16, i9-13900H RTX 4070 | |
| Gemiddeld Intel Core i7-13700H (1339 - 4224, n=29) | |
| Schenker VISION 16 Pro (M23) | |
| Dell XPS 15 9530 RTX 4070 | |
| Schenker Vision 16 Pro RTX 3070 Ti | |
| AIDA64 / CPU Queen | |
| Asus ProArt Studiobook 16 OLED H7604 | |
| MSI Stealth 16 Studio A13VG | |
| Dell XPS 15 9530 RTX 4070 | |
| Schenker VISION 16 Pro (M23) | |
| Gemiddeld Intel Core i7-13700H (59324 - 107159, n=29) | |
| Schenker Vision 16 Pro RTX 3070 Ti | |
| Samsung Galaxy Book3 Ultra 16, i9-13900H RTX 4070 | |
| Gemiddelde van klas Multimedia (13483 - 181505, n=59, laatste 2 jaar) | |
| AIDA64 / FPU SinJulia | |
| Asus ProArt Studiobook 16 OLED H7604 | |
| MSI Stealth 16 Studio A13VG | |
| Gemiddelde van klas Multimedia (1240 - 28794, n=59, laatste 2 jaar) | |
| Schenker VISION 16 Pro (M23) | |
| Gemiddeld Intel Core i7-13700H (4800 - 11050, n=29) | |
| Dell XPS 15 9530 RTX 4070 | |
| Schenker Vision 16 Pro RTX 3070 Ti | |
| Samsung Galaxy Book3 Ultra 16, i9-13900H RTX 4070 | |
| AIDA64 / FPU Mandel | |
| Asus ProArt Studiobook 16 OLED H7604 | |
| MSI Stealth 16 Studio A13VG | |
| Gemiddelde van klas Multimedia (6395 - 105740, n=58, laatste 2 jaar) | |
| Samsung Galaxy Book3 Ultra 16, i9-13900H RTX 4070 | |
| Gemiddeld Intel Core i7-13700H (12321 - 45118, n=29) | |
| Dell XPS 15 9530 RTX 4070 | |
| Schenker VISION 16 Pro (M23) | |
| Schenker Vision 16 Pro RTX 3070 Ti | |
| AIDA64 / CPU AES | |
| Asus ProArt Studiobook 16 OLED H7604 | |
| MSI Stealth 16 Studio A13VG | |
| Gemiddeld Intel Core i7-13700H (28769 - 151254, n=29) | |
| Gemiddelde van klas Multimedia (13243 - 152179, n=59, laatste 2 jaar) | |
| Schenker VISION 16 Pro (M23) | |
| Dell XPS 15 9530 RTX 4070 | |
| Schenker Vision 16 Pro RTX 3070 Ti | |
| Samsung Galaxy Book3 Ultra 16, i9-13900H RTX 4070 | |
| AIDA64 / CPU ZLib | |
| Asus ProArt Studiobook 16 OLED H7604 | |
| MSI Stealth 16 Studio A13VG | |
| Gemiddelde van klas Multimedia (167.2 - 2022, n=59, laatste 2 jaar) | |
| Samsung Galaxy Book3 Ultra 16, i9-13900H RTX 4070 | |
| Schenker VISION 16 Pro (M23) | |
| Gemiddeld Intel Core i7-13700H (389 - 1215, n=29) | |
| Dell XPS 15 9530 RTX 4070 | |
| Schenker Vision 16 Pro RTX 3070 Ti | |
| AIDA64 / FP64 Ray-Trace | |
| Asus ProArt Studiobook 16 OLED H7604 | |
| MSI Stealth 16 Studio A13VG | |
| Gemiddelde van klas Multimedia (1014 - 26875, n=59, laatste 2 jaar) | |
| Dell XPS 15 9530 RTX 4070 | |
| Gemiddeld Intel Core i7-13700H (2540 - 10135, n=29) | |
| Schenker VISION 16 Pro (M23) | |
| Schenker Vision 16 Pro RTX 3070 Ti | |
| Samsung Galaxy Book3 Ultra 16, i9-13900H RTX 4070 | |
| AIDA64 / CPU PhotoWorxx | |
| Asus ProArt Studiobook 16 OLED H7604 | |
| Samsung Galaxy Book3 Ultra 16, i9-13900H RTX 4070 | |
| MSI Stealth 16 Studio A13VG | |
| Gemiddelde van klas Multimedia (12860 - 65787, n=59, laatste 2 jaar) | |
| Schenker VISION 16 Pro (M23) | |
| Dell XPS 15 9530 RTX 4070 | |
| Schenker Vision 16 Pro RTX 3070 Ti | |
| Gemiddeld Intel Core i7-13700H (12872 - 52727, n=29) | |
Systeemprestaties
De testresultaten in de synthetische benchmarks zijn erg goed, maar de vergelijkingsapparaten liggen erg dicht bij elkaar en er zullen geen merkbare verschillen zijn in het dagelijks gebruik. Dit zijn gewoon allemaal zeer responsieve computers met moderne componenten. We zijn geen stabiliteitsproblemen tegengekomen tijdens onze tests.
CrossMark: Overall | Productivity | Creativity | Responsiveness
| PCMark 10 / Score | |
| Asus ProArt Studiobook 16 OLED H7604 | |
| Gemiddeld Intel Core i7-13700H, NVIDIA GeForce RTX 4070 Laptop GPU (7158 - 7956, n=8) | |
| Schenker VISION 16 Pro (M23) | |
| MSI Stealth 16 Studio A13VG | |
| Dell XPS 15 9530 RTX 4070 | |
| Gemiddelde van klas Multimedia (4325 - 10386, n=54, laatste 2 jaar) | |
| Samsung Galaxy Book3 Ultra 16, i9-13900H RTX 4070 | |
| PCMark 10 / Essentials | |
| Dell XPS 15 9530 RTX 4070 | |
| Asus ProArt Studiobook 16 OLED H7604 | |
| Schenker VISION 16 Pro (M23) | |
| Gemiddeld Intel Core i7-13700H, NVIDIA GeForce RTX 4070 Laptop GPU (10252 - 11449, n=8) | |
| MSI Stealth 16 Studio A13VG | |
| Gemiddelde van klas Multimedia (8025 - 11664, n=54, laatste 2 jaar) | |
| Samsung Galaxy Book3 Ultra 16, i9-13900H RTX 4070 | |
| PCMark 10 / Productivity | |
| Asus ProArt Studiobook 16 OLED H7604 | |
| Gemiddelde van klas Multimedia (7323 - 18233, n=54, laatste 2 jaar) | |
| Schenker VISION 16 Pro (M23) | |
| Gemiddeld Intel Core i7-13700H, NVIDIA GeForce RTX 4070 Laptop GPU (8501 - 10769, n=8) | |
| MSI Stealth 16 Studio A13VG | |
| Dell XPS 15 9530 RTX 4070 | |
| Samsung Galaxy Book3 Ultra 16, i9-13900H RTX 4070 | |
| PCMark 10 / Digital Content Creation | |
| Gemiddeld Intel Core i7-13700H, NVIDIA GeForce RTX 4070 Laptop GPU (10358 - 12908, n=8) | |
| MSI Stealth 16 Studio A13VG | |
| Schenker VISION 16 Pro (M23) | |
| Dell XPS 15 9530 RTX 4070 | |
| Asus ProArt Studiobook 16 OLED H7604 | |
| Gemiddelde van klas Multimedia (3651 - 16240, n=54, laatste 2 jaar) | |
| Samsung Galaxy Book3 Ultra 16, i9-13900H RTX 4070 | |
| CrossMark / Overall | |
| Asus ProArt Studiobook 16 OLED H7604 | |
| Apple MacBook Pro 16 2023 M2 Max | |
| Schenker VISION 16 Pro (M23) | |
| Dell XPS 15 9530 RTX 4070 | |
| Gemiddeld Intel Core i7-13700H, NVIDIA GeForce RTX 4070 Laptop GPU (1768 - 2073, n=6) | |
| MSI Stealth 16 Studio A13VG | |
| Gemiddelde van klas Multimedia (866 - 2426, n=62, laatste 2 jaar) | |
| Schenker Vision 16 Pro RTX 3070 Ti | |
| Samsung Galaxy Book3 Ultra 16, i9-13900H RTX 4070 | |
| CrossMark / Productivity | |
| Asus ProArt Studiobook 16 OLED H7604 | |
| Schenker VISION 16 Pro (M23) | |
| Gemiddeld Intel Core i7-13700H, NVIDIA GeForce RTX 4070 Laptop GPU (1645 - 2006, n=6) | |
| Dell XPS 15 9530 RTX 4070 | |
| MSI Stealth 16 Studio A13VG | |
| Gemiddelde van klas Multimedia (913 - 2344, n=62, laatste 2 jaar) | |
| Apple MacBook Pro 16 2023 M2 Max | |
| Schenker Vision 16 Pro RTX 3070 Ti | |
| Samsung Galaxy Book3 Ultra 16, i9-13900H RTX 4070 | |
| CrossMark / Creativity | |
| Apple MacBook Pro 16 2023 M2 Max | |
| Asus ProArt Studiobook 16 OLED H7604 | |
| Dell XPS 15 9530 RTX 4070 | |
| Gemiddeld Intel Core i7-13700H, NVIDIA GeForce RTX 4070 Laptop GPU (1936 - 2137, n=6) | |
| Schenker VISION 16 Pro (M23) | |
| Gemiddelde van klas Multimedia (907 - 2820, n=62, laatste 2 jaar) | |
| MSI Stealth 16 Studio A13VG | |
| Schenker Vision 16 Pro RTX 3070 Ti | |
| Samsung Galaxy Book3 Ultra 16, i9-13900H RTX 4070 | |
| CrossMark / Responsiveness | |
| Asus ProArt Studiobook 16 OLED H7604 | |
| Schenker VISION 16 Pro (M23) | |
| Gemiddeld Intel Core i7-13700H, NVIDIA GeForce RTX 4070 Laptop GPU (1451 - 2202, n=6) | |
| MSI Stealth 16 Studio A13VG | |
| Dell XPS 15 9530 RTX 4070 | |
| Gemiddelde van klas Multimedia (605 - 2024, n=62, laatste 2 jaar) | |
| Apple MacBook Pro 16 2023 M2 Max | |
| Schenker Vision 16 Pro RTX 3070 Ti | |
| Samsung Galaxy Book3 Ultra 16, i9-13900H RTX 4070 | |
| PCMark 10 Score | 7368 punten | |
Help | ||
| AIDA64 / Memory Copy | |
| Gemiddelde van klas Multimedia (21158 - 109252, n=59, laatste 2 jaar) | |
| Asus ProArt Studiobook 16 OLED H7604 | |
| Samsung Galaxy Book3 Ultra 16, i9-13900H RTX 4070 | |
| MSI Stealth 16 Studio A13VG | |
| Dell XPS 15 9530 RTX 4070 | |
| Schenker VISION 16 Pro (M23) | |
| Schenker Vision 16 Pro RTX 3070 Ti | |
| Gemiddeld Intel Core i7-13700H (24334 - 78081, n=29) | |
| AIDA64 / Memory Read | |
| Gemiddelde van klas Multimedia (19699 - 125604, n=59, laatste 2 jaar) | |
| Asus ProArt Studiobook 16 OLED H7604 | |
| MSI Stealth 16 Studio A13VG | |
| Schenker VISION 16 Pro (M23) | |
| Samsung Galaxy Book3 Ultra 16, i9-13900H RTX 4070 | |
| Dell XPS 15 9530 RTX 4070 | |
| Schenker Vision 16 Pro RTX 3070 Ti | |
| Gemiddeld Intel Core i7-13700H (23681 - 79656, n=29) | |
| AIDA64 / Memory Write | |
| Samsung Galaxy Book3 Ultra 16, i9-13900H RTX 4070 | |
| Gemiddelde van klas Multimedia (17733 - 117933, n=59, laatste 2 jaar) | |
| Asus ProArt Studiobook 16 OLED H7604 | |
| MSI Stealth 16 Studio A13VG | |
| Gemiddeld Intel Core i7-13700H (22986 - 99898, n=29) | |
| Dell XPS 15 9530 RTX 4070 | |
| Schenker VISION 16 Pro (M23) | |
| Schenker Vision 16 Pro RTX 3070 Ti | |
| AIDA64 / Memory Latency | |
| Gemiddelde van klas Multimedia (7 - 535, n=59, laatste 2 jaar) | |
| Samsung Galaxy Book3 Ultra 16, i9-13900H RTX 4070 | |
| Gemiddeld Intel Core i7-13700H (82.4 - 136.8, n=29) | |
| Schenker Vision 16 Pro RTX 3070 Ti | |
| MSI Stealth 16 Studio A13VG | |
| Dell XPS 15 9530 RTX 4070 | |
| Asus ProArt Studiobook 16 OLED H7604 | |
| Schenker VISION 16 Pro (M23) | |
* ... kleiner is beter
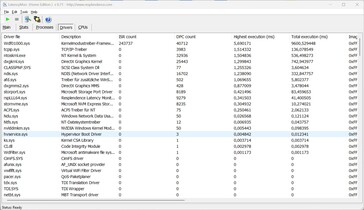
DPC latenties
In onze gestandaardiseerde latentietest (met surfen op het internet, 4K YouTube-weergave en CPU-belasting), met de huidige BIOS-versie op het moment van de test, toont onze testunit enkele kleine beperkingen voor gebruik in real-time audiotoepassingen.
| DPC Latencies / LatencyMon - interrupt to process latency (max), Web, Youtube, Prime95 | |
| MSI Stealth 16 Studio A13VG | |
| Samsung Galaxy Book3 Ultra 16, i9-13900H RTX 4070 | |
| Asus ProArt Studiobook 16 OLED H7604 | |
| Dell XPS 15 9530 RTX 4070 | |
| Schenker VISION 16 Pro (M23) | |
| Schenker Vision 16 Pro RTX 3070 Ti | |
* ... kleiner is beter
Opslagoplossing
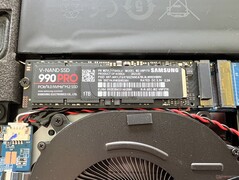
De Vision 16 Pro biedt twee snelle PCIe 4.0 slots voor SSD's, waarbij het tweede slot naast de batterij alleen geschikt is voor een enkelzijdige SSD. Onze testunit gebruikt de 1-TB versie van de Samsung 990 Pro, en na de eerste keer opstarten is er nog steeds 870 GB aan opslagruimte beschikbaar voor de gebruiker. De overdrachtsnelheden van de SSD zijn erg hoog en de prestaties blijven ook na langere belasting volledig stabiel, wat zeker niet vanzelfsprekend is bij de huidige SSD's met hoge prestaties. Je kunt meer SSD benchmarks vinden hier.
* ... kleiner is beter
Disk Throttling: DiskSpd Read Loop, Queue Depth 8
Grafische kaart - RTX 4070 Laptop
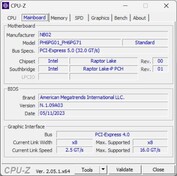
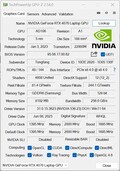
Net als in het model van vorig jaar wordt een huidige Nvidia GPU met een maximale TGP van 95 watt gebruikt (70W TGP + 25W Dynamic Boost van de CPU), maar dit jaar is de nieuwe RTX 4070 laptopgebruikt. DeRTX 4080 laptopdie de directe opvolger is van de RTX 3080 er zit geen MUX-schakelaar in de multimedia-laptop, dus er wordt regelmatig van grafische processor gewisseld via Optimus.
Met een maximum van 95 watt is dit een snelle versie van de RTX 4070 laptop, aangezien dit dicht in de buurt komt van het maximum van 105 watt dat de 4070 over het algemeen verbruikt tijdens het gamen. Alleen in sommige synthetische tests zoals FurMark kan het verbruik hoger liggen, maar in de praktijk speelt dit geen rol. Je kunt dit ook goed zien in de 3DMarks, waar de Schenker Vision 16 Pro praktisch op hetzelfde niveau uitkomt als de ProArt Studiobook 16 die een TGP van 130 watt opgeeft voor de RTX 4070 Laptop. Vergeleken met de Vision 16 Promet de RTX 3070 Tiis er een snelheidsverhoging van ongeveer 25-30%.
Onze testunit doorstaat de Time Spy stresstest op 98,2% zonder problemen, maar het stroomverbruik van de GPU wordt afgetopt tot 36 watt in batterijmodus. Zonder oplader zijn de GPU-prestaties daarom ongeveer 40% lager. Je kunt aanvullende GPU-benchmarks vinden hier.
| 3DMark 11 Performance | 32729 punten | |
| 3DMark Fire Strike Score | 24151 punten | |
| 3DMark Time Spy Score | 11566 punten | |
Help | ||
| Blender / v3.3 Classroom METAL | |
| Apple MacBook Pro 16 2023 M2 Max | |
| Gemiddelde van klas Multimedia (17.8 - 68, n=3, laatste 2 jaar) | |
| Blender / v3.3 Classroom OPTIX/RTX | |
| Gemiddelde van klas Multimedia (12 - 105, n=29, laatste 2 jaar) | |
| Dell XPS 15 9530 RTX 4070 | |
| Schenker Vision 16 Pro RTX 3070 Ti | |
| Samsung Galaxy Book3 Ultra 16, i9-13900H RTX 4070 | |
| MSI Stealth 16 Studio A13VG | |
| Schenker VISION 16 Pro (M23) | |
| Asus ProArt Studiobook 16 OLED H7604 | |
| Gemiddeld NVIDIA GeForce RTX 4070 Laptop GPU (18 - 30, n=68) | |
| Blender / v3.3 Classroom CUDA | |
| Gemiddelde van klas Multimedia (20 - 186, n=29, laatste 2 jaar) | |
| Dell XPS 15 9530 RTX 4070 | |
| Schenker Vision 16 Pro RTX 3070 Ti | |
| Samsung Galaxy Book3 Ultra 16, i9-13900H RTX 4070 | |
| MSI Stealth 16 Studio A13VG | |
| Asus ProArt Studiobook 16 OLED H7604 | |
| Schenker VISION 16 Pro (M23) | |
| Gemiddeld NVIDIA GeForce RTX 4070 Laptop GPU (32 - 50, n=67) | |
| Blender / v3.3 Classroom CPU | |
| Schenker Vision 16 Pro RTX 3070 Ti | |
| Samsung Galaxy Book3 Ultra 16, i9-13900H RTX 4070 | |
| Gemiddelde van klas Multimedia (160 - 1042, n=63, laatste 2 jaar) | |
| Schenker VISION 16 Pro (M23) | |
| Dell XPS 15 9530 RTX 4070 | |
| Apple MacBook Pro 16 2023 M2 Max | |
| MSI Stealth 16 Studio A13VG | |
| Gemiddeld NVIDIA GeForce RTX 4070 Laptop GPU (158 - 440, n=67) | |
| Asus ProArt Studiobook 16 OLED H7604 | |
* ... kleiner is beter
Spelprestaties
De relatief lage CPU-prestaties kunnen een negatief effect hebben op de gamingprestaties, omdat de prestaties van de Vision 16 Pro hier af en toe afnemen, vergeleken met die van andere laptops met de RTX 4070 Laptop. Maar in principe zijn de prestaties volledig voldoende om ook moderne games zoals Cyberpunk 2077 of Star Wars: Jedi Survivor vloeiend te spelen in QHD-resolutie, en het blijft ook stabiel tijdens langere gamesessies.
| The Witcher 3 - 1920x1080 Ultra Graphics & Postprocessing (HBAO+) | |
| MSI Stealth 16 Studio A13VG | |
| Asus ProArt Studiobook 16 OLED H7604 | |
| Schenker VISION 16 Pro (M23) | |
| Schenker Vision 16 Pro RTX 3070 Ti | |
| Samsung Galaxy Book3 Ultra 16, i9-13900H RTX 4070 | |
| Dell XPS 15 9530 RTX 4070 | |
| Gemiddelde van klas Multimedia (11 - 121, n=25, laatste 2 jaar) | |
The Witcher 3 FPS Chart
| lage | gem. | hoge | ultra | QHD | |
|---|---|---|---|---|---|
| GTA V (2015) | 170 | 156.9 | 96.5 | 80.6 | |
| The Witcher 3 (2015) | 226 | 105.4 | |||
| Dota 2 Reborn (2015) | 178.4 | 161.3 | 152.4 | 143.8 | |
| Final Fantasy XV Benchmark (2018) | 175.3 | 143.2 | 109 | 81.6 | |
| X-Plane 11.11 (2018) | 154.8 | 138.4 | 109.7 | ||
| Far Cry 5 (2018) | 168 | 134 | 127 | 120 | 108 |
| Strange Brigade (2018) | 362 | 270 | 223 | 196.7 | 131.6 |
| F1 2021 (2021) | 339 | 276 | 234 | 133.1 | 104.3 |
| Cyberpunk 2077 1.6 (2022) | 106 | 102 | 101 | 82 | 52 |
| F1 22 (2022) | 220 | 183 | 72.6 | 47 | |
| Star Wars Jedi Survivor (2023) | 84 | 76 | 72 | 67 | 44 |
Uitstoot - Lawaaierige ventilatoren op vol vermogen
Geluidsemissies
Je kunt in het BIOS instellen of de twee ventilatoren constant op een lage snelheid moeten draaien of niet, wat als voordeel heeft dat piekbelastingen beter kunnen worden opgevangen. Hoewel deze optie was geactiveerd in onze testunit, stonden de ventilatoren in veel gevallen stil, zelfs in de snelste prestatiemodus. De ventilatoren worden pas duidelijk hoorbaar onder belasting, wanneer de GPU een grotere rol speelt door het hogere stroomverbruik. Met ongeveer 53 dB(A) tijdens het gamen en in de stresstest, wordt de Vision 16 Pro nu eigenlijk net zo luid als de voorganger in de Turbo modus. In de volgende tabel geven we een overzicht van de metingen in de verschillende modi:
| Toepassing | Stil | Performance Gebalanceerd | Performance Enthusiast |
|---|---|---|---|
| 3DMark 06 | 37,7 dB(A) | 47,2 dB(A) | 47,2 dB(A) |
| Witcher 3 | 37.7 dB(A) | 49,9 dB(A) | 53,1 dB(A) |
| Stresstest | 40,6 dB(A) | 49,9 dB(A) | 53,1 dB(A) |
Vooral bij dagelijks gebruik en ook bij sommige oudere of minder veeleisende games is het de moeite waard om over te schakelen naar de Stille modus (via het Control Center of met de F3-toets), omdat de prestaties dan nog steeds voldoende zijn en de ventilatoren dan aanzienlijk stiller blijven met ongeveer 38 tot 40 dB(A). We hebben geen andere elektronische geluiden opgemerkt in onze testunit.
Geluidsniveau
| Onbelast |
| 25.9 / 25.9 / 32 dB (A) |
| Belasting |
| 47.2 / 53.1 dB (A) |
 | ||
30 dB stil 40 dB(A) hoorbaar 50 dB(A) luid |
||
min: | ||
| Schenker VISION 16 Pro (M23) GeForce RTX 4070 Laptop GPU, i7-13700H, Samsung 990 Pro 1 TB | Samsung Galaxy Book3 Ultra 16, i9-13900H RTX 4070 GeForce RTX 4070 Laptop GPU, i9-13900H, Samsung PM9A1 MZVL21T0HCLR | MSI Stealth 16 Studio A13VG GeForce RTX 4070 Laptop GPU, i7-13700H, Micron 3400 2TB MTFDKBA2T0TFH | Dell XPS 15 9530 RTX 4070 GeForce RTX 4070 Laptop GPU, i7-13700H, SK hynix PC801 HFS001TEJ9X101N | Asus ProArt Studiobook 16 OLED H7604 GeForce RTX 4070 Laptop GPU, i9-13980HX, Phison EM2804TBMTCB47 | Apple MacBook Pro 16 2023 M2 Max M2 Max 38-Core GPU, M2 Max, Apple SSD AP2048Z | Schenker Vision 16 Pro RTX 3070 Ti GeForce RTX 3070 Ti Laptop GPU, i7-12700H, Samsung SSD 980 Pro 1TB MZ-V8P1T0BW | |
|---|---|---|---|---|---|---|---|
| Noise | 6% | 13% | 20% | 4% | 18% | 11% | |
| uit / omgeving * (dB) | 25.9 | 25.2 3% | 24 7% | 23.1 11% | 24.5 5% | 23.9 8% | 22.9 12% |
| Idle Minimum * (dB) | 25.9 | 25.2 3% | 24 7% | 23.1 11% | 24.5 5% | 23.9 8% | 24.3 6% |
| Idle Average * (dB) | 25.9 | 25.2 3% | 24 7% | 23.1 11% | 24.5 5% | 23.9 8% | 24.3 6% |
| Idle Maximum * (dB) | 32 | 31.3 2% | 24 25% | 24.2 24% | 24.5 23% | 23.9 25% | 24.3 24% |
| Load Average * (dB) | 47.2 | 38.8 18% | 34.81 26% | 27.1 43% | 47.6 -1% | 36.6 22% | 38.5 18% |
| Witcher 3 ultra * (dB) | 53.1 | 44.05 17% | 40.1 24% | 55.9 -5% | 35.1 34% | 51 4% | |
| Load Maximum * (dB) | 53.1 | 51.2 4% | 51.57 3% | 44.6 16% | 56.7 -7% | 43.2 19% | 51 4% |
* ... kleiner is beter
Temperaturen
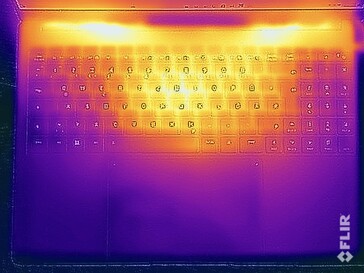
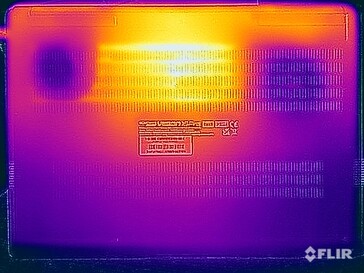
Hoewel er geen temperatuurproblemen zijn bij dagelijks gebruik, moet je het apparaat niet op je schoot leggen tijdens het gamen of bij hoge belasting van de onderdelen. In het extreme geval meten we temperaturen van meer dan 50 °C (122 °F) in het centrale gebied aan de onderkant. Het centrale gedeelte van het toetsenbord warmt ook op tot meer dan 45 °C, wat merkbaar wordt tijdens het typen. Maar de typische WASD-toetsen blijven aanzienlijk koeler, wat helpt tijdens het gamen. De aanzienlijk compactere lader wordt slechts marginaal warmer dan die van het oude model en er zijn geen problemen met een maximumtemperatuur van 44 °C.
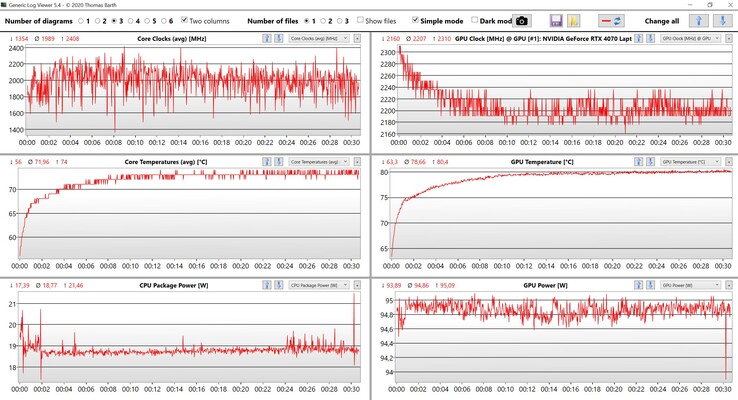
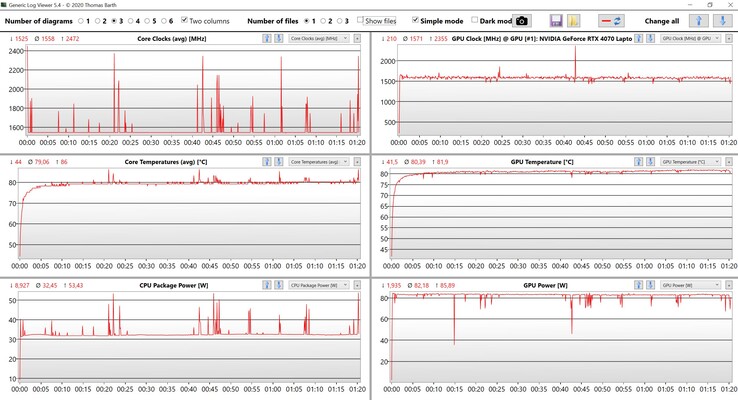
Tijdens de stresstest krijgt de grafische kaart voorrang, omdat deze stabiel draait op ongeveer 82 watt. De processor, aan de andere kant, vlakt snel af op ongeveer ~32 watt. Over het geheel genomen is dit een behoorlijk resultaat voor zo'n slank apparaat.
(-) De maximumtemperatuur aan de bovenzijde bedraagt 46.7 °C / 116 F, vergeleken met het gemiddelde van 36.9 °C / 98 F, variërend van 21.1 tot 71 °C voor de klasse Multimedia.
(-) De bodem warmt op tot een maximum van 54.1 °C / 129 F, vergeleken met een gemiddelde van 39.2 °C / 103 F
(+) Bij onbelast gebruik bedraagt de gemiddelde temperatuur voor de bovenzijde 24.7 °C / 76 F, vergeleken met het apparaatgemiddelde van 31.3 °C / 88 F.
(±) Bij het spelen van The Witcher 3 is de gemiddelde temperatuur voor de bovenzijde 37.7 °C / 100 F, vergeleken met het apparaatgemiddelde van 31.3 °C / 88 F.
(+) De palmsteunen en het touchpad zijn met een maximum van ###max## °C / 82.4 F koeler dan de huidtemperatuur en voelen daarom koel aan.
(±) De gemiddelde temperatuur van de handpalmsteun van soortgelijke toestellen bedroeg 28.7 °C / 83.7 F (+0.7 °C / 1.3 F).
| Schenker VISION 16 Pro (M23) Intel Core i7-13700H, NVIDIA GeForce RTX 4070 Laptop GPU | Samsung Galaxy Book3 Ultra 16, i9-13900H RTX 4070 Intel Core i9-13900H, NVIDIA GeForce RTX 4070 Laptop GPU | MSI Stealth 16 Studio A13VG Intel Core i7-13700H, NVIDIA GeForce RTX 4070 Laptop GPU | Dell XPS 15 9530 RTX 4070 Intel Core i7-13700H, NVIDIA GeForce RTX 4070 Laptop GPU | Asus ProArt Studiobook 16 OLED H7604 Intel Core i9-13980HX, NVIDIA GeForce RTX 4070 Laptop GPU | Apple MacBook Pro 16 2023 M2 Max Apple M2 Max, Apple M2 Max 38-Core GPU | Schenker Vision 16 Pro RTX 3070 Ti Intel Core i7-12700H, NVIDIA GeForce RTX 3070 Ti Laptop GPU | |
|---|---|---|---|---|---|---|---|
| Heat | -10% | -32% | -8% | -9% | 15% | 1% | |
| Maximum Upper Side * (°C) | 46.7 | 45.9 2% | 60 -28% | 45.6 2% | 44.1 6% | 44.2 5% | 50.8 -9% |
| Maximum Bottom * (°C) | 54.1 | 50.9 6% | 61 -13% | 42 22% | 48 11% | 42.9 21% | 46.3 14% |
| Idle Upper Side * (°C) | 26.5 | 31.6 -19% | 38.2 -44% | 34.4 -30% | 32.7 -23% | 22.4 15% | 27.2 -3% |
| Idle Bottom * (°C) | 26.8 | 34.2 -28% | 37.7 -41% | 33.2 -24% | 34.9 -30% | 22.3 17% | 26.6 1% |
* ... kleiner is beter
Luidsprekers
Er is niets veranderd aan het luidsprekersysteem, en vooral de hoge frequenties zijn erg nauwkeurig. Over het algemeen zijn de prestaties ook hier behoorlijk, maar de Vision 16 Pro kan nog steeds niet de uitstekende prestaties van deMacBook Pro 16.
Schenker VISION 16 Pro (M23) audioanalyse
(±) | luidspreker luidheid is gemiddeld maar goed (77.6 dB)
Bas 100 - 315 Hz
(±) | verminderde zeebaars - gemiddeld 14.7% lager dan de mediaan
(-) | de lage tonen zijn niet lineair (15% delta naar de vorige frequentie)
Midden 400 - 2000 Hz
(+) | evenwichtige middens - slechts 3.1% verwijderd van de mediaan
(+) | de middentonen zijn lineair (4.6% delta ten opzichte van de vorige frequentie)
Hoog 2 - 16 kHz
(+) | evenwichtige hoogtepunten - slechts 1.3% verwijderd van de mediaan
(+) | de hoge tonen zijn lineair (4.1% delta naar de vorige frequentie)
Algemeen 100 - 16.000 Hz
(+) | het totale geluid is lineair (13.1% verschil met de mediaan)
Vergeleken met dezelfde klasse
» 24% van alle geteste apparaten in deze klasse waren beter, 5% vergelijkbaar, 71% slechter
» De beste had een delta van 5%, het gemiddelde was 17%, de slechtste was 45%
Vergeleken met alle geteste toestellen
» 13% van alle geteste apparaten waren beter, 3% gelijk, 85% slechter
» De beste had een delta van 4%, het gemiddelde was 24%, de slechtste was 134%
Apple MacBook Pro 16 2023 M2 Max audioanalyse
(+) | luidsprekers kunnen relatief luid spelen (86.1 dB)
Bas 100 - 315 Hz
(+) | goede baars - slechts 3.9% verwijderd van de mediaan
(+) | de lage tonen zijn lineair (5.7% delta naar de vorige frequentie)
Midden 400 - 2000 Hz
(+) | evenwichtige middens - slechts 1.2% verwijderd van de mediaan
(+) | de middentonen zijn lineair (1.5% delta ten opzichte van de vorige frequentie)
Hoog 2 - 16 kHz
(+) | evenwichtige hoogtepunten - slechts 2.5% verwijderd van de mediaan
(+) | de hoge tonen zijn lineair (1.7% delta naar de vorige frequentie)
Algemeen 100 - 16.000 Hz
(+) | het totale geluid is lineair (4.9% verschil met de mediaan)
Vergeleken met dezelfde klasse
» 0% van alle geteste apparaten in deze klasse waren beter, 1% vergelijkbaar, 99% slechter
» De beste had een delta van 5%, het gemiddelde was 17%, de slechtste was 45%
Vergeleken met alle geteste toestellen
» 0% van alle geteste apparaten waren beter, 0% gelijk, 100% slechter
» De beste had een delta van 4%, het gemiddelde was 24%, de slechtste was 134%
Energiebeheer - Verbeterde levensduur van batterij
Stroomverbruik
In onze metingen van het verbruik blijkt het nieuwe 2023-model over de hele linie iets efficiënter, waarbij alleen het maximale verbruik van 173 watt vrijwel identiek is. Maar deze waarde daalt al snel naar rond de 150 watt (ook tijdens het gamen), dus de meegeleverde 180 watt lader is voldoende groot. Overigens is die nu niet alleen aanzienlijk compacter, maar ook veel lichter (489 vs. 811 gram, 17,2 vs. 28,6 oz).
| Uit / Standby | |
| Inactief | |
| Belasting |
|
Key:
min: | |
| Schenker VISION 16 Pro (M23) i7-13700H, GeForce RTX 4070 Laptop GPU, Samsung 990 Pro 1 TB, IPS, 2560x1600, 16" | Samsung Galaxy Book3 Ultra 16, i9-13900H RTX 4070 i9-13900H, GeForce RTX 4070 Laptop GPU, Samsung PM9A1 MZVL21T0HCLR, OLED / AMOLED, 2880x1800, 16" | MSI Stealth 16 Studio A13VG i7-13700H, GeForce RTX 4070 Laptop GPU, Micron 3400 2TB MTFDKBA2T0TFH, IPS, 2560x1600, 16" | Dell XPS 15 9530 RTX 4070 i7-13700H, GeForce RTX 4070 Laptop GPU, SK hynix PC801 HFS001TEJ9X101N, OLED, 3456x2160, 15.6" | Asus ProArt Studiobook 16 OLED H7604 i9-13980HX, GeForce RTX 4070 Laptop GPU, Phison EM2804TBMTCB47, OLED, 3200x2000, 16" | Apple MacBook Pro 16 2023 M2 Max M2 Max, M2 Max 38-Core GPU, Apple SSD AP2048Z, Mini-LED, 3456x2234, 16.2" | Schenker Vision 16 Pro RTX 3070 Ti i7-12700H, GeForce RTX 3070 Ti Laptop GPU, Samsung SSD 980 Pro 1TB MZ-V8P1T0BW, IPS, 2560x1600, 16" | Gemiddeld NVIDIA GeForce RTX 4070 Laptop GPU | Gemiddelde van klas Multimedia | |
|---|---|---|---|---|---|---|---|---|---|
| Power Consumption | 28% | -28% | -38% | -53% | -3% | -12% | -50% | 17% | |
| Idle Minimum * (Watt) | 8.6 | 4.3 50% | 11 -28% | 20 -133% | 12.8 -49% | 5.2 40% | 9 -5% | 13.2 ? -53% | 6.09 ? 29% |
| Idle Average * (Watt) | 12 | 4.6 62% | 18 -50% | 20.7 -73% | 19.9 -66% | 16.5 -38% | 13.3 -11% | 18.2 ? -52% | 10.6 ? 12% |
| Idle Maximum * (Watt) | 12.4 | 11.4 8% | 19 -53% | 22.4 -81% | 20.3 -64% | 16.8 -35% | 14.3 -15% | 24.6 ? -98% | 12.6 ? -2% |
| Load Average * (Watt) | 80 | 97 -21% | 91 -14% | 77.1 4% | 131.4 -64% | 113 -41% | 107 -34% | 97 ? -21% | 69.2 ? 13% |
| Witcher 3 ultra * (Watt) | 147.7 | 100.9 32% | 130 12% | 95.4 35% | 196.5 -33% | 92 38% | 155.2 -5% | ||
| Load Maximum * (Watt) | 173.1 | 107 38% | 228 -32% | 133.4 23% | 246.8 -43% | 145 16% | 172 1% | 221 ? -28% | 115.8 ? 33% |
* ... kleiner is beter
Power Consumption The Witcher 3 / Stress Test
Power Consumption With External Monitor
Levensduur batterij
In overeenstemming met de iets efficiëntere verbruikswaarden is ook de levensduur van de batterij iets beter. Bij een aangepaste helderheid van 150 cd/m² (wat overeenkomt met 39% van de maximale helderheid van onze testunit) gaat onze WLAN-test iets langer dan 7,5 uur mee met zowel 60 als 240 Hz, wat de Vision 16 Pro 2023 aanzienlijk competitiever maakt. Alleen de MacBook Pro 16 speelt in een andere competitie en gaat hier bijna 15 uur mee. De videotest bij 150 cd/m² duurt ook bijna 8 uur.
Bij de maximale helderheid van het beeldscherm maakt de vernieuwingsfrequentie wel een verschil, want de WLAN-test bij 240 Hz duurt amper 6 uur, terwijl dat bij 60 Hz nog steeds meer dan 7 uur is. We zouden het leuk vinden als Schenker, net als bij de kleinere Vision 14, ook een versie van de Vision 16 Pro zou aanbieden met een grotere batterij, en het secundaire M.2-slot zou laten vallen.
| Schenker VISION 16 Pro (M23) i7-13700H, GeForce RTX 4070 Laptop GPU, 80 Wh | Samsung Galaxy Book3 Ultra 16, i9-13900H RTX 4070 i9-13900H, GeForce RTX 4070 Laptop GPU, 76 Wh | MSI Stealth 16 Studio A13VG i7-13700H, GeForce RTX 4070 Laptop GPU, 99.9 Wh | Dell XPS 15 9530 RTX 4070 i7-13700H, GeForce RTX 4070 Laptop GPU, 86 Wh | Asus ProArt Studiobook 16 OLED H7604 i9-13980HX, GeForce RTX 4070 Laptop GPU, 90 Wh | Apple MacBook Pro 16 2023 M2 Max M2 Max, M2 Max 38-Core GPU, 99.6 Wh | Schenker Vision 16 Pro RTX 3070 Ti i7-12700H, GeForce RTX 3070 Ti Laptop GPU, 80 Wh | Gemiddelde van klas Multimedia | |
|---|---|---|---|---|---|---|---|---|
| Batterijduur | -4% | 28% | 9% | -22% | 72% | -15% | 59% | |
| H.264 (h) | 7.8 | 9 15% | 7.7 -1% | 6 -23% | 18.7 140% | 6.1 -22% | 16 ? 105% | |
| WiFi v1.3 (h) | 7.8 | 8 3% | 7.8 0% | 8 3% | 5.6 -28% | 14.8 90% | 6 -23% | 11.3 ? 45% |
| Load (h) | 1.3 | 0.9 -31% | 2.4 85% | 1.5 15% | 1.1 -15% | 1.1 -15% | 1.3 0% | 1.667 ? 28% |
Pro
Contra
Conclusie - Vision 16 Pro blijft indrukwekkend licht en slank
Hoewel het nieuwe 2023 model van de Vision 16 Pro de verwachte updates bevat met een Intel Raptor Lake processor en de nieuwe Nvidia GeForce RTX 4070 Laptop, zijn er ook wat extra aanpassingen in de stroomprofielen. De Vision 16 Pro is een van de zeldzame gevallen, waarbij de 45-Watt processor ook echt op die waarde draait zonder dat de korte-termijn vermogenslimiet absurd hoog is. Dit betekent dat de prestaties redelijk constant blijven en de temperaturen niet zo snel omhoog springen, maar tegelijkertijd zijn de prestaties ook iets lager, vooral in korte benchmarks. Dit speelt echter niet echt een rol bij dagelijks gebruik. Aan de andere kant begrijpen we niet echt waarom Schenker de handmatige of Turbo modus heeft verwijderd waarmee je de TDP waarden van de CPU kon aanpassen. In het vorige model kon je hiermee de prestaties van de CPU nog merkbaar verbeteren.
Met dezelfde maximale TGP van 95 watt levert de nieuwe GeForce RTX 4070 Laptop ongeveer 25-30% meer prestaties dan de oude RTX 3070 Ti, maar er is geen directe opvolger voor de oude RTX 3080. Verder zijn er weinig redenen om te klagen over de algehele prestaties, en de overdrachtssnelheden van de snelle PCIe 4.0 SSD blijven ook constant. We begrijpen echter niet waarom er nu een aanzienlijk langzamere kaartlezer is.
De Schenker Vision 16 Pro biedt veel prestaties in een zeer slanke en lichte behuizing, ook in de 2023-versie. Desondanks zijn er geen compromissen in de aansluitingen of onderhoudsmogelijkheden.
Het matte IPS-scherm met 240 Hz levert subjectief gezien een goede beeldkwaliteit, en met het meegeleverde gekalibreerde profiel van Schenker kun je ook de kleurtint verhelpen, maar de lage kleurruimtedekking en het gebrek aan HDR-ondersteuning zijn nog steeds nadelen. Maar er wordt tenminste geen PWM gebruikt.
De weergaveopties zijn ook de grootste voordelen van de concurrenten, die vaak OLED- of MiniLED-panelen bieden. Of dit altijd beter is (trefwoord: PWM) is de vraag, maar de subjectieve beeldindruk is iets beter en er zijn voordelen in de kleurruimte en HDR. De pure CPU prestaties (multi-core) zijn ook vaak beter bij de concurrenten, maar vooral in de grafische prestaties hoeft de Vision 16 Pro zich niet te verstoppen achter de Asus ProArt Studiobook 16 of MSI Stealth 16 Studio vergelijkers. Met name deDell XPS 15met de 50-Watt versie van de RTX 4070 Laptop blijft in dit opzicht aanzienlijk achter.
Prijs en beschikbaarheid
De nieuwe Vision 16 Pro M23 kan worden geconfigureerd bij Bestware vanaf 2.099 euro (~$2,361). Voor onze testconfiguratie met upgrades naar de RTX 4070 laptopen meer RAM en SSD opslag, betaal je ongeveer 2.600 euro (~$2.924).
Schenker VISION 16 Pro (M23)
- 18-07-2023 v7 (old)
Andreas Osthoff
Transparantie
De selectie van te beoordelen apparaten wordt gemaakt door onze redactie. Het testexemplaar werd ten behoeve van deze beoordeling door de fabrikant of detailhandelaar in bruikleen aan de auteur verstrekt. De kredietverstrekker had geen invloed op deze recensie, noch ontving de fabrikant vóór publicatie een exemplaar van deze recensie. Er bestond geen verplichting om deze recensie te publiceren. Als onafhankelijk mediabedrijf is Notebookcheck niet onderworpen aan het gezag van fabrikanten, detailhandelaren of uitgevers.
[transparency_disclaimer]Dit is hoe Notebookcheck test
Elk jaar beoordeelt Notebookcheck onafhankelijk honderden laptops en smartphones met behulp van gestandaardiseerde procedures om ervoor te zorgen dat alle resultaten vergelijkbaar zijn. We hebben onze testmethoden al zo'n 20 jaar voortdurend ontwikkeld en daarbij de industriestandaard bepaald. In onze testlaboratoria wordt gebruik gemaakt van hoogwaardige meetapparatuur door ervaren technici en redacteuren. Deze tests omvatten een validatieproces in meerdere fasen. Ons complexe beoordelingssysteem is gebaseerd op honderden goed onderbouwde metingen en benchmarks, waardoor de objectiviteit behouden blijft. Meer informatie over onze testmethoden kunt u hier vinden.


