Dell XPS 15 9530 RTX 4070 laptop review: Zowel indrukwekkend als ondermaats

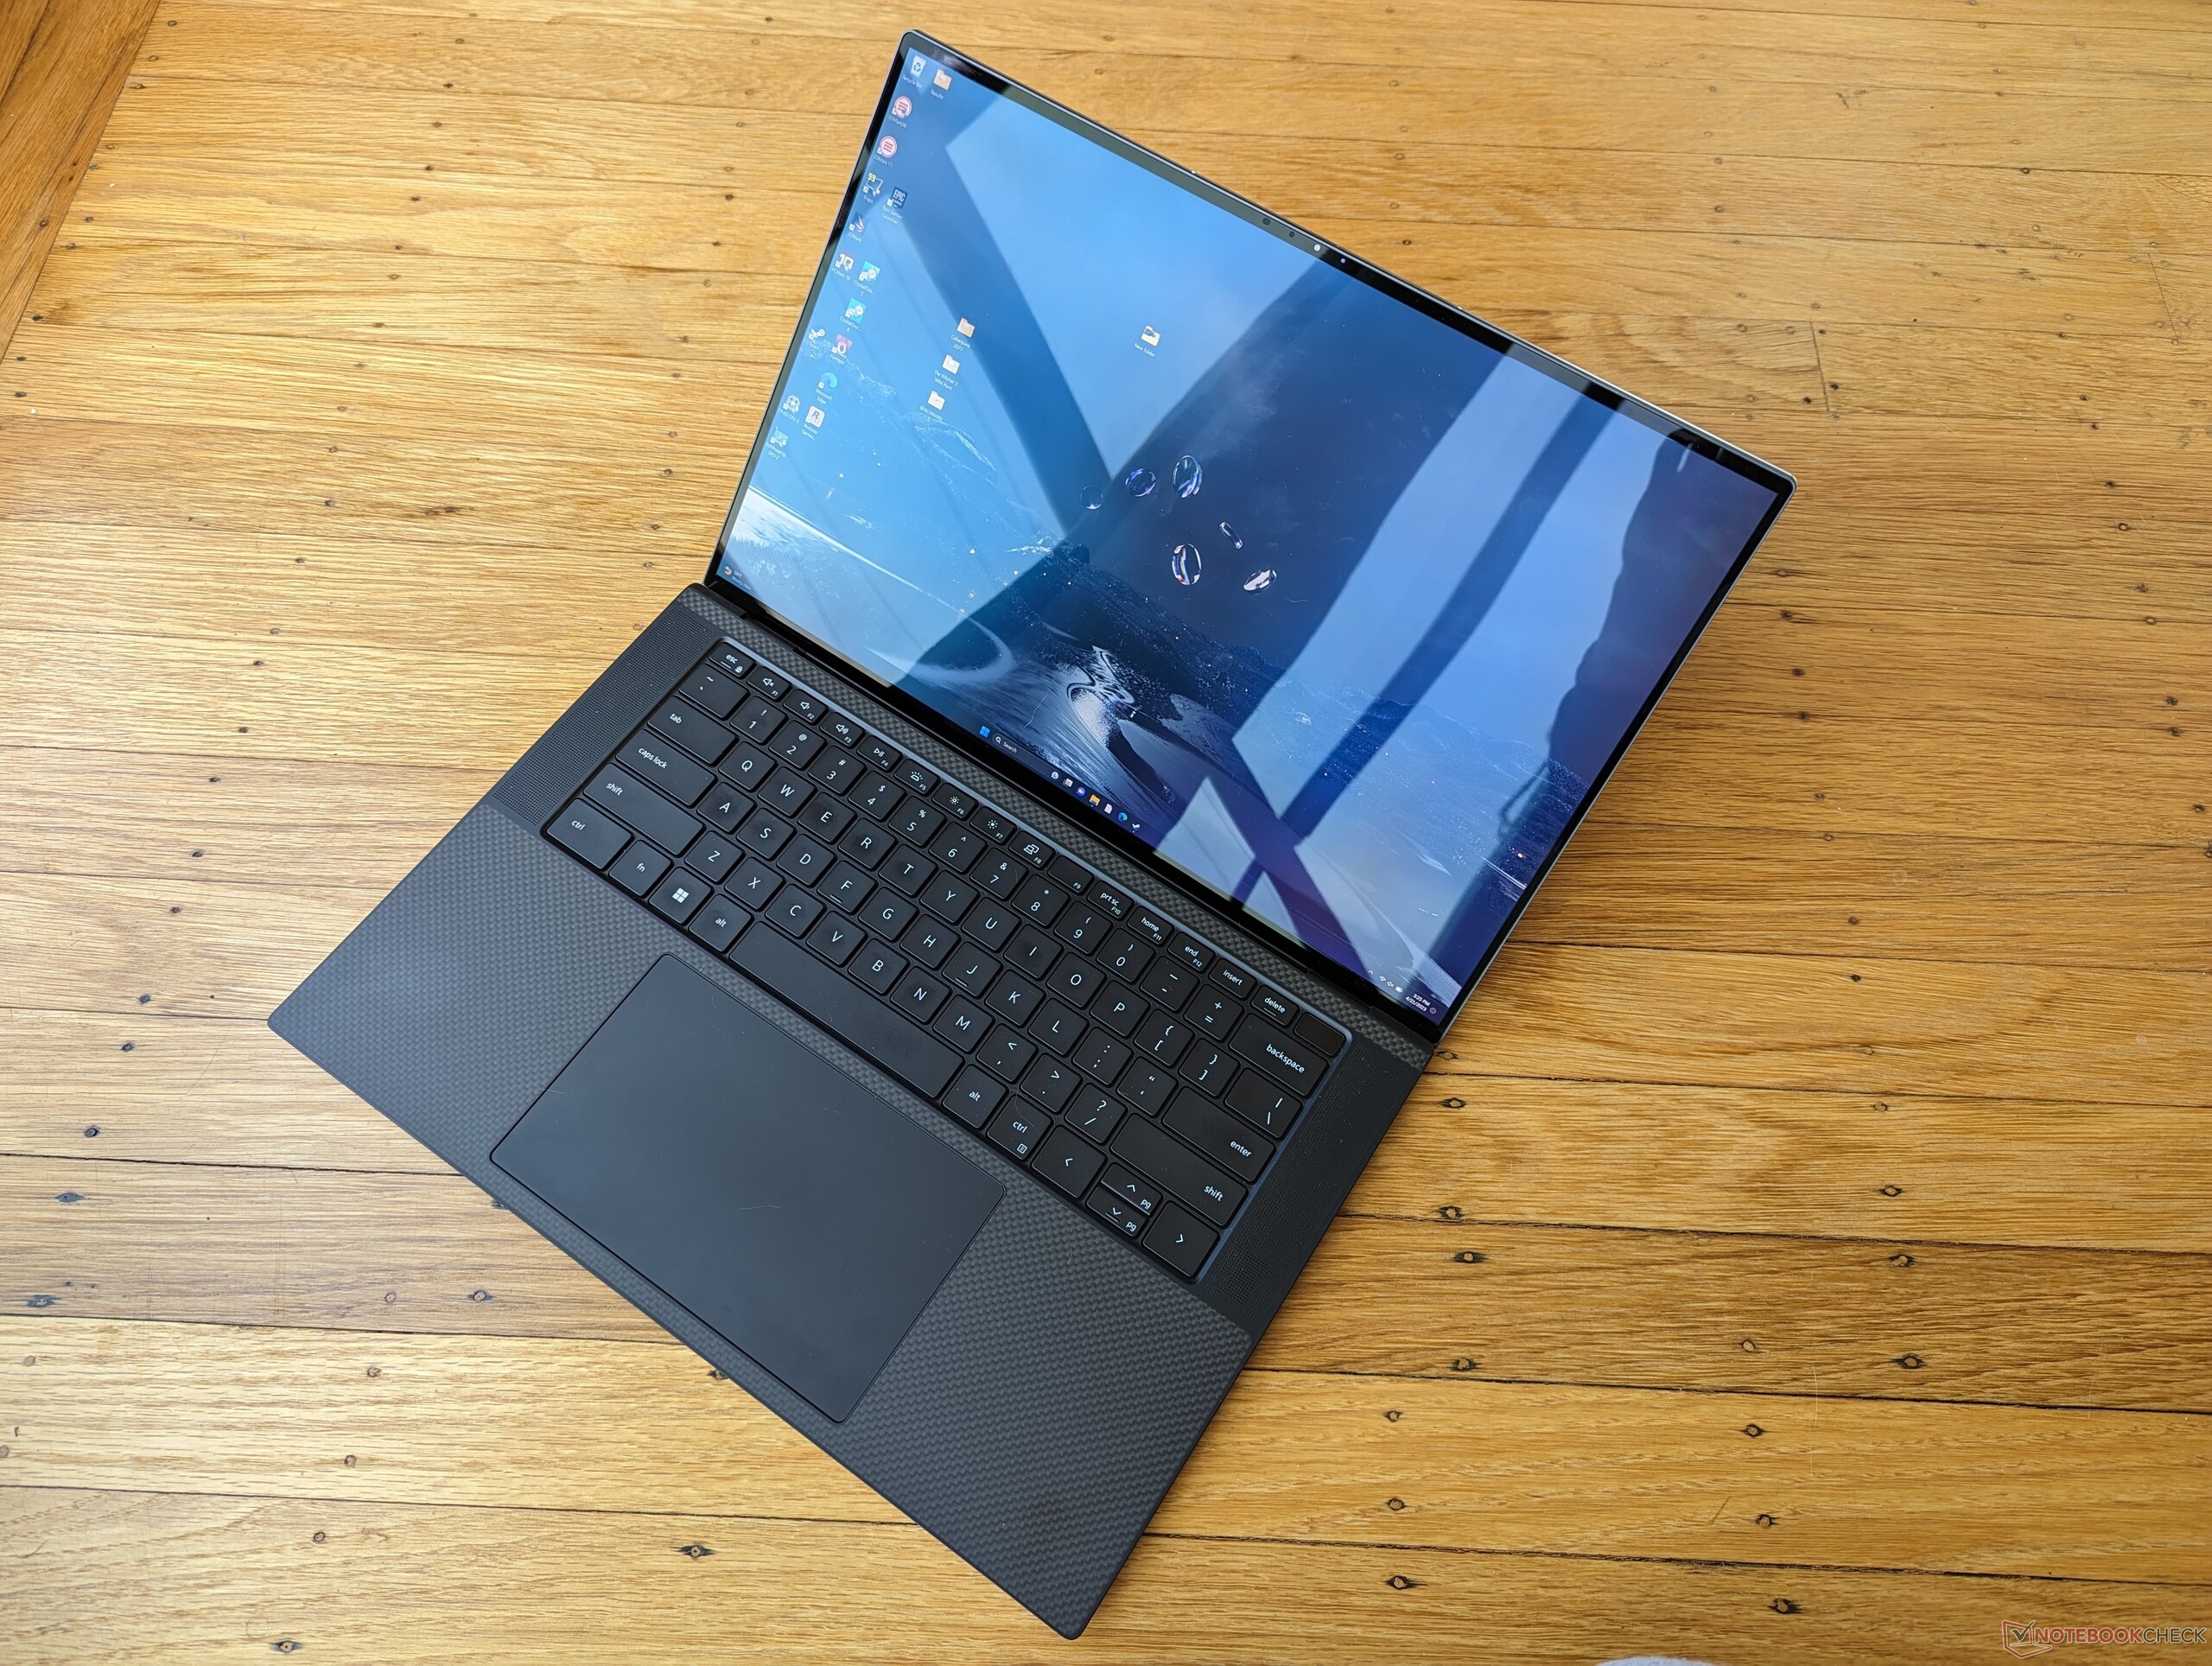
De XPS 15 9530 is een interne update over de 2022 XPS 15 9520. De 12e gen Alder Lake-H CPU's en Nvidia Ampere GPU's op het model van vorig jaar zijn opgewaardeerd naar 13e gen Raptor Lake-H en Ada Lovelace-opties, respectievelijk. Voor de rest blijven het chassis en de schermopties hetzelfde als vorig jaar, dus we raden aan onze bestaande reviews over de XPS 15 9520, 9510en 9500 om meer te weten te komen over de fysieke kenmerken van het model.
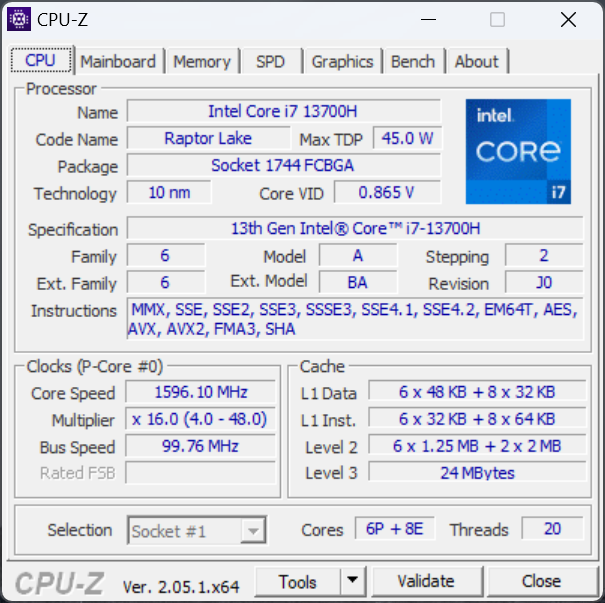
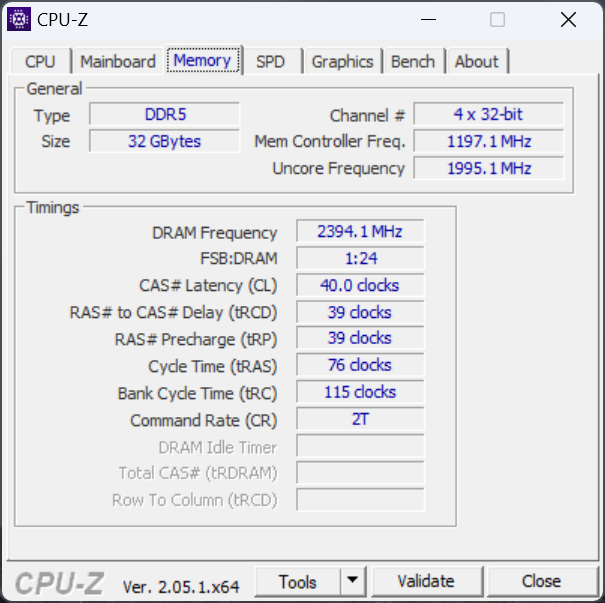
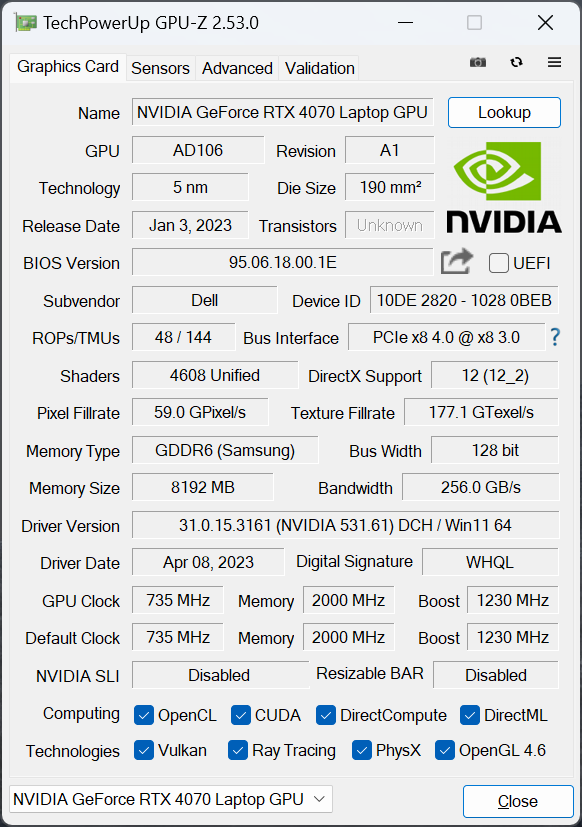
Onze specifieke recensie-eenheid is een high-end configuratie met de Core i7-13700H, RTX 4070, 32 GB RAM, 1 TB SSD, en glanzend 3,5K OLED-touchscreen voor ongeveer 2800 USD. Andere SKU's zijn beschikbaar met de snellere Core i9-13900H, tragere RTX 4060, of een lagere resolutie mat FHD+ paneel. Merk op dat dit een van de weinige laptops is met een 50 W GeForce RTX 4070 in vergelijking met 100 W of meer op de meeste andere laptops met dezelfde GPU.
Concurrenten zijn andere high-end 15-inch multimedia laptops zoals deAsus Zenbook Pro 15, MSI Summit E15,Gigabyte Aero 15of de Razer Blade 15 Studio.
Meer Dell beoordelingen:
Potentiële concurrenten in vergelijking
Evaluatie | Datum | Model | Gewicht | Hoogte | Formaat | Resolutie | Beste prijs |
|---|---|---|---|---|---|---|---|
| 90.3 % v7 (old) | 04-2023 | Dell XPS 15 9530 RTX 4070 i7-13700H, GeForce RTX 4070 Laptop GPU | 1.9 kg | 18 mm | 15.60" | 3456x2160 | |
| 89.5 % v7 (old) | 05-2022 | Dell XPS 15 9520 RTX 3050 Ti i7-12700H, GeForce RTX 3050 Ti Laptop GPU | 1.9 kg | 18 mm | 15.60" | 3456x2160 | |
| 90.1 % v7 (old) | 06-2020 | Dell XPS 15 9500 Core i7 4K UHD i7-10875H, GeForce GTX 1650 Ti Mobile | 2 kg | 18 mm | 15.60" | 3840x2400 | |
| 87.7 % v7 (old) | 05-2022 | Asus Zenbook Pro 15 OLED UM535Q R9 5900HX, GeForce RTX 3050 Ti Laptop GPU | 1.9 kg | 18 mm | 15.60" | 1920x1080 | |
| 85.4 % v7 (old) | 12-2022 | MSI Prestige 15 A12UD-093 i7-1280P, GeForce RTX 3050 Ti Laptop GPU | 1.8 kg | 20.1 mm | 15.60" | 3840x2160 | |
| 85.6 % v7 (old) | 08-2021 | Gigabyte Aero 15 OLED XD i7-11800H, GeForce RTX 3070 Laptop GPU | 2.2 kg | 20 mm | 15.60" | 3840x2160 |
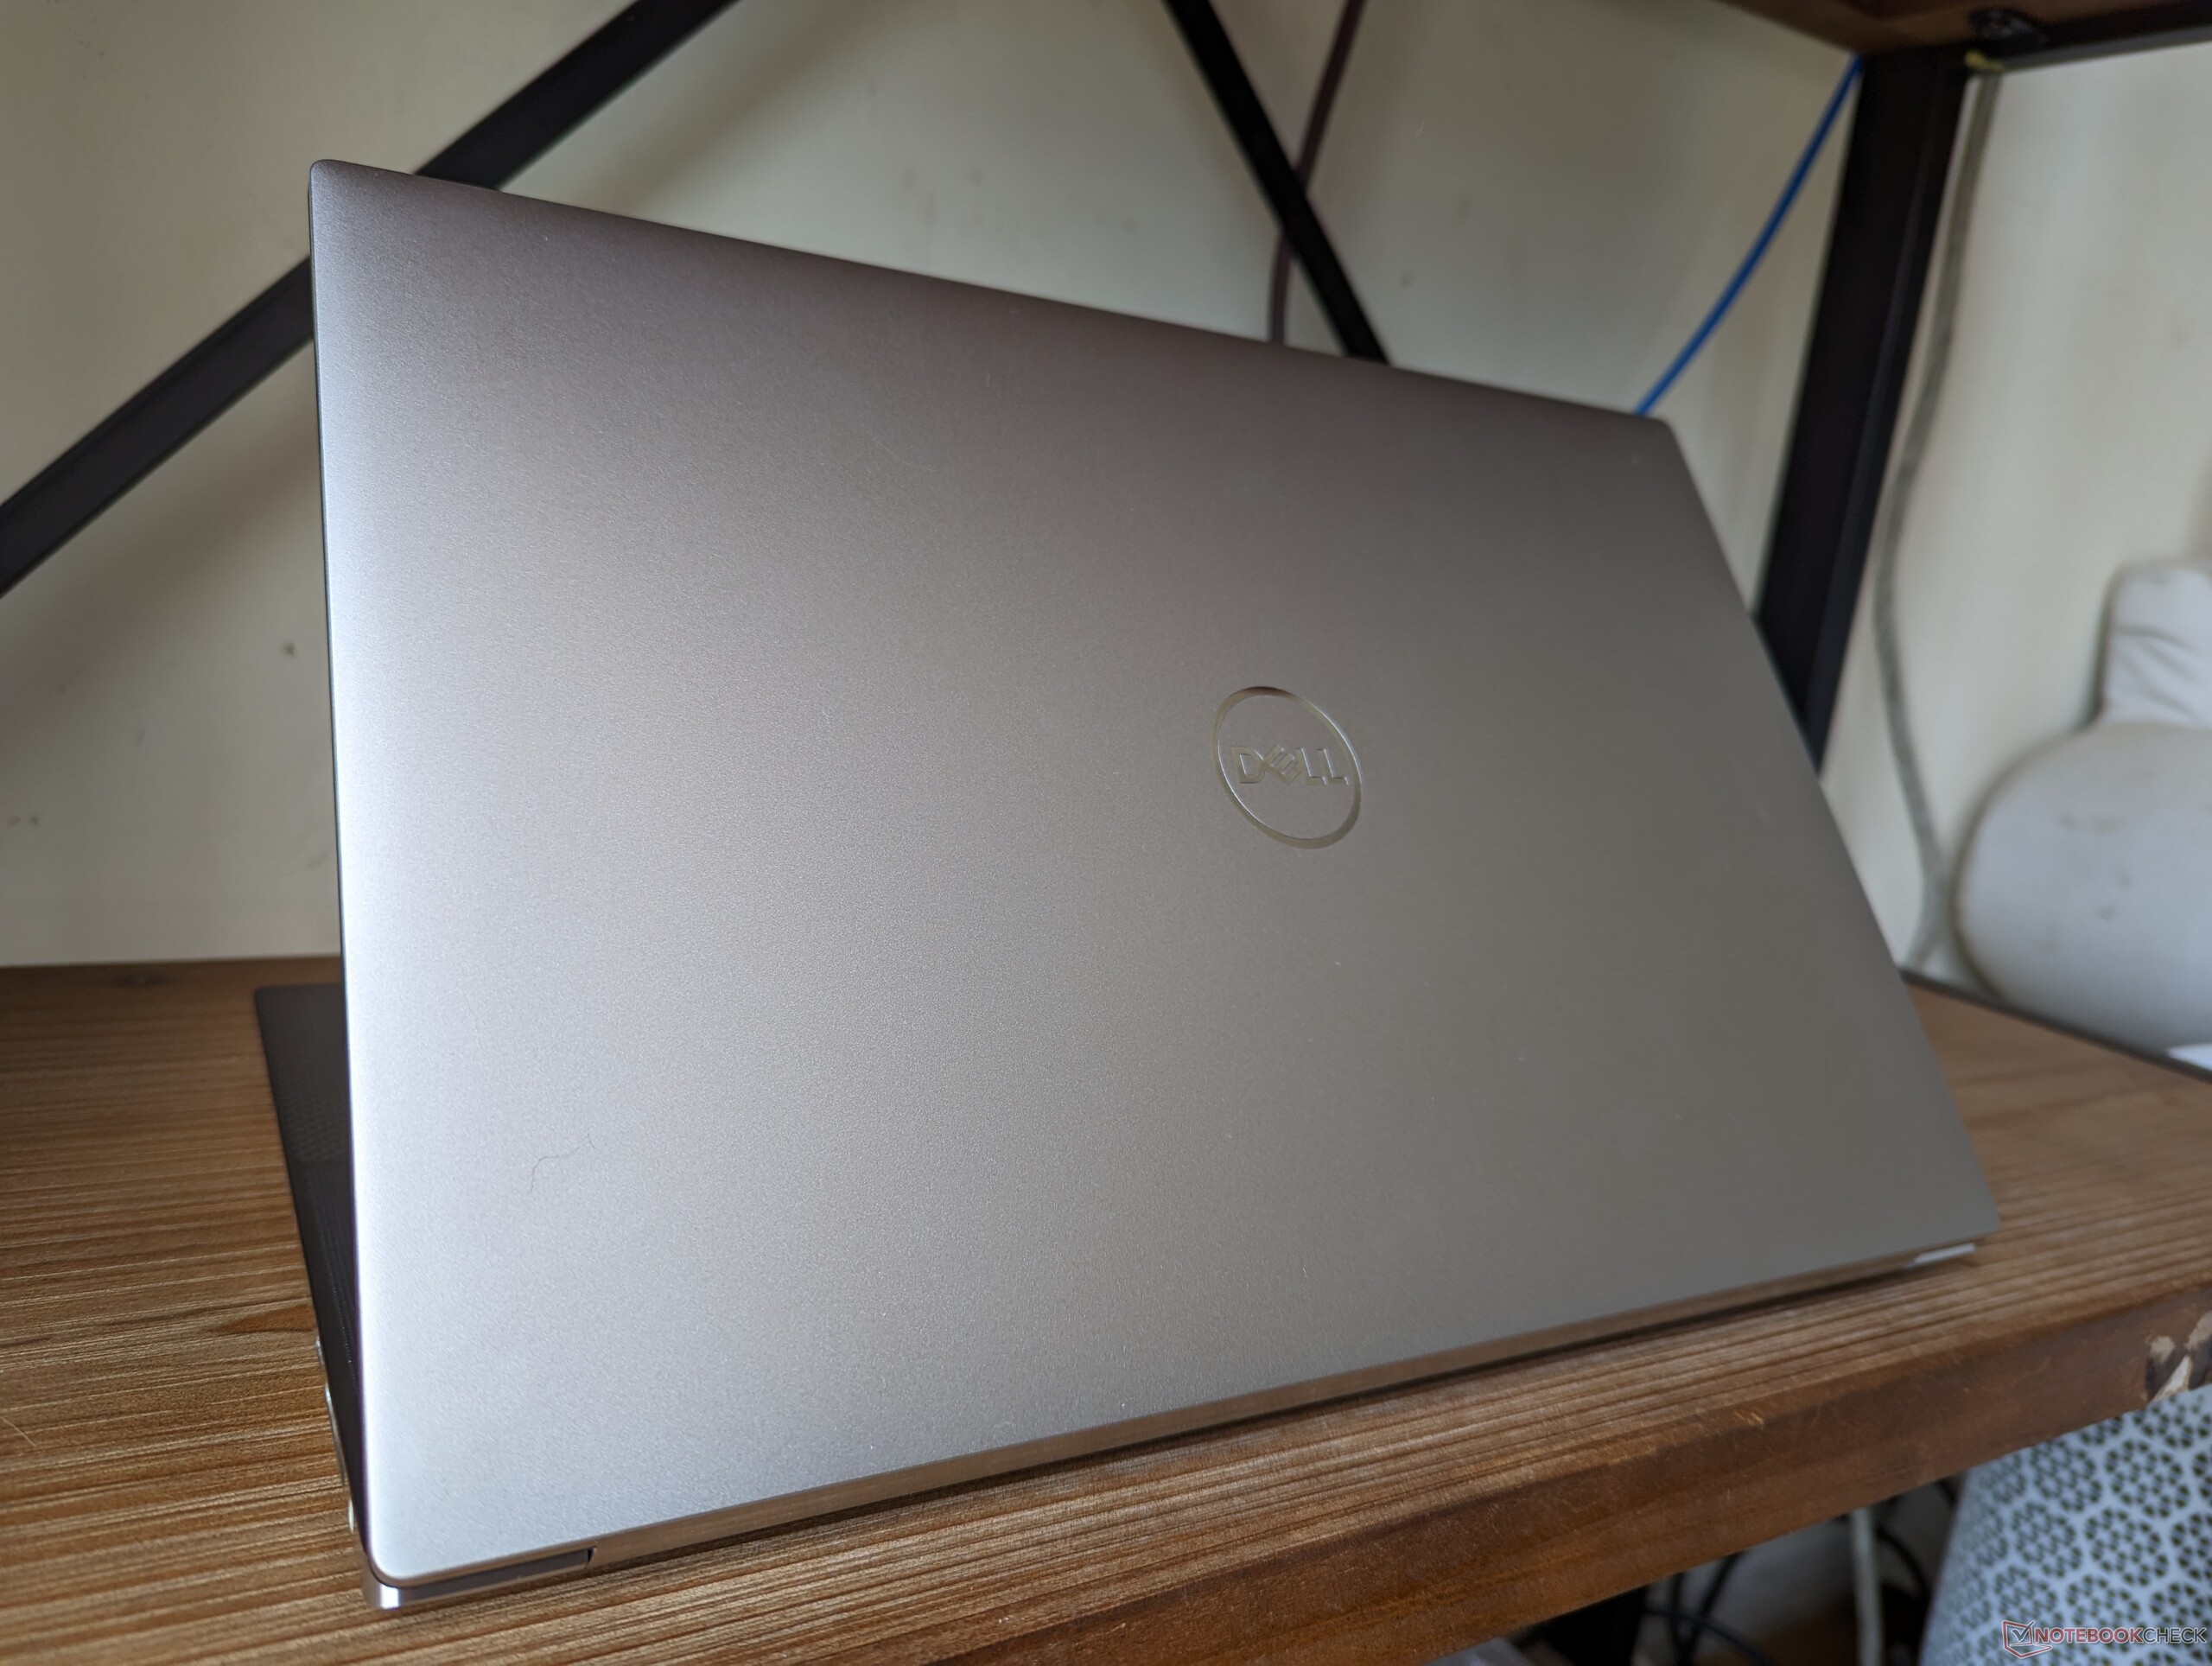
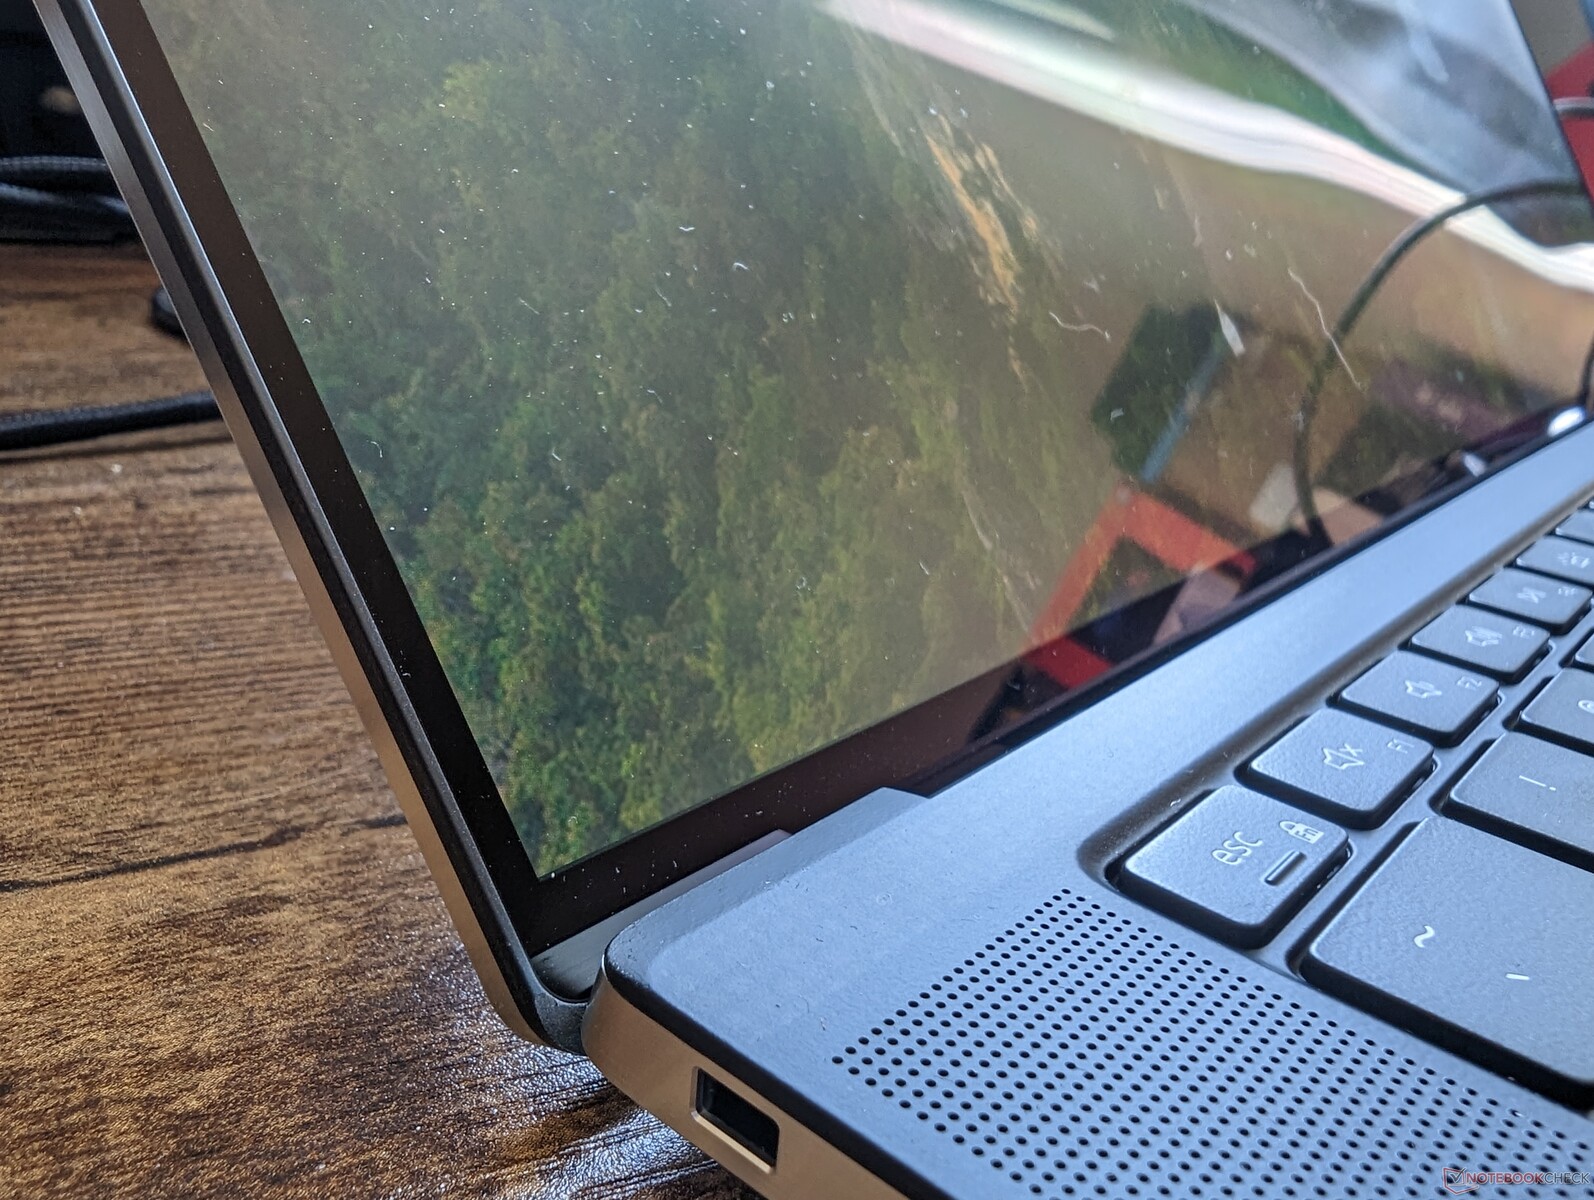
Geval - Geen grote veranderingen sinds de XPS 15 9500
SD-kaartlezer
| SD Card Reader | |
| average JPG Copy Test (av. of 3 runs) | |
| Dell XPS 15 9500 Core i7 4K UHD (Toshiba Exceria Pro SDXC 64 GB UHS-II) | |
| Gigabyte Aero 15 OLED XD (AV PRO microSD 128 GB V60) | |
| Dell XPS 15 9520 RTX 3050 Ti (Toshiba Exceria Pro SDXC 64 GB UHS-II) | |
| Dell XPS 15 9530 RTX 4070 (Toshiba Exceria Pro SDXC 64 GB UHS-II) | |
| Asus Zenbook Pro 15 OLED UM535Q (Toshiba Exceria Pro SDXC 64 GB UHS-II) | |
| MSI Prestige 15 A12UD-093 (AV Pro SD microSD 128 GB V60) | |
| maximum AS SSD Seq Read Test (1GB) | |
| Dell XPS 15 9500 Core i7 4K UHD (Toshiba Exceria Pro SDXC 64 GB UHS-II) | |
| Gigabyte Aero 15 OLED XD (AV PRO microSD 128 GB V60) | |
| Dell XPS 15 9530 RTX 4070 (Toshiba Exceria Pro SDXC 64 GB UHS-II) | |
| Dell XPS 15 9520 RTX 3050 Ti (Toshiba Exceria Pro SDXC 64 GB UHS-II) | |
| MSI Prestige 15 A12UD-093 (AV Pro SD microSD 128 GB V60) | |
| Asus Zenbook Pro 15 OLED UM535Q (Toshiba Exceria Pro SDXC 64 GB UHS-II) | |
Communicatie
Een Intel AX211 wordt standaard geleverd voor Wi-Fi 6E en Bluetooth 5.2 ondersteuning. We kunnen zonder problemen verbinding maken met ons Asus AXE11000 Wi-Fi 6 netwerk, maar de laptop herkent of maakt vreemd genoeg geen verbinding met ons 6 GHz Wi-Fi 6E netwerk. Andere apparaten met Wi-Fi 6E, zoals de Pixel 7 Pro konden ons 6 GHz netwerk zonder problemen herkennen en er verbinding mee maken.
| Networking | |
| iperf3 transmit AX12 | |
| Gigabyte Aero 15 OLED XD | |
| Dell XPS 15 9500 Core i7 4K UHD | |
| Asus Zenbook Pro 15 OLED UM535Q | |
| iperf3 receive AX12 | |
| Dell XPS 15 9500 Core i7 4K UHD | |
| Gigabyte Aero 15 OLED XD | |
| Asus Zenbook Pro 15 OLED UM535Q | |
| iperf3 transmit AXE11000 | |
| Dell XPS 15 9530 RTX 4070 | |
| Dell XPS 15 9520 RTX 3050 Ti | |
| MSI Prestige 15 A12UD-093 | |
| iperf3 receive AXE11000 | |
| Dell XPS 15 9520 RTX 3050 Ti | |
| Dell XPS 15 9530 RTX 4070 | |
| MSI Prestige 15 A12UD-093 | |
| iperf3 transmit AXE11000 6GHz | |
| MSI Prestige 15 A12UD-093 | |
| iperf3 receive AXE11000 6GHz | |
| MSI Prestige 15 A12UD-093 | |
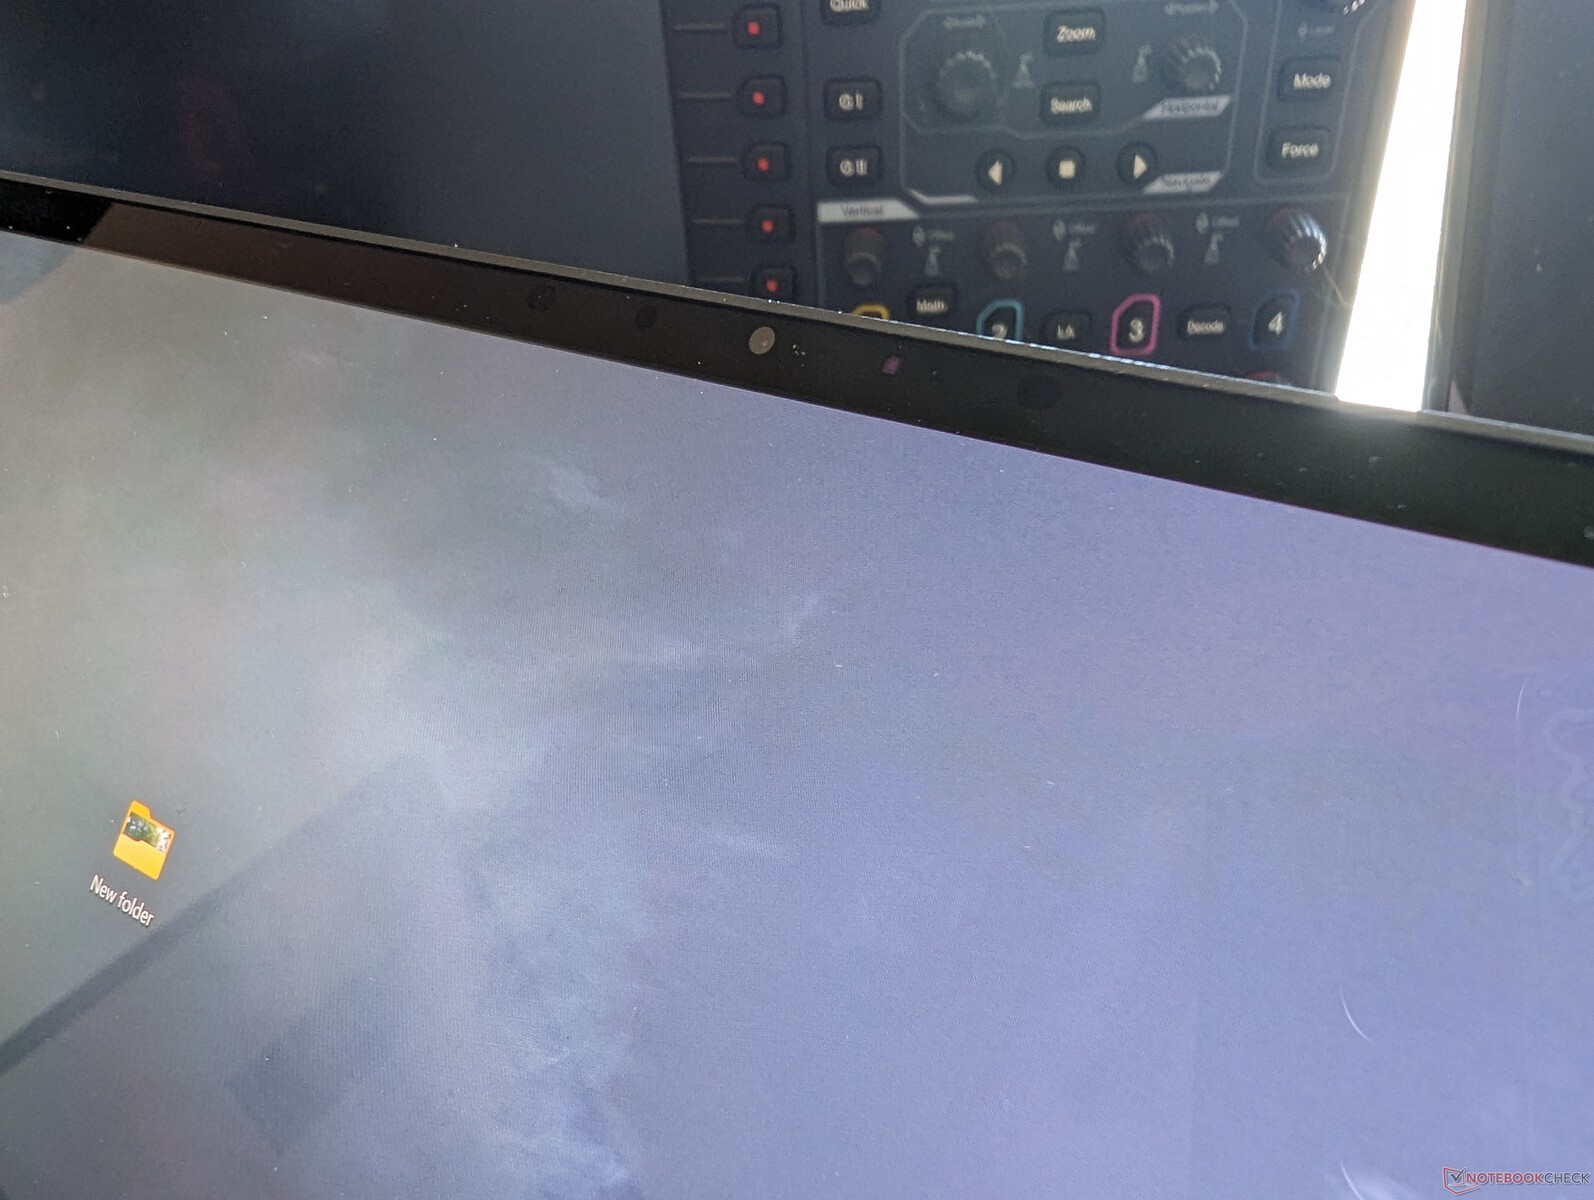
Webcam - 1 MP resolutie wordt gênant
De nieuwste XPS 15 vertrouwt *nog* op een lage resolutie 1 MP/720p webcam zonder privacy shutter, ondanks de vraagprijs van >$2000 USD. Concurrerende modellen zoals de HP Spectre x360 16 of Razer Blade serie zijn al overgestapt op 2 MP of zelfs 5 MP sensoren. Onnodig te zeggen dat de beeldkwaliteit erg wazig is op een overigens prachtig OLED-scherm. IR wordt tenminste ondersteund.
Dell zegt dat de lage resolutie webcam een gevolg is van het hebben van een van de smalste bezels op een laptop. Een hogere resolutie webcam zou de rand dikker maken.


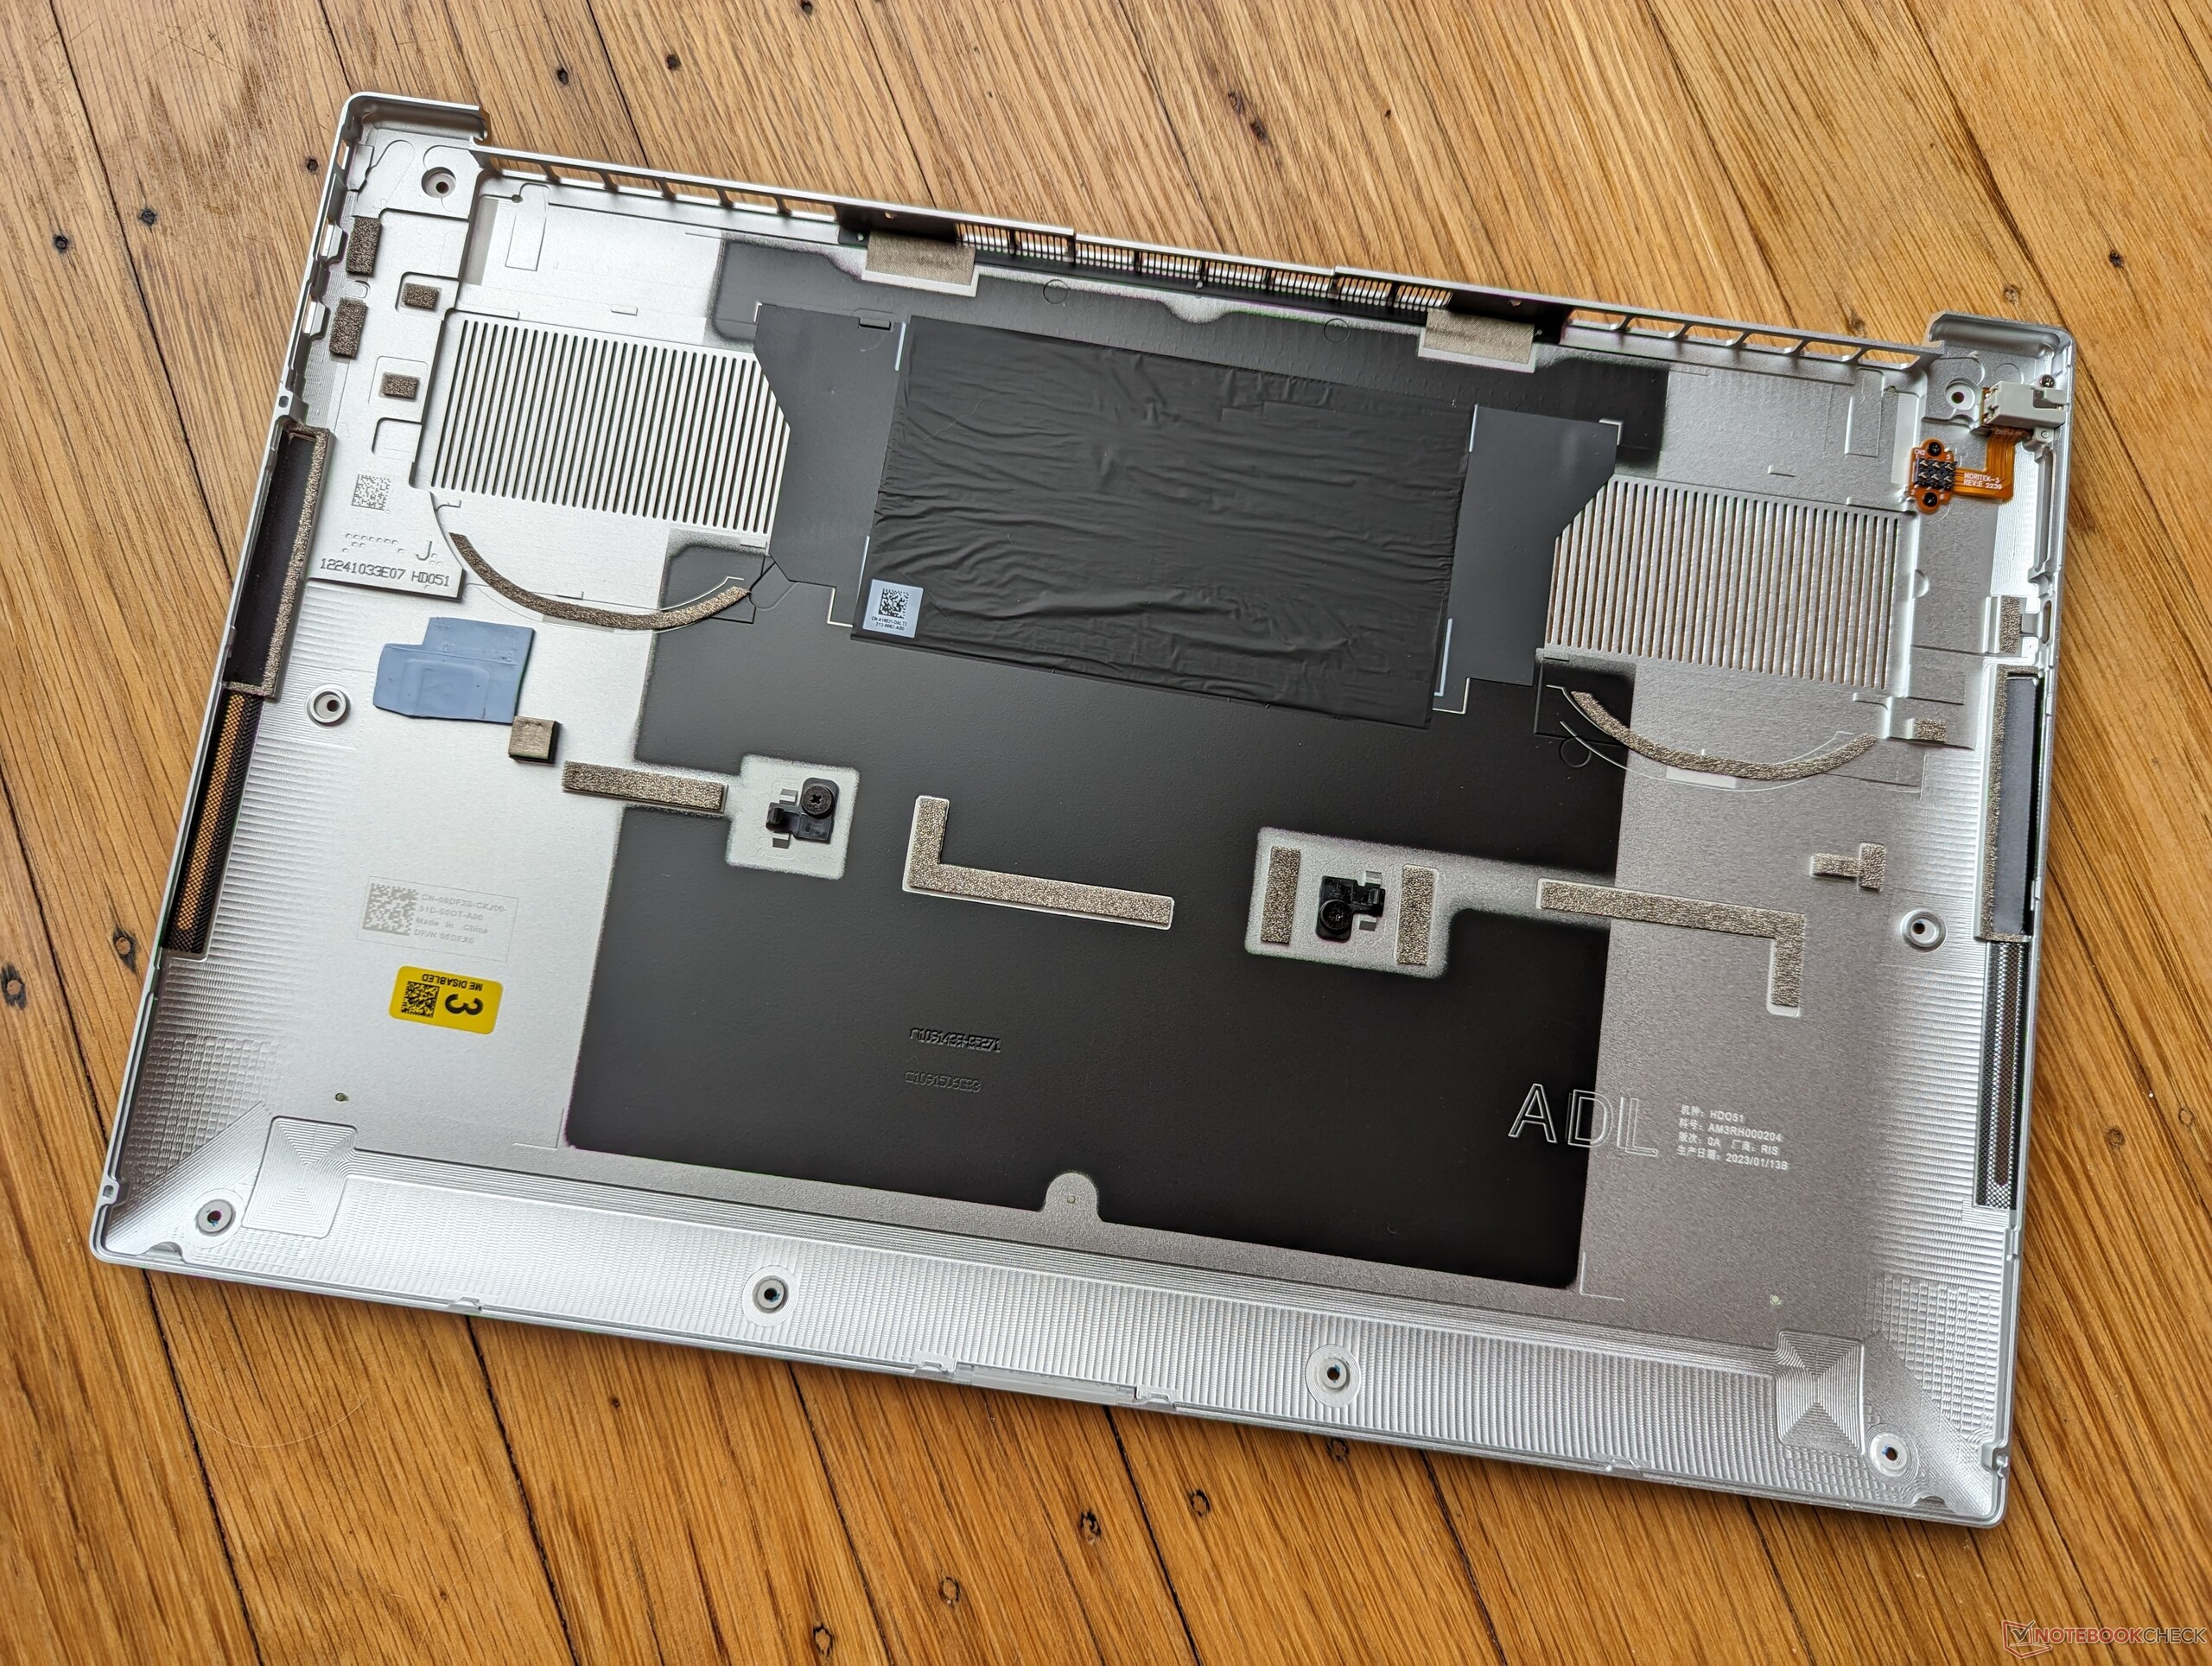
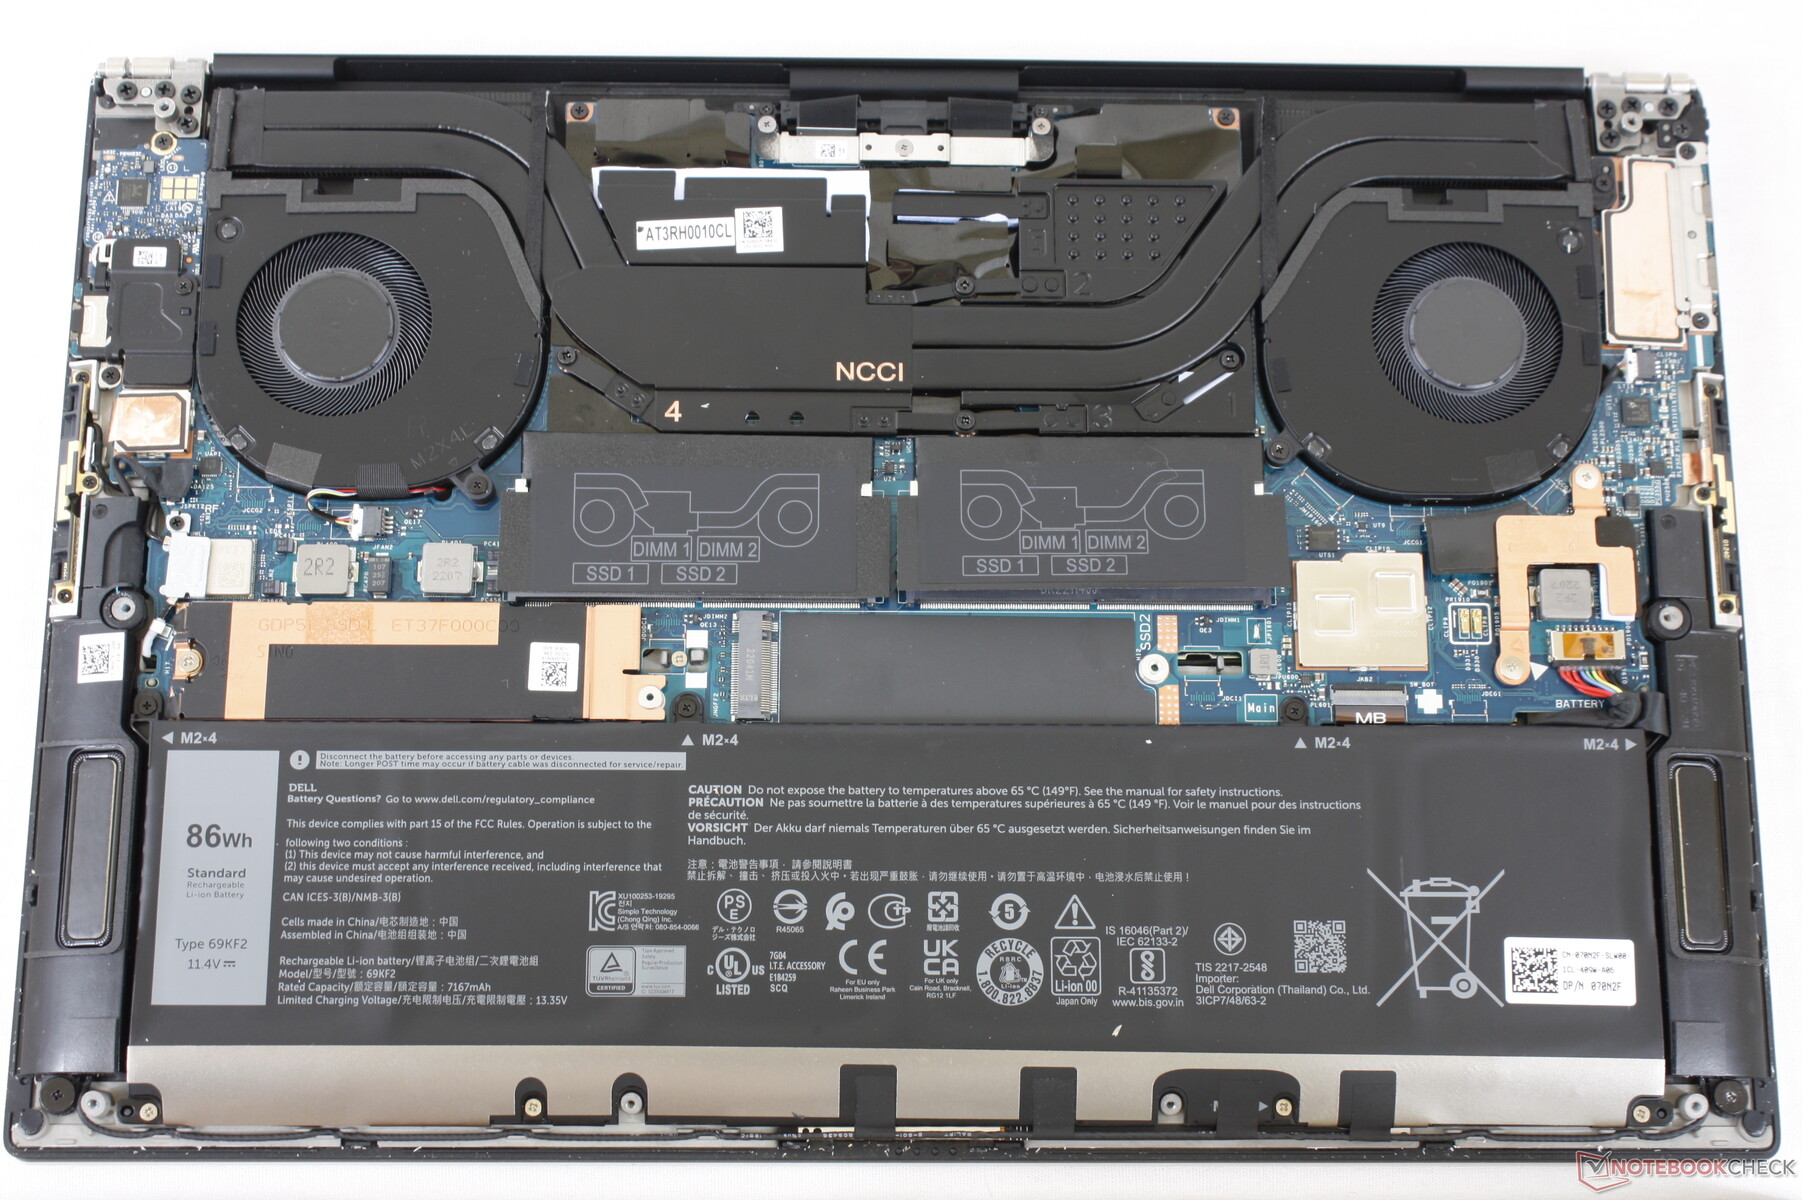
Onderhoud
Accessoires en garantie
Dell levert nog steeds een handige USB-C naar USB-A en HDMI-adapter mee in elke verkoopverpakking, wat we waarderen. De gebruikelijke beperkte fabrieksgarantie van een jaar is van toepassing.
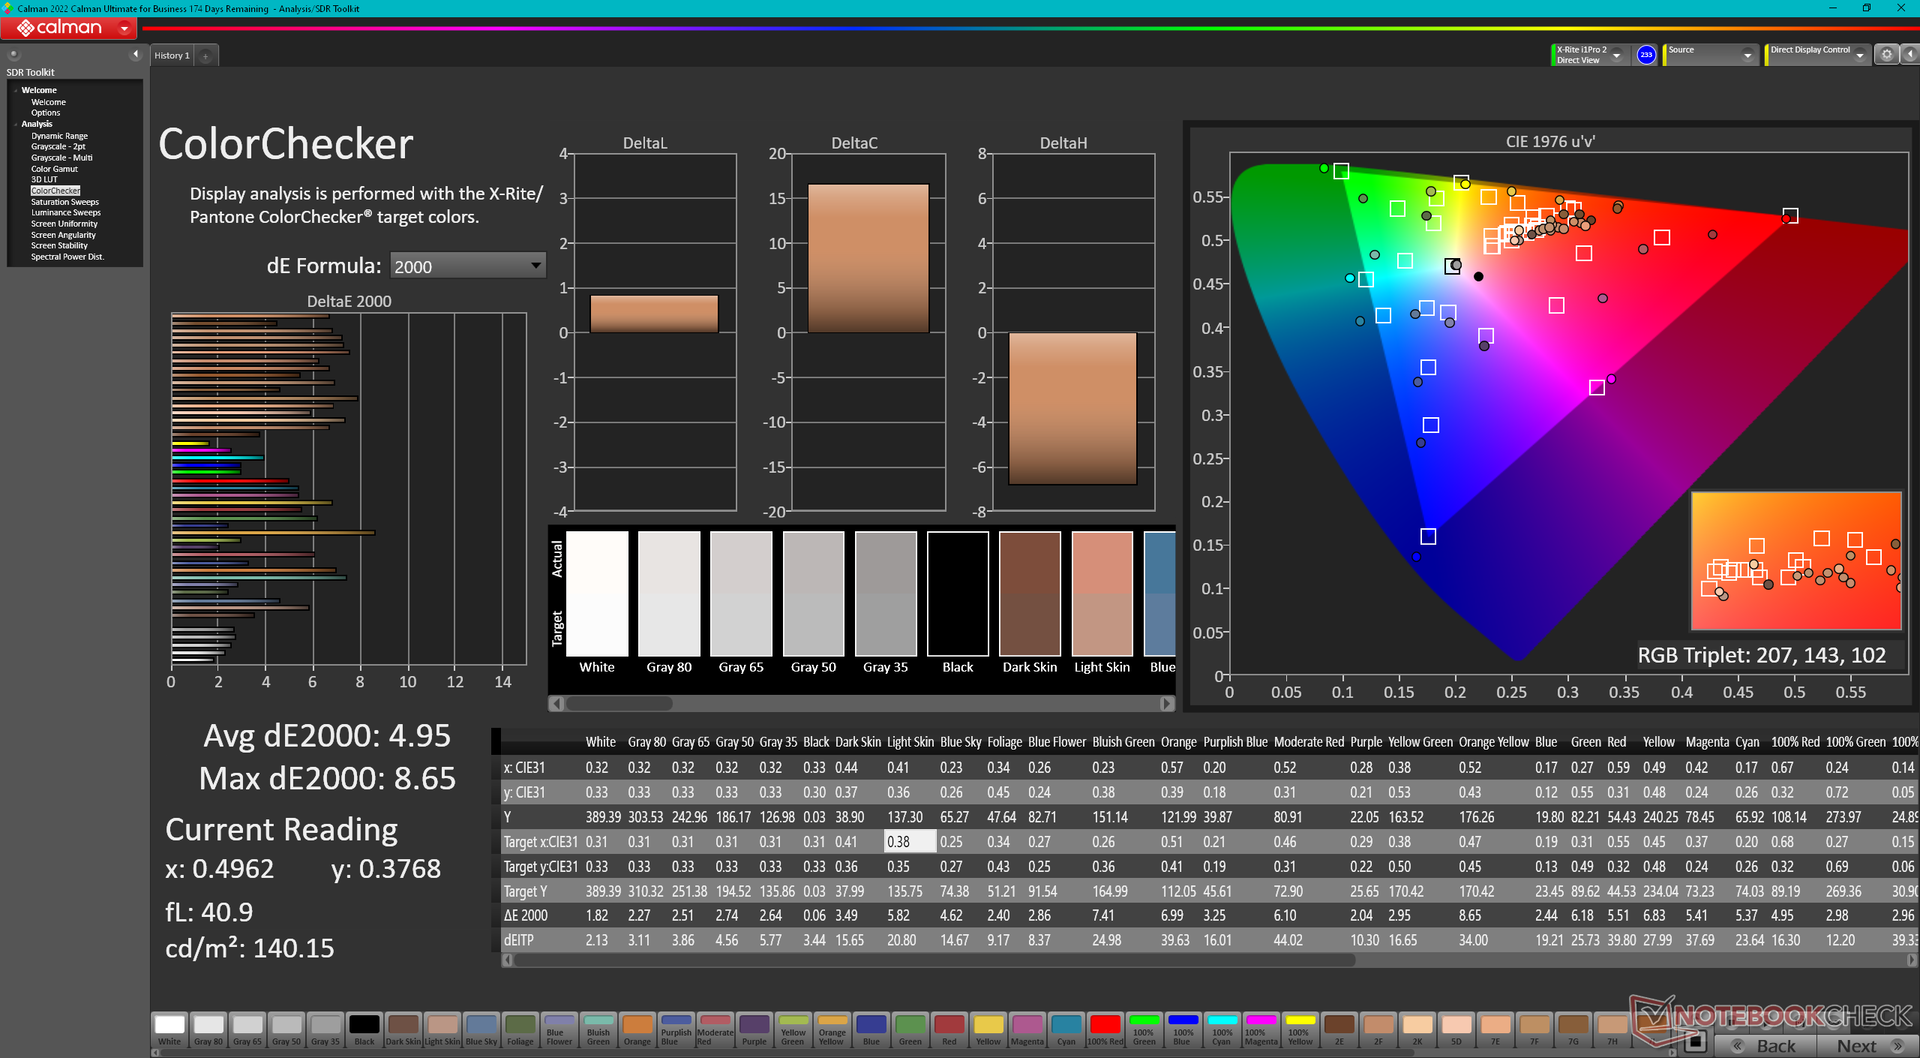
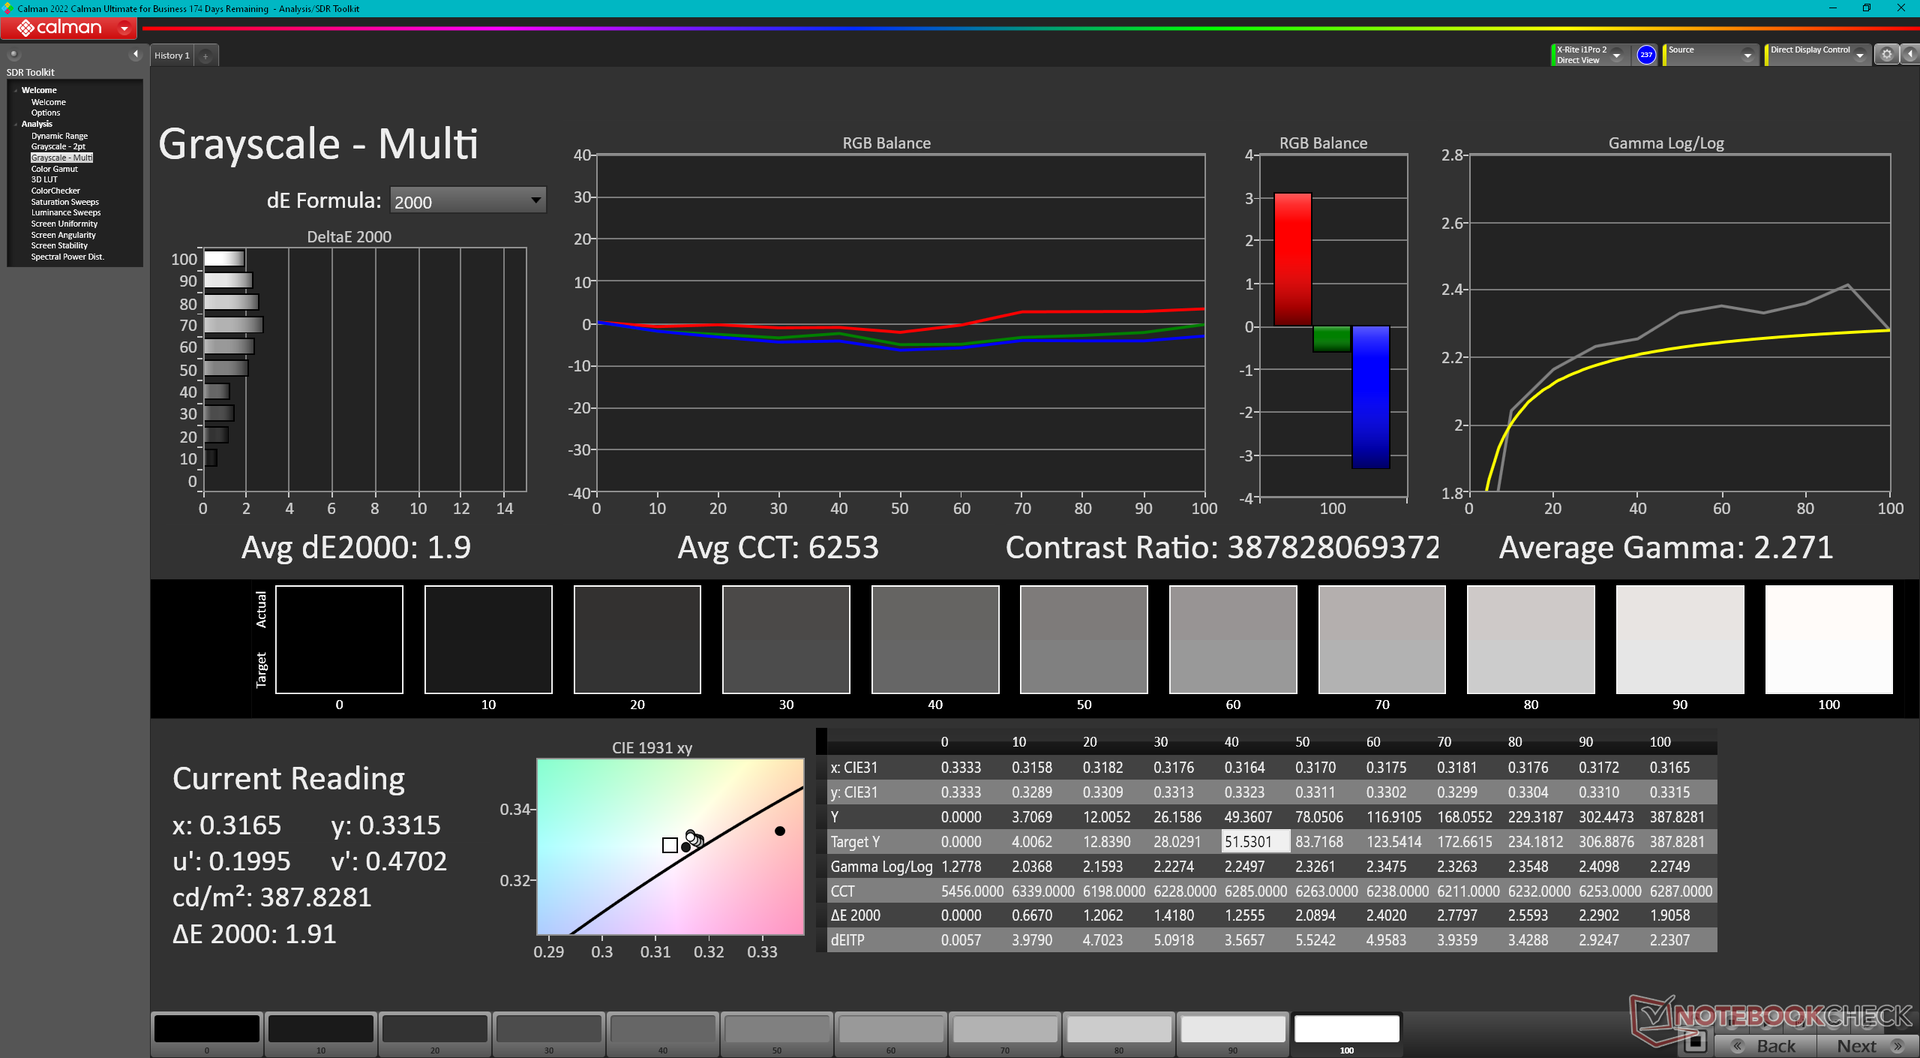
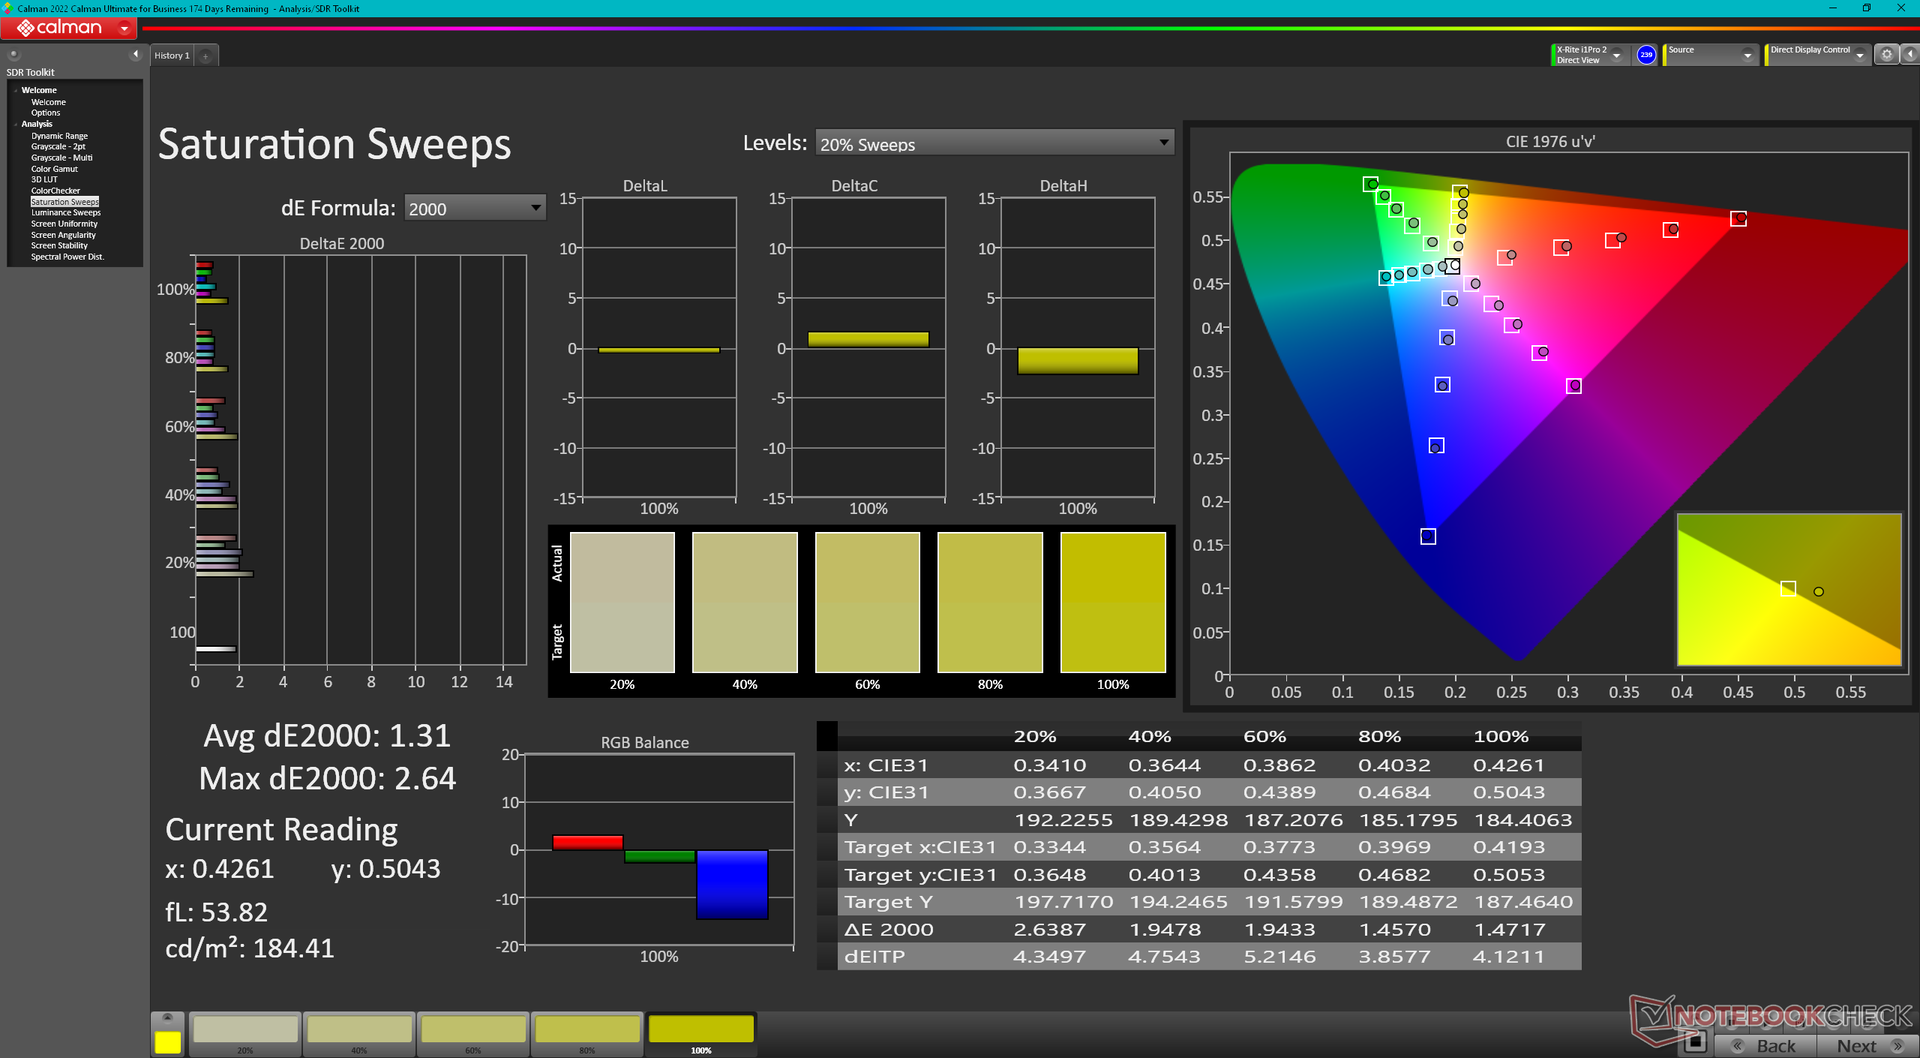
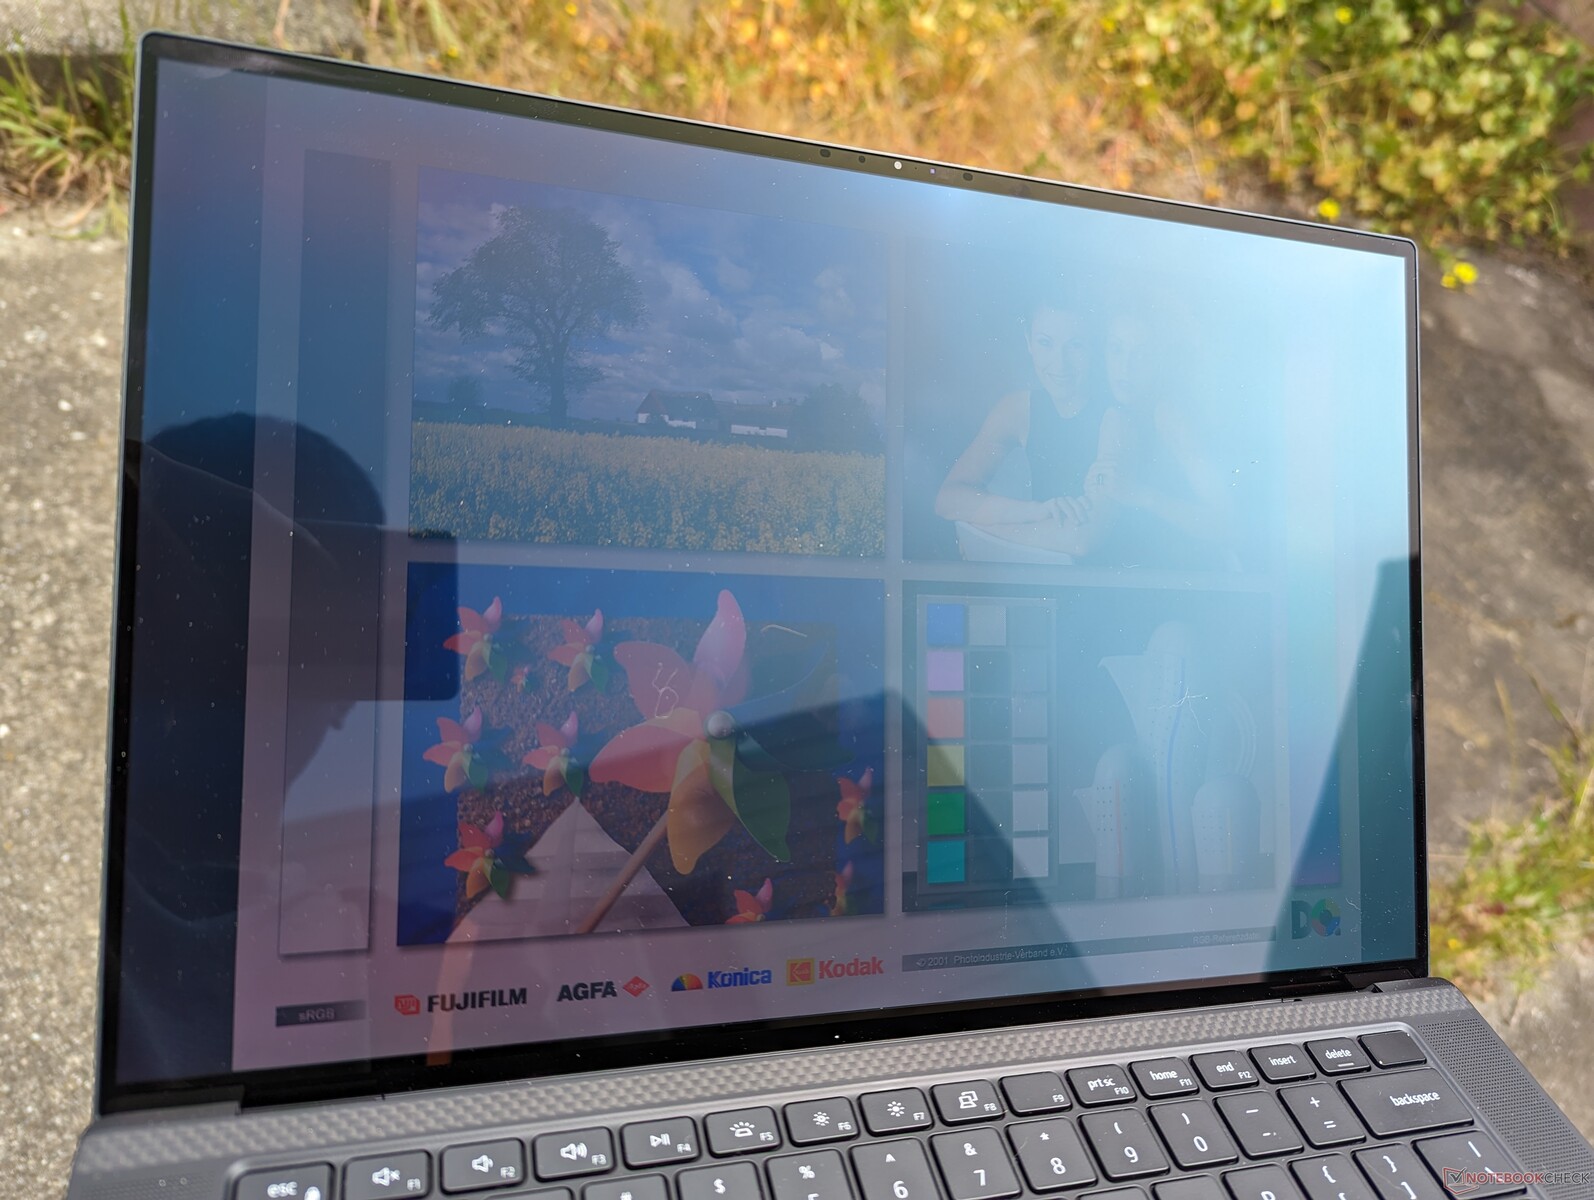
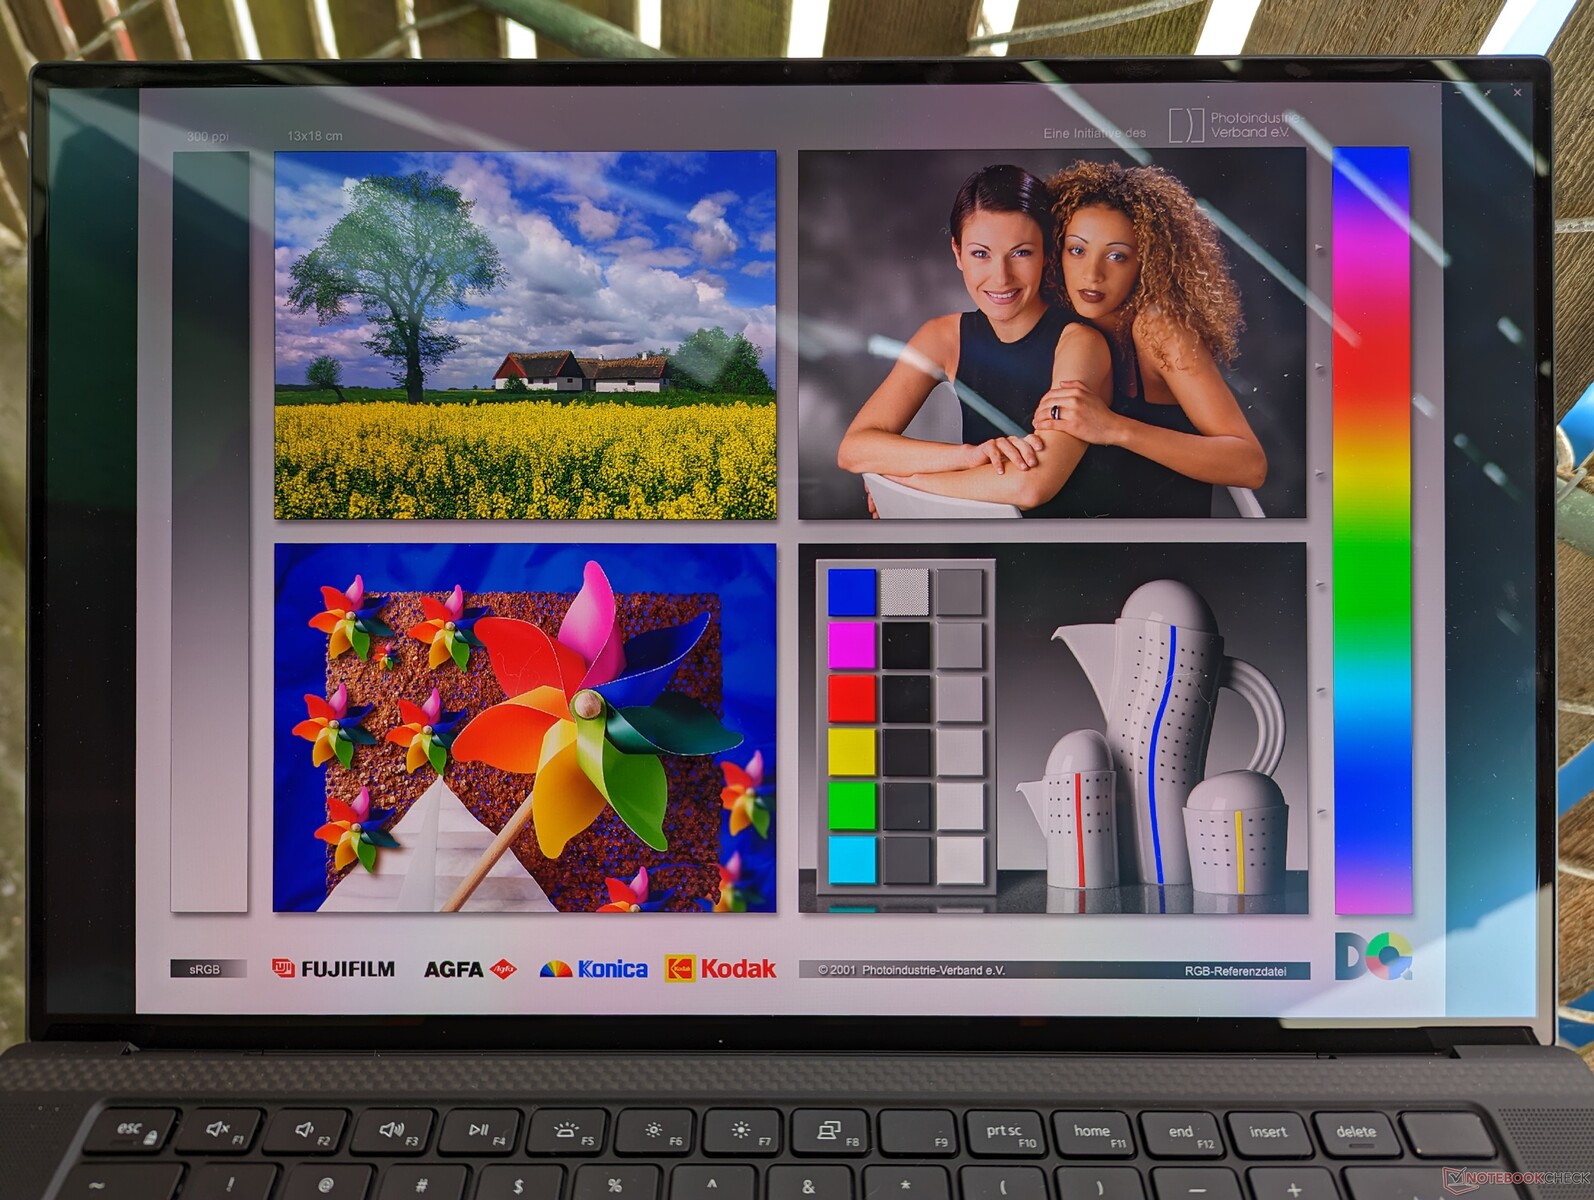
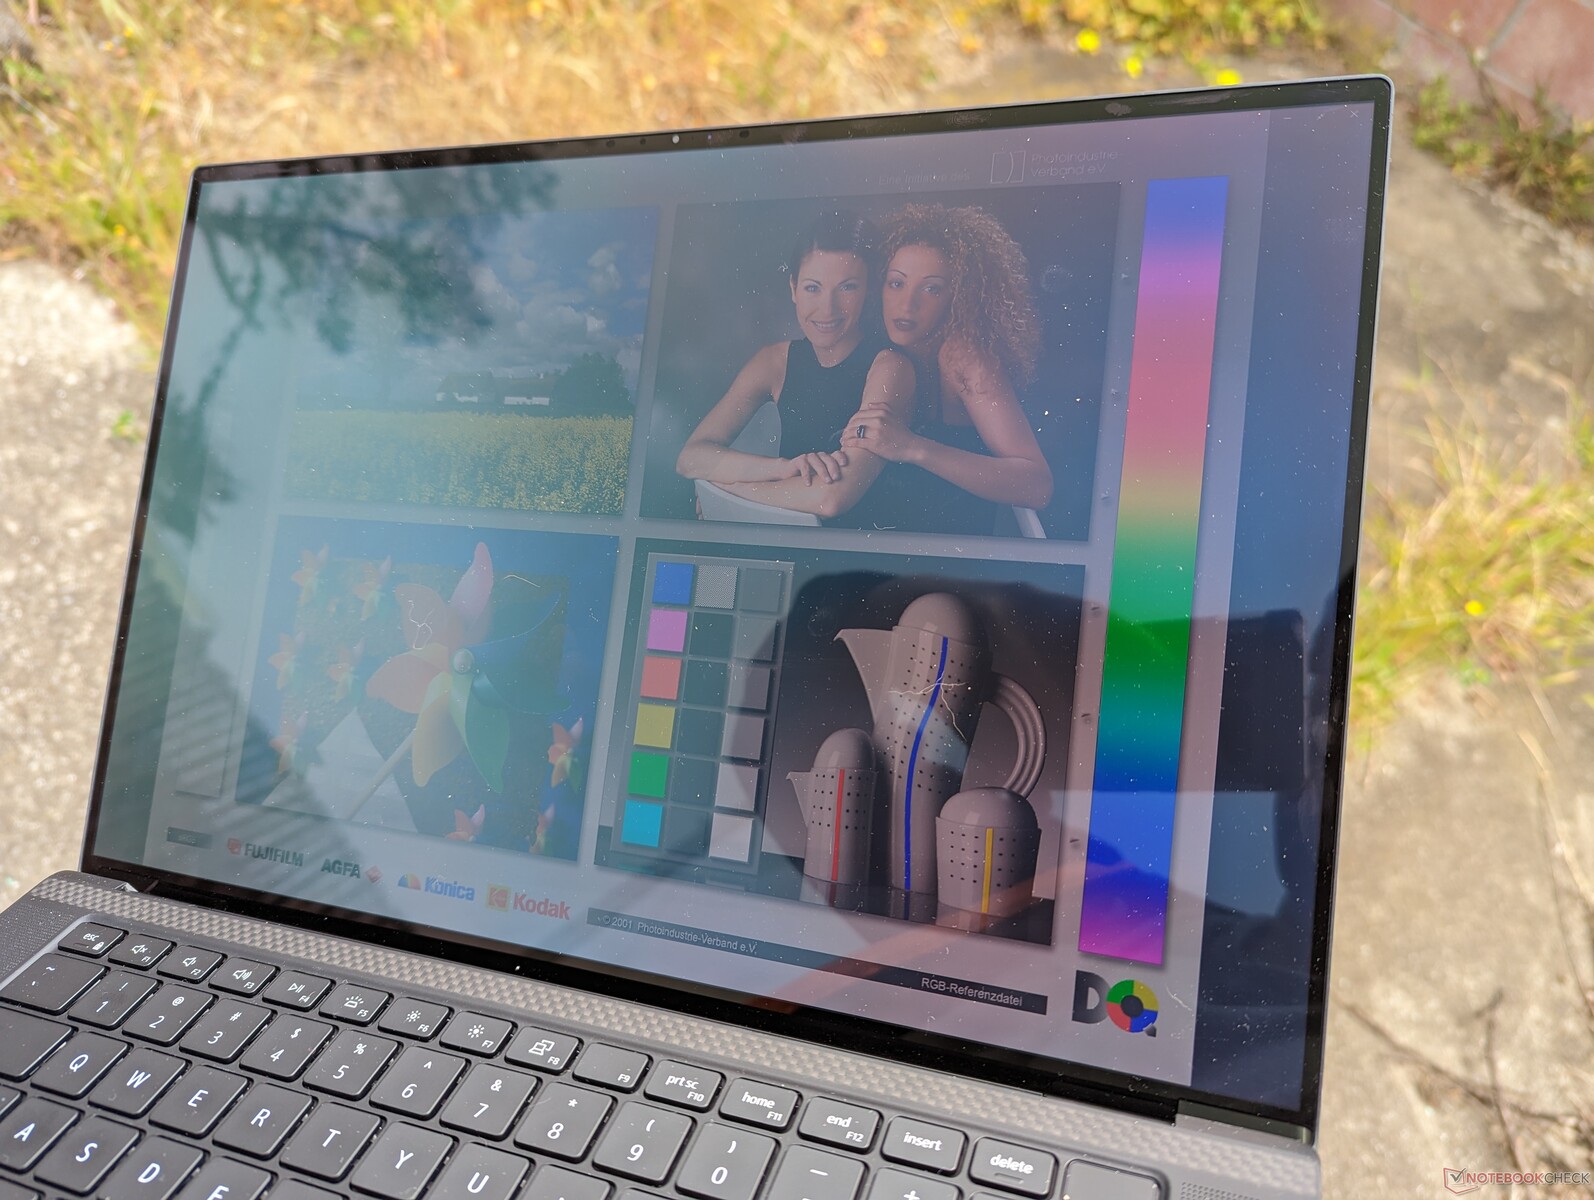
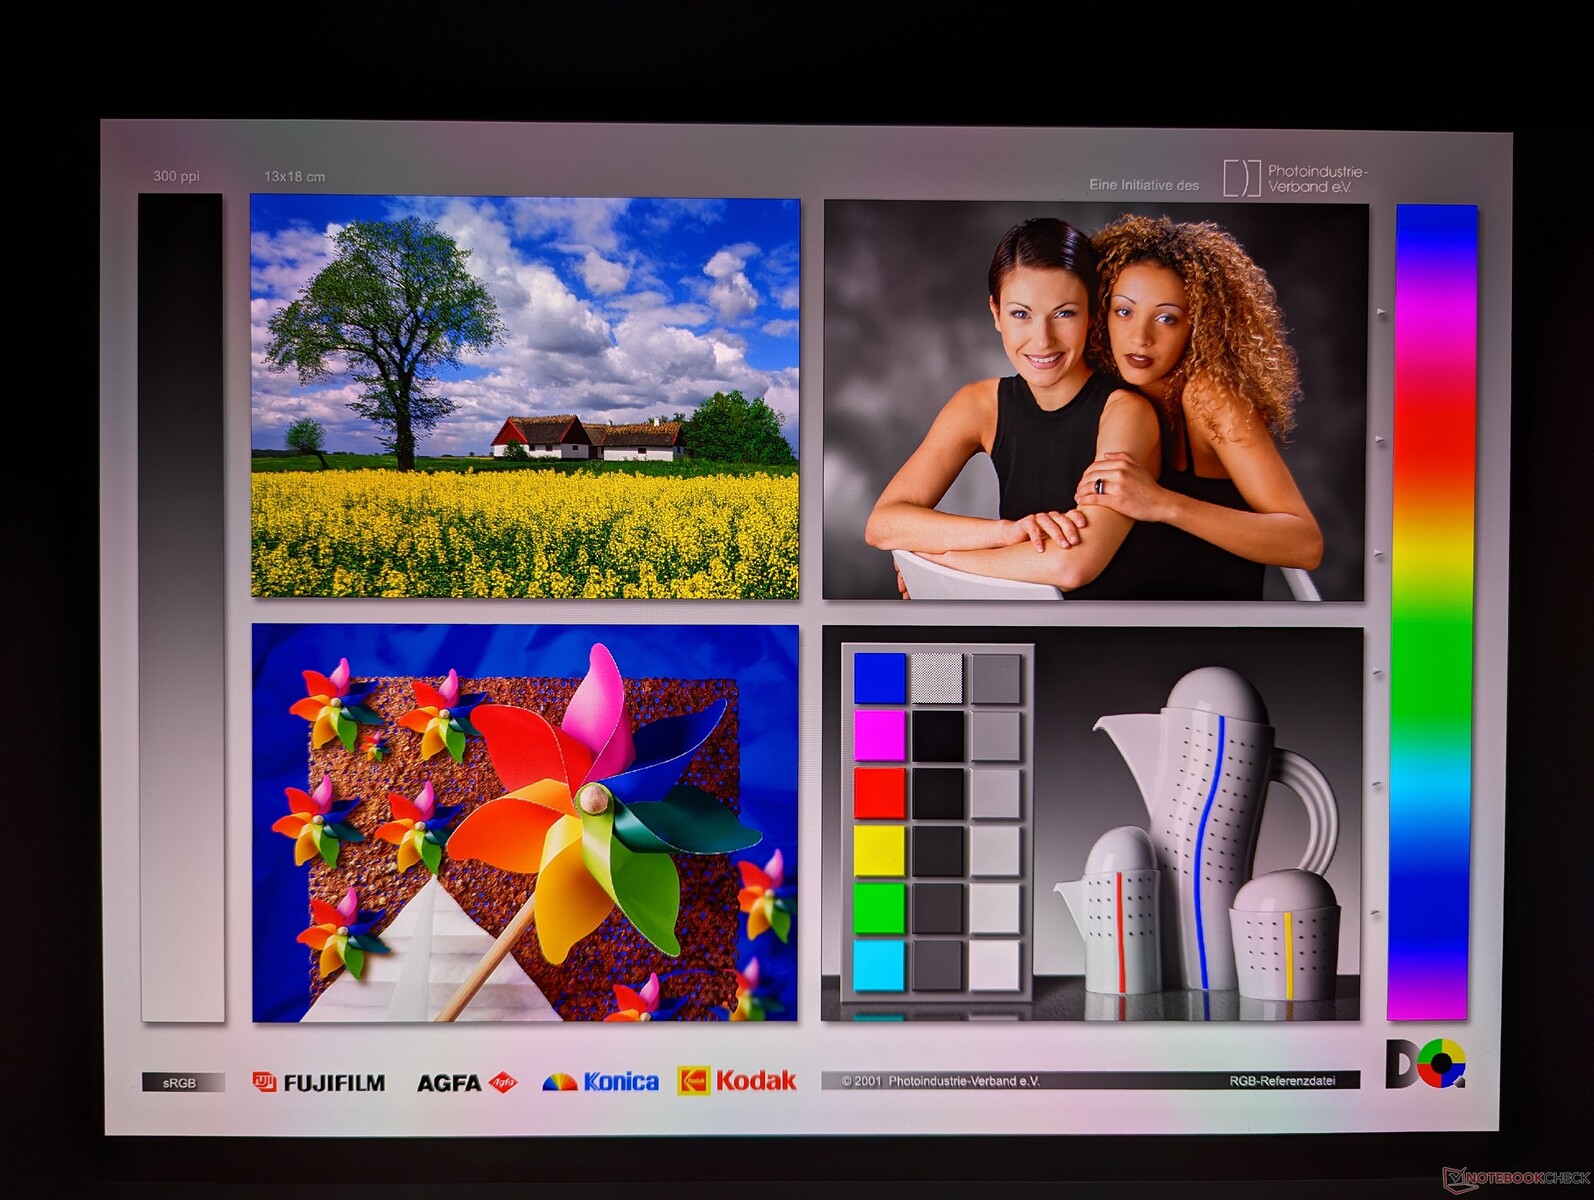
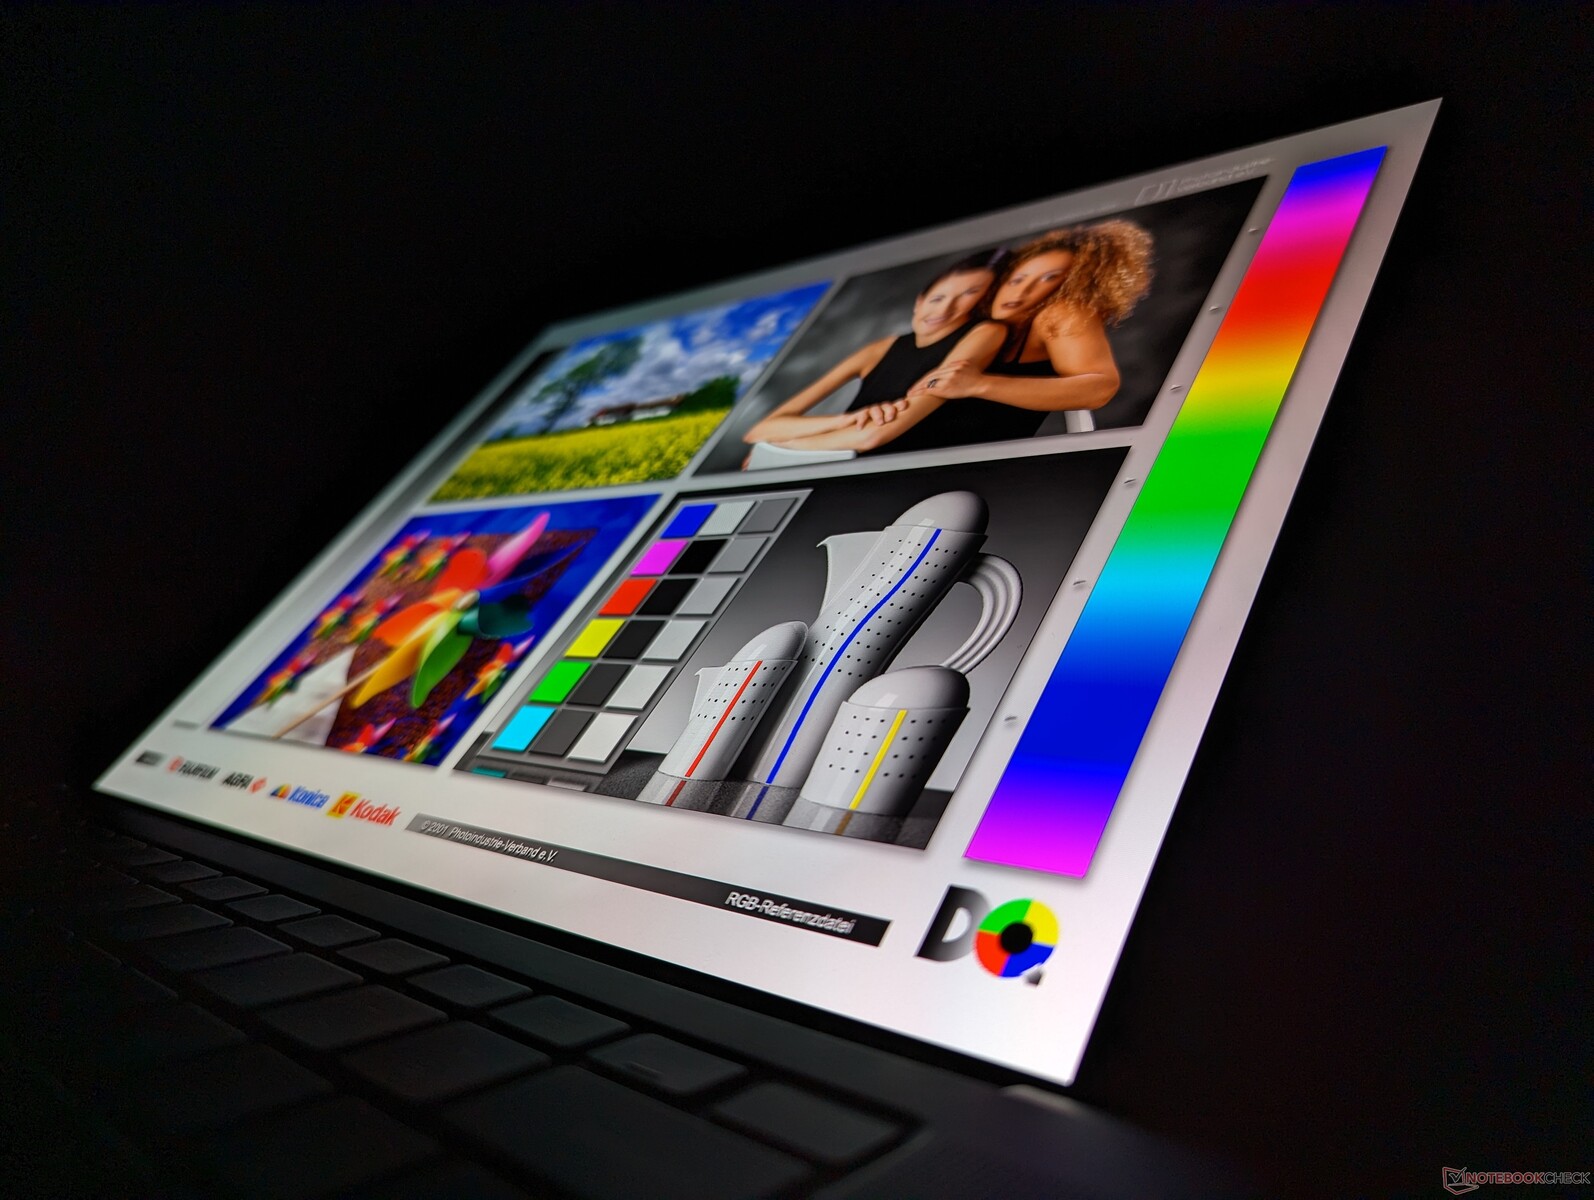
Beeldscherm - 3.5K Samsung OLED ziet er nog steeds geweldig uit
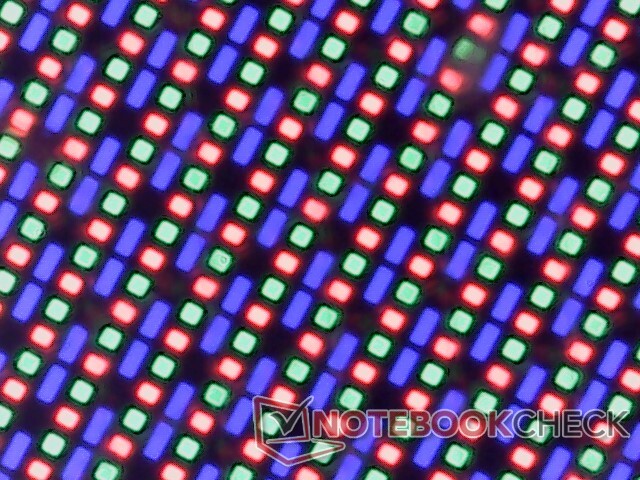
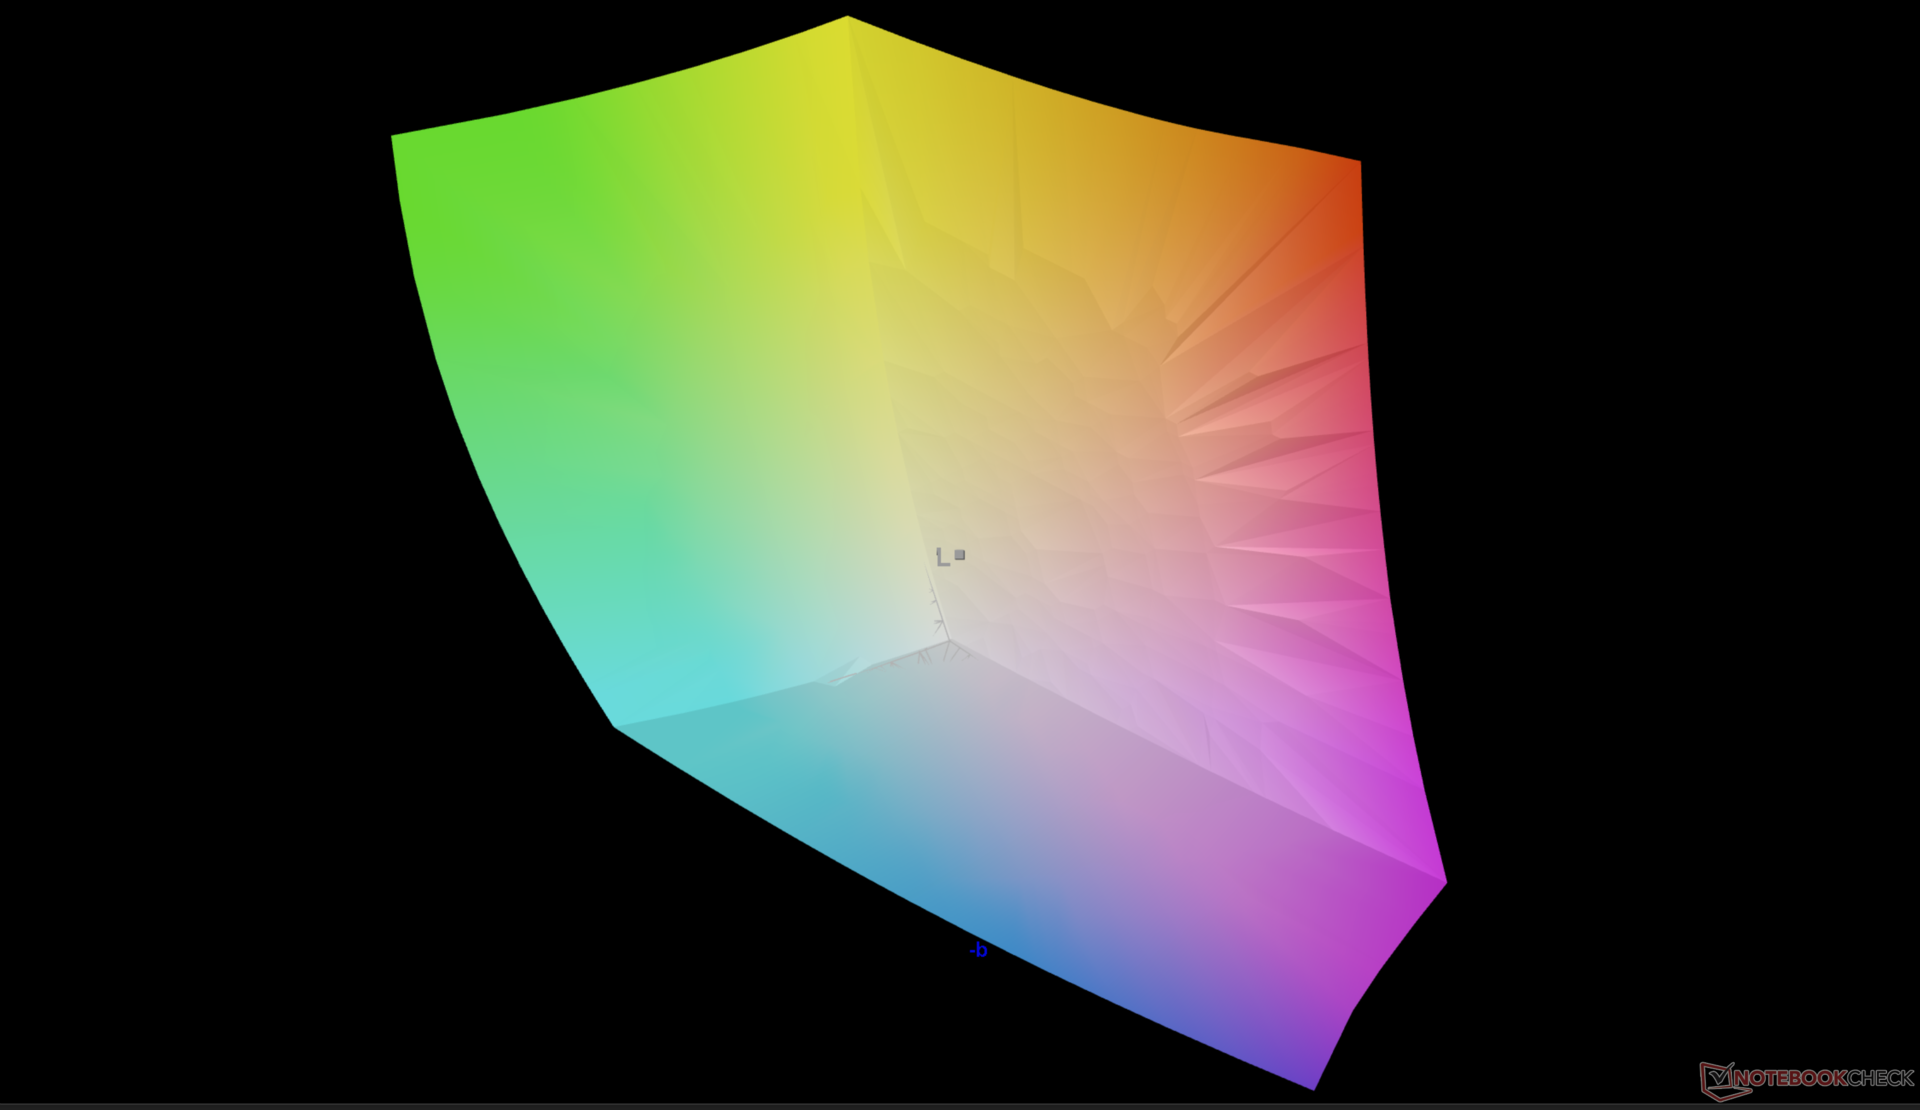
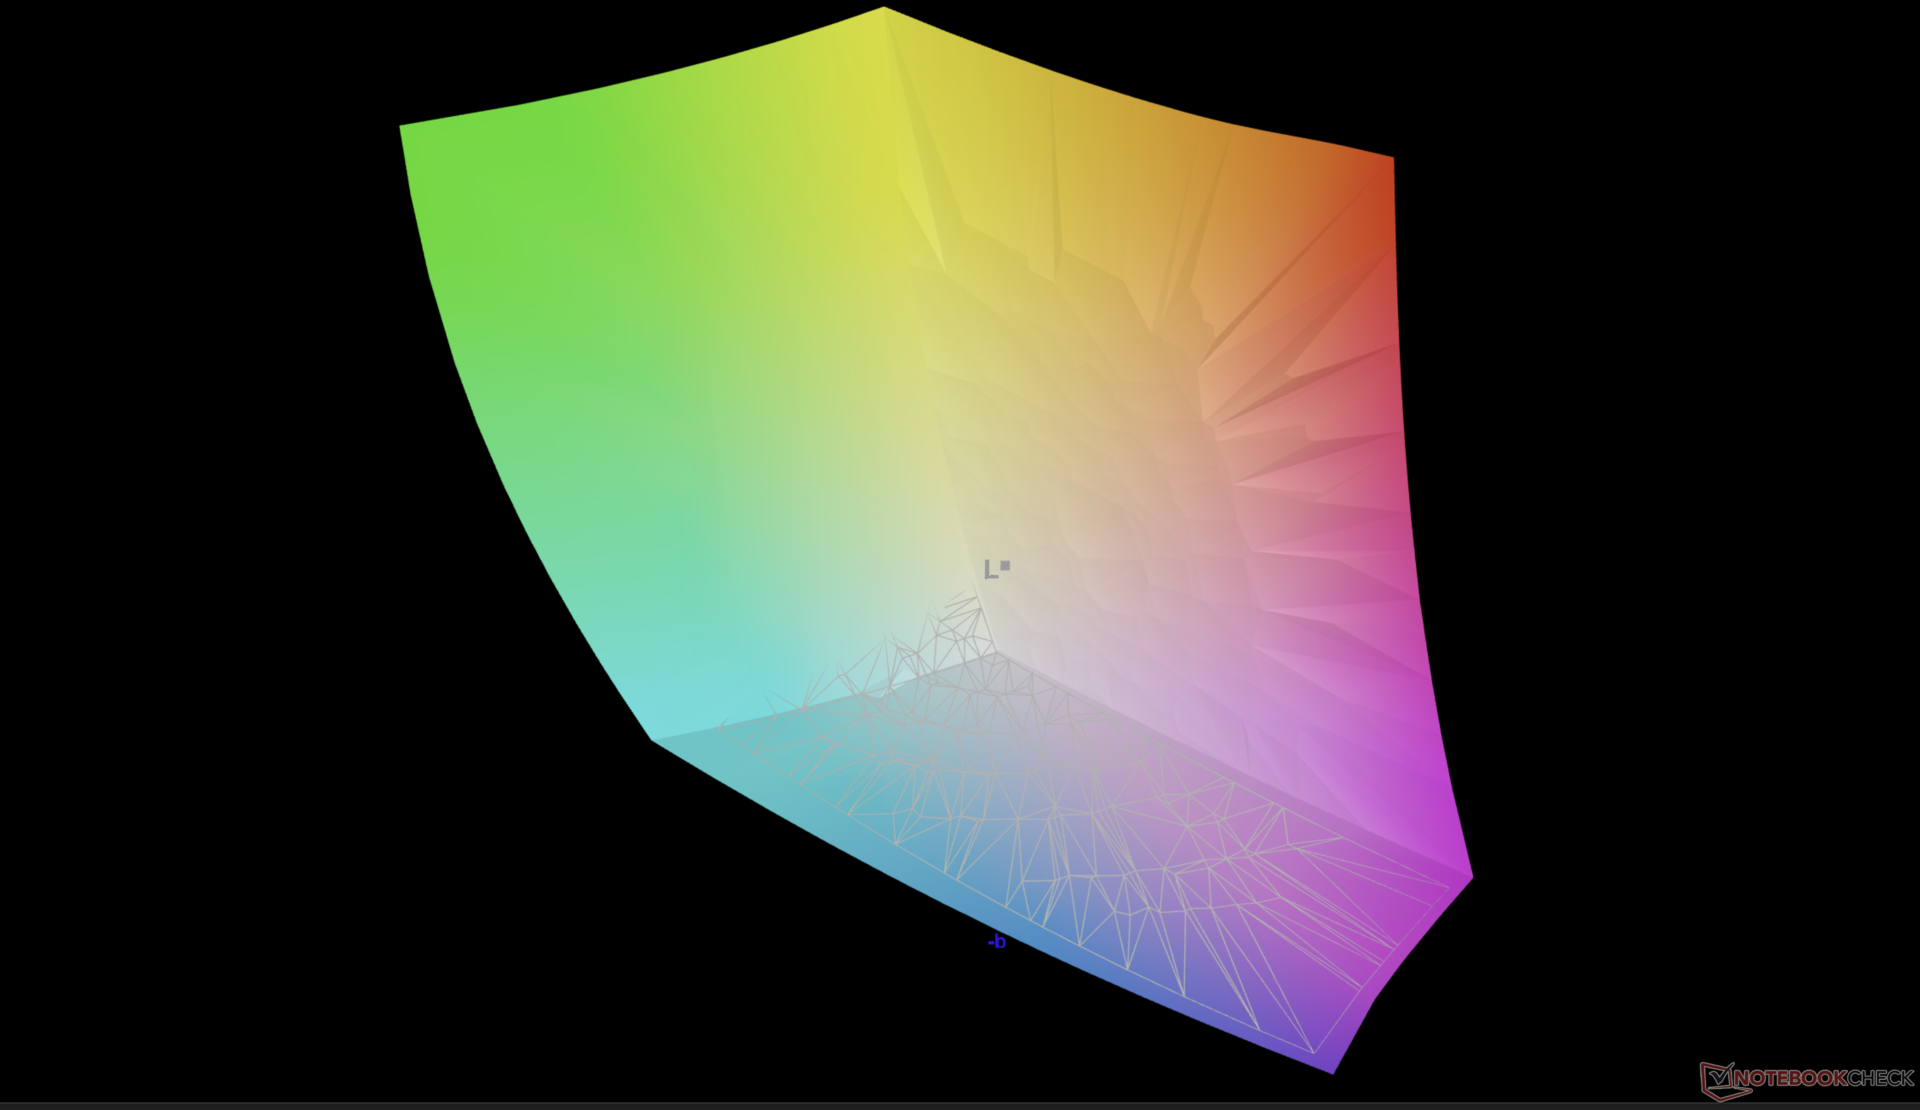
Dell gebruikt hetzelfde Samsung 156XG01 OLED paneel op de 2023 en 2022 XPS 15 modellen voor een vergelijkbare kijkervaring. Dit is niet per se een slechte zaak, aangezien het Samsung paneel nog steeds zowel volledige DCI-P3 kleuren als een scherp beeld biedt, maar we zouden graag 90 Hz of snellere paneelopties zien in de toekomst. Bepaalde Asus VivoBook modellenworden bijvoorbeeld geleverd met 120 Hz OLED-panelen voor een veel vloeiendere visuele ervaring.
| |||||||||||||||||||||||||
Helderheidsverdeling: 98 %
Helderheid in Batterij-modus: 389.5 cd/m²
Contrast: ∞:1 (Zwart: 0 cd/m²)
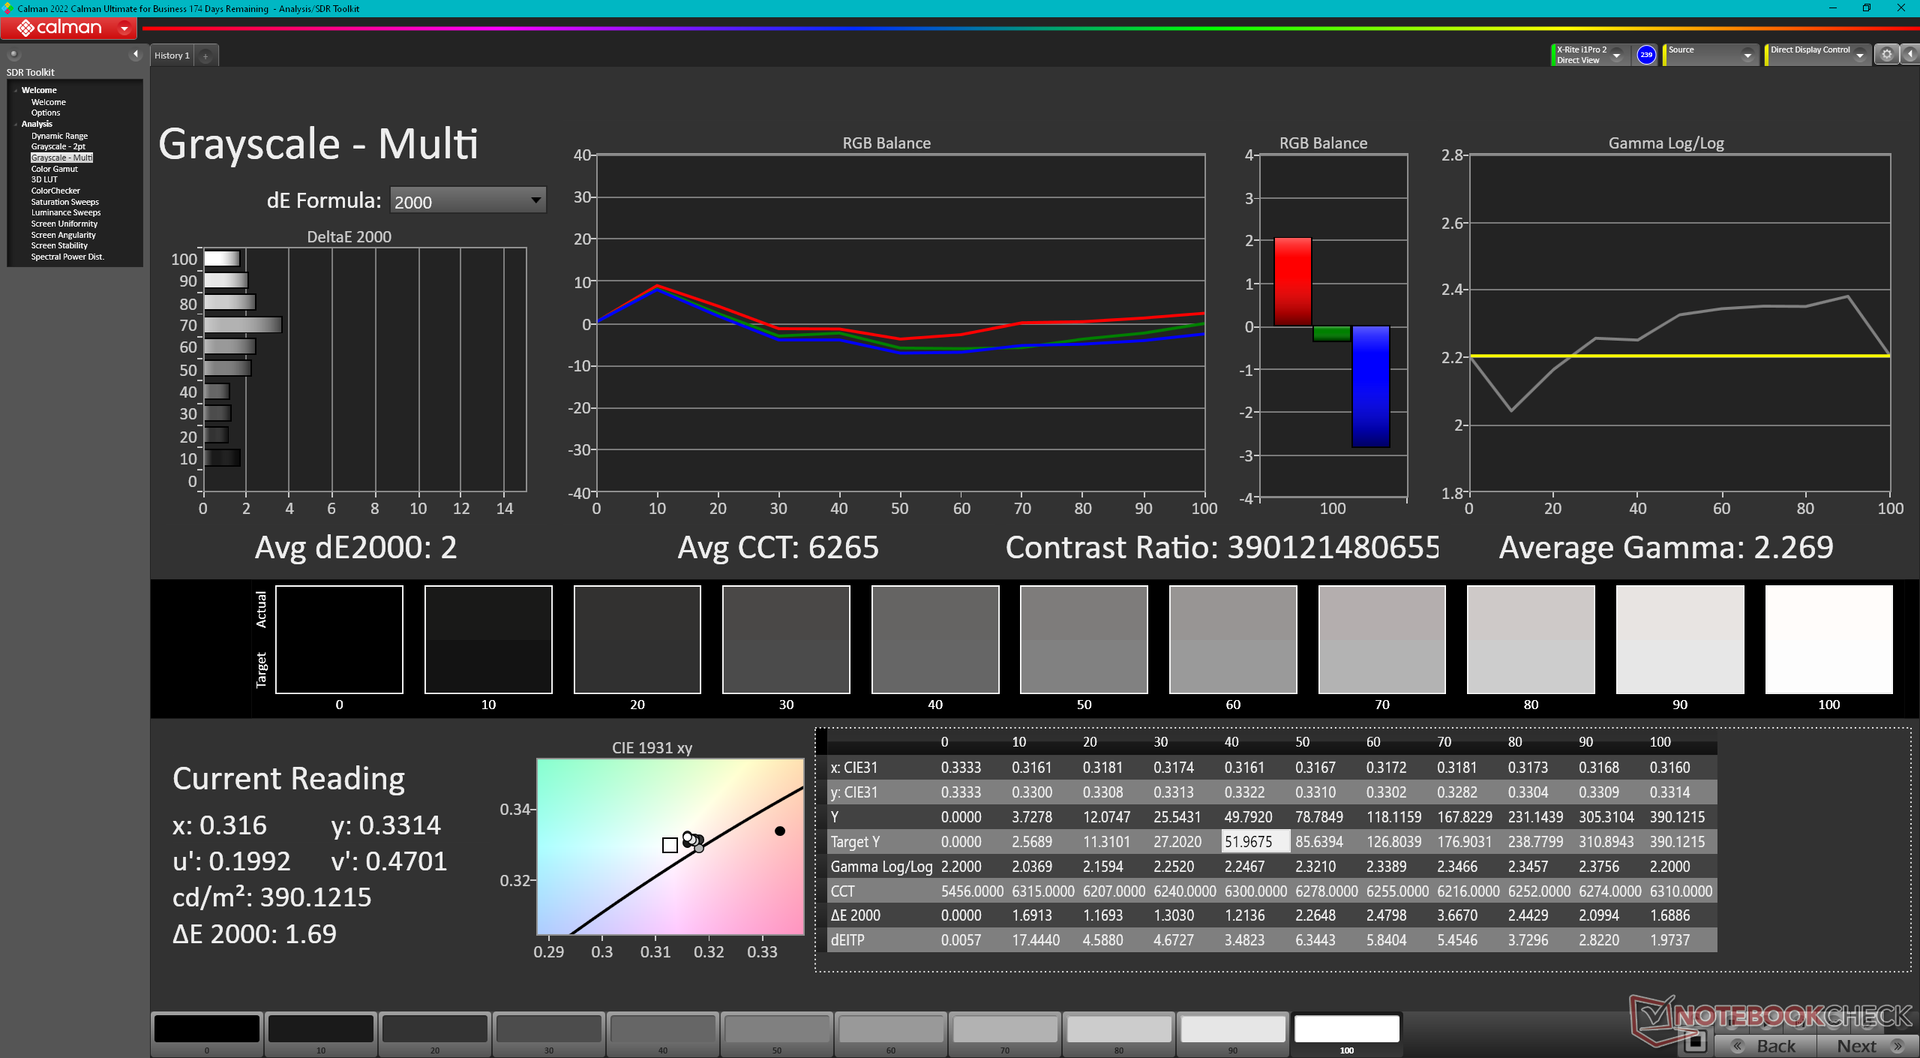
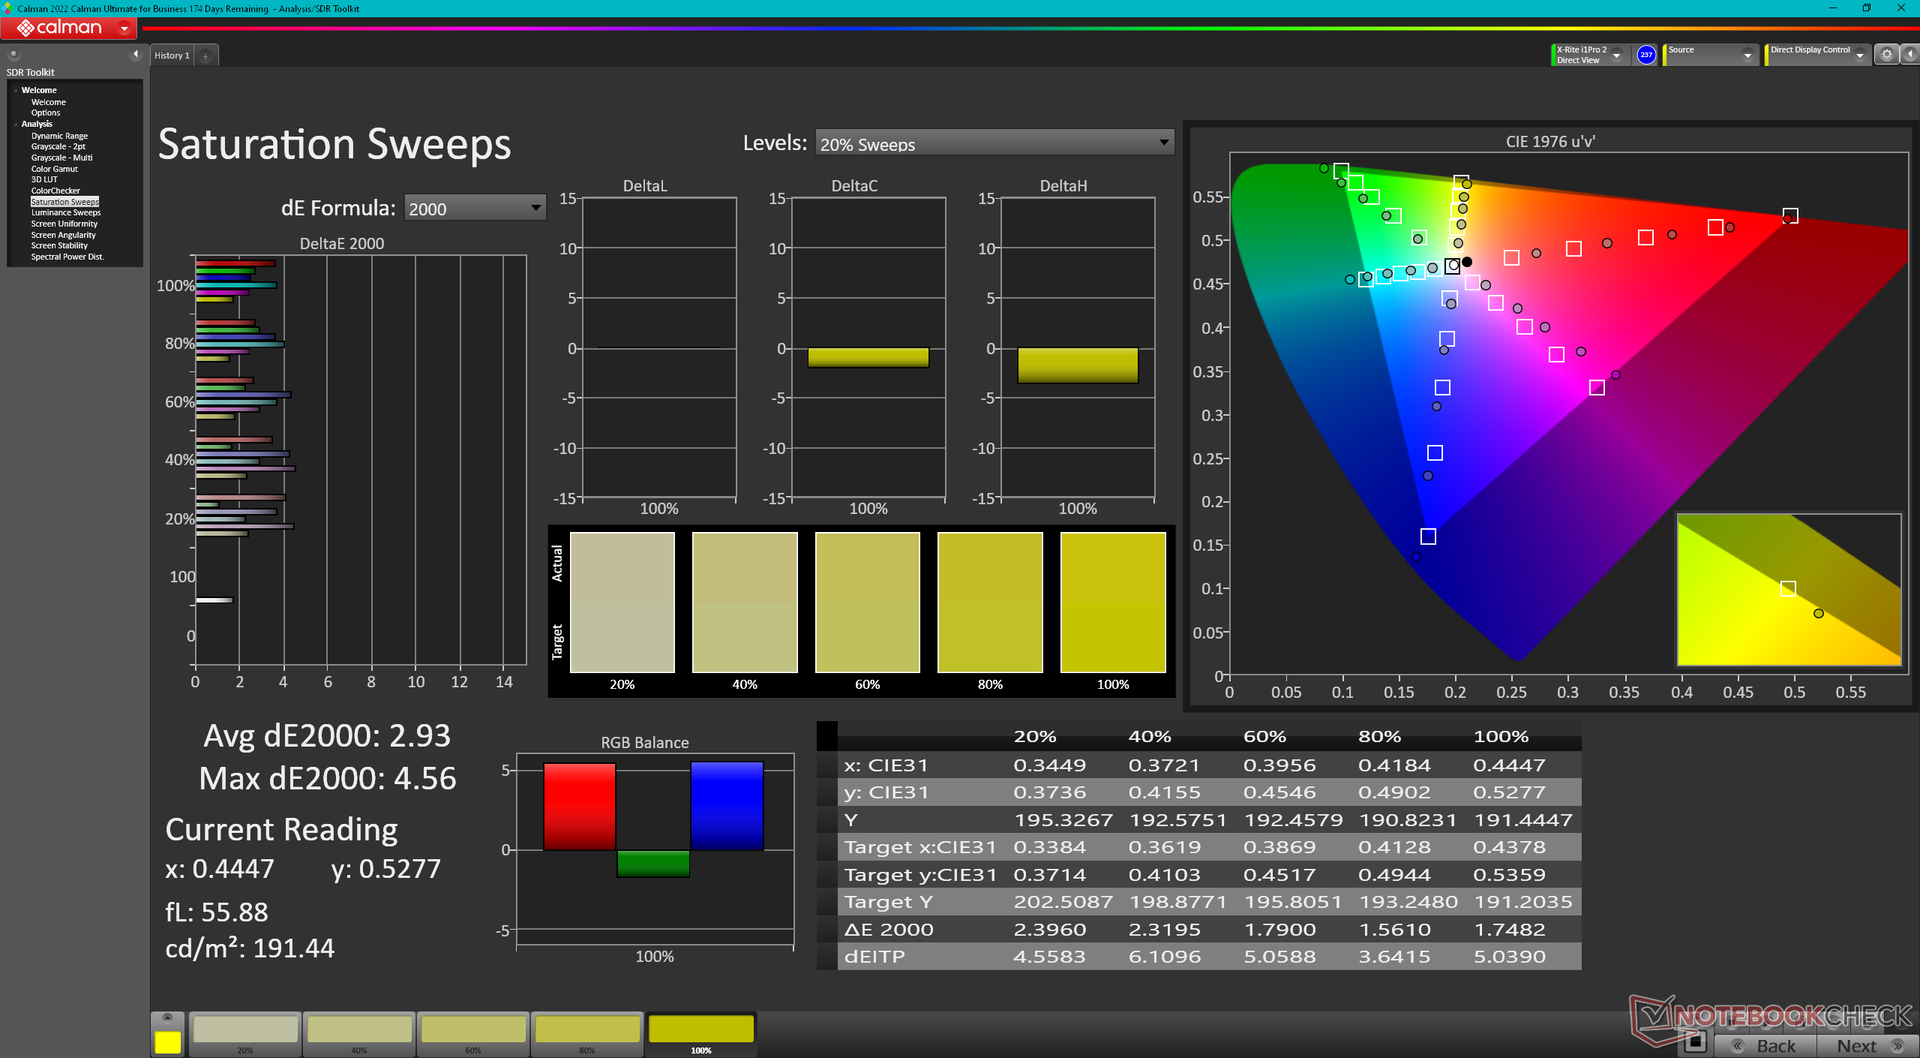
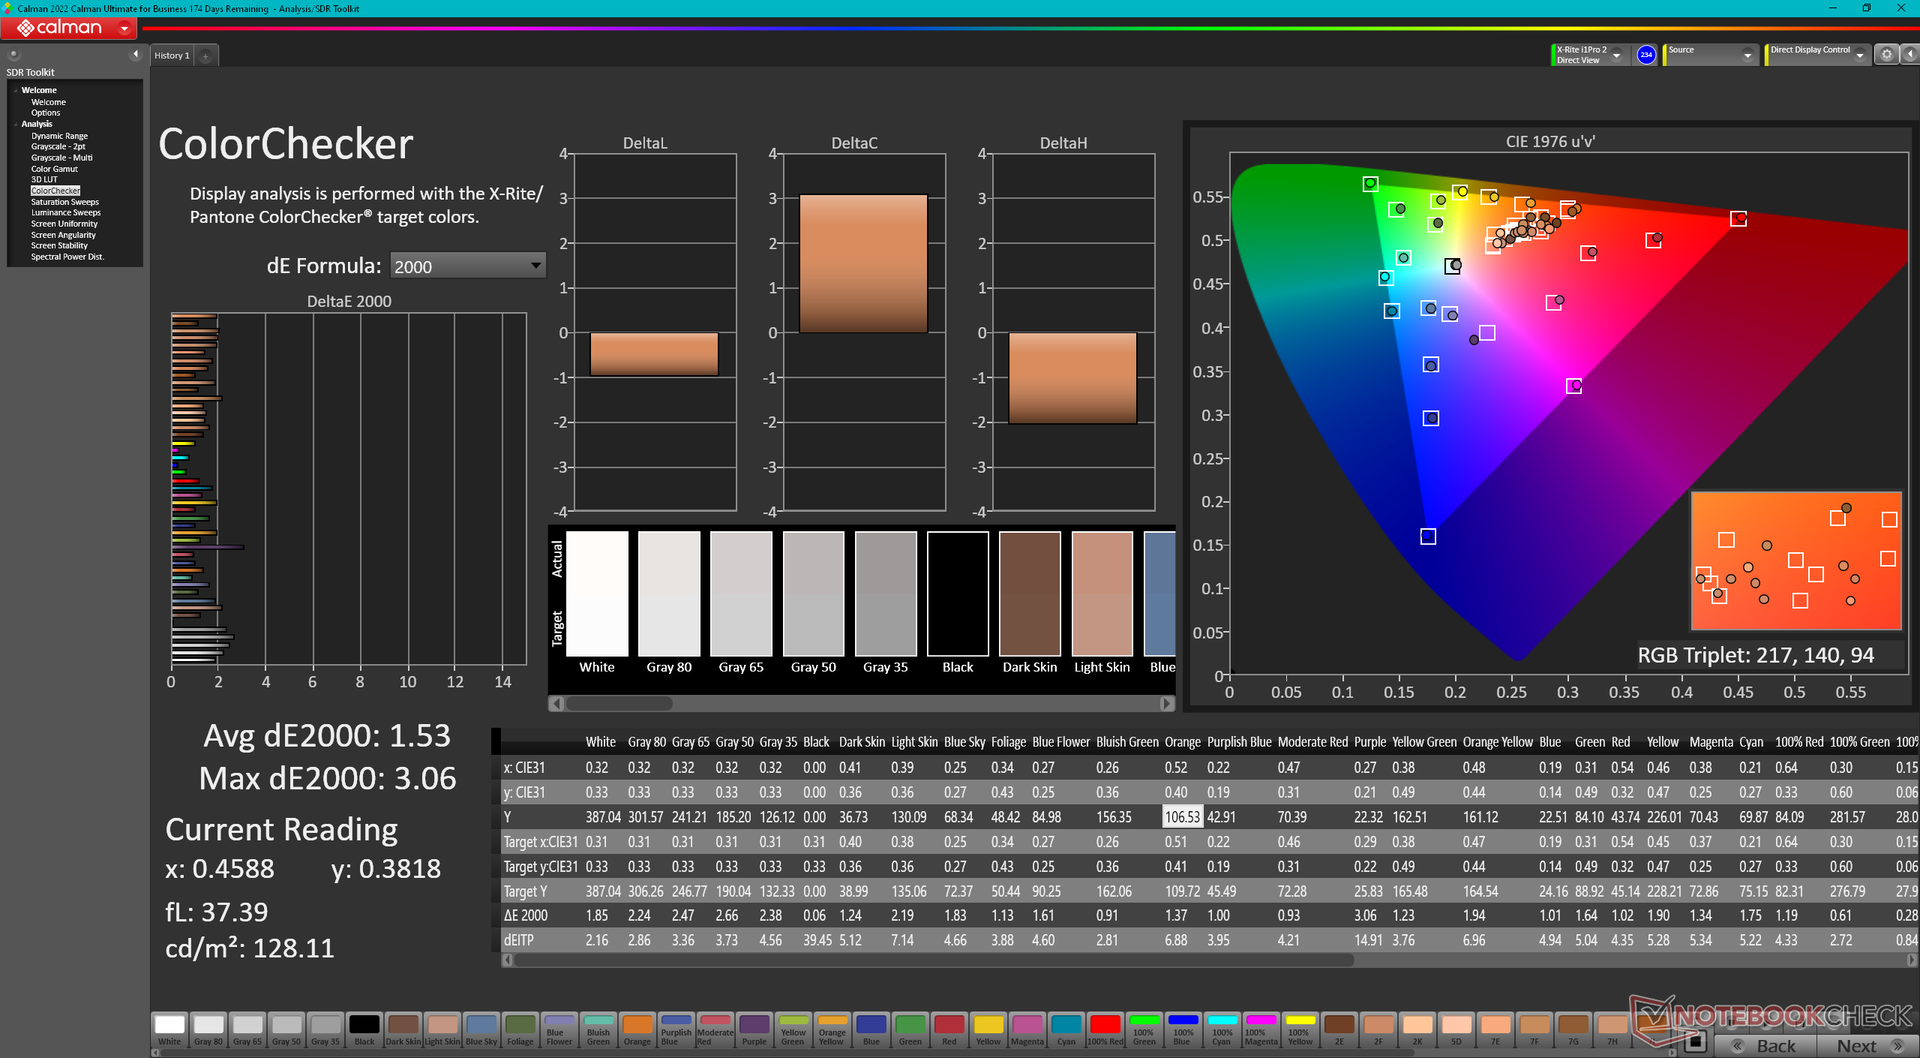
ΔE ColorChecker Calman: 4.95 | ∀{0.5-29.43 Ø4.71}
calibrated: 1.53
ΔE Greyscale Calman: 2 | ∀{0.09-98 Ø4.96}
98.4% AdobeRGB 1998 (Argyll 3D)
100% sRGB (Argyll 3D)
99.8% Display P3 (Argyll 3D)
Gamma: 2.27
CCT: 6265 K
| Dell XPS 15 9530 RTX 4070 Samsung 156XG01, OLED, 3456x2160, 15.6" | Dell XPS 15 9520 RTX 3050 Ti Samsung 156XG01, OLED, 3456x2160, 15.6" | Dell XPS 15 9500 Core i7 4K UHD Sharp LQ156R1, IPS, 3840x2400, 15.6" | Asus Zenbook Pro 15 OLED UM535Q Samsung ATNA56YX03-0, OLED, 1920x1080, 15.6" | MSI Prestige 15 A12UD-093 Sharp LQ156D1JW42, IPS, 3840x2160, 15.6" | Gigabyte Aero 15 OLED XD Samsung SDC4143, OLED, 3840x2160, 15.6" | |
|---|---|---|---|---|---|---|
| Display | -5% | -3% | -12% | -9% | 0% | |
| Display P3 Coverage (%) | 99.8 | 97.8 -2% | 89.7 -10% | 79.3 -21% | 80.48 -19% | 99.9 0% |
| sRGB Coverage (%) | 100 | 99.9 0% | 100 0% | 95.6 -4% | 96.95 -3% | 100 0% |
| AdobeRGB 1998 Coverage (%) | 98.4 | 86 -13% | 99.8 1% | 87.3 -11% | 94.02 -4% | 99.5 1% |
| Response Times | -6% | -2363% | -22% | -2088% | -35% | |
| Response Time Grey 50% / Grey 80% * (ms) | 1.68 ? | 1.9 ? -13% | 54 ? -3114% | 2.1 ? -25% | 51 ? -2936% | 2.8 ? -67% |
| Response Time Black / White * (ms) | 1.94 ? | 1.9 ? 2% | 33.2 ? -1611% | 2.3 ? -19% | 26 ? -1240% | 2 ? -3% |
| PWM Frequency (Hz) | 239 | 59.52 ? | 60.2 | 240 ? | ||
| Screen | -0% | -17% | 13% | 18% | 7% | |
| Brightness middle (cd/m²) | 389.5 | 381.4 -2% | 557.9 43% | 342.9 -12% | 441 13% | 440 13% |
| Brightness (cd/m²) | 392 | 384 -2% | 541 38% | 346 -12% | 416 6% | 446 14% |
| Brightness Distribution (%) | 98 | 95 -3% | 91 -7% | 98 0% | 85 -13% | 92 -6% |
| Black Level * (cd/m²) | 0.39 | 0.155 | 0.04 | |||
| Colorchecker dE 2000 * | 4.95 | 4.34 12% | 4.54 8% | 2.42 51% | 1.51 69% | 2.53 49% |
| Colorchecker dE 2000 max. * | 8.65 | 9.24 -7% | 7.92 8% | 4.05 53% | 3.56 59% | 7.82 10% |
| Colorchecker dE 2000 calibrated * | 1.53 | 3.82 -150% | 2.57 -68% | |||
| Greyscale dE 2000 * | 2 | 2 -0% | 3.2 -60% | 2.1 -5% | 2.49 -25% | 1.2 40% |
| Gamma | 2.27 97% | 2.13 103% | 1.99 111% | 2.21 100% | 2.17 101% | 2.206 100% |
| CCT | 6265 104% | 6210 105% | 6451 101% | 6364 102% | 6292 103% | 6371 102% |
| Contrast (:1) | 1431 | 2845 | 11000 | |||
| Color Space (Percent of AdobeRGB 1998) (%) | 89.5 | |||||
| Color Space (Percent of sRGB) (%) | 100 | |||||
| Totaal Gemiddelde (Programma / Instellingen) | -4% /
-3% | -794% /
-405% | -7% /
-0% | -693% /
-372% | -9% /
-1% |
* ... kleiner is beter
Het paneel is behoorlijk gekalibreerd uit de doos, maar gebruikers kunnen nog steeds ons gekalibreerde ICM profiel hierboven toepassen om de kleurnauwkeurigheid iets te verbeteren. Dell heeft eindelijk de verschillende kleurprofielen zoals sRGB, AdobeRGB, DCI-P3, en andere geïntegreerd in het Windows Display menu om gemakkelijker van profiel te kunnen wisselen.
Responstijd Scherm
| ↔ Responstijd Zwart naar Wit | ||
|---|---|---|
| 1.94 ms ... stijging ↗ en daling ↘ gecombineerd | ↗ 0.97 ms stijging | 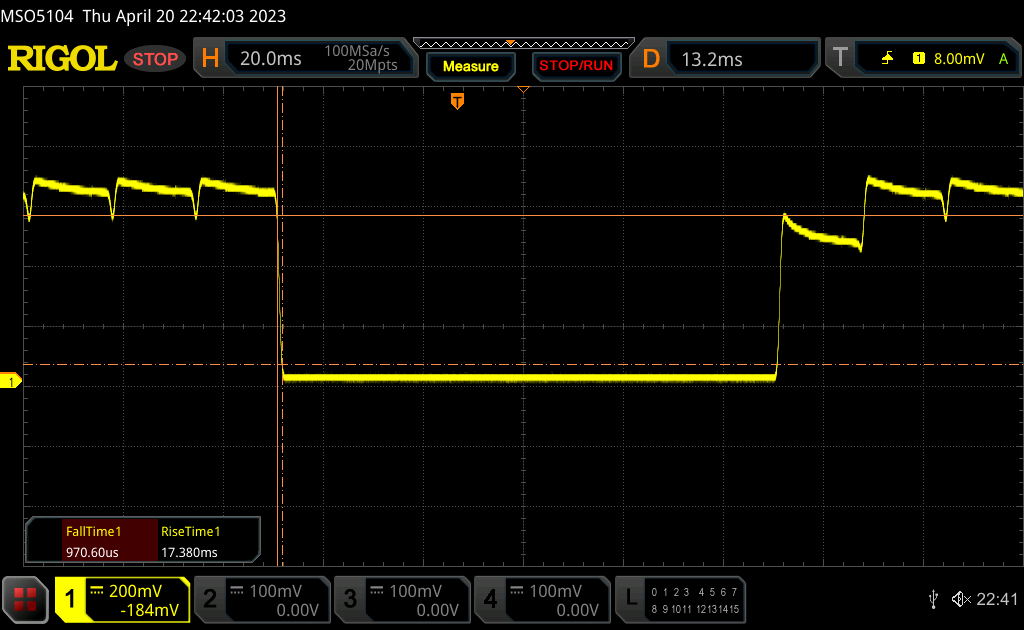 |
| ↘ 0.97 ms daling | ||
| Het scherm vertoonde erg snelle responstijden in onze tests en zou zeer geschikt moeten zijn voor snelle games. Ter vergelijking: alle testtoestellen variëren van 0.1 (minimum) tot 240 (maximum) ms. » 11 % van alle toestellen zijn beter. Dit betekent dat de gemeten responstijd beter is dan het gemiddelde (19.8 ms) van alle geteste toestellen. | ||
| ↔ Responstijd 50% Grijs naar 80% Grijs | ||
| 1.68 ms ... stijging ↗ en daling ↘ gecombineerd | ↗ 0.8 ms stijging | 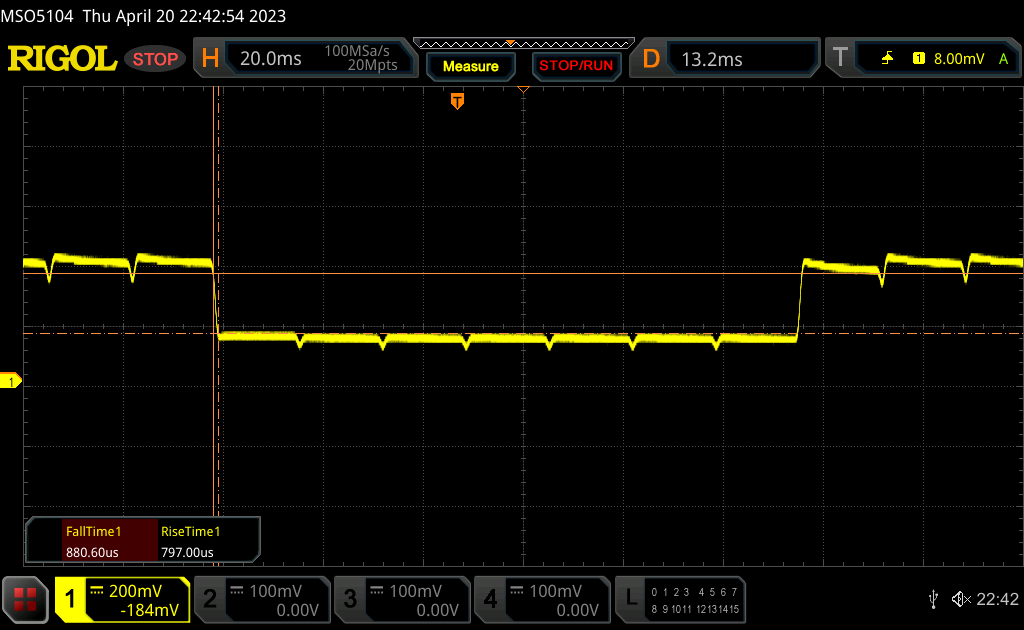 |
| ↘ 0.88 ms daling | ||
| Het scherm vertoonde erg snelle responstijden in onze tests en zou zeer geschikt moeten zijn voor snelle games. Ter vergelijking: alle testtoestellen variëren van 0.165 (minimum) tot 636 (maximum) ms. » 8 % van alle toestellen zijn beter. Dit betekent dat de gemeten responstijd beter is dan het gemiddelde (31 ms) van alle geteste toestellen. | ||
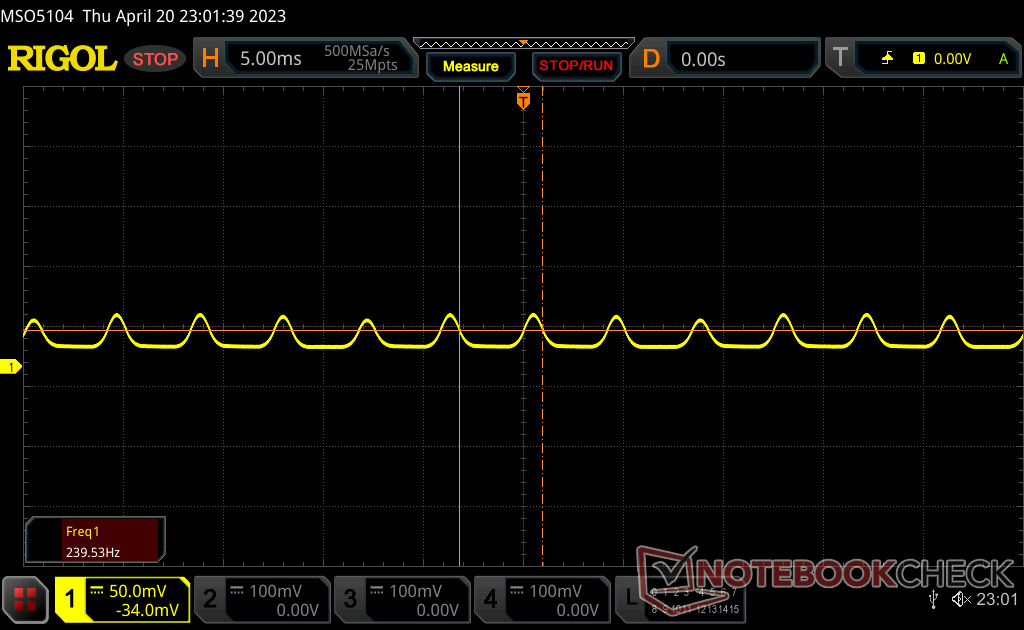
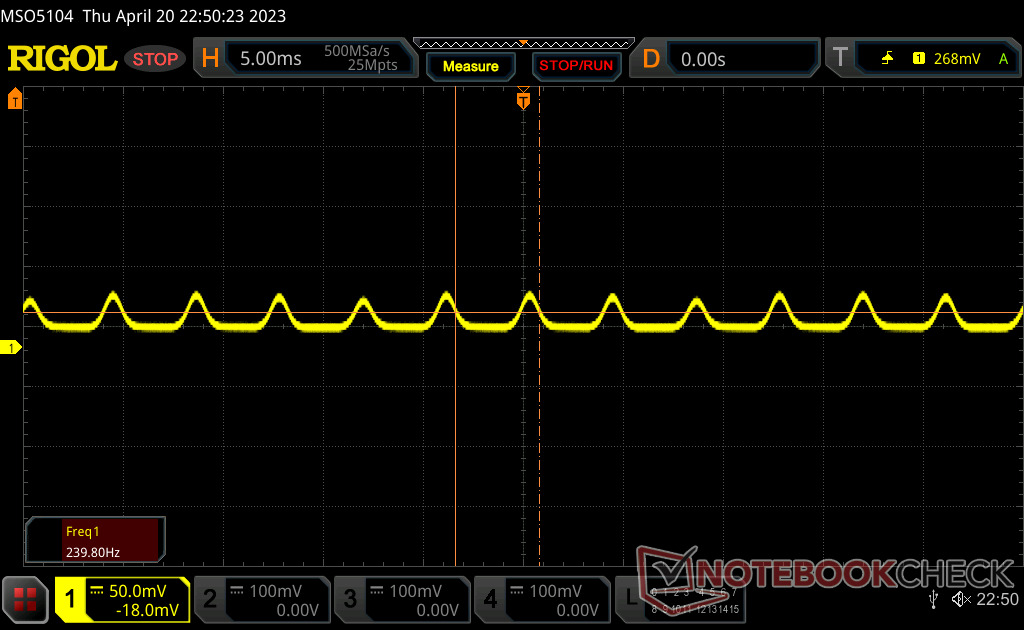
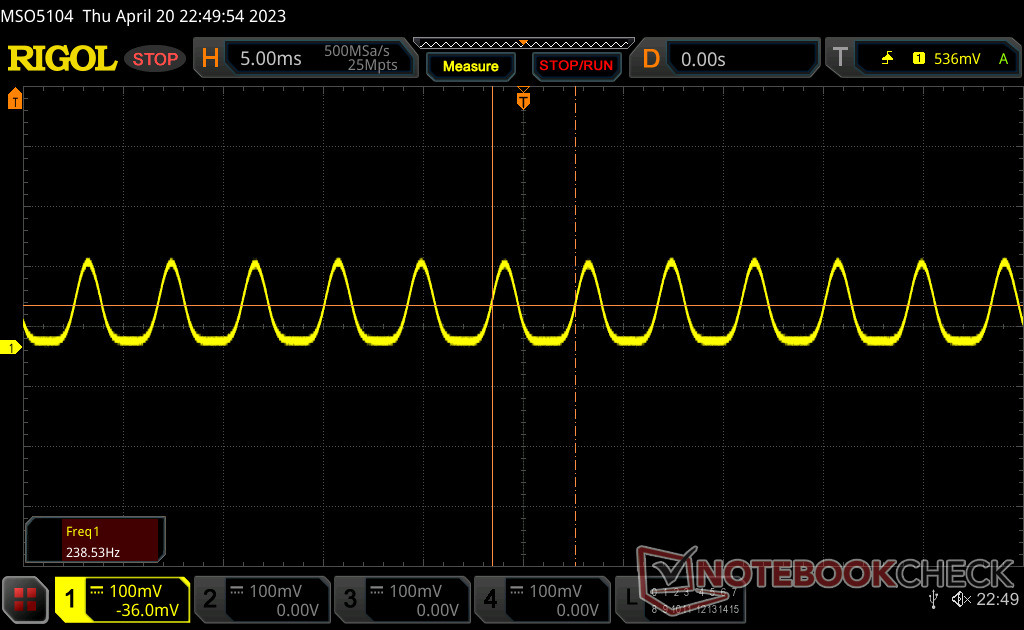
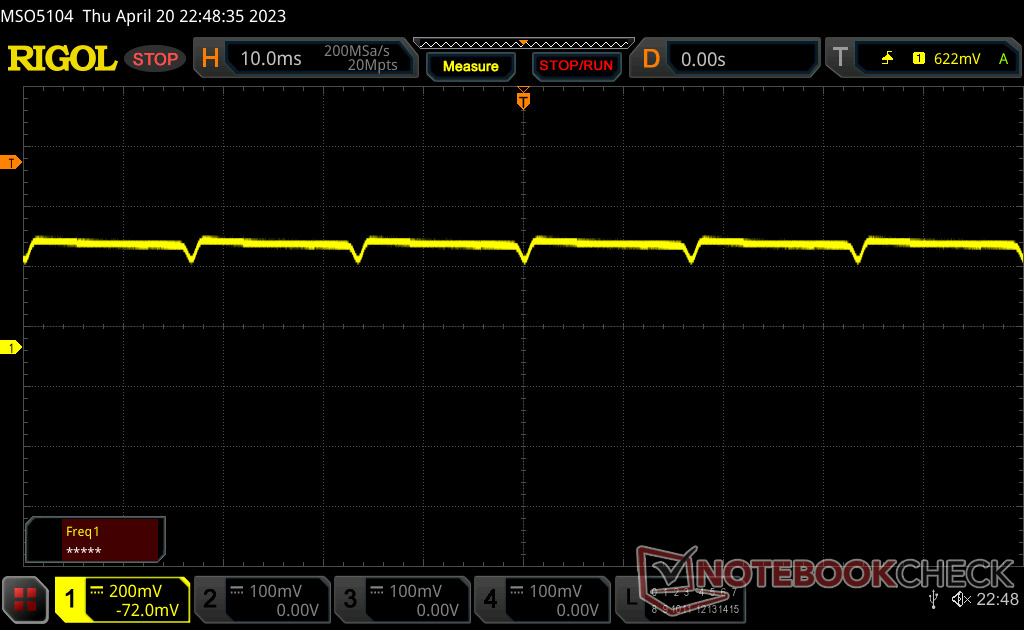
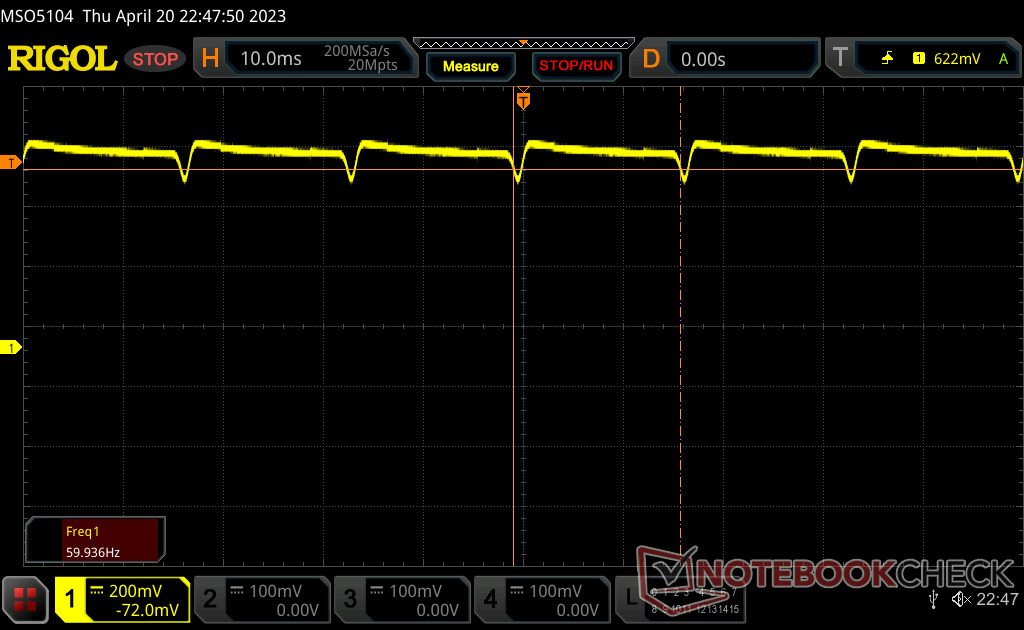
Screen Flickering / PWM (Pulse-Width Modulation)
| Screen flickering / PWM waargenomen | 239 Hz | 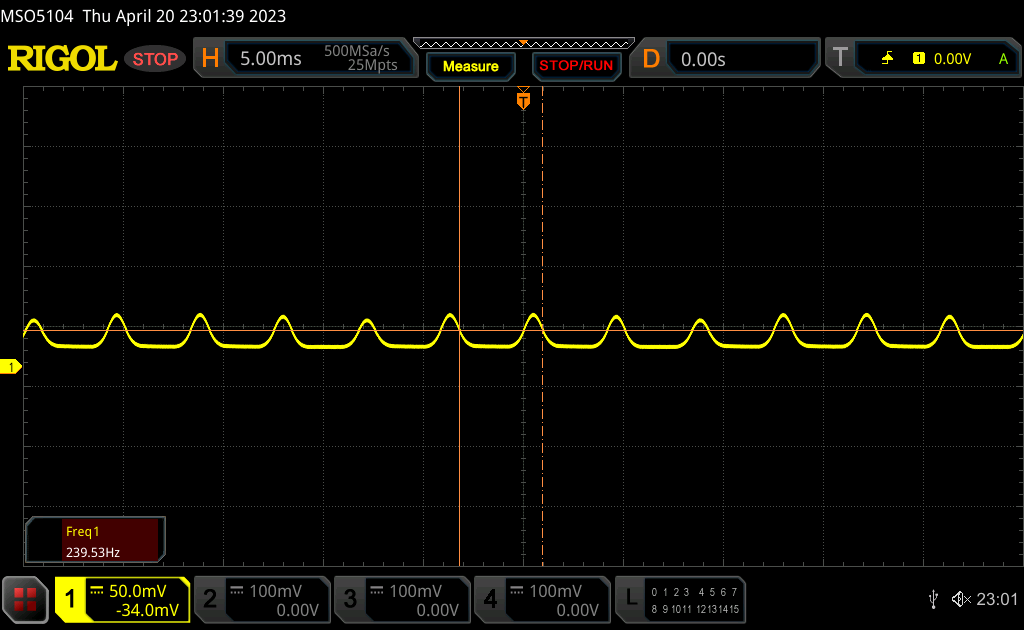 | |
De achtergrondverlichting van het scherm flikkert op 239 Hz (in het slechtste geval, bijvoorbeeld bij gebruik van PWM) . De frequentie van 239 Hz is redelijk laag en de meeste mensen die gevoelig zijn aan flickering kunnen dit dus waarnemen of geïrriteerde ogen krijgen (gebruikmakend van de vermelde helderheid en lager). Ter vergelijking: 52 % van alle geteste toestellen maakten geen gebruik van PWM om de schermhelderheid te verlagen. Als het wel werd gebruikt, werd een gemiddelde van 7757 (minimum: 5 - maximum: 343500) Hz waargenomen. | |||
Flikkering is aanwezig op alle helderheidsniveaus, net als bij de OLED-panelen op andere laptops. We registreren frequenties van 240 Hz van 0 tot 52 procent helderheid en 60 Hz van 53 procent tot 100 procent helderheid.

Prestaties - 13e generatie Intel + GeForce RTX 4070 Graphics
Testomstandigheden
We hebben ons toestel ingesteld op de modi Performance en dGPU voordat we de onderstaande benchmarks uitvoerden. Advanced Optimus of MUX wordt niet ondersteund.
Processor
De CPU prestaties zijn wisselend door het beperkte Turbo Boost potentieel van het systeem. Bijvoorbeeld, onze Core i7-13700H CineBench R15 xT score zou 19 procent hoger zijn dan de i7-12700H in de XPS 15 9520 van vorig jaar. Na verschillende benchmark loops zou het prestatieverschil echter kleiner worden en veel dichter in de buurt komen van de processor van vorig jaar. De kleinere MSI Stealth 14 Studio, die gebruik maakt van dezelfde Core i7-13700H CPU als onze XPS 15 9530, zou vergelijkbaar throttling gedrag vertonen.
Opwaarderen naar de Core i9-13900H configuratie zal naar verwachting de prestaties met 15 tot 25 procent verbeteren. De voordelen zouden echter kleiner kunnen zijn, aangezien Core i9 CPU's de neiging hebben om harder te kloppen op dunne multimedia laptops zoals de XPS 15.
Cinebench R15 Multi Loop
Cinebench R23: Multi Core | Single Core
Cinebench R20: CPU (Multi Core) | CPU (Single Core)
Cinebench R15: CPU Multi 64Bit | CPU Single 64Bit
Blender: v2.79 BMW27 CPU
7-Zip 18.03: 7z b 4 | 7z b 4 -mmt1
Geekbench 5.5: Multi-Core | Single-Core
HWBOT x265 Benchmark v2.2: 4k Preset
LibreOffice : 20 Documents To PDF
R Benchmark 2.5: Overall mean
| CPU Performance rating | |
| Asus Zephyrus Duo 16 GX650PY-NM006W | |
| Uniwill GM6PX7X RTX 4070 | |
| Asus ROG Zephyrus M16 GU604VY-NM042X | |
| Alienware x15 R2 P111F | |
| Dell XPS 15 9530 RTX 4070 | |
| Gemiddeld Intel Core i7-13700H | |
| Dell XPS 15 9520 RTX 3050 Ti | |
| MSI Prestige 15 A12UD-093 -1! | |
| Asus ROG Strix G15 G513RW | |
| Asus Zenbook Pro 15 OLED UM535Q | |
| Gigabyte Aero 15 OLED XD | |
| Dell XPS 15 9500 Core i7 4K UHD -2! | |
| Cinebench R23 / Multi Core | |
| Asus Zephyrus Duo 16 GX650PY-NM006W | |
| Uniwill GM6PX7X RTX 4070 | |
| Asus ROG Zephyrus M16 GU604VY-NM042X | |
| Alienware x15 R2 P111F | |
| Dell XPS 15 9530 RTX 4070 | |
| Gemiddeld Intel Core i7-13700H (5890 - 20034, n=29) | |
| Dell XPS 15 9520 RTX 3050 Ti | |
| Asus ROG Strix G15 G513RW | |
| Asus Zenbook Pro 15 OLED UM535Q | |
| MSI Prestige 15 A12UD-093 | |
| Gigabyte Aero 15 OLED XD | |
| Cinebench R23 / Single Core | |
| Asus ROG Zephyrus M16 GU604VY-NM042X | |
| Asus Zephyrus Duo 16 GX650PY-NM006W | |
| Alienware x15 R2 P111F | |
| Dell XPS 15 9530 RTX 4070 | |
| Uniwill GM6PX7X RTX 4070 | |
| Gemiddeld Intel Core i7-13700H (1323 - 1914, n=29) | |
| Dell XPS 15 9520 RTX 3050 Ti | |
| MSI Prestige 15 A12UD-093 | |
| Asus ROG Strix G15 G513RW | |
| Asus Zenbook Pro 15 OLED UM535Q | |
| Gigabyte Aero 15 OLED XD | |
| Cinebench R20 / CPU (Multi Core) | |
| Asus Zephyrus Duo 16 GX650PY-NM006W | |
| Uniwill GM6PX7X RTX 4070 | |
| Asus ROG Zephyrus M16 GU604VY-NM042X | |
| Alienware x15 R2 P111F | |
| Dell XPS 15 9530 RTX 4070 | |
| Gemiddeld Intel Core i7-13700H (2322 - 7674, n=29) | |
| Dell XPS 15 9520 RTX 3050 Ti | |
| Asus ROG Strix G15 G513RW | |
| Asus Zenbook Pro 15 OLED UM535Q | |
| MSI Prestige 15 A12UD-093 | |
| Gigabyte Aero 15 OLED XD | |
| Dell XPS 15 9500 Core i7 4K UHD | |
| Cinebench R20 / CPU (Single Core) | |
| Asus Zephyrus Duo 16 GX650PY-NM006W | |
| Asus ROG Zephyrus M16 GU604VY-NM042X | |
| Alienware x15 R2 P111F | |
| Uniwill GM6PX7X RTX 4070 | |
| Dell XPS 15 9530 RTX 4070 | |
| Gemiddeld Intel Core i7-13700H (508 - 741, n=29) | |
| Dell XPS 15 9520 RTX 3050 Ti | |
| MSI Prestige 15 A12UD-093 | |
| Asus ROG Strix G15 G513RW | |
| Asus Zenbook Pro 15 OLED UM535Q | |
| Gigabyte Aero 15 OLED XD | |
| Dell XPS 15 9500 Core i7 4K UHD | |
| Cinebench R15 / CPU Multi 64Bit | |
| Asus Zephyrus Duo 16 GX650PY-NM006W | |
| Uniwill GM6PX7X RTX 4070 | |
| Asus ROG Zephyrus M16 GU604VY-NM042X | |
| Alienware x15 R2 P111F | |
| Dell XPS 15 9530 RTX 4070 | |
| Gemiddeld Intel Core i7-13700H (905 - 2982, n=29) | |
| MSI Prestige 15 A12UD-093 | |
| Dell XPS 15 9520 RTX 3050 Ti | |
| Asus ROG Strix G15 G513RW | |
| Asus Zenbook Pro 15 OLED UM535Q | |
| Gigabyte Aero 15 OLED XD | |
| Dell XPS 15 9500 Core i7 4K UHD | |
| Cinebench R15 / CPU Single 64Bit | |
| Asus Zephyrus Duo 16 GX650PY-NM006W | |
| Asus ROG Zephyrus M16 GU604VY-NM042X | |
| Alienware x15 R2 P111F | |
| Dell XPS 15 9530 RTX 4070 | |
| Uniwill GM6PX7X RTX 4070 | |
| Gemiddeld Intel Core i7-13700H (213 - 278, n=29) | |
| Dell XPS 15 9520 RTX 3050 Ti | |
| Asus ROG Strix G15 G513RW | |
| Asus Zenbook Pro 15 OLED UM535Q | |
| Dell XPS 15 9500 Core i7 4K UHD | |
| Gigabyte Aero 15 OLED XD | |
| MSI Prestige 15 A12UD-093 | |
| Blender / v2.79 BMW27 CPU | |
| Dell XPS 15 9500 Core i7 4K UHD | |
| Gigabyte Aero 15 OLED XD | |
| MSI Prestige 15 A12UD-093 | |
| Asus Zenbook Pro 15 OLED UM535Q | |
| Asus ROG Strix G15 G513RW | |
| Gemiddeld Intel Core i7-13700H (169 - 555, n=29) | |
| Dell XPS 15 9520 RTX 3050 Ti | |
| Dell XPS 15 9530 RTX 4070 | |
| Alienware x15 R2 P111F | |
| Asus ROG Zephyrus M16 GU604VY-NM042X | |
| Uniwill GM6PX7X RTX 4070 | |
| Asus Zephyrus Duo 16 GX650PY-NM006W | |
| 7-Zip 18.03 / 7z b 4 | |
| Asus Zephyrus Duo 16 GX650PY-NM006W | |
| Uniwill GM6PX7X RTX 4070 | |
| Asus ROG Zephyrus M16 GU604VY-NM042X | |
| Alienware x15 R2 P111F | |
| Dell XPS 15 9520 RTX 3050 Ti | |
| Gemiddeld Intel Core i7-13700H (27322 - 76344, n=29) | |
| Dell XPS 15 9530 RTX 4070 | |
| Asus ROG Strix G15 G513RW | |
| Asus Zenbook Pro 15 OLED UM535Q | |
| MSI Prestige 15 A12UD-093 | |
| Gigabyte Aero 15 OLED XD | |
| Dell XPS 15 9500 Core i7 4K UHD | |
| 7-Zip 18.03 / 7z b 4 -mmt1 | |
| Asus Zephyrus Duo 16 GX650PY-NM006W | |
| Asus ROG Zephyrus M16 GU604VY-NM042X | |
| Dell XPS 15 9530 RTX 4070 | |
| Uniwill GM6PX7X RTX 4070 | |
| Gemiddeld Intel Core i7-13700H (4825 - 6238, n=29) | |
| Alienware x15 R2 P111F | |
| Asus ROG Strix G15 G513RW | |
| Dell XPS 15 9520 RTX 3050 Ti | |
| Asus Zenbook Pro 15 OLED UM535Q | |
| MSI Prestige 15 A12UD-093 | |
| Gigabyte Aero 15 OLED XD | |
| Dell XPS 15 9500 Core i7 4K UHD | |
| Geekbench 5.5 / Multi-Core | |
| Asus Zephyrus Duo 16 GX650PY-NM006W | |
| Uniwill GM6PX7X RTX 4070 | |
| Asus ROG Zephyrus M16 GU604VY-NM042X | |
| Alienware x15 R2 P111F | |
| Dell XPS 15 9530 RTX 4070 | |
| Dell XPS 15 9520 RTX 3050 Ti | |
| MSI Prestige 15 A12UD-093 | |
| Gemiddeld Intel Core i7-13700H (6165 - 14215, n=29) | |
| Asus ROG Strix G15 G513RW | |
| Gigabyte Aero 15 OLED XD | |
| Asus Zenbook Pro 15 OLED UM535Q | |
| Dell XPS 15 9500 Core i7 4K UHD | |
| Geekbench 5.5 / Single-Core | |
| Asus Zephyrus Duo 16 GX650PY-NM006W | |
| Asus ROG Zephyrus M16 GU604VY-NM042X | |
| Dell XPS 15 9530 RTX 4070 | |
| Alienware x15 R2 P111F | |
| Uniwill GM6PX7X RTX 4070 | |
| Gemiddeld Intel Core i7-13700H (1362 - 1919, n=29) | |
| Dell XPS 15 9520 RTX 3050 Ti | |
| Asus ROG Strix G15 G513RW | |
| MSI Prestige 15 A12UD-093 | |
| Asus Zenbook Pro 15 OLED UM535Q | |
| Gigabyte Aero 15 OLED XD | |
| Dell XPS 15 9500 Core i7 4K UHD | |
| HWBOT x265 Benchmark v2.2 / 4k Preset | |
| Asus Zephyrus Duo 16 GX650PY-NM006W | |
| Uniwill GM6PX7X RTX 4070 | |
| Asus ROG Zephyrus M16 GU604VY-NM042X | |
| Alienware x15 R2 P111F | |
| Dell XPS 15 9530 RTX 4070 | |
| Gemiddeld Intel Core i7-13700H (6.72 - 21.2, n=29) | |
| Asus ROG Strix G15 G513RW | |
| Asus Zenbook Pro 15 OLED UM535Q | |
| Dell XPS 15 9520 RTX 3050 Ti | |
| Gigabyte Aero 15 OLED XD | |
| Dell XPS 15 9500 Core i7 4K UHD | |
| LibreOffice / 20 Documents To PDF | |
| Asus ROG Strix G15 G513RW | |
| MSI Prestige 15 A12UD-093 | |
| MSI Prestige 15 A12UD-093 | |
| Asus Zephyrus Duo 16 GX650PY-NM006W | |
| Dell XPS 15 9500 Core i7 4K UHD | |
| Asus ROG Zephyrus M16 GU604VY-NM042X | |
| Asus Zenbook Pro 15 OLED UM535Q | |
| Gemiddeld Intel Core i7-13700H (31.3 - 62.4, n=29) | |
| Gigabyte Aero 15 OLED XD | |
| Alienware x15 R2 P111F | |
| Dell XPS 15 9530 RTX 4070 | |
| Dell XPS 15 9520 RTX 3050 Ti | |
| Uniwill GM6PX7X RTX 4070 | |
| R Benchmark 2.5 / Overall mean | |
| Gigabyte Aero 15 OLED XD | |
| Dell XPS 15 9500 Core i7 4K UHD | |
| Asus Zenbook Pro 15 OLED UM535Q | |
| Asus ROG Strix G15 G513RW | |
| Gemiddeld Intel Core i7-13700H (0.4308 - 0.607, n=29) | |
| Uniwill GM6PX7X RTX 4070 | |
| Dell XPS 15 9520 RTX 3050 Ti | |
| MSI Prestige 15 A12UD-093 | |
| Dell XPS 15 9530 RTX 4070 | |
| Alienware x15 R2 P111F | |
| Asus ROG Zephyrus M16 GU604VY-NM042X | |
| Asus Zephyrus Duo 16 GX650PY-NM006W | |
* ... kleiner is beter
AIDA64: FP32 Ray-Trace | FPU Julia | CPU SHA3 | CPU Queen | FPU SinJulia | FPU Mandel | CPU AES | CPU ZLib | FP64 Ray-Trace | CPU PhotoWorxx
| Performance rating | |
| Asus Zenbook Pro 15 OLED UM535Q | |
| Dell XPS 15 9530 RTX 4070 | |
| Gemiddeld Intel Core i7-13700H | |
| MSI Prestige 15 A12UD-093 | |
| Dell XPS 15 9520 RTX 3050 Ti | |
| Dell XPS 15 9500 Core i7 4K UHD | |
| Gigabyte Aero 15 OLED XD -9! | |
| AIDA64 / FP32 Ray-Trace | |
| Asus Zenbook Pro 15 OLED UM535Q | |
| Dell XPS 15 9530 RTX 4070 | |
| Gemiddeld Intel Core i7-13700H (4986 - 18908, n=29) | |
| MSI Prestige 15 A12UD-093 | |
| Dell XPS 15 9500 Core i7 4K UHD | |
| Dell XPS 15 9520 RTX 3050 Ti | |
| AIDA64 / FPU Julia | |
| Asus Zenbook Pro 15 OLED UM535Q | |
| Gemiddeld Intel Core i7-13700H (25360 - 92359, n=29) | |
| Dell XPS 15 9530 RTX 4070 | |
| Dell XPS 15 9500 Core i7 4K UHD | |
| MSI Prestige 15 A12UD-093 | |
| Dell XPS 15 9520 RTX 3050 Ti | |
| AIDA64 / CPU SHA3 | |
| Asus Zenbook Pro 15 OLED UM535Q | |
| Gemiddeld Intel Core i7-13700H (1339 - 4224, n=29) | |
| Dell XPS 15 9530 RTX 4070 | |
| Dell XPS 15 9500 Core i7 4K UHD | |
| Dell XPS 15 9520 RTX 3050 Ti | |
| MSI Prestige 15 A12UD-093 | |
| AIDA64 / CPU Queen | |
| Dell XPS 15 9530 RTX 4070 | |
| Asus Zenbook Pro 15 OLED UM535Q | |
| Dell XPS 15 9520 RTX 3050 Ti | |
| Gemiddeld Intel Core i7-13700H (59324 - 107159, n=29) | |
| Dell XPS 15 9500 Core i7 4K UHD | |
| MSI Prestige 15 A12UD-093 | |
| AIDA64 / FPU SinJulia | |
| Asus Zenbook Pro 15 OLED UM535Q | |
| Dell XPS 15 9500 Core i7 4K UHD | |
| Gemiddeld Intel Core i7-13700H (4800 - 11050, n=29) | |
| Dell XPS 15 9530 RTX 4070 | |
| Dell XPS 15 9520 RTX 3050 Ti | |
| MSI Prestige 15 A12UD-093 | |
| AIDA64 / FPU Mandel | |
| Asus Zenbook Pro 15 OLED UM535Q | |
| Gemiddeld Intel Core i7-13700H (12321 - 45118, n=29) | |
| Dell XPS 15 9530 RTX 4070 | |
| Dell XPS 15 9500 Core i7 4K UHD | |
| MSI Prestige 15 A12UD-093 | |
| Dell XPS 15 9520 RTX 3050 Ti | |
| AIDA64 / CPU AES | |
| Asus Zenbook Pro 15 OLED UM535Q | |
| MSI Prestige 15 A12UD-093 | |
| Dell XPS 15 9520 RTX 3050 Ti | |
| Gemiddeld Intel Core i7-13700H (28769 - 151254, n=29) | |
| Dell XPS 15 9530 RTX 4070 | |
| Dell XPS 15 9500 Core i7 4K UHD | |
| AIDA64 / CPU ZLib | |
| Gemiddeld Intel Core i7-13700H (389 - 1215, n=29) | |
| Dell XPS 15 9530 RTX 4070 | |
| Dell XPS 15 9520 RTX 3050 Ti | |
| Asus Zenbook Pro 15 OLED UM535Q | |
| MSI Prestige 15 A12UD-093 | |
| Dell XPS 15 9500 Core i7 4K UHD | |
| Gigabyte Aero 15 OLED XD | |
| AIDA64 / FP64 Ray-Trace | |
| Asus Zenbook Pro 15 OLED UM535Q | |
| Dell XPS 15 9530 RTX 4070 | |
| Gemiddeld Intel Core i7-13700H (2540 - 10135, n=29) | |
| MSI Prestige 15 A12UD-093 | |
| Dell XPS 15 9520 RTX 3050 Ti | |
| Dell XPS 15 9500 Core i7 4K UHD | |
| AIDA64 / CPU PhotoWorxx | |
| Dell XPS 15 9530 RTX 4070 | |
| MSI Prestige 15 A12UD-093 | |
| Gemiddeld Intel Core i7-13700H (12872 - 52727, n=29) | |
| Dell XPS 15 9520 RTX 3050 Ti | |
| Dell XPS 15 9500 Core i7 4K UHD | |
| Asus Zenbook Pro 15 OLED UM535Q | |
Systeemprestaties
CrossMark: Overall | Productivity | Creativity | Responsiveness
| PCMark 10 / Score | |
| Gemiddeld Intel Core i7-13700H, NVIDIA GeForce RTX 4070 Laptop GPU (7158 - 7956, n=8) | |
| Dell XPS 15 9530 RTX 4070 | |
| Dell XPS 15 9520 RTX 3050 Ti | |
| Gigabyte Aero 15 OLED XD | |
| Asus Zenbook Pro 15 OLED UM535Q | |
| MSI Prestige 15 A12UD-093 | |
| Dell XPS 15 9500 Core i7 4K UHD | |
| PCMark 10 / Essentials | |
| Dell XPS 15 9530 RTX 4070 | |
| Dell XPS 15 9520 RTX 3050 Ti | |
| Gemiddeld Intel Core i7-13700H, NVIDIA GeForce RTX 4070 Laptop GPU (10252 - 11449, n=8) | |
| Asus Zenbook Pro 15 OLED UM535Q | |
| MSI Prestige 15 A12UD-093 | |
| Gigabyte Aero 15 OLED XD | |
| Dell XPS 15 9500 Core i7 4K UHD | |
| PCMark 10 / Productivity | |
| Gigabyte Aero 15 OLED XD | |
| Asus Zenbook Pro 15 OLED UM535Q | |
| Dell XPS 15 9520 RTX 3050 Ti | |
| Gemiddeld Intel Core i7-13700H, NVIDIA GeForce RTX 4070 Laptop GPU (8501 - 10769, n=8) | |
| MSI Prestige 15 A12UD-093 | |
| Dell XPS 15 9530 RTX 4070 | |
| Dell XPS 15 9500 Core i7 4K UHD | |
| PCMark 10 / Digital Content Creation | |
| Gemiddeld Intel Core i7-13700H, NVIDIA GeForce RTX 4070 Laptop GPU (10358 - 12908, n=8) | |
| Dell XPS 15 9530 RTX 4070 | |
| Gigabyte Aero 15 OLED XD | |
| Dell XPS 15 9520 RTX 3050 Ti | |
| Asus Zenbook Pro 15 OLED UM535Q | |
| MSI Prestige 15 A12UD-093 | |
| Dell XPS 15 9500 Core i7 4K UHD | |
| CrossMark / Overall | |
| Dell XPS 15 9530 RTX 4070 | |
| Gemiddeld Intel Core i7-13700H, NVIDIA GeForce RTX 4070 Laptop GPU (1768 - 2073, n=6) | |
| Dell XPS 15 9520 RTX 3050 Ti | |
| MSI Prestige 15 A12UD-093 | |
| Asus Zenbook Pro 15 OLED UM535Q | |
| CrossMark / Productivity | |
| Dell XPS 15 9520 RTX 3050 Ti | |
| Gemiddeld Intel Core i7-13700H, NVIDIA GeForce RTX 4070 Laptop GPU (1645 - 2006, n=6) | |
| Dell XPS 15 9530 RTX 4070 | |
| MSI Prestige 15 A12UD-093 | |
| Asus Zenbook Pro 15 OLED UM535Q | |
| CrossMark / Creativity | |
| Dell XPS 15 9530 RTX 4070 | |
| Gemiddeld Intel Core i7-13700H, NVIDIA GeForce RTX 4070 Laptop GPU (1936 - 2137, n=6) | |
| Dell XPS 15 9520 RTX 3050 Ti | |
| MSI Prestige 15 A12UD-093 | |
| Asus Zenbook Pro 15 OLED UM535Q | |
| CrossMark / Responsiveness | |
| Dell XPS 15 9520 RTX 3050 Ti | |
| Gemiddeld Intel Core i7-13700H, NVIDIA GeForce RTX 4070 Laptop GPU (1451 - 2202, n=6) | |
| Dell XPS 15 9530 RTX 4070 | |
| MSI Prestige 15 A12UD-093 | |
| Asus Zenbook Pro 15 OLED UM535Q | |
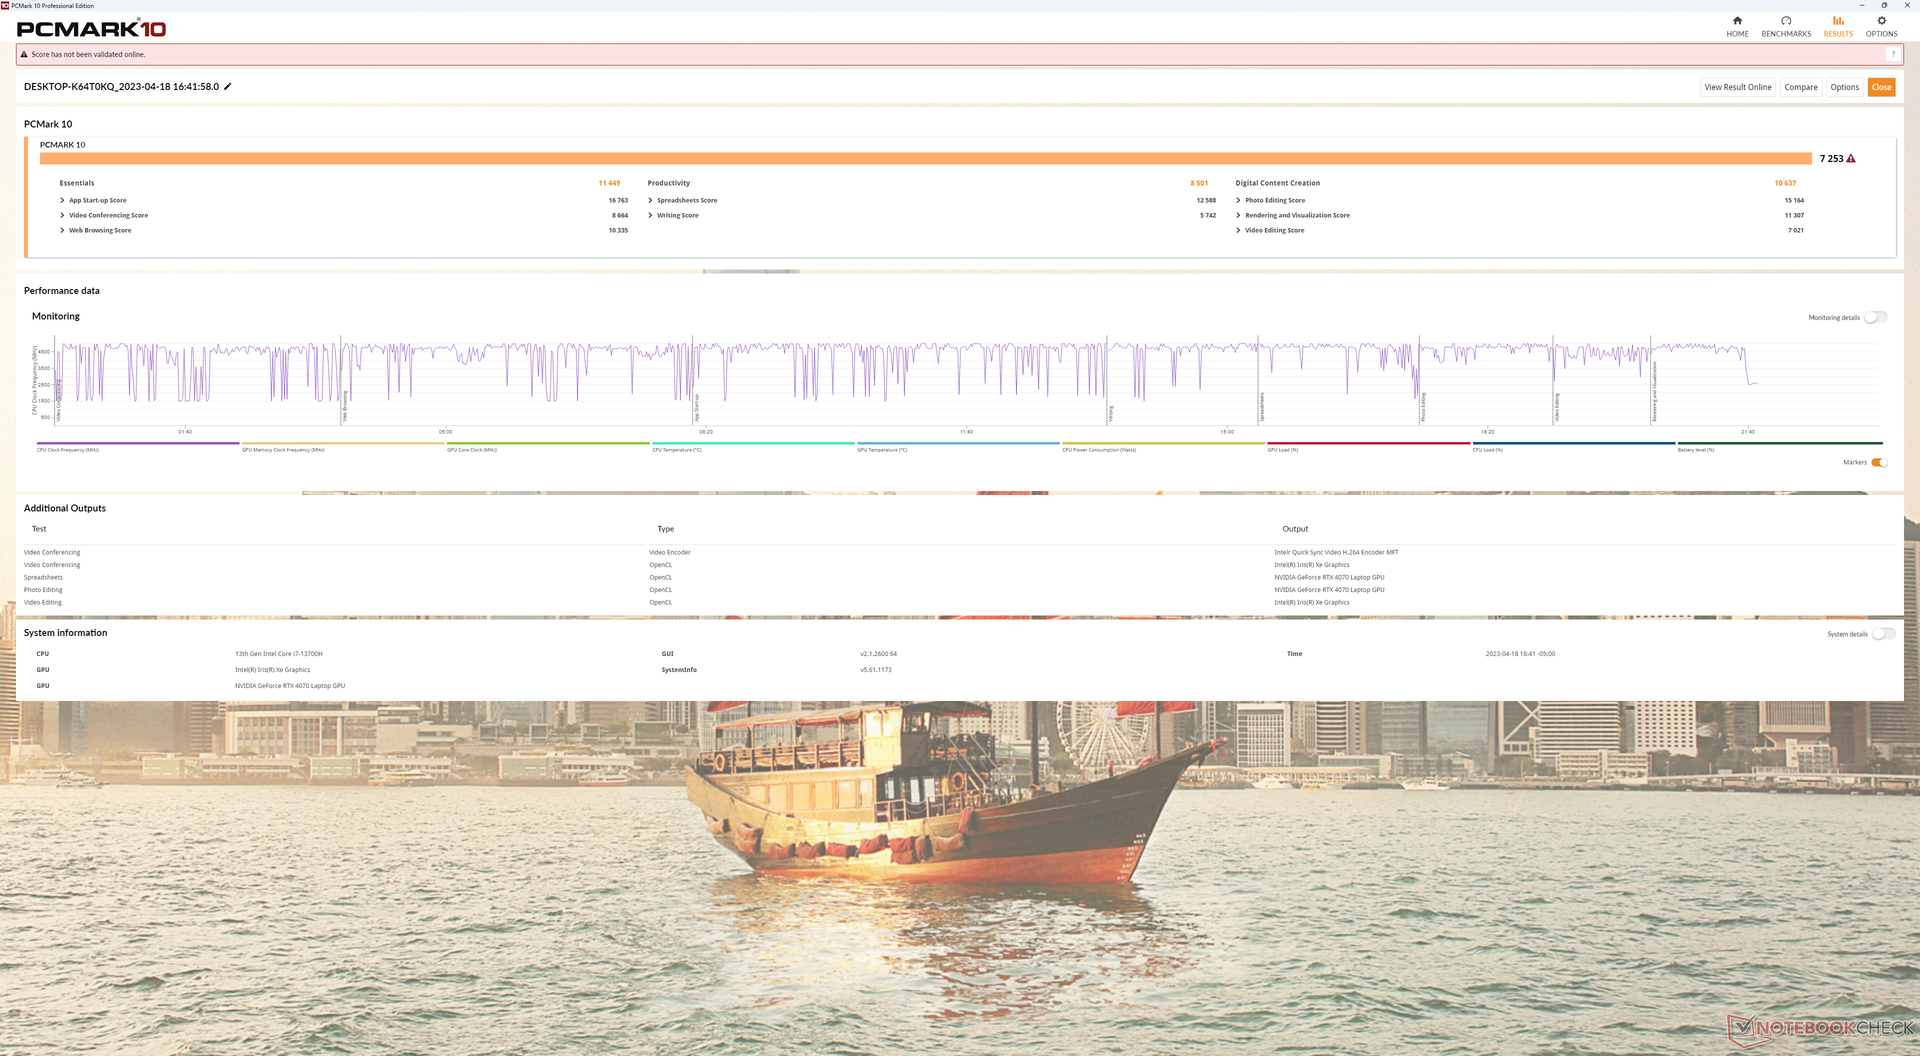
| PCMark 10 Score | 7253 punten | |
Help | ||
| AIDA64 / Memory Copy | |
| Dell XPS 15 9530 RTX 4070 | |
| MSI Prestige 15 A12UD-093 | |
| Gemiddeld Intel Core i7-13700H (24334 - 78081, n=29) | |
| Dell XPS 15 9520 RTX 3050 Ti | |
| Asus Zenbook Pro 15 OLED UM535Q | |
| Dell XPS 15 9500 Core i7 4K UHD | |
| AIDA64 / Memory Read | |
| Dell XPS 15 9530 RTX 4070 | |
| Gemiddeld Intel Core i7-13700H (23681 - 79656, n=29) | |
| MSI Prestige 15 A12UD-093 | |
| Dell XPS 15 9520 RTX 3050 Ti | |
| Asus Zenbook Pro 15 OLED UM535Q | |
| Dell XPS 15 9500 Core i7 4K UHD | |
| AIDA64 / Memory Write | |
| Gemiddeld Intel Core i7-13700H (22986 - 99898, n=29) | |
| Dell XPS 15 9530 RTX 4070 | |
| MSI Prestige 15 A12UD-093 | |
| Dell XPS 15 9520 RTX 3050 Ti | |
| Asus Zenbook Pro 15 OLED UM535Q | |
| Dell XPS 15 9500 Core i7 4K UHD | |
| AIDA64 / Memory Latency | |
| Dell XPS 15 9520 RTX 3050 Ti | |
| MSI Prestige 15 A12UD-093 | |
| Asus Zenbook Pro 15 OLED UM535Q | |
| Gemiddeld Intel Core i7-13700H (82.4 - 136.8, n=29) | |
| Dell XPS 15 9530 RTX 4070 | |
| Dell XPS 15 9500 Core i7 4K UHD | |
| Gigabyte Aero 15 OLED XD | |
* ... kleiner is beter
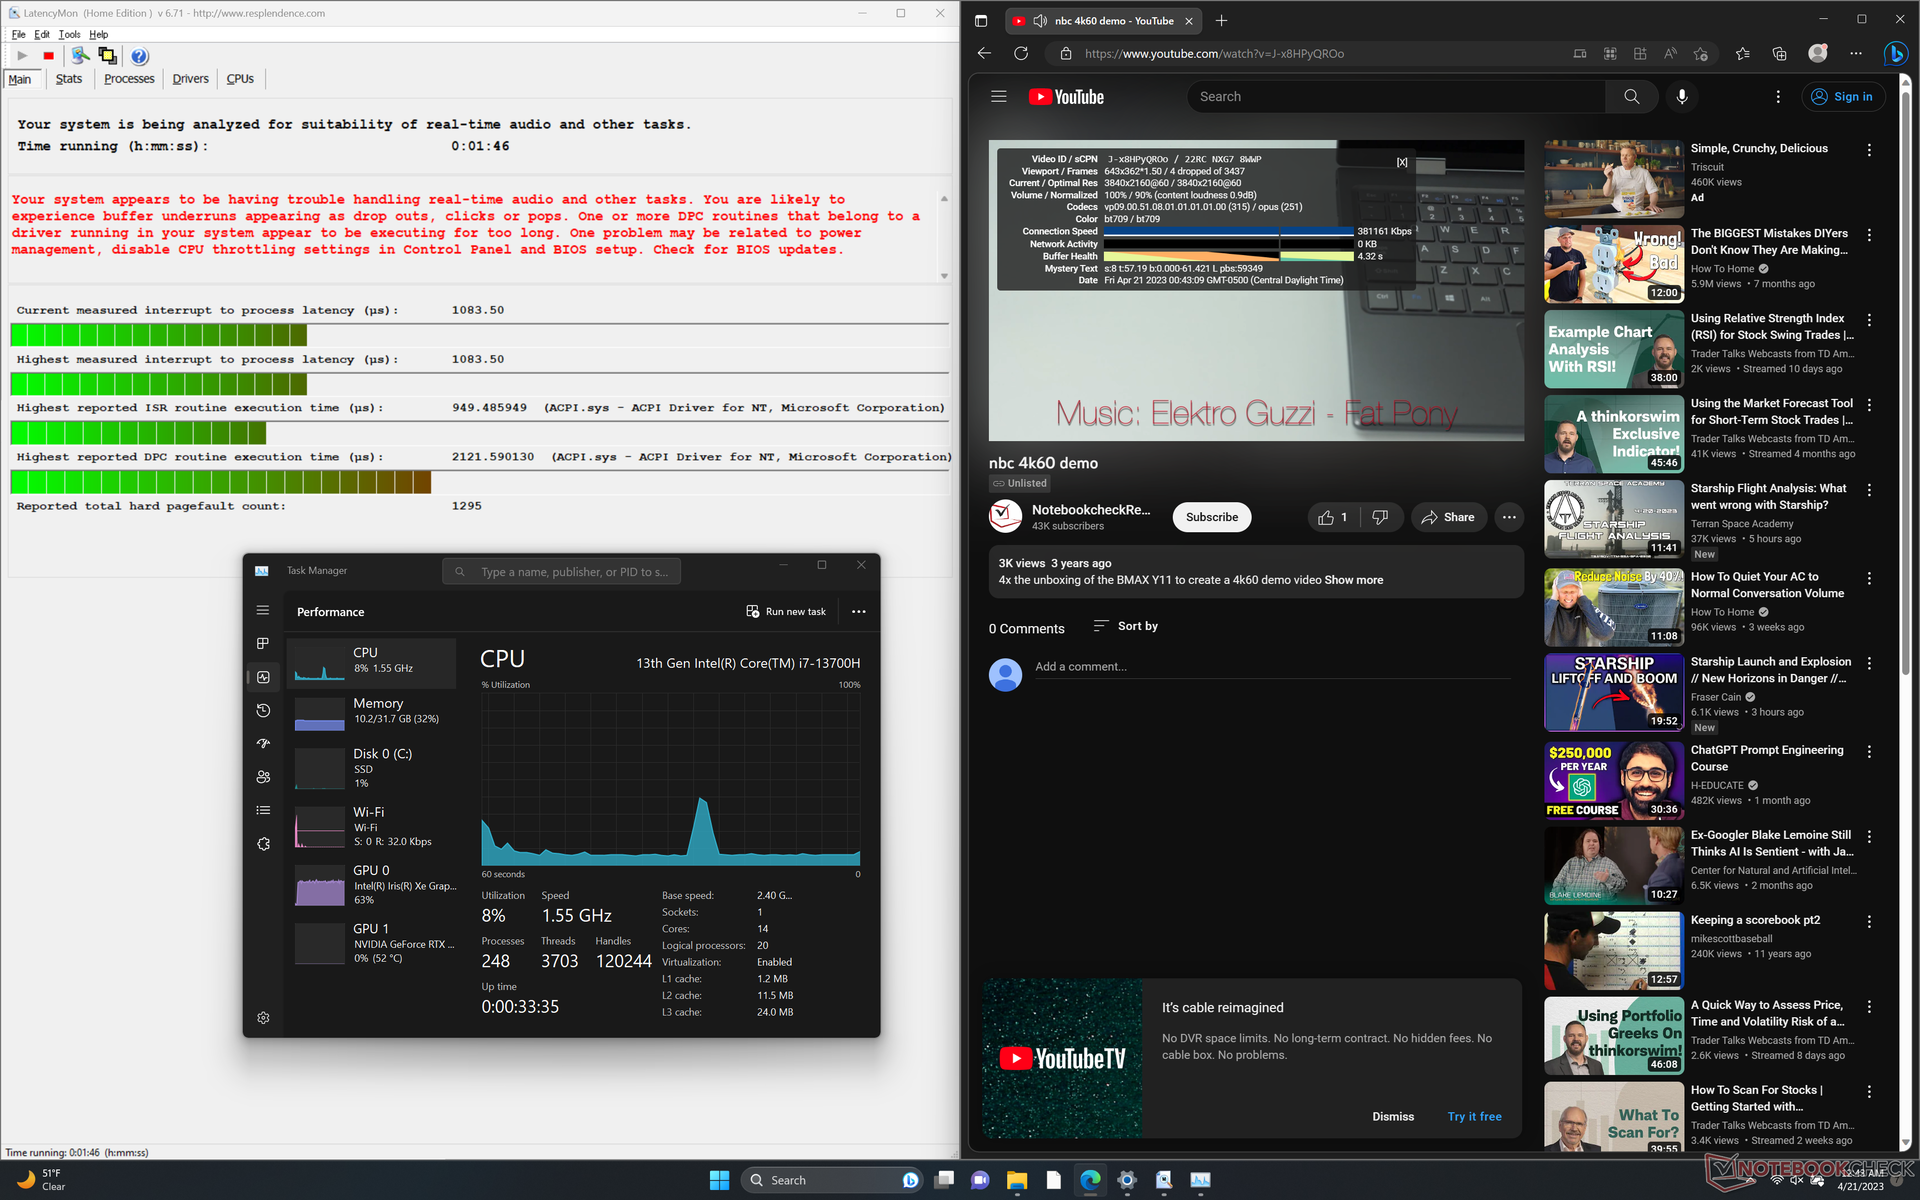
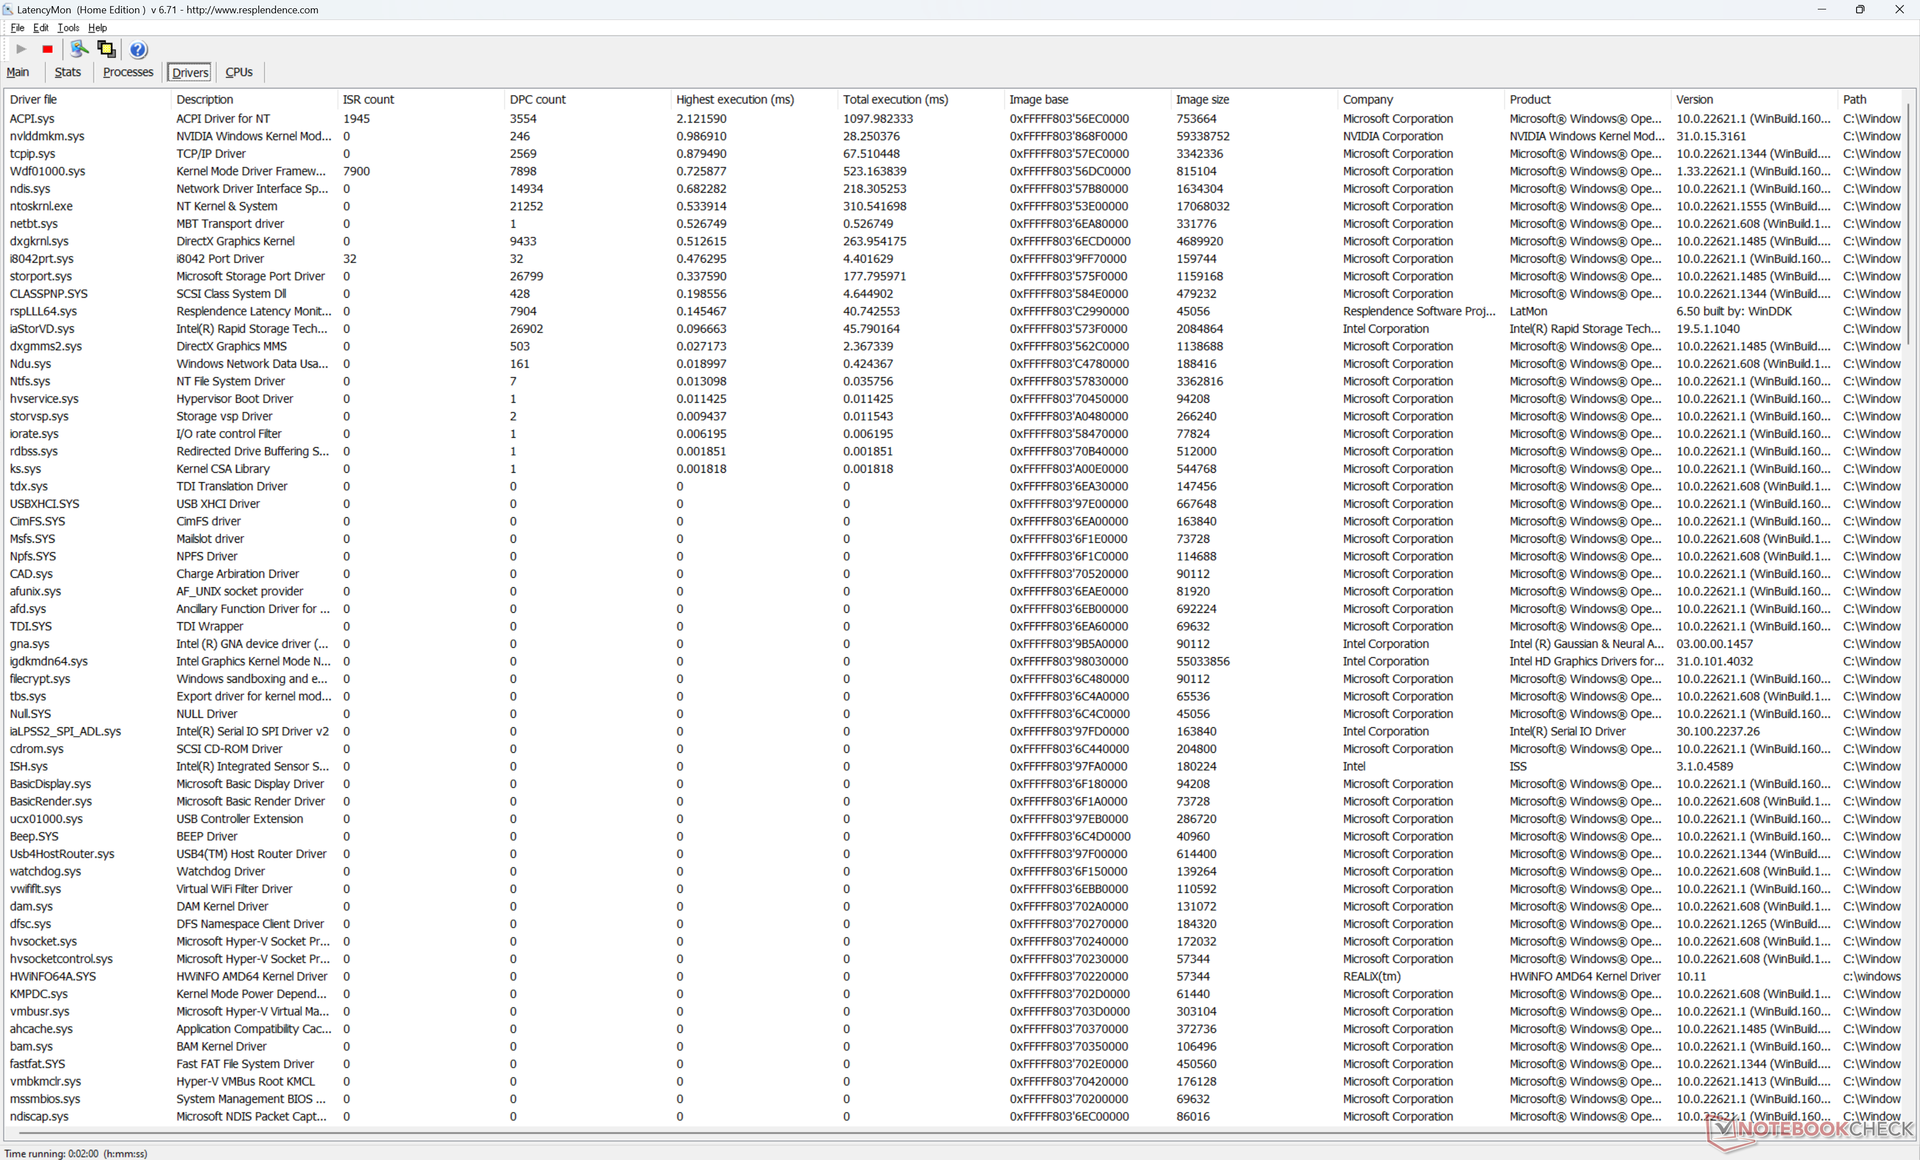
DPC latentie
LatencyMon onthult DPC-problemen bij het openen van meerdere browsertabbladen van onze homepage. het afspelen van 4K60-video's is ook niet perfect, met 4 dropped frames tijdens onze testvideo van een minuut.
| DPC Latencies / LatencyMon - interrupt to process latency (max), Web, Youtube, Prime95 | |
| Dell XPS 15 9500 Core i7 4K UHD | |
| MSI Prestige 15 A12UD-093 | |
| Dell XPS 15 9530 RTX 4070 | |
| Dell XPS 15 9520 RTX 3050 Ti | |
| Gigabyte Aero 15 OLED XD | |
| Asus Zenbook Pro 15 OLED UM535Q | |
* ... kleiner is beter
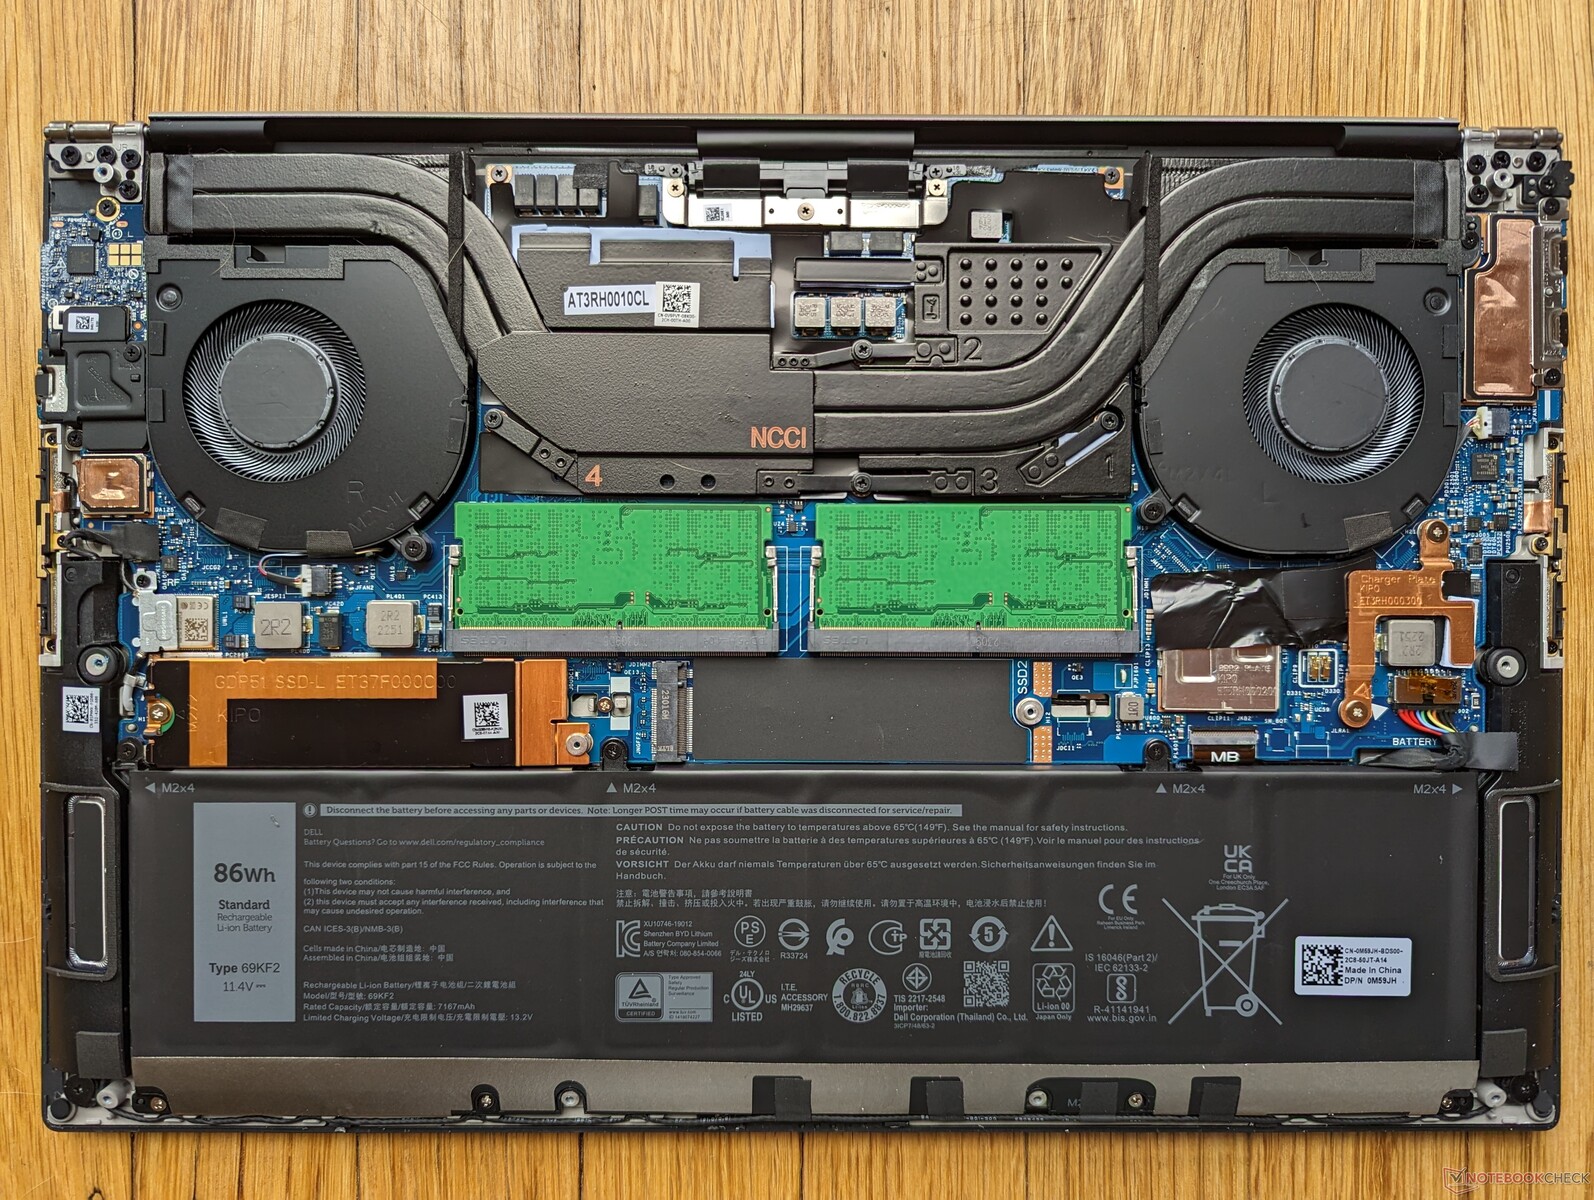
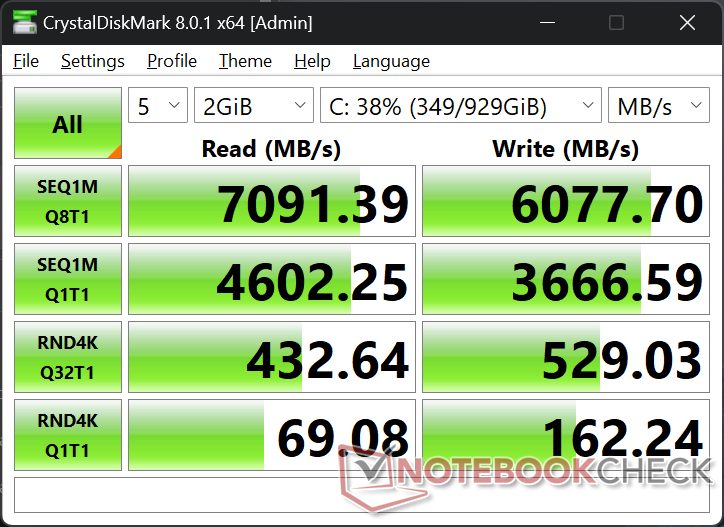
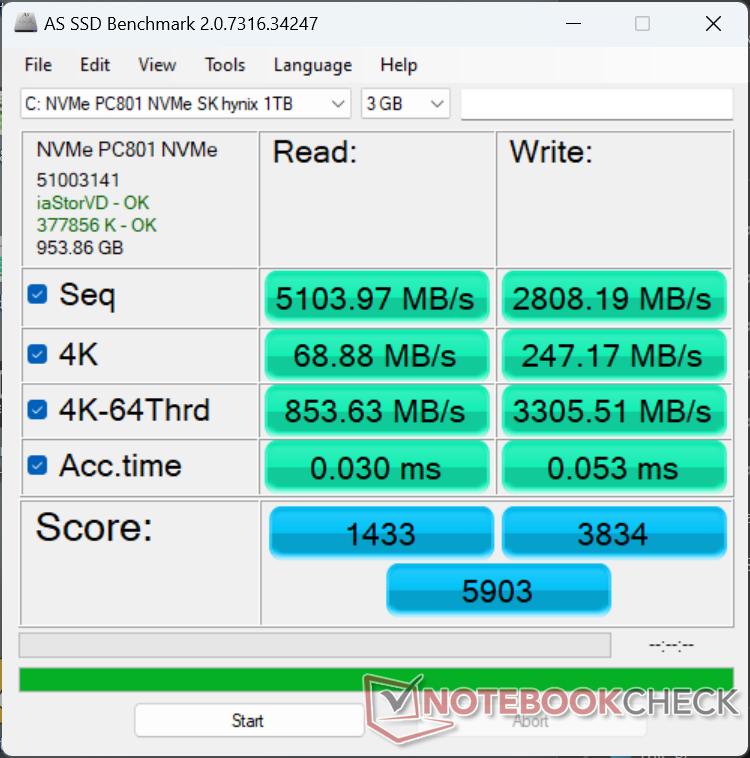
Opslagapparaten - Tot twee PCIe4-schijven
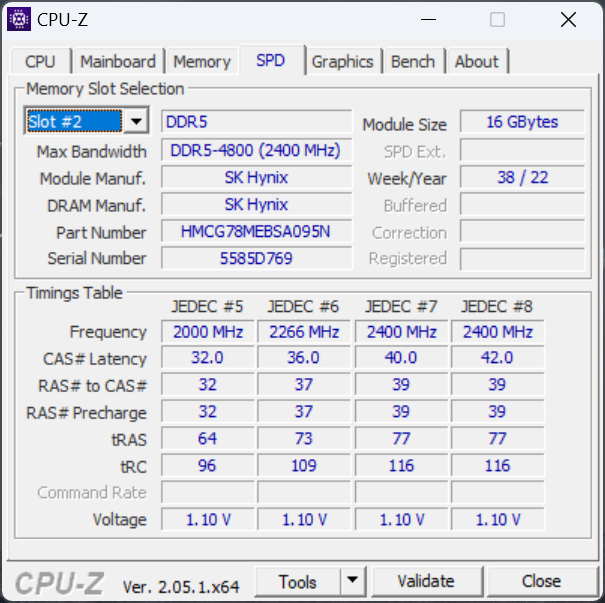
Onze recensie-eenheid heeft een SK Hynix PC801 PCIe4 x4 NVMe SSD in plaats van de WD SN810 op onze oudere XPS 15 9510 testunit. De prestaties zijn over het algemeen vergelijkbaar tussen de twee SSD's, maar ze blijven achter bij de populaire Samsung PM9A1.
De duurzaamheid van de prestaties is uitstekend, zonder throttling bij stress. Het is jammer dat PCIe5 SSD's niet worden aangeboden bij het afrekenen.

| Drive Performance rating - Percent | |
| Gigabyte Aero 15 OLED XD | |
| Dell XPS 15 9530 RTX 4070 | |
| Dell XPS 15 9520 RTX 3050 Ti | |
| MSI Prestige 15 A12UD-093 | |
| Asus Zenbook Pro 15 OLED UM535Q | |
| Dell XPS 15 9500 Core i7 4K UHD | |
* ... kleiner is beter
Disk Throttling: DiskSpd Read Loop, Queue Depth 8
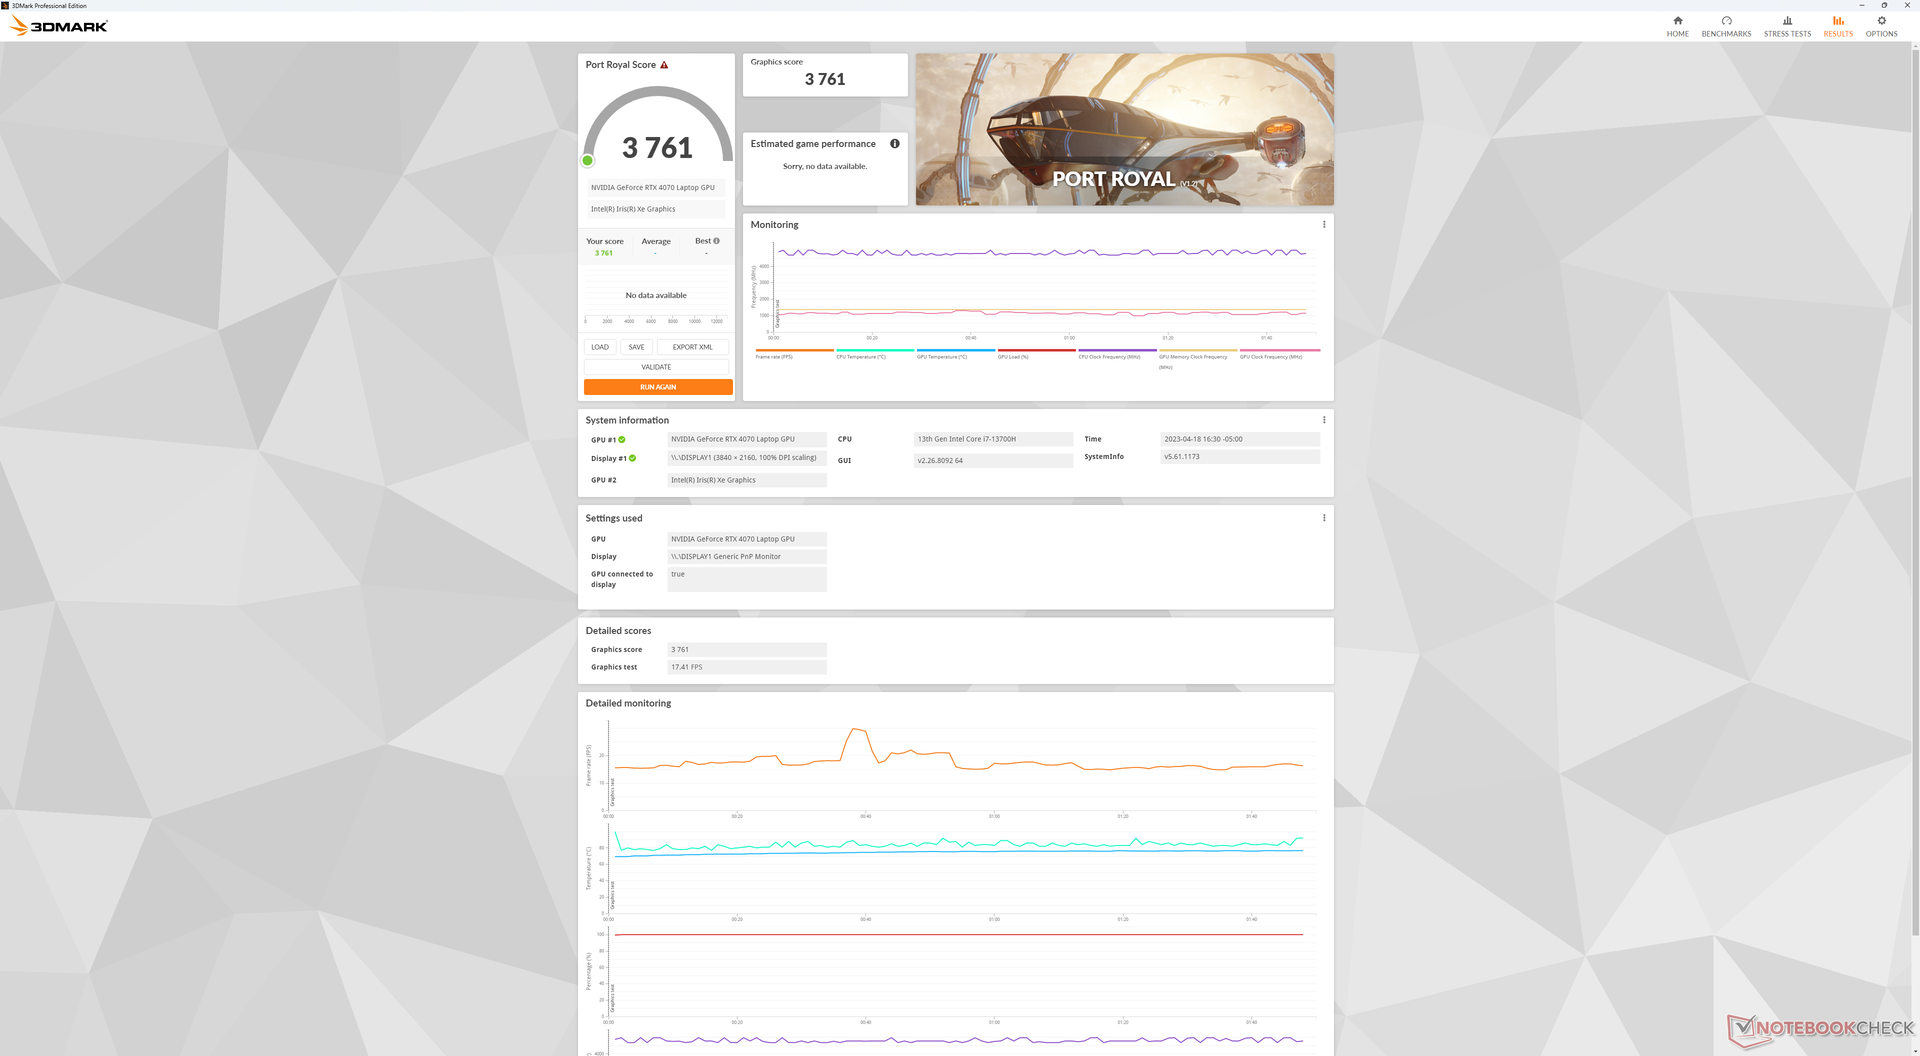
GPU-prestaties - De helft van de TGP staat gelijk aan de helft van het vermogen
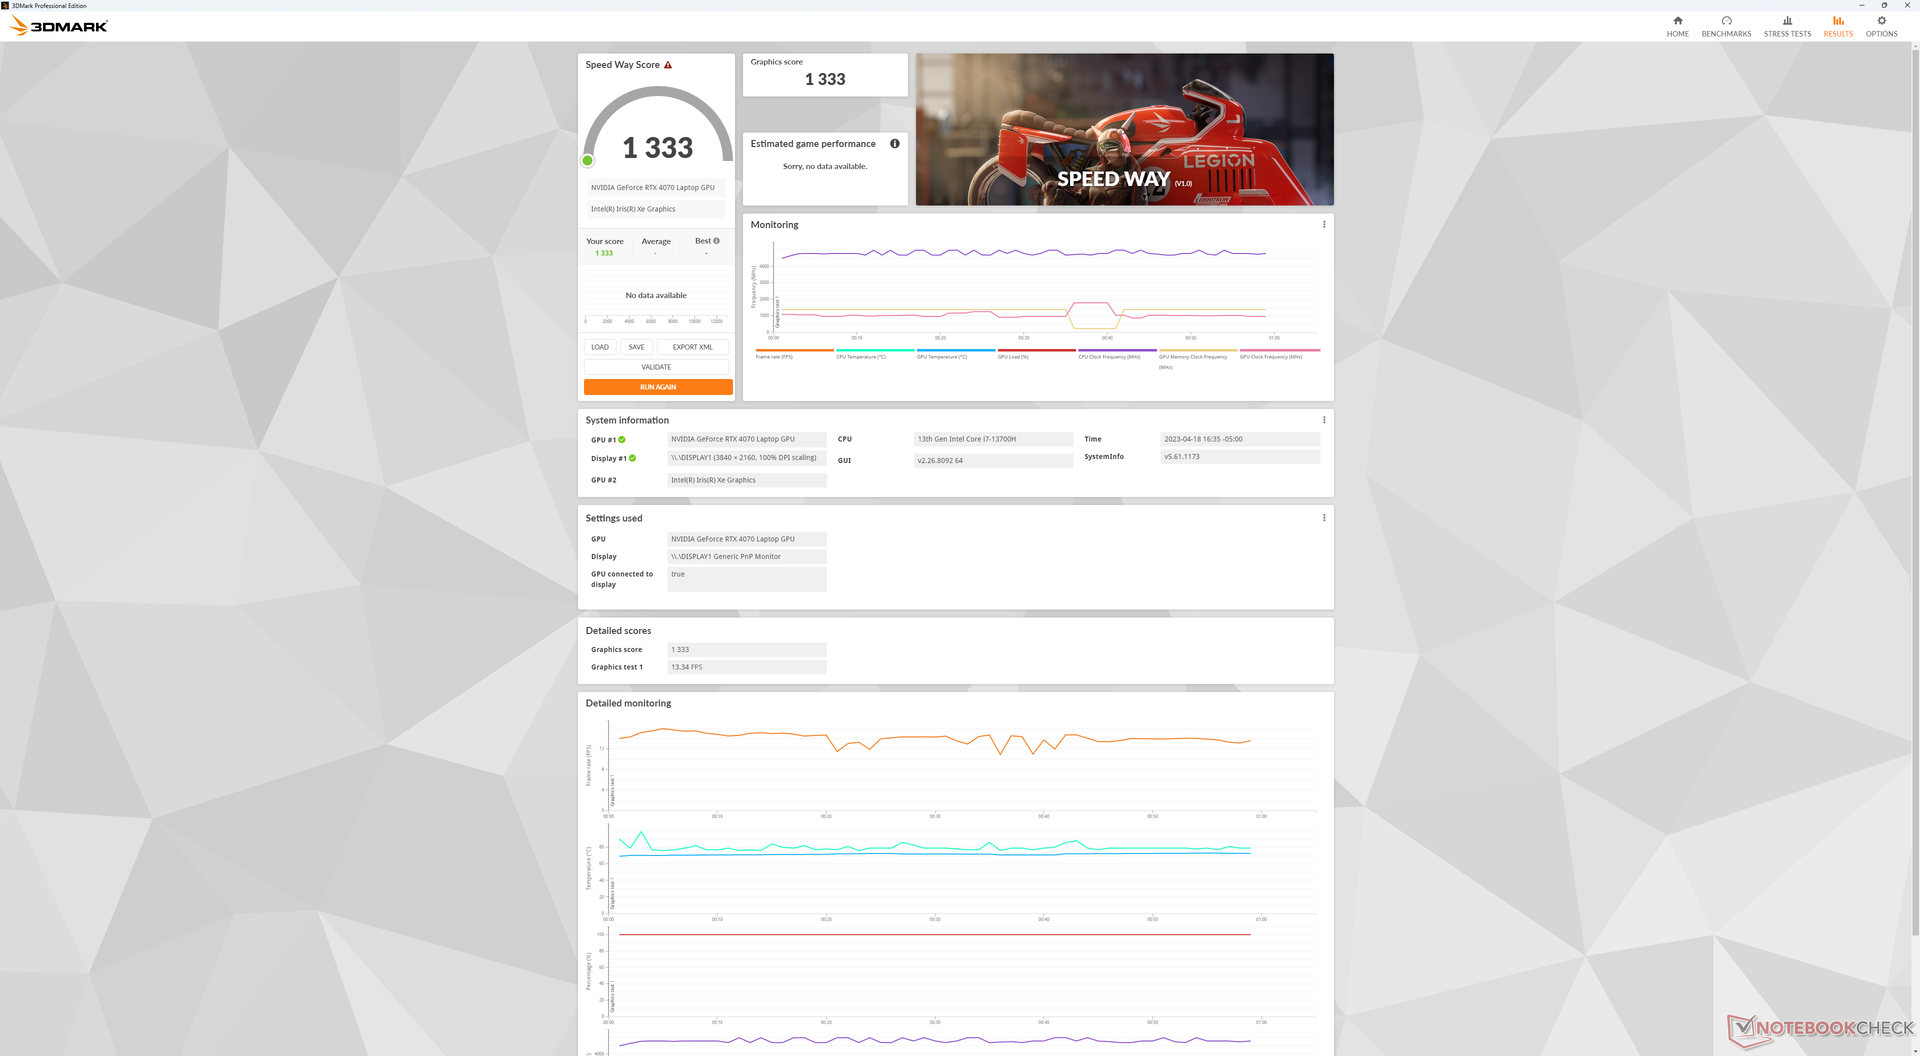
Uiteraard moeten de grafische prestaties langzamer zijn dan de "gemiddelde" GeForce RTX 4070 laptop vanwege de lage 50 W TGP doelstelling van de XPS 15, maar we hadden geen idee met hoeveel. Nu we een testeenheid in de hand hebben, kan het tekort behoorlijk opvallend zijn met maximaal 40 tot 50 procent langzamer dan het gemiddelde onze database volgens 3DMark benchmarks. Het is zo erg dat zelfs een vier jaar oude RTX 2070 laptop zoals de HP Omen 15 ongeveer hetzelfde kan presteren als onze duurdere RTX 4070 XPS 15. Als je van plan bent om veel games te spelen, dan wordt de XPS 15 een slechte waardepropositie.
Het goede nieuws is dat de grafische prestaties nog steeds sneller zijn dan de RTX 3050 Ti in de XPS 15 9520 van vorig jaar met ongeveer 30 tot 35 procent. Er is dus een aanzienlijke jaar-op-jaar boost, ook al is dit gemakkelijk een van de traagste iteraties van de mobiele RTX 4070 die we hebben gezien.
Interessant is dat de grafische versnelling bij het uitvoeren van 3D-softwaretools veel sneller is dan verwacht ten opzichte van de 50 W TGP. Blender Classroom met CUDA versnelling, bijvoorbeeld, zou in slechts 46 seconden voltooid zijn, wat slechts ongeveer 25 procent langzamer is dan de gemiddelde RTX 4070 laptop waar 100 W of hogere TGP's typisch zijn. De oudere RTX 3050 Ti zou er bijna 2,5x langer over doen bij dezelfde benchmark. Content creators zullen dus het meest profiteren wanneer ze de 2023 XPS 15 kiezen boven oudere modellen.
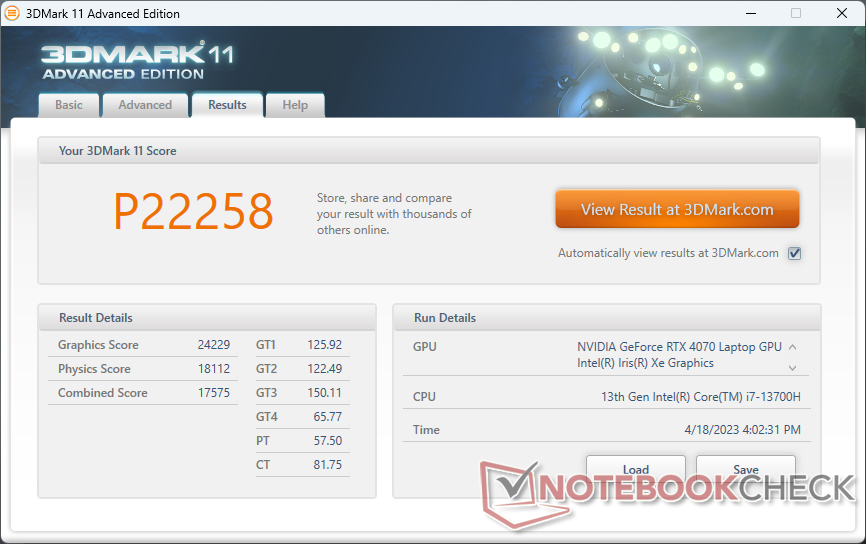
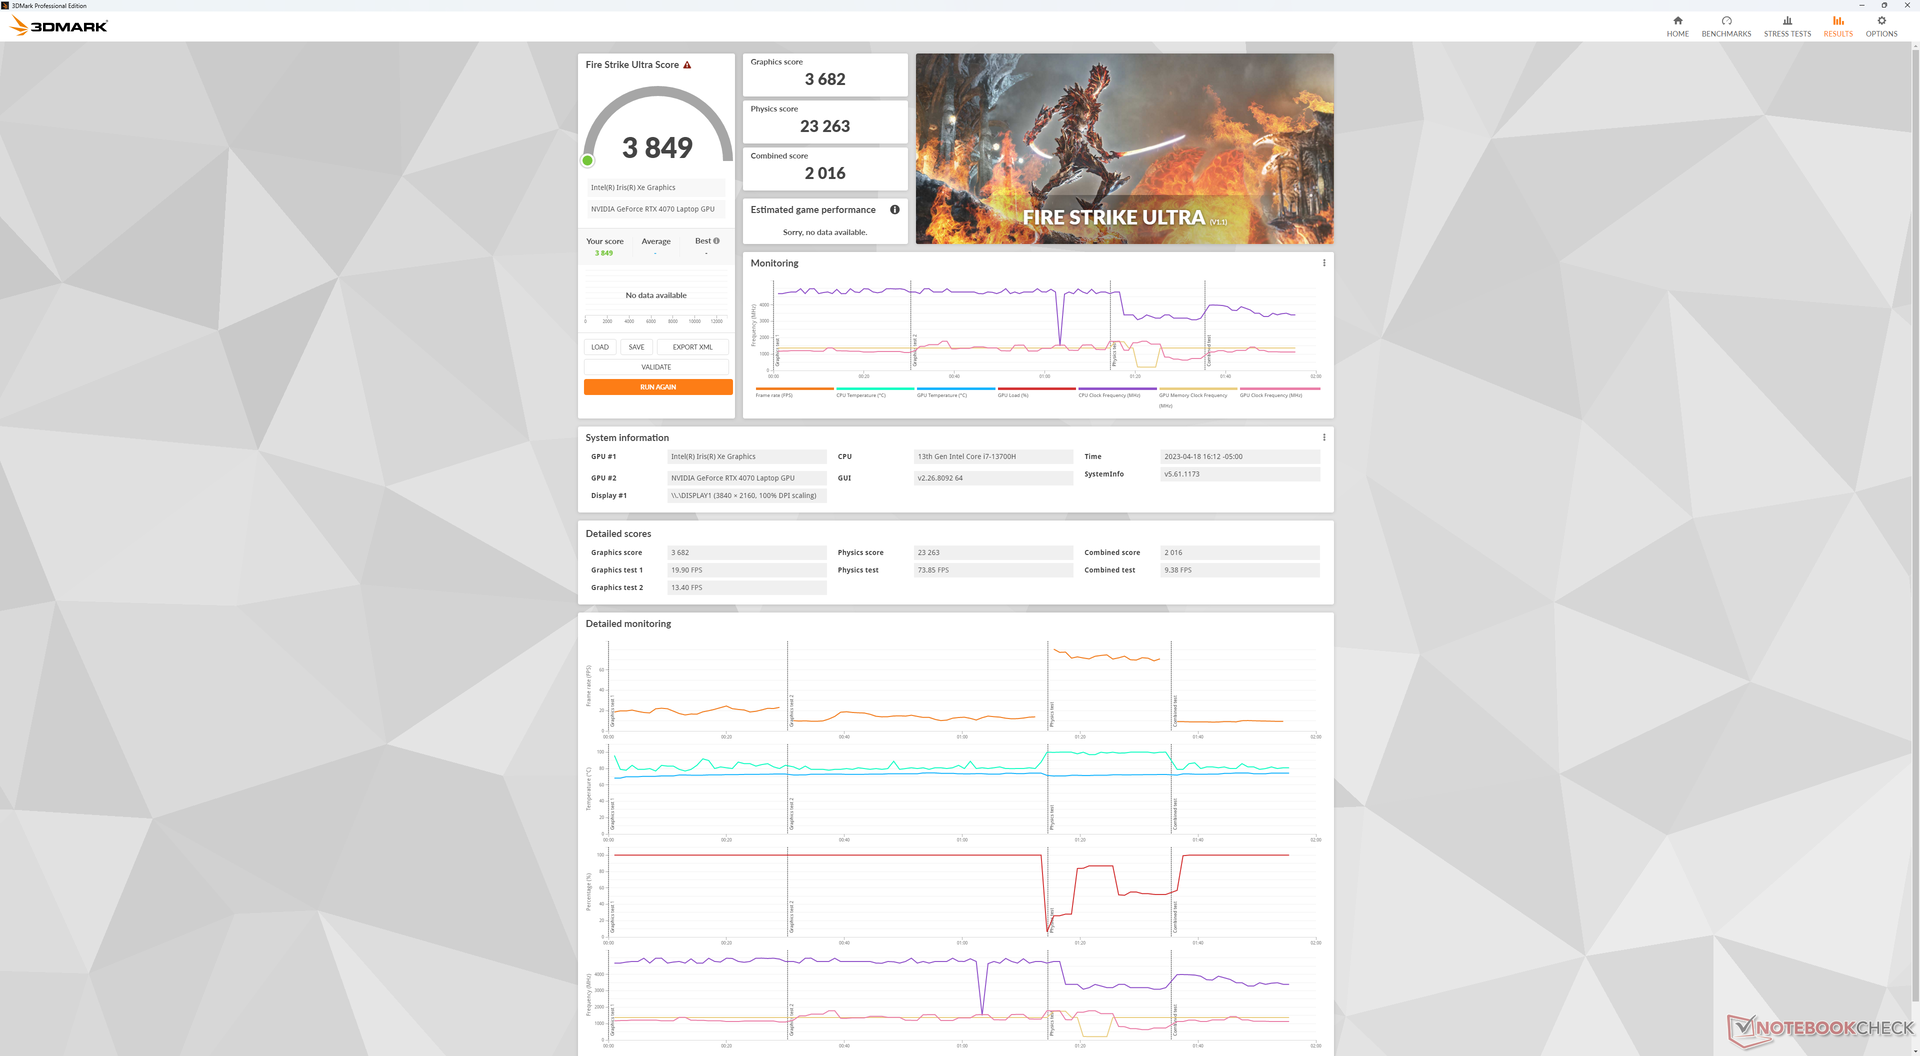
| 3DMark 11 Performance | 22258 punten | |
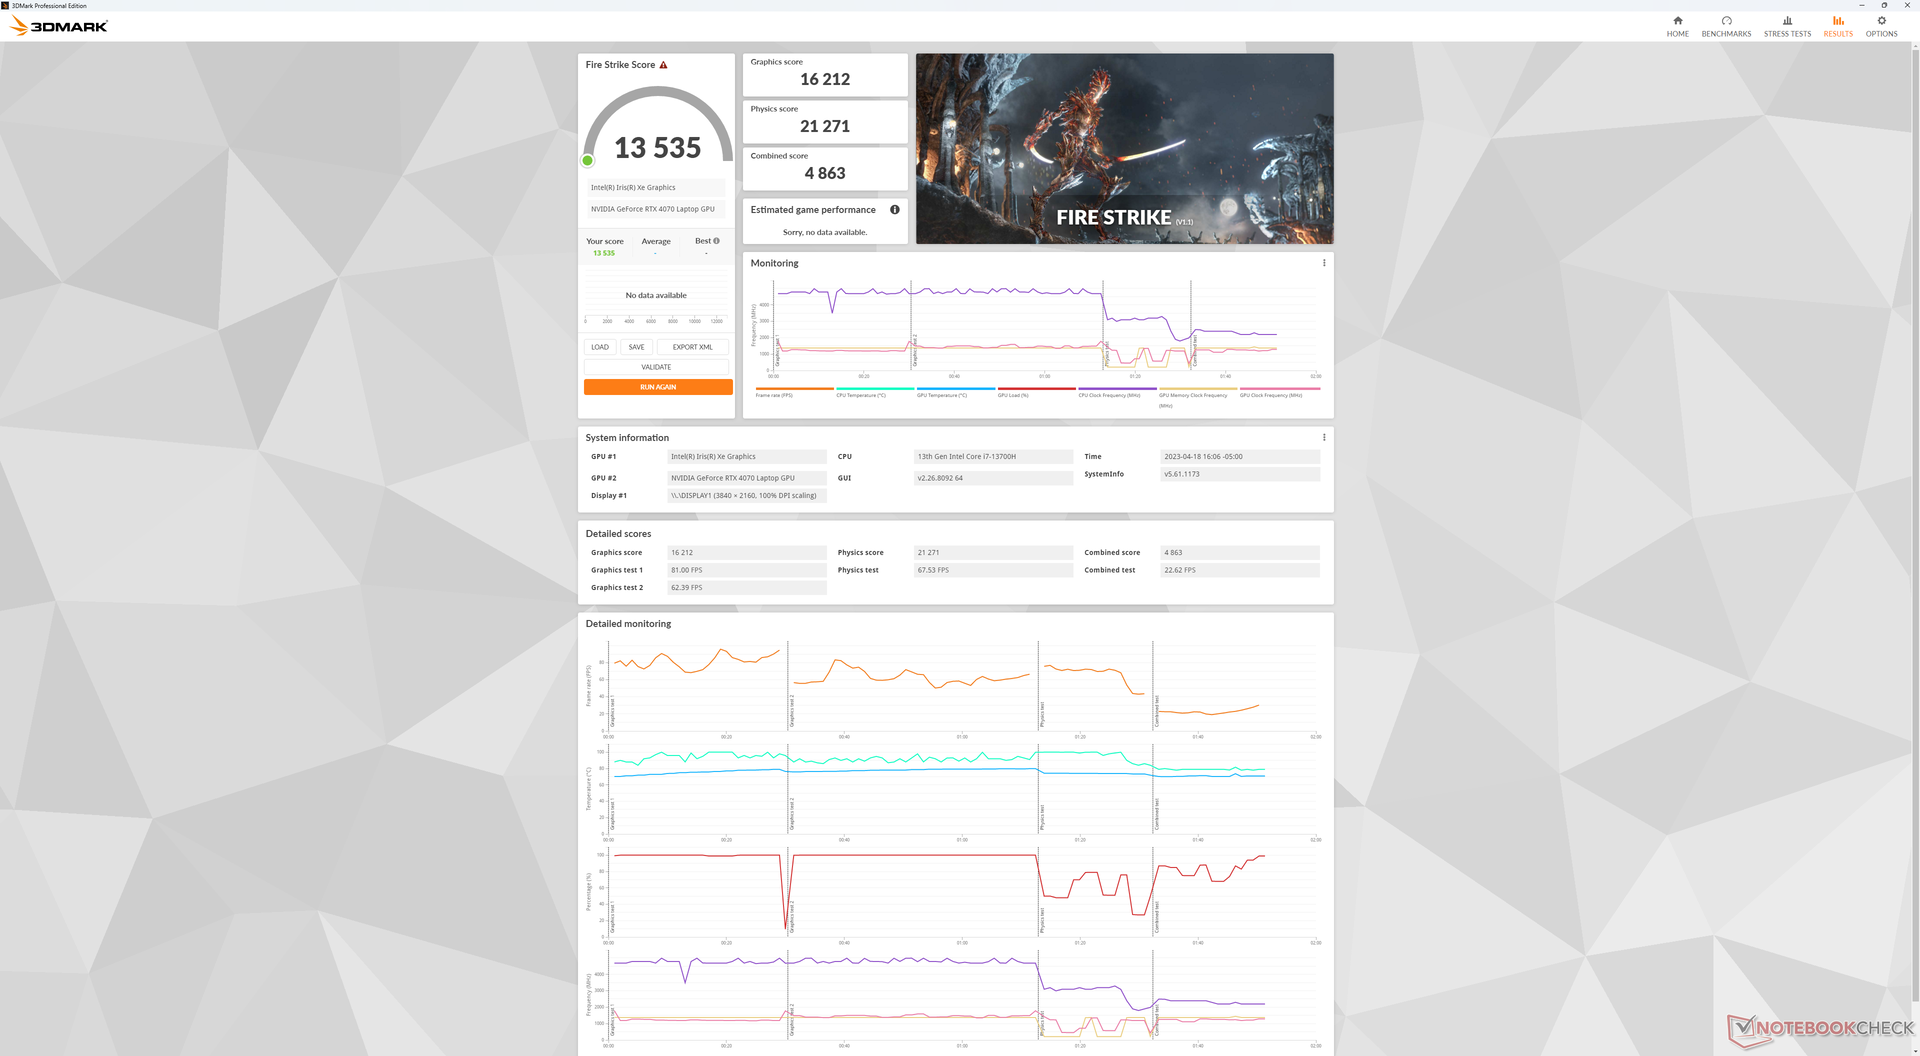
| 3DMark Fire Strike Score | 13535 punten | |
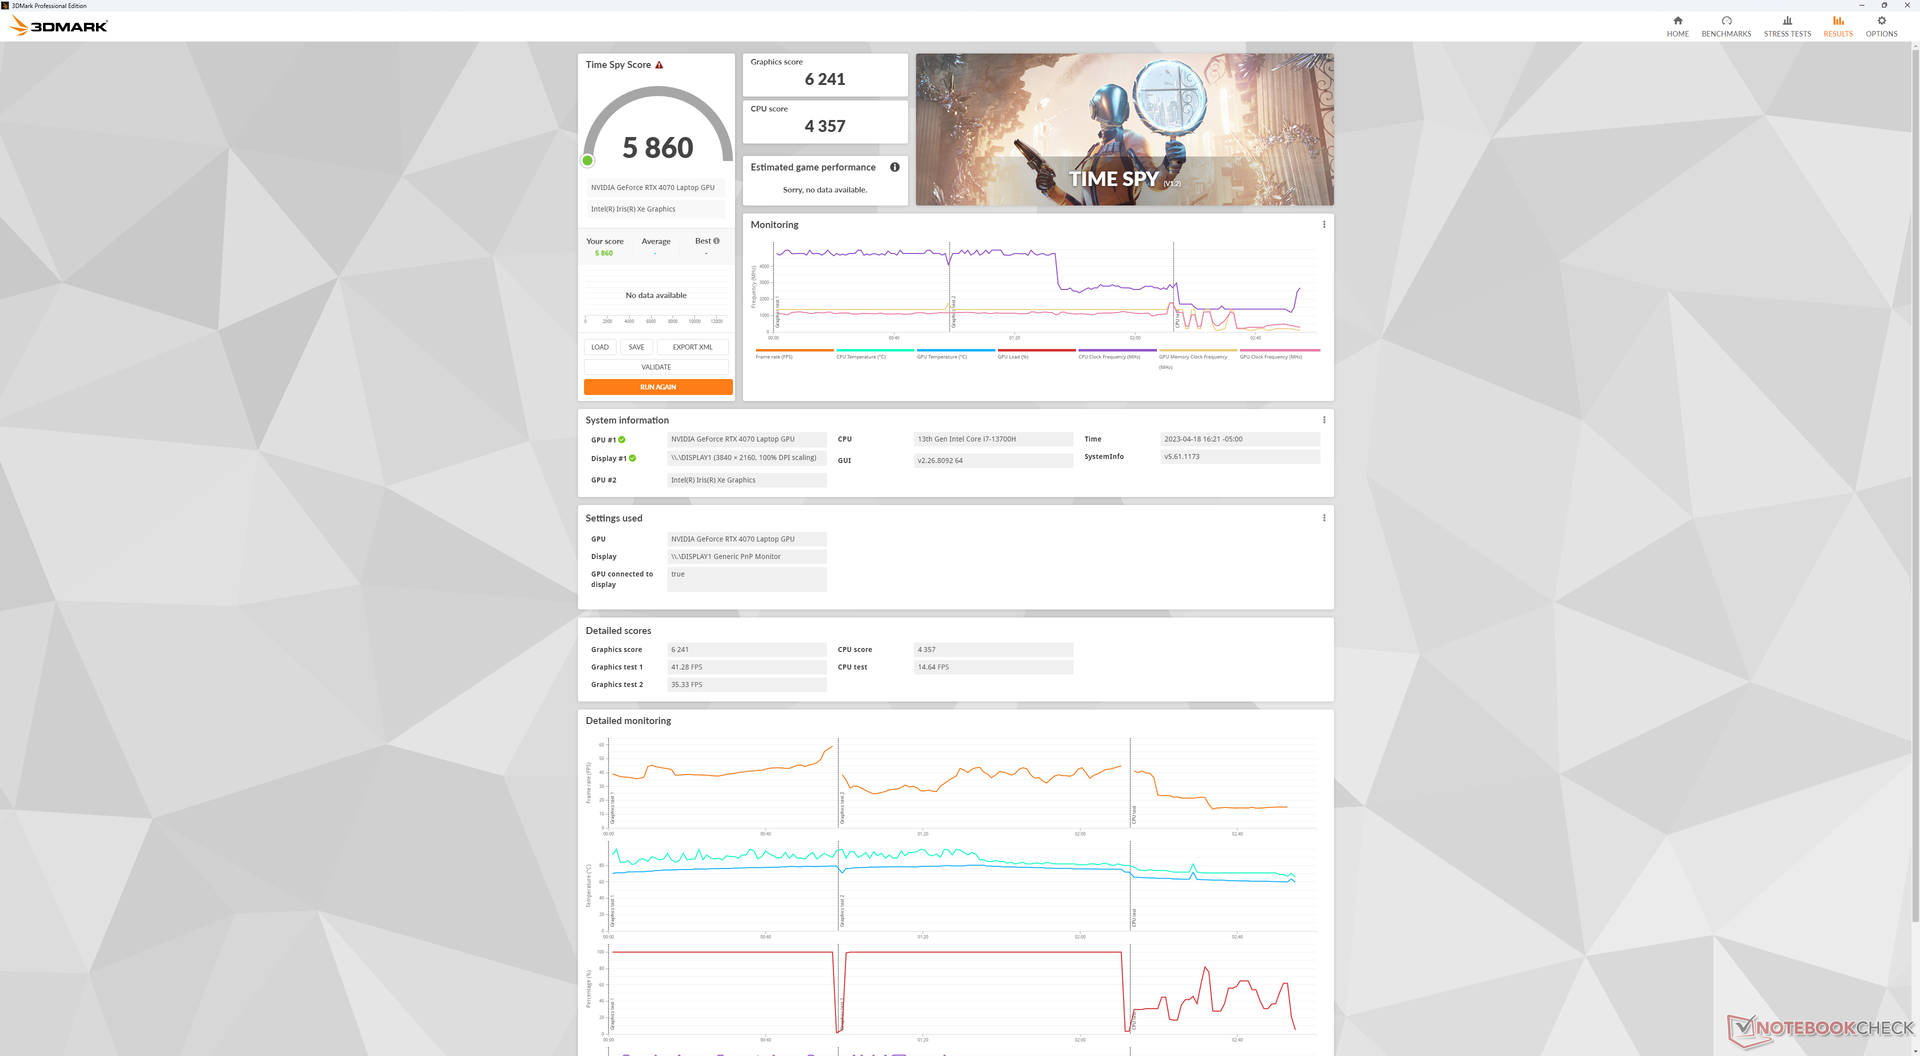
| 3DMark Time Spy Score | 5860 punten | |
Help | ||
* ... kleiner is beter
Spelprestaties
Ondanks de hierboven genoemde teleurstellende RTX 4070-prestaties kan het systeem nog steeds elke huidige titel draaien op middelhoge instellingen op 1080p en 60 FPS. Iets hoger, echter, en de GPU begint te worstelen. Veeleisende titels zoals Cyberpunk 2077 of Returnal zouden elk naar het 40 FPS bereik dalen bij instellingen boven medium, wat resulteert in merkbare schermscheuren zonder G-Sync hulp. De meeste games afgezien van niet veeleisende multiplayer games zoals DOTA 2 kunnen nauwelijks draaien in de native 3.5K resolutie.
Bovendien kunnen de prestaties tijdens het gamen onstabiel zijn. Framerates bij stationair draaien op Witcher 3 daalde regelmatig van 50 FPS naar 40 FPS om vervolgens zonder reden weer terug te springen naar 50 FPS. Dergelijk gedrag suggereert een slechte prioritering van achtergrondactiviteiten.
Een ander jammerlijk nadeel is dat de framerates bij zeer lage instellingen soms langzamer zijn dan de framerates bij hogere instellingen. Dit werd waargenomen bij het draaien van Cyberpunk 2077 en Returnal op lage 1080p instellingen waar frame rates consequent langzamer waren dan medium 1080p instellingen, zelfs na herhaalde tests. Dergelijk gedrag suggereert een PSU-beperking en een daaruit voortvloeiende krachtmeting tussen CPU en GPU wanneer beide worden belast.
| The Witcher 3 - 1920x1080 Ultra Graphics & Postprocessing (HBAO+) | |
| Asus Zephyrus Duo 16 GX650PY-NM006W | |
| Uniwill GM6PX7X RTX 4070 | |
| Alienware x15 R2 P111F | |
| Gigabyte Aero 15 OLED XD | |
| Dell XPS 15 9530 RTX 4070 | |
| MSI Stealth 15M A11SEK | |
| Dell XPS 15 9500 Core i7 4K UHD | |
| Dell XPS 15 9520 RTX 3050 Ti | |
| GTA V - 1920x1080 Highest AA:4xMSAA + FX AF:16x | |
| Asus Zephyrus Duo 16 GX650PY-NM006W | |
| Uniwill GM6PX7X RTX 4070 | |
| Gigabyte Aero 15 OLED XD | |
| MSI Stealth 15M A11SEK | |
| Dell XPS 15 9530 RTX 4070 | |
| Dell XPS 15 9520 RTX 3050 Ti | |
| Final Fantasy XV Benchmark - 1920x1080 High Quality | |
| Asus Zephyrus Duo 16 GX650PY-NM006W | |
| Uniwill GM6PX7X RTX 4070 | |
| Alienware x15 R2 P111F | |
| Gigabyte Aero 15 OLED XD | |
| Dell XPS 15 9530 RTX 4070 | |
| MSI Stealth 15M A11SEK | |
| Dell XPS 15 9520 RTX 3050 Ti | |
| Strange Brigade - 1920x1080 ultra AA:ultra AF:16 | |
| Asus Zephyrus Duo 16 GX650PY-NM006W | |
| Uniwill GM6PX7X RTX 4070 | |
| Alienware x15 R2 P111F | |
| Gigabyte Aero 15 OLED XD | |
| Dell XPS 15 9530 RTX 4070 | |
| MSI Stealth 15M A11SEK | |
| Dell XPS 15 9520 RTX 3050 Ti | |
| Returnal | |
| 1920x1080 Low Preset | |
| Gemiddeld NVIDIA GeForce RTX 4070 Laptop GPU (65 - 119, n=11) | |
| Dell XPS 15 9530 RTX 4070 | |
| 1920x1080 Medium Preset | |
| Gemiddeld NVIDIA GeForce RTX 4070 Laptop GPU (69 - 117, n=12) | |
| Dell XPS 15 9530 RTX 4070 | |
| 1920x1080 High Preset | |
| Gemiddeld NVIDIA GeForce RTX 4070 Laptop GPU (64 - 106, n=12) | |
| Dell XPS 15 9530 RTX 4070 | |
| 1920x1080 Epic Preset | |
| Gemiddeld NVIDIA GeForce RTX 4070 Laptop GPU (54 - 90, n=12) | |
| Dell XPS 15 9530 RTX 4070 | |
| 2560x1440 Epic Preset | |
| Gemiddeld NVIDIA GeForce RTX 4070 Laptop GPU (39 - 66, n=12) | |
| Dell XPS 15 9530 RTX 4070 | |
| 3840x2160 Epic Preset | |
| Gemiddeld NVIDIA GeForce RTX 4070 Laptop GPU (21 - 39, n=8) | |
| Dell XPS 15 9530 RTX 4070 | |
Witcher 3 FPS Chart
| lage | gem. | hoge | ultra | QHD | 4K | |
|---|---|---|---|---|---|---|
| GTA V (2015) | 180 | 168.1 | 134.3 | 63.5 | 52.9 | 53 |
| The Witcher 3 (2015) | 354.2 | 233.3 | 123.9 | 69.8 | 47 | 26.5 |
| Dota 2 Reborn (2015) | 189.5 | 163.1 | 147.6 | 137 | 88.4 | |
| Final Fantasy XV Benchmark (2018) | 108.6 | 84 | 66 | 48.8 | 26.6 | |
| X-Plane 11.11 (2018) | 134.2 | 91.6 | 90.6 | 67.3 | ||
| Strange Brigade (2018) | 334 | 172.1 | 136.6 | 117.7 | 79.9 | 42.7 |
| Cyberpunk 2077 1.6 (2022) | 55.3 | 70 | 57.5 | 48 | 30 | 12.8 |
| Tiny Tina's Wonderlands (2022) | 98.1 | 92.5 | 74.3 | 58.6 | 49.8 | 39.2 |
| F1 22 (2022) | 155.1 | 148.5 | 123.5 | 39.2 | 10.6 | 4.7 |
| Returnal (2023) | 65 | 69 | 64 | 54 | 39 | 21 |
Emissies
Systeemgeluid - niet te luid voor de grootte
Het geluid van de ventilator tijdens het surfen op het web of het streamen van video schommelt rond de 24 dB(A) tegen een stille achtergrond van 23 dB(A) en is dus bijna onhoorbaar. Bij hogere belastingen zoals games zou het geluid van de ventilator tussen de 40 en 45 dB(A) liggen, wat stiller is dan deAsus Zenbook Pro 15 ofGigabyte Aero 15 onder belasting. De XPS 15 is over het algemeen niet zo luidruchtig als andere krachtige 15-inch multimedia laptops.
Geluidsniveau
| Onbelast |
| 23.1 / 23.1 / 24.2 dB (A) |
| Belasting |
| 27.1 / 44.6 dB (A) |
 | ||
30 dB stil 40 dB(A) hoorbaar 50 dB(A) luid |
||
min: | ||
| Dell XPS 15 9530 RTX 4070 GeForce RTX 4070 Laptop GPU, i7-13700H, SK hynix PC801 HFS001TEJ9X101N | Dell XPS 15 9520 RTX 3050 Ti GeForce RTX 3050 Ti Laptop GPU, i7-12700H, WDC PC SN810 512GB | Dell XPS 15 9500 Core i7 4K UHD GeForce GTX 1650 Ti Mobile, i7-10875H, SK Hynix PC611 512GB | Asus Zenbook Pro 15 OLED UM535Q GeForce RTX 3050 Ti Laptop GPU, R9 5900HX, WDC PC SN730 SDBPNTY-1T00 | MSI Prestige 15 A12UD-093 GeForce RTX 3050 Ti Laptop GPU, i7-1280P, Micron 3400 1TB MTFDKBA1T0TFH | Gigabyte Aero 15 OLED XD GeForce RTX 3070 Laptop GPU, i7-11800H, Samsung PM9A1 MZVL21T0HCLR | |
|---|---|---|---|---|---|---|
| Noise | 0% | -24% | -7% | -22% | -35% | |
| uit / omgeving * (dB) | 23.1 | 22.8 1% | 28.4 -23% | 22.8 1% | 26 -13% | 25 -8% |
| Idle Minimum * (dB) | 23.1 | 22.9 1% | 28.4 -23% | 22.9 1% | 26 -13% | 30 -30% |
| Idle Average * (dB) | 23.1 | 22.9 1% | 28.4 -23% | 22.9 1% | 30.7 -33% | 32 -39% |
| Idle Maximum * (dB) | 24.2 | 22.9 5% | 28.4 -17% | 22.9 5% | 30.7 -27% | 35 -45% |
| Load Average * (dB) | 27.1 | 30.9 -14% | 46 -70% | 33.2 -23% | 41.9 -55% | 44 -62% |
| Witcher 3 ultra * (dB) | 40.1 | 37.8 6% | 42 -5% | 47.3 -18% | 51 -27% | |
| Load Maximum * (dB) | 44.6 | 44.7 -0% | 47.1 -6% | 52.8 -18% | 40.7 9% | 60 -35% |
* ... kleiner is beter
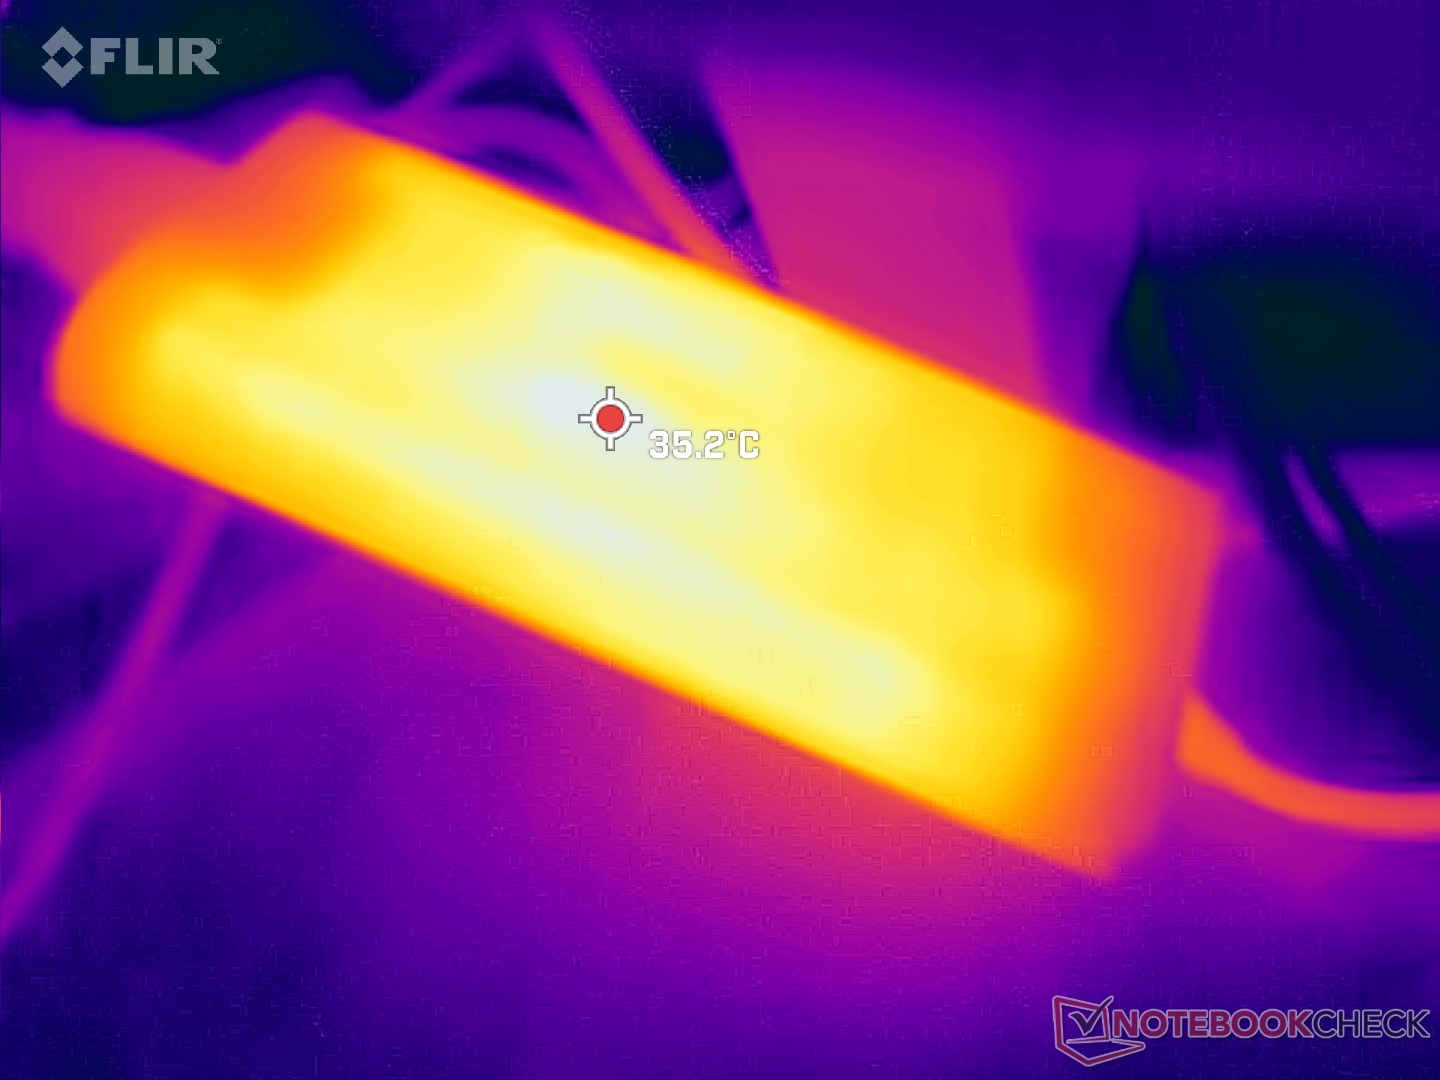
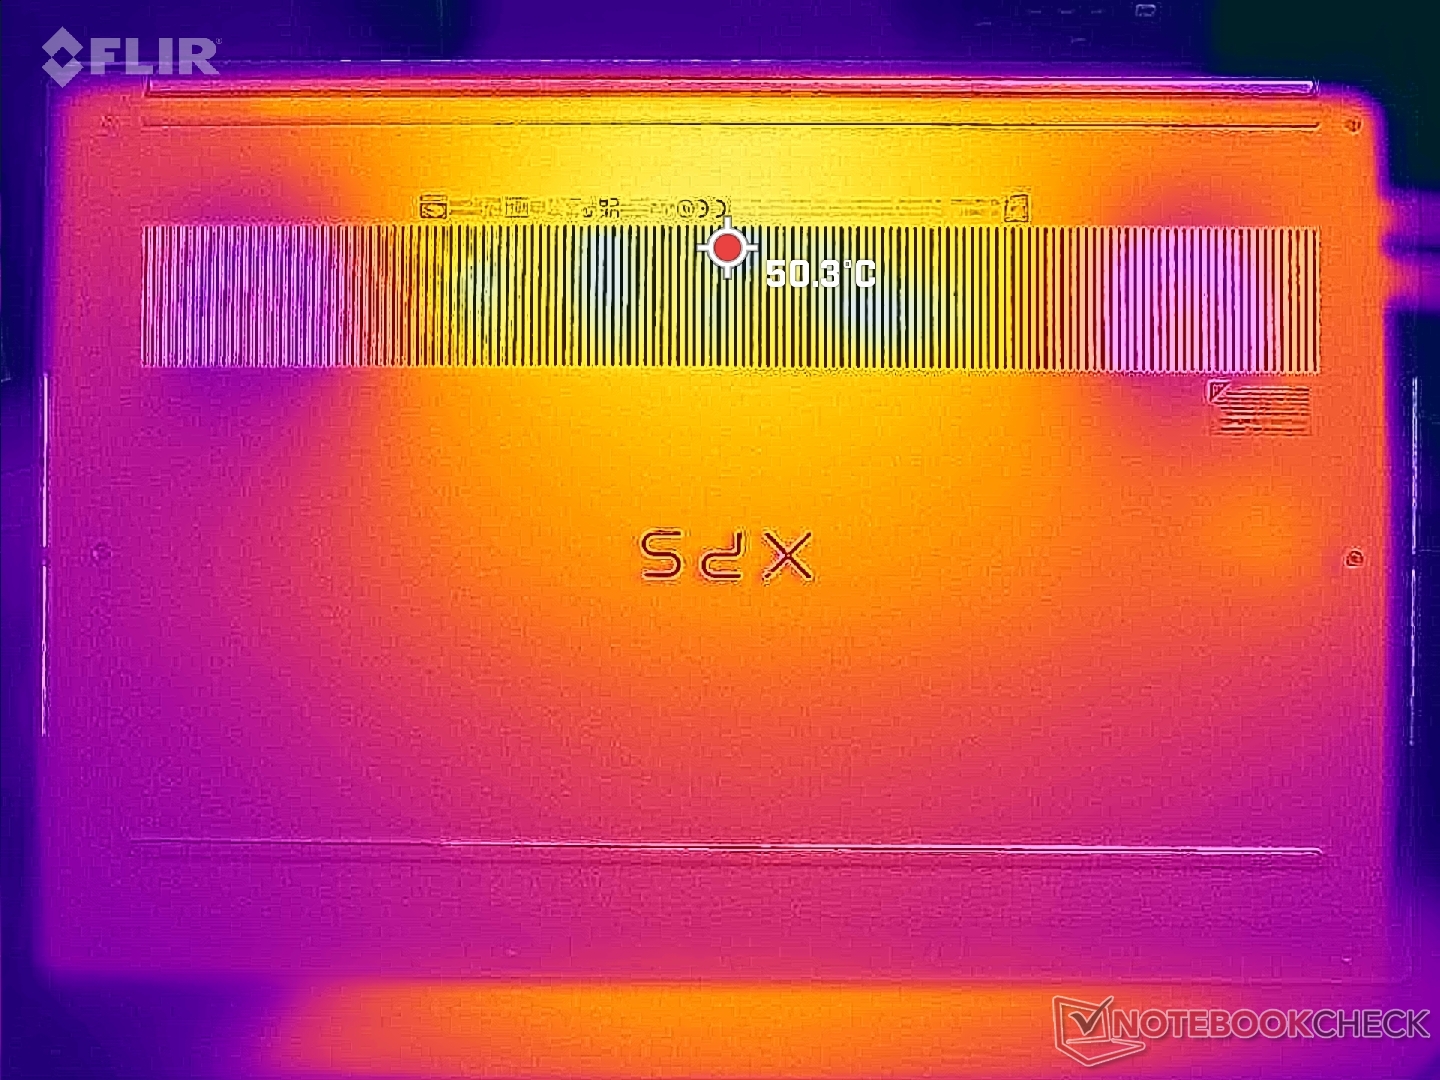
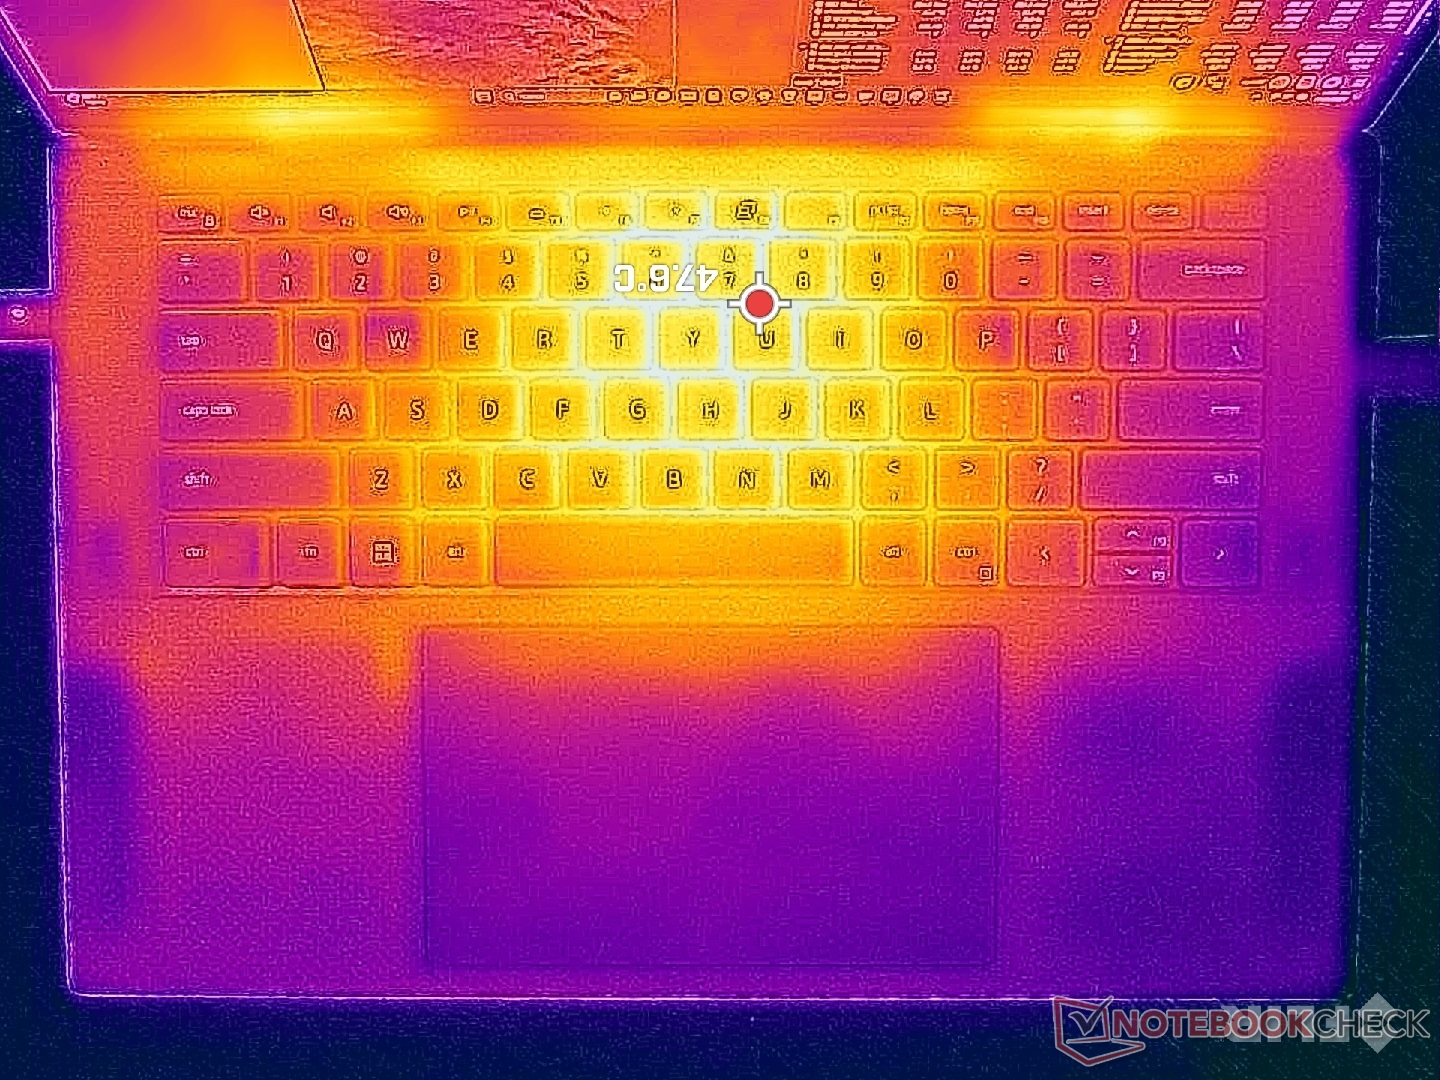
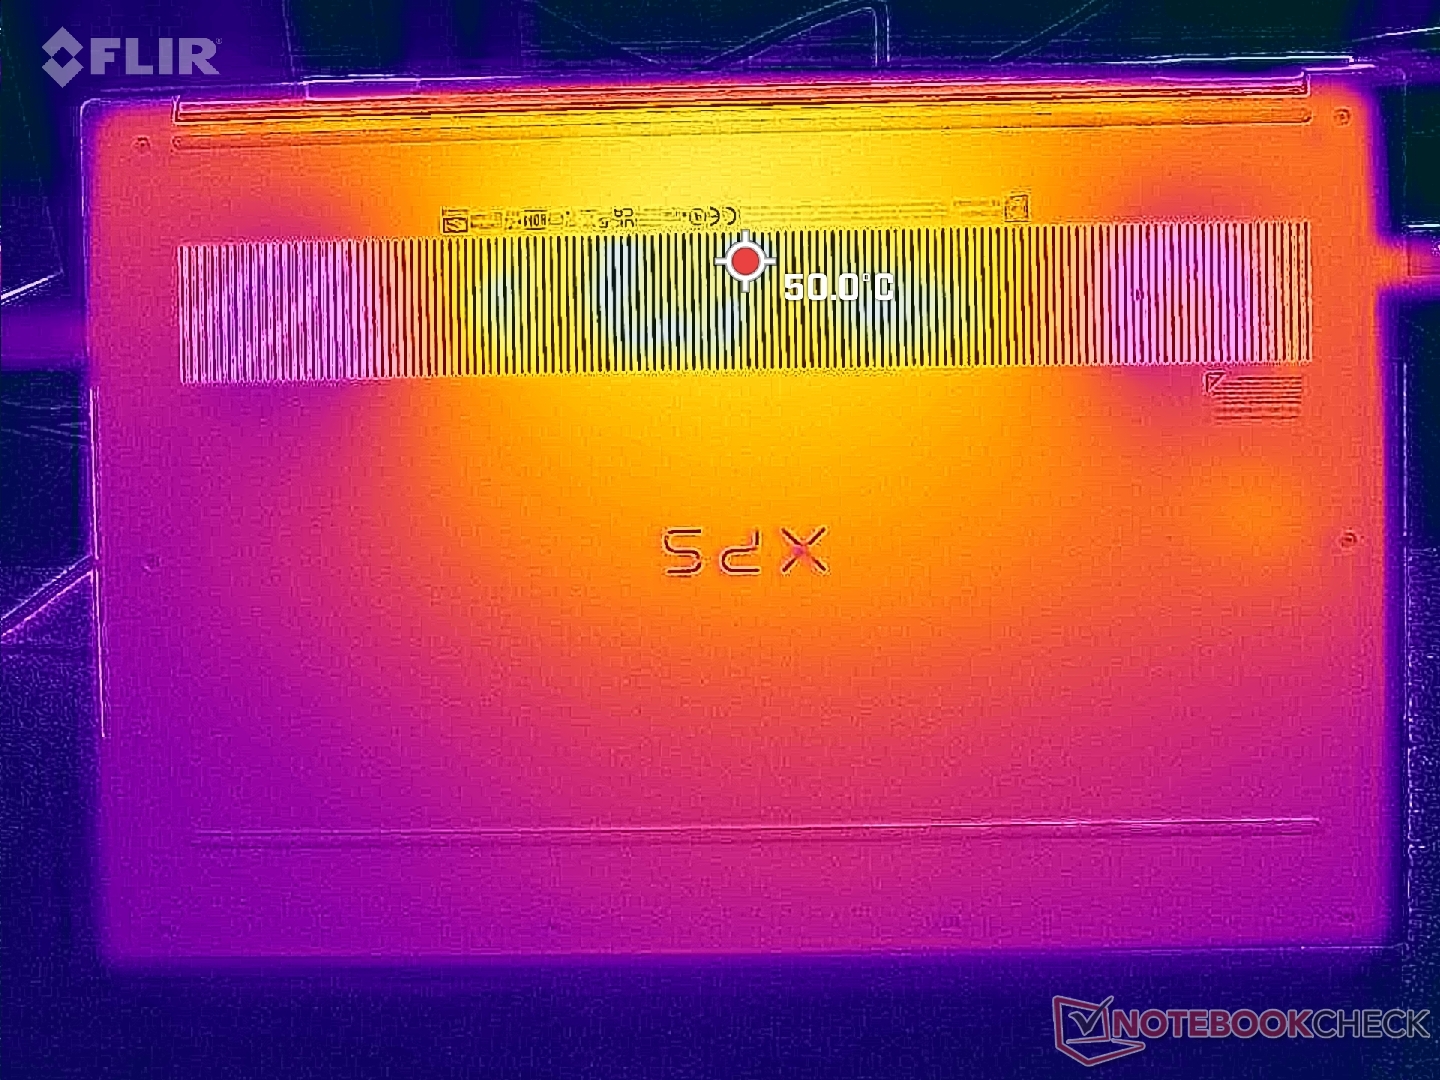
Temperatuur
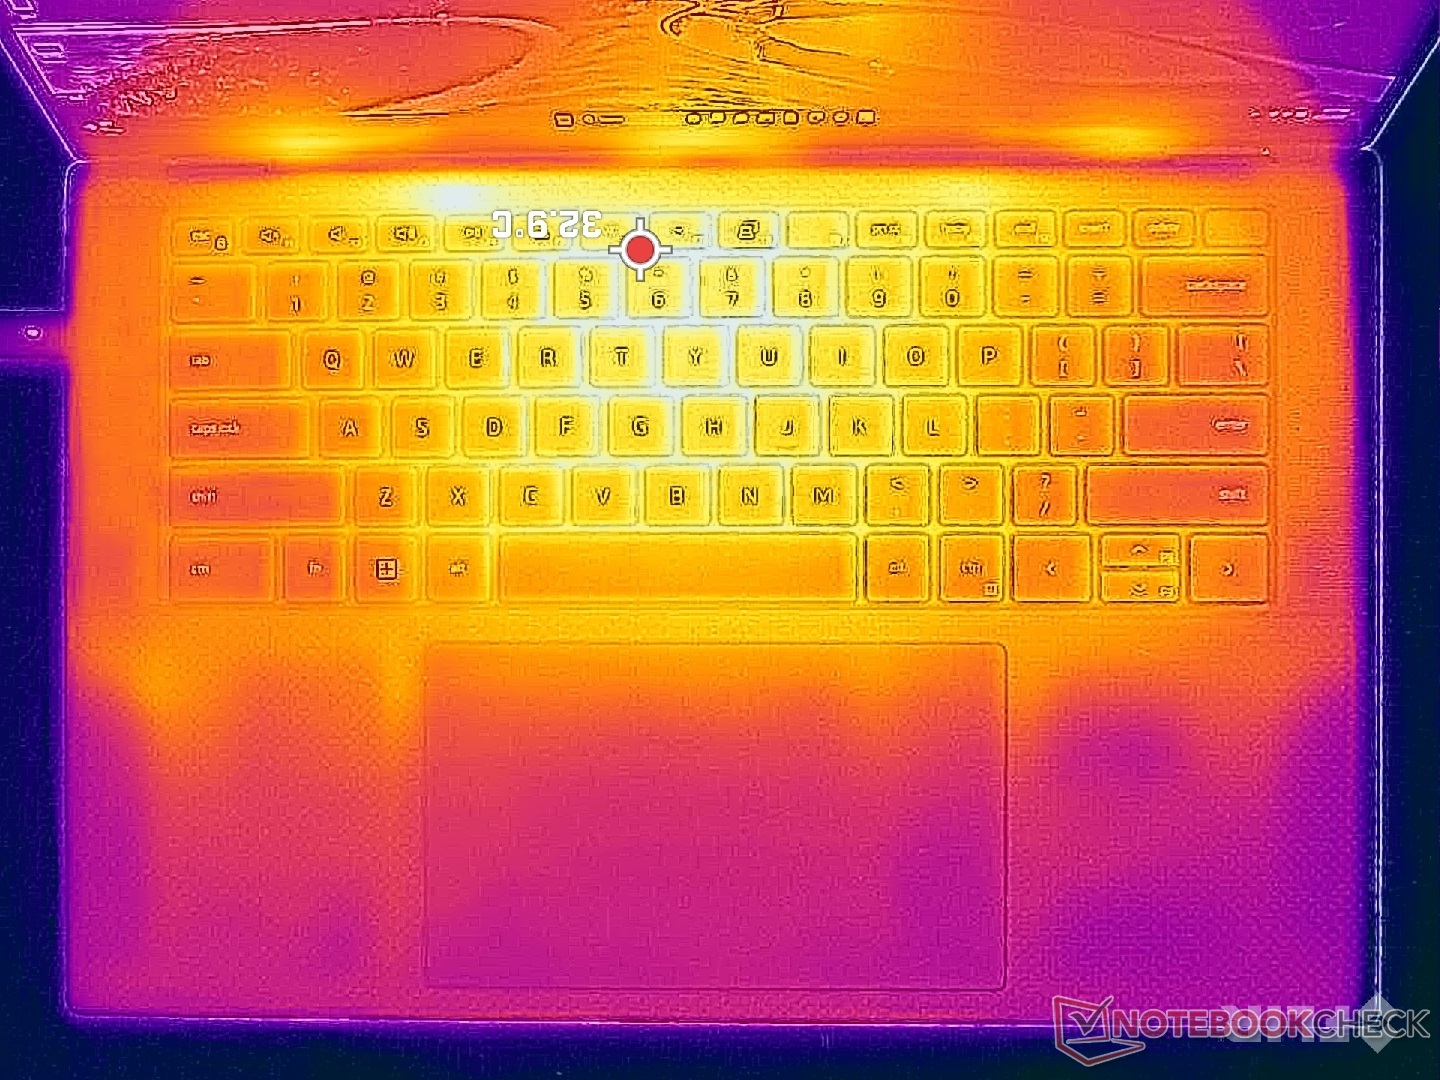
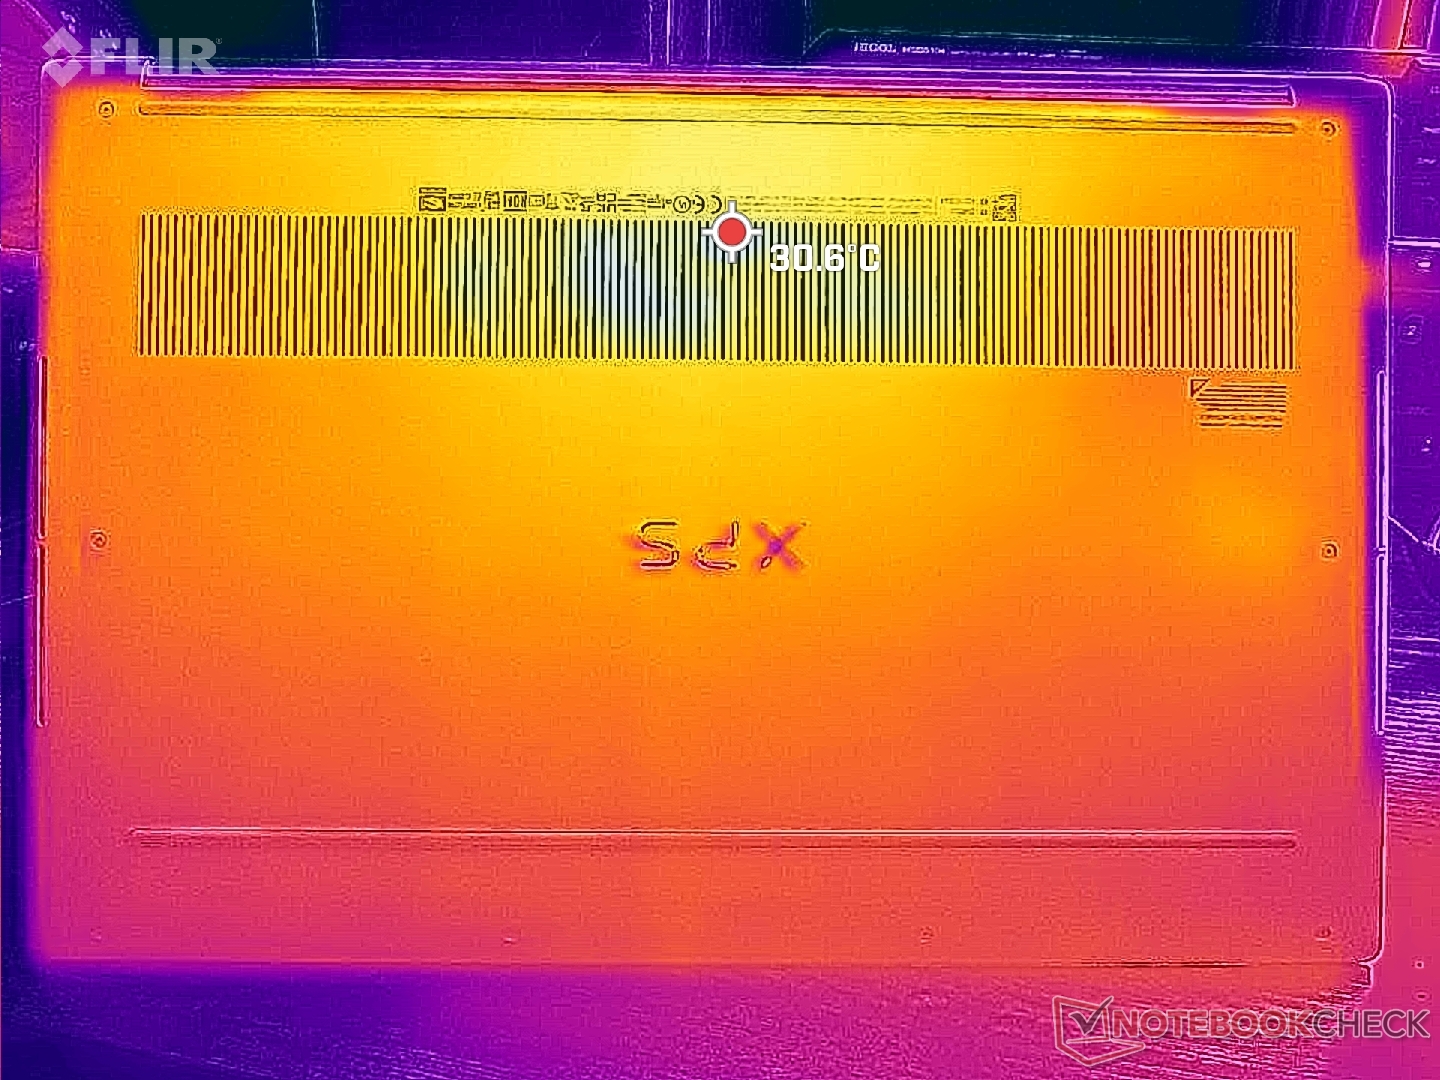
De oppervlaktetemperaturen zijn relatief warm, rond de 30 C, zelfs als hij gewoon stationair draait op de desktop, vanwege de hoge vermogensdichtheid van het dunne chassis. Dit is echter niet anders dan bij het model van vorig jaar, aangezien de vermogensomvang ongeveer hetzelfde is gebleven. De huidtemperatuur kan onaangenaam warm aanvoelen bij 45 C aan de onderkant van het chassis bij het draaien van veeleisende belastingen zoals games.
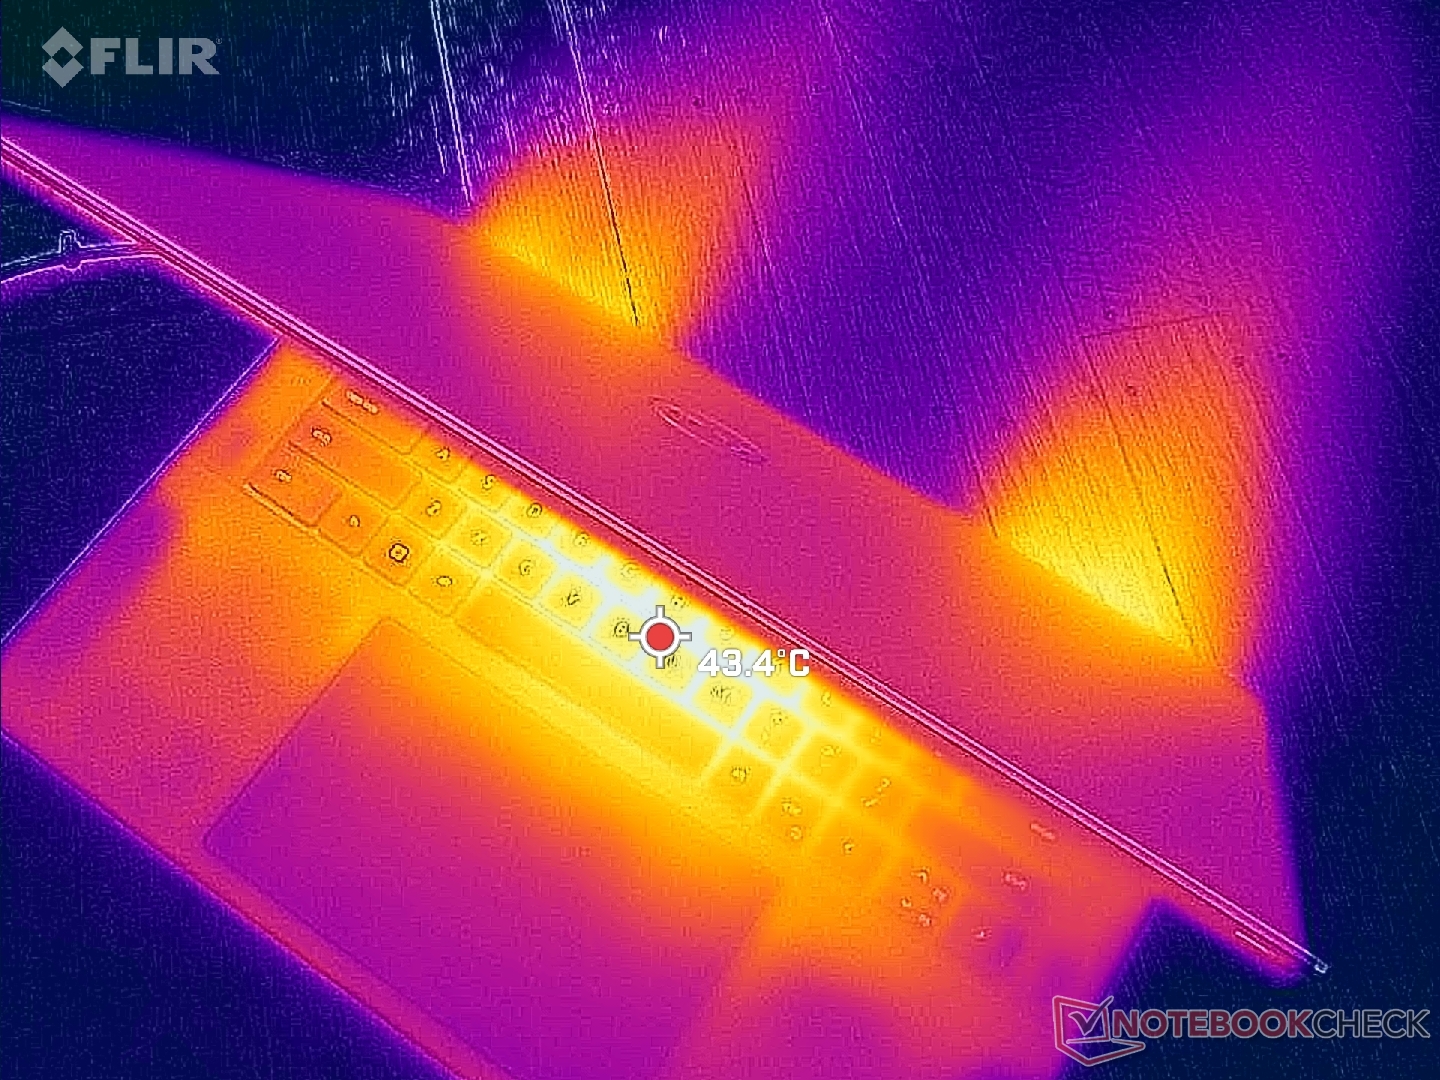
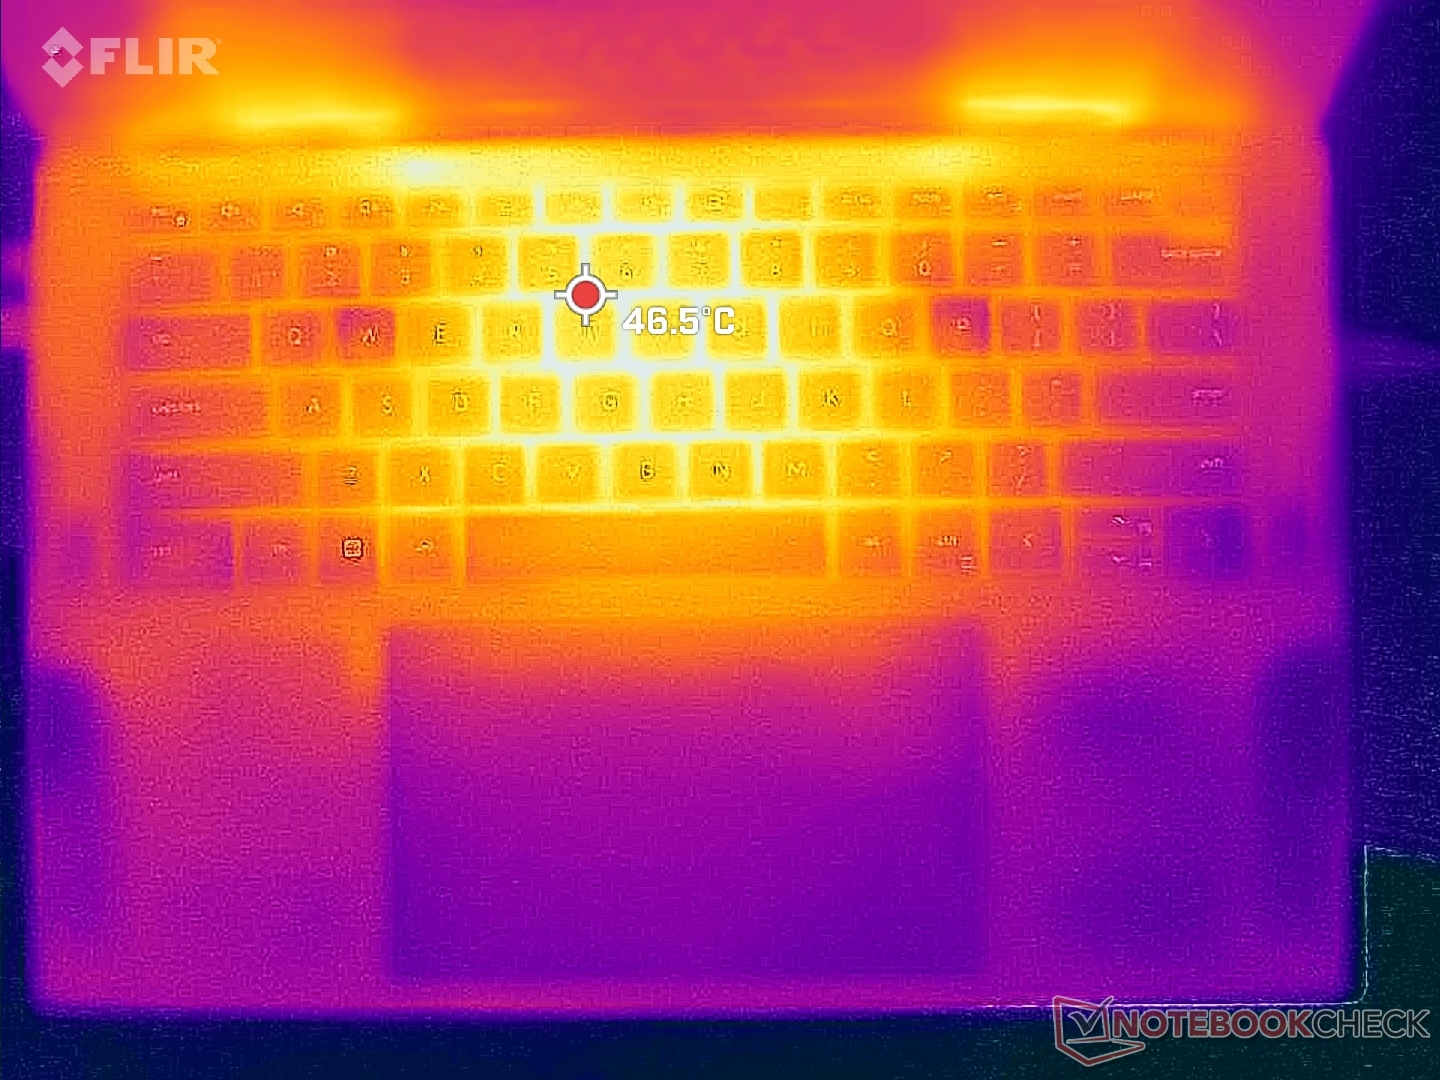
(-) De maximumtemperatuur aan de bovenzijde bedraagt 45.6 °C / 114 F, vergeleken met het gemiddelde van 36.8 °C / 98 F, variërend van 21 tot 71 °C voor de klasse Multimedia.
(±) De bodem warmt op tot een maximum van 42 °C / 108 F, vergeleken met een gemiddelde van 39.1 °C / 102 F
(+) Bij onbelast gebruik bedraagt de gemiddelde temperatuur voor de bovenzijde 31.1 °C / 88 F, vergeleken met het apparaatgemiddelde van 31.3 °C / 88 F.
(±) Bij het spelen van The Witcher 3 is de gemiddelde temperatuur voor de bovenzijde 37.2 °C / 99 F, vergeleken met het apparaatgemiddelde van 31.3 °C / 88 F.
(+) De palmsteunen en het touchpad zijn met een maximum van ###max## °C / 87.1 F koeler dan de huidtemperatuur en voelen daarom koel aan.
(±) De gemiddelde temperatuur van de handpalmsteun van soortgelijke toestellen bedroeg 28.7 °C / 83.7 F (-1.9 °C / -3.4 F).
| Dell XPS 15 9530 RTX 4070 Intel Core i7-13700H, NVIDIA GeForce RTX 4070 Laptop GPU | Dell XPS 15 9520 RTX 3050 Ti Intel Core i7-12700H, NVIDIA GeForce RTX 3050 Ti Laptop GPU | Dell XPS 15 9500 Core i7 4K UHD Intel Core i7-10875H, NVIDIA GeForce GTX 1650 Ti Mobile | Asus Zenbook Pro 15 OLED UM535Q AMD Ryzen 9 5900HX, NVIDIA GeForce RTX 3050 Ti Laptop GPU | MSI Prestige 15 A12UD-093 Intel Core i7-1280P, NVIDIA GeForce RTX 3050 Ti Laptop GPU | Gigabyte Aero 15 OLED XD Intel Core i7-11800H, NVIDIA GeForce RTX 3070 Laptop GPU | |
|---|---|---|---|---|---|---|
| Heat | -5% | -2% | -4% | -3% | -9% | |
| Maximum Upper Side * (°C) | 45.6 | 51.4 -13% | 44 4% | 36 21% | 49 -7% | 45 1% |
| Maximum Bottom * (°C) | 42 | 51 -21% | 48.8 -16% | 47.2 -12% | 52.6 -25% | 54 -29% |
| Idle Upper Side * (°C) | 34.4 | 30 13% | 33 4% | 37 -8% | 29.7 14% | 34 1% |
| Idle Bottom * (°C) | 33.2 | 33 1% | 32.4 2% | 39.2 -18% | 30.7 8% | 36 -8% |
* ... kleiner is beter
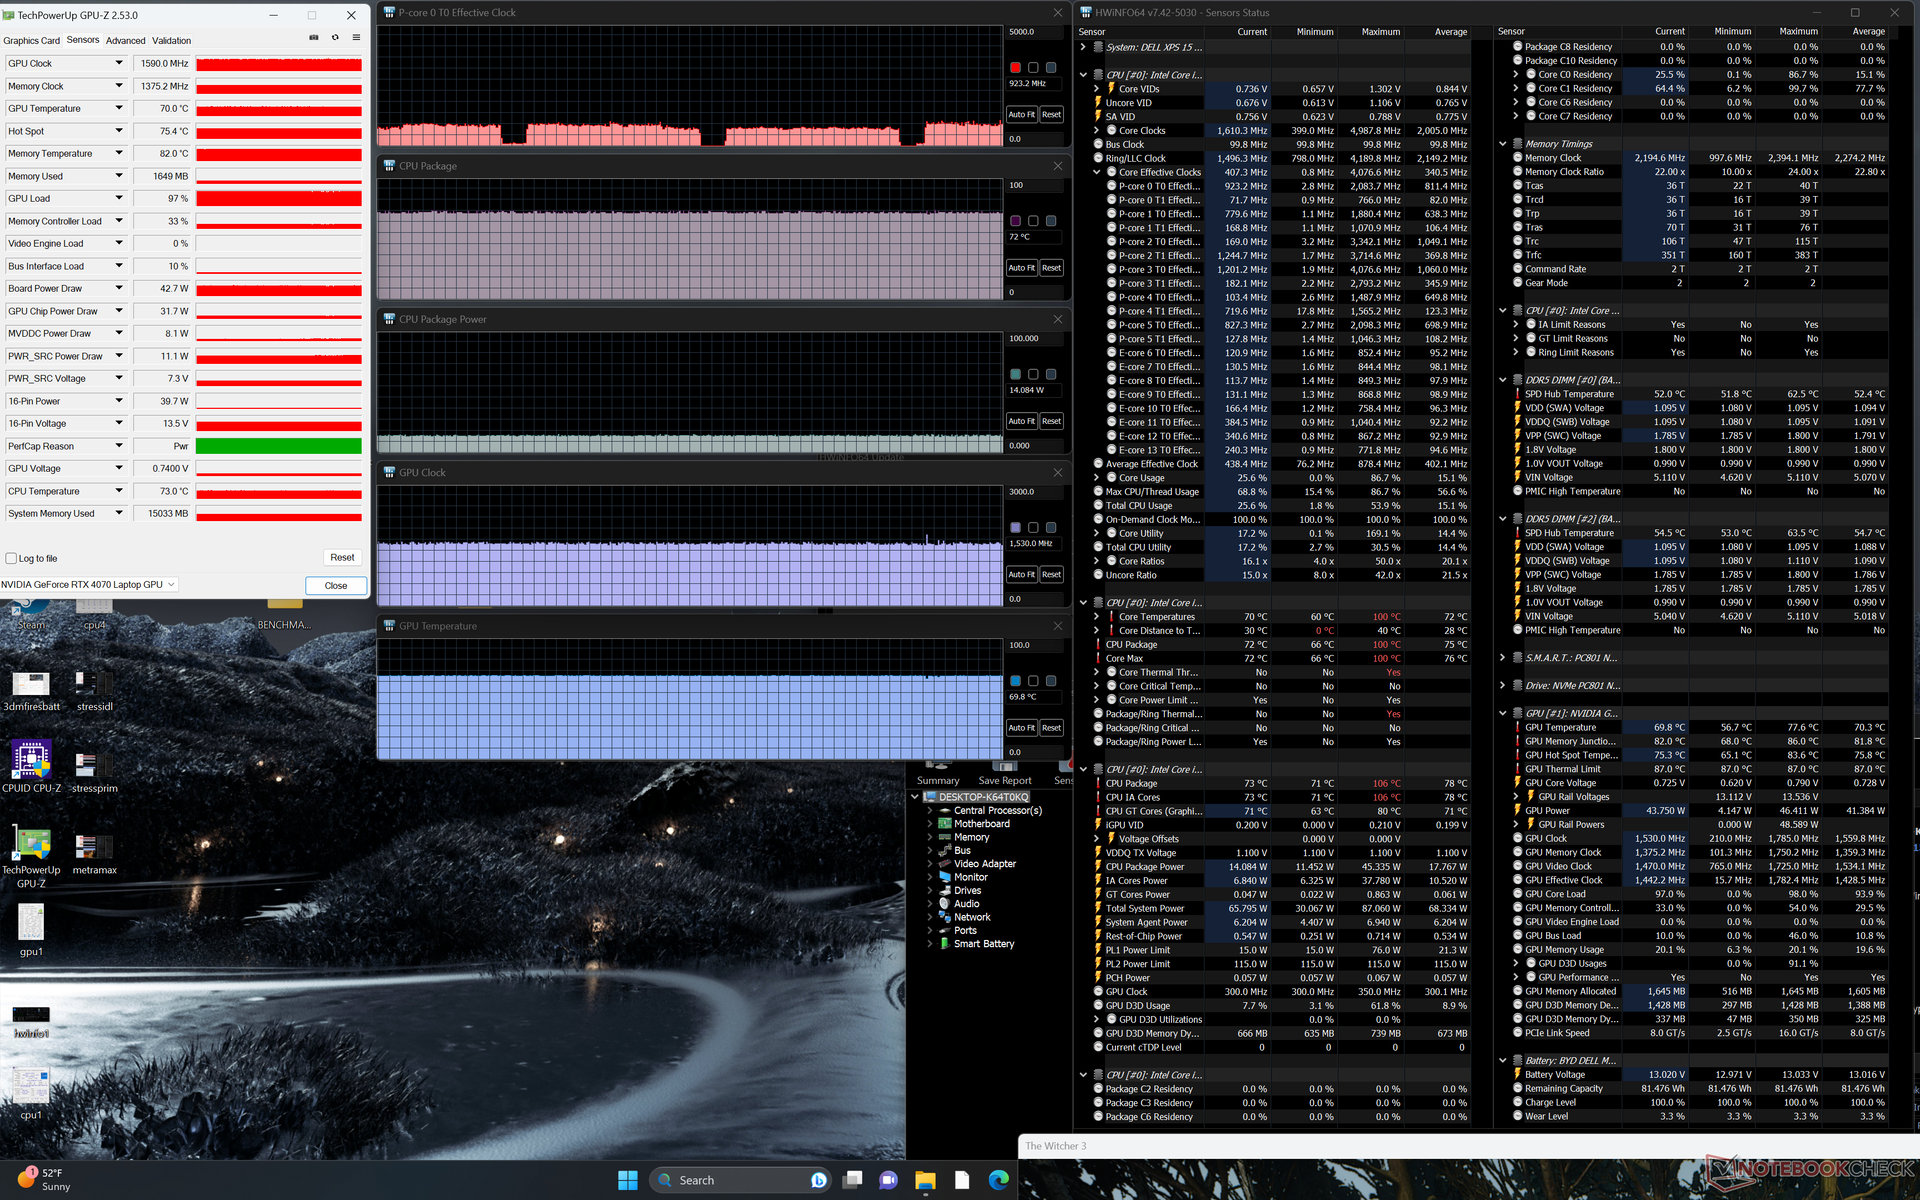
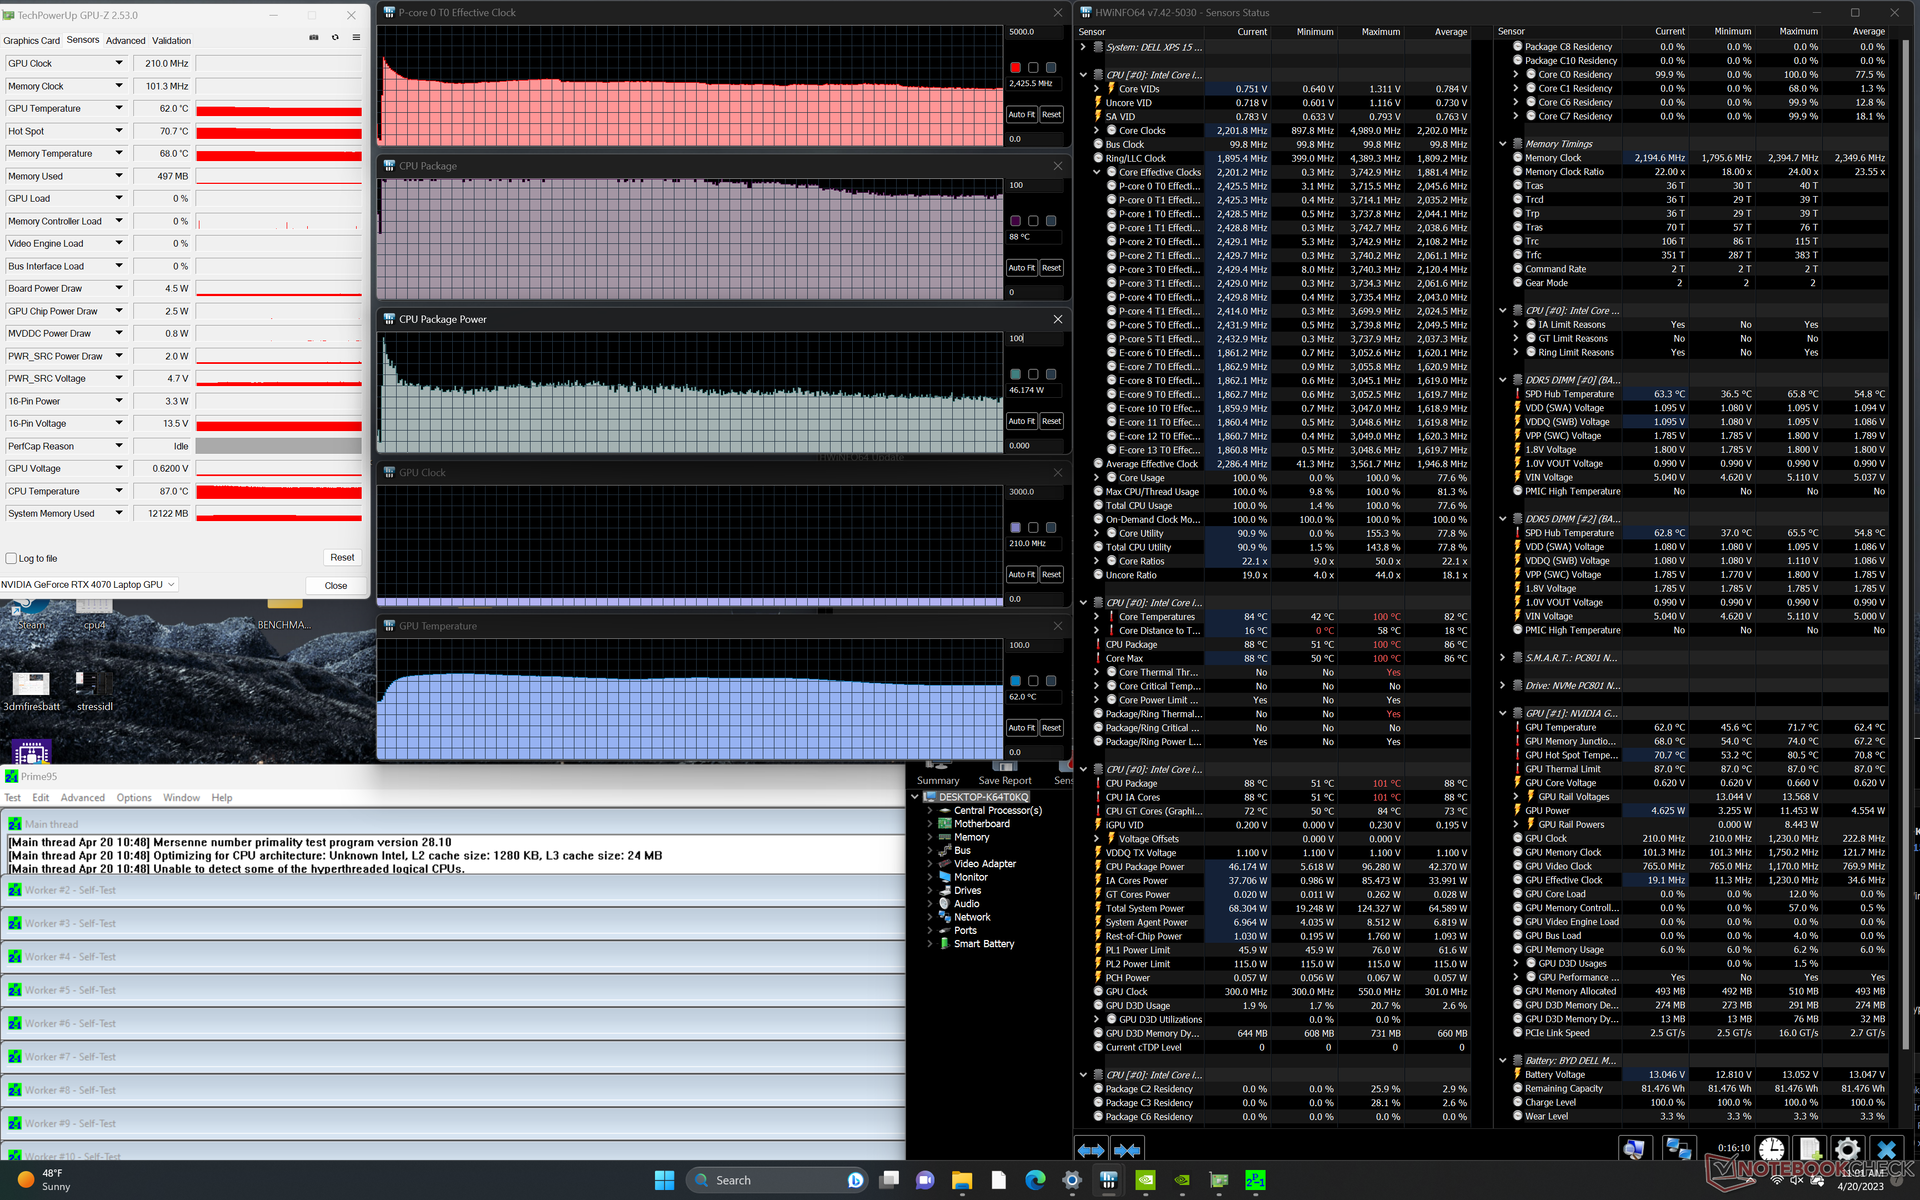
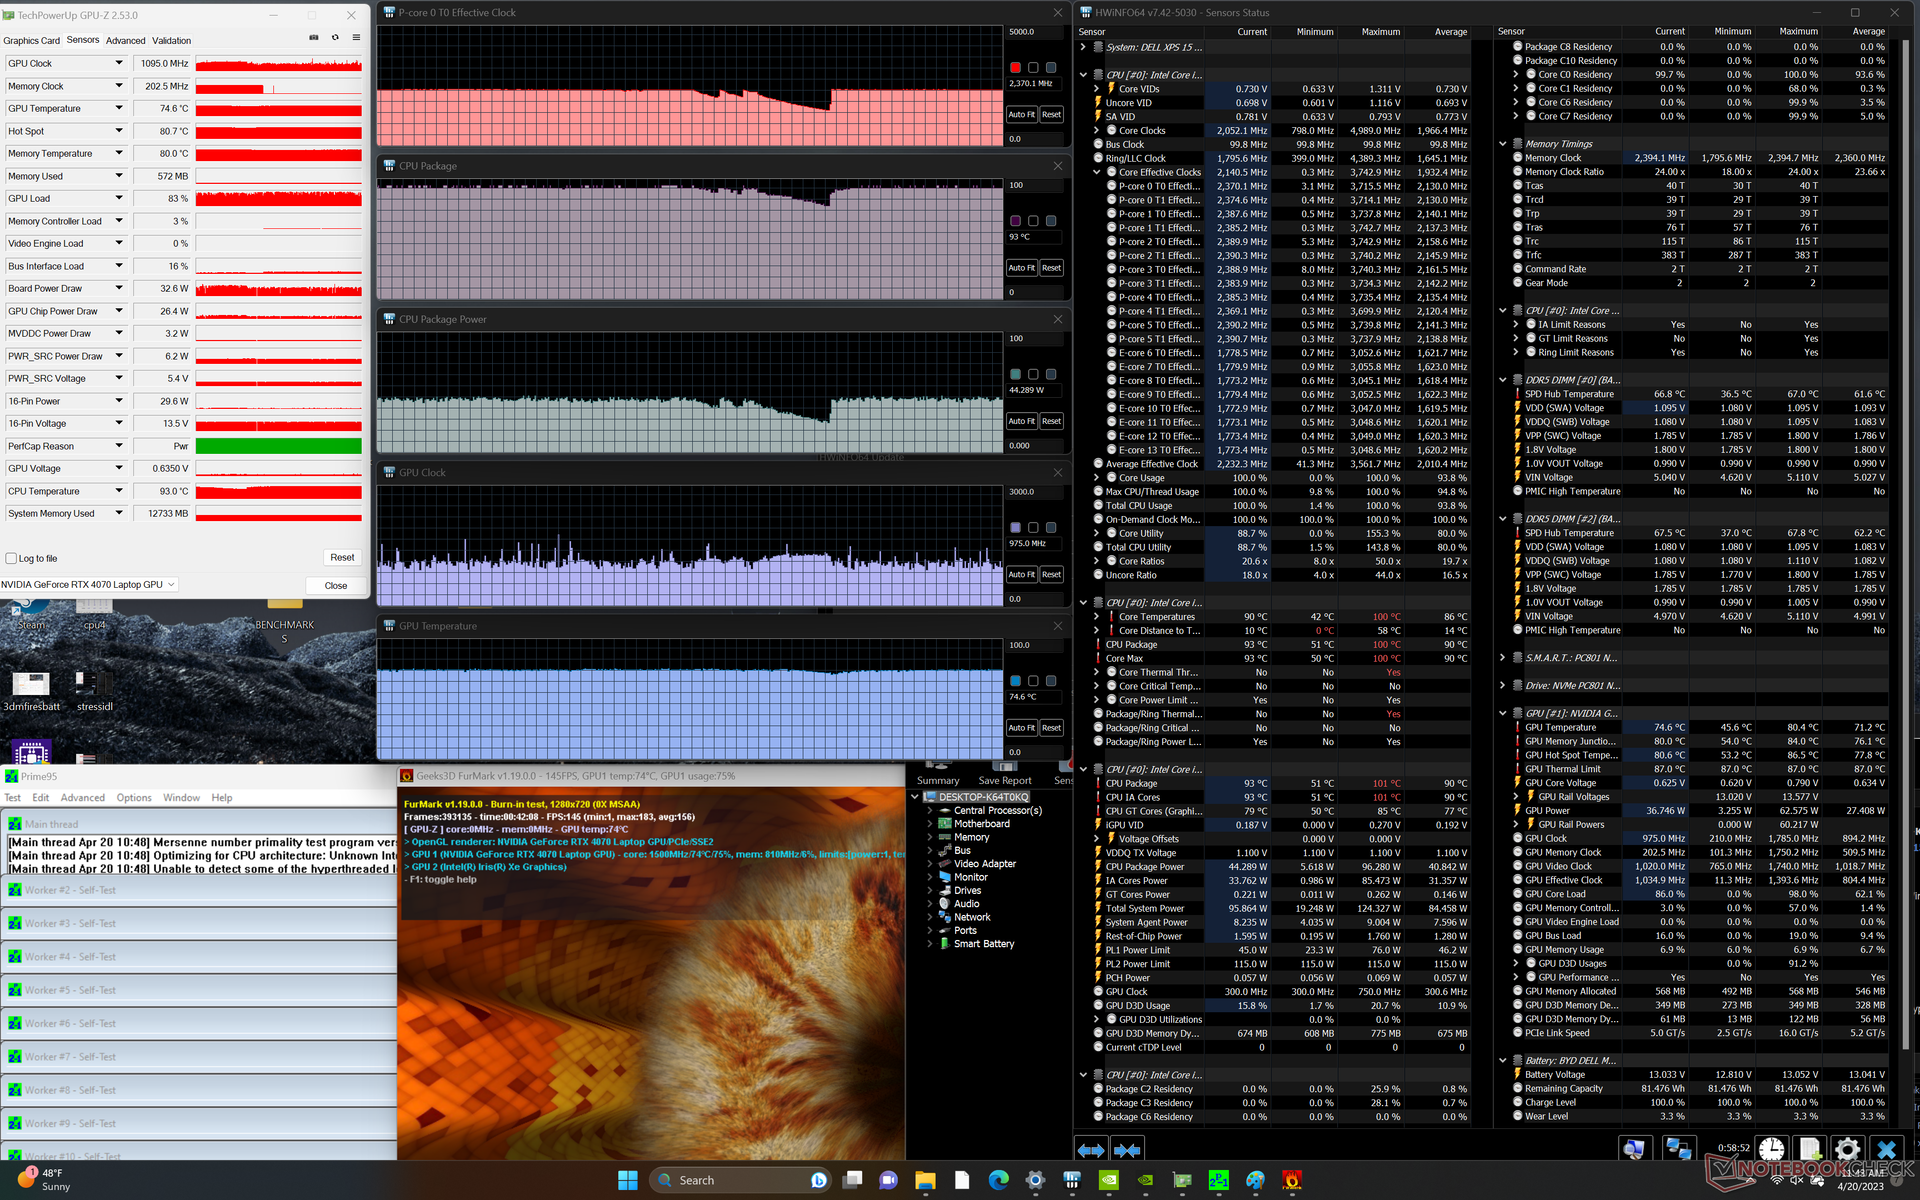
Stresstest - Hoge CPU-temperaturen
De CPU steeg naar 3,7 GHz en 96 W gedurende slechts een seconde of twee bij het starten van Prime95 stress. Dit zou gestaag dalen tot slechts 2,7 GHz en 55 W vanwege de zeer hoge kerntemperatuur van 88 tot 100 C wanneer de CPU volledig wordt belast. Ter vergelijking, het herhalen van dezelfde test op de AMD-aangedreven Asus Zenbook Pro 15 UM535Q zou resulteren in een koelere kerntemperatuur van slechts 76 C. De hoger dan gemiddelde kerntemperatuur op het Dell systeem is niet verrassend, want het is een gemeenschappelijk kenmerk van de XPS 15 serie. Upgraden naar de Core i9 configuratie kan dus in het beste geval slechts kleine voordelen opleveren, aangezien onze Core i7 configuratie al aan het plafond van 100 C zit.
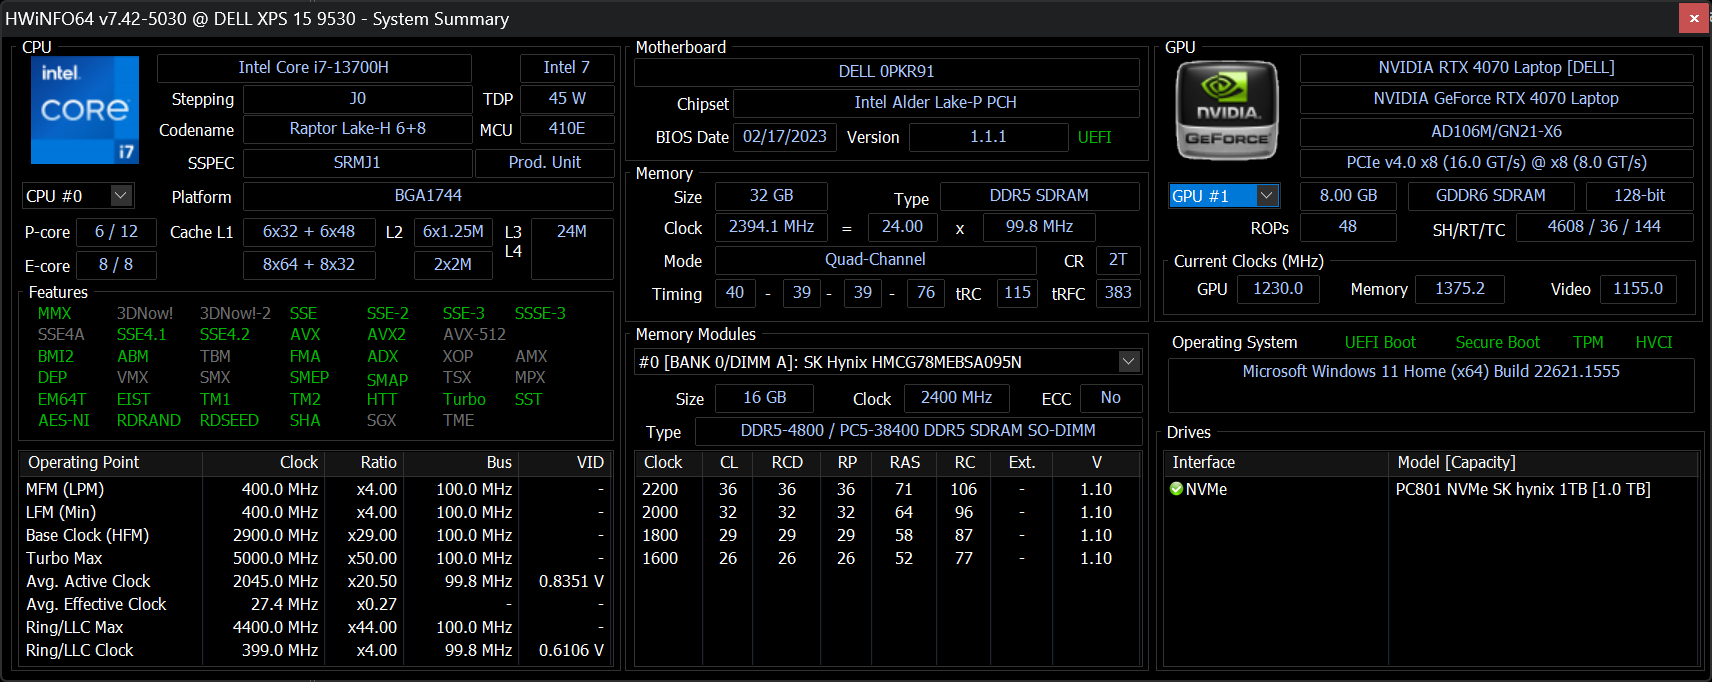
Bij het draaien Witcher 3 om typische gaming belastingen te vertegenwoordigen, zou de GPU stabiliseren op 1590 MHz kern, 1375 MHz geheugen, 70 C, en 43 W tegen een 50 W doel. Bij herhaling van deze test op de grotereUniwill GM6PX7X IDX met een krachtigere 130 W RTX 4070 zou resulteren in een stabiele kernklok, geheugenklok, temperatuur en GPU-vermogen van respectievelijk 2370 MHz, 2125 MHz, 73 C en 100 W. Het prestatieverschil tussen de 50 W en 100+ W RTX 4070 is heel duidelijk in dit voorbeeld.
Verrassend genoeg heeft het draaien op batterijvoeding geen invloed op de prestaties, wat zeldzaam is voor een GeForce RTX-aangedreven laptop. Een 3DMark 11 test op batterijen levert Physics en Graphic scores op van respectievelijk 20751 en 24569 punten, vergeleken met 18112 en 24229 punten wanneer de laptop op netstroom werkt.
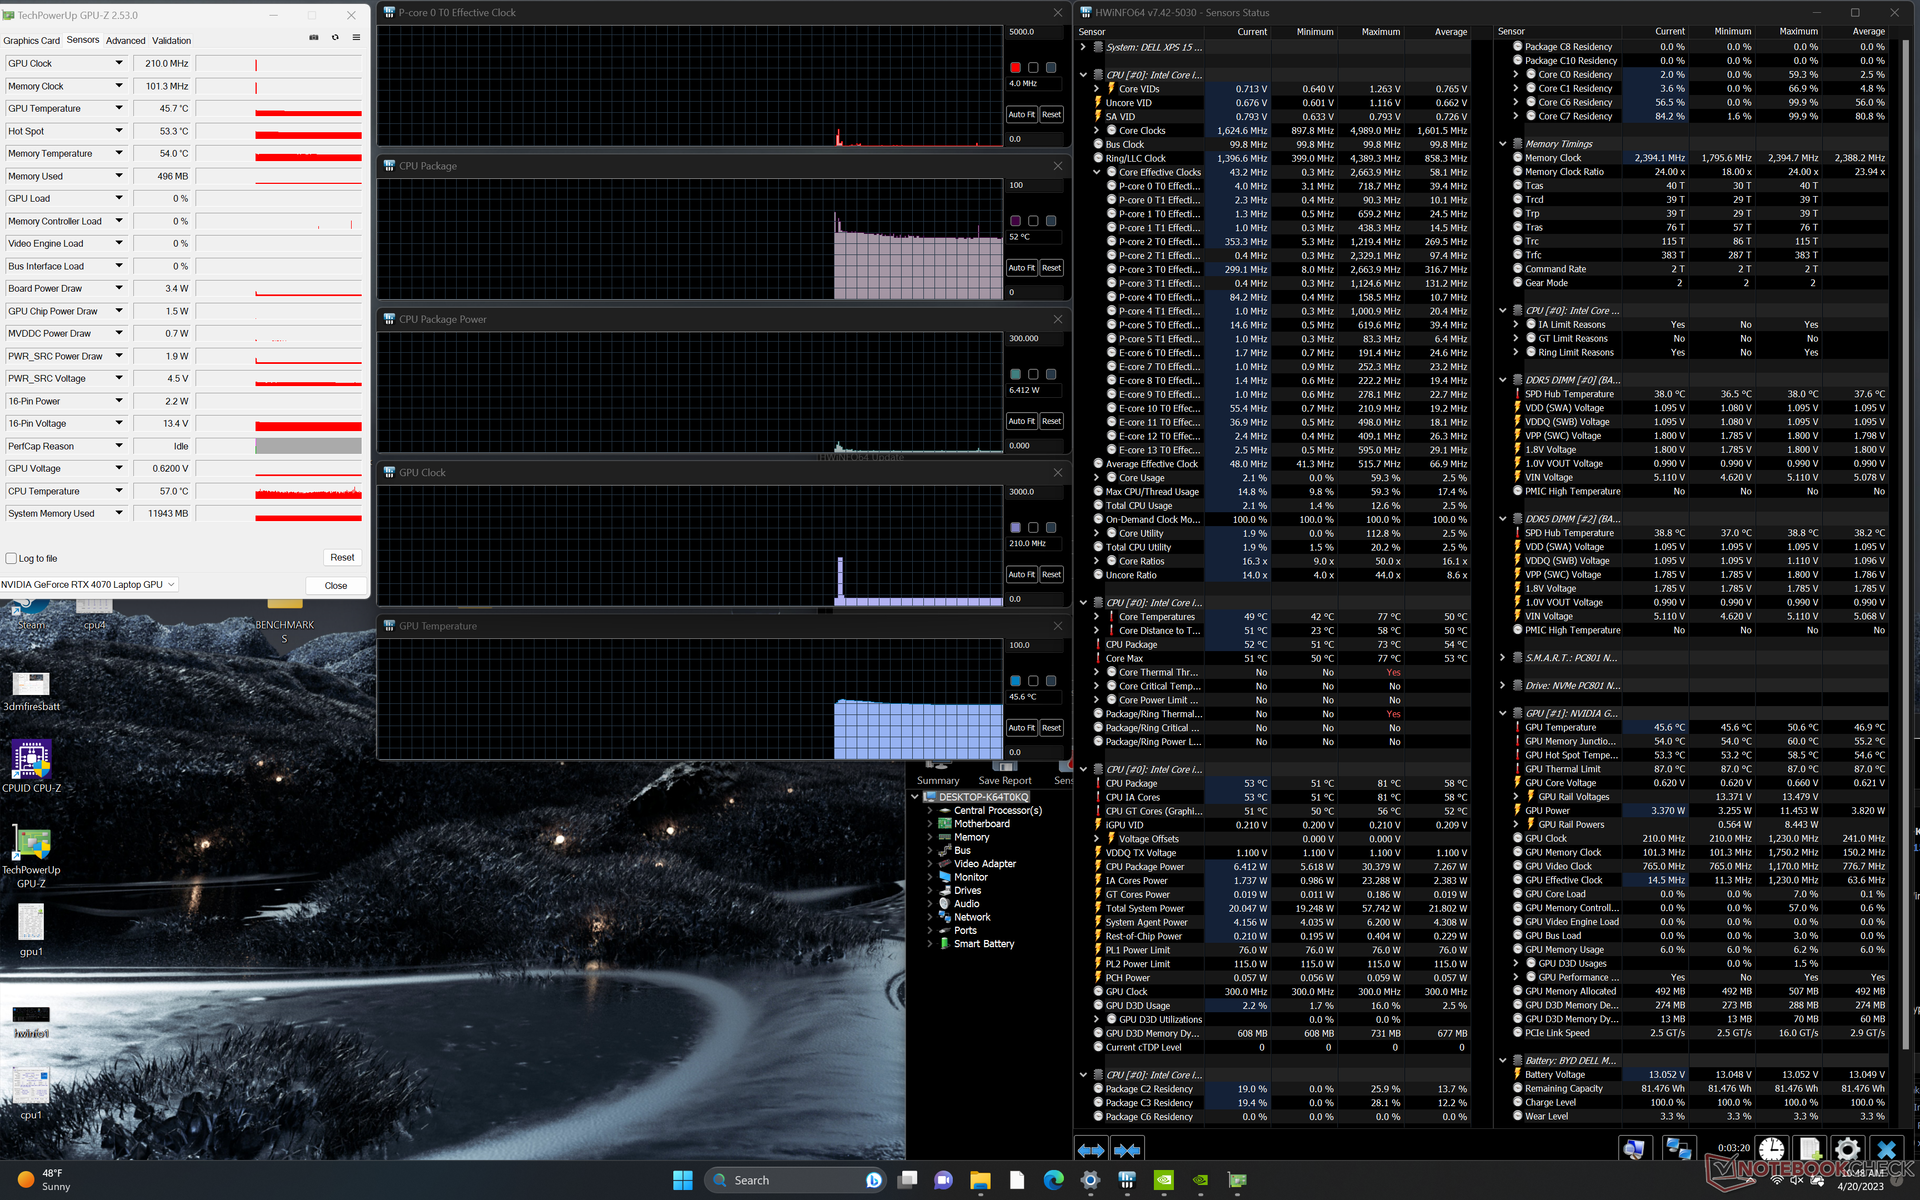
| CPU-klok (GHz) | GPU-klok (MHz) | Gemiddelde CPU-temperatuur (°C) | Gemiddelde GPU-temperatuur (°C) | |
| Systeem Idle | -- | -- | 52 | 46 |
| Prime95 Stress | 2.4 | -- | 88 | 62 |
| Prime95 + FurMark Stress | 2.4 | ~1095 | 93 | 75 |
| Witcher 3 Stress | ~0.9 | 1590 | 72 | 70 |
Luidsprekers
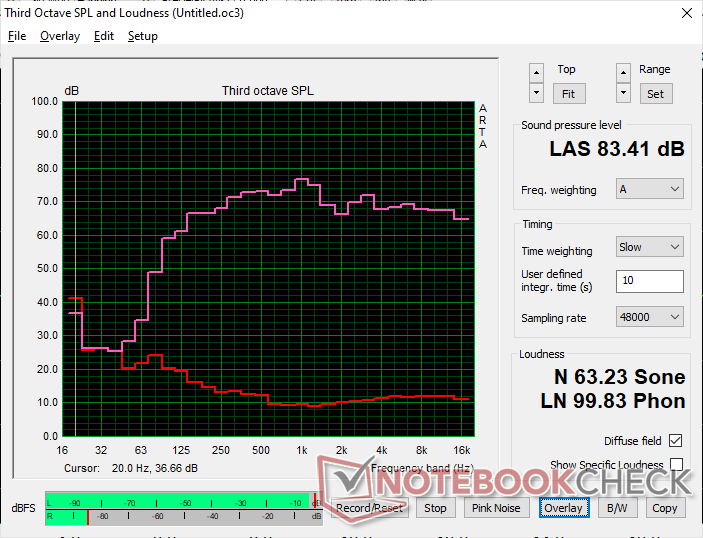
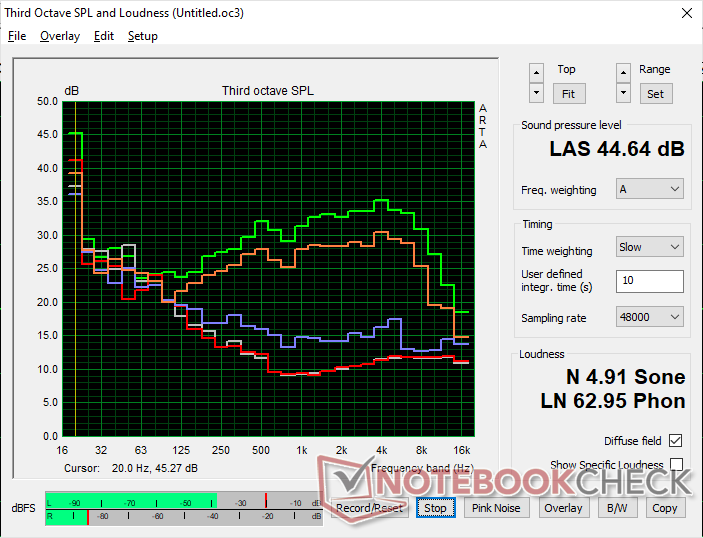
Dell XPS 15 9530 RTX 4070 audioanalyse
(+) | luidsprekers kunnen relatief luid spelen (83.4 dB)
Bas 100 - 315 Hz
(+) | goede baars - slechts 3.9% verwijderd van de mediaan
(+) | de lage tonen zijn lineair (6.8% delta naar de vorige frequentie)
Midden 400 - 2000 Hz
(+) | evenwichtige middens - slechts 4.4% verwijderd van de mediaan
(+) | de middentonen zijn lineair (4.1% delta ten opzichte van de vorige frequentie)
Hoog 2 - 16 kHz
(+) | evenwichtige hoogtepunten - slechts 1.1% verwijderd van de mediaan
(+) | de hoge tonen zijn lineair (3.3% delta naar de vorige frequentie)
Algemeen 100 - 16.000 Hz
(+) | het totale geluid is lineair (6.4% verschil met de mediaan)
Vergeleken met dezelfde klasse
» 4% van alle geteste apparaten in deze klasse waren beter, 1% vergelijkbaar, 95% slechter
» De beste had een delta van 5%, het gemiddelde was 17%, de slechtste was 45%
Vergeleken met alle geteste toestellen
» 1% van alle geteste apparaten waren beter, 0% gelijk, 99% slechter
» De beste had een delta van 4%, het gemiddelde was 23%, de slechtste was 134%
Apple MacBook Pro 16 2021 M1 Pro audioanalyse
(+) | luidsprekers kunnen relatief luid spelen (84.7 dB)
Bas 100 - 315 Hz
(+) | goede baars - slechts 3.8% verwijderd van de mediaan
(+) | de lage tonen zijn lineair (5.2% delta naar de vorige frequentie)
Midden 400 - 2000 Hz
(+) | evenwichtige middens - slechts 1.3% verwijderd van de mediaan
(+) | de middentonen zijn lineair (2.1% delta ten opzichte van de vorige frequentie)
Hoog 2 - 16 kHz
(+) | evenwichtige hoogtepunten - slechts 1.9% verwijderd van de mediaan
(+) | de hoge tonen zijn lineair (2.7% delta naar de vorige frequentie)
Algemeen 100 - 16.000 Hz
(+) | het totale geluid is lineair (4.6% verschil met de mediaan)
Vergeleken met dezelfde klasse
» 0% van alle geteste apparaten in deze klasse waren beter, 0% vergelijkbaar, 100% slechter
» De beste had een delta van 5%, het gemiddelde was 17%, de slechtste was 45%
Vergeleken met alle geteste toestellen
» 0% van alle geteste apparaten waren beter, 0% gelijk, 100% slechter
» De beste had een delta van 4%, het gemiddelde was 23%, de slechtste was 134%
Energiebeheer - Core H en GeForce RTX op USB-C
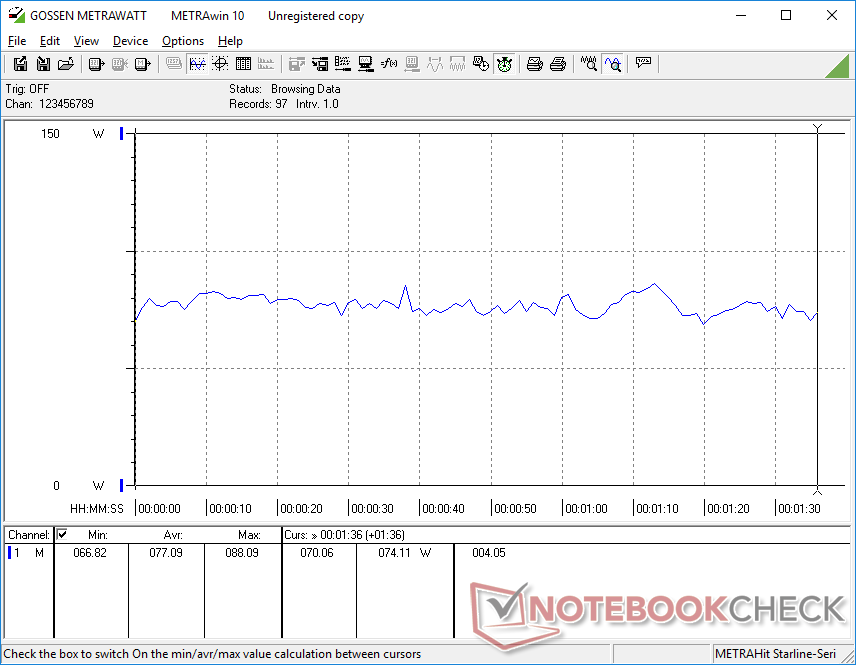
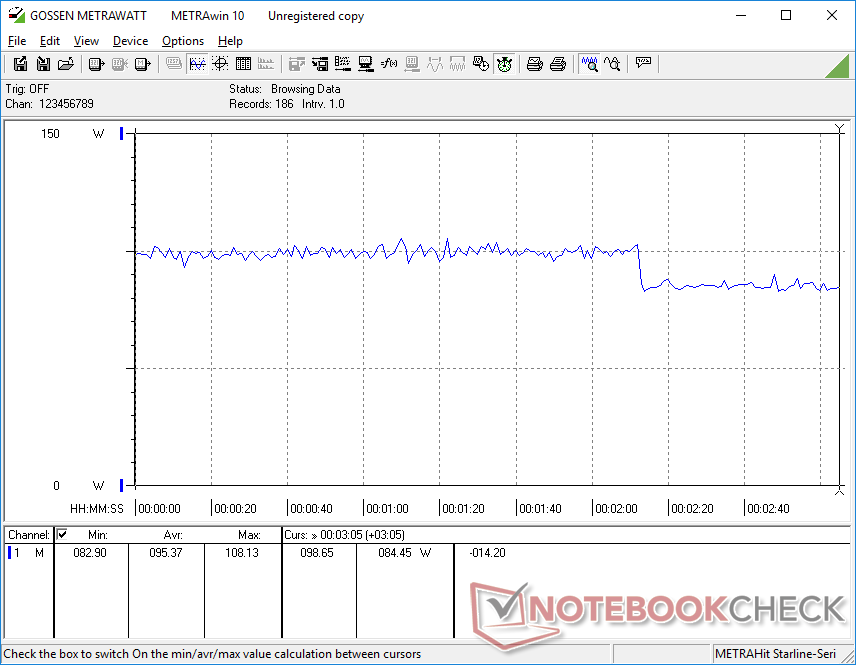
Stroomverbruik
Het stroomverbruik is over het algemeen hoger in vergelijking met het model van vorig jaar. Als de XPS 15 9530 bijvoorbeeld stationair draait op de laagste instellingen, verbruikt hij ongeveer 20 W, vergeleken met slechts 5 tot 6 W op de oudere XPS 15 9520. Bij gaming zou het verbruik ongeveer 25 procent hoger liggen, wat betekent dat de extra prestaties ten opzichte van de oudere RTX 3050 Ti niet helemaal gratis zijn.
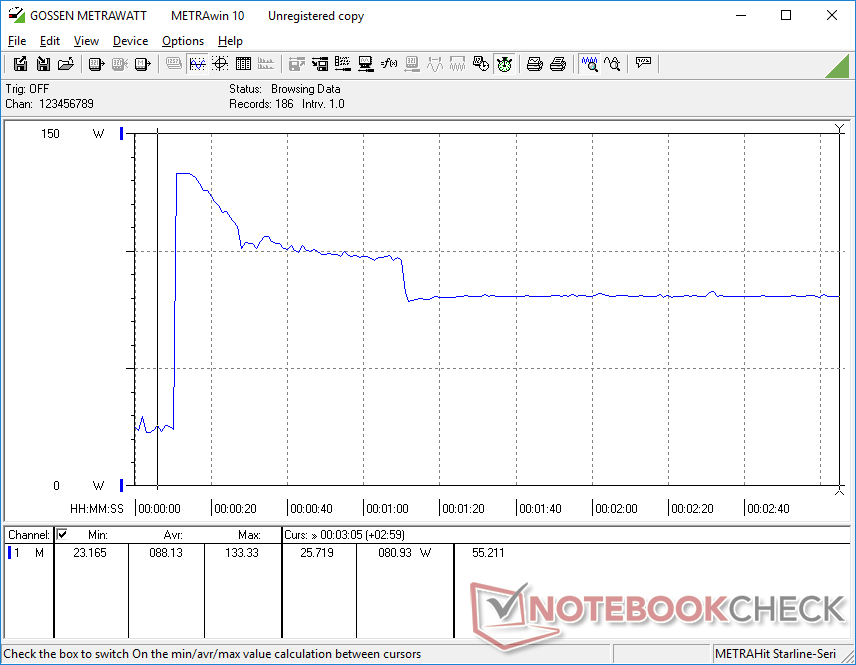
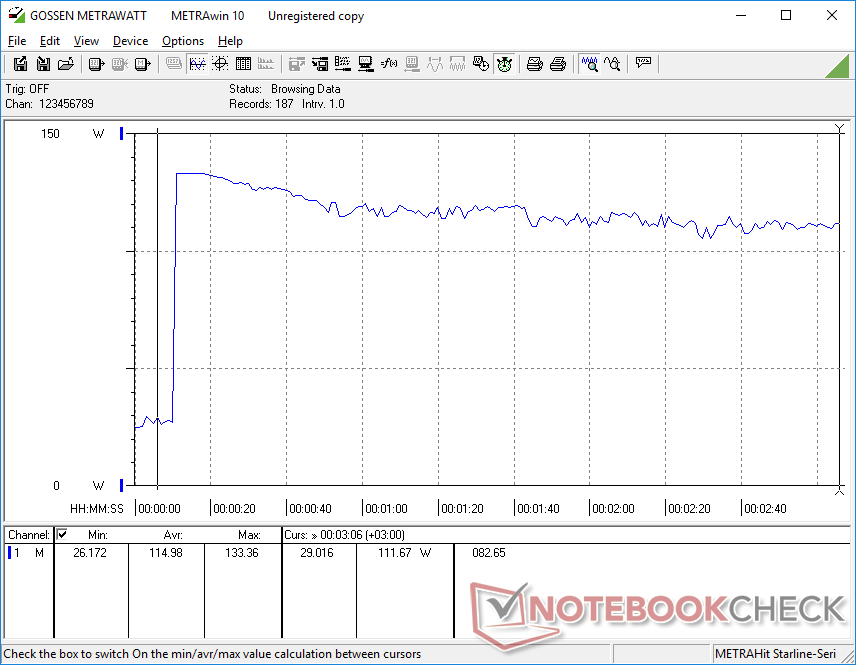
We zijn in staat om een tijdelijke maximale opname van 133 W uit de klein-medium (~14,3 x 6,6 x 2,2 cm) 130 W AC-adapter op te nemen. De XPS 15 is een van de eerste laptops met zowel een Core H-serie CPU als een GeForce RTX 4070 GPU die uitsluitend via USB-C wordt gevoed. Dit heeft zeker zijn voordelen in termen van draagbaarheid en veelzijdigheid, maar prestaties en opladen kunnen een klap krijgen door het beperkte vermogen. Opladen van leeg naar vol is bijvoorbeeld langzamer dan normaal met ongeveer 2,5 uur en dit zal nog langzamer zijn als veeleisende belastingen tegelijkertijd worden uitgevoerd.
Gelukkig loopt de batterij niet langzaam leeg tijdens het gamen of het uitvoeren van veeleisende belastingen, in tegenstelling tot wat we zagen op oudere XPS 17 modellen.
| Uit / Standby | |
| Inactief | |
| Belasting |
|
Key:
min: | |
| Dell XPS 15 9530 RTX 4070 i7-13700H, GeForce RTX 4070 Laptop GPU, SK hynix PC801 HFS001TEJ9X101N, OLED, 3456x2160, 15.6" | Dell XPS 15 9520 RTX 3050 Ti i7-12700H, GeForce RTX 3050 Ti Laptop GPU, WDC PC SN810 512GB, OLED, 3456x2160, 15.6" | Dell XPS 15 9500 Core i7 4K UHD i7-10875H, GeForce GTX 1650 Ti Mobile, SK Hynix PC611 512GB, IPS, 3840x2400, 15.6" | Asus Zenbook Pro 15 OLED UM535Q R9 5900HX, GeForce RTX 3050 Ti Laptop GPU, WDC PC SN730 SDBPNTY-1T00, OLED, 1920x1080, 15.6" | MSI Prestige 15 A12UD-093 i7-1280P, GeForce RTX 3050 Ti Laptop GPU, Micron 3400 1TB MTFDKBA1T0TFH, IPS, 3840x2160, 15.6" | Gigabyte Aero 15 OLED XD i7-11800H, GeForce RTX 3070 Laptop GPU, Samsung PM9A1 MZVL21T0HCLR, OLED, 3840x2160, 15.6" | |
|---|---|---|---|---|---|---|
| Power Consumption | 28% | 12% | 34% | 51% | -39% | |
| Idle Minimum * (Watt) | 20 | 5.5 72% | 5.7 71% | 5.5 72% | 5.4 73% | 23 -15% |
| Idle Average * (Watt) | 20.7 | 7.2 65% | 13.5 35% | 7.4 64% | 11.8 43% | 26 -26% |
| Idle Maximum * (Watt) | 22.4 | 16 29% | 19.6 12% | 14.9 33% | 12.7 43% | 34 -52% |
| Load Average * (Watt) | 77.1 | 91.8 -19% | 114.1 -48% | 78.2 -1% | 45.9 40% | 99 -28% |
| Witcher 3 ultra * (Watt) | 95.4 | 74.6 22% | 93 3% | 80.1 16% | 45.7 52% | 163 -71% |
| Load Maximum * (Watt) | 133.4 | 134.7 -1% | 135.2 -1% | 110.9 17% | 63 53% | 190 -42% |
* ... kleiner is beter
Power Consumption Witcher 3 / Stresstest
Power Consumption external Monitor
Batterijduur - iets korter, maar niet slecht
Runtimes zijn over het algemeen korter dan op het model van vorig jaar, wat niet verrassend is aangezien de 13e generatie Intel CPU en GeForce 40 GPU onder vergelijkbare energie enveloppen zitten als hun respectievelijke voorgangers. We zijn in staat om 8 uur echt WLAN-gebruik te registreren, oftewel 40 minuten korter dan op de 2022 XPS 15. Het is nog steeds goed, ook al is het iets korter dan concurrerende modellen zoals de Asus Zenbook Pro 15.
De accuduur kan worden verlengd door donkere kleuren weer te geven in plaats van wit op de OLED-configuratie, zoals beschreven hier. We verwachten dat de IPS SKU met een lagere resolutie langere looptijden biedt dan wat we hier hebben opgenomen.
| Dell XPS 15 9530 RTX 4070 i7-13700H, GeForce RTX 4070 Laptop GPU, 86 Wh | Dell XPS 15 9520 RTX 3050 Ti i7-12700H, GeForce RTX 3050 Ti Laptop GPU, 86 Wh | Dell XPS 15 9500 Core i7 4K UHD i7-10875H, GeForce GTX 1650 Ti Mobile, 86 Wh | Asus Zenbook Pro 15 OLED UM535Q R9 5900HX, GeForce RTX 3050 Ti Laptop GPU, 96 Wh | MSI Prestige 15 A12UD-093 i7-1280P, GeForce RTX 3050 Ti Laptop GPU, 80 Wh | Gigabyte Aero 15 OLED XD i7-11800H, GeForce RTX 3070 Laptop GPU, 99 Wh | |
|---|---|---|---|---|---|---|
| Batterijduur | 51% | 49% | 109% | 2% | 6% | |
| Reader / Idle (h) | 11.5 | 14.8 29% | 23 100% | 26.2 128% | ||
| WiFi v1.3 (h) | 8 | 8.8 10% | 9.1 14% | 12.8 60% | 8.9 11% | 8.5 6% |
| Load (h) | 1.5 | 3.2 113% | 2 33% | 3.6 140% | 1.4 -7% | |
| H.264 (h) | 7.1 | |||||
| Witcher 3 ultra (h) | 2.2 |
Pro
Contra
Verdict - Prestaties opofferen voor slankheid
De Core i7-13700H en GeForce RTX 4070 zijn doorgaans voorbehouden aan grotere gaming laptops zoals deAsus ROG Strix G18 ofAorus 15X ASF elk met omvangrijke 200+ W power bricks. Ze in energiezuinige dunnere ontwerpen zoals de XPS 15 proppen kan zeker werken, maar de prestaties krijgen onvermijdelijk een flinke klap. In dit geval is TGP met de helft of meer verminderd voor slechte prestaties per dollar. Als u van plan bent om zowel grafische editors als games te draaien, dan is een dedicated gaming machine zoals de Alienware x15 onze XPS 15 ruimschoots overtreffen, zelfs met dezelfde CPU en GPU.
De prestatievermindering bij het draaien van grafische editors is niet zo ernstig als de vermindering van de gamingprestaties in vergelijking met grotere laptops met hogere TGP-doelstellingen. Dit komt grotendeels omdat zelfs een 50 W RTX 4070 hetzelfde aantal CUDA-kernen voor versnelling heeft als een 100+ W versie. De XPS 15 9530 blinkt daarom uit in content creatie met slechts af en toe gaming. Het is immers een Nvidia Studio laptop.
De XPS 15 9530 is de content creatie laptop om te bezitten als je prestaties in balans wilt brengen met draagbaarheid. Verwacht echter niet dat hij presteert zoals de meeste andere laptops met dezelfde GPU.
Er zijn genoeg veranderingen die we graag op toekomstige modellen zouden zien. Ten eerste zouden nieuwere schermopties met 90 Hz of 120 Hz verversingsfrequenties de gebruikerservaring aanzienlijk verbeteren. Ten tweede, de 720p webcam is abysmal, omdat het voelt ongewijzigd van zelfs een decennium geleden. Ten derde zou een herziene koeloplossing met mogelijk vloeibaar metaal de Turbo Boost-prestaties kunnen verhogen zonder dat het ontwerp dikker hoeft te worden. En tot slot, de DPC problemen, frame skips, en frame drops moeten zeker worden bekeken, vooral voor een vlaggenschip laptop gericht op content creatie. Er is veel leuks aan de XPS 15, vooral als je de MacBook Pro-achtige draagbaarheid waardeert, maar de processors binnenin ontgroeien het chassis en voelen daardoor wat beperkt aan.
Prijs en beschikbaarheid
De XPS 15 9530 is op het moment van schrijven nog niet algemeen verkrijgbaar via retailers. De beste kans om een model te bemachtigen is rechtstreeks via Dell. Prijzen beginnen bij $2250 USD voor de basisconfiguratie tot $4700 indien volledig geconfigureerd met maximale opslag en RAM.
Dell XPS 15 9530 RTX 4070
- 23-04-2023 v7 (old)
Allen Ngo
Transparantie
De selectie van te beoordelen apparaten wordt gemaakt door onze redactie. Het testexemplaar werd ten behoeve van deze beoordeling door de fabrikant of detailhandelaar in bruikleen aan de auteur verstrekt. De kredietverstrekker had geen invloed op deze recensie, noch ontving de fabrikant vóór publicatie een exemplaar van deze recensie. Er bestond geen verplichting om deze recensie te publiceren. Als onafhankelijk mediabedrijf is Notebookcheck niet onderworpen aan het gezag van fabrikanten, detailhandelaren of uitgevers.
[transparency_disclaimer]Dit is hoe Notebookcheck test
Elk jaar beoordeelt Notebookcheck onafhankelijk honderden laptops en smartphones met behulp van gestandaardiseerde procedures om ervoor te zorgen dat alle resultaten vergelijkbaar zijn. We hebben onze testmethoden al zo'n 20 jaar voortdurend ontwikkeld en daarbij de industriestandaard bepaald. In onze testlaboratoria wordt gebruik gemaakt van hoogwaardige meetapparatuur door ervaren technici en redacteuren. Deze tests omvatten een validatieproces in meerdere fasen. Ons complexe beoordelingssysteem is gebaseerd op honderden goed onderbouwde metingen en benchmarks, waardoor de objectiviteit behouden blijft. Meer informatie over onze testmethoden kunt u hier vinden.
Price comparison

