Dell Inspiron 14 Plus 7420 laptop review: Voor power users met een budget
Dell heeft voor 2022 drie afzonderlijke 14-inch Inspiron 14 7420-modellen geïntroduceerd: de standaard Inspiron 14 7420, Inspiron 14 7420 2-in-1, en Inspiron 14 7420 Plus. Deze review richt zich op het Plus-model, dat is voorzien van veel snellere Core H-serie processors en discrete Nvidia GeForce RTX graphics, bedoeld voor power users die ontevreden zijn over de gebruikelijke Core-U-serie Ultrabooks.
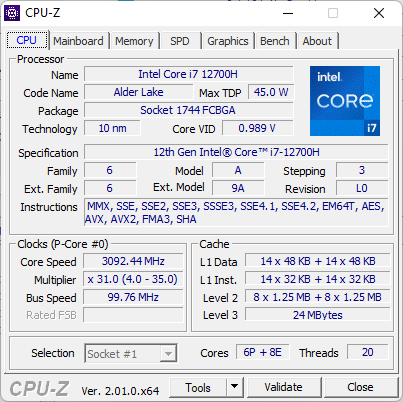
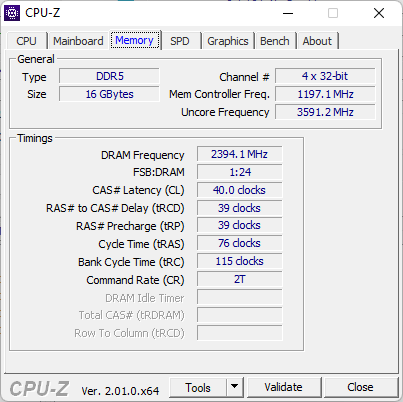
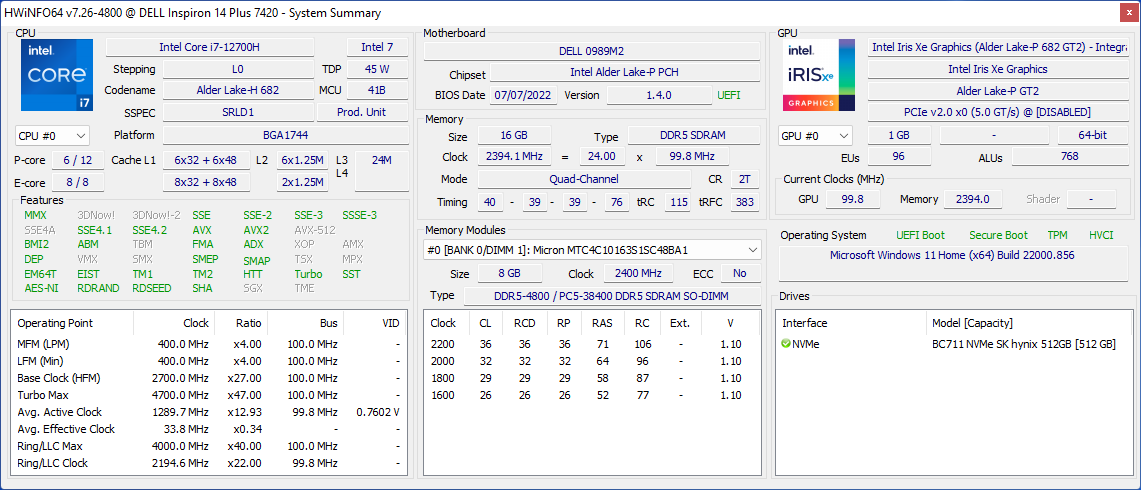
Onze specifieke review unit wordt geleverd met de Alder Lake-H Core i7-12700H CPU en GeForce RTX 3050 GPU voor ongeveer $1400 USD retail. Andere SKU's met de Core i5-12500H, RTX 3050 Ti of geïntegreerde graphics, en kleinere 54 Wh batterij zijn gepland, maar alle configuraties worden geleverd met dezelfde 2.2K 2240 x 1400 resolutie paneel.
Tot de concurrenten behoren andere krachtige 14-inch laptops zoals de Asus VivoBook Pro 14, HP Pavilion 14 Plus, Schenker Vision 14, HP Envy 14, of de Lenovo IdeaPad 5 Pro 14. De Razer Blade 14 en Asus Zephyrus G14 kunnen ook als alternatieven worden beschouwd, maar ze zijn aanzienlijk duurder.
Meer Dell beoordelingen:
Potentiële concurrenten in vergelijking
Evaluatie | Datum | Model | Gewicht | Hoogte | Formaat | Resolutie | Beste prijs |
|---|---|---|---|---|---|---|---|
| 87.2 % v7 (old) | 09-2022 | Dell Inspiron 14 Plus 7420 i7-12700H, GeForce RTX 3050 4GB Laptop GPU | 1.7 kg | 18.87 mm | 14.00" | 2240x1400 | |
| 86.3 % v7 (old) | 07-2022 | Asus Vivobook Pro 14 M3401QC-KM007T R5 5600H, GeForce RTX 3050 4GB Laptop GPU | 1.5 kg | 19 mm | 14.00" | 2880x1800 | |
| 83.7 % v7 (old) | 06-2022 | Dell Inspiron 14 7420 2-in-1 i7-1255U, Iris Xe G7 96EUs | 1.6 kg | 17.86 mm | 14.00" | 1920x1200 | |
| 87.7 % v7 (old) | 01-2022 | Schenker Vision 14 i7-11370H, GeForce RTX 3050 Ti Laptop GPU | 1.1 kg | 15.6 mm | 14.00" | 2880x1800 | |
v (old) | 10-2021 | Asus Zenbook 14X UX5400E i7-1165G7, GeForce MX450 | 1.4 kg | 16.9 mm | 14.00" | 2880x1800 | |
| 82.3 % v7 (old) | 07-2021 | MSI Summit E14 A11SCS i7-1185G7, GeForce GTX 1650 Ti Max-Q | 1.3 kg | 16 mm | 14.00" | 3840x2160 | |
| 86.5 % v7 (old) | 02-2021 | HP Envy 14-eb0010nr i5-1135G7, GeForce GTX 1650 Ti Max-Q | 1.6 kg | 17.9 mm | 14.00" | 1920x1200 |
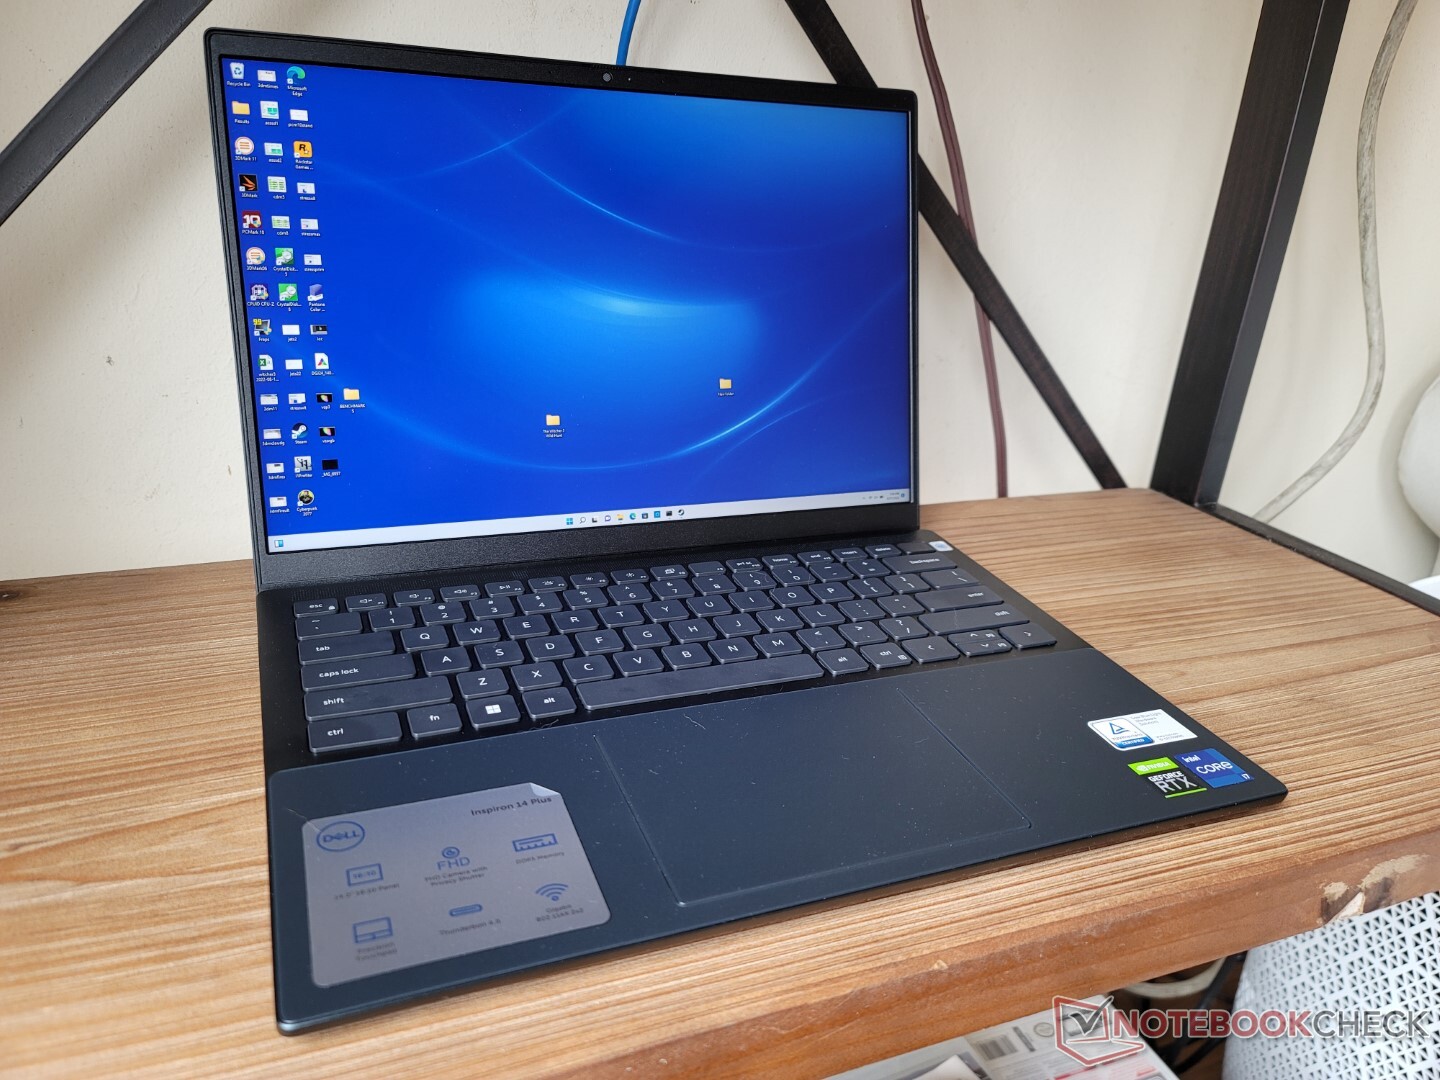
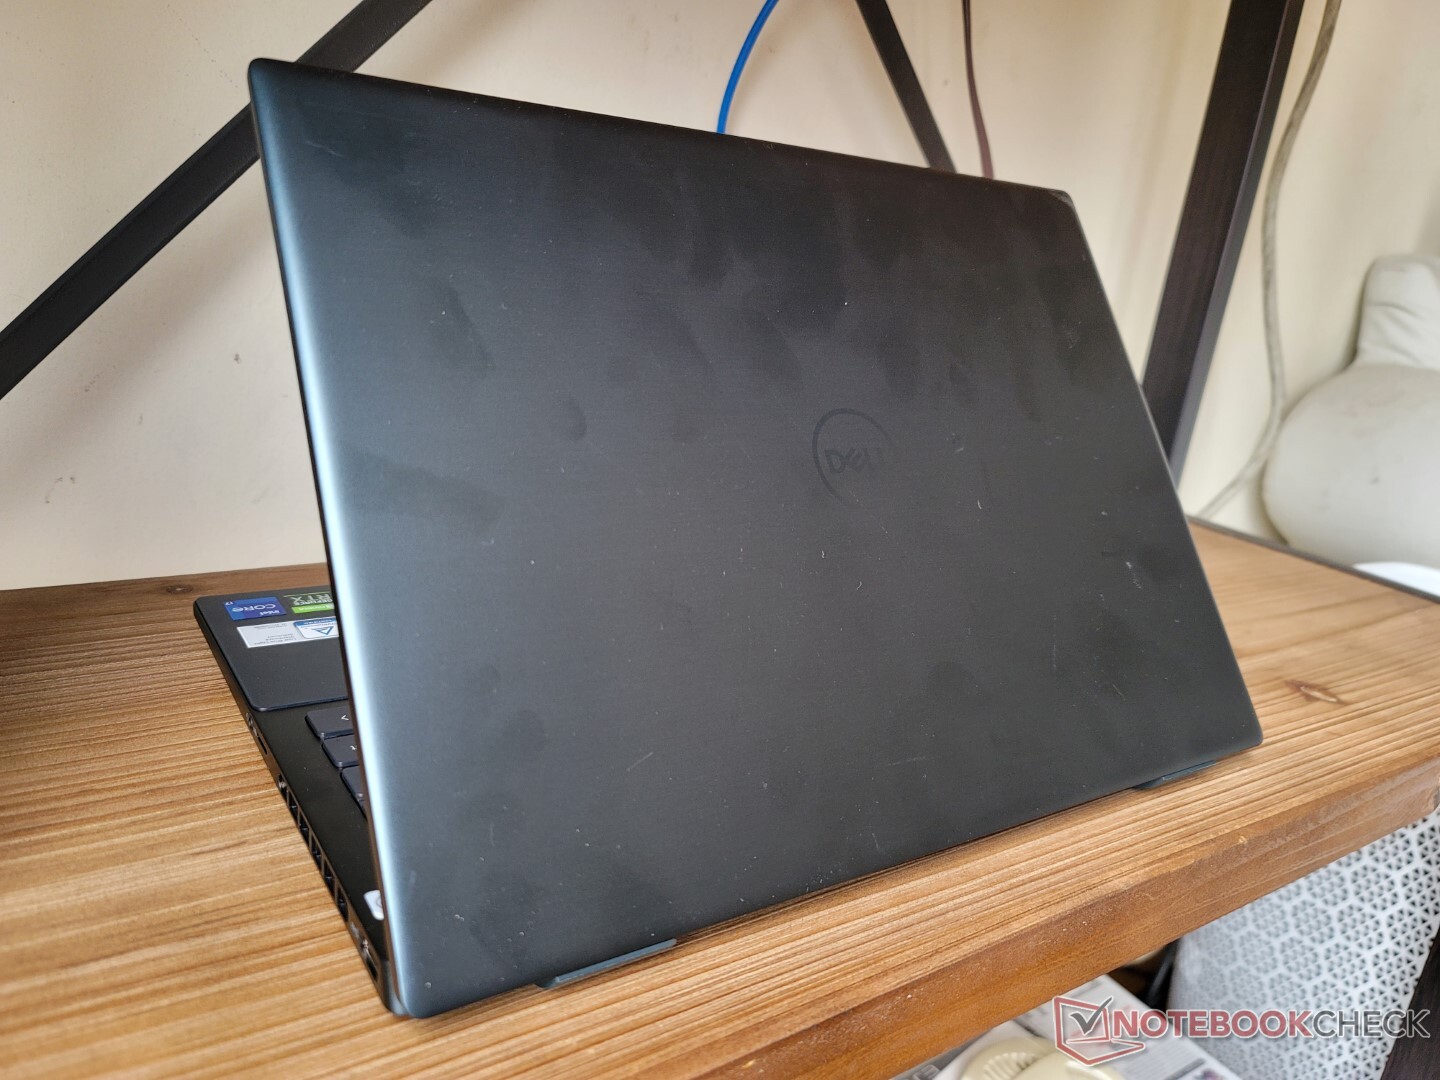
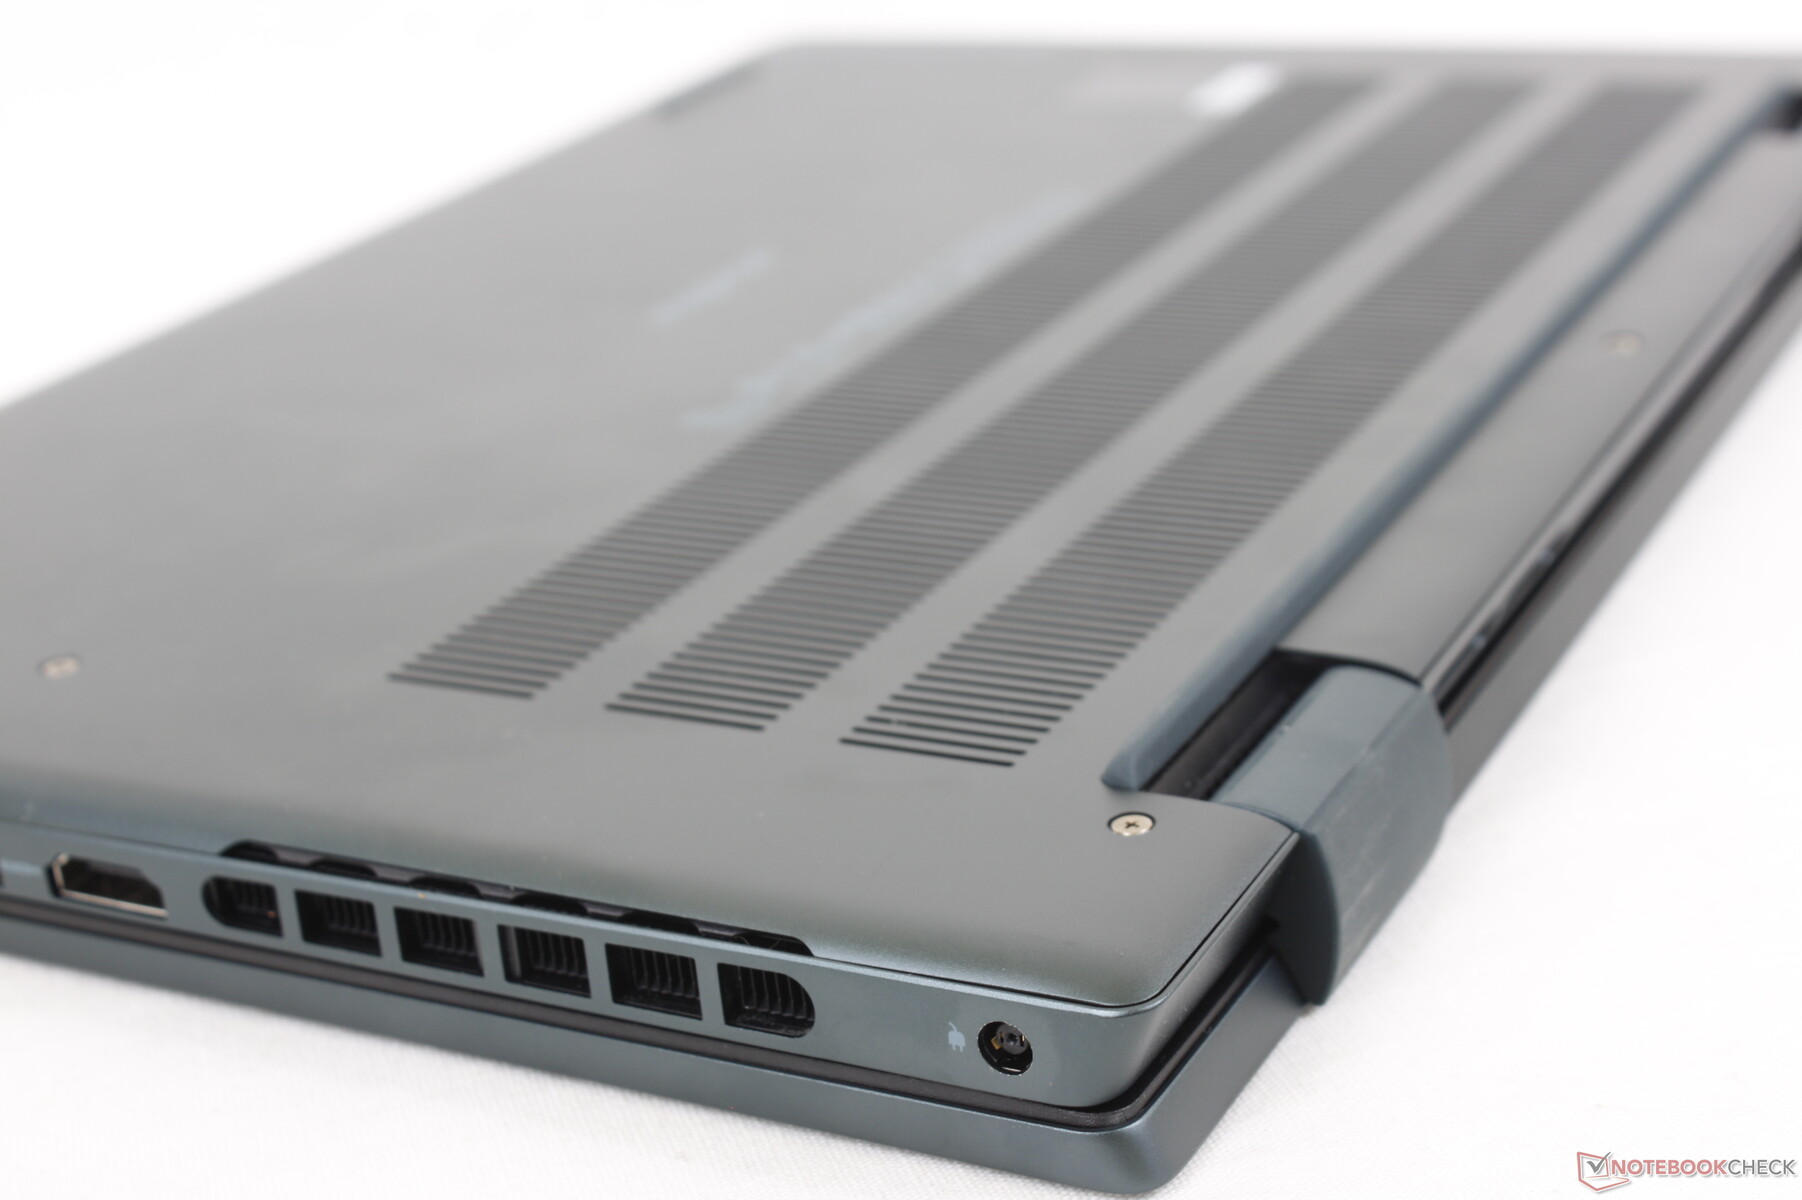
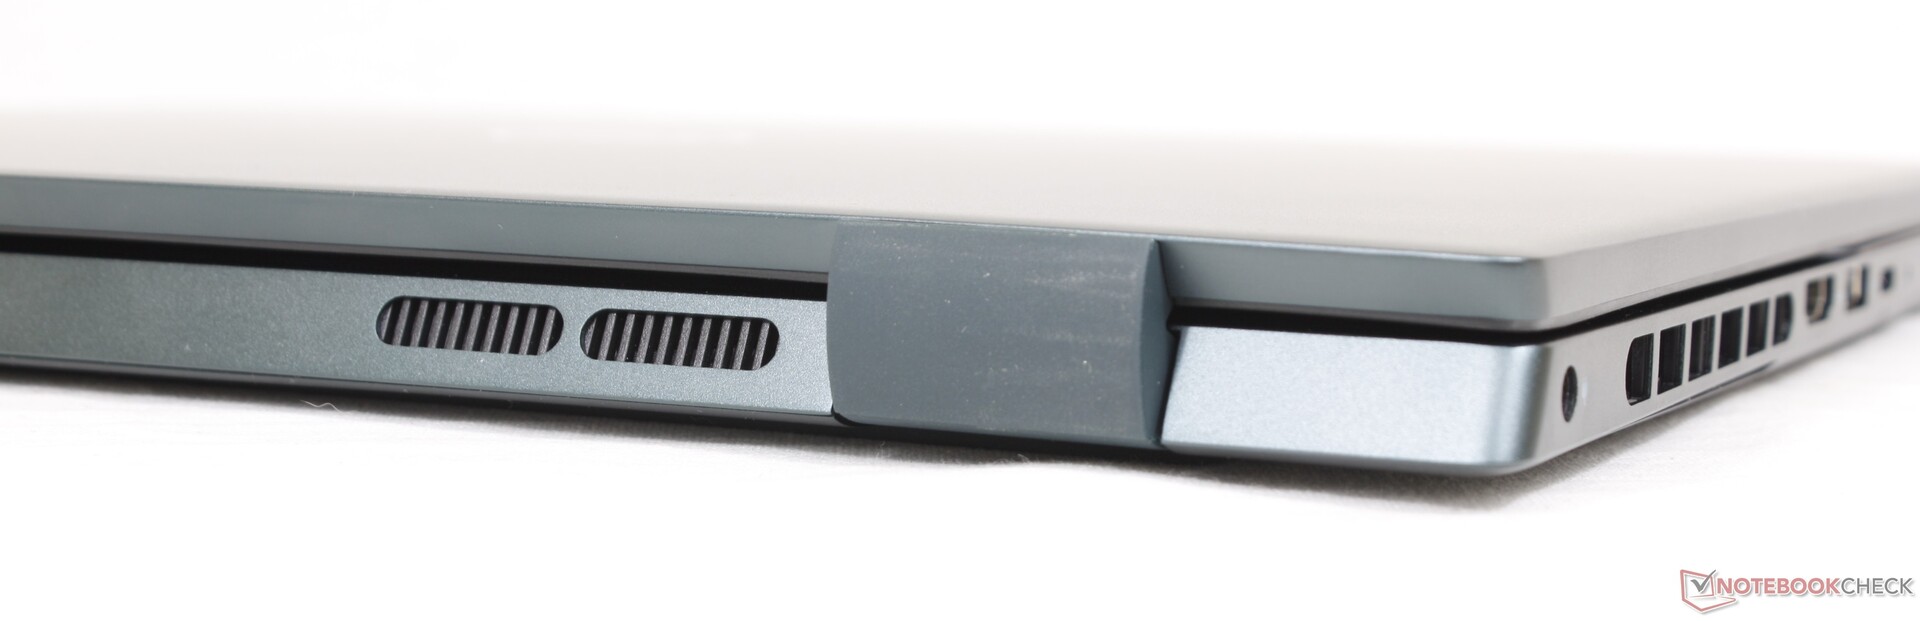
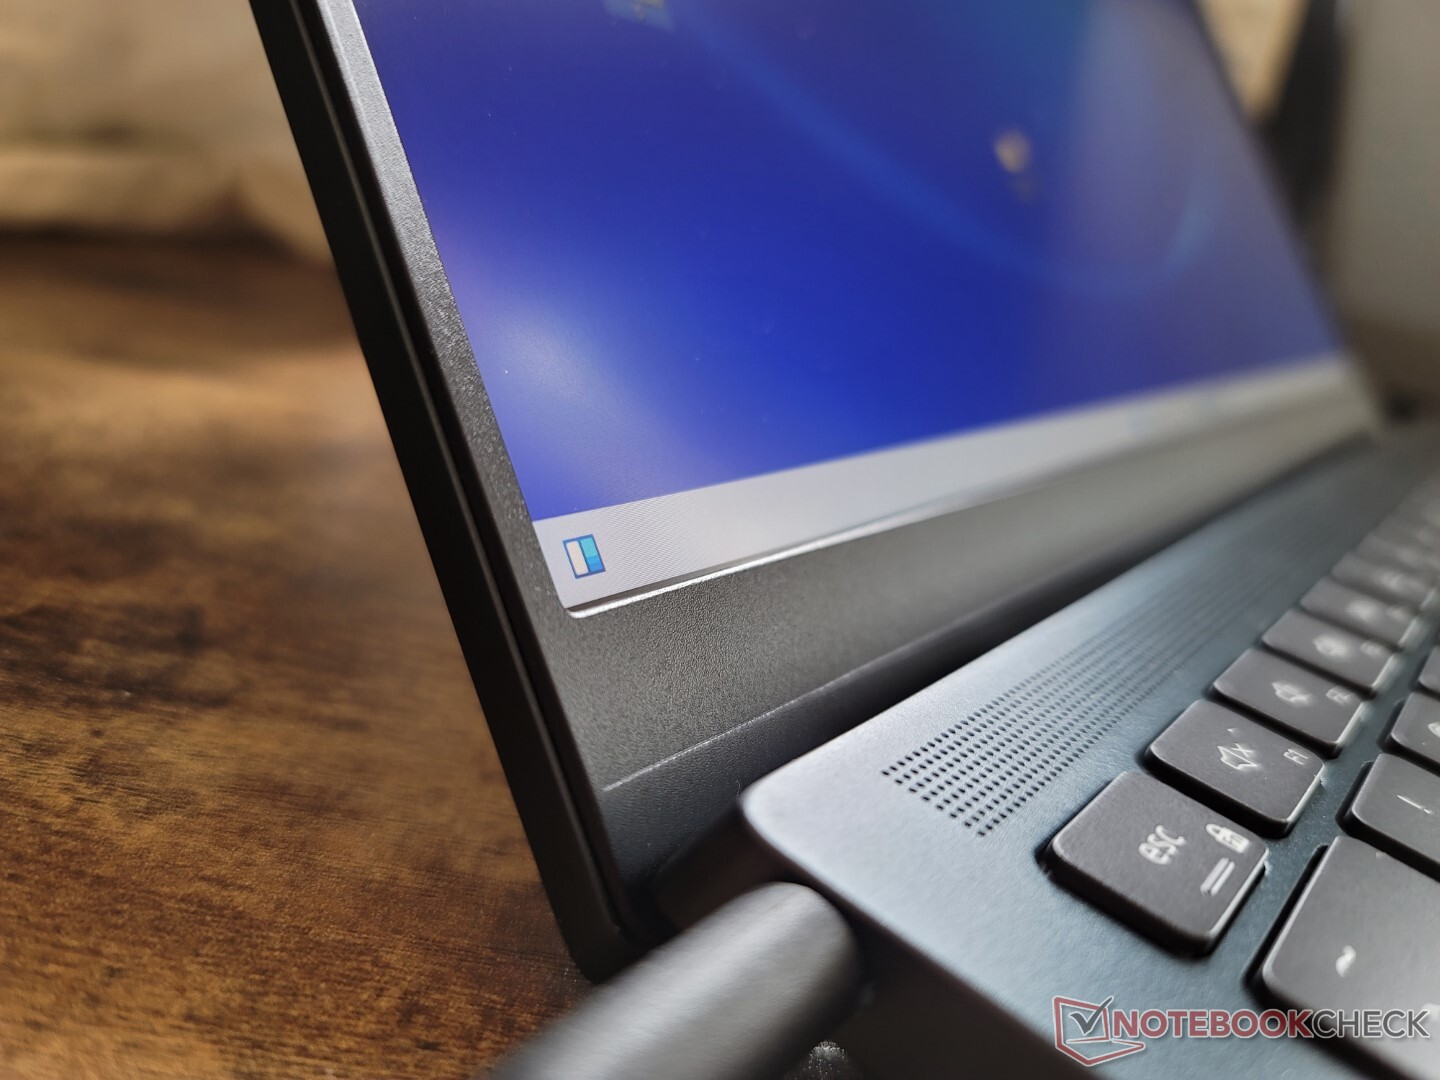
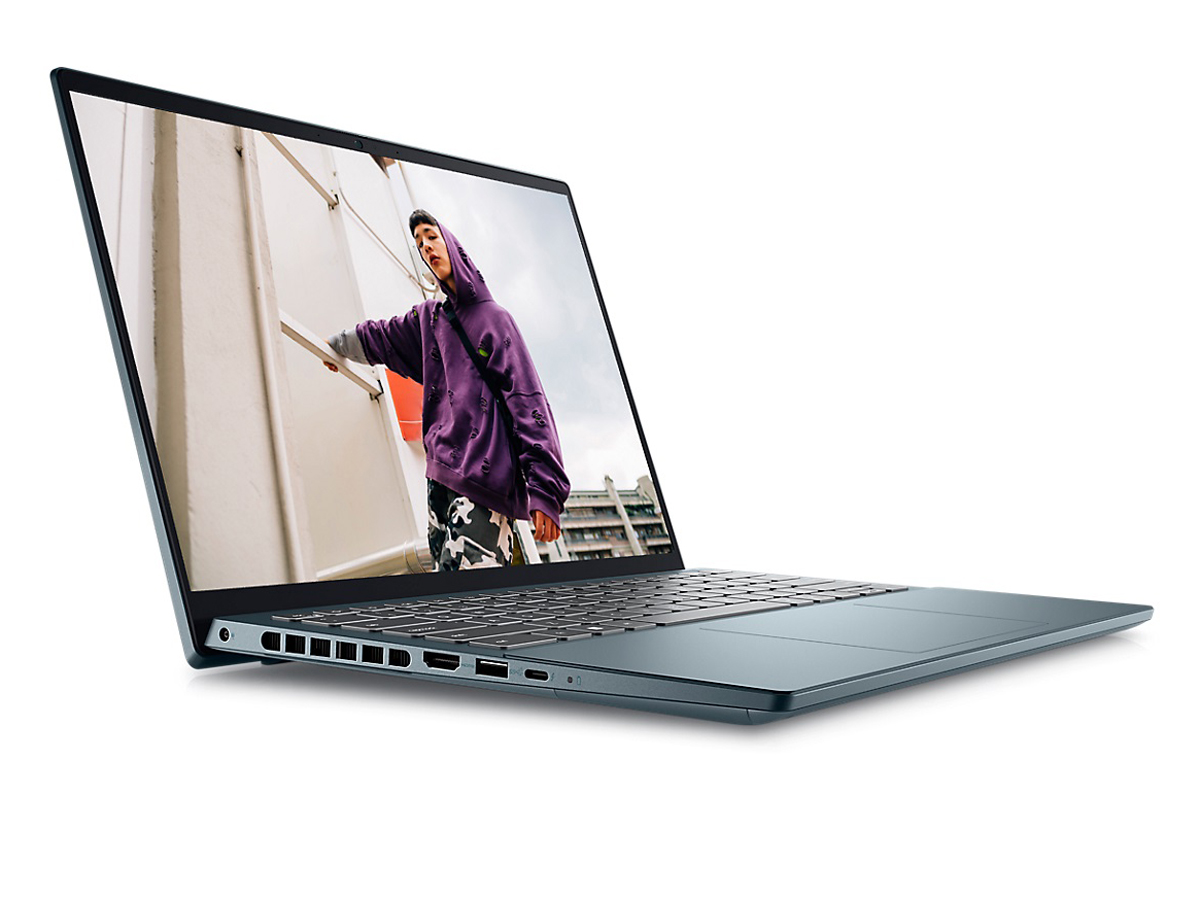
Case - Een miniatuur Inspiron 16 7620
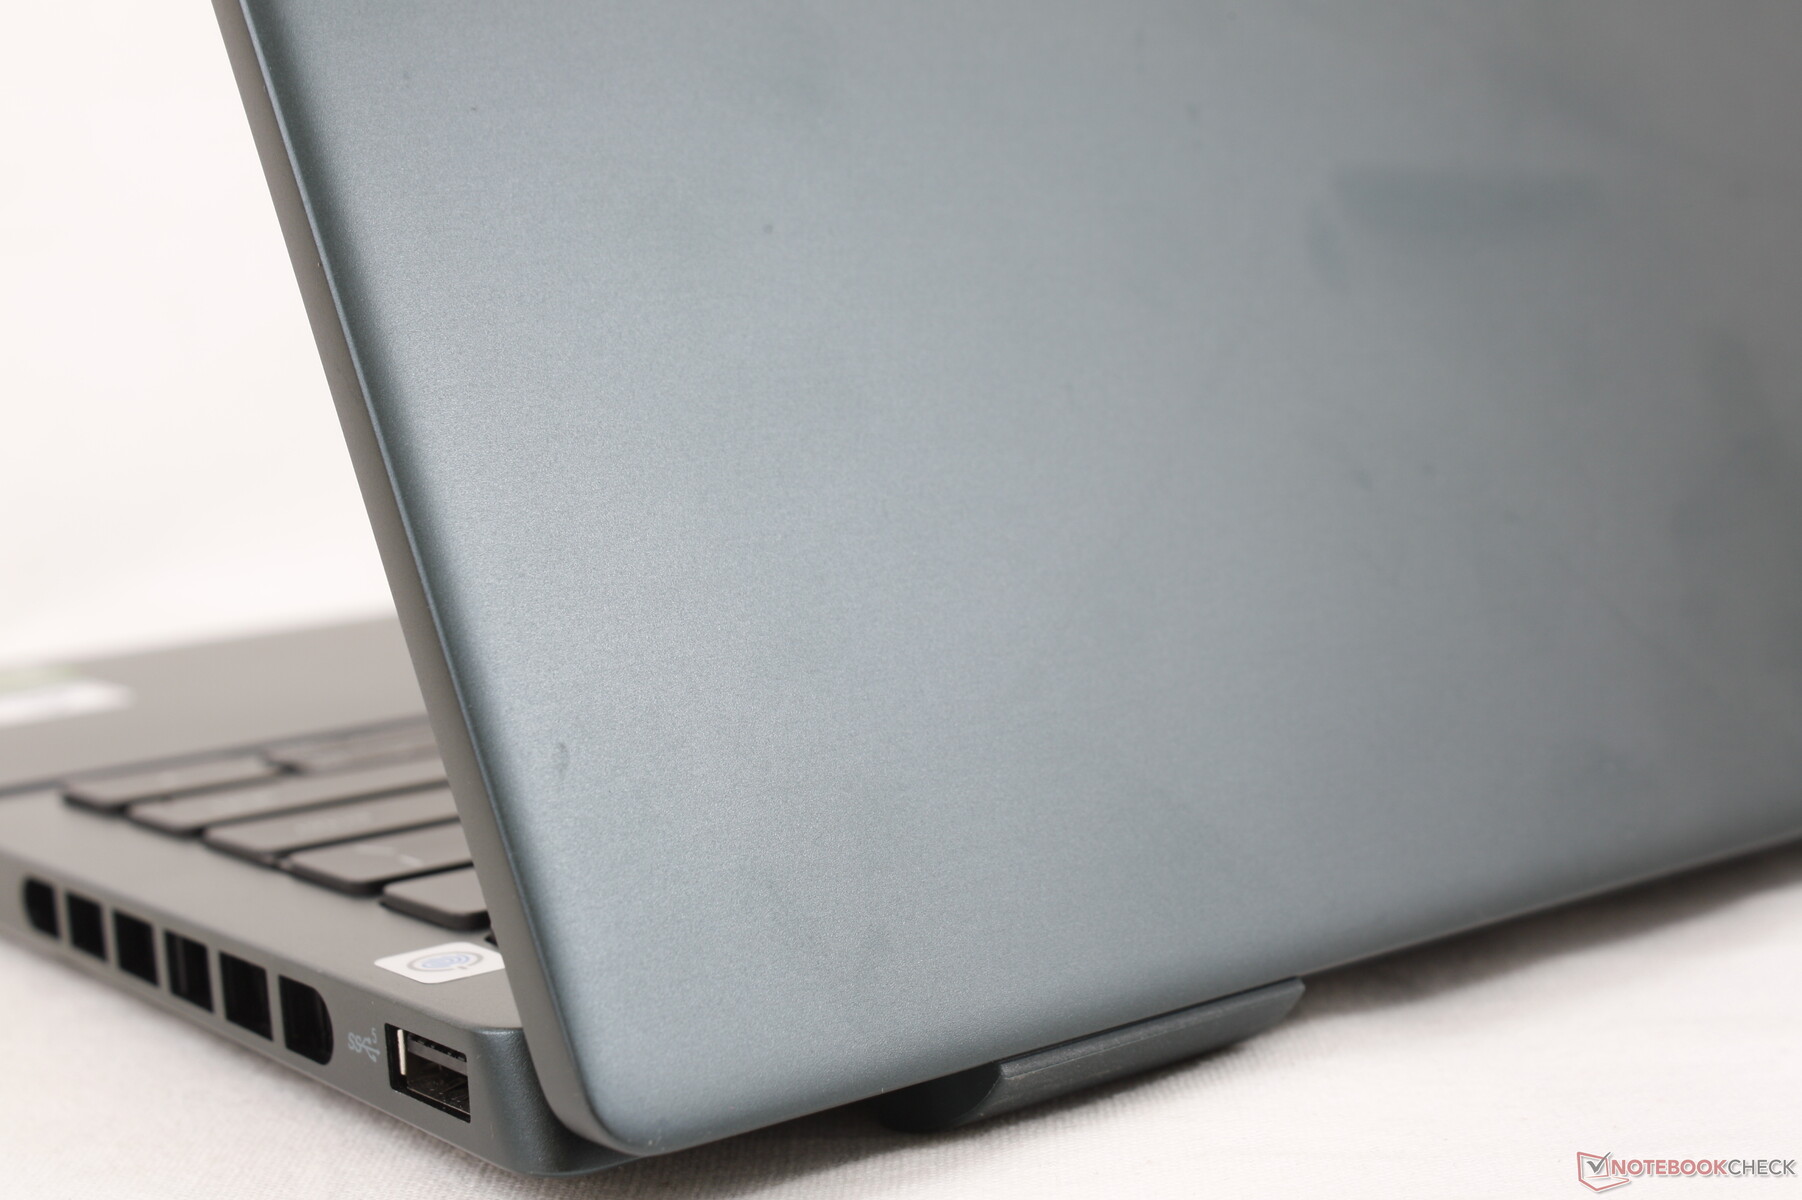
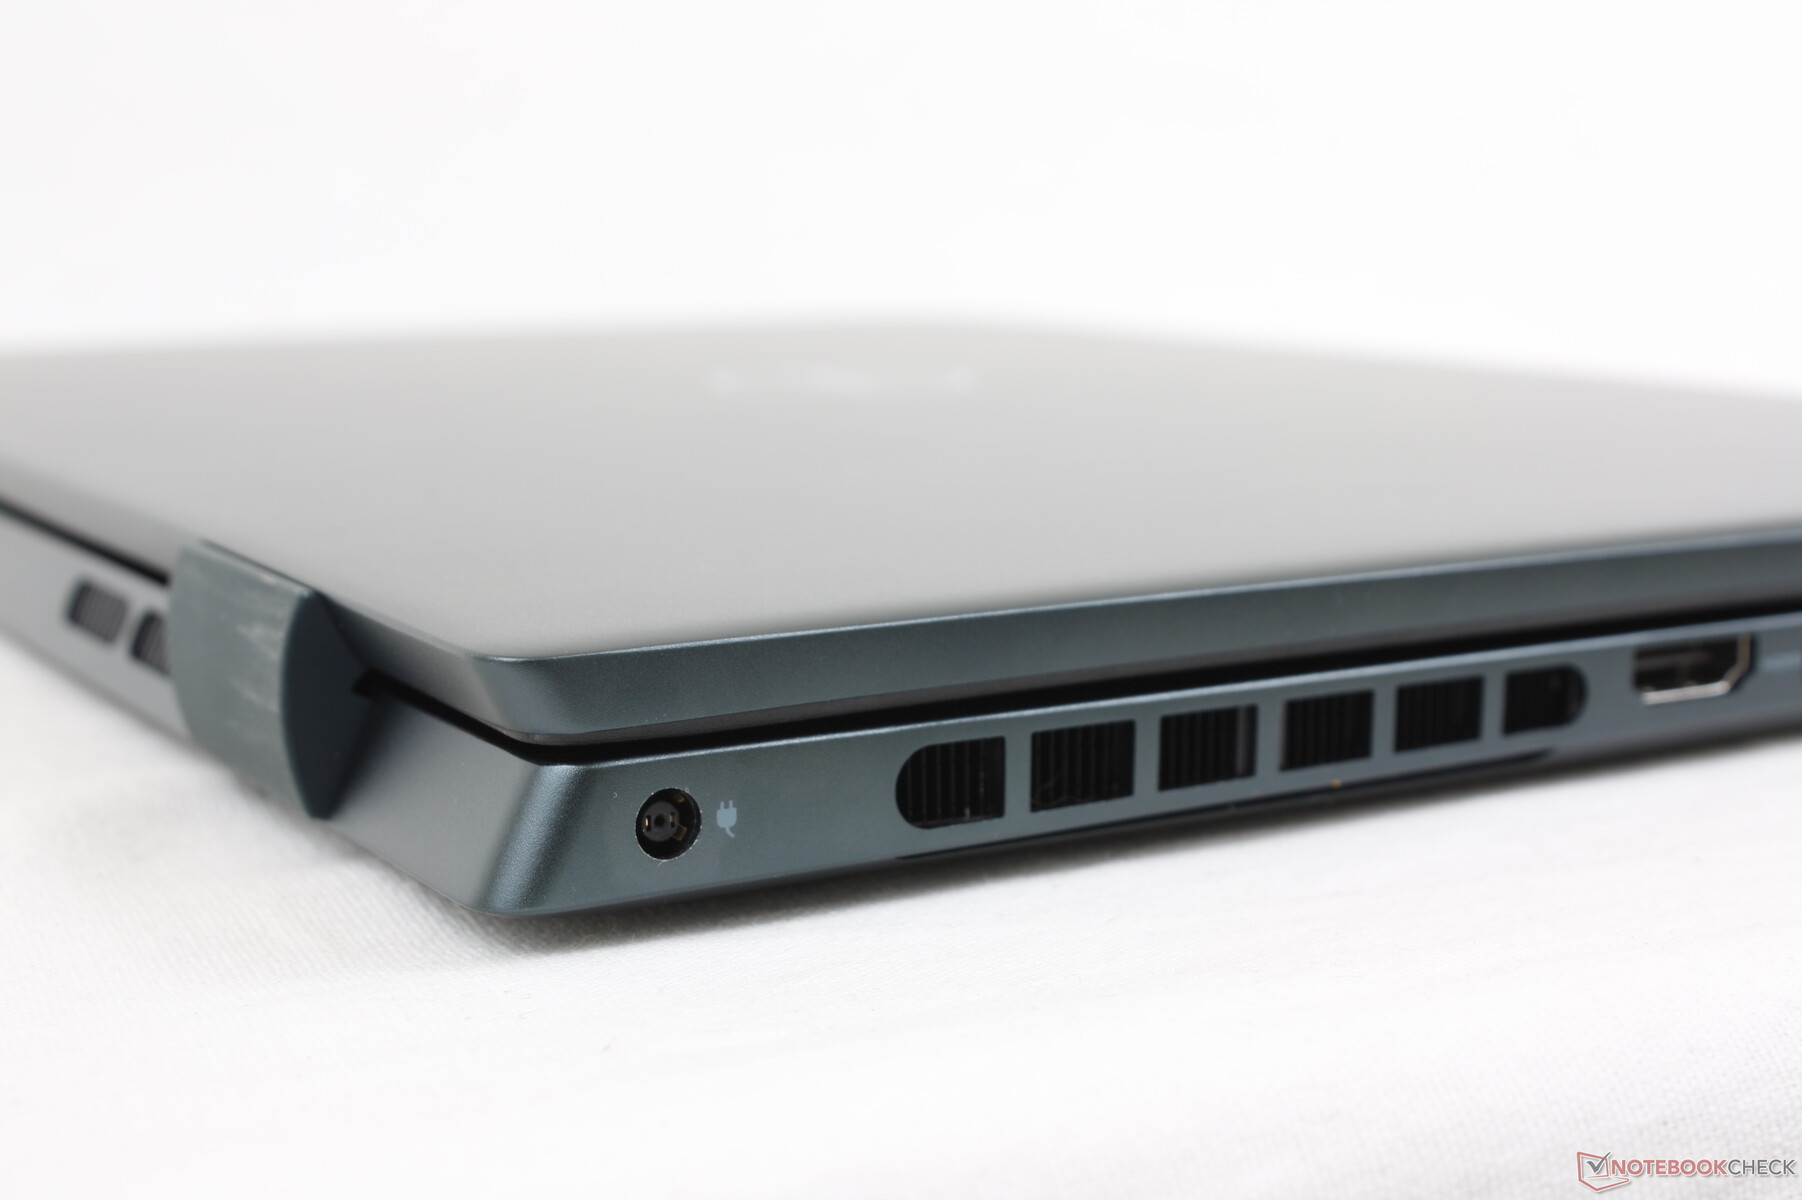
Het chassis kan het best omschreven worden als een kleinere versie van de Inspiron 16 7620 Plus aangezien ze beiden dezelfde visuele ontwerptaal delen. De materialen die zijn gebruikt voor het metalen chassis en de laag Mylar over het clickpad en de palmsteunen zijn dan ook vergelijkbaar met die van de grotere Inspiron. Het is een gladde matte gevoel van boven naar beneden dat bijna het gladde metalen buitenste deksel van een XPS 15
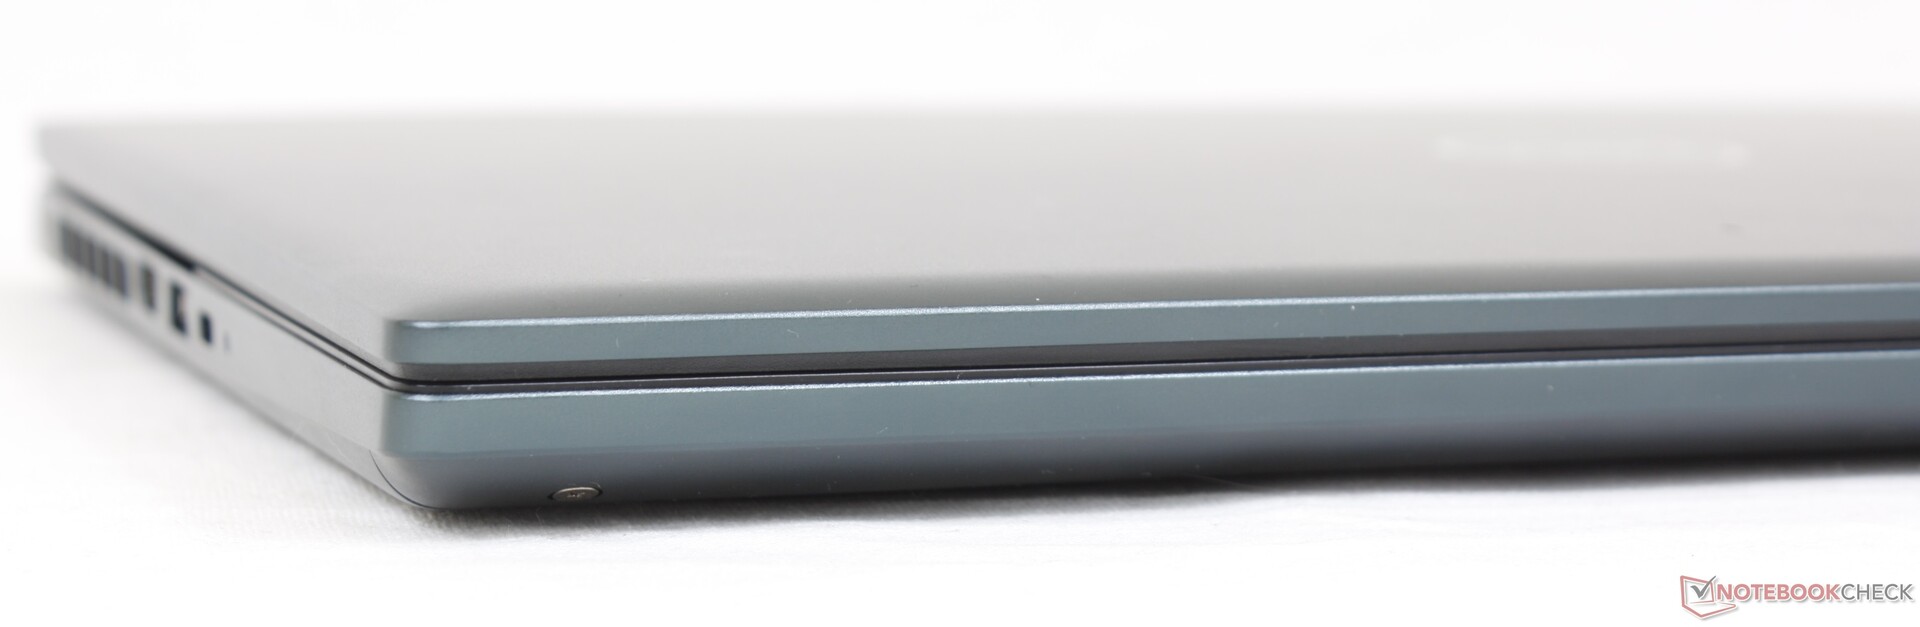
Het zwakste aspect van het skelet is misschien wel het deksel, omdat het vrij gemakkelijk draait. Een licht kraken is hoorbaar bij het draaien van de basis en het uitoefenen van druk op het midden van het toetsenbord zal het oppervlak ook licht vervormen. Hoewel dit model bijna net zoveel kost als een Dell XPS 15, moet u niet verwachten dat het zo sterk is gebouwd.
Je zou misschien verwachten dat de Inspiron 14 Plus 7620 groter en zwaarder is dan de Inspiron 14 7620 2-in-1, maar dat is niet echt het geval. De Inspiron 14 Plus 7620 heeft dezelfde voetafdruk als de 2-in-1 versie, maar is net een tikje dikker en zwaarder ondanks de aanzienlijk krachtigere hardware binnenin. Niettemin is hij nog steeds zwaarder en groter dan de meeste andere 14-inch laptops zoals de HP Envy 14,Asus Zenbook 14Xof Schenker Vision 14, die ook allemaal zijn uitgerust met afzonderlijke Nvidia grafische kaarten.
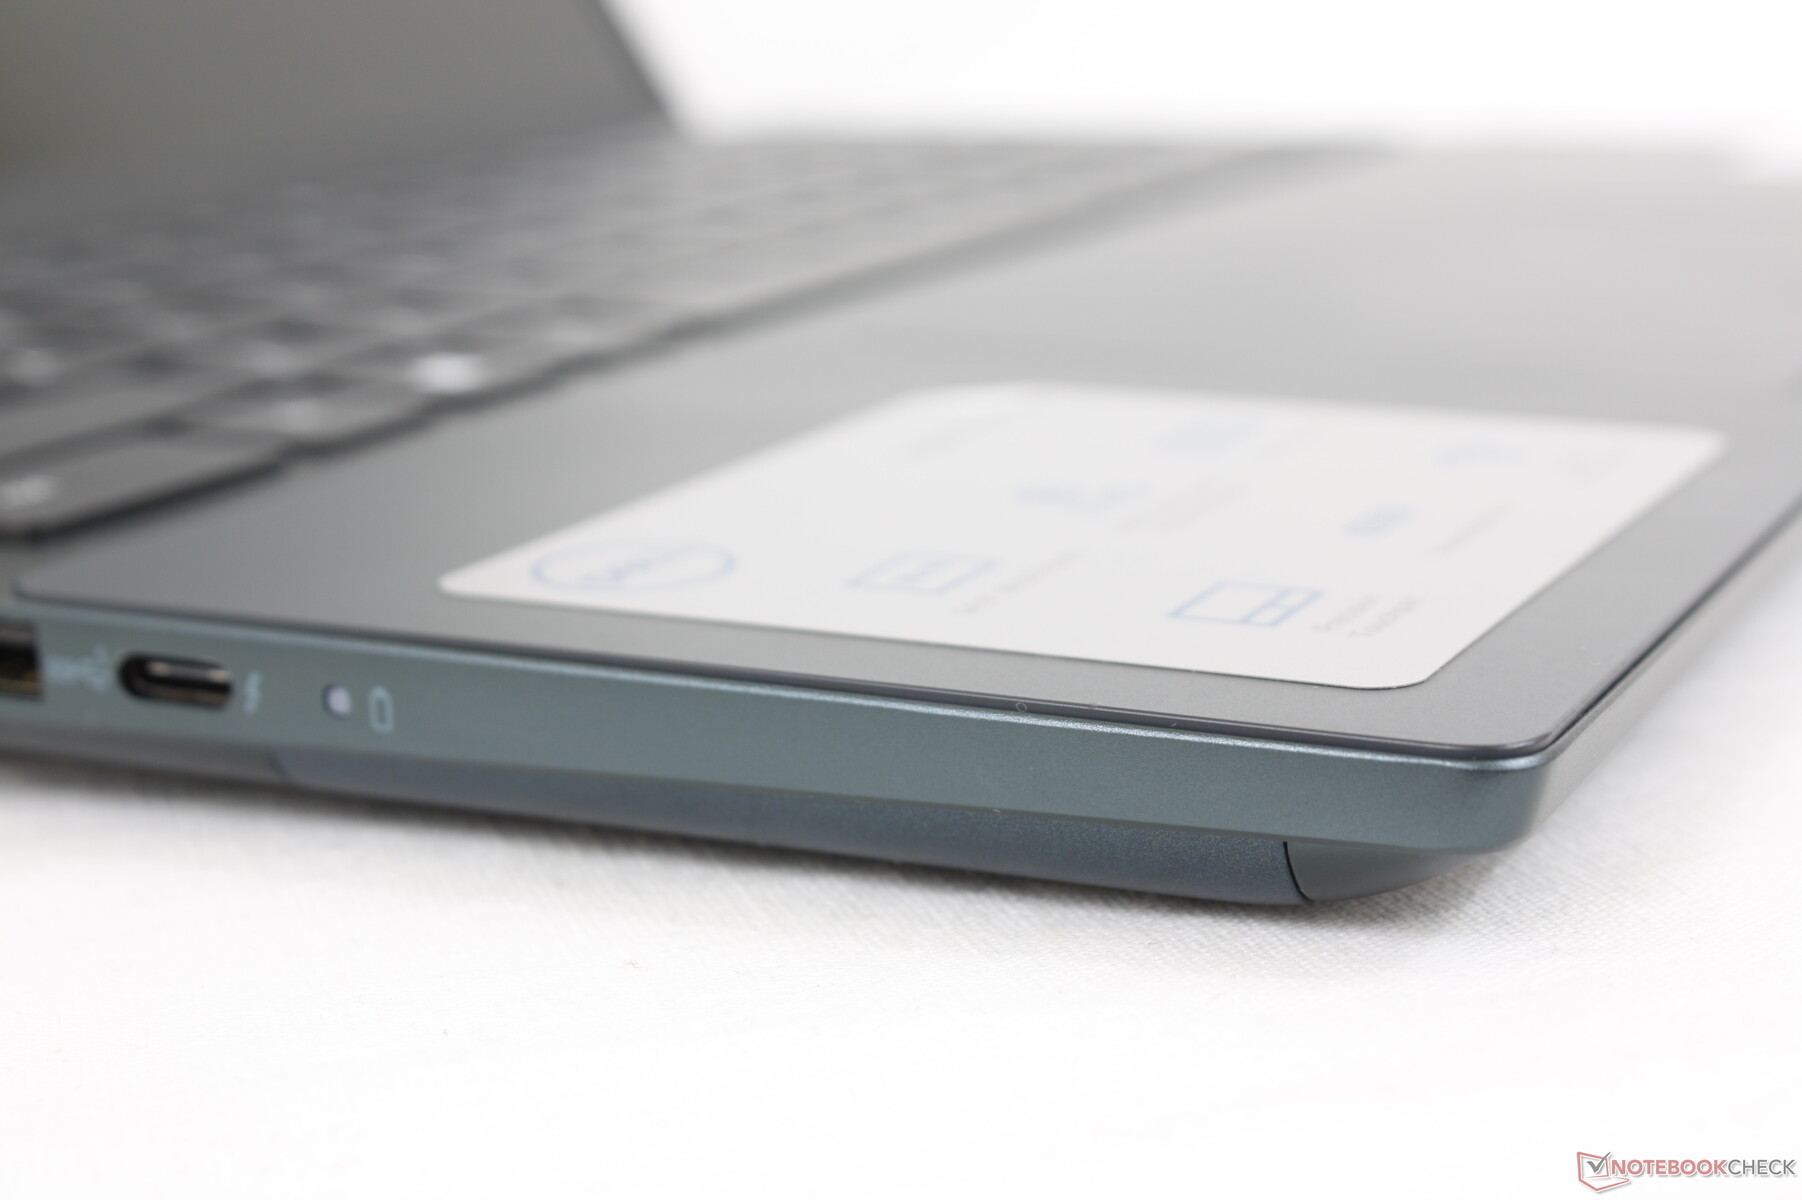
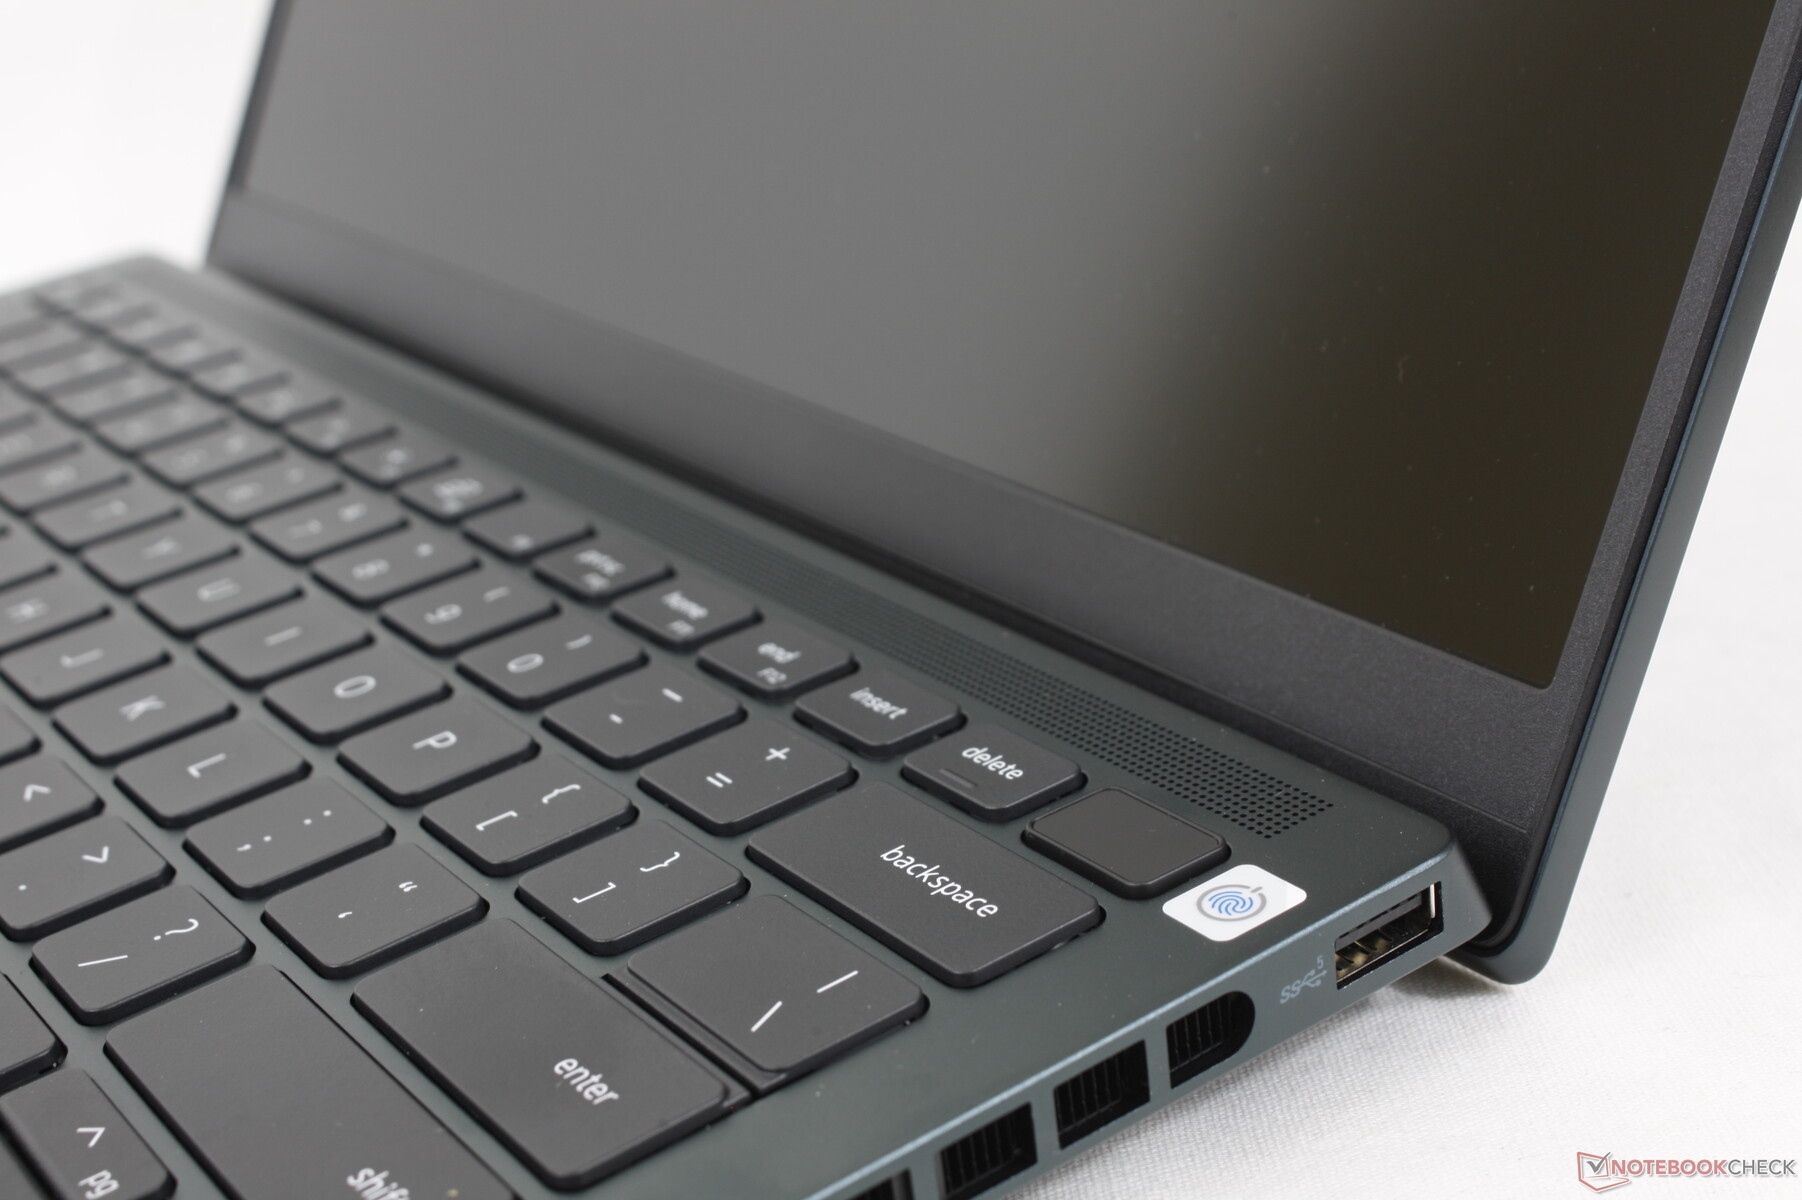
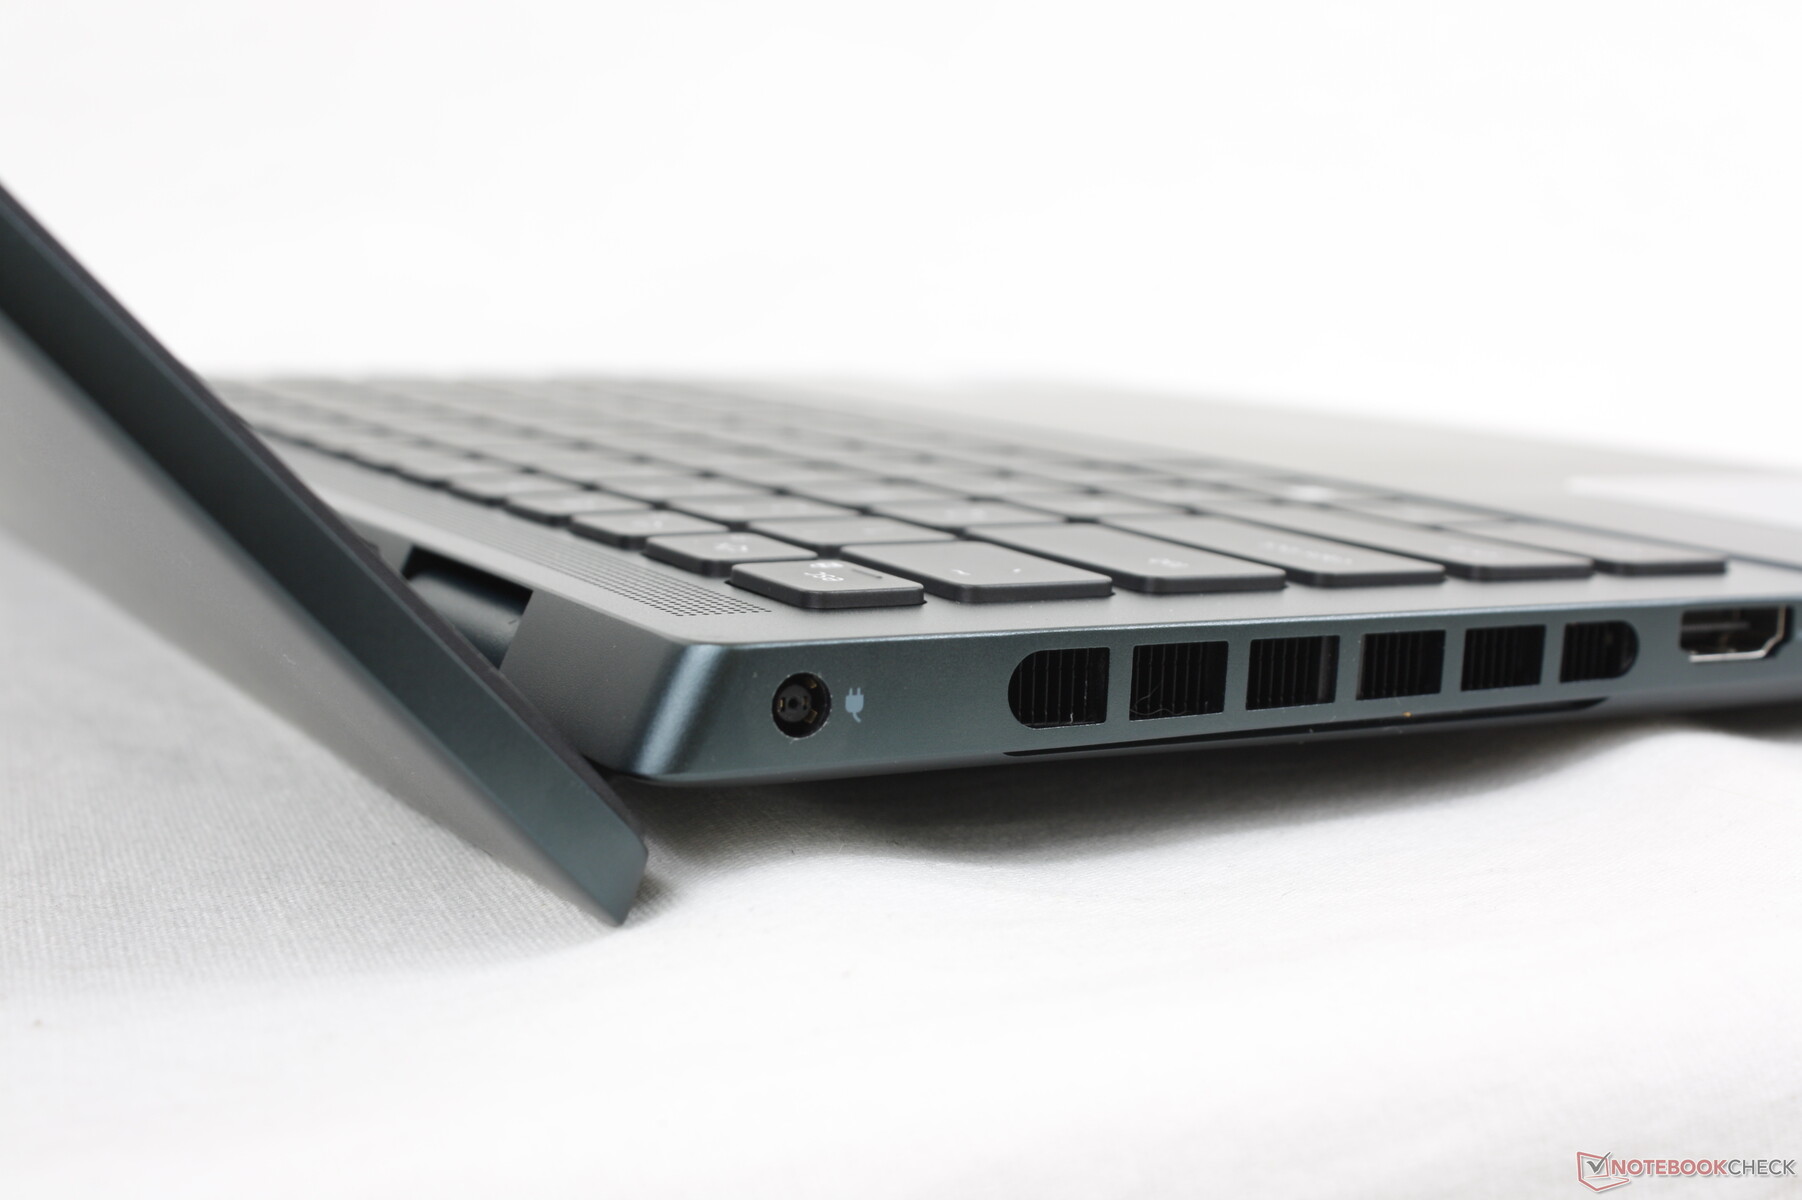
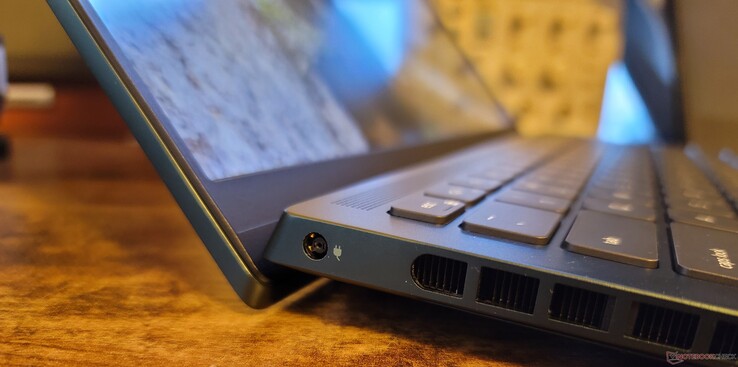
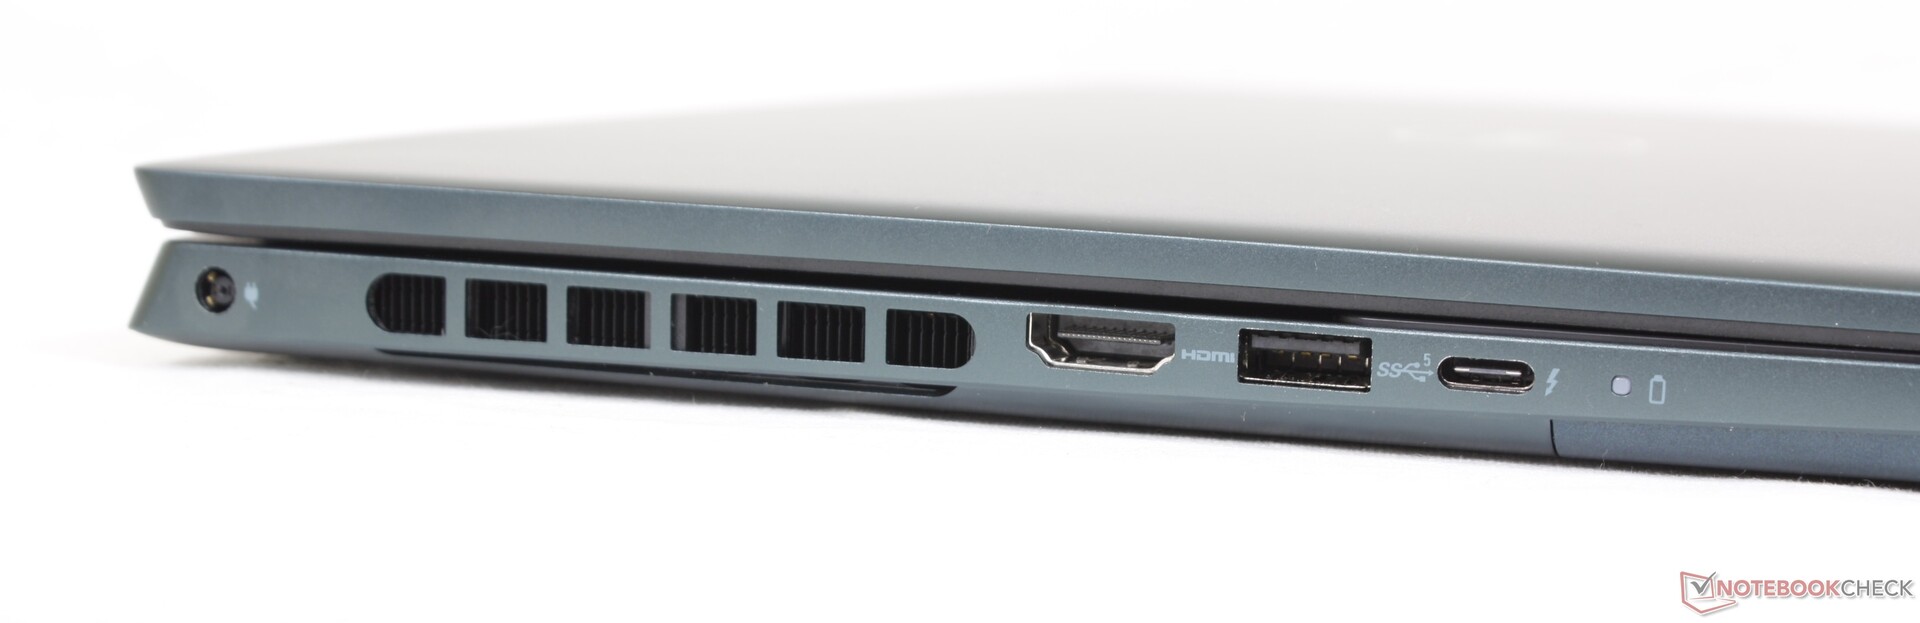
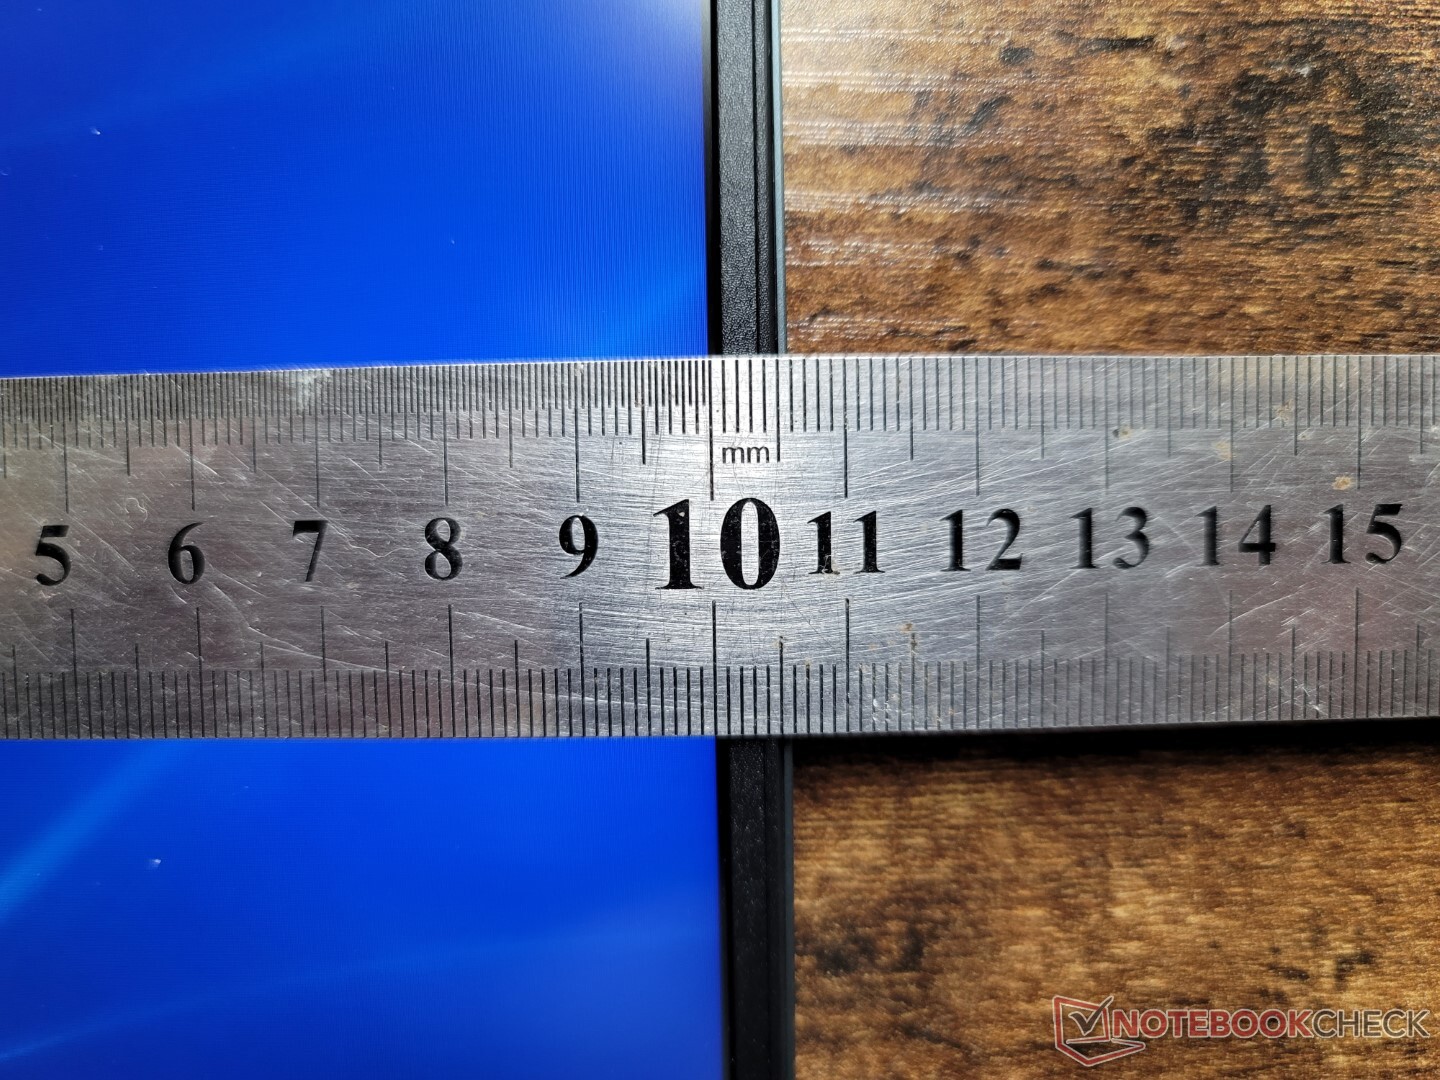
Connectiviteit - Thunderbolt 4 ondersteuning
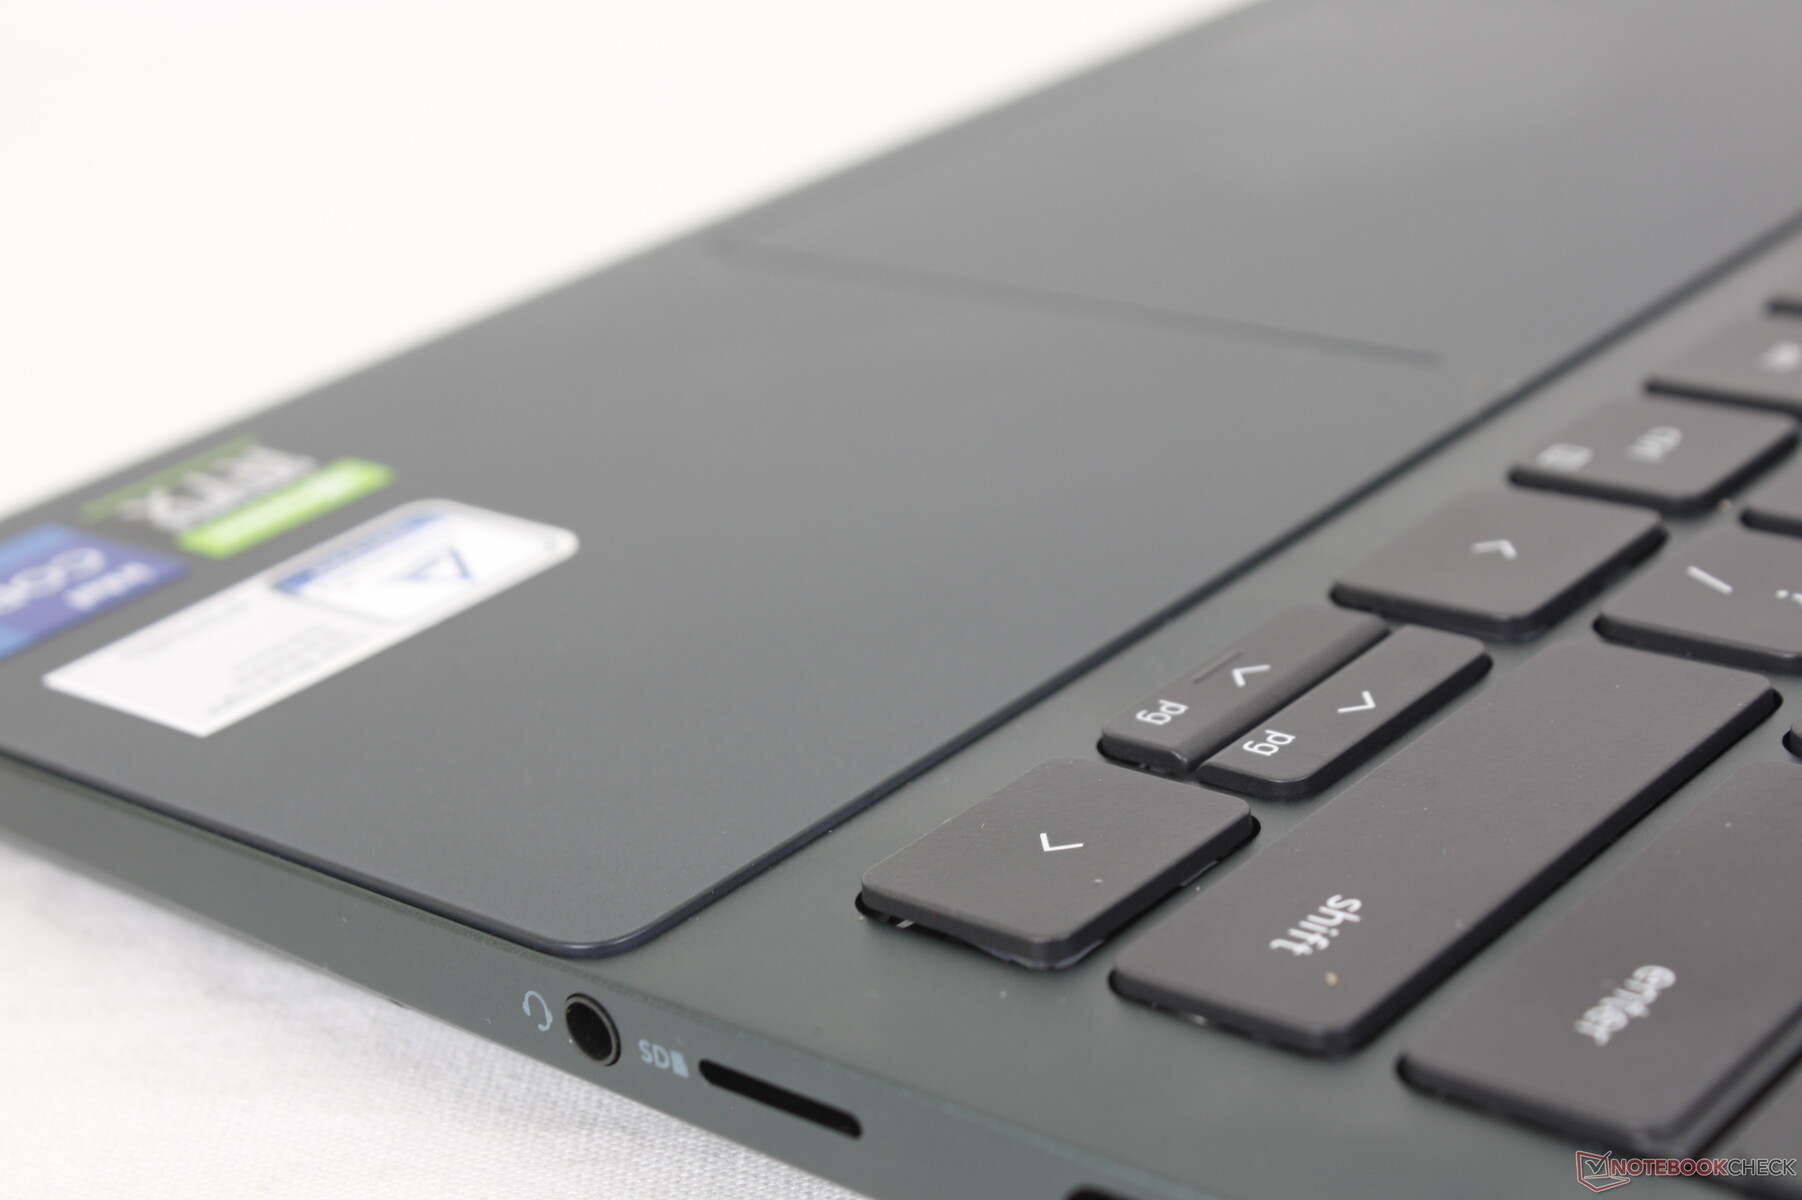
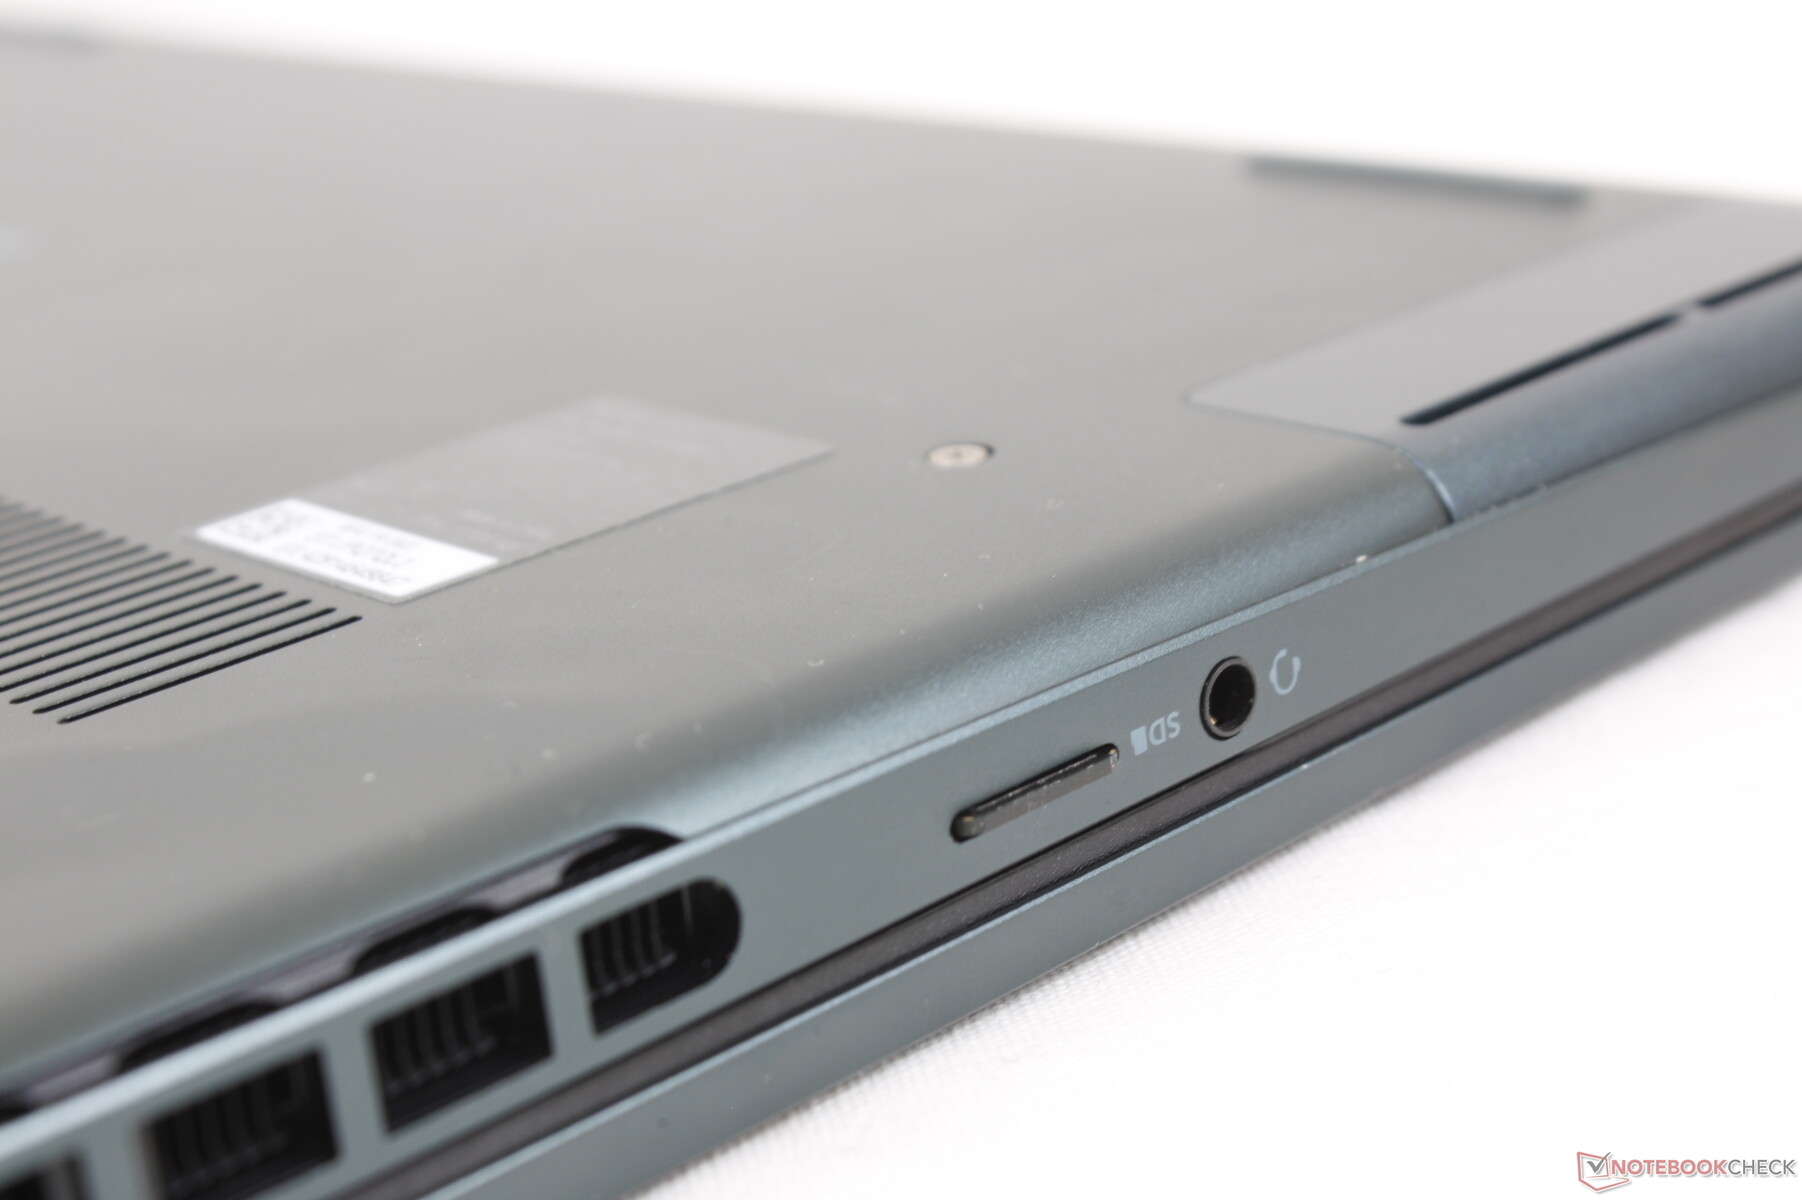
De poortopties zijn identiek aan die van de Inspiron 16 Plus 7620, zij het dat de full-size SD-lezer is ingeruild voor een kleinere microSD-lezer. We waarderen de ondersteuning voor Thunderbolt 4, omdat noch de concurrerende HP Pavilion Plus 14 noch de Asus Vivobook Pro 14 OLED Thunderbolt ondersteunen, ook al hebben ze USB-C poorten.
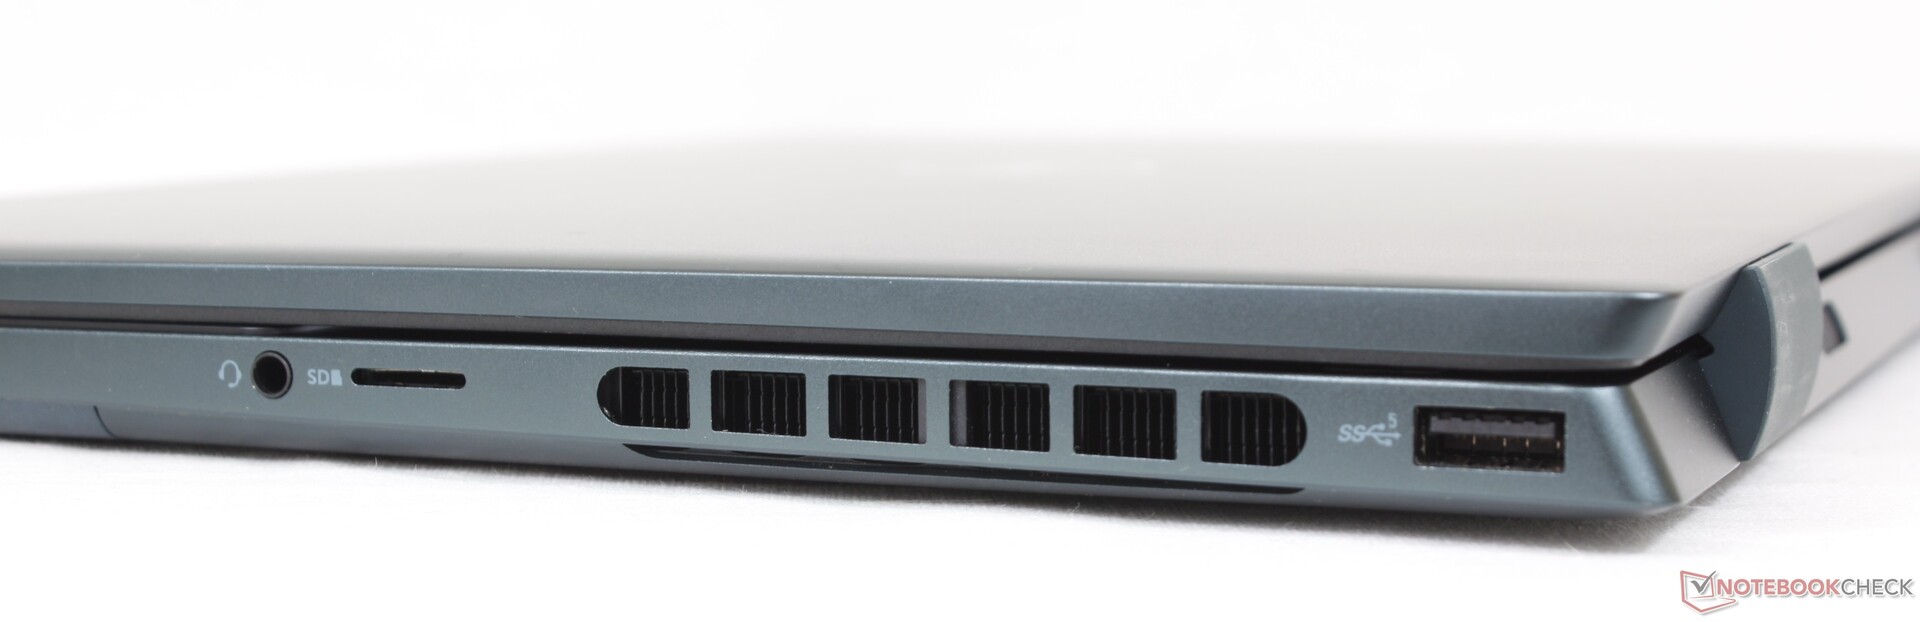
SD-kaartlezer
Overdrachtssnelheden van de geïntegreerde verende MicroSD-lezer zijn traag, net als wat we hebben waargenomen op de Inspiron 14 7420 2-in-1. Het verplaatsen van 1 GB aan foto's van onze UHS-II testkaart naar de desktop duurt ongeveer 45 seconden.
| SD Card Reader | |
| average JPG Copy Test (av. of 3 runs) | |
| MSI Summit E14 A11SCS (AV Pro V60) | |
| Schenker Vision 14 (Angelbird AV Pro V60) | |
| HP Envy 14-eb0010nr (Toshiba Exceria Pro M501 microSDXC 32GB) | |
| Asus Zenbook 14X UX5400E (AV Pro SD microSD 128 GB V60) | |
| Asus Vivobook Pro 14 M3401QC-KM007T (AV Pro SD microSD 128 GB V60) | |
| Dell Inspiron 14 Plus 7420 (AV PRO microSD 128 GB V60) | |
| Dell Inspiron 14 7420 2-in-1 (Toshiba Exceria Pro SDXC 64 GB UHS-II) | |
| maximum AS SSD Seq Read Test (1GB) | |
| MSI Summit E14 A11SCS (AV Pro V60) | |
| Schenker Vision 14 (Angelbird AV Pro V60) | |
| HP Envy 14-eb0010nr (Toshiba Exceria Pro M501 microSDXC 32GB) | |
| Asus Zenbook 14X UX5400E (AV Pro SD microSD 128 GB V60) | |
| Asus Vivobook Pro 14 M3401QC-KM007T (AV Pro SD microSD 128 GB V60) | |
| Dell Inspiron 14 Plus 7420 (AV PRO microSD 128 GB V60) | |
| Dell Inspiron 14 7420 2-in-1 (Toshiba Exceria Pro SDXC 64 GB UHS-II) | |
Communicatie
Een Intel AX211 wordt standaard geleverd voor Wi-Fi 6E en Bluetooth 5.2 connectiviteit. Hoewel we geen problemen ondervonden bij het koppelen met ons 6 GHz netwerk, waren de transmissiesnelheden iets onstabieler dan de ontvangstsnelheden, zoals blijkt uit de onderstaande grafiek.
| Networking | |
| iperf3 transmit AX12 | |
| Schenker Vision 14 | |
| HP Envy 14-eb0010nr | |
| MSI Summit E14 A11SCS | |
| Asus Zenbook 14X UX5400E | |
| iperf3 receive AX12 | |
| Schenker Vision 14 | |
| MSI Summit E14 A11SCS | |
| HP Envy 14-eb0010nr | |
| Asus Zenbook 14X UX5400E | |
| iperf3 receive AXE11000 6GHz | |
| Dell Inspiron 14 Plus 7420 | |
| Dell Inspiron 14 7420 2-in-1 | |
| Asus Vivobook Pro 14 M3401QC-KM007T | |
| iperf3 transmit AXE11000 6GHz | |
| Dell Inspiron 14 Plus 7420 | |
| Dell Inspiron 14 7420 2-in-1 | |
| Asus Vivobook Pro 14 M3401QC-KM007T | |
Webcam
de 2 MP webcam biedt een vergelijkbare beeldkwaliteit als de 2 MP webcam op de standaard Inspiron 14 7420 2-in-1. Een fysieke privacy shutter wordt standaard meegeleverd, terwijl Windows Hello en IR niet worden ondersteund.


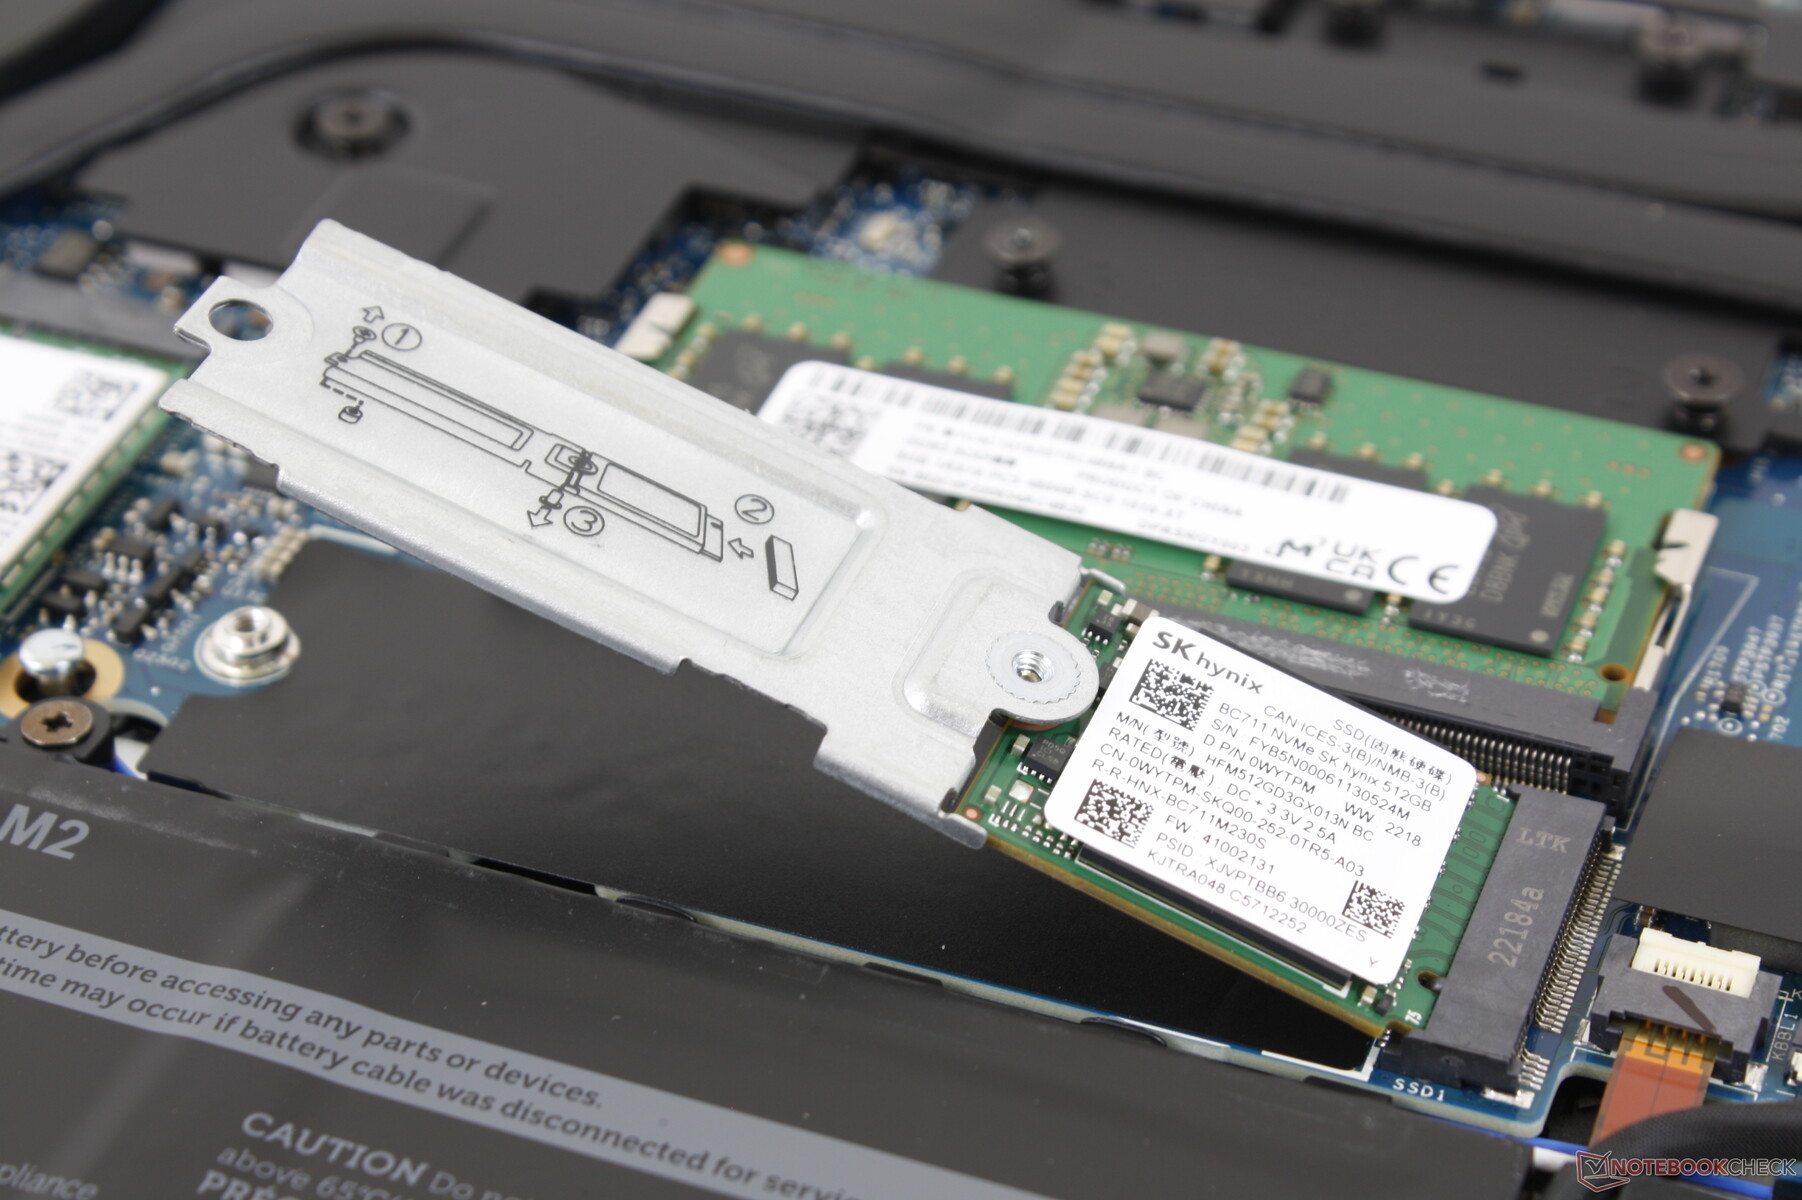
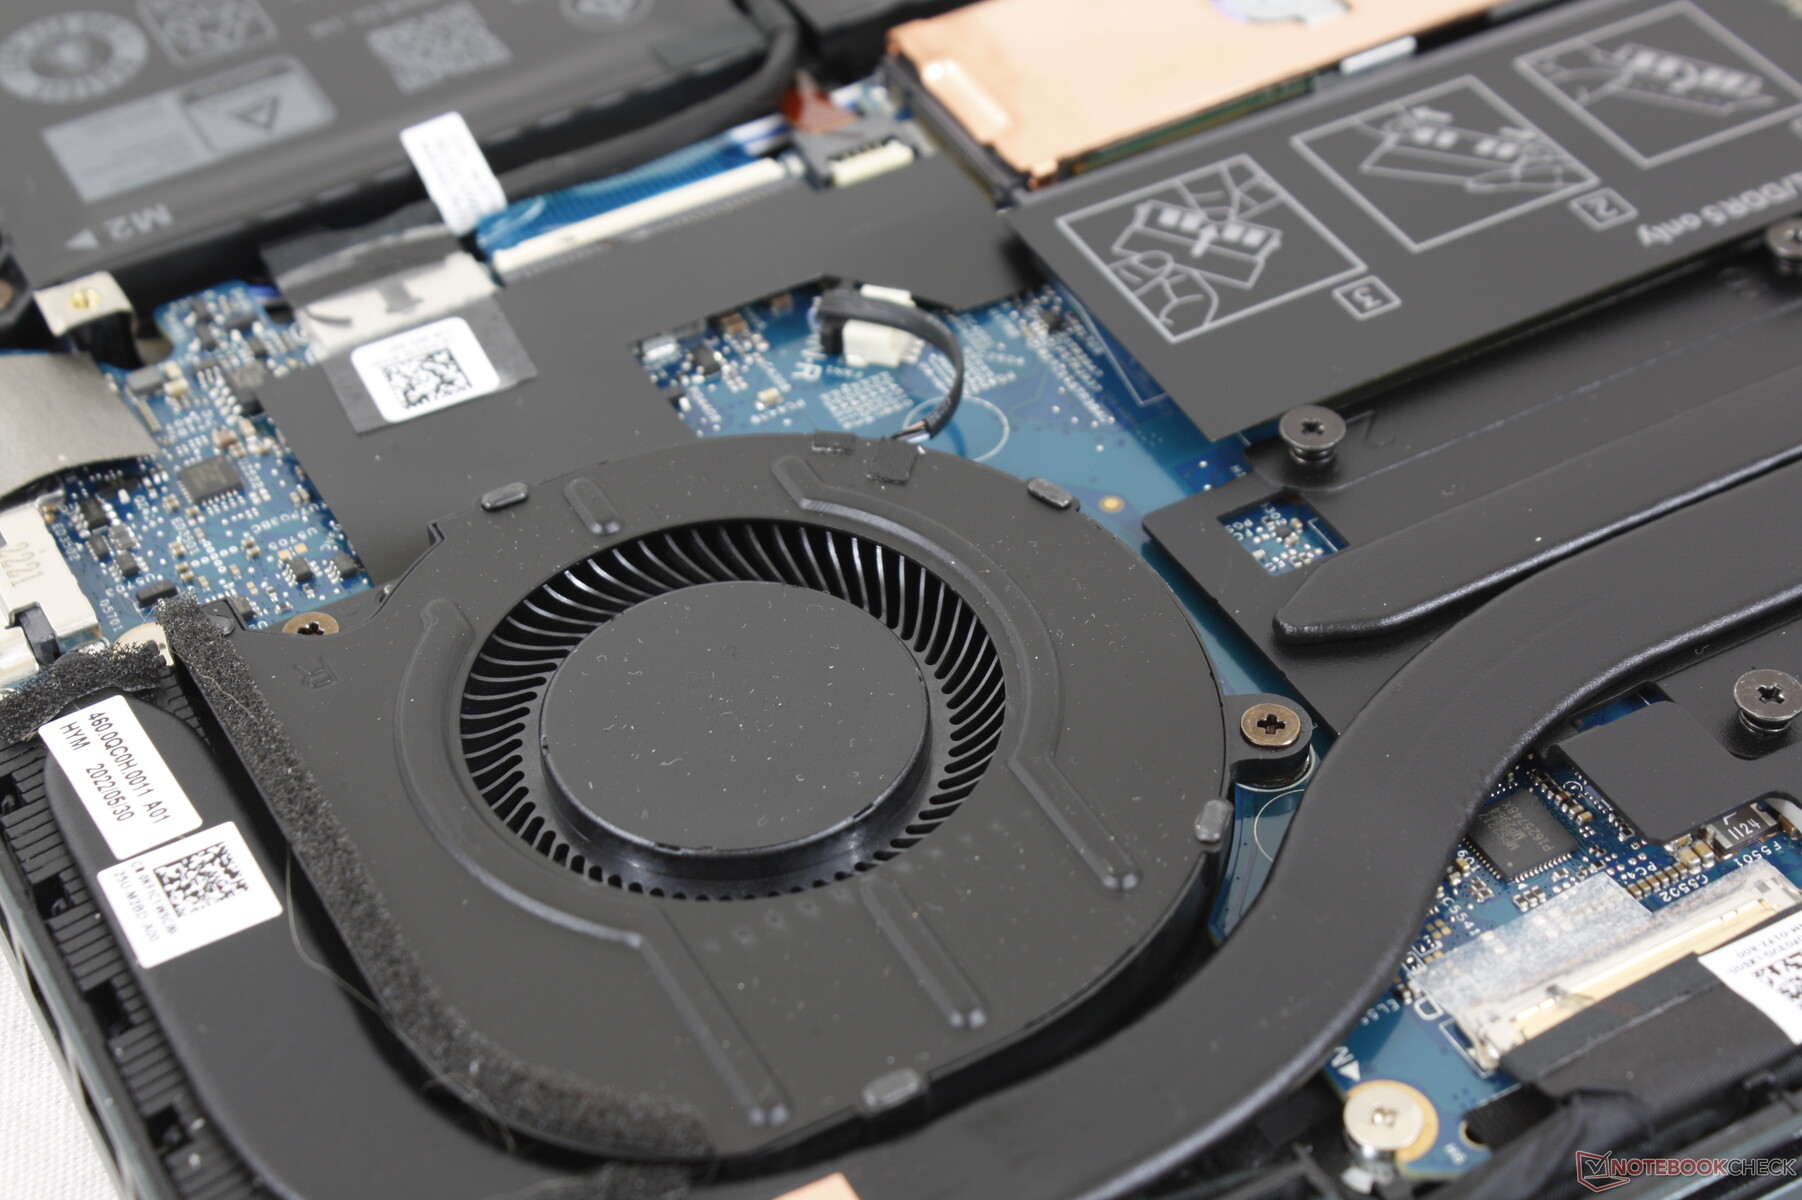
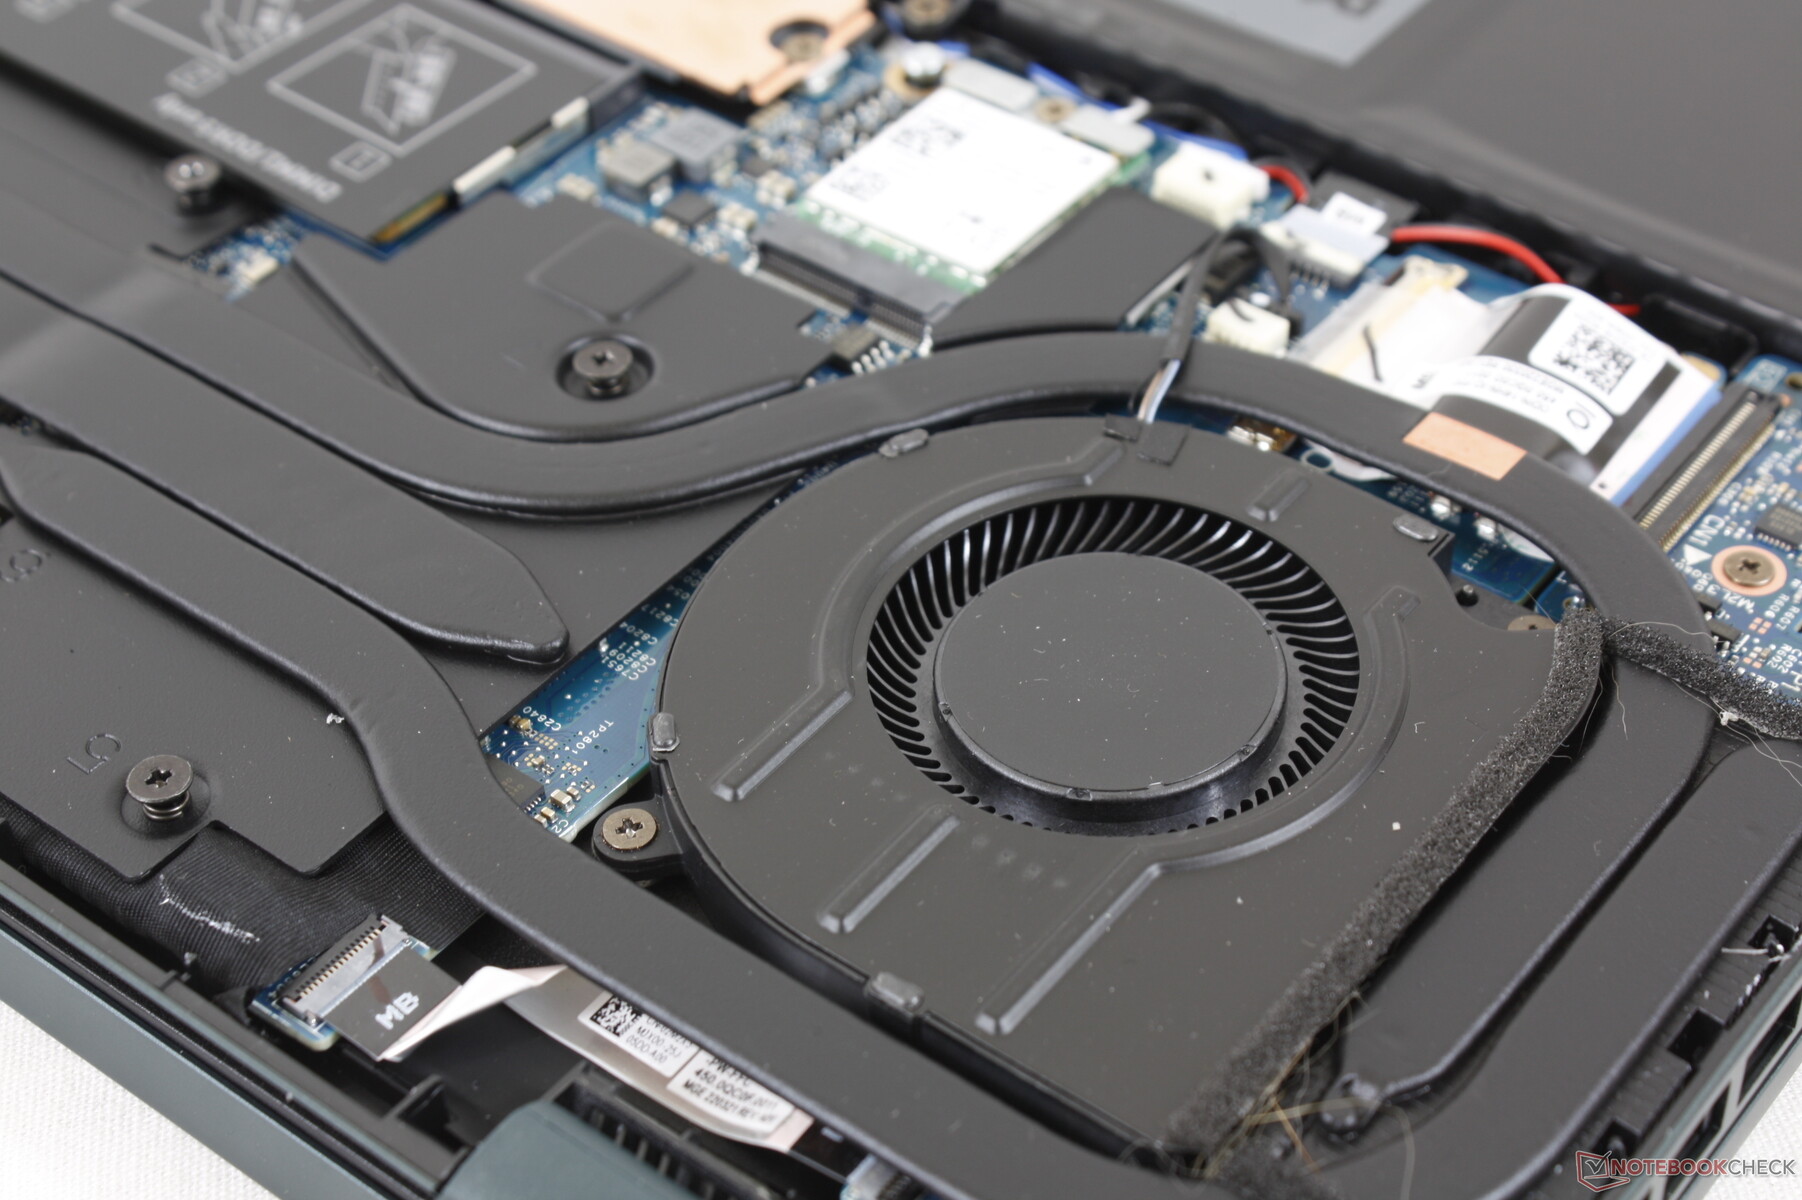
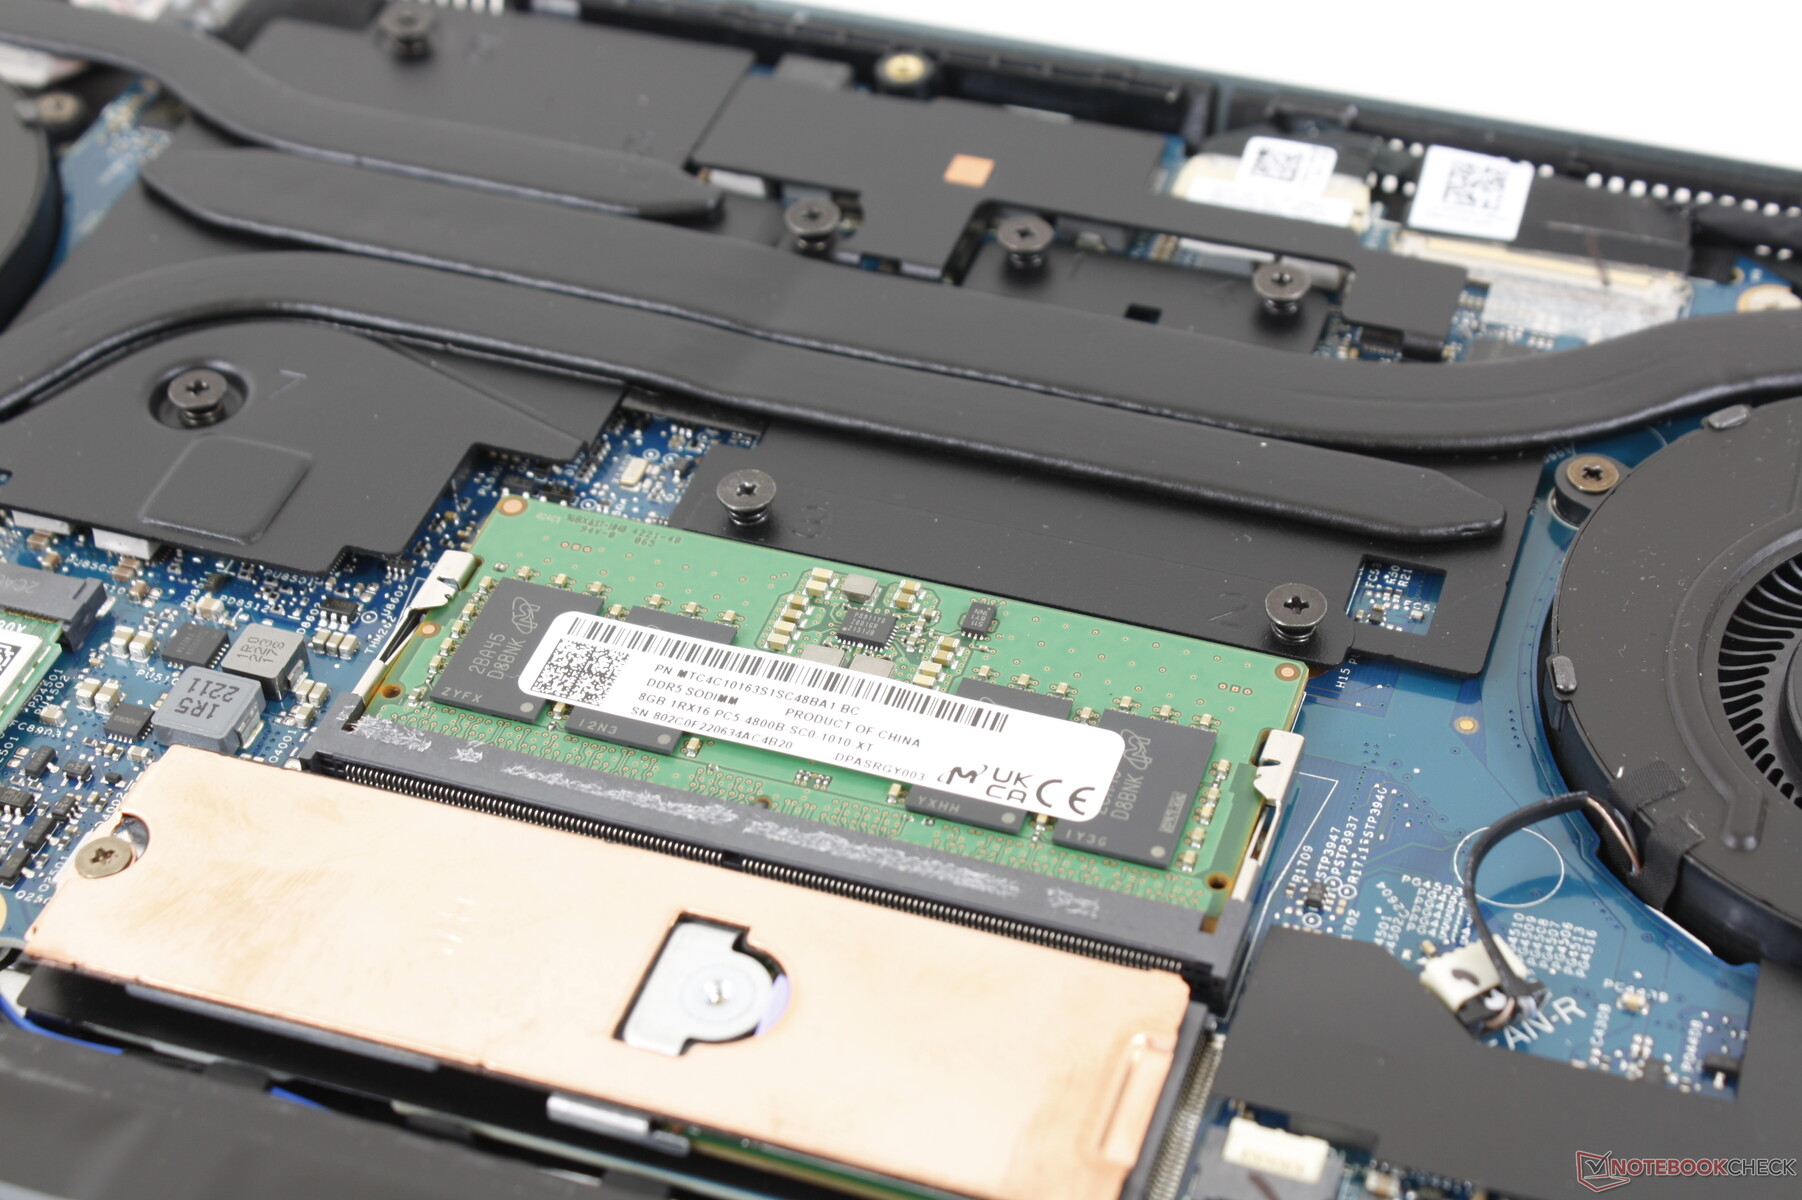
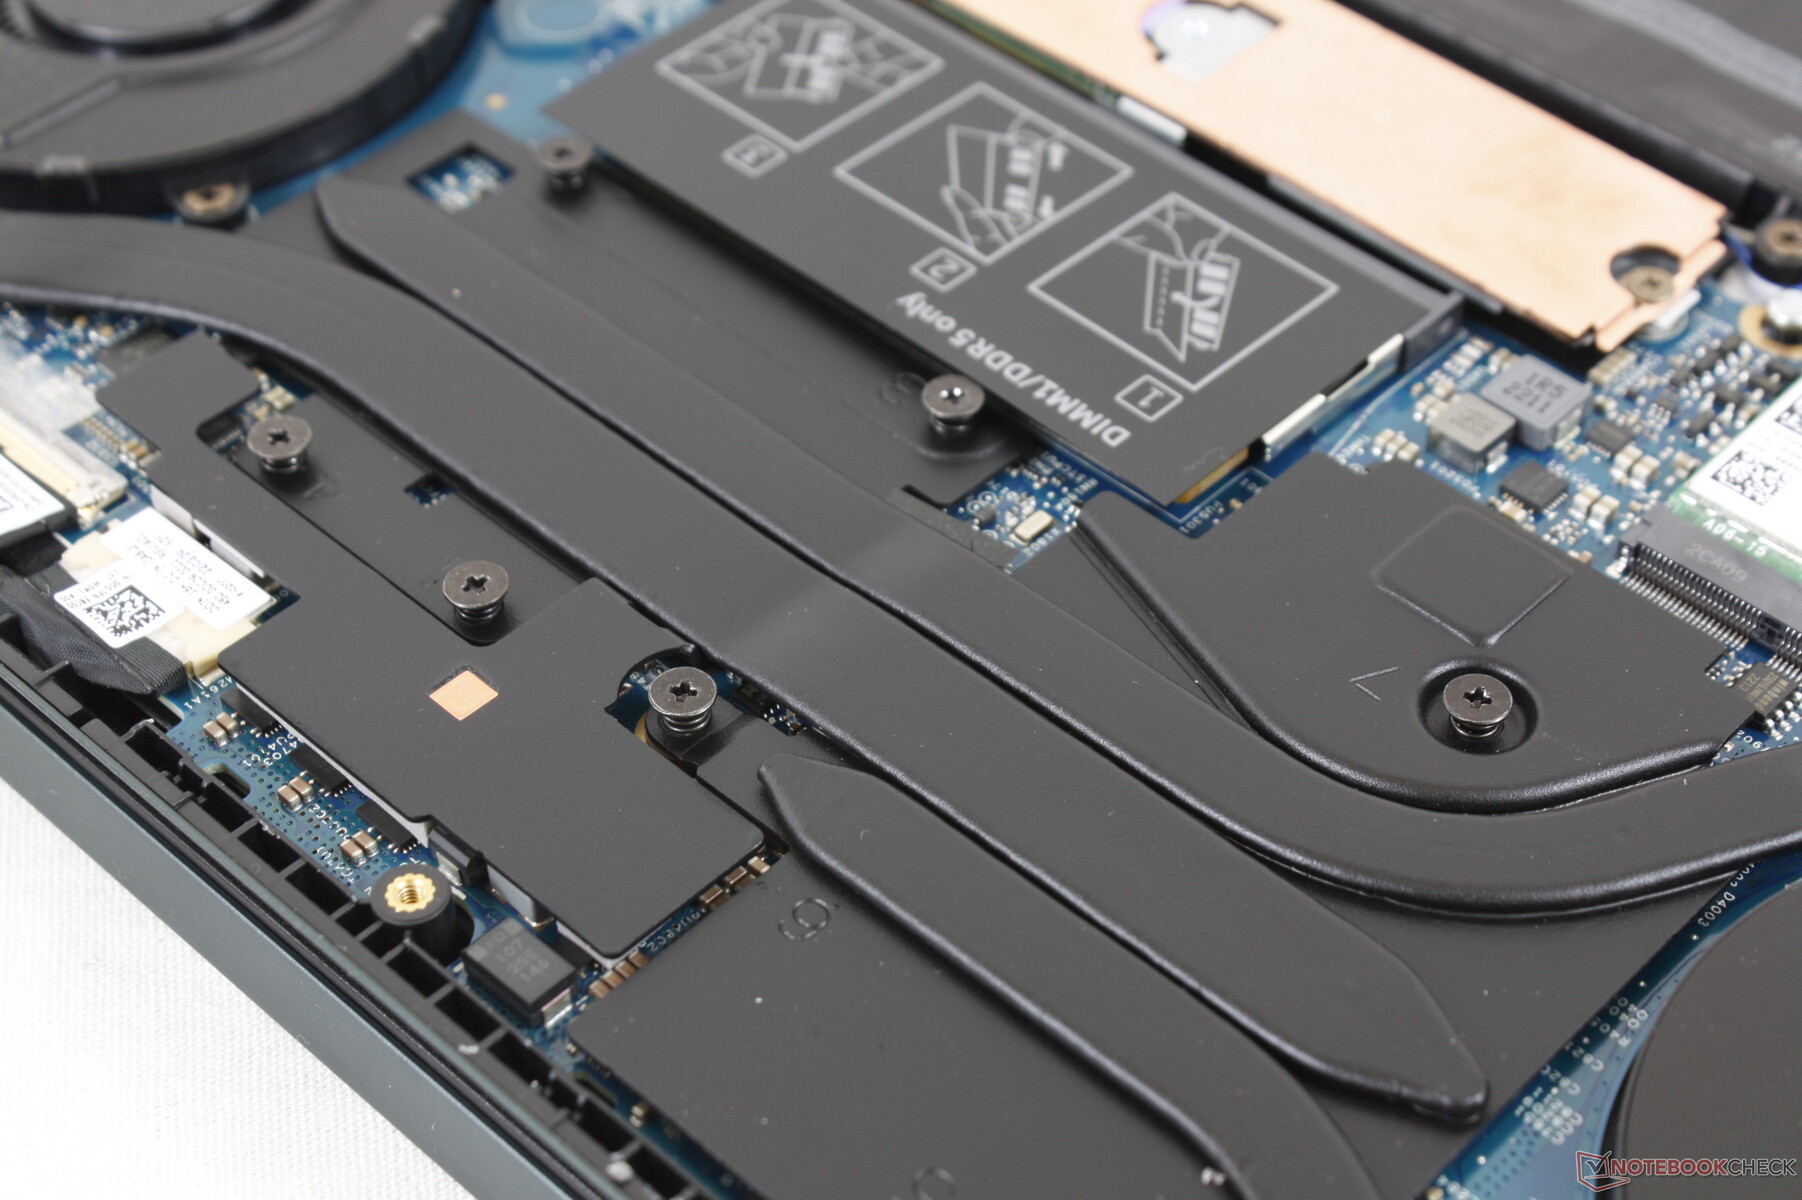
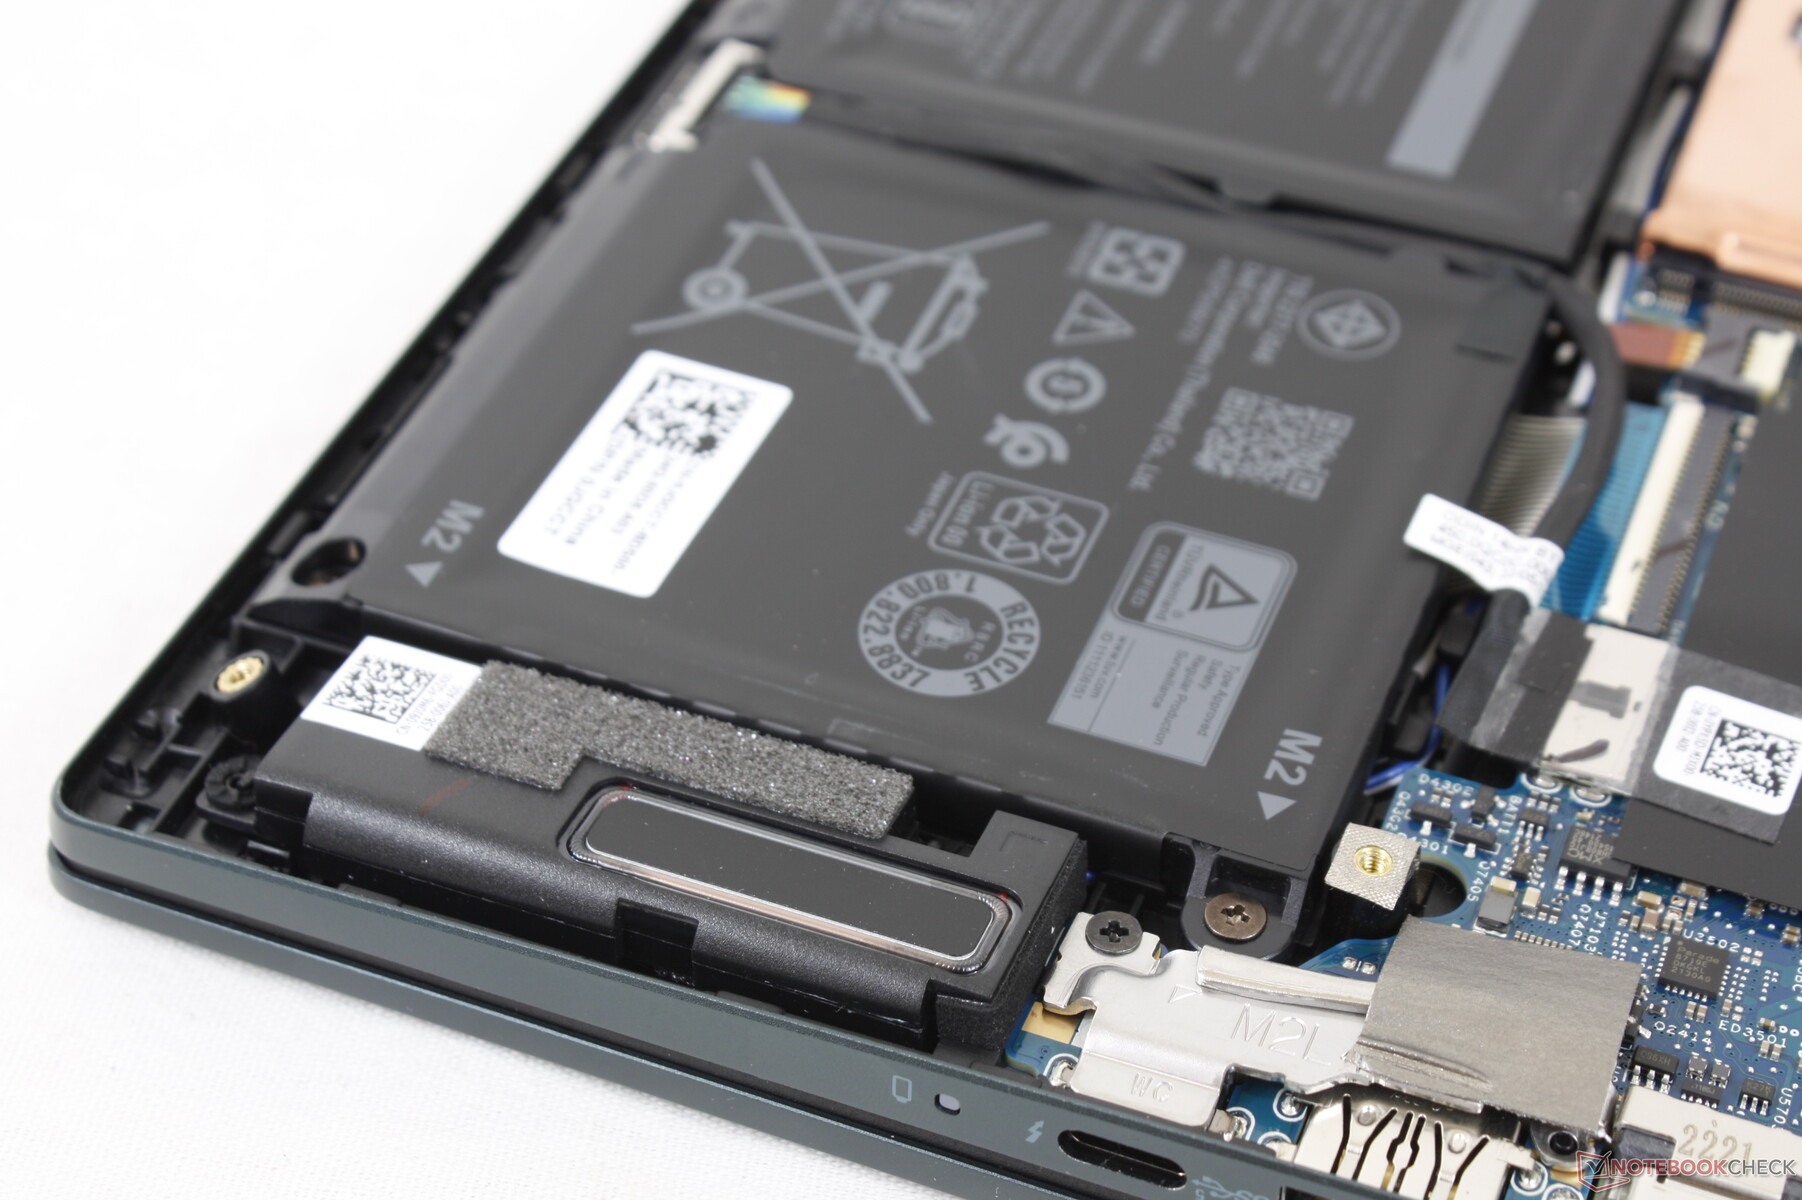
Onderhoud
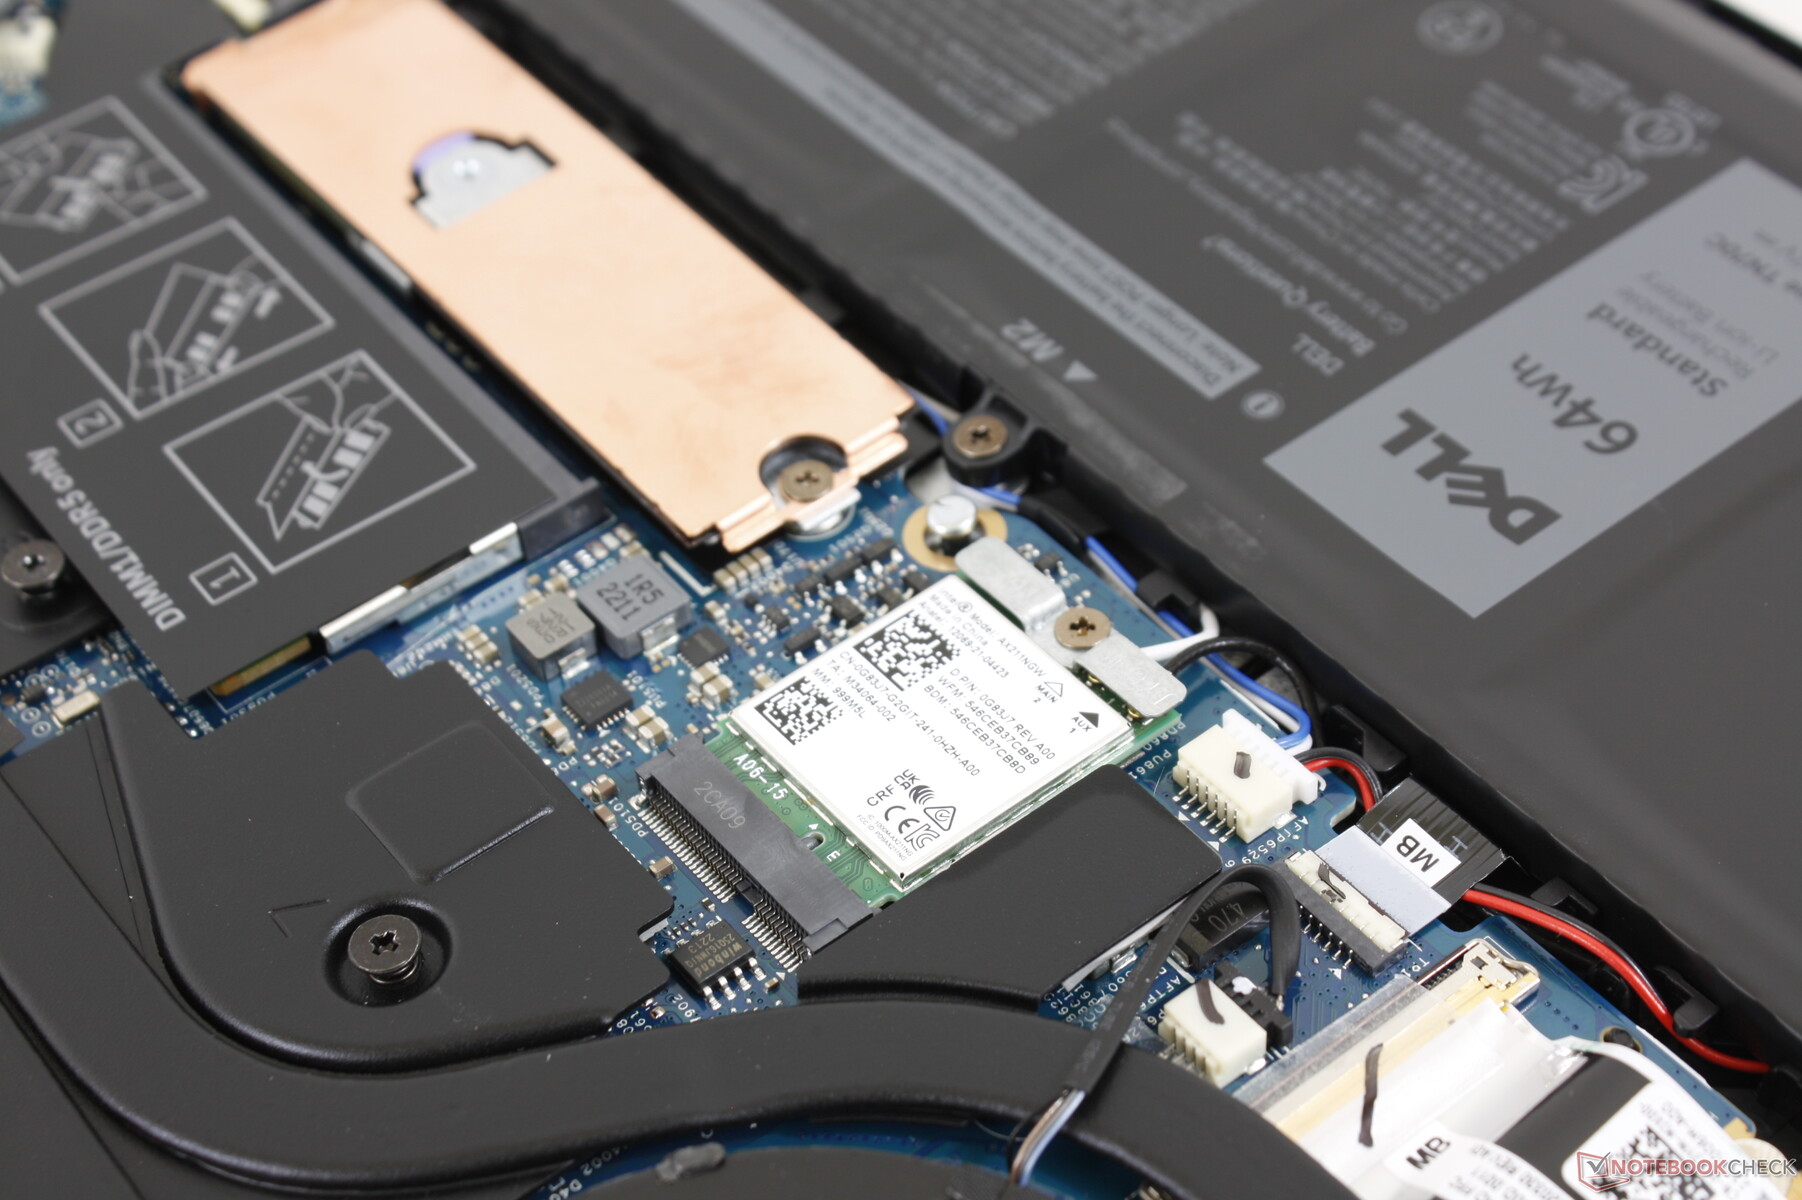
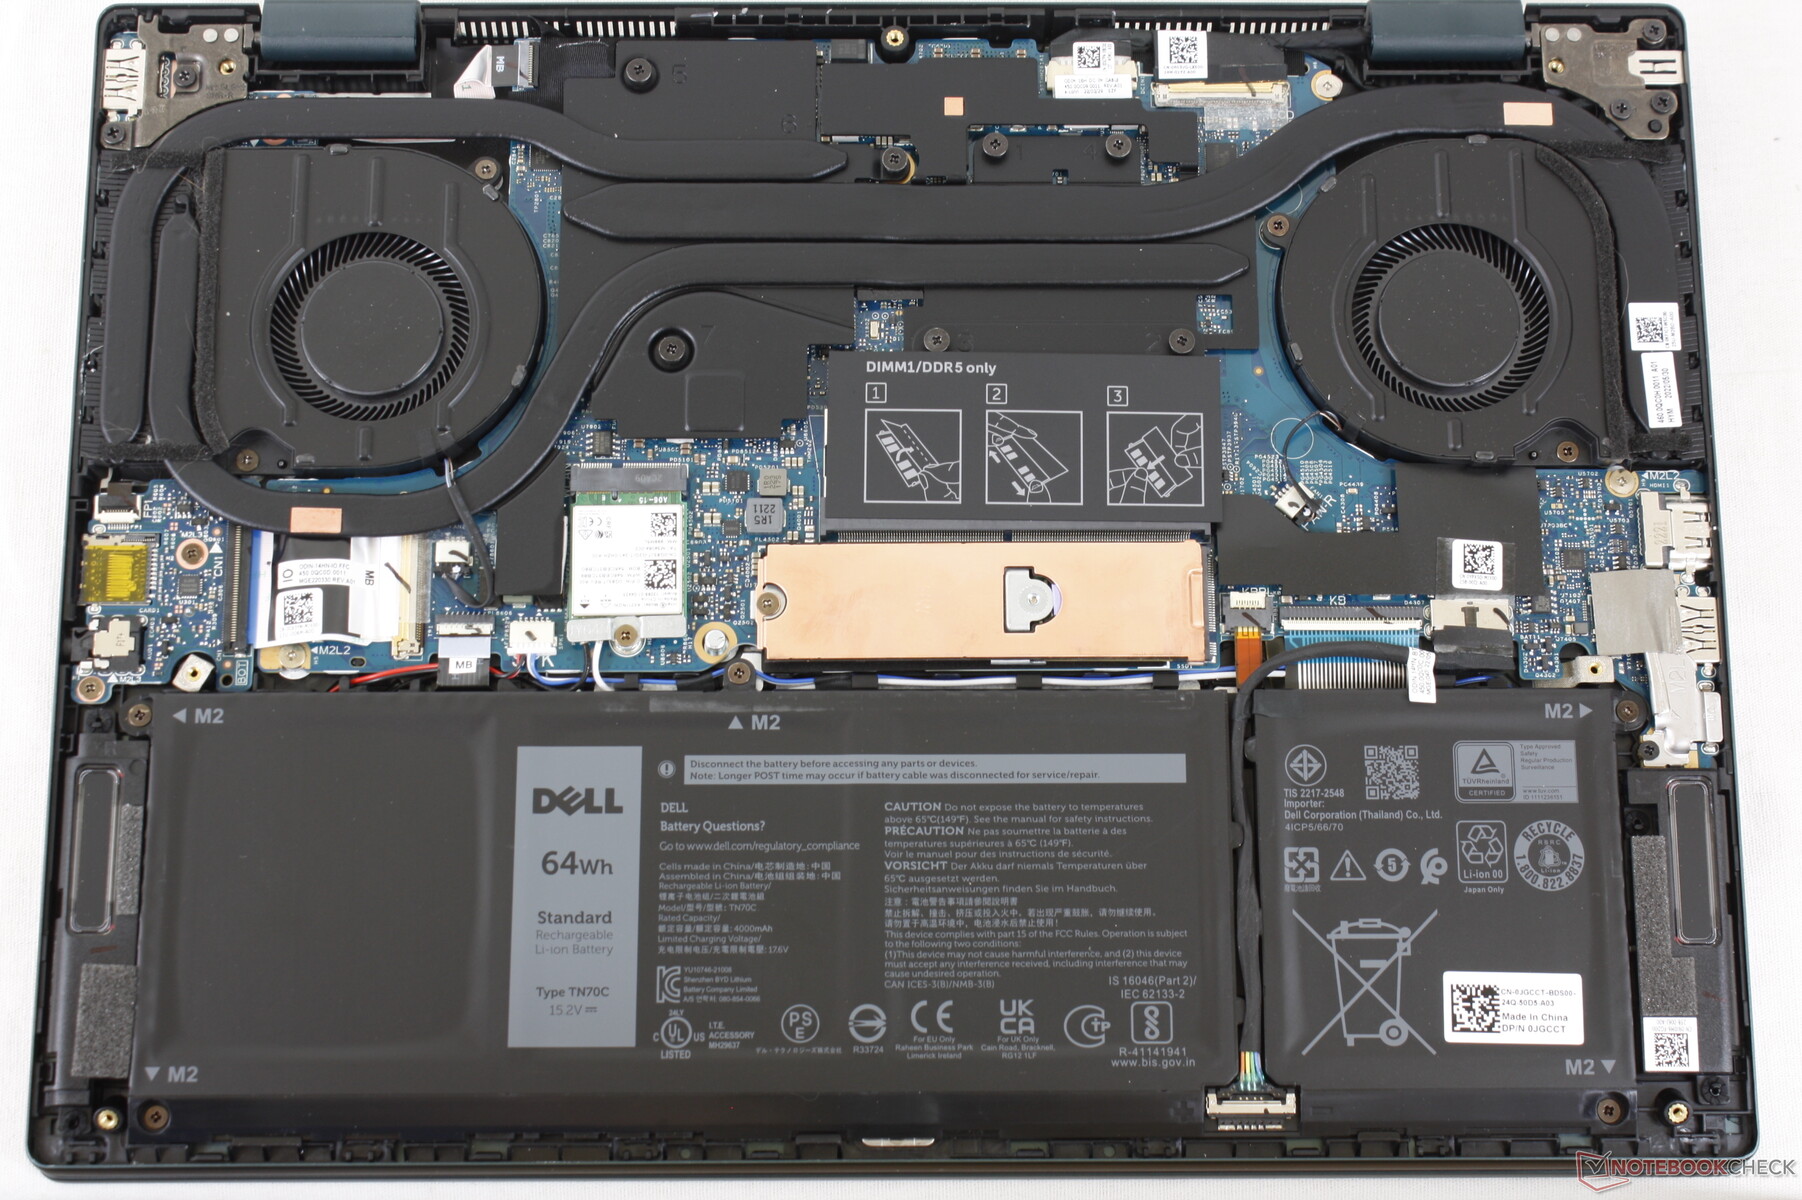
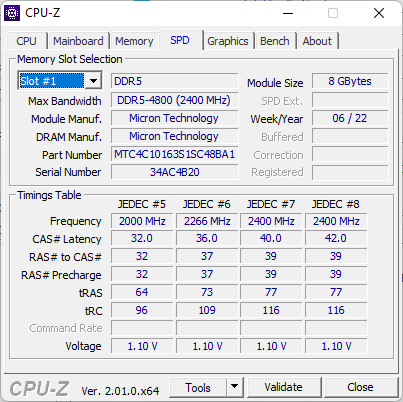
Het bodempaneel springt vrij gemakkelijk los met een Philips schroevendraaier en een scherpe plastic rand. Eenmaal binnen kunnen gebruikers de batterij, 1x M.2 2280 opslagsleuf, 1x DDR5 SODIMM sleuf, en M.2 WLAN module onderhouden. Merk op dat 8 GB RAM gesoldeerd wordt geleverd op alle SKU's, wat betekent dat gebruikers slechts een enkele module kunnen toevoegen voor een maximale RAM capaciteit van 40 GB.
Accessoires en garantie
Er zijn geen extra's in de doos, behalve de wisselstroomadapter en de papieren. De gebruikelijke beperkte garantie van één jaar is van toepassing indien gekocht in de VS.
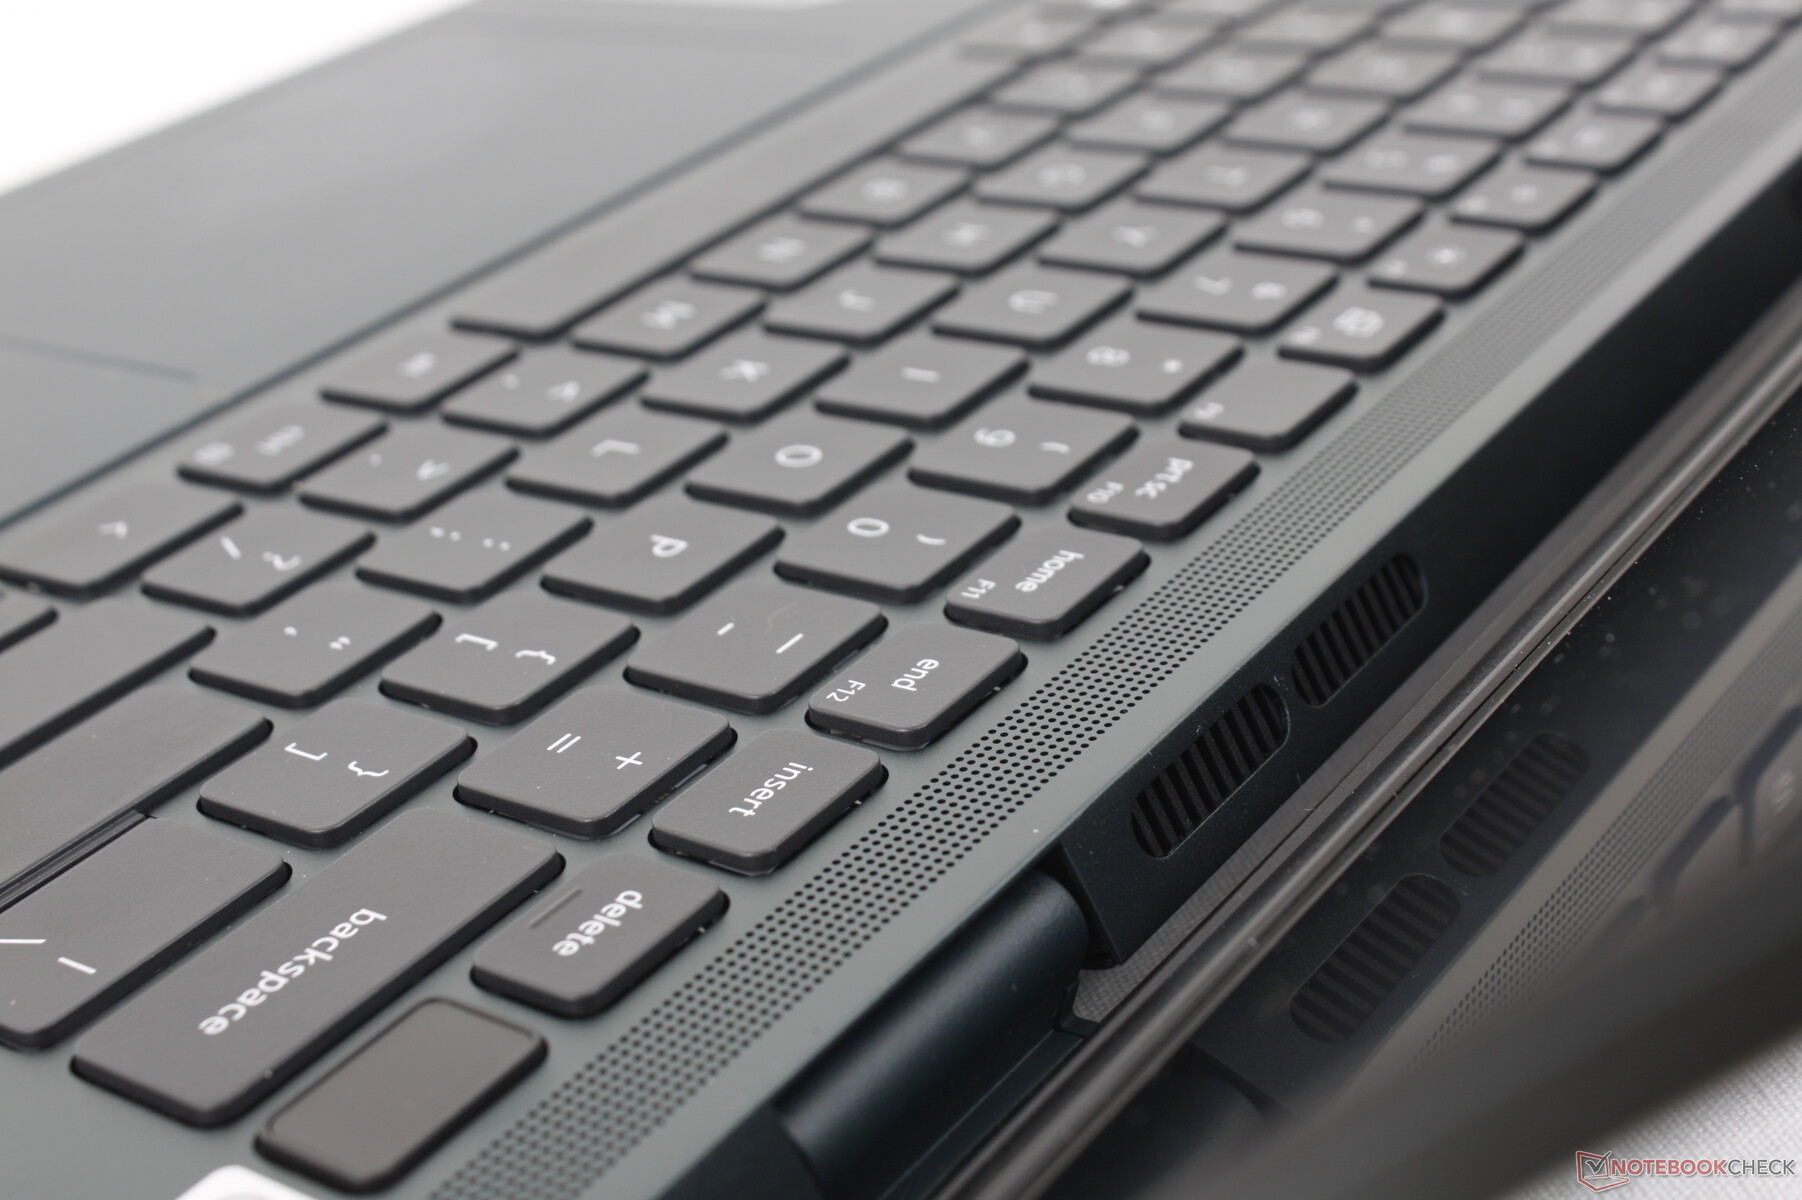
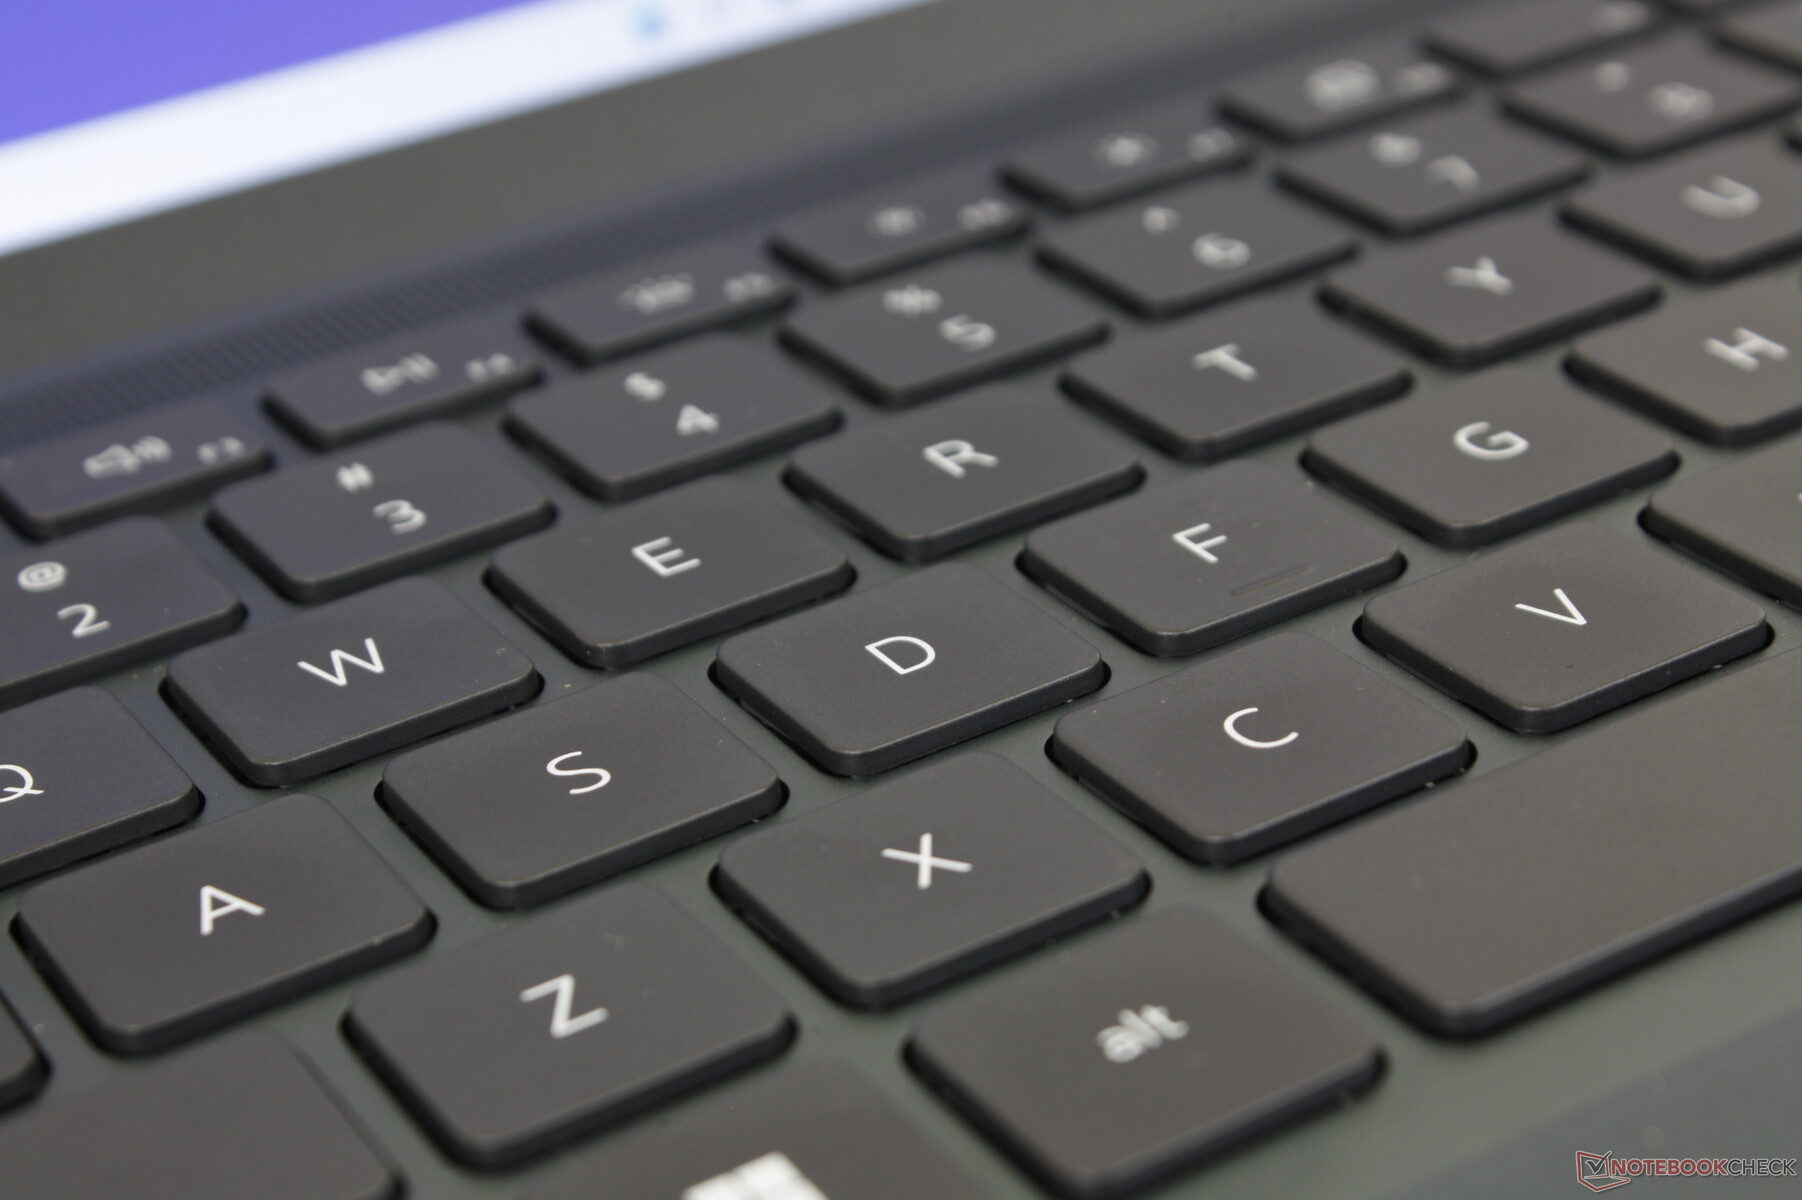
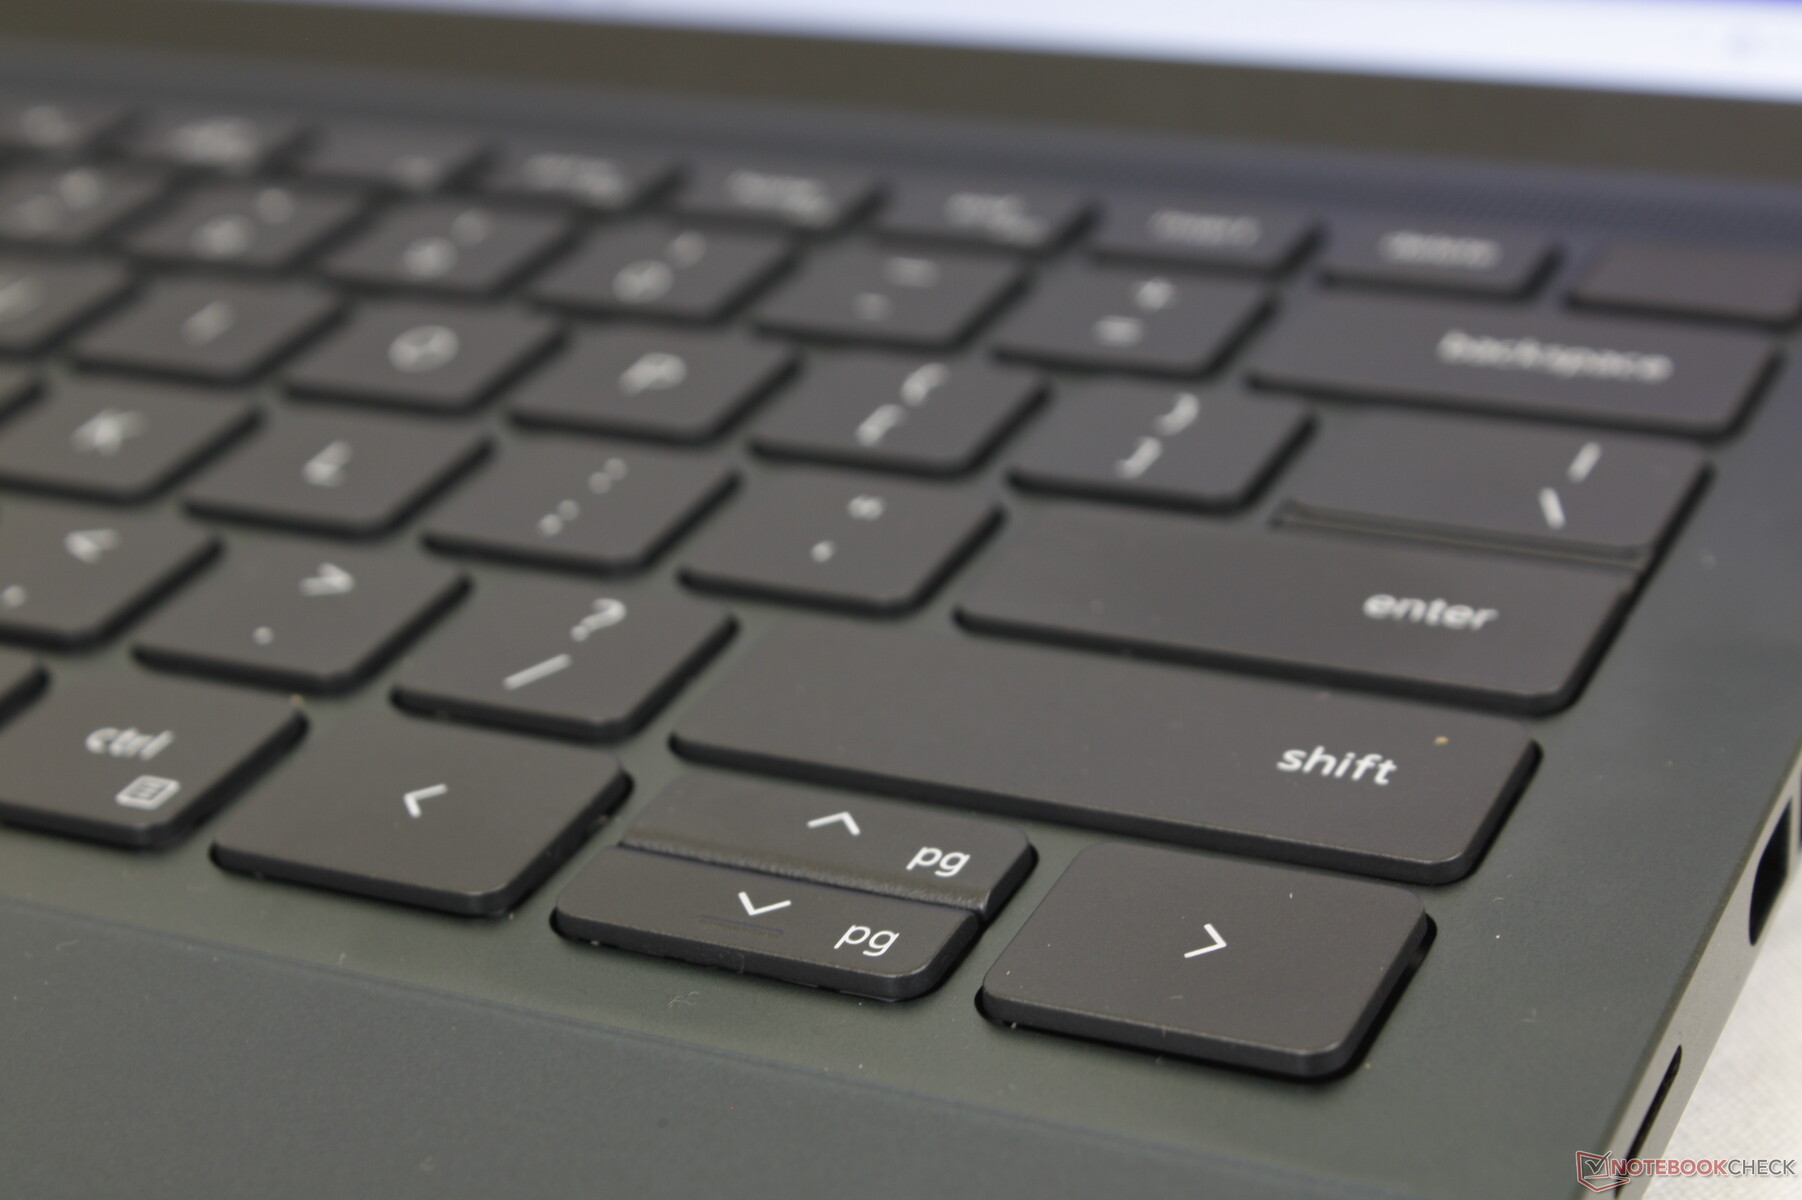
Invoerapparaten - hier geweest, dat gezien
Toetsenbord en touchpad
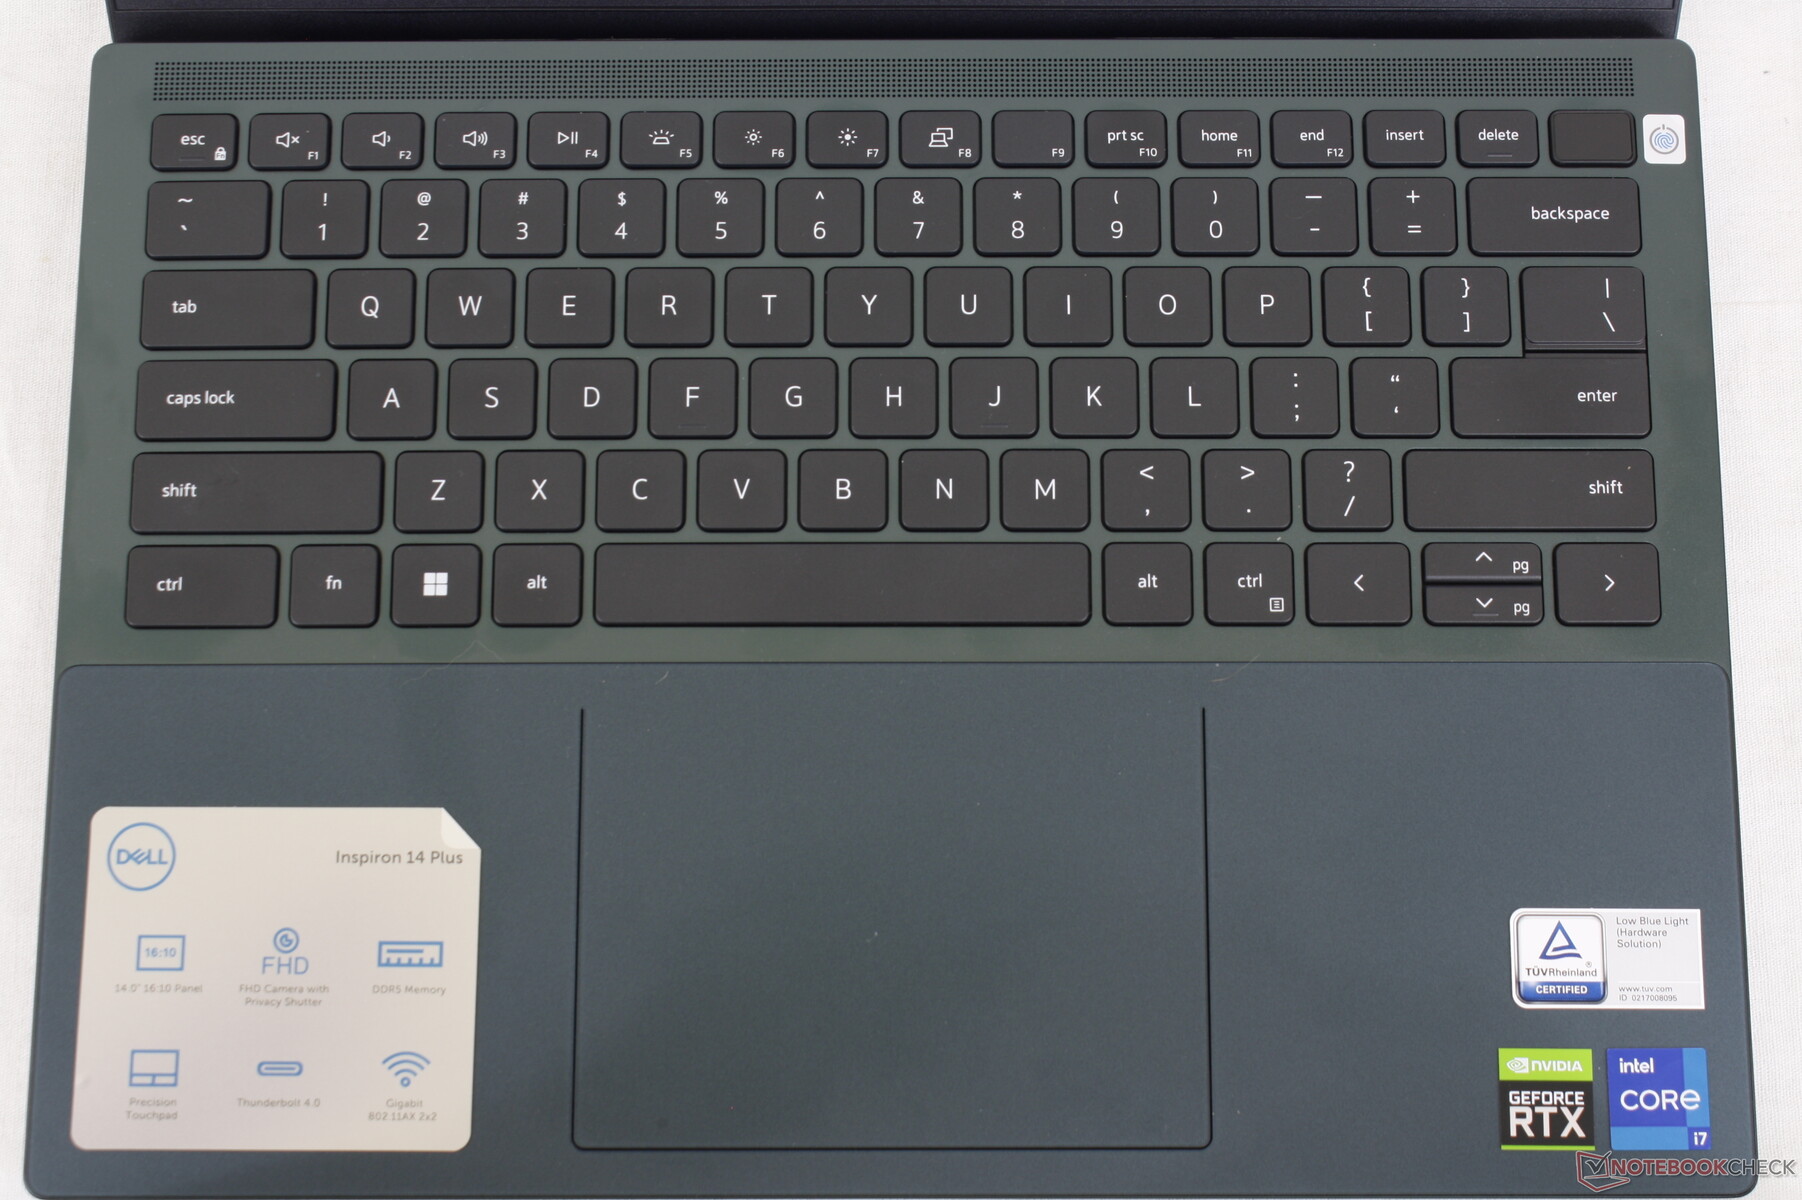
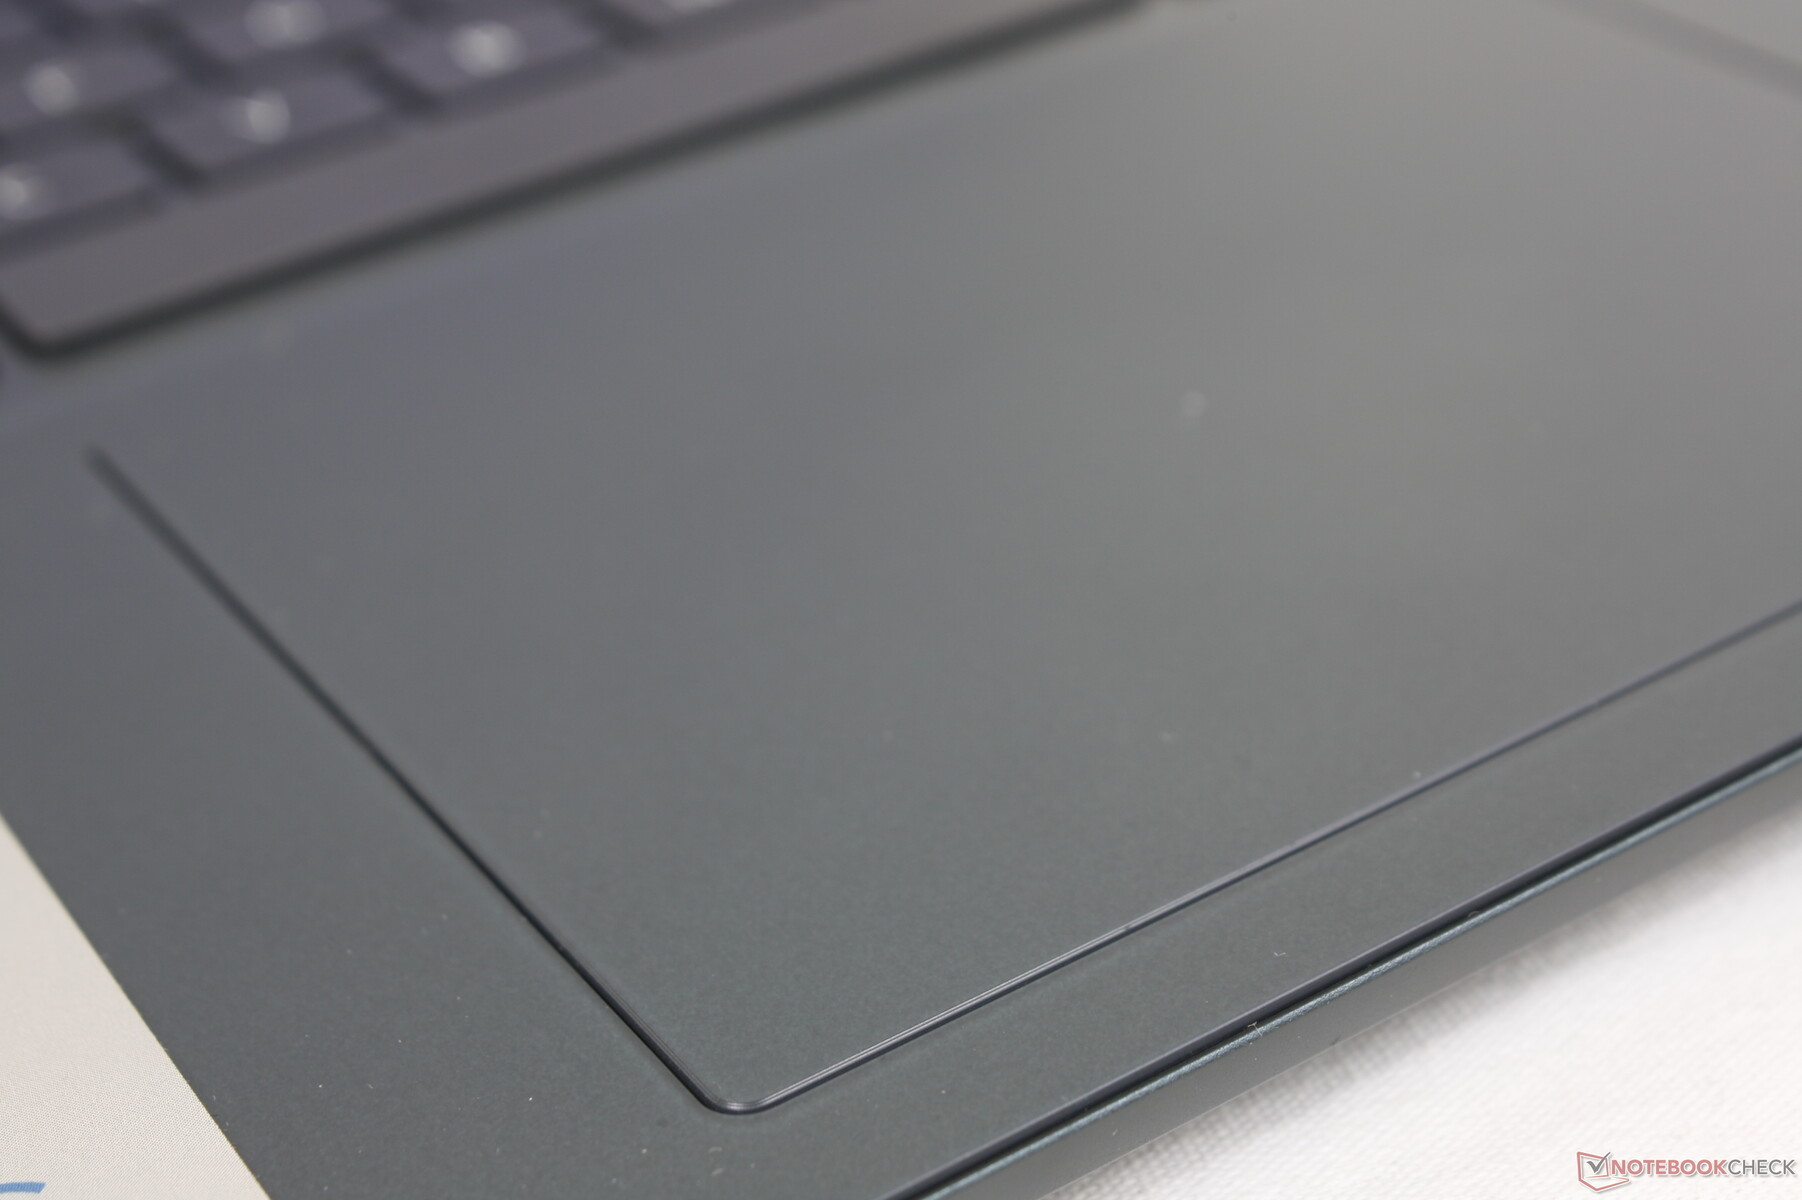
De type-ervaring is hetzelfde als op de Inspiron 16 Plus 7620,Inspiron 16 7620 2-in-1of Inspiron 14 7420 2-in-1 aangezien alle vier de modellen dezelfde toetsen en hetzelfde Mylar clickpad hebben. Zelfs de primaire en secundaire toetssymbolen en de grootte van het clickpad (11,5 x 8 cm) zijn identiek tussen de modellen, ongeacht eventuele verschillen in schermgrootte. Kortom, de toetsen geven voldoende feedback en kletteren matig, met uitzondering van de spatietoets die iets te ondiep aanvoelt. Ook het oppervlak van het clickpad werkt betrouwbaar voor standaard cursorbesturing, terwijl de geïntegreerde toetsen te zacht en sponzig zijn bij slepen en neerzetten.
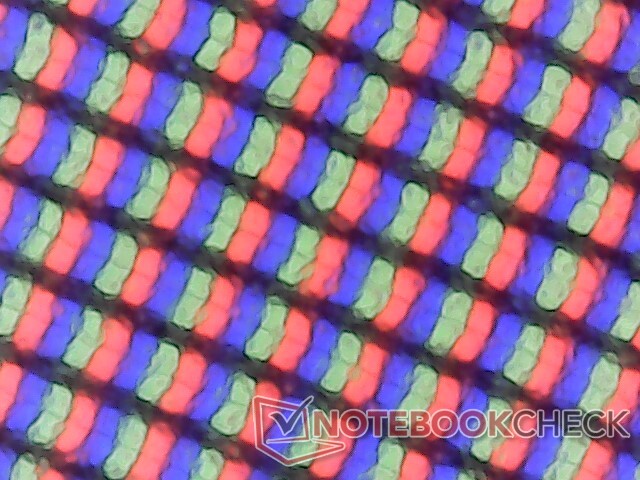
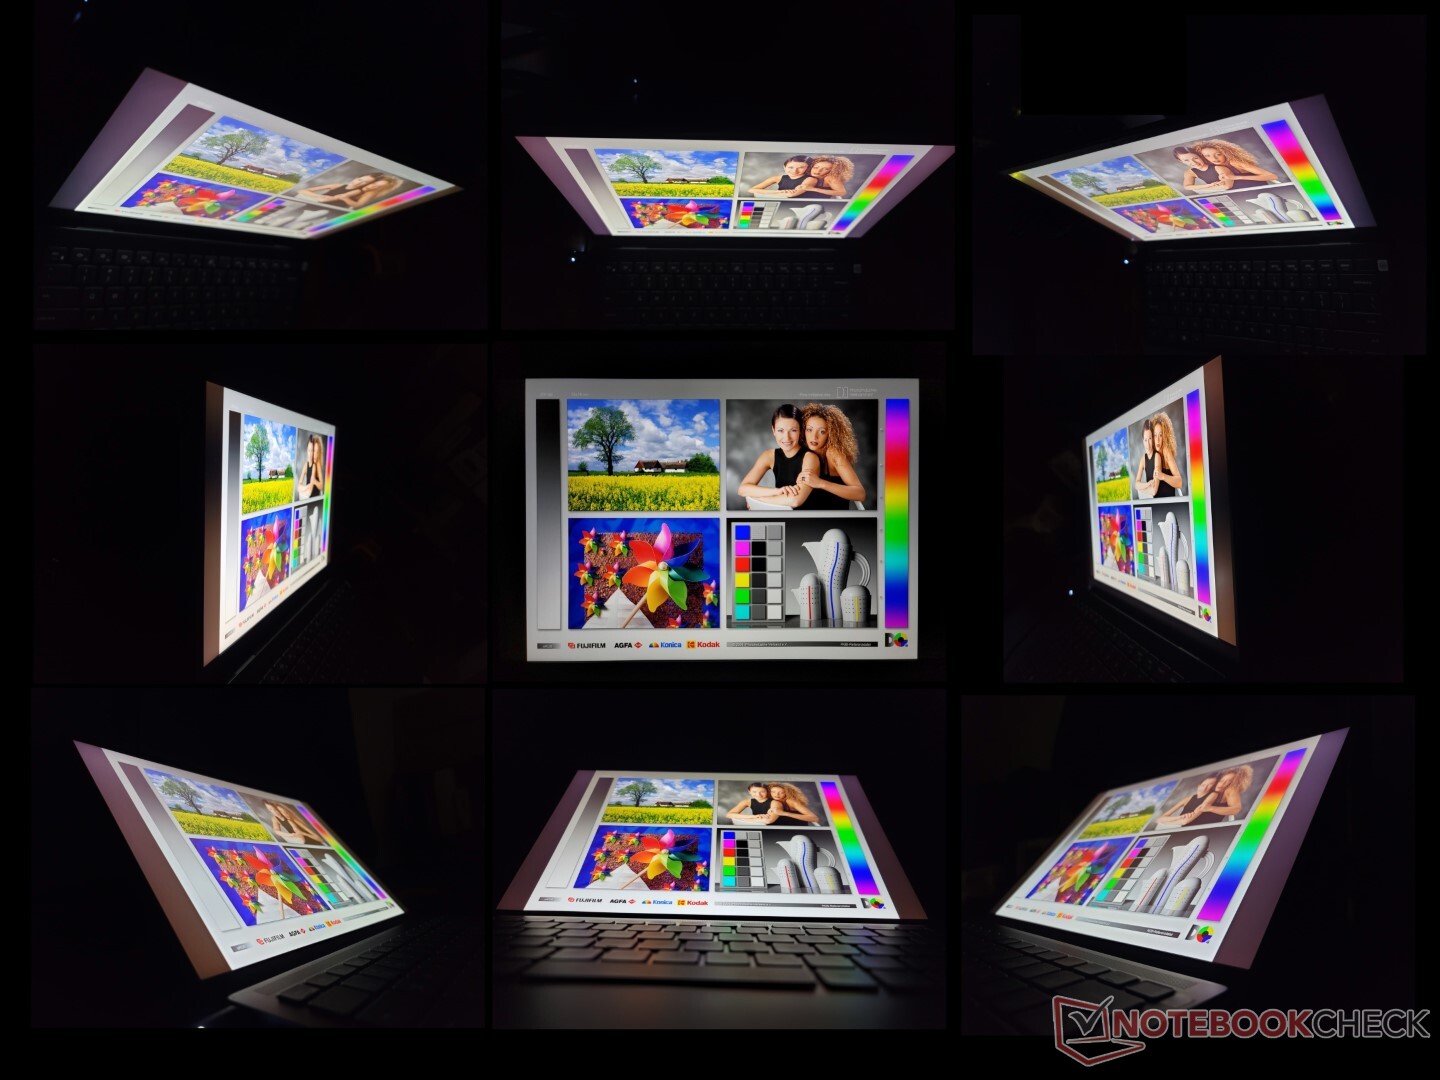
Beeldscherm - Volledige sRGB-dekking en 60 Hz
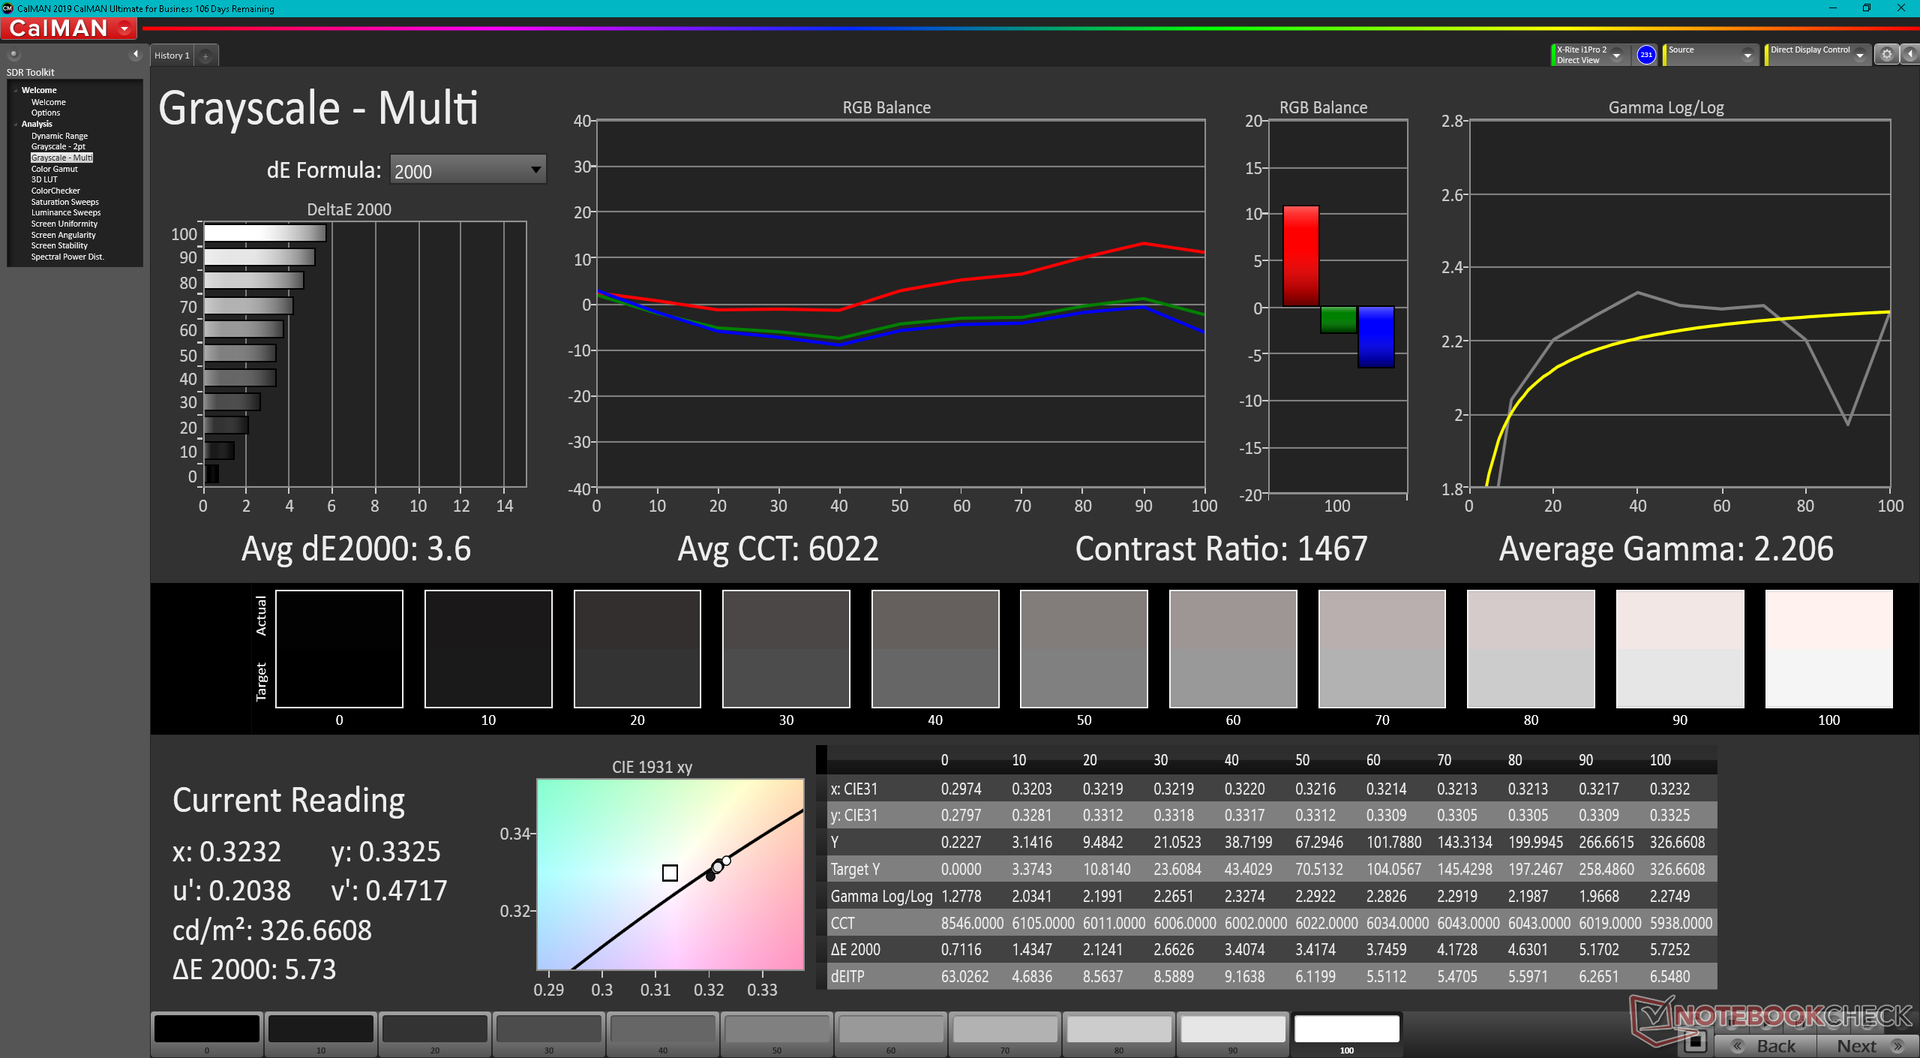
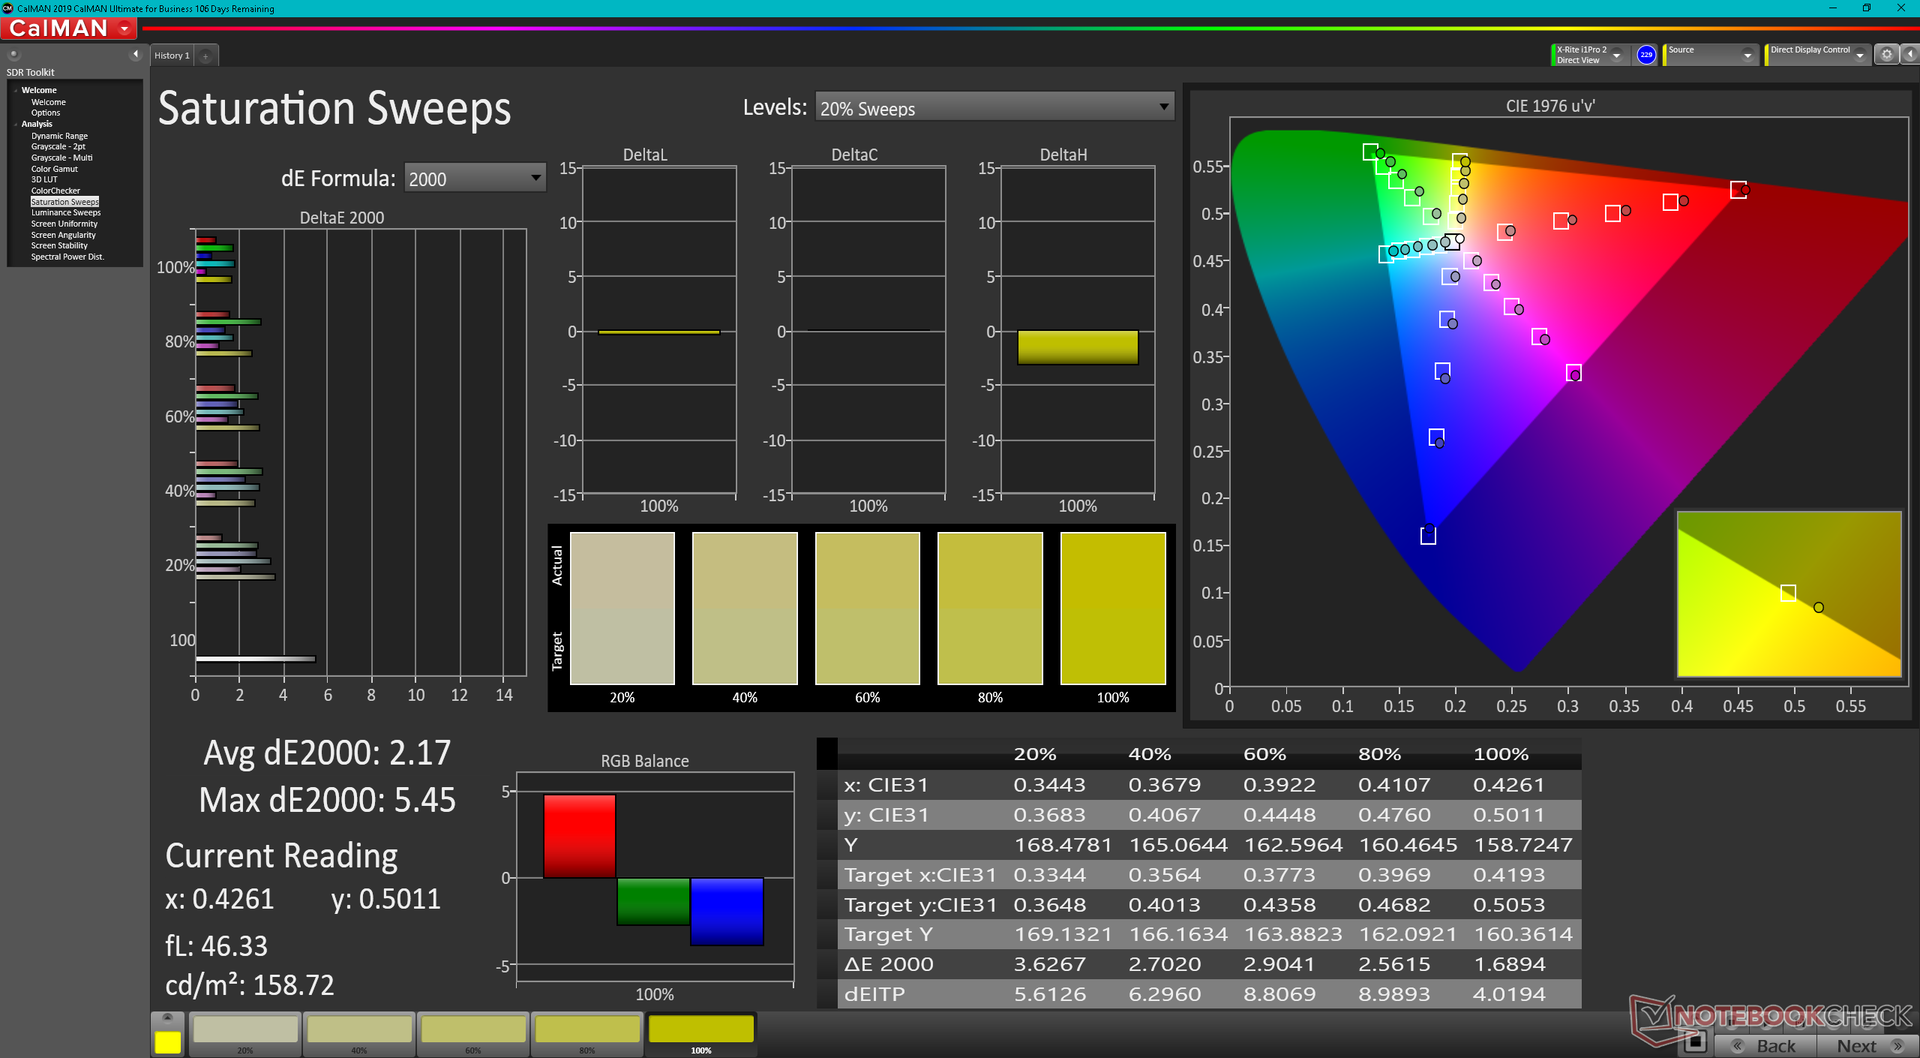
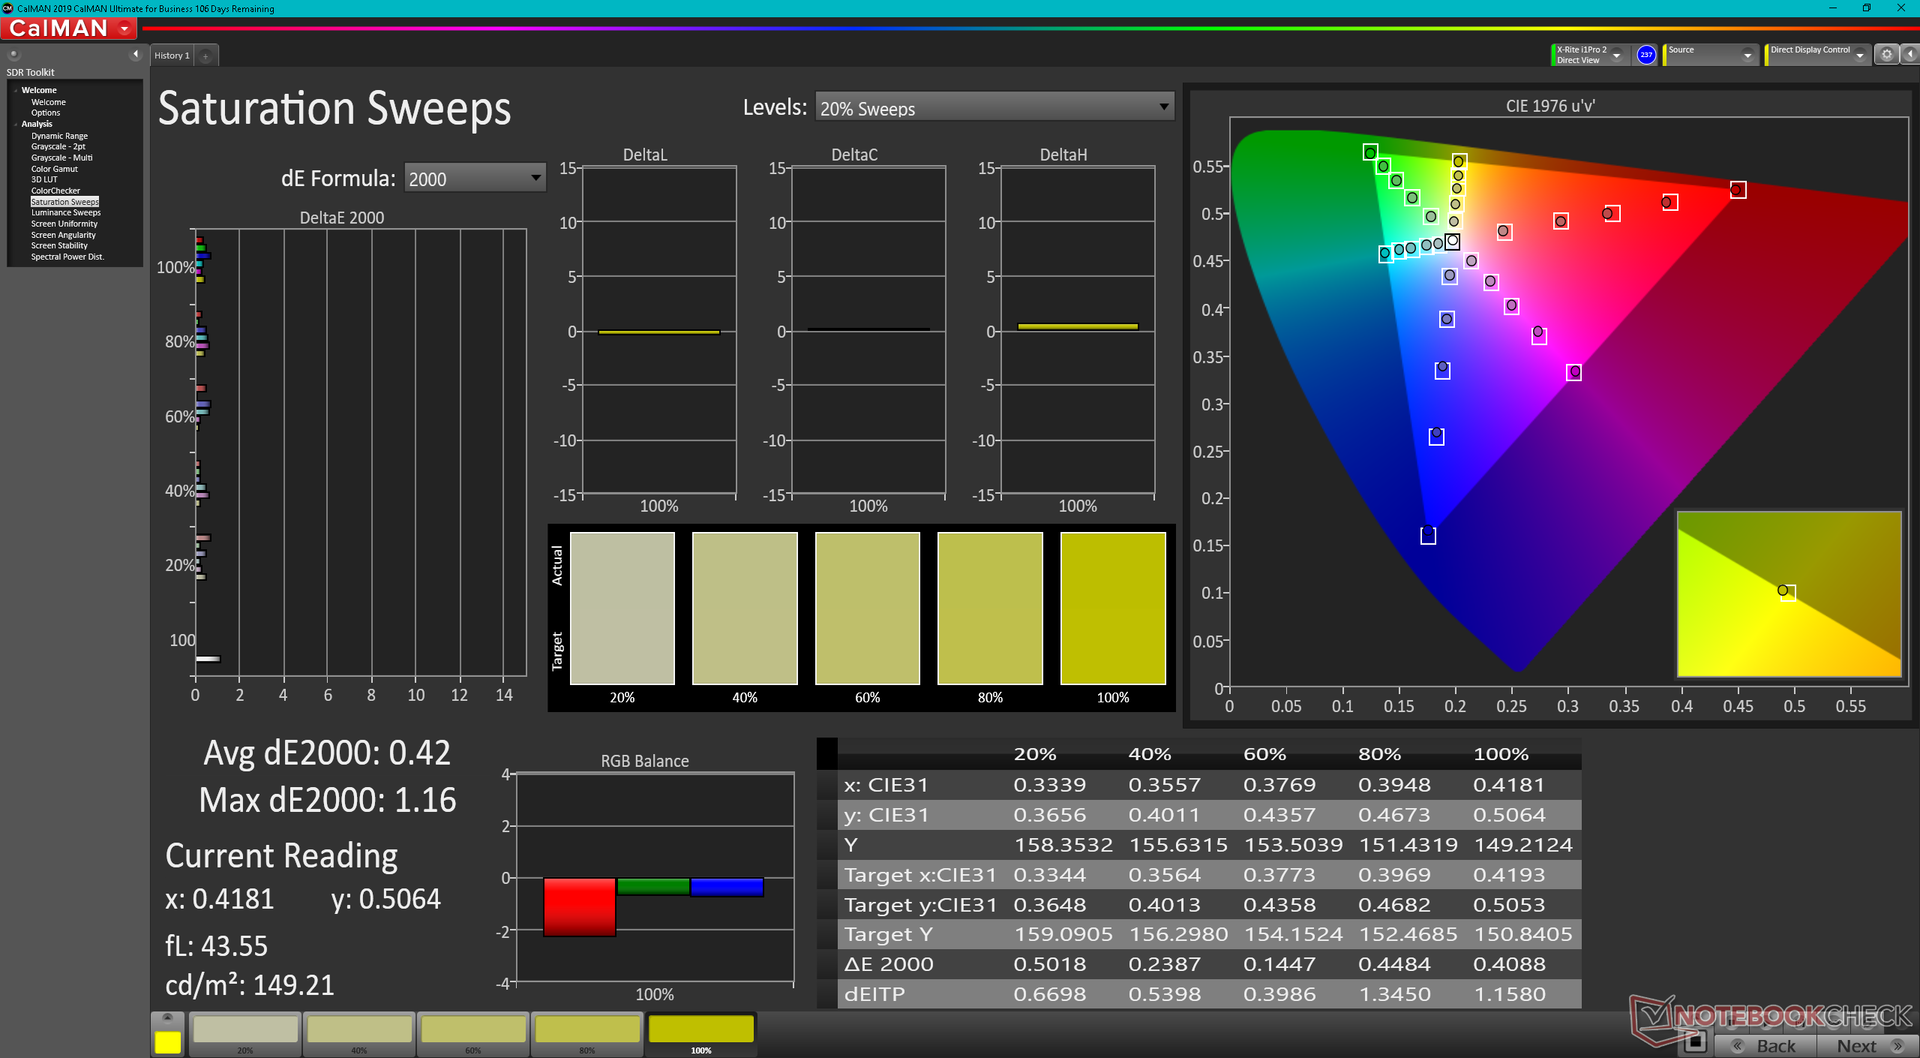
Terwijl andere 14-inch laptops doorgaans mikken op native resoluties van 1200p, 1800p of 2160p, wordt de Inspiron 14 Plus 7420 standaard geleverd met een relatief ongebruikelijk 2.2K- of 2240 x 1400-paneel. De belangrijkste kenmerken zijn verder solide, inclusief de volledige sRGB-dekking, ~1000:1 contrastratio, en fatsoenlijke responstijden voor zijn formaatklasse. Het is jammer dat er geen OLED of glanzende opties beschikbaar zijn om de kleuren of scherpte nog verder op te voeren.
| |||||||||||||||||||||||||
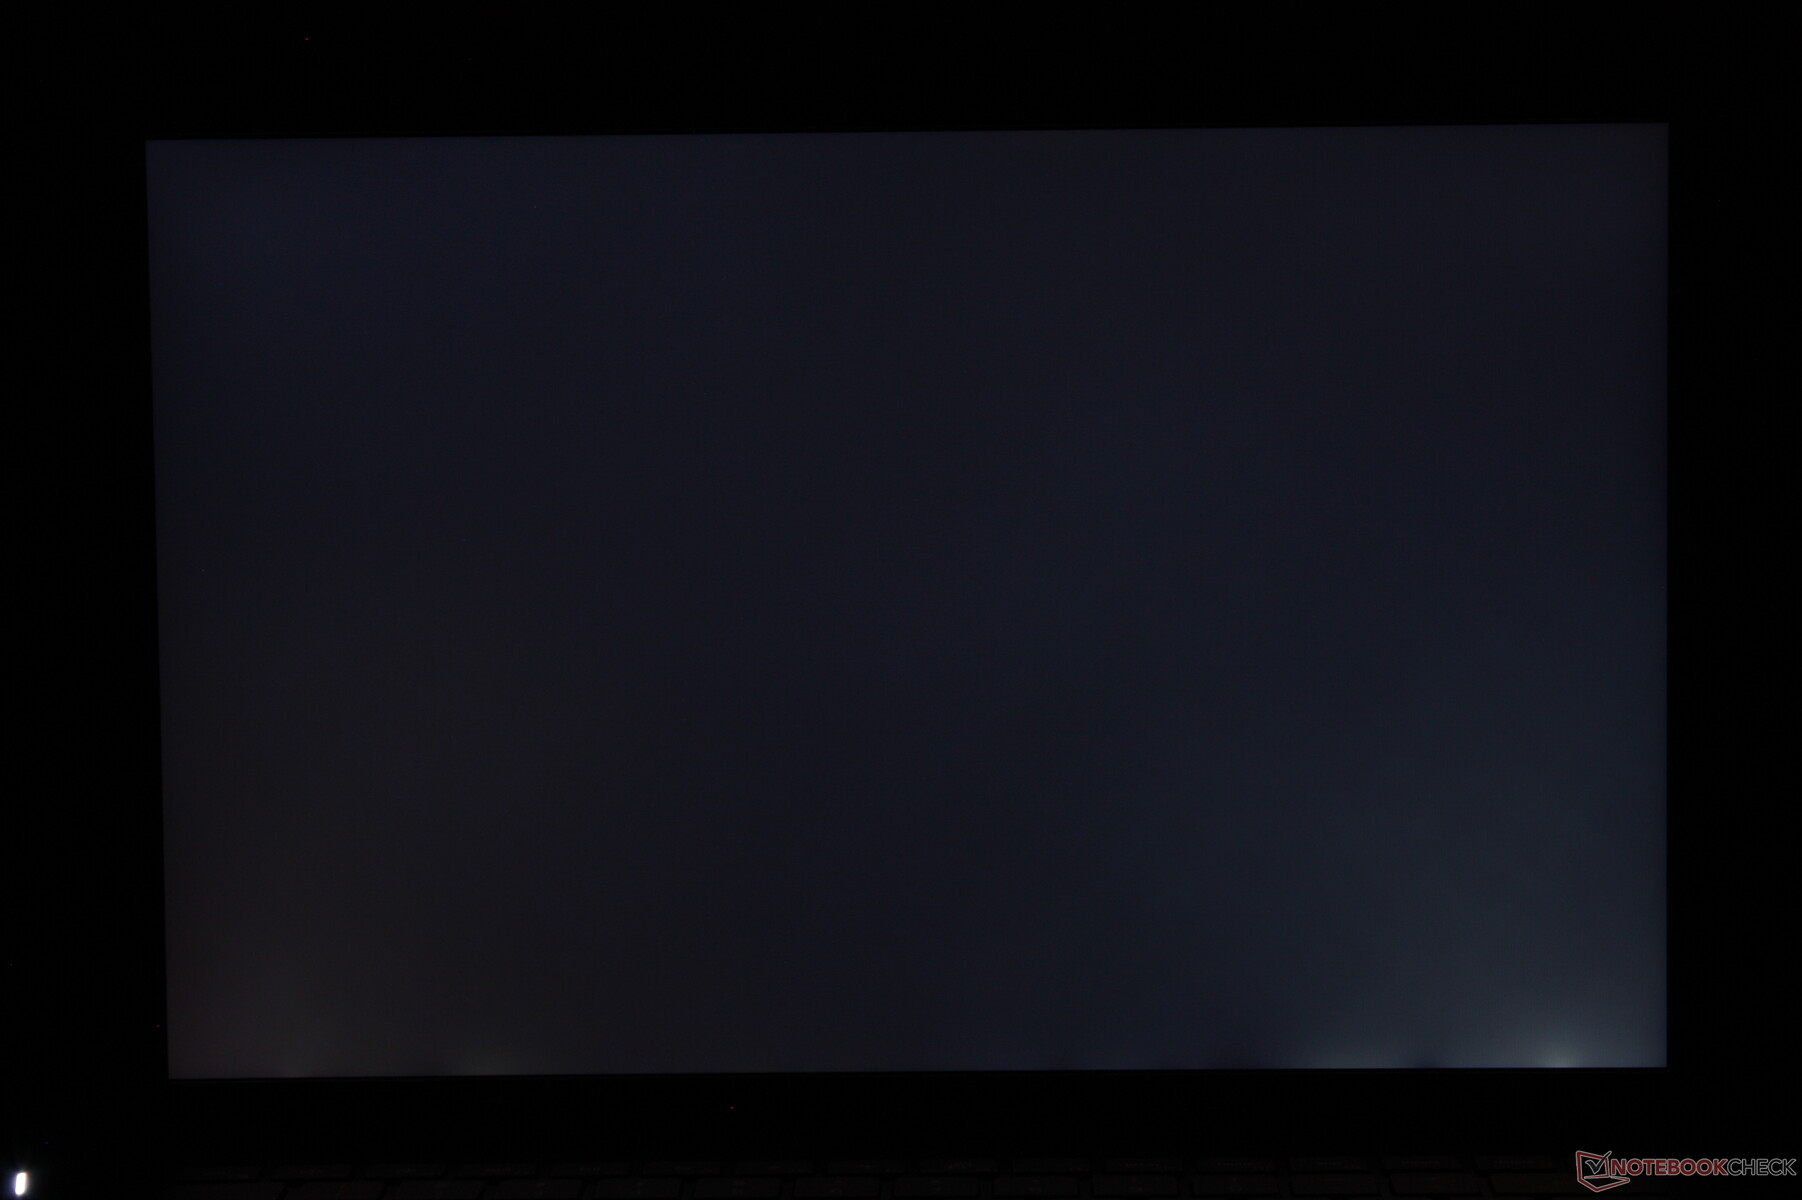
Helderheidsverdeling: 85 %
Helderheid in Batterij-modus: 331.1 cd/m²
Contrast: 1142:1 (Zwart: 0.29 cd/m²)
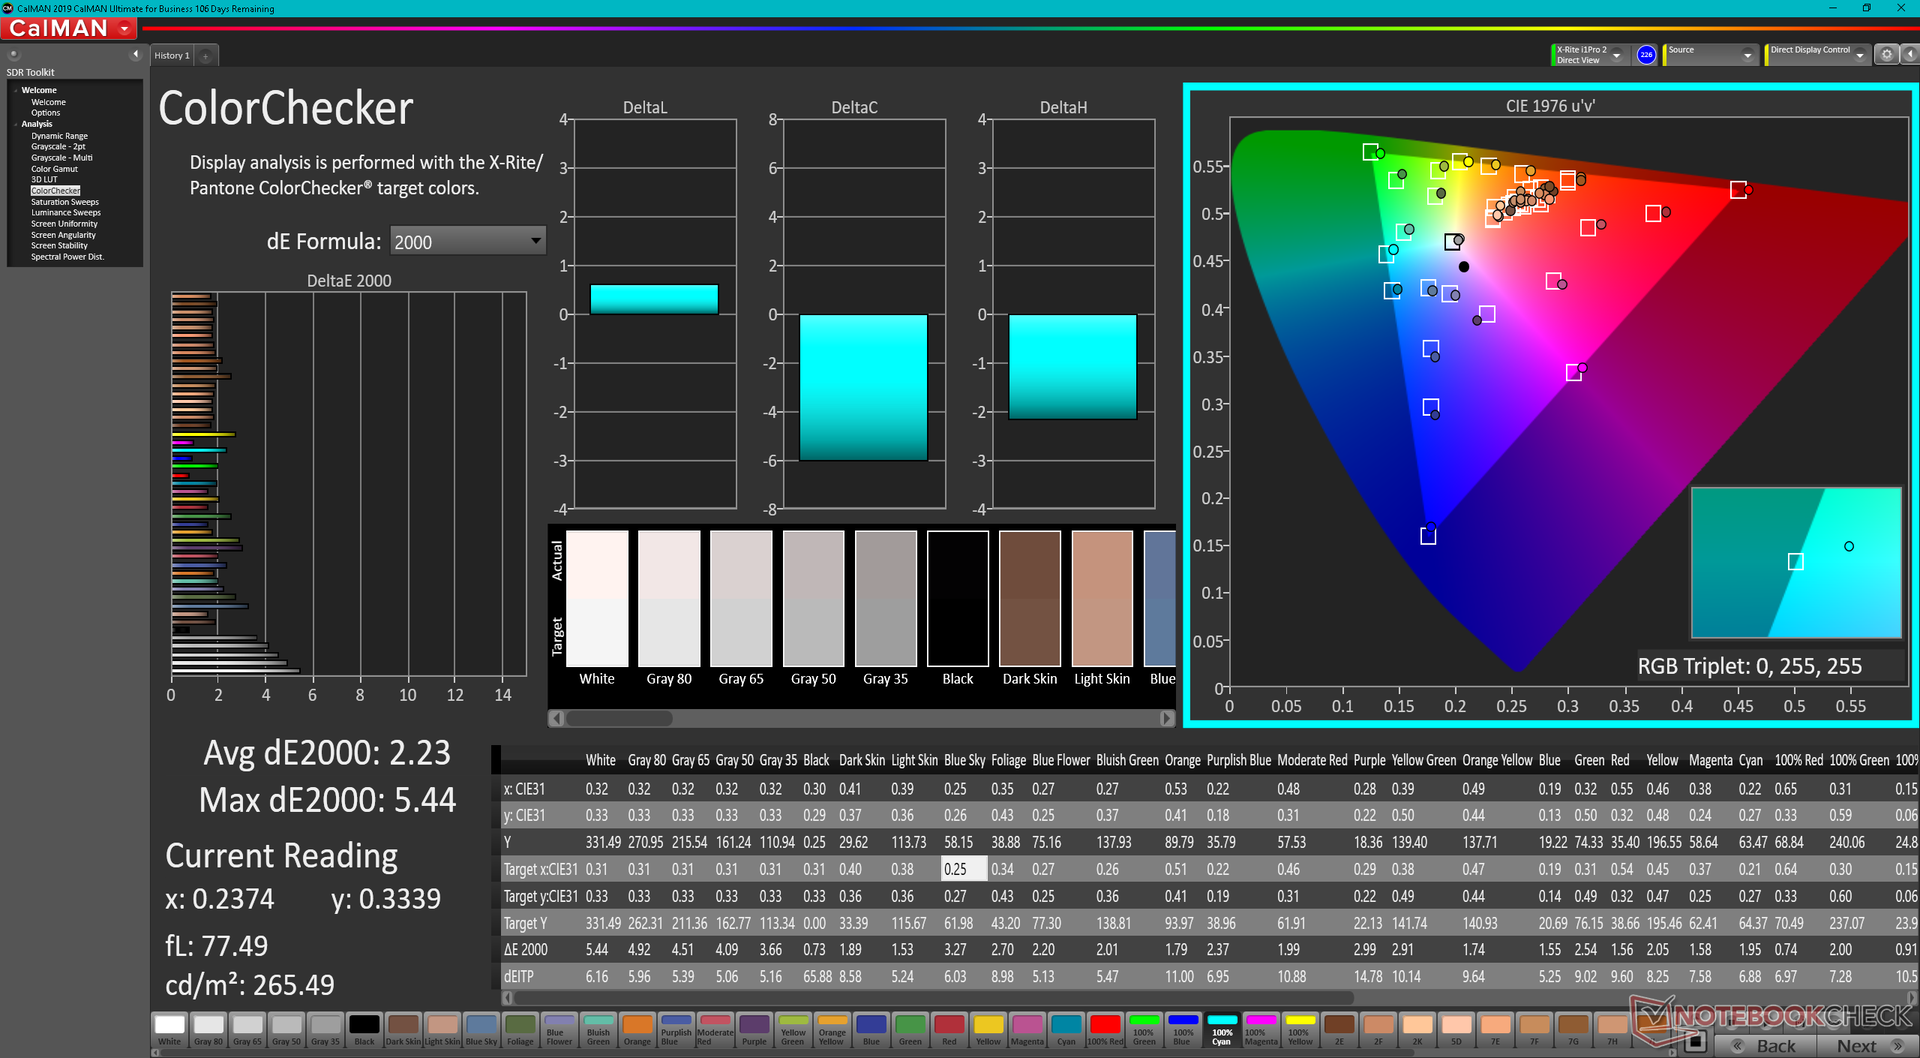
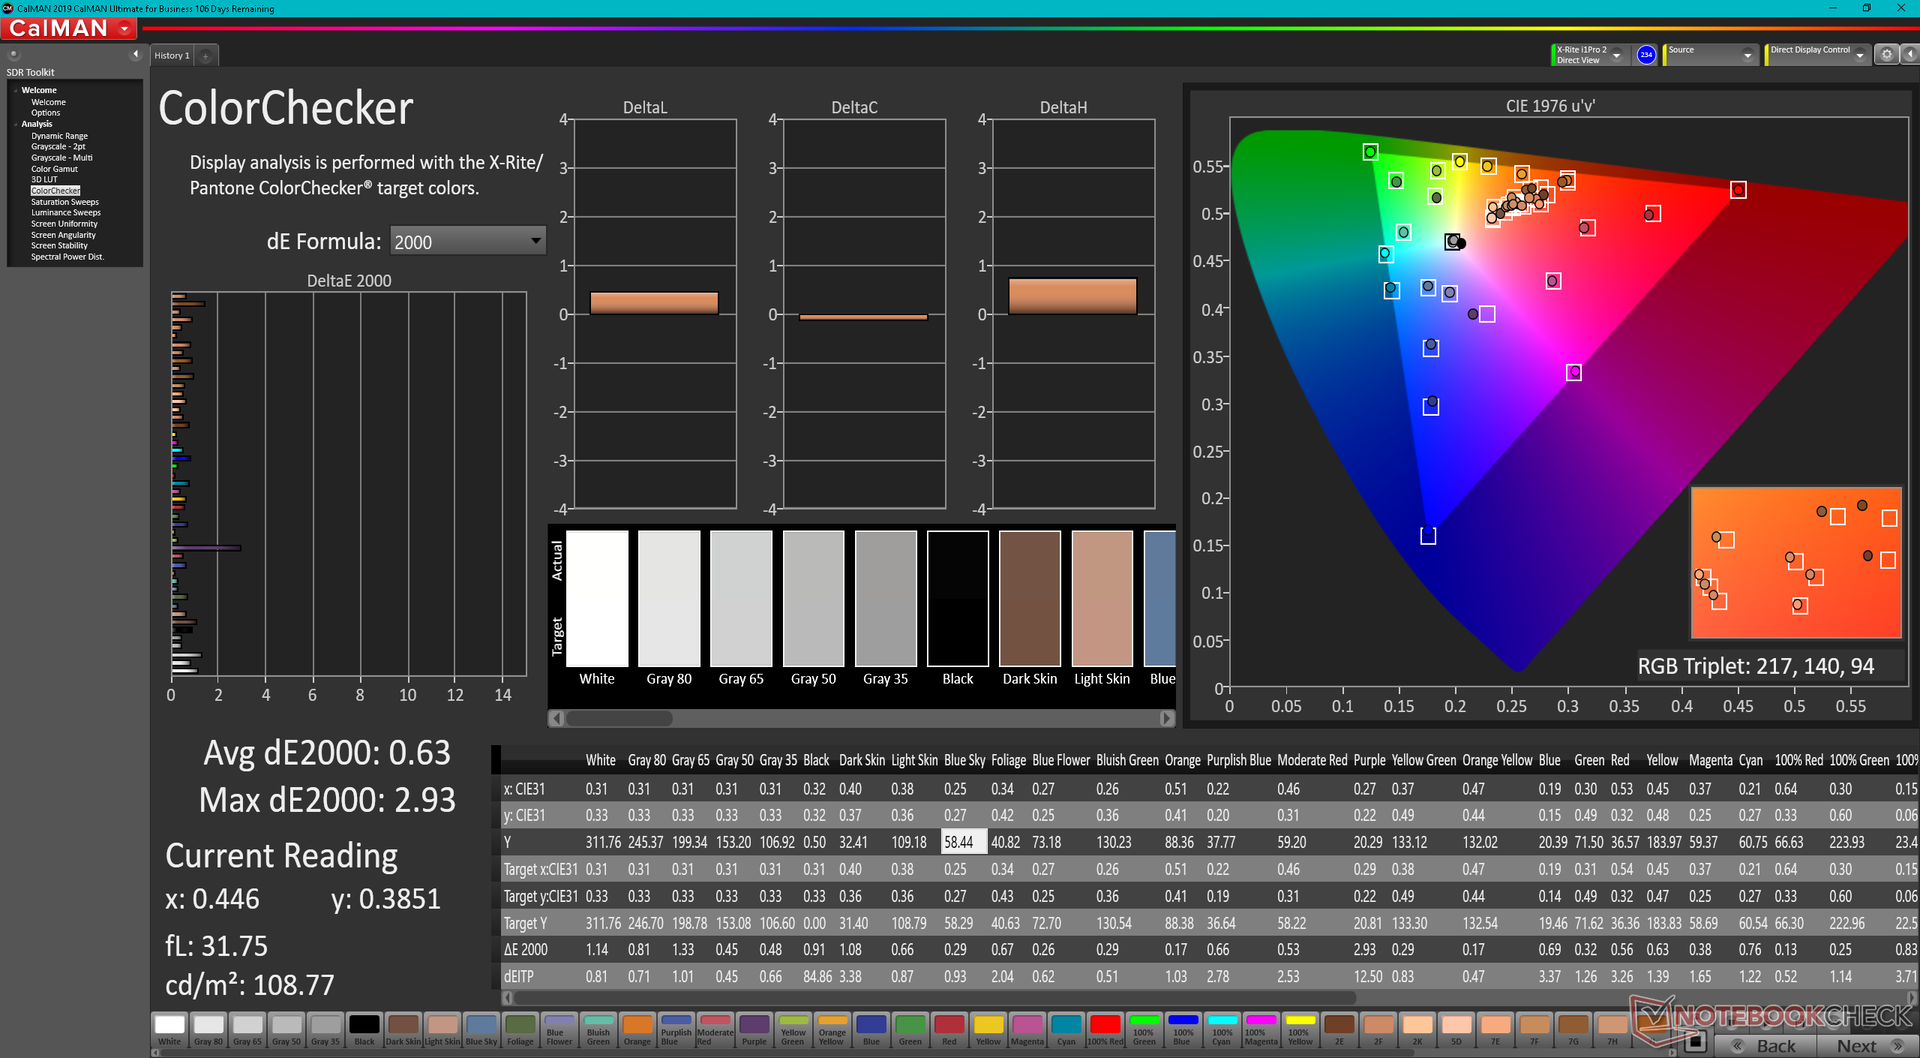
ΔE ColorChecker Calman: 2.23 | ∀{0.5-29.43 Ø4.71}
calibrated: 0.63
ΔE Greyscale Calman: 3.6 | ∀{0.09-98 Ø4.96}
69.5% AdobeRGB 1998 (Argyll 3D)
99.3% sRGB (Argyll 3D)
68.8% Display P3 (Argyll 3D)
Gamma: 2.21
CCT: 6022 K
| Dell Inspiron 14 Plus 7420 InfoVision 140NWHE, IPS, 2240x1400, 14" | Asus Vivobook Pro 14 M3401QC-KM007T SAMSUNG: SDC4171, OLED, 2880x1800, 14" | Dell Inspiron 14 7420 2-in-1 BOE NV14N42, IPS, 1920x1200, 14" | Schenker Vision 14 MNE007ZA1, IPS, 2880x1800, 14" | Asus Zenbook 14X UX5400E Samsung SDC4154, OLED, 2880x1800, 14" | MSI Summit E14 A11SCS AU Optronics AUO123B, IPS, 3840x2160, 14" | HP Envy 14-eb0010nr AU Optronics AUOF392, IPS, 1920x1200, 14" | |
|---|---|---|---|---|---|---|---|
| Display | 27% | -43% | 5% | 28% | 24% | 8% | |
| Display P3 Coverage (%) | 68.8 | 99.41 44% | 38.6 -44% | 74.3 8% | 100 45% | 87.5 27% | 77.1 12% |
| sRGB Coverage (%) | 99.3 | 99.94 1% | 56.2 -43% | 97.6 -2% | 100 1% | 100 1% | 99.8 1% |
| AdobeRGB 1998 Coverage (%) | 69.5 | 94.79 36% | 39.9 -43% | 75.7 9% | 96 38% | 99.4 43% | 76.7 10% |
| Response Times | 89% | 13% | -2% | 93% | -47% | -95% | |
| Response Time Grey 50% / Grey 80% * (ms) | 32.8 ? | 3 ? 91% | 27.2 ? 17% | 40.4 ? -23% | 2 ? 94% | 52 ? -59% | 61.2 ? -87% |
| Response Time Black / White * (ms) | 22.8 ? | 3 ? 87% | 20.8 ? 9% | 18.4 ? 19% | 2 ? 91% | 30.8 ? -35% | 46 ? -102% |
| PWM Frequency (Hz) | 360 | ||||||
| Screen | 41% | -113% | -8% | 13% | -70% | -8% | |
| Brightness middle (cd/m²) | 331.1 | 384 16% | 269.4 -19% | 407 23% | 379 14% | 593.3 79% | 412 24% |
| Brightness (cd/m²) | 326 | 385 18% | 260 -20% | 407 25% | 381 17% | 571 75% | 392 20% |
| Brightness Distribution (%) | 85 | 98 15% | 89 5% | 94 11% | 93 9% | 87 2% | 81 -5% |
| Black Level * (cd/m²) | 0.29 | 0.07 76% | 0.41 -41% | 0.25 14% | 0.1 66% | 0.53 -83% | 0.32 -10% |
| Contrast (:1) | 1142 | 5486 380% | 657 -42% | 1628 43% | 3790 232% | 1119 -2% | 1288 13% |
| Colorchecker dE 2000 * | 2.23 | 1.75 22% | 6.53 -193% | 2.6 -17% | 2.3 -3% | 4.42 -98% | 1.88 16% |
| Colorchecker dE 2000 max. * | 5.44 | 3.41 37% | 19.76 -263% | 4.4 19% | 4.16 24% | 7.16 -32% | 3.06 44% |
| Colorchecker dE 2000 calibrated * | 0.63 | 2.32 -268% | 3.13 -397% | 2 -217% | 2.42 -284% | 4.3 -583% | 1.96 -211% |
| Greyscale dE 2000 * | 3.6 | 1.06 71% | 5.4 -50% | 2.7 25% | 2.12 41% | 3.2 11% | 2.2 39% |
| Gamma | 2.21 100% | 2.39 92% | 2.05 107% | 2.18 101% | 2.42 91% | 2.04 108% | 2.1 105% |
| CCT | 6022 108% | 6440 101% | 6007 108% | 6316 103% | 6737 96% | 6650 98% | |
| Color Space (Percent of AdobeRGB 1998) (%) | 68.7 | ||||||
| Color Space (Percent of sRGB) (%) | 99.8 | ||||||
| Totaal Gemiddelde (Programma / Instellingen) | 52% /
45% | -48% /
-80% | -2% /
-5% | 45% /
28% | -31% /
-47% | -32% /
-17% |
* ... kleiner is beter
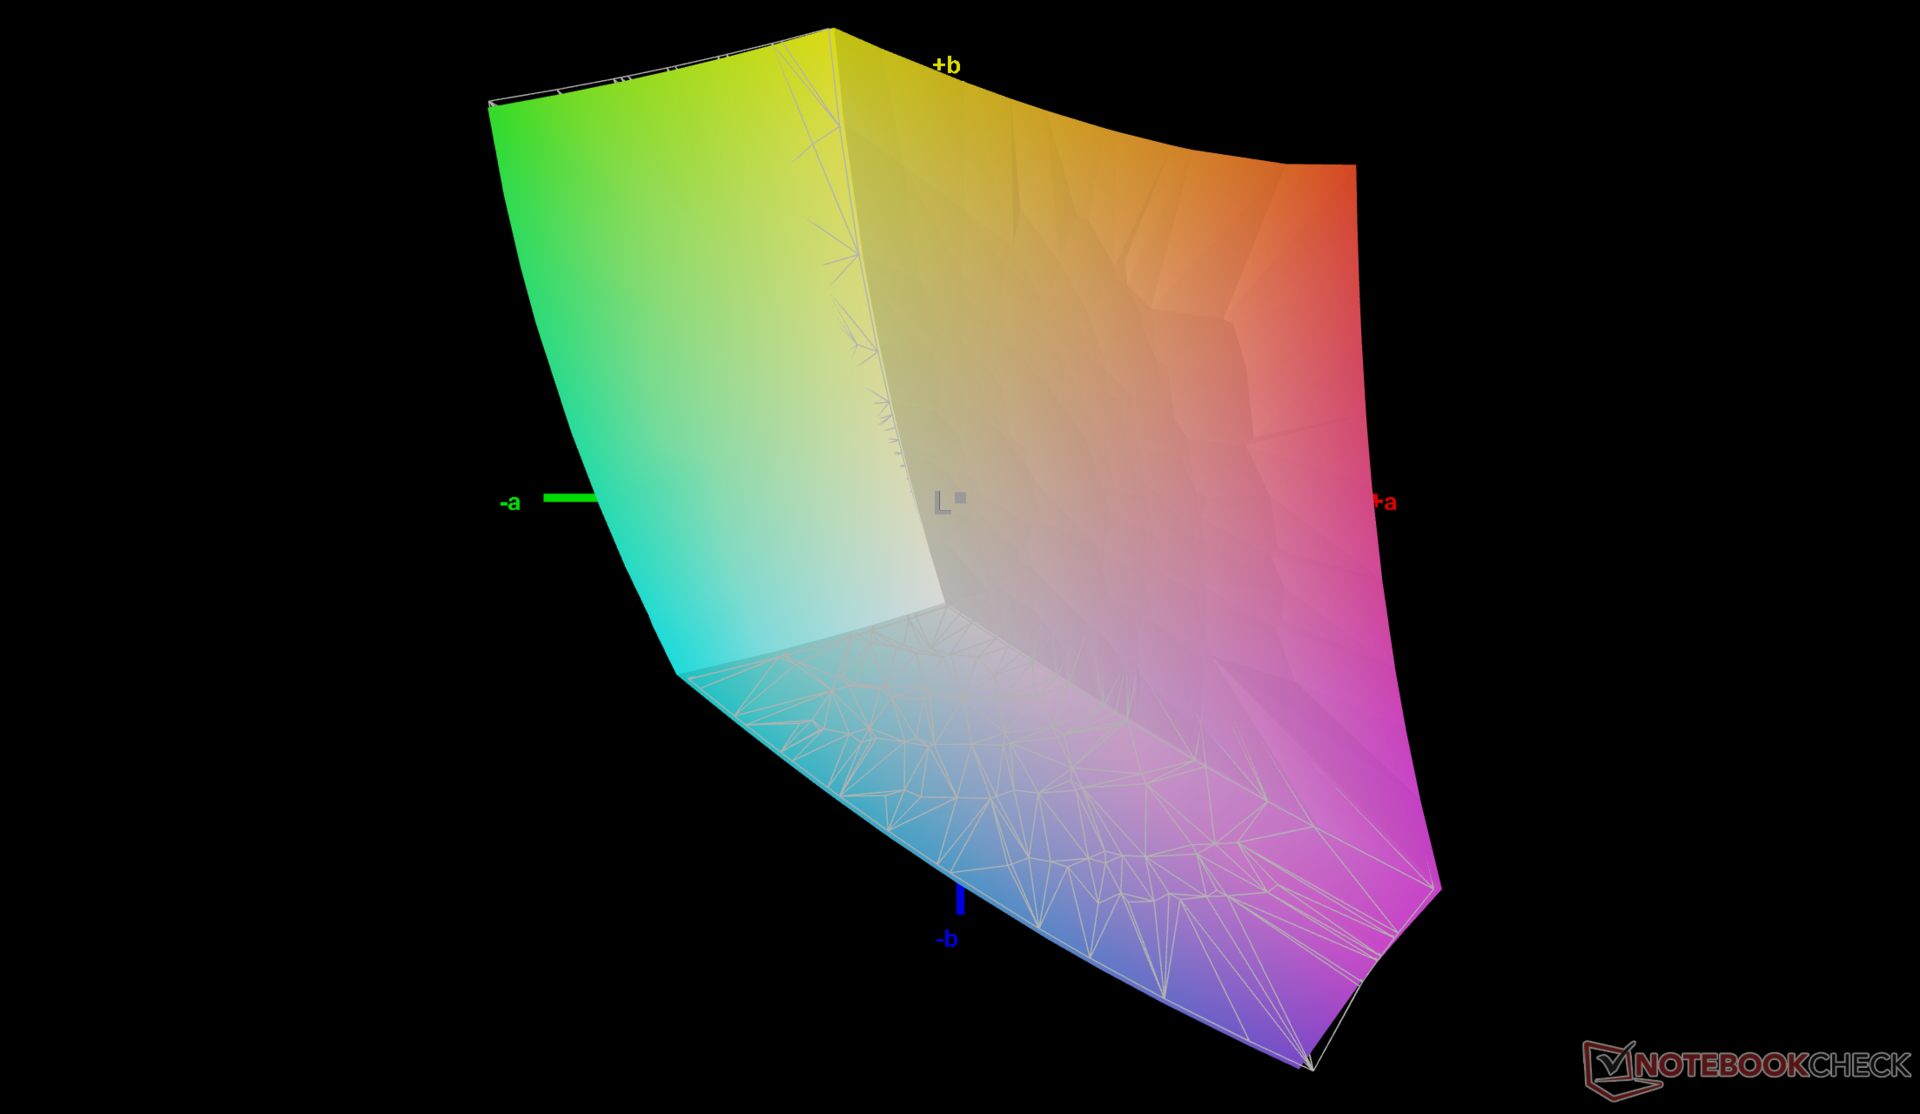
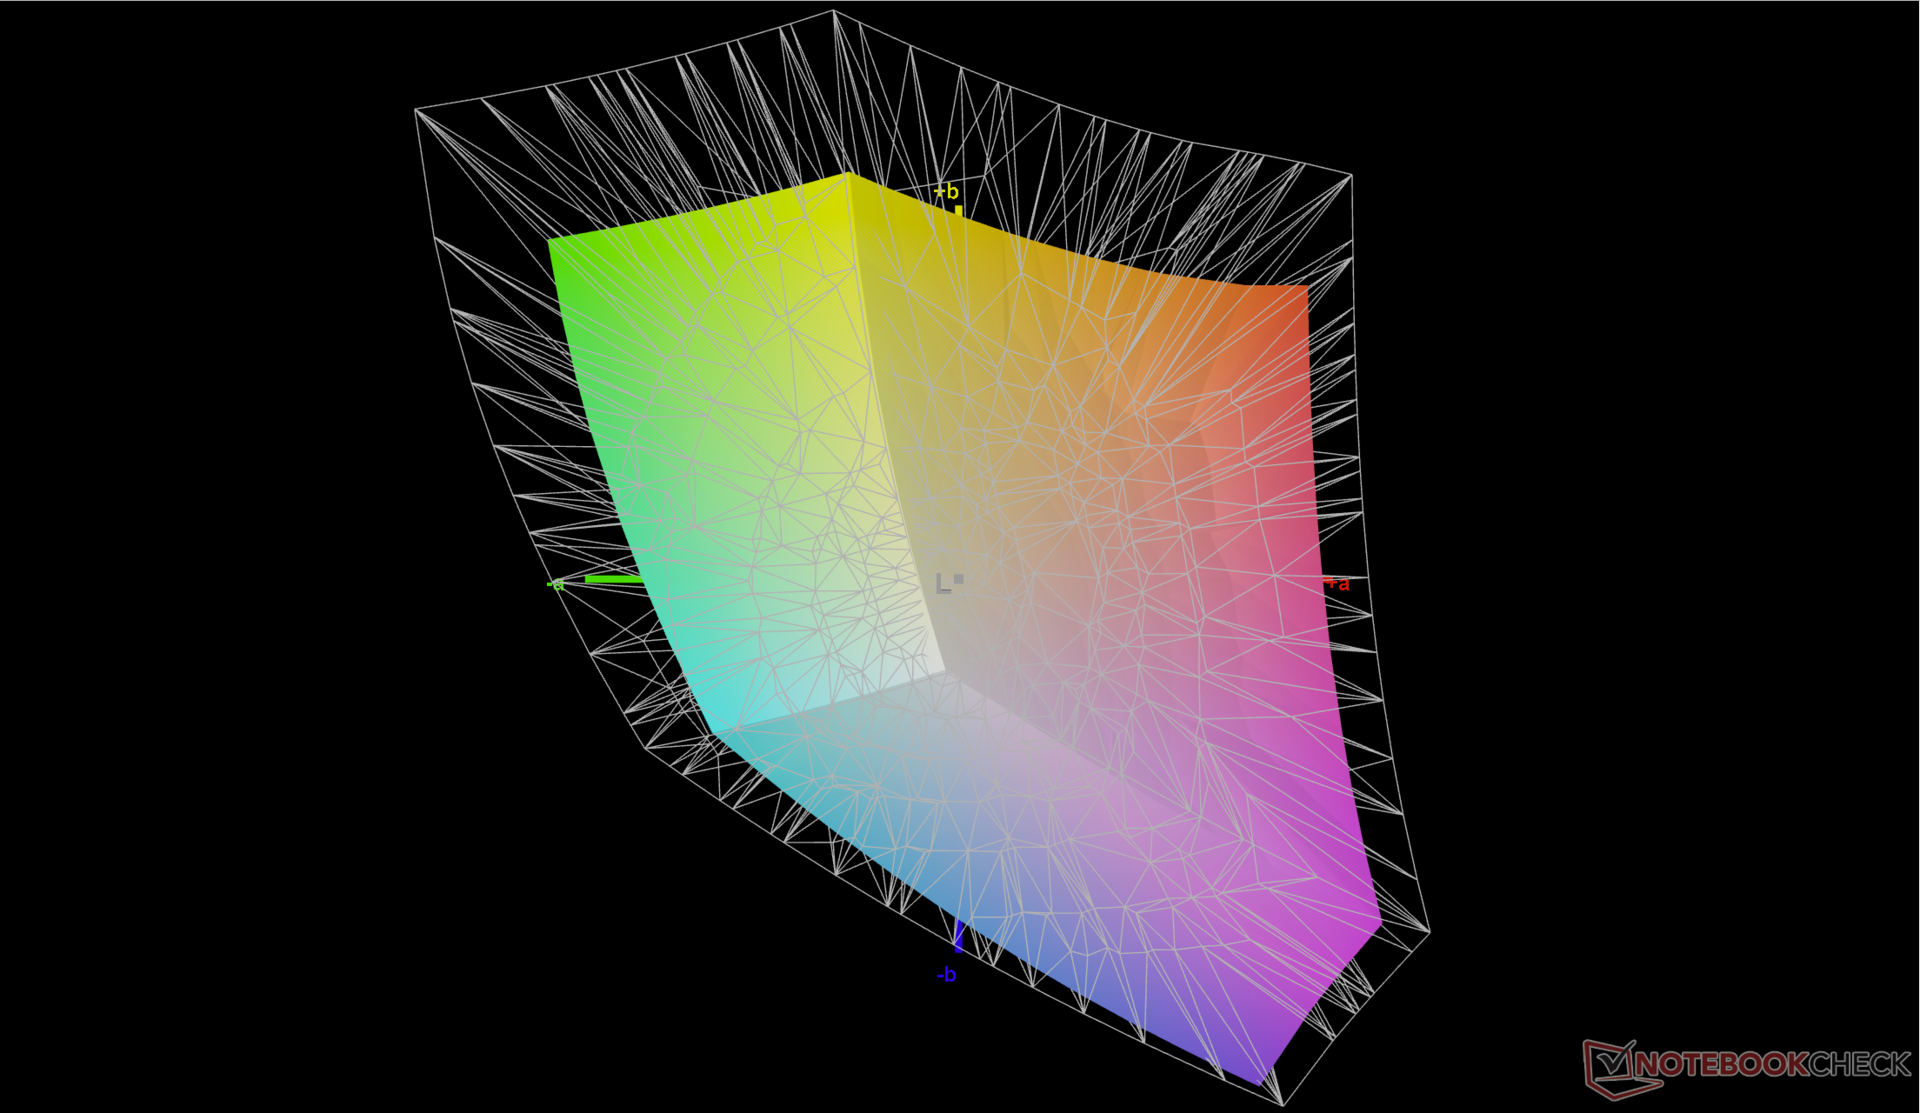
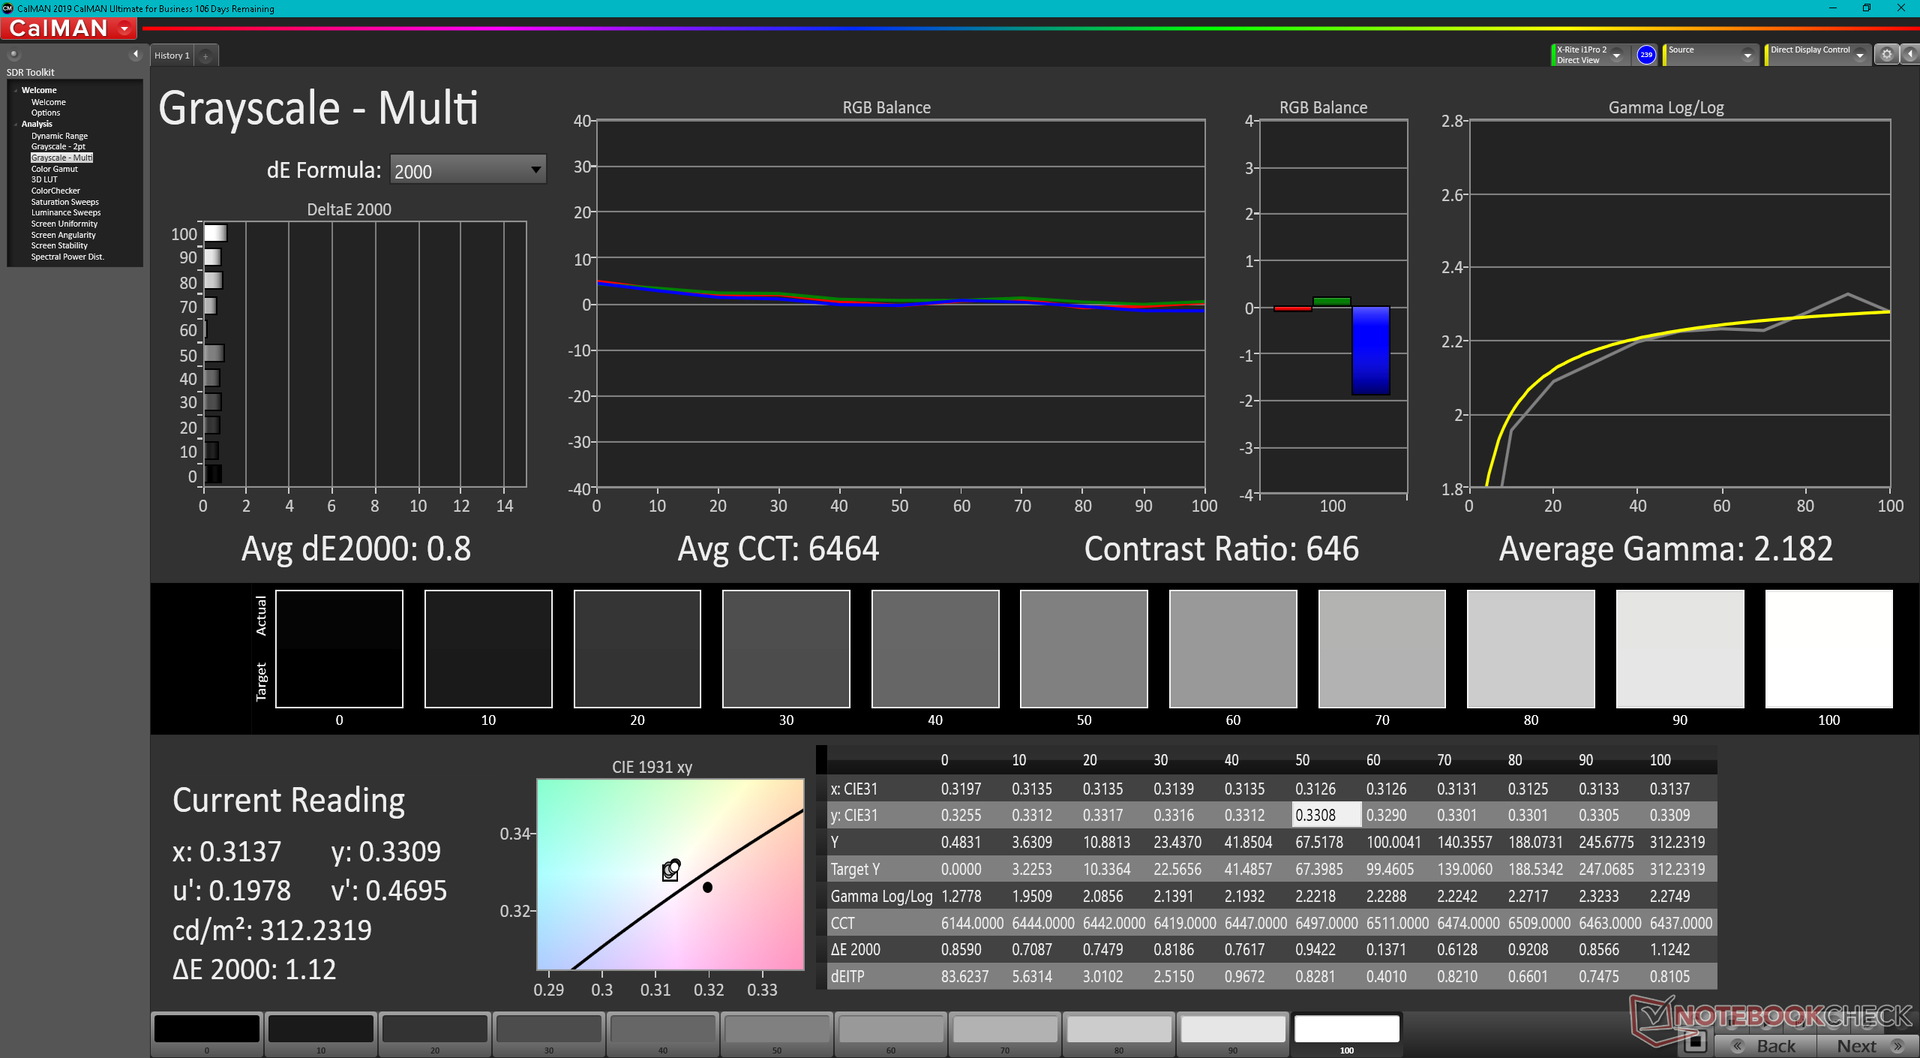
Het beeldscherm is in de fabriek niet gekalibreerd, waardoor de kleuren niet zo nauwkeurig zijn als ze zouden kunnen zijn. Met name de kleurtemperatuur is met ongeveer 6000 te warm in vergelijking met de 6500 van de sRGB-standaard. Na een juiste kalibratie met onze X-Rite colorimeter zouden de gemiddelde grijswaarden en kleur DeltaE-waarden verbeteren van 3,6 en 2,23 tot respectievelijk slechts 0,8 en 0,63. Wij raden een kalibratie door de eindgebruiker aan om de 100 procent sRGB-dekking van het paneel volledig te benutten.
Responstijd Scherm
| ↔ Responstijd Zwart naar Wit | ||
|---|---|---|
| 22.8 ms ... stijging ↗ en daling ↘ gecombineerd | ↗ 12 ms stijging | 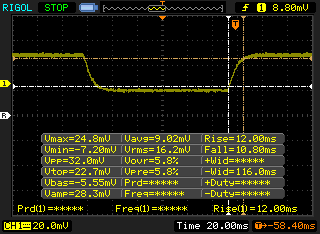 |
| ↘ 10.8 ms daling | ||
| Het scherm vertoonde prima responstijden in onze tests maar is misschien wat te traag voor competitieve games. Ter vergelijking: alle testtoestellen variëren van 0.1 (minimum) tot 240 (maximum) ms. » 51 % van alle toestellen zijn beter. Dit betekent dat de gemeten responstijd slechter is dan het gemiddelde (19.8 ms) van alle geteste toestellen. | ||
| ↔ Responstijd 50% Grijs naar 80% Grijs | ||
| 32.8 ms ... stijging ↗ en daling ↘ gecombineerd | ↗ 16 ms stijging | 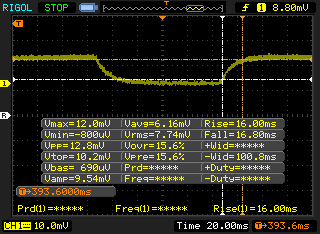 |
| ↘ 16.8 ms daling | ||
| Het scherm vertoonde trage responstijden in onze tests en is misschien te traag voor games. Ter vergelijking: alle testtoestellen variëren van 0.165 (minimum) tot 636 (maximum) ms. » 45 % van alle toestellen zijn beter. Dit betekent dat de gemeten responstijd vergelijkbaar is met het gemiddelde (31 ms) van alle geteste toestellen. | ||
Screen Flickering / PWM (Pulse-Width Modulation)
| Screen flickering / PWM niet waargenomen | 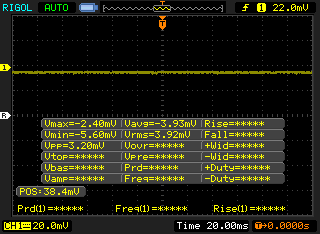 | ||
Ter vergelijking: 52 % van alle geteste toestellen maakten geen gebruik van PWM om de schermhelderheid te verlagen. Als het wel werd gebruikt, werd een gemiddelde van 7757 (minimum: 5 - maximum: 343500) Hz waargenomen. | |||
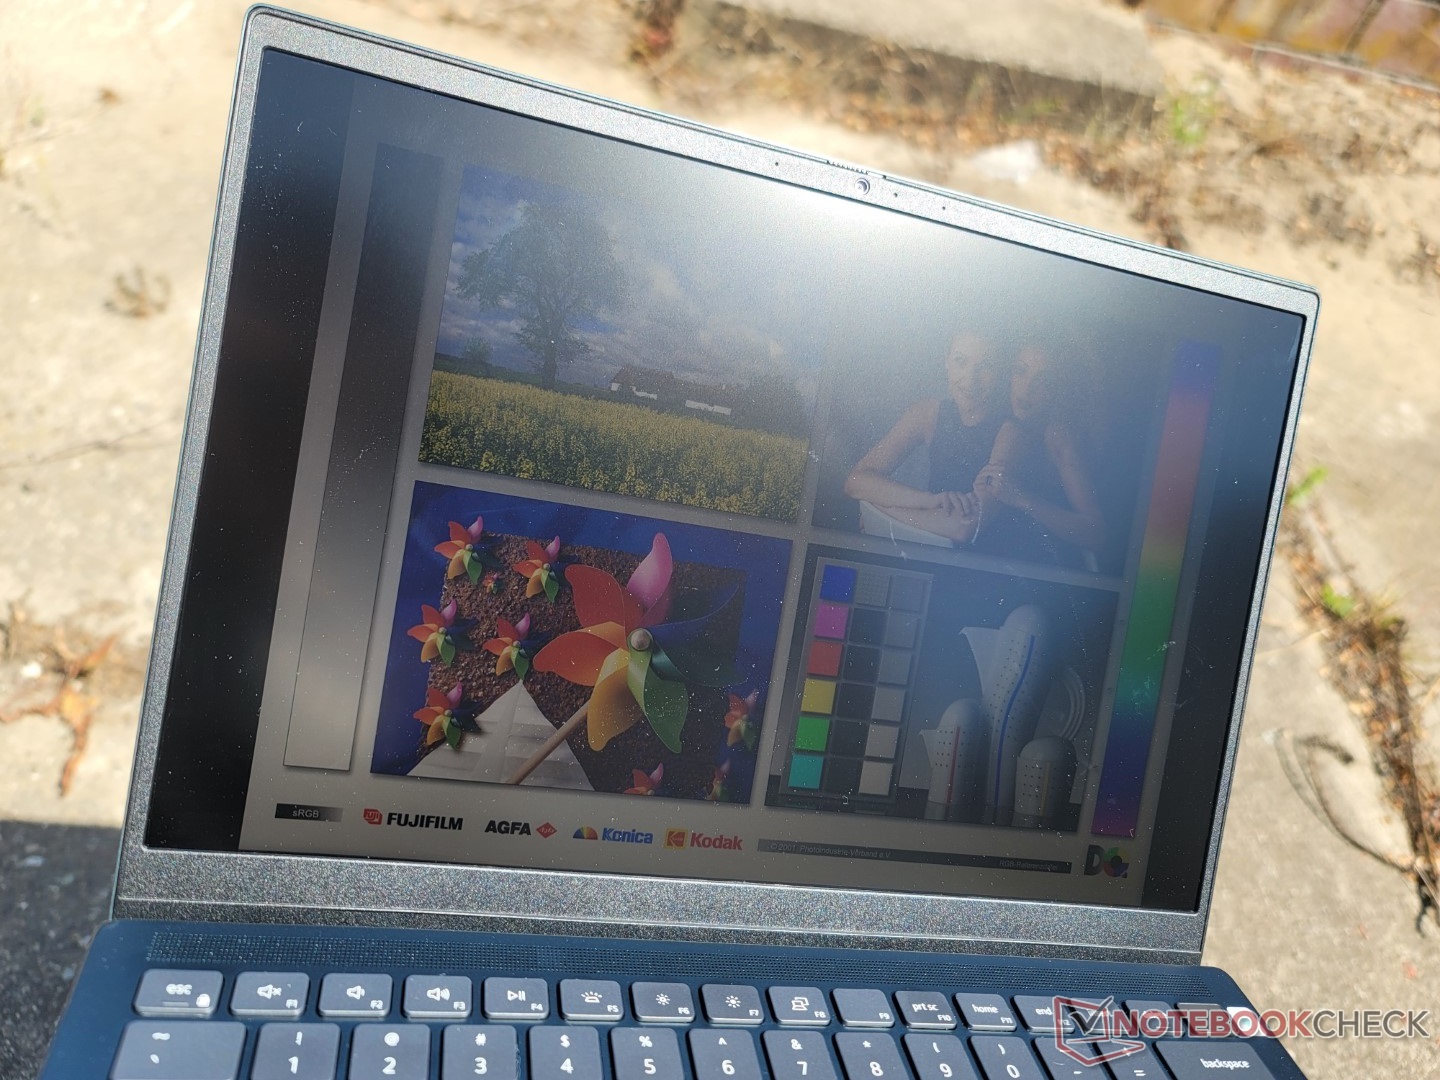
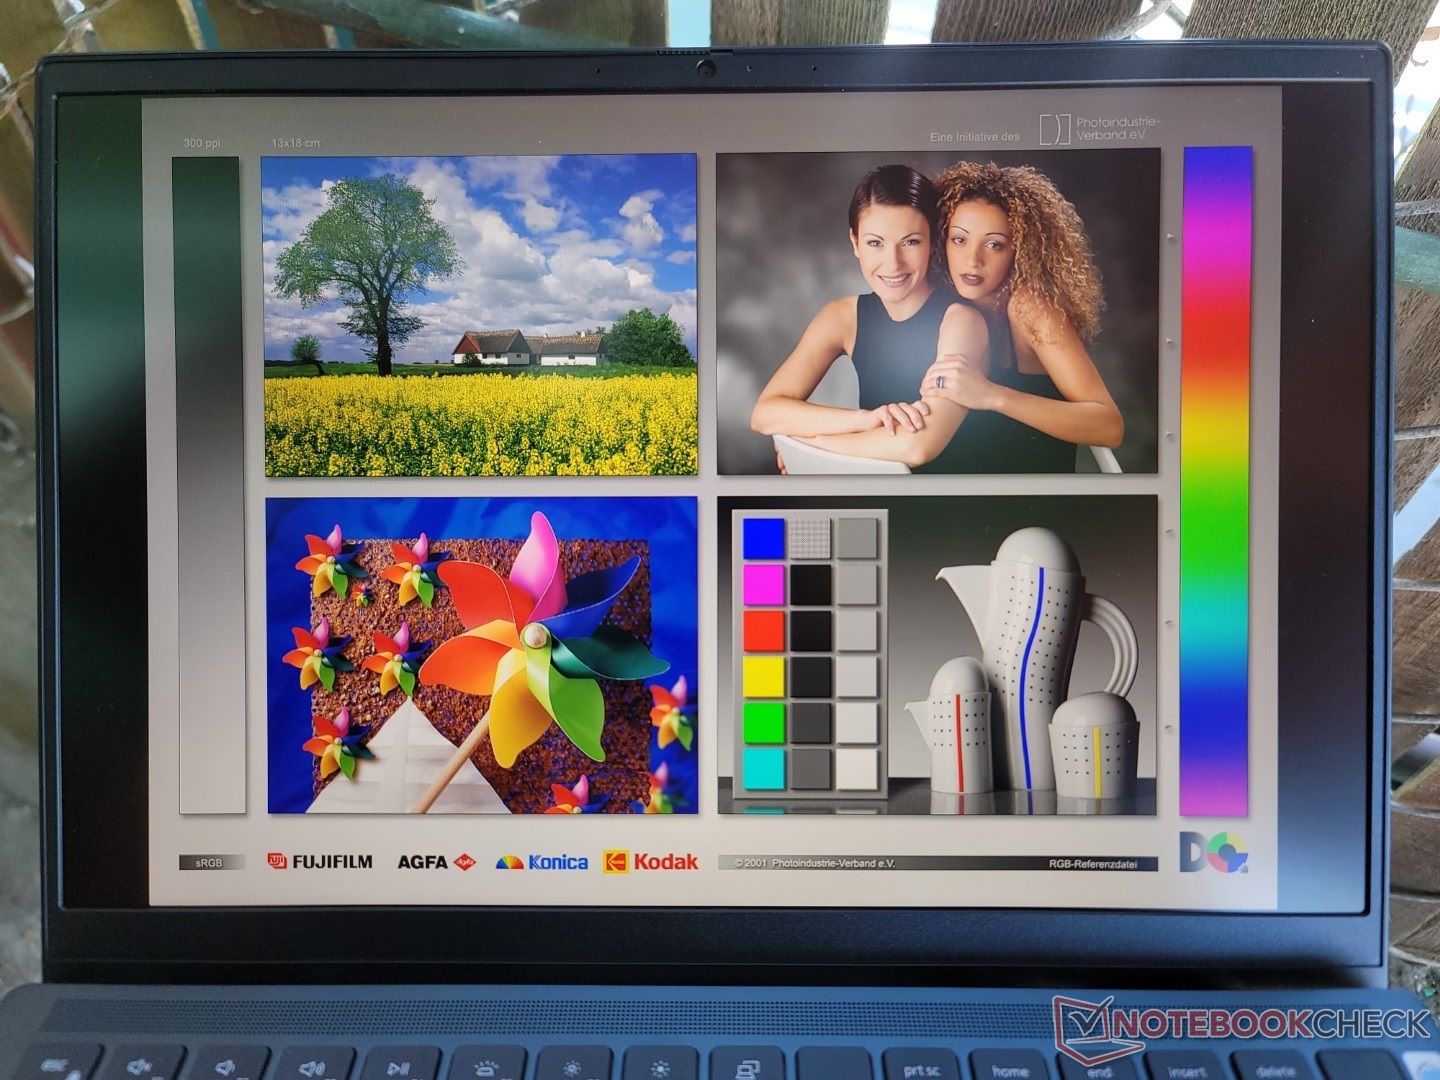
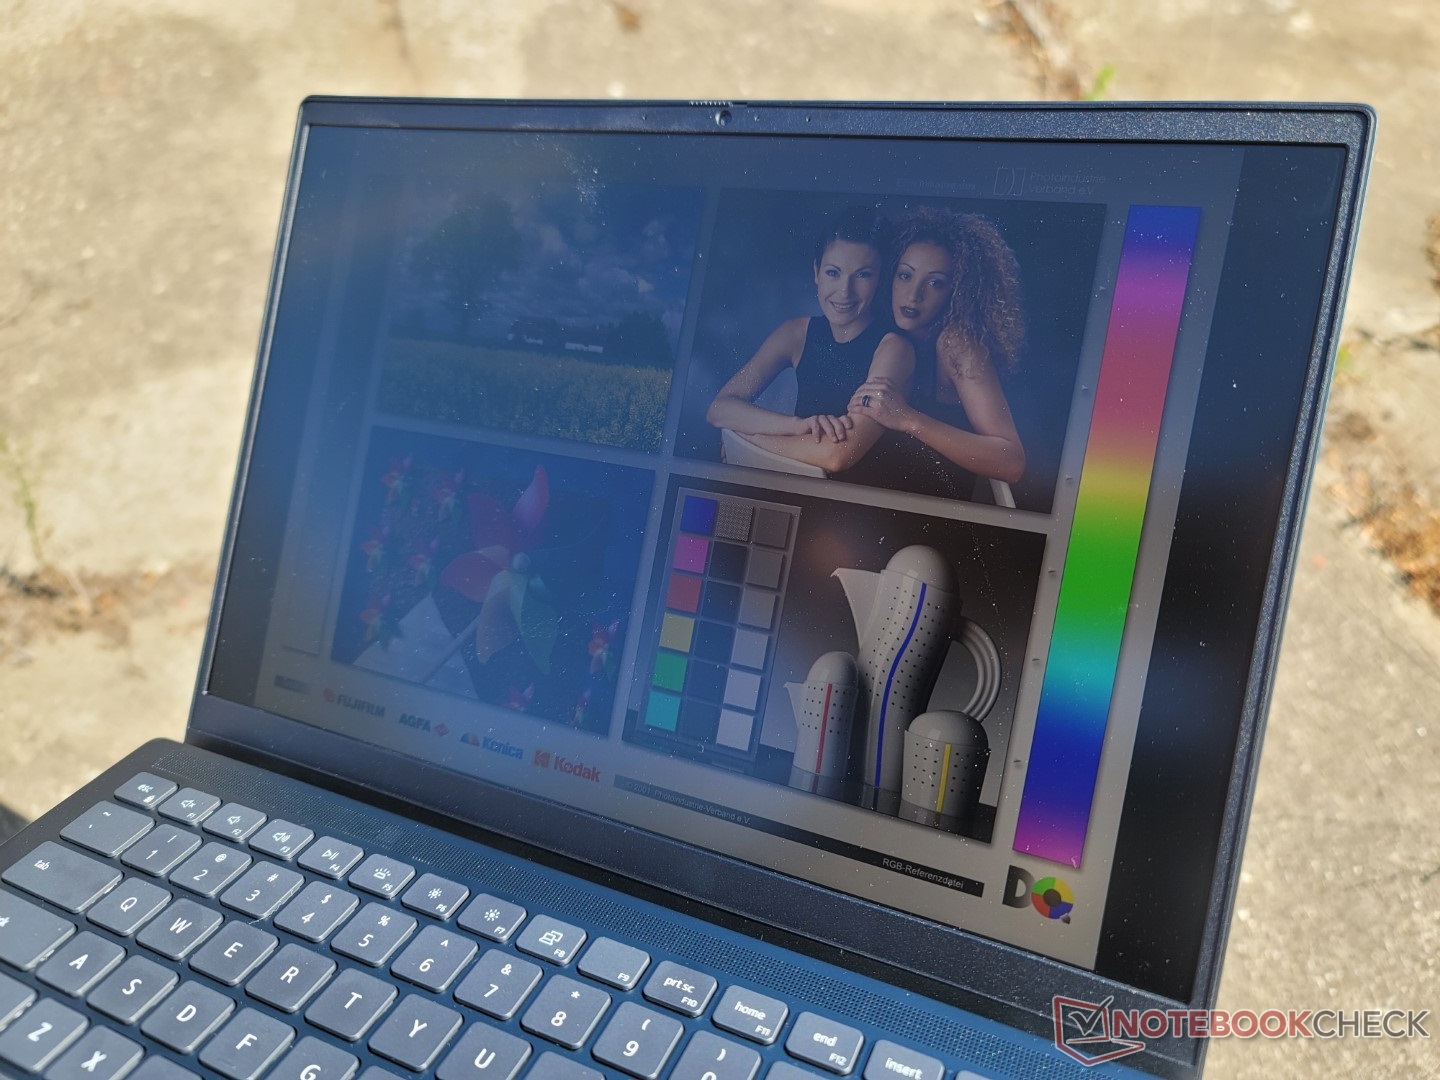
De zichtbaarheid buitenshuis is ondermaats, want het scherm heeft gemiddeld slechts 300 nits bij de maximale instelling. Als u buiten werkt, wilt u het liefst zoveel mogelijk in de schaduw werken, anders valt het scherm weg bij feller omgevingslicht. DeMSI Summit E14 heeft een beduidend helderder scherm, terwijl hij nog steeds discrete GPU opties biedt in vergelijking.
Prestaties - Supercharged 14-incher
Testomstandigheden
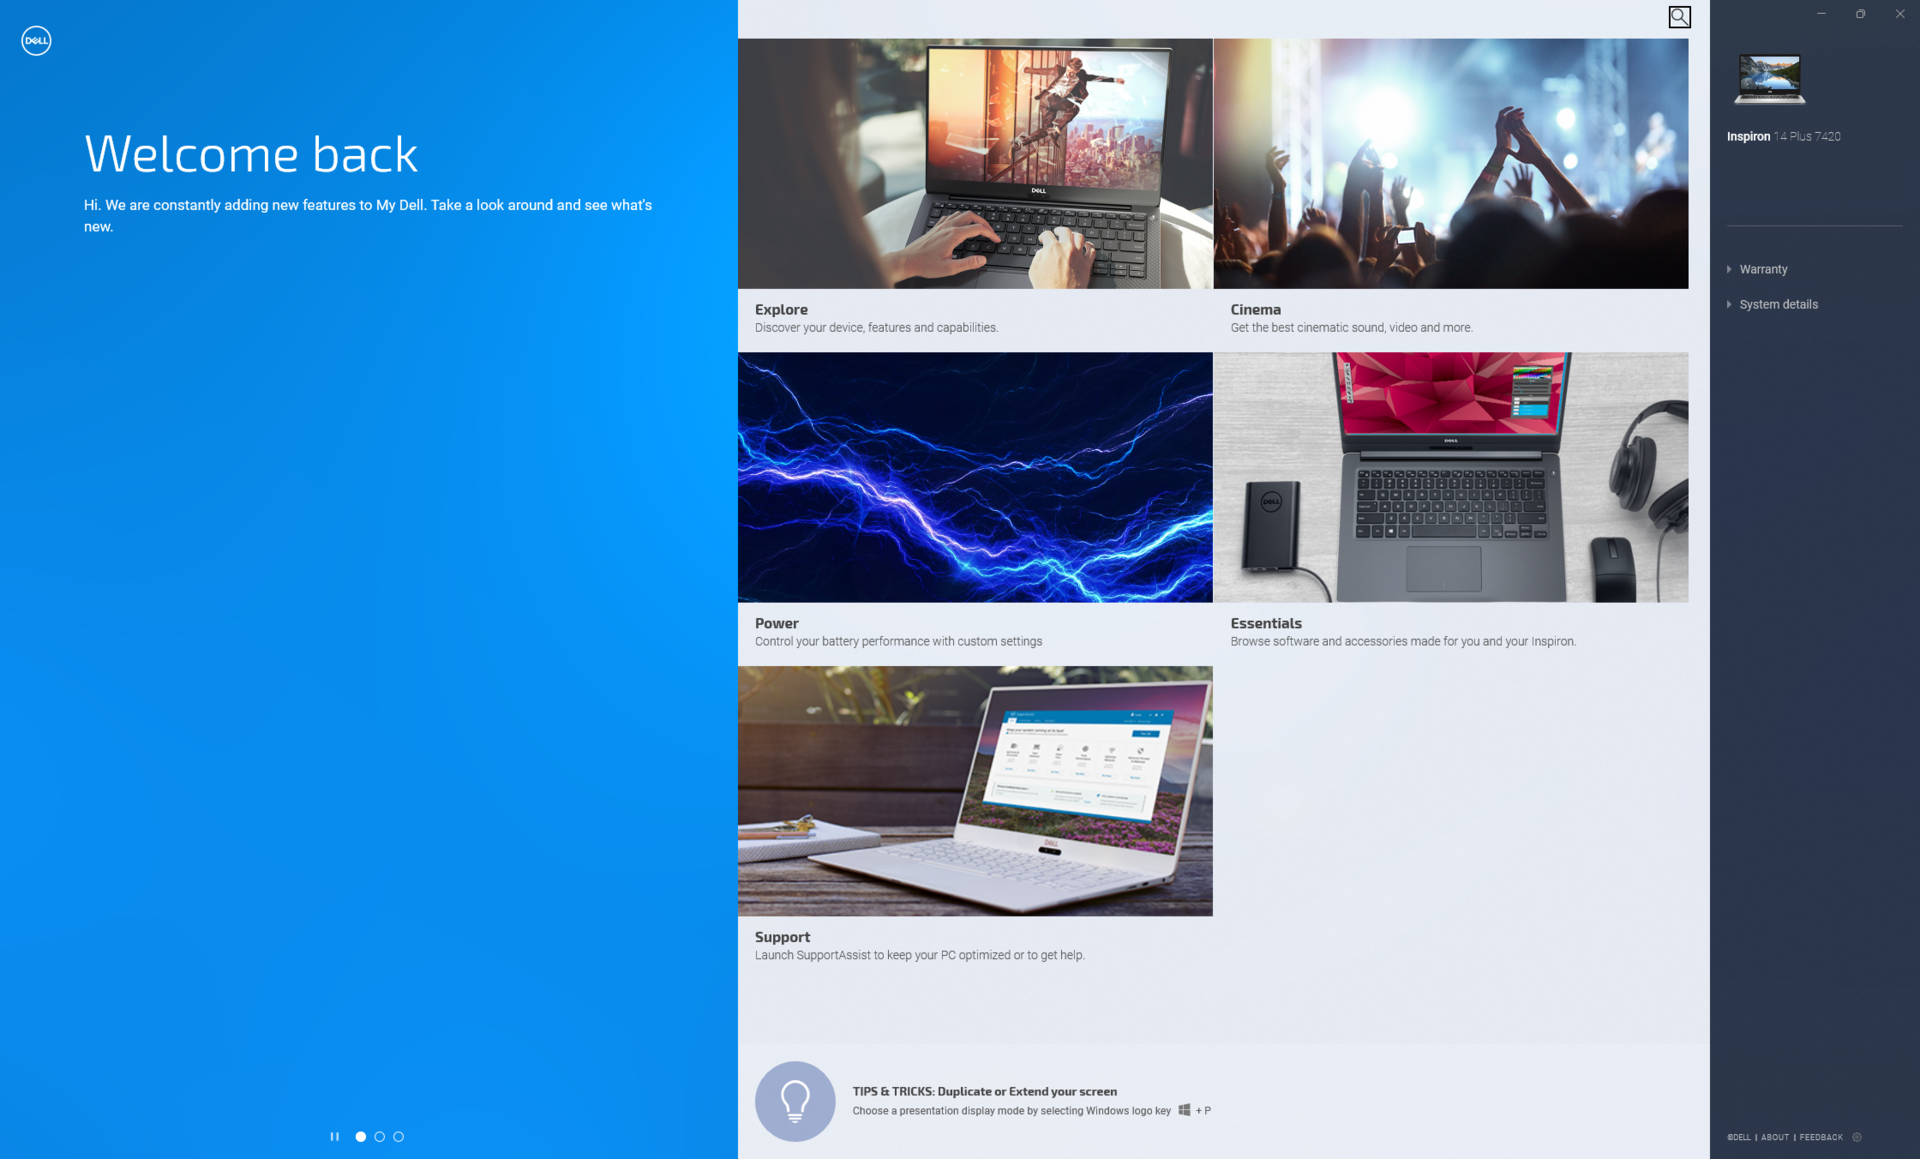
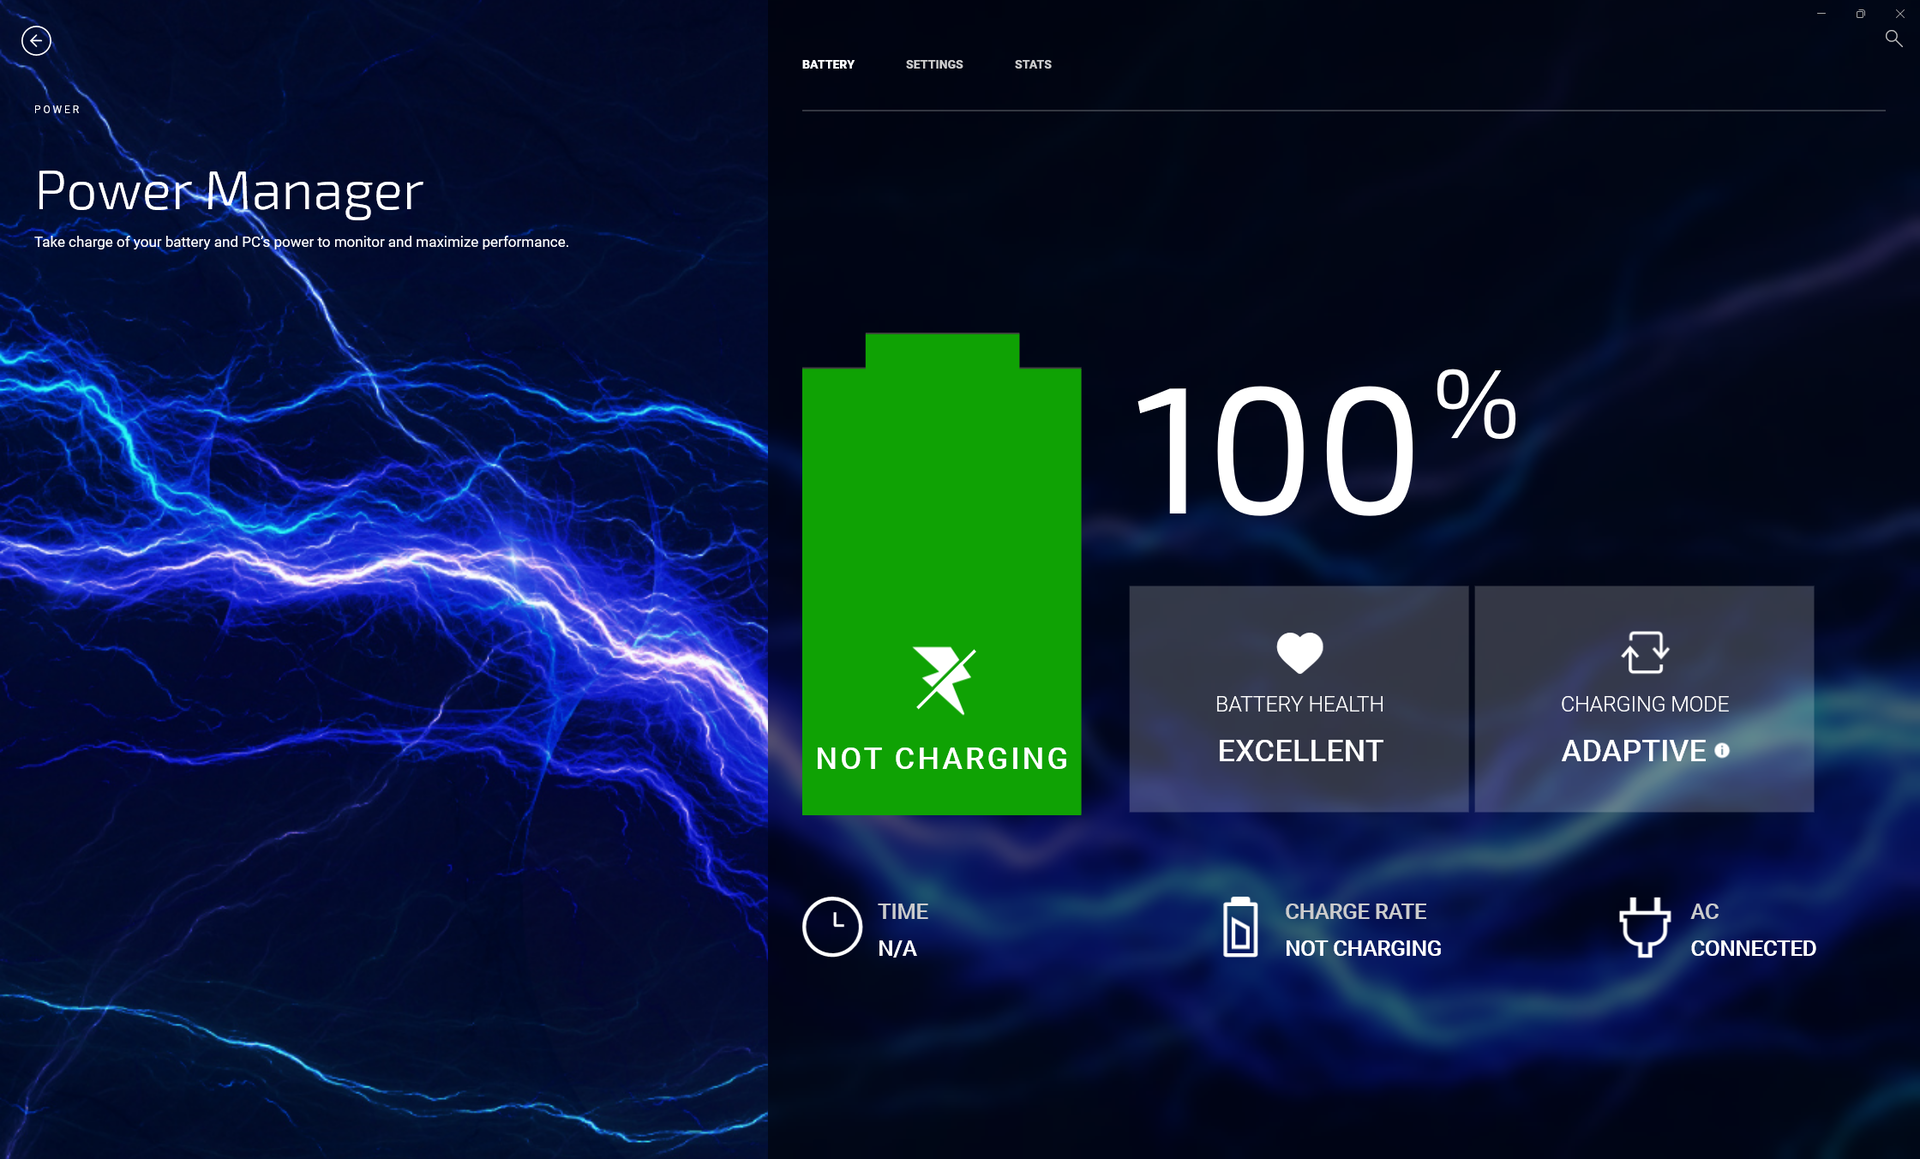
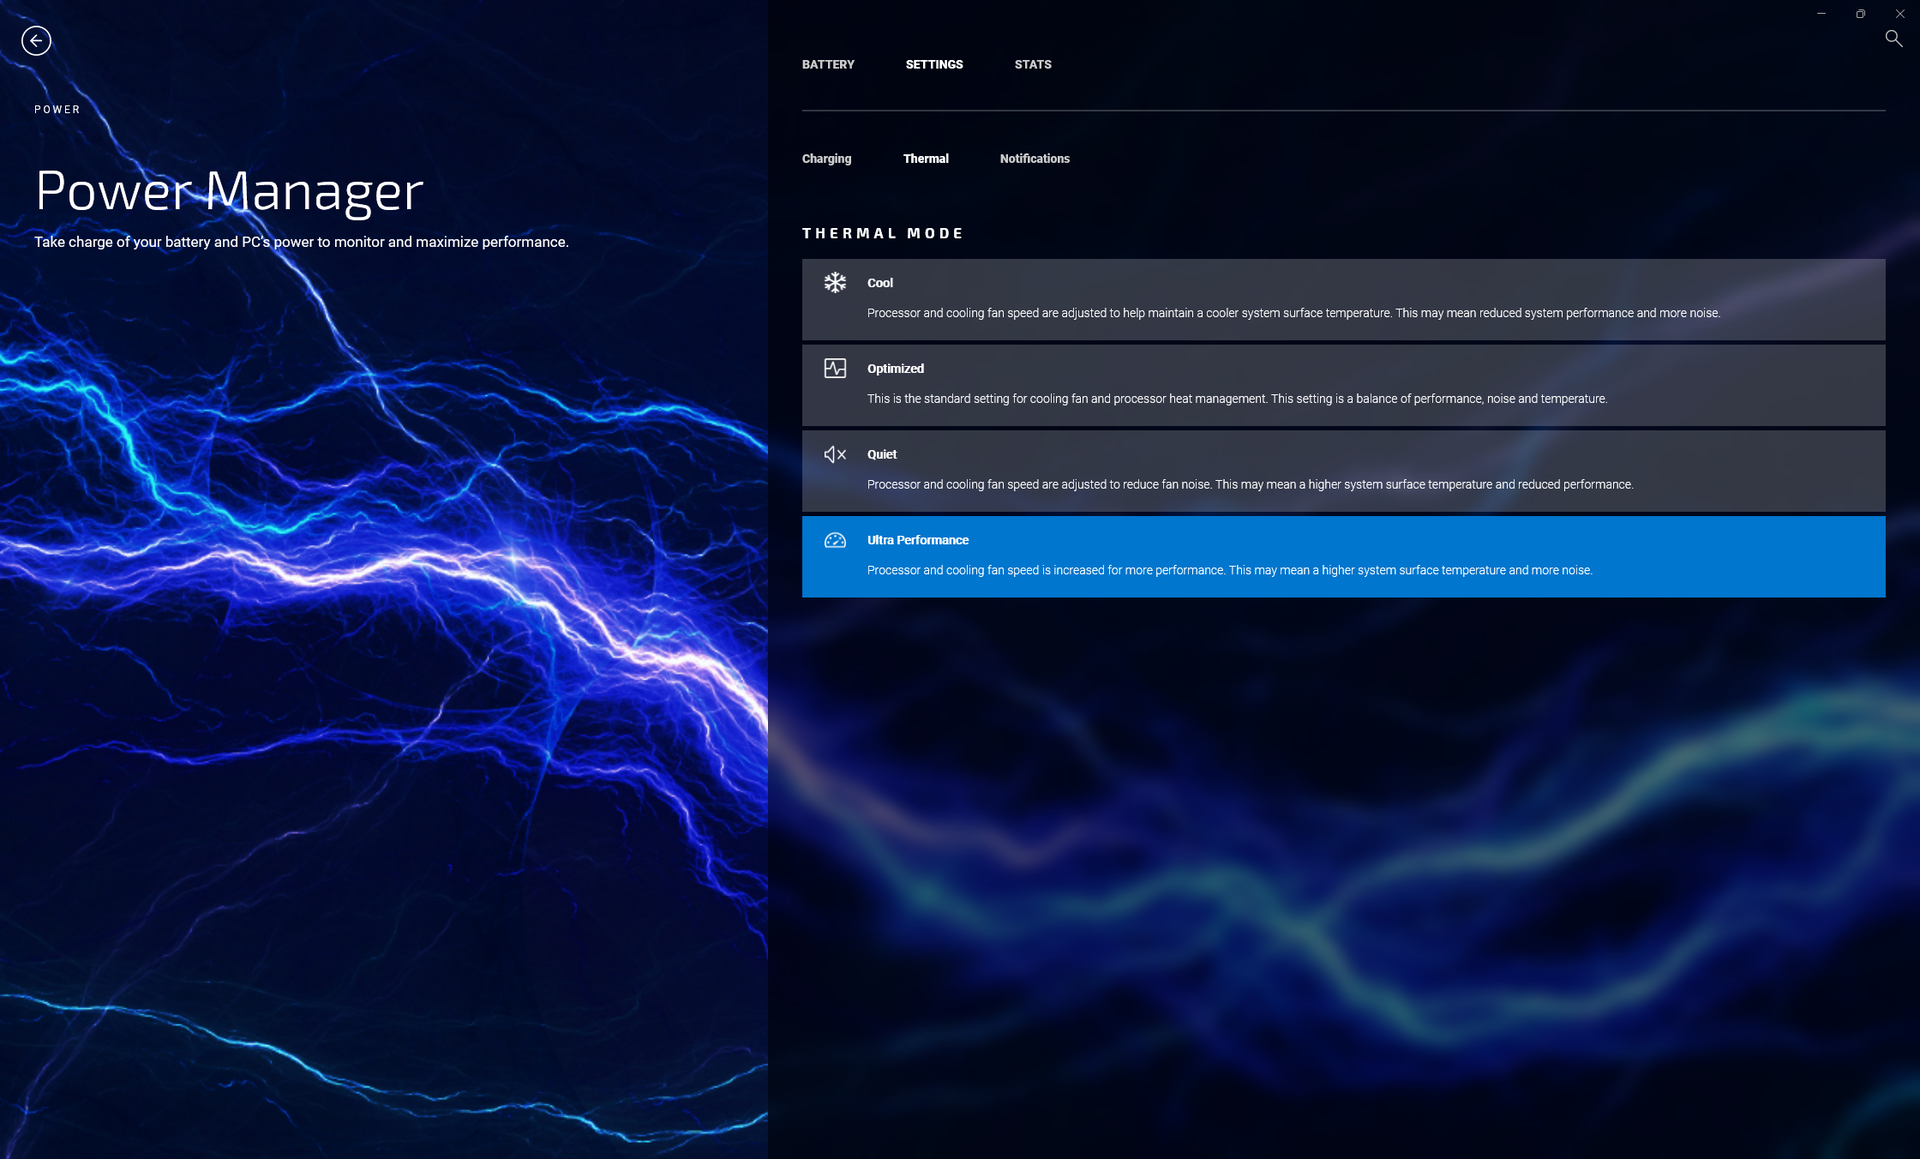
Wij hebben onze unit ingesteld op de Ultra Performance-modus via de My Dell-software voordat wij de onderstaande benchmarks uitvoerden. Het wordt aanbevolen dat eigenaars bekend raken met Mijn Dell, omdat het dient als een portaal voor garantieondersteuning, oplaadgedrag van de batterij, systeemprestaties en meer, zoals blijkt uit de onderstaande schermafbeeldingen
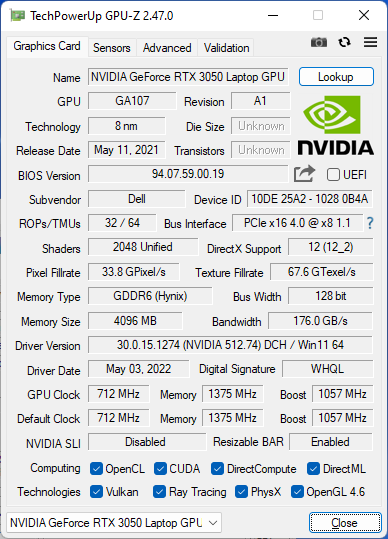
Standaard Optimus wordt ondersteund voor het schakelen tussen de geïntegreerde en discrete GeForce RTX 3050 GPU's. Advanced Optimus, MUX en WhisperMode worden niet ondersteund.

Processor
CPU-prestaties kunnen worden geanalyseerd vanuit een glas half vol of glas half leeg perspectief. Vanuit het pessimistische oogpunt is de 45 W Core i7-12700H in de Dell enigszins teleurstellend, aangezien de multi-thread prestaties ongeveer 10 procent langzamer zijn dan die van andere laptops die met dezelfde processor zijn uitgerust. Vanuit optimistisch oogpunt is de Dell aanzienlijk sneller dan de meeste andere 14-inch laptops waar 15 W, 25 W of 35 W CPU's gebruikelijker zijn. Dit is een van de kleinere laptops die je met de Core i7-12700H kunt krijgen, maar de keerzijde is dat de Turbo Boost prestaties vervolgens beperkter zijn in vergelijking met grotere laptops met dezelfde processoroptie. De Core i7-12700H is immers ook vaak te vinden op volwaardige gaming laptops. De 16-inch Lenovo Legion Slim 7 met dezelfde CPU biedt bijvoorbeeld 30 procent snellere prestaties dan onze Inspiron 14 Plus
De beperkte Turbo Boost prestaties van onze CPU kunnen worden aangetoond door CineBench R15 xT in een lus uit te voeren. Zoals de onderstaande grafiek laat zien, daalt onze oorspronkelijke score van 2410 punten met 21 procent tegen de derde of vierde lus, wat een aanzienlijke prestatiedaling betekent.
Cinebench R15 Multi Loop
Cinebench R23: Multi Core | Single Core
Cinebench R15: CPU Multi 64Bit | CPU Single 64Bit
Blender: v2.79 BMW27 CPU
7-Zip 18.03: 7z b 4 | 7z b 4 -mmt1
Geekbench 5.5: Multi-Core | Single-Core
HWBOT x265 Benchmark v2.2: 4k Preset
LibreOffice : 20 Documents To PDF
R Benchmark 2.5: Overall mean
* ... kleiner is beter
AIDA64: FP32 Ray-Trace | FPU Julia | CPU SHA3 | CPU Queen | FPU SinJulia | FPU Mandel | CPU AES | CPU ZLib | FP64 Ray-Trace | CPU PhotoWorxx
| Performance rating | |
| Gemiddeld Intel Core i7-12700H | |
| Dell Inspiron 14 Plus 7420 | |
| Asus Vivobook Pro 14 M3401QC-KM007T | |
| Schenker Vision 14 | |
| Asus Zenbook 14X UX5400E | |
| MSI Summit E14 A11SCS | |
| Dell Inspiron 14 7420 2-in-1 | |
| AIDA64 / FP32 Ray-Trace | |
| Dell Inspiron 14 Plus 7420 | |
| Gemiddeld Intel Core i7-12700H (2585 - 17957, n=64) | |
| Asus Vivobook Pro 14 M3401QC-KM007T | |
| Schenker Vision 14 | |
| Asus Zenbook 14X UX5400E | |
| MSI Summit E14 A11SCS | |
| Dell Inspiron 14 7420 2-in-1 | |
| AIDA64 / FPU Julia | |
| Asus Vivobook Pro 14 M3401QC-KM007T | |
| Dell Inspiron 14 Plus 7420 | |
| Gemiddeld Intel Core i7-12700H (12439 - 90760, n=64) | |
| Schenker Vision 14 | |
| Asus Zenbook 14X UX5400E | |
| MSI Summit E14 A11SCS | |
| Dell Inspiron 14 7420 2-in-1 | |
| AIDA64 / CPU SHA3 | |
| Gemiddeld Intel Core i7-12700H (833 - 4242, n=64) | |
| Dell Inspiron 14 Plus 7420 | |
| Schenker Vision 14 | |
| Asus Vivobook Pro 14 M3401QC-KM007T | |
| Asus Zenbook 14X UX5400E | |
| MSI Summit E14 A11SCS | |
| Dell Inspiron 14 7420 2-in-1 | |
| AIDA64 / CPU Queen | |
| Gemiddeld Intel Core i7-12700H (57923 - 103202, n=63) | |
| Dell Inspiron 14 Plus 7420 | |
| Asus Vivobook Pro 14 M3401QC-KM007T | |
| Dell Inspiron 14 7420 2-in-1 | |
| Schenker Vision 14 | |
| Asus Zenbook 14X UX5400E | |
| MSI Summit E14 A11SCS | |
| AIDA64 / FPU SinJulia | |
| Gemiddeld Intel Core i7-12700H (3249 - 9939, n=64) | |
| Asus Vivobook Pro 14 M3401QC-KM007T | |
| Dell Inspiron 14 Plus 7420 | |
| Schenker Vision 14 | |
| Asus Zenbook 14X UX5400E | |
| MSI Summit E14 A11SCS | |
| Dell Inspiron 14 7420 2-in-1 | |
| AIDA64 / FPU Mandel | |
| Asus Vivobook Pro 14 M3401QC-KM007T | |
| Dell Inspiron 14 Plus 7420 | |
| Gemiddeld Intel Core i7-12700H (7135 - 44760, n=64) | |
| Schenker Vision 14 | |
| MSI Summit E14 A11SCS | |
| Asus Zenbook 14X UX5400E | |
| Dell Inspiron 14 7420 2-in-1 | |
| AIDA64 / CPU AES | |
| Asus Vivobook Pro 14 M3401QC-KM007T | |
| Gemiddeld Intel Core i7-12700H (31839 - 144360, n=64) | |
| Schenker Vision 14 | |
| Asus Zenbook 14X UX5400E | |
| Dell Inspiron 14 Plus 7420 | |
| MSI Summit E14 A11SCS | |
| Dell Inspiron 14 7420 2-in-1 | |
| AIDA64 / CPU ZLib | |
| Gemiddeld Intel Core i7-12700H (305 - 1171, n=64) | |
| Dell Inspiron 14 Plus 7420 | |
| Asus Vivobook Pro 14 M3401QC-KM007T | |
| Dell Inspiron 14 7420 2-in-1 | |
| Schenker Vision 14 | |
| Asus Zenbook 14X UX5400E | |
| MSI Summit E14 A11SCS | |
| AIDA64 / FP64 Ray-Trace | |
| Dell Inspiron 14 Plus 7420 | |
| Gemiddeld Intel Core i7-12700H (1437 - 9692, n=64) | |
| Asus Vivobook Pro 14 M3401QC-KM007T | |
| Schenker Vision 14 | |
| Asus Zenbook 14X UX5400E | |
| MSI Summit E14 A11SCS | |
| Dell Inspiron 14 7420 2-in-1 | |
| AIDA64 / CPU PhotoWorxx | |
| MSI Summit E14 A11SCS | |
| Dell Inspiron 14 Plus 7420 | |
| Gemiddeld Intel Core i7-12700H (12863 - 52207, n=64) | |
| Asus Zenbook 14X UX5400E | |
| Schenker Vision 14 | |
| Dell Inspiron 14 7420 2-in-1 | |
| Asus Vivobook Pro 14 M3401QC-KM007T | |
Systeemprestaties
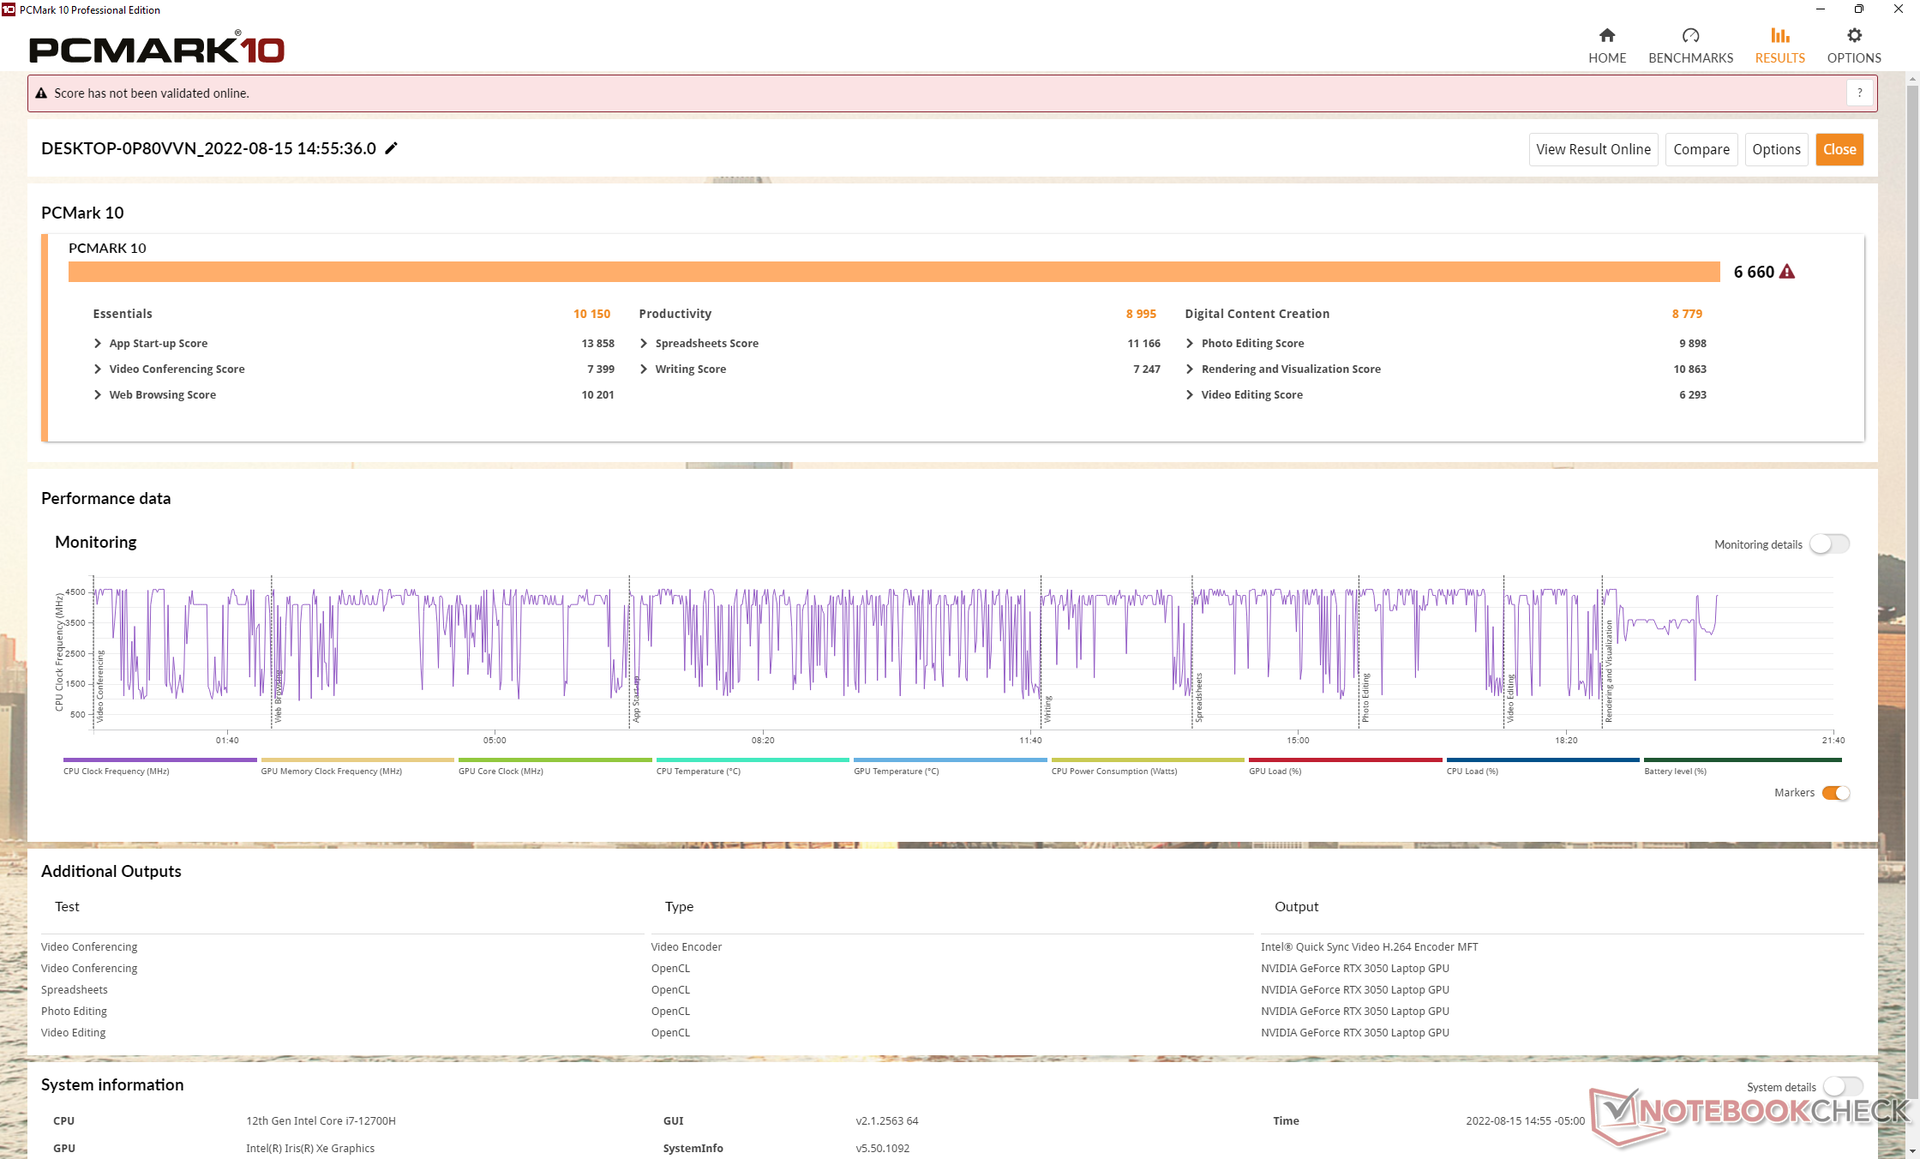
PCMark 10 resultaten zijn uitstekend en hoger dan zelfs concurrenten zoals de Schenker Vision 14 met snellere RTX 3050 Ti graphics of deAsus Vivobook Pro 14 met de AMD Ryzen 5600H CPU. Het lijdt geen twijfel dat de Core i7-12700H een grote rol speelt in het verbeteren van de algehele prestaties van de Inspiron 14 Plus 7420 ten opzichte van de meeste andere 14-inch multimedia laptops.
CrossMark: Overall | Productivity | Creativity | Responsiveness
| PCMark 10 / Score | |
| Gemiddeld Intel Core i7-12700H, NVIDIA GeForce RTX 3050 4GB Laptop GPU (6660 - 6879, n=3) | |
| Dell Inspiron 14 Plus 7420 | |
| Schenker Vision 14 | |
| Asus Vivobook Pro 14 M3401QC-KM007T | |
| HP Envy 14-eb0010nr | |
| MSI Summit E14 A11SCS | |
| Dell Inspiron 14 7420 2-in-1 | |
| Asus Zenbook 14X UX5400E | |
| PCMark 10 / Essentials | |
| Gemiddeld Intel Core i7-12700H, NVIDIA GeForce RTX 3050 4GB Laptop GPU (10150 - 10369, n=3) | |
| Dell Inspiron 14 7420 2-in-1 | |
| Dell Inspiron 14 Plus 7420 | |
| Asus Vivobook Pro 14 M3401QC-KM007T | |
| Schenker Vision 14 | |
| HP Envy 14-eb0010nr | |
| MSI Summit E14 A11SCS | |
| Asus Zenbook 14X UX5400E | |
| PCMark 10 / Productivity | |
| Gemiddeld Intel Core i7-12700H, NVIDIA GeForce RTX 3050 4GB Laptop GPU (8995 - 9397, n=3) | |
| Dell Inspiron 14 Plus 7420 | |
| Schenker Vision 14 | |
| Asus Zenbook 14X UX5400E | |
| HP Envy 14-eb0010nr | |
| MSI Summit E14 A11SCS | |
| Asus Vivobook Pro 14 M3401QC-KM007T | |
| Dell Inspiron 14 7420 2-in-1 | |
| PCMark 10 / Digital Content Creation | |
| Gemiddeld Intel Core i7-12700H, NVIDIA GeForce RTX 3050 4GB Laptop GPU (8779 - 9203, n=3) | |
| Dell Inspiron 14 Plus 7420 | |
| Asus Vivobook Pro 14 M3401QC-KM007T | |
| Schenker Vision 14 | |
| Dell Inspiron 14 7420 2-in-1 | |
| HP Envy 14-eb0010nr | |
| MSI Summit E14 A11SCS | |
| Asus Zenbook 14X UX5400E | |
| CrossMark / Overall | |
| Gemiddeld Intel Core i7-12700H, NVIDIA GeForce RTX 3050 4GB Laptop GPU (1717 - 1857, n=3) | |
| Dell Inspiron 14 Plus 7420 | |
| Schenker Vision 14 | |
| Dell Inspiron 14 7420 2-in-1 | |
| Asus Vivobook Pro 14 M3401QC-KM007T | |
| CrossMark / Productivity | |
| Gemiddeld Intel Core i7-12700H, NVIDIA GeForce RTX 3050 4GB Laptop GPU (1620 - 1735, n=3) | |
| Dell Inspiron 14 Plus 7420 | |
| Schenker Vision 14 | |
| Dell Inspiron 14 7420 2-in-1 | |
| Asus Vivobook Pro 14 M3401QC-KM007T | |
| CrossMark / Creativity | |
| Gemiddeld Intel Core i7-12700H, NVIDIA GeForce RTX 3050 4GB Laptop GPU (1911 - 2067, n=3) | |
| Dell Inspiron 14 Plus 7420 | |
| Dell Inspiron 14 7420 2-in-1 | |
| Schenker Vision 14 | |
| Asus Vivobook Pro 14 M3401QC-KM007T | |
| CrossMark / Responsiveness | |
| Gemiddeld Intel Core i7-12700H, NVIDIA GeForce RTX 3050 4GB Laptop GPU (1481 - 1651, n=3) | |
| Schenker Vision 14 | |
| Dell Inspiron 14 Plus 7420 | |
| Dell Inspiron 14 7420 2-in-1 | |
| Asus Vivobook Pro 14 M3401QC-KM007T | |
| PCMark 10 Score | 6660 punten | |
Help | ||
| AIDA64 / Memory Copy | |
| MSI Summit E14 A11SCS | |
| Asus Zenbook 14X UX5400E | |
| Dell Inspiron 14 Plus 7420 | |
| Gemiddeld Intel Core i7-12700H (25615 - 80511, n=64) | |
| Schenker Vision 14 | |
| Dell Inspiron 14 7420 2-in-1 | |
| Asus Vivobook Pro 14 M3401QC-KM007T | |
| AIDA64 / Memory Read | |
| Dell Inspiron 14 Plus 7420 | |
| MSI Summit E14 A11SCS | |
| Asus Zenbook 14X UX5400E | |
| Gemiddeld Intel Core i7-12700H (25586 - 79442, n=64) | |
| Schenker Vision 14 | |
| Asus Vivobook Pro 14 M3401QC-KM007T | |
| Dell Inspiron 14 7420 2-in-1 | |
| AIDA64 / Memory Write | |
| Asus Zenbook 14X UX5400E | |
| MSI Summit E14 A11SCS | |
| Dell Inspiron 14 Plus 7420 | |
| Gemiddeld Intel Core i7-12700H (23679 - 88660, n=64) | |
| Schenker Vision 14 | |
| Dell Inspiron 14 7420 2-in-1 | |
| Asus Vivobook Pro 14 M3401QC-KM007T | |
| AIDA64 / Memory Latency | |
| Dell Inspiron 14 Plus 7420 | |
| Asus Zenbook 14X UX5400E | |
| MSI Summit E14 A11SCS | |
| Asus Vivobook Pro 14 M3401QC-KM007T | |
| Gemiddeld Intel Core i7-12700H (76.2 - 133.9, n=62) | |
| Schenker Vision 14 | |
| Dell Inspiron 14 7420 2-in-1 | |
* ... kleiner is beter
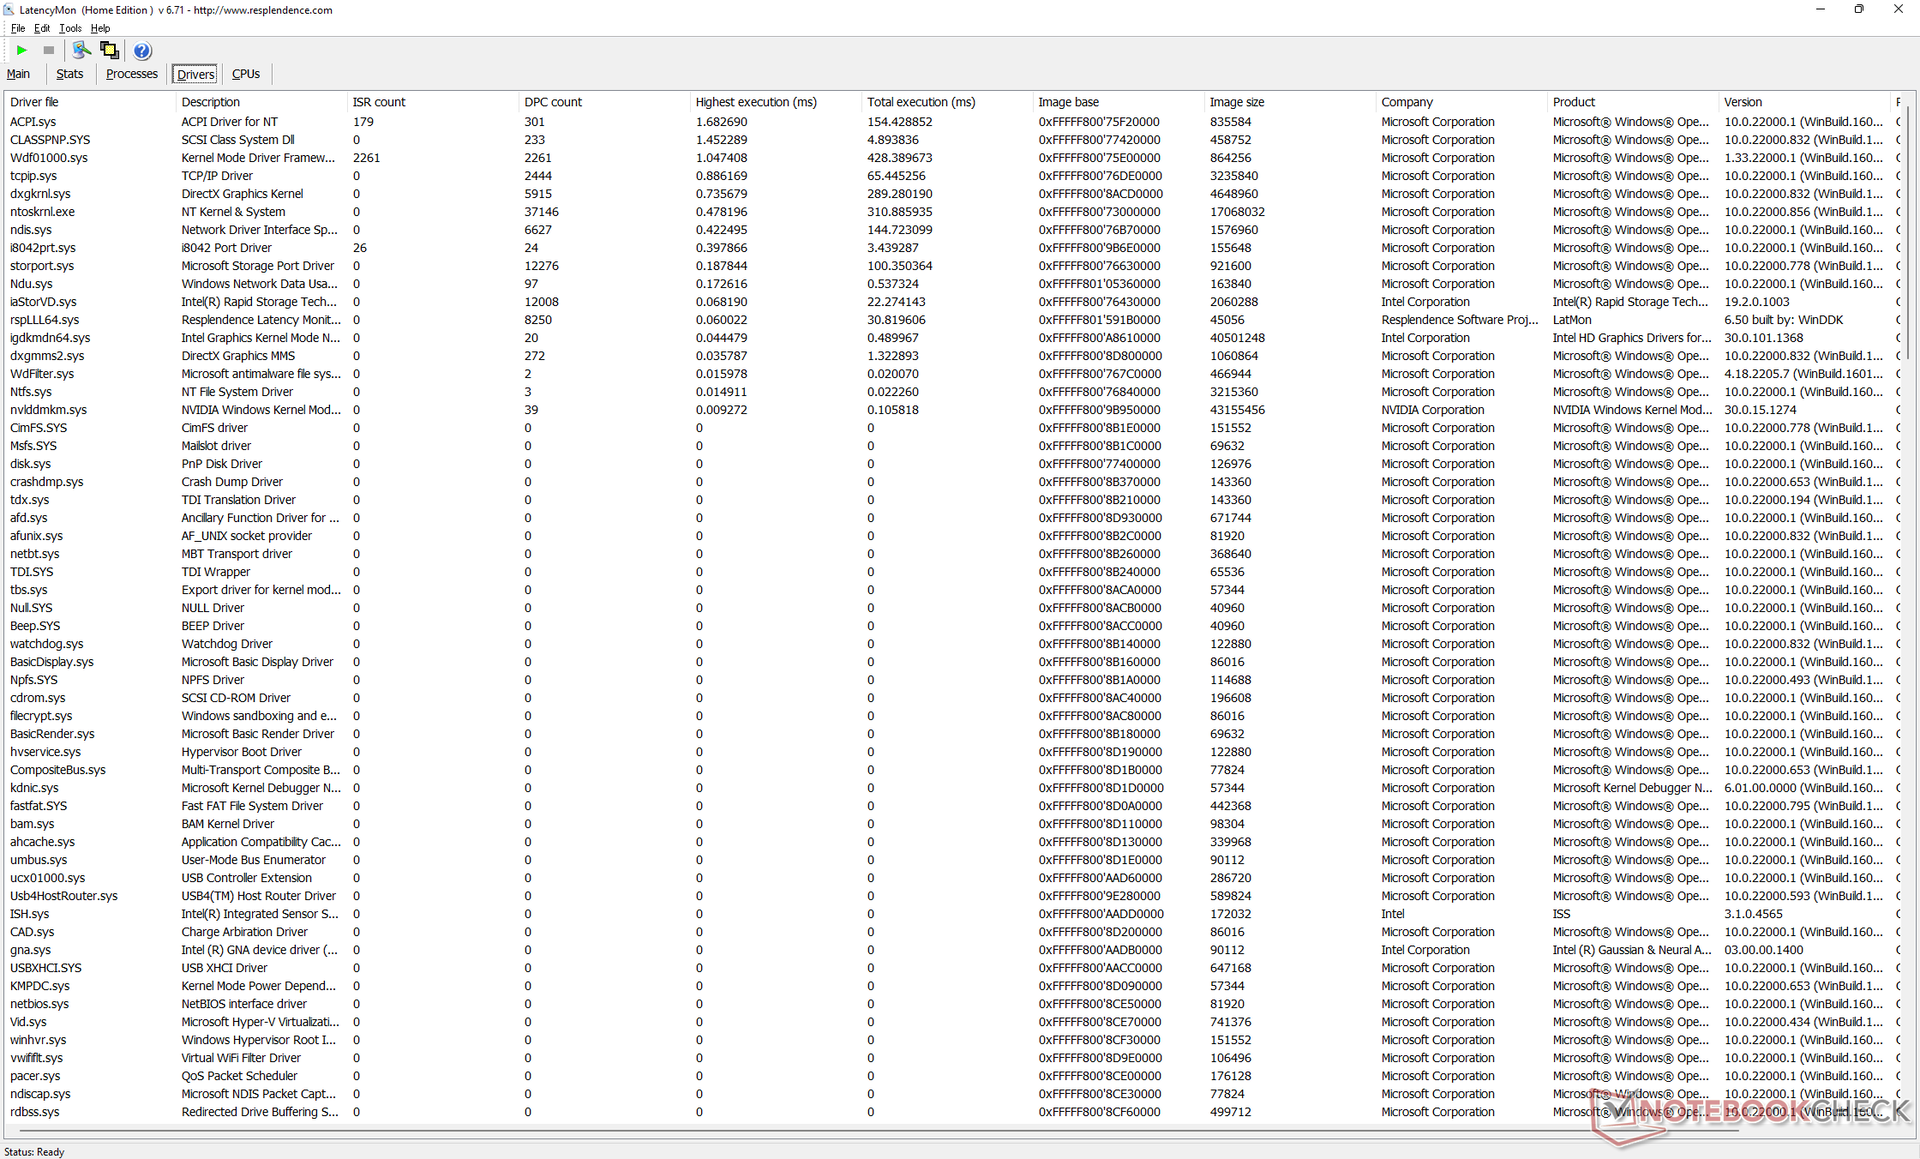
DPC latentie
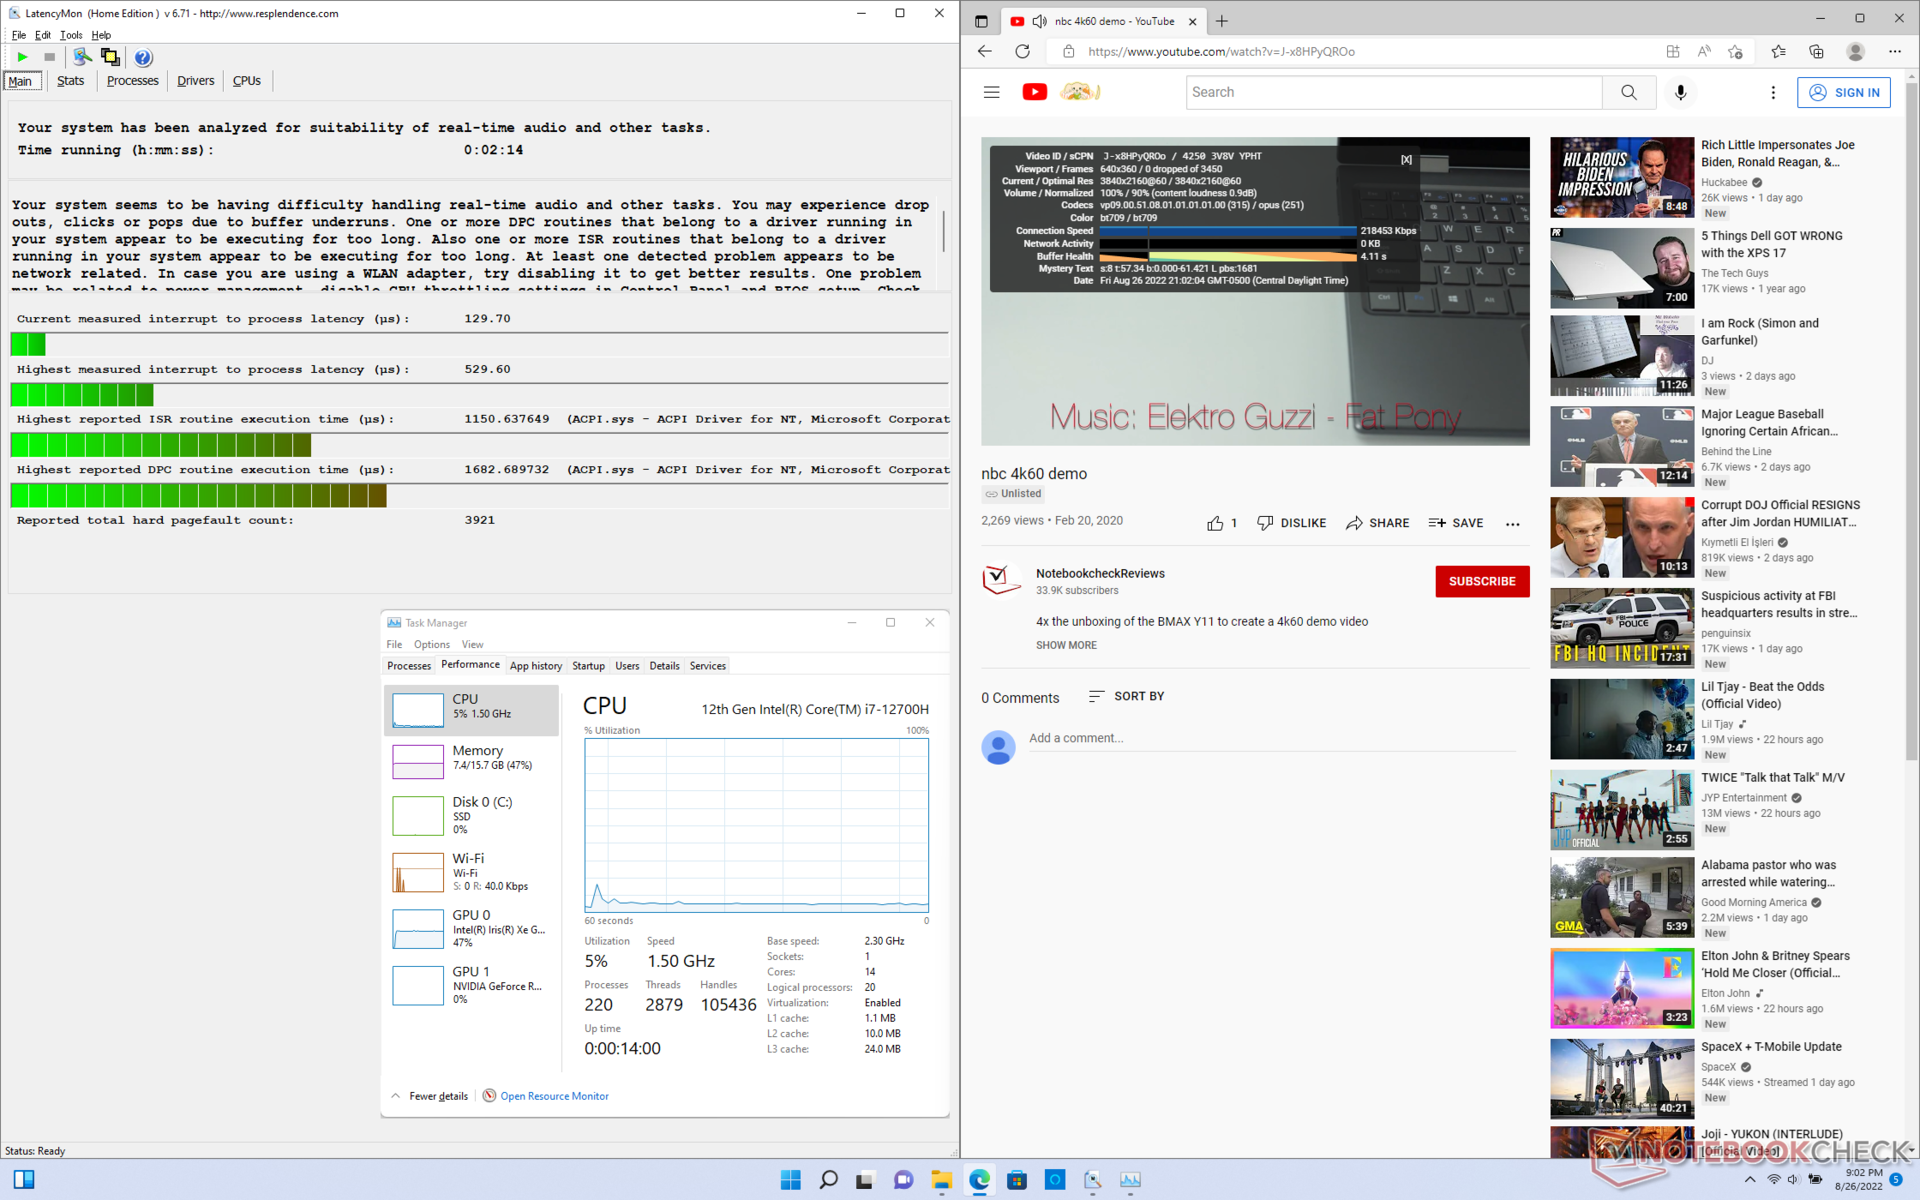
LatencyMon toont kleine DPC-problemen bij het openen van meerdere browsertabbladen van onze startpagina. het afspelen van 4K-video's met 60 FPS verloopt verder vloeiend en zonder enig verlies van frames.
| DPC Latencies / LatencyMon - interrupt to process latency (max), Web, Youtube, Prime95 | |
| HP Envy 14-eb0010nr | |
| Schenker Vision 14 | |
| MSI Summit E14 A11SCS | |
| Asus Vivobook Pro 14 M3401QC-KM007T | |
| Asus Zenbook 14X UX5400E | |
| Dell Inspiron 14 7420 2-in-1 | |
| Dell Inspiron 14 Plus 7420 | |
* ... kleiner is beter
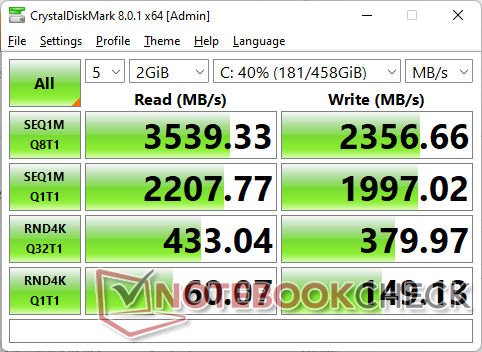
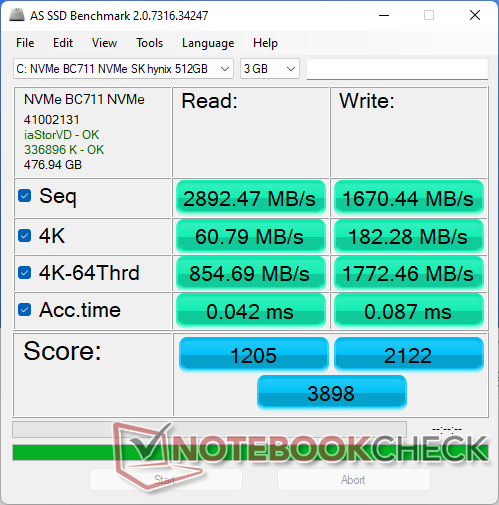
Opslagvoorzieningen - Warmtespreider inbegrepen
Onze unit wordt geleverd met een 512 GB SK Hynix BC711 PCIe3 NVMe SSD die sequentiële leessnelheden biedt tot 3600 MB/s. De schijf vertoont geen prestatieproblemen bij het uitvoeren van DiskSpd in een lus, omdat deze wordt geleverd met zijn eigen vooraf geïnstalleerde hitteverspreider. Ter vergelijking, de meeste andere OEM's leveren er geen bij hun budget of zelfs midrange laptop modellen. Het zou echter leuk zijn geweest om snellere PCIe4 opties te zien op de Inspiron 14 Plus 7420.

* ... kleiner is beter
Disk Throttling: DiskSpd Read Loop, Queue Depth 8
GPU-prestaties - snel voor de grootte en de prijs
Grafische prestaties zijn waar we verwachten dat hij is ten opzichte van andere laptops met dezelfde GeForce RTX 3050 GPU. In feite zijn de resultaten vrijwel gelijk aan die van de RTX 3050 Ti zoals gevonden op de Schenker Vision 14 ofAsus ROG Flow Z13. Dell introduceert in de nabije toekomst misschien SKU's met de RTX 3050 Ti, maar we raden het niet aan, omdat het waarschijnlijk slechts marginaal sneller zal zijn dan onze basis RTX 3050 SKU op zijn best.
Gebruikers die upgraden van de veel oudere GTX 1650 Ti Max-Q zullen aanzienlijke verbeteringen zien van ongeveer 50 procent.
Houd er rekening mee dat de grafische prestaties afnemen als u werkt in de Dell geoptimaliseerde modus in plaats van de Dell Ultra Performance-modus. Een Fire Strike test in de geoptimaliseerde modus zou een grafische score van 10966 punten opleveren, vergeleken met 12125 punten in de Ultra Performance modus.
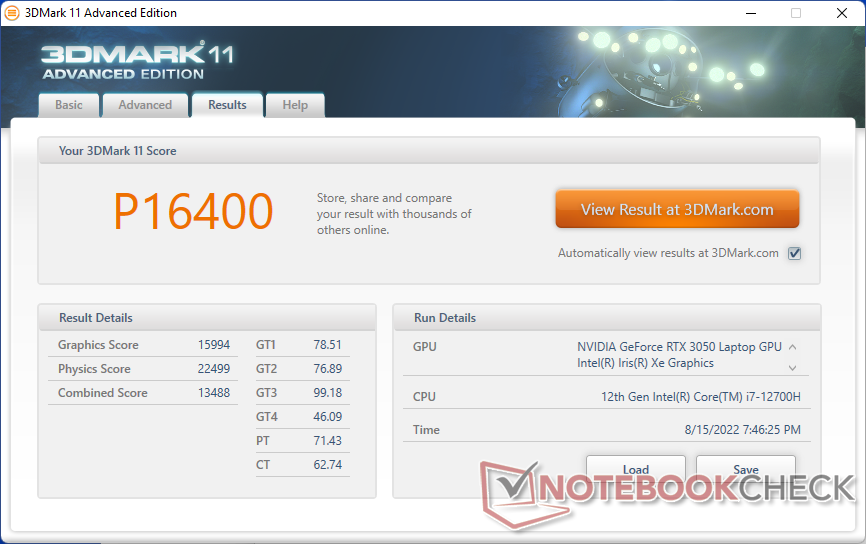
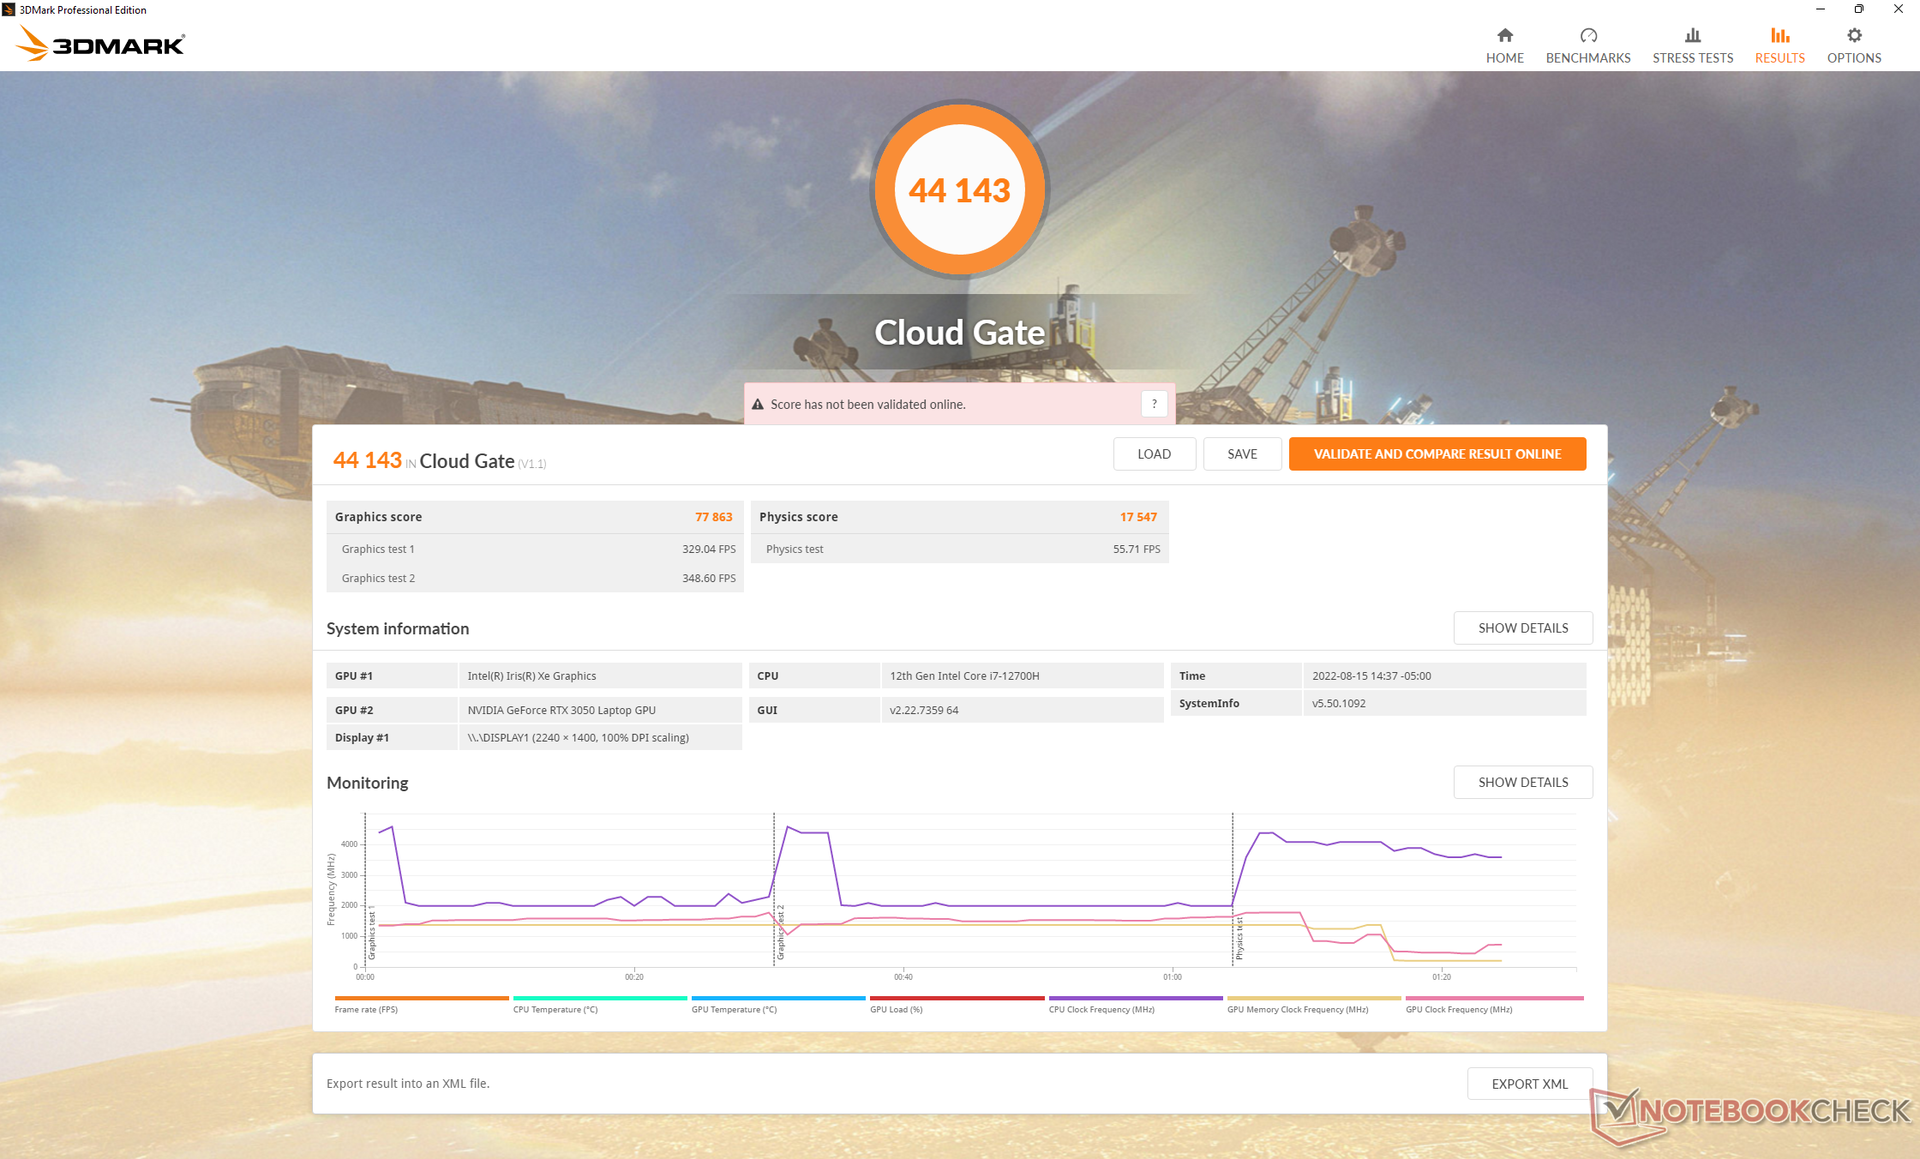
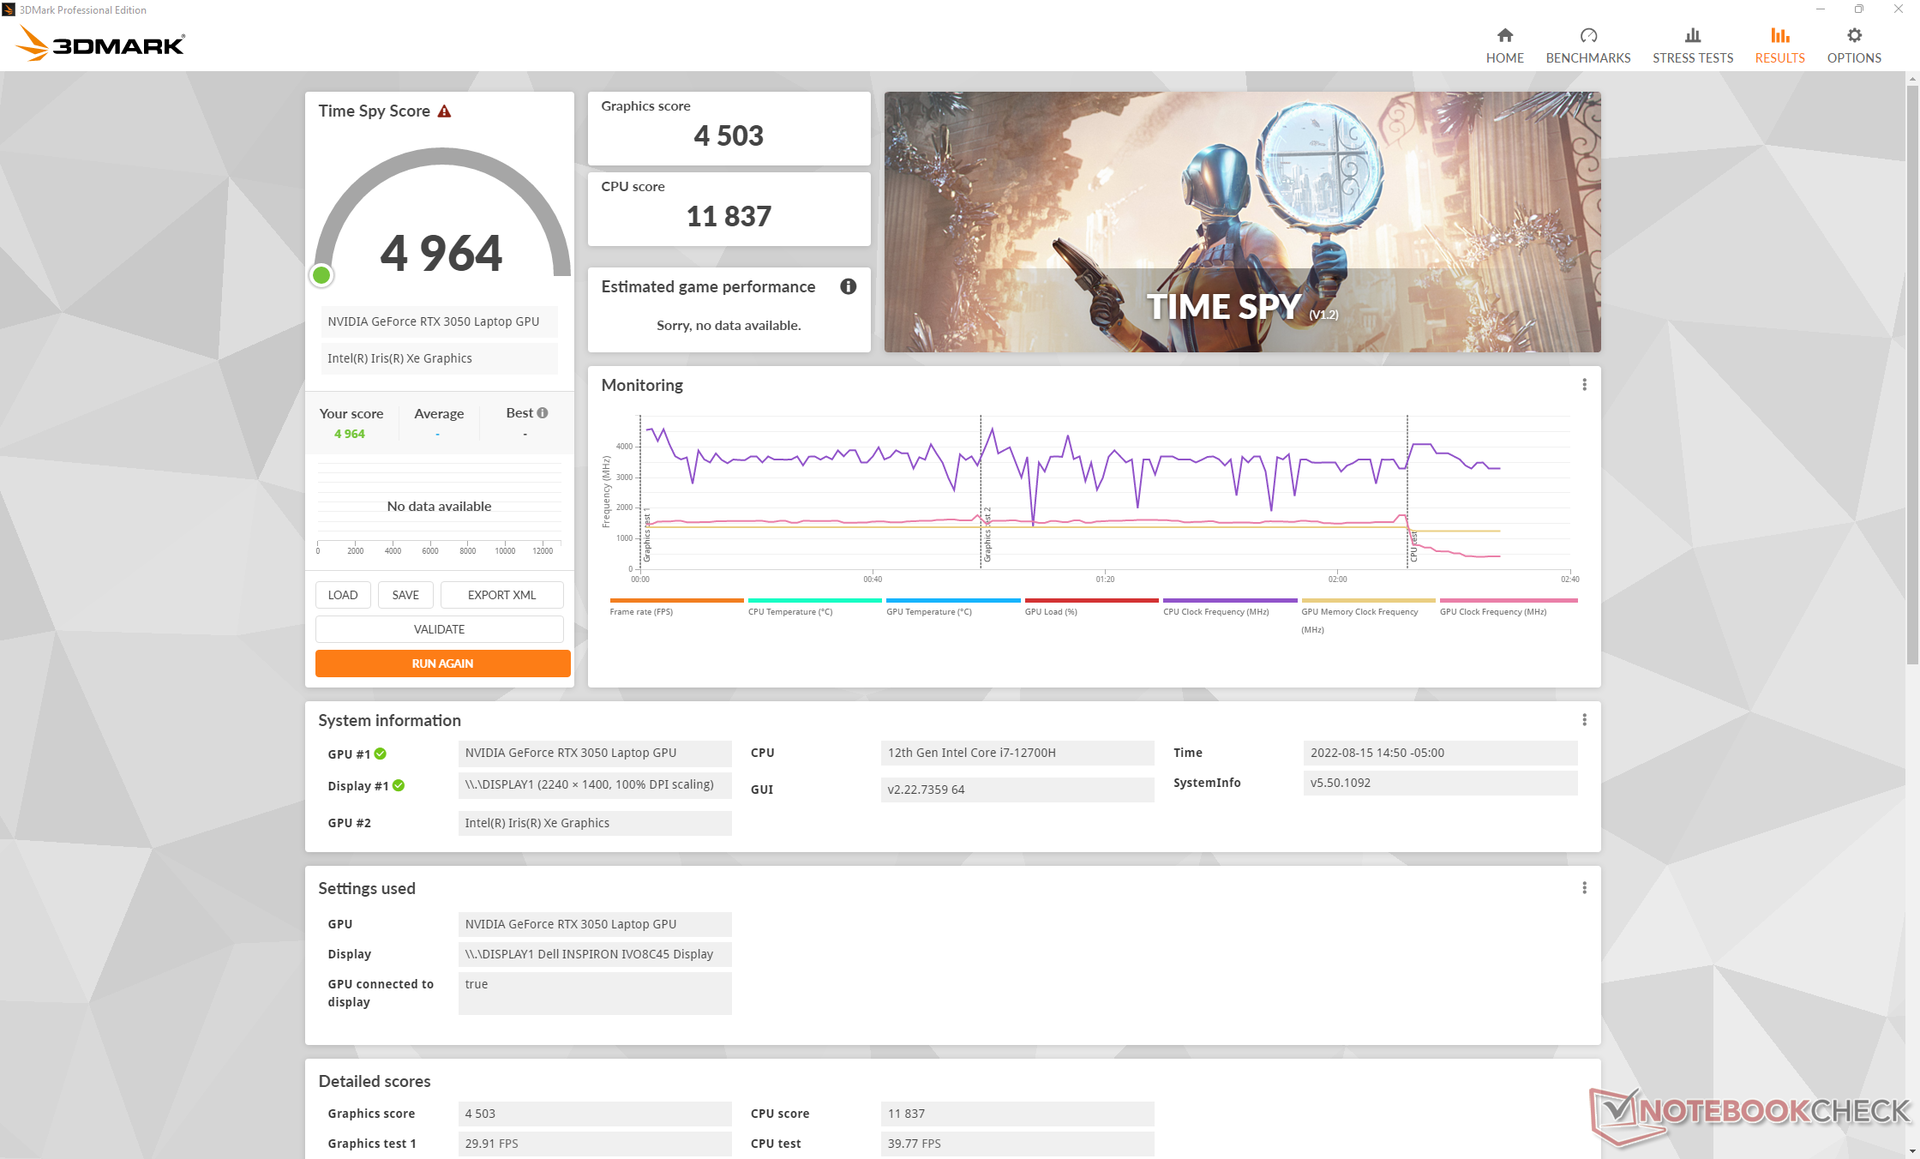

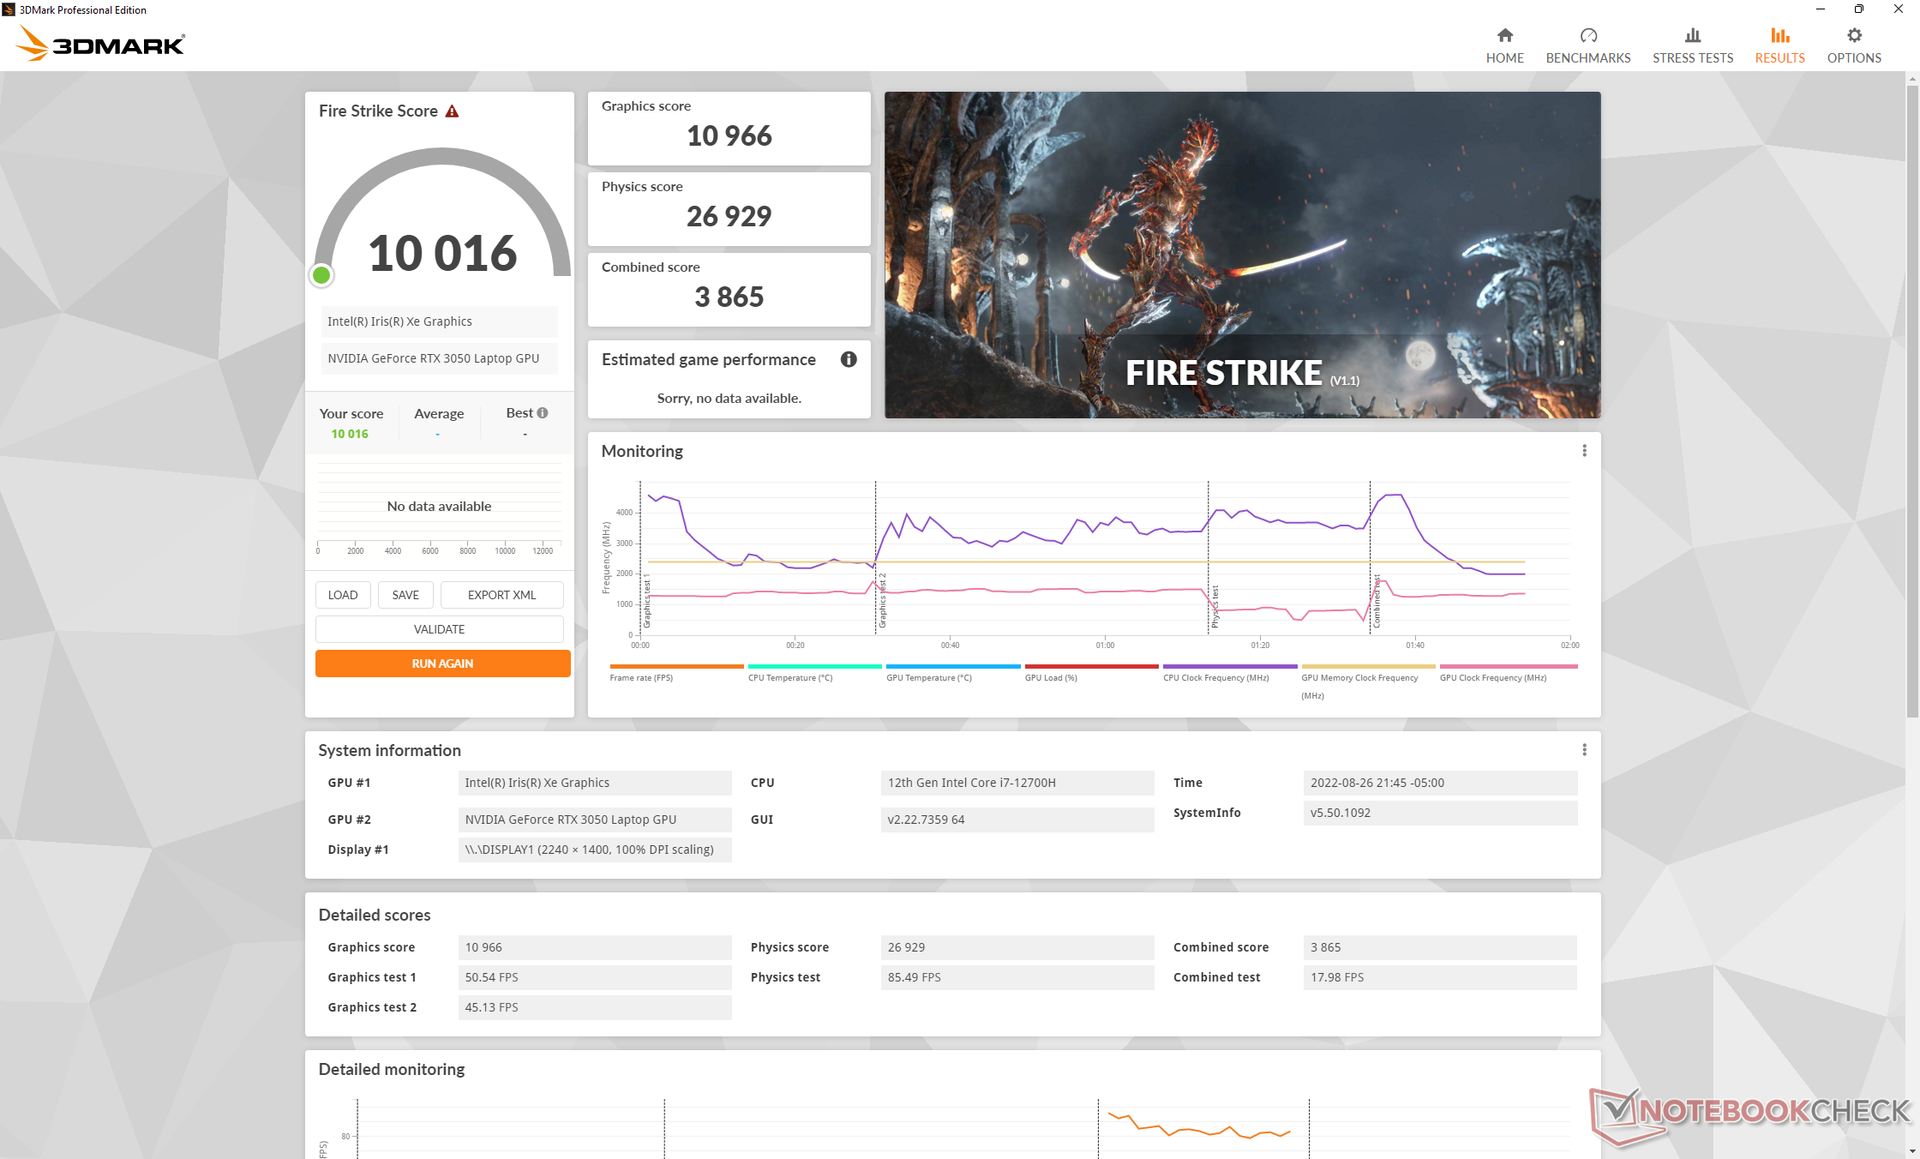
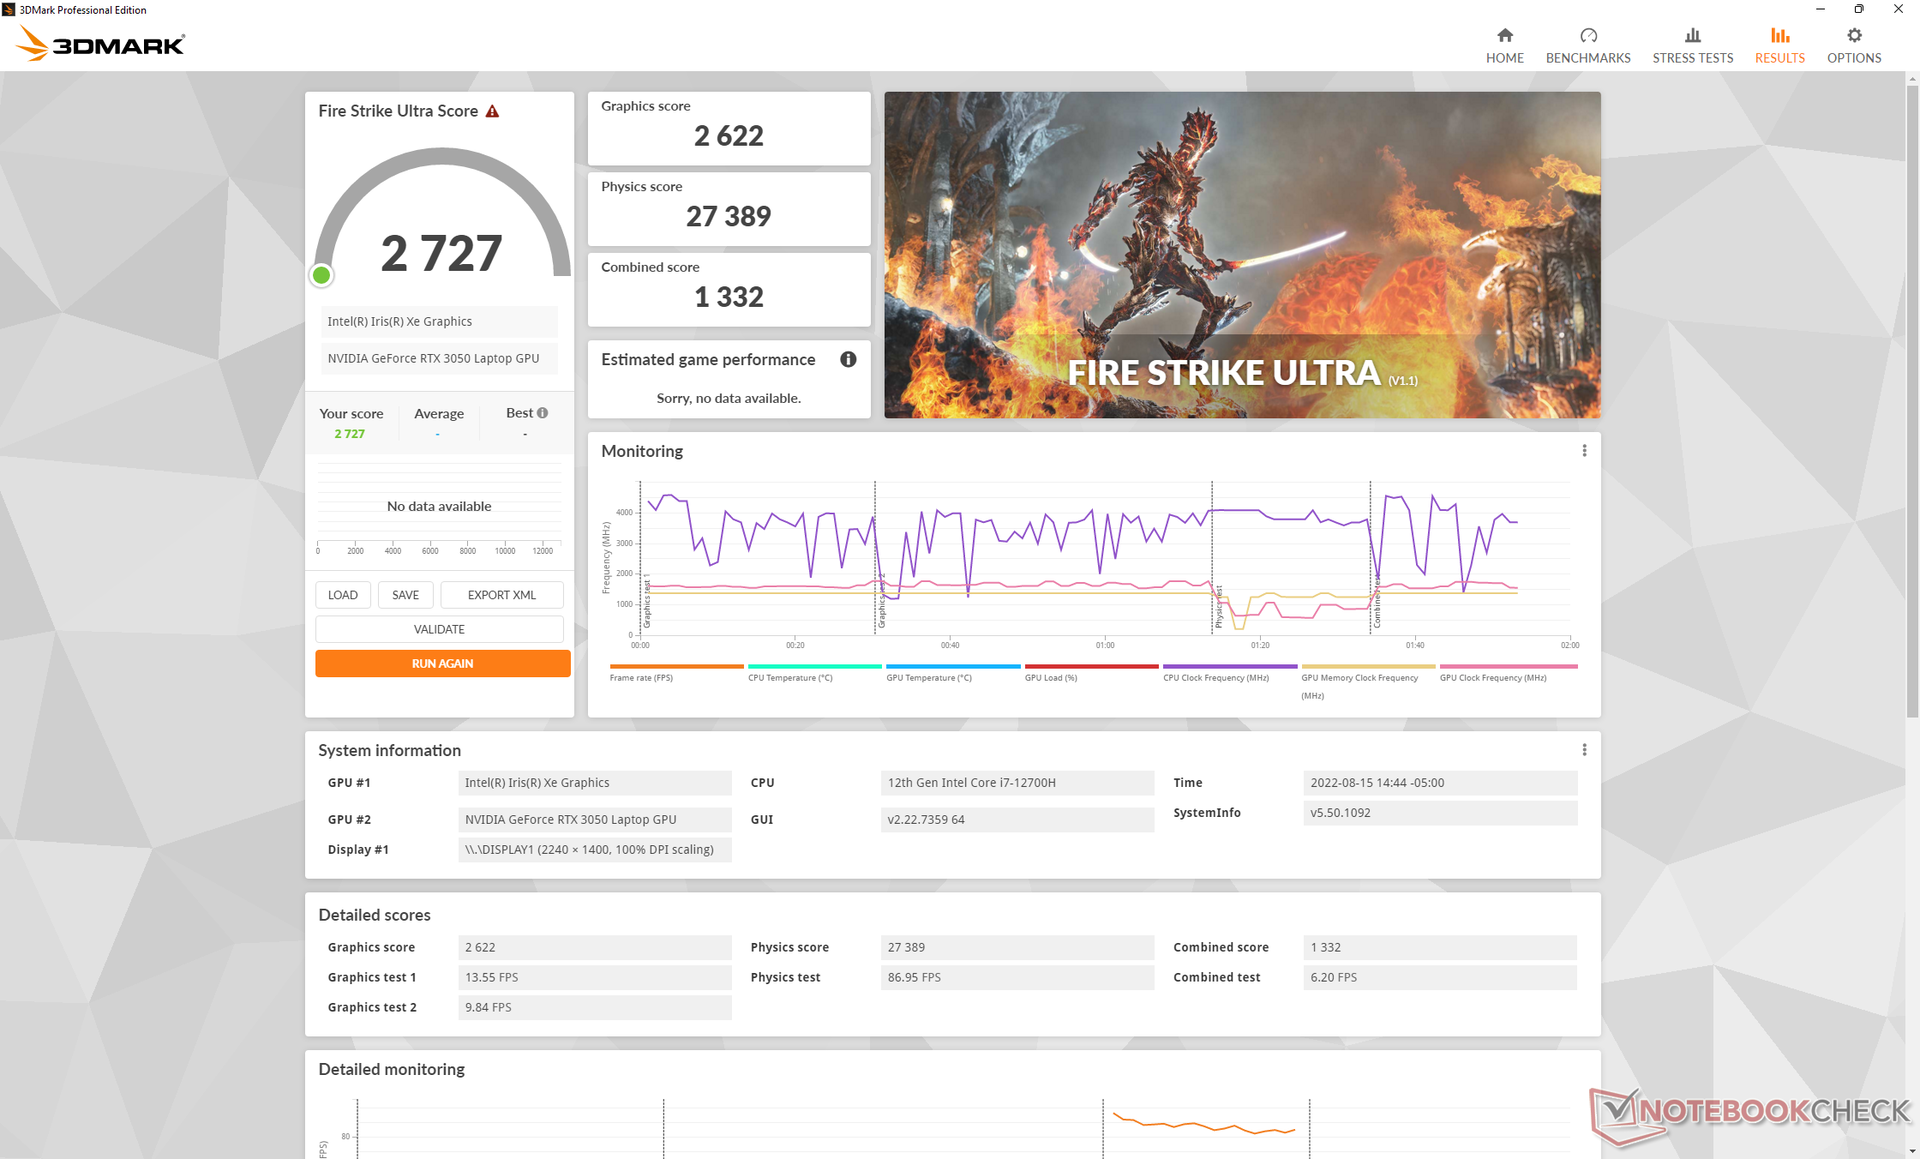
| 3DMark 11 Performance | 16400 punten | |
| 3DMark Cloud Gate Standard Score | 44143 punten | |
| 3DMark Fire Strike Score | 11060 punten | |
| 3DMark Time Spy Score | 4964 punten | |
Help | ||
Witcher 3 FPS Chart
| lage | gem. | hoge | ultra | |
|---|---|---|---|---|
| GTA V (2015) | 181.8 | 161.4 | 111.5 | 61.8 |
| The Witcher 3 (2015) | 222.2 | 150.4 | 83.5 | 46 |
| Dota 2 Reborn (2015) | 174.4 | 158.7 | 145 | 134.4 |
| Final Fantasy XV Benchmark (2018) | 113.5 | 66.1 | 47.4 | |
| X-Plane 11.11 (2018) | 137.8 | 117.2 | 94.4 | |
| Strange Brigade (2018) | 263 | 118.2 | 94.7 | 82.4 |
| Cyberpunk 2077 1.6 (2022) | 68.6 | 55 | 41 | 33.8 |
Emissions - Loud Like A Gamer
Systeemgeluid
De dubbele ventilatoren in het systeem zijn gevoelig voor hoge belastingen. Bij het starten van 3DMark 06, bijvoorbeeld, nam het ventilatorgeluid snel toe voordat het stabiliseerde op ongeveer 47 dB(A) tegen het einde van de eerste benchmarkscène, vergeleken met 43 dB(A) op de Schenker Vision 14 of 35 dB(A) op de HP Envy 14 elk met discrete GeForce graphics
Het draaien van games op Ultra Performance modus zou resulteren in een ventilatorgeluid van bijna 52 dB(A), wat vergelijkbaar is met veel dedicated gaming laptops met snellere graphics. Het ventilatorgeluid zou dalen tot 48 dB(A) als in plaats daarvan wordt gegamed in de Dell Optimized modus, maar dit gaat gepaard met een kleine vermindering van de grafische prestaties, zoals hierboven vermeld. Gebruikers moeten dus de maximale toerentallen van de ventilatoren verdragen als ze de volledige 50 W vermogensenveloppe van de GeForce GPU willen benutten
Gelukkig zijn de ventilatoren behoorlijk stil met 26,5 dB(A) tegen een stille achtergrond van 23,2 dB(A) tijdens meer alledaagse taken zoals surfen op het web of video streamen. Pas wanneer hogere belastingen worden geïntroduceerd, beginnen ze erg snel op te lopen.
Geluidsniveau
| Onbelast |
| 23.2 / 23.2 / 23.2 dB (A) |
| Belasting |
| 47.5 / 51.7 dB (A) |
 | ||
30 dB stil 40 dB(A) hoorbaar 50 dB(A) luid |
||
min: | ||
| Dell Inspiron 14 Plus 7420 GeForce RTX 3050 4GB Laptop GPU, i7-12700H, SK Hynix BC711 512GB HFM512GD3GX013N | Asus Vivobook Pro 14 M3401QC-KM007T GeForce RTX 3050 4GB Laptop GPU, R5 5600H, Intel SSD 670p SSDPEKNU512GZ | Dell Inspiron 14 7420 2-in-1 Iris Xe G7 96EUs, i7-1255U, WDC PC SN530 SDBPMPZ-512G | Schenker Vision 14 GeForce RTX 3050 Ti Laptop GPU, i7-11370H, Samsung SSD 980 Pro 1TB MZ-V8P1T0BW | Asus Zenbook 14X UX5400E GeForce MX450, i7-1165G7, SK Hynix HFM001TD3JX013N | HP Envy 14-eb0010nr GeForce GTX 1650 Ti Max-Q, i5-1135G7, Samsung SSD PM981a MZVLB256HBHQ | |
|---|---|---|---|---|---|---|
| Noise | -14% | 7% | 0% | -0% | 3% | |
| uit / omgeving * (dB) | 23.2 | 25.4 -9% | 23.1 -0% | 24.3 -5% | 26 -12% | 25.9 -12% |
| Idle Minimum * (dB) | 23.2 | 25.4 -9% | 24.7 -6% | 24.3 -5% | 26 -12% | 26 -12% |
| Idle Average * (dB) | 23.2 | 25.4 -9% | 24.7 -6% | 24.3 -5% | 26 -12% | 26 -12% |
| Idle Maximum * (dB) | 23.2 | 30.9 -33% | 24.7 -6% | 25.9 -12% | 26.3 -13% | 26 -12% |
| Load Average * (dB) | 47.5 | 56 -18% | 27.7 42% | 43.3 9% | 37.1 22% | 34.9 27% |
| Witcher 3 ultra * (dB) | 51.7 | 45.1 13% | 44.6 14% | 34.5 33% | ||
| Load Maximum * (dB) | 51.7 | 56 -8% | 45.1 13% | 49.5 4% | 38 26% | 48.7 6% |
* ... kleiner is beter
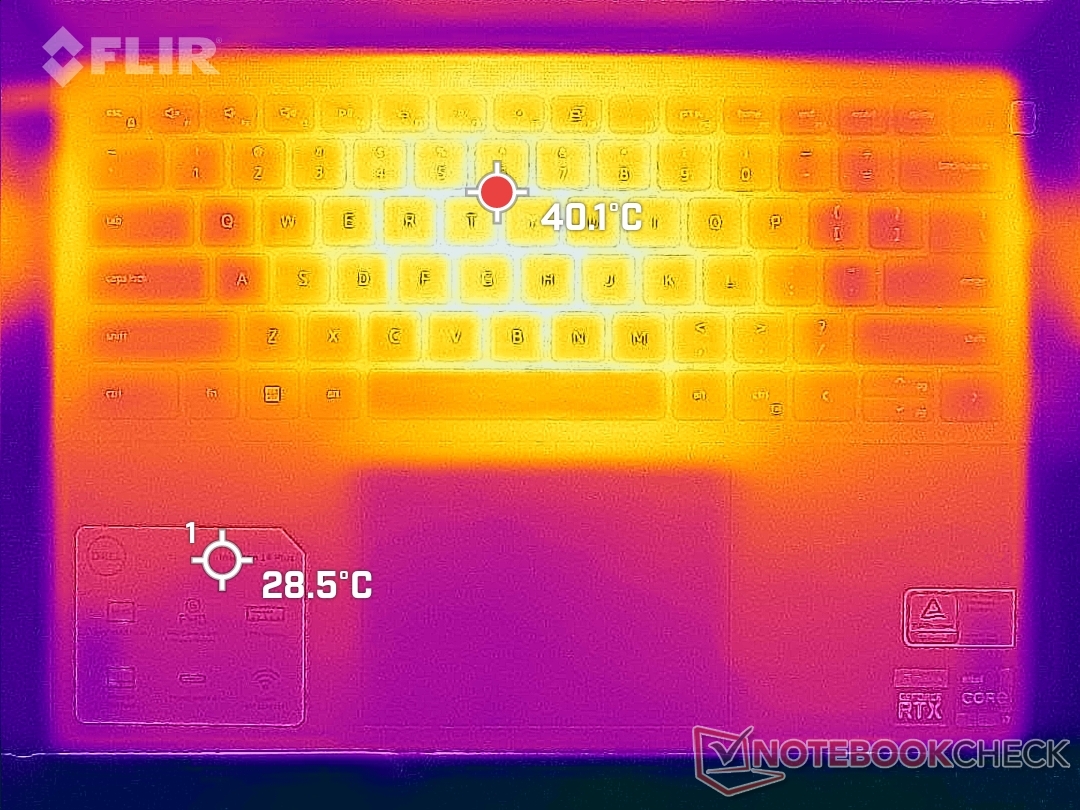
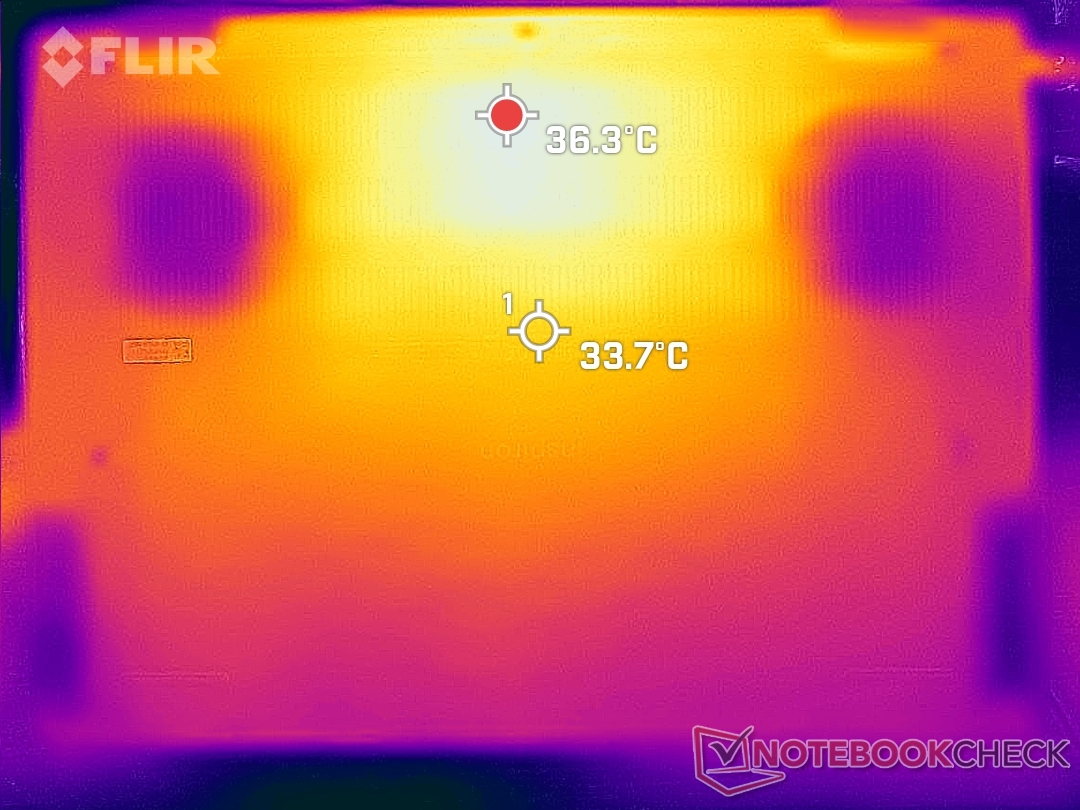
Temperatuur
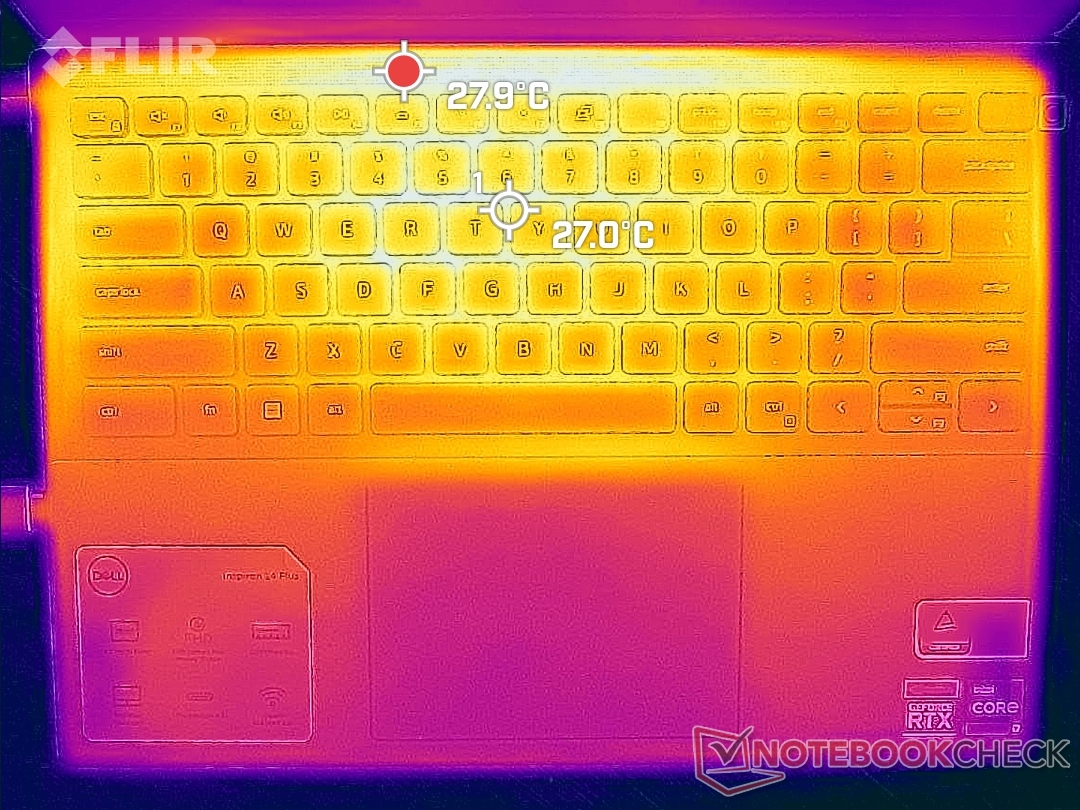
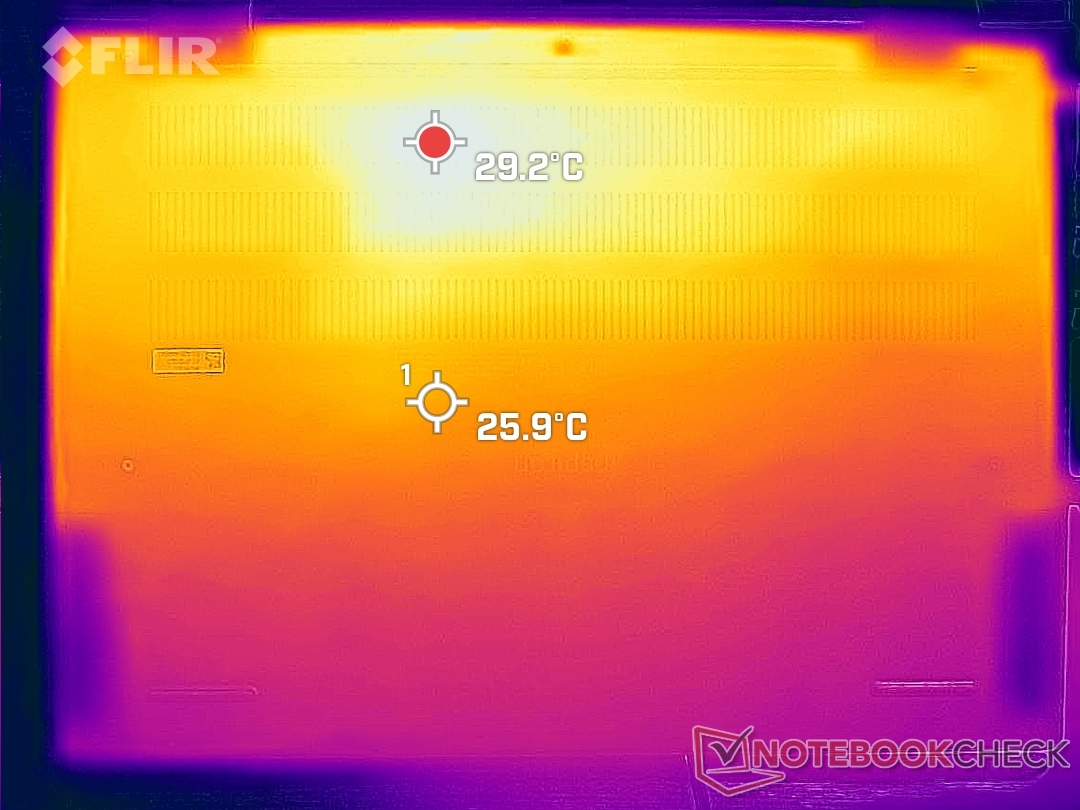
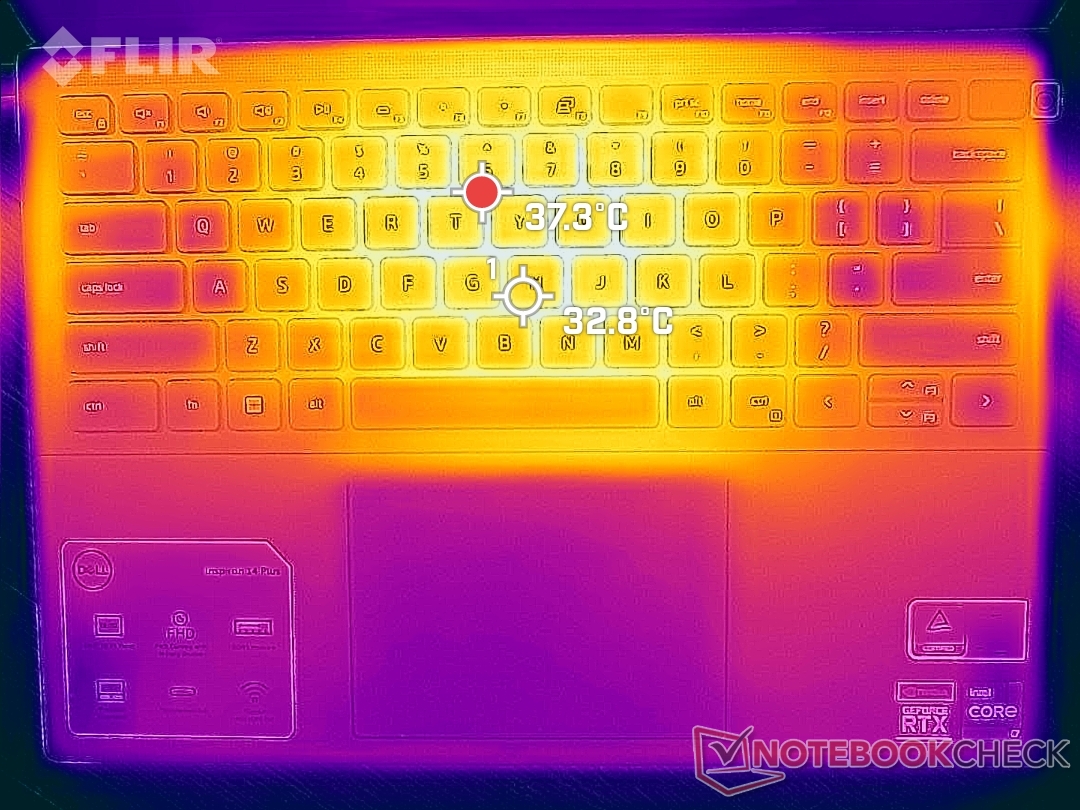
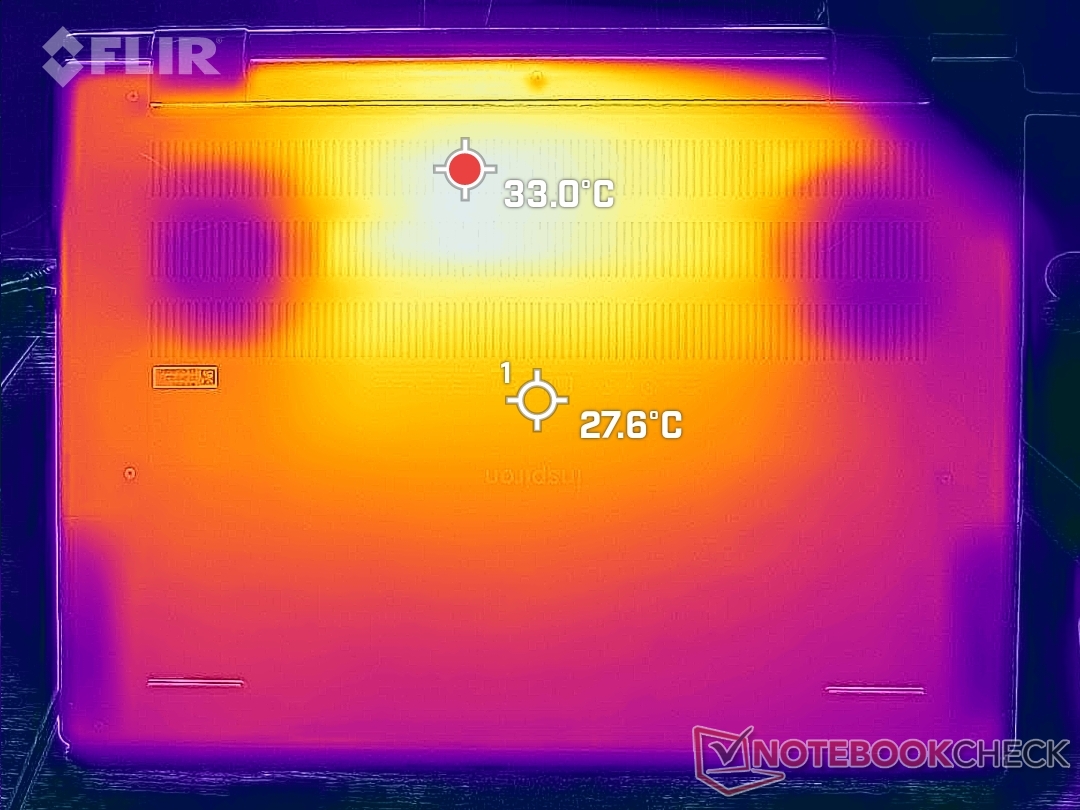
De oppervlaktetemperaturen bij stationair draaien zijn warm met ongeveer 28 C aan zowel de boven- als onderkant, wat vergelijkbaar is met andere dunne multimedia-laptops met discrete graphics, zoals deAsus Vivobook Pro 14 of Schenker Vision 14. Tijdens het gamen kunnen de hotspots oplopen tot net boven de 40 C in de buurt van het midden van het toetsenbord en de achterkant van het chassis, terwijl de armsteunen comfortabeler blijven in het bereik van onder de 30 C. Hete plekken zijn hier over het algemeen koeler dan op de eerder genoemde Asus of Schenker die 45 C tot 55 C kunnen bereiken.
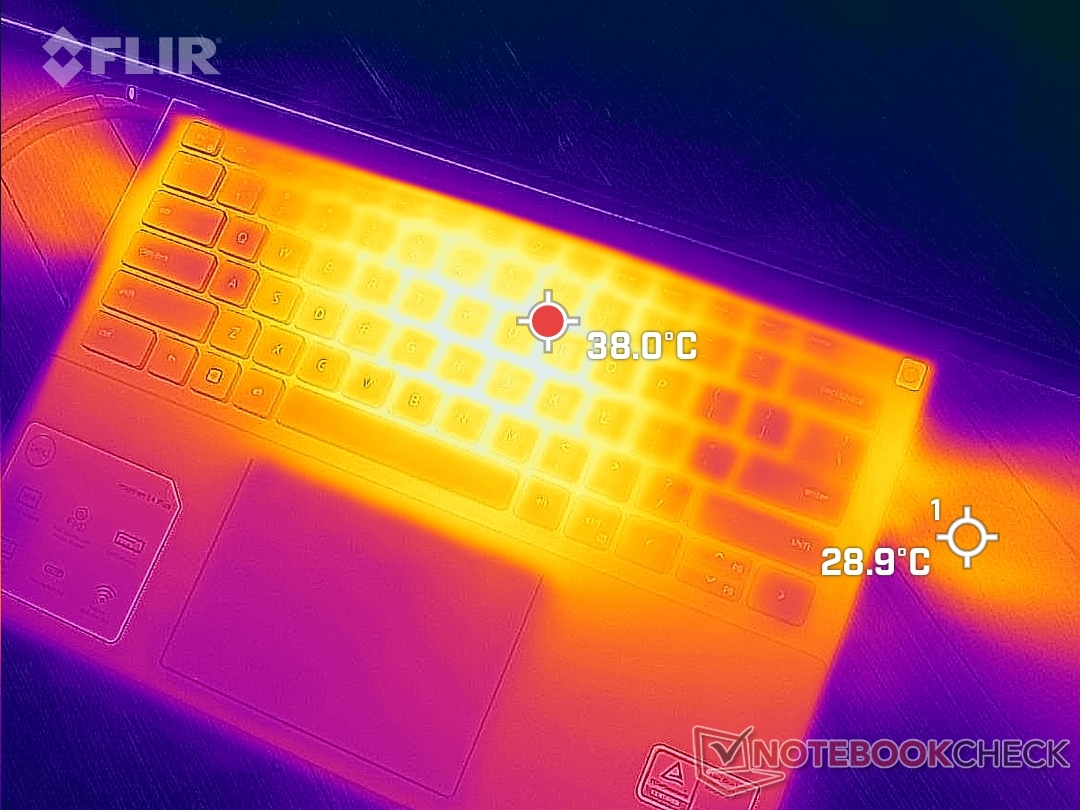
(±) De maximumtemperatuur aan de bovenzijde bedraagt 40 °C / 104 F, vergeleken met het gemiddelde van 36.8 °C / 98 F, variërend van 21 tot 71 °C voor de klasse Multimedia.
(+) De bodem warmt op tot een maximum van 36.4 °C / 98 F, vergeleken met een gemiddelde van 39.1 °C / 102 F
(+) Bij onbelast gebruik bedraagt de gemiddelde temperatuur voor de bovenzijde 24.2 °C / 76 F, vergeleken met het apparaatgemiddelde van 31.3 °C / 88 F.
(+) Bij het spelen van The Witcher 3 is de gemiddelde temperatuur voor de bovenzijde 28.6 °C / 83 F, vergeleken met het apparaatgemiddelde van 31.3 °C / 88 F.
(+) De palmsteunen en het touchpad zijn met een maximum van ###max## °C / 84.9 F koeler dan de huidtemperatuur en voelen daarom koel aan.
(±) De gemiddelde temperatuur van de handpalmsteun van soortgelijke toestellen bedroeg 28.7 °C / 83.7 F (-0.7 °C / -1.2 F).
| Dell Inspiron 14 Plus 7420 Intel Core i7-12700H, NVIDIA GeForce RTX 3050 4GB Laptop GPU | Asus Vivobook Pro 14 M3401QC-KM007T AMD Ryzen 5 5600H, NVIDIA GeForce RTX 3050 4GB Laptop GPU | Dell Inspiron 14 7420 2-in-1 Intel Core i7-1255U, Intel Iris Xe Graphics G7 96EUs | Schenker Vision 14 Intel Core i7-11370H, NVIDIA GeForce RTX 3050 Ti Laptop GPU | Asus Zenbook 14X UX5400E Intel Core i7-1165G7, NVIDIA GeForce MX450 | MSI Summit E14 A11SCS Intel Core i7-1185G7, NVIDIA GeForce GTX 1650 Ti Max-Q | HP Envy 14-eb0010nr Intel Core i5-1135G7, NVIDIA GeForce GTX 1650 Ti Max-Q | |
|---|---|---|---|---|---|---|---|
| Heat | -25% | -5% | -23% | -17% | -33% | -19% | |
| Maximum Upper Side * (°C) | 40 | 42.3 -6% | 38.2 4% | 49.7 -24% | 42.4 -6% | 49.4 -23% | 41.2 -3% |
| Maximum Bottom * (°C) | 36.4 | 49.6 -36% | 45.6 -25% | 56 -54% | 47.7 -31% | 60.6 -66% | 45.6 -25% |
| Idle Upper Side * (°C) | 27 | 34.2 -27% | 27.4 -1% | 28.8 -7% | 32.3 -20% | 30.6 -13% | 31.8 -18% |
| Idle Bottom * (°C) | 29.2 | 37.9 -30% | 28.4 3% | 30.6 -5% | 31.9 -9% | 37.4 -28% | 37.8 -29% |
* ... kleiner is beter
Stresstest
Het draaien van Prime95 om de CPU te belasten zou de kloksnelheden, temperatuur en het stroomverbruik van de kaart doen pieken tot respectievelijk 3,5 GHz, 100 C en 80 W, gedurende ongeveer 10 seconden. Daarna namen de kloksnelheden, temperatuur en het opgenomen vermogen gestaag af, voordat ze stabiliseerden op respectievelijk 1,9 GHz, 80 C en 38 W, om de temperatuur onder controle te houden. De prestatiedaling is relatief steil naarmate de HP Pavilion Plus 14 met dezelfde CPU in staat is om een sneller 2,2 tot 2,9 GHz bereik te handhaven wanneer hij aan dezelfde test wordt onderworpen.
Het draaien van Witcher 3 laat zien dat de GeForce GPU stabiliseert op 1590 MHz, 74 C en 50 W. Ter vergelijking, de RTX 3050 Ti in de grotere Inspiron 16 Plus zou stabiliseren op 1627 MHz, 84 C en 63 W. Core temperaturen zijn niet verrassend hoog, omdat dit een van de weinige 14-inch laptops is die zowel met een Core H-serie CPU als een GeForce RTX GPU wordt geleverd. Door het energieprofiel te wijzigen van Ultra Performance naar Optimized zal de GPU minder energie verbruiken, tot ongeveer 45 W of minder.
Op de batterij werken beperkt de prestaties. Een Fire Strike test op batterijen zou Natuurkunde en Grafische scores opleveren van slechts 9493 en 7637 punten, respectievelijk, vergeleken met 26940 en 12125 punten op netstroom.
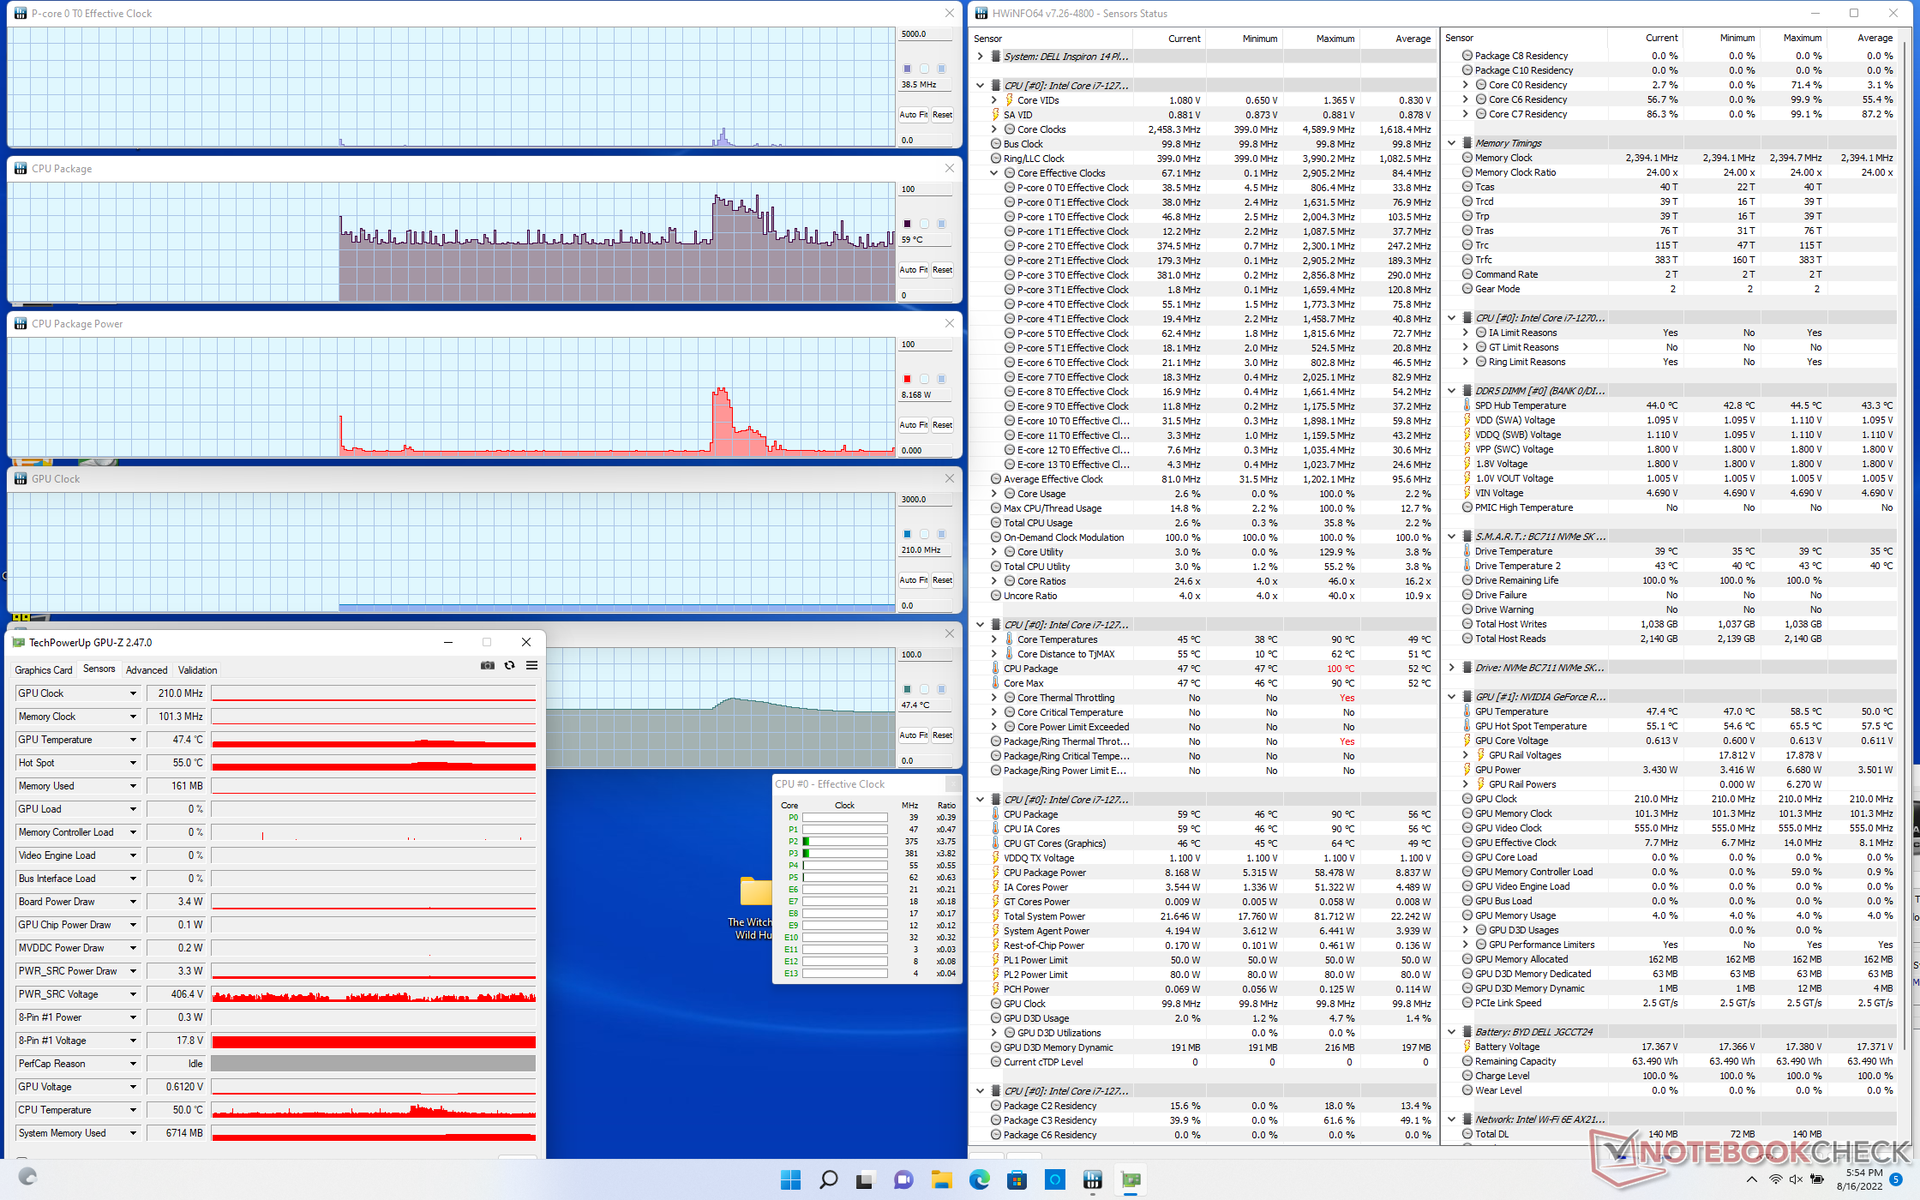
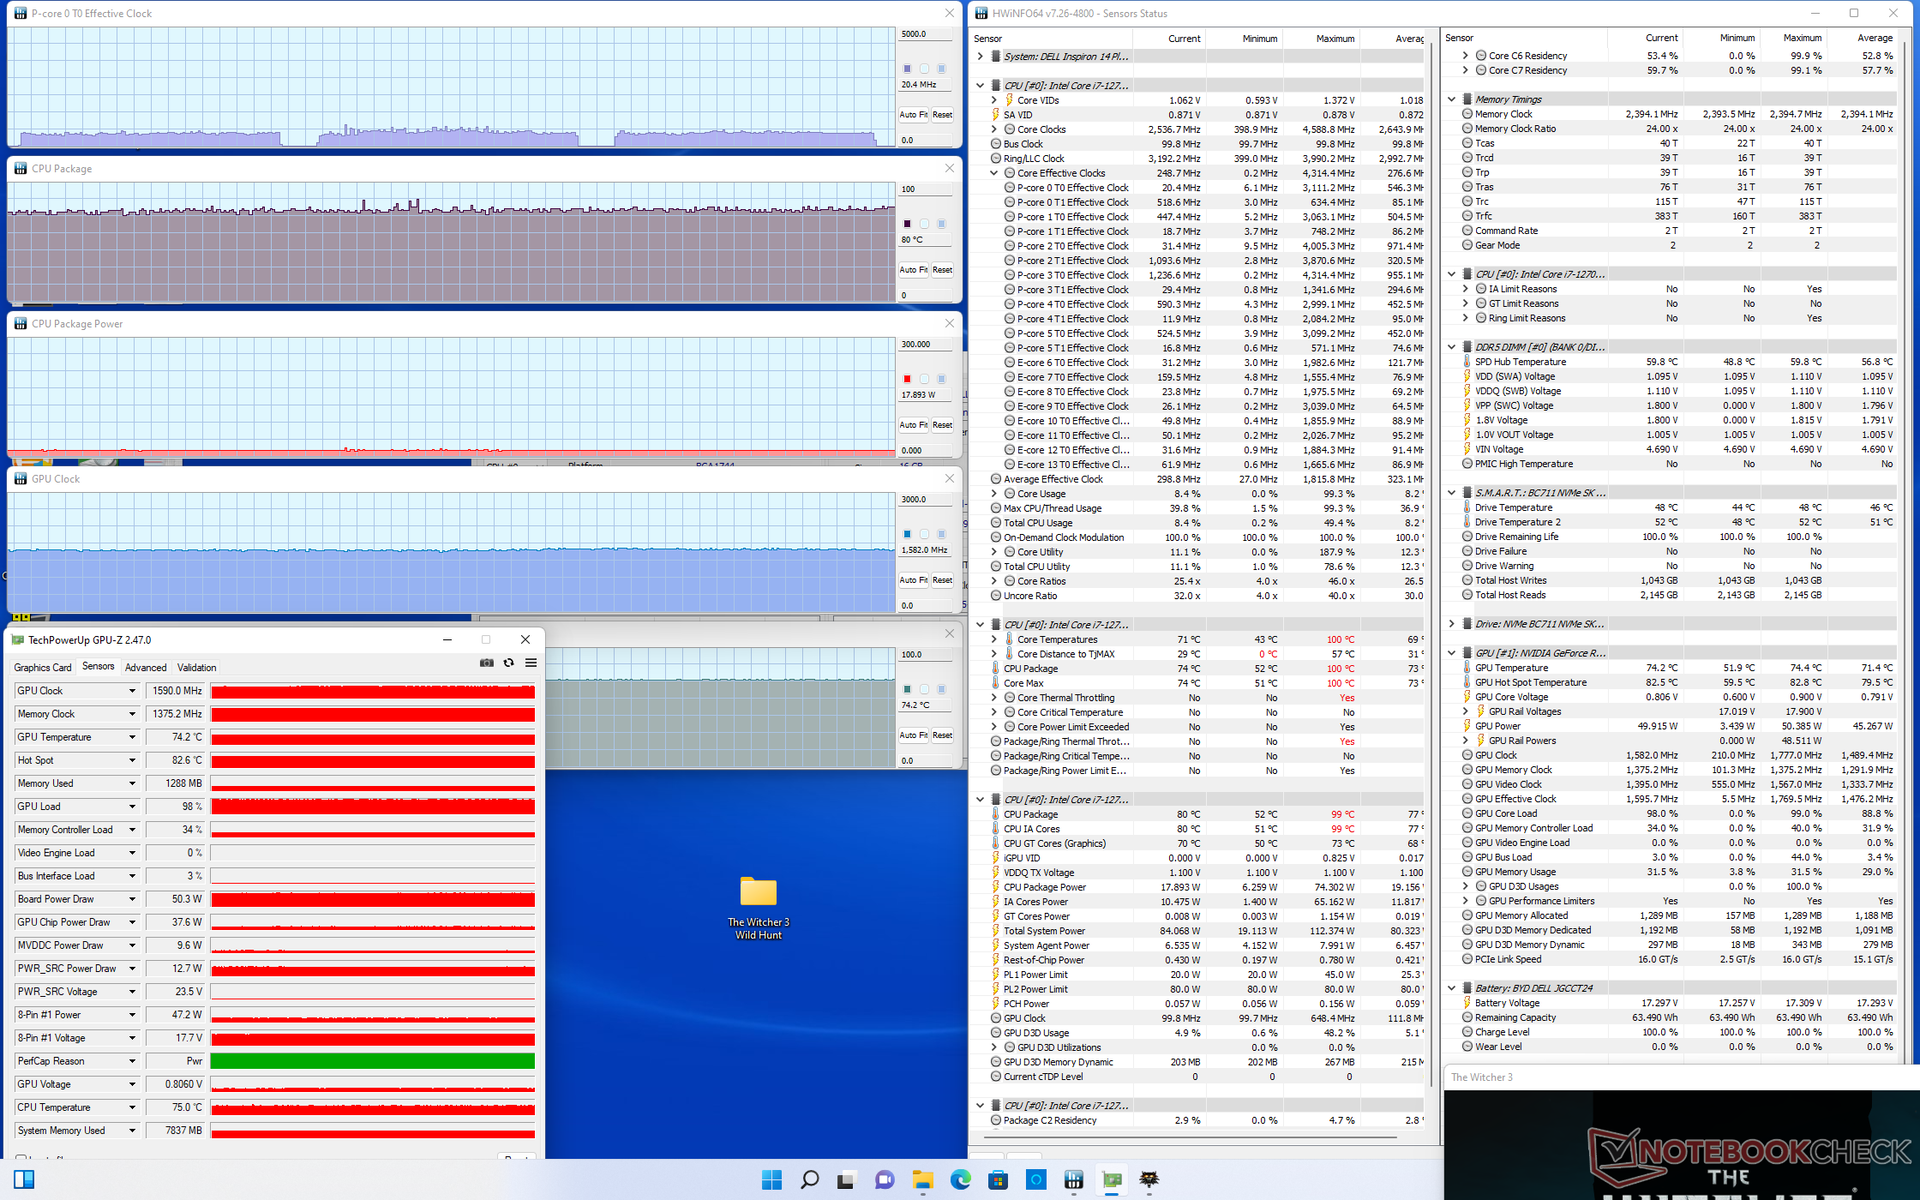
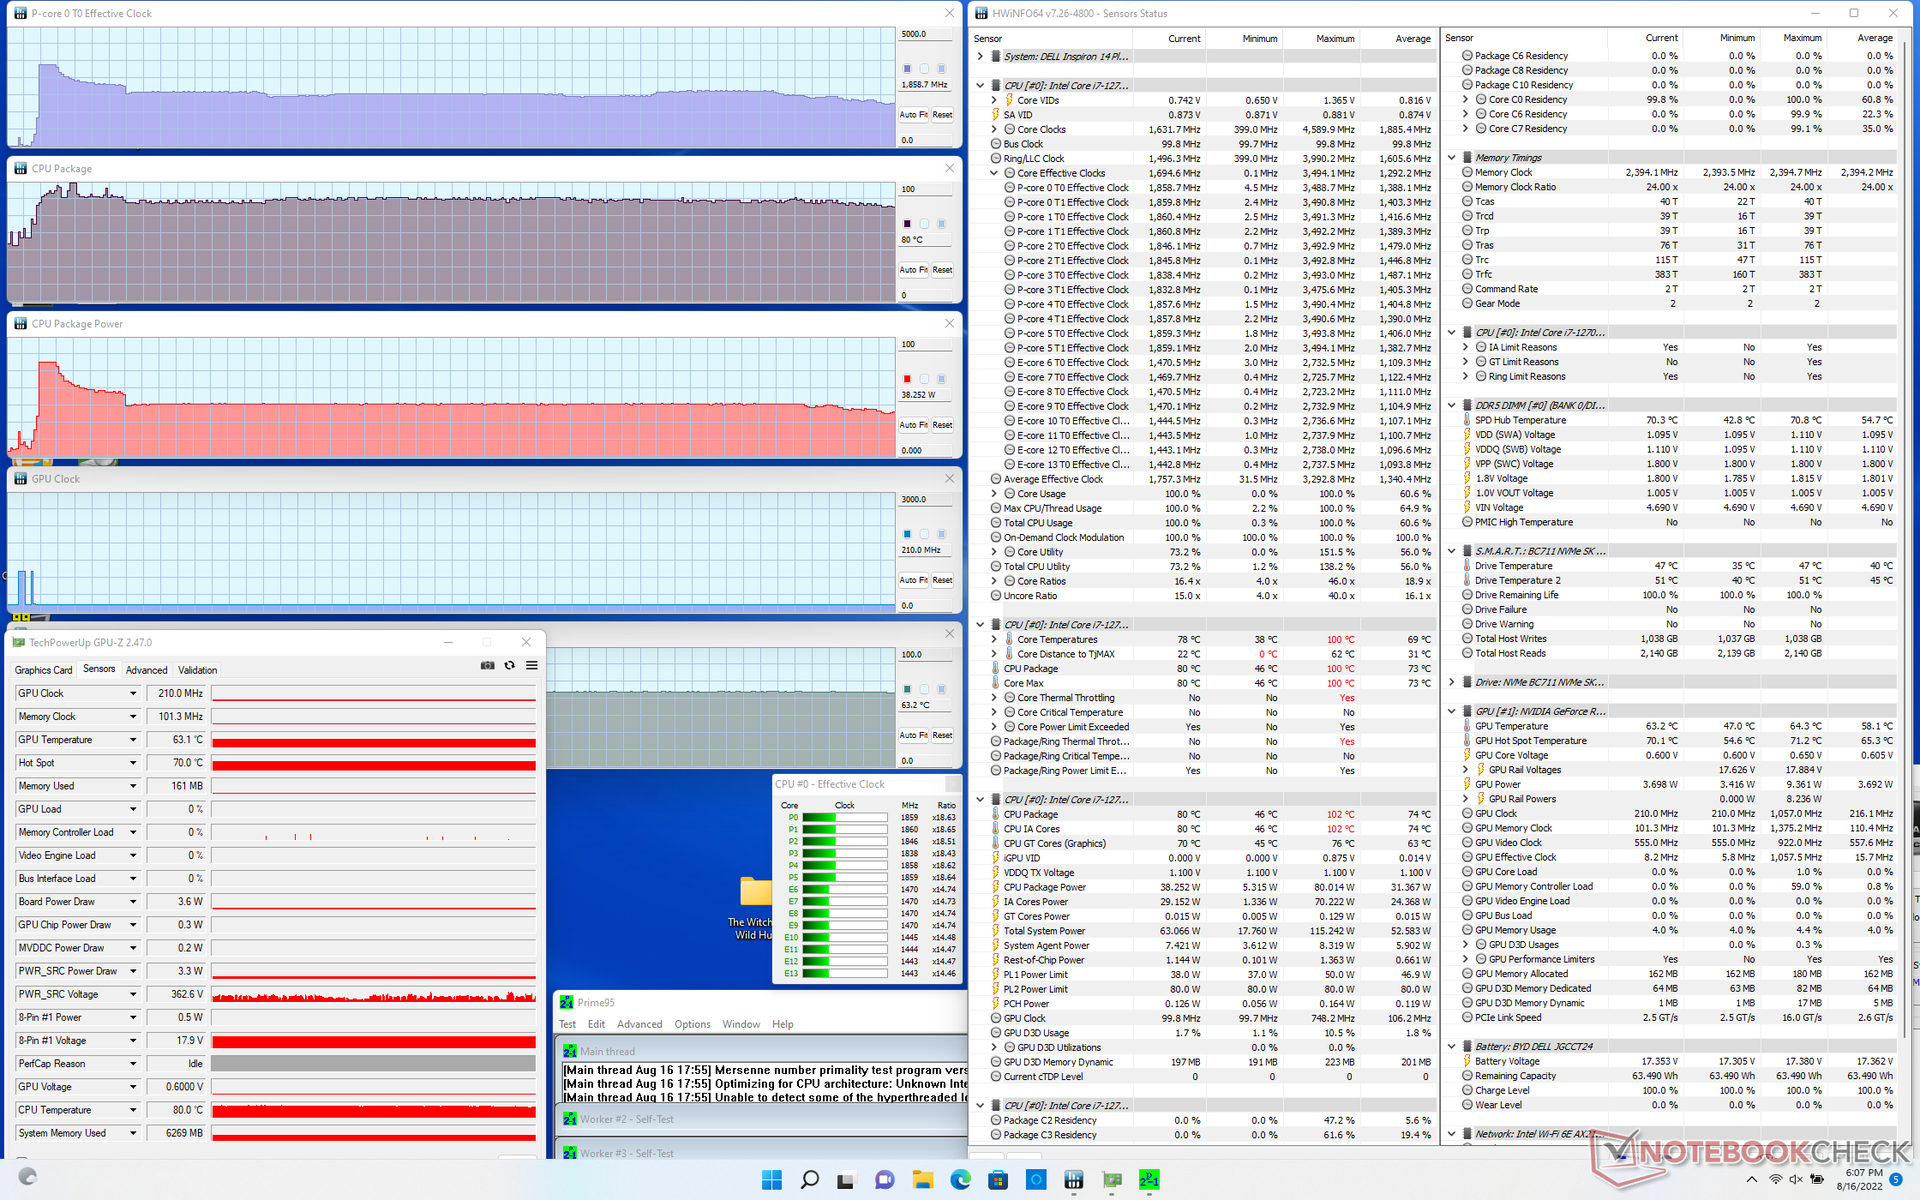
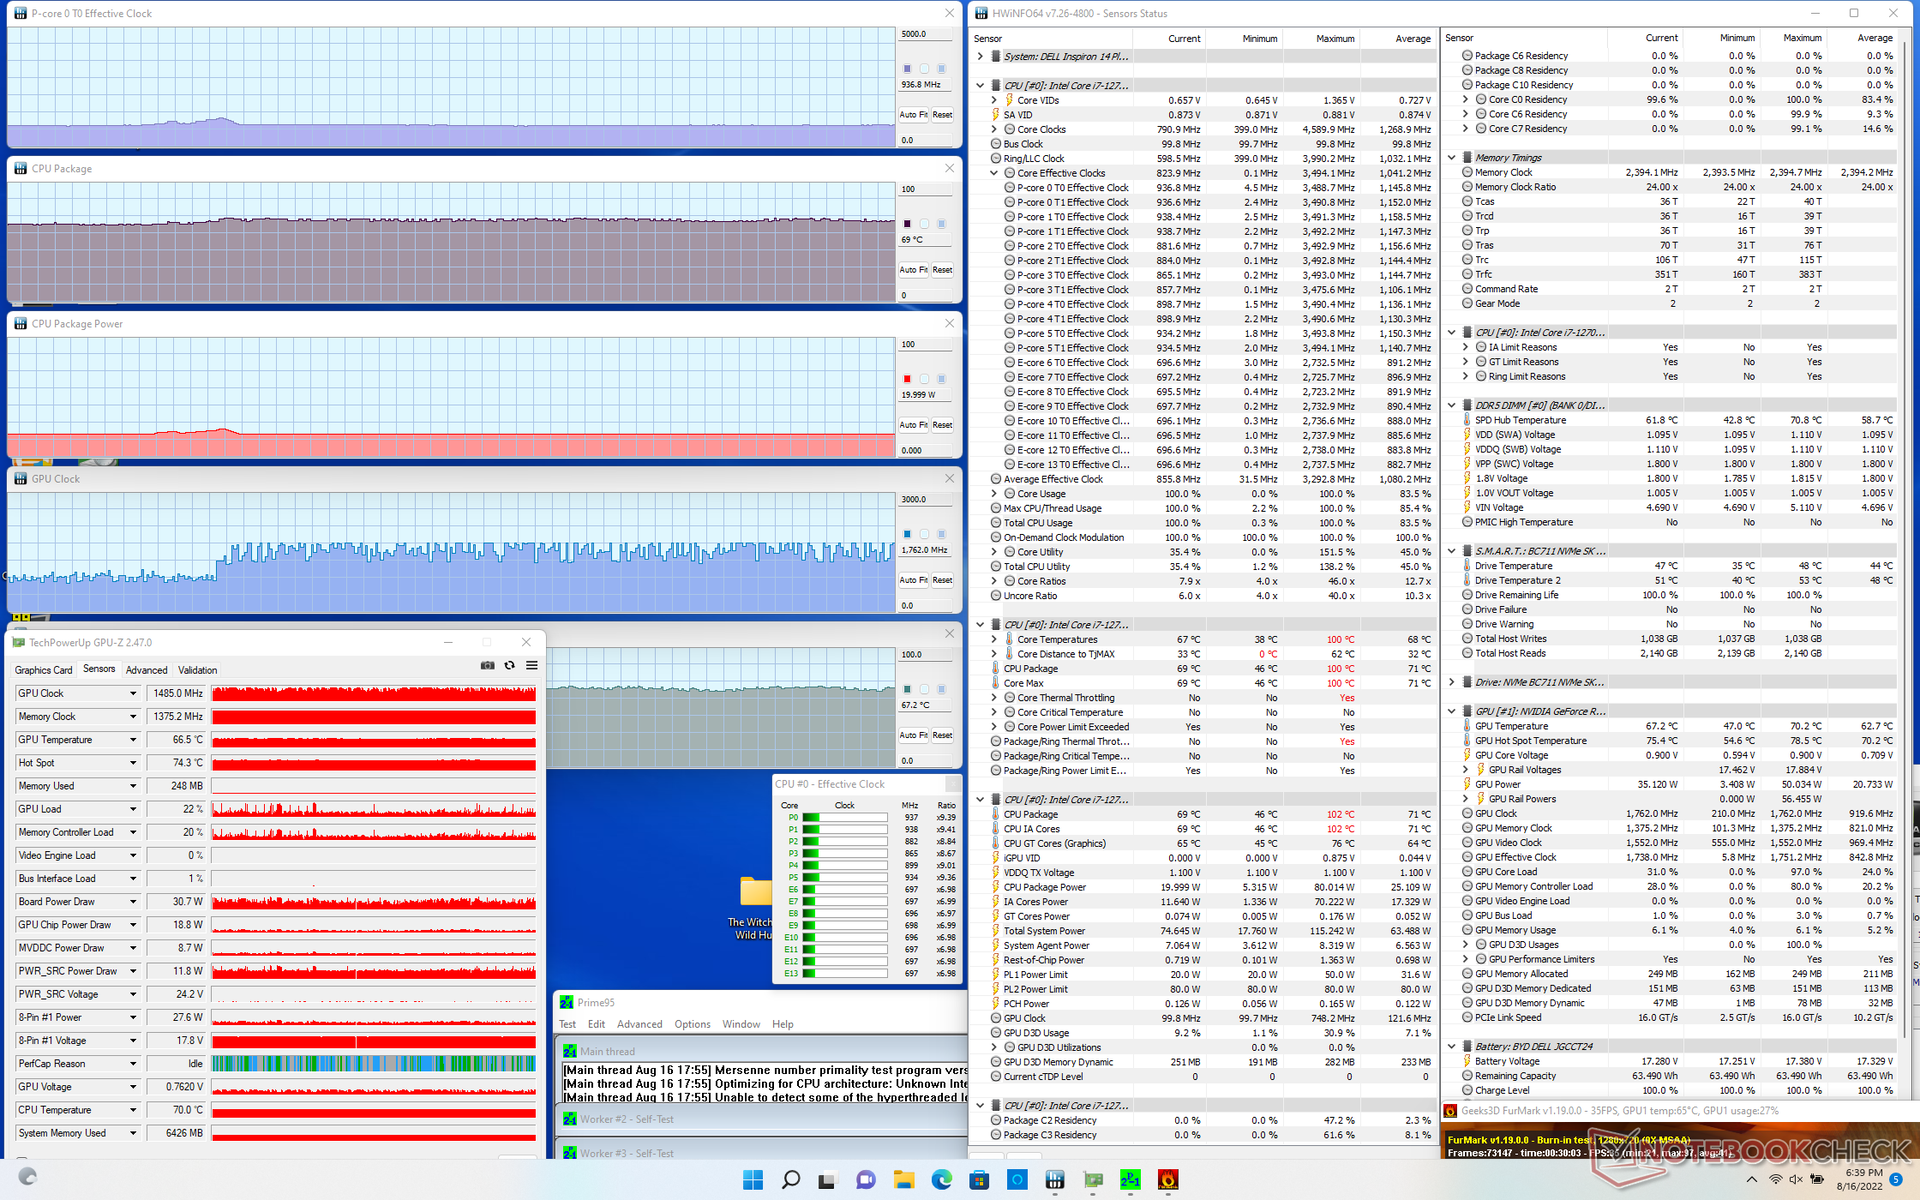
| CPU Klok (GHz) | GPU Klok (MHz) | Gemiddelde CPU Temperatuur (°C) | Gemiddelde GPU Temperatuur (°C) | |
| Systeem in rusttoestand | -- | -- | 59 | 47 |
| Prime95 Stress | 1.9 | -- | 80 | 63 |
| Prime95 + FurMark Stress | 0.9 | ~1485 | 69 | 67 |
| Witcher 3 Stress | ~1.1 | 1590 | 80 | 74 |
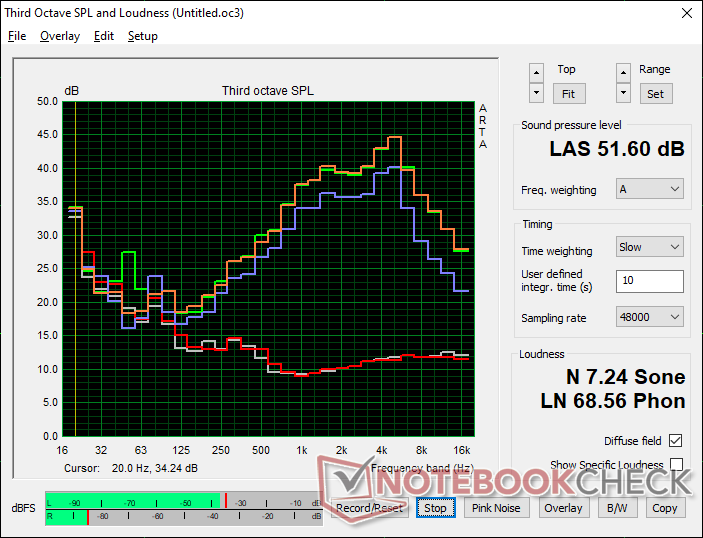
Sprekers
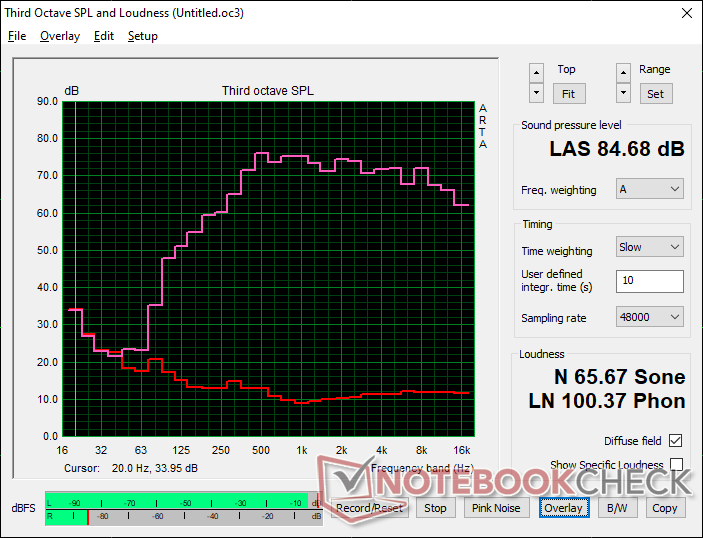
Dell Inspiron 14 Plus 7420 audioanalyse
(+) | luidsprekers kunnen relatief luid spelen (84.7 dB)
Bas 100 - 315 Hz
(±) | verminderde zeebaars - gemiddeld 14.7% lager dan de mediaan
(±) | lineariteit van de lage tonen is gemiddeld (8.3% delta ten opzichte van de vorige frequentie)
Midden 400 - 2000 Hz
(+) | evenwichtige middens - slechts 2.6% verwijderd van de mediaan
(+) | de middentonen zijn lineair (4.8% delta ten opzichte van de vorige frequentie)
Hoog 2 - 16 kHz
(+) | evenwichtige hoogtepunten - slechts 1.8% verwijderd van de mediaan
(+) | de hoge tonen zijn lineair (4.4% delta naar de vorige frequentie)
Algemeen 100 - 16.000 Hz
(+) | het totale geluid is lineair (10.4% verschil met de mediaan)
Vergeleken met dezelfde klasse
» 15% van alle geteste apparaten in deze klasse waren beter, 1% vergelijkbaar, 84% slechter
» De beste had een delta van 5%, het gemiddelde was 17%, de slechtste was 45%
Vergeleken met alle geteste toestellen
» 5% van alle geteste apparaten waren beter, 1% gelijk, 93% slechter
» De beste had een delta van 4%, het gemiddelde was 23%, de slechtste was 134%
Apple MacBook Pro 16 2021 M1 Pro audioanalyse
(+) | luidsprekers kunnen relatief luid spelen (84.7 dB)
Bas 100 - 315 Hz
(+) | goede baars - slechts 3.8% verwijderd van de mediaan
(+) | de lage tonen zijn lineair (5.2% delta naar de vorige frequentie)
Midden 400 - 2000 Hz
(+) | evenwichtige middens - slechts 1.3% verwijderd van de mediaan
(+) | de middentonen zijn lineair (2.1% delta ten opzichte van de vorige frequentie)
Hoog 2 - 16 kHz
(+) | evenwichtige hoogtepunten - slechts 1.9% verwijderd van de mediaan
(+) | de hoge tonen zijn lineair (2.7% delta naar de vorige frequentie)
Algemeen 100 - 16.000 Hz
(+) | het totale geluid is lineair (4.6% verschil met de mediaan)
Vergeleken met dezelfde klasse
» 0% van alle geteste apparaten in deze klasse waren beter, 0% vergelijkbaar, 100% slechter
» De beste had een delta van 5%, het gemiddelde was 17%, de slechtste was 45%
Vergeleken met alle geteste toestellen
» 0% van alle geteste apparaten waren beter, 0% gelijk, 100% slechter
» De beste had een delta van 4%, het gemiddelde was 23%, de slechtste was 134%
Energiebeheer - veeleisende kleine machine
Stroomverbruik
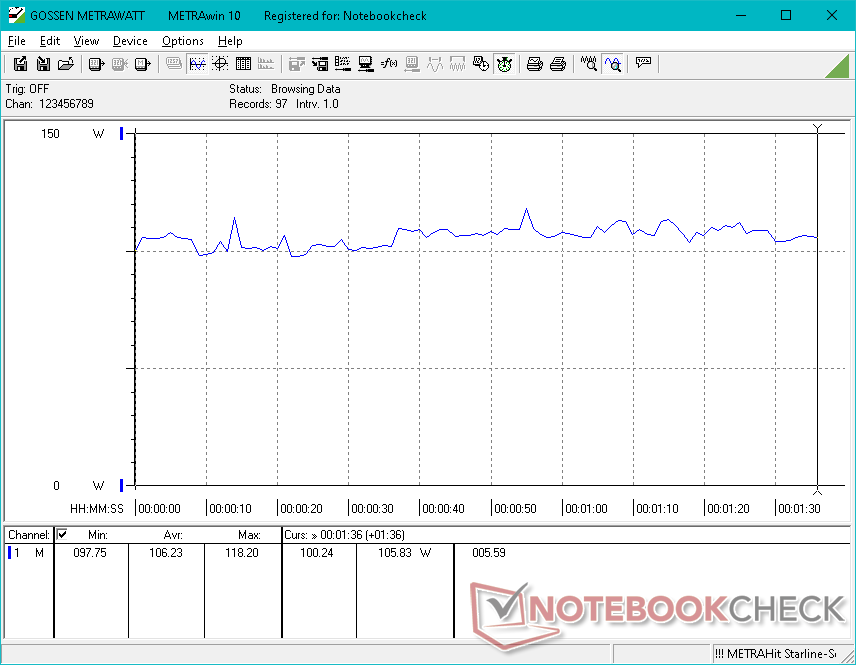
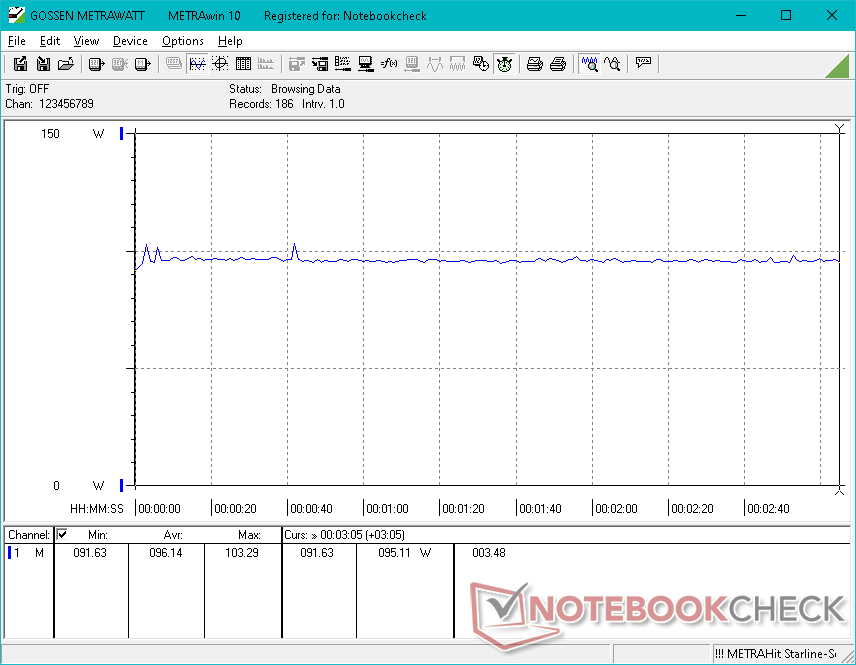
Het stroomverbruik in de spaarstand varieert van 6 W bij de minimale helderheidsinstelling tot 10 W bij de maximale instelling. Als het energieprofiel wordt gewijzigd naar de Ultra Performance-modus met de Nvidia GPU actief, stijgt het stroomverbruik bij stationair gebruik tot 20 W, ongeveer twee keer zoveel als bij de meeste tragere 14-inch laptops die worden aangedreven door CPU's uit de U-serie
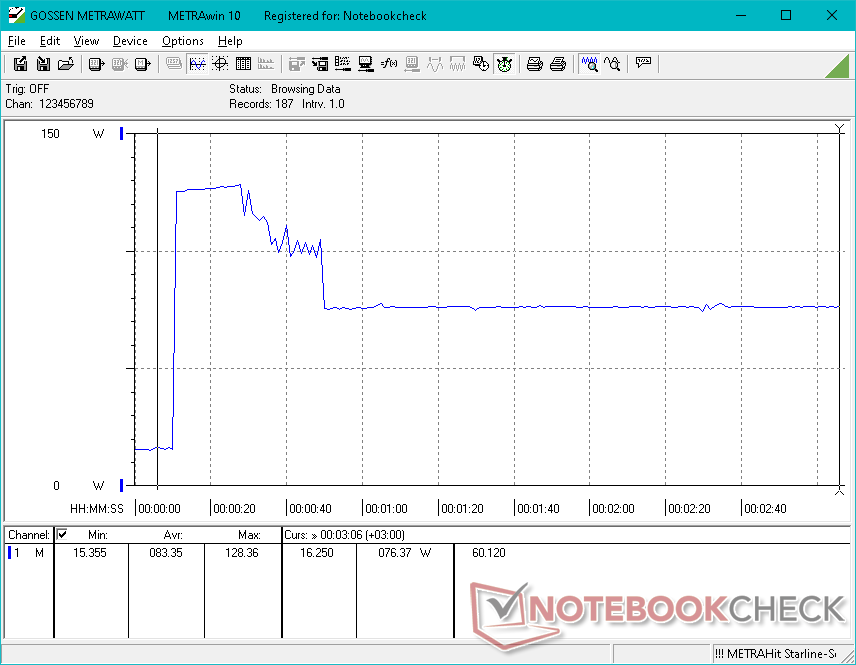
Gaming vereist tussen 96 W en 106 W, vergeleken met slechts 40 W of 50 W op traditionele U-serie-aangedreven alternatieven. De Intel 12e generatie H-serie staat erom bekend zeer veeleisend te zijn, bovenop een toch al veeleisende discrete GPU. Het is dan ook geen wonder dat de Inspiron 14 Plus zowel luider als warmer draait dan de gemiddelde 14-inch laptop
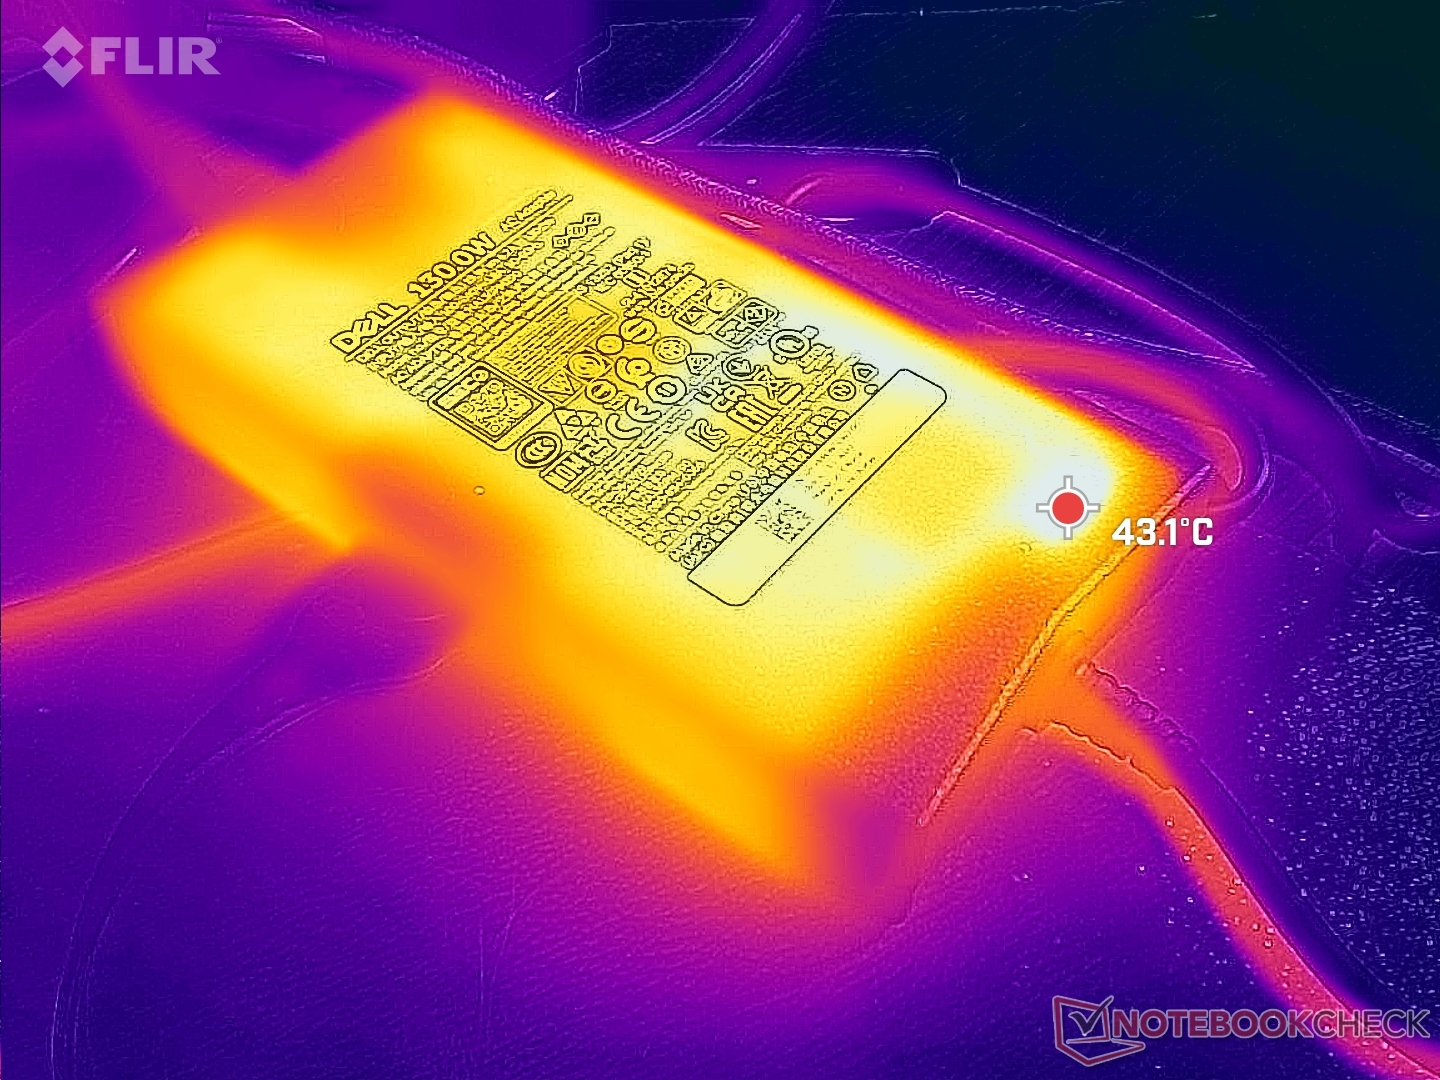
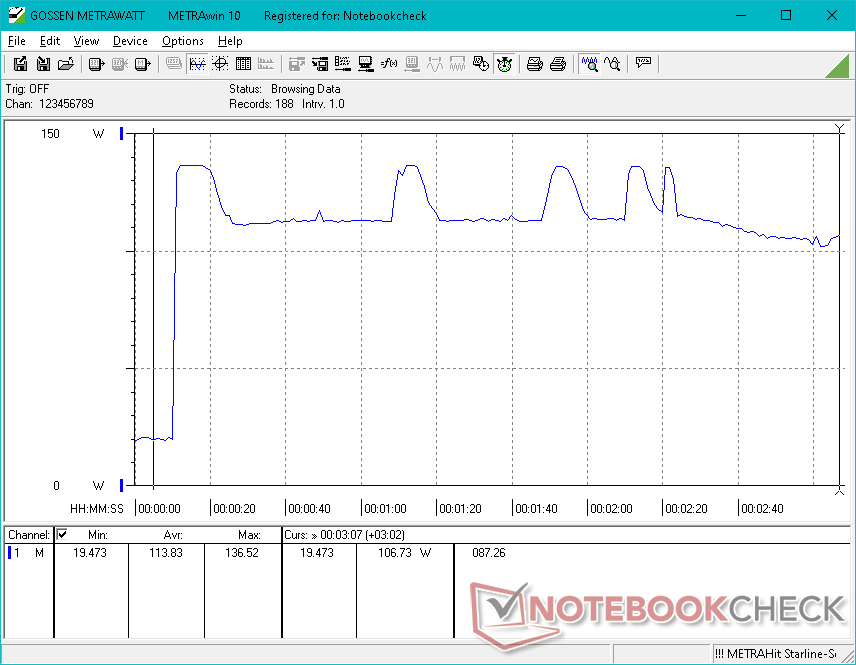
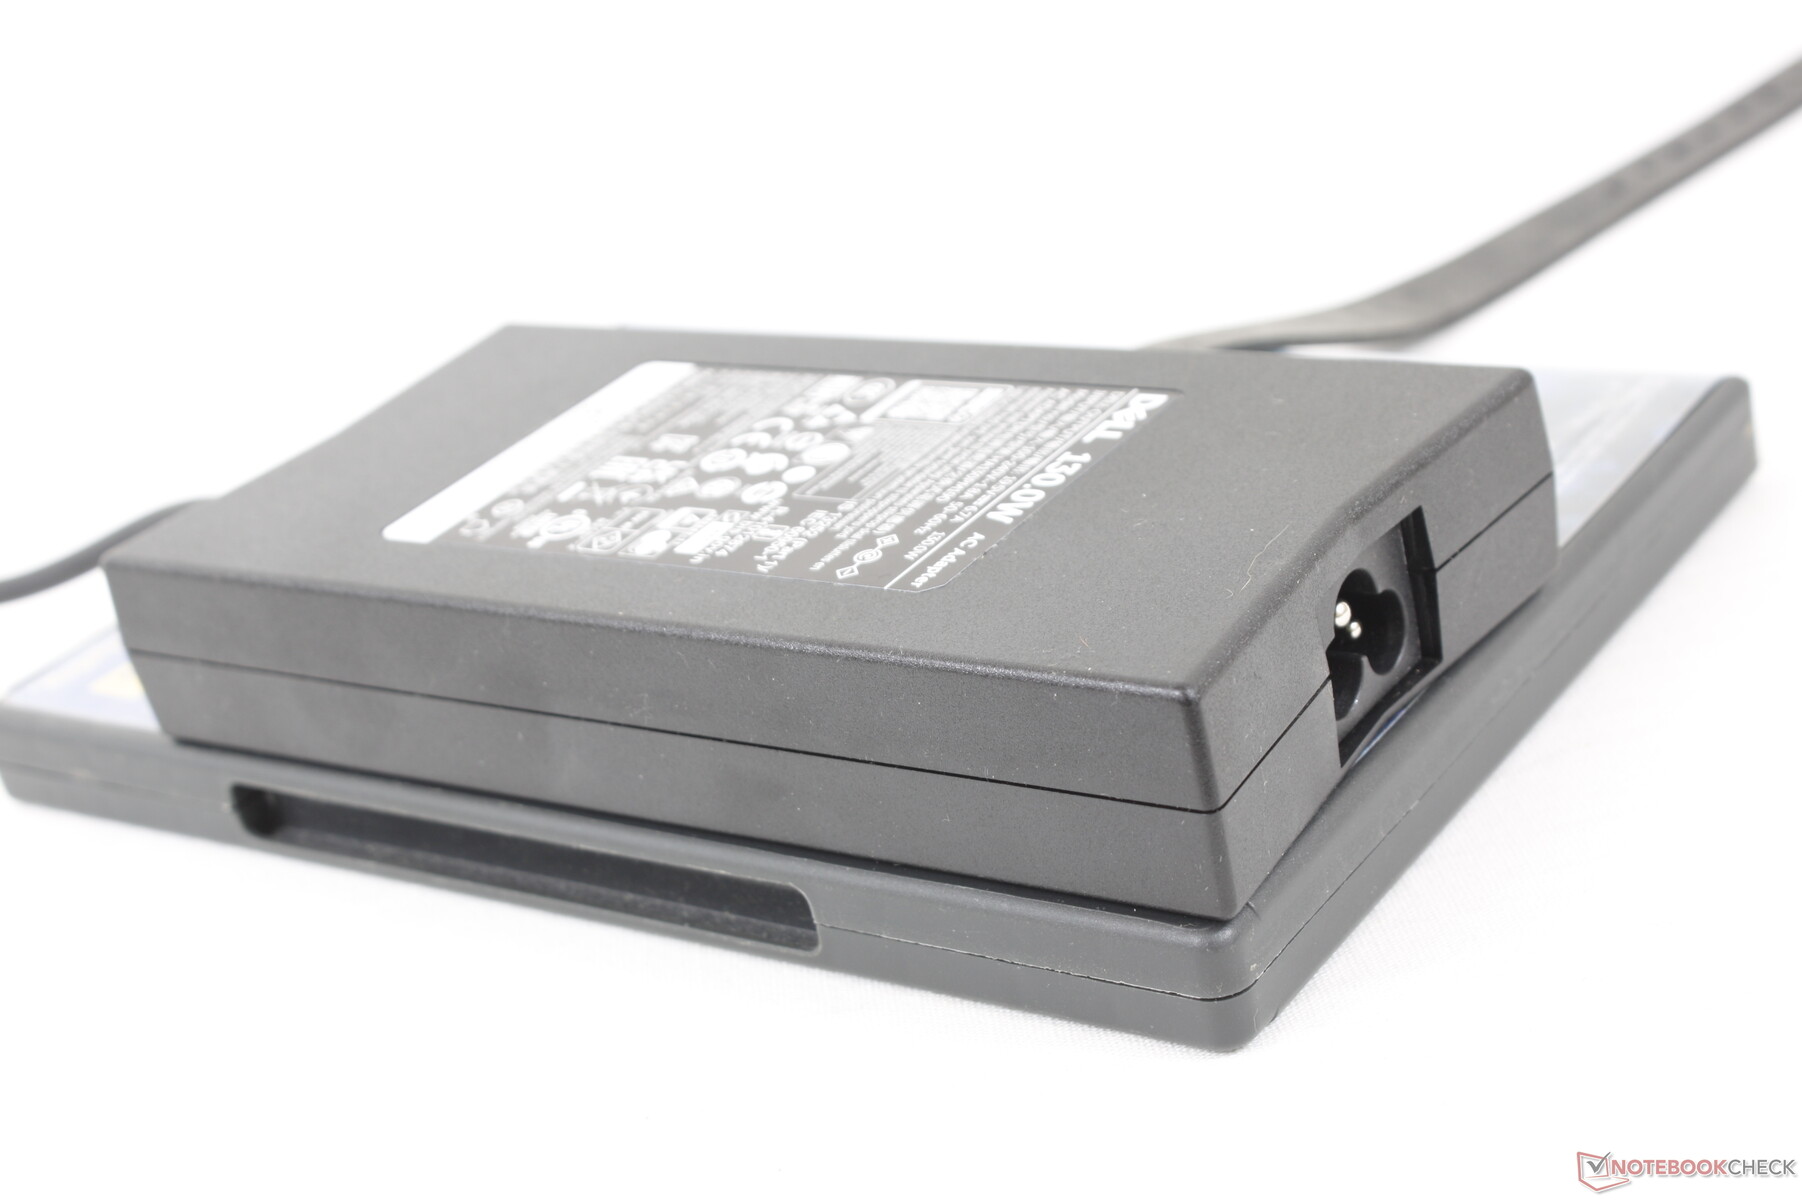
We zijn in staat om een maximale trek van 137 W te registreren van de middelgrote (~15,3 x 7,5 x 2,6 cm) 130 W AC adapter bij het gelijktijdig draaien van zowel Prime95 als FurMark. Het verbruik heeft de neiging om te wisselen tussen 110 W en 137 W, zoals blijkt uit onze schermafdruk hieronder. Reken op een tragere oplaadsnelheid als u dergelijke zware belastingen gebruikt.
| Uit / Standby | |
| Inactief | |
| Belasting |
|
Key:
min: | |
| Dell Inspiron 14 Plus 7420 i7-12700H, GeForce RTX 3050 4GB Laptop GPU, SK Hynix BC711 512GB HFM512GD3GX013N, IPS, 2240x1400, 14" | Asus Vivobook Pro 14 M3401QC-KM007T R5 5600H, GeForce RTX 3050 4GB Laptop GPU, Intel SSD 670p SSDPEKNU512GZ, OLED, 2880x1800, 14" | Dell Inspiron 14 7420 2-in-1 i7-1255U, Iris Xe G7 96EUs, WDC PC SN530 SDBPMPZ-512G, IPS, 1920x1200, 14" | Schenker Vision 14 i7-11370H, GeForce RTX 3050 Ti Laptop GPU, Samsung SSD 980 Pro 1TB MZ-V8P1T0BW, IPS, 2880x1800, 14" | Asus Zenbook 14X UX5400E i7-1165G7, GeForce MX450, SK Hynix HFM001TD3JX013N, OLED, 2880x1800, 14" | MSI Summit E14 A11SCS i7-1185G7, GeForce GTX 1650 Ti Max-Q, Phison 1TB SM2801T24GKBB4S-E162, IPS, 3840x2160, 14" | HP Envy 14-eb0010nr i5-1135G7, GeForce GTX 1650 Ti Max-Q, Samsung SSD PM981a MZVLB256HBHQ, IPS, 1920x1200, 14" | |
|---|---|---|---|---|---|---|---|
| Power Consumption | 22% | 44% | 8% | 24% | -10% | 5% | |
| Idle Minimum * (Watt) | 6.3 | 6.6 -5% | 5.2 17% | 6.7 -6% | 7.2 -14% | 9.9 -57% | 4.2 33% |
| Idle Average * (Watt) | 10.3 | 9.6 7% | 8.2 20% | 12.6 -22% | 10.4 -1% | 17.4 -69% | 18.3 -78% |
| Idle Maximum * (Watt) | 20 | 7.3 63% | 9.9 50% | 15.4 23% | 11 45% | 22.5 -13% | 19.2 4% |
| Load Average * (Watt) | 106.2 | 73 31% | 44.4 58% | 85.7 19% | 61.7 42% | 85.6 19% | 72.9 31% |
| Witcher 3 ultra * (Watt) | 96.1 | 74.4 23% | 35 64% | 83 14% | 53.6 44% | 70.9 26% | 61.5 36% |
| Load Maximum * (Watt) | 136.5 | 119 13% | 62.5 54% | 110.9 19% | 96 30% | 91.1 33% | 127.8 6% |
* ... kleiner is beter
Power Consumption Witcher 3 / Stresstest
Power Consumption external Monitor
Levensduur batterij
De runtimes zijn beter dan verwacht met meer dan 7 uur real-world WLAN gebruik, wat erg dicht in de buurt komt van wat we hebben geregistreerd op de langzamere Inspiron 14 7420 2-in-1 zonder speciale grafische voorzieningen. Merk echter op dat onze resultaten alleen de 64 Wh configuratie weergeven en niet de mindere 54 Wh configuratie die een iets kortere batterijduur zou moeten hebben.
Opladen van leeg naar volledig met de meegeleverde vat AC-adapter duurt ongeveer 2 uur. Opladen via USB-C AC-adapters van derden wordt ondersteund.
| Dell Inspiron 14 Plus 7420 i7-12700H, GeForce RTX 3050 4GB Laptop GPU, 64 Wh | Asus Vivobook Pro 14 M3401QC-KM007T R5 5600H, GeForce RTX 3050 4GB Laptop GPU, 63 Wh | Dell Inspiron 14 7420 2-in-1 i7-1255U, Iris Xe G7 96EUs, 54 Wh | Schenker Vision 14 i7-11370H, GeForce RTX 3050 Ti Laptop GPU, 53 Wh | Asus Zenbook 14X UX5400E i7-1165G7, GeForce MX450, 63 Wh | MSI Summit E14 A11SCS i7-1185G7, GeForce GTX 1650 Ti Max-Q, 52 Wh | HP Envy 14-eb0010nr i5-1135G7, GeForce GTX 1650 Ti Max-Q, 63.3 Wh | |
|---|---|---|---|---|---|---|---|
| Batterijduur | 47% | 58% | 16% | 65% | -24% | 83% | |
| Reader / Idle (h) | 11.9 | 11.5 -3% | 15.9 34% | 34 186% | 6.6 -45% | 27.7 133% | |
| WiFi v1.3 (h) | 7.2 | 9.5 32% | 7.6 6% | 5.5 -24% | 5.4 -25% | 4.5 -37% | 10.8 50% |
| Load (h) | 0.9 | 1.9 111% | 2.1 133% | 1.4 56% | 1.2 33% | 1 11% | 1.5 67% |
| H.264 (h) | 6.8 |
Pro
Contra
Verdict - Plus-size Prestaties, Plus-size Gewicht
Als je op zoek bent naar maximale CPU en GPU prestaties op je volgende 14-inch laptop, overweeg dan de duurdere Razer Blade 14 of Asus Zephyrus G14. Als je op zoek bent naar een dunne en lichte 14-inch Ultrabook, dan is de Asus Zenbook 14 of LG Gram 14 betere opties zijn. Voor het beste van twee werelden zit je met de Dell Inspiron 14 Plus 7420 echter op een fijne lijn tussen extreme prestaties en draagbaarheid, terwijl de prijs toch redelijk blijft. Frequente reizigers die vertrouwen op prestaties die verder gaan dan wat de Core U-serie en geïntegreerde grafische series kunnen bieden, zullen de Dell een solide oplossing vinden.
Zoveel kracht verpakken in een 14-inch chassis brengt de gebruikelijke nadelen met zich mee: warmere temperaturen, luider ventilatorgeluid, zwaarder gewicht en een hoger stroomverbruik dan de meeste andere laptops in de 14-inch categorie. Van deze vier nadelen denken wij dat het gewicht het meest voor verbetering vatbaar is, omdat de concurrerendeAsus Vivobook Pro 14 wordt geleverd met AMD H-serie CPU's en dezelfde GeForce RTX 3050 GPU terwijl hij een paar honderd gram lichter is. De ventilatoren zijn in ieder geval uitstekend in staat om stil te blijven tijdens lagere verwerkingsbelastingen, zodat ze alleen luidruchtig zijn bij het draaien van veeleisende applicaties.
De Inspiron 14 Plus 7420 mag dan zwaar zijn, maar hij klaart de klus met hogere snelheden dan uw typische Ultrabook.
Andere minpunten zijn het sponsachtige clickpad en het flexibele deksel. Voor zo'n zware 14-inch laptop zou een steviger deksel op prijs zijn gesteld. Het prestatievoordeel ten opzichte van de meeste 14-inch laptops in deze prijsklasse is anders het belangrijkste hoogtepunt van het systeem.
Prijs en beschikbaarheid
De Inspiron 14 Plus 7420 clamshell wordt nu verzonden op Amazon en Newegg Voor respectievelijk $1300 en $1400 USD. De configuraties zijn momenteel echter beperkt tot alleen geïntegreerde graphics. Wij raden aan om rechtstreeks bij Dell te kopen als u de GeForce RTX 3050 SKU wilt.
Dell Inspiron 14 Plus 7420
- 30-08-2022 v7 (old)
Allen Ngo
Price comparison

