Dell Inspiron 16 Plus 7620 review: De doe-het-alles multimedia laptop
De 2022 Dell Inspiron 16 Plus 7620 volgt direct de 2021 Inspiron 16 Plus 7610 op door de introductie van 12e gen CPU's en snellere GeForce RTX GPU's ter vervanging van de 11e gen CPU's op het model van vorig jaar. De fabrikant heeft zelfs het chassis herzien voor een ander uiterlijk na slechts een jaar op de markt voor de serie.
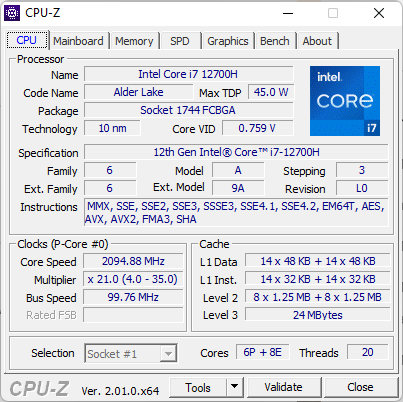
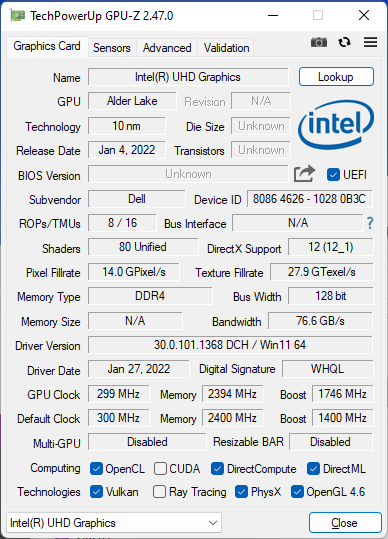
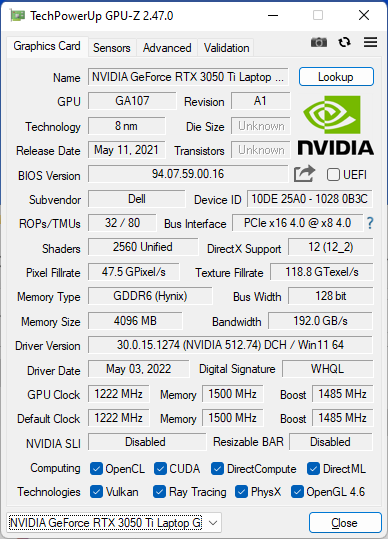
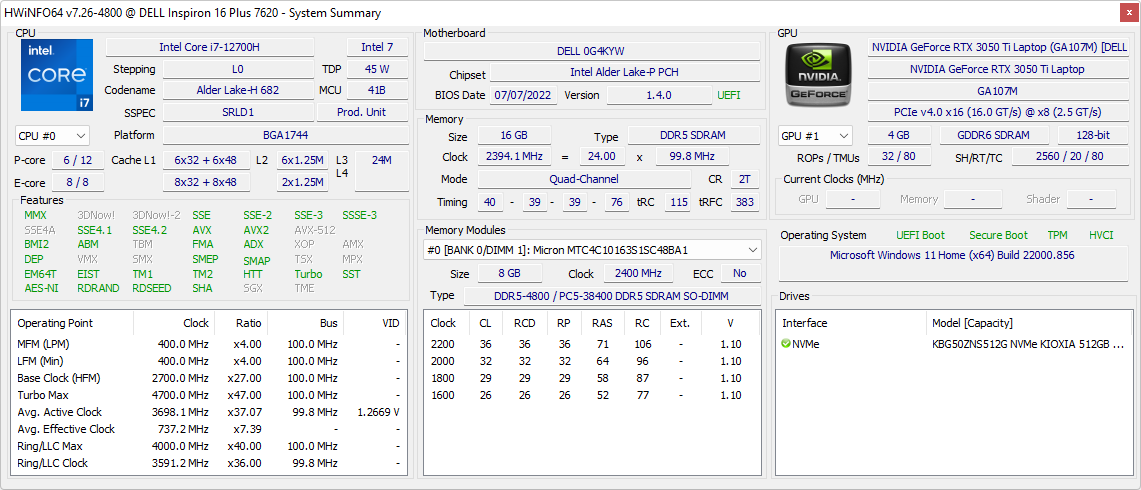
Onze testeenheid wordt geleverd geconfigureerd met de Alder Lake-H Core i7-12700H CPU, 65 W GeForce RTX 3050 Ti, en 16:10 3072 x 1280 IPS beeldscherm voor ongeveer $1400 USD. Andere SKU's met de Core i5-12500H, 60 W RTX 3060, en 1920 x 1200 touchscreen zijn ook beschikbaar. Er bestaat een 2-in-1 versie van het model genaamd de Inspiron 16 Plus 7620 2-in-1.
Concurrenten in deze ruimte zijn onder andere midrange tot high-end 16-inch multimedia of maker laptops zoals de Lenovo Yoga 7 16IAP7, Huawei MateBook D 16, Acer Swift X, Asus Vivobook Pro 16X, of zelfs de MSI Creator Z16.
Meer Dell reviews:
Potentiële concurrenten in vergelijking
Evaluatie | Datum | Model | Gewicht | Hoogte | Formaat | Resolutie | Beste prijs |
|---|---|---|---|---|---|---|---|
| 87.4 % v7 (old) | 08-2022 | Dell Inspiron 16 Plus 7620 i7-12700H, GeForce RTX 3050 Ti Laptop GPU | 2.1 kg | 18.99 mm | 16.00" | 3072x1920 | |
| 86.7 % v7 (old) | 08-2021 | Dell Inspiron 16 Plus 7610 i7-11800H, GeForce RTX 3050 4GB Laptop GPU | 2 kg | 18.99 mm | 16.00" | 3072x1920 | |
| 88.7 % v7 (old) | 08-2022 | Lenovo Yoga 7 16IAP7 i7-1260P, Iris Xe G7 96EUs | 2 kg | 19.2 mm | 16.00" | 2560x1600 | |
| 83.6 % v7 (old) | 07-2022 | Huawei MateBook D 16 2022 i7-12700H, Iris Xe G7 96EUs | 1.7 kg | 18.4 mm | 16.00" | 1920x1200 | |
| 86.2 % v7 (old) | 07-2022 | Acer Swift X SFX16-51G-5388 i5-11320H, GeForce RTX 3050 4GB Laptop GPU | 1.8 kg | 18.9 mm | 16.10" | 1920x1080 | |
v (old) | 12-2021 | Asus Vivobook Pro 16X-M7600QE R9 5900HX, GeForce RTX 3050 Ti Laptop GPU | 1.9 kg | 19 mm | 16.10" | 3840x2400 |
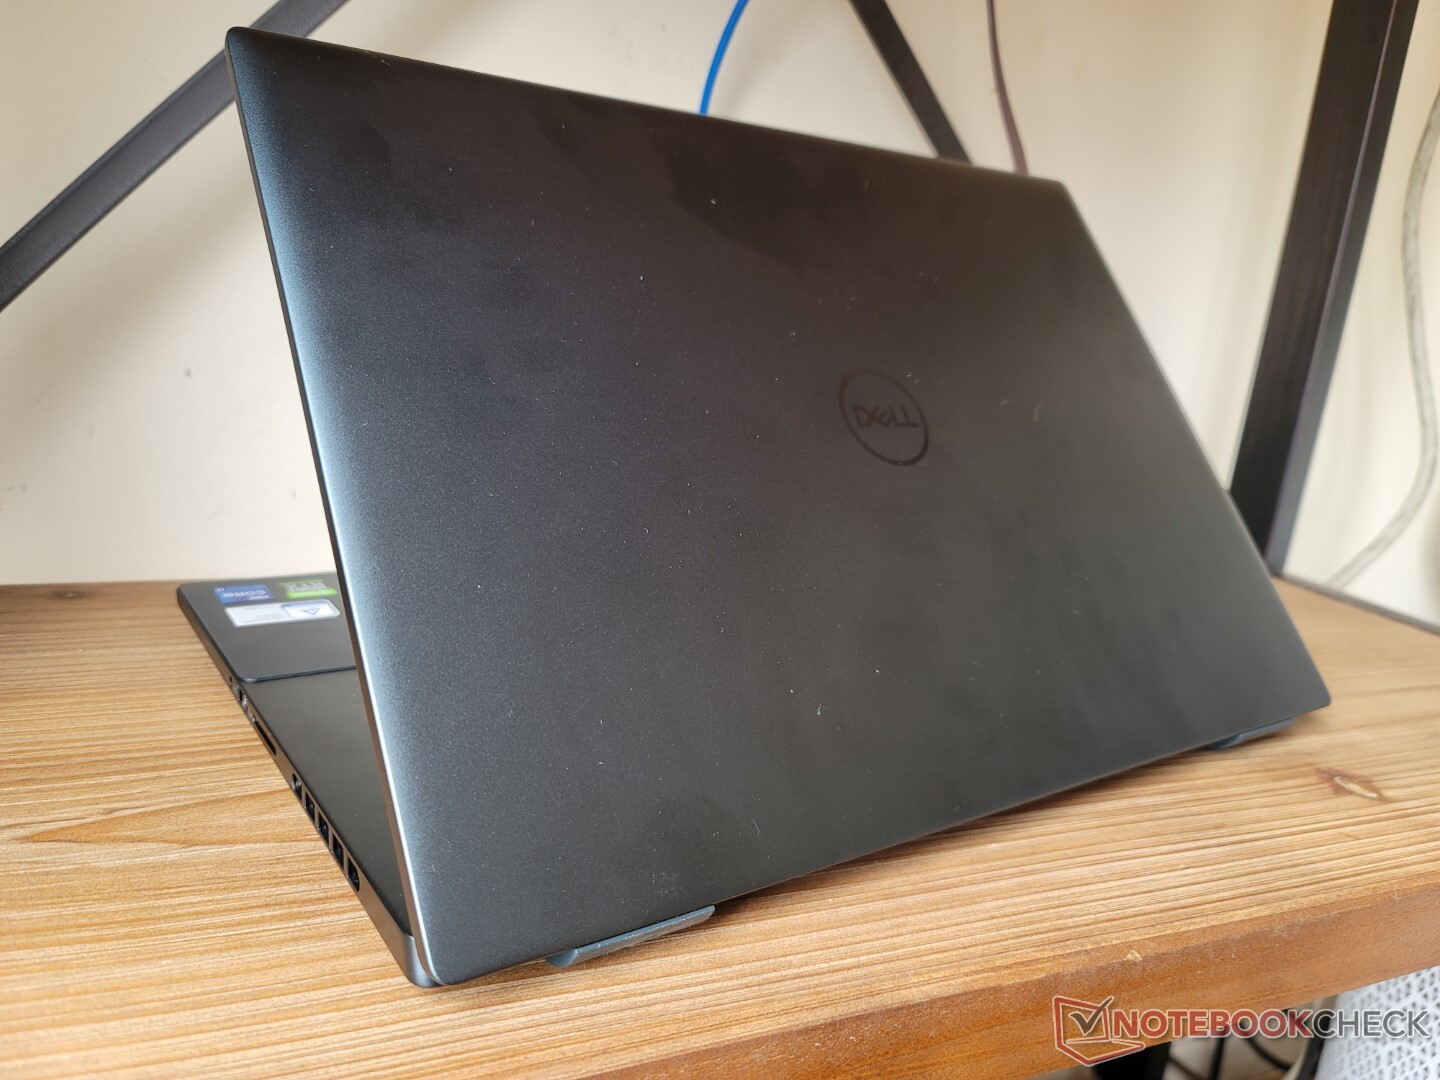
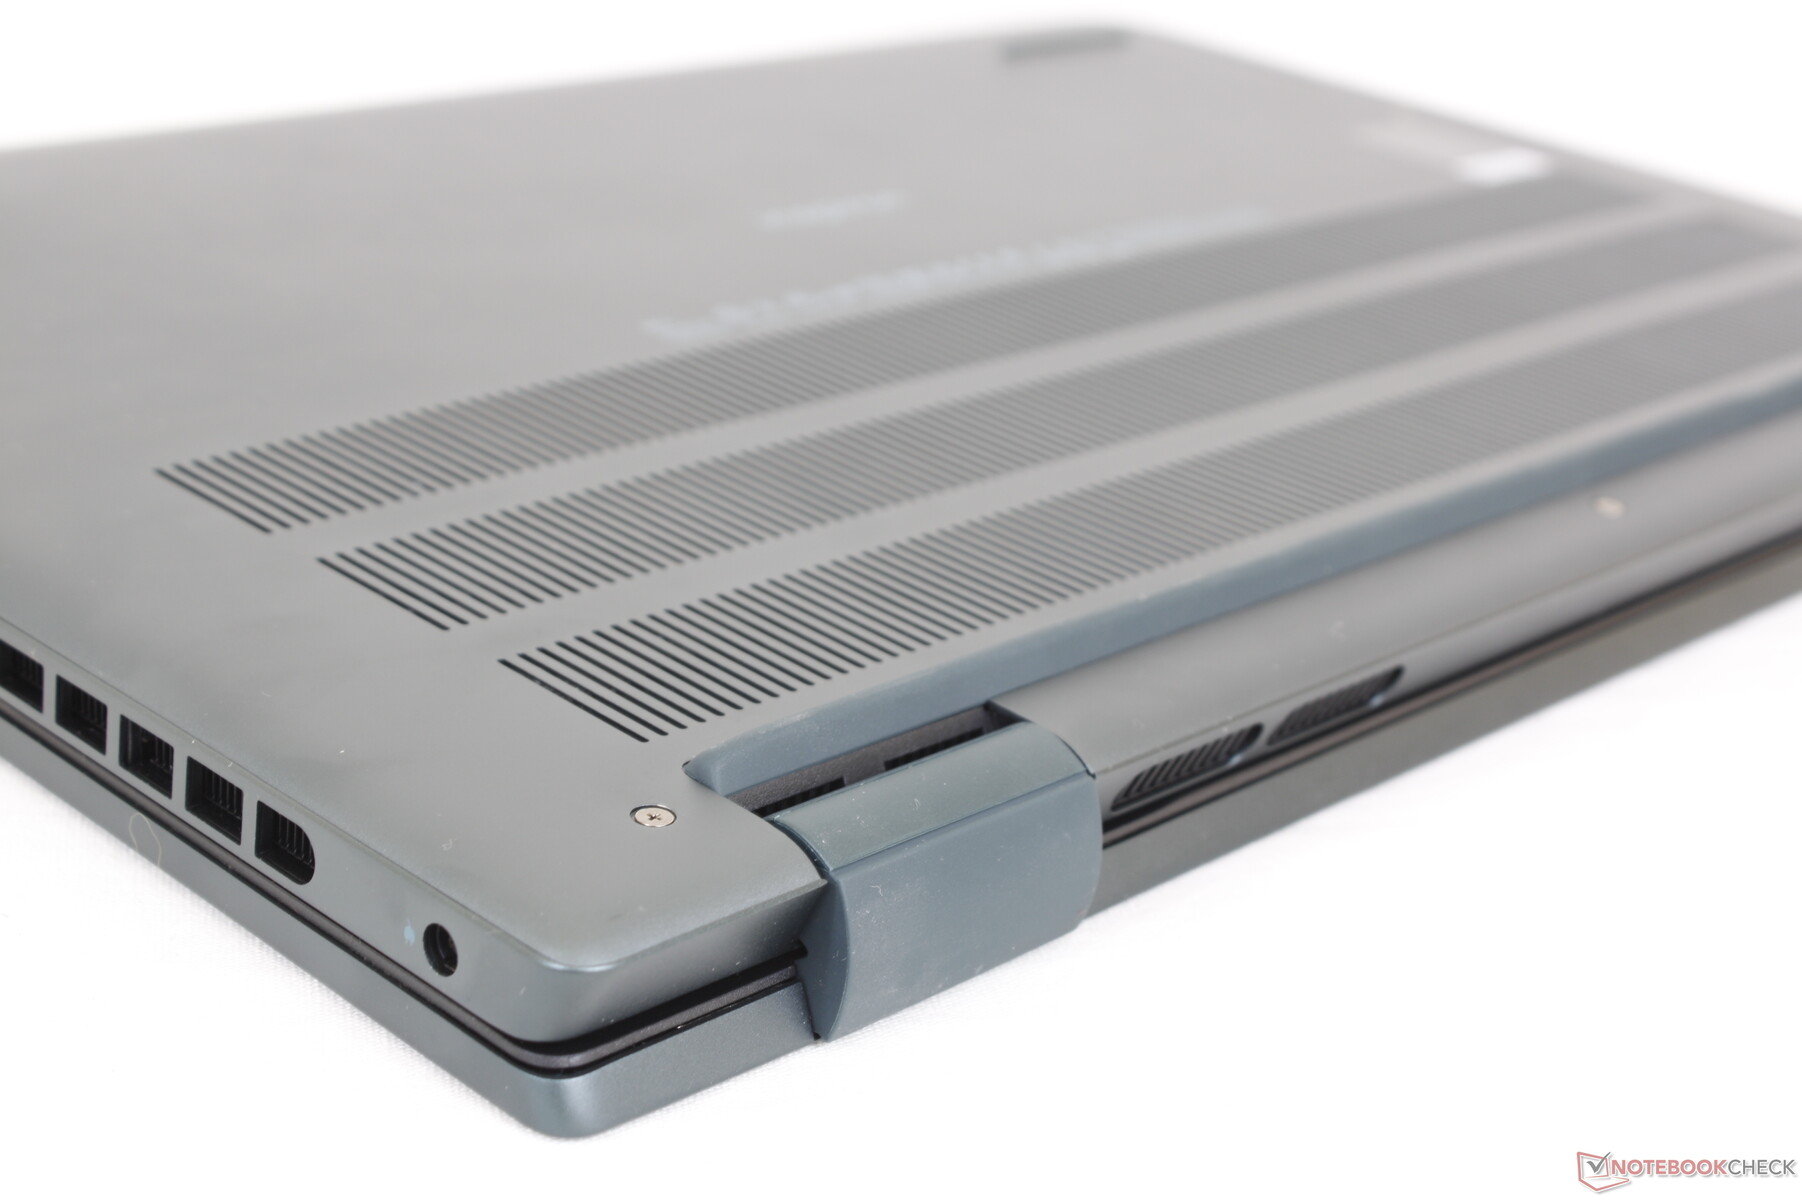
Geval - Donkere Tinten
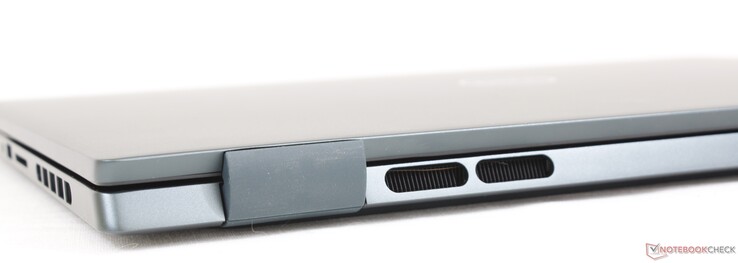
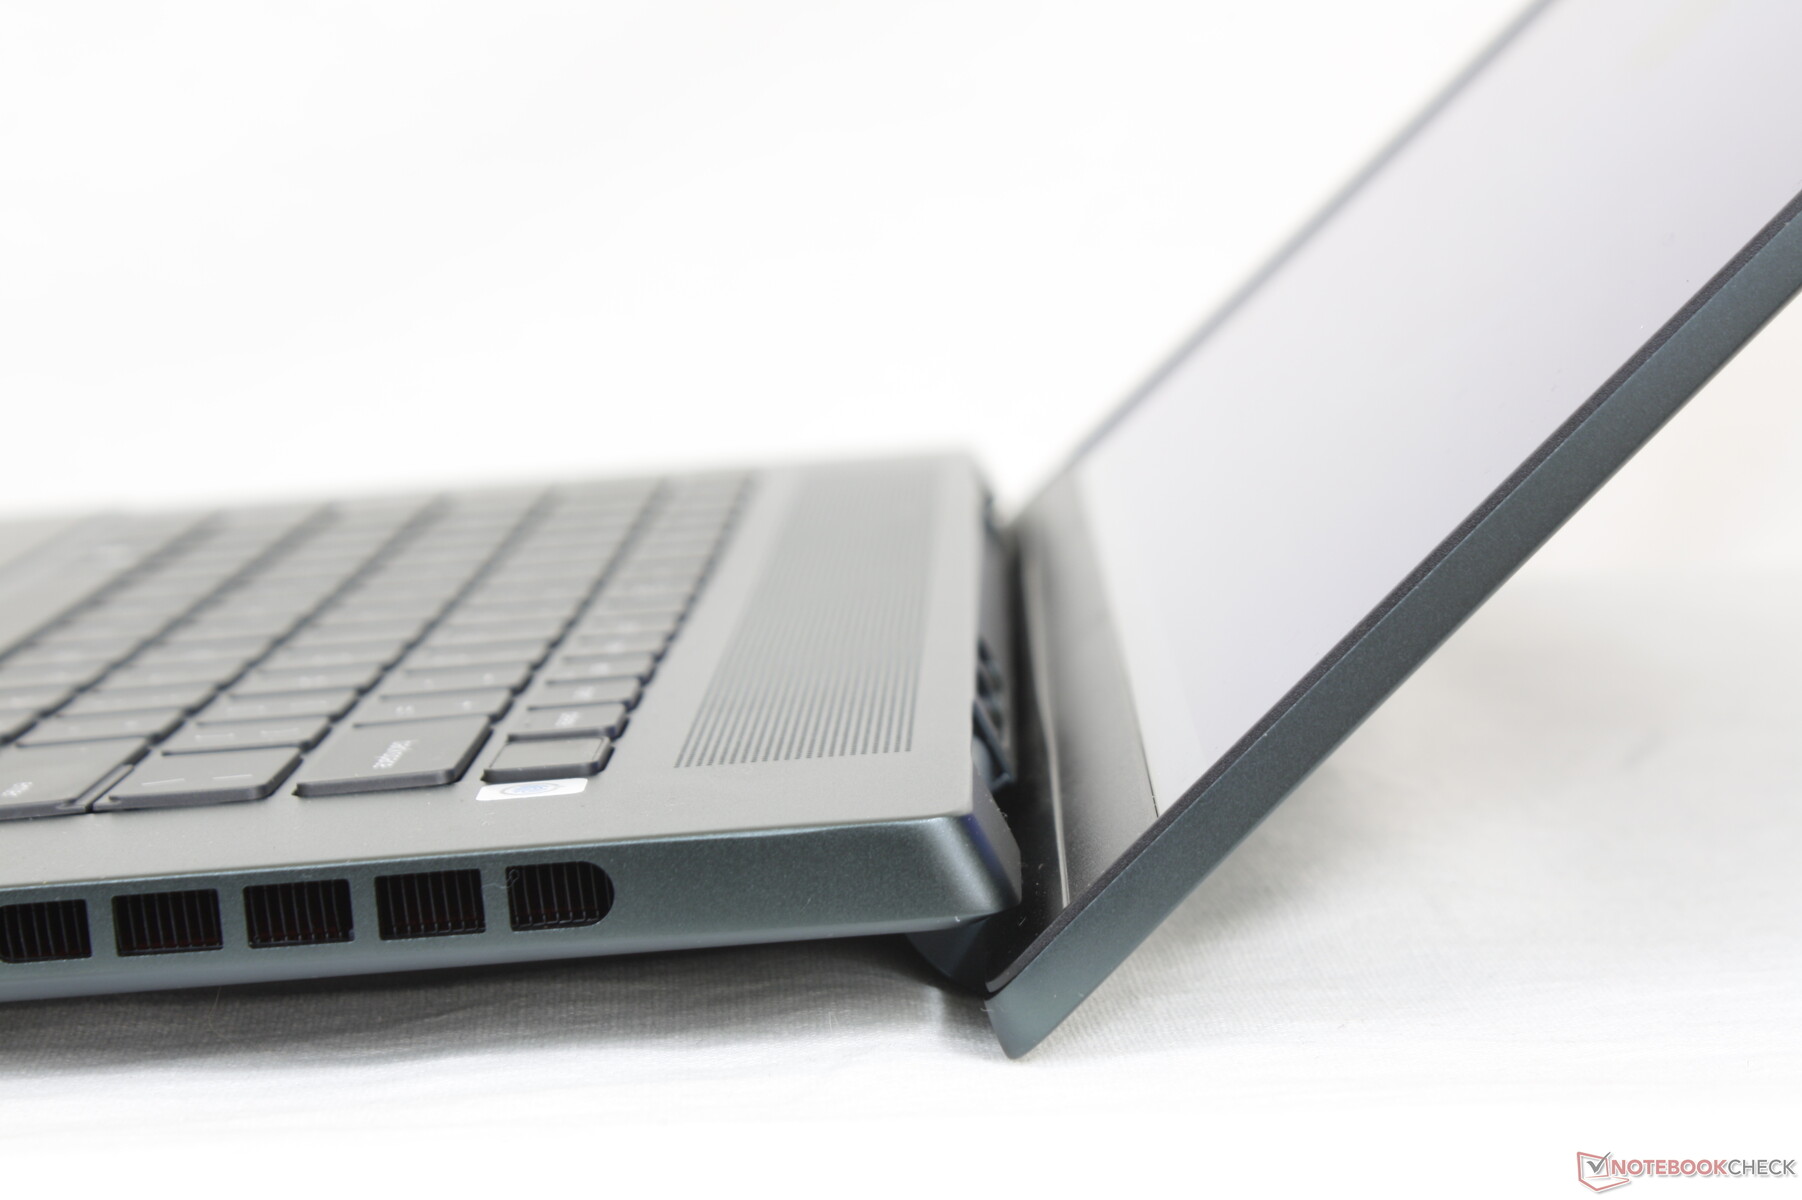
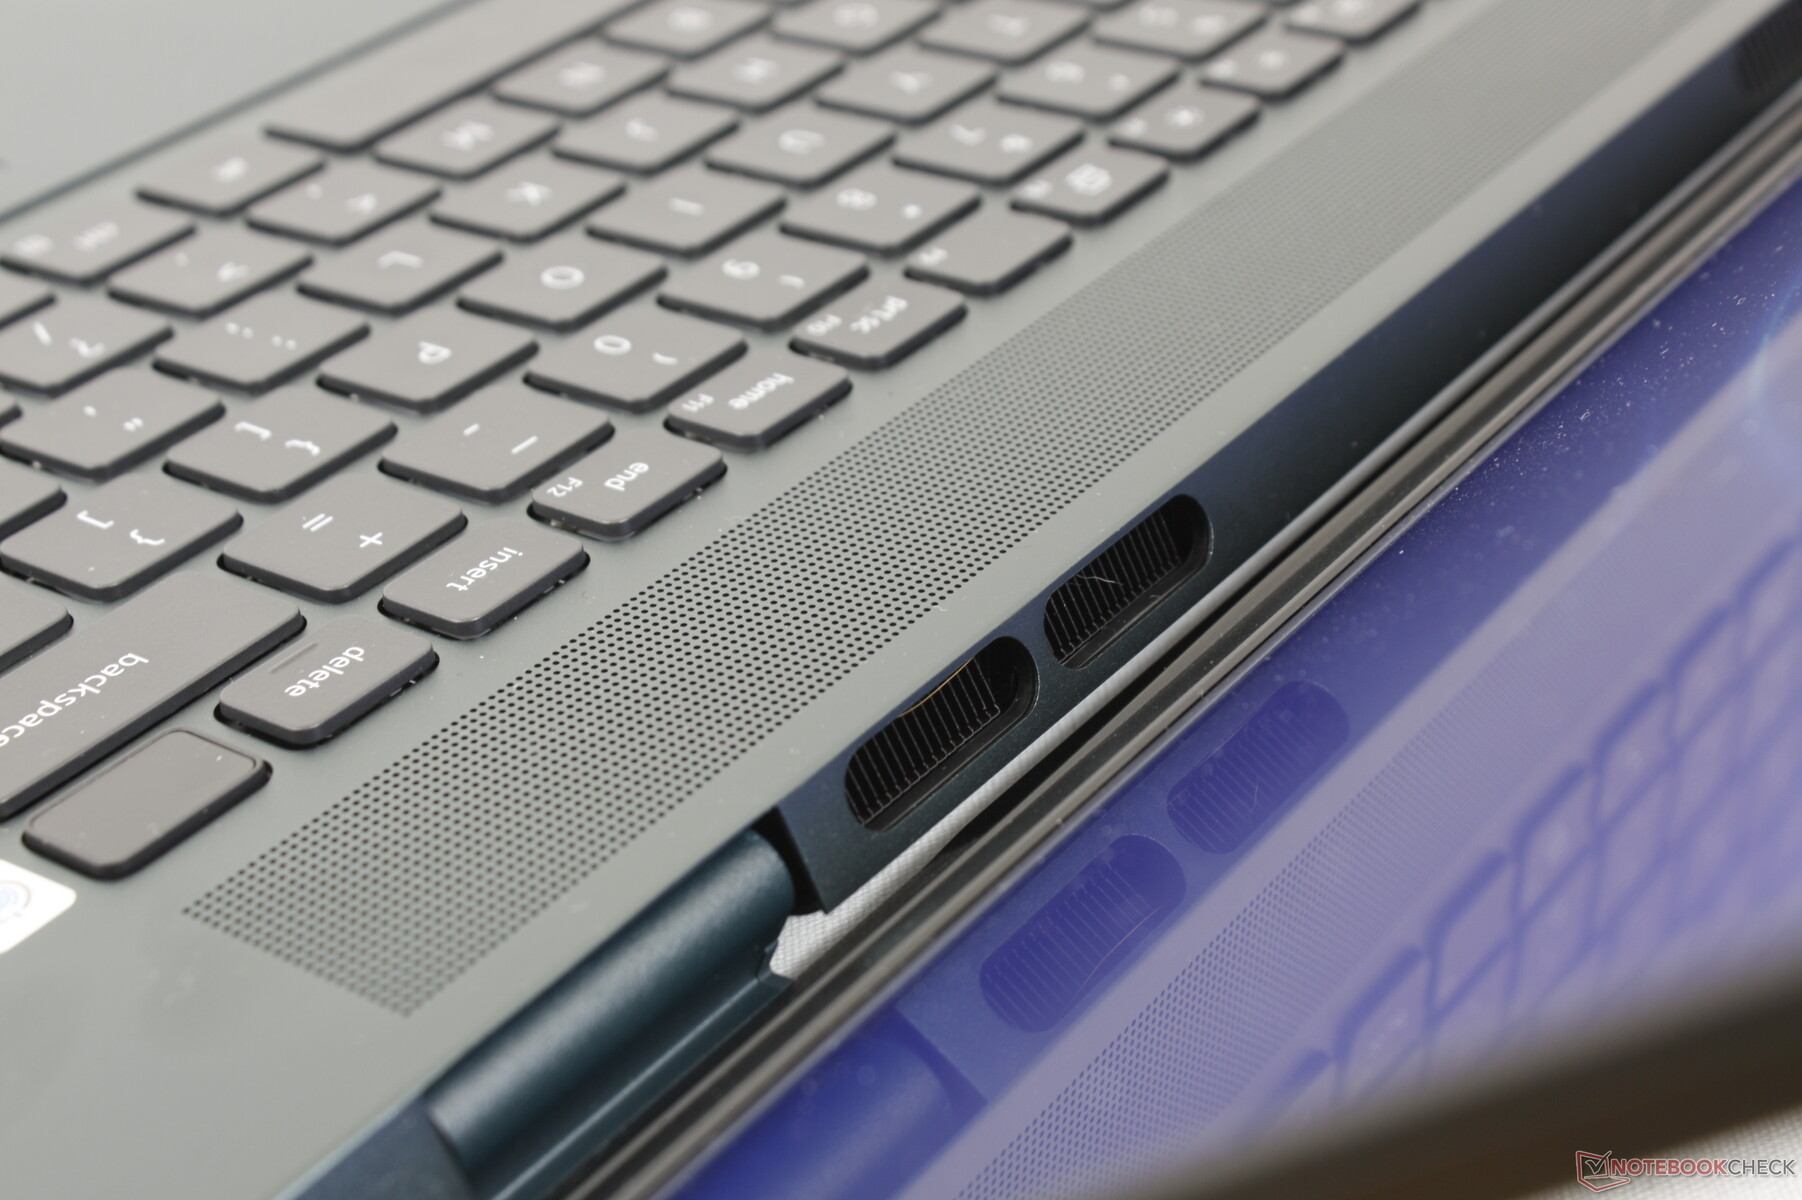
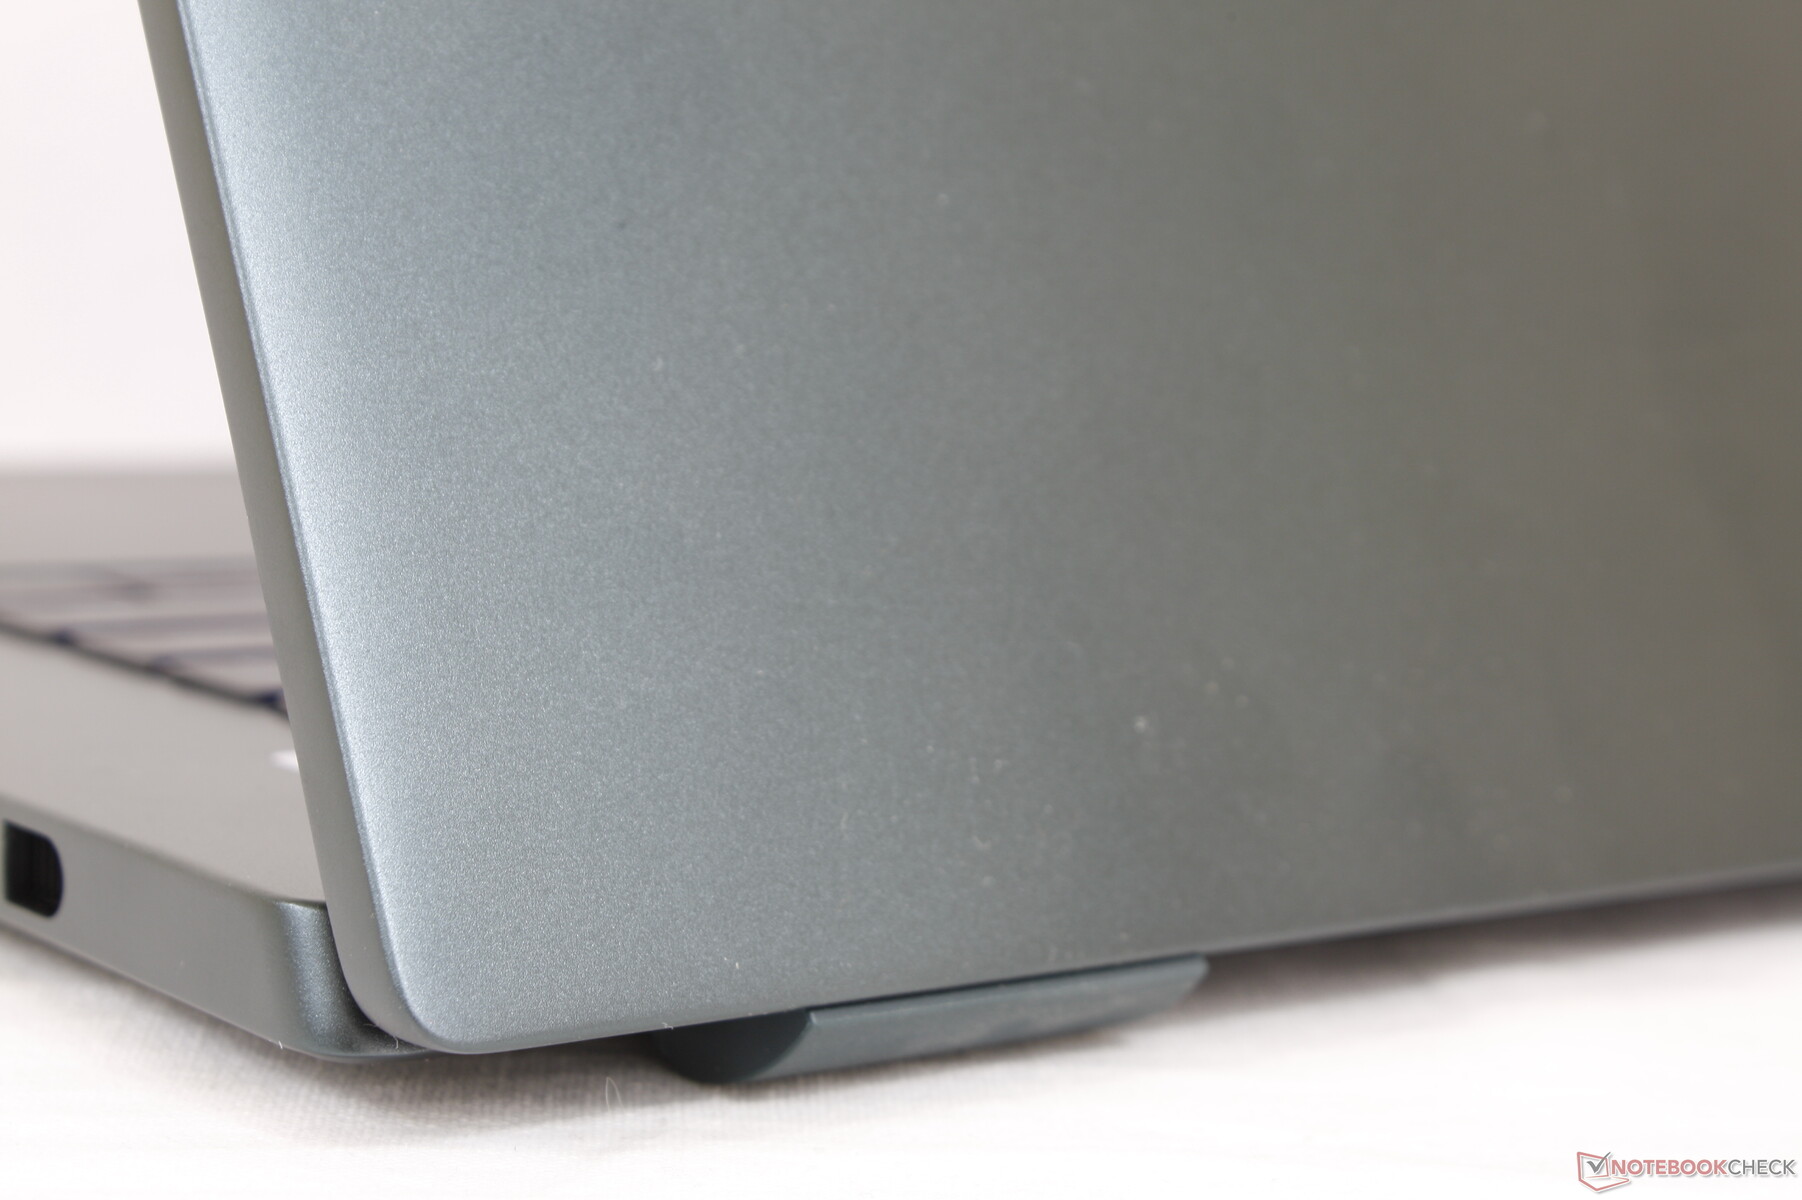
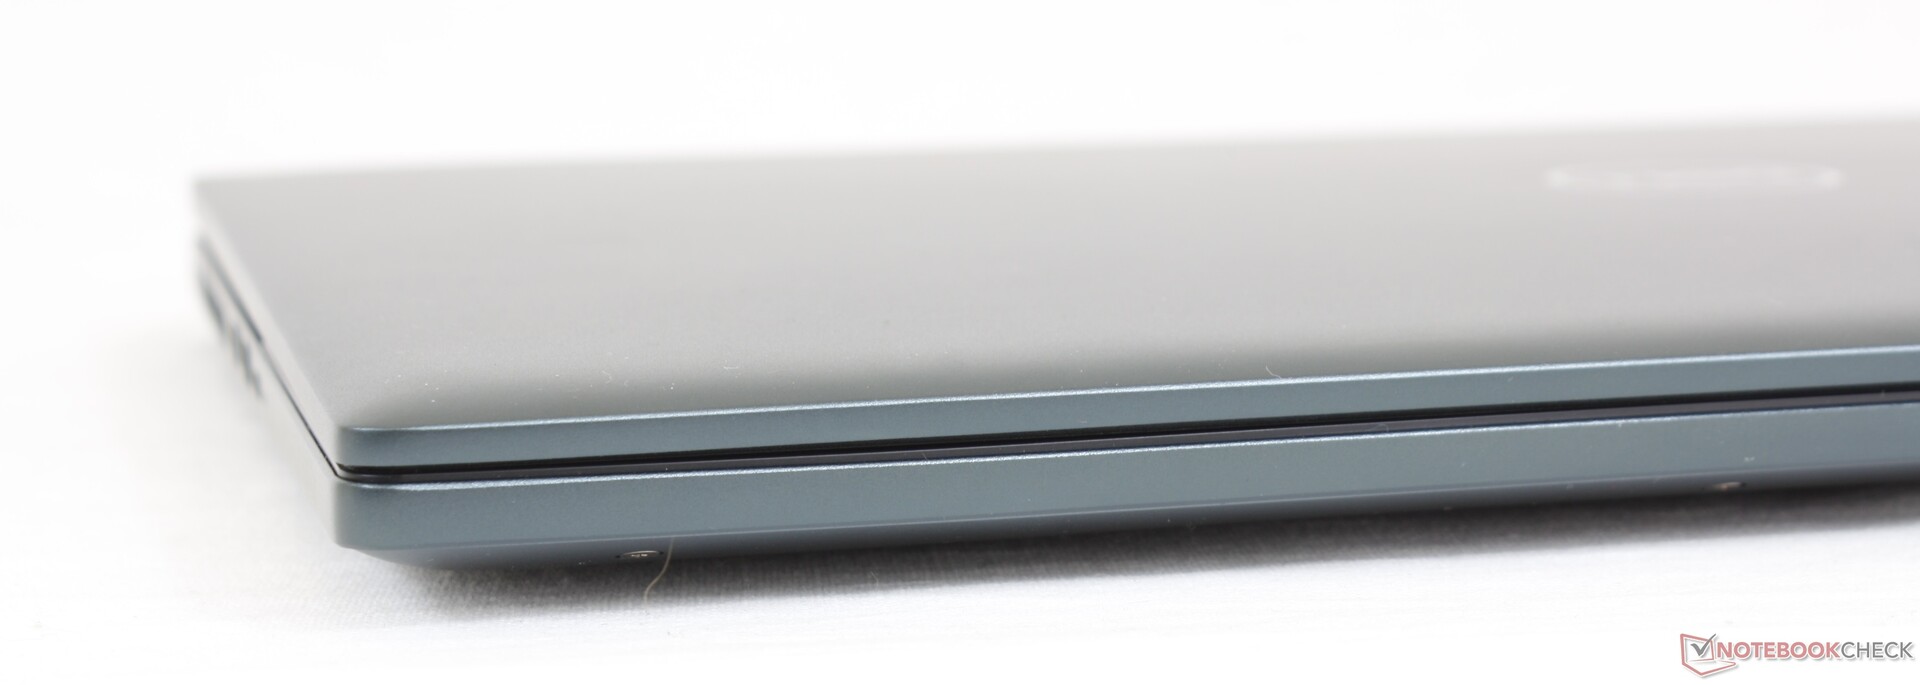
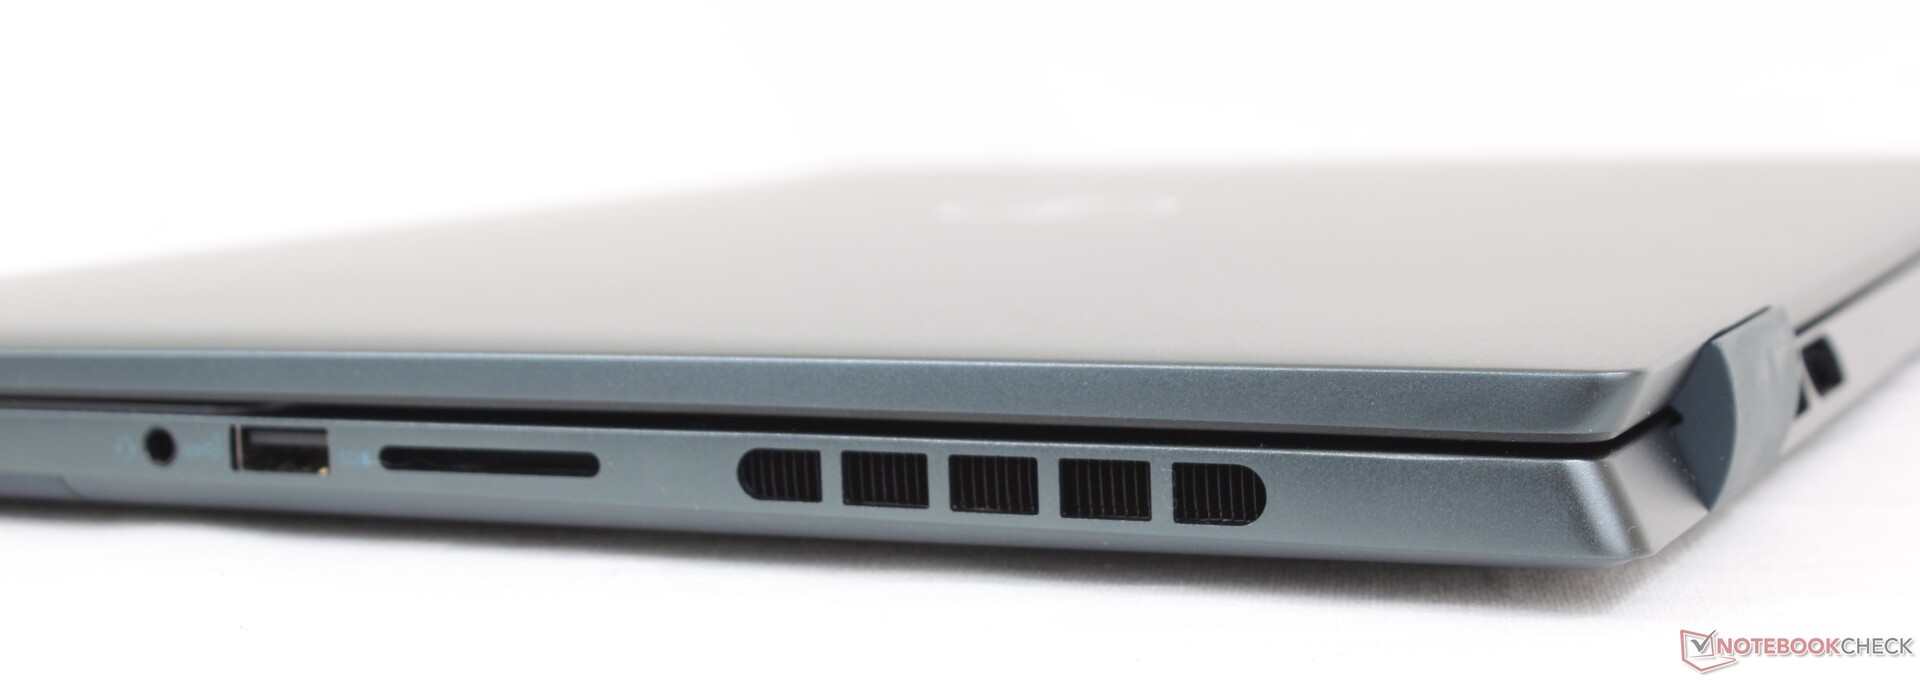
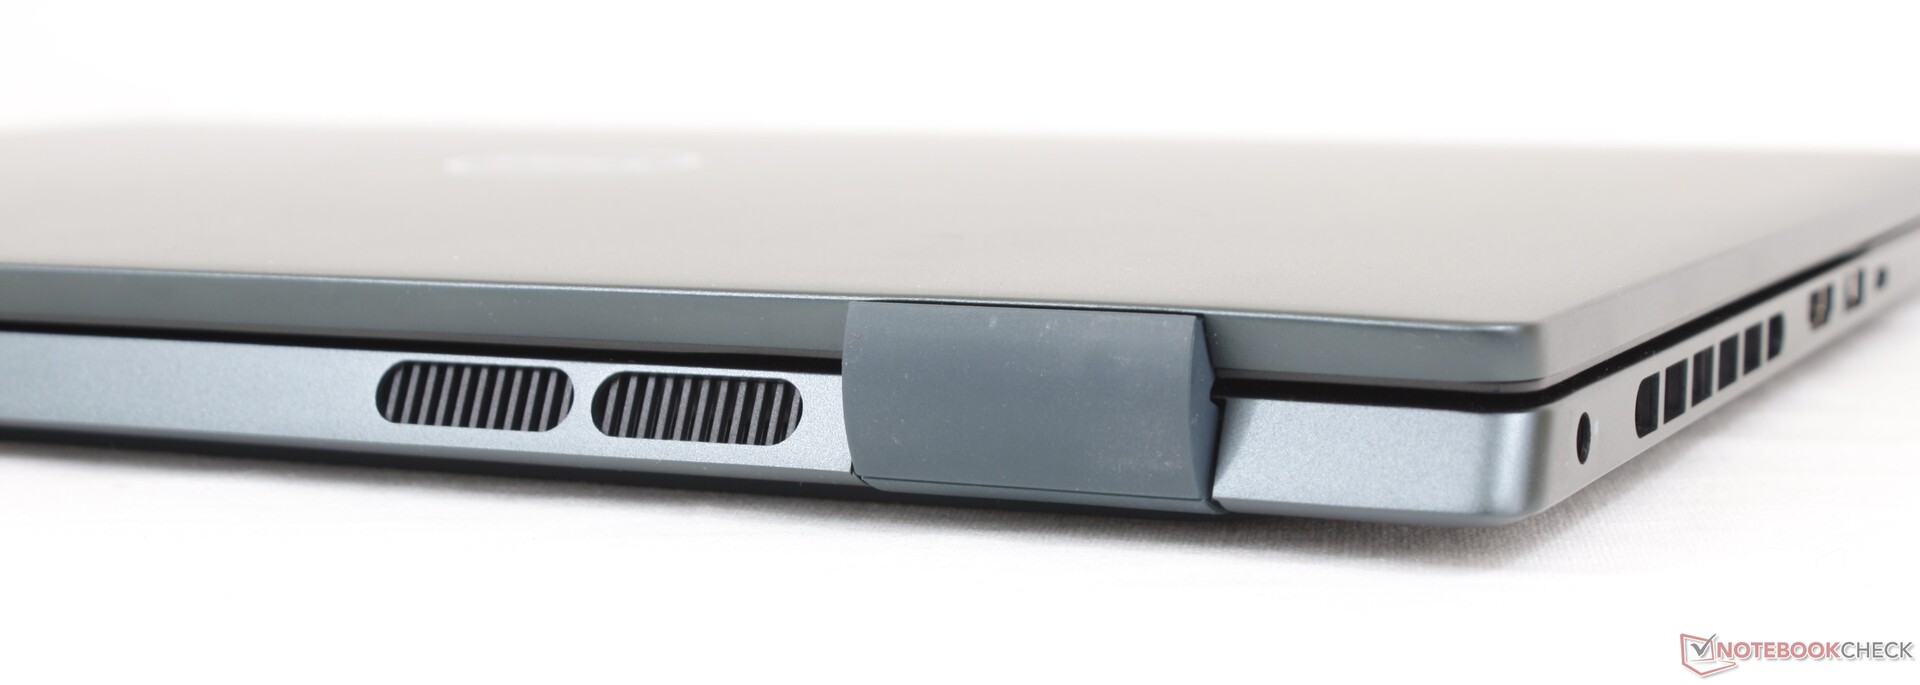
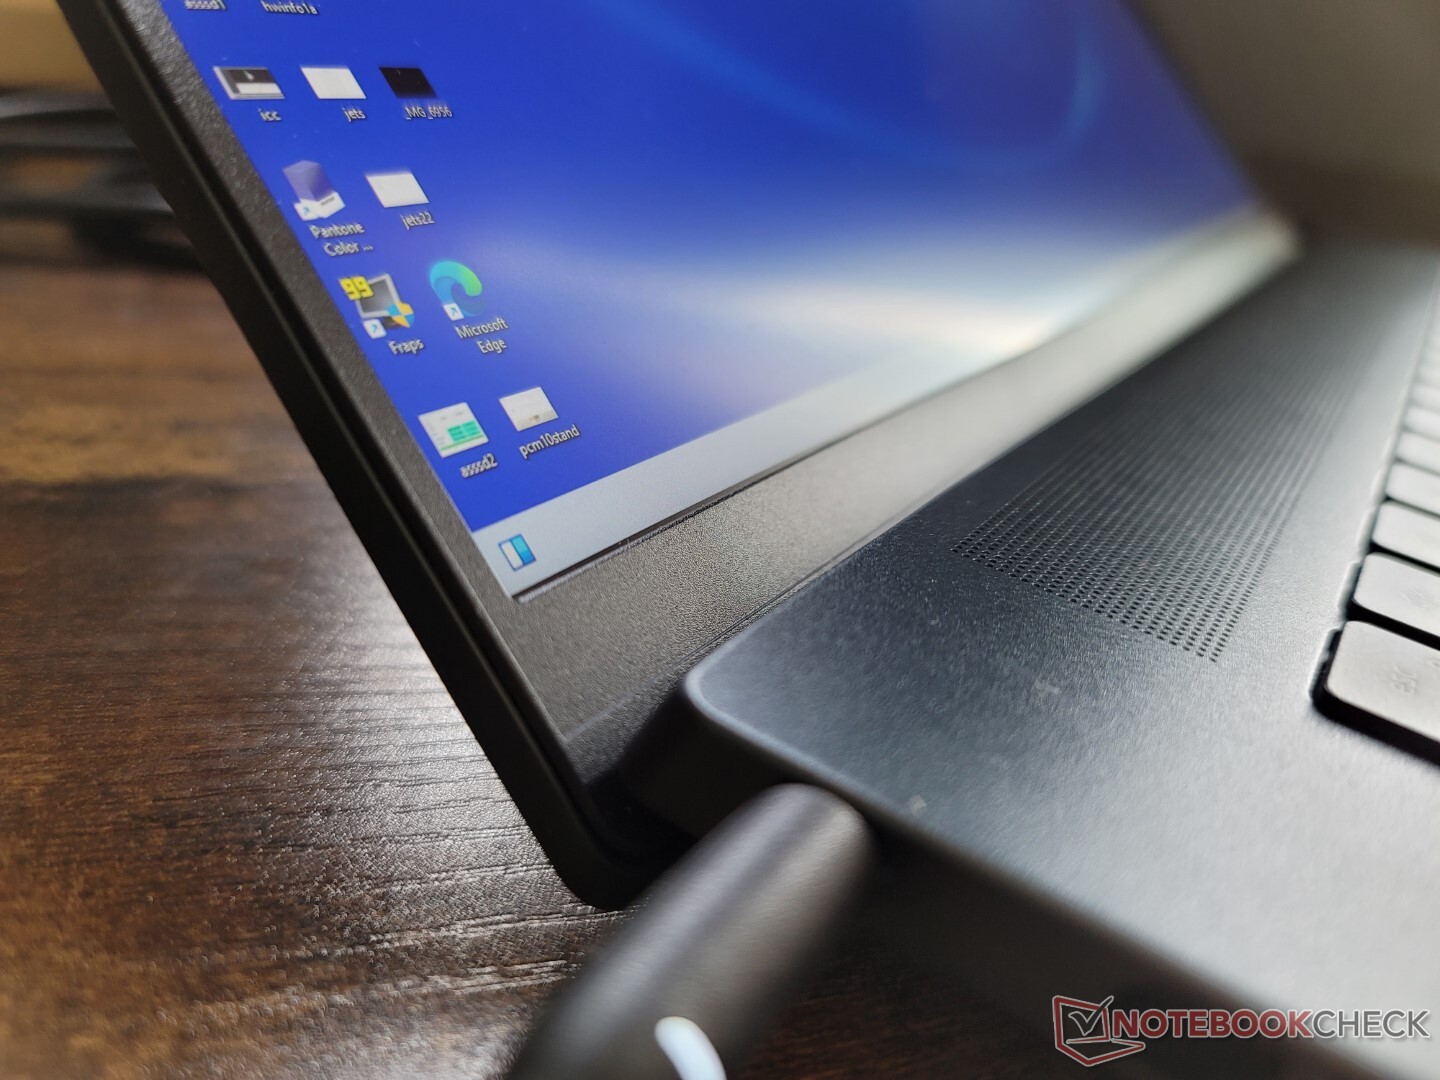
Visueel zijn de verschillen tussen de 2021- en 2022-modellen onmiddellijk merkbaar. Zo zijn de ventilatieroosters aan de zij- en achterkant nu respectievelijk rechthoekig en ovaal in plaats van cirkelvormig. De verchroomde randen en hoeken zijn nu verdwenen voor een meer monochroom en minder sierlijk uiterlijk
De bouwkwaliteit blijft ongeveer hetzelfde. De metalen basis verdraait en kraakt iets meer dan bij een duurdere XPS of Spectre en dit geldt vooral voor het deksel. We hoopten dat alle visuele veranderingen zouden leiden tot een sterker chassis, maar dat lijkt niet het geval te zijn. Als je nog steeds het 2021 model gebruikt, dan mis je niet veel op het gebied van design met het 2022 model.
Een van onze klachten over de Inspiron 16 Plus 7610 was het gewicht en dat geldt nog steeds voor de 7620, ondanks het nieuwe ontwerp van het chassis. Met 2 tot 2,1 kg is het systeem een paar honderd gram zwaarder dan de 16-inch Acer Swift X of Huawei MateBook D 16. Het nieuwe ontwerp is ook niet kleiner, want de afmetingen zijn zelfs iets groter dan die van de 7610.
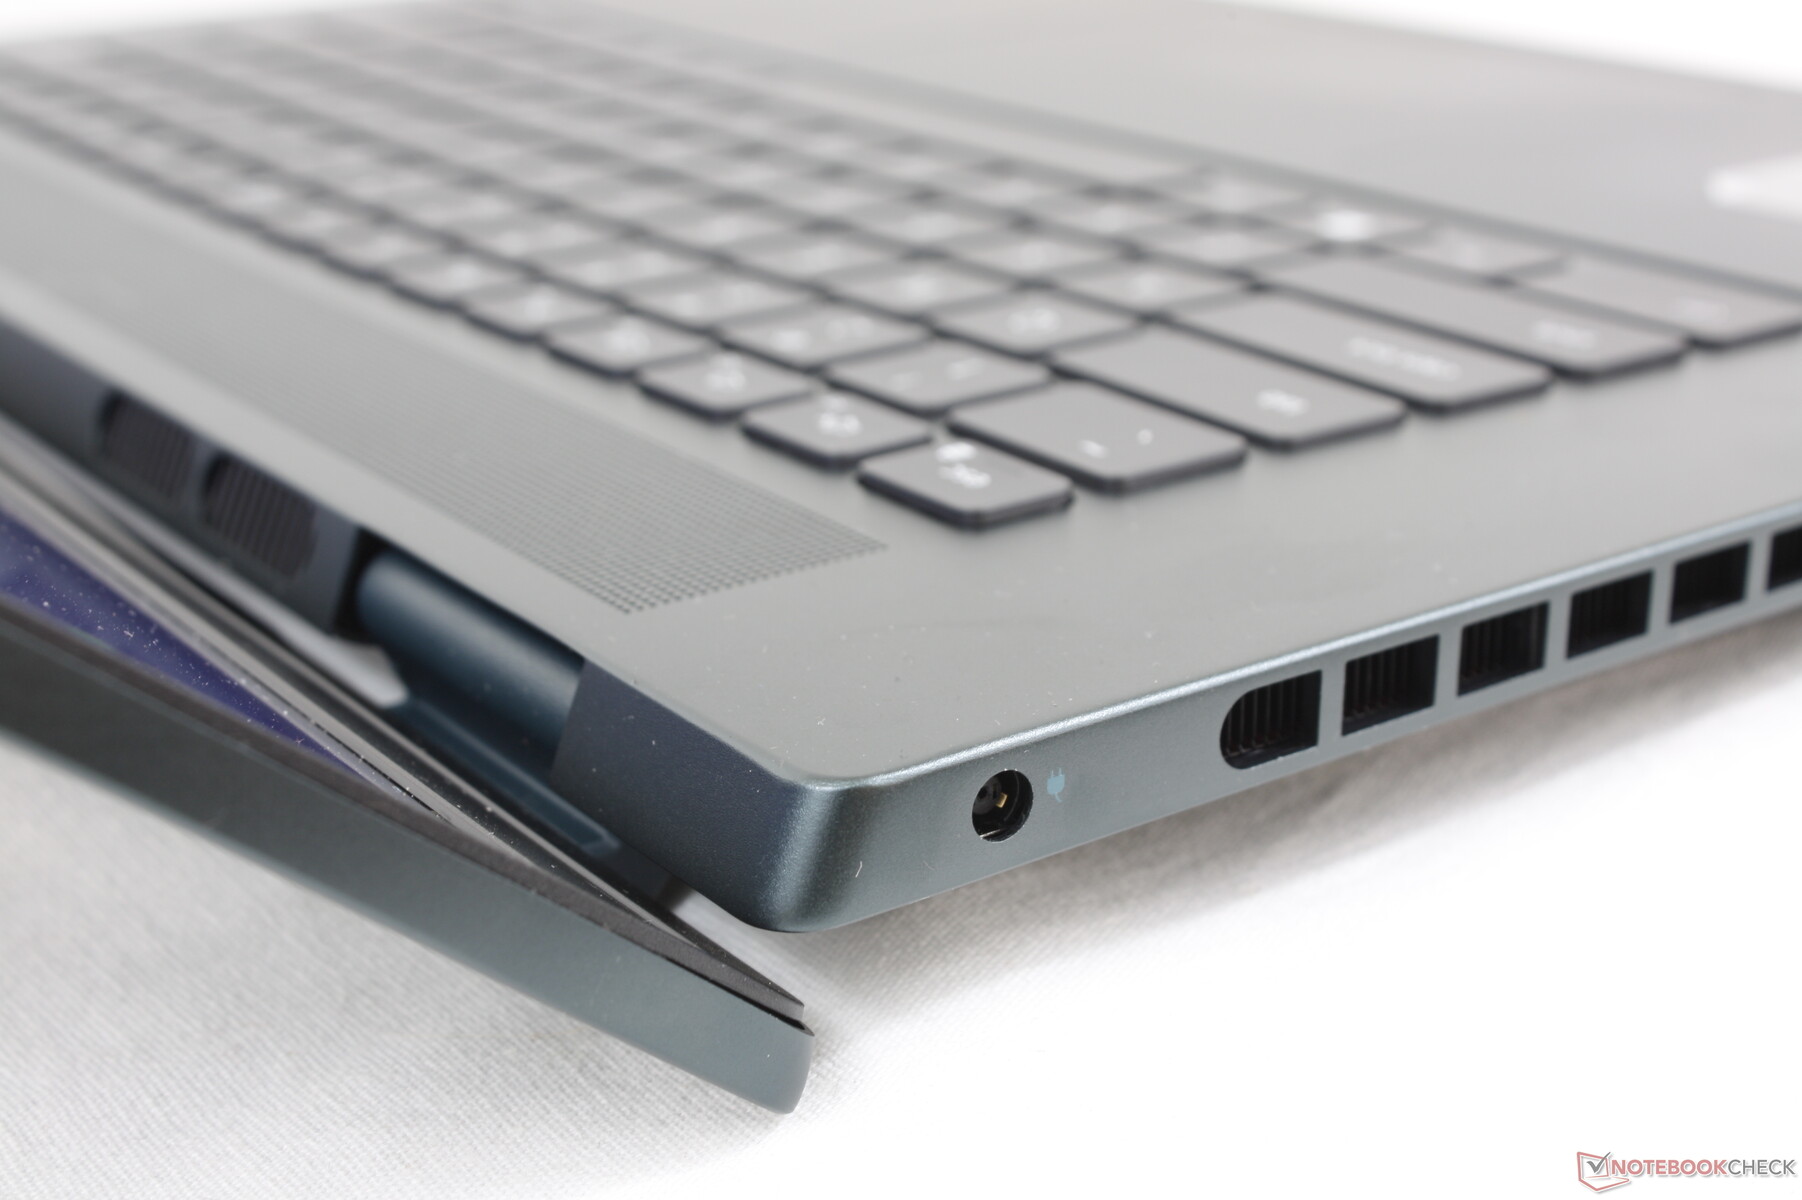
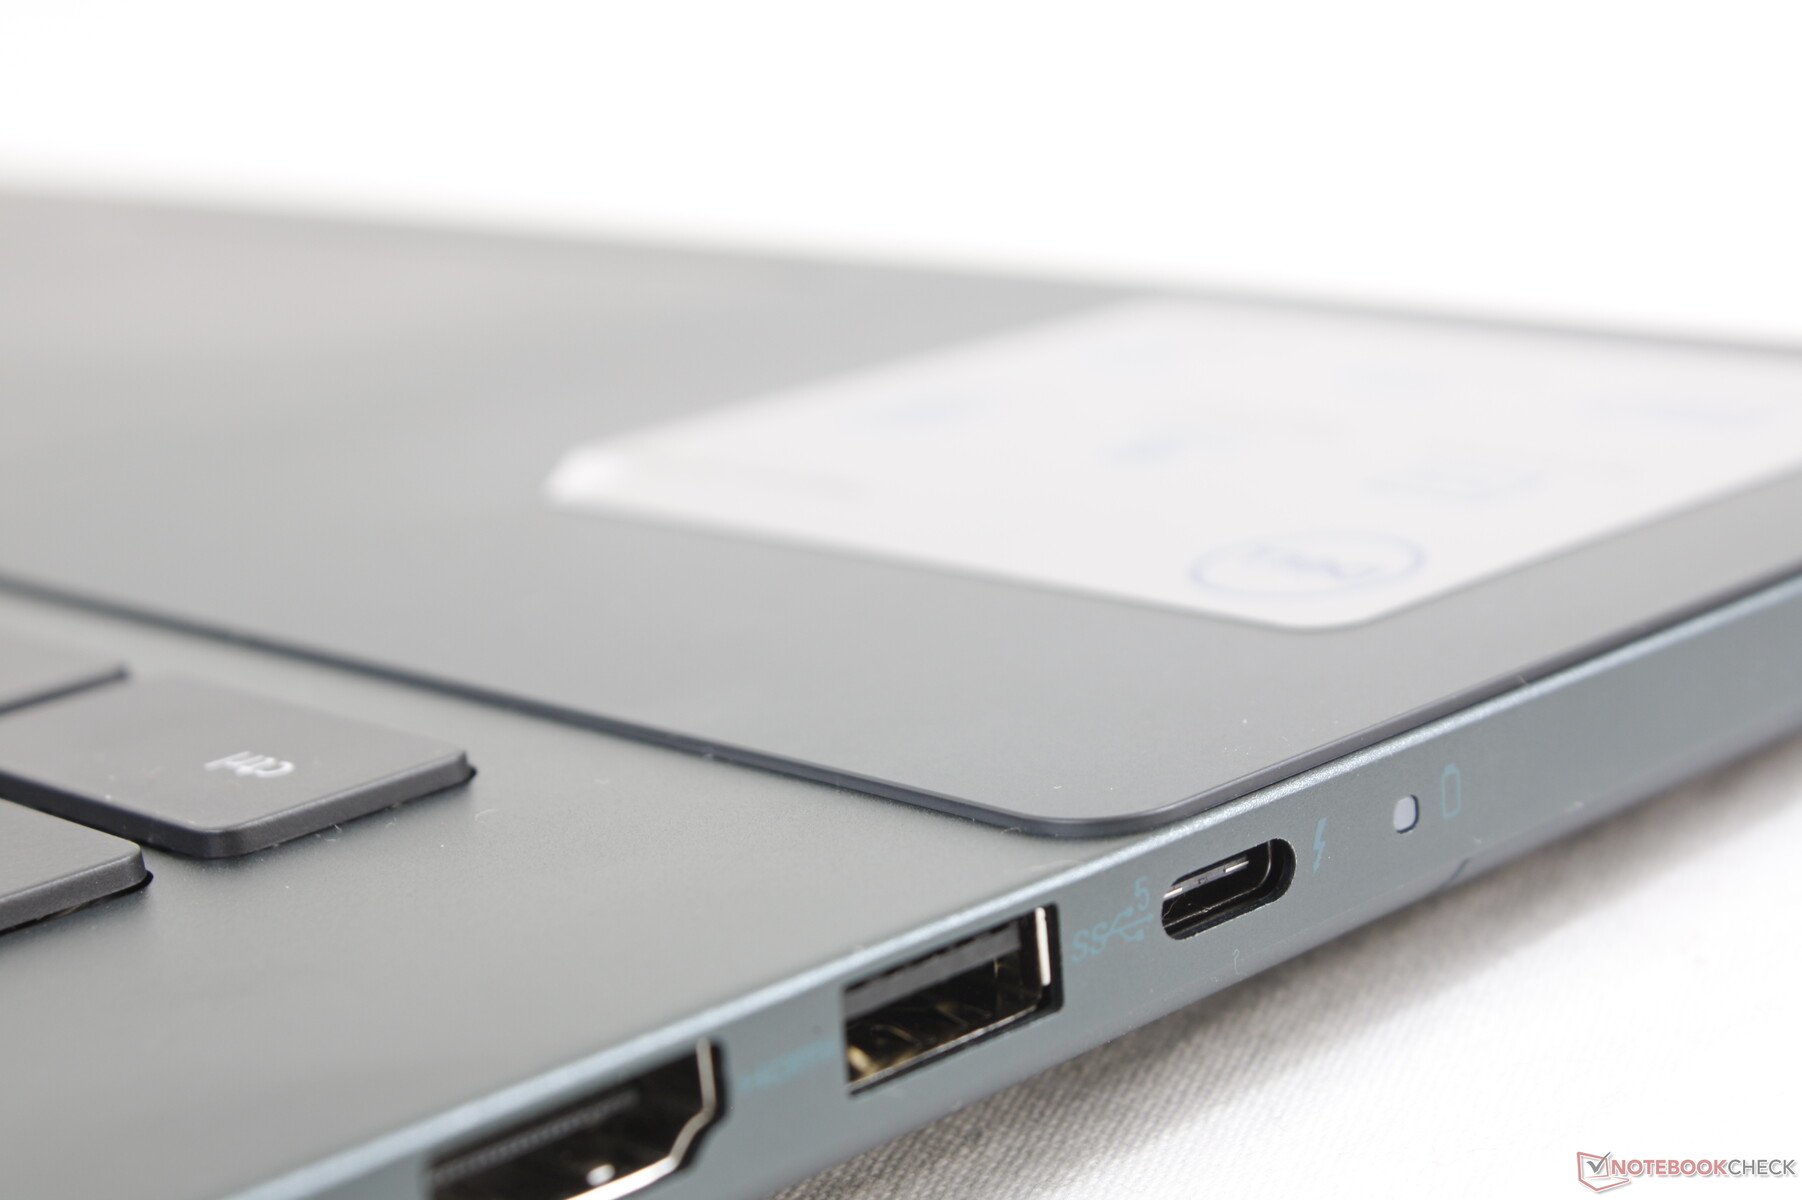
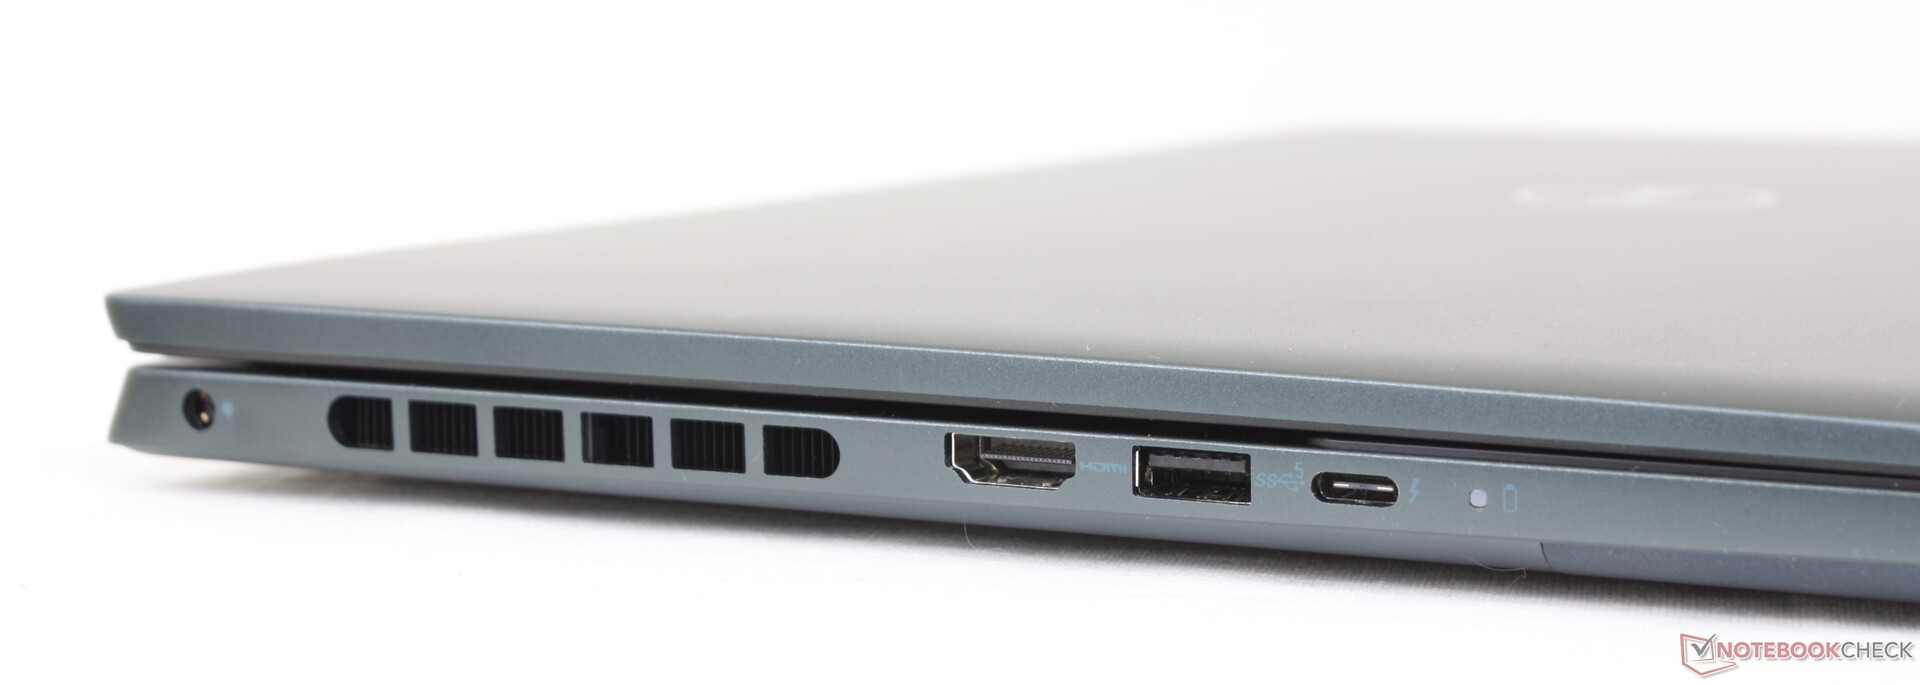
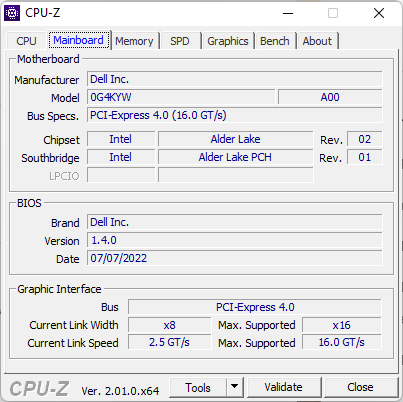
Connectiviteit - Thunderbolt 4 ondersteuning
De 7620 heeft dezelfde poorten als de 7610, ondanks de veranderingen aan de buitenkant. Een tweede USB-C poort zoals op de Lenovo Yoga 7 16 Gen 7 zou leuk zijn geweest om te hebben gezien hoe groot en zwaar het apparaat is.
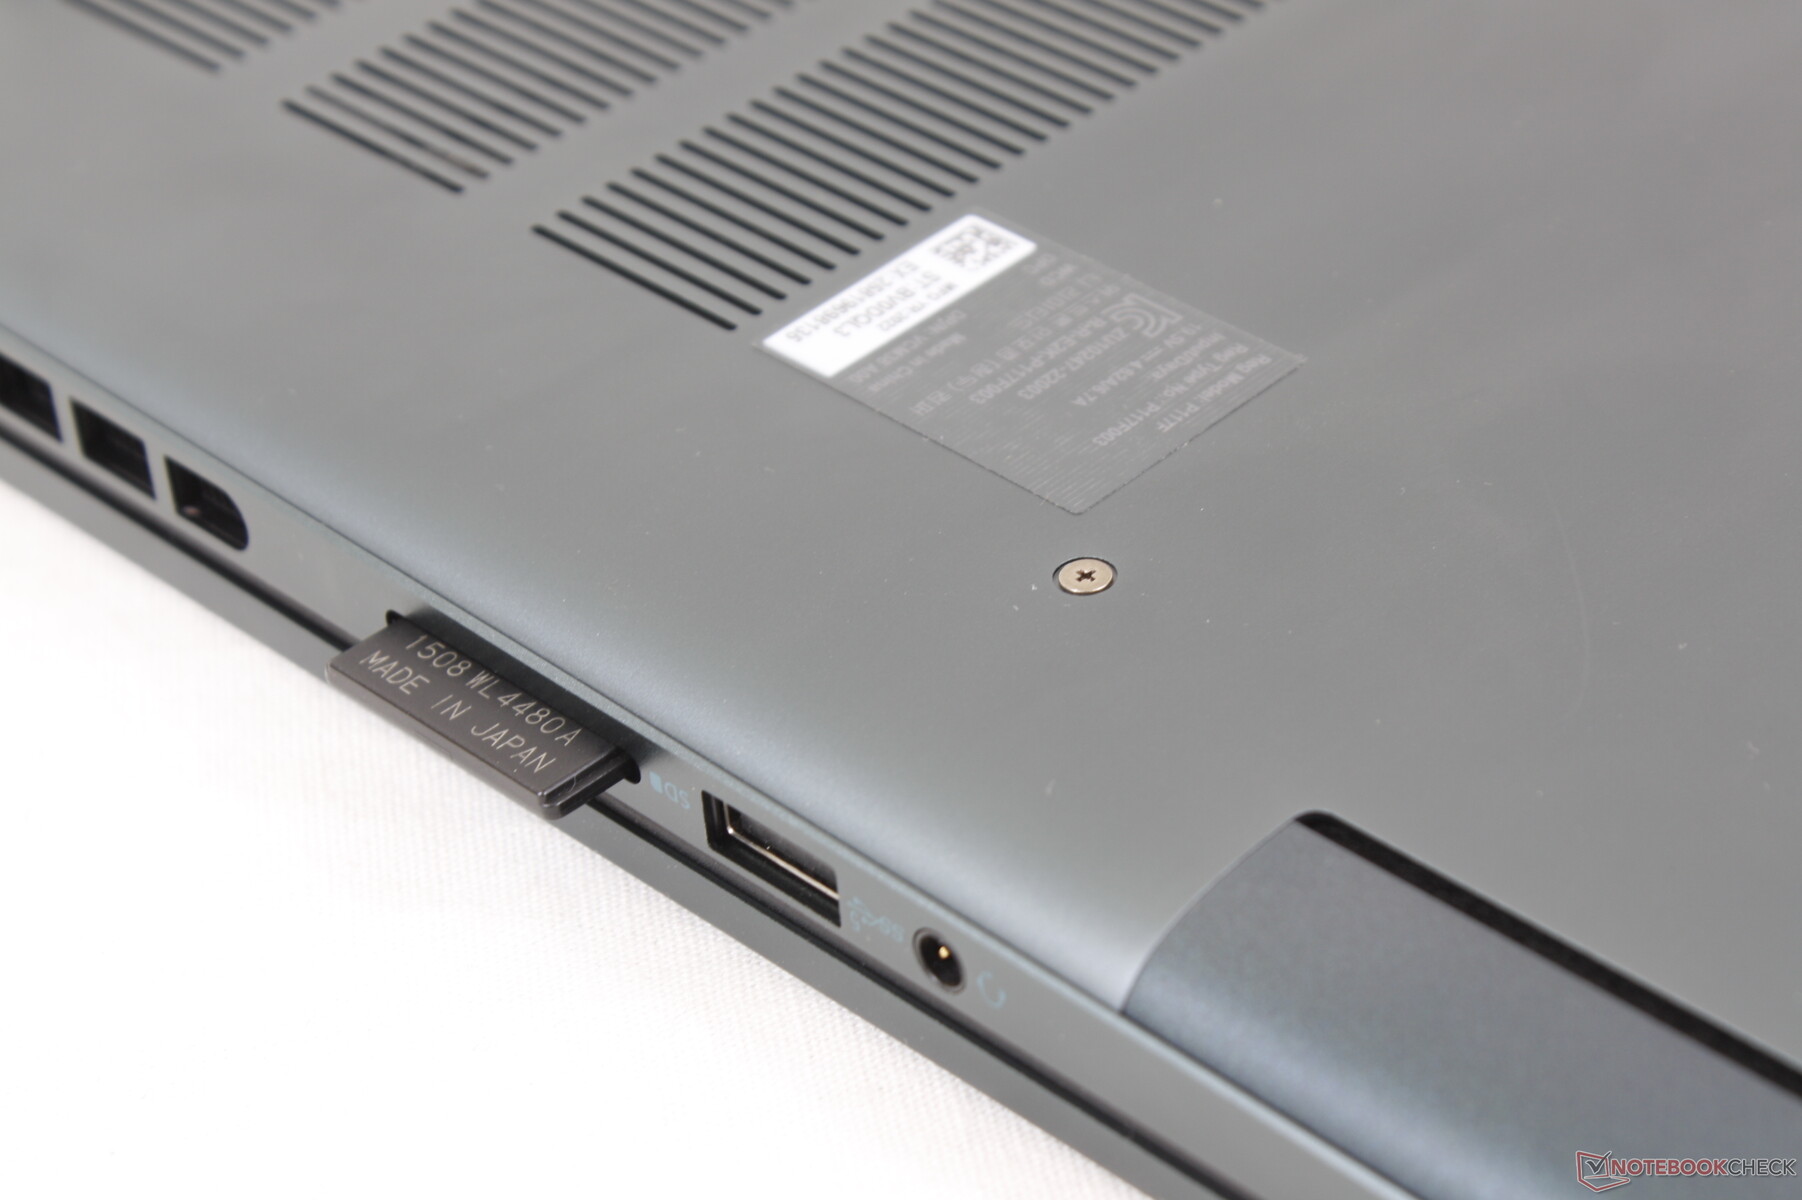
SD-kaartlezer
Overdrachtssnelheden met de SD-kaart blijven erg traag. Het is nu duidelijk dat Dell wil dat gebruikers upgraden naar de duurdere XPS serie als ze snellere SD kaart prestaties willen.
Merk op dat de RTX 3060 SKU wordt geleverd met een MicroSD lezer in plaats van een full-size.
| SD Card Reader | |
| average JPG Copy Test (av. of 3 runs) | |
| Dell XPS 15 9520 RTX 3050 Ti (Toshiba Exceria Pro SDXC 64 GB UHS-II) | |
| Lenovo Yoga 7 16IAP7 (Toshiba Exceria Pro SDXC 64 GB UHS-II) | |
| Asus Vivobook Pro 16X-M7600QE (AV Pro SD microSD 128 GB V60) | |
| Dell Inspiron 16 Plus 7620 (Toshiba Exceria Pro SDXC 64 GB UHS-II) | |
| Dell Inspiron 16 Plus 7610 (AV PRO microSD 128 GB V60) | |
| maximum AS SSD Seq Read Test (1GB) | |
| Dell XPS 15 9520 RTX 3050 Ti (Toshiba Exceria Pro SDXC 64 GB UHS-II) | |
| Lenovo Yoga 7 16IAP7 (Toshiba Exceria Pro SDXC 64 GB UHS-II) | |
| Asus Vivobook Pro 16X-M7600QE (AV Pro SD microSD 128 GB V60) | |
| Dell Inspiron 16 Plus 7620 (Toshiba Exceria Pro SDXC 64 GB UHS-II) | |
| Dell Inspiron 16 Plus 7610 (AV PRO microSD 128 GB V60) | |
Communicatie
De SKU's kunnen worden geconfigureerd met ofwel de Intel AX201 of AX211 voor Wi-Fi 6 en Wi-Fi 6E connectiviteit, respectievelijk. De AX211 in onze unit vertoont uitstekende ontvangstsnelheden wanneer deze wordt gekoppeld aan onze 6 GHz router, maar de verzendsnelheden zijn niet zo stabiel als verwacht, zelfs niet na meerdere pogingen.
| Networking | |
| iperf3 transmit AX12 | |
| Acer Swift X SFX16-51G-5388 | |
| Dell Inspiron 16 Plus 7610 | |
| Asus Vivobook Pro 16X-M7600QE | |
| iperf3 receive AX12 | |
| Acer Swift X SFX16-51G-5388 | |
| Dell Inspiron 16 Plus 7610 | |
| Asus Vivobook Pro 16X-M7600QE | |
| iperf3 receive AXE11000 6GHz | |
| Lenovo Yoga 7 16IAP7 | |
| Dell Inspiron 16 Plus 7620 | |
| iperf3 transmit AXE11000 6GHz | |
| Lenovo Yoga 7 16IAP7 | |
| Dell Inspiron 16 Plus 7620 | |
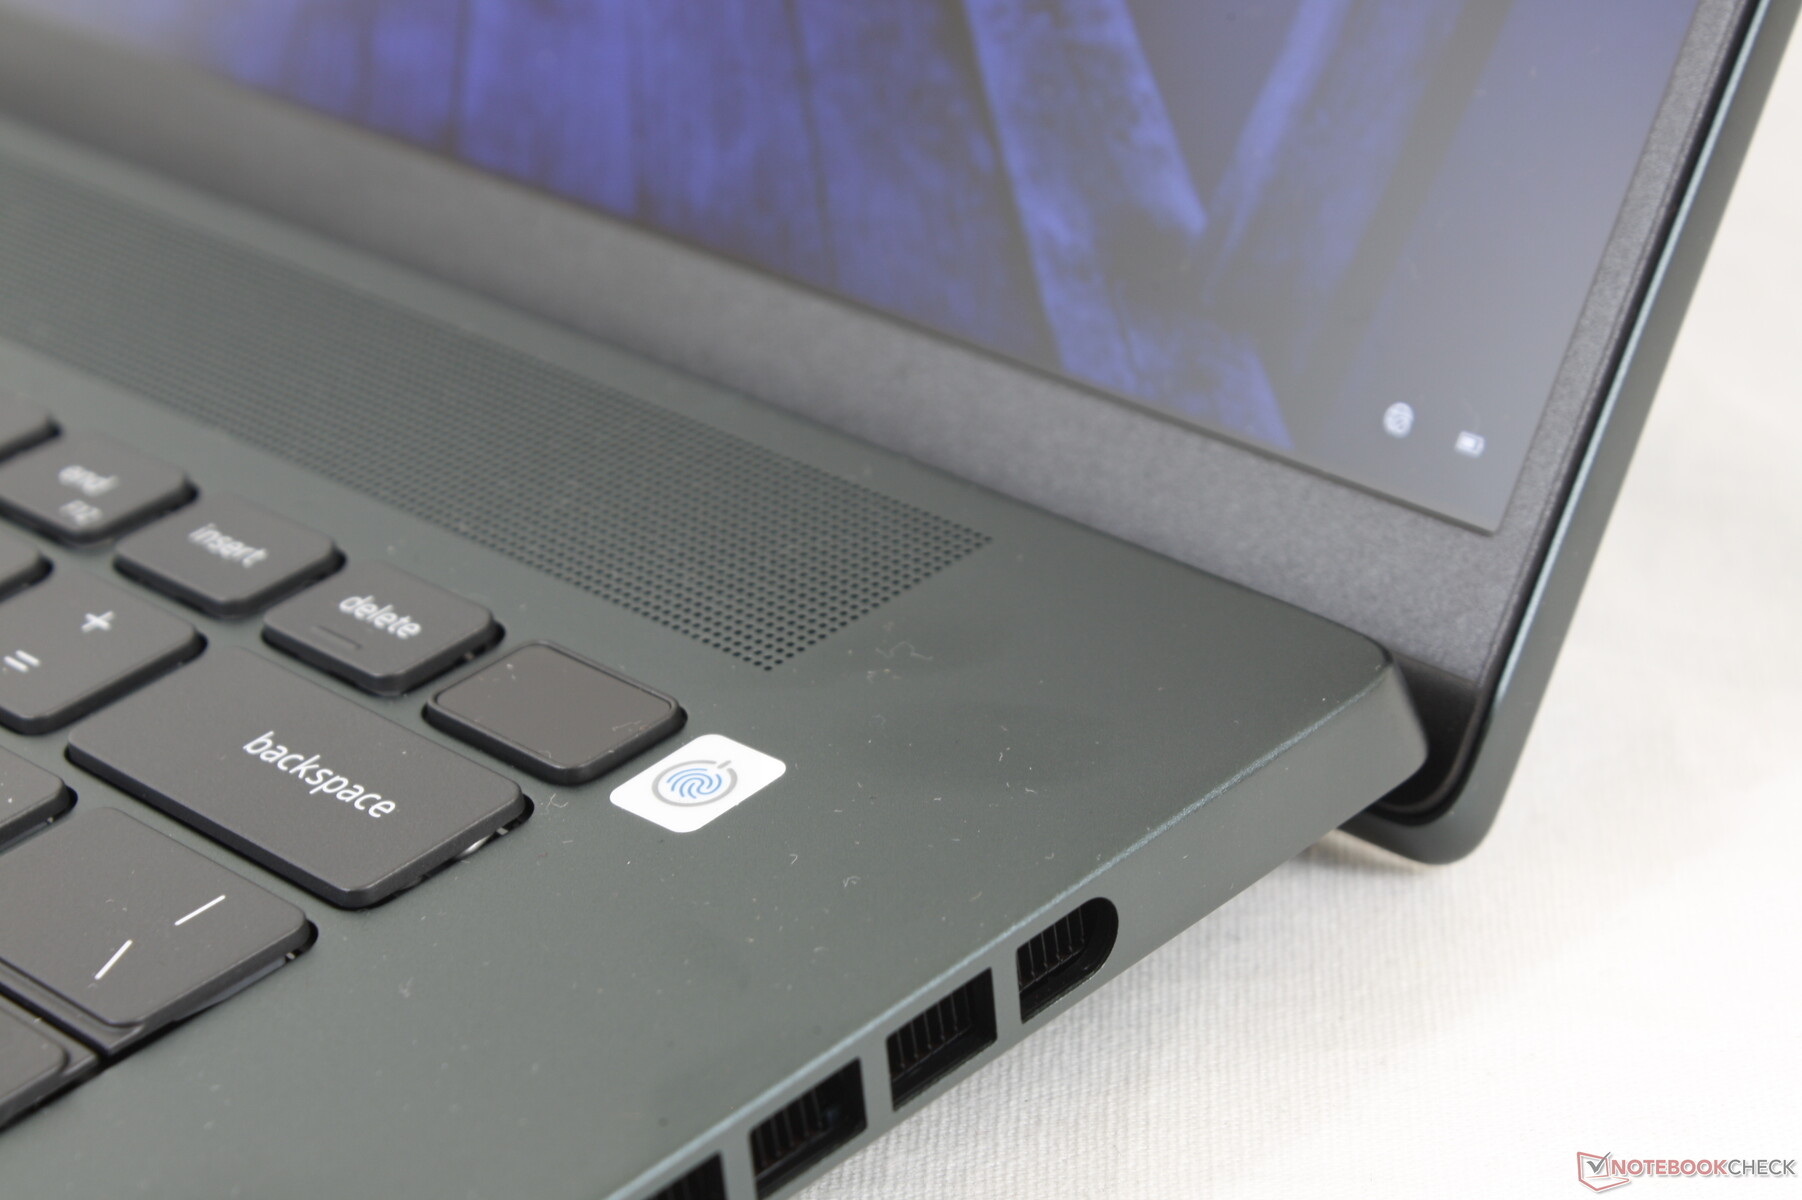
Webcam - Nu 2 MP in plaats van 1 MP
Dell heeft de webcam geüpgraded van 720p of 1 MP op de Inspiron 16 Plus 7610 naar 1080p of 2 MP op het 7620 model voor schonere beelden. Er is ondersteuning voor Windows Hello en een fysieke webcam sluiter voor privacy.


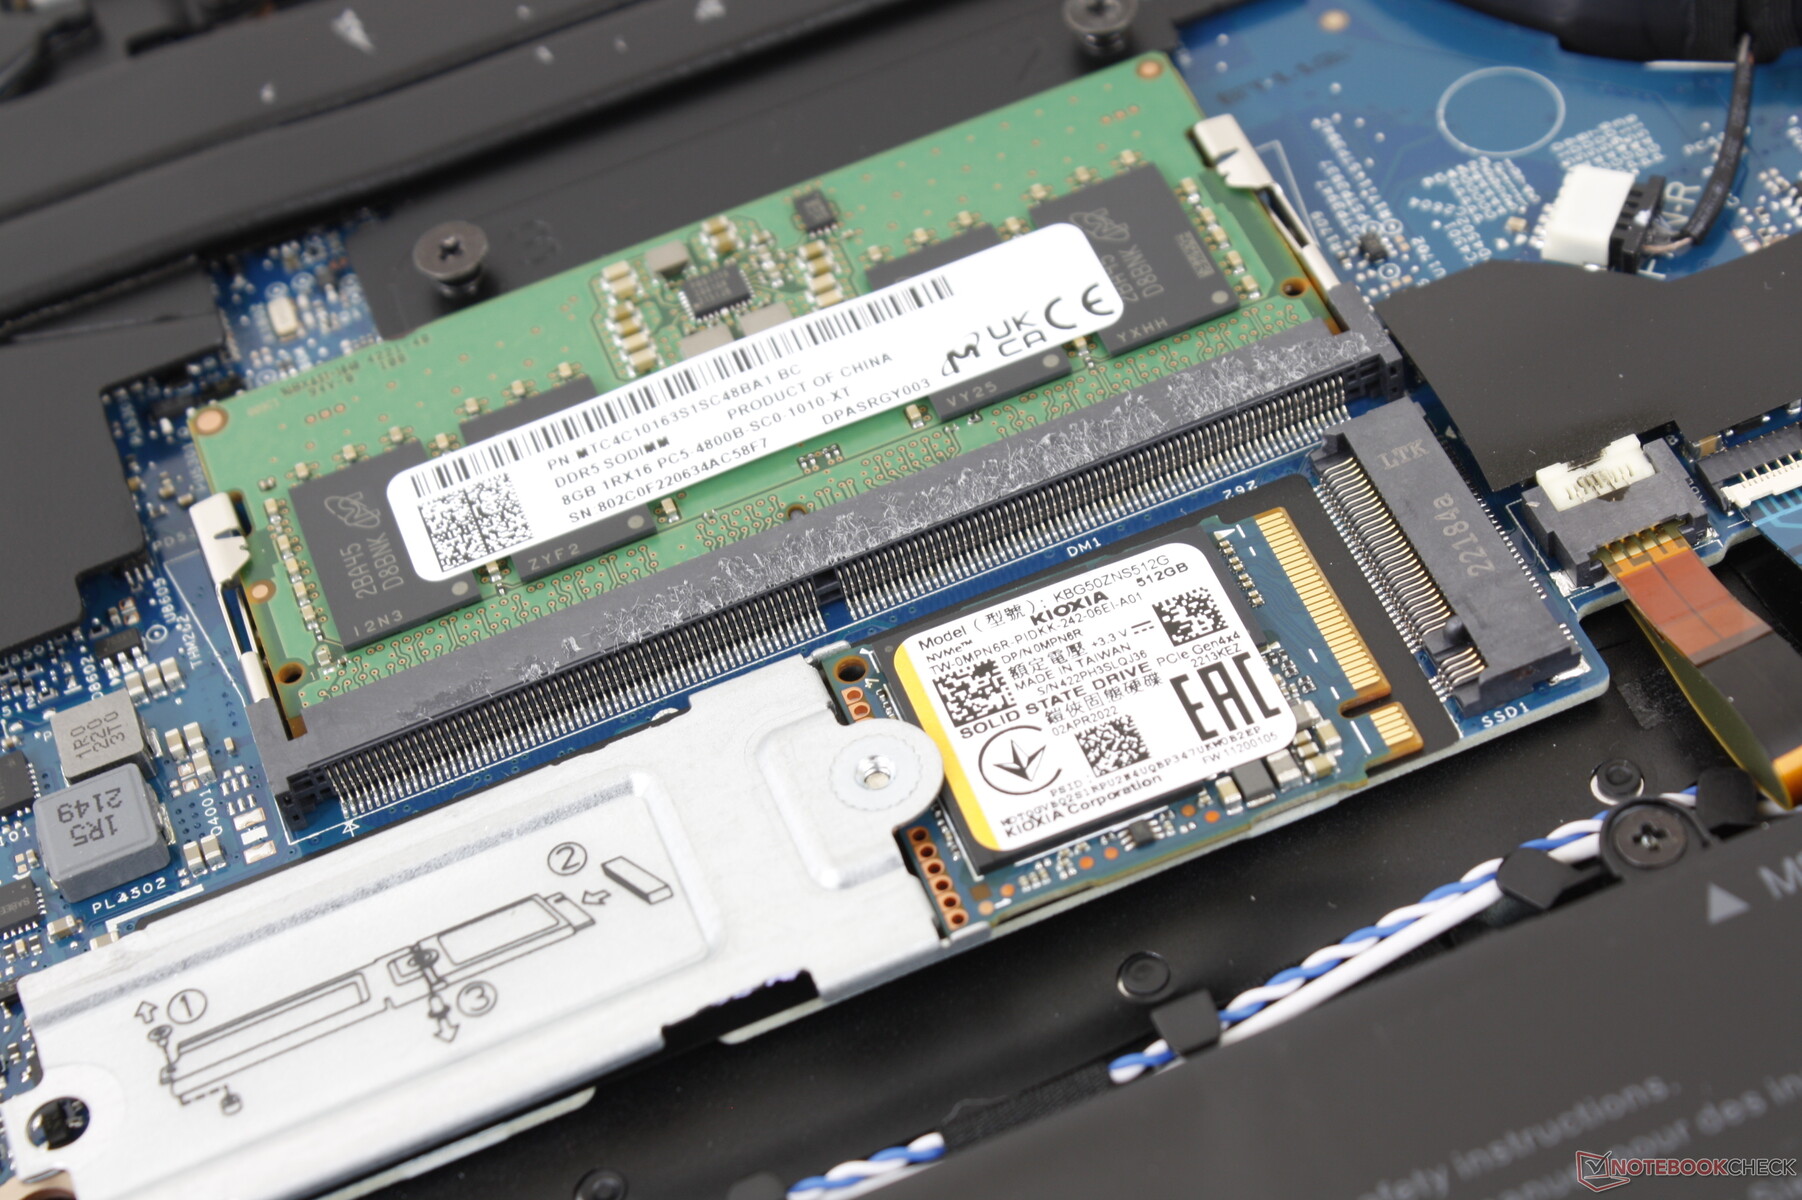
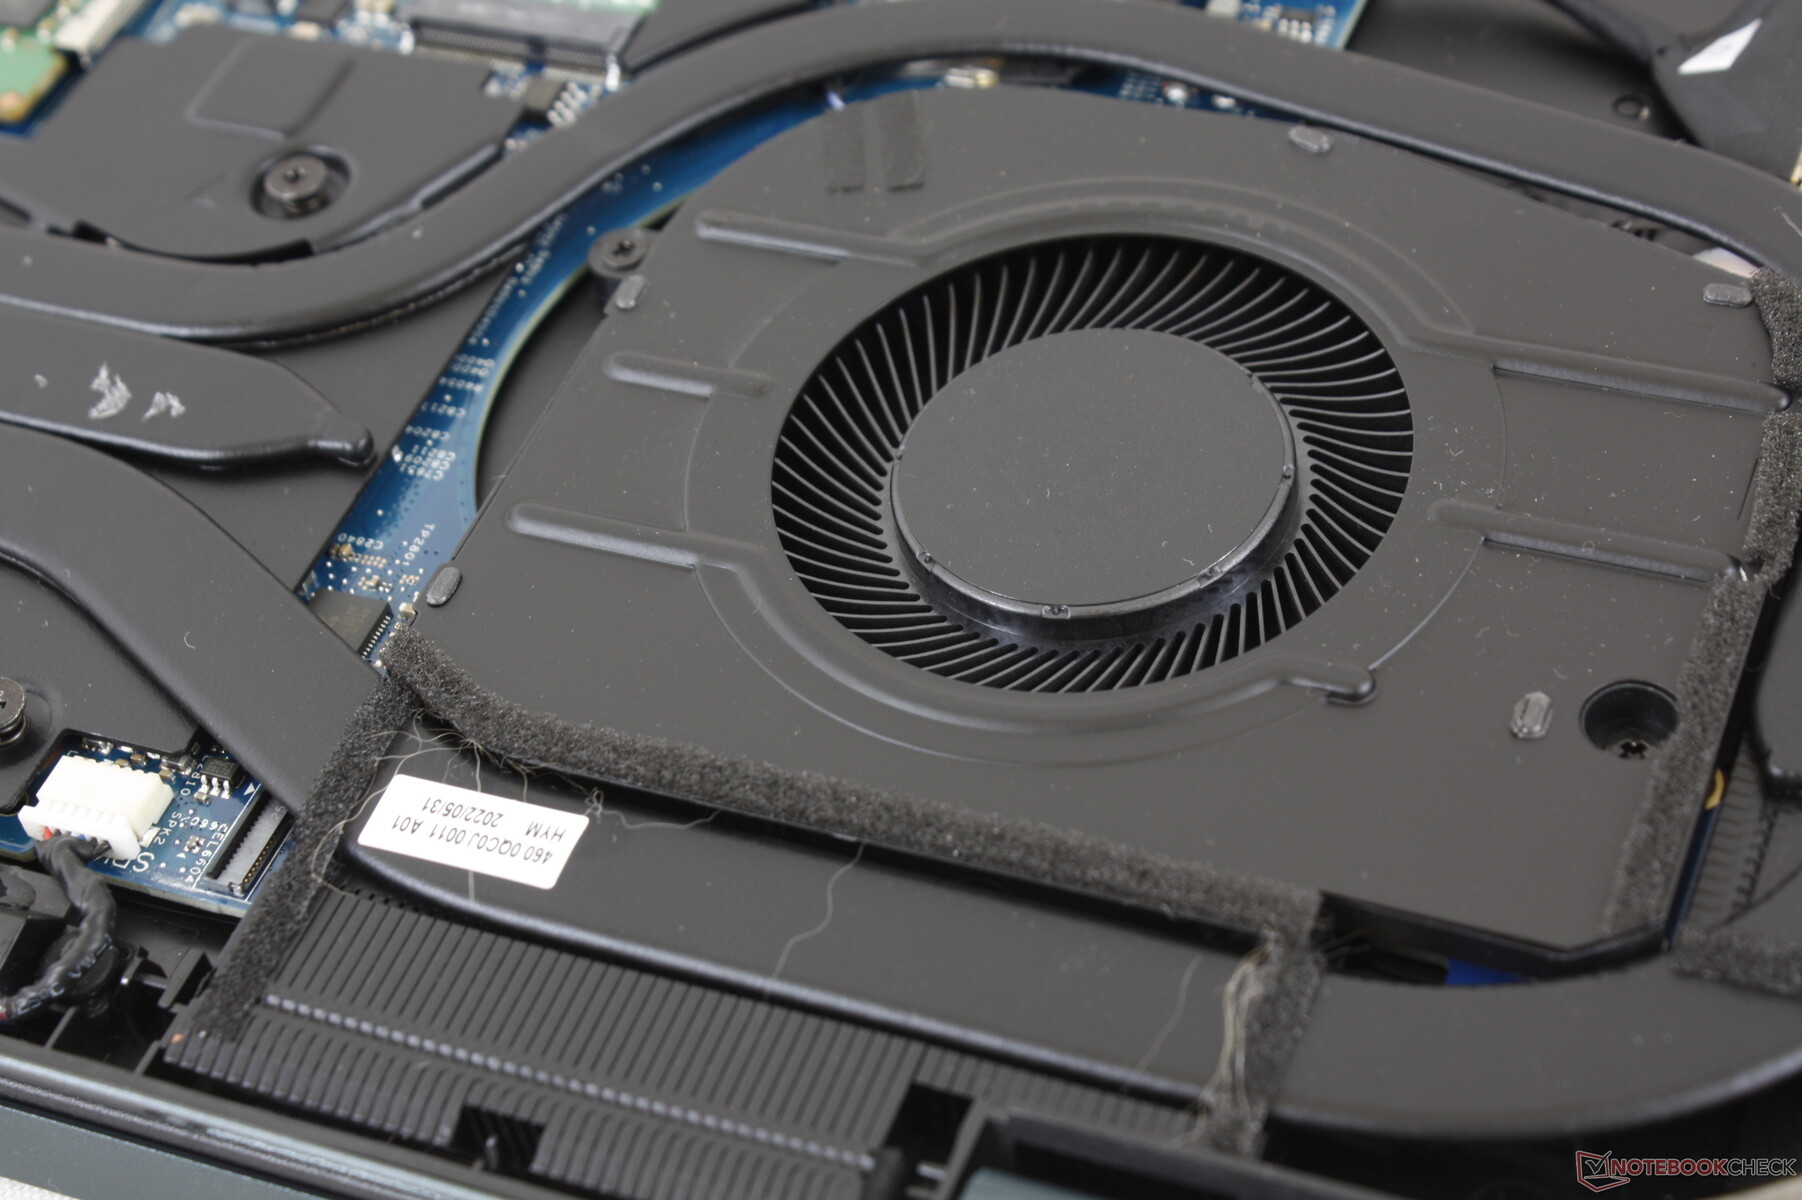
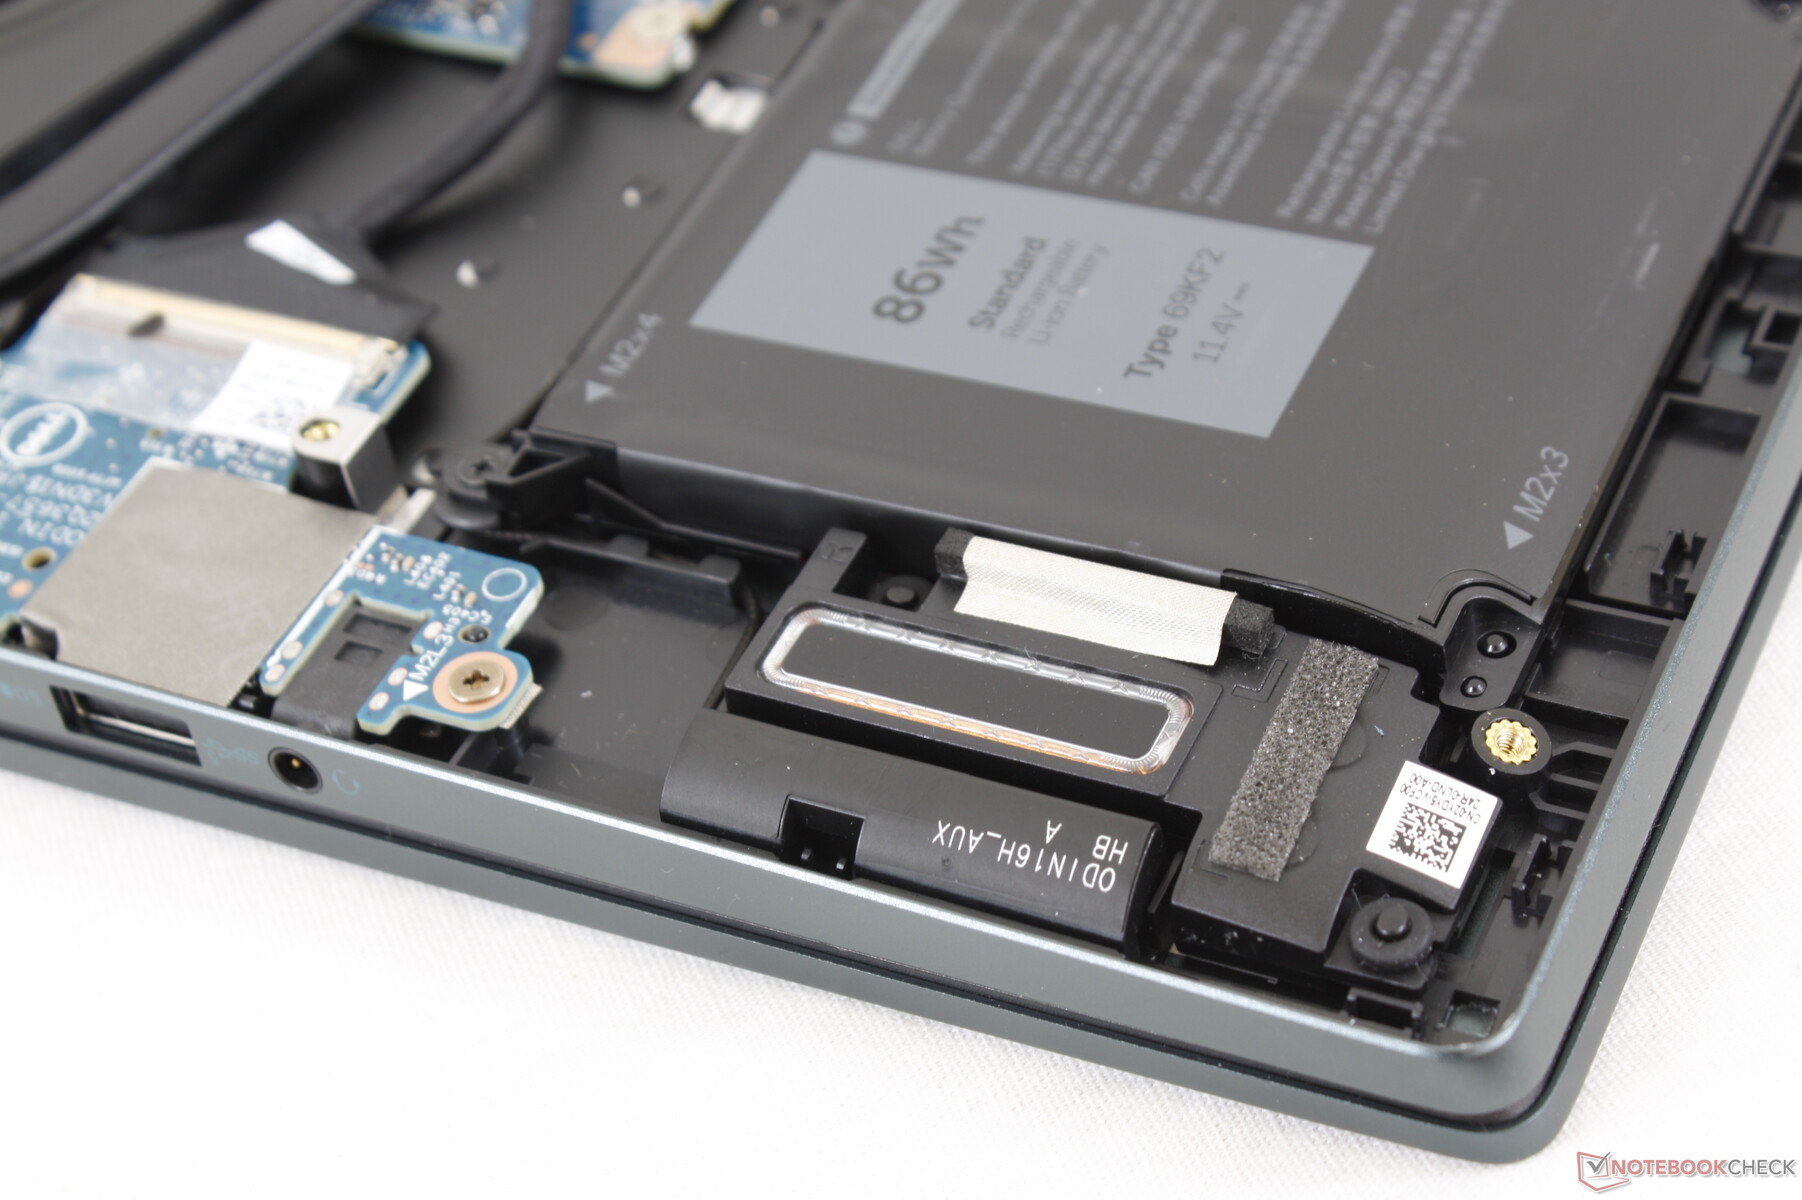
Onderhoud
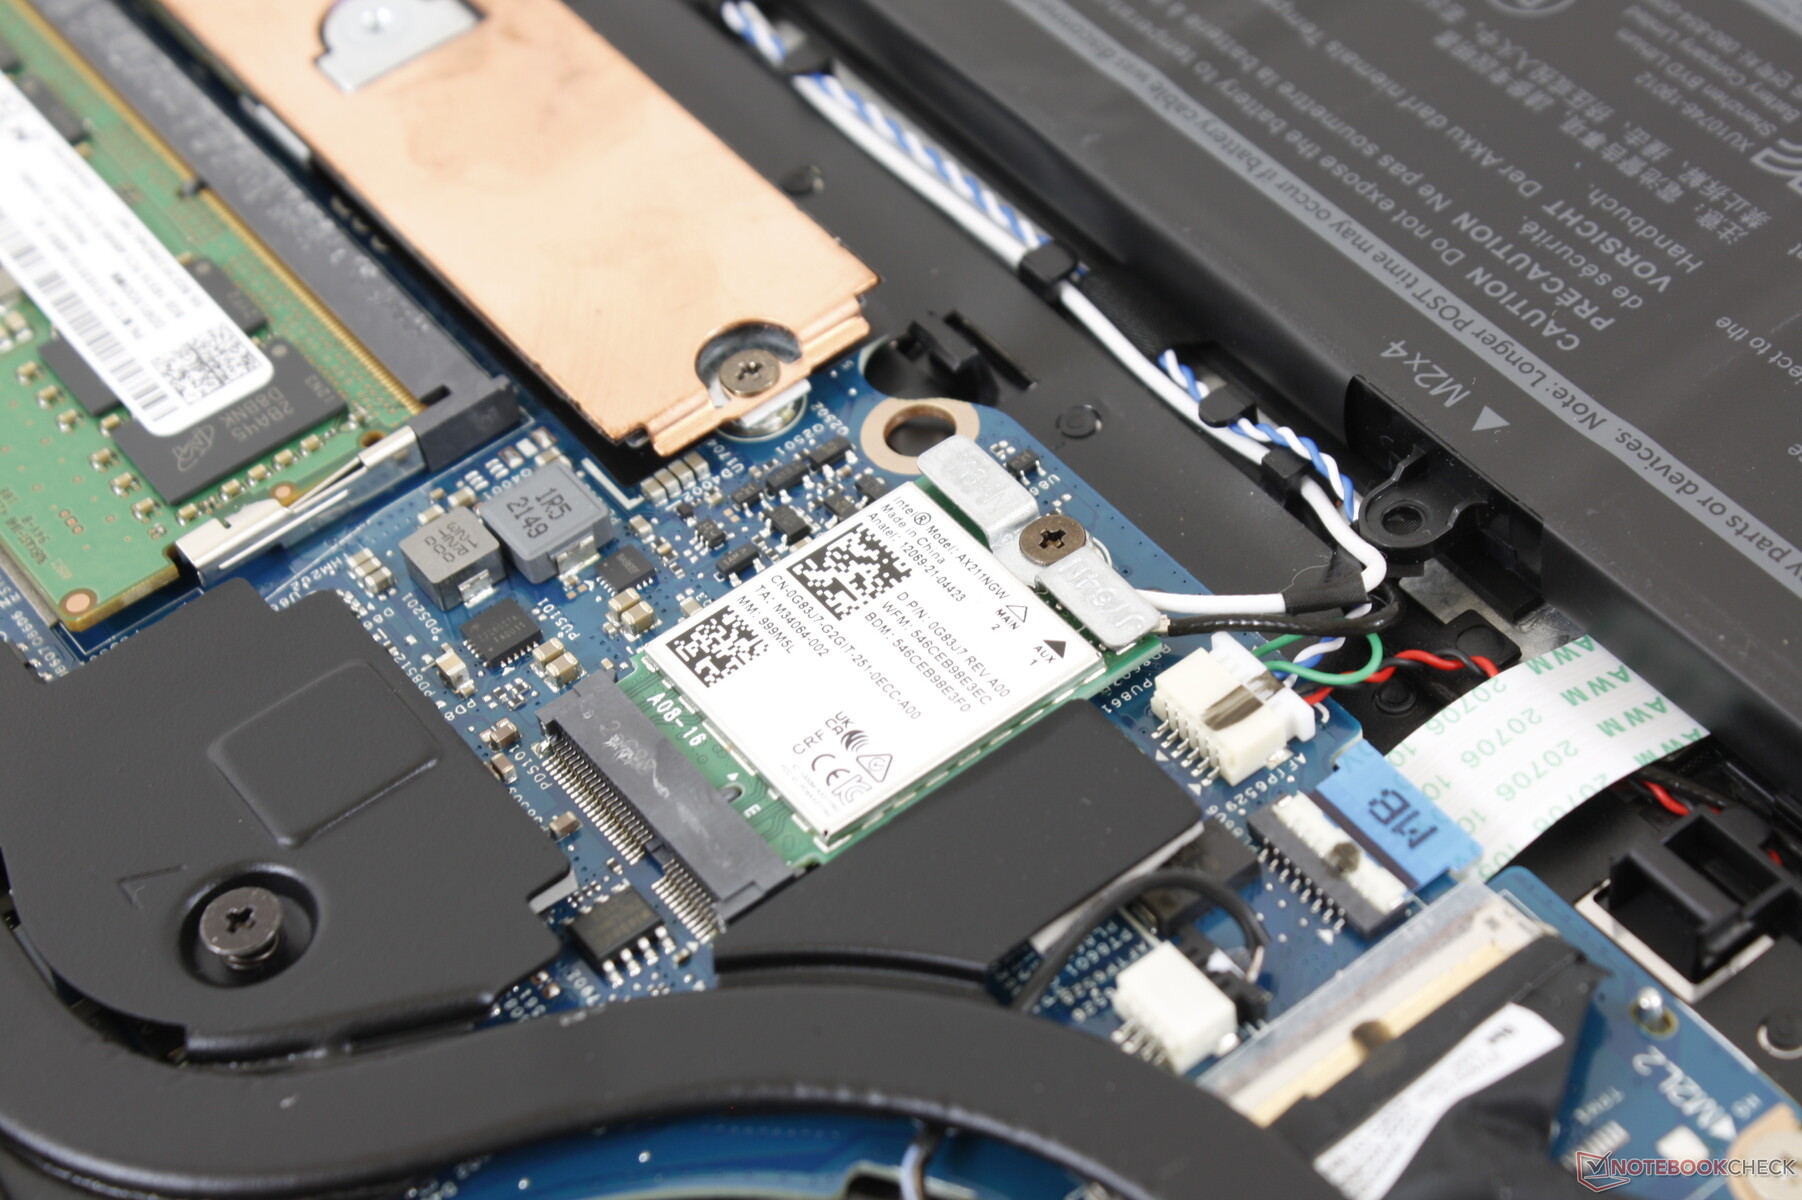
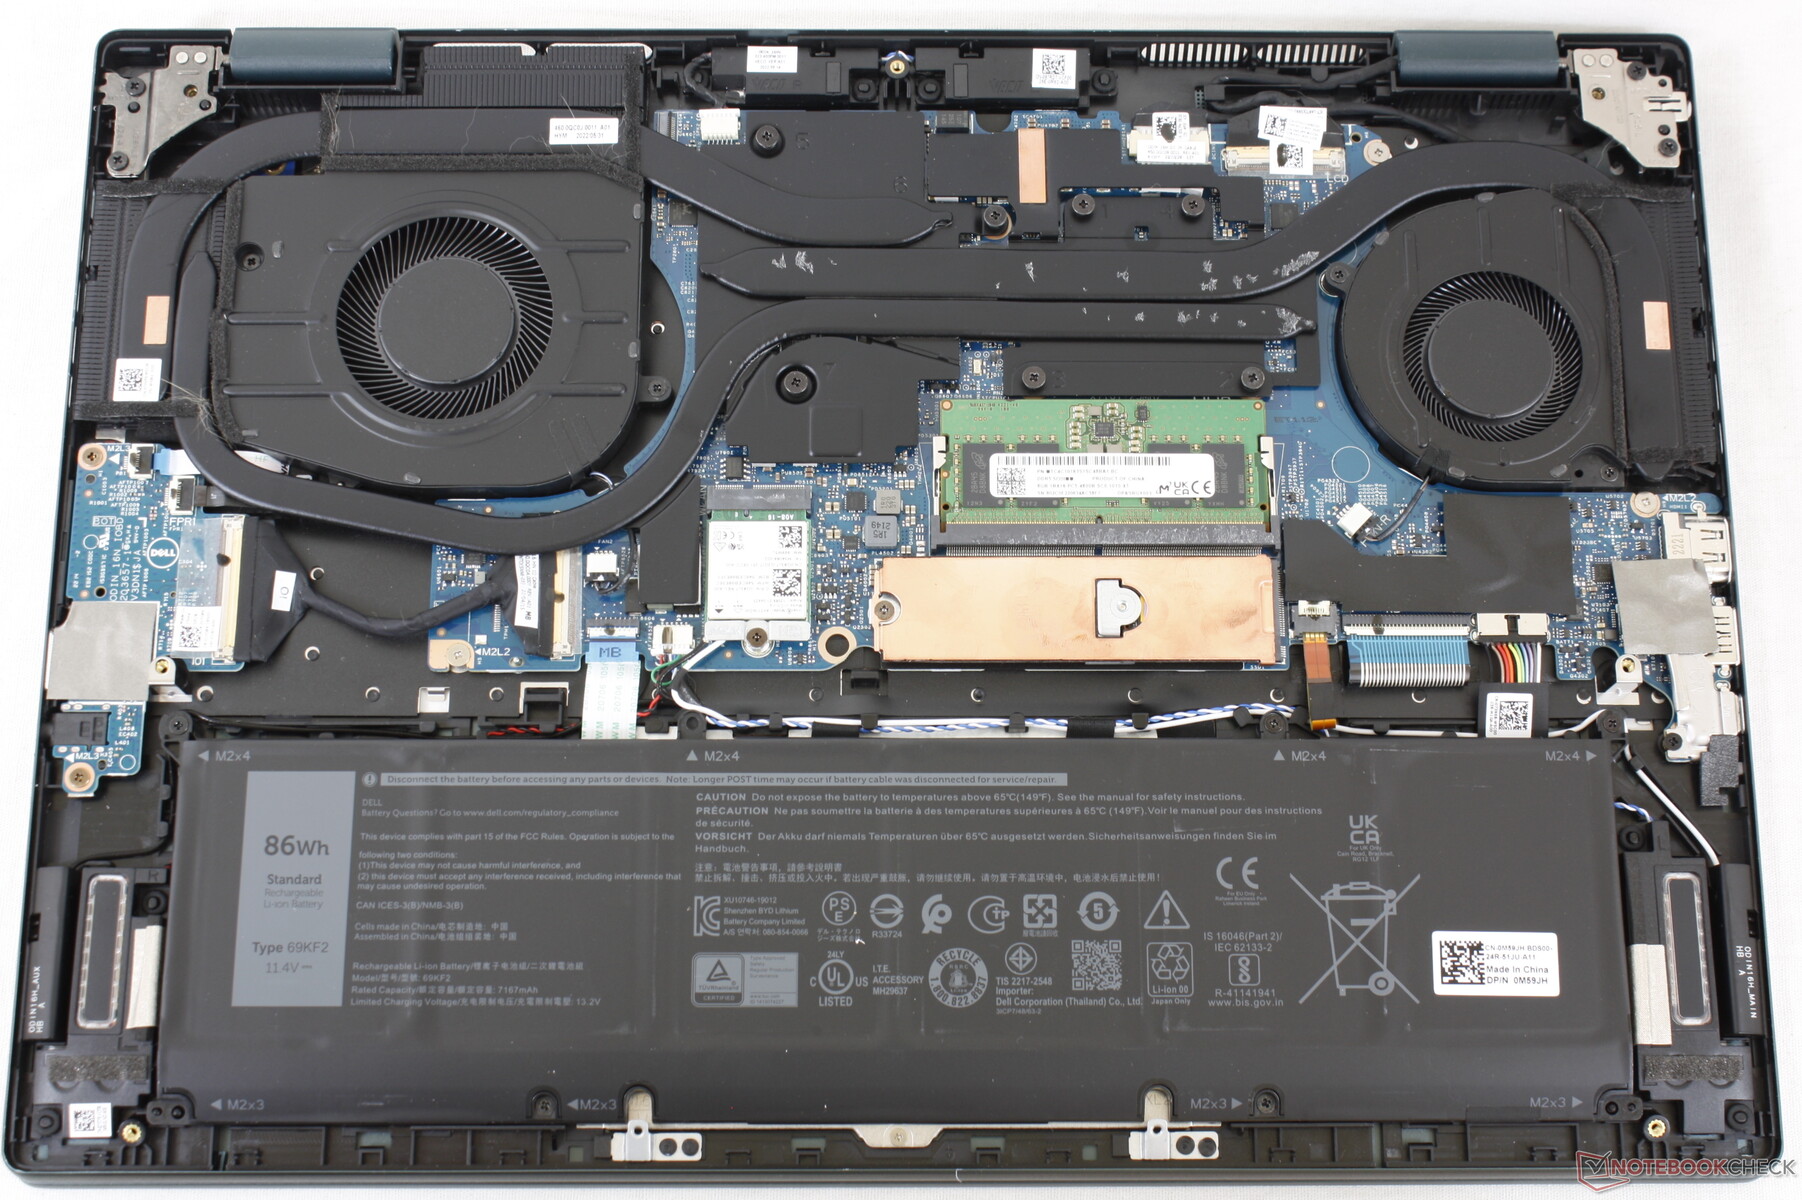
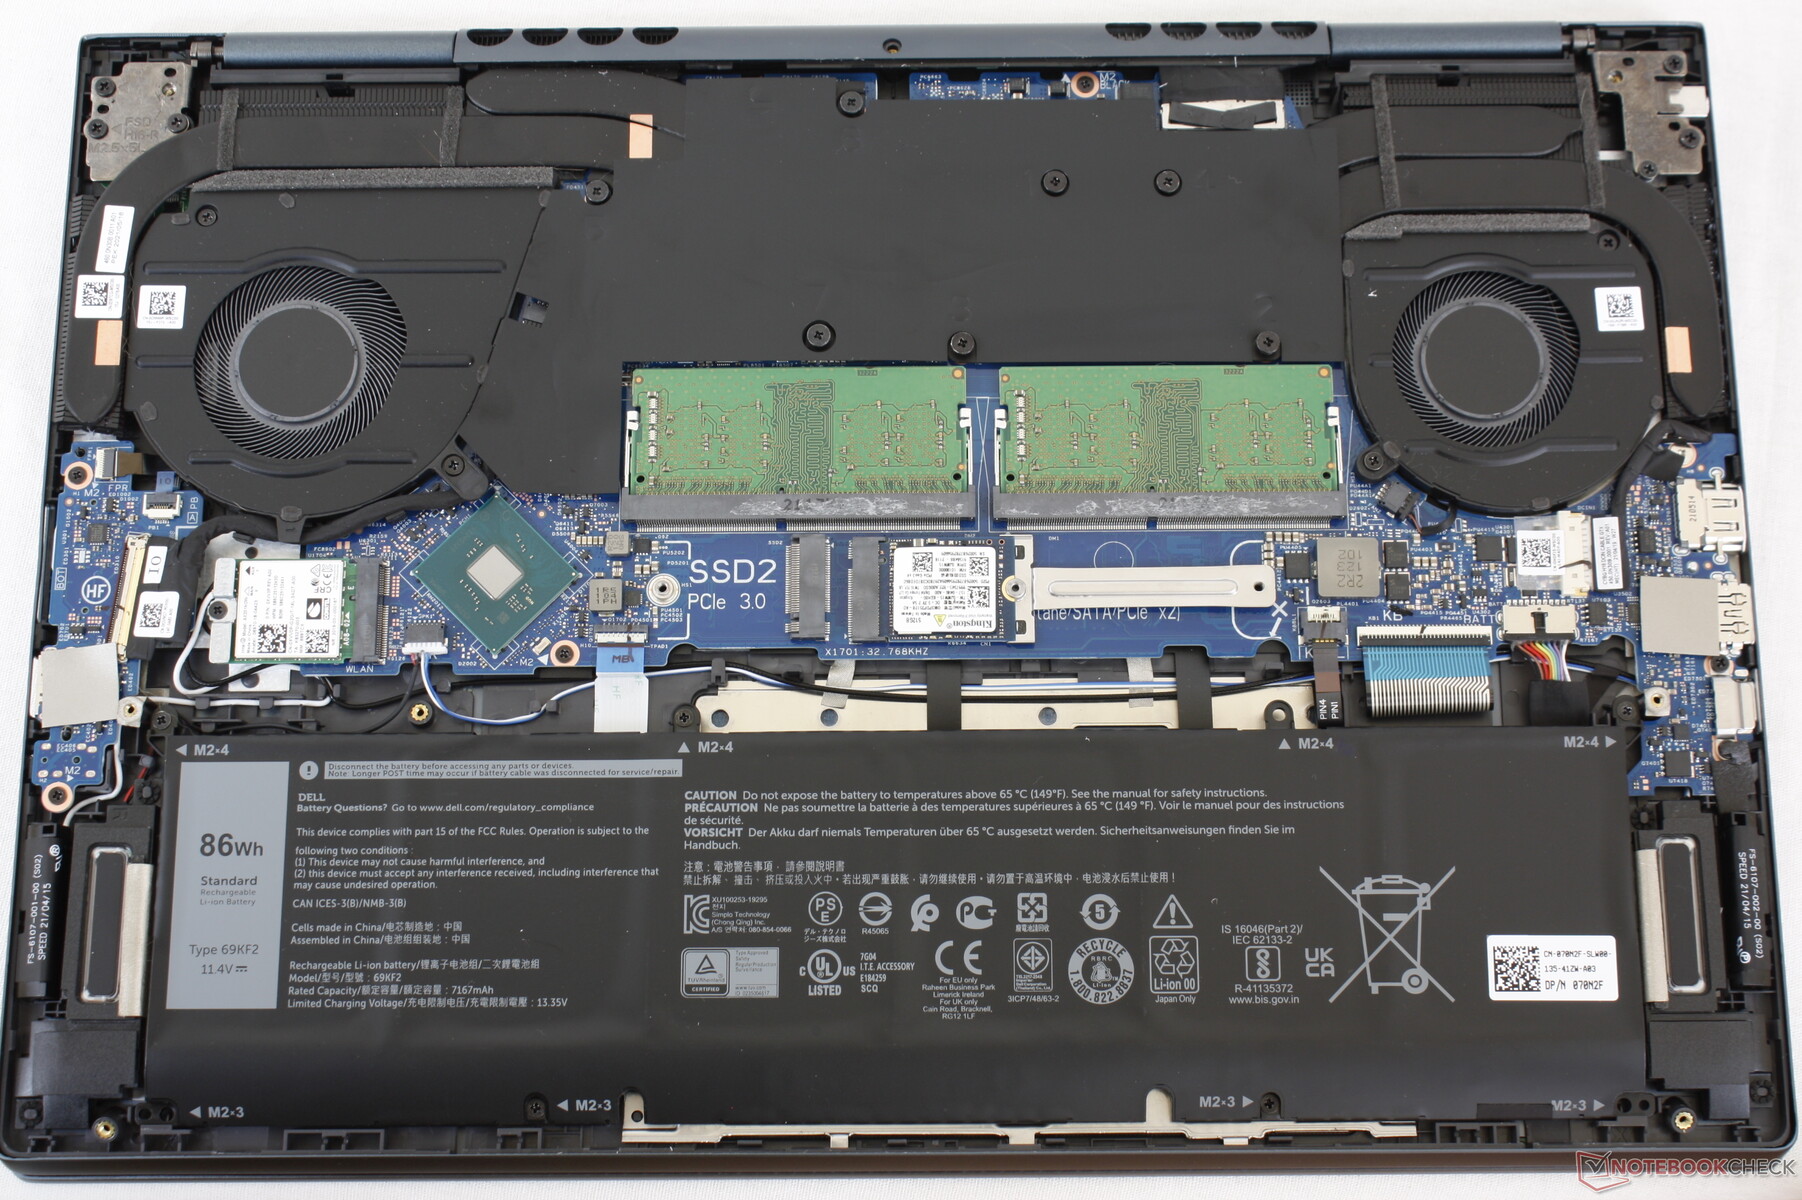
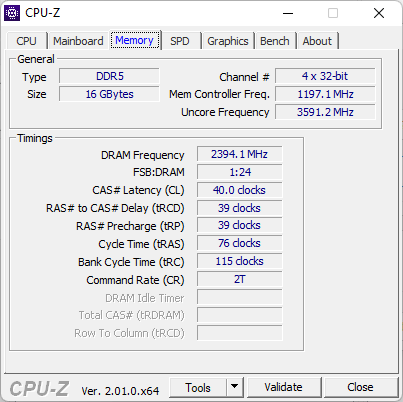
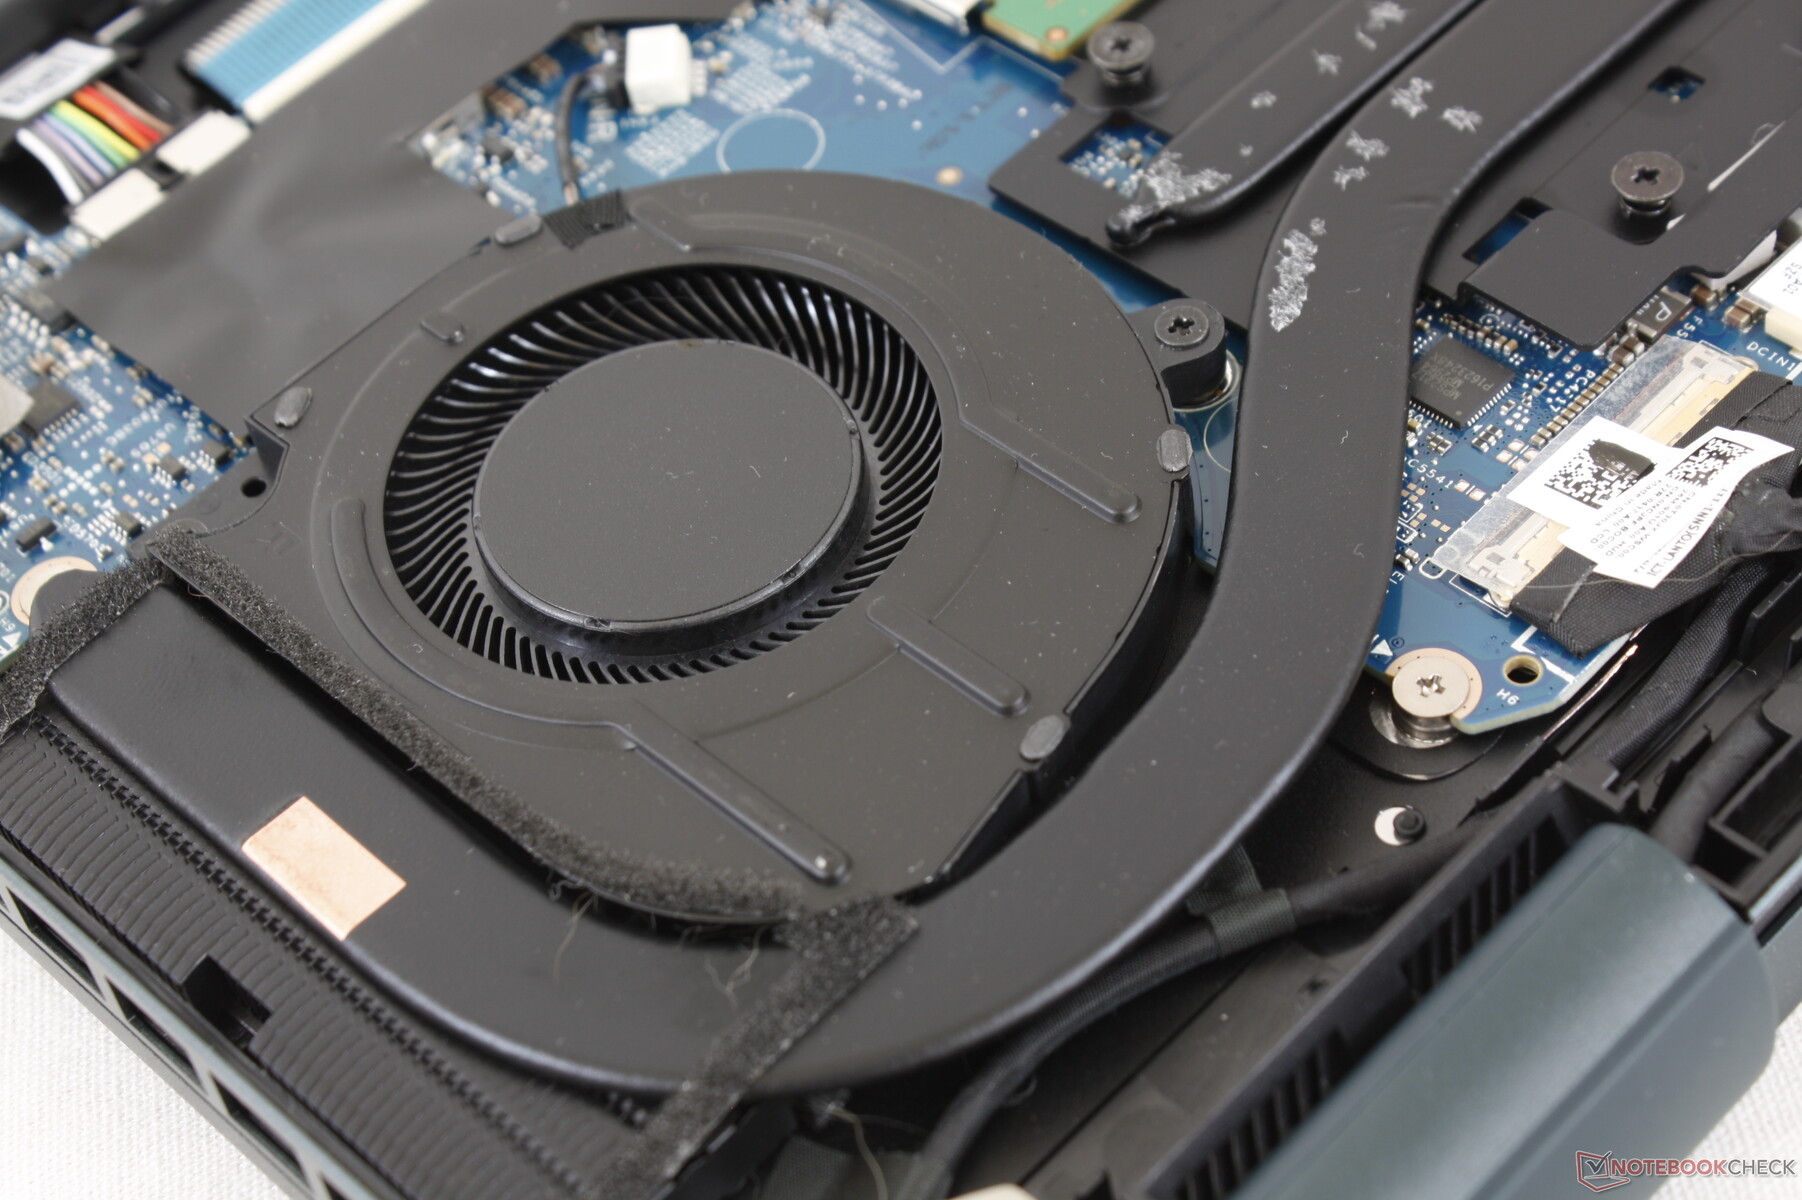
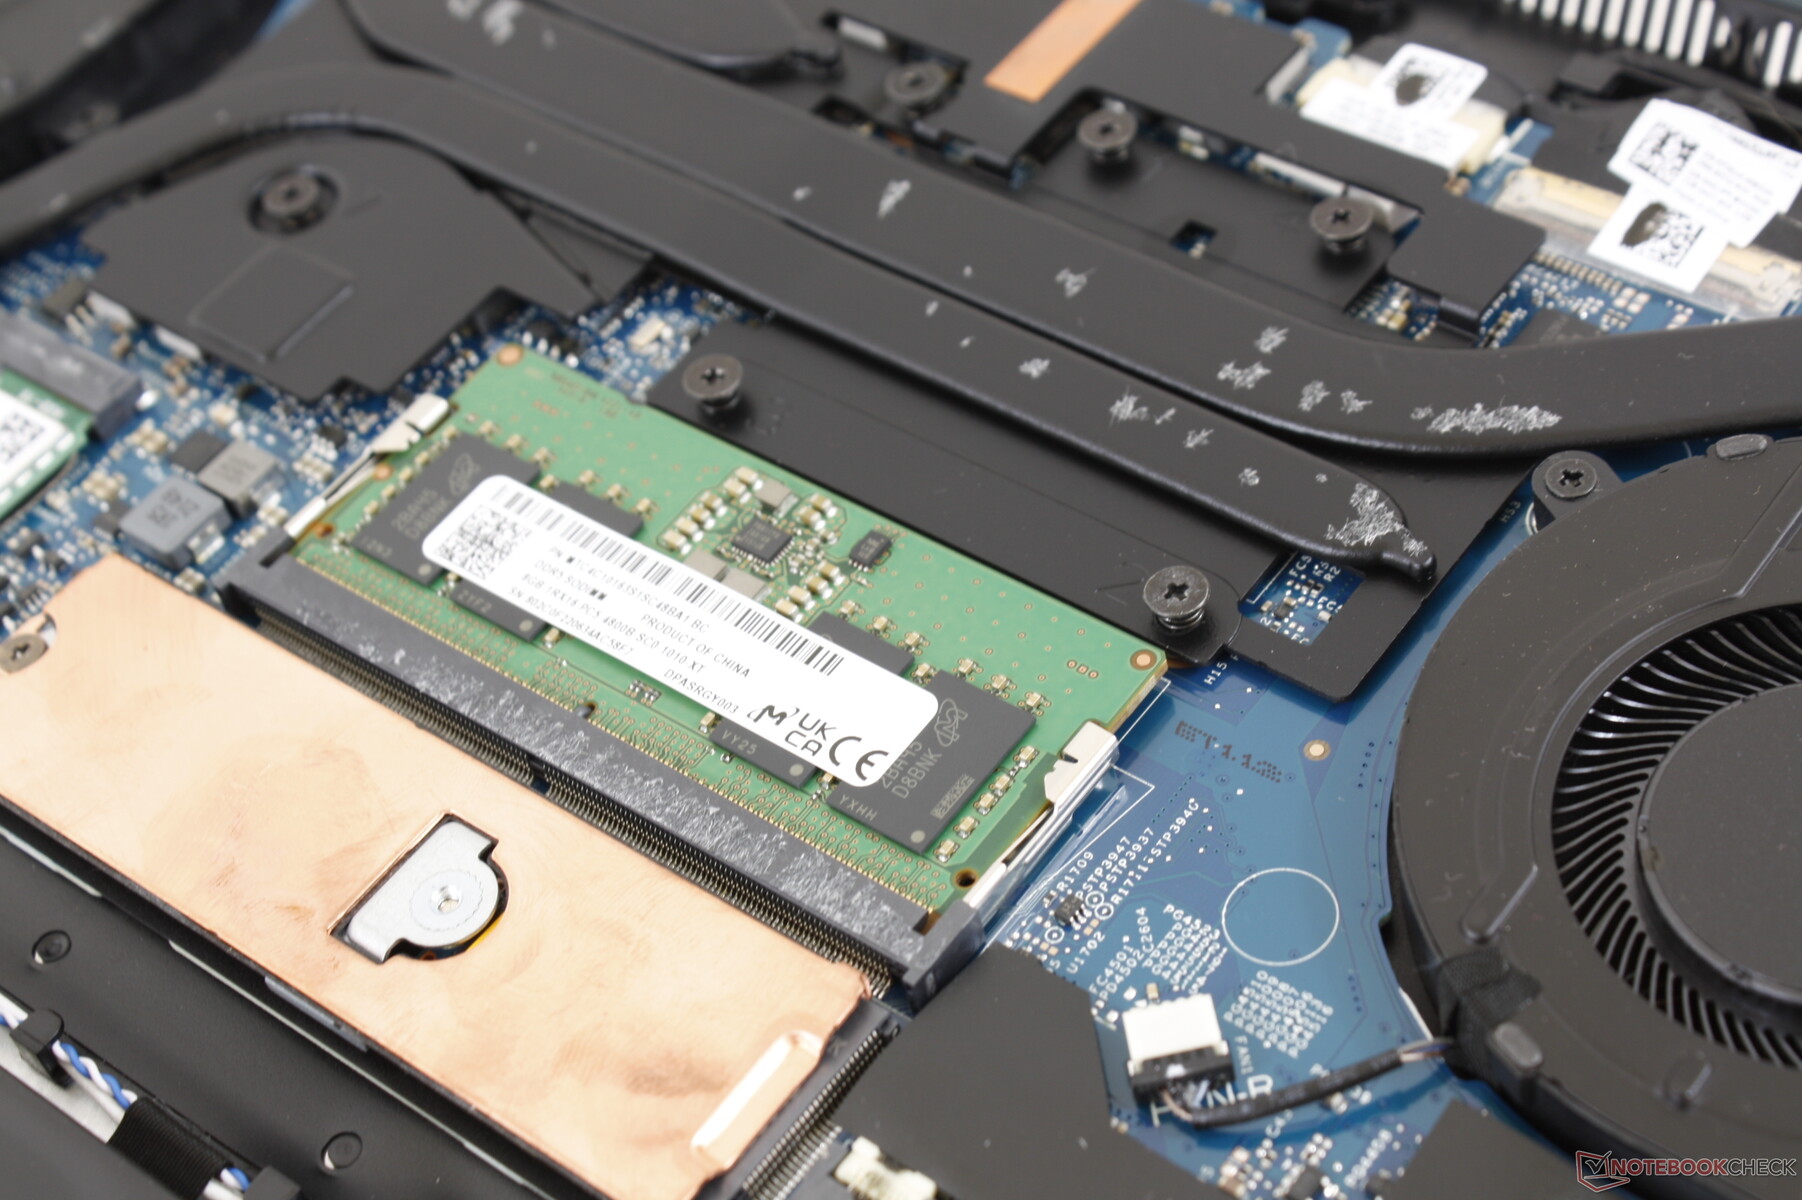
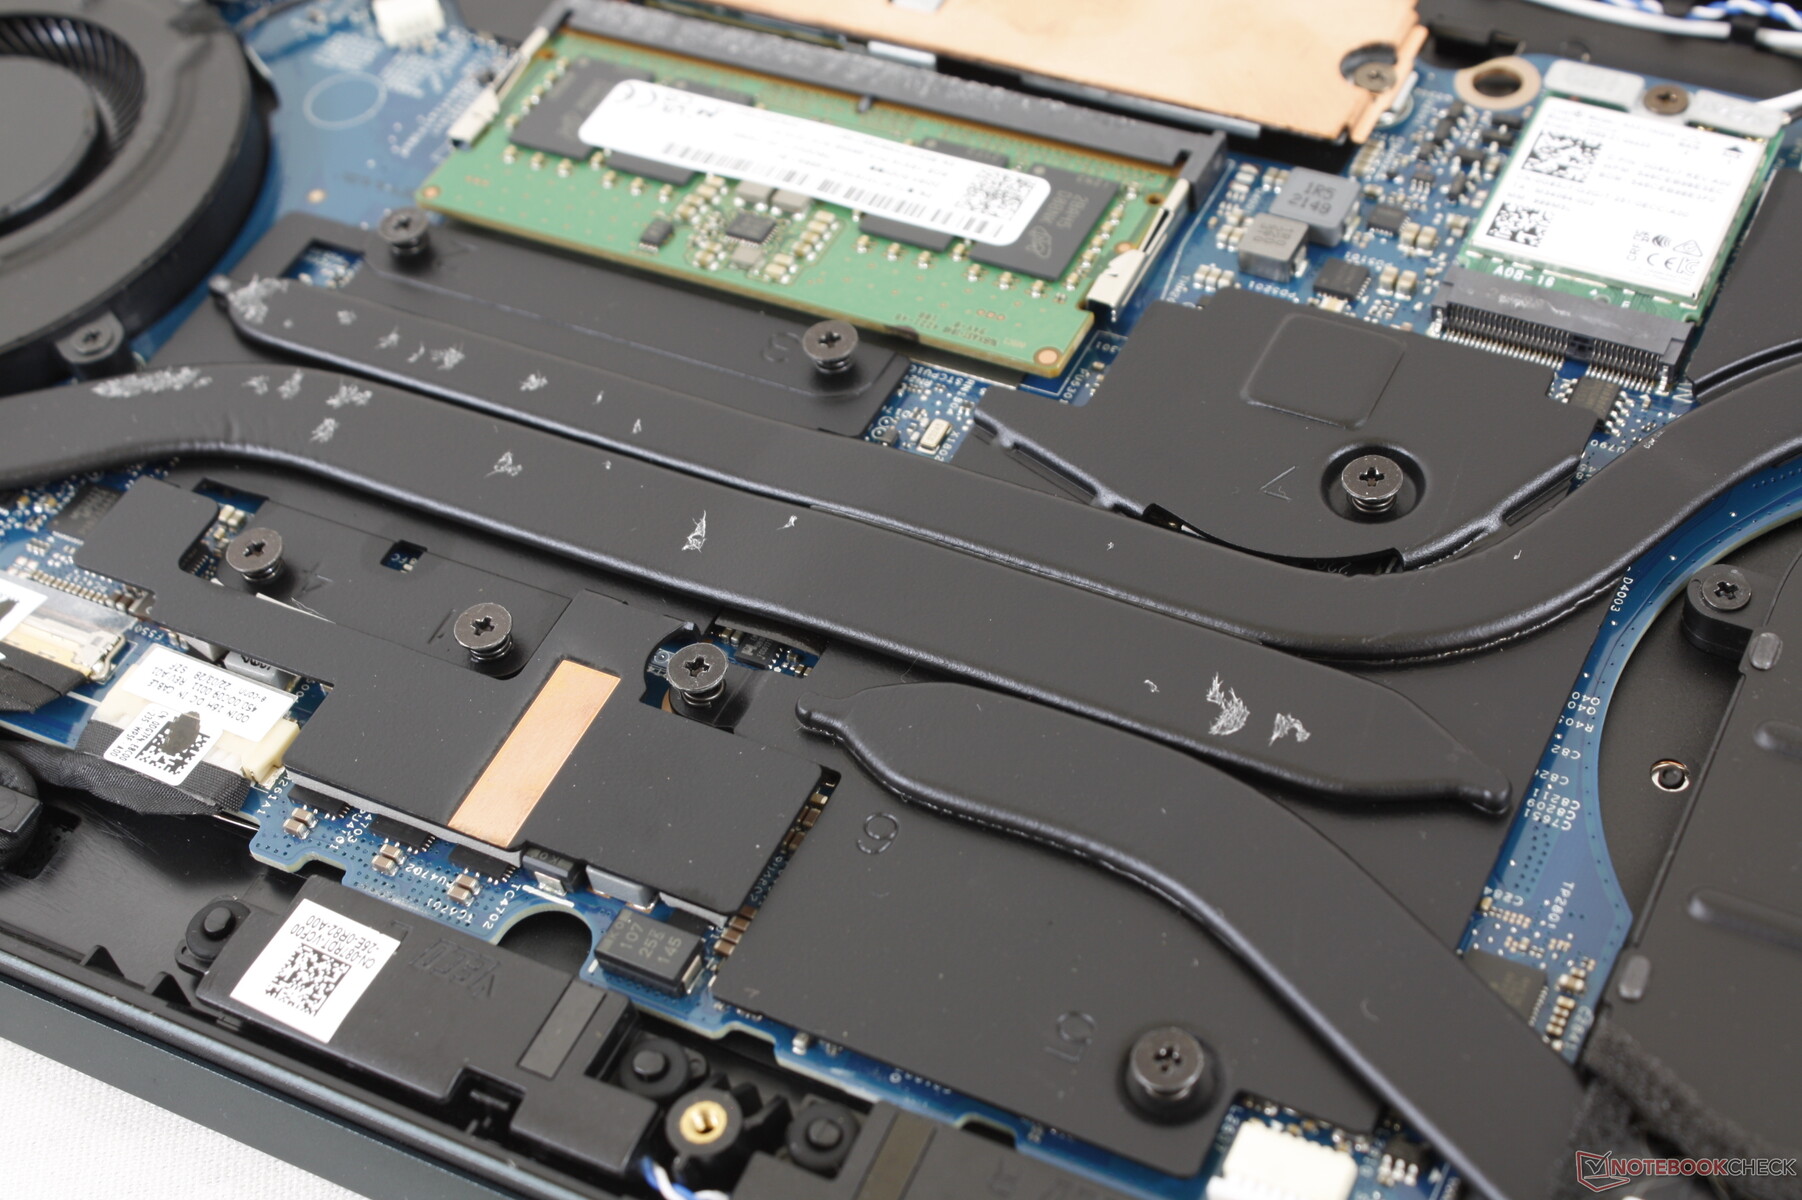
Het bodempaneel kan gemakkelijk worden verwijderd met slechts een Philips schroevendraaier. Eenmaal binnen zullen gebruikers de herziene koeloplossing opmerken in vergelijking met de oudere 7610. De wijzigingen hebben in feite één SODIMM slot en één M.2 SSD slot verwijderd uit de 7620, waardoor er slechts één SSD slot en één SODIMM slot overblijft om mee te werken, zoals te zien is op onze afbeeldingen hieronder. Nog verwarrender is dat gebruikers die kiezen voor de RTX 3060 SKU 2x SODIMM slots zullen hebben.
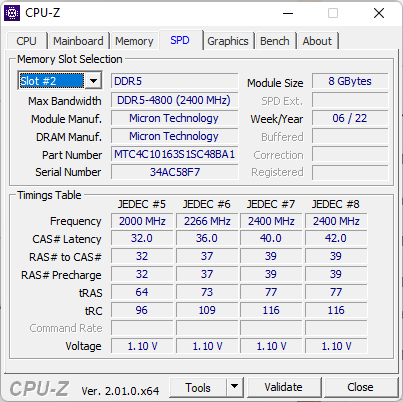
8 GB RAM wordt gesoldeerd geleverd op ons bord voor een maximum van 40 GB indien geconfigureerd met een verwijderbare 32 GB DDR5 RAM-module. RTX 3060 SKU's kunnen worden geconfigureerd met maximaal 64 GB, aangezien ze 2x SODIMM slots hebben en geen gesoldeerd RAM.
Accessoires en garantie
Er zitten geen extra's in de doos, behalve de wisselstroomadapter en de papieren. De standaard beperkte garantie van één jaar is van toepassing indien gekocht in de VS.
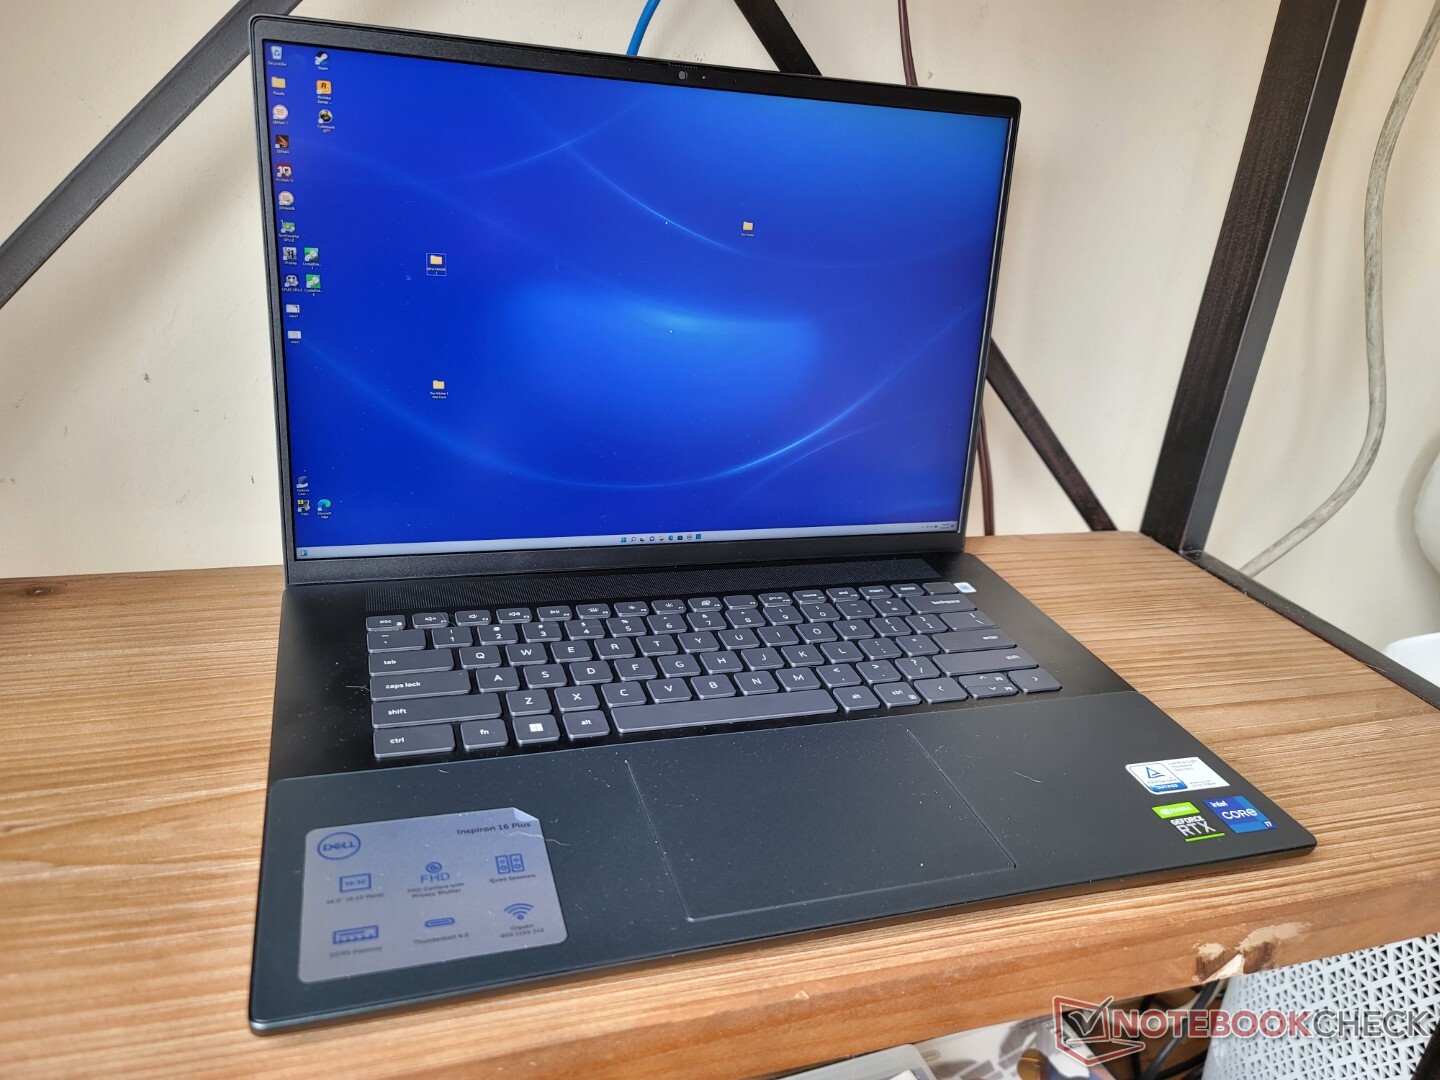
Invoerapparaten - hetzelfde als de Inspiron 16 Plus 7620 2-in-1
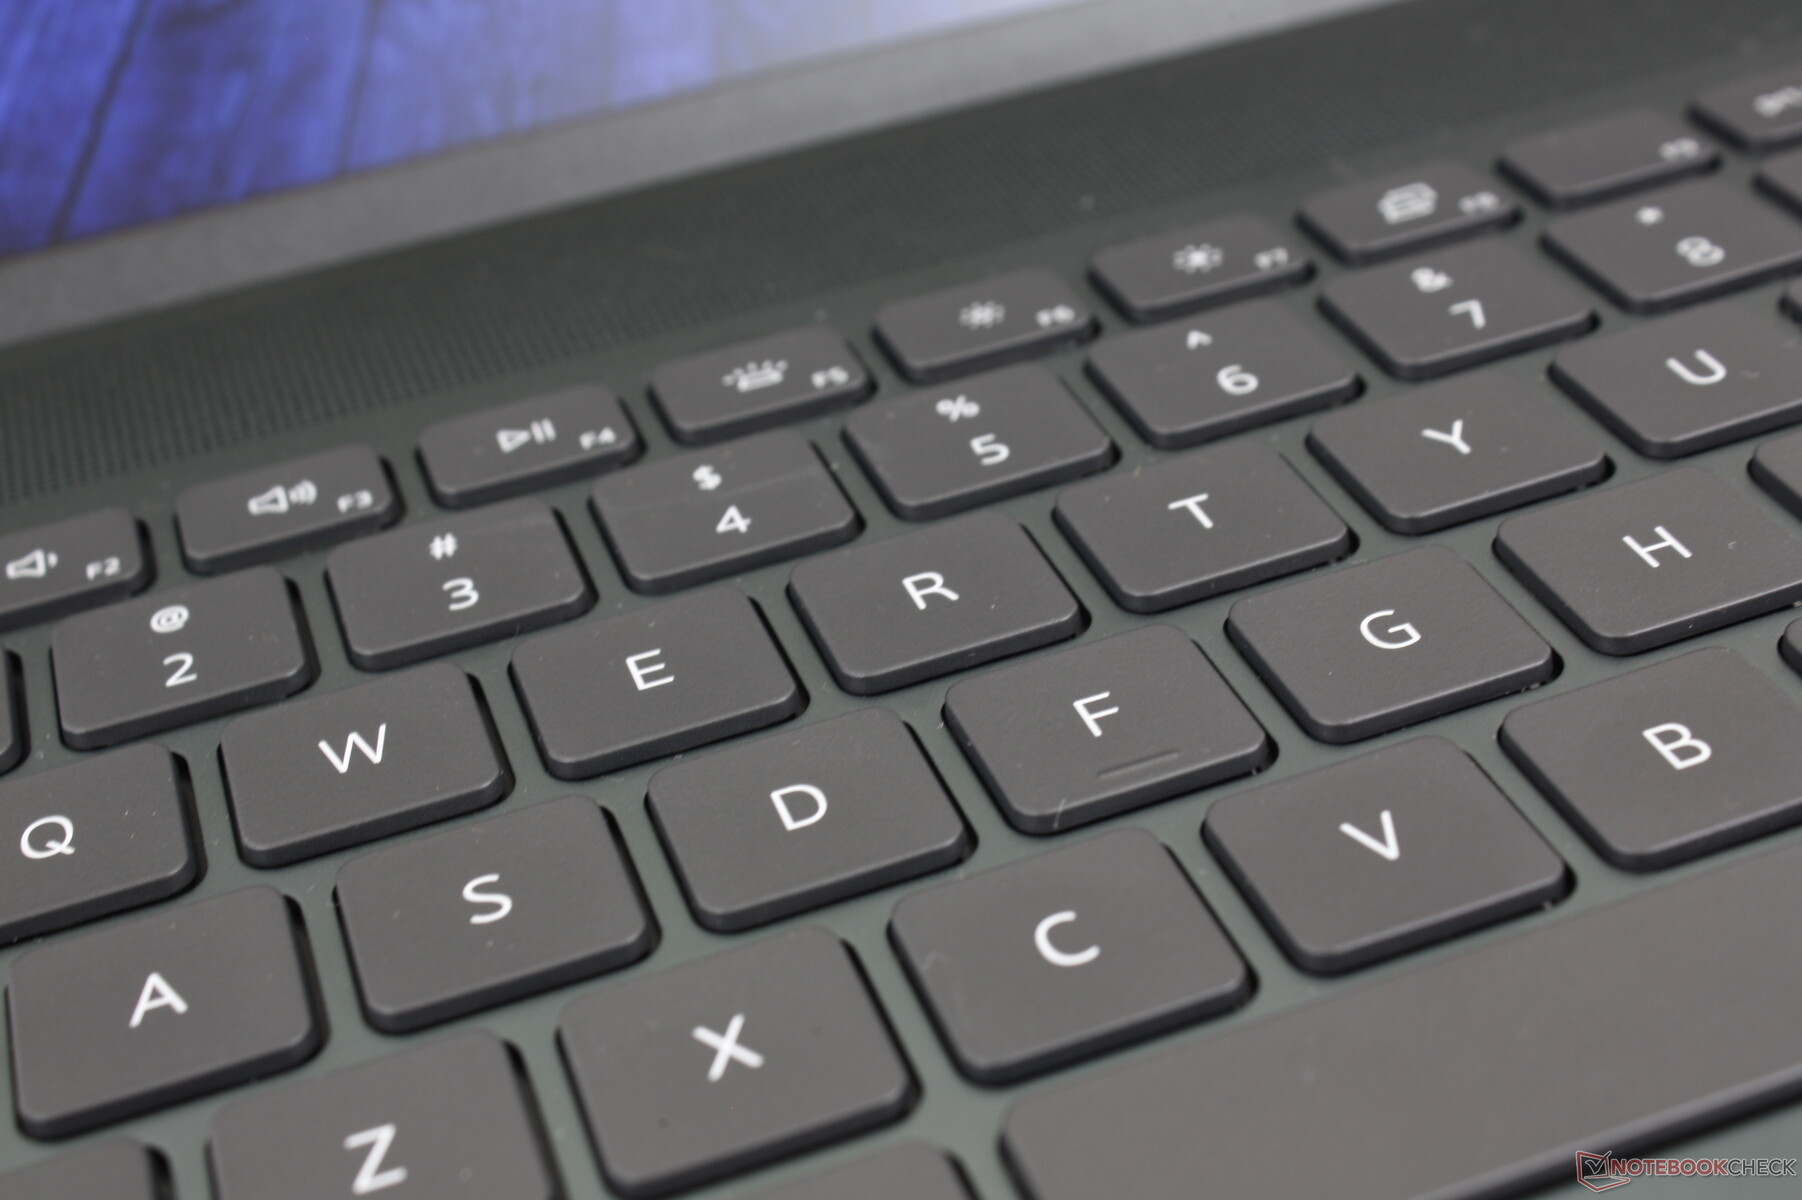
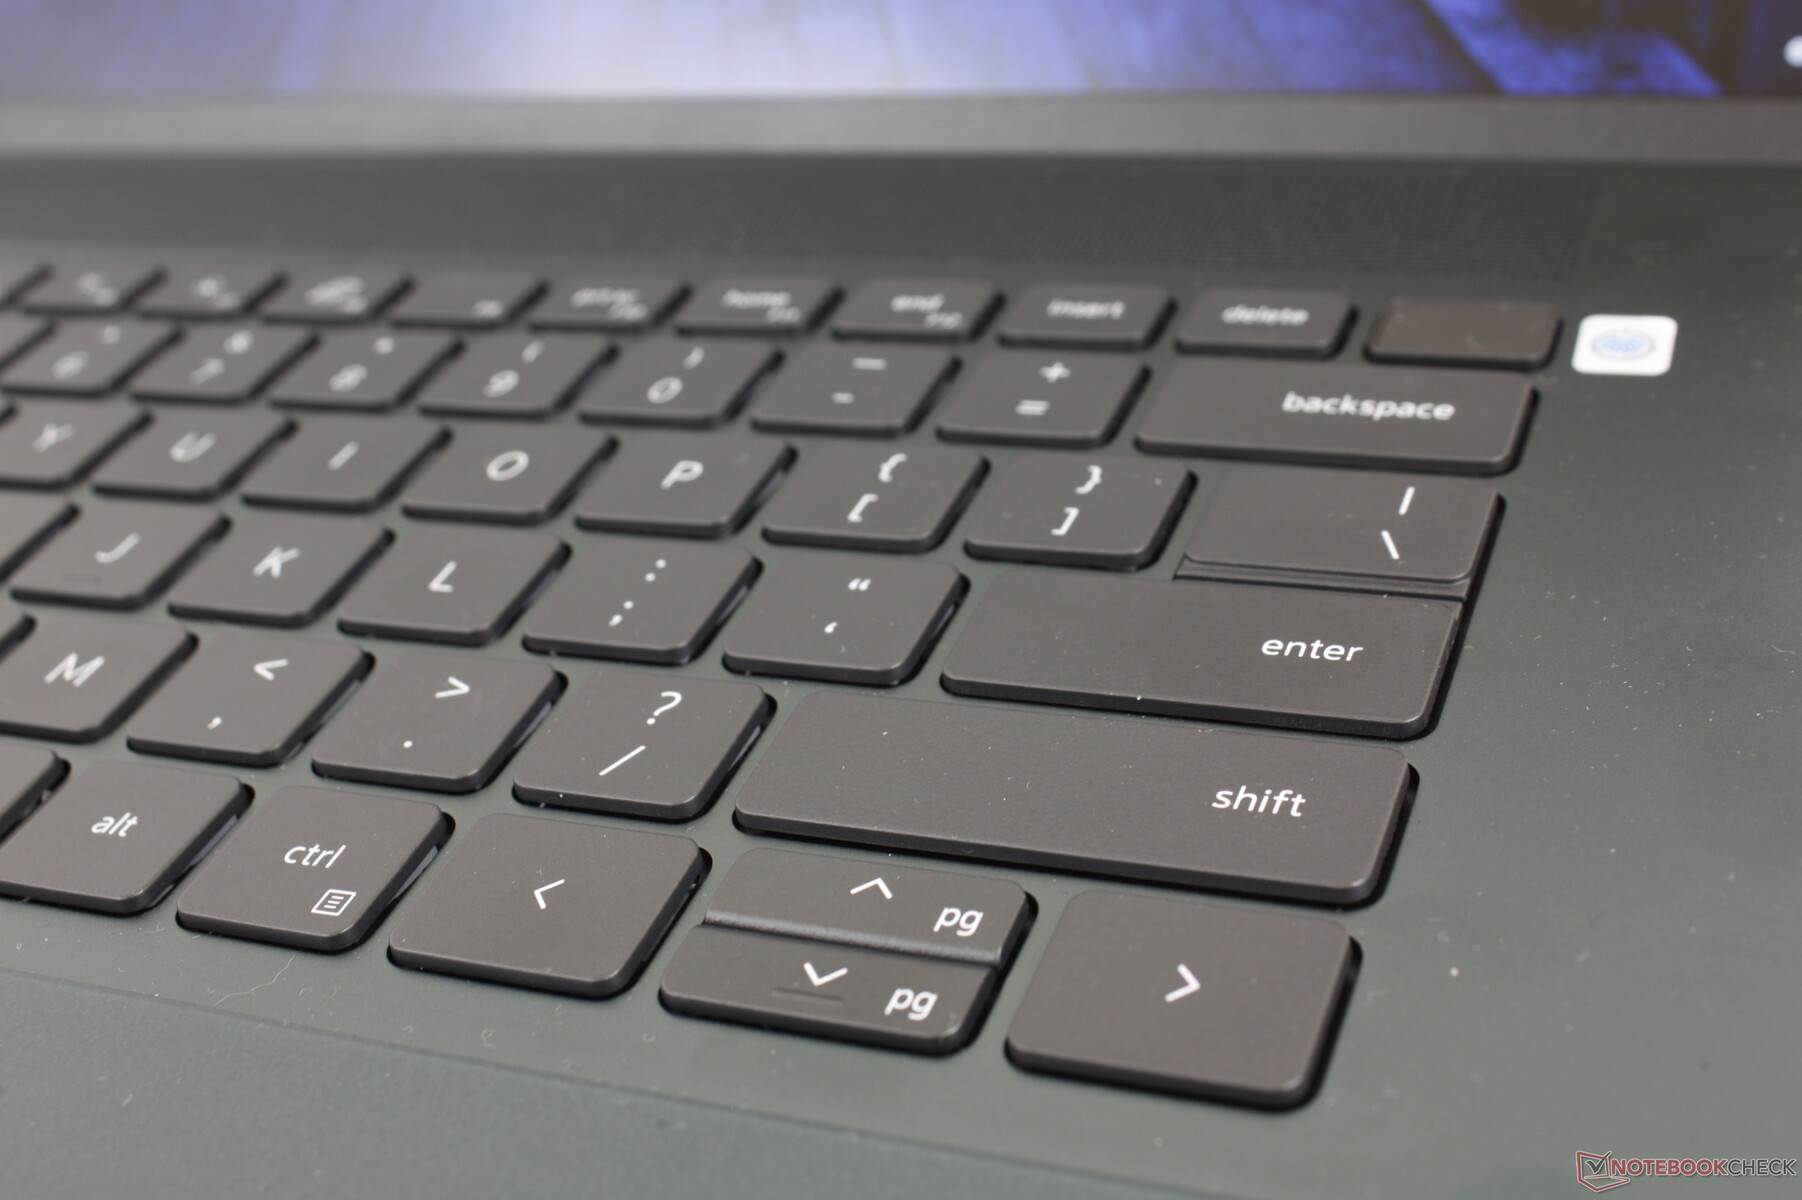
Toetsenbord
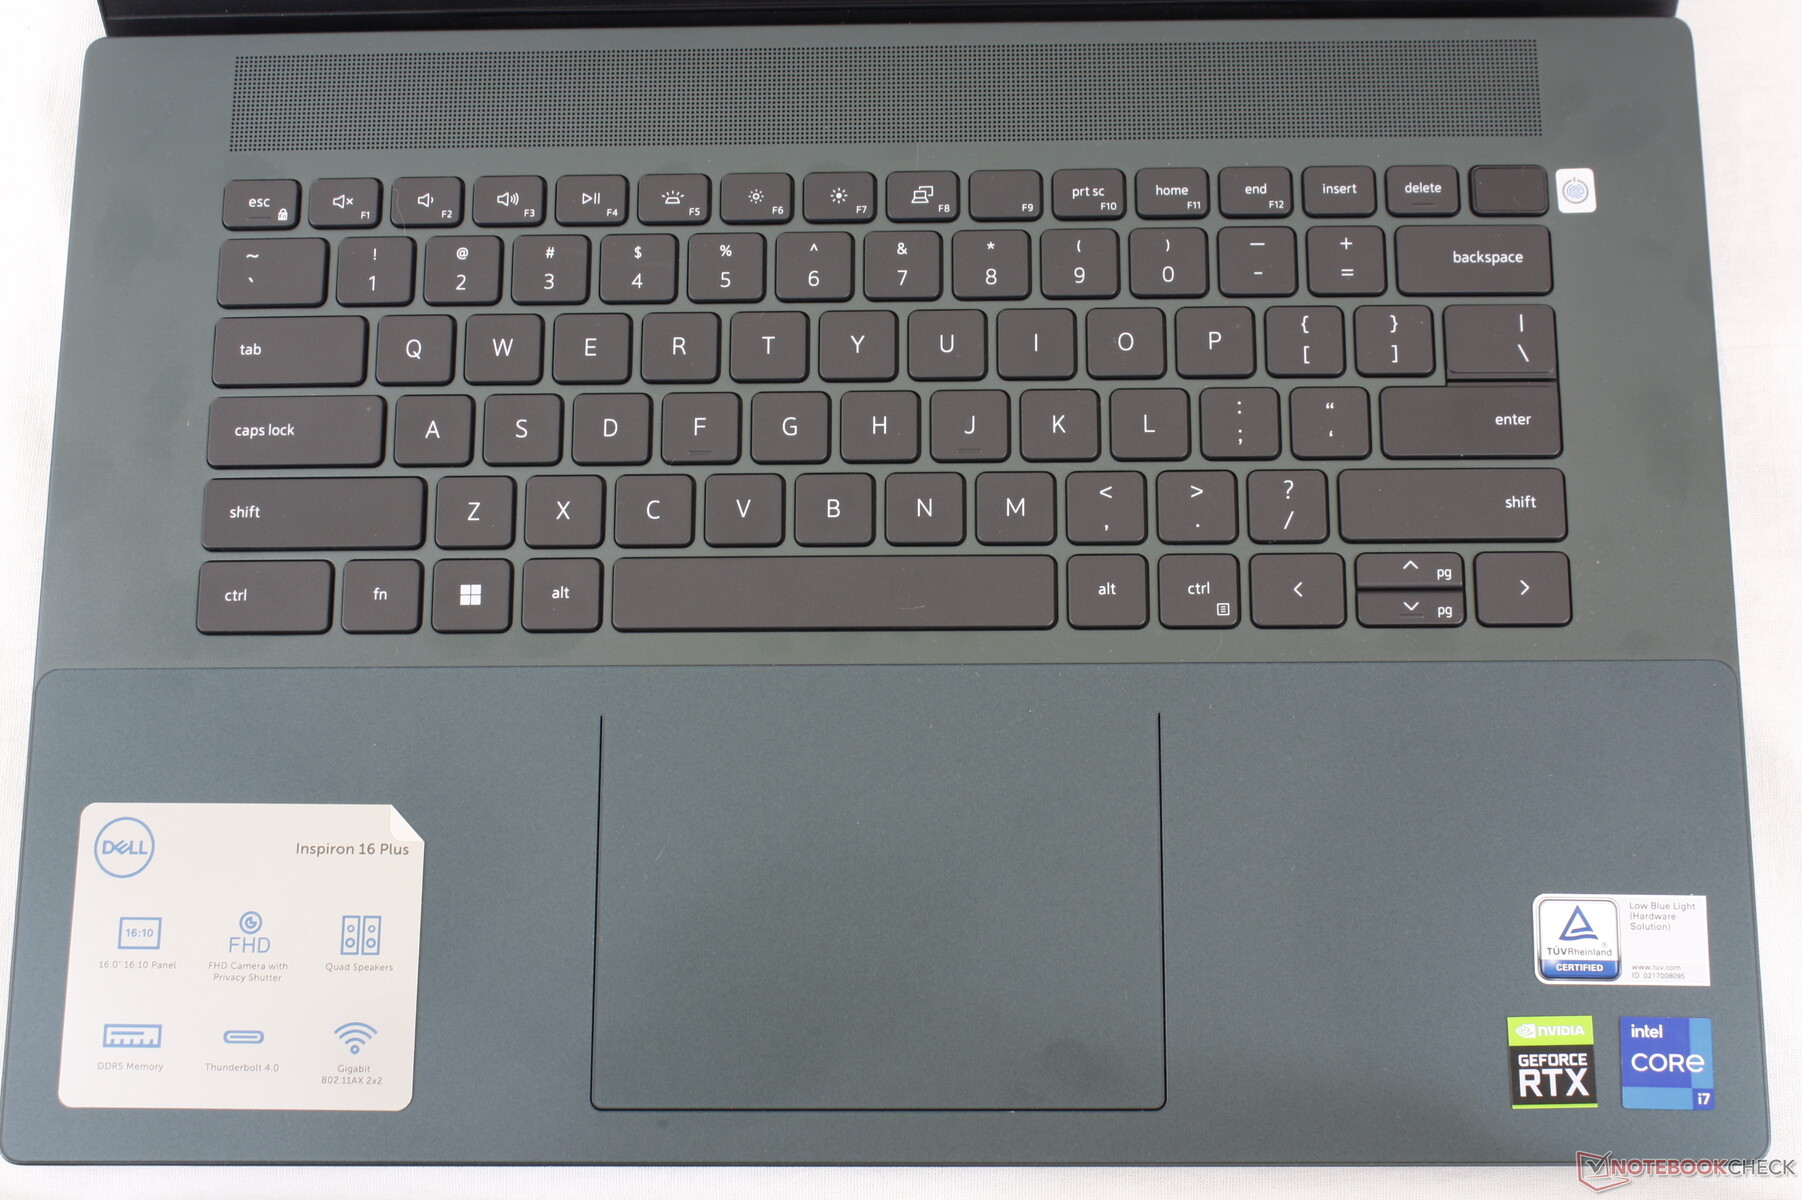
Dell heeft het toetsenbord dit jaar vernieuwd door het numpad weg te laten. De type-ervaring is verder vergelijkbaar met deInspiron 16 Plus 7620 2-in-1 aangezien de toetsen nog steeds iets zachter zijn dan de toetsen op de LG Gram 16 of HP Spectre serie.
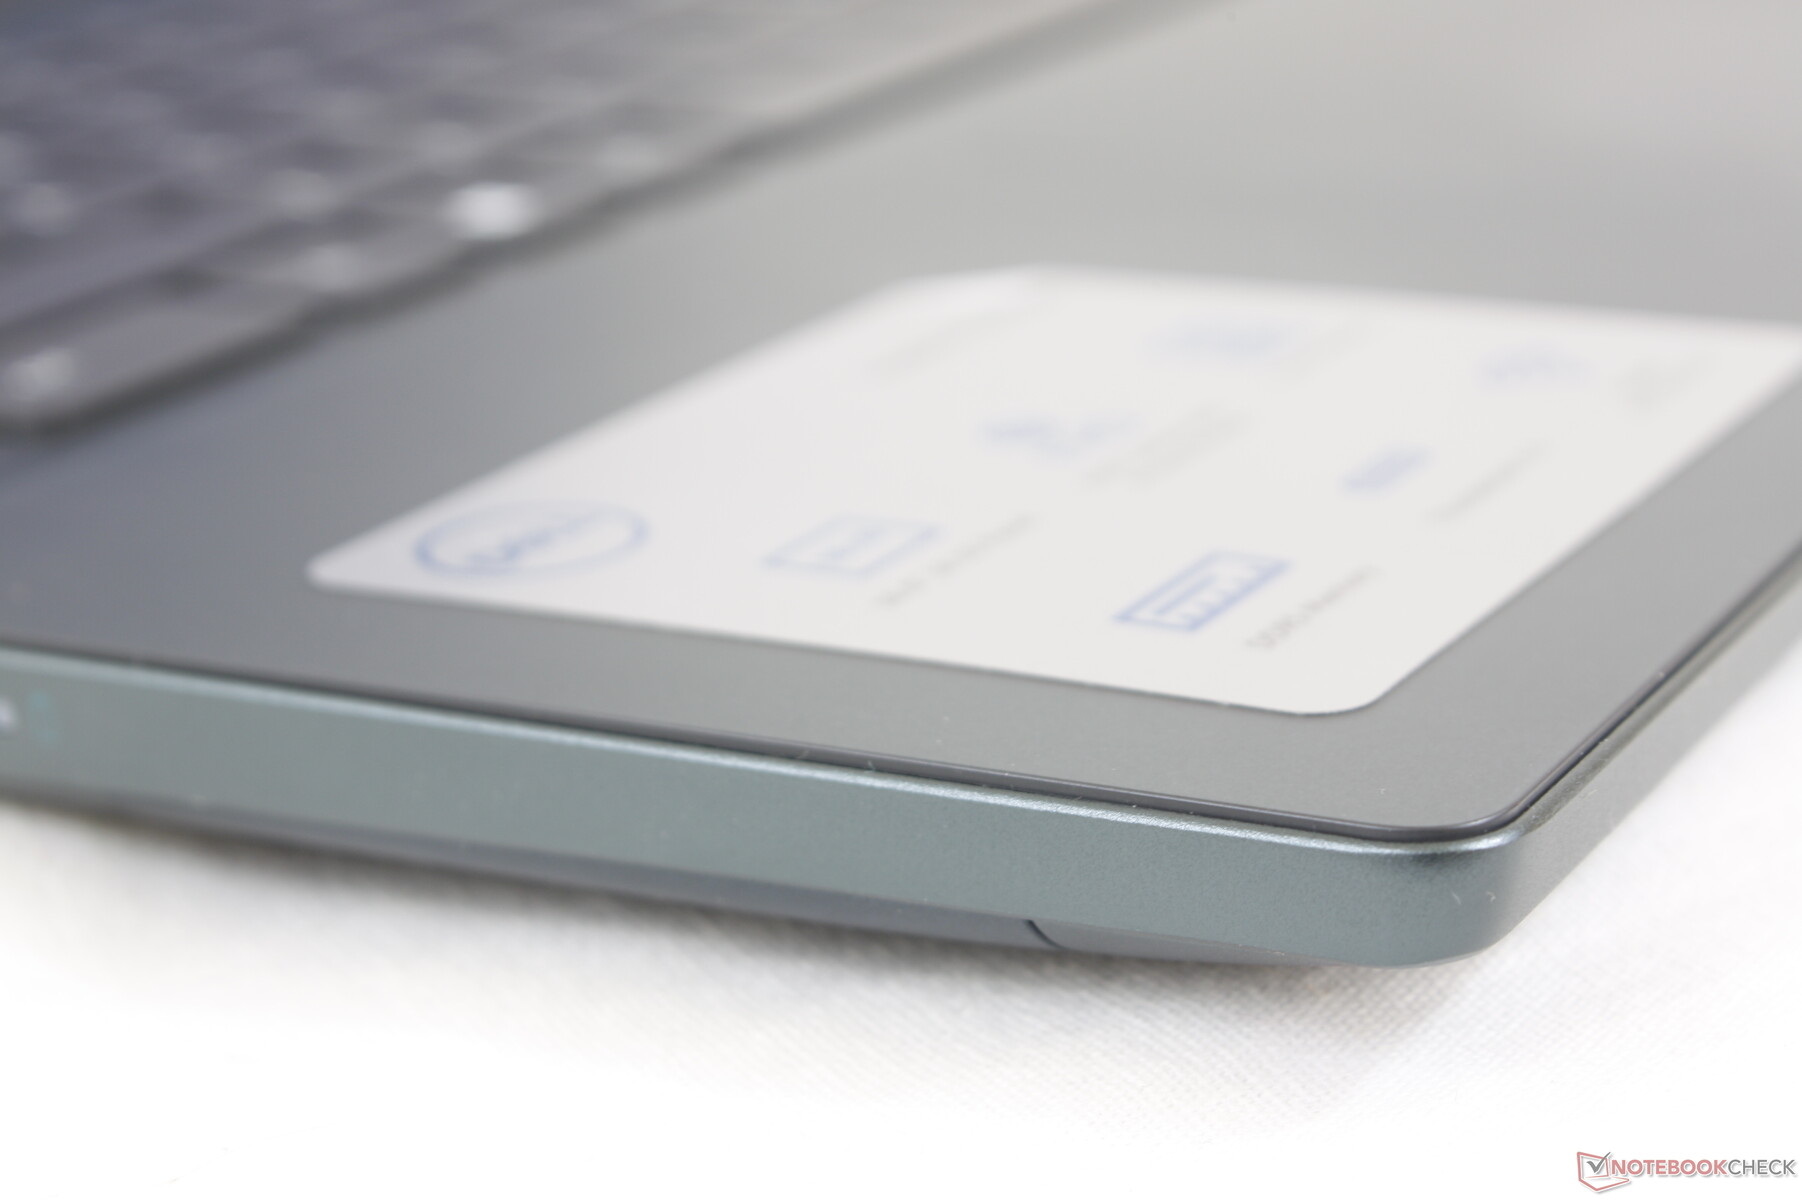
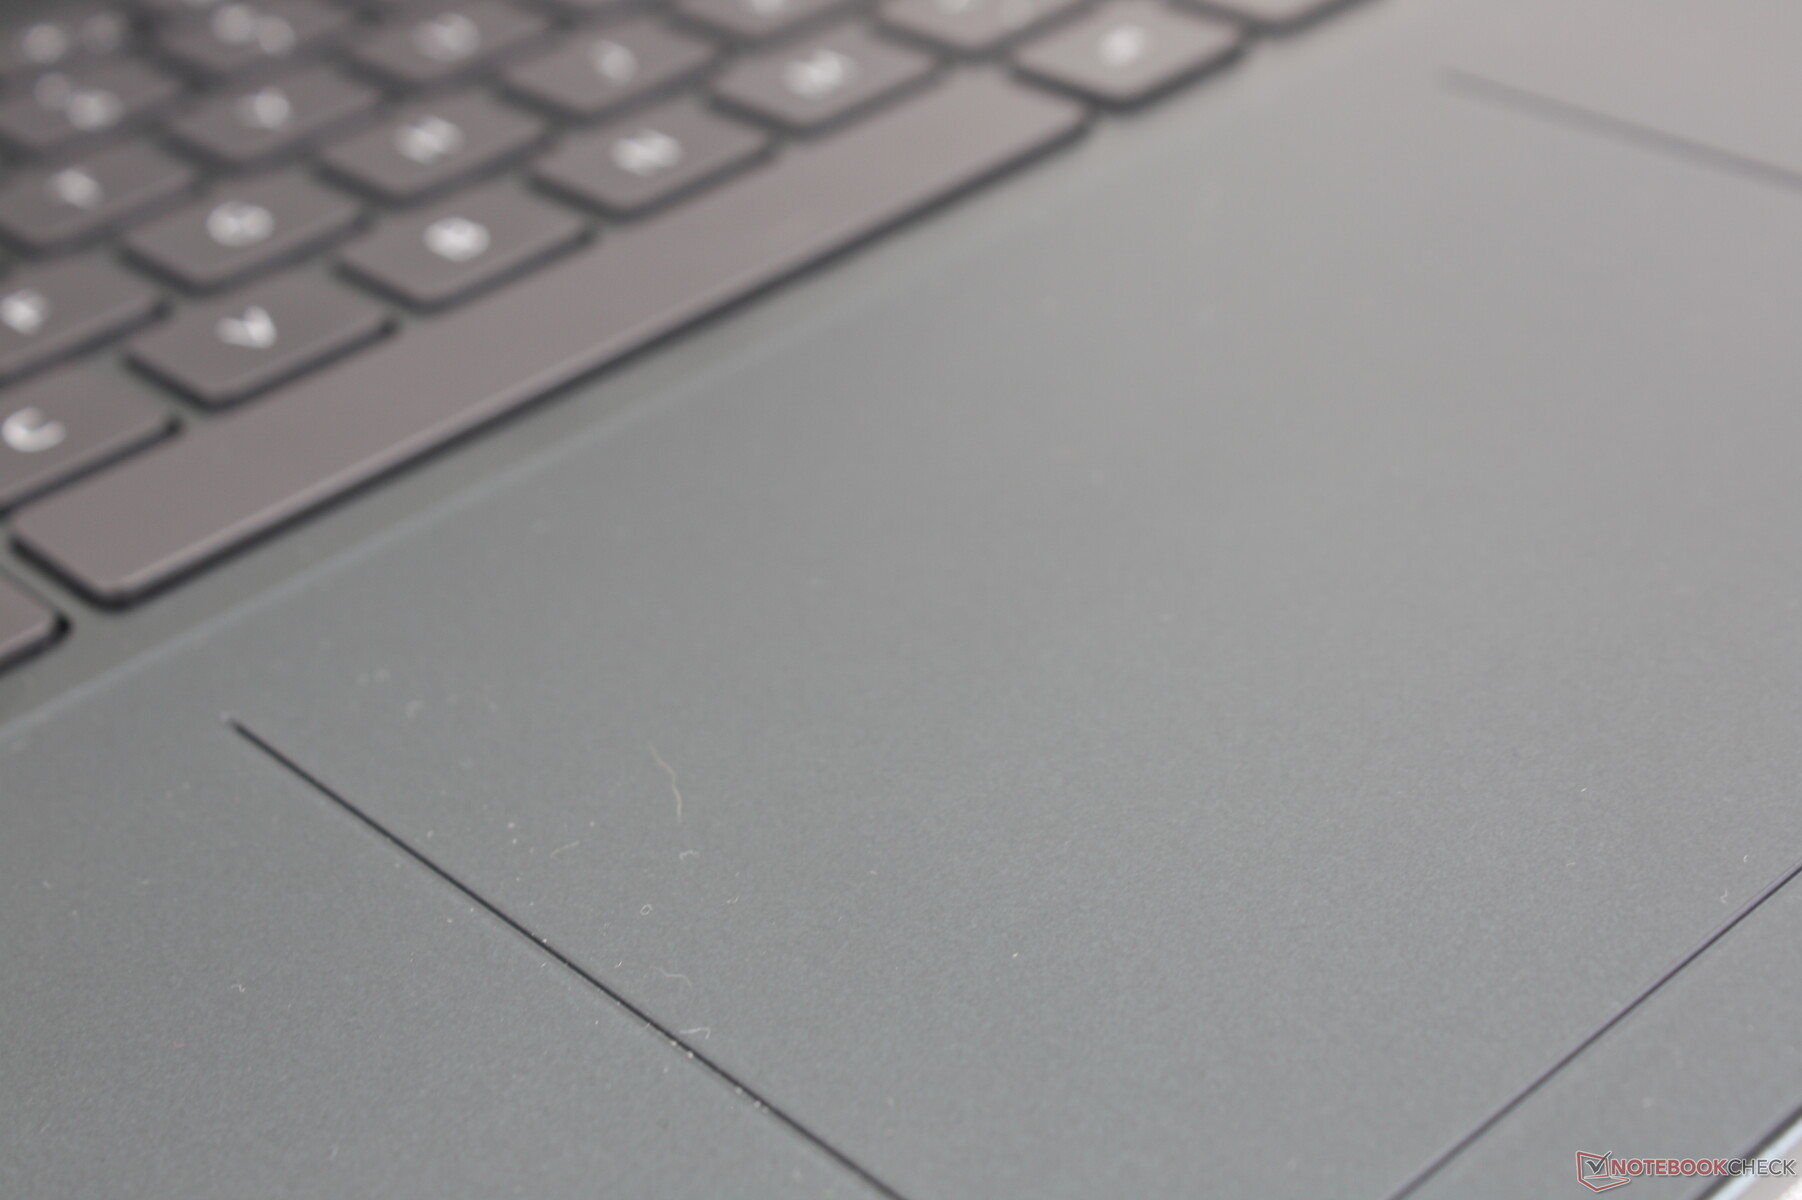
Touchpad
Het clickpad op ons 2022-model is kleiner dan het clickpad op het 2021-model (11,5 x 8 cm vs. 13,5 x 9 cm) om op gelijke voet te staan met het clickpad op de Inspiron 16 7620 2-in-1. Het nieuwe Mylar-oppervlak werkt uitstekend voor cursorbesturing, omdat het glad is wanneer het snel glijdt, maar een beetje plakkerig wanneer het langzaam glijdt voor nauwkeurigere klikken. Klikken op het clickpad is echter nog steeds zachter en sponziger dan we zouden willen.
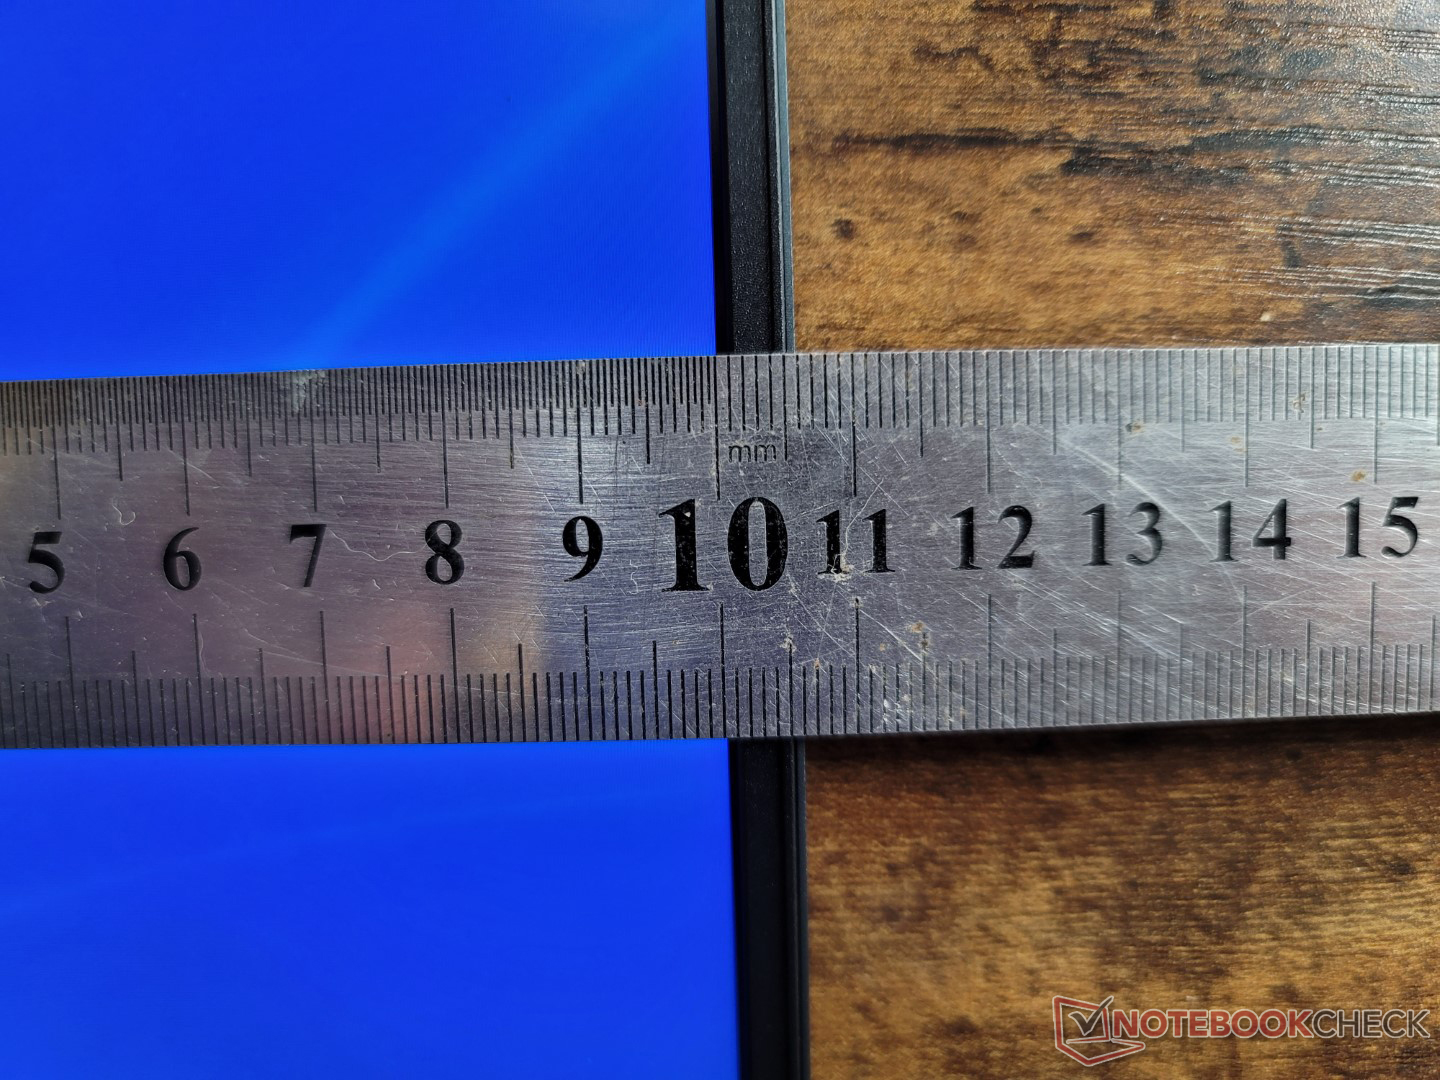
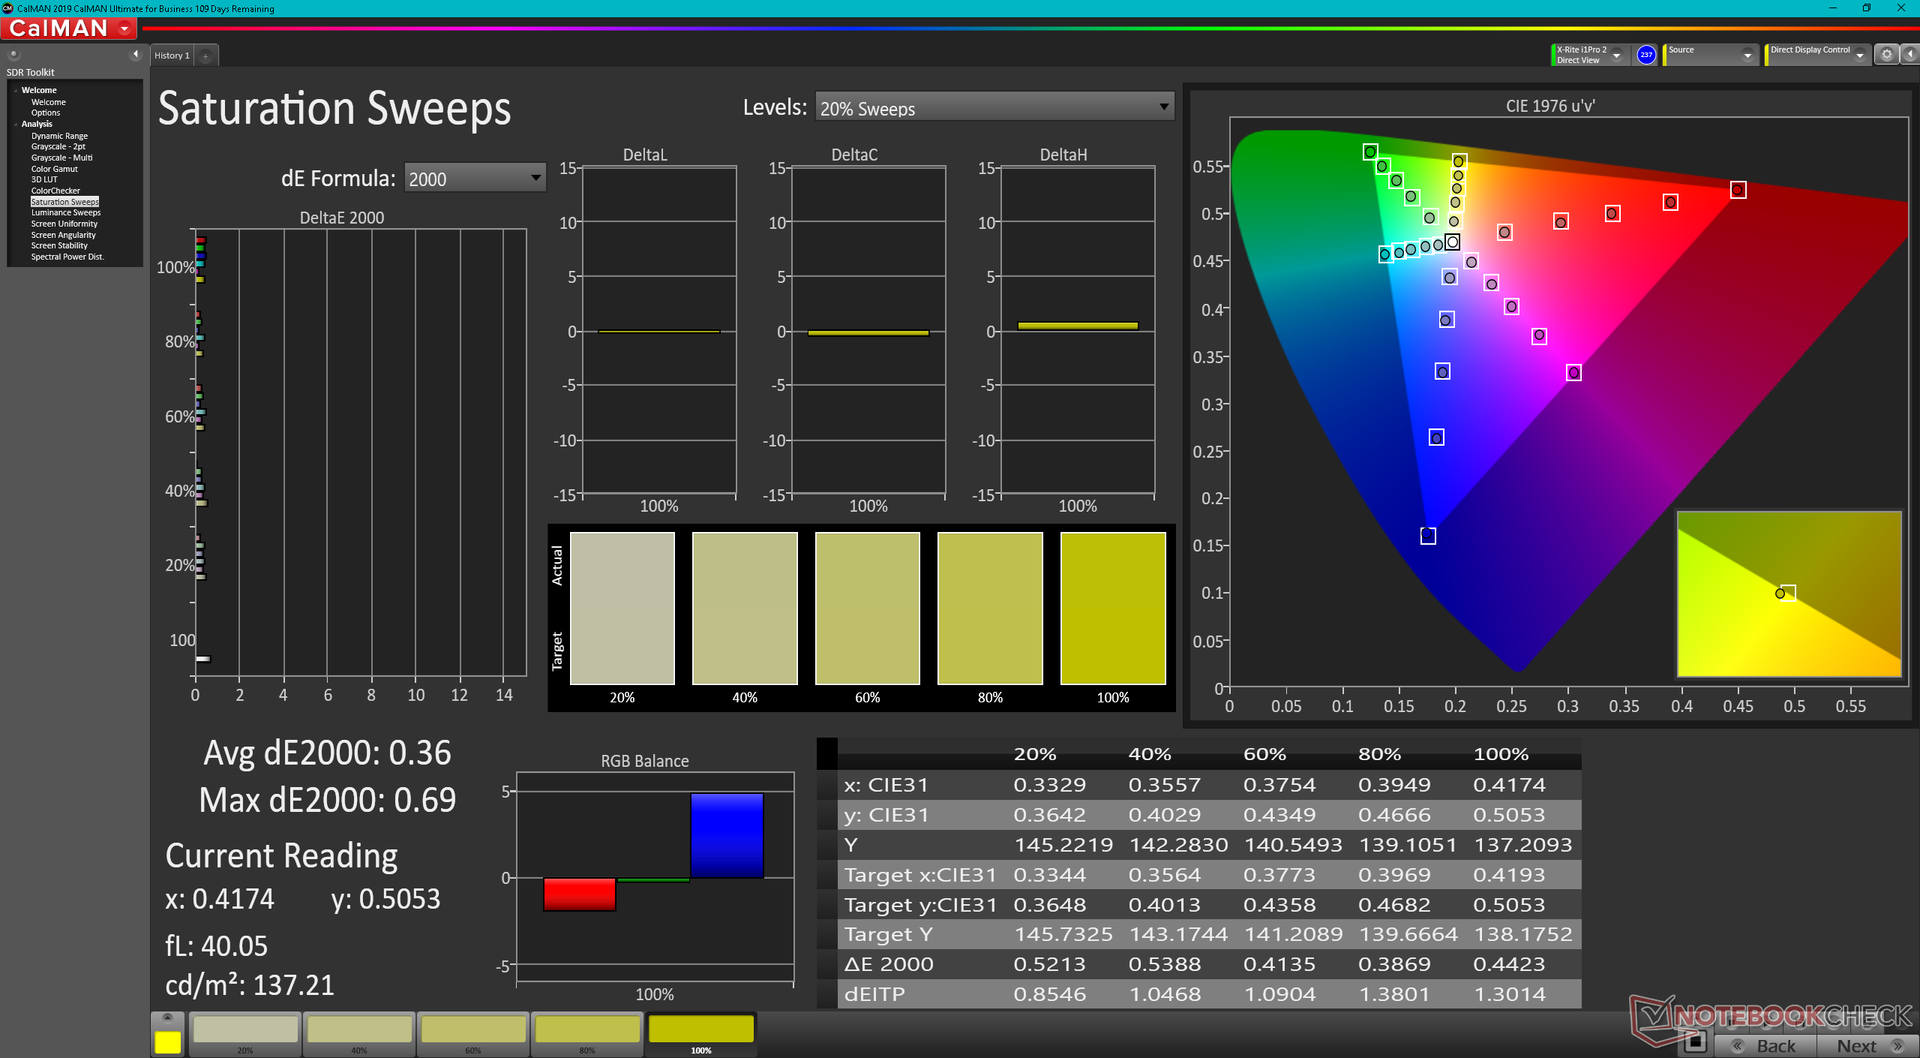
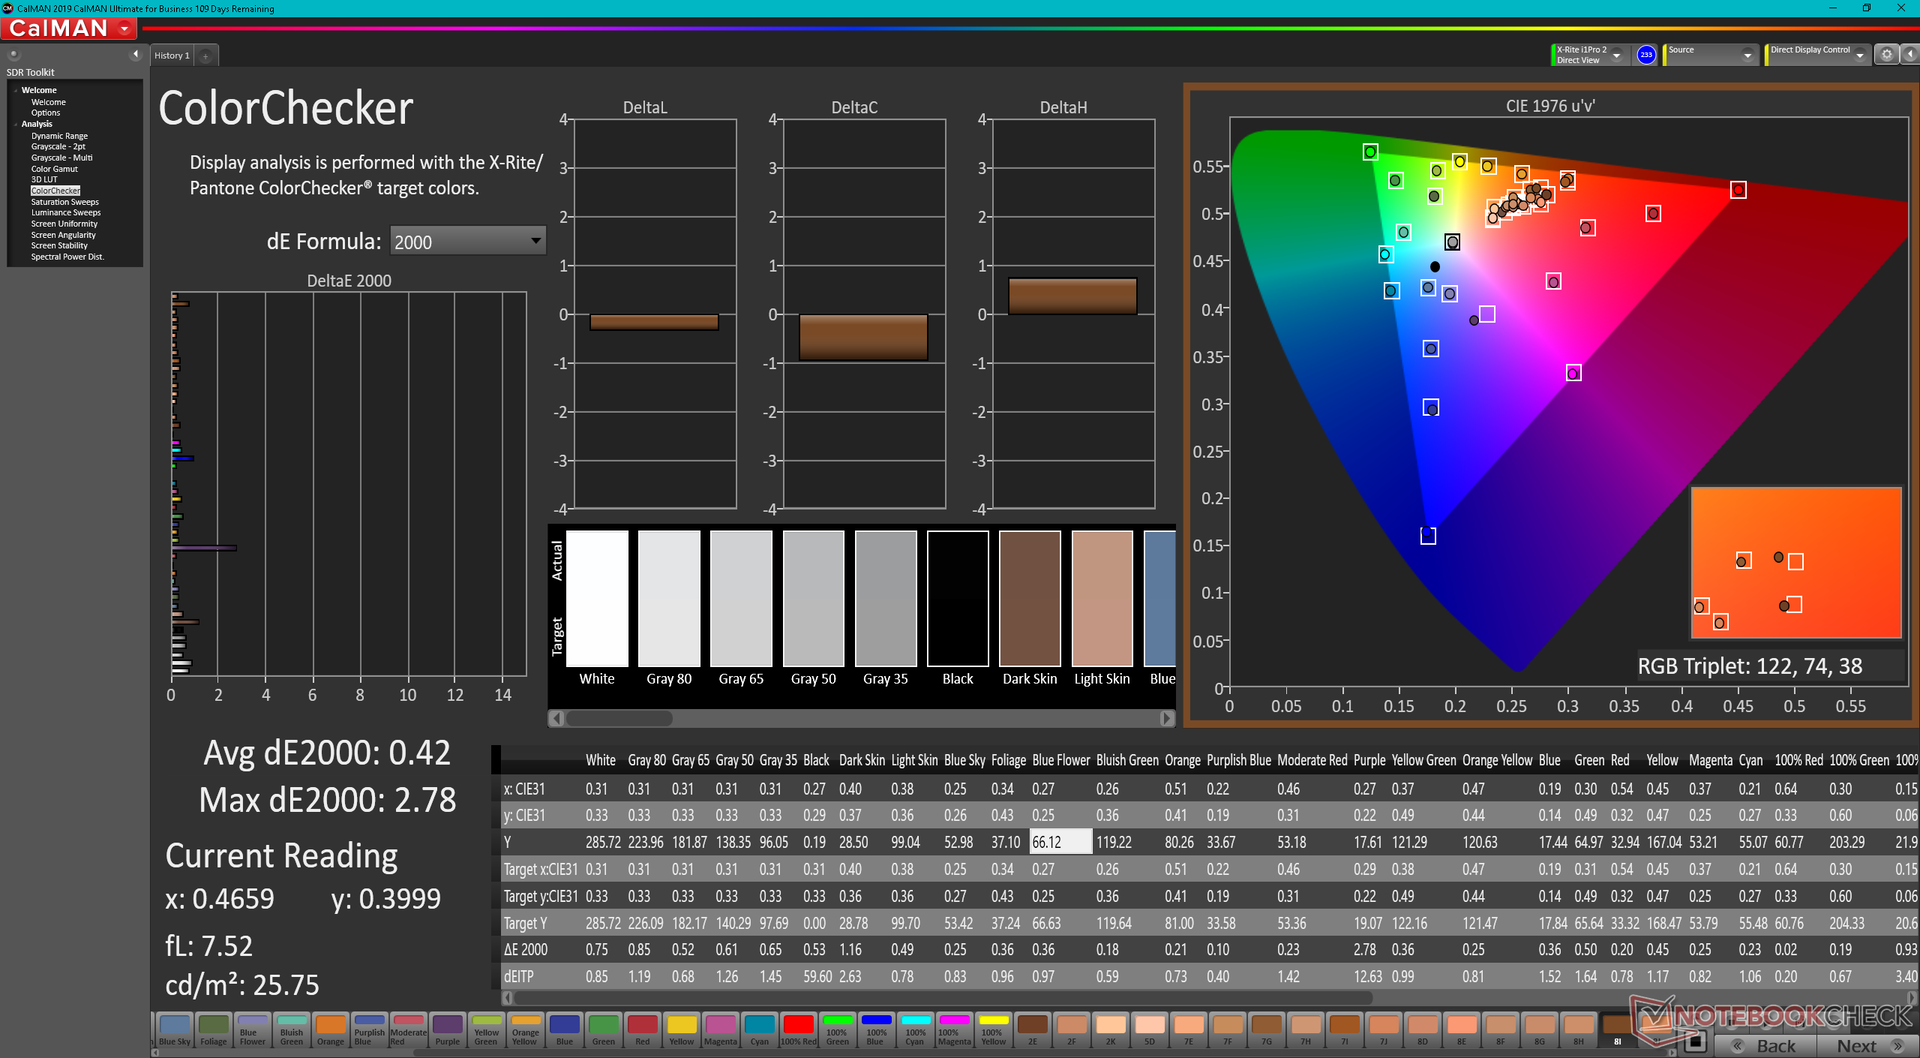
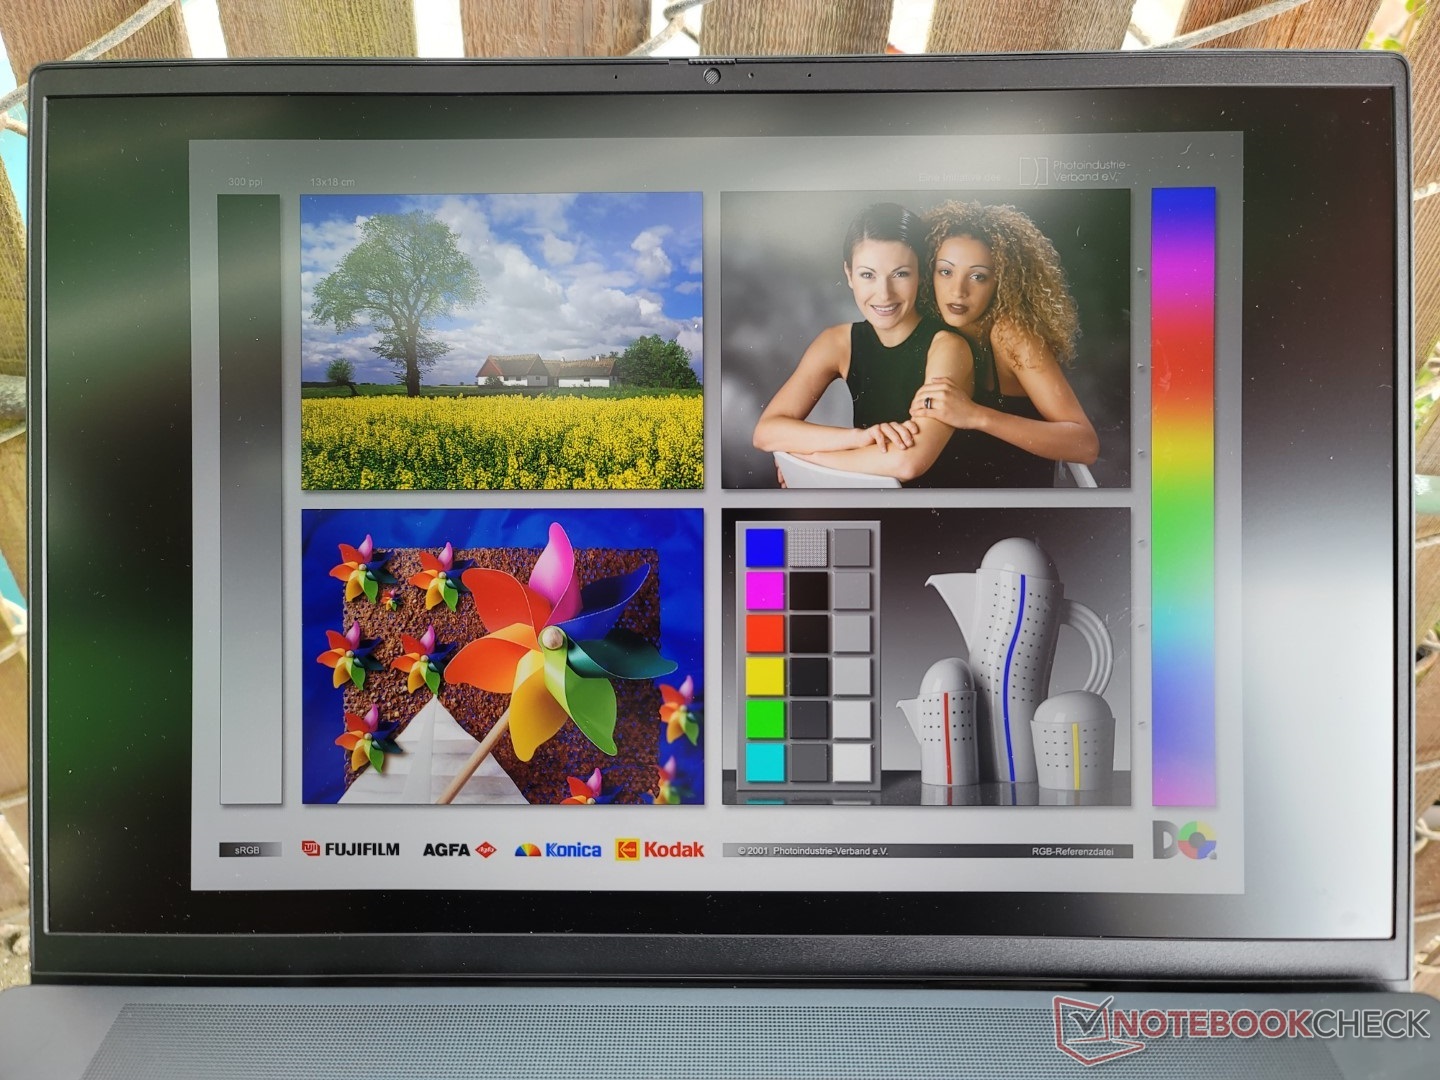
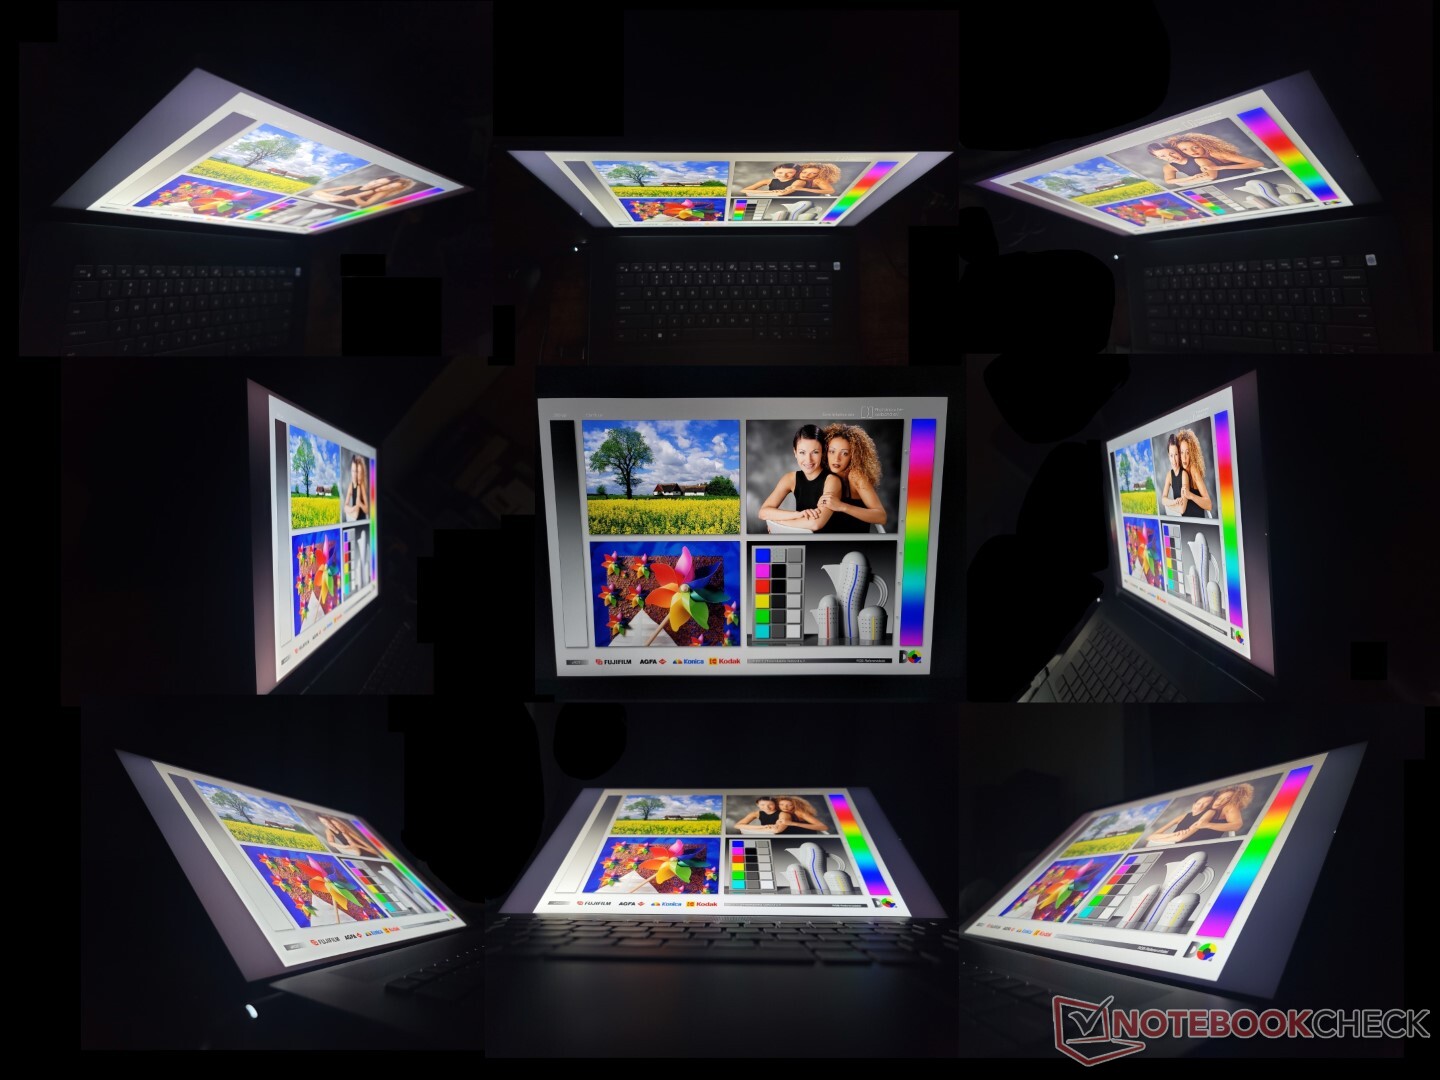
Weergave - Geen grote veranderingen
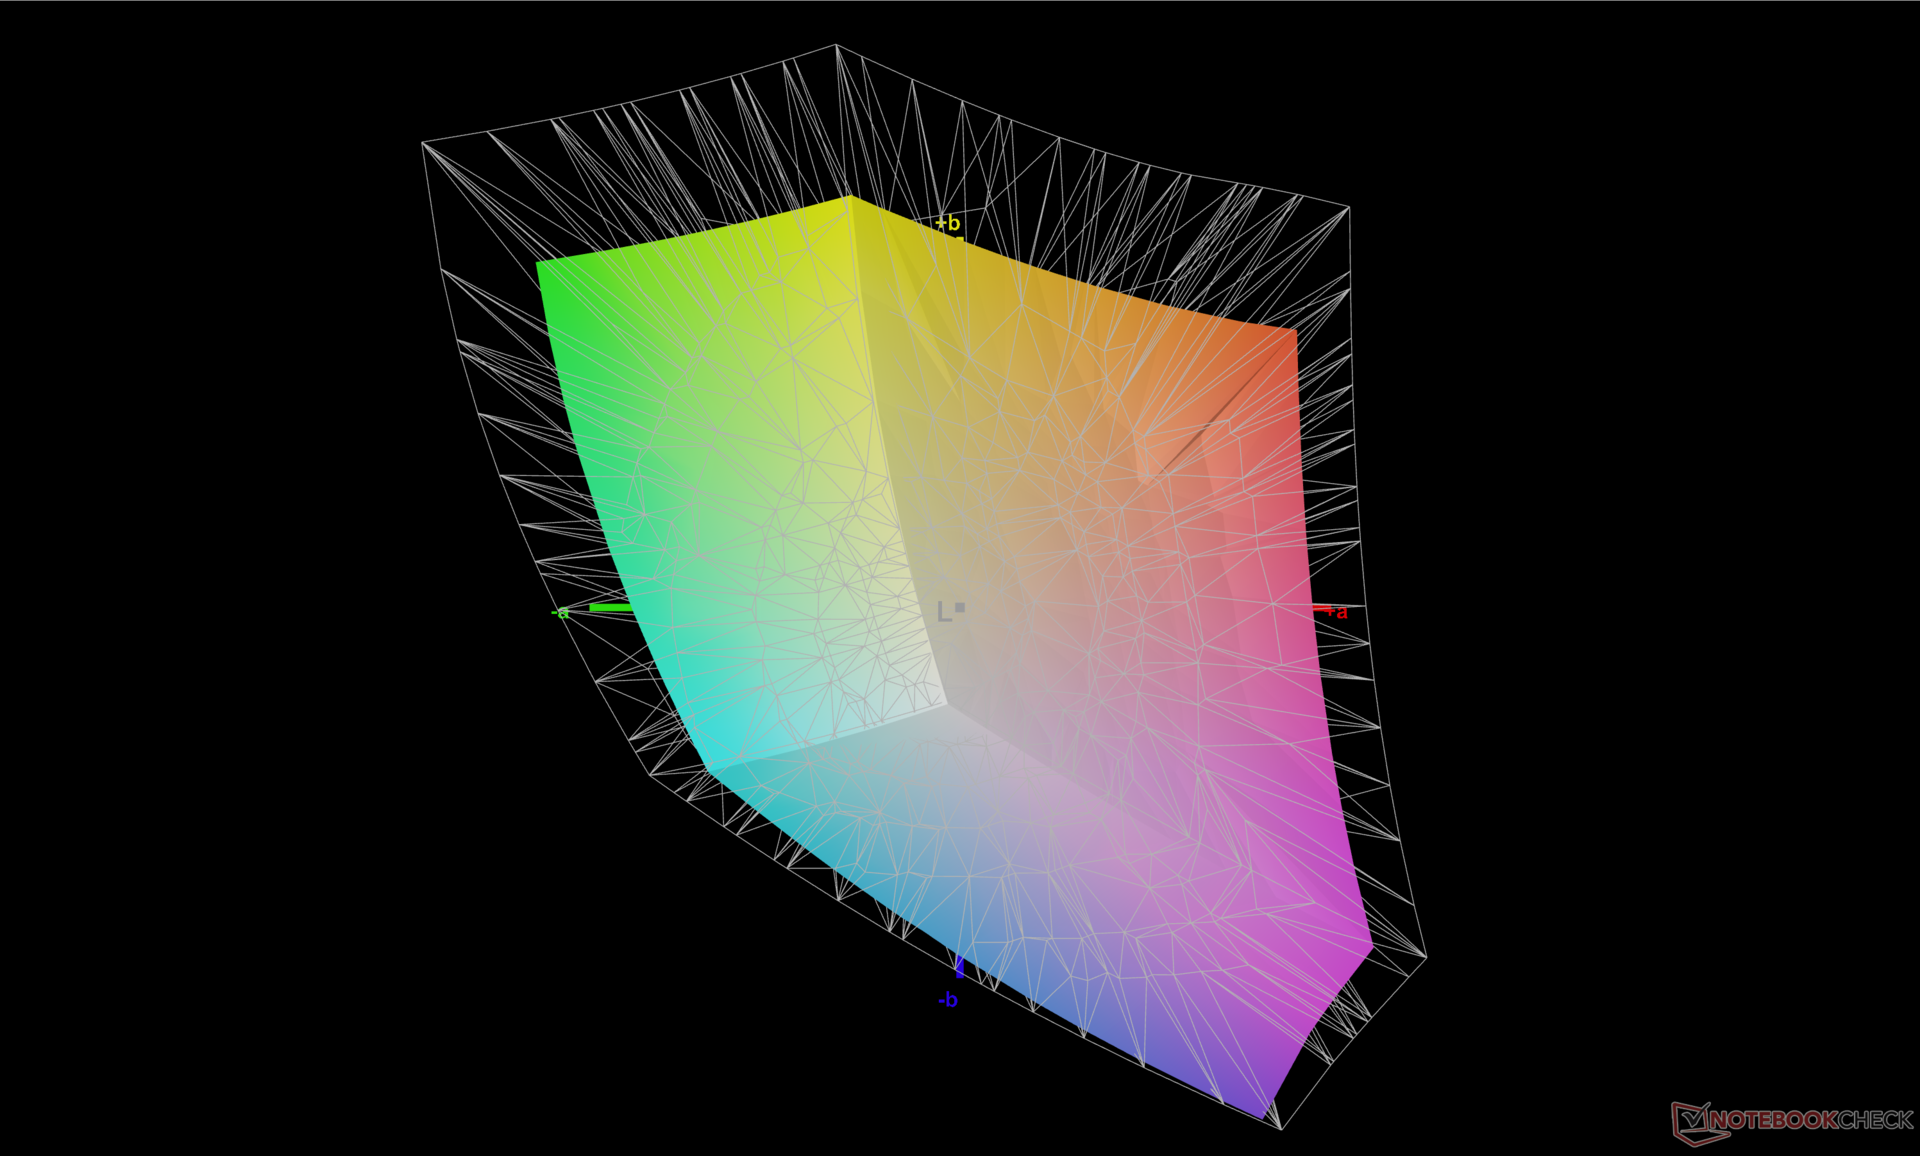
Interessant is dat Dell is overgestapt van paneelleverancier AU Optronics voor de Inspiron 16 Plus 7610 van vorig jaar naar BOE voor dit nieuwste model. De responstijden zijn iets sneller voor minder ernstige ghosting, maar al het andere blijft grotendeels hetzelfde, inclusief de volledige sRGB-dekking, ~1000:1 contrastratio, en ~290 nit maximale helderheid
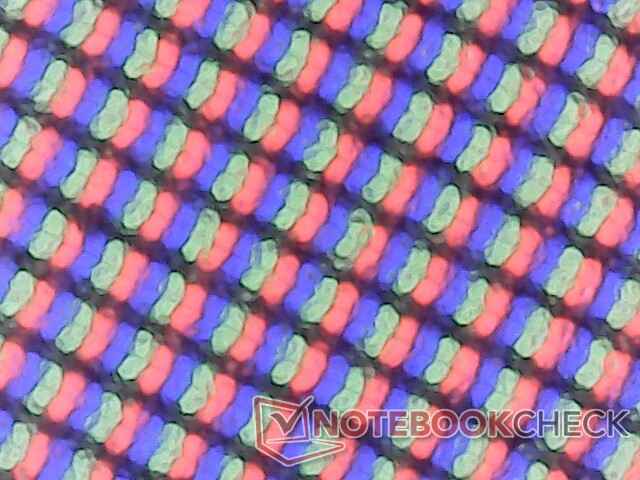
De kijkervaring is goed, maar nog steeds een paar stappen lager dan die van de XPS-serie of het OLED paneel op de Asus VivoBook Pro 16X. De beeldkwaliteit is merkbaar korreliger door de agressieve matte overlay, terwijl de kleuren lang niet zo levendig zijn als op OLED. We begrijpen dat de Inspiron-serie niet bedoeld is om top-of-the-line te zijn, maar het is teleurstellend dat Dell dit jaar geen significante wijzigingen in het beeldscherm heeft aangebracht
Er zijn drie 300-nit paneel opties om uit te kiezen: 3072 x 1920 matte non-touch, 1920 x 1200 matte non-touch, en 1920 x 1200 glanzende touch. Onze metingen hieronder hebben alleen betrekking op het paneel met de hogere resolutie.
| |||||||||||||||||||||||||
Helderheidsverdeling: 92 %
Helderheid in Batterij-modus: 288.9 cd/m²
Contrast: 1111:1 (Zwart: 0.26 cd/m²)
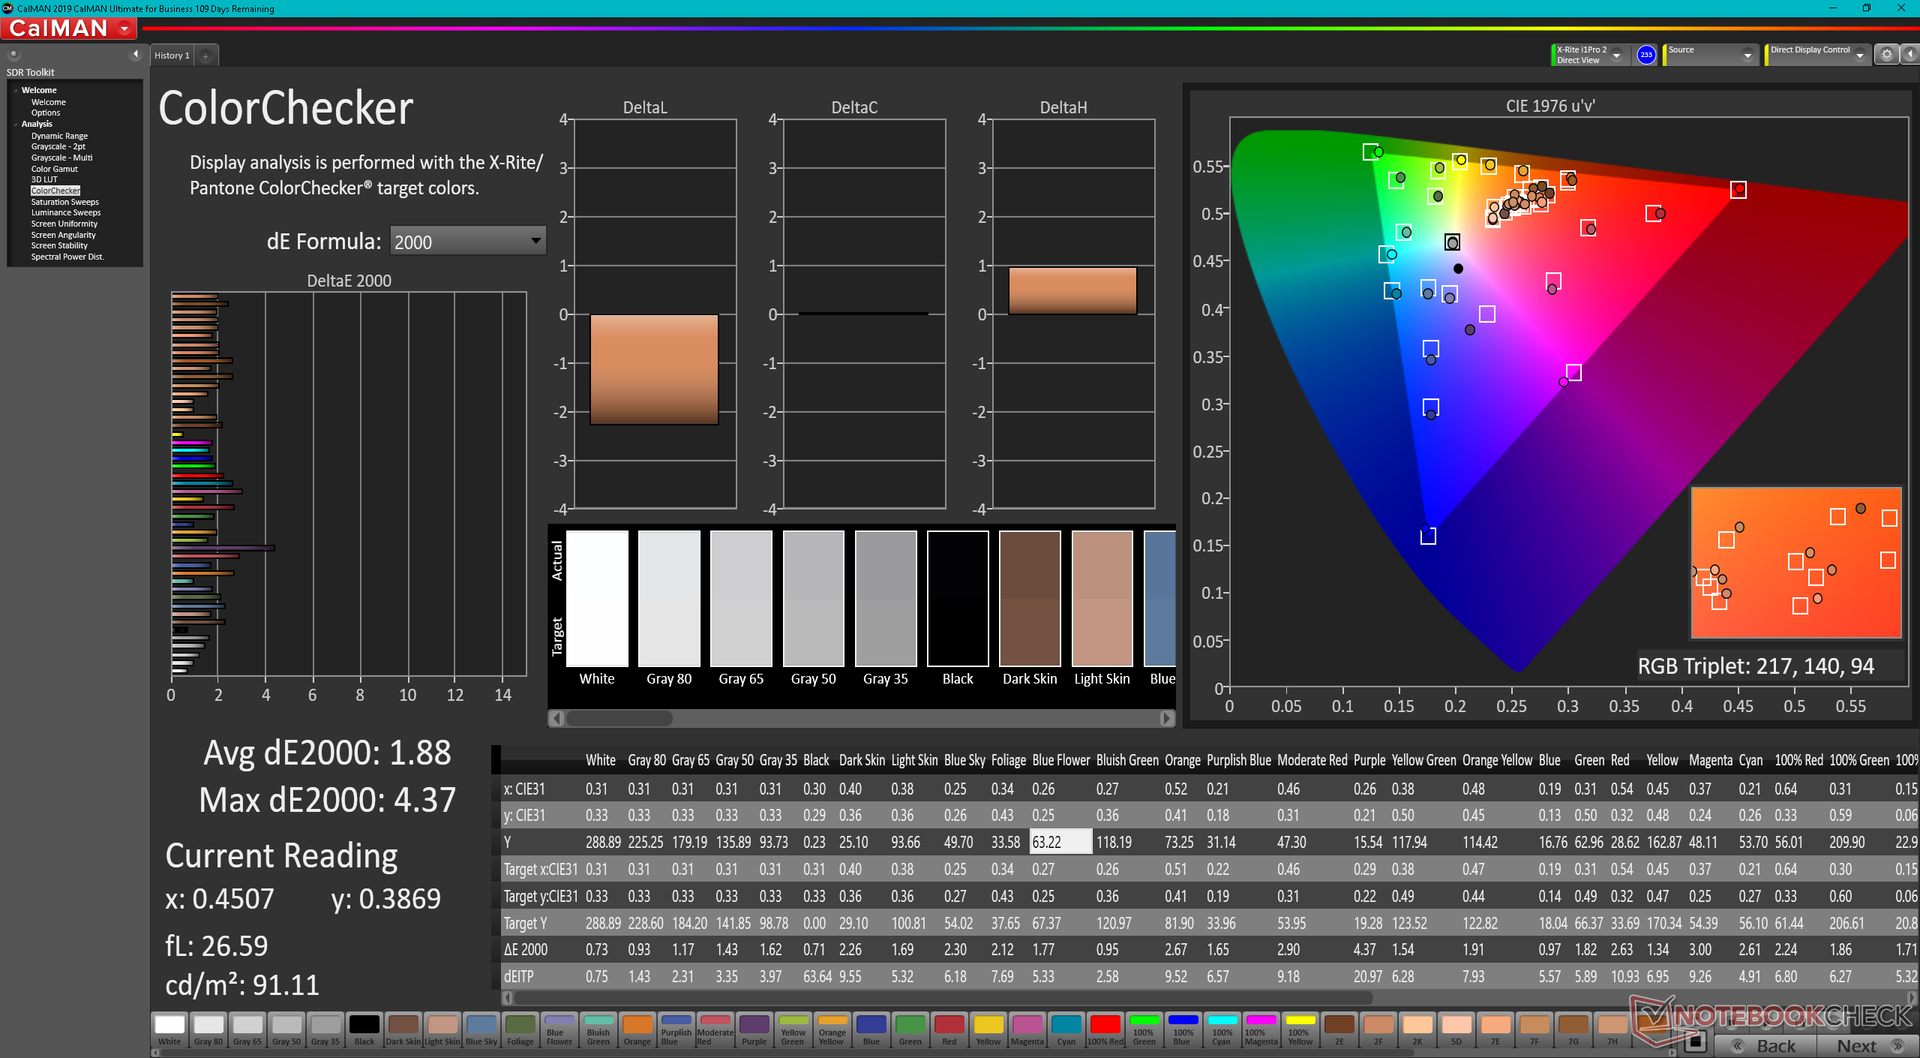
ΔE ColorChecker Calman: 1.88 | ∀{0.5-29.43 Ø4.72}
calibrated: 0.42
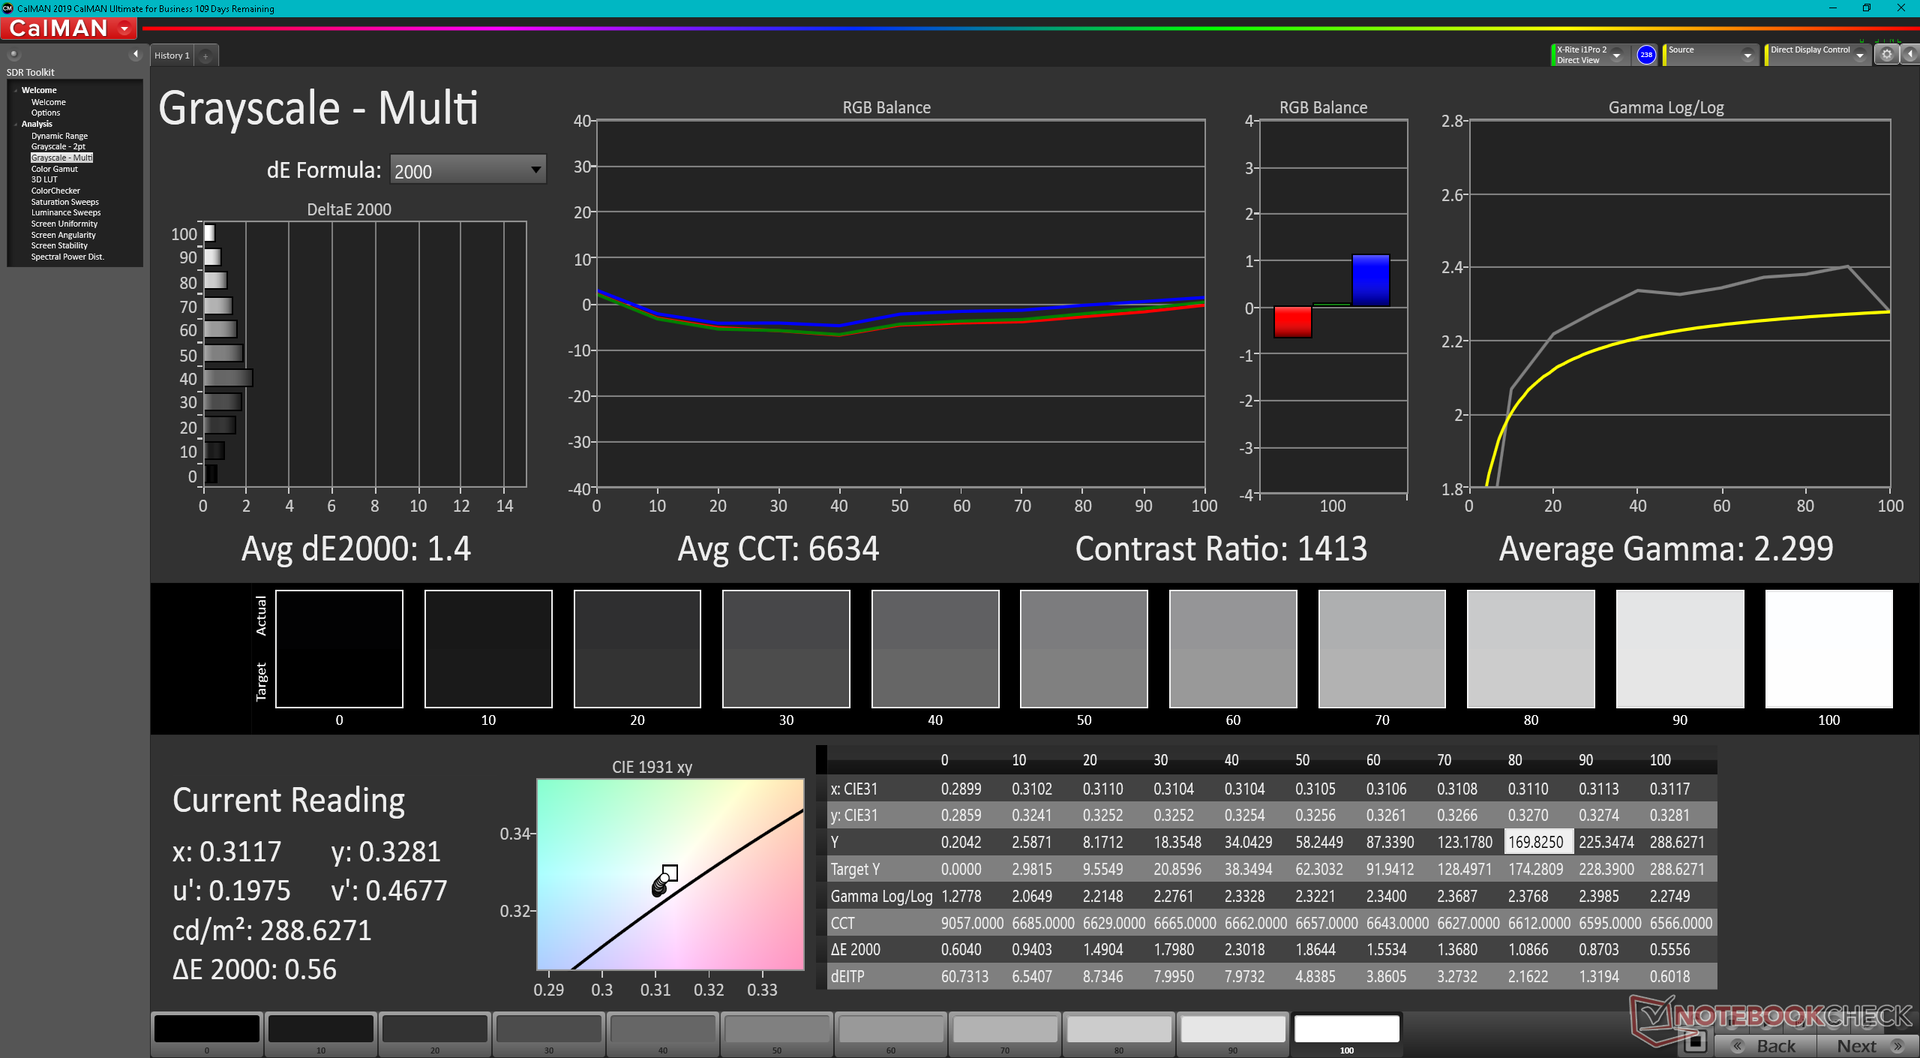
ΔE Greyscale Calman: 1.4 | ∀{0.09-98 Ø4.97}
73.2% AdobeRGB 1998 (Argyll 3D)
99.5% sRGB (Argyll 3D)
70.8% Display P3 (Argyll 3D)
Gamma: 2.3
CCT: 6634 K
| Dell Inspiron 16 Plus 7620 BOE NE16N41, IPS, 3072x1920, 16" | Dell Inspiron 16 Plus 7610 AU Optronics B160QAN, IPS, 3072x1920, 16" | Lenovo Yoga 7 16IAP7 Lenovo LEN160WQXGA, IPS, 2560x1600, 16" | Huawei MateBook D 16 2022 BOE NV160WUM-NH0, IPS, 1920x1200, 16" | Acer Swift X SFX16-51G-5388 Chi Mei N161HCA-EA3, , 1920x1080, 16.1" | Asus Vivobook Pro 16X-M7600QE Samsung ATNA60YV02-0, OLED, 3840x2400, 16.1" | |
|---|---|---|---|---|---|---|
| Display | 3% | -5% | -5% | -7% | 25% | |
| Display P3 Coverage (%) | 70.8 | 74.1 5% | 67 -5% | 66.2 -6% | 65.1 -8% | 99.8 41% |
| sRGB Coverage (%) | 99.5 | 99.4 0% | 95.7 -4% | 96.4 -3% | 95.65 -4% | 100 1% |
| AdobeRGB 1998 Coverage (%) | 73.2 | 75.8 4% | 69.3 -5% | 68.3 -7% | 66.75 -9% | 96.9 32% |
| Response Times | -30% | 8% | 27% | 25% | 94% | |
| Response Time Grey 50% / Grey 80% * (ms) | 38 ? | 49.2 ? -29% | 36 ? 5% | 30.5 ? 20% | 30 ? 21% | 2 ? 95% |
| Response Time Black / White * (ms) | 28 ? | 36.8 ? -31% | 24.8 ? 11% | 18.7 ? 33% | 20 ? 29% | 2 ? 93% |
| PWM Frequency (Hz) | 60 ? | |||||
| Screen | -47% | -13% | -56% | -6% | -35% | |
| Brightness middle (cd/m²) | 288.9 | 296.8 3% | 393.7 36% | 319 10% | 276 -4% | 392 36% |
| Brightness (cd/m²) | 276 | 292 6% | 367 33% | 317 15% | 264 -4% | 396 43% |
| Brightness Distribution (%) | 92 | 87 -5% | 84 -9% | 90 -2% | 85 -8% | 98 7% |
| Black Level * (cd/m²) | 0.26 | 0.21 19% | 0.38 -46% | 0.23 12% | 0.16 38% | |
| Contrast (:1) | 1111 | 1413 27% | 1036 -7% | 1387 25% | 1725 55% | |
| Colorchecker dE 2000 * | 1.88 | 2.56 -36% | 1.97 -5% | 3.4 -81% | 1.8 4% | 1.74 7% |
| Colorchecker dE 2000 max. * | 4.37 | 4.76 -9% | 5.46 -25% | 8.1 -85% | 3.77 14% | 3.18 27% |
| Colorchecker dE 2000 calibrated * | 0.42 | 1.86 -343% | 0.62 -48% | 0.8 -90% | 0.63 -50% | 1.85 -340% |
| Greyscale dE 2000 * | 1.4 | 2.6 -86% | 2.1 -50% | 5.7 -307% | 2.76 -97% | 1.77 -26% |
| Gamma | 2.3 96% | 2.07 106% | 2.1 105% | 2.1 105% | 2.37 93% | 2.22 99% |
| CCT | 6634 98% | 6628 98% | 6461 101% | 7433 87% | 6564 99% | 6483 100% |
| Totaal Gemiddelde (Programma / Instellingen) | -25% /
-34% | -3% /
-9% | -11% /
-33% | 4% /
-2% | 28% /
1% |
* ... kleiner is beter
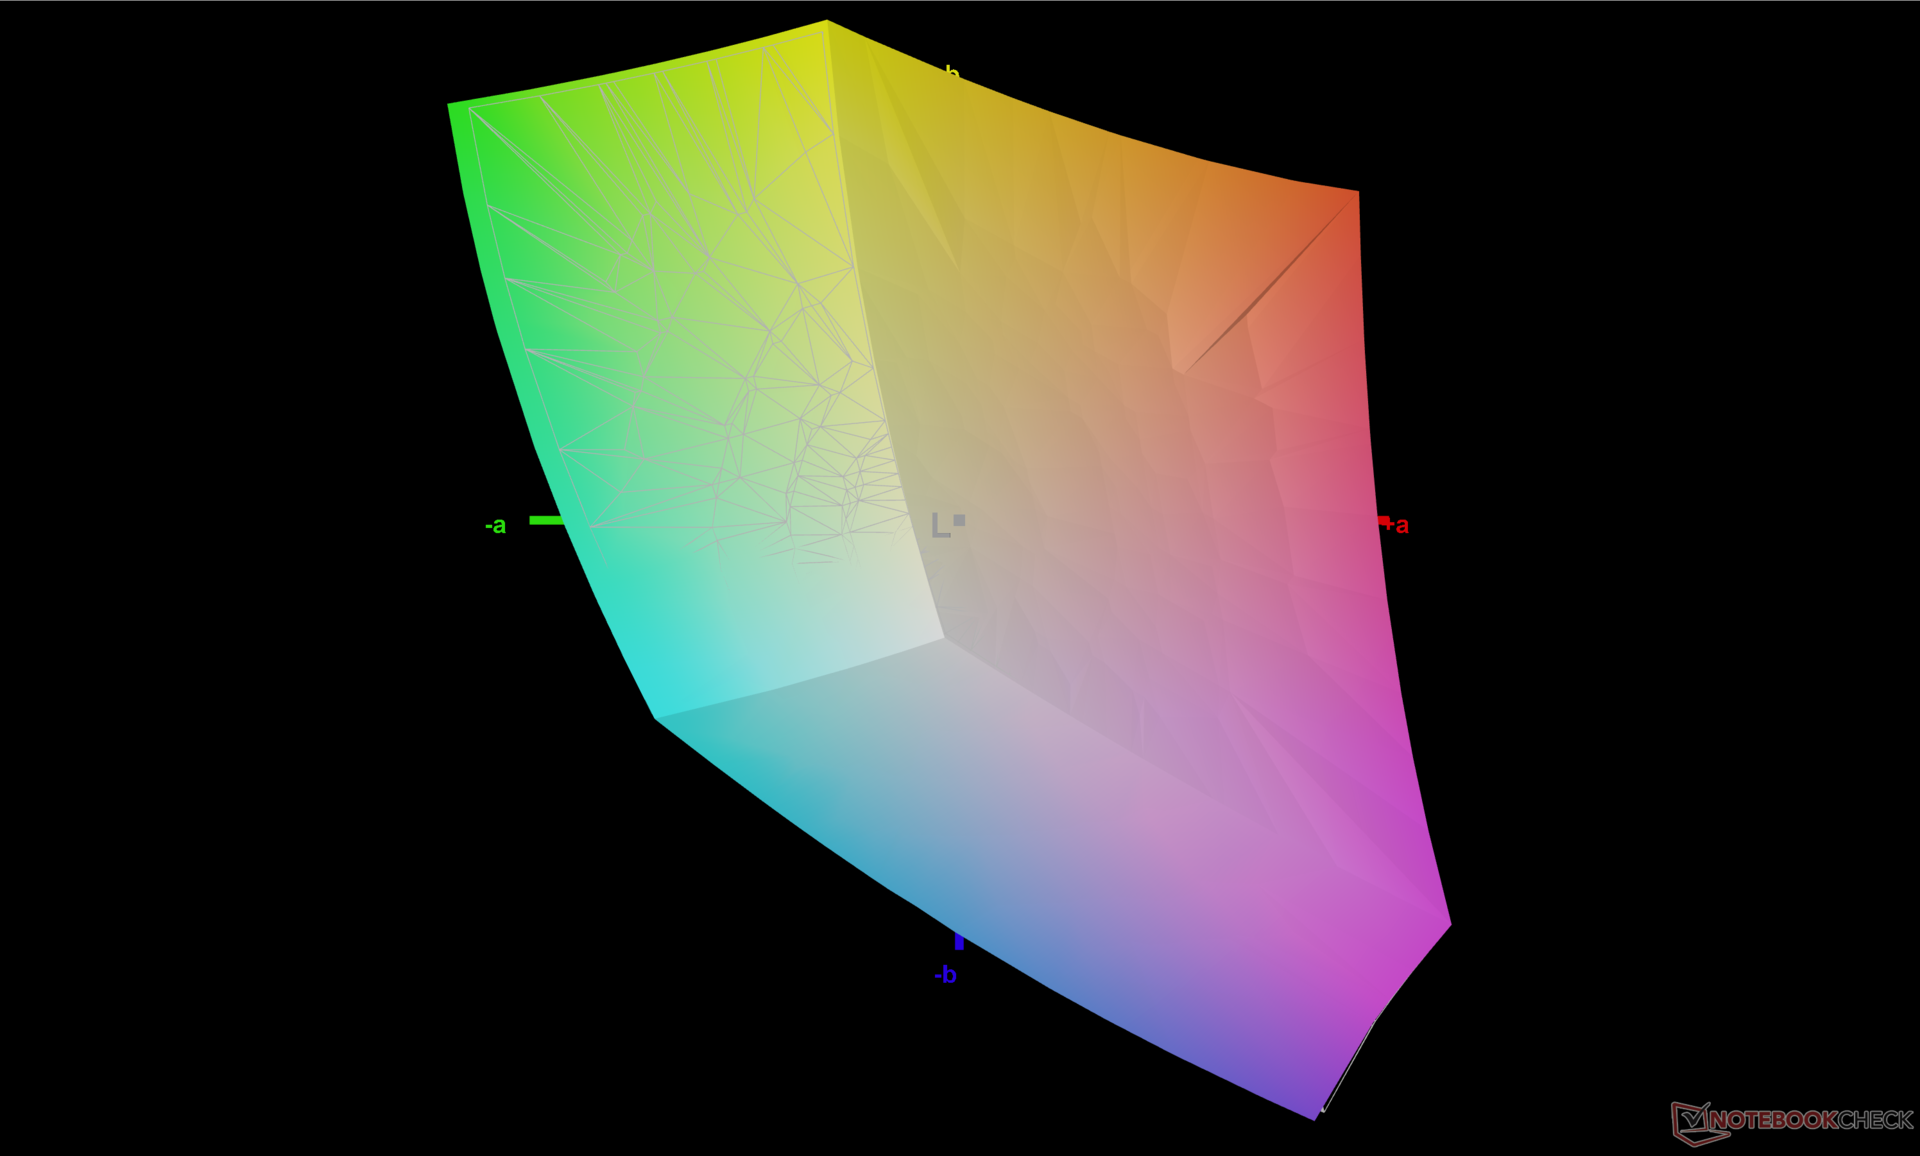
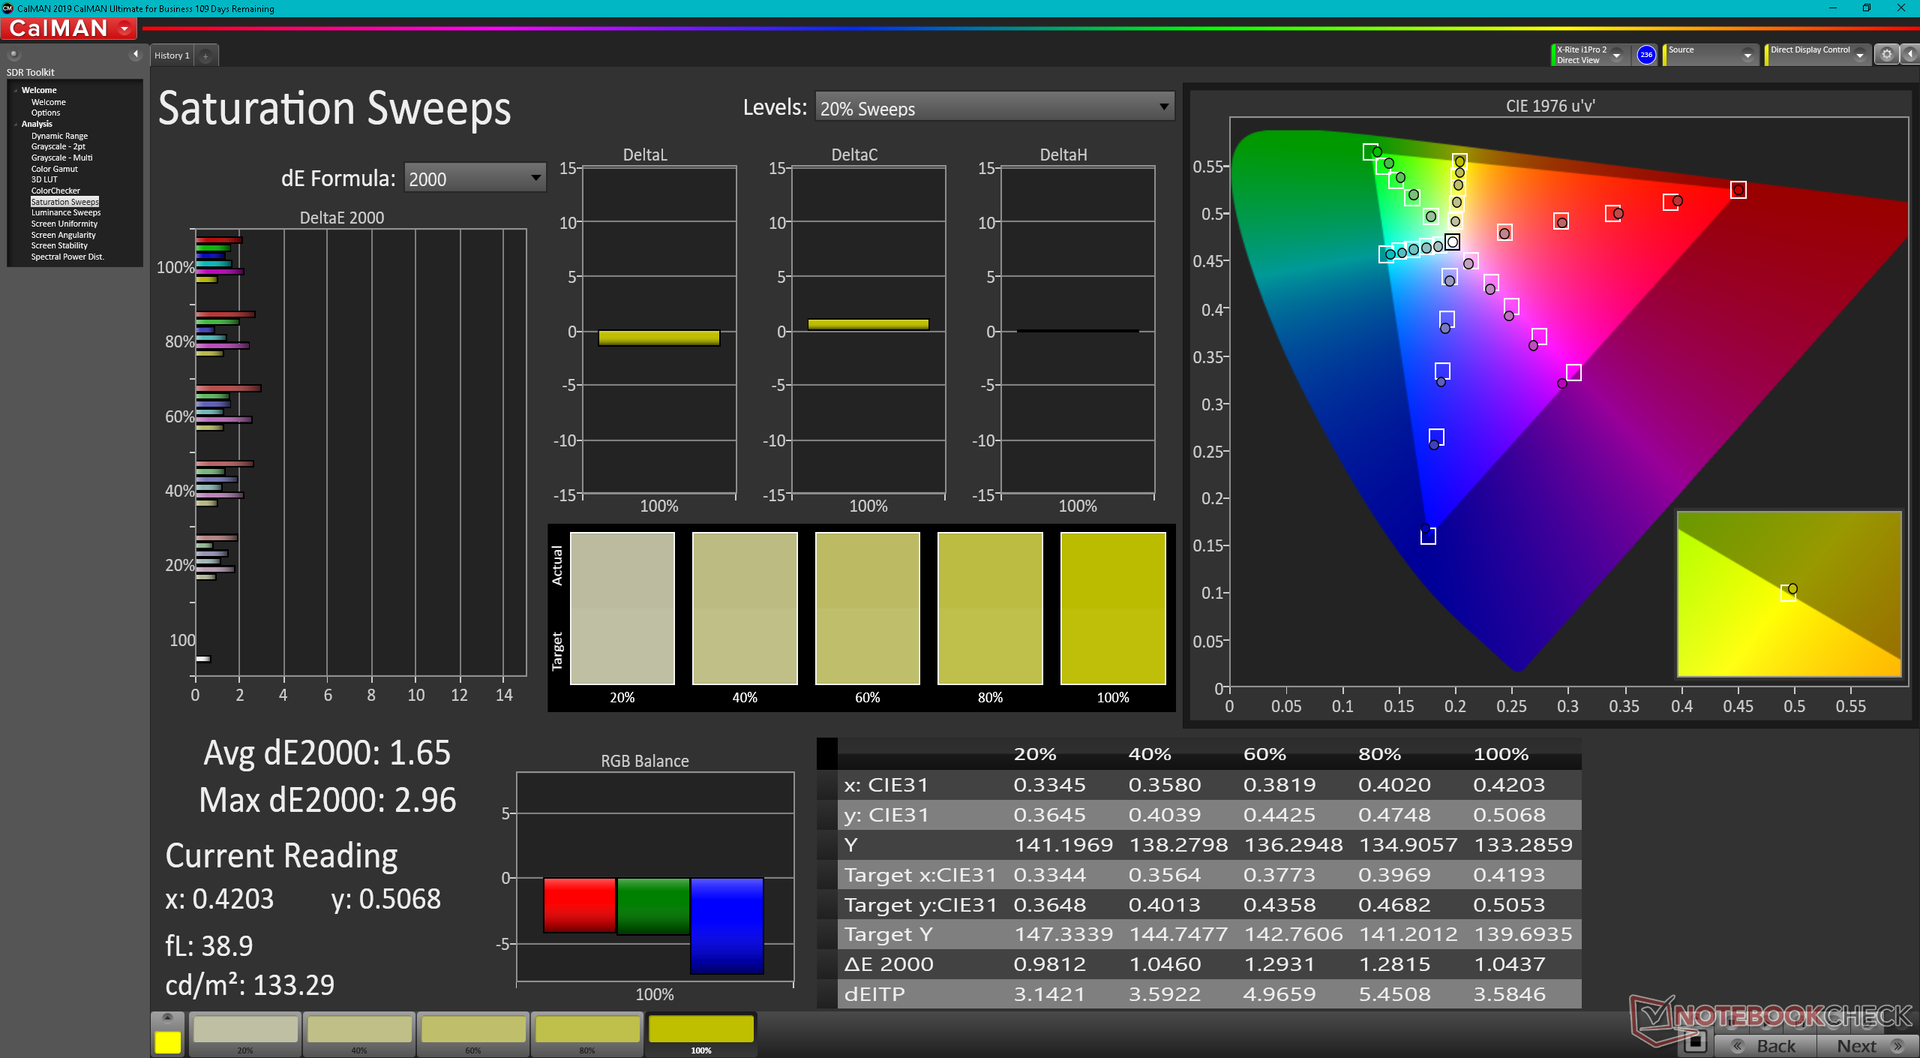
Het scherm is goed gekalibreerd uit de doos, net als wat we ontdekten op de 7610. De gemiddelde DeltaE-waarden voor grijstinten en kleuren liggen op respectievelijk 1,4 en 1,88, terwijl onze eigen kalibratiepogingen de gemiddelden nog verder zouden verbeteren tot slechts 0,5 en 0,42. Als u waarde hecht aan sRGB-nauwkeurige beeldschermen, dan zult u blij zijn met wat u hier ziet.

Responstijd Scherm
| ↔ Responstijd Zwart naar Wit | ||
|---|---|---|
| 28 ms ... stijging ↗ en daling ↘ gecombineerd | ↗ 13.2 ms stijging | 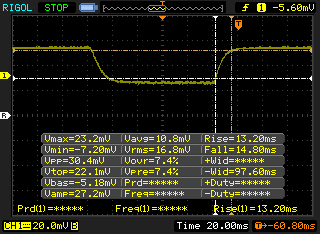 |
| ↘ 14.8 ms daling | ||
| Het scherm vertoonde relatief trage responstijden in onze tests en is misschien te traag voor games. Ter vergelijking: alle testtoestellen variëren van 0.1 (minimum) tot 240 (maximum) ms. » 71 % van alle toestellen zijn beter. Dit betekent dat de gemeten responstijd slechter is dan het gemiddelde (19.9 ms) van alle geteste toestellen. | ||
| ↔ Responstijd 50% Grijs naar 80% Grijs | ||
| 38 ms ... stijging ↗ en daling ↘ gecombineerd | ↗ 21.2 ms stijging | 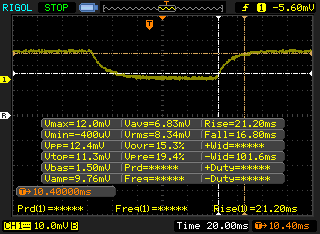 |
| ↘ 16.8 ms daling | ||
| Het scherm vertoonde trage responstijden in onze tests en is misschien te traag voor games. Ter vergelijking: alle testtoestellen variëren van 0.165 (minimum) tot 636 (maximum) ms. » 55 % van alle toestellen zijn beter. Dit betekent dat de gemeten responstijd slechter is dan het gemiddelde (31.1 ms) van alle geteste toestellen. | ||
Screen Flickering / PWM (Pulse-Width Modulation)
| Screen flickering / PWM niet waargenomen | 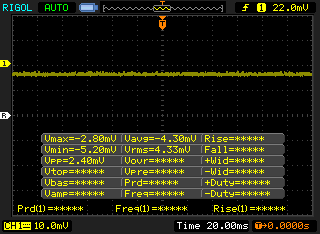 | ||
Ter vergelijking: 52 % van alle geteste toestellen maakten geen gebruik van PWM om de schermhelderheid te verlagen. Als het wel werd gebruikt, werd een gemiddelde van 7784 (minimum: 5 - maximum: 343500) Hz waargenomen. | |||
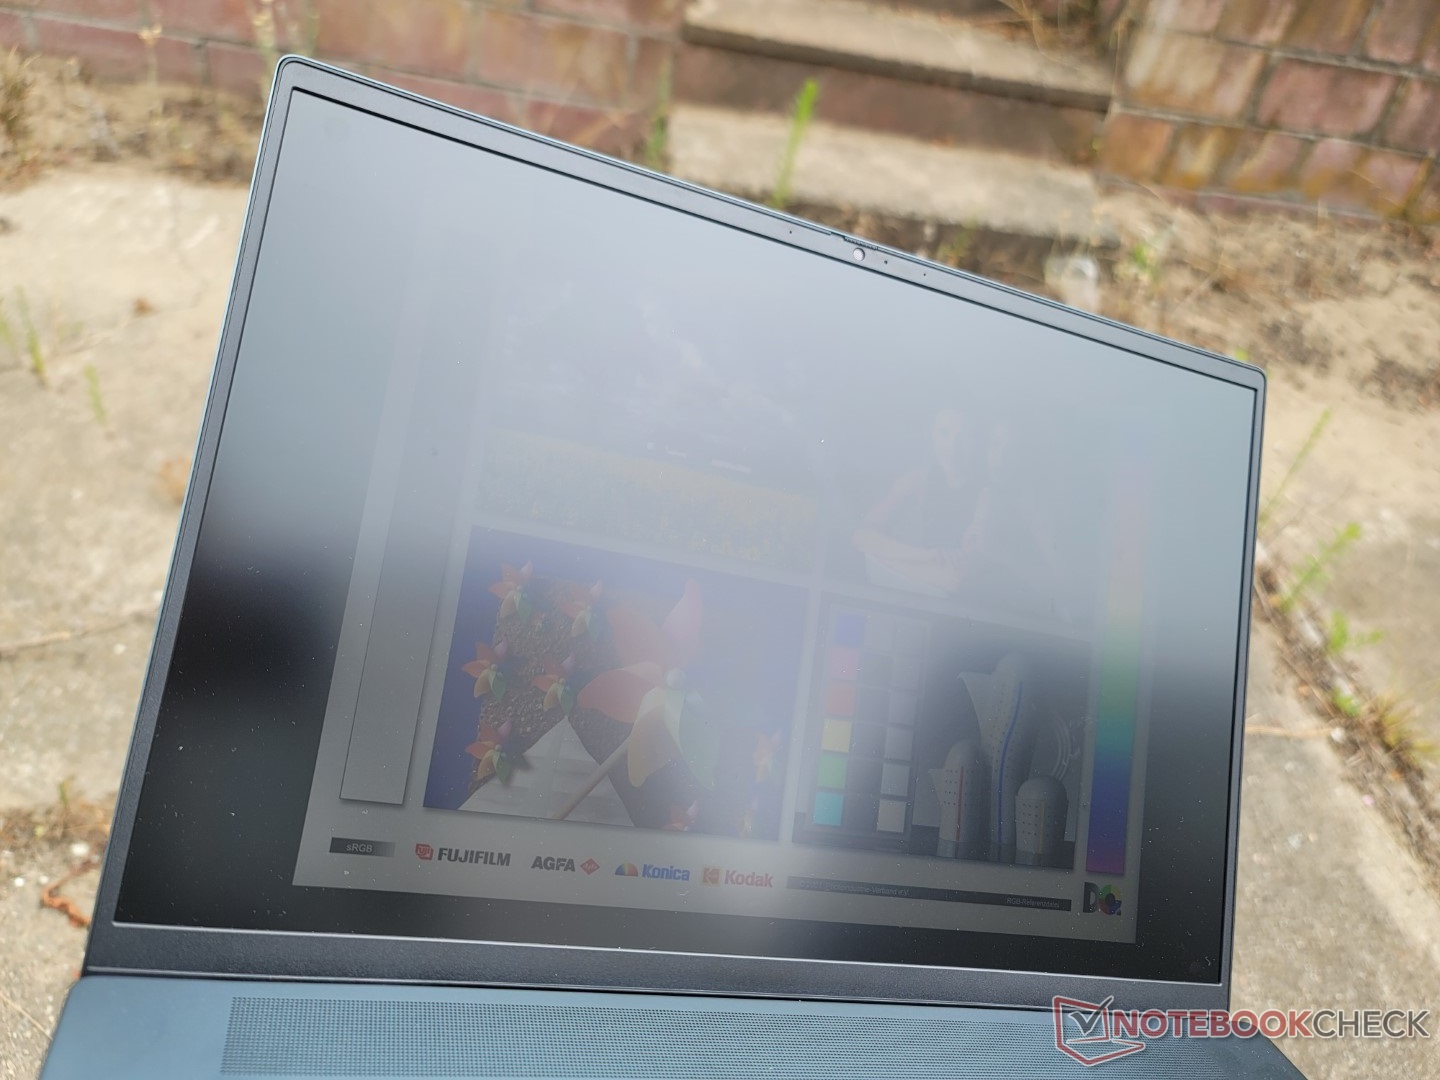
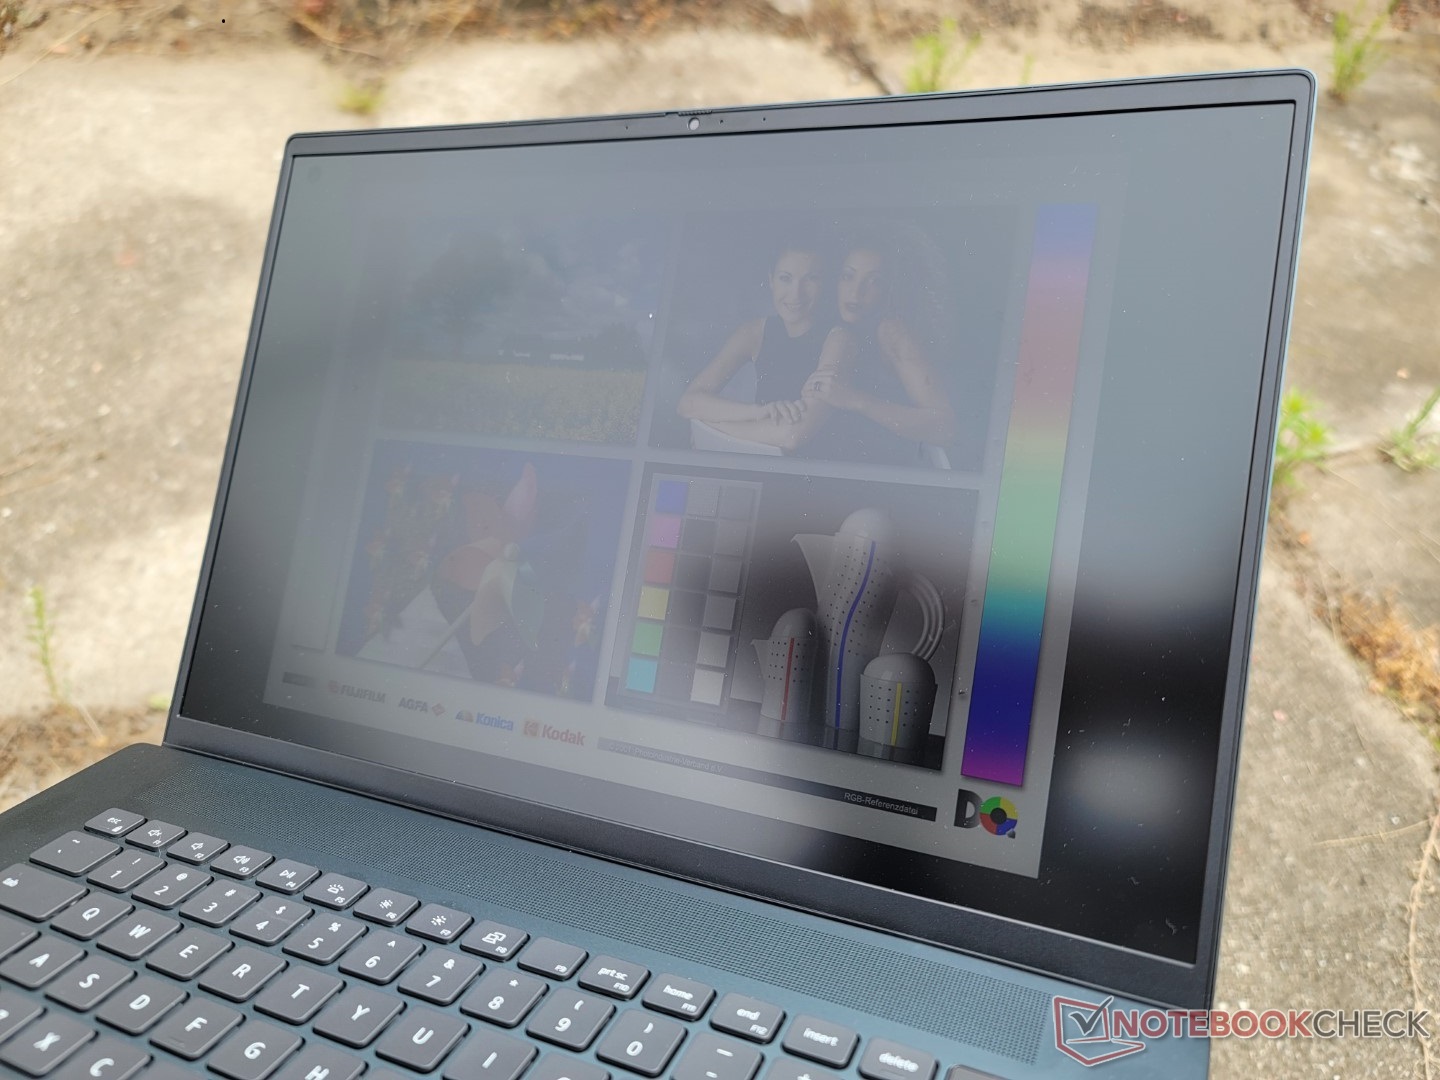
De zichtbaarheid buitenshuis is vergelijkbaar met het model van vorig jaar, aangezien de maximale helderheid niet is veranderd. De Lenovo Yoga 7 of Asus VivoBook Pro 16X hebben helderdere schermen, maar schittering van hun glanzende overlays is moeilijker te vermijden.
Prestaties - 12e Gen brengt hogere prestaties en stroomverbruik
Testomstandigheden
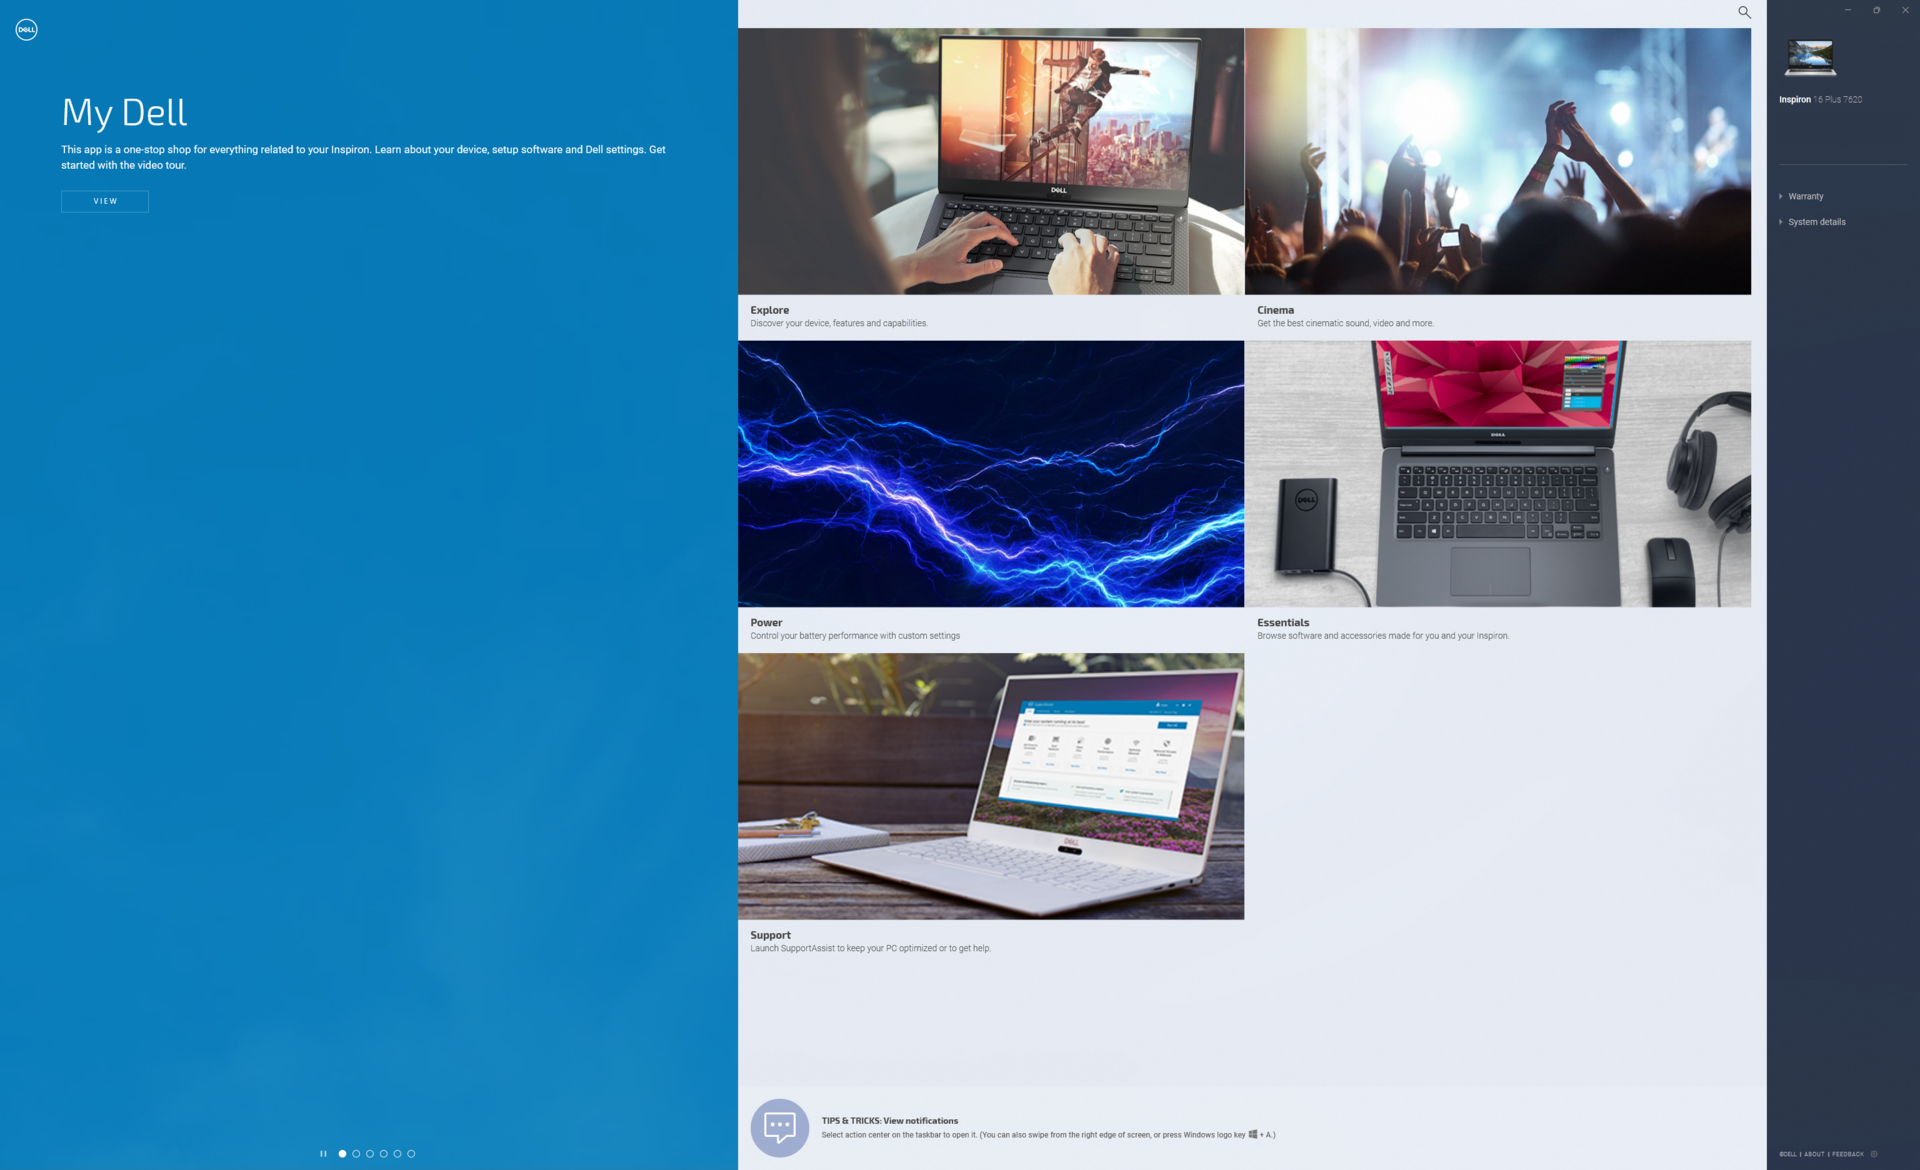
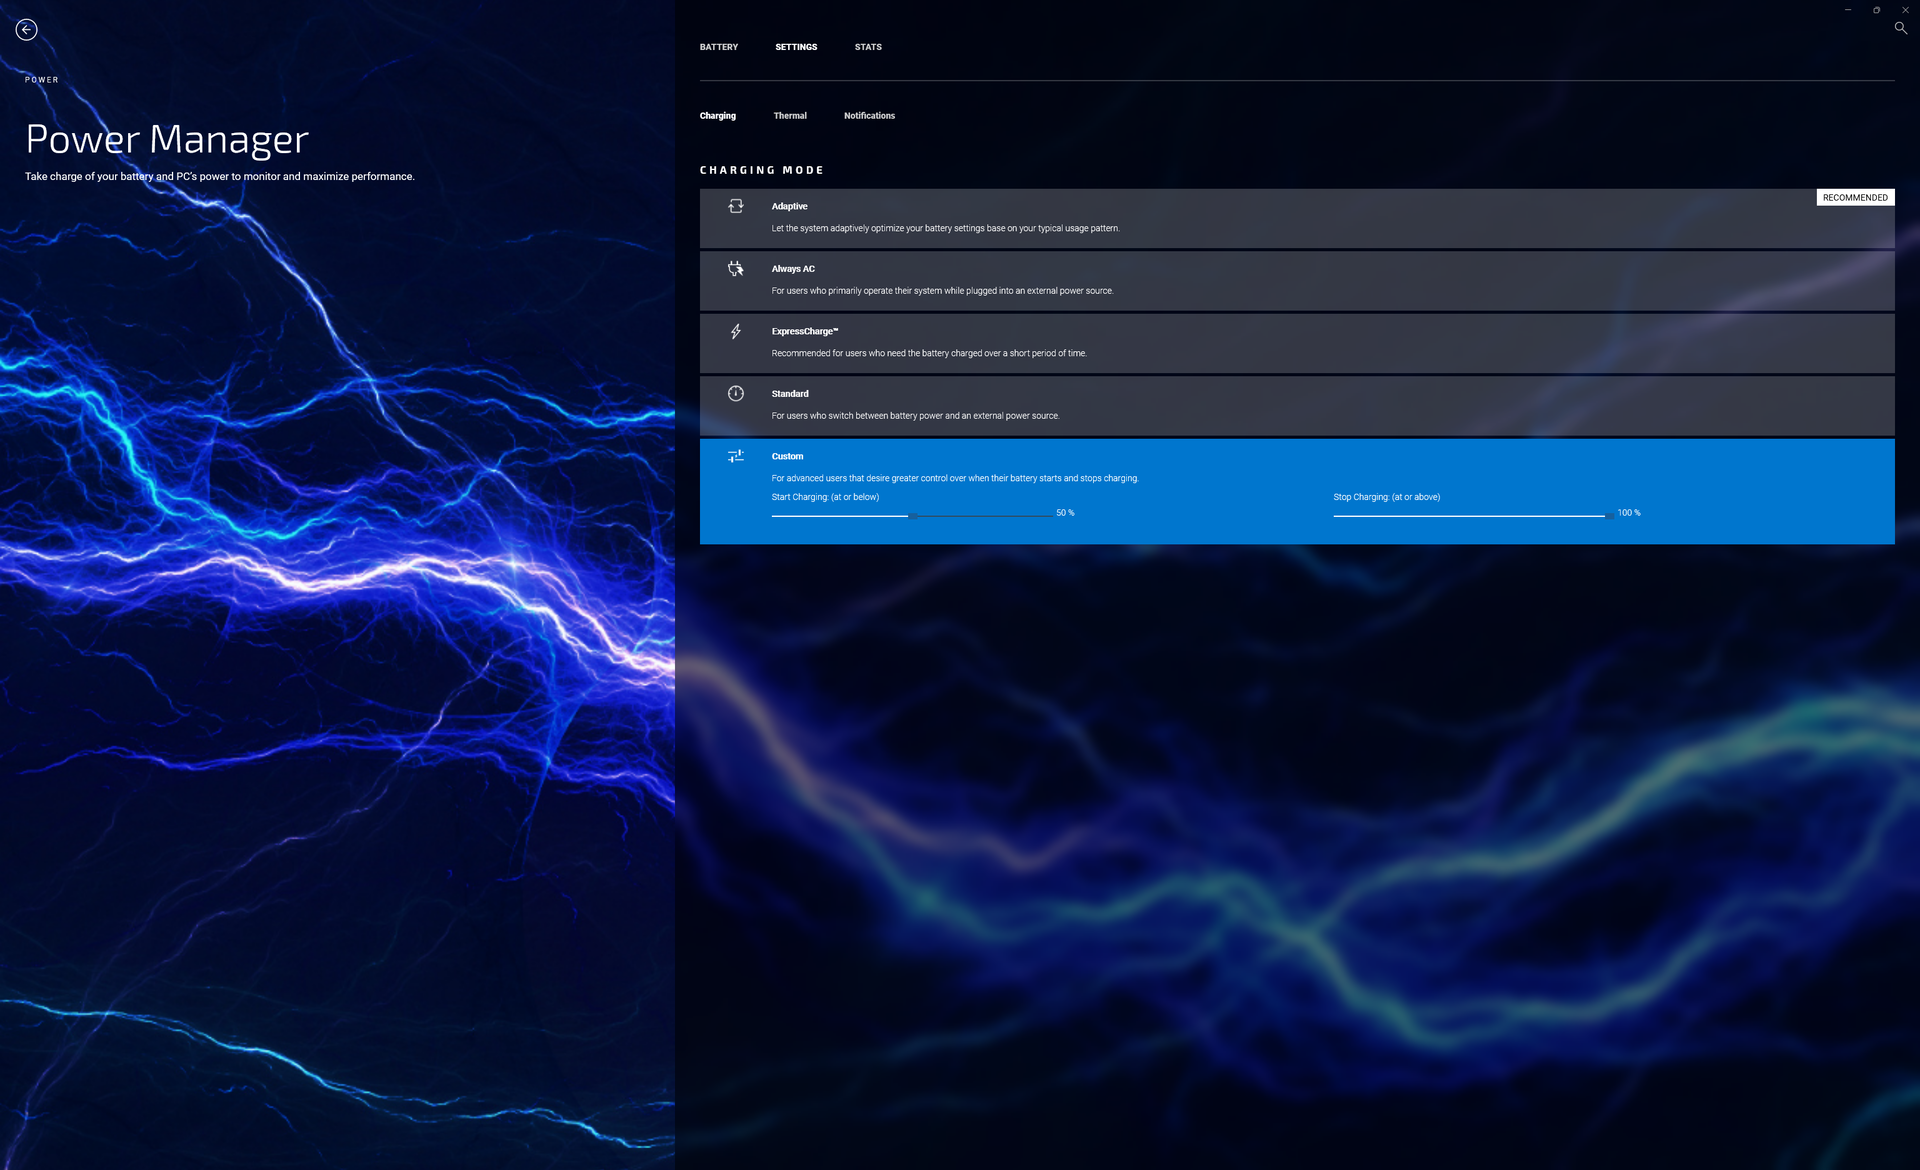
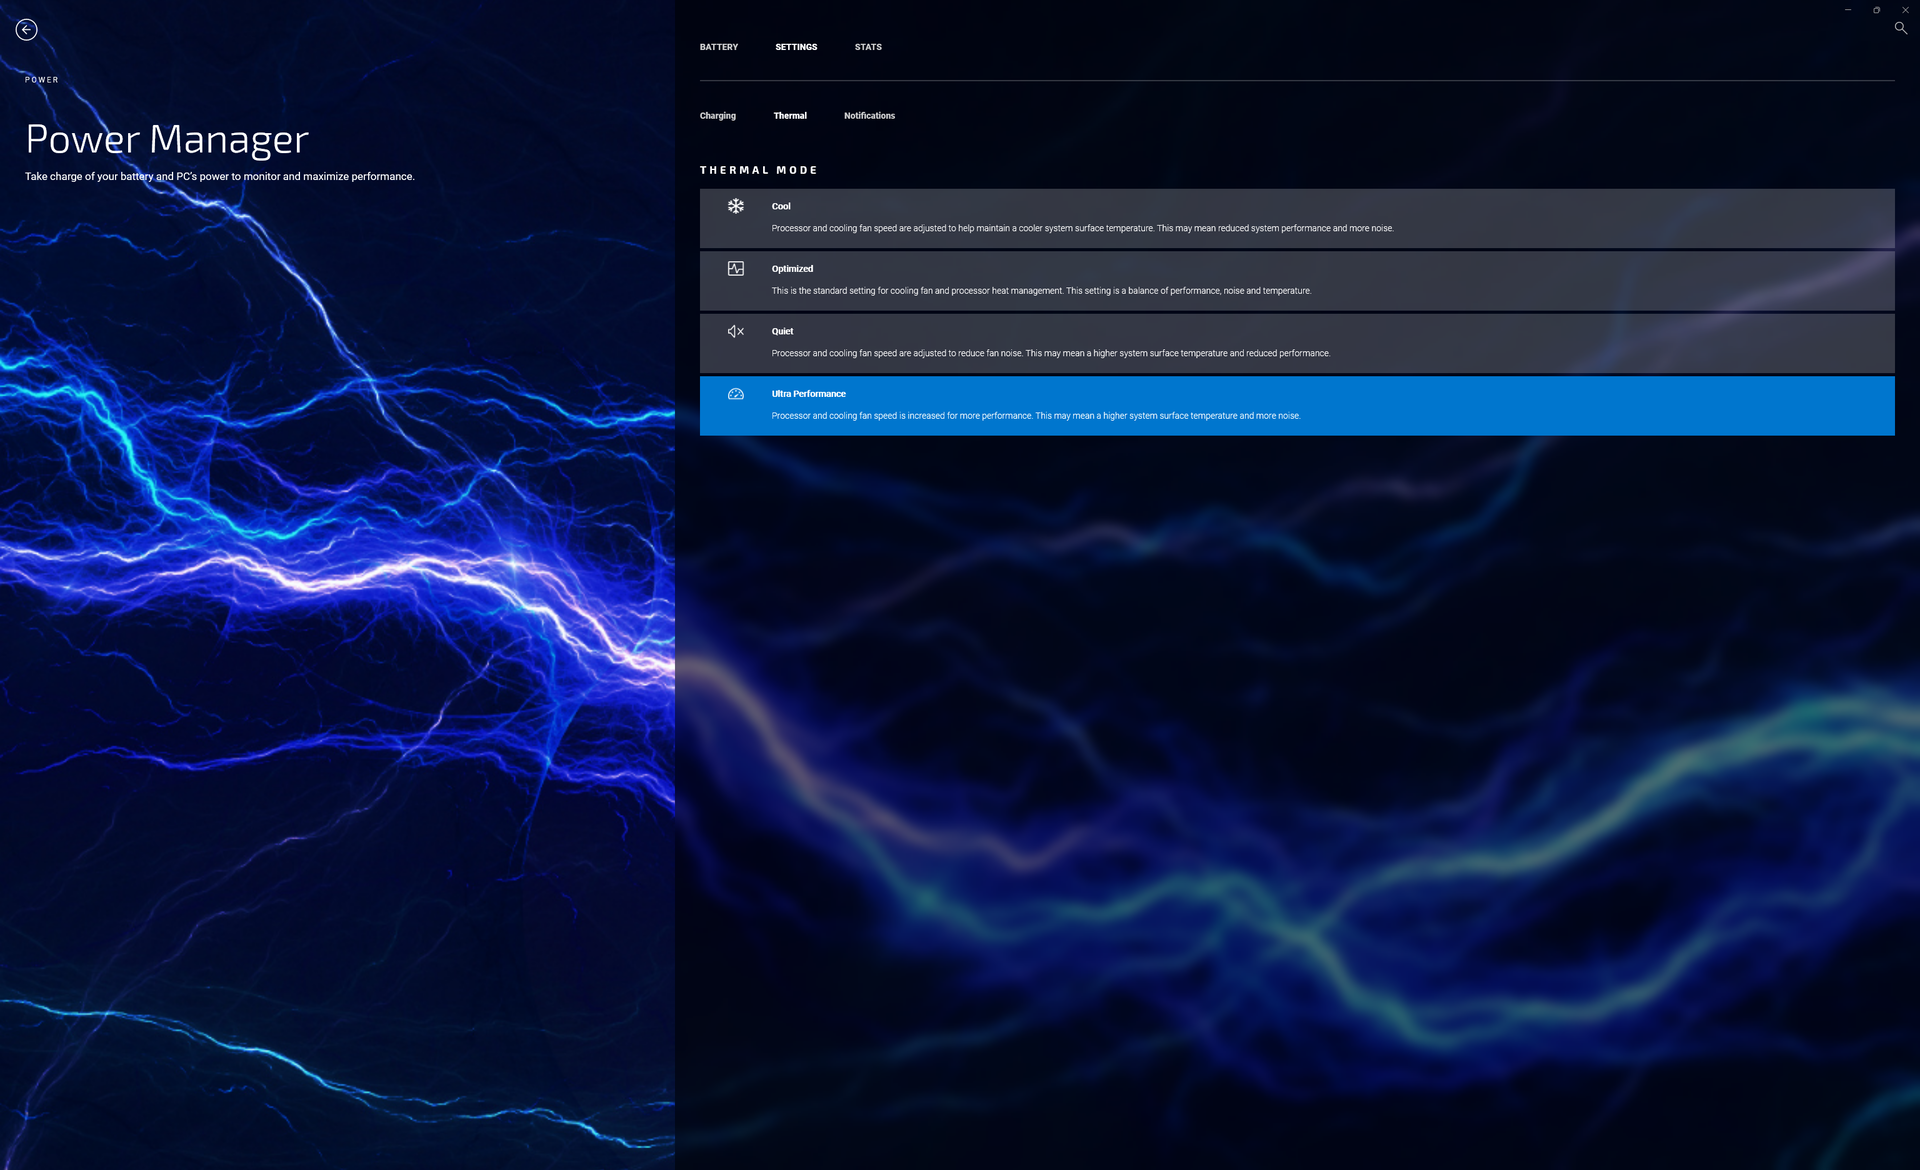
We hebben ons toestel ingesteld op de modus Prestaties via Windows en de modus Ultraprestaties via de vooraf geïnstalleerde MyDell-software voordat we de onderstaande benchmarks uitvoerden. Gebruikers moeten vertrouwd raken met MyDell omdat het de hub is voor garantiezaken, productregistratie, instellingen voor het opladen van de batterij en prestatiemodi
Nvidia Optimus wordt standaard geleverd zonder MUX-optie.
Processor
De ruwe multi-thread prestaties zijn ongeveer 30 tot 50 procent sneller dan de laatste generatie Core i7-11800H wat een vrij significante jaar-op-jaar boost betekent. De duurzaamheid van de prestaties zou echter nog wat beter kunnen, aangezien de CineBench R15 xT scores met ongeveer 18 procent zouden dalen wanneer de benchmark in een loop wordt uitgevoerd. We weten niet zeker hoeveel prestatiedip gebruikers moeten verwachten als ze downgraden naar de Core i5-12500H configuratie, omdat we op dit moment nog geen enkele laptop met zo'n CPU hebben getest.
Cinebench R15 Multi Loop
Cinebench R23: Multi Core | Single Core
Cinebench R15: CPU Multi 64Bit | CPU Single 64Bit
Blender: v2.79 BMW27 CPU
7-Zip 18.03: 7z b 4 | 7z b 4 -mmt1
Geekbench 5.5: Multi-Core | Single-Core
HWBOT x265 Benchmark v2.2: 4k Preset
LibreOffice : 20 Documents To PDF
R Benchmark 2.5: Overall mean
| Cinebench R20 / CPU (Multi Core) | |
| MSI Creator Z16P B12UHST | |
| Gigabyte Aero 16 YE5 | |
| Gemiddeld Intel Core i7-12700H (1576 - 7407, n=64) | |
| Razer Blade 15 2022 | |
| Dell Inspiron 16 Plus 7620 | |
| Lenovo Yoga 7 16IAP7 | |
| Dell Inspiron 16 Plus 7610-MHJ8F | |
| HP Victus 16-e0145ng | |
| Dell Inspiron 14 7420 2-in-1 | |
| Acer Swift X SFX16-51G-5388 | |
| HP Pavilion Gaming 16-a0242ng | |
| Cinebench R20 / CPU (Single Core) | |
| MSI Creator Z16P B12UHST | |
| Razer Blade 15 2022 | |
| Gigabyte Aero 16 YE5 | |
| Dell Inspiron 14 7420 2-in-1 | |
| Dell Inspiron 16 Plus 7620 | |
| Gemiddeld Intel Core i7-12700H (300 - 704, n=64) | |
| Lenovo Yoga 7 16IAP7 | |
| Dell Inspiron 16 Plus 7610-MHJ8F | |
| Acer Swift X SFX16-51G-5388 | |
| HP Victus 16-e0145ng | |
| HP Pavilion Gaming 16-a0242ng | |
| Cinebench R23 / Multi Core | |
| MSI Creator Z16P B12UHST | |
| Gigabyte Aero 16 YE5 | |
| Gemiddeld Intel Core i7-12700H (4032 - 19330, n=64) | |
| Razer Blade 15 2022 | |
| Dell Inspiron 16 Plus 7620 | |
| Dell Inspiron 16 Plus 7610-MHJ8F | |
| Lenovo Yoga 7 16IAP7 | |
| HP Victus 16-e0145ng | |
| Dell Inspiron 14 7420 2-in-1 | |
| Acer Swift X SFX16-51G-5388 | |
| Cinebench R23 / Single Core | |
| Gigabyte Aero 16 YE5 | |
| MSI Creator Z16P B12UHST | |
| Razer Blade 15 2022 | |
| Dell Inspiron 14 7420 2-in-1 | |
| Dell Inspiron 16 Plus 7620 | |
| Gemiddeld Intel Core i7-12700H (778 - 1826, n=63) | |
| Lenovo Yoga 7 16IAP7 | |
| Dell Inspiron 16 Plus 7610-MHJ8F | |
| HP Victus 16-e0145ng | |
| Acer Swift X SFX16-51G-5388 | |
| Cinebench R15 / CPU Single 64Bit | |
| Gigabyte Aero 16 YE5 | |
| MSI Creator Z16P B12UHST | |
| Razer Blade 15 2022 | |
| Dell Inspiron 16 Plus 7620 | |
| Gemiddeld Intel Core i7-12700H (113 - 263, n=65) | |
| Dell Inspiron 14 7420 2-in-1 | |
| Lenovo Yoga 7 16IAP7 | |
| Dell Inspiron 16 Plus 7610-MHJ8F | |
| HP Victus 16-e0145ng | |
| Acer Swift X SFX16-51G-5388 | |
| HP Pavilion Gaming 16-a0242ng | |
| HWBOT x265 Benchmark v2.2 / 4k Preset | |
| MSI Creator Z16P B12UHST | |
| Gigabyte Aero 16 YE5 | |
| Razer Blade 15 2022 | |
| Gemiddeld Intel Core i7-12700H (4.67 - 21.8, n=64) | |
| Dell Inspiron 16 Plus 7620 | |
| HP Victus 16-e0145ng | |
| Lenovo Yoga 7 16IAP7 | |
| Dell Inspiron 16 Plus 7610-MHJ8F | |
| Dell Inspiron 14 7420 2-in-1 | |
| Acer Swift X SFX16-51G-5388 | |
| HP Pavilion Gaming 16-a0242ng | |
| LibreOffice / 20 Documents To PDF | |
| HP Victus 16-e0145ng | |
| HP Pavilion Gaming 16-a0242ng | |
| Razer Blade 15 2022 | |
| Acer Swift X SFX16-51G-5388 | |
| Dell Inspiron 14 7420 2-in-1 | |
| Lenovo Yoga 7 16IAP7 | |
| Dell Inspiron 16 Plus 7620 | |
| Gemiddeld Intel Core i7-12700H (34.2 - 95.3, n=63) | |
| Dell Inspiron 16 Plus 7610-MHJ8F | |
| Gigabyte Aero 16 YE5 | |
| MSI Creator Z16P B12UHST | |
* ... kleiner is beter
AIDA64: FP32 Ray-Trace | FPU Julia | CPU SHA3 | CPU Queen | FPU SinJulia | FPU Mandel | CPU AES | CPU ZLib | FP64 Ray-Trace | CPU PhotoWorxx
| Performance rating | |
| Asus Vivobook Pro 16X-M7600QE | |
| Dell Inspiron 16 Plus 7620 | |
| Gemiddeld Intel Core i7-12700H | |
| Huawei MateBook D 16 2022 | |
| Lenovo Yoga 7 16IAP7 | |
| Acer Swift X SFX16-51G-5388 | |
| Dell Inspiron 16 Plus 7610 -9! | |
| AIDA64 / FP32 Ray-Trace | |
| Asus Vivobook Pro 16X-M7600QE | |
| Asus Vivobook Pro 16X-M7600QE | |
| Dell Inspiron 16 Plus 7620 | |
| Huawei MateBook D 16 2022 | |
| Gemiddeld Intel Core i7-12700H (2585 - 17957, n=64) | |
| Lenovo Yoga 7 16IAP7 | |
| Acer Swift X SFX16-51G-5388 | |
| AIDA64 / FPU Julia | |
| Asus Vivobook Pro 16X-M7600QE | |
| Asus Vivobook Pro 16X-M7600QE | |
| Dell Inspiron 16 Plus 7620 | |
| Huawei MateBook D 16 2022 | |
| Gemiddeld Intel Core i7-12700H (12439 - 90760, n=64) | |
| Lenovo Yoga 7 16IAP7 | |
| Acer Swift X SFX16-51G-5388 | |
| AIDA64 / CPU SHA3 | |
| Asus Vivobook Pro 16X-M7600QE | |
| Asus Vivobook Pro 16X-M7600QE | |
| Gemiddeld Intel Core i7-12700H (833 - 4242, n=64) | |
| Dell Inspiron 16 Plus 7620 | |
| Huawei MateBook D 16 2022 | |
| Lenovo Yoga 7 16IAP7 | |
| Acer Swift X SFX16-51G-5388 | |
| AIDA64 / CPU Queen | |
| Asus Vivobook Pro 16X-M7600QE | |
| Asus Vivobook Pro 16X-M7600QE | |
| Gemiddeld Intel Core i7-12700H (57923 - 103202, n=63) | |
| Huawei MateBook D 16 2022 | |
| Dell Inspiron 16 Plus 7620 | |
| Lenovo Yoga 7 16IAP7 | |
| Acer Swift X SFX16-51G-5388 | |
| AIDA64 / FPU SinJulia | |
| Asus Vivobook Pro 16X-M7600QE | |
| Asus Vivobook Pro 16X-M7600QE | |
| Gemiddeld Intel Core i7-12700H (3249 - 9939, n=64) | |
| Dell Inspiron 16 Plus 7620 | |
| Huawei MateBook D 16 2022 | |
| Lenovo Yoga 7 16IAP7 | |
| Acer Swift X SFX16-51G-5388 | |
| AIDA64 / FPU Mandel | |
| Asus Vivobook Pro 16X-M7600QE | |
| Asus Vivobook Pro 16X-M7600QE | |
| Dell Inspiron 16 Plus 7620 | |
| Gemiddeld Intel Core i7-12700H (7135 - 44760, n=64) | |
| Huawei MateBook D 16 2022 | |
| Lenovo Yoga 7 16IAP7 | |
| Acer Swift X SFX16-51G-5388 | |
| AIDA64 / CPU AES | |
| Asus Vivobook Pro 16X-M7600QE | |
| Asus Vivobook Pro 16X-M7600QE | |
| Huawei MateBook D 16 2022 | |
| Gemiddeld Intel Core i7-12700H (31839 - 144360, n=64) | |
| Dell Inspiron 16 Plus 7620 | |
| Acer Swift X SFX16-51G-5388 | |
| Lenovo Yoga 7 16IAP7 | |
| AIDA64 / CPU ZLib | |
| Dell Inspiron 16 Plus 7620 | |
| Gemiddeld Intel Core i7-12700H (305 - 1171, n=64) | |
| Asus Vivobook Pro 16X-M7600QE | |
| Asus Vivobook Pro 16X-M7600QE | |
| Huawei MateBook D 16 2022 | |
| Lenovo Yoga 7 16IAP7 | |
| Acer Swift X SFX16-51G-5388 | |
| Dell Inspiron 16 Plus 7610 | |
| AIDA64 / FP64 Ray-Trace | |
| Asus Vivobook Pro 16X-M7600QE | |
| Asus Vivobook Pro 16X-M7600QE | |
| Dell Inspiron 16 Plus 7620 | |
| Gemiddeld Intel Core i7-12700H (1437 - 9692, n=64) | |
| Huawei MateBook D 16 2022 | |
| Lenovo Yoga 7 16IAP7 | |
| Acer Swift X SFX16-51G-5388 | |
| AIDA64 / CPU PhotoWorxx | |
| Lenovo Yoga 7 16IAP7 | |
| Huawei MateBook D 16 2022 | |
| Acer Swift X SFX16-51G-5388 | |
| Dell Inspiron 16 Plus 7620 | |
| Gemiddeld Intel Core i7-12700H (12863 - 52207, n=64) | |
| Asus Vivobook Pro 16X-M7600QE | |
| Asus Vivobook Pro 16X-M7600QE | |
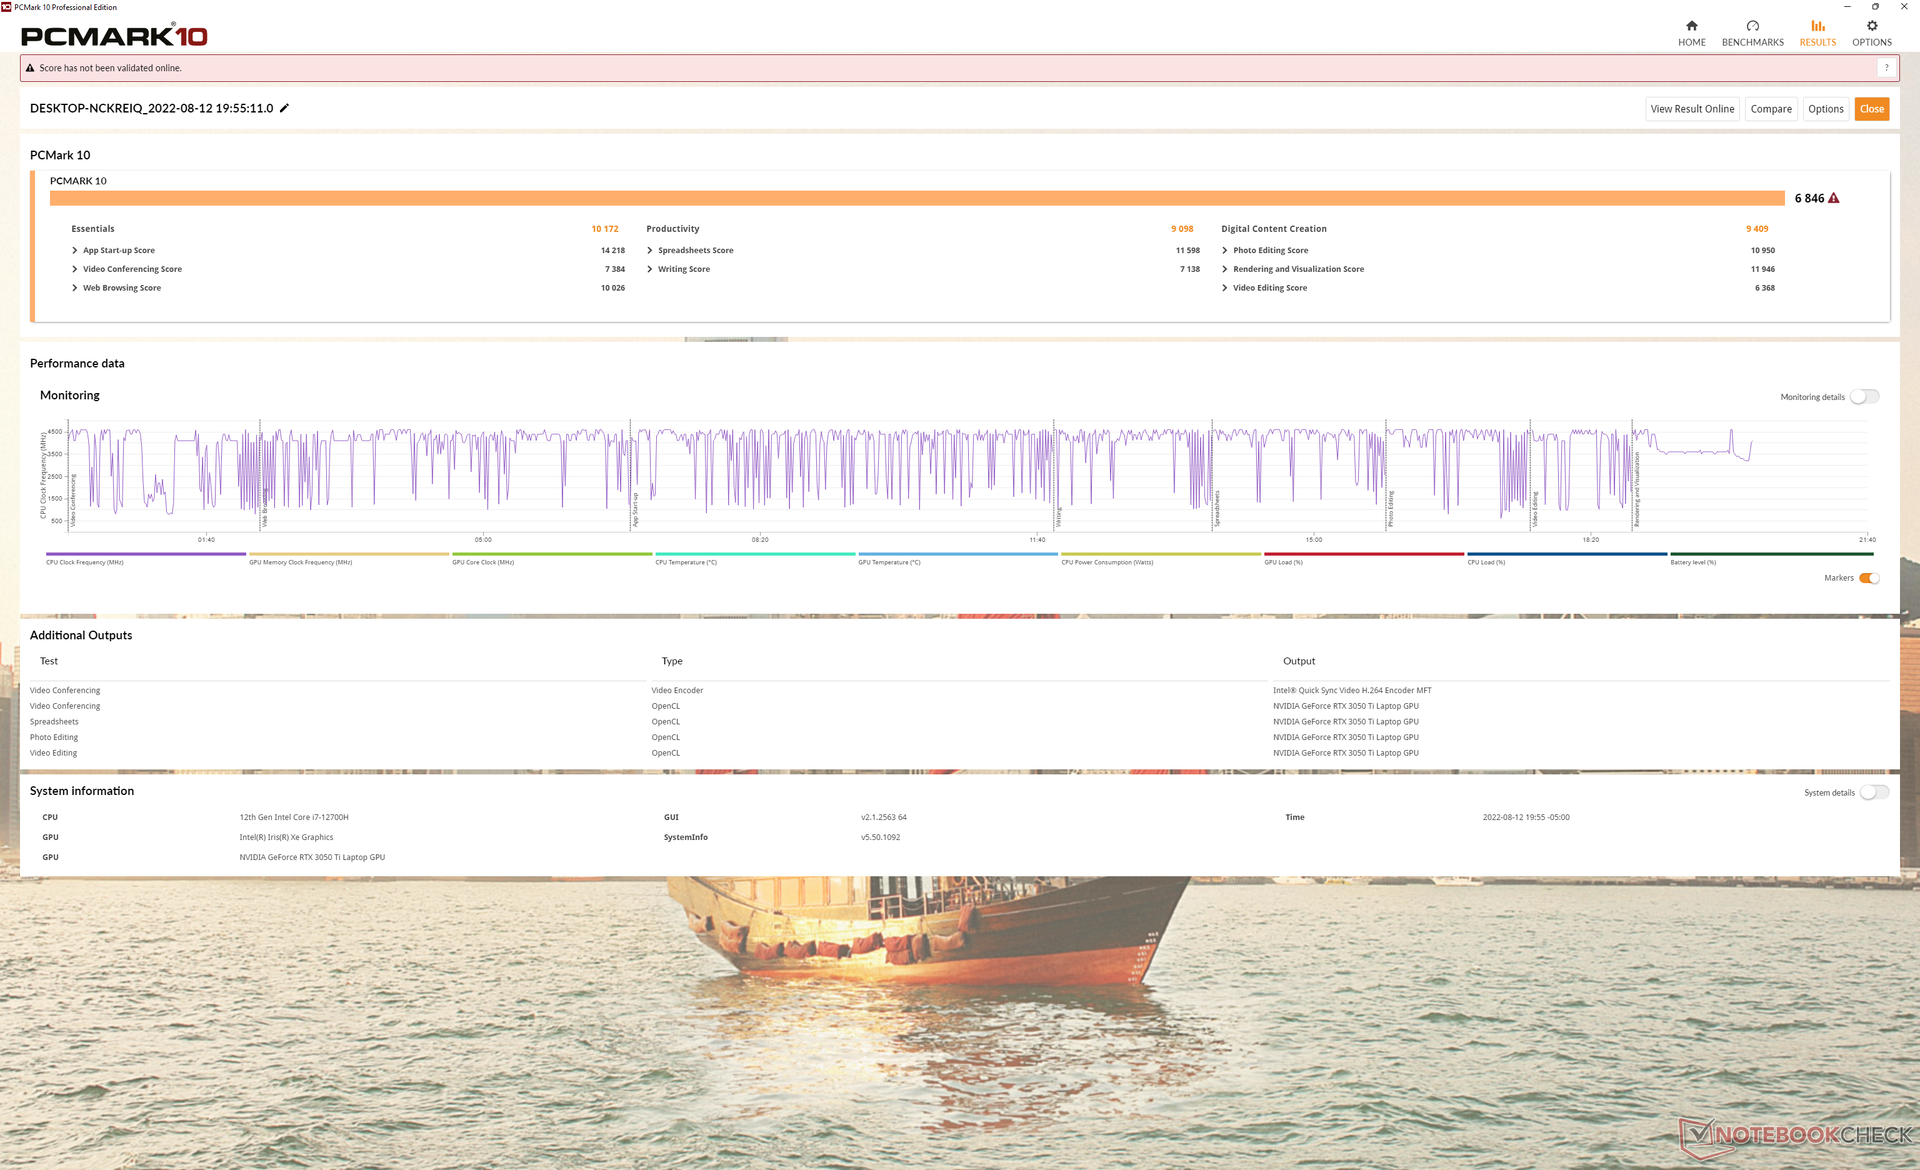
Systeemprestaties
De PCMark 10-resultaten zijn consistent hoger dan op de Inspiron 16 Plus 7610 van de vorige generatie, evenals op de meeste andere 16-inch multimedia-laptops.
CrossMark: Overall | Productivity | Creativity | Responsiveness
| PCMark 10 / Score | |
| Dell Inspiron 16 Plus 7620 | |
| Gemiddeld Intel Core i7-12700H, NVIDIA GeForce RTX 3050 Ti Laptop GPU (6623 - 7075, n=5) | |
| Asus Vivobook Pro 16X-M7600QE | |
| Dell Inspiron 16 Plus 7610 | |
| Huawei MateBook D 16 2022 | |
| Lenovo Yoga 7 16IAP7 | |
| Acer Swift X SFX16-51G-5388 | |
| PCMark 10 / Essentials | |
| Huawei MateBook D 16 2022 | |
| Lenovo Yoga 7 16IAP7 | |
| Asus Vivobook Pro 16X-M7600QE | |
| Gemiddeld Intel Core i7-12700H, NVIDIA GeForce RTX 3050 Ti Laptop GPU (9540 - 10970, n=5) | |
| Dell Inspiron 16 Plus 7620 | |
| Dell Inspiron 16 Plus 7610 | |
| Acer Swift X SFX16-51G-5388 | |
| PCMark 10 / Productivity | |
| Asus Vivobook Pro 16X-M7600QE | |
| Dell Inspiron 16 Plus 7620 | |
| Gemiddeld Intel Core i7-12700H, NVIDIA GeForce RTX 3050 Ti Laptop GPU (8530 - 9555, n=5) | |
| Acer Swift X SFX16-51G-5388 | |
| Dell Inspiron 16 Plus 7610 | |
| Huawei MateBook D 16 2022 | |
| Lenovo Yoga 7 16IAP7 | |
| PCMark 10 / Digital Content Creation | |
| Dell Inspiron 16 Plus 7620 | |
| Gemiddeld Intel Core i7-12700H, NVIDIA GeForce RTX 3050 Ti Laptop GPU (8855 - 9542, n=5) | |
| Dell Inspiron 16 Plus 7610 | |
| Asus Vivobook Pro 16X-M7600QE | |
| Lenovo Yoga 7 16IAP7 | |
| Huawei MateBook D 16 2022 | |
| Acer Swift X SFX16-51G-5388 | |
| CrossMark / Overall | |
| Huawei MateBook D 16 2022 | |
| Dell Inspiron 16 Plus 7620 | |
| Gemiddeld Intel Core i7-12700H, NVIDIA GeForce RTX 3050 Ti Laptop GPU (1654 - 1872, n=5) | |
| Lenovo Yoga 7 16IAP7 | |
| Acer Swift X SFX16-51G-5388 | |
| CrossMark / Productivity | |
| Huawei MateBook D 16 2022 | |
| Gemiddeld Intel Core i7-12700H, NVIDIA GeForce RTX 3050 Ti Laptop GPU (1595 - 1792, n=5) | |
| Dell Inspiron 16 Plus 7620 | |
| Lenovo Yoga 7 16IAP7 | |
| Acer Swift X SFX16-51G-5388 | |
| CrossMark / Creativity | |
| Huawei MateBook D 16 2022 | |
| Dell Inspiron 16 Plus 7620 | |
| Lenovo Yoga 7 16IAP7 | |
| Gemiddeld Intel Core i7-12700H, NVIDIA GeForce RTX 3050 Ti Laptop GPU (1699 - 1993, n=5) | |
| Acer Swift X SFX16-51G-5388 | |
| CrossMark / Responsiveness | |
| Huawei MateBook D 16 2022 | |
| Gemiddeld Intel Core i7-12700H, NVIDIA GeForce RTX 3050 Ti Laptop GPU (1383 - 1768, n=5) | |
| Dell Inspiron 16 Plus 7620 | |
| Lenovo Yoga 7 16IAP7 | |
| Acer Swift X SFX16-51G-5388 | |
| PCMark 10 Score | 6846 punten | |
Help | ||
| AIDA64 / Memory Copy | |
| Lenovo Yoga 7 16IAP7 | |
| Huawei MateBook D 16 2022 | |
| Acer Swift X SFX16-51G-5388 | |
| Dell Inspiron 16 Plus 7620 | |
| Gemiddeld Intel Core i7-12700H (25615 - 80511, n=64) | |
| Asus Vivobook Pro 16X-M7600QE | |
| Asus Vivobook Pro 16X-M7600QE | |
| AIDA64 / Memory Read | |
| Lenovo Yoga 7 16IAP7 | |
| Dell Inspiron 16 Plus 7620 | |
| Gemiddeld Intel Core i7-12700H (25586 - 79442, n=64) | |
| Huawei MateBook D 16 2022 | |
| Acer Swift X SFX16-51G-5388 | |
| Asus Vivobook Pro 16X-M7600QE | |
| Asus Vivobook Pro 16X-M7600QE | |
| AIDA64 / Memory Write | |
| Acer Swift X SFX16-51G-5388 | |
| Lenovo Yoga 7 16IAP7 | |
| Huawei MateBook D 16 2022 | |
| Dell Inspiron 16 Plus 7620 | |
| Gemiddeld Intel Core i7-12700H (23679 - 88660, n=64) | |
| Asus Vivobook Pro 16X-M7600QE | |
| Asus Vivobook Pro 16X-M7600QE | |
| AIDA64 / Memory Latency | |
| Acer Swift X SFX16-51G-5388 | |
| Huawei MateBook D 16 2022 | |
| Lenovo Yoga 7 16IAP7 | |
| Dell Inspiron 16 Plus 7620 | |
| Gemiddeld Intel Core i7-12700H (76.2 - 133.9, n=62) | |
| Asus Vivobook Pro 16X-M7600QE | |
| Asus Vivobook Pro 16X-M7600QE | |
| Dell Inspiron 16 Plus 7610 | |
* ... kleiner is beter
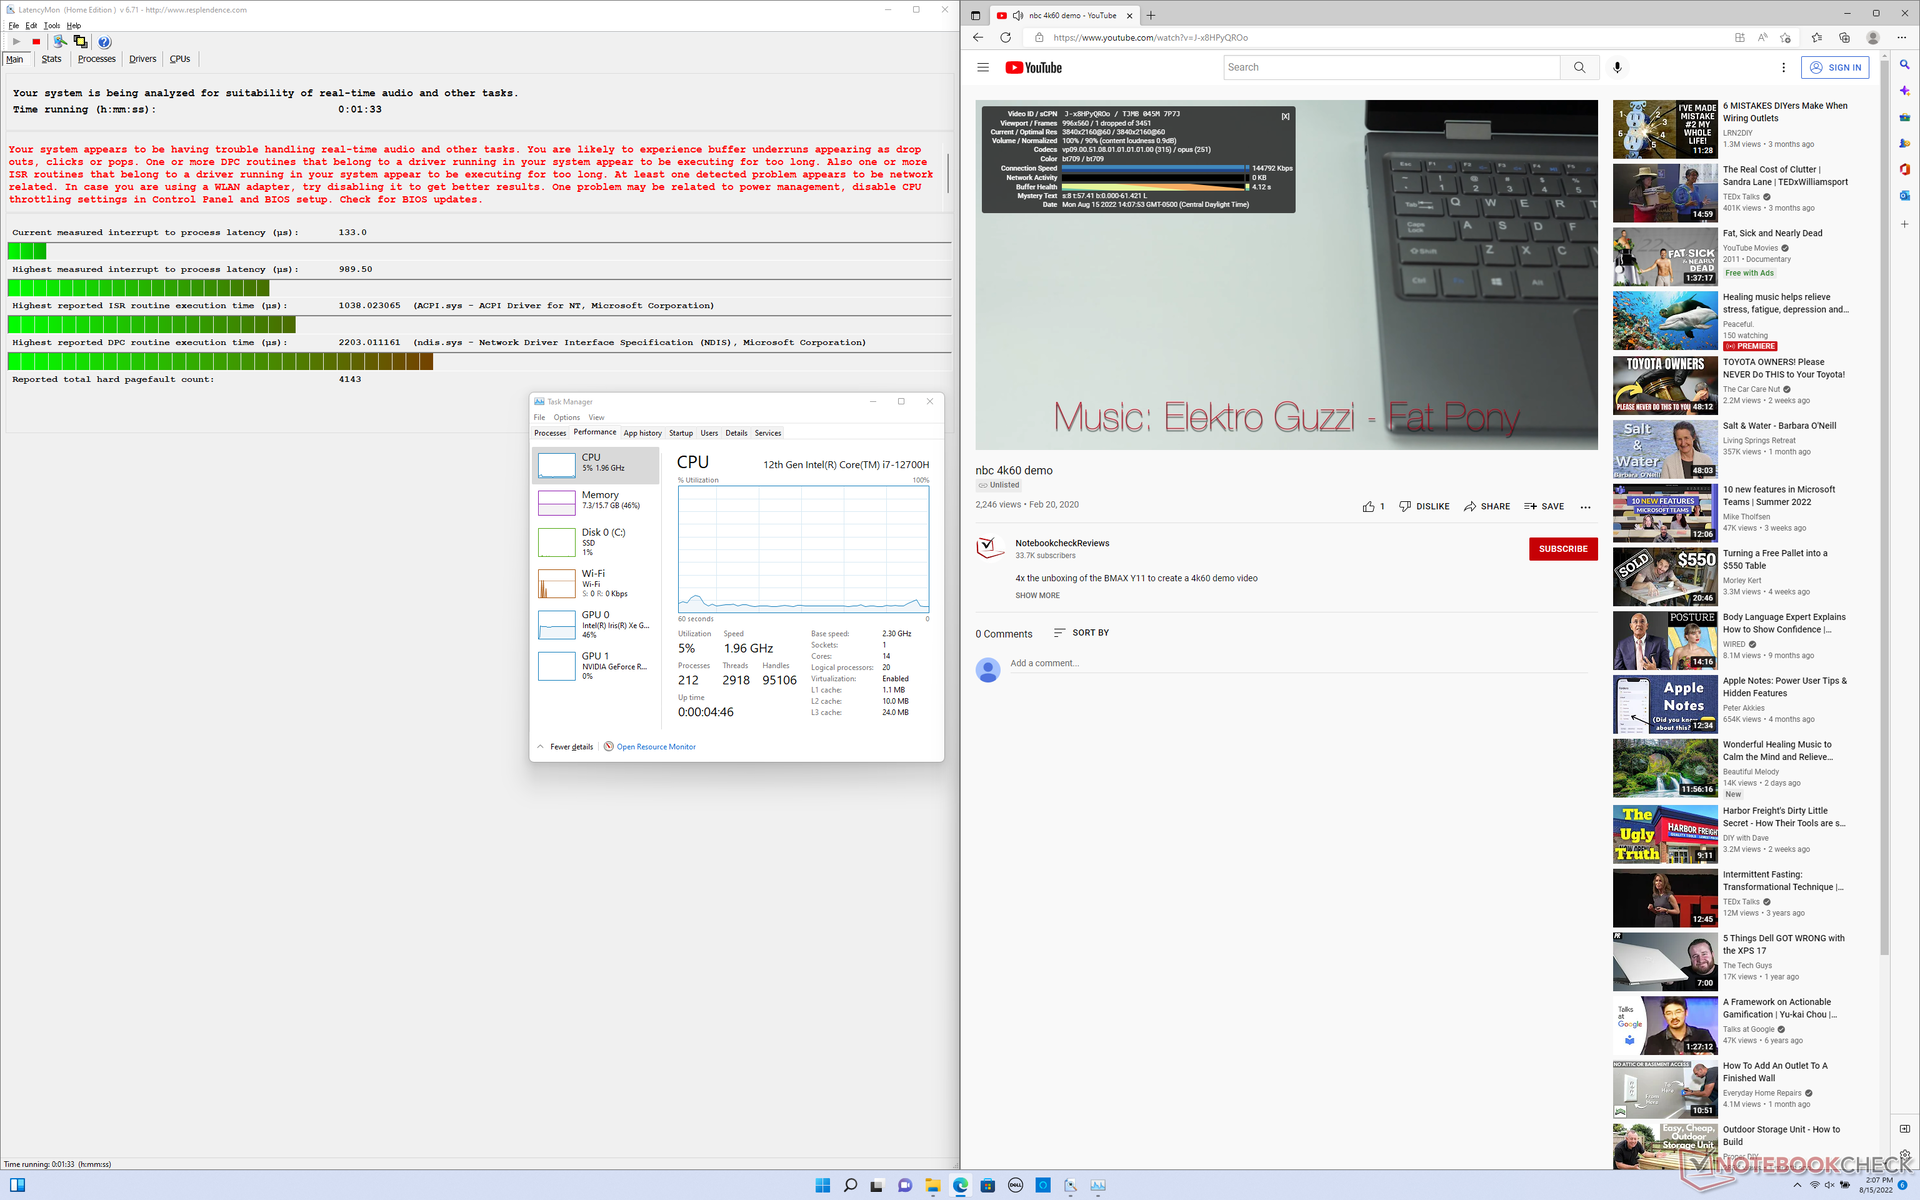
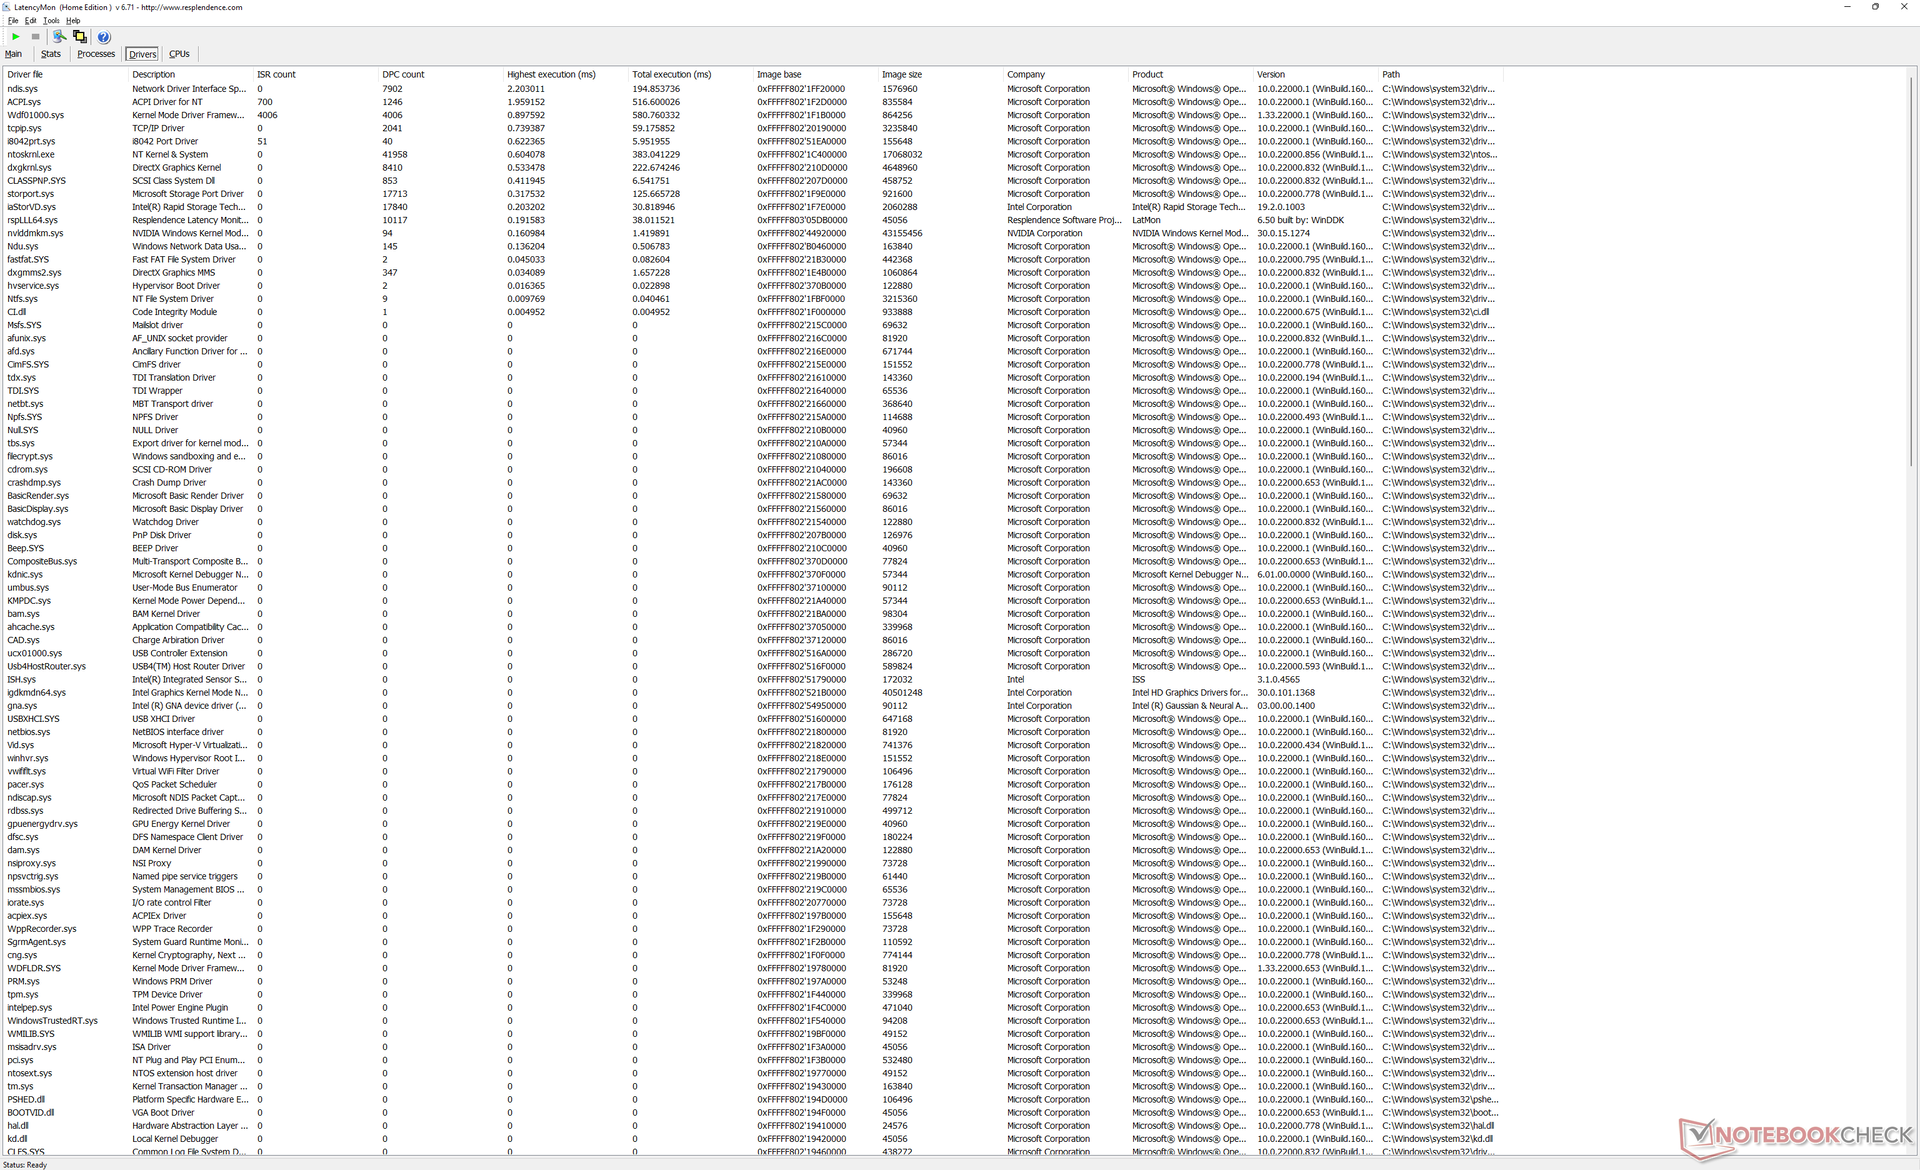
DPC latentie
LatencyMon onthult kleine DPC-problemen bij het openen van meerdere browsertabbladen op onze startpagina. het afspelen van 4K-video's met 60 FPS verloopt verder vloeiend, met slechts één uitgevallen frame tijdens onze minutenlange testvideo.
| DPC Latencies / LatencyMon - interrupt to process latency (max), Web, Youtube, Prime95 | |
| Acer Swift X SFX16-51G-5388 | |
| Asus Vivobook Pro 16X-M7600QE | |
| Dell Inspiron 16 Plus 7610 | |
| Dell Inspiron 16 Plus 7620 | |
| Huawei MateBook D 16 2022 | |
| Lenovo Yoga 7 16IAP7 | |
* ... kleiner is beter
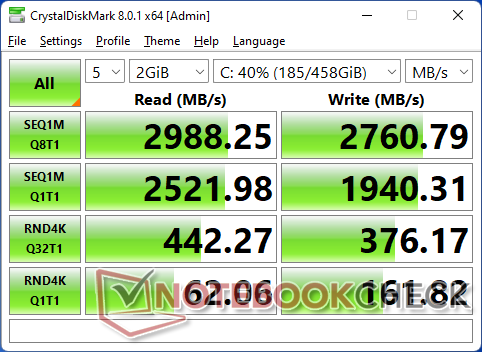
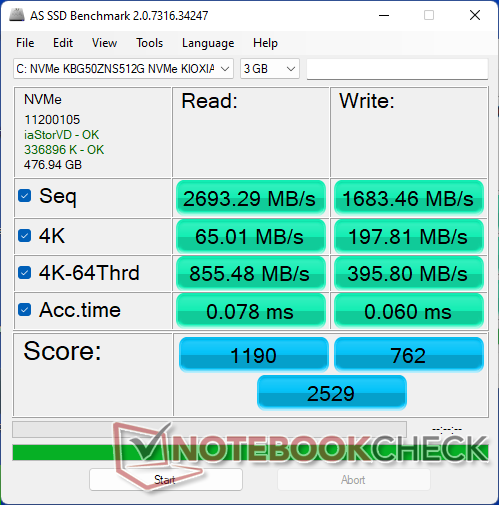
Opslagapparaten
Onze testeenheid wordt geleverd met een budget 512 GB PCIe4 x4 M.2Kioxia SSD voor sequentiële lees- en schrijfsnelheden tot ~2700 MB/s elk. Een koperen hitte verspreider ligt bovenop om te helpen bij de koeling. De schijf in onze unit vertoonde geen prestatie throttling problemen bij het draaien van DiskSpd in een loop.

| Drive Performance rating - Percent | |
| Huawei MateBook D 16 2022 | |
| Asus Vivobook Pro 16X-M7600QE | |
| Lenovo Yoga 7 16IAP7 | |
| Dell Inspiron 16 Plus 7620 | |
| Acer Swift X SFX16-51G-5388 | |
| Dell Inspiron 16 Plus 7610 | |
* ... kleiner is beter
Disk Throttling: DiskSpd Read Loop, Queue Depth 8
GPU-prestaties - Iets sneller dan voorheen
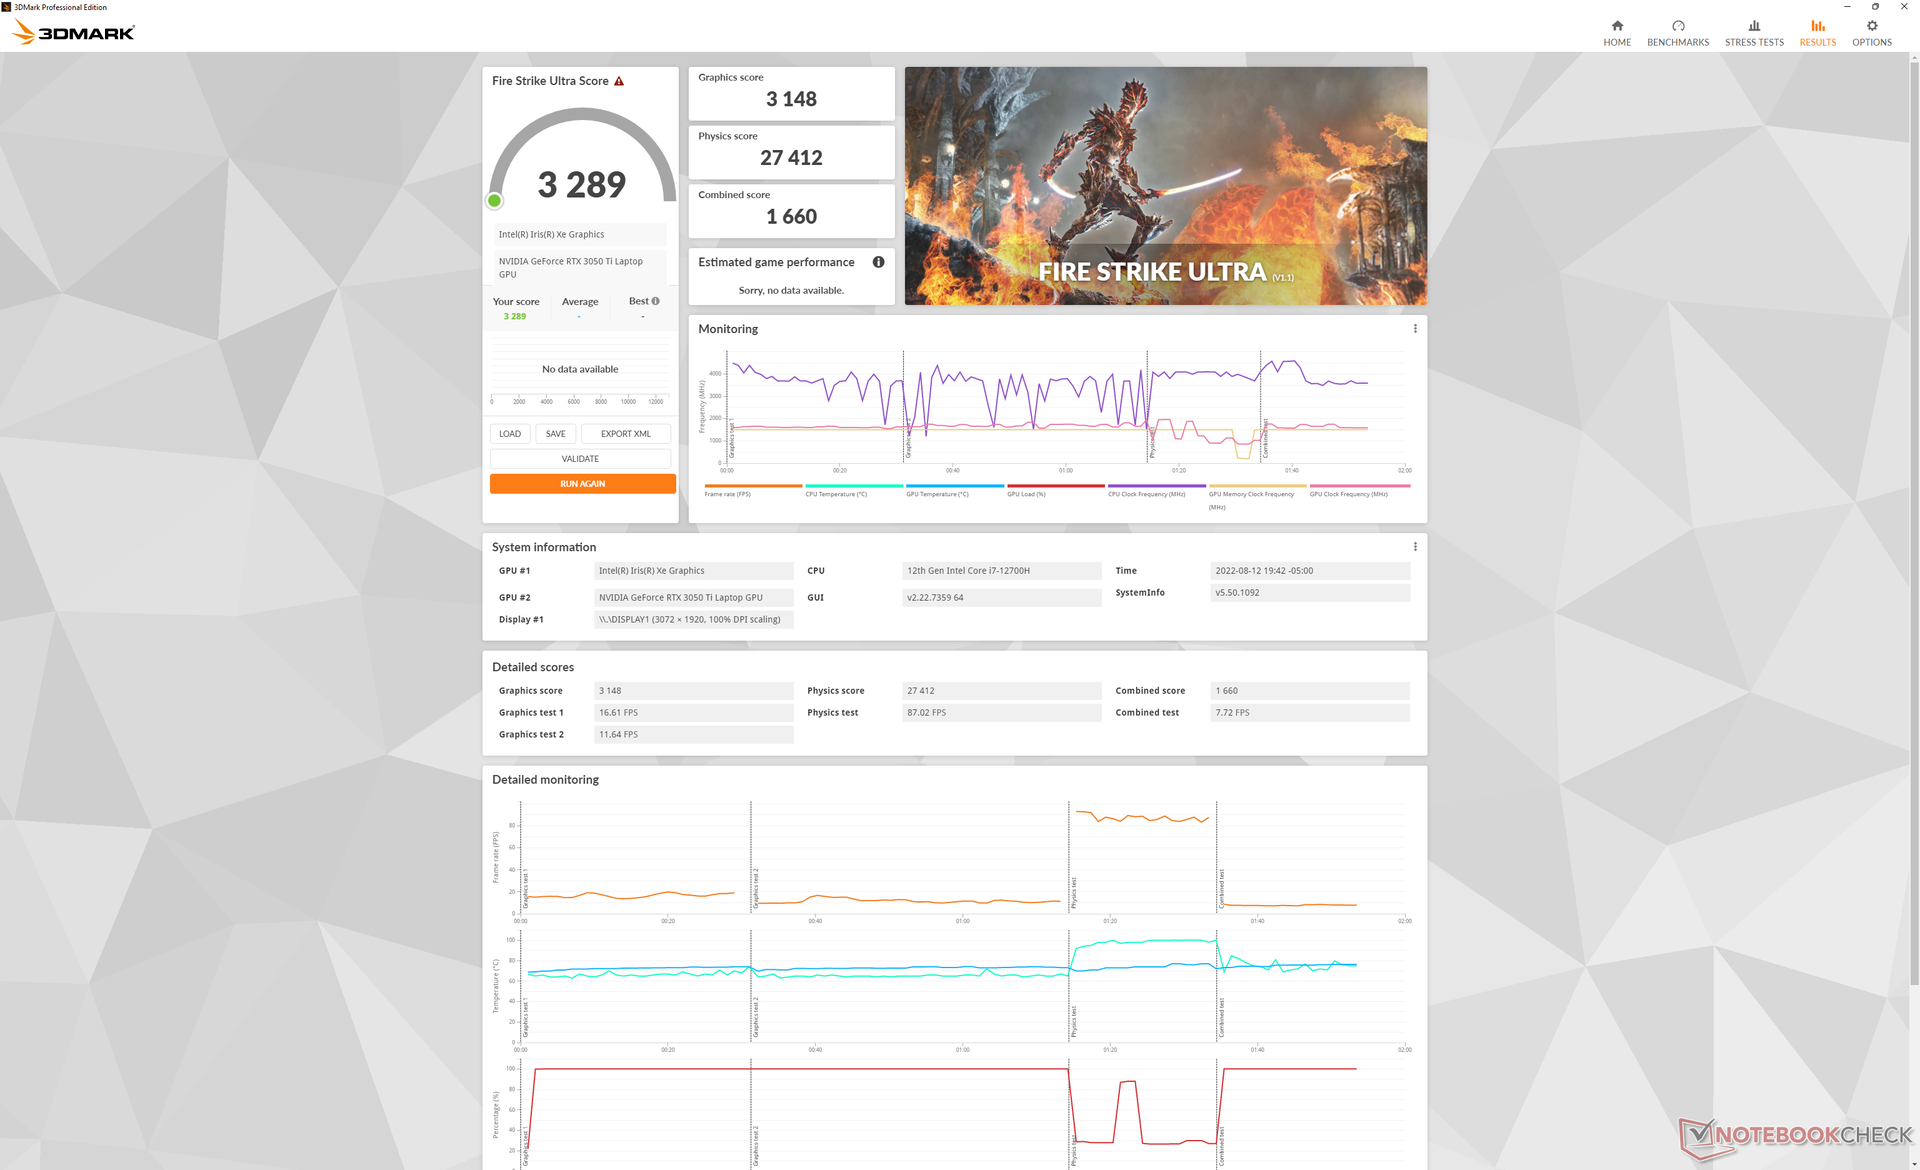
Grafische prestaties van onze GeForce RTX 3050 Ti is slechts ongeveer 10 procent sneller dan de RTX 3050 in het model van vorig jaar. Hoewel de RTX 3050 serie over het algemeen teleurstellend is sinds de oudere en goedkopere GTX 1660 Ti superieur is, is de implementatie van Dell hier in ieder geval sneller dan de meeste andere laptops met dezelfde GPU
Upgraden naar de RTX 3060 configuratie zal naar verwachting de grafische prestaties met maximaal 20 procent opkrikken. De GPU zou echter beperkt zijn tot een 60 W TGP, wat aan de onderkant van het spectrum is voor mobiele RTX 3060 opties.
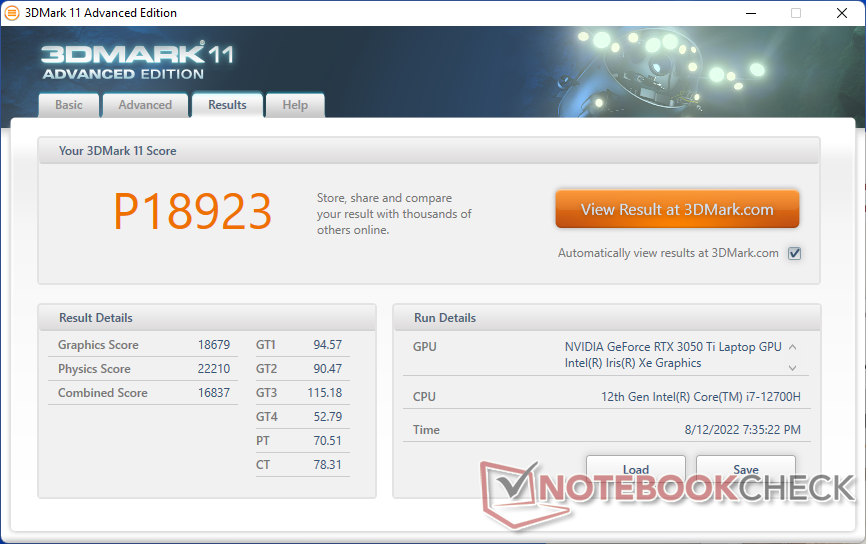
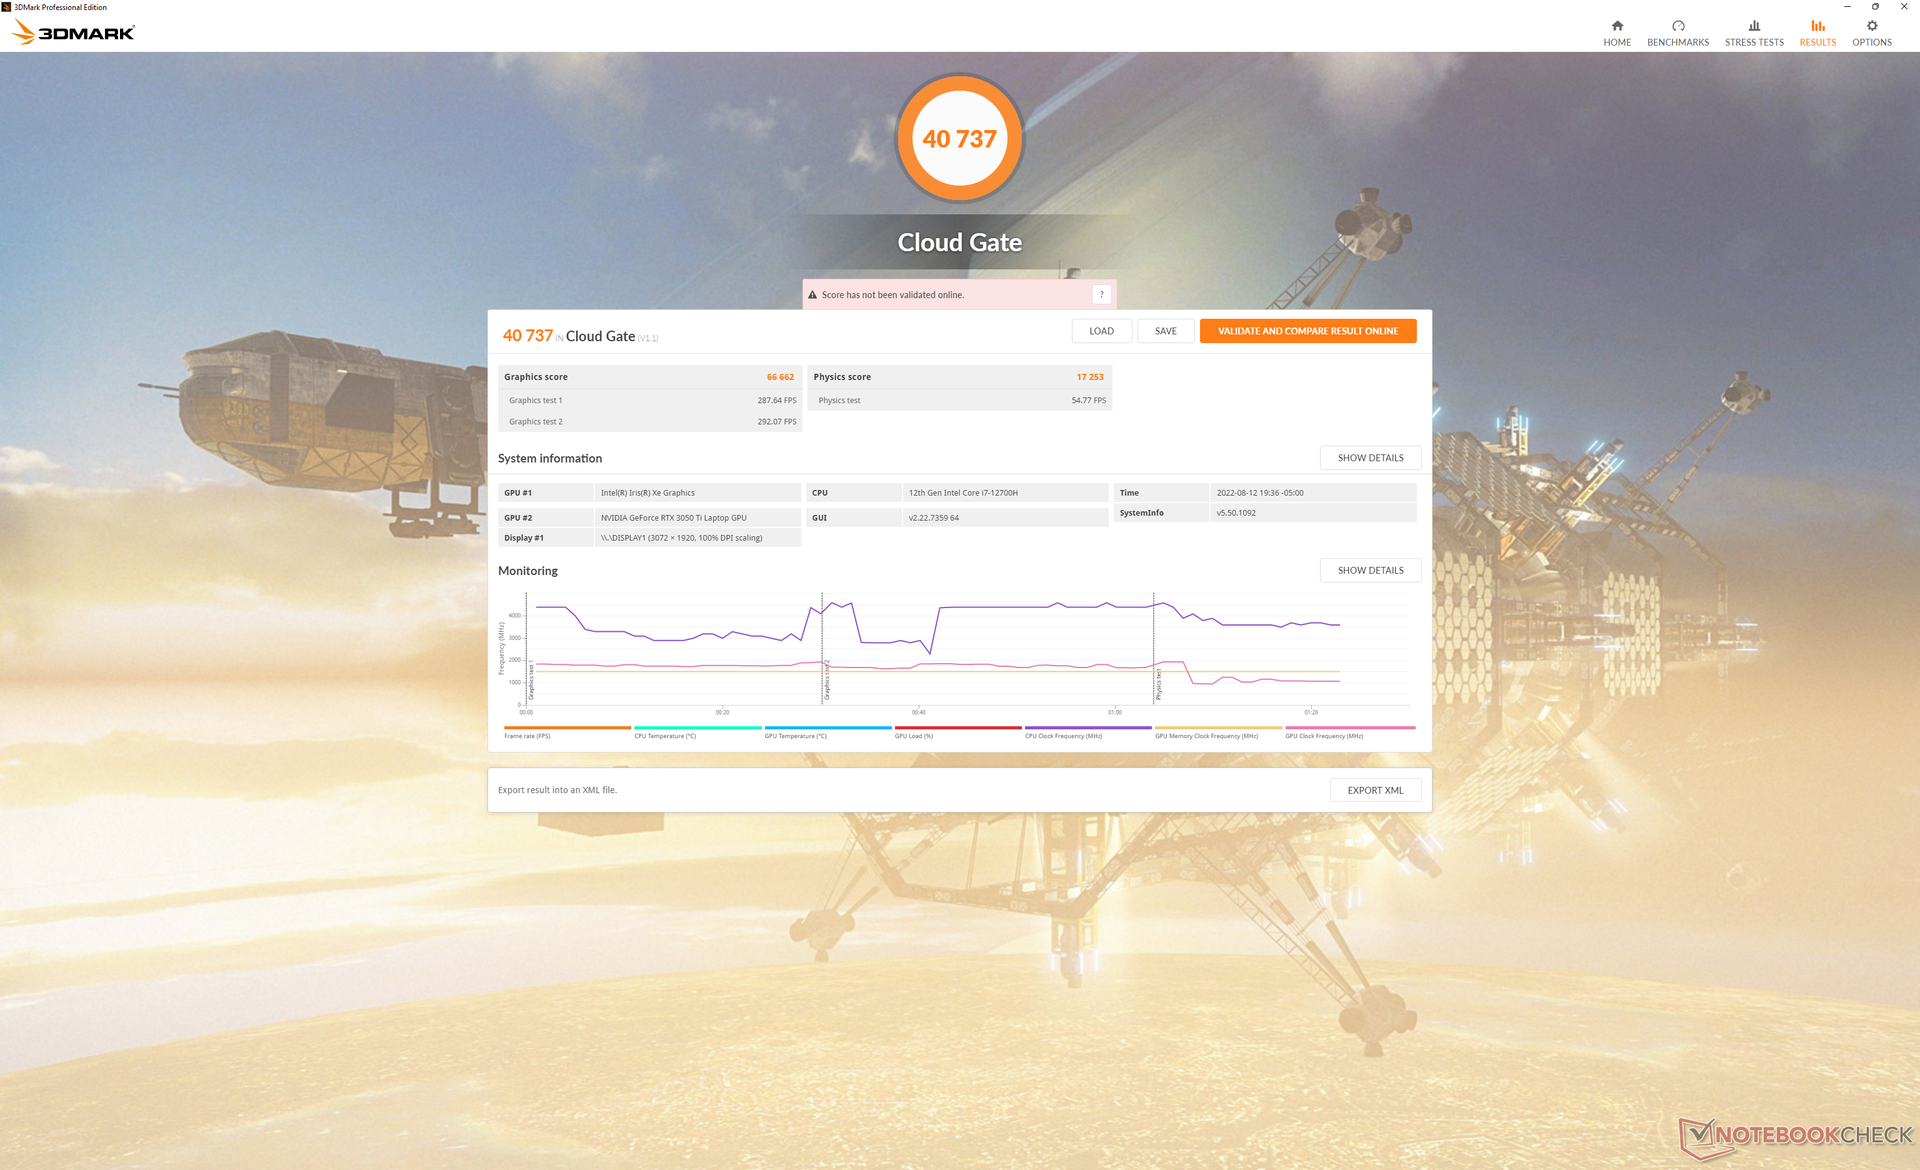
| 3DMark 11 Performance | 18923 punten | |
| 3DMark Cloud Gate Standard Score | 40737 punten | |
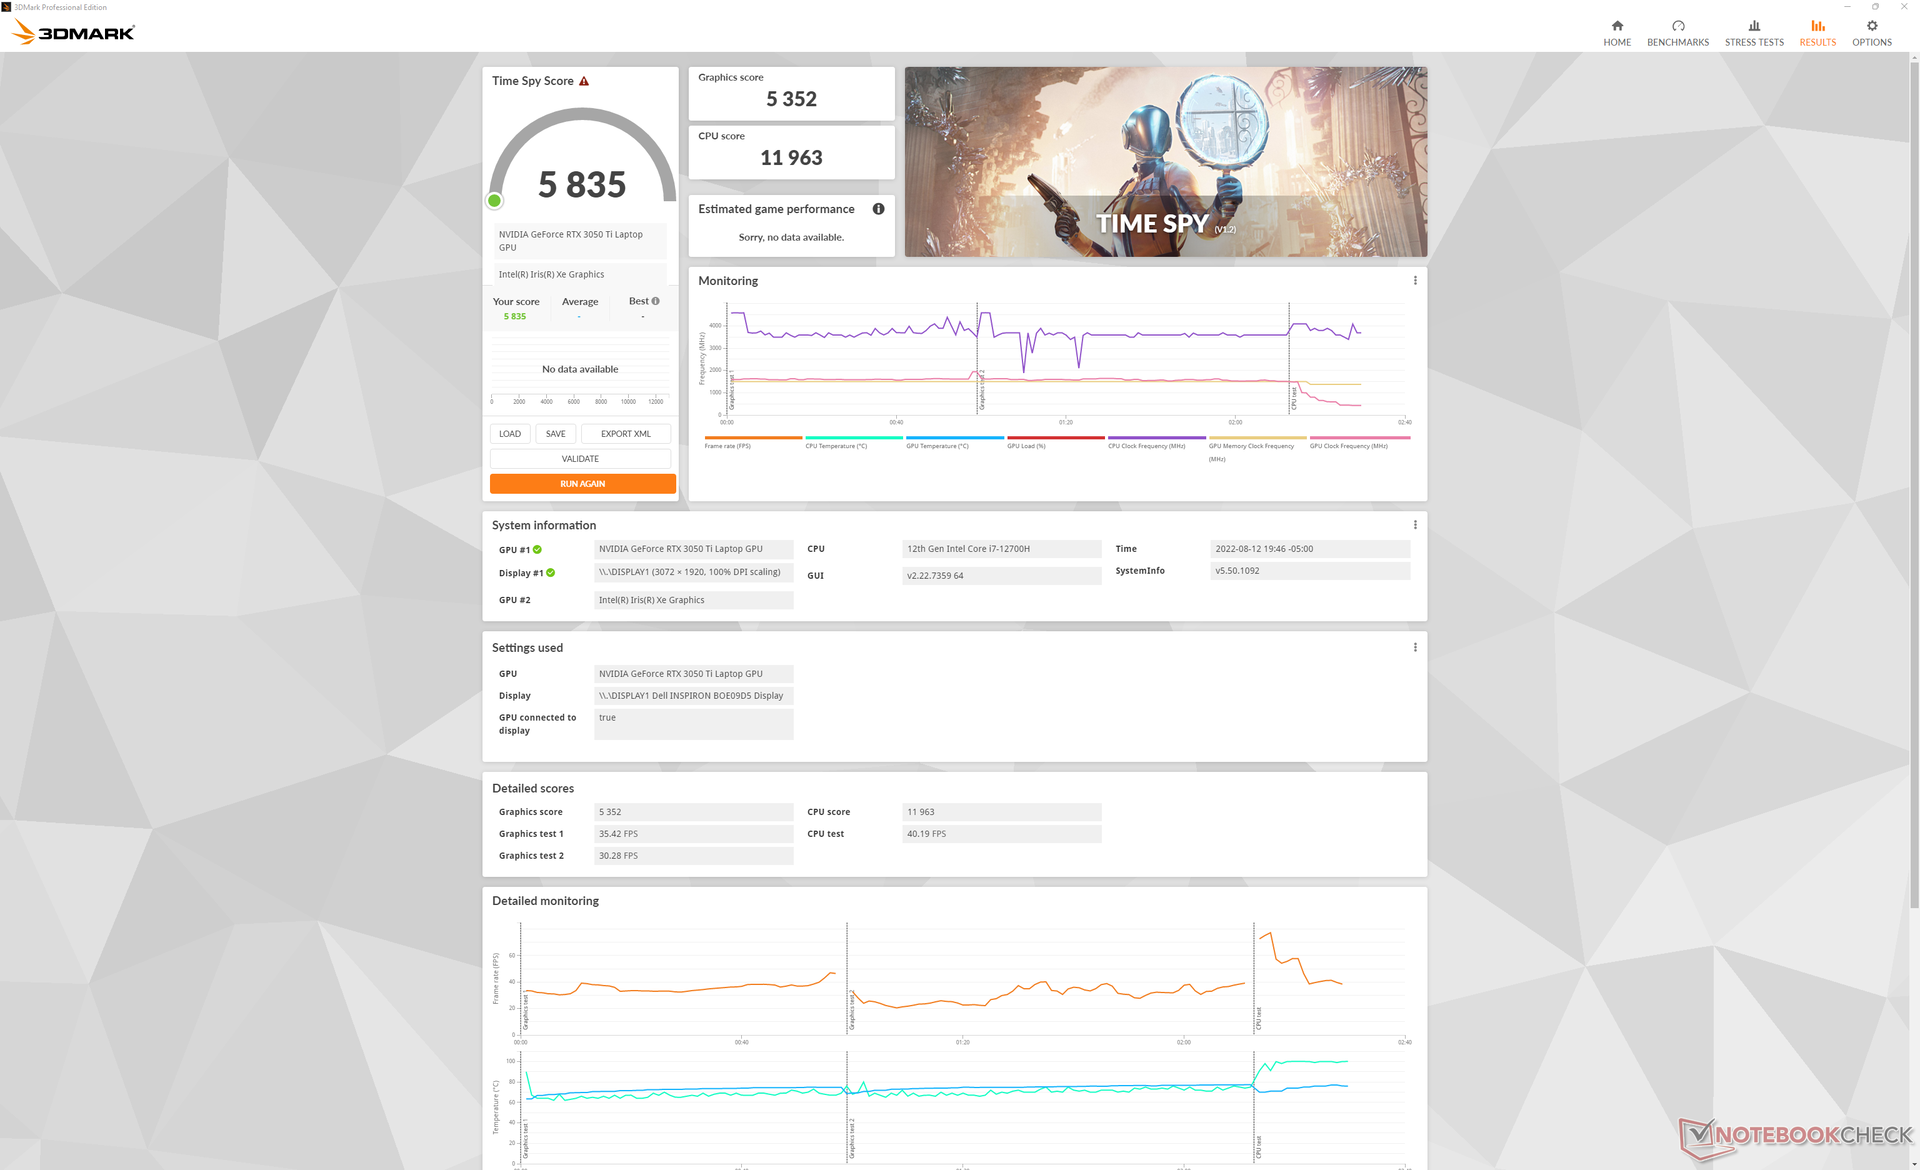
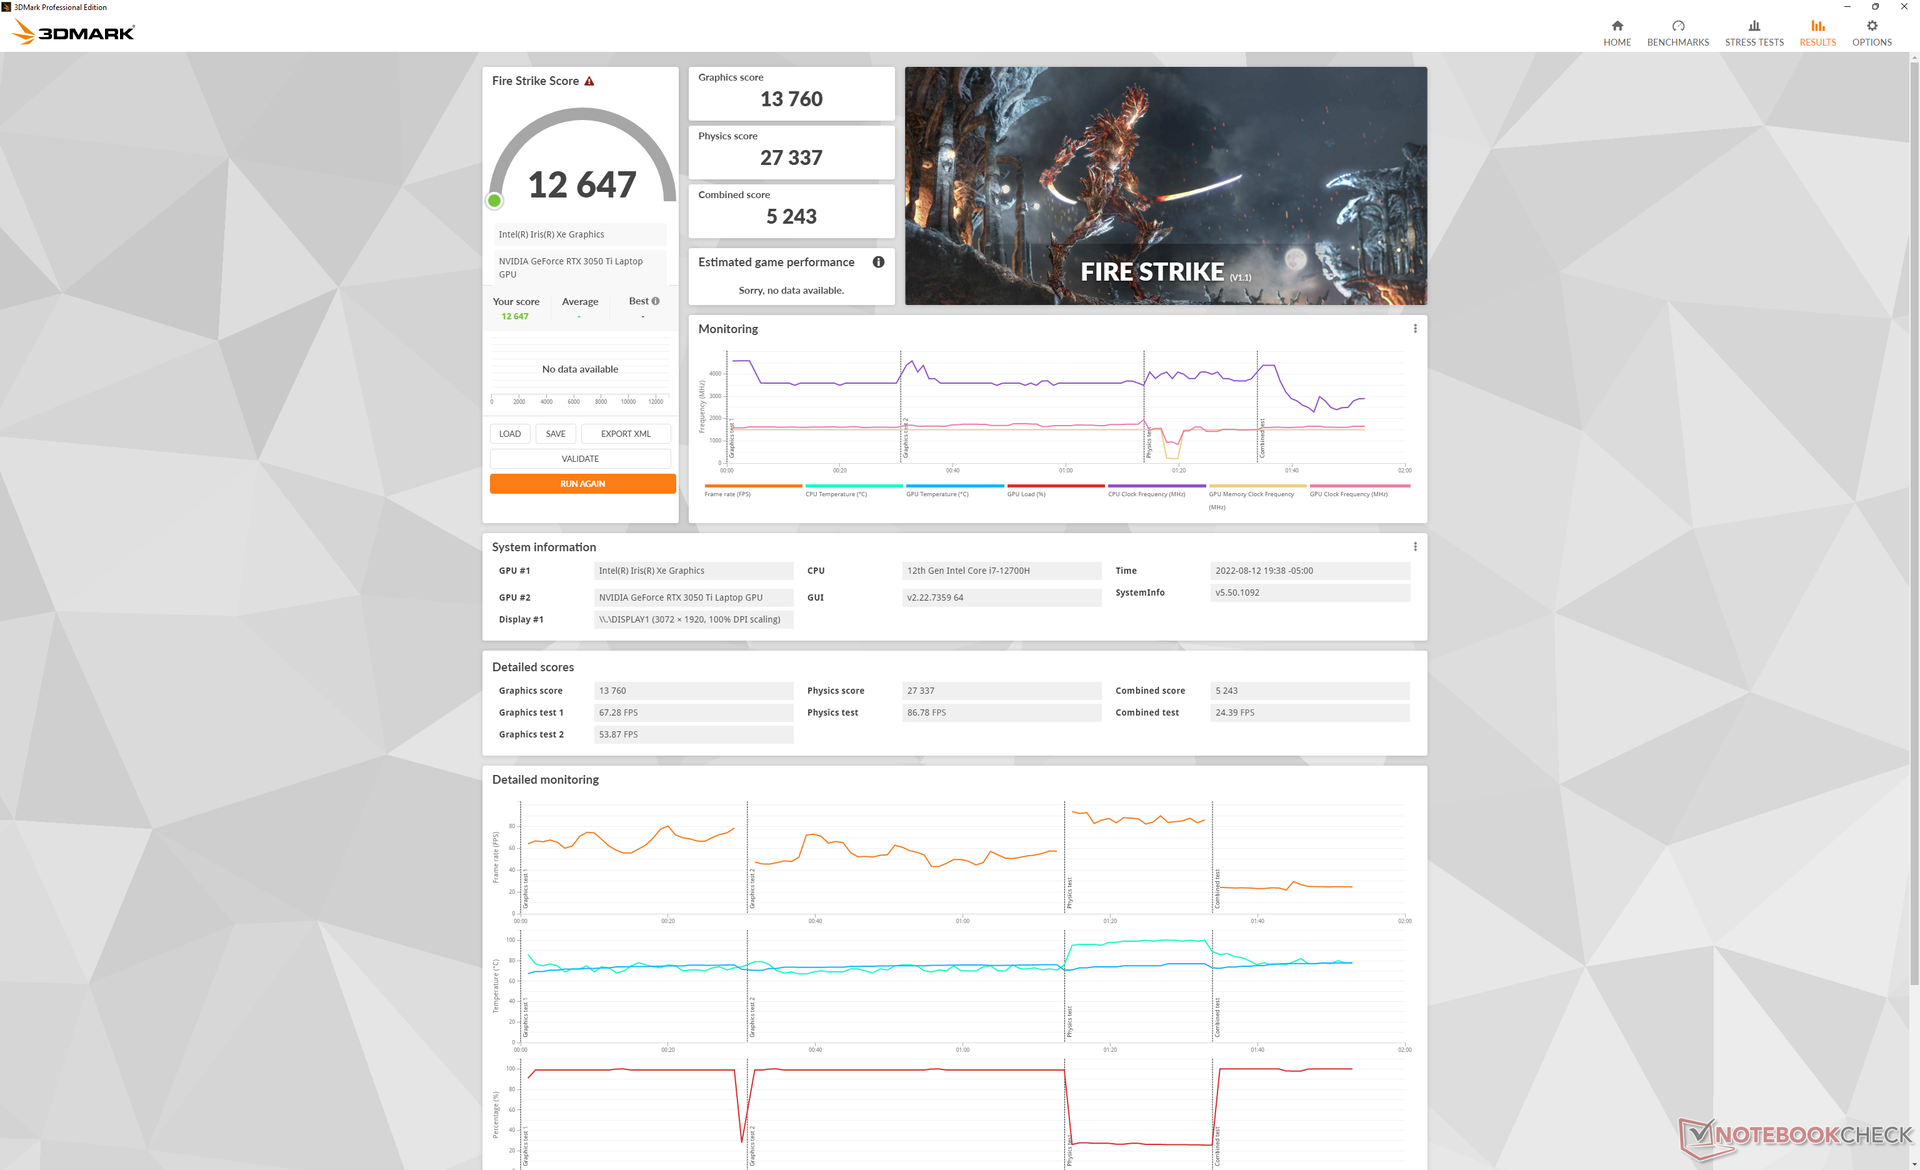
| 3DMark Fire Strike Score | 12647 punten | |
| 3DMark Time Spy Score | 5835 punten | |
Help | ||
| Cyberpunk 2077 1.6 | |
| 1920x1080 Low Preset | |
| Dell Inspiron 16 Plus 7620 | |
| Gemiddeld NVIDIA GeForce RTX 3050 Ti Laptop GPU (48.2 - 81.9, n=9) | |
| Lenovo Yoga 7 16IAP7 | |
| 1920x1080 Medium Preset | |
| Dell Inspiron 16 Plus 7620 | |
| Gemiddeld NVIDIA GeForce RTX 3050 Ti Laptop GPU (47.4 - 67.4, n=9) | |
| Lenovo Yoga 7 16IAP7 | |
| 1920x1080 High Preset | |
| Dell Inspiron 16 Plus 7620 | |
| Gemiddeld NVIDIA GeForce RTX 3050 Ti Laptop GPU (39 - 51.5, n=9) | |
| Lenovo Yoga 7 16IAP7 | |
| 1920x1080 Ultra Preset | |
| Gemiddeld NVIDIA GeForce RTX 3050 Ti Laptop GPU (31 - 50.5, n=9) | |
| Dell Inspiron 16 Plus 7620 | |
| Lenovo Yoga 7 16IAP7 | |
| 2560x1440 Ultra Preset | |
| Dell Inspiron 16 Plus 7620 | |
| Gemiddeld NVIDIA GeForce RTX 3050 Ti Laptop GPU (20 - 25, n=4) | |
Witcher 3 FPS Chart
| lage | gem. | hoge | ultra | QHD | |
|---|---|---|---|---|---|
| GTA V (2015) | 181.7 | 176.1 | 148.7 | 75.4 | 53.4 |
| The Witcher 3 (2015) | 297.3 | 183 | 108.4 | 57 | |
| Dota 2 Reborn (2015) | 171.8 | 157.5 | 148 | 140.7 | |
| Final Fantasy XV Benchmark (2018) | 138.9 | 77.7 | 54.1 | 38.1 | |
| X-Plane 11.11 (2018) | 132.5 | 115.6 | 92.8 | ||
| Strange Brigade (2018) | 307 | 138.3 | 110.2 | 95.2 | 69.1 |
| Cyberpunk 2077 1.6 (2022) | 79.5 | 66.2 | 47.9 | 39.5 | 23.4 |
Emissies - Kan stiller
Systeemgeluid
Ventilatorgeluid is altijd aanwezig, omdat beide ventilatoren nooit echt stationair draaien, zelfs niet wanneer de computer op een bureaublad zit zonder draaiende applicaties. Op zijn stilst registreren we een geluid van 25,7 dB(A) tegen een stille achtergrond van 23,3 dB(A), zelfs als het systeem is ingesteld op het "Quiet" power profiel. Bovendien duurt het een tijdje voordat het ventilatorgeluid weer tot rust komt na het uitvoeren van hoge belastingen zoals games. Na het sluiten van Witcher 3blijven de ventilatoren bijvoorbeeld nog enkele minuten luidruchtig.
Het ventilatorgeluid stabiliseert zich op 49,2 dB(A) wanneer de Witcher 3 in Ultra Performance modus of 46,1 dB(A) in Balanced modus, om luider te zijn dan de Vivobook Pro 16X uitgerust met dezelfde RTX 3050 Ti GPU. Het hoge 40 dB(A) bereik heeft meer gemeen met gaming laptops met een hoog vermogen dan met andere multimedia laptops.
Geluidsniveau
| Onbelast |
| 25.7 / 26.1 / 30.6 dB (A) |
| Belasting |
| 46.2 / 49.4 dB (A) |
 | ||
30 dB stil 40 dB(A) hoorbaar 50 dB(A) luid |
||
min: | ||
| Dell Inspiron 16 Plus 7620 GeForce RTX 3050 Ti Laptop GPU, i7-12700H, Kioxia BG5 KBG50ZNS512G | Dell Inspiron 16 Plus 7610 GeForce RTX 3050 4GB Laptop GPU, i7-11800H, Kingston OM3PDP3512B | Lenovo Yoga 7 16IAP7 Iris Xe G7 96EUs, i7-1260P, Micron 2450 512GB MTFDKCD512TFK | Huawei MateBook D 16 2022 Iris Xe G7 96EUs, i7-12700H, Silicon Motion PCIe-8 SSD | Acer Swift X SFX16-51G-5388 GeForce RTX 3050 4GB Laptop GPU, i5-11320H, Samsung PM991 MZVLQ512HBLU | Asus Vivobook Pro 16X-M7600QE GeForce RTX 3050 Ti Laptop GPU, R9 5900HX, SK Hynix HFM001TD3JX013N | |
|---|---|---|---|---|---|---|
| Noise | 3% | 14% | 8% | 3% | 1% | |
| uit / omgeving * (dB) | 23.3 | 24.4 -5% | 23.6 -1% | 24.2 -4% | 25.4 -9% | 26 -12% |
| Idle Minimum * (dB) | 25.7 | 24.4 5% | 23.6 8% | 24.2 6% | 25.4 1% | 27 -5% |
| Idle Average * (dB) | 26.1 | 24.4 7% | 23.6 10% | 25.8 1% | 25.4 3% | 27 -3% |
| Idle Maximum * (dB) | 30.6 | 24.4 20% | 23.6 23% | 30.5 -0% | 27.8 9% | 27.5 10% |
| Load Average * (dB) | 46.2 | 48.3 -5% | 37.7 18% | 39.8 14% | 41 11% | 41.7 10% |
| Witcher 3 ultra * (dB) | 49.2 | 48.9 1% | 40 19% | 39.8 19% | ||
| Load Maximum * (dB) | 49.4 | 48.9 1% | 40.2 19% | 39.8 19% | 47 5% | 45.3 8% |
* ... kleiner is beter
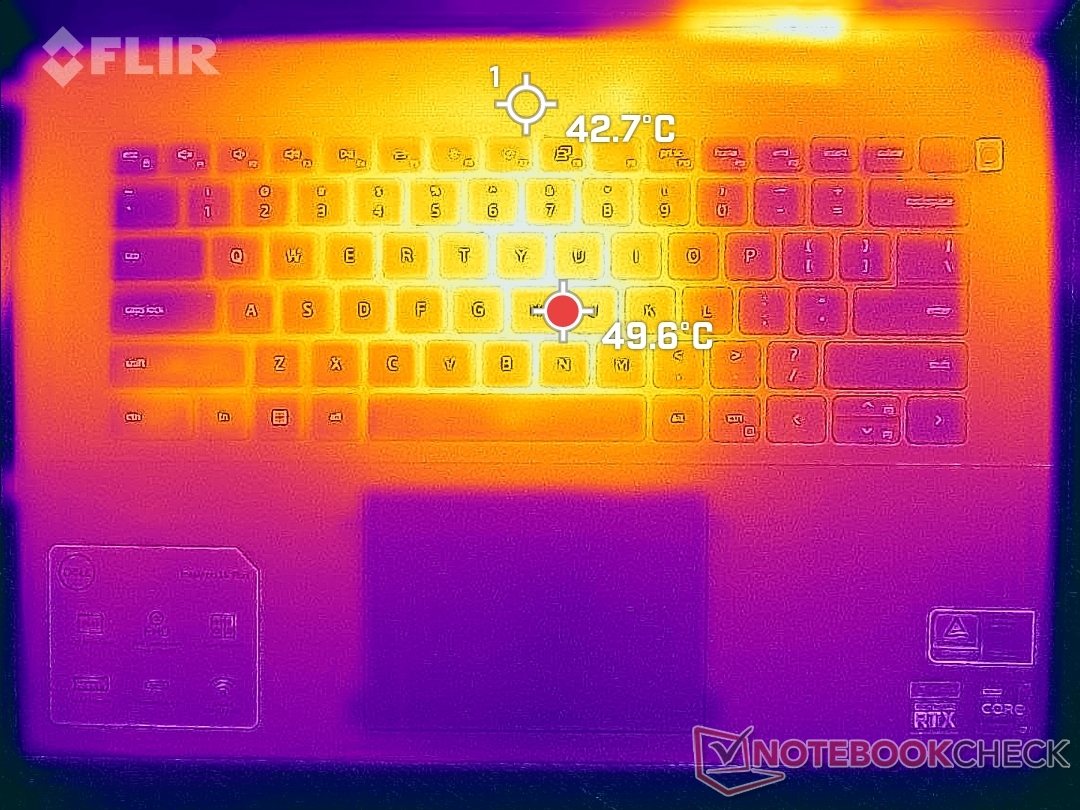
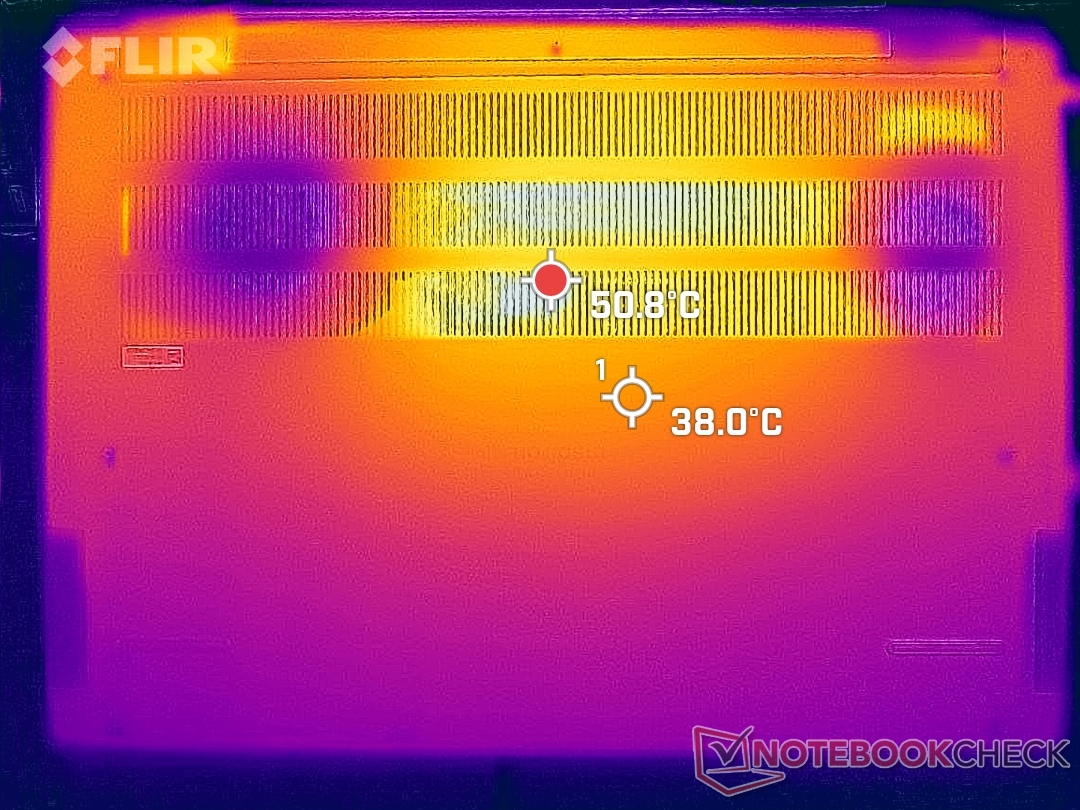
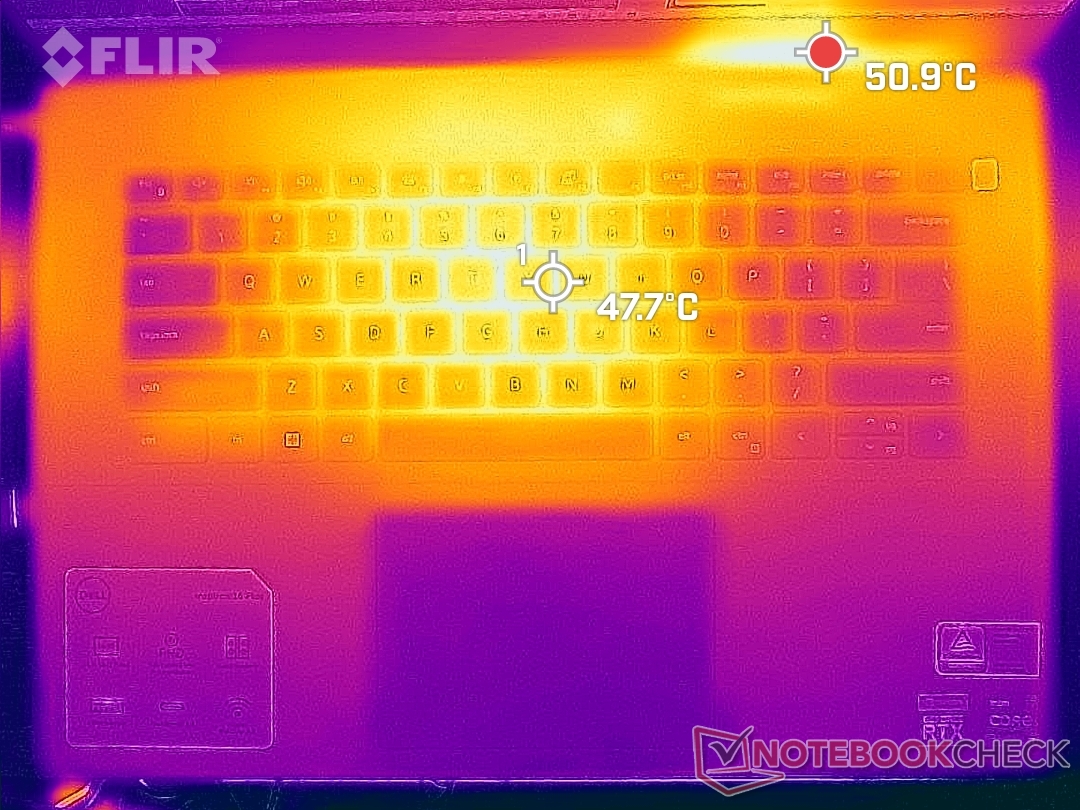
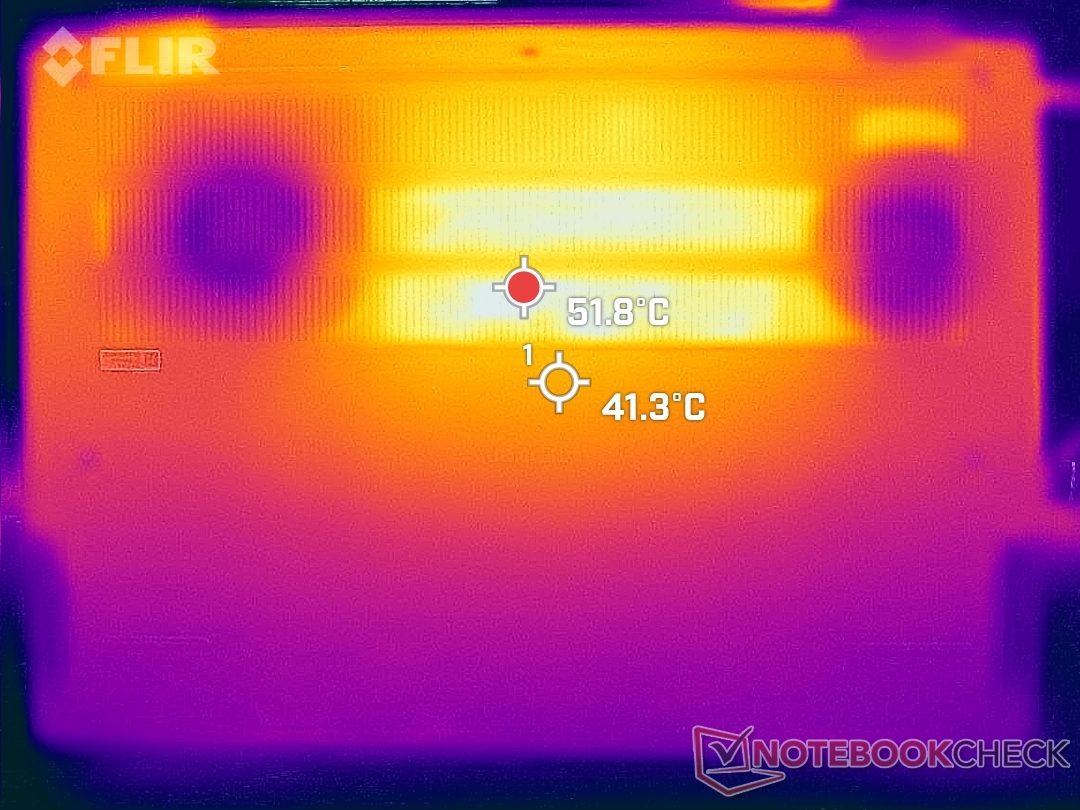
Temperatuur
Hete plekken zijn in het midden van het toetsenbord, waar de temperatuur kan oplopen tot 50 C bij hoge belasting zoals games. Andere 16-inch laptops zoals de Asus Vivobook Pro 16X, Lenovo Yoga 7, en zelfs de oudere Inspiron 16 7610 zijn koeler met meer dan een paar graden bij soortgelijke belastingen. De palmsteunen kunnen ook warmer zijn dan verwacht met 30 C in vergelijking met het meer gebruikelijke midden 20 C bereik. De Inspiron 16 Plus 7620 is zeker meer een bureaulaptop dan een laptop voor op schoot.
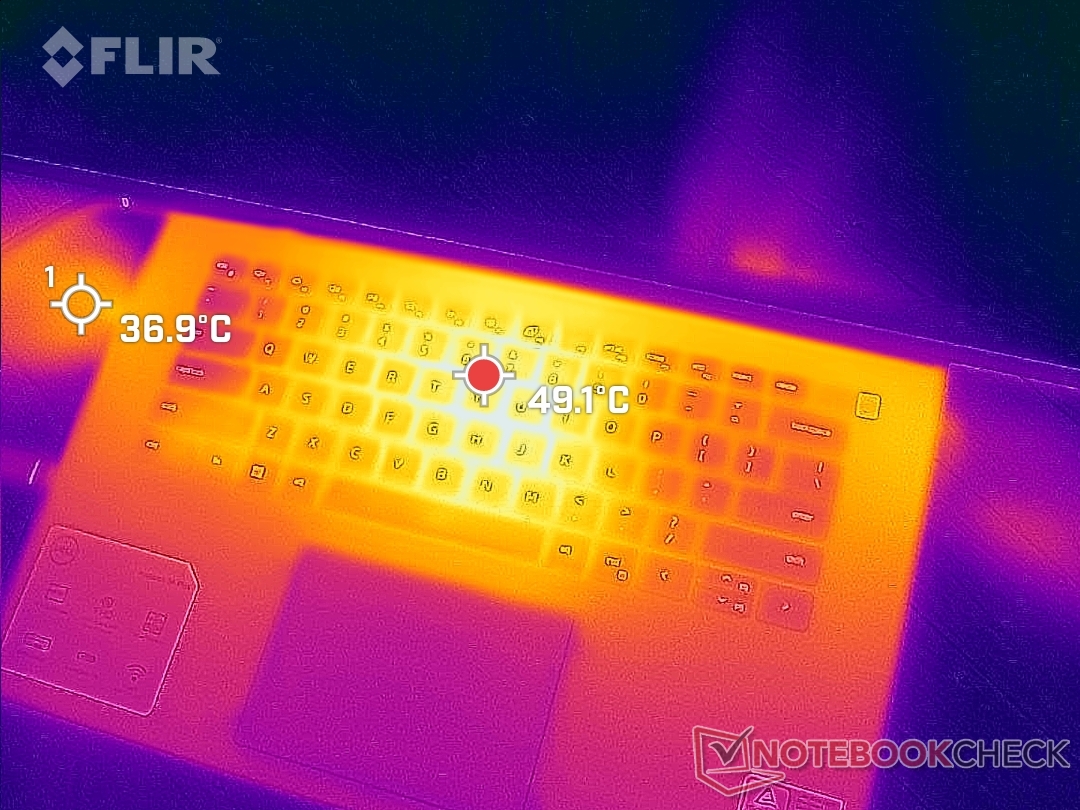
(-) De maximumtemperatuur aan de bovenzijde bedraagt 46 °C / 115 F, vergeleken met het gemiddelde van 36.8 °C / 98 F, variërend van 21 tot 71 °C voor de klasse Multimedia.
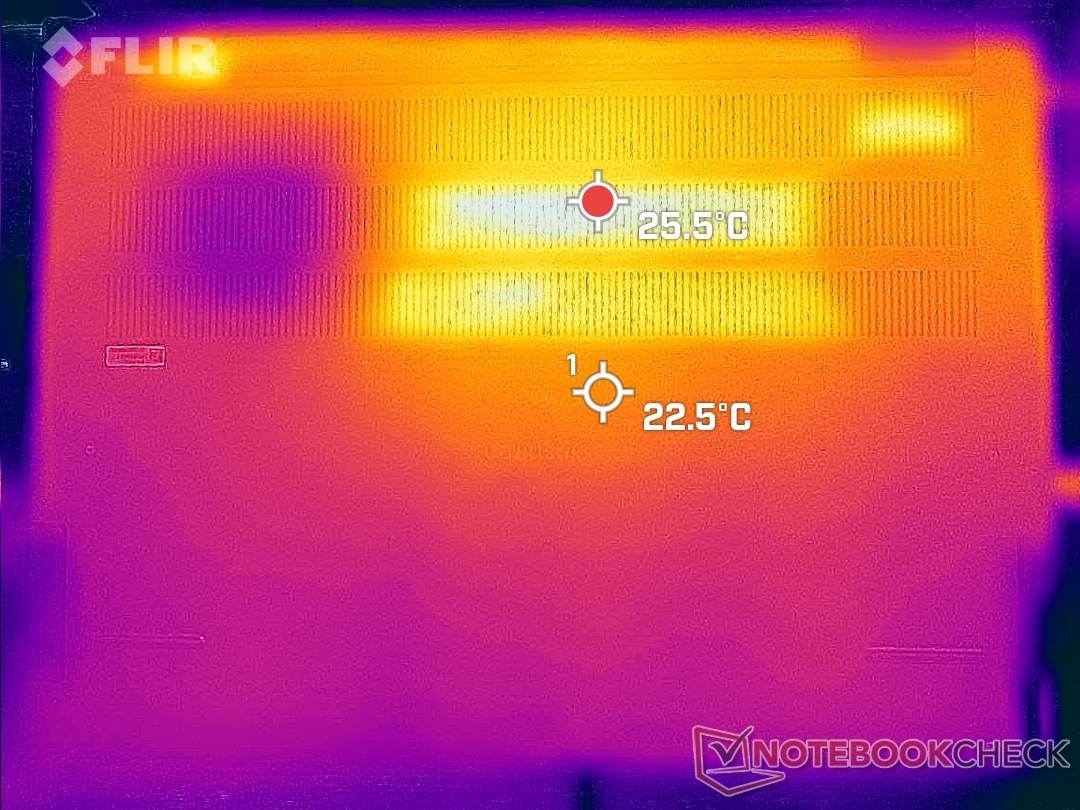
(-) De bodem warmt op tot een maximum van 45.8 °C / 114 F, vergeleken met een gemiddelde van 39.1 °C / 102 F
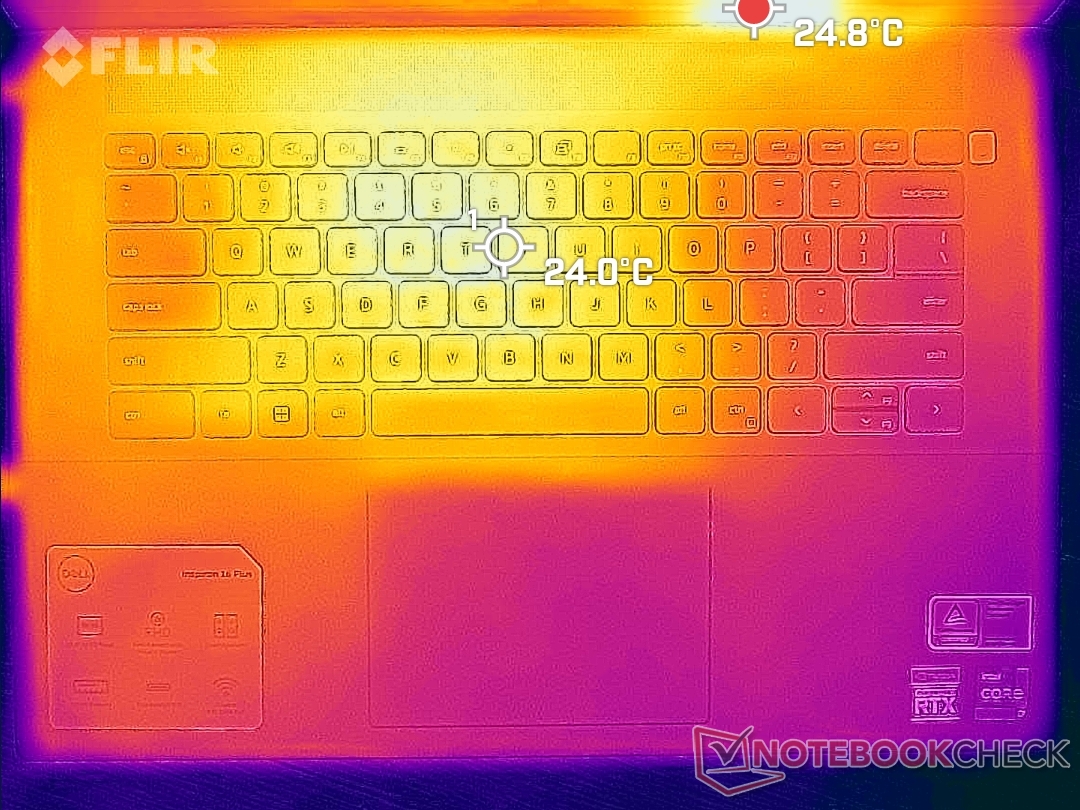
(+) Bij onbelast gebruik bedraagt de gemiddelde temperatuur voor de bovenzijde 26.8 °C / 80 F, vergeleken met het apparaatgemiddelde van 31.3 °C / 88 F.
(±) Bij het spelen van The Witcher 3 is de gemiddelde temperatuur voor de bovenzijde 36.8 °C / 98 F, vergeleken met het apparaatgemiddelde van 31.3 °C / 88 F.
(+) De palmsteunen en het touchpad zijn met een maximum van ###max## °C / 87.1 F koeler dan de huidtemperatuur en voelen daarom koel aan.
(±) De gemiddelde temperatuur van de handpalmsteun van soortgelijke toestellen bedroeg 28.7 °C / 83.7 F (-1.9 °C / -3.4 F).
| Dell Inspiron 16 Plus 7620 Intel Core i7-12700H, NVIDIA GeForce RTX 3050 Ti Laptop GPU | Dell Inspiron 16 Plus 7610 Intel Core i7-11800H, NVIDIA GeForce RTX 3050 4GB Laptop GPU | Lenovo Yoga 7 16IAP7 Intel Core i7-1260P, Intel Iris Xe Graphics G7 96EUs | Huawei MateBook D 16 2022 Intel Core i7-12700H, Intel Iris Xe Graphics G7 96EUs | Acer Swift X SFX16-51G-5388 Intel Core i5-11320H, NVIDIA GeForce RTX 3050 4GB Laptop GPU | Asus Vivobook Pro 16X-M7600QE AMD Ryzen 9 5900HX, NVIDIA GeForce RTX 3050 Ti Laptop GPU | |
|---|---|---|---|---|---|---|
| Heat | -12% | 24% | 3% | -6% | 9% | |
| Maximum Upper Side * (°C) | 46 | 46.4 -1% | 39 15% | 41.8 9% | 52.4 -14% | 39.4 14% |
| Maximum Bottom * (°C) | 45.8 | 54.8 -20% | 34.2 25% | 47.3 -3% | 50 -9% | 43.6 5% |
| Idle Upper Side * (°C) | 29.2 | 31.4 -8% | 21.2 27% | 28.3 3% | 30.3 -4% | 27.6 5% |
| Idle Bottom * (°C) | 31 | 36.6 -18% | 21.6 30% | 30.2 3% | 30.4 2% | 27.5 11% |
* ... kleiner is beter
Stresstest
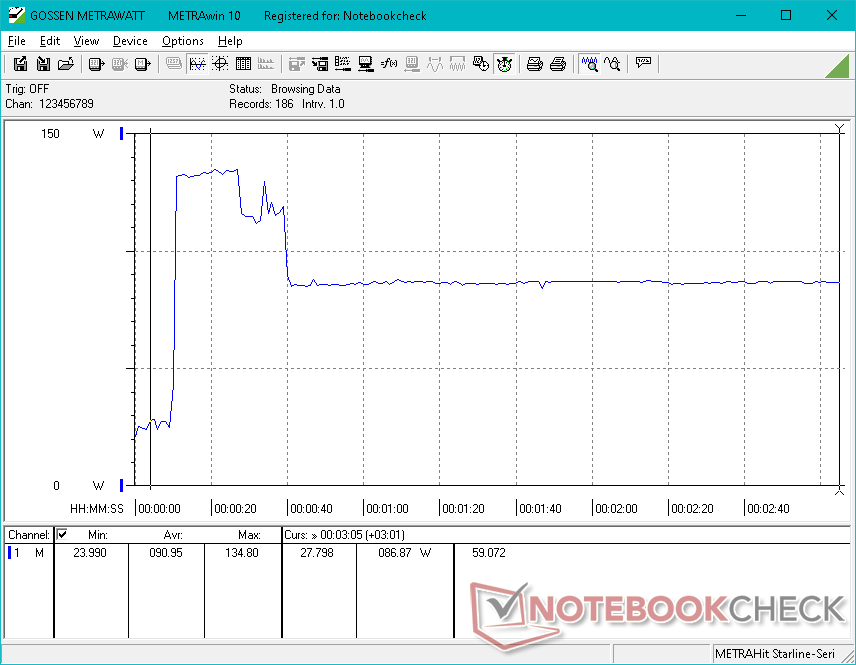
Bij het uitvoeren van Prime95 stress, zou de CPU 3,5 GHz en 80 W bereiken gedurende de eerste 15 seconden of zo, totdat de kerntemperatuur 90 C bereikt. Daarna zouden de kloksnelheden en het stroomverbruik van het bord geleidelijk dalen voordat ze stabiliseerden op respectievelijk 2,3 GHz en 50 W, om een kerntemperatuur van 86 C te handhaven.
GPU kloksnelheid, temperatuur en stroomverbruik op de kaart zouden stabiliseren op respectievelijk 1627 MHz, 85 C en 64 W bij gebruik Witcher 3 vergeleken met 1837 MHz, 69 C en 63 W op de Inspiron 16 Plus 7610. Het lijdt geen twijfel dat de processoren in het 2022-model warmer draaien om hogere prestatieniveaus te kunnen leveren.
Het draaien op batterijvoeding beperkt de prestaties, zelfs in de Ultra Performance modus. Een 3DMark 11 test op de batterij zou een Physics en Graphics score opleveren van respectievelijk 10252 en 8609 punten, vergeleken met 22210 en 18923 punten op de netvoeding.
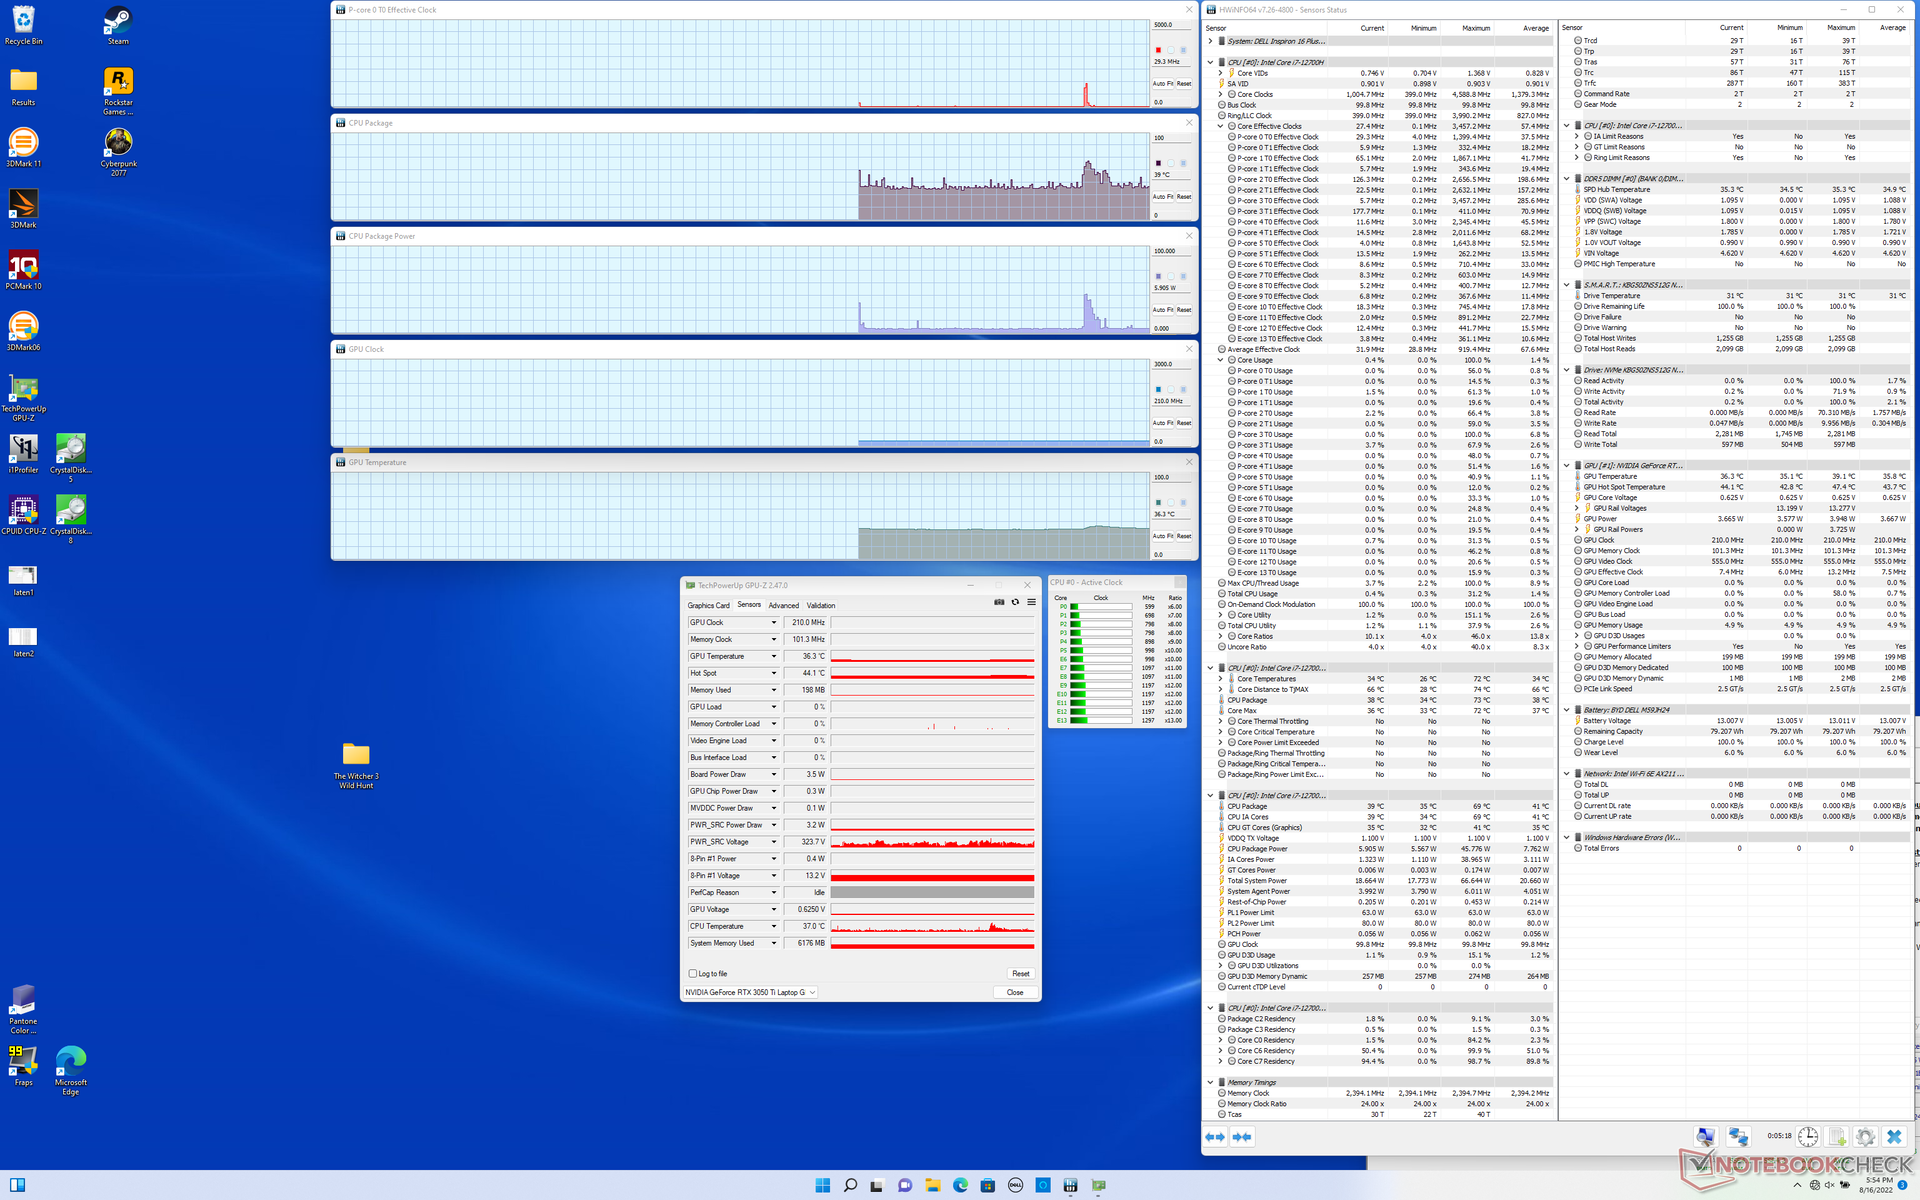
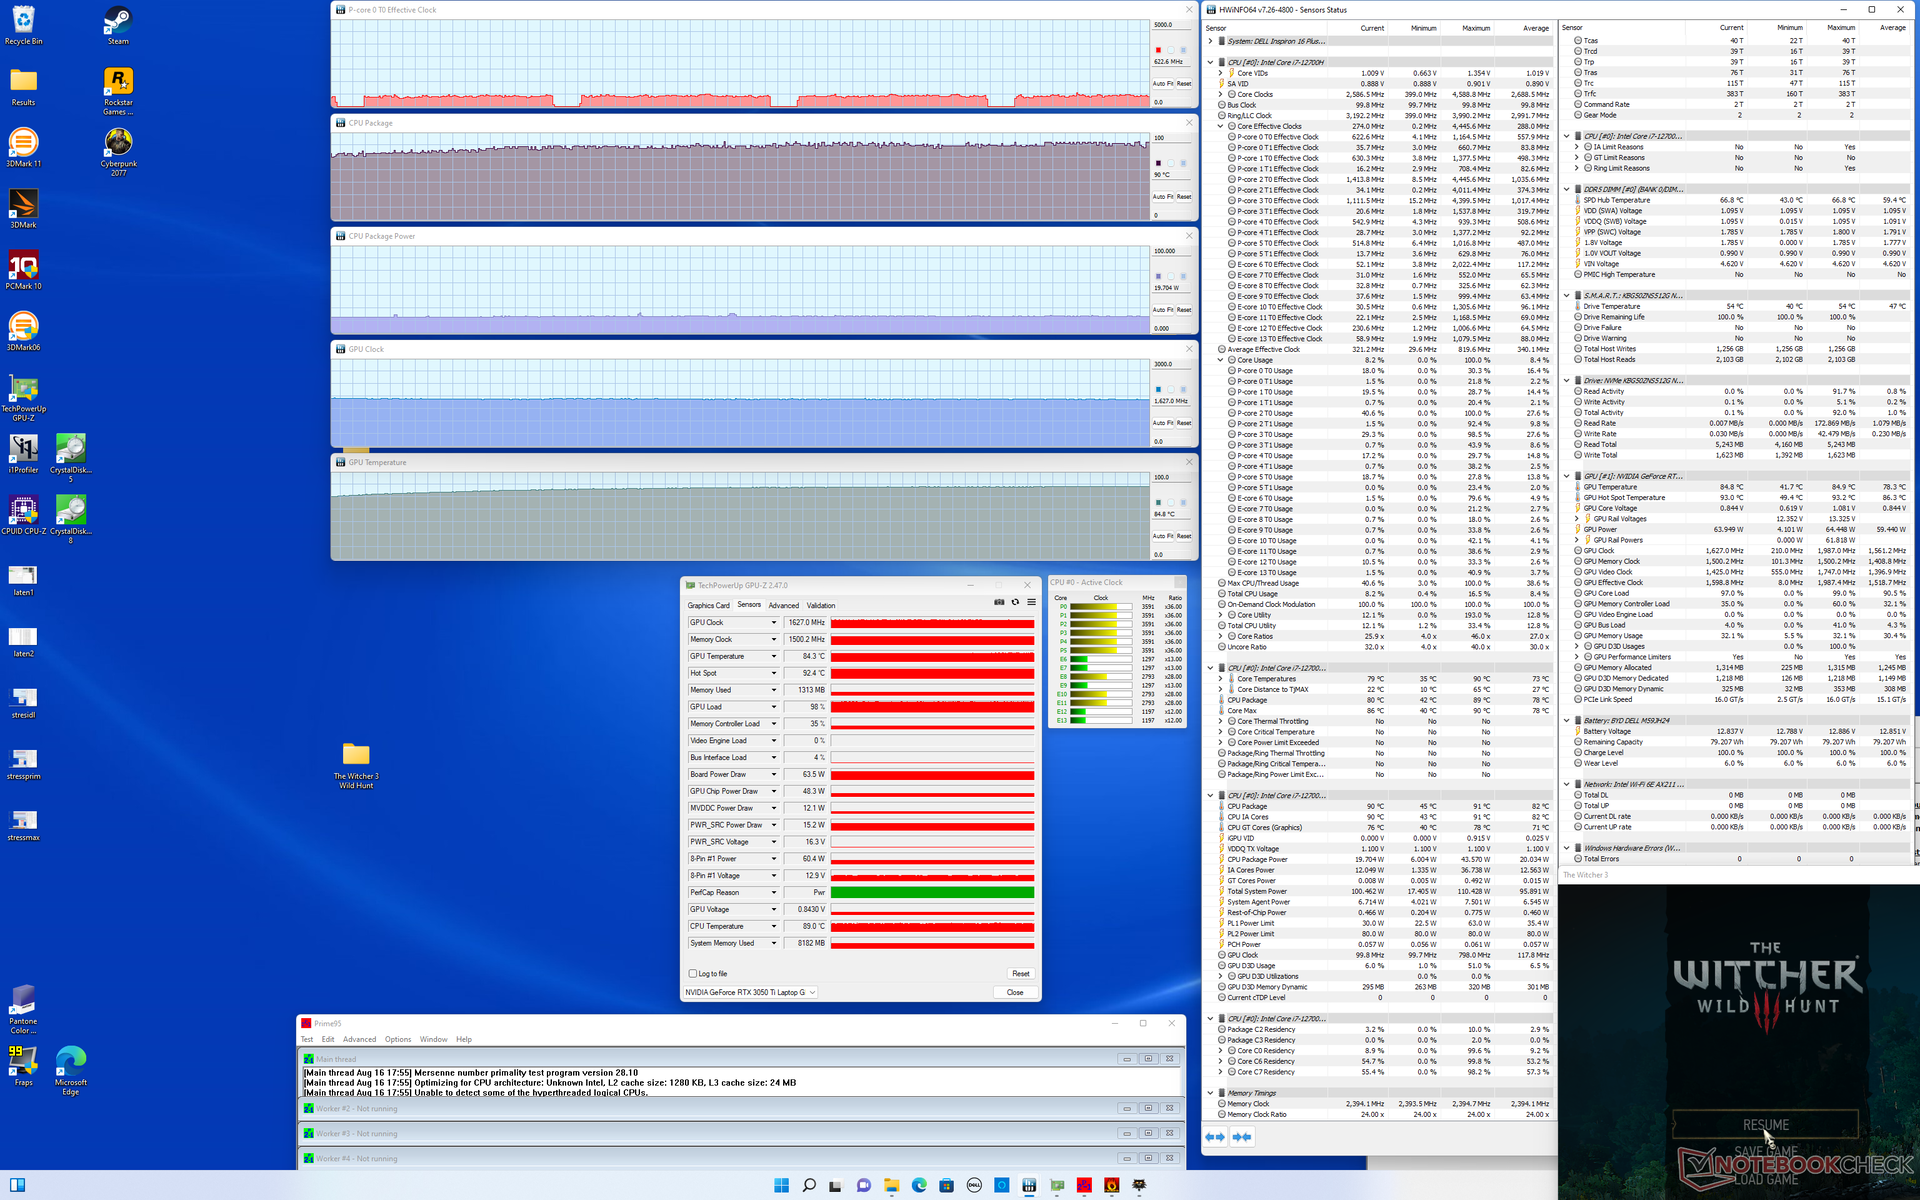
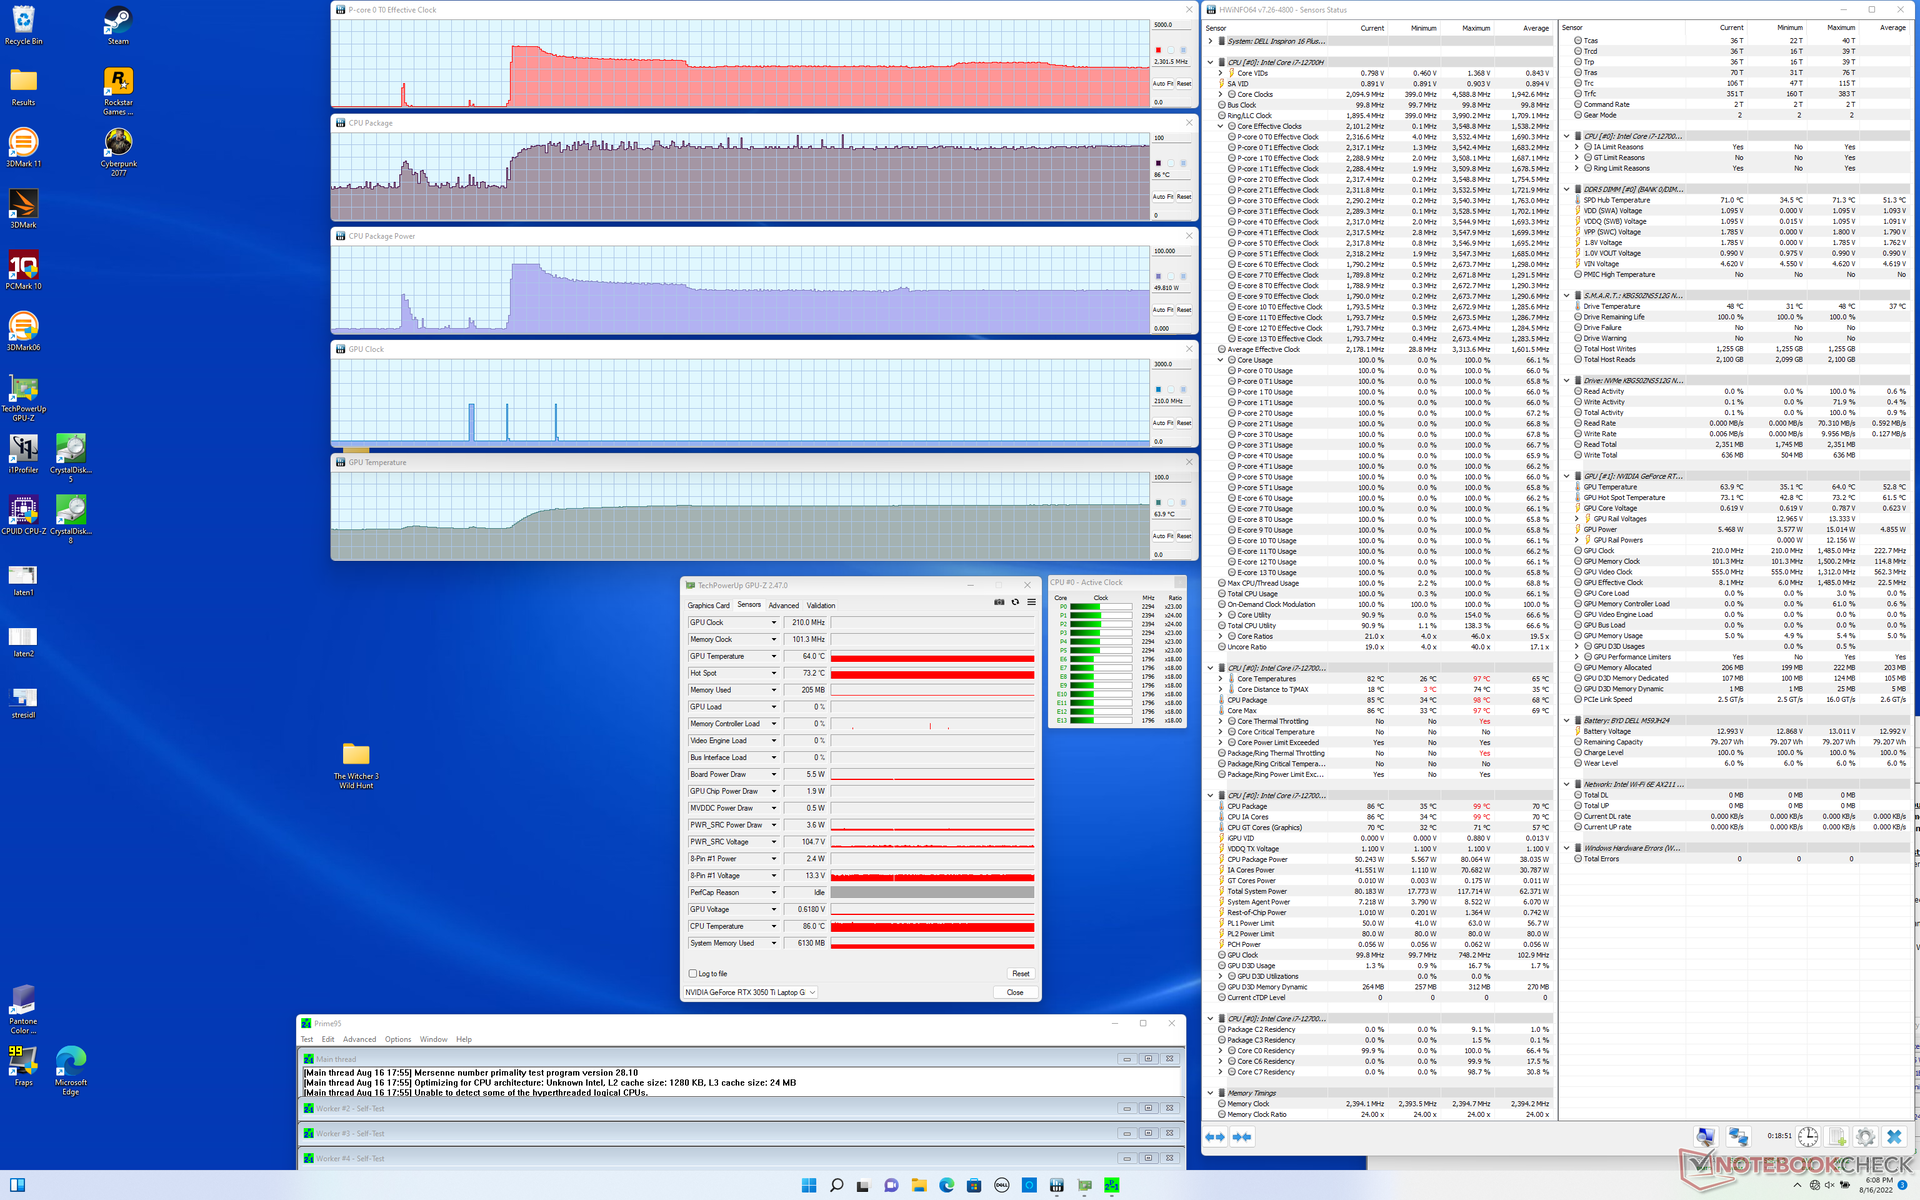
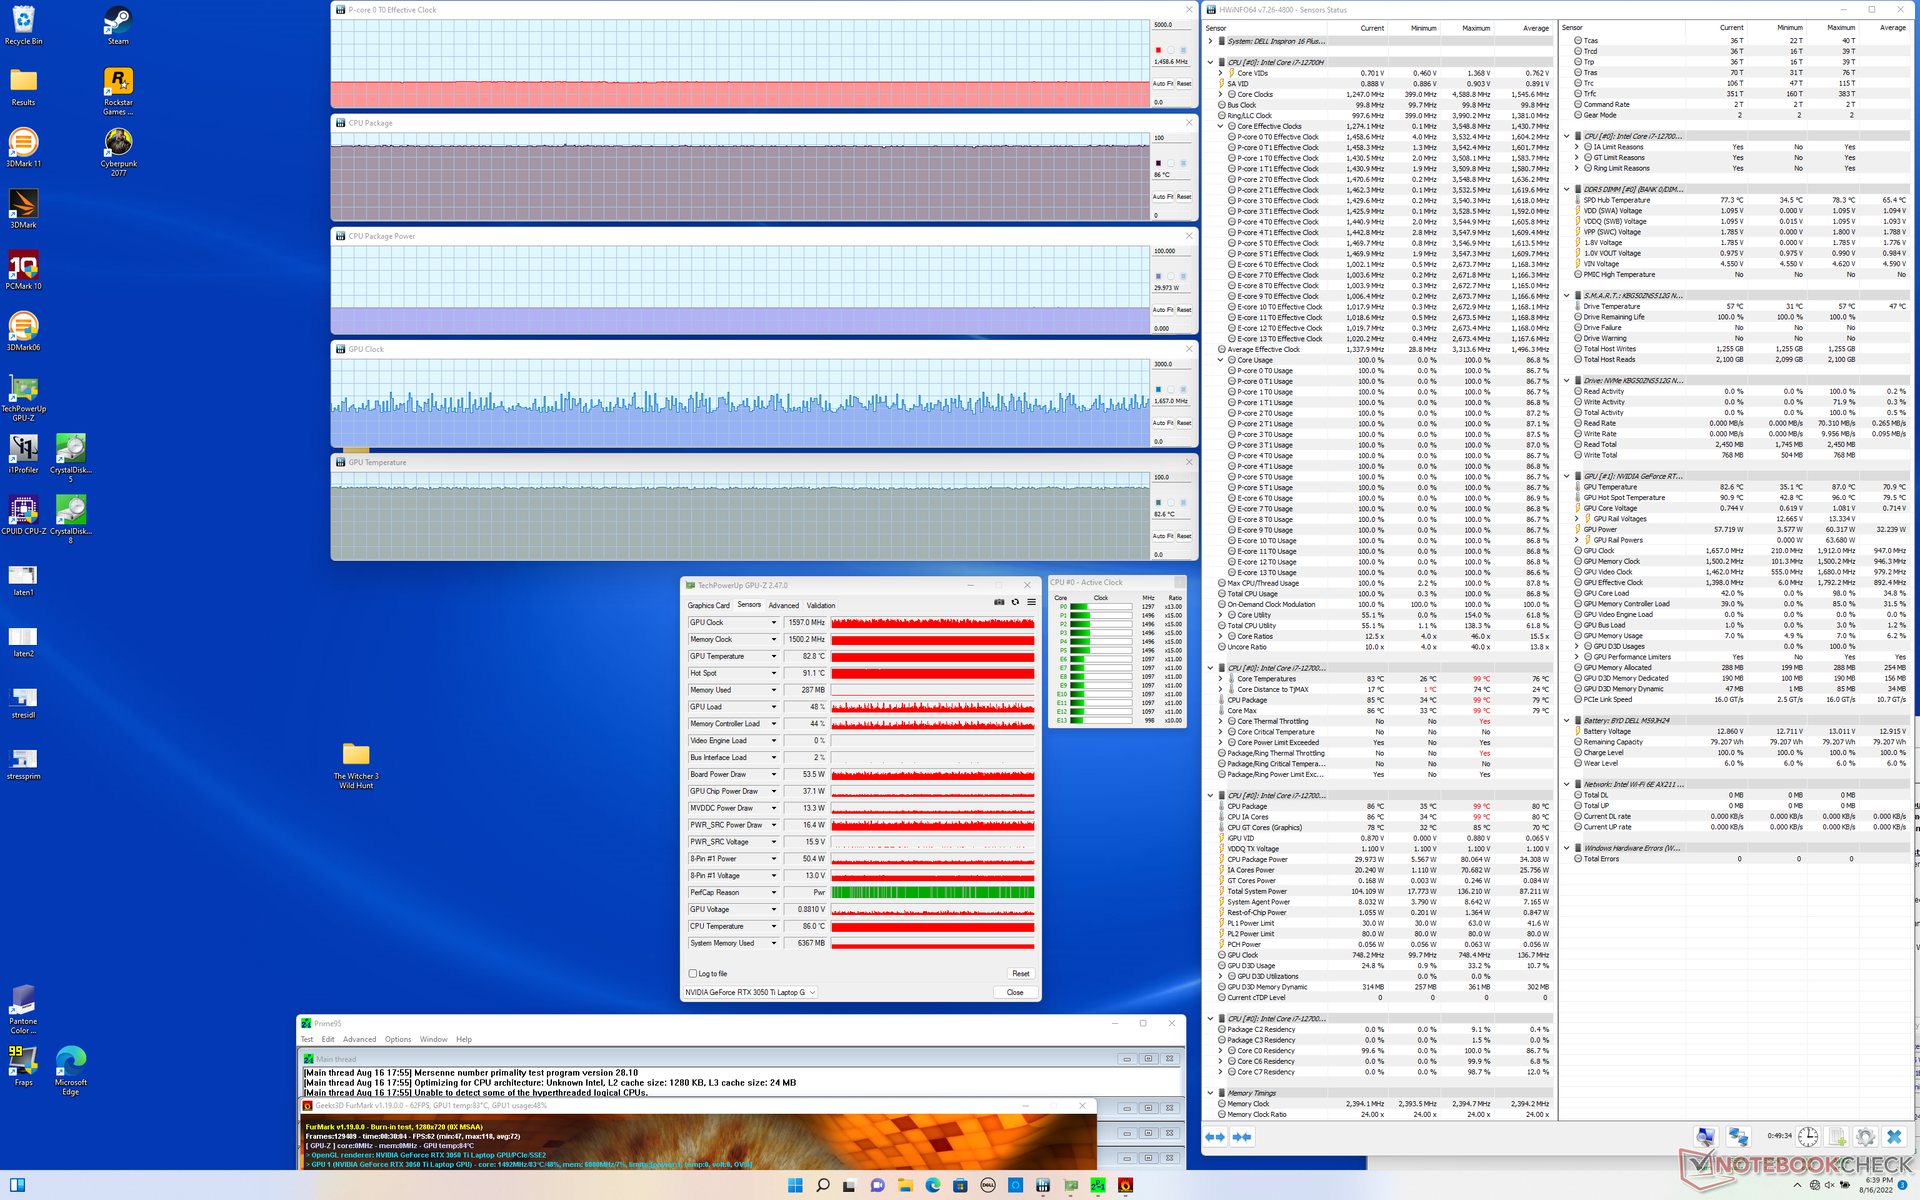
| CPU Klok (GHz) | GPU Klok (MHz) | Gemiddelde CPU Temperatuur (°C) | Gemiddelde GPU Temperatuur (°C) | |
| Systeem in rusttoestand | -- | -- | 39 | 36 |
| Prime95 Stress | 2.3 | -- | 86 | 64 |
| Prime95 + FurMark Stress | 1.5 | ~1597 | 86 | 83 |
| Witcher 3 Stress | ~0.6 | 1627 | 90 | 85 |
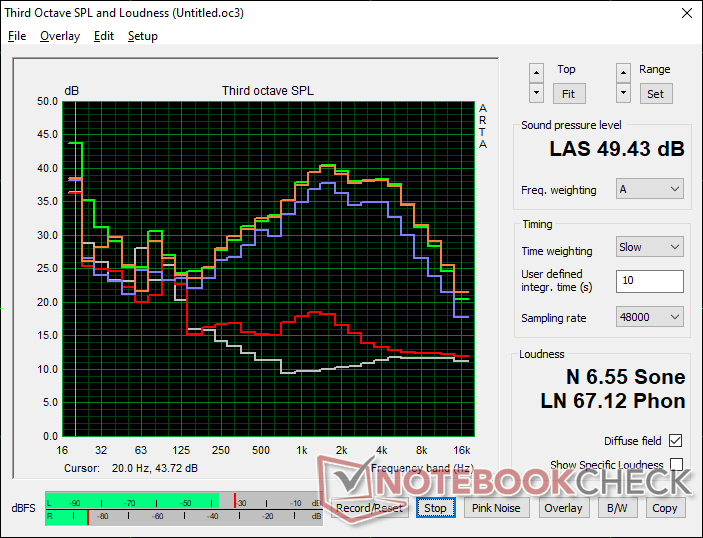
Sprekers
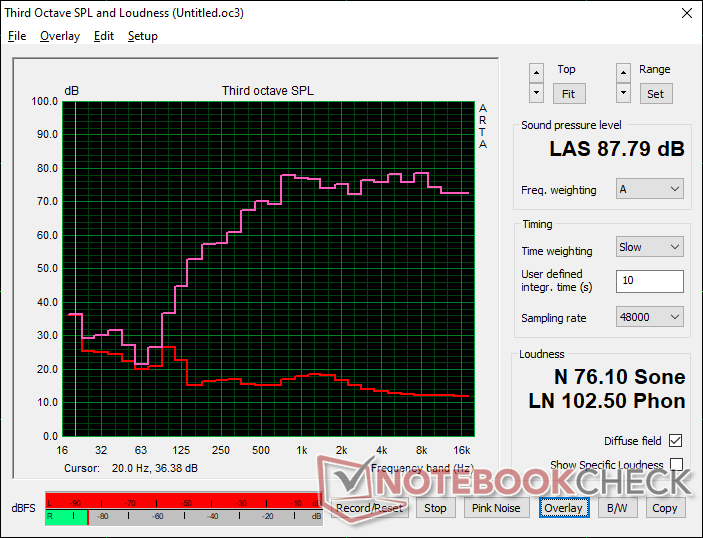
Dell Inspiron 16 Plus 7620 audioanalyse
(+) | luidsprekers kunnen relatief luid spelen (87.8 dB)
Bas 100 - 315 Hz
(-) | bijna geen lage tonen - gemiddeld 22.2% lager dan de mediaan
(±) | lineariteit van de lage tonen is gemiddeld (9.7% delta ten opzichte van de vorige frequentie)
Midden 400 - 2000 Hz
(+) | evenwichtige middens - slechts 3.3% verwijderd van de mediaan
(+) | de middentonen zijn lineair (5.3% delta ten opzichte van de vorige frequentie)
Hoog 2 - 16 kHz
(+) | evenwichtige hoogtepunten - slechts 2.5% verwijderd van de mediaan
(+) | de hoge tonen zijn lineair (4.7% delta naar de vorige frequentie)
Algemeen 100 - 16.000 Hz
(+) | het totale geluid is lineair (13.4% verschil met de mediaan)
Vergeleken met dezelfde klasse
» 28% van alle geteste apparaten in deze klasse waren beter, 5% vergelijkbaar, 68% slechter
» De beste had een delta van 5%, het gemiddelde was 17%, de slechtste was 45%
Vergeleken met alle geteste toestellen
» 14% van alle geteste apparaten waren beter, 4% gelijk, 83% slechter
» De beste had een delta van 4%, het gemiddelde was 24%, de slechtste was 134%
Apple MacBook Pro 16 2021 M1 Pro audioanalyse
(+) | luidsprekers kunnen relatief luid spelen (84.7 dB)
Bas 100 - 315 Hz
(+) | goede baars - slechts 3.8% verwijderd van de mediaan
(+) | de lage tonen zijn lineair (5.2% delta naar de vorige frequentie)
Midden 400 - 2000 Hz
(+) | evenwichtige middens - slechts 1.3% verwijderd van de mediaan
(+) | de middentonen zijn lineair (2.1% delta ten opzichte van de vorige frequentie)
Hoog 2 - 16 kHz
(+) | evenwichtige hoogtepunten - slechts 1.9% verwijderd van de mediaan
(+) | de hoge tonen zijn lineair (2.7% delta naar de vorige frequentie)
Algemeen 100 - 16.000 Hz
(+) | het totale geluid is lineair (4.6% verschil met de mediaan)
Vergeleken met dezelfde klasse
» 0% van alle geteste apparaten in deze klasse waren beter, 0% vergelijkbaar, 100% slechter
» De beste had een delta van 5%, het gemiddelde was 17%, de slechtste was 45%
Vergeleken met alle geteste toestellen
» 0% van alle geteste apparaten waren beter, 0% gelijk, 100% slechter
» De beste had een delta van 4%, het gemiddelde was 24%, de slechtste was 134%
Energiebeheer - CPU met veel stroomverbruik
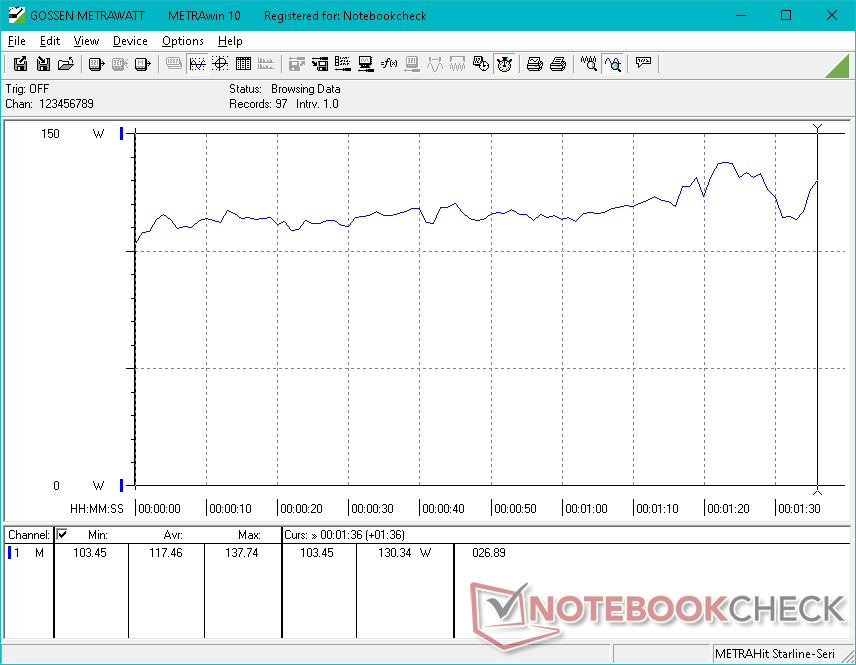
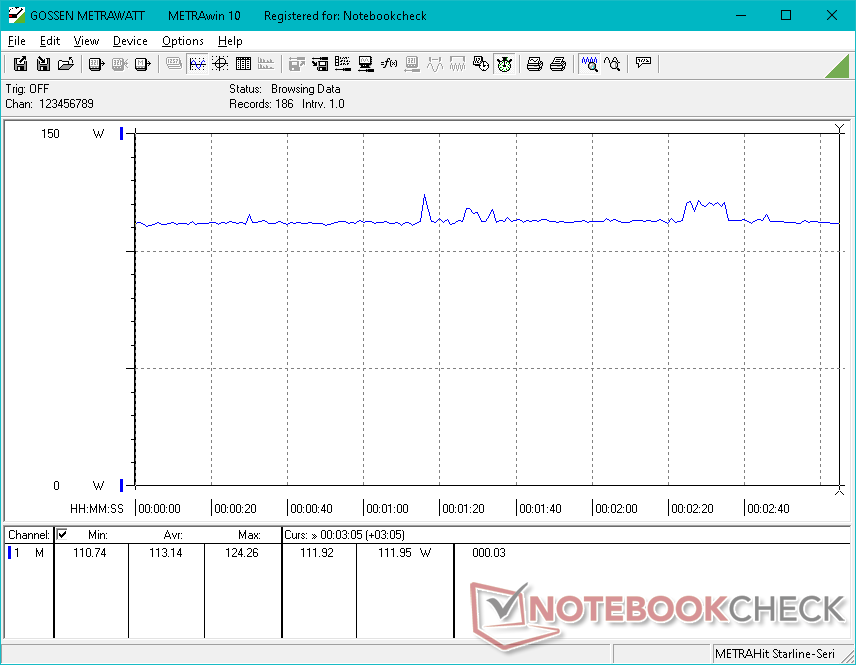
Stroomverbruik
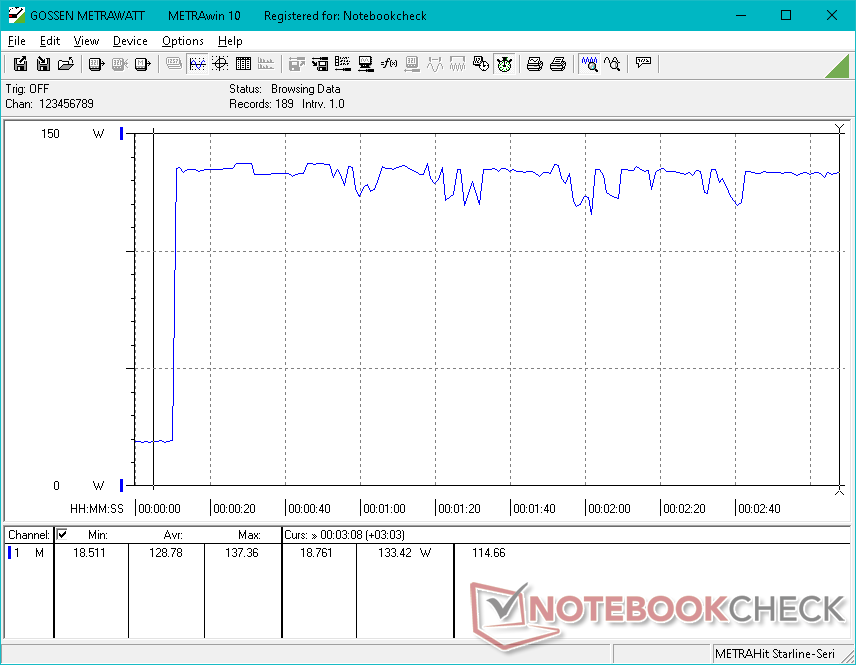
Het stroomverbruik is vergelijkbaar met dat van model 2021 wanneer de computer stationair draait of bij zeer lage belasting. Bij hogere belastingen wordt het 2022-model echter veeleisender, vooral als dergelijke belastingen CPU-intensief zijn. Het draaien van Witcher 3trekt bijvoorbeeld slechts 5 procent meer stroom, terwijl Prime95 maar liefst 72 procent meer zou trekken. Het aanzienlijk hogere verbruik is in lijn met de meeste andere laptops die we tot nu toe hebben getest, aangedreven door 12e generatie Alder Lake CPU's
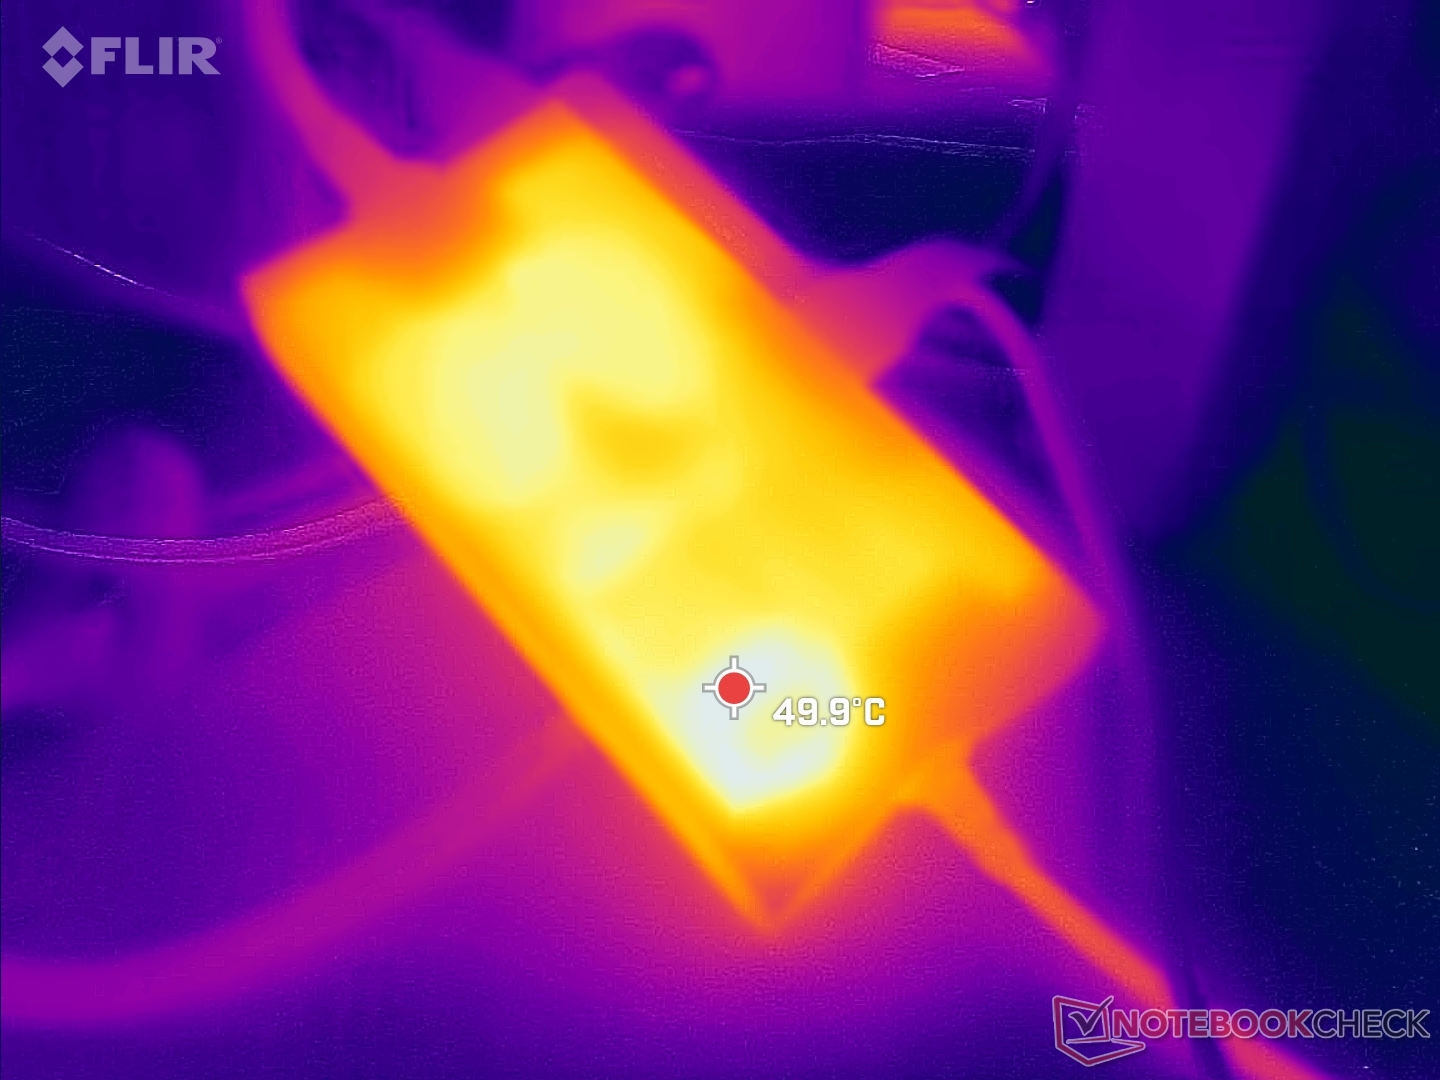
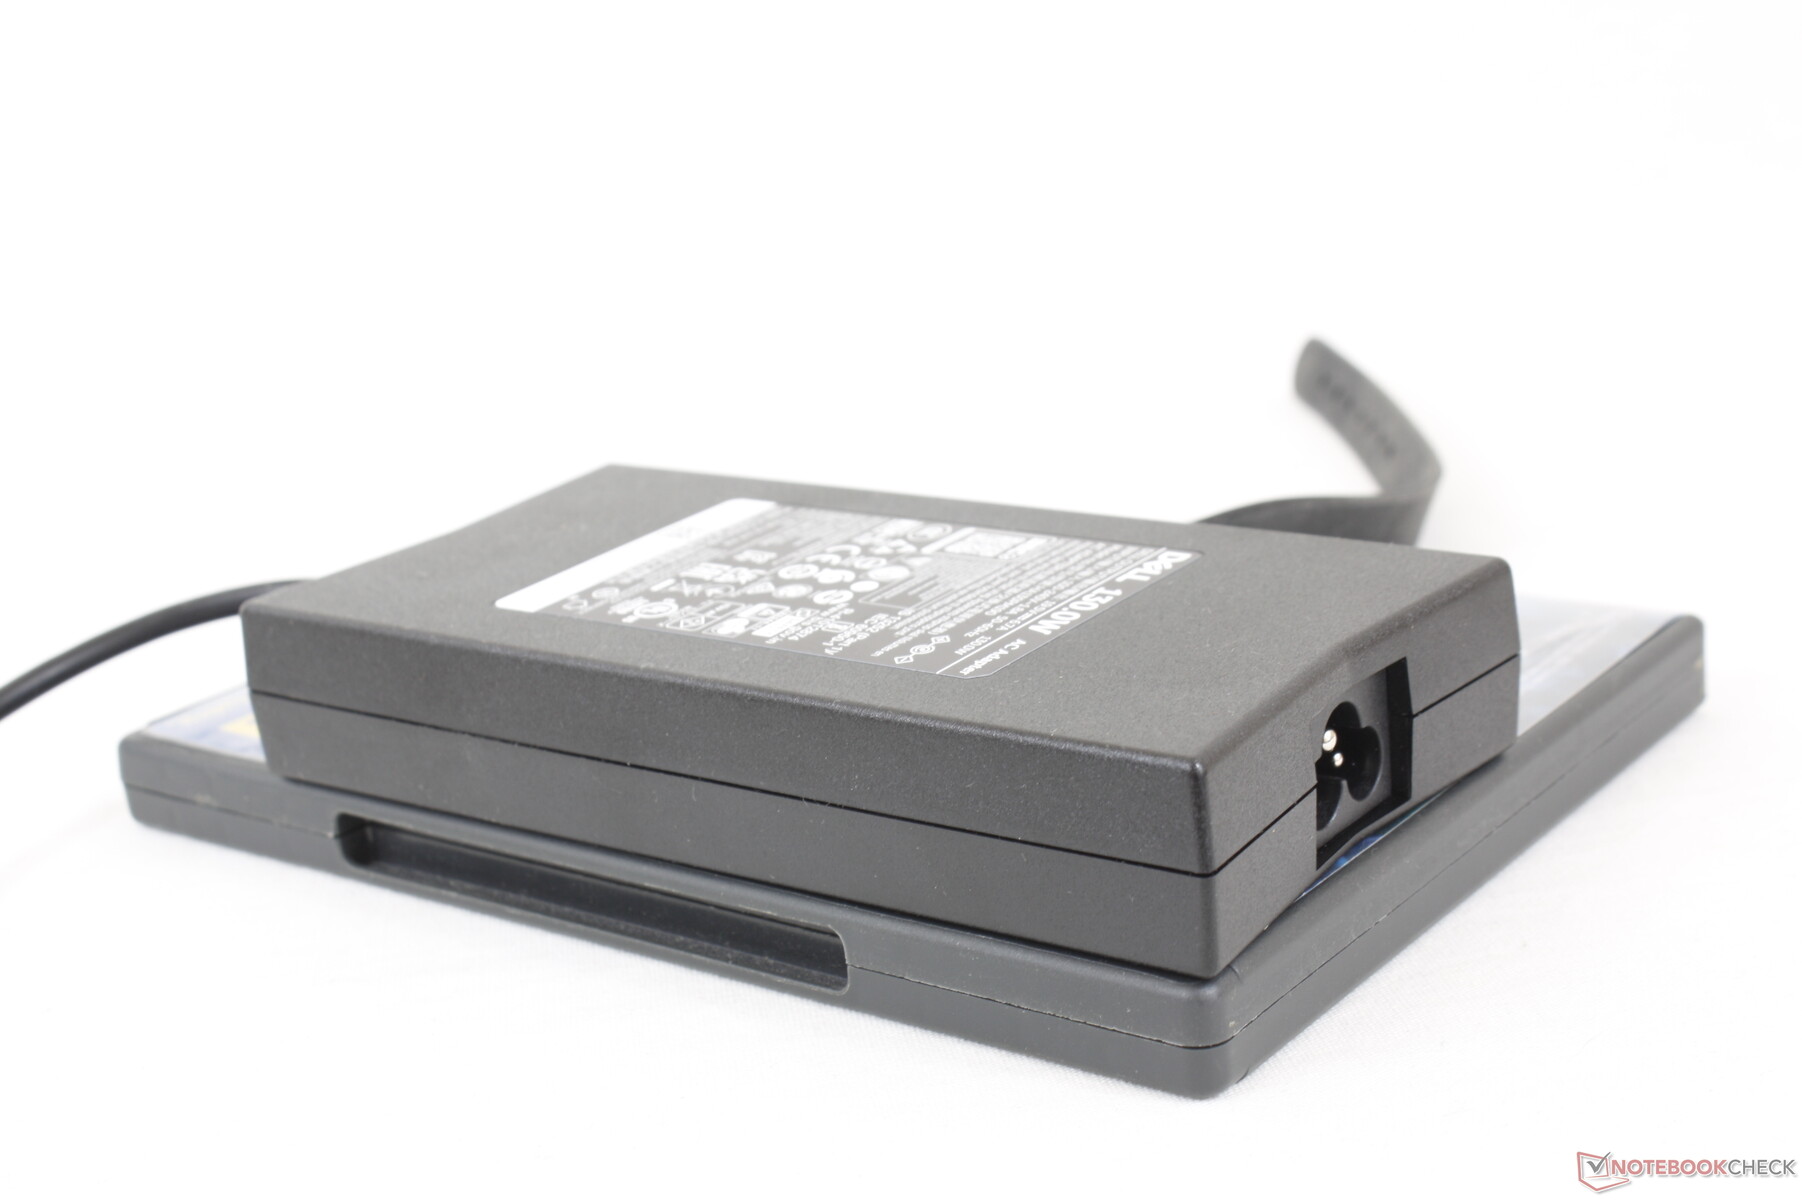
We zijn in staat om een maximale trek van 137 W van de middelgrote (~ 15,3 x 7,5 x 2,6 cm) 130 W AC-adapter te registreren. Dell heeft geen wijzigingen aangebracht aan de AC-adapter of de nominale capaciteit ervan, ondanks de meer energievretende CPU.
| Uit / Standby | |
| Inactief | |
| Belasting |
|
Key:
min: | |
| Dell Inspiron 16 Plus 7620 i7-12700H, GeForce RTX 3050 Ti Laptop GPU, Kioxia BG5 KBG50ZNS512G, IPS, 3072x1920, 16" | Dell Inspiron 16 Plus 7610 i7-11800H, GeForce RTX 3050 4GB Laptop GPU, Kingston OM3PDP3512B, IPS, 3072x1920, 16" | Lenovo Yoga 7 16IAP7 i7-1260P, Iris Xe G7 96EUs, Micron 2450 512GB MTFDKCD512TFK, IPS, 2560x1600, 16" | Huawei MateBook D 16 2022 i7-12700H, Iris Xe G7 96EUs, Silicon Motion PCIe-8 SSD, IPS, 1920x1200, 16" | Acer Swift X SFX16-51G-5388 i5-11320H, GeForce RTX 3050 4GB Laptop GPU, Samsung PM991 MZVLQ512HBLU, , 1920x1080, 16.1" | Asus Vivobook Pro 16X-M7600QE R9 5900HX, GeForce RTX 3050 Ti Laptop GPU, SK Hynix HFM001TD3JX013N, OLED, 3840x2400, 16.1" | |
|---|---|---|---|---|---|---|
| Power Consumption | 1% | 35% | 29% | 21% | 1% | |
| Idle Minimum * (Watt) | 6.8 | 7.7 -13% | 6.6 3% | 6.1 10% | 7 -3% | 8.2 -21% |
| Idle Average * (Watt) | 9.6 | 10.7 -11% | 8.3 14% | 10.6 -10% | 10.1 -5% | 16.2 -69% |
| Idle Maximum * (Watt) | 17 | 16.8 1% | 9.8 42% | 11.5 32% | 15 12% | 19.7 -16% |
| Load Average * (Watt) | 117.5 | 100.39 15% | 66 44% | 65.5 44% | 63.3 46% | 65.8 44% |
| Witcher 3 ultra * (Watt) | 113.1 | 108 5% | 52 54% | 61.2 46% | 63.3 44% | 65.6 42% |
| Load Maximum * (Watt) | 137.4 | 129 6% | 67.1 51% | 68.4 50% | 94 32% | 104 24% |
* ... kleiner is beter
Power Consumption Witcher 3 / Stresstest
Power Consumption external Monitor
Levensduur batterij
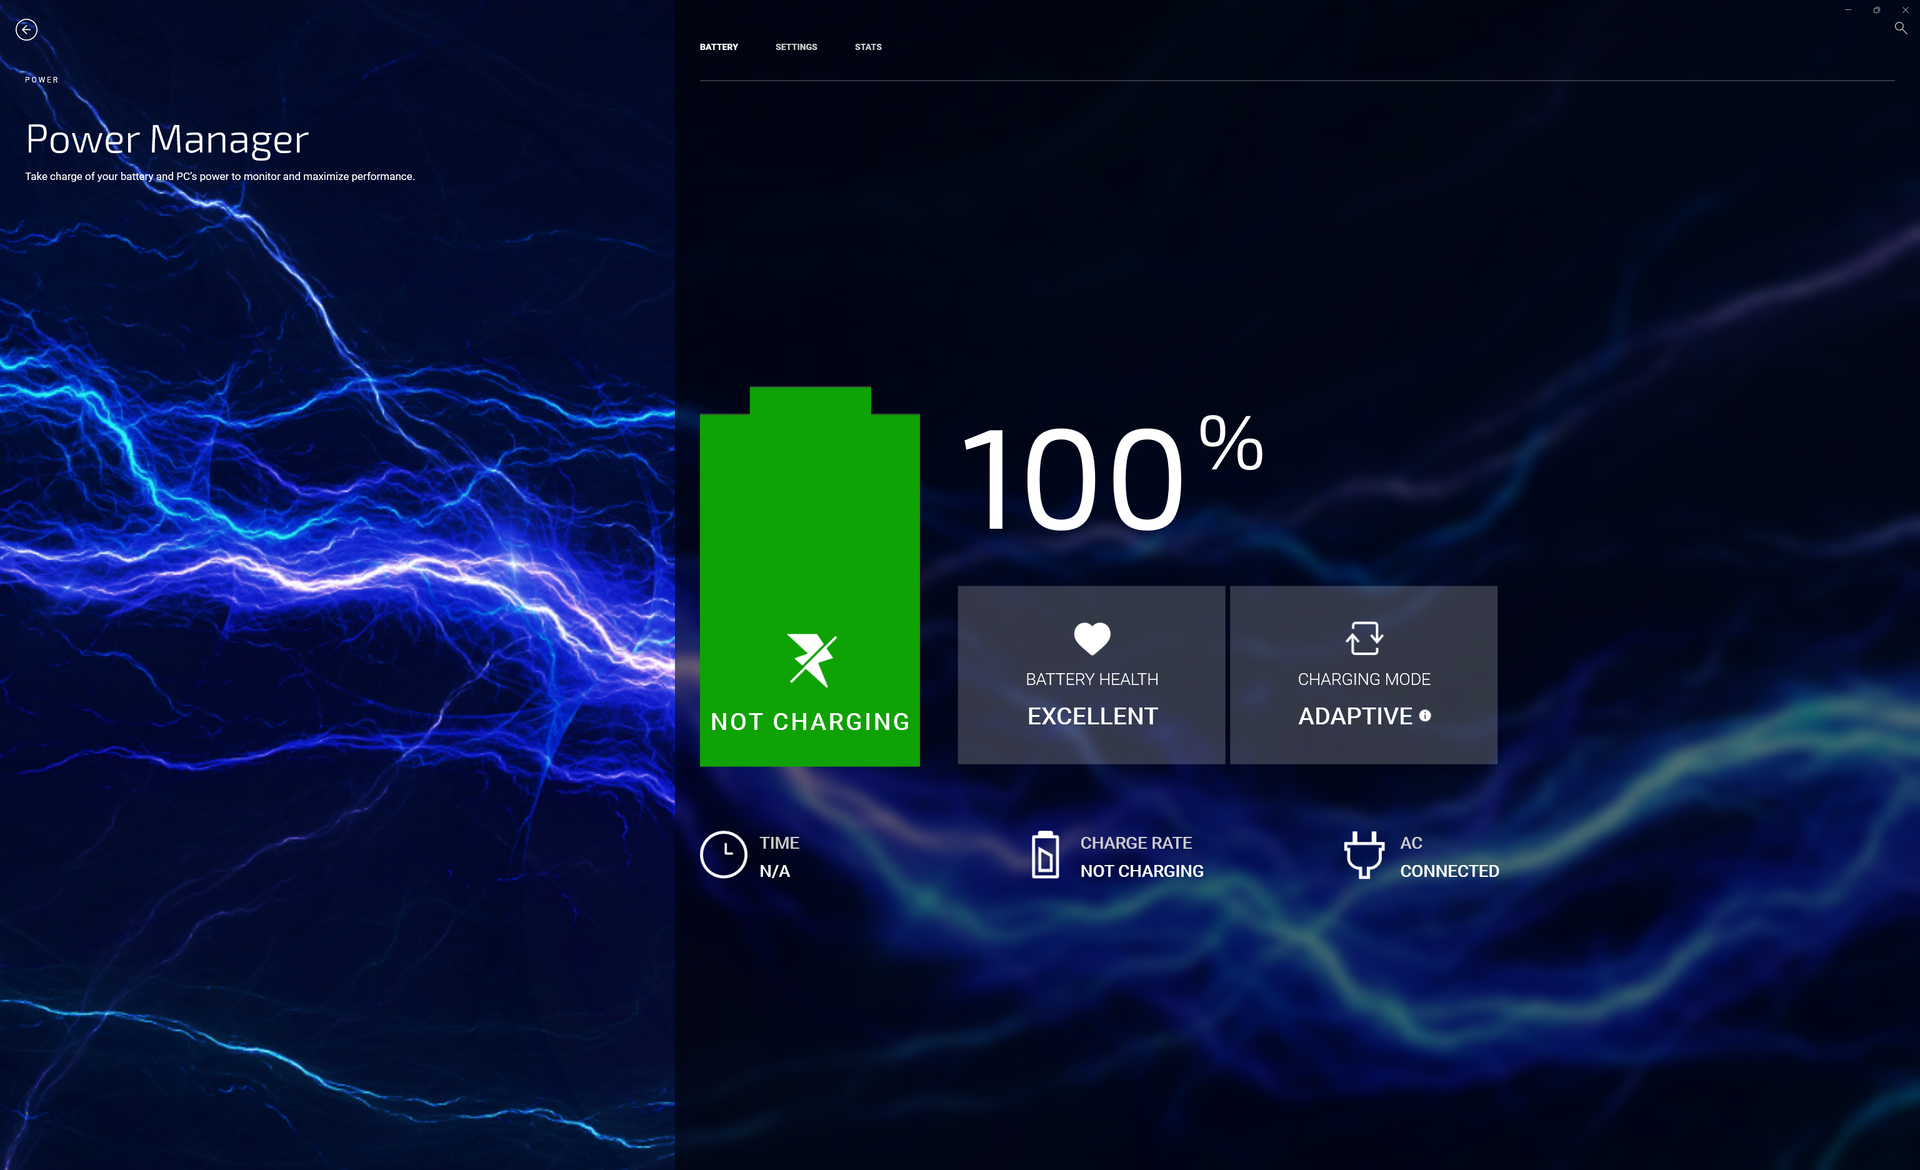
De accucapaciteit is niet veranderd ten opzichte van het model van vorig jaar, zodat de runtimes vergelijkbaar zijn. Gebruikers kunnen 9,5 uur WLAN-gebruik in de praktijk verwachten op het Balanced power-profiel. Een kleinere 56 Wh batterij is beschikbaar op sommige SKU's voor een lichter totaalgewicht.
Opladen van leeg naar vol duurt ongeveer 2 uur met de meegeleverde vat AC-adapter. Het systeem kan ook worden opgeladen via USB-C-opladers van derden.
| Dell Inspiron 16 Plus 7620 i7-12700H, GeForce RTX 3050 Ti Laptop GPU, 86 Wh | Dell Inspiron 16 Plus 7610 i7-11800H, GeForce RTX 3050 4GB Laptop GPU, 86 Wh | Lenovo Yoga 7 16IAP7 i7-1260P, Iris Xe G7 96EUs, 71 Wh | Huawei MateBook D 16 2022 i7-12700H, Iris Xe G7 96EUs, 60 Wh | Acer Swift X SFX16-51G-5388 i5-11320H, GeForce RTX 3050 4GB Laptop GPU, 58.7 Wh | Asus Vivobook Pro 16X-M7600QE R9 5900HX, GeForce RTX 3050 Ti Laptop GPU, 96 Wh | |
|---|---|---|---|---|---|---|
| Batterijduur | 63% | 2% | -26% | 5% | 6% | |
| Reader / Idle (h) | 18.6 | 20.5 10% | 12.2 -34% | 20.3 9% | ||
| WiFi v1.3 (h) | 9.6 | 9.9 3% | 7.9 -18% | 7.1 -26% | 8.1 -16% | 11.3 18% |
| Load (h) | 1.2 | 3.3 175% | 1.9 58% | 1.5 25% | 1.1 -8% | |
| H.264 (h) | 8.4 | |||||
| Gaming (h) | 1.1 |
Pro
Contra
Verdict - Deels Multimedia, deels Schepper, deels Gamer
Het meest opvallende voordeel van de Inspiron 16 Plus 7620 in vergelijking met de 7610 is de 12e generatie Intel Core-H CPU, die tot 50 procent snellere multi-thread prestaties biedt. Als uw werklasten de snellere processor kunnen benutten, dan kan de 7620 een lonende investering zijn ten opzichte van zijn voorganger.
De meeste andere wijzigingen zijn een zijsprong voor de serie of in het beste geval slechts relatief kleine upgrades. Bijvoorbeeld, de hogere resolutie 2 MP webcam is leuk, maar het is nergens in de buurt van de 5 MP webcams op de HP Spectre of Envy 16. Het herziene chassisontwerp is ook leuk, maar het maakt het systeem niet echt lichter, kleiner of sterker dan het oudere 7610 ontwerp. Alternatieven zoals de lichtere Asus VivoBook Pro 16X worden geleverd met de RTX 3050 Ti en een OLED paneel, waarvan onze Dell het laatste nog steeds niet aanbiedt. Een sneller verversingspaneel, zoals het 120 Hz paneel op de HP Envy 16, zou een geweldige optie zijn om te hebben.
De Inspiron 16 Plus 7620 is een stuk sneller dan de 7610 als het gaat om CPU prestaties. Voor de rest is bijna alles grotendeels hetzelfde of zelfs slechter, zoals de warmere temperaturen en minder uitbreidingssleuven.
Ondertussen kunnen verschillende andere veranderingen worden gezien als downgrades, zoals het weggelaten numpad, kleinere clickpad, hoger stroomverbruik onder belasting, warmere temperaturen, en minder aantal SODIMM en M.2 SSD slots. Het is nog steeds een krachtig systeem met zowel de kleuren als de prestaties geschikt voor casual gaming en content creatie, maar het is niet bepaald een homerun als sommige features ontbreken.
Prijs en beschikbaarheid
Amazon heeft momenteel één configuratie beschikbaar met de Core i7-12700H, 16 GB RAM, 512 GB SSD, 3K beeldscherm, en RTX 3050 graphics voor $1450 USD. Wij raden aan om rechtstreeks bij Dell te bestellen voor meer opties.
Dell Inspiron 16 Plus 7620
- 18-08-2022 v7 (old)
Allen Ngo
Price comparison

