Dell Inspiron 16 7635 2-in-1 laptop review: Een afgezwakte Inspiron 16 7630 met AMD Ryzen

De Inspiron 16 7635 2-in-1 is de AMD-versie van de Intel-gebaseerde Inspiron 16 7630 2-in-1. Net als andere Inspiron-modellen richt hij zich op de budget- tot middenklasse consumentencategorie. Net als andere Inspiron-modellen richt deze zich op de budget- tot middenklasse consumentencategorie, in tegenstelling tot de high-end zakelijke Latitude of prosumer XPS-serie. Het is de directe opvolger van de Inspiron 16 7620 2-in-1 met zowel nieuwe CPU's als een herzien uiterlijk.
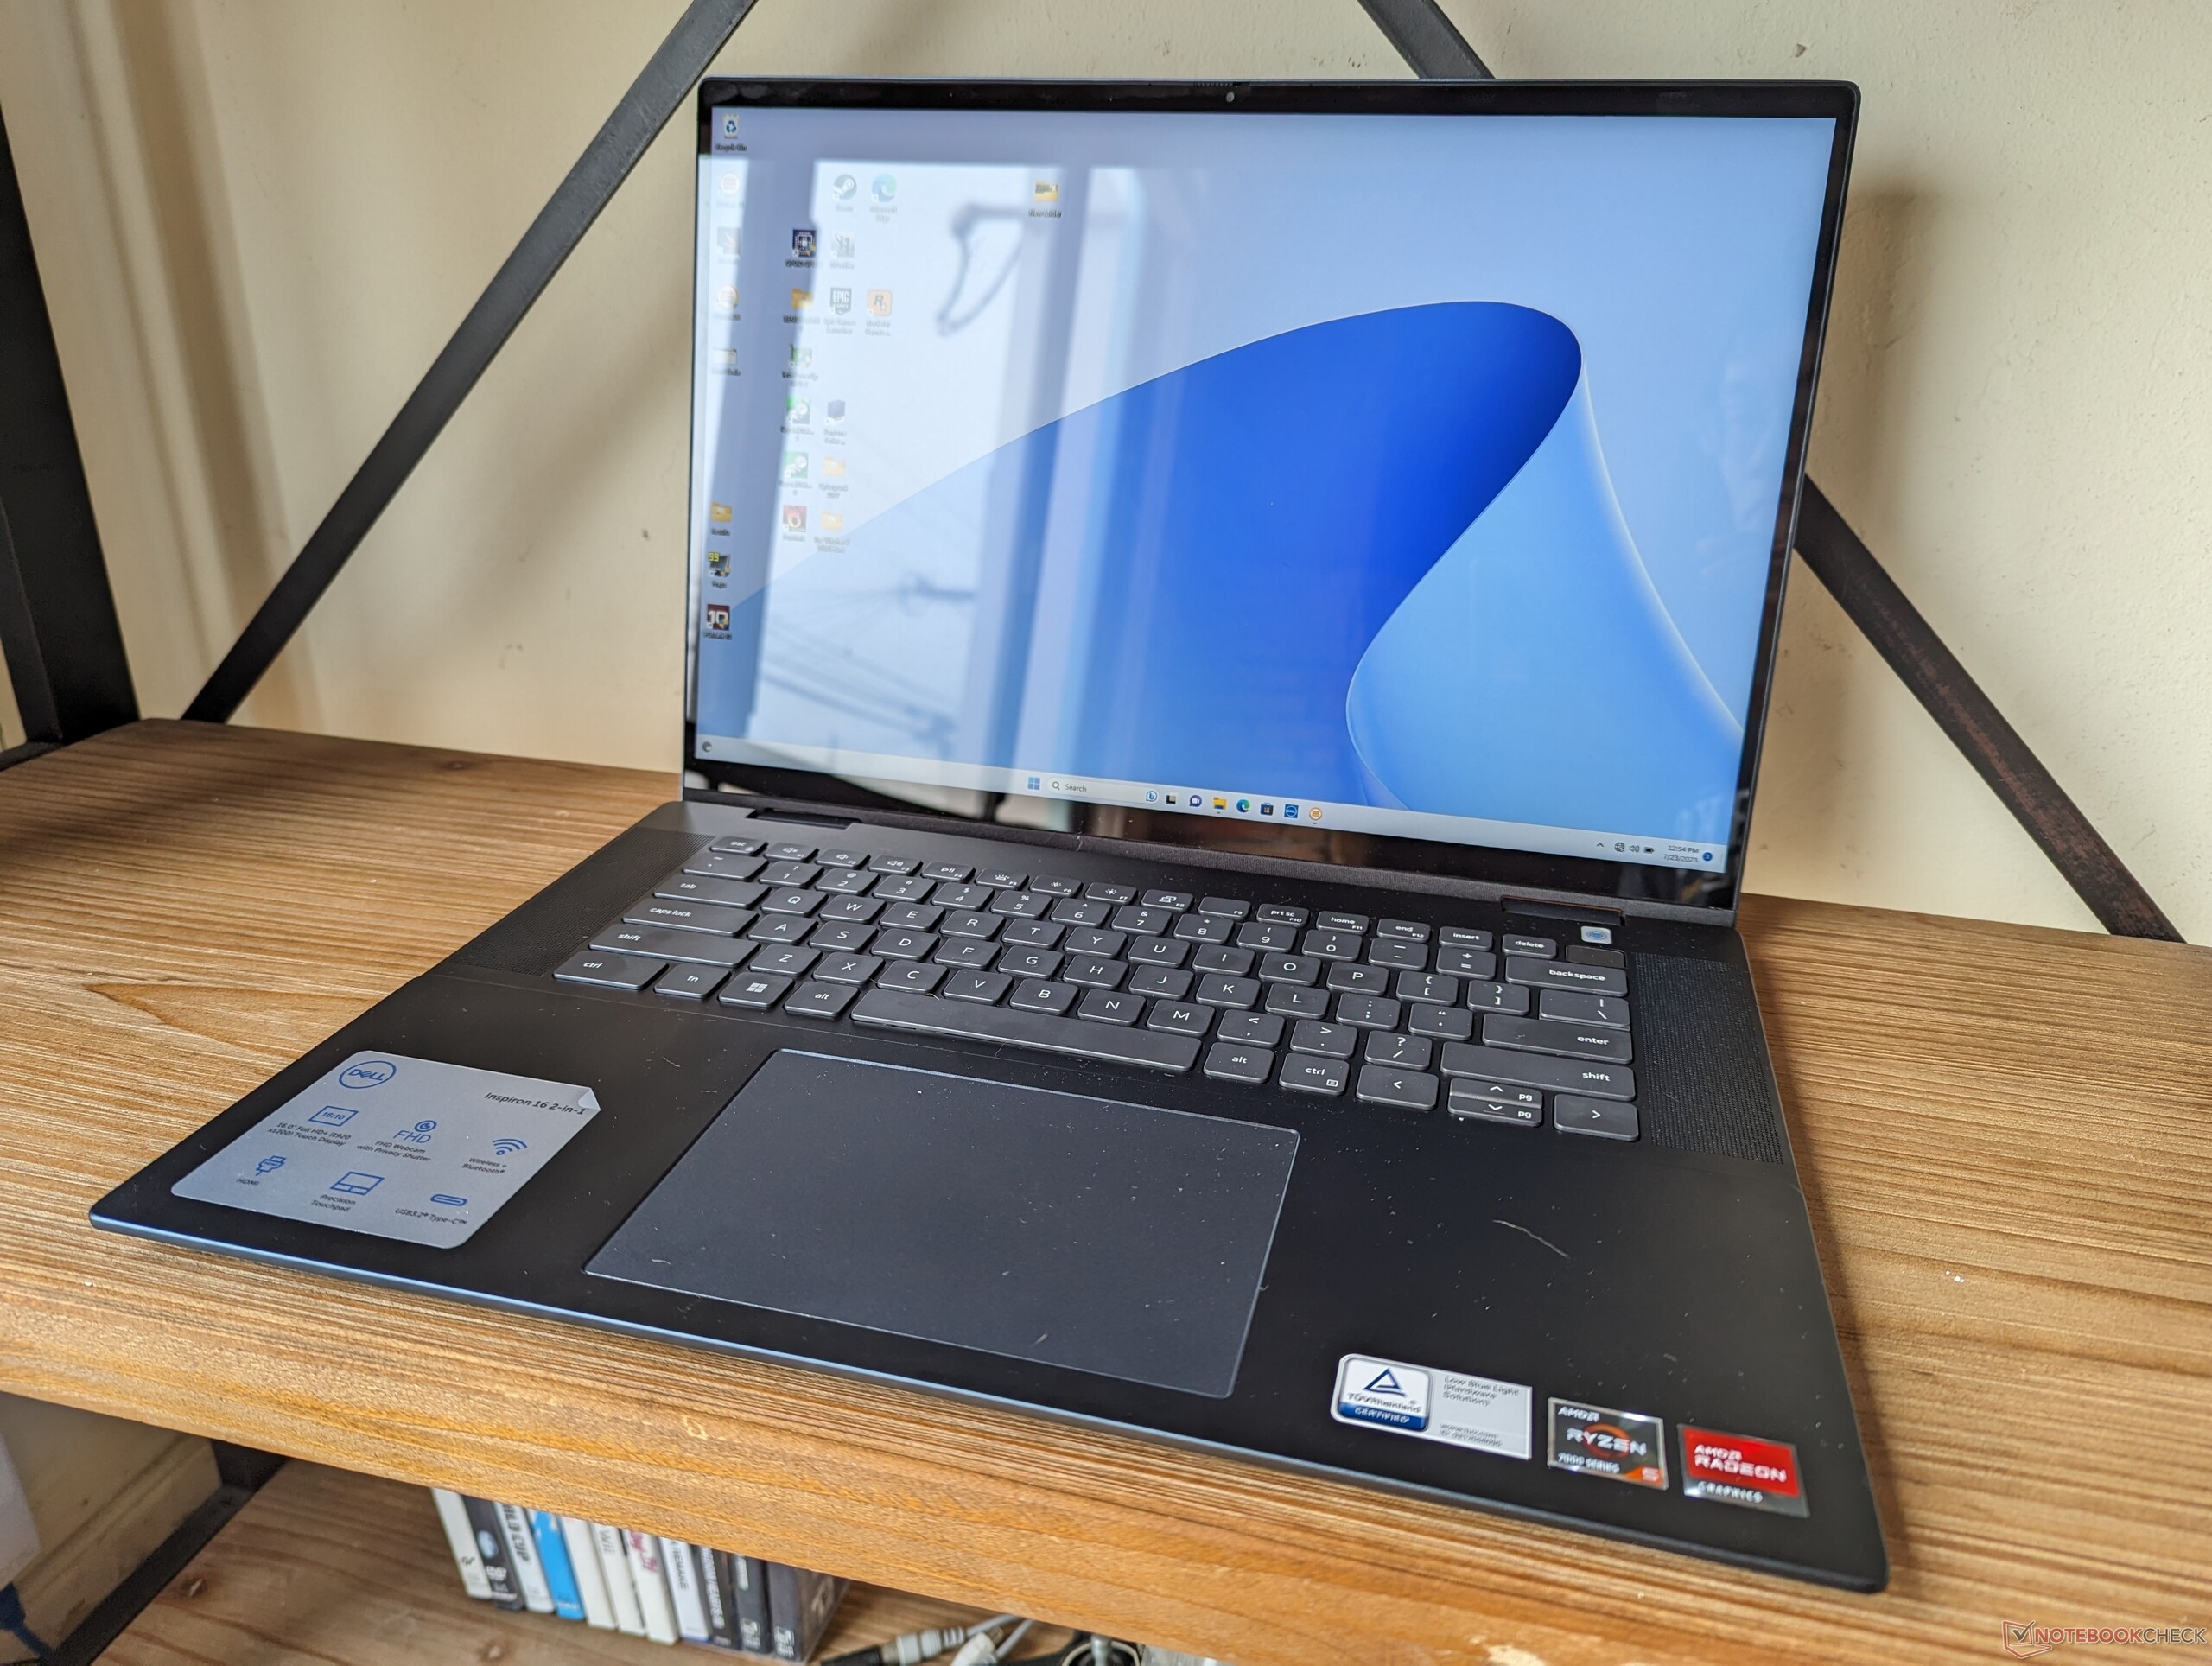
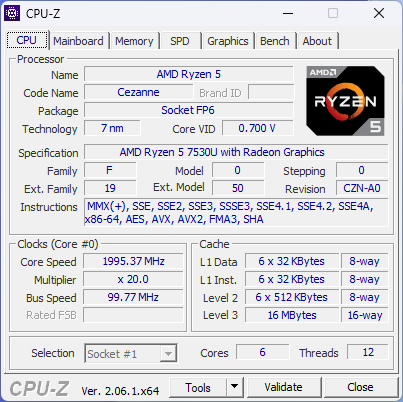
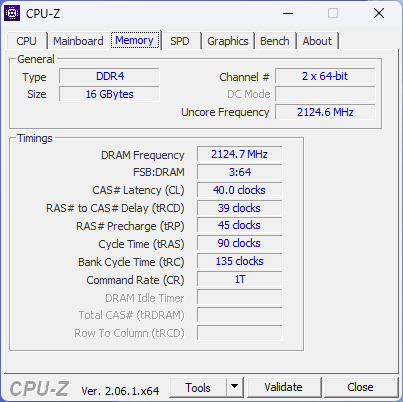
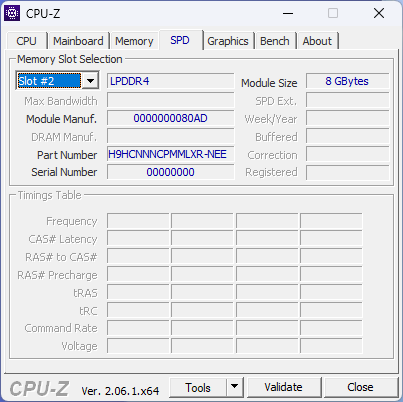
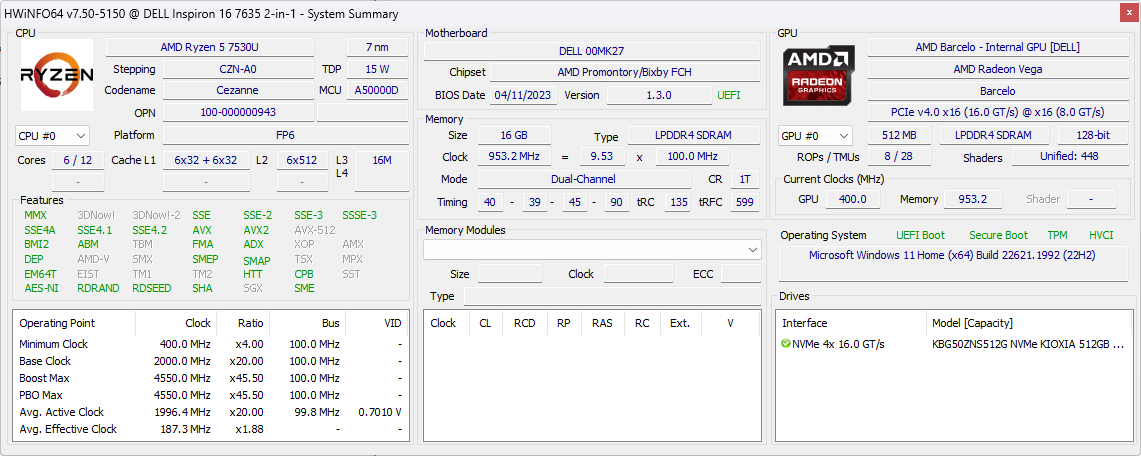
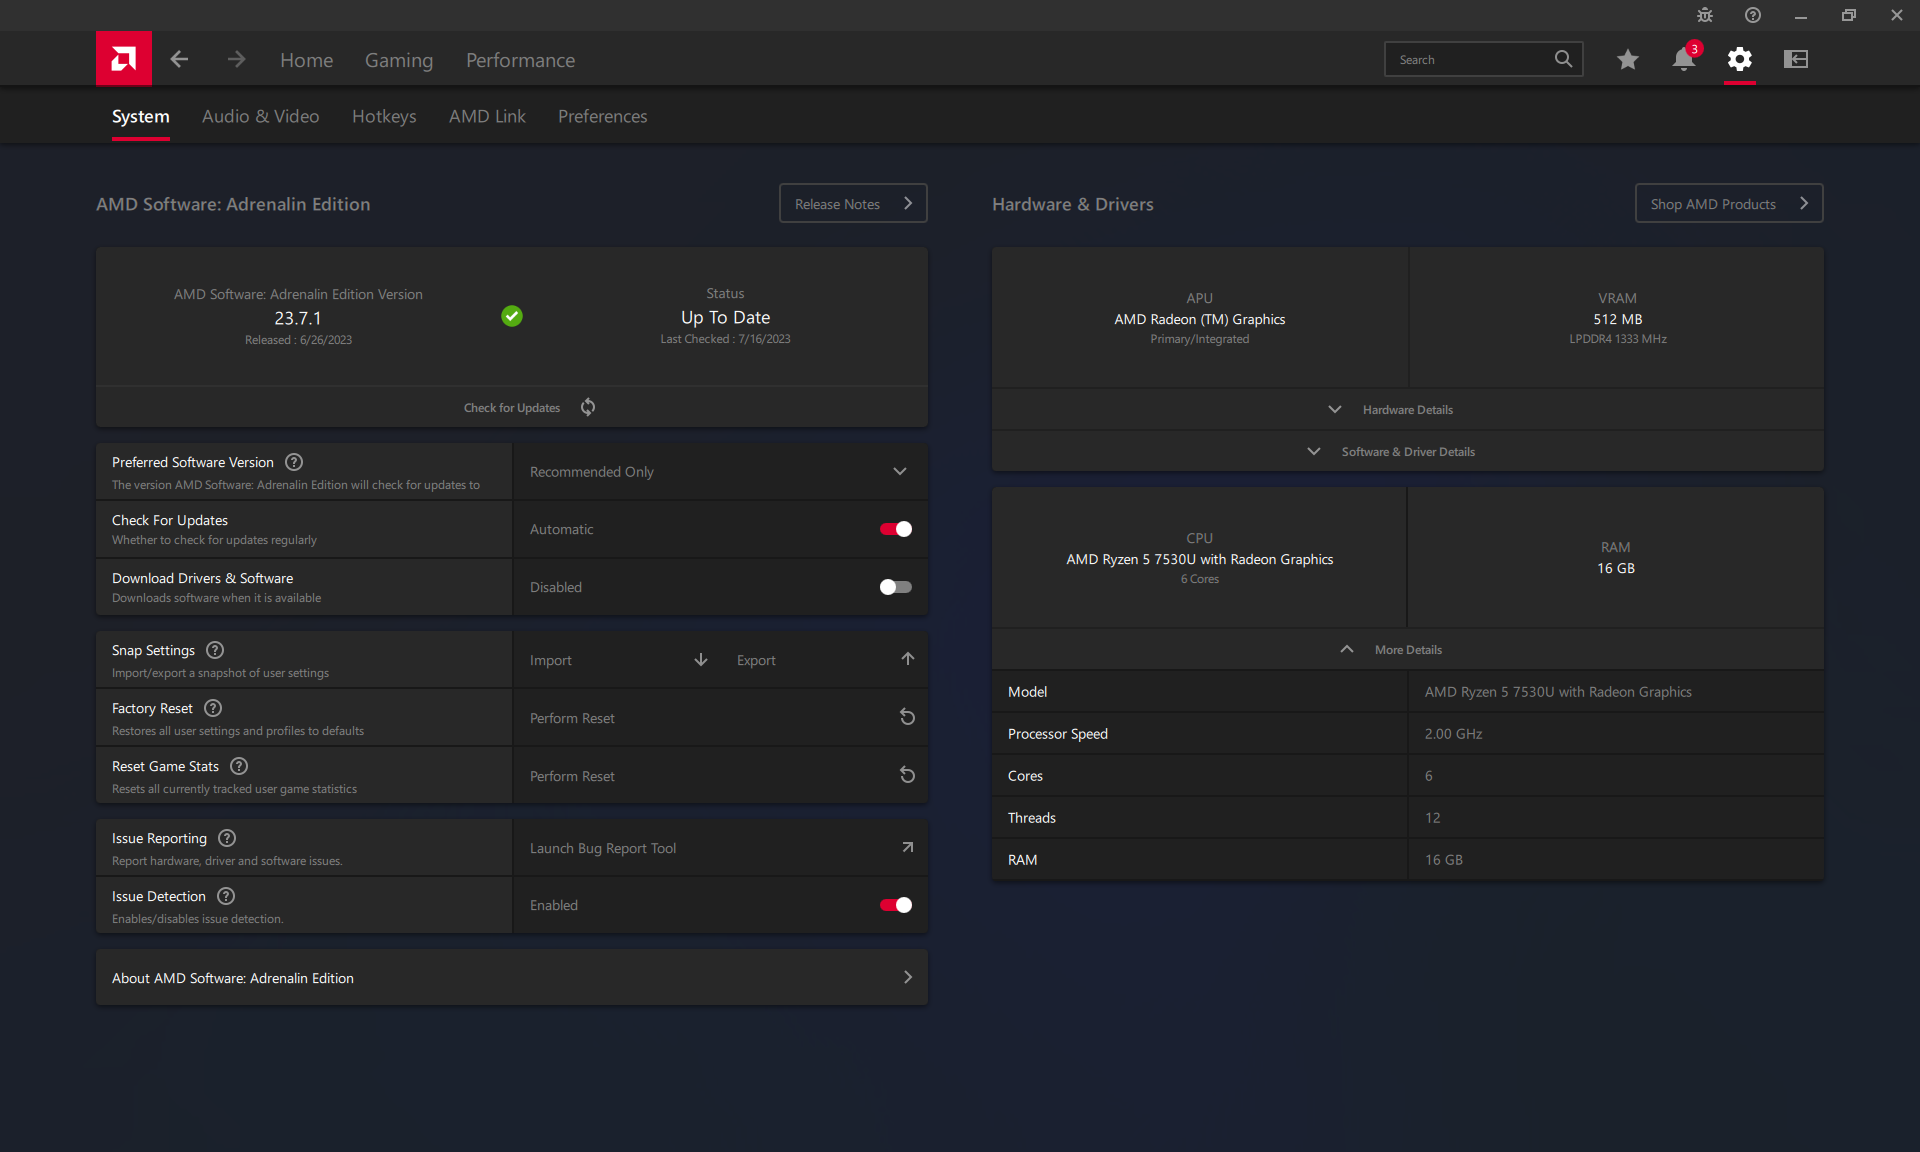
Onze specifieke testunit is een low-end configuratie met de Zen 3 Ryzen 5 7530U CPU, 16 GB gesoldeerd LPDDR4x 4266 MHz RAM en 512 GB NVMe SSD voor ongeveer 900 USD retail. Er is een duurdere Ryzen 7 7730U optie beschikbaar, maar alle AMD SKU's worden op dit moment geleverd met hetzelfde 1200p IPS paneel, terwijl de Intel versie een duurdere 2400p OLED optie heeft.
Alternatieven voor de Inspiron 16 7635 2-in-1 zijn andere grote convertible laptops zoals de Lenovo Flex 5 16 of de krachtigere MSI Summit E16 Flipof HP Spectre x360 16.
Meer Dell beoordelingen:
Potentiële concurrenten in vergelijking
Evaluatie | Datum | Model | Gewicht | Hoogte | Formaat | Resolutie | Beste prijs |
|---|---|---|---|---|---|---|---|
| 84.6 % v7 (old) | 07-2023 | Dell Inspiron 16 7635 2-in-1 R5 7530U, Vega 7 | 2 kg | 18.99 mm | 16.00" | 1920x1200 | |
| 87.5 % v7 (old) | 06-2023 | Acer Swift Edge SFE16-42-R1GM R7 7735U, Radeon 680M | 1.2 kg | 13.95 mm | 16.00" | 3840x2400 | |
| 85.8 % v7 (old) | 05-2023 | Lenovo Yoga 7 16IRL8 i7-1355U, Iris Xe G7 96EUs | 2 kg | 16.99 mm | 16.00" | 1920x1200 | |
| 85.6 % v7 (old) | 05-2023 | Samsung Galaxy Book3 Pro 16 i5-1340P, Iris Xe G7 80EUs | 1.6 kg | 12.5 mm | 16.00" | 2880x1800 | |
| 80.7 % v7 (old) | 04-2023 | Lenovo IdeaPad Flex 5 16ABR G8 R7 7730U, Vega 8 | 2 kg | 18.7 mm | 16.00" | 1920x1200 | |
| 85.7 % v7 (old) | 06-2022 | Dell Inspiron 16 7620 2-in-1 i7-1260P, Iris Xe G7 96EUs | 2.1 kg | 18.41 mm | 16.00" | 1920x1200 |
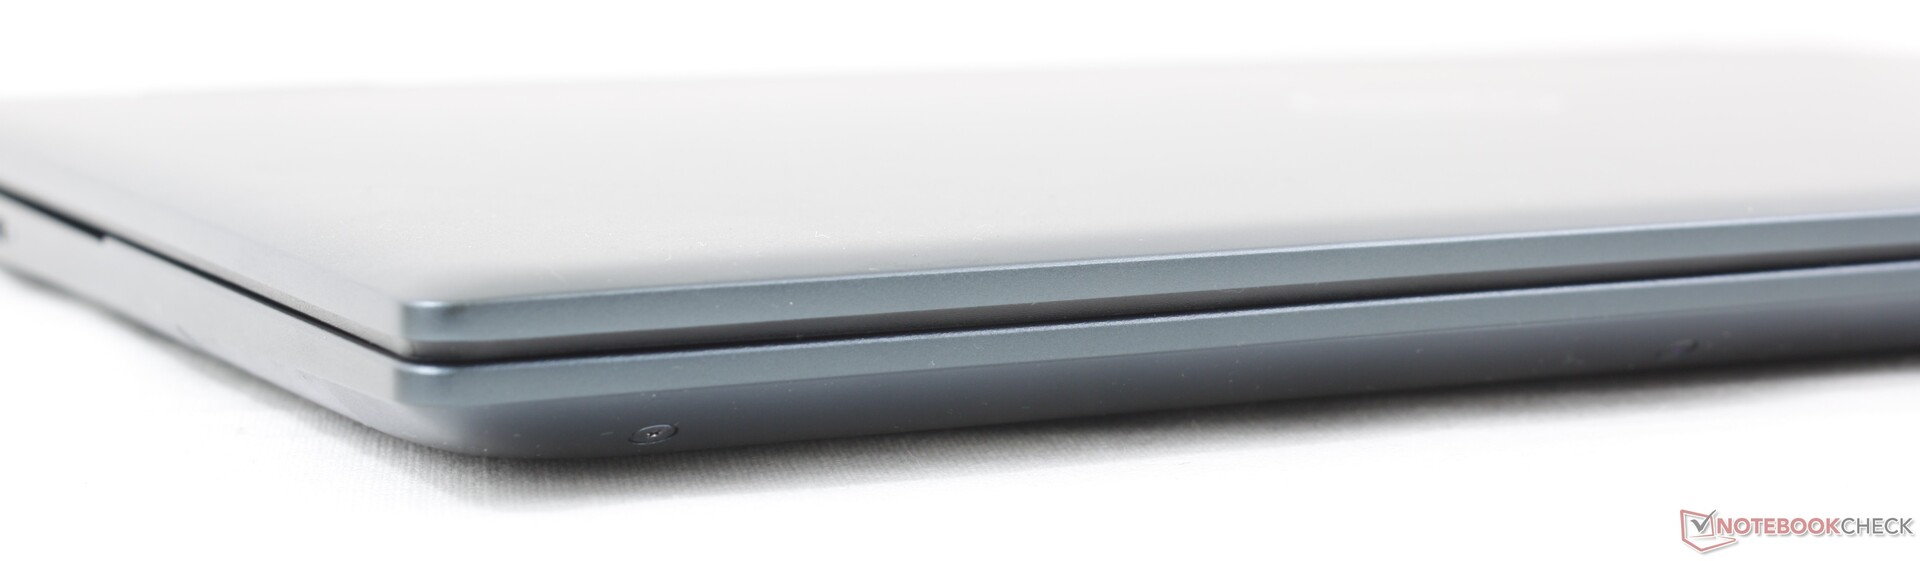
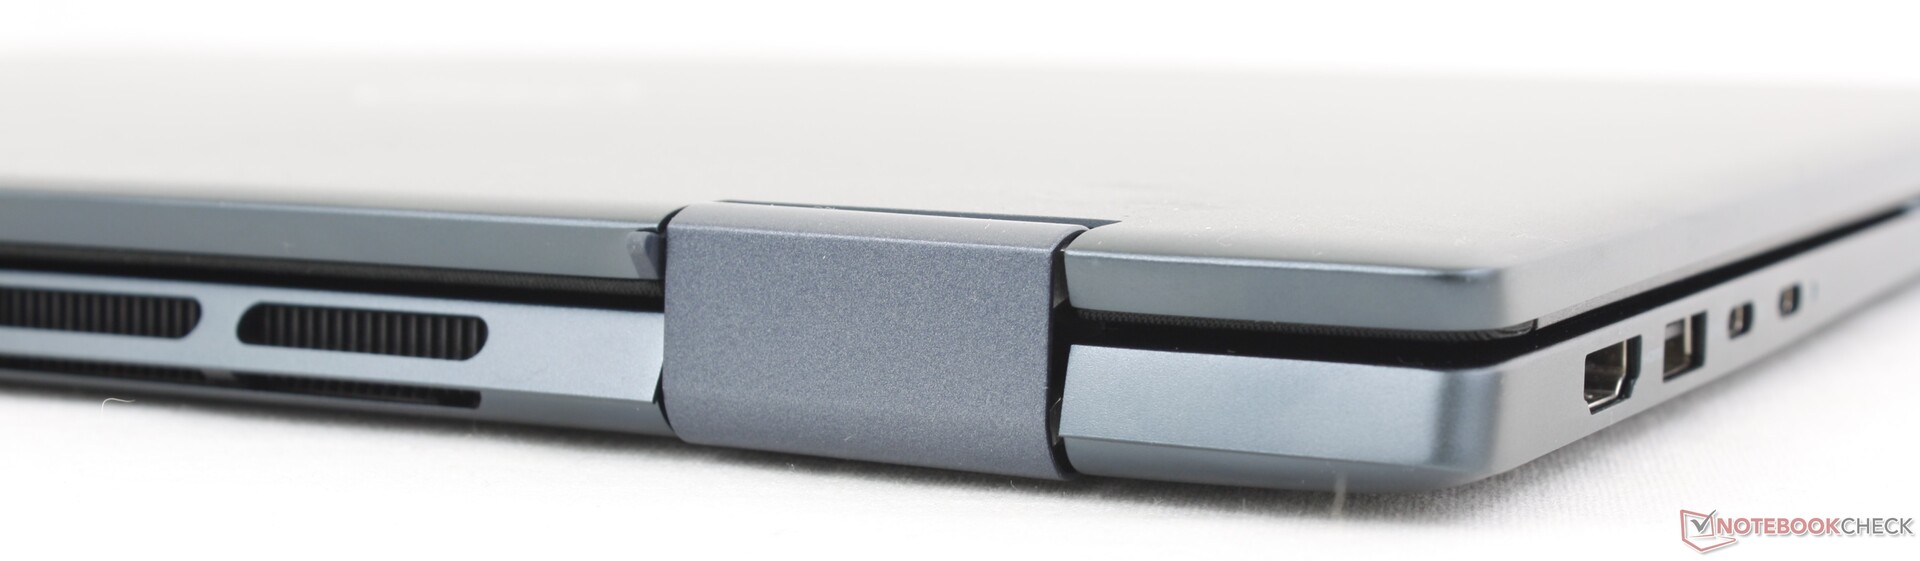
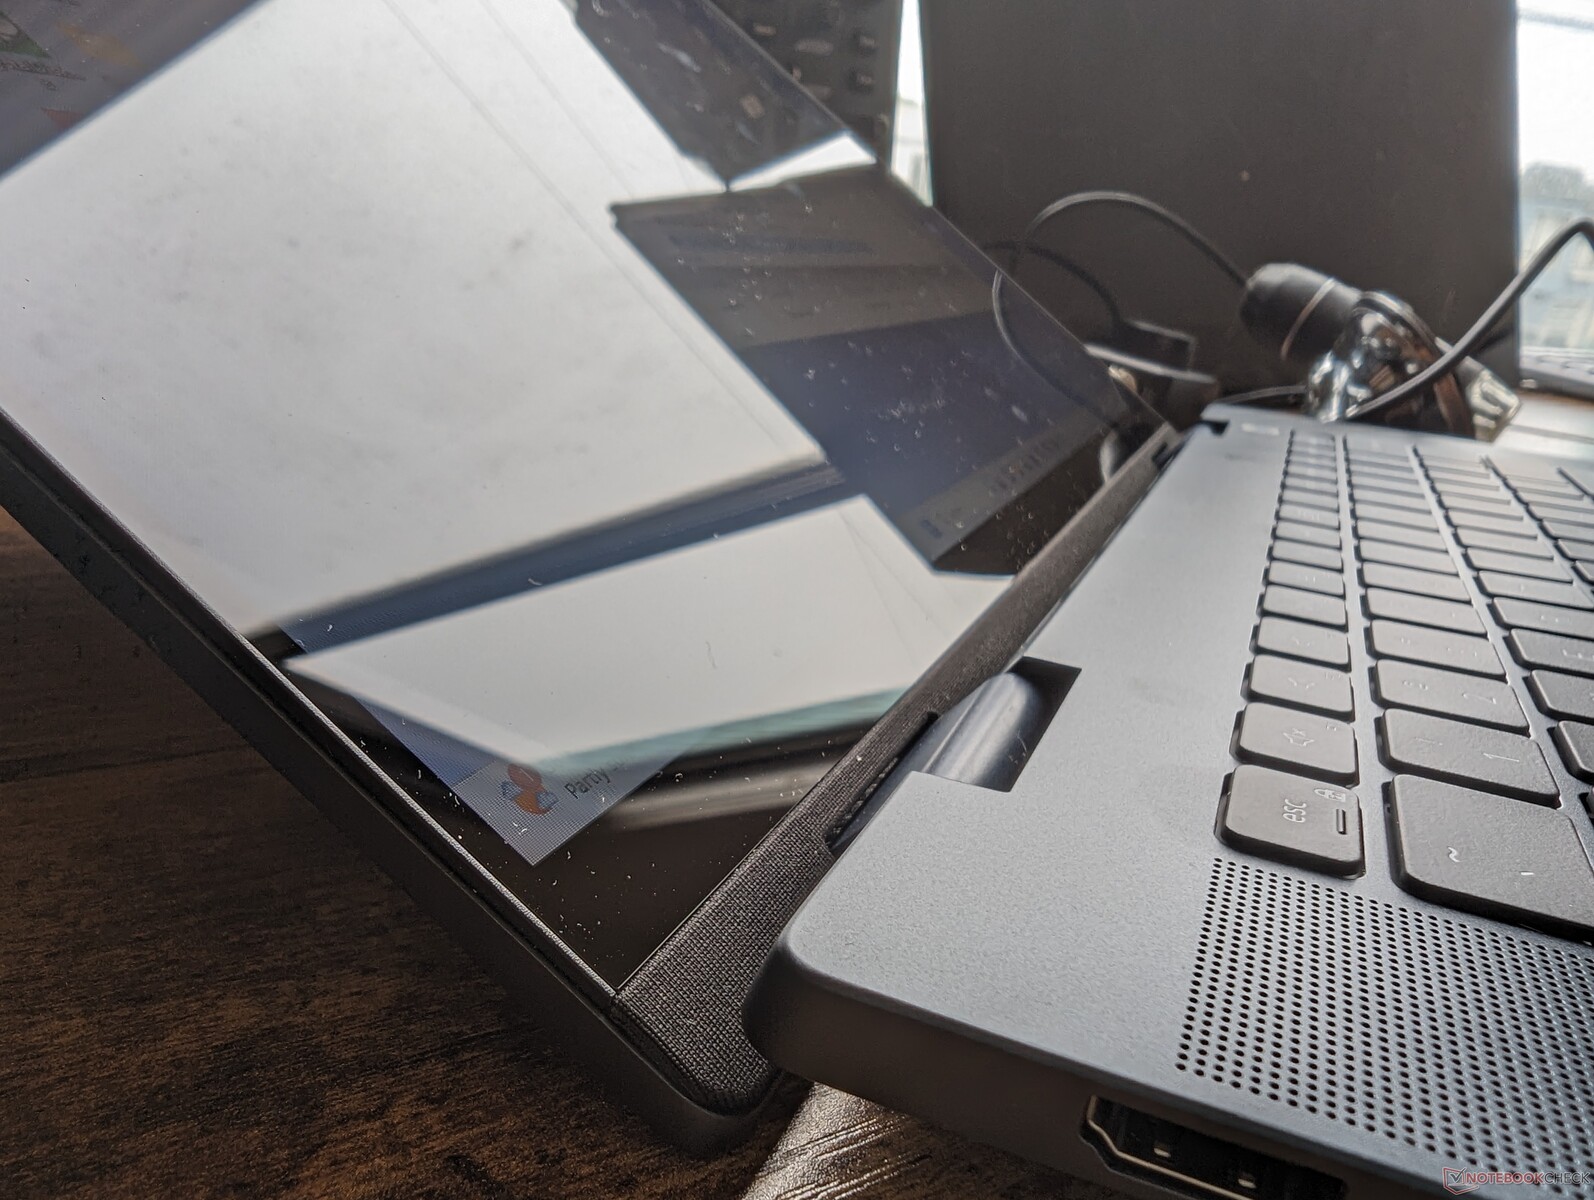
Koffer - Mylar stilletjes laten vallen
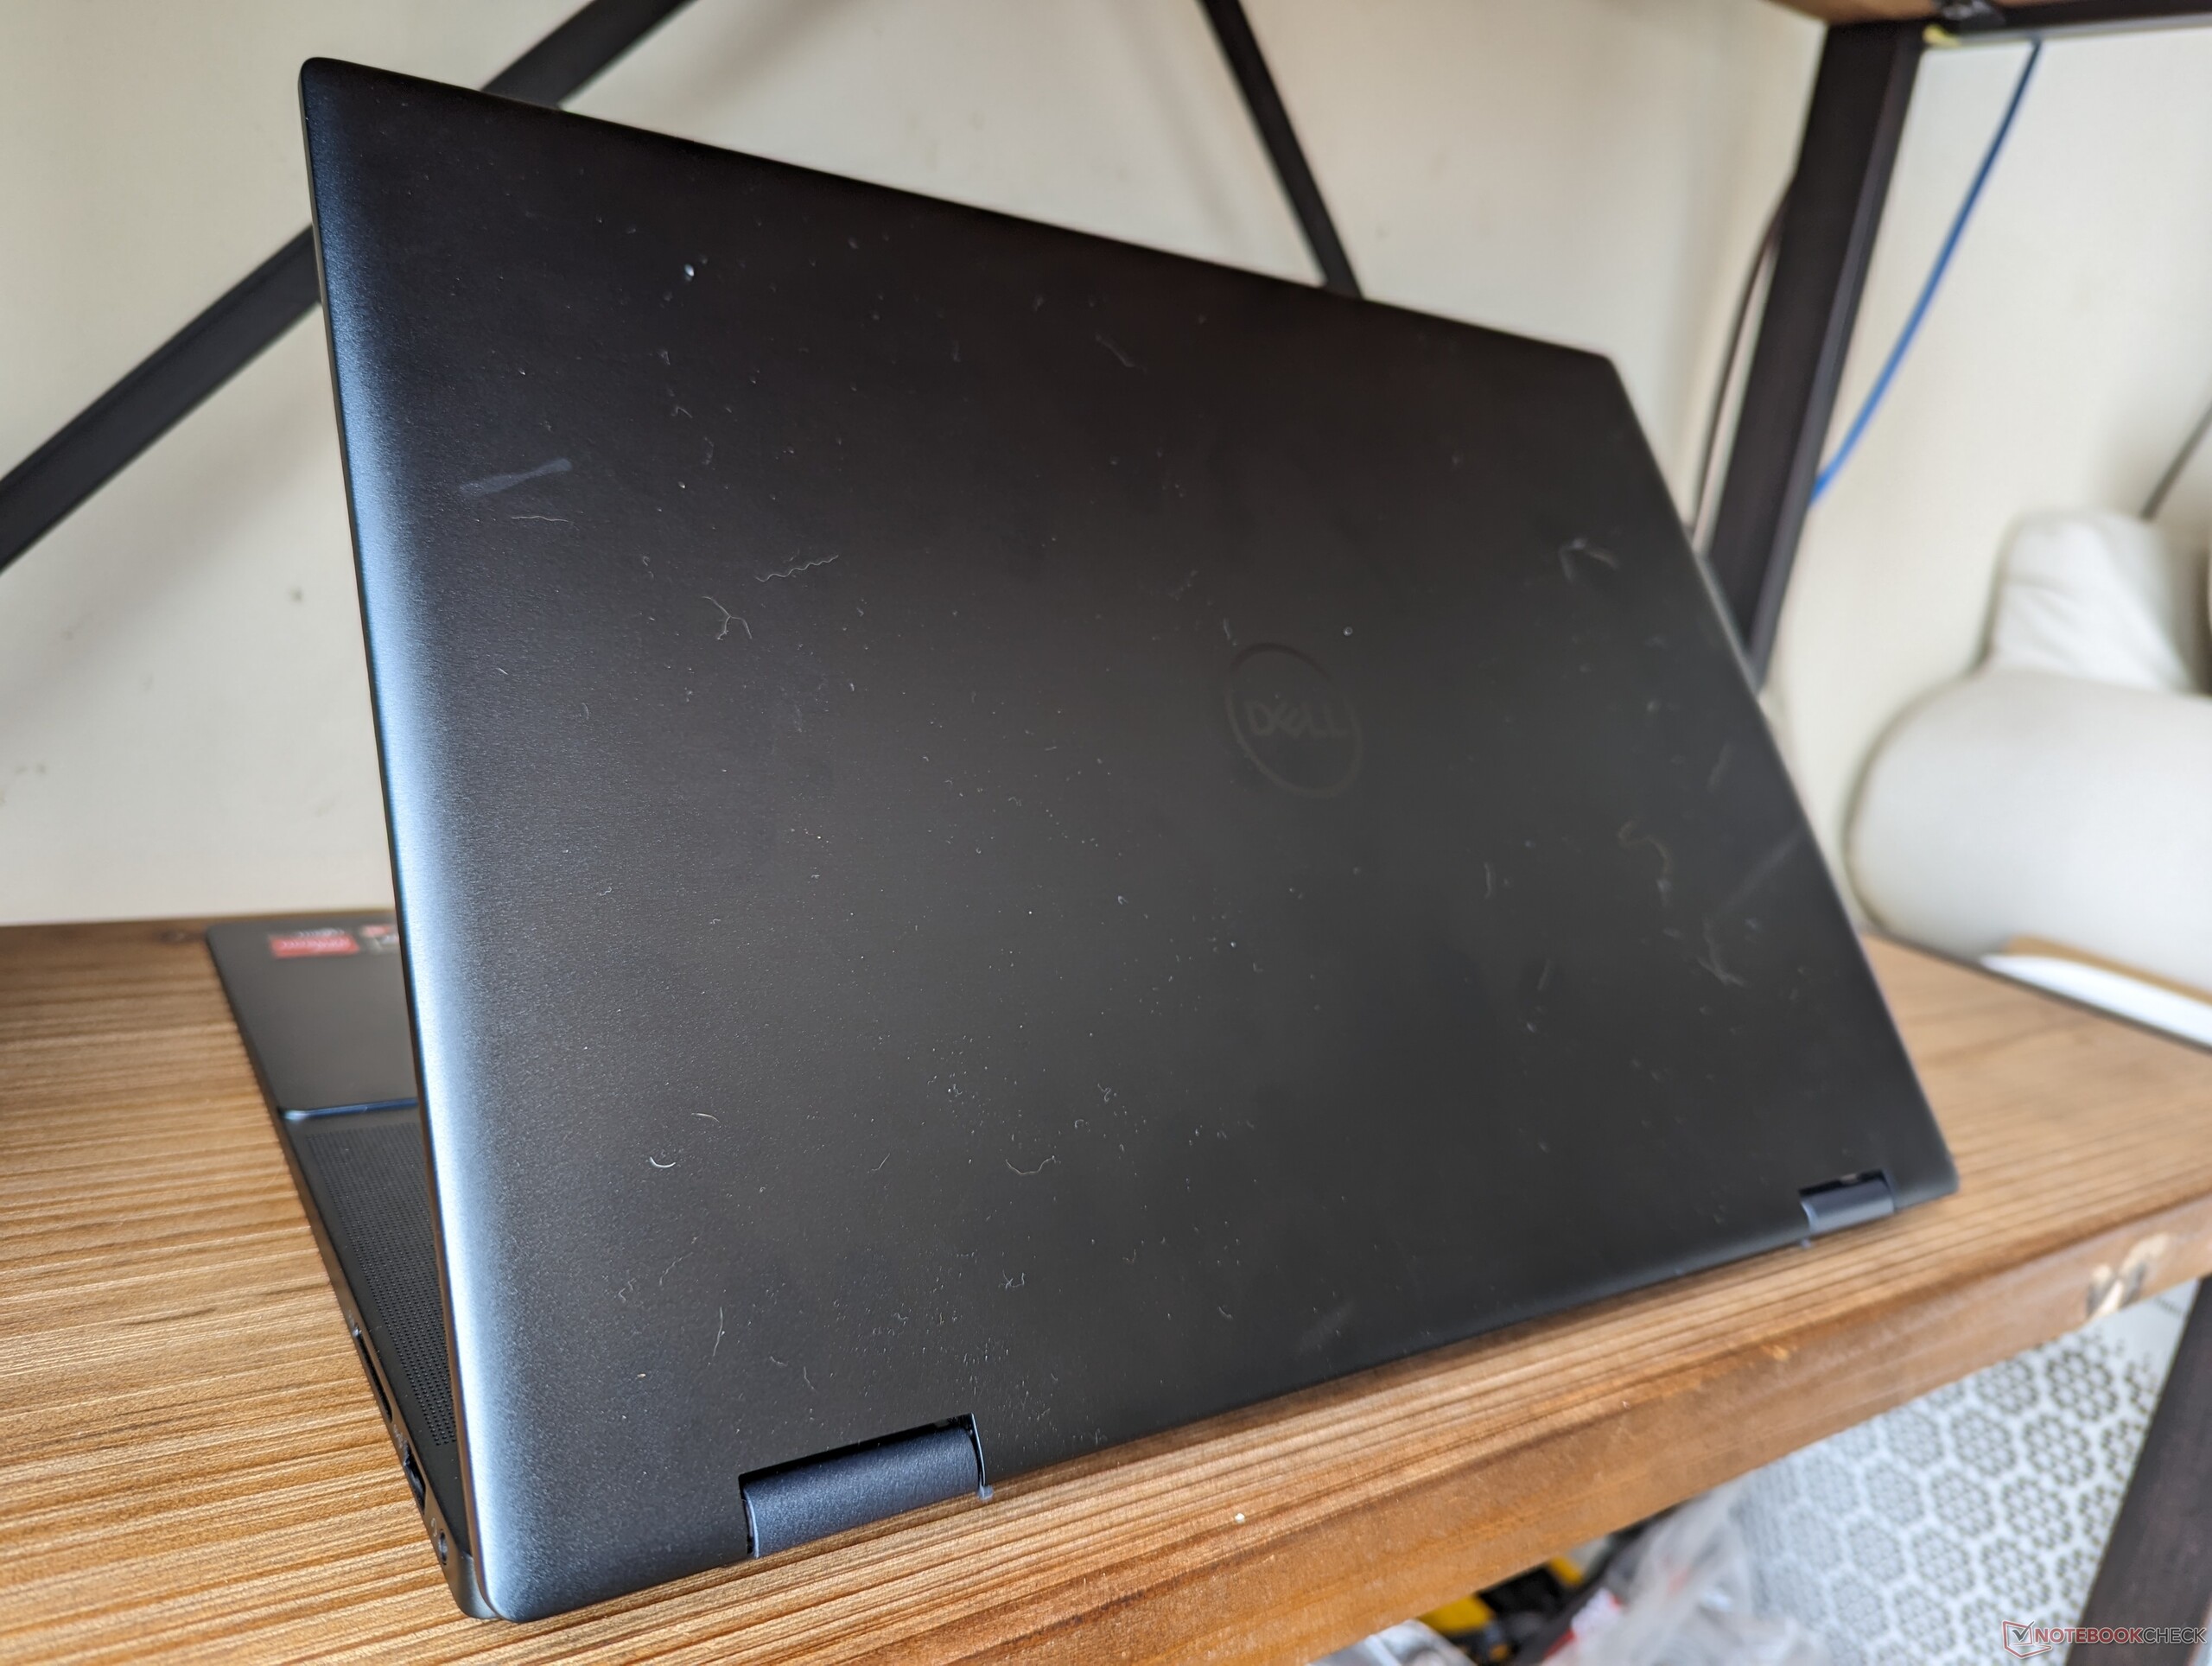
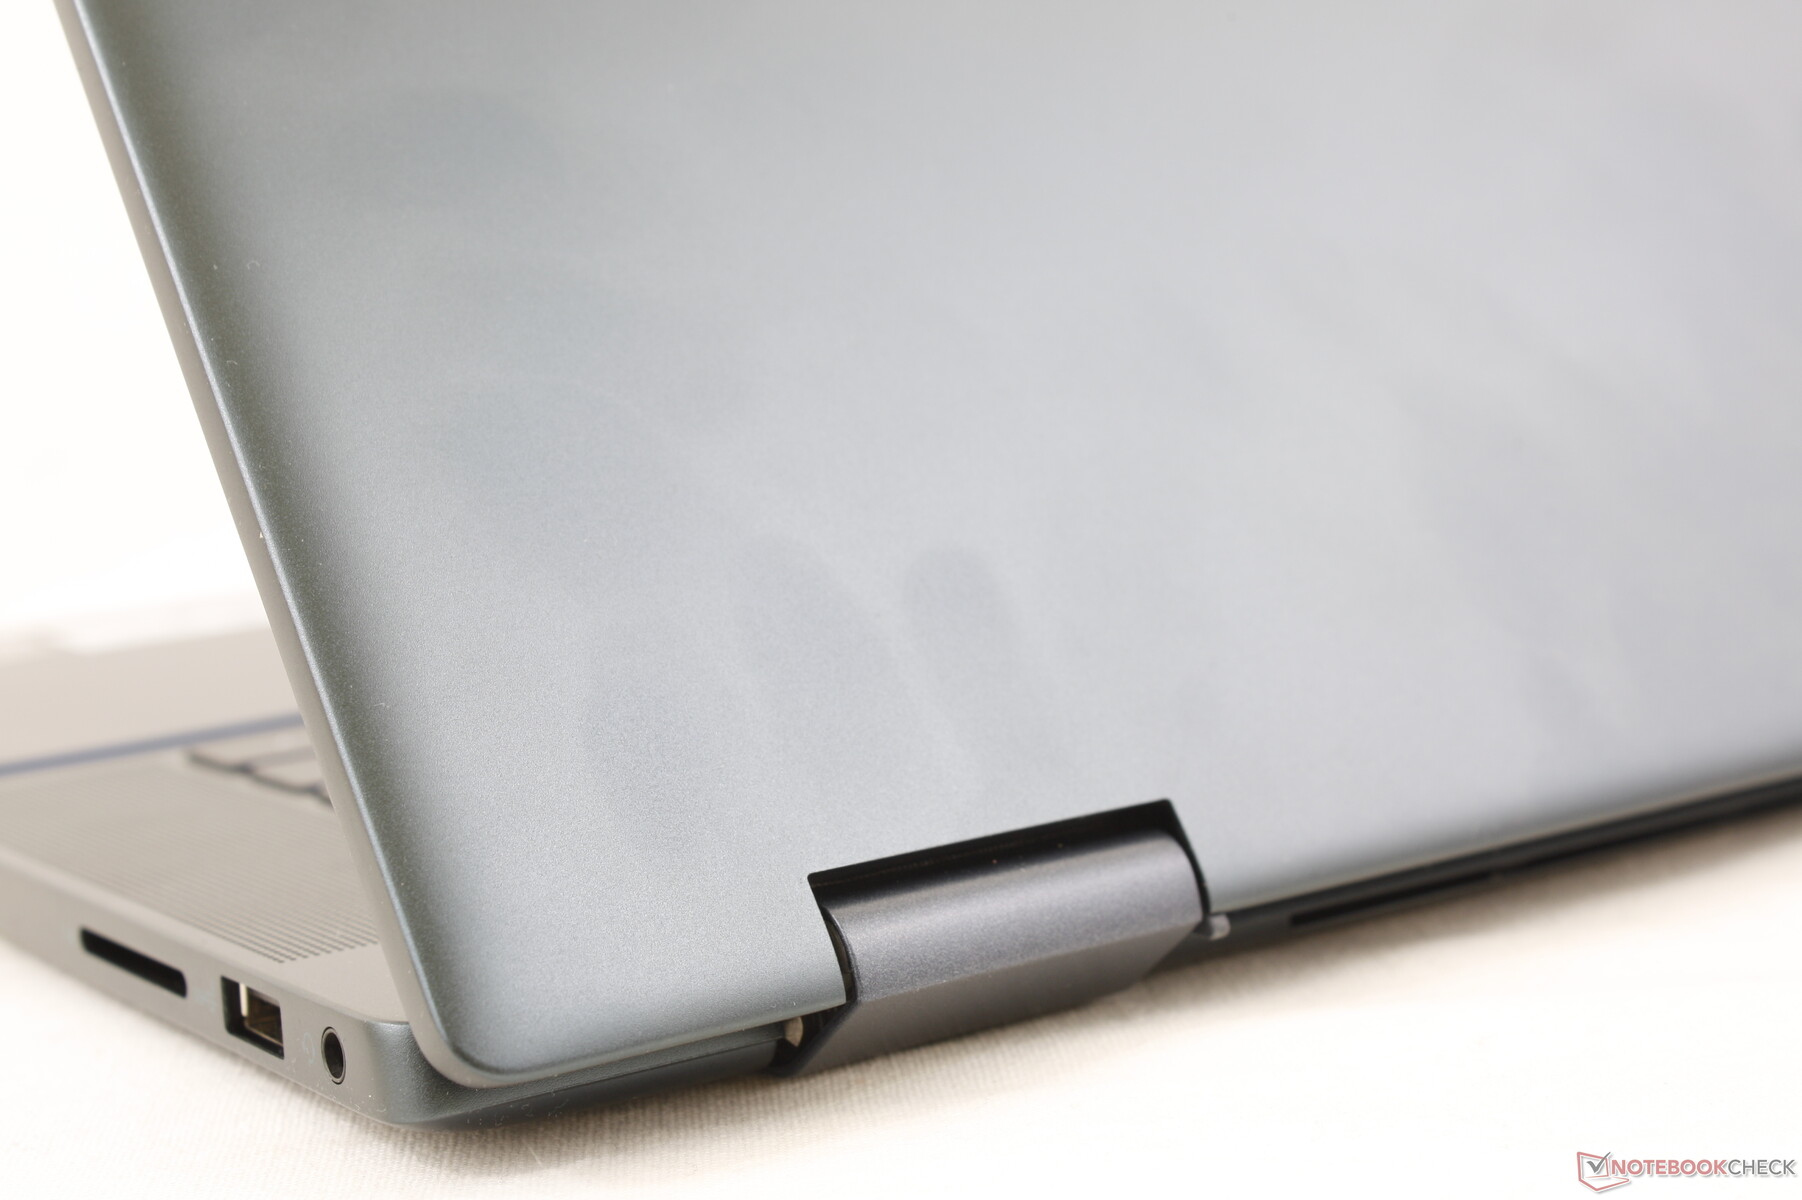
Dell maakte veel ophef over het gebruik van Mylar op de Inspiron 16 7620 2-in-1 van vorig jaar en dus is het een beetje verbijsterend om te zien dat het plotseling verdwenen is voor de Inspiron 16 7630/7635 refresh van dit jaar. In plaats daarvan bestaat het chassis nu uit een combinatie van aluminium en gerecycled plastic voor een meer monotoon kleurenschema en uiterlijk. De scharnieren zijn ook platter gemaakt en er zijn nu extra ventilatieroosters aan de achterkant om de koeling te bevorderen.
Ondanks de uiterlijke veranderingen is de kwaliteit van het chassis hetzelfde gebleven. Het dichte gewicht draagt bij aan een onverzettelijke basis voor een sterke eerste indruk die slechts een stap of twee lager is dan de veel duurdere en even zwareHP Spectre x360 16.
Misschien is het toeval dat de afmetingen en het gewicht bijna identiek zijn aan die van de concurrerendeIdeaPad Flex 5 16. Het nieuwe model is helaas niet kleiner of lichter dan de Inspiron 16 7620 2-in-1 van vorig jaar en dus blijft het een relatief zware laptop, zelfs voor de 16-inch formaatcategorie.
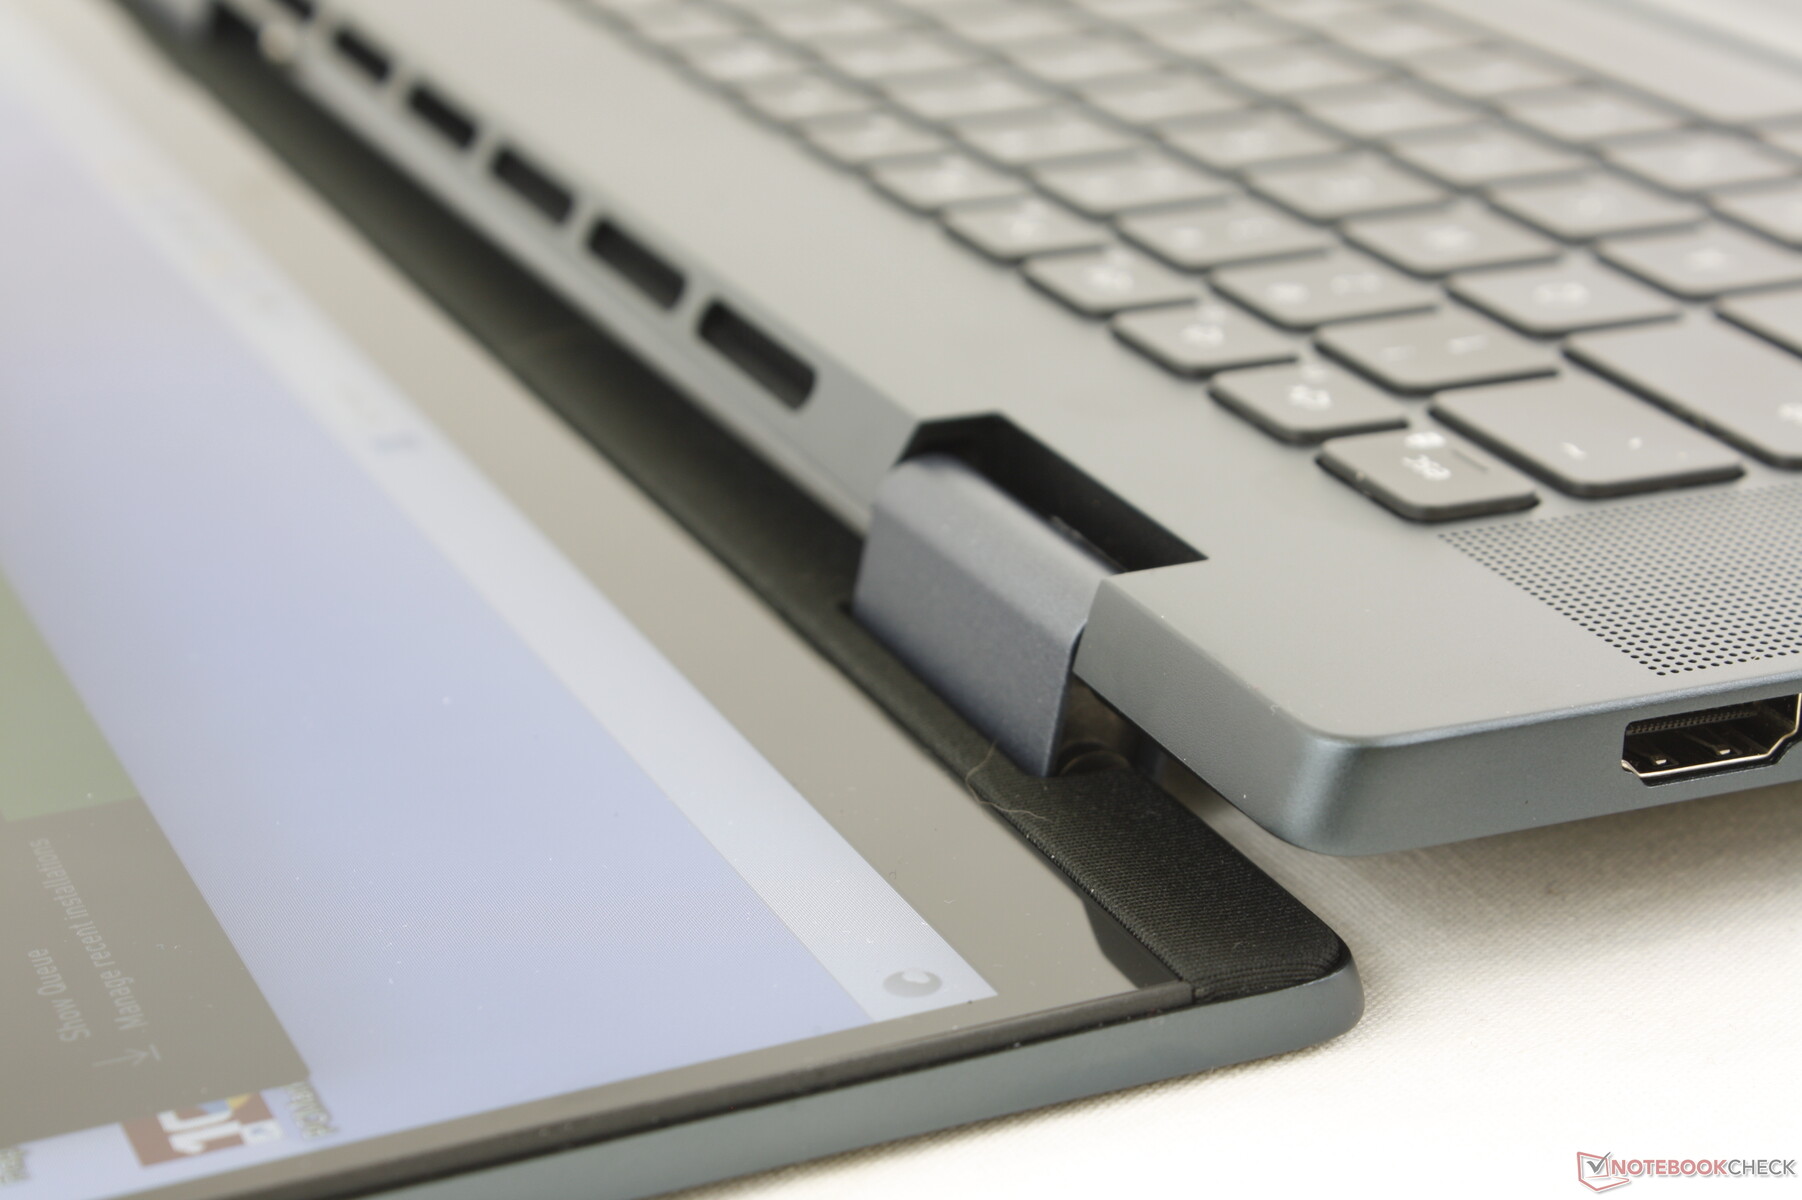
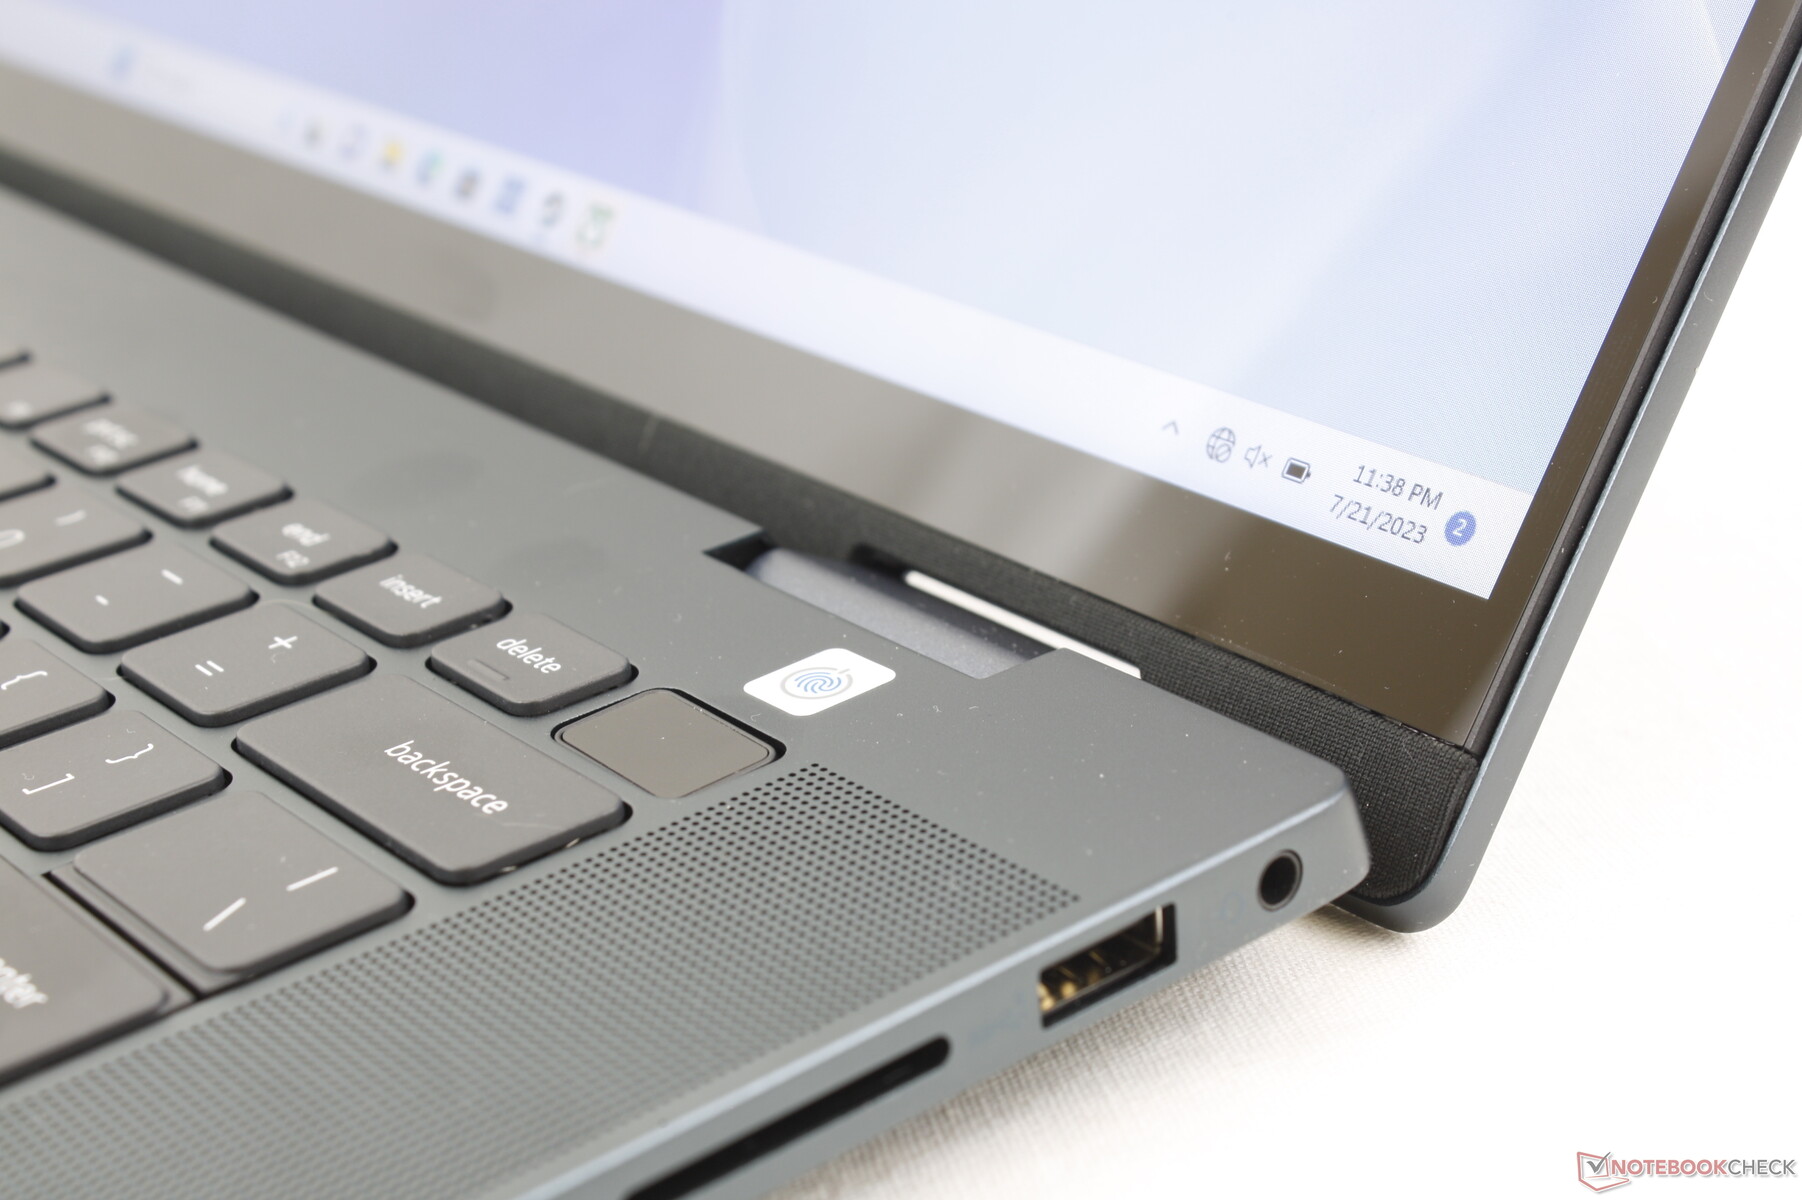

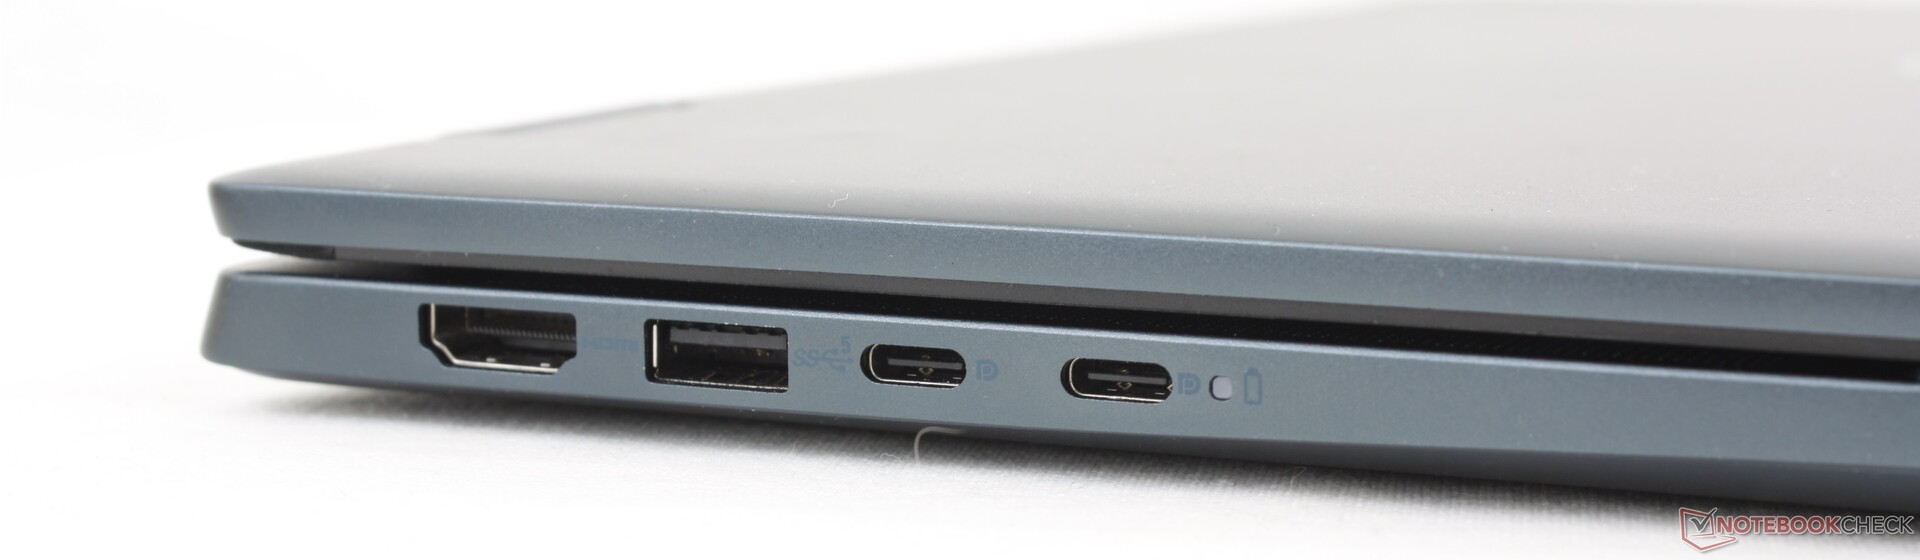
Connectiviteit - Geen Thunderbolt-ondersteuning
Het model heeft alle poorten van de Inspiron 16 7620 2-in-1 van vorig jaar. Het grootste verschil is echter dat onze AMD-configuratie geen Thunderbolt-ondersteuning heeft. De verscheidenheid aan poorten is echter nog steeds vergelijkbaar met andere 16-inch laptops, zoals de IdeaPad Flex 5 16 of de Acer Swift Edge SFE16.
Houd er rekening mee dat de HDMI-poort slechts 1.4 is in plaats van 2.0. Voor een goede ondersteuning van externe 4K-monitoren met 60 Hz moet je in plaats daarvan de USB-C-poorten gebruiken.
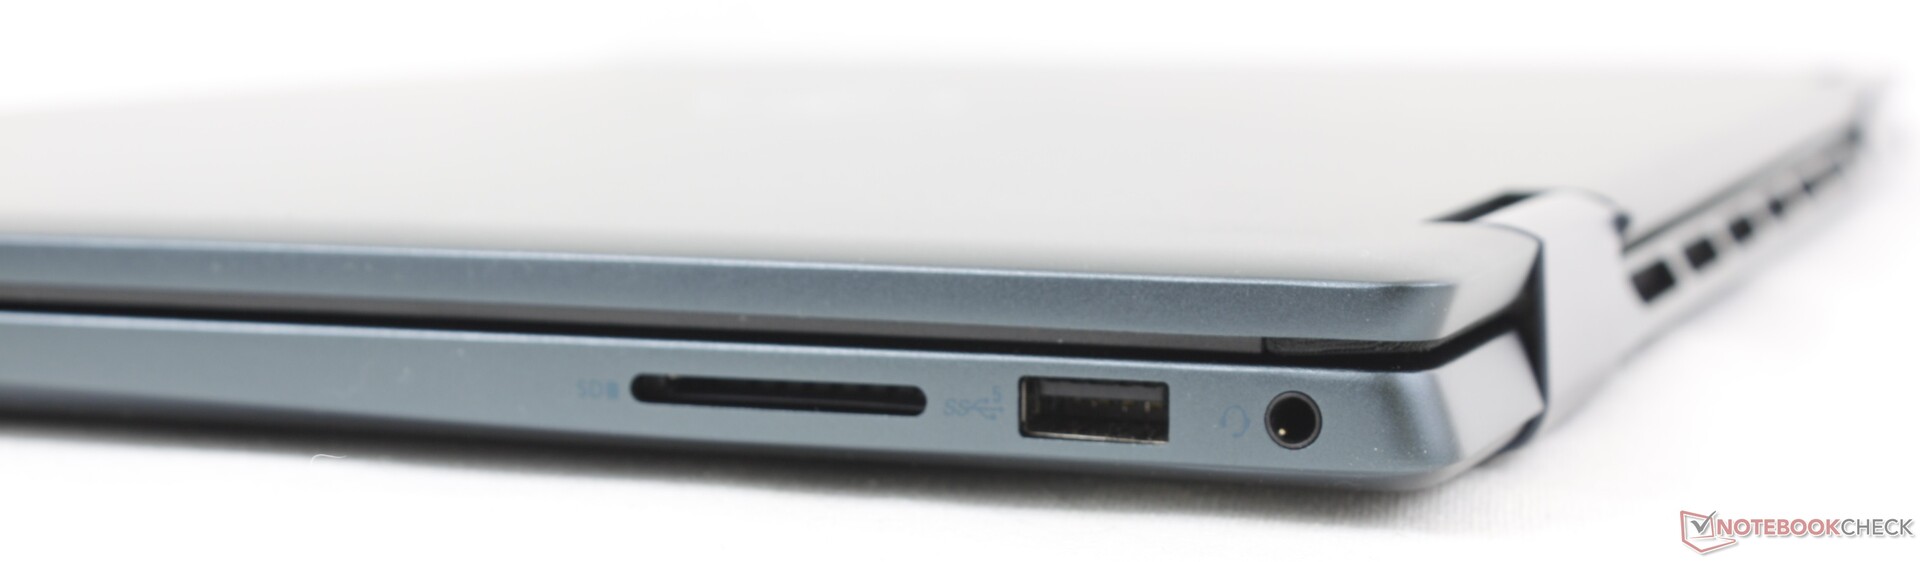
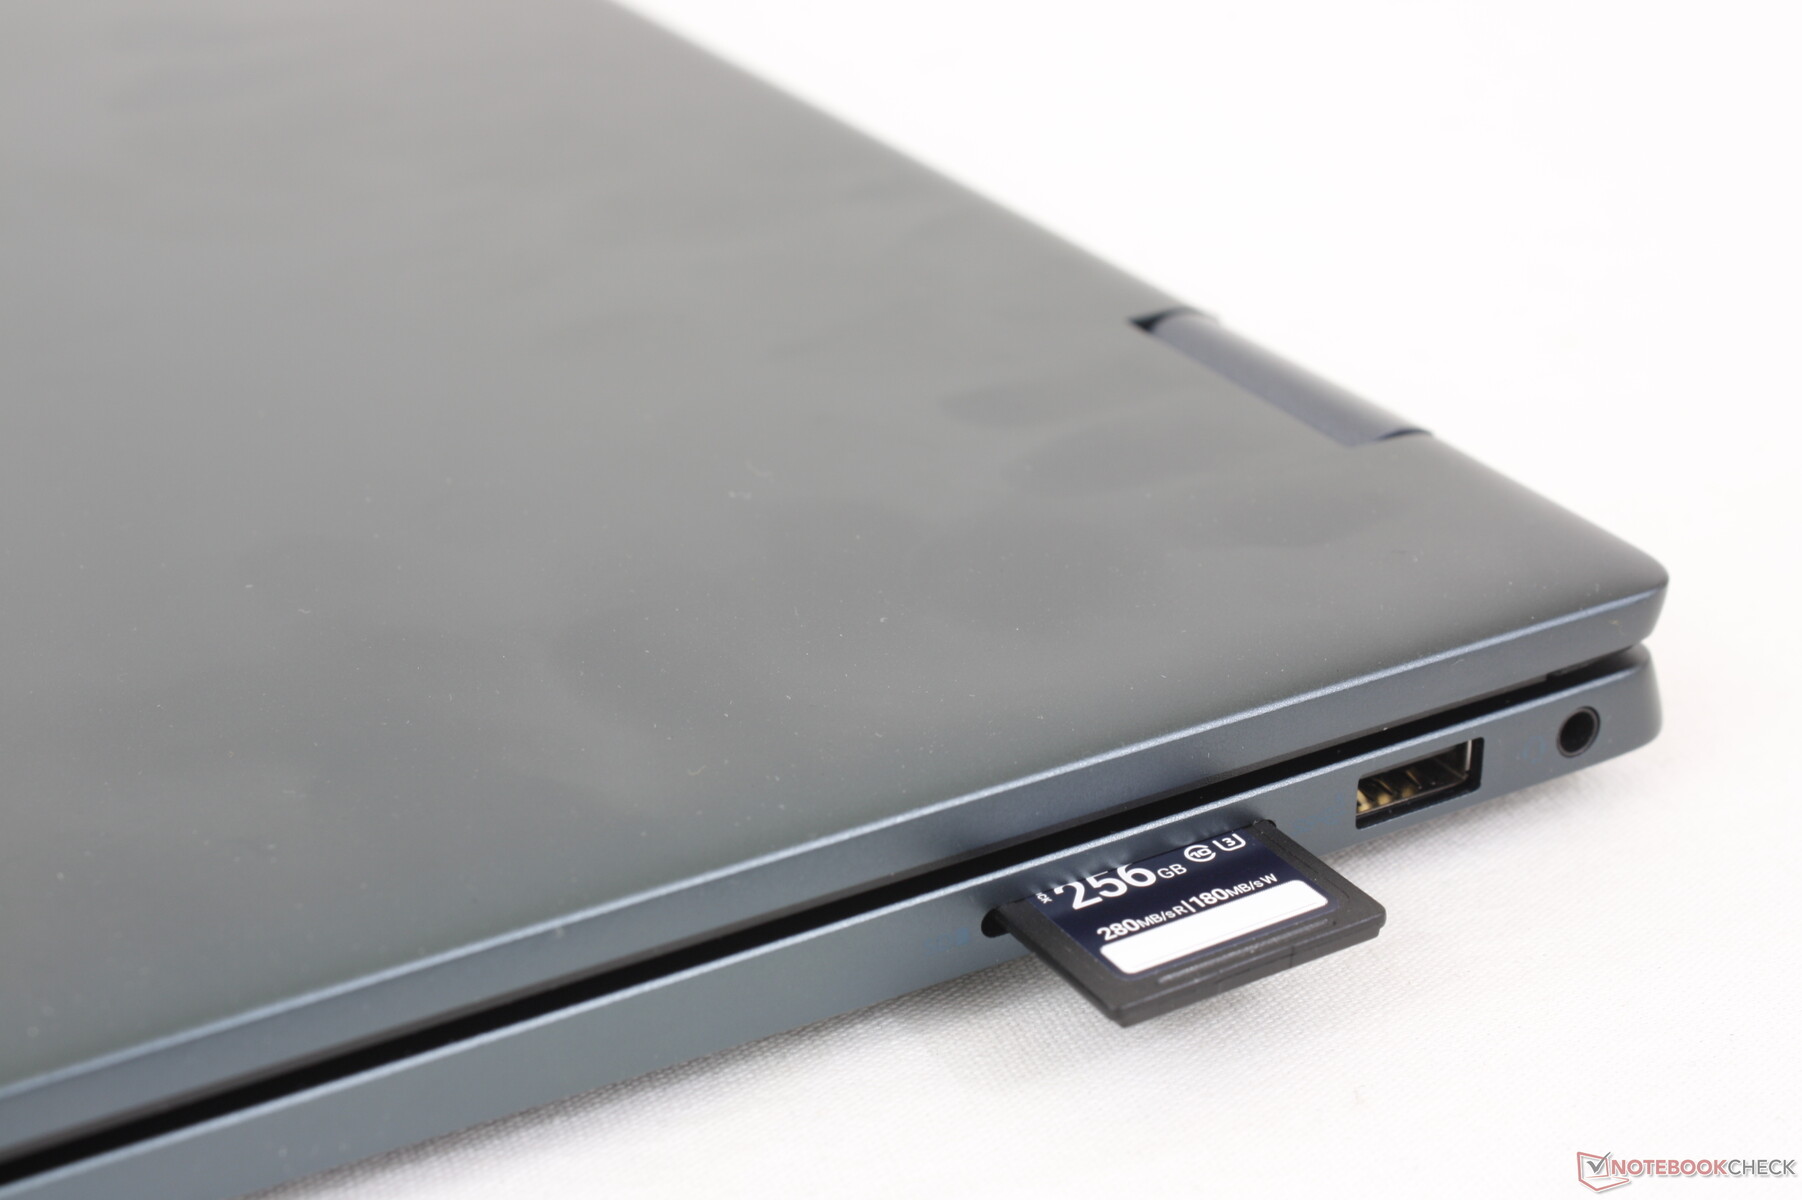
SD-kaartlezer
De geïntegreerde kaartlezer presteert iets sneller dan voorheen, maar de overdrachtsnelheden zijn nog steeds ongeveer half zo snel als op de Lenovo IdeaPad Flex 5 16 of Galaxy Book3 Pro 16. Het verplaatsen van 1 GB aan foto's van onze PNY UHS-II testkaart naar het bureaublad duurt ongeveer 32 seconden, vergeleken met 17 seconden op de eerder genoemde Lenovo.
| SD Card Reader | |
| average JPG Copy Test (av. of 3 runs) | |
| Lenovo IdeaPad Flex 5 16ABR G8 (Angelibird AV Pro V60) | |
| Samsung Galaxy Book3 Pro 16 | |
| Lenovo Yoga 7 16IRL8 (AV Pro SD microSD 128 GB V60) | |
| Dell Inspiron 16 7635 2-in-1 (PNY EliteX-Pro60 V60 256 GB) | |
| Dell Inspiron 16 7620 2-in-1 (Toshiba Exceria Pro SDXC 64 GB UHS-II) | |
| maximum AS SSD Seq Read Test (1GB) | |
| Lenovo Yoga 7 16IRL8 (AV Pro SD microSD 128 GB V60) | |
| Lenovo IdeaPad Flex 5 16ABR G8 (Angelibird AV Pro V60) | |
| Samsung Galaxy Book3 Pro 16 | |
| Dell Inspiron 16 7635 2-in-1 (PNY EliteX-Pro60 V60 256 GB) | |
| Dell Inspiron 16 7620 2-in-1 (Toshiba Exceria Pro SDXC 64 GB UHS-II) | |
Communicatie
De AMD Inspiron wordt geleverd met de MediaTek Wi-Fi 6E MT7922, terwijl de Intel Inspiron wordt geleverd met de AX211. Beide modules zijn compatibel met Wi-Fi 6E of 6 GHz routers. De prestaties zijn stabiel en zonder problemen in combinatie met onze Asus AXE11000.
Webcam
Een 1080p webcam en privacy shutter zijn standaard op alle configuraties, zodat je niet voor verrassingen komt te staan wat betreft de beeldkwaliteit. Alleen het Intel-model wordt echter geleverd met een optionele IR-sensor.


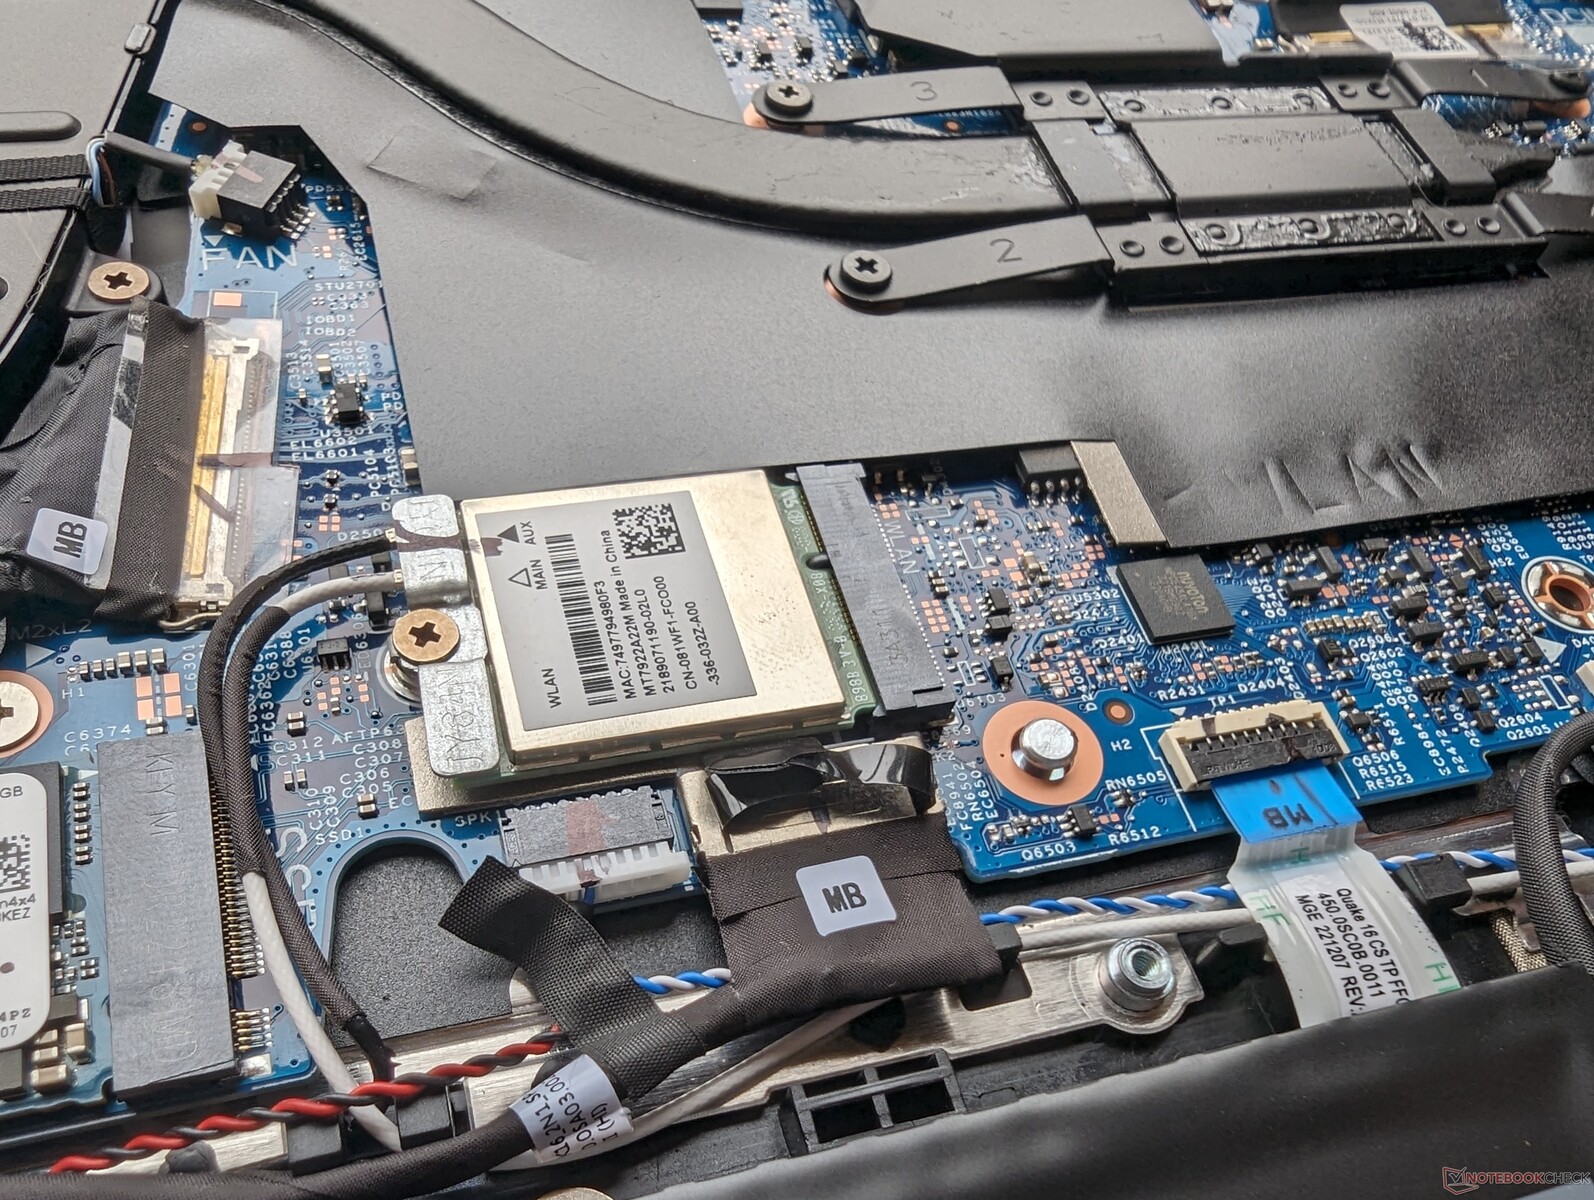
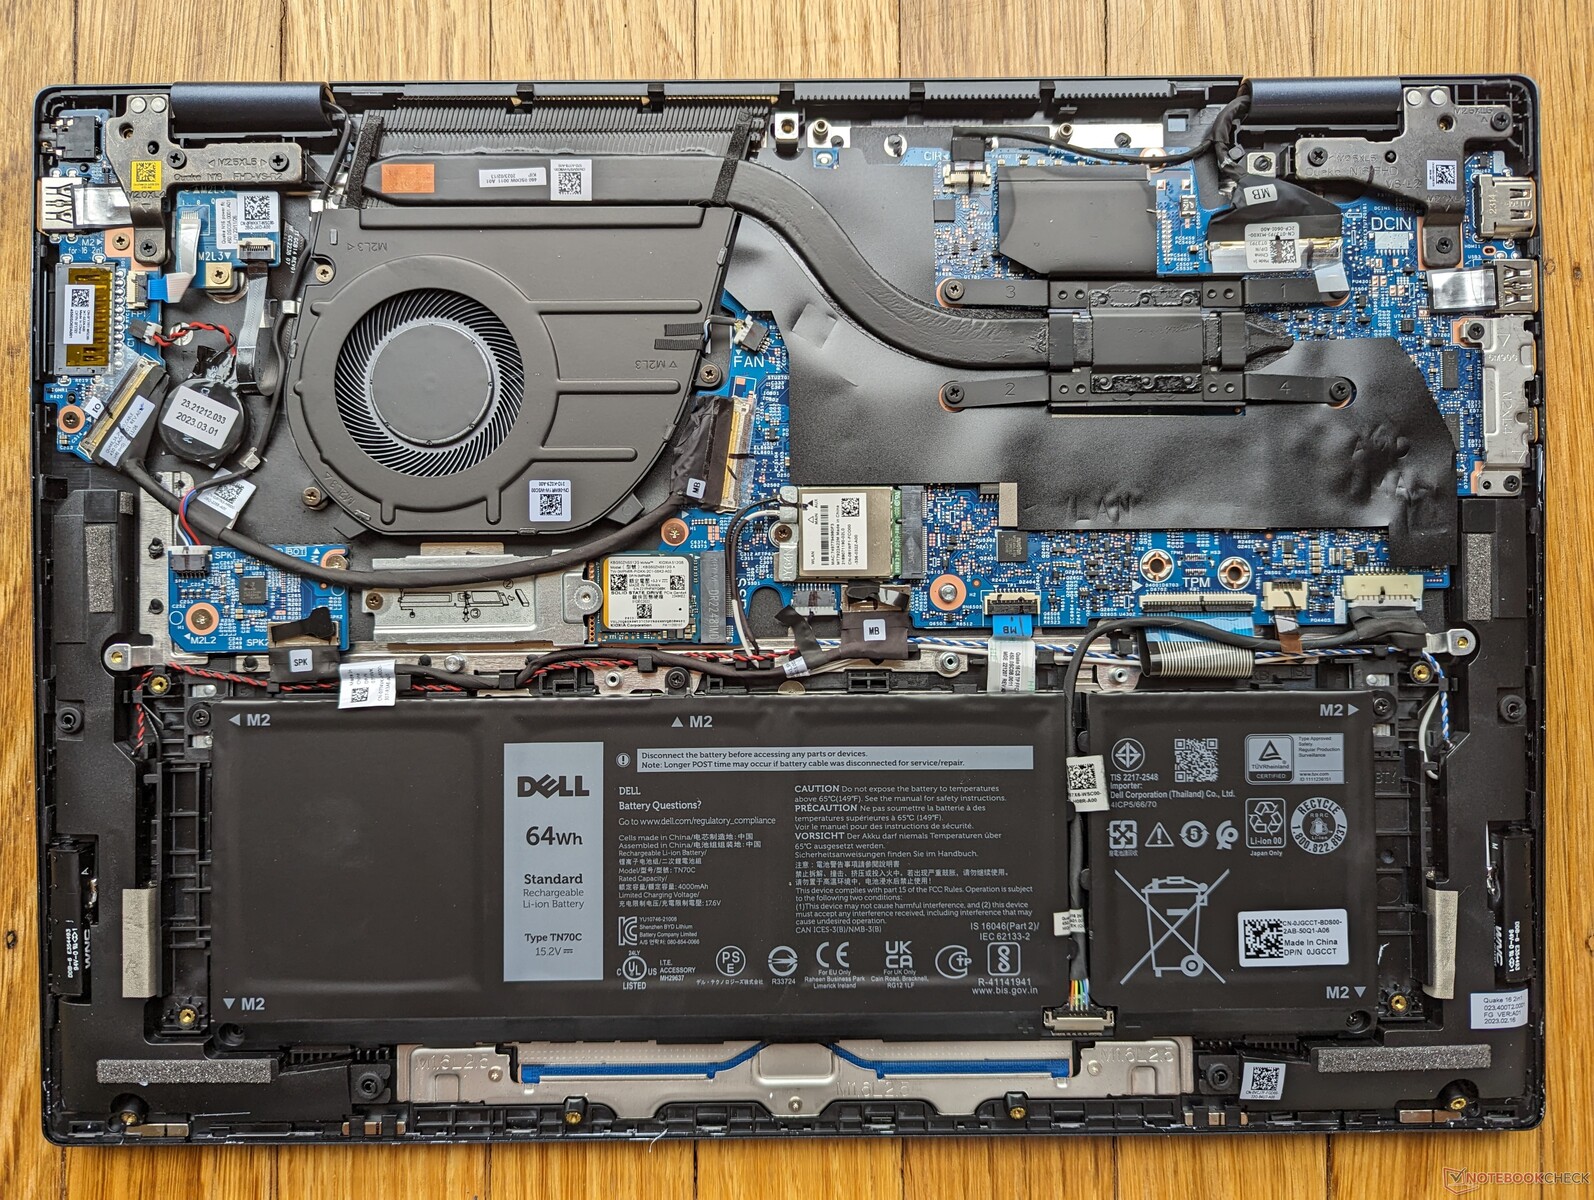
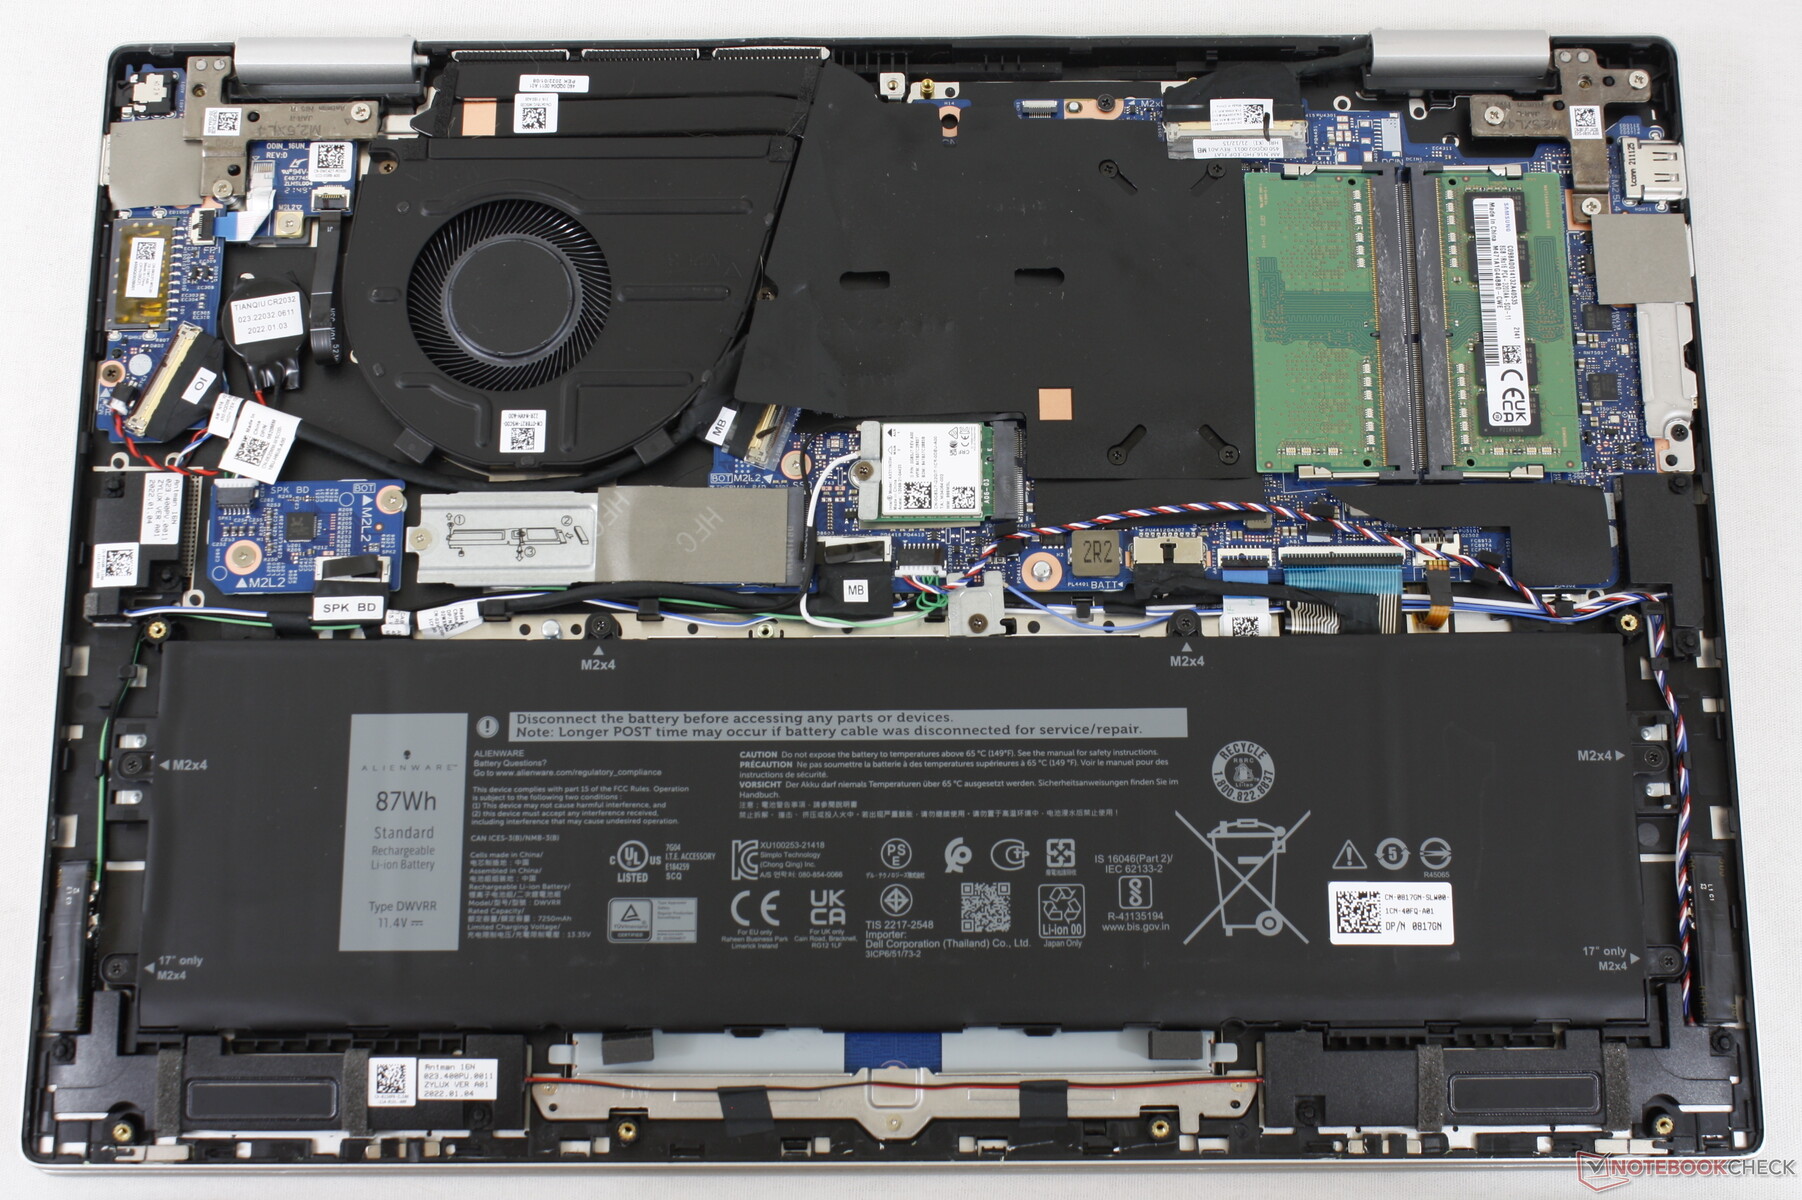
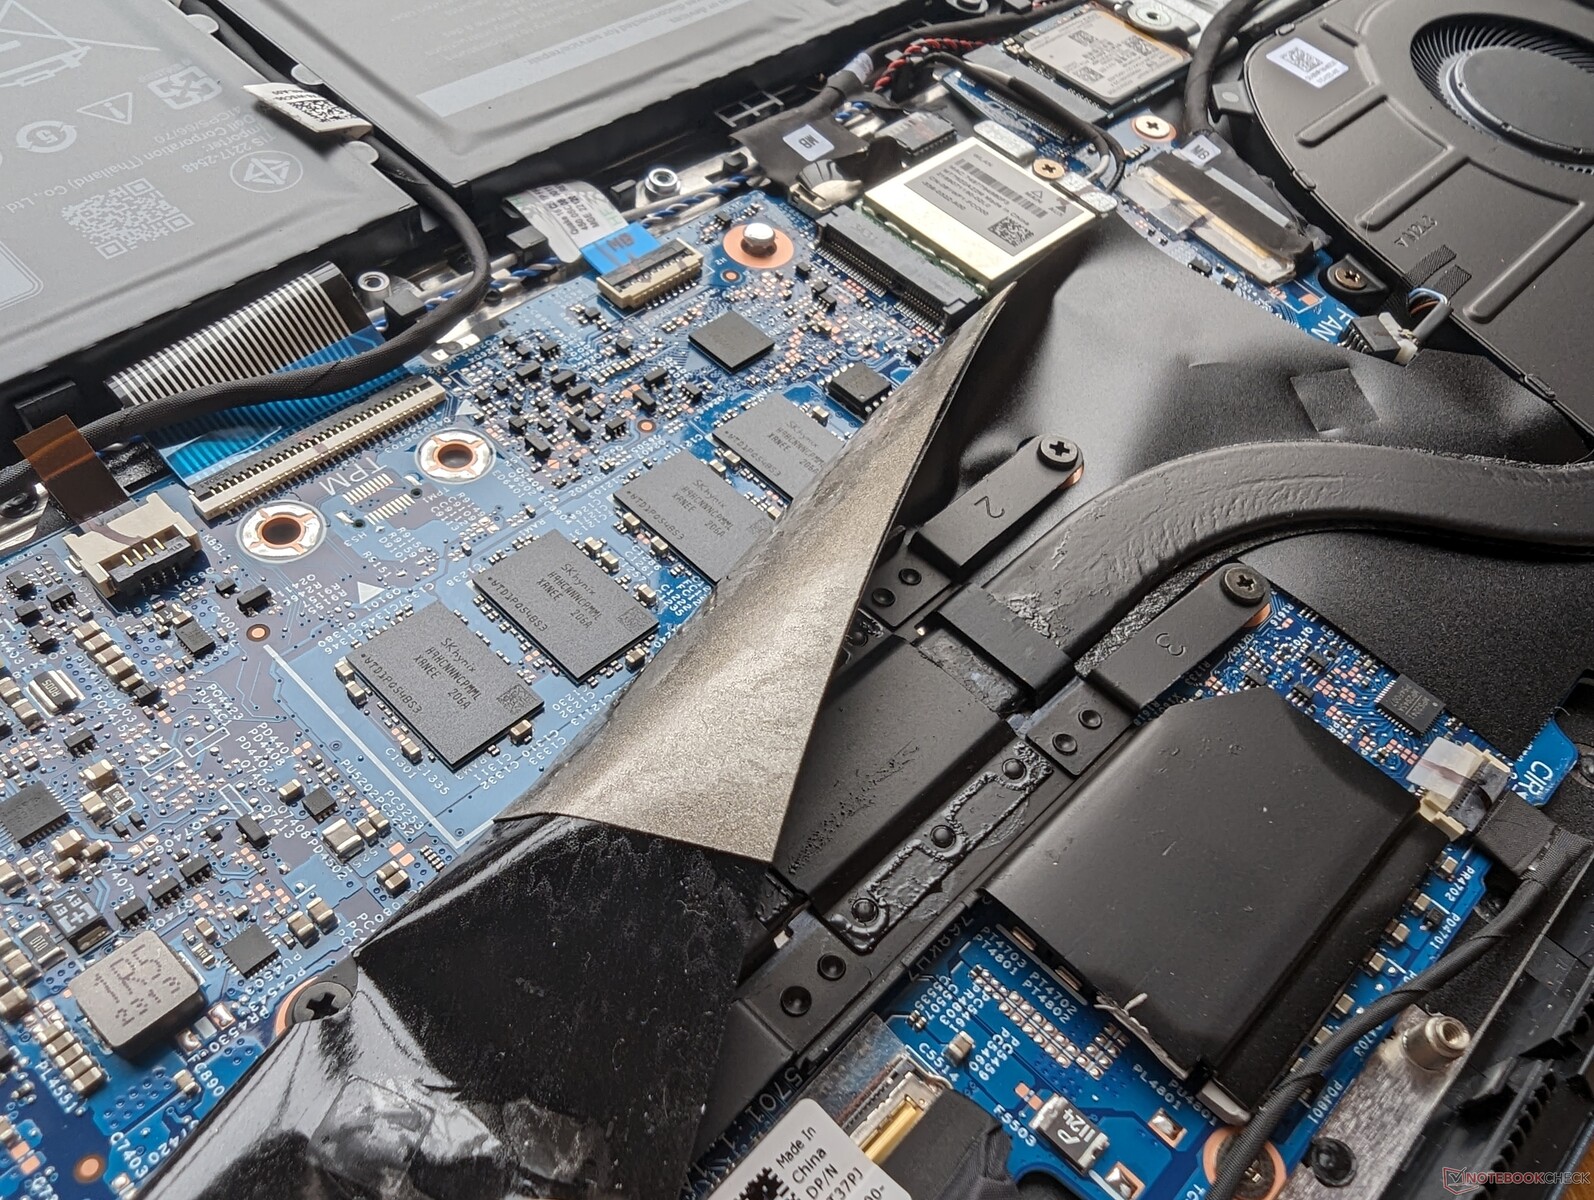
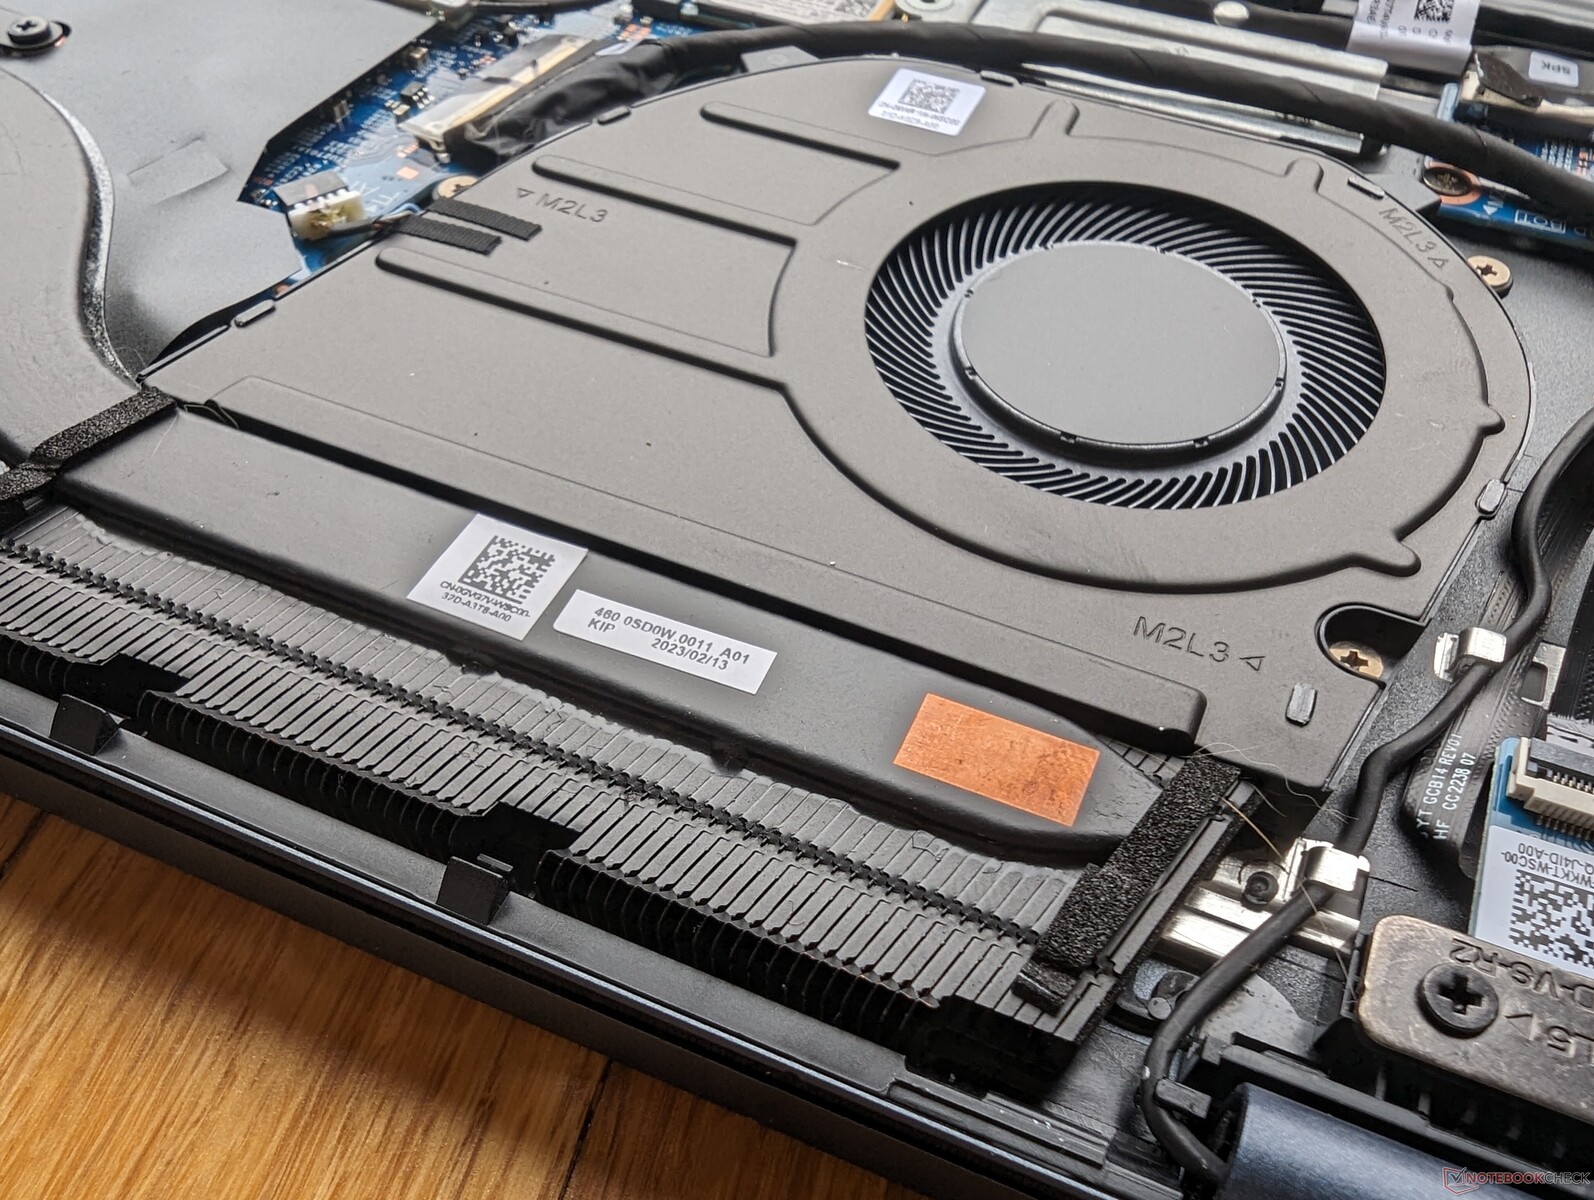
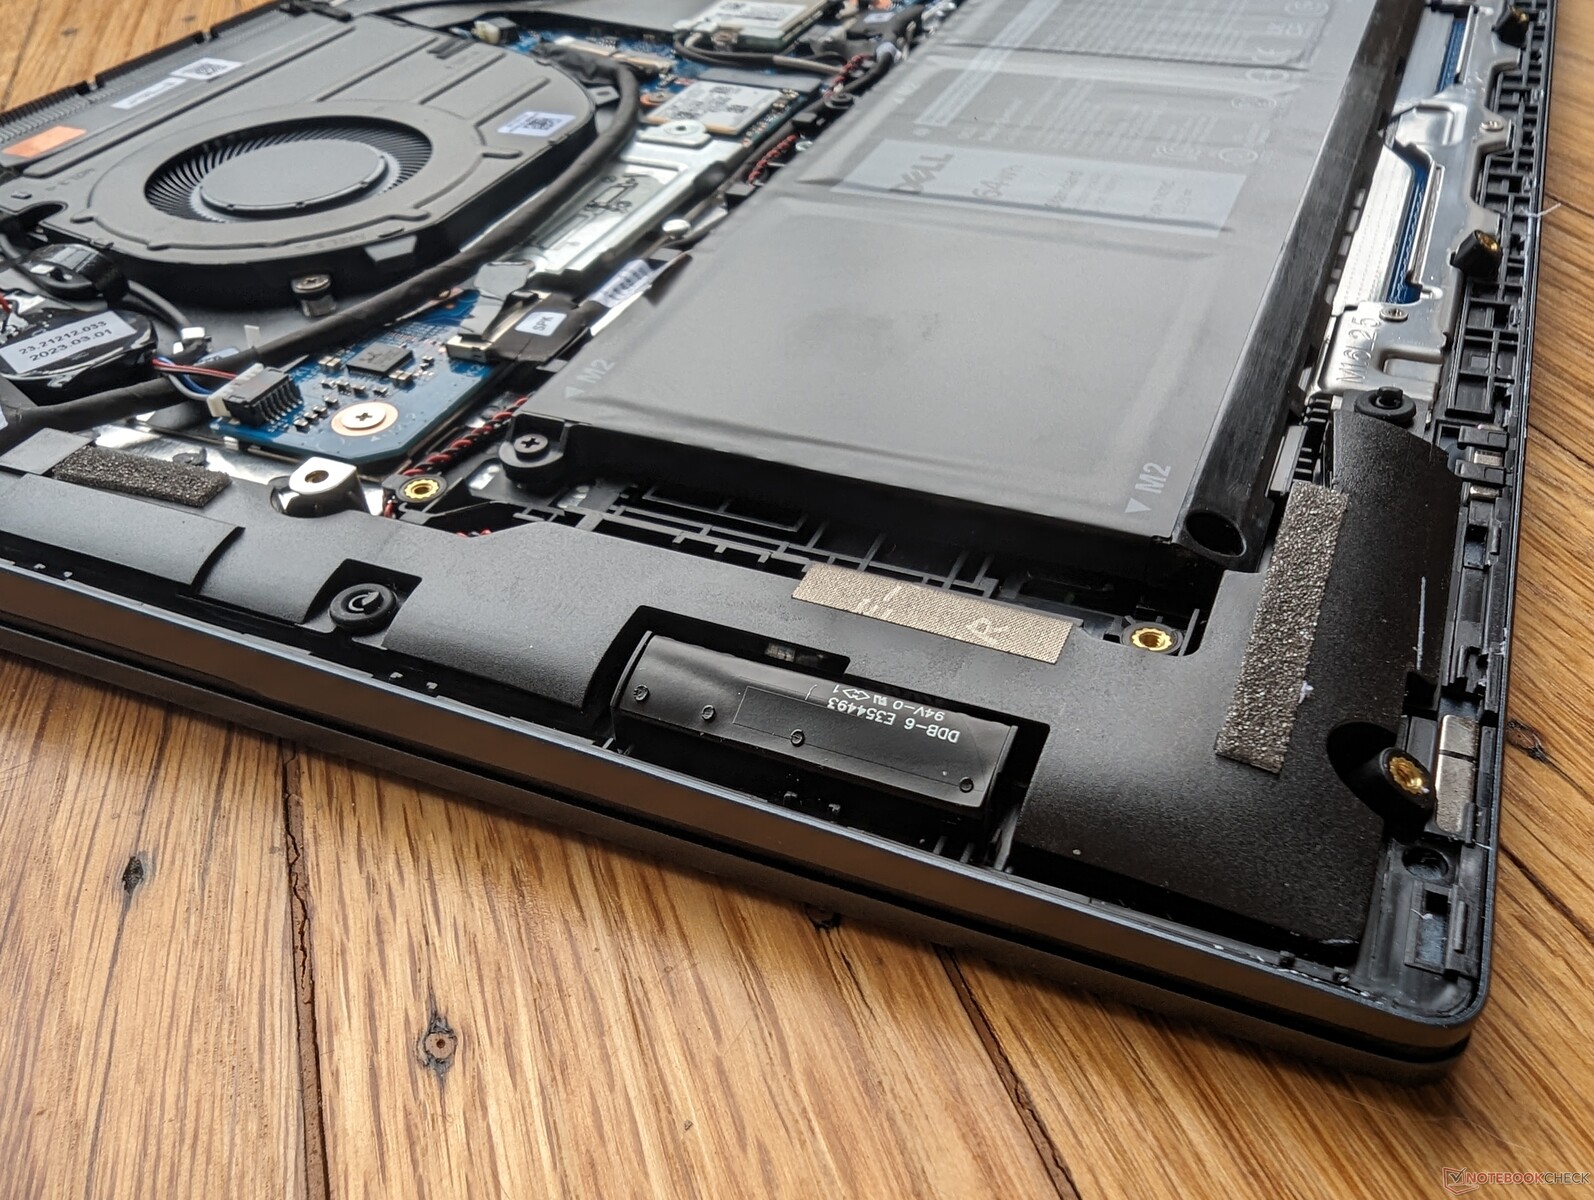
Onderhoud
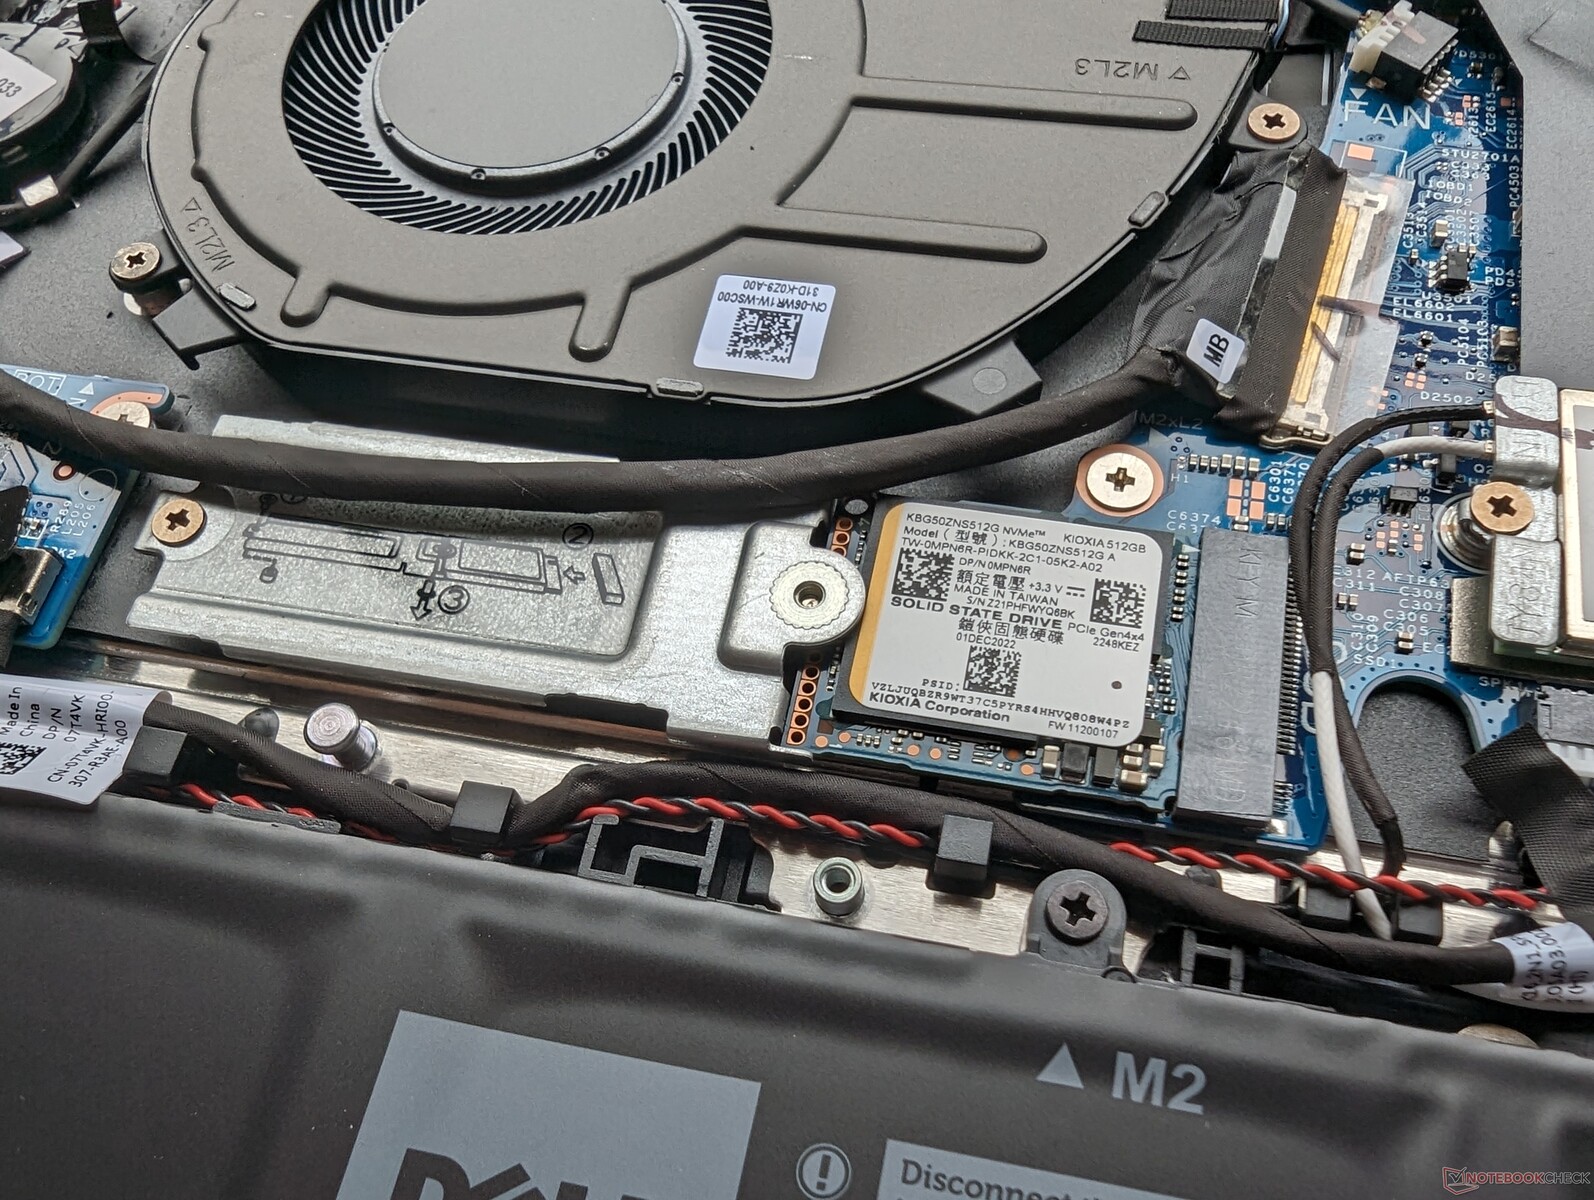
Het bodempaneel wordt vastgezet met negen kruiskopschroeven. Merk op dat de vergrendelingen rond de randen erg strak zitten en daarom raden we aan om een scherpe plastic rand te gebruiken om het paneel voorzichtig open te wrikken, beginnend vanaf de achterkant.
Het RAM-geheugen is nu gesoldeerd op het 2023 model, terwijl het op de 2022 versie door de gebruiker kon worden geüpgraded, zoals de afbeeldingen hieronder laten zien.
Accessoires en garantie
Er zitten geen extra's in de doos behalve de AC-adapter en papierwerk. Bij aankoop in de VS geldt de gebruikelijke beperkte fabrieksgarantie van een jaar.
Invoerapparaten
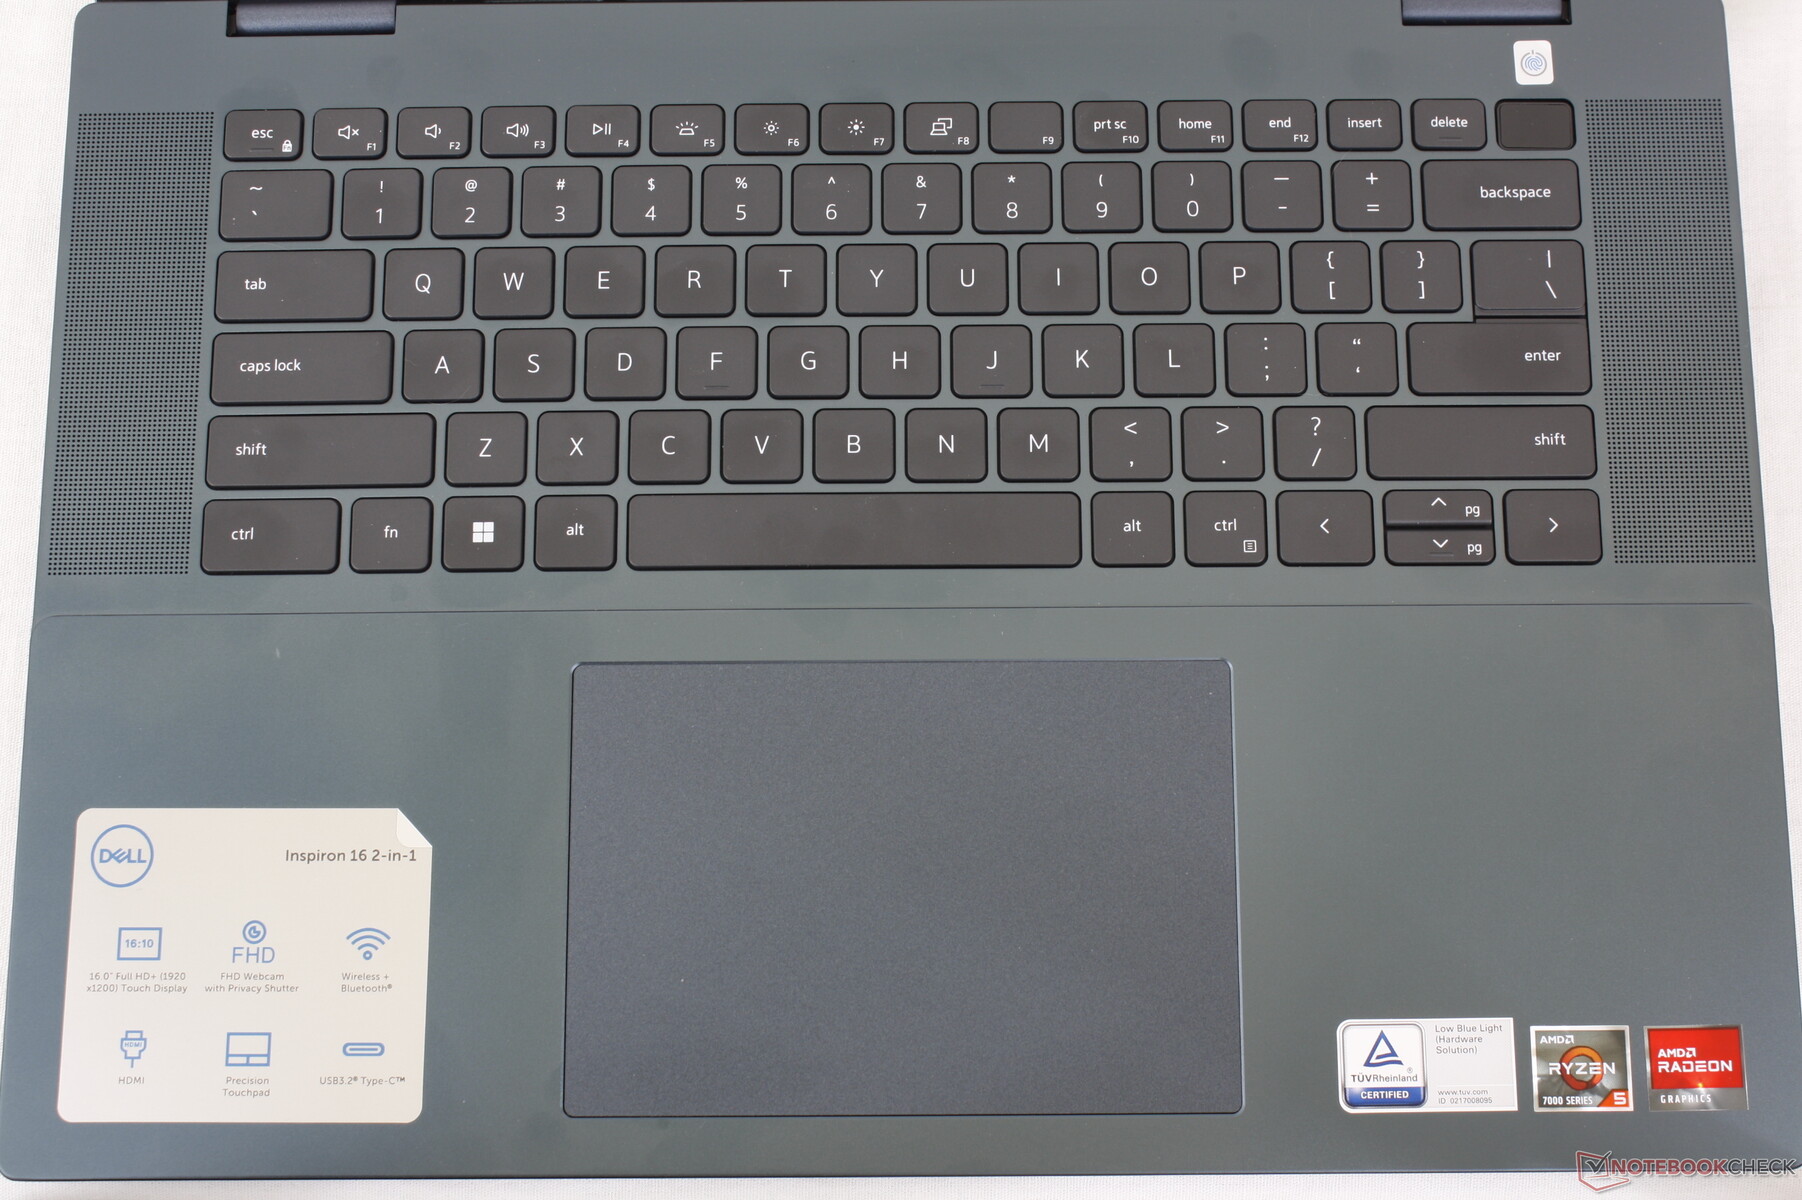
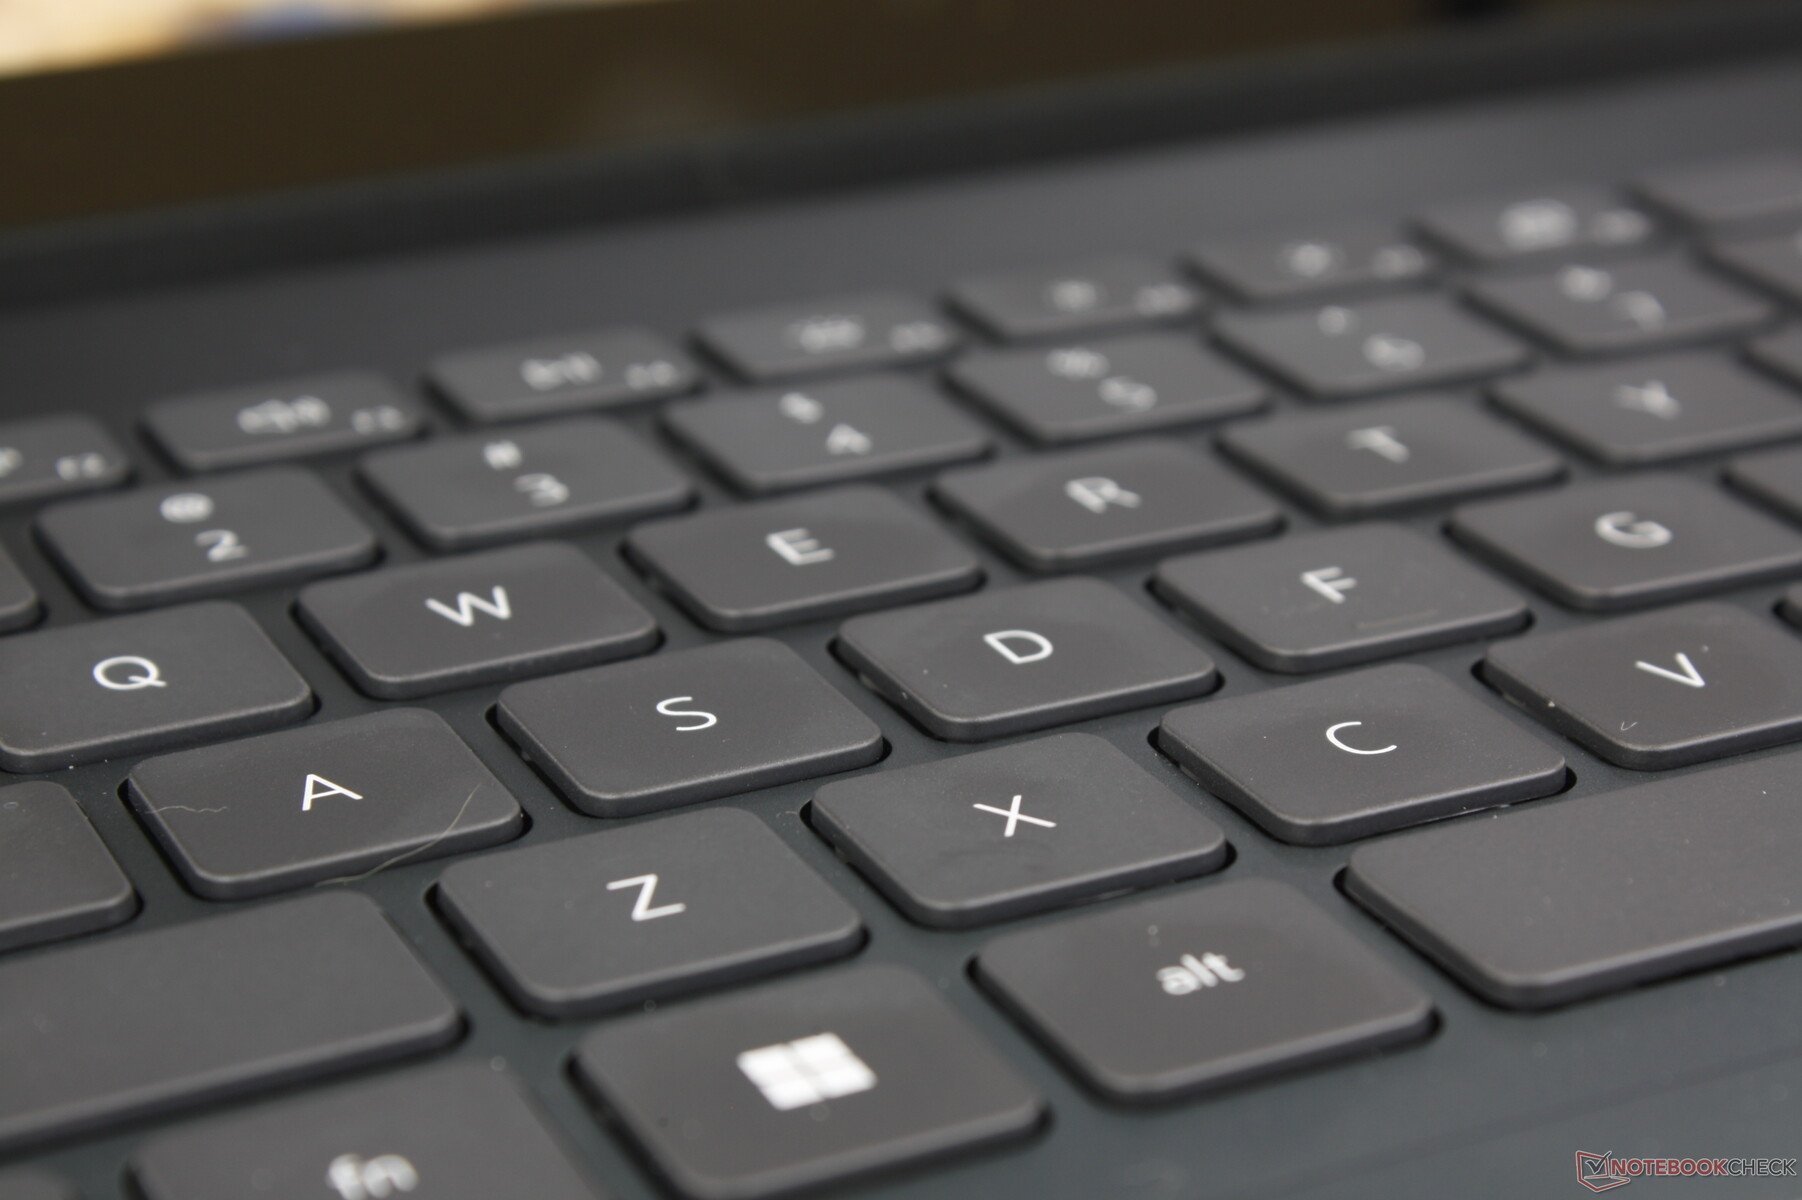
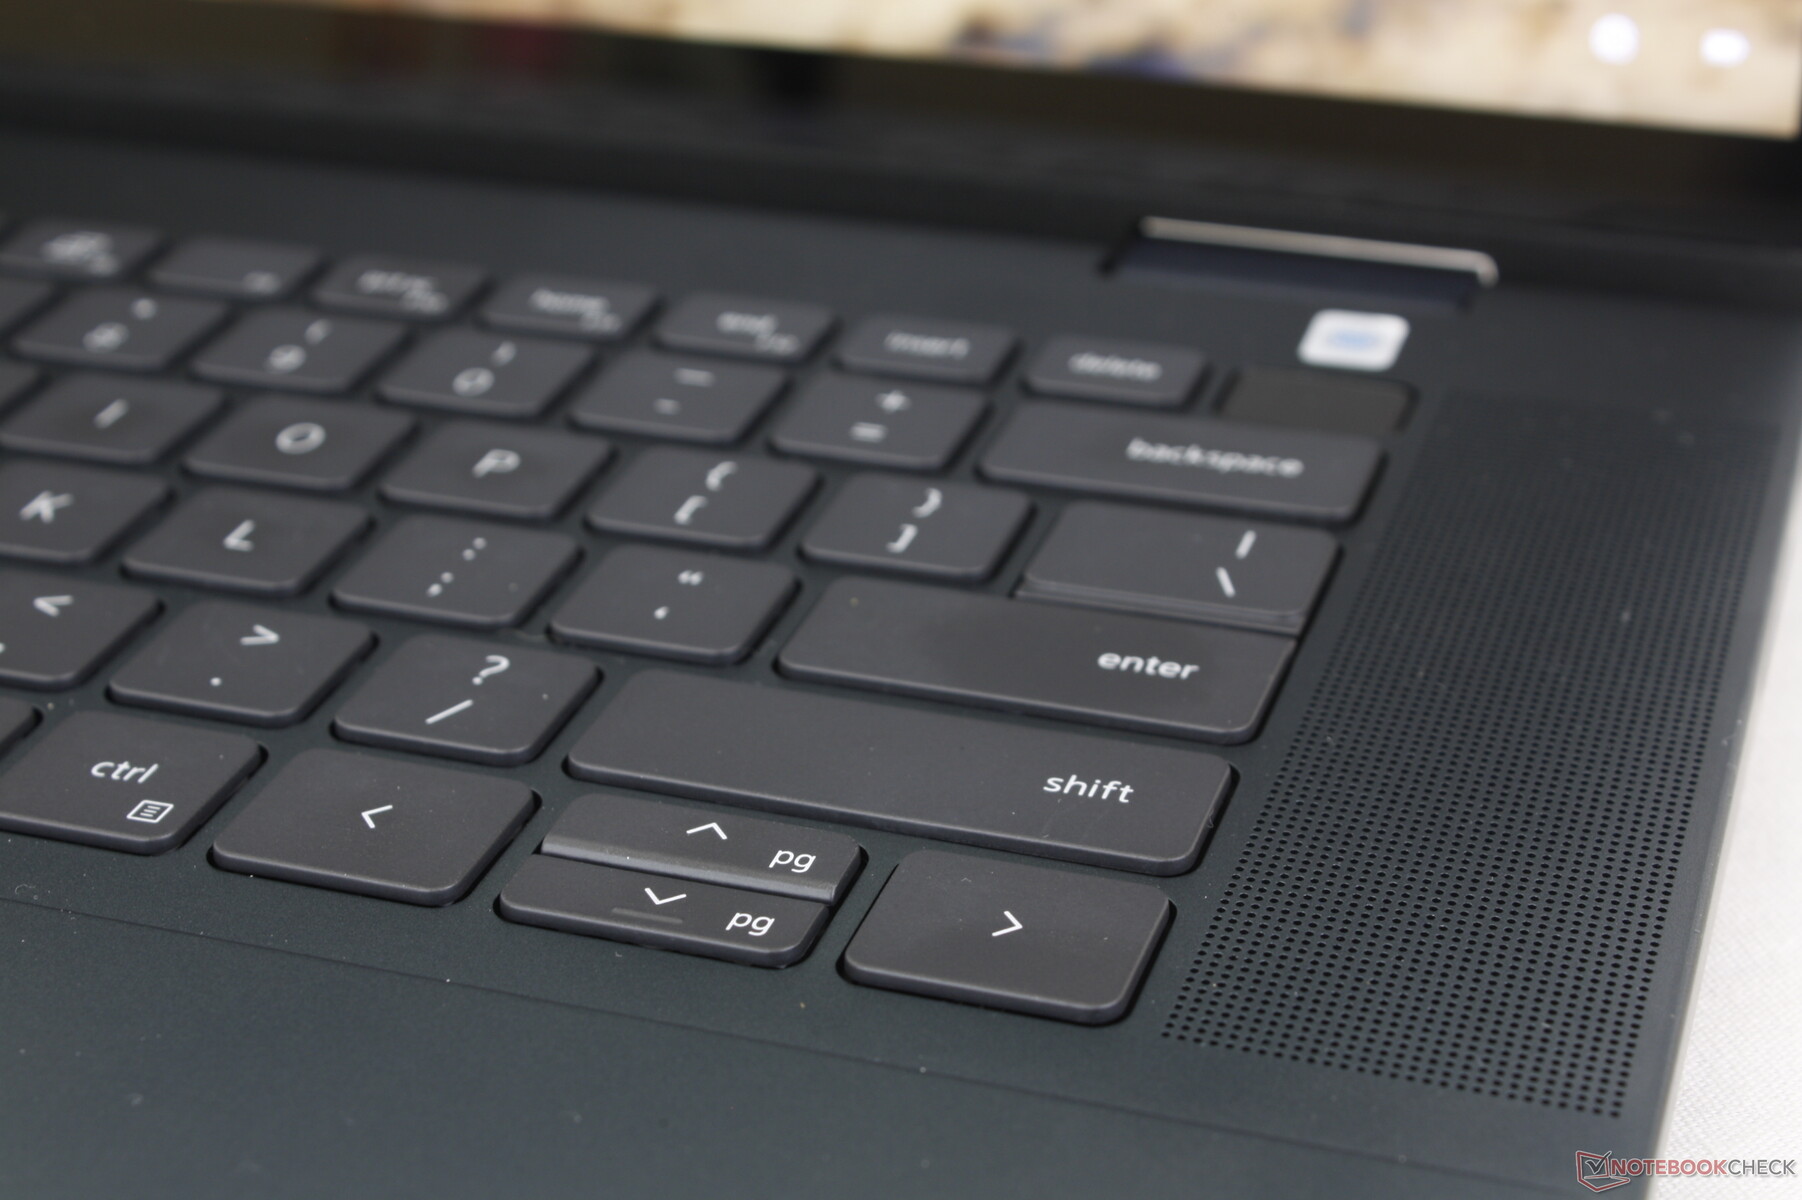
Toetsenbord
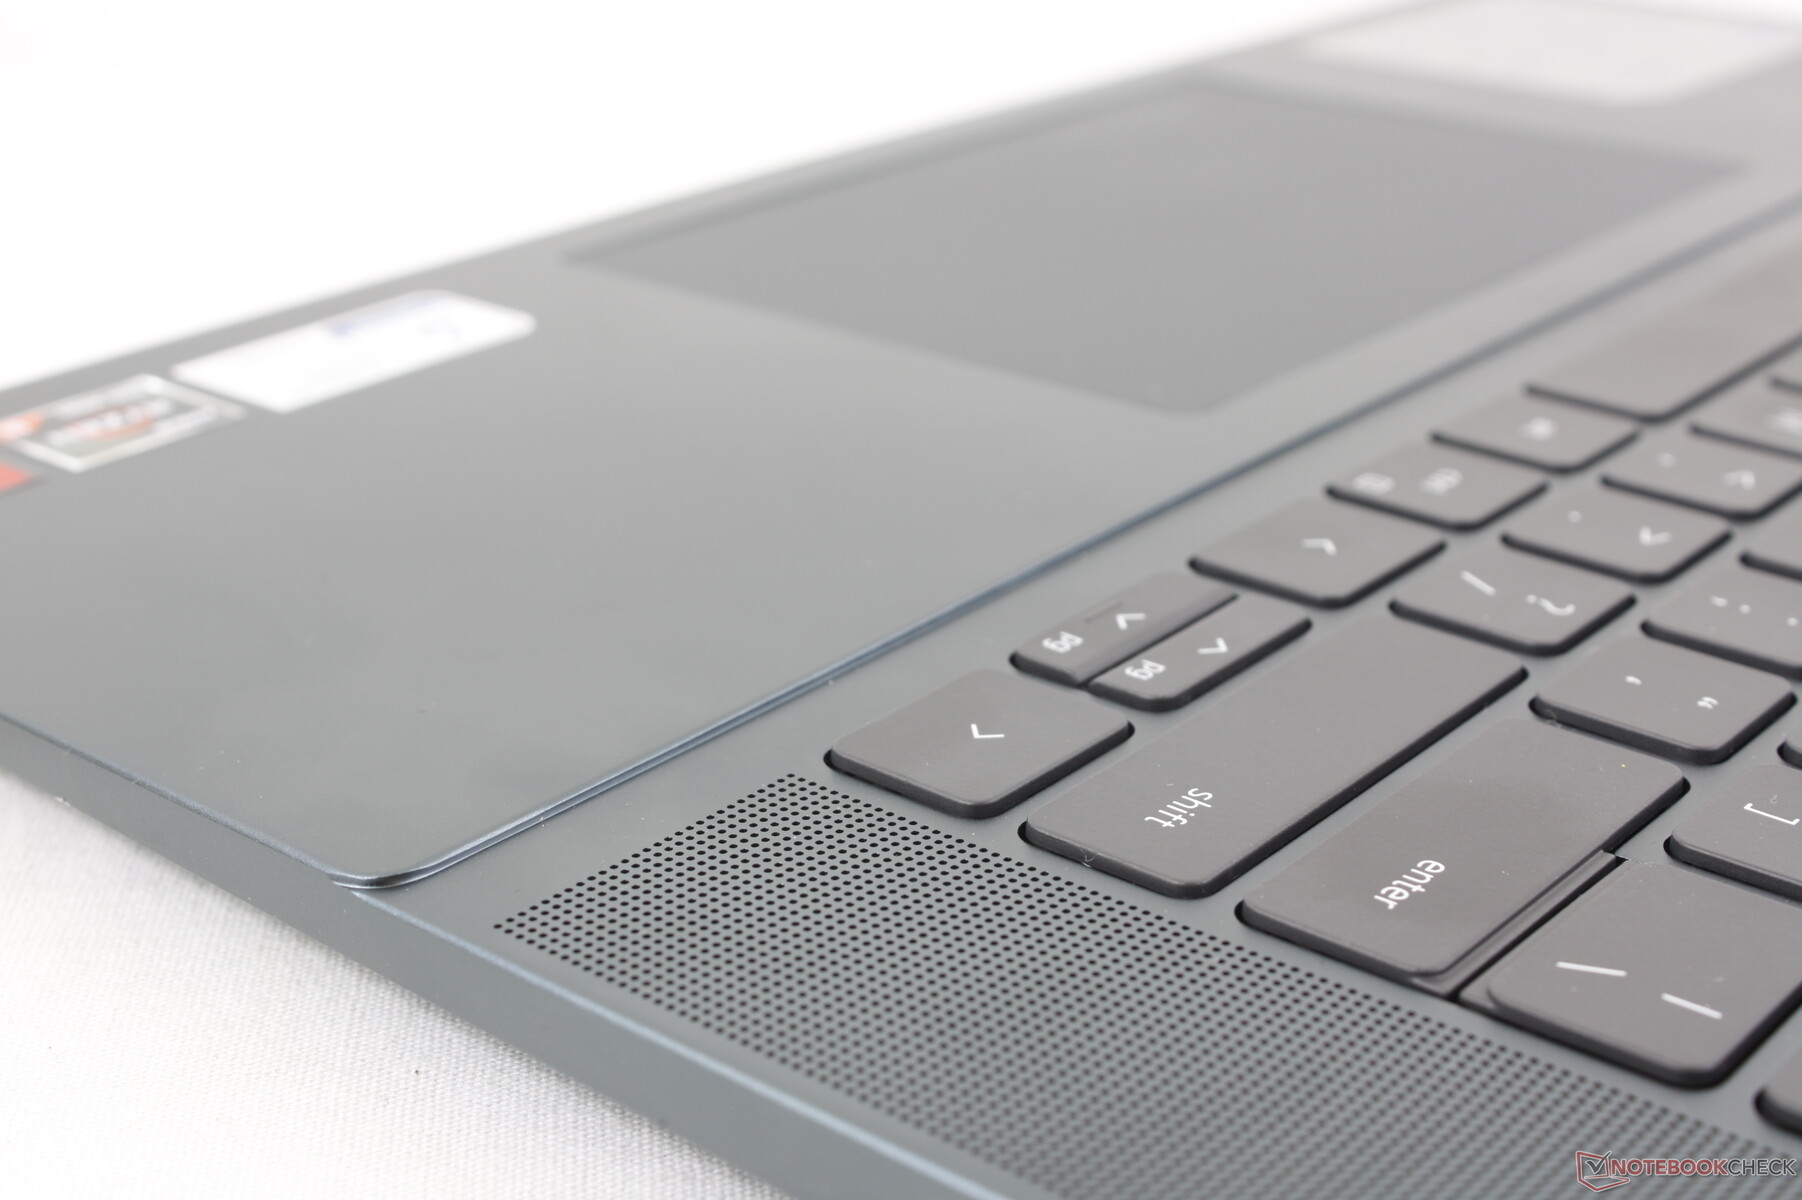
De type-ervaring is redelijk consistent voor alle Inspiron laptops en de QWERTY-toetsen blijven dus relatief zacht en hebben een kleine veerweg. Zelfs de 14-inch Inspiron 14 maakt gebruik van hetzelfde toetsenbord als op onze grotere 16-inch Inspiron 16; het enige verschil is dat de Inspiron 16 extra omhoog gerichte luidsprekers langs de zijkanten van het toetsenbord heeft. De toegevoegde luidsprekers in plaats van een numpad maken duidelijk dat de Inspiron 16 7635 2-in-1 in de eerste plaats een multimedia PC is.
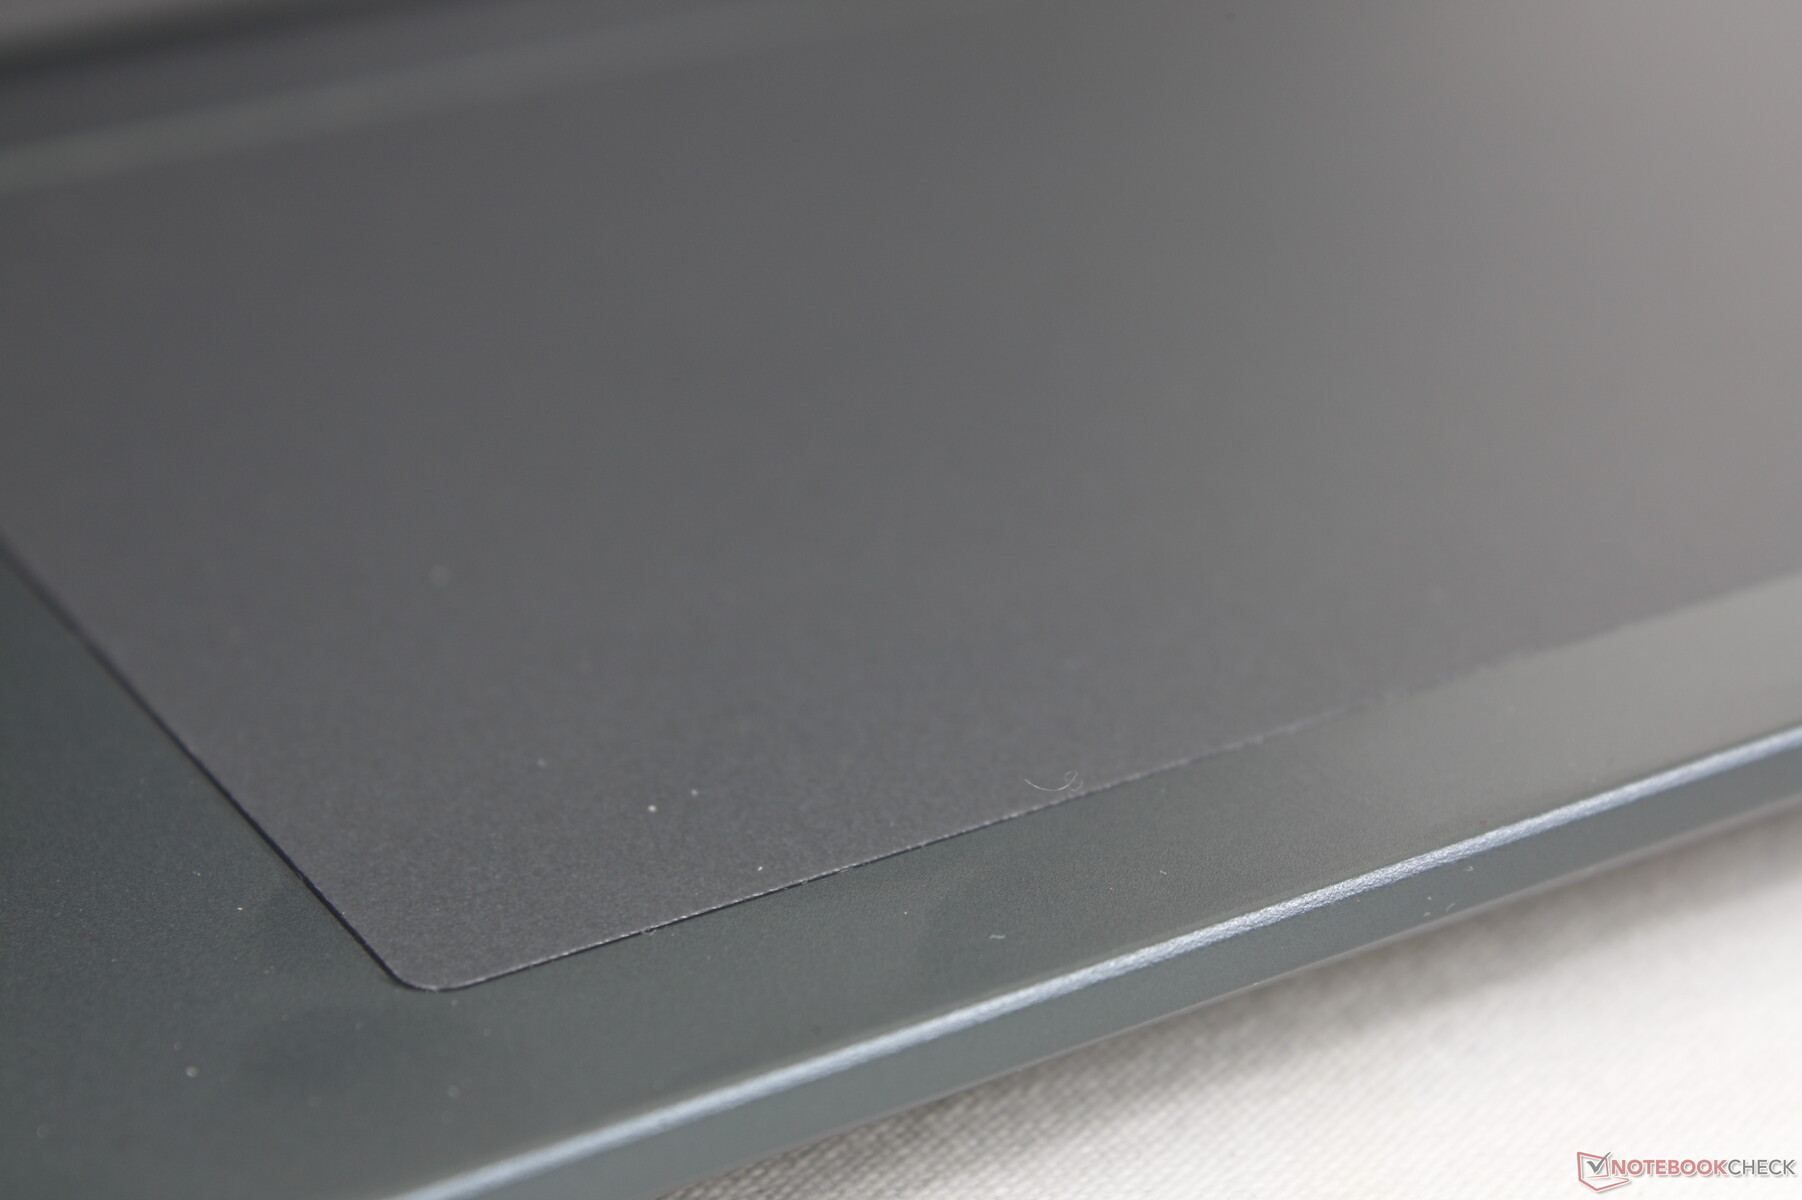
Touchpad
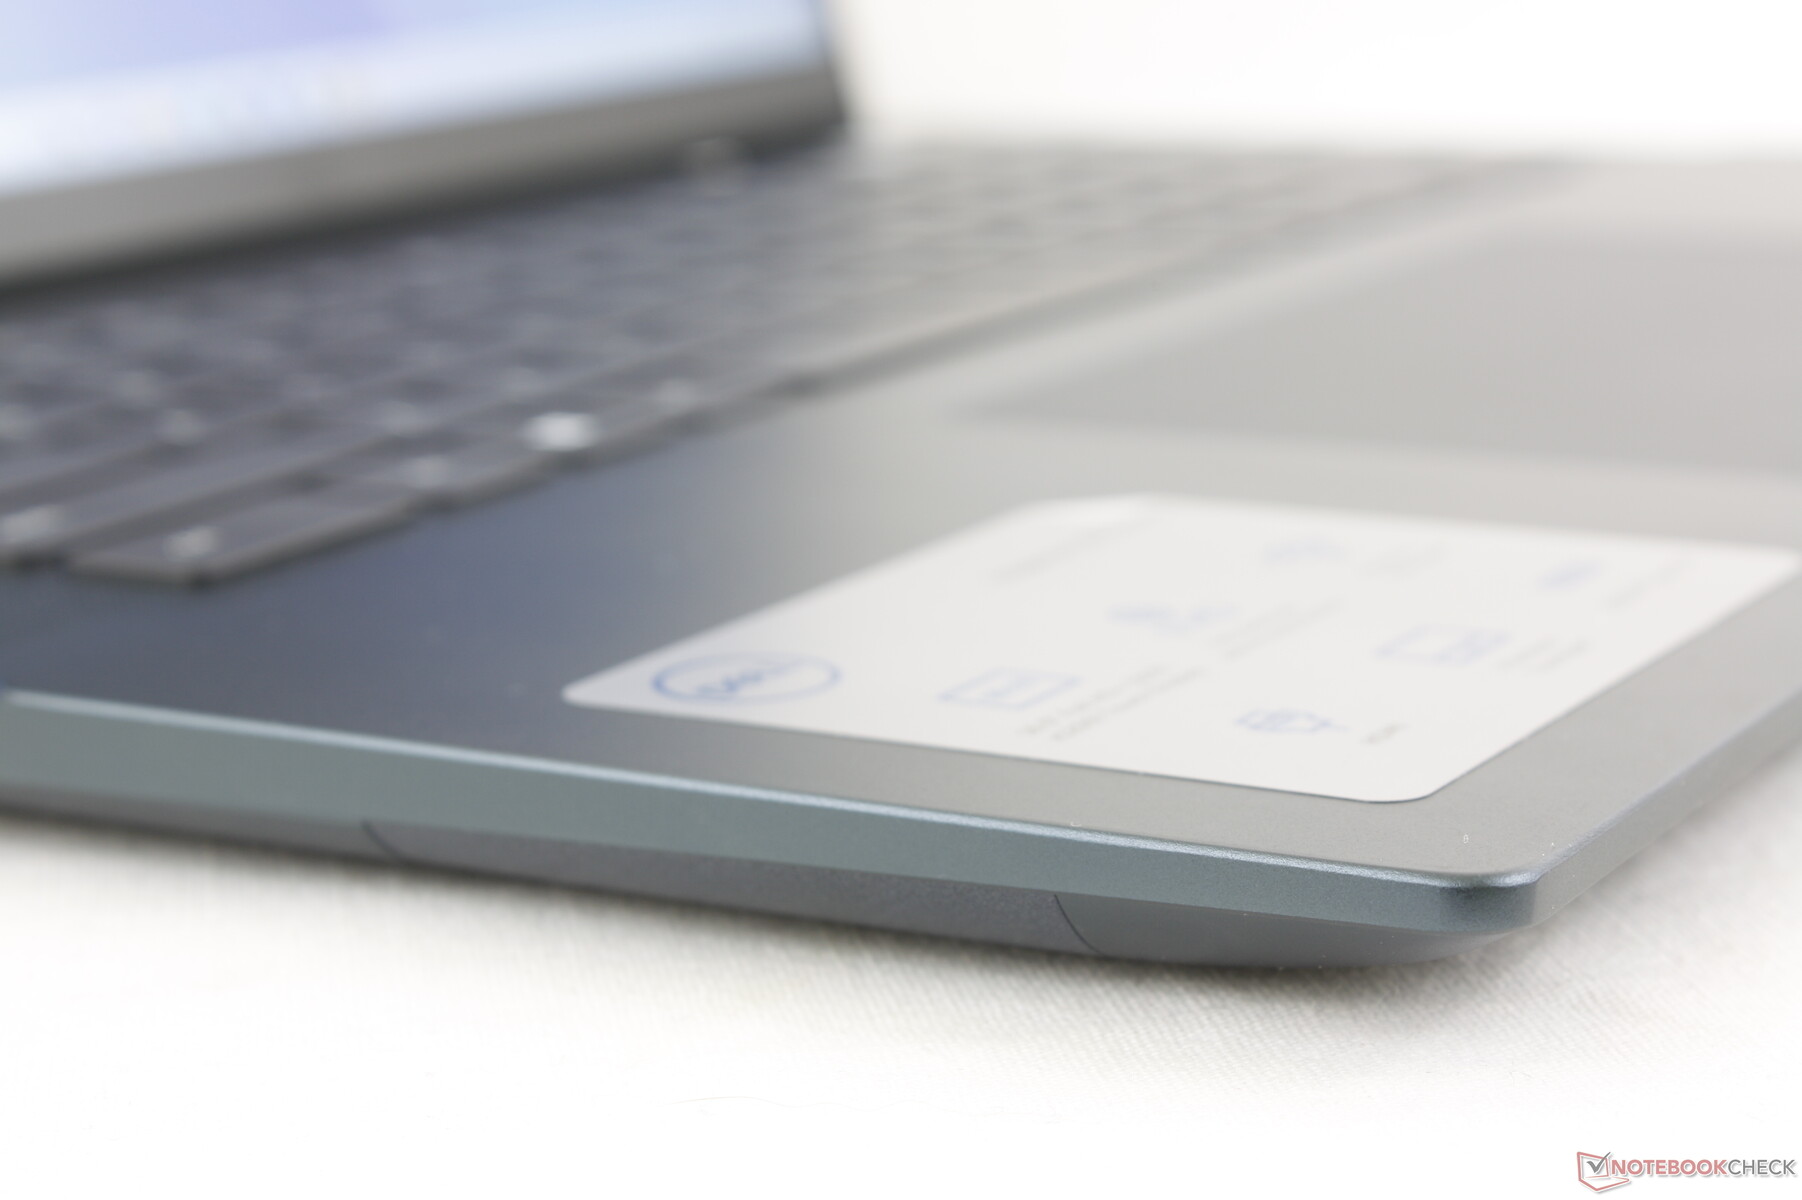
De grootte van het clickpad (13,3 x 9 cm) is ongewijzigd ten opzichte van het model van vorig jaar, hoewel het visuele ontwerp van het clickpad is teruggekeerd naar een meer traditionele uitstraling. Helaas is de feedback bij het klikken op het oppervlak niet verbeterd en blijft het zacht en oppervlakkig in vergelijking met het stevigere clickpad op de HP Spectre clickpad.
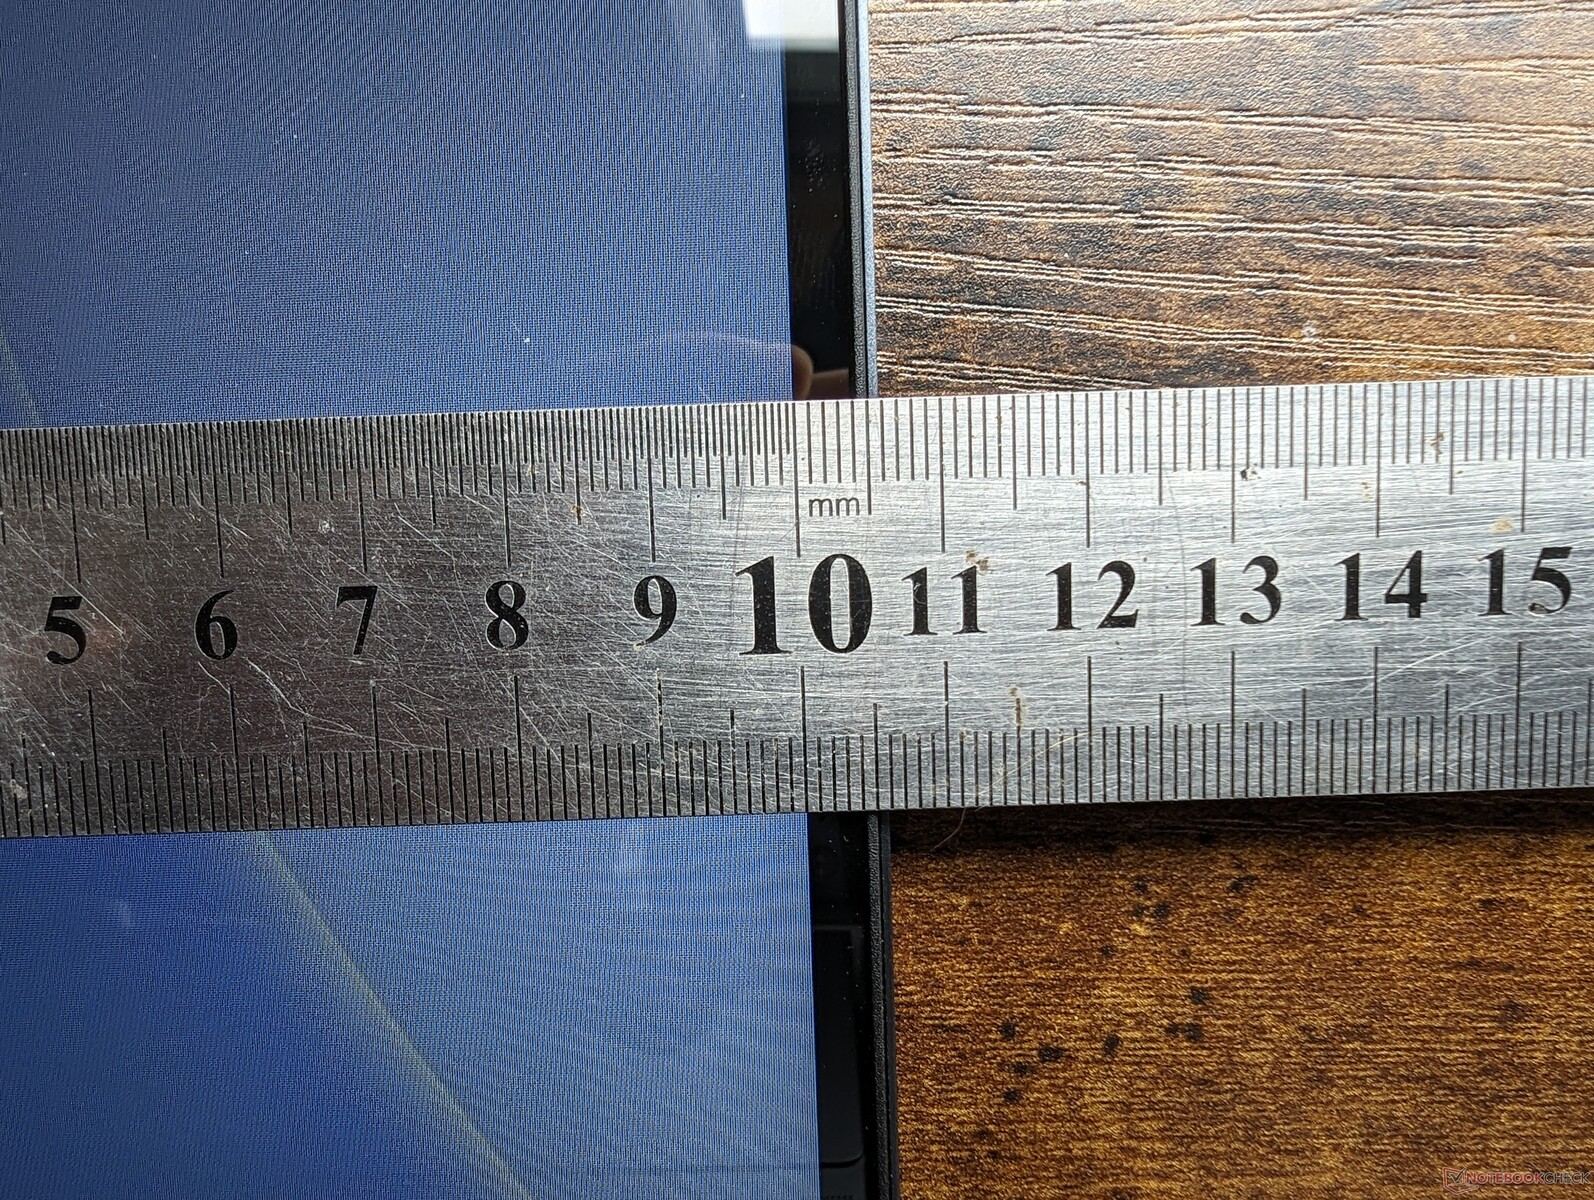
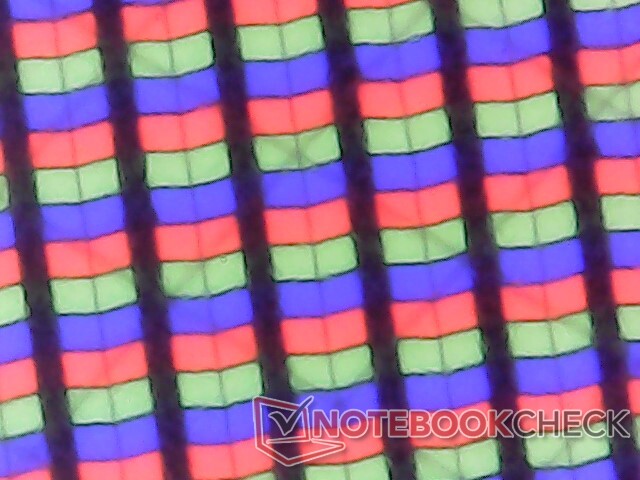
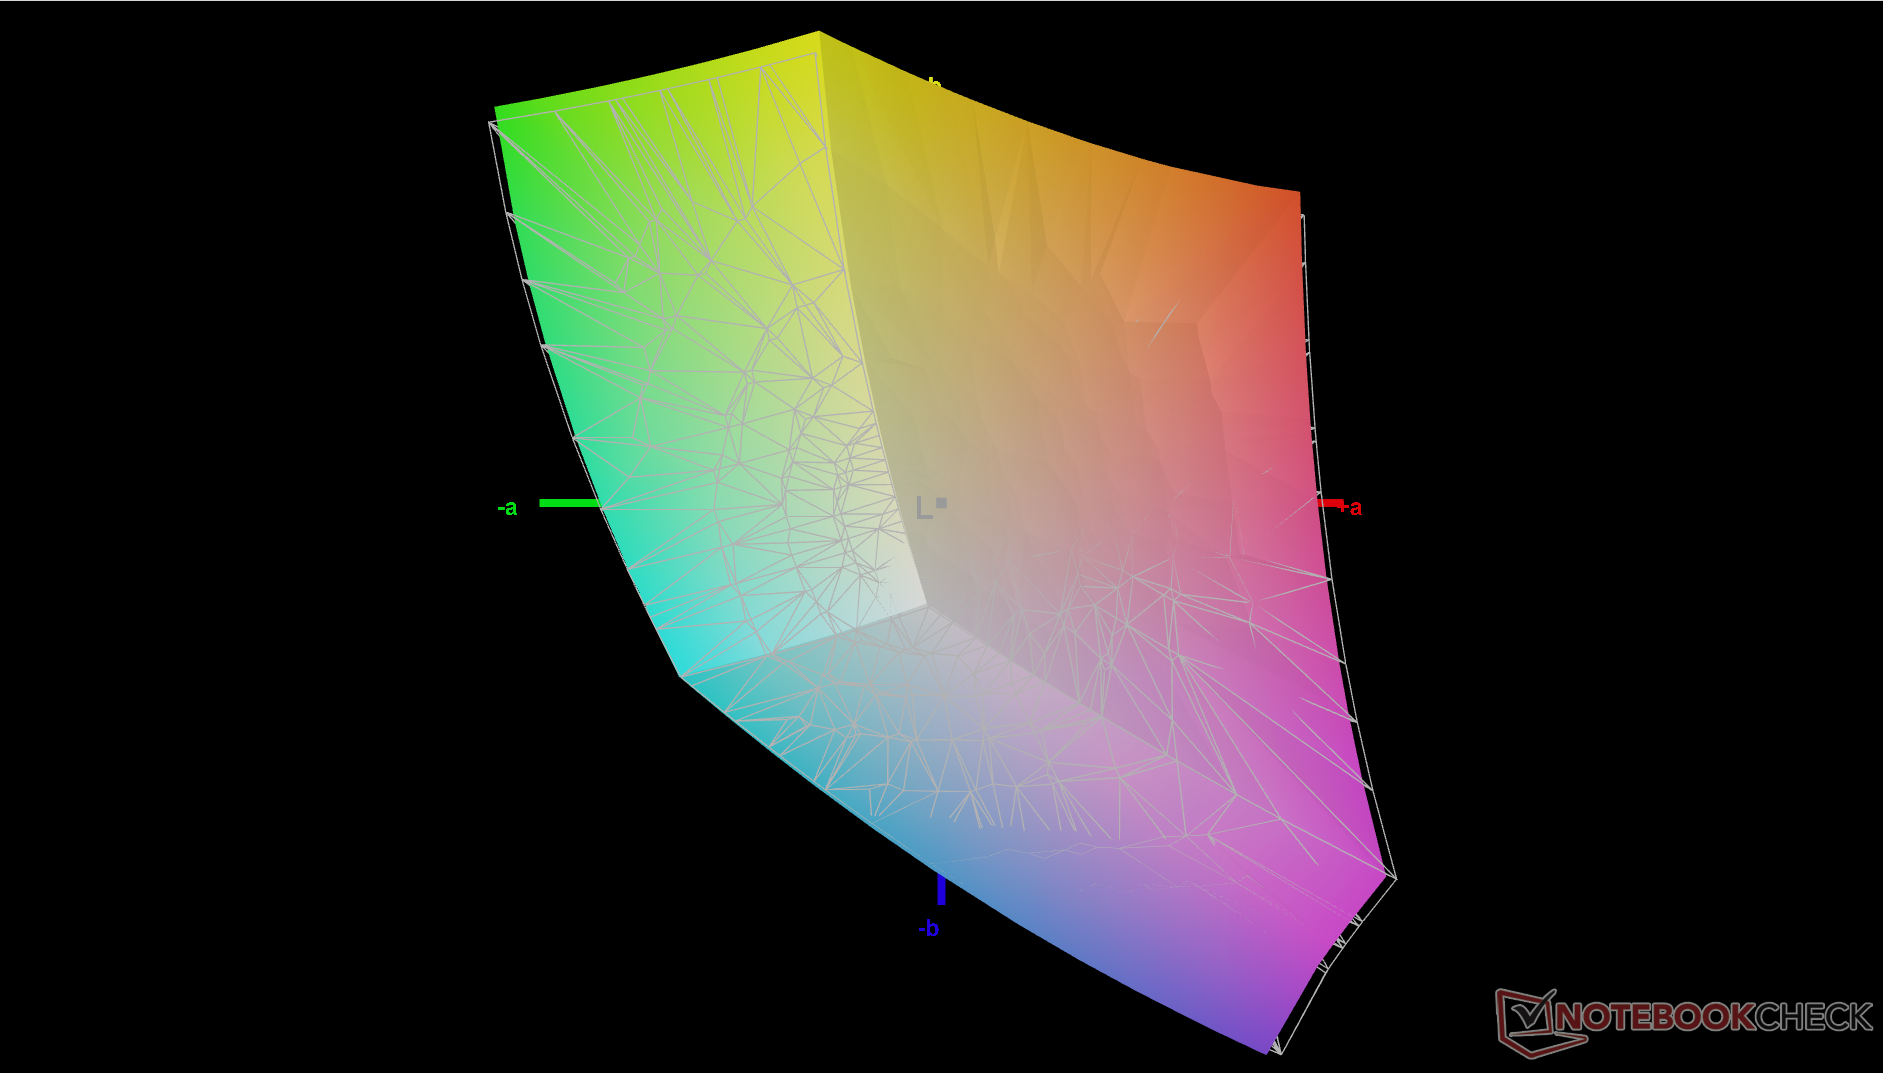
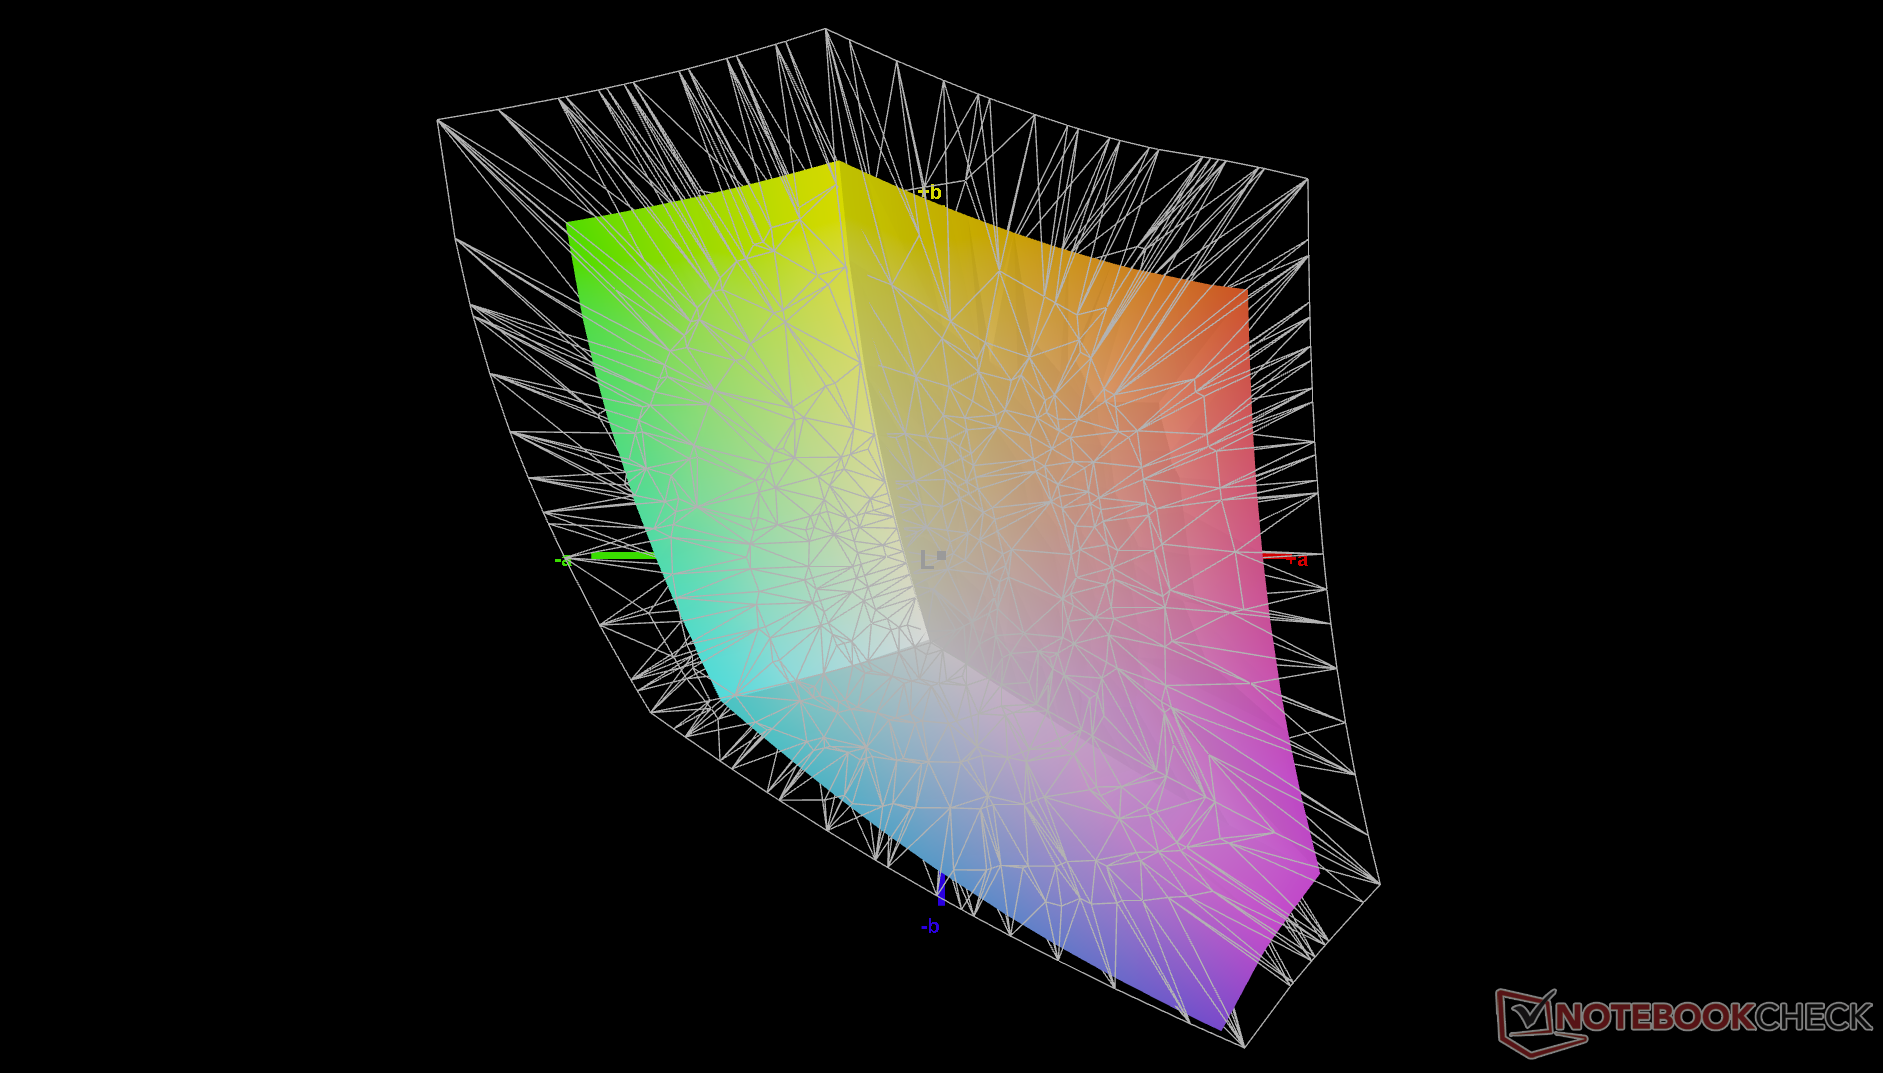
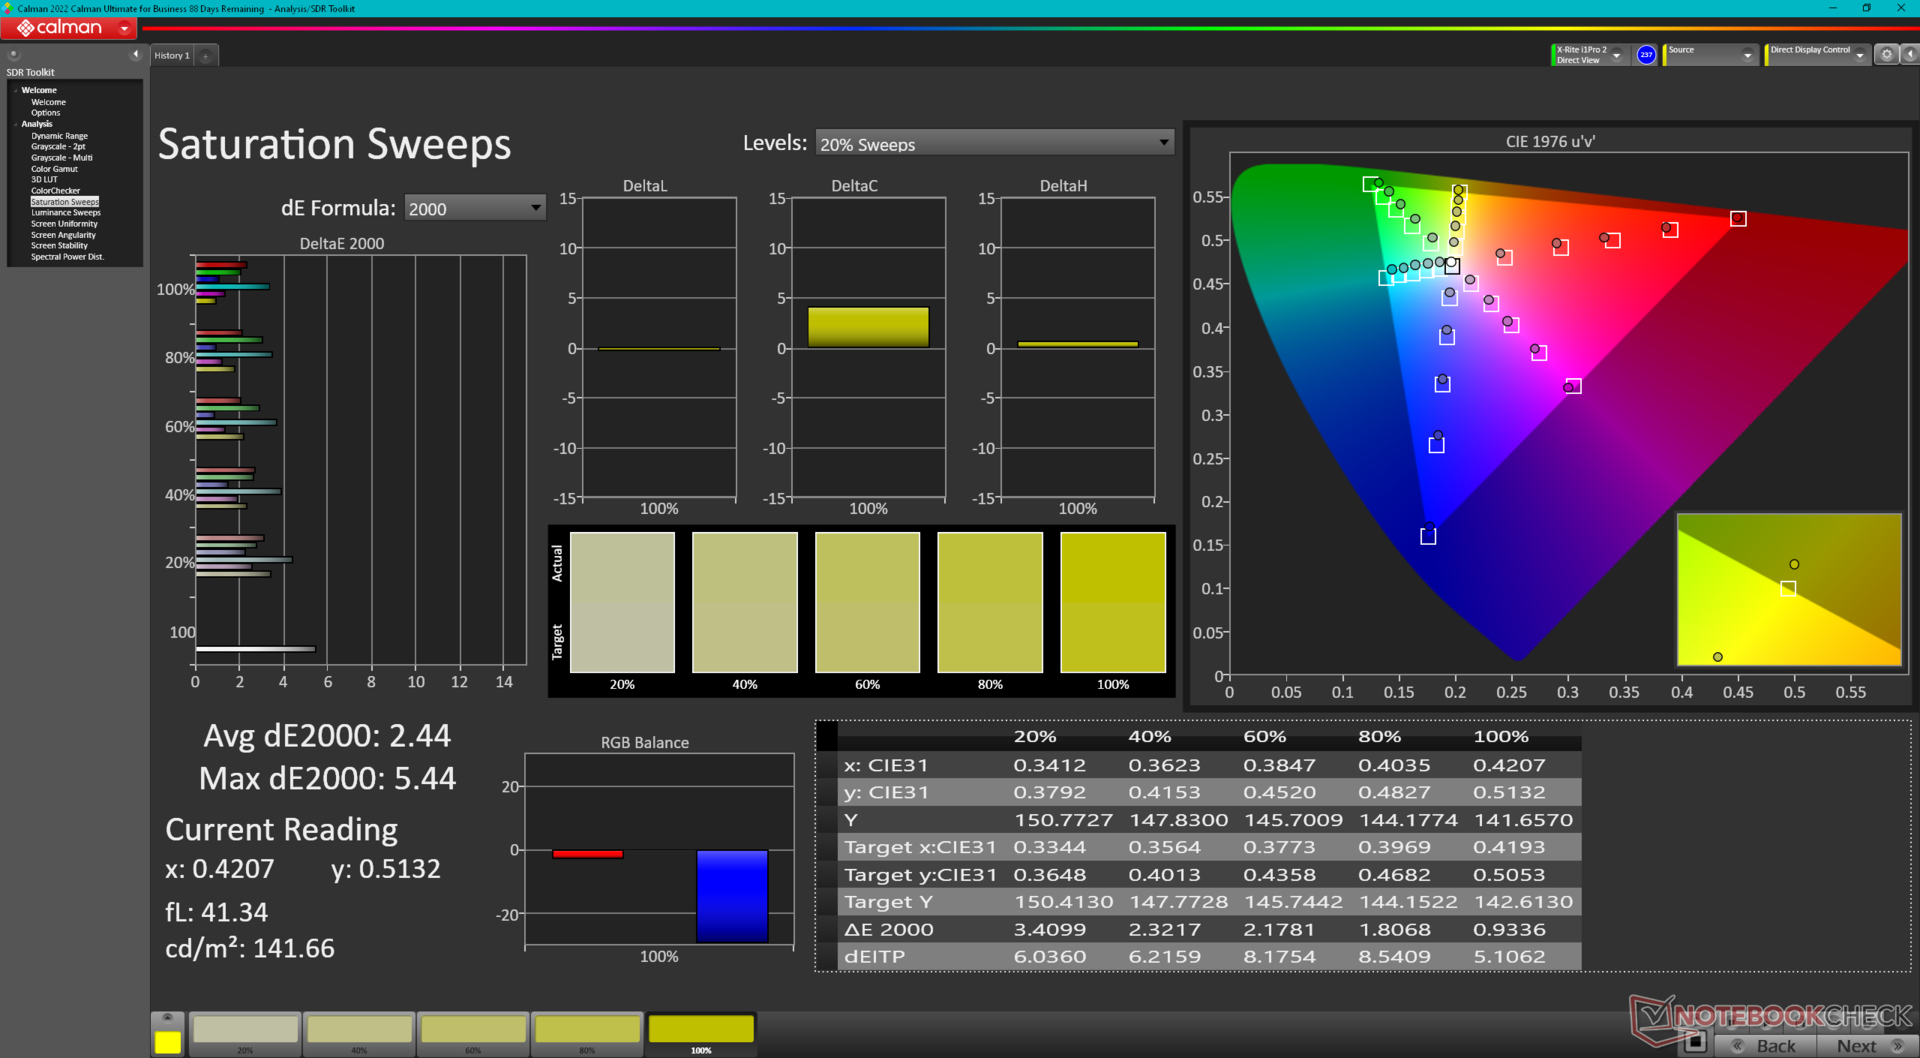
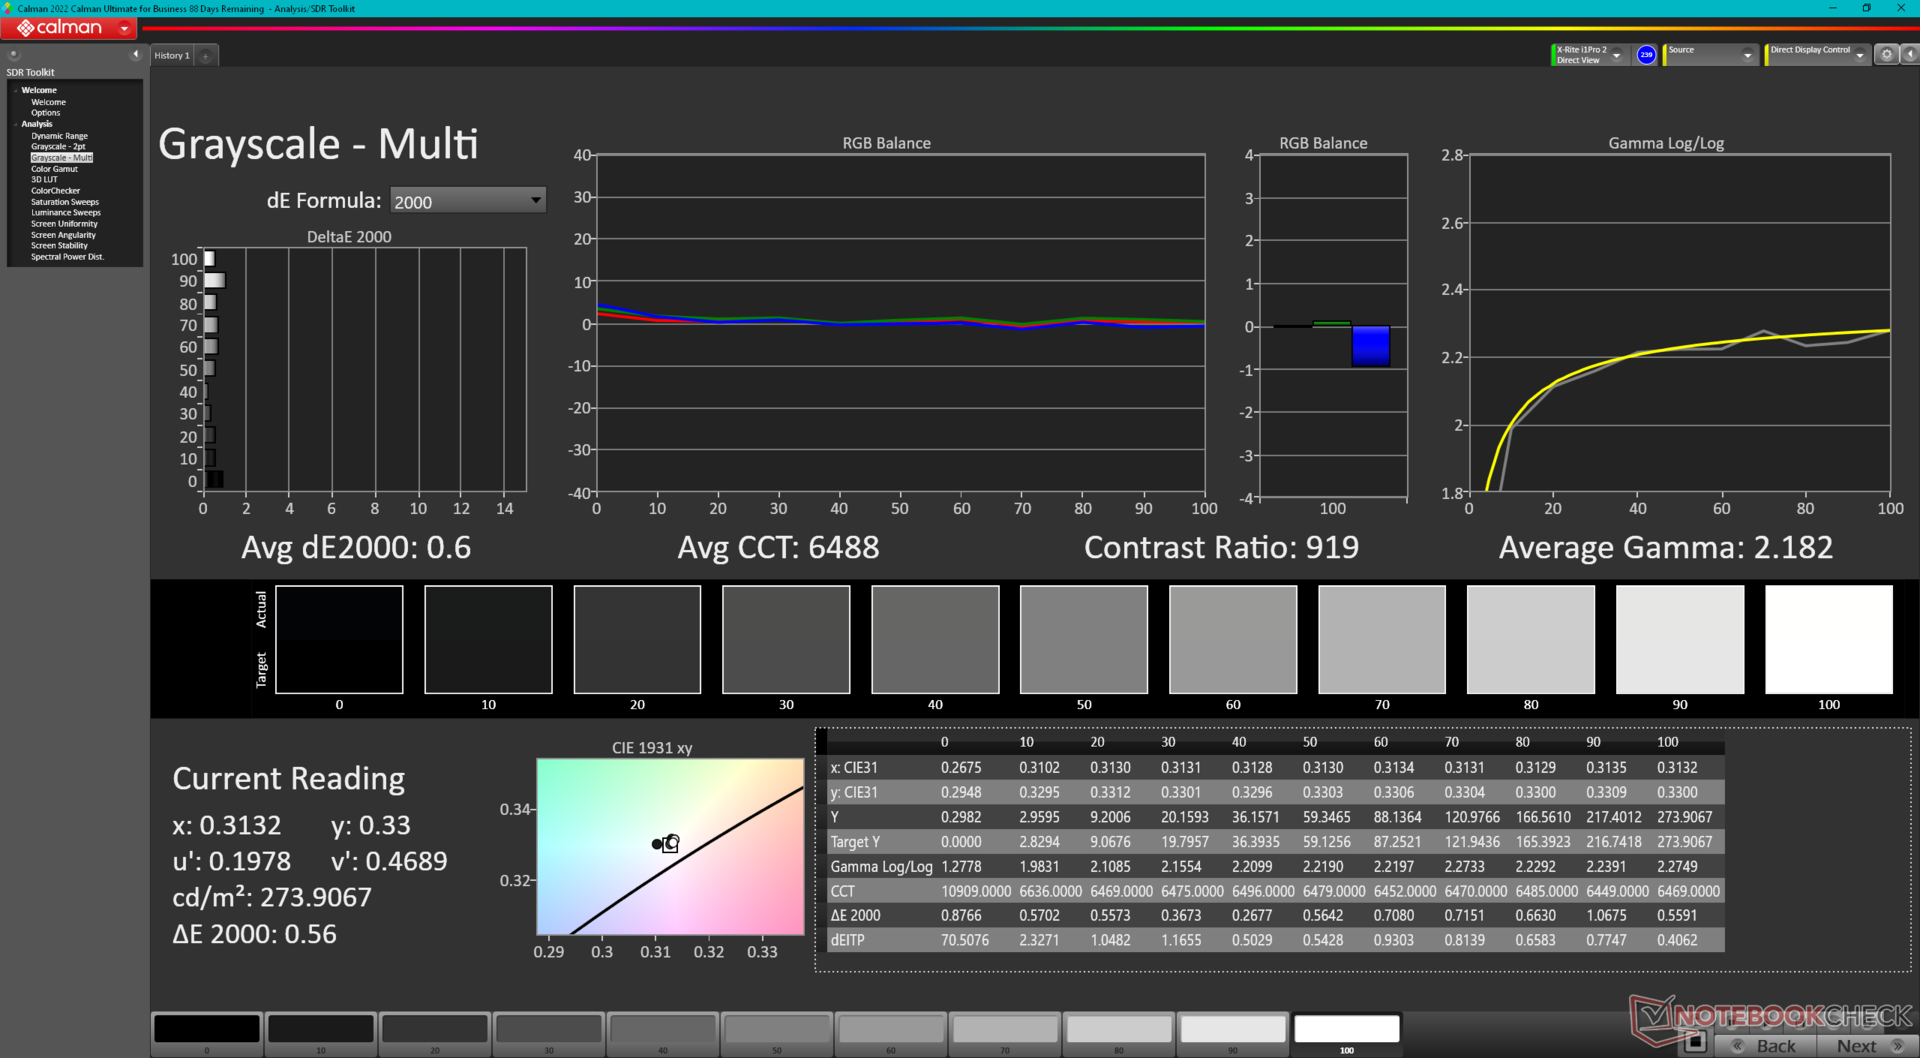
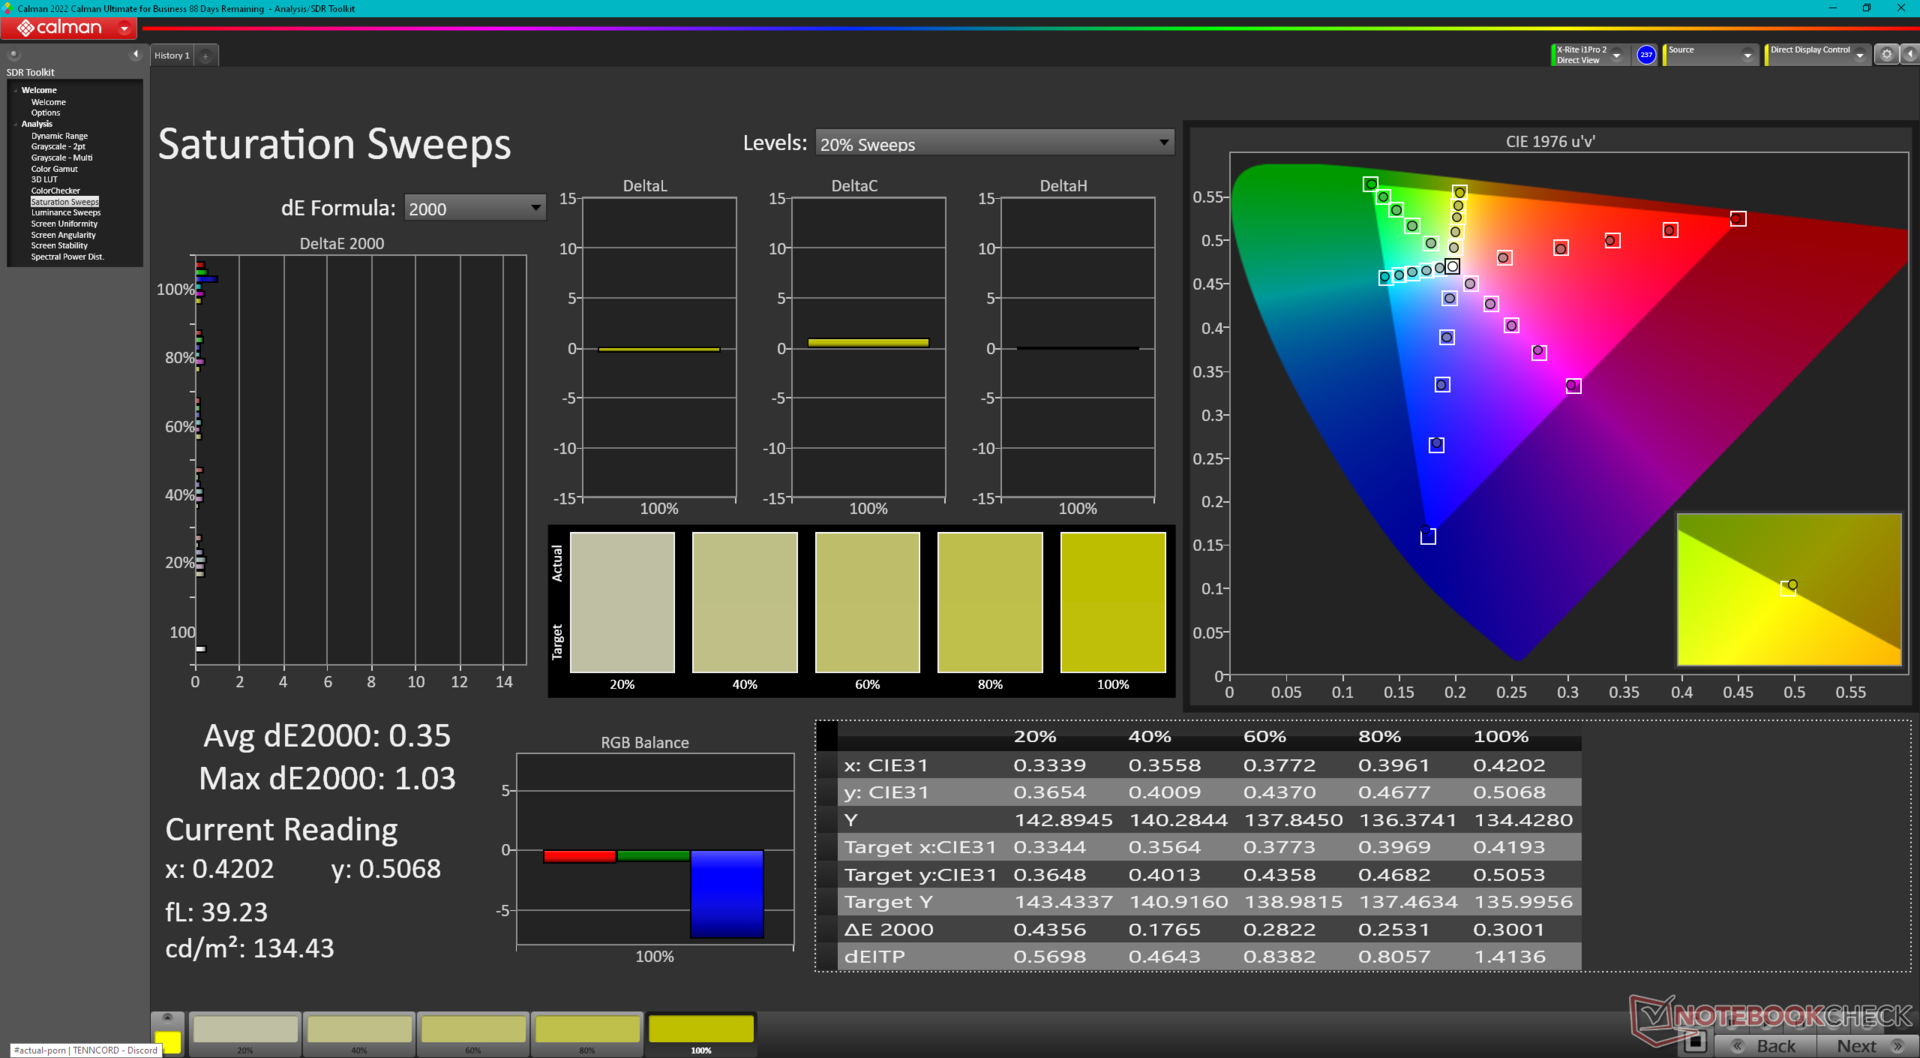
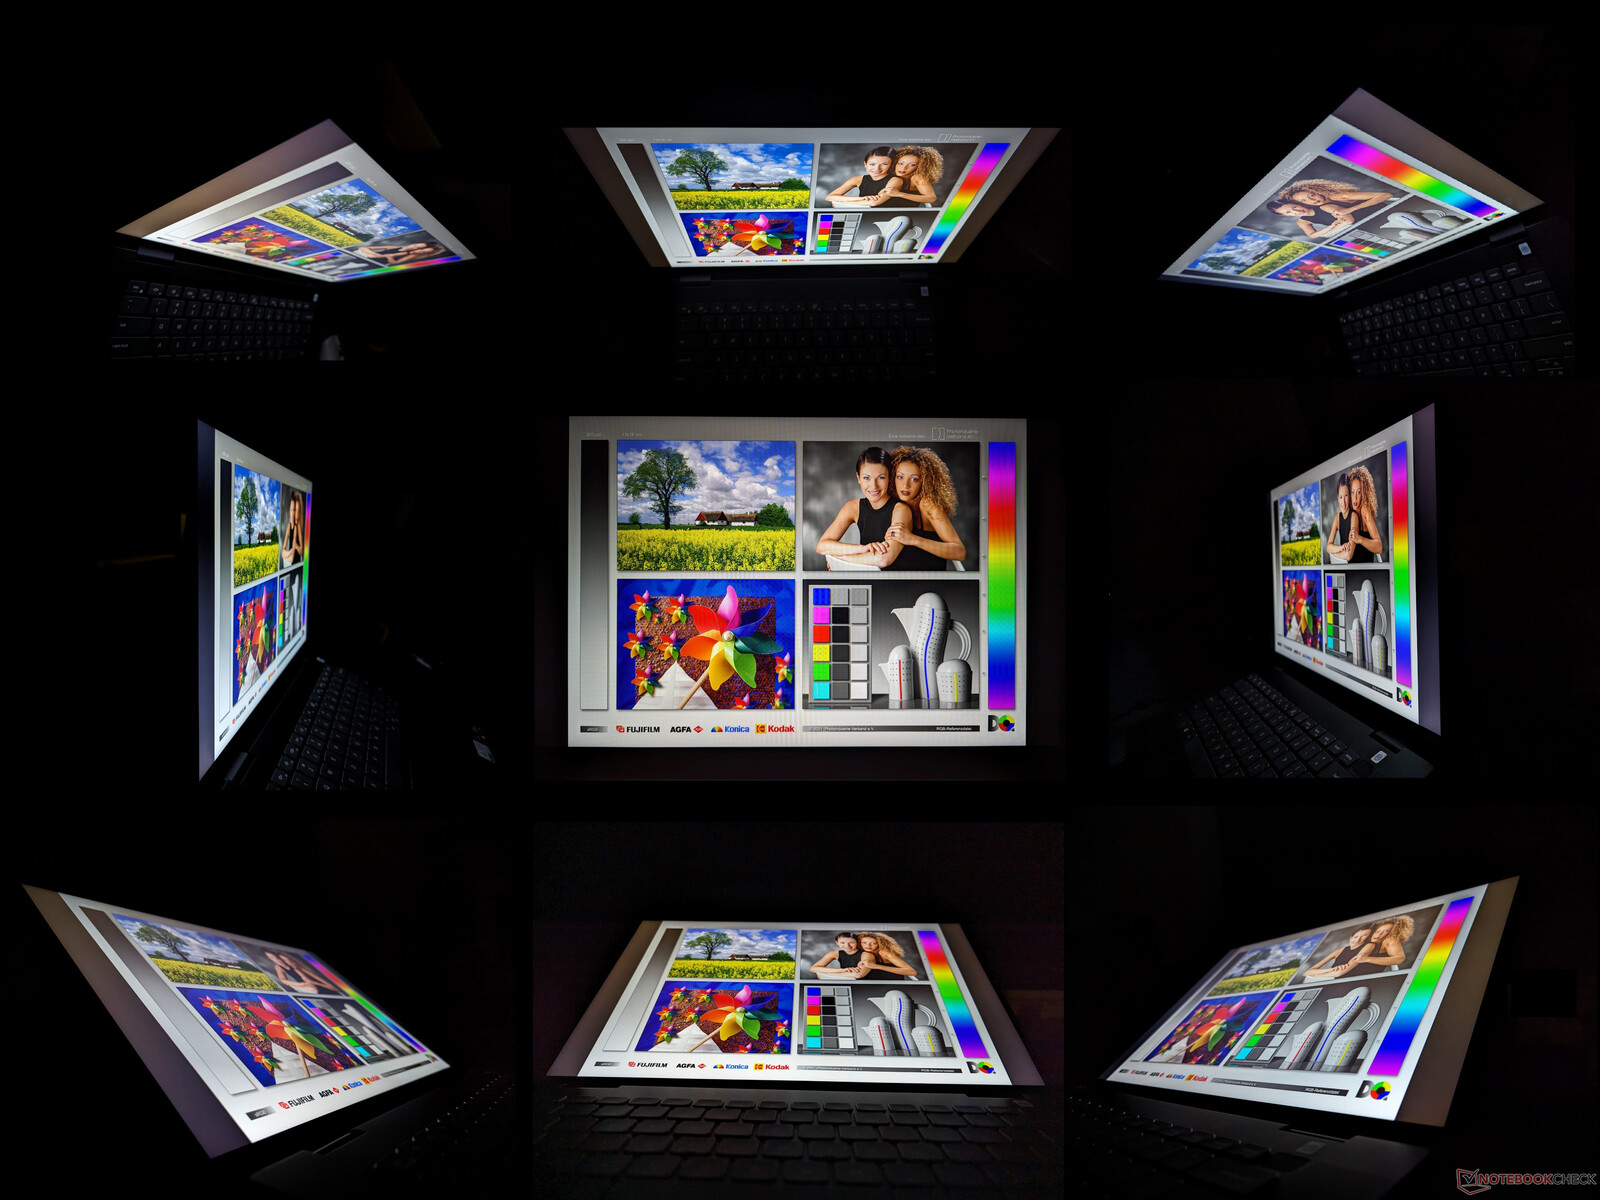
Beeldscherm - volledige sRGB-kleuren
Het model is het eerste in onze database dat wordt geleverd met het Chi Mei 160JCA IPS-paneel, terwijl het paneel op het model van vorig jaar de BOE NV16N45 was. De belangrijkste kenmerken van de twee panelen zijn verder vrijwel identiek, waaronder hun contrastratio's van ~1000:1, volledige sRGB-dekking, verversingssnelheid van 60 Hz en gemiddelde responstijden. De visuele ervaring is daarom in essentie hetzelfde tussen de 2022 en 2023 modellen, tenzij geconfigureerd met de 2400p OLED optie op de Intel-gebaseerde Inspiron 16 7630 2-in-1.
Hoewel ons Chi Mei paneel van hogere kwaliteit is dan de LEN160WUXGA op deIdeaPad Flex 5 16 qua kleuren, zou het leuk zijn geweest als Dell dit jaar een stap verder was gegaan door snellere 90 Hz of 120 Hz vernieuwingsfrequentie opties toe te voegen voor een soepelere UI.
| |||||||||||||||||||||||||
Helderheidsverdeling: 79 %
Helderheid in Batterij-modus: 301.3 cd/m²
Contrast: 1076:1 (Zwart: 0.28 cd/m²)
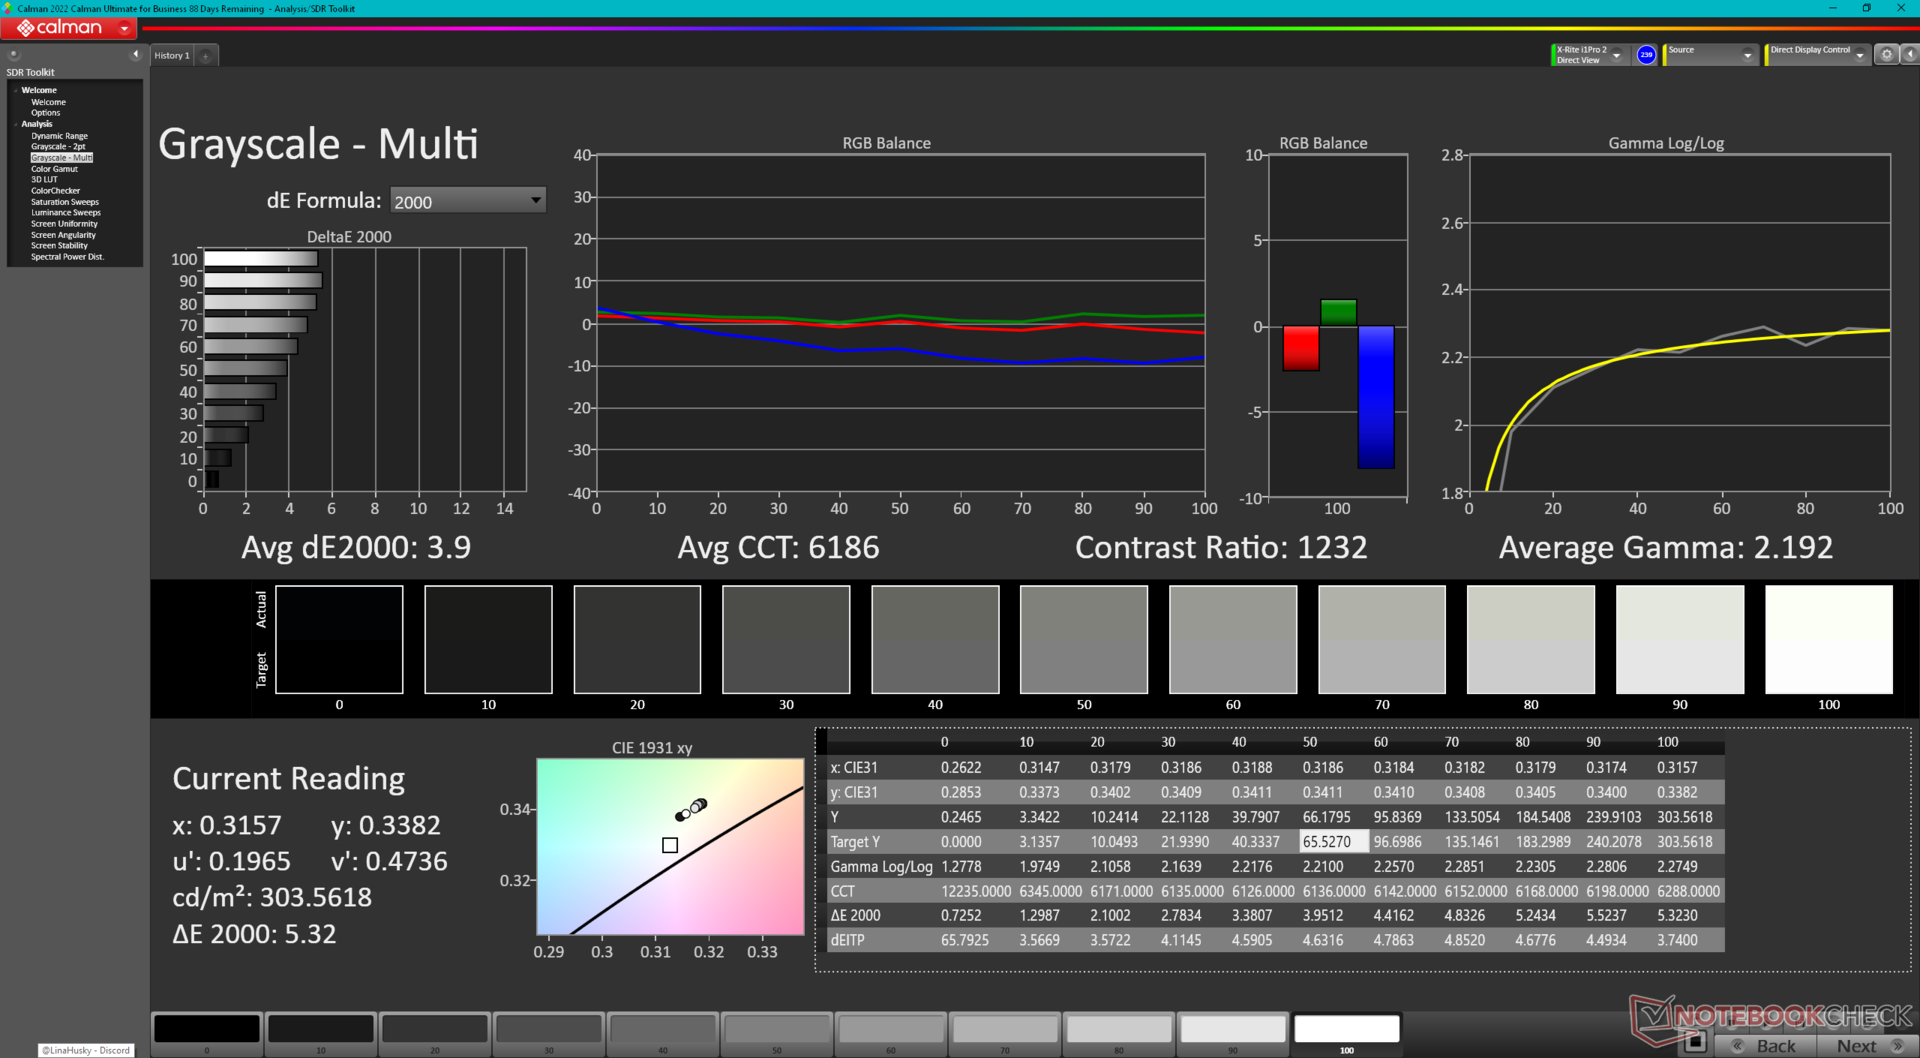
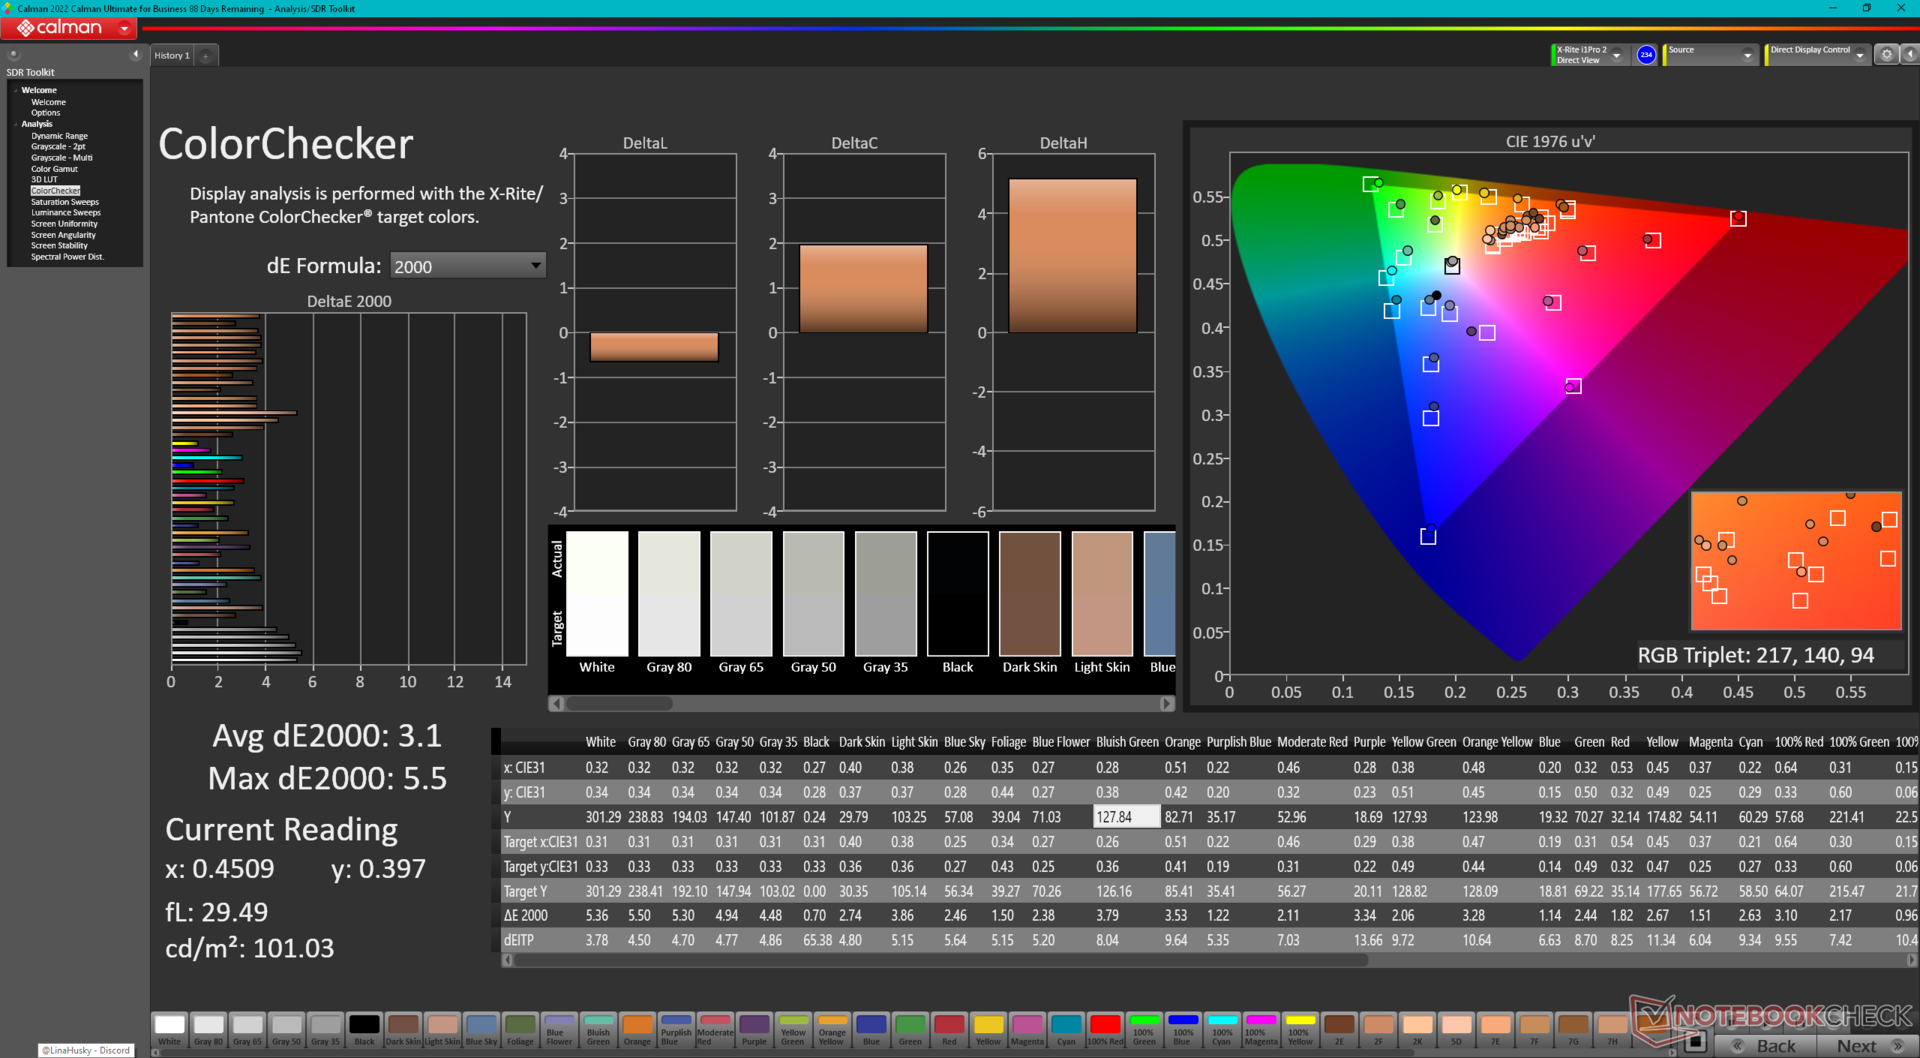
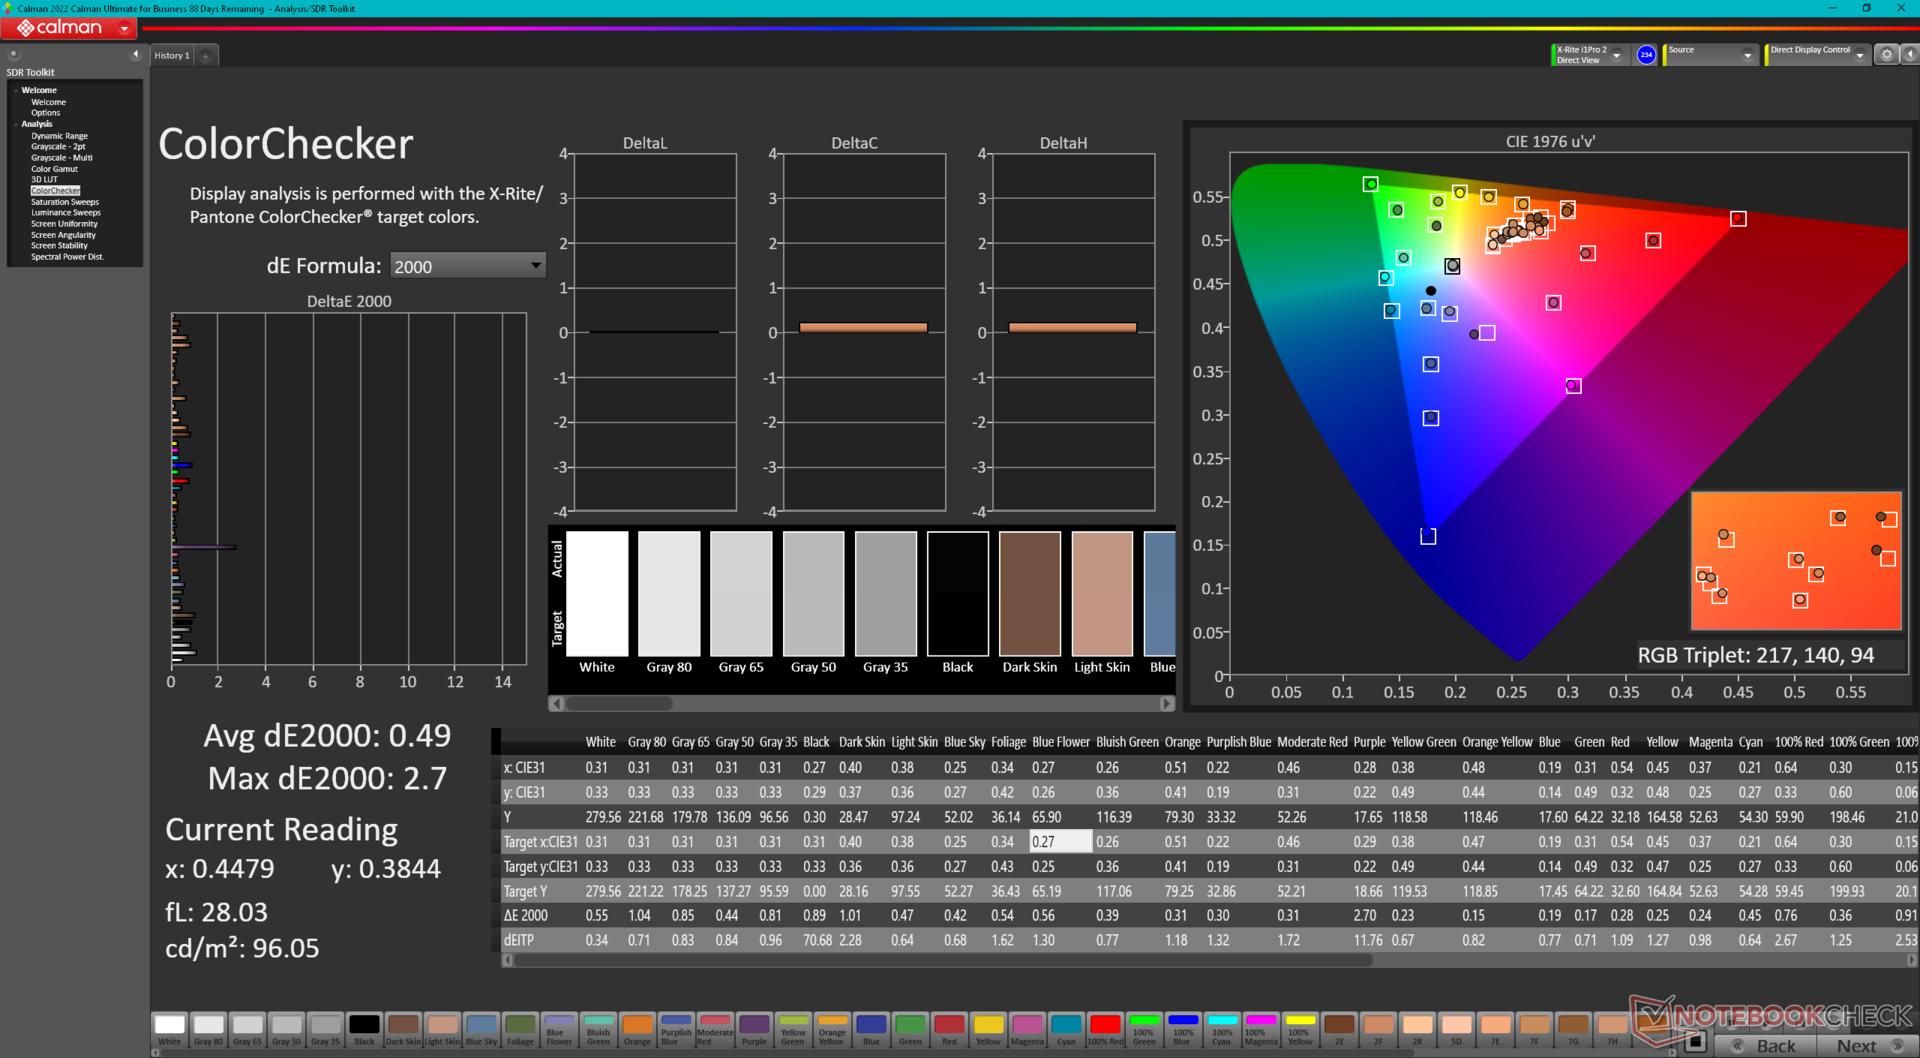
ΔE ColorChecker Calman: 3.1 | ∀{0.5-29.43 Ø4.71}
calibrated: 0.49
ΔE Greyscale Calman: 3.9 | ∀{0.09-98 Ø4.96}
69.5% AdobeRGB 1998 (Argyll 3D)
98.2% sRGB (Argyll 3D)
67.4% Display P3 (Argyll 3D)
Gamma: 2.19
CCT: 6186 K
| Dell Inspiron 16 7635 2-in-1 Chi Mei 160JCA, IPS, 1920x1200, 16" | Acer Swift Edge SFE16-42-R1GM Samsung SDC4168, OLED, 3840x2400, 16" | Lenovo Yoga 7 16IRL8 LEN160FHD, IPS, 1920x1200, 16" | Samsung Galaxy Book3 Pro 16 Samsung ATNA60CL03-0, AMOLED, 2880x1800, 16" | Lenovo IdeaPad Flex 5 16ABR G8 LEN160WUXGA, IPS, 1920x1200, 16" | Dell Inspiron 16 7620 2-in-1 BOE NV16N45, IPS, 1920x1200, 16" | |
|---|---|---|---|---|---|---|
| Display | 30% | -37% | 30% | -41% | -1% | |
| Display P3 Coverage (%) | 67.4 | 99.7 48% | 42 -38% | 99.7 48% | 40 -41% | 67 -1% |
| sRGB Coverage (%) | 98.2 | 100 2% | 62.8 -36% | 100 2% | 57.6 -41% | 95.9 -2% |
| AdobeRGB 1998 Coverage (%) | 69.5 | 97.2 40% | 43.5 -37% | 97 40% | 41.3 -41% | 69.3 0% |
| Response Times | 89% | -15% | 91% | -16% | -15% | |
| Response Time Grey 50% / Grey 80% * (ms) | 27.6 ? | 2 ? 93% | 31.8 ? -15% | 2 ? 93% | 33 ? -20% | 32 ? -16% |
| Response Time Black / White * (ms) | 18.2 ? | 3 ? 84% | 20.9 ? -15% | 2 ? 89% | 20.2 ? -11% | 20.8 ? -14% |
| PWM Frequency (Hz) | 239 ? | |||||
| Screen | -43% | -63% | 250% | -149% | -24% | |
| Brightness middle (cd/m²) | 301.3 | 369 22% | 279.4 -7% | 412 37% | 392 30% | 320.7 6% |
| Brightness (cd/m²) | 269 | 371 38% | 257 -4% | 412 53% | 371 38% | 309 15% |
| Brightness Distribution (%) | 79 | 97 23% | 81 3% | 98 24% | 89 13% | 90 14% |
| Black Level * (cd/m²) | 0.28 | 0.18 36% | 0.015 95% | 0.25 11% | 0.36 -29% | |
| Contrast (:1) | 1076 | 1552 44% | 27467 2453% | 1568 46% | 891 -17% | |
| Colorchecker dE 2000 * | 3.1 | 2.3 26% | 5.12 -65% | 2.34 25% | 7.3 -135% | 4.18 -35% |
| Colorchecker dE 2000 max. * | 5.5 | 4.37 21% | 19.42 -253% | 3.34 39% | 20.8 -278% | 8.48 -54% |
| Colorchecker dE 2000 calibrated * | 0.49 | 2.87 -486% | 1.84 -276% | 2.95 -502% | 5.4 -1002% | 0.77 -57% |
| Greyscale dE 2000 * | 3.9 | 1.83 53% | 5.5 -41% | 2.78 29% | 6.5 -67% | 6.3 -62% |
| Gamma | 2.19 100% | 2.39 92% | 2.22 99% | 2.5 88% | 2.29 96% | 2.21 100% |
| CCT | 6186 105% | 6392 102% | 6407 101% | 6879 94% | 5993 108% | 6258 104% |
| Totaal Gemiddelde (Programma / Instellingen) | 25% /
-3% | -38% /
-50% | 124% /
180% | -69% /
-107% | -13% /
-18% |
* ... kleiner is beter
Het scherm is niet voorgekalibreerd, wat te verwachten is van een budgetmachine. Desalniettemin zijn de gemiddelde grijswaarden en kleur deltaE waarden met respectievelijk slechts 3,9 en 3,1 niet slecht. Een goede kalibratie zou de gemiddelden nog verder verbeteren tot slechts 0,6 en 0,49 en daarom raden we aan om ons gekalibreerde ICM-profiel hierboven toe te passen om de volledige sRGB-kleuren van het paneel beter te benutten.
Responstijd Scherm
| ↔ Responstijd Zwart naar Wit | ||
|---|---|---|
| 18.2 ms ... stijging ↗ en daling ↘ gecombineerd | ↗ 9.6 ms stijging | 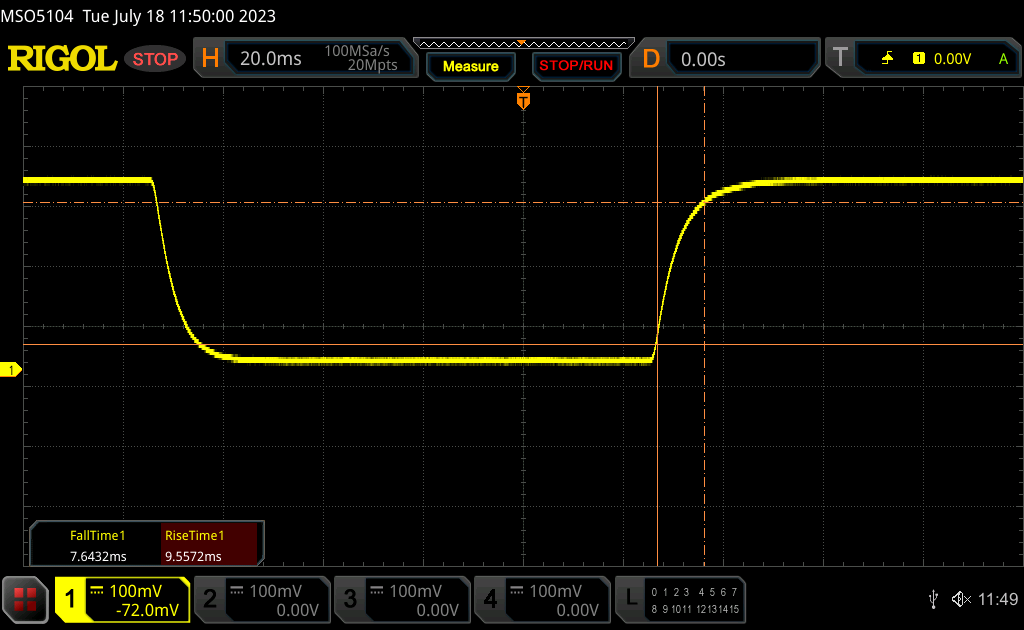 |
| ↘ 7.6 ms daling | ||
| Het scherm vertoonde prima responstijden in onze tests maar is misschien wat te traag voor competitieve games. Ter vergelijking: alle testtoestellen variëren van 0.1 (minimum) tot 240 (maximum) ms. » 41 % van alle toestellen zijn beter. Dit betekent dat de gemeten responstijd vergelijkbaar is met het gemiddelde (19.8 ms) van alle geteste toestellen. | ||
| ↔ Responstijd 50% Grijs naar 80% Grijs | ||
| 27.6 ms ... stijging ↗ en daling ↘ gecombineerd | ↗ 13.2 ms stijging | 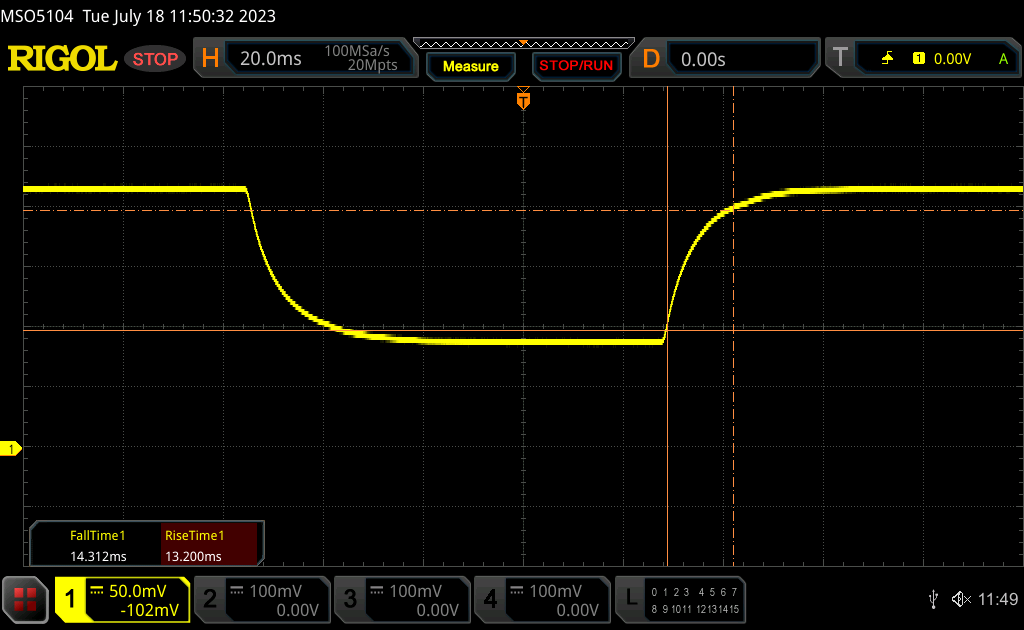 |
| ↘ 14.3 ms daling | ||
| Het scherm vertoonde relatief trage responstijden in onze tests en is misschien te traag voor games. Ter vergelijking: alle testtoestellen variëren van 0.165 (minimum) tot 636 (maximum) ms. » 37 % van alle toestellen zijn beter. Dit betekent dat de gemeten responstijd beter is dan het gemiddelde (31 ms) van alle geteste toestellen. | ||
Screen Flickering / PWM (Pulse-Width Modulation)
| Screen flickering / PWM niet waargenomen | 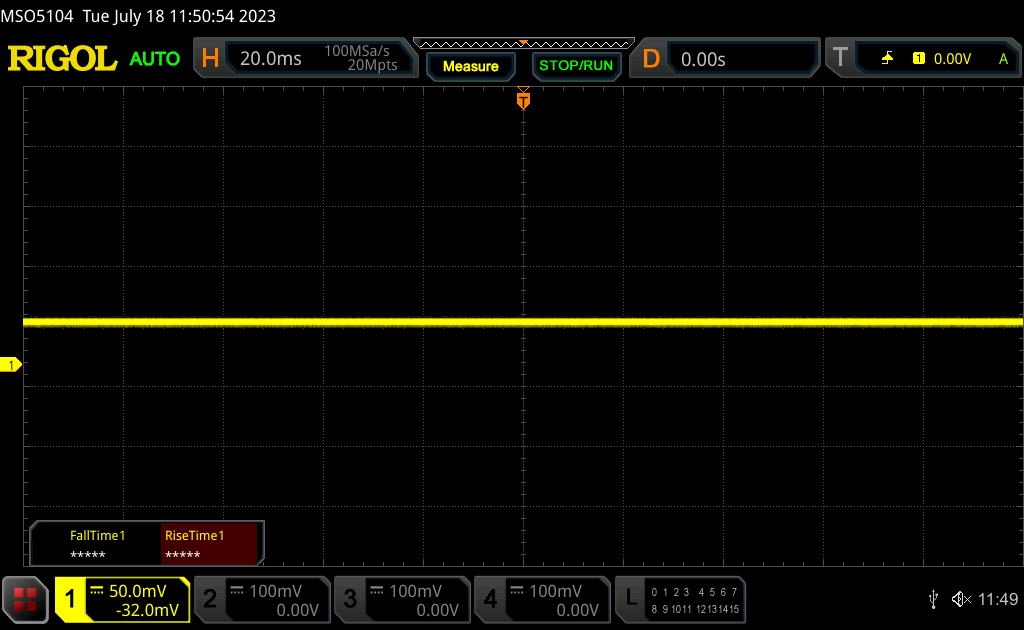 | ||
Ter vergelijking: 52 % van alle geteste toestellen maakten geen gebruik van PWM om de schermhelderheid te verlagen. Als het wel werd gebruikt, werd een gemiddelde van 7754 (minimum: 5 - maximum: 343500) Hz waargenomen. | |||
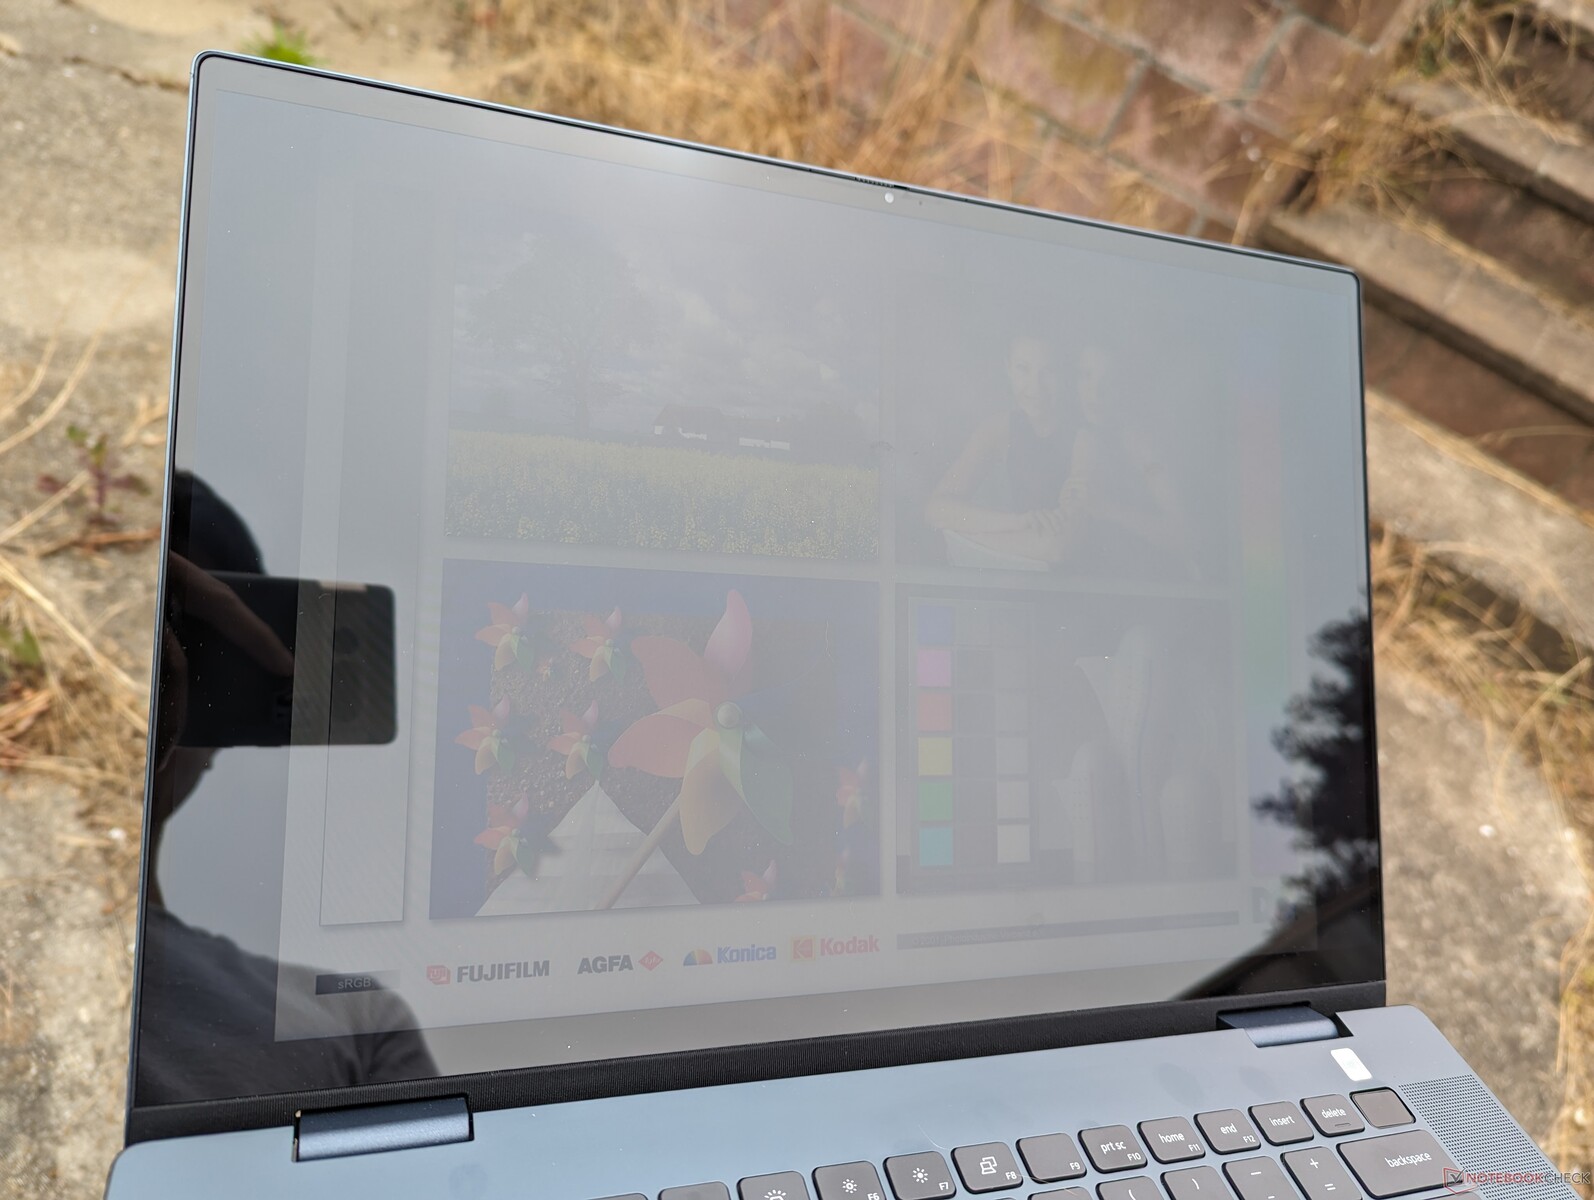
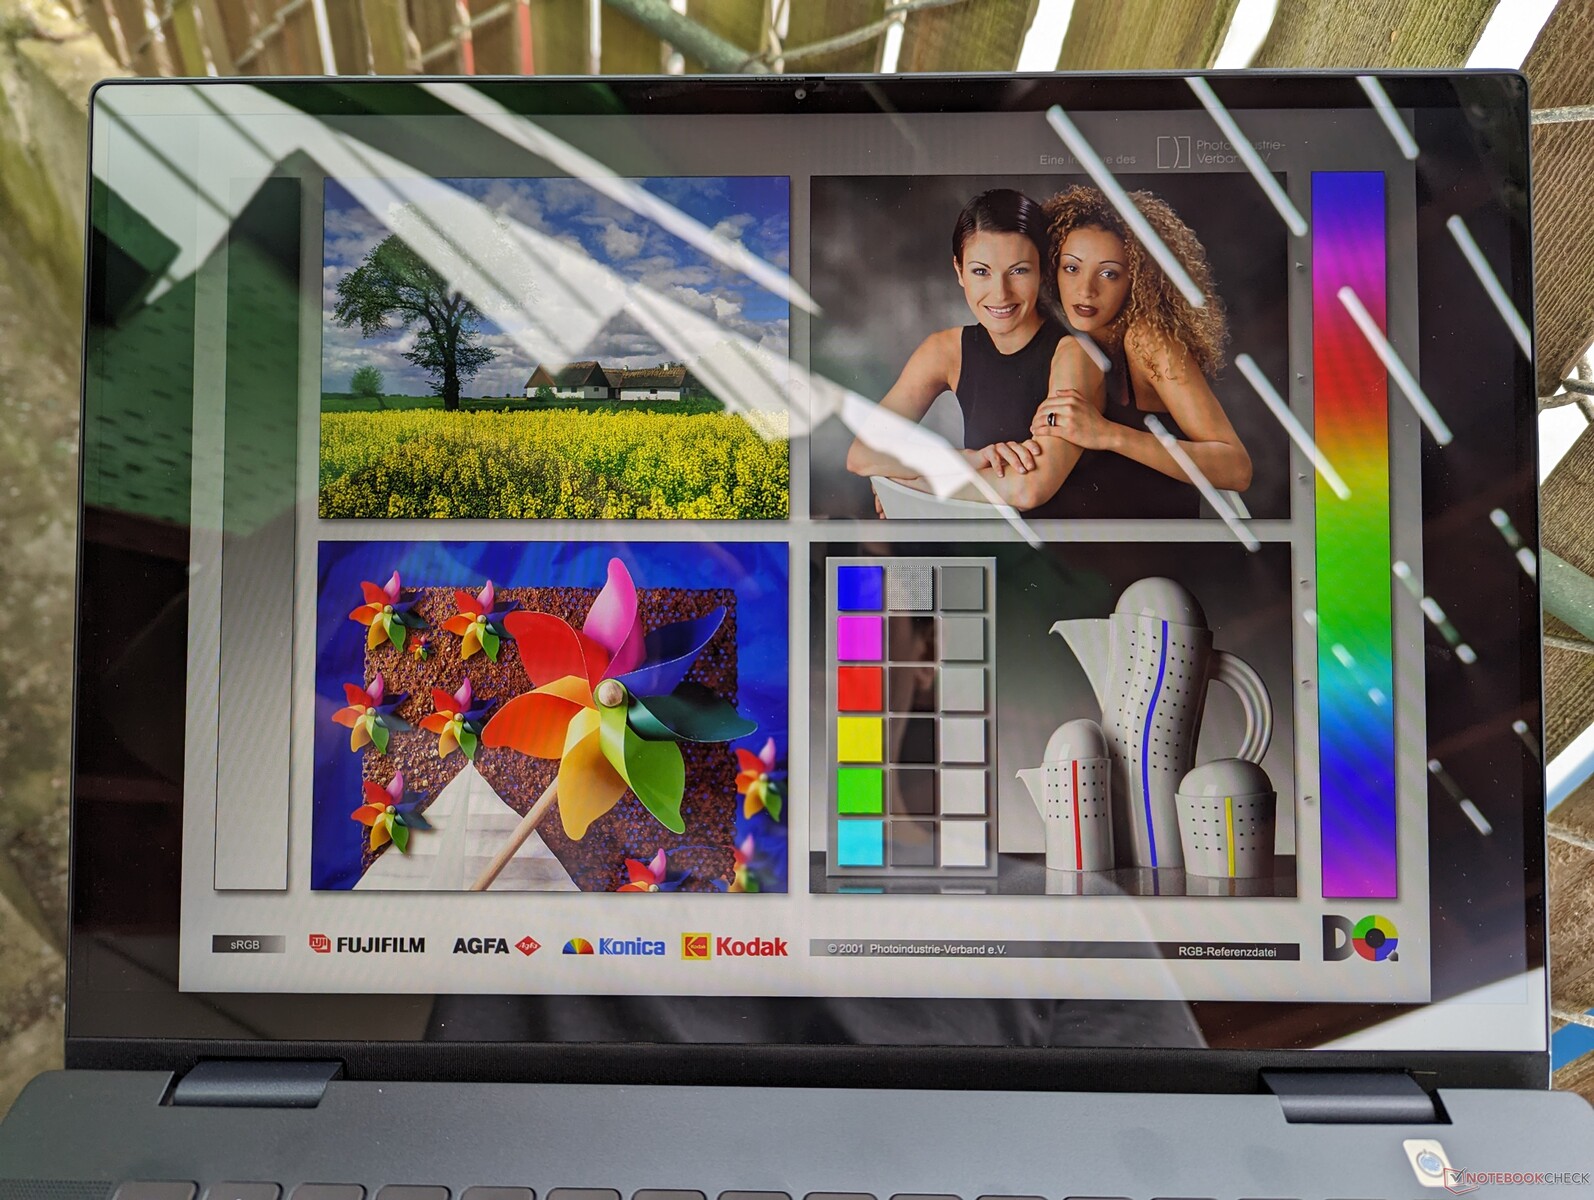
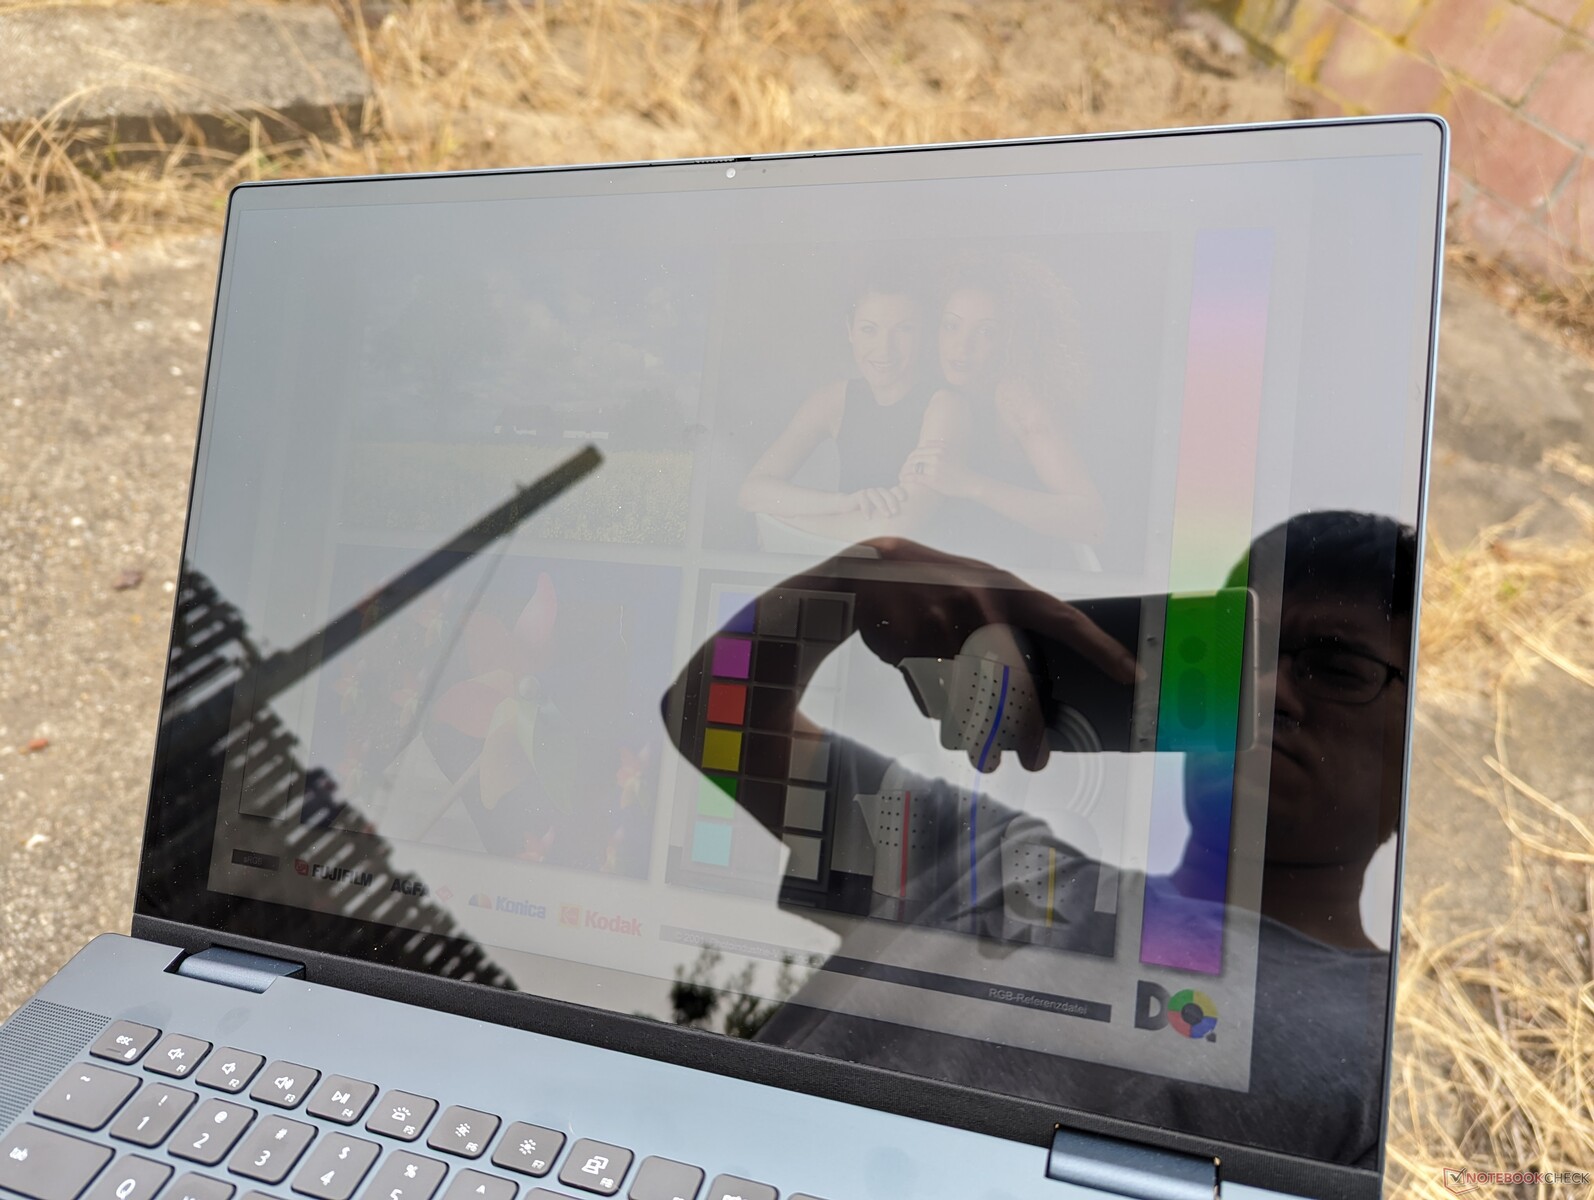
De zichtbaarheid buitenshuis is op zijn best gemiddeld, omdat het 300-nit touchscreen niet helder genoeg is om schittering aanzienlijk te verminderen of te verhelpen. Tablets zoals de iPad Pro 12.6 zijn twee keer helderder of meer. De Dell is in de eerste plaats een multimedia convertible voor binnenomgevingen.
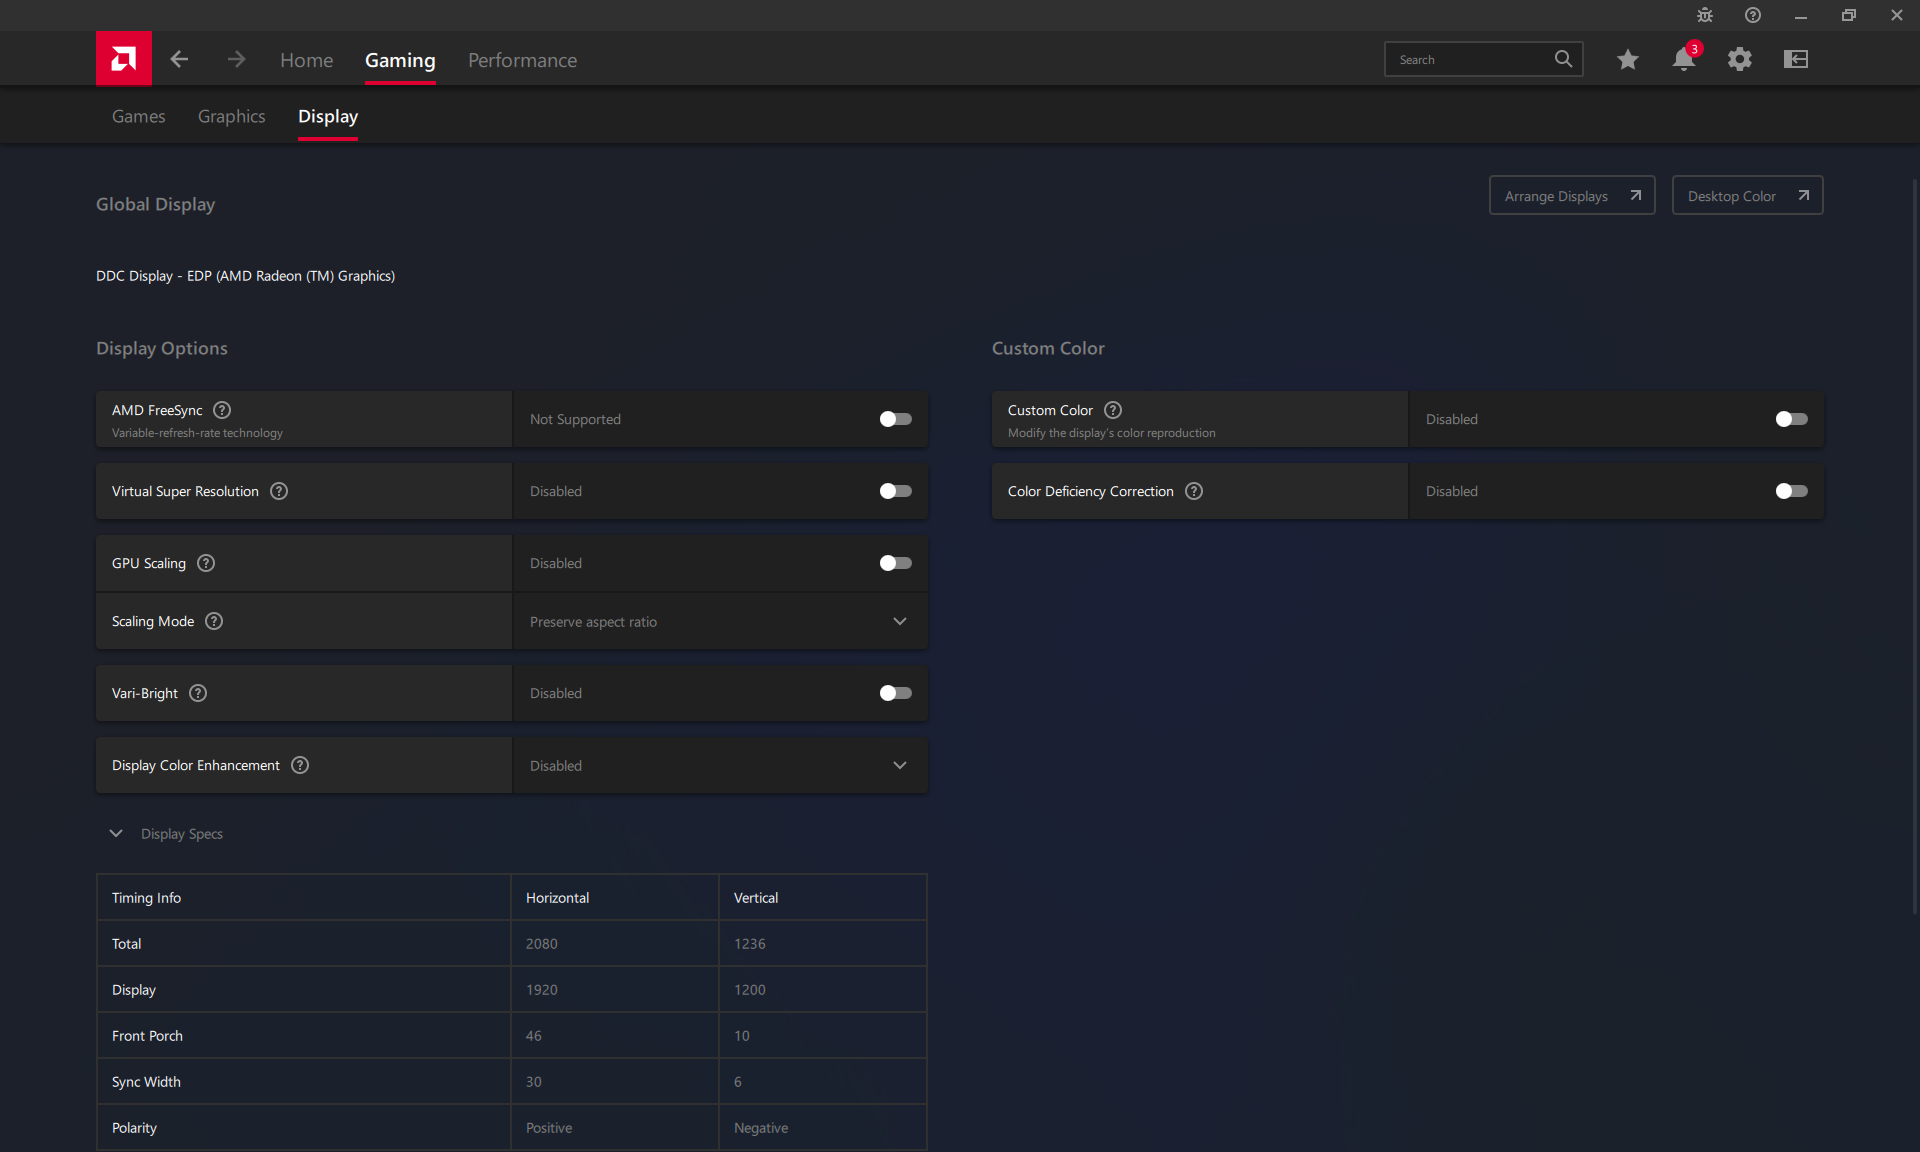
Zorg ervoor dat je AMD Vari-Bright uitschakelt via de AMD Adrenalin, anders wordt de maximale helderheid verminderd wanneer je op de batterij werkt.
Prestaties - Niet alle Ryzen 7000 CPU's zijn Zen 4
Testomstandigheden
We hebben ons apparaat via Windows ingesteld op de modus Prestaties voordat we de onderstaande benchmarks uitvoerden. Extra grafische instellingen zijn beschikbaar op AMD Adrenalin, dat niet vooraf op ons apparaat is geladen. We raden aan de AMD auto-detect tool voor Adrenalin en de nieuwste grafische stuurprogramma's te installeren.
Processor
DeRyzen 5 7530U presteert bijna identiek aan de Ryzen 5 6600H zij het met een lager energieverbruik voor hogere prestaties per watt. Het is daarom een midrange CPU die vergelijkbaar is met de concurrerende Core i5-1235U of Core i7-1255U zoals die te vinden zijn in veel Ultrabooks zoals dehP Spectre x360 13.5. Op typische AMD-wijze zijn de single-thread prestaties echter zo'n 15 tot 20 procent langzamer dan die van de eerder genoemde Intel-processors.
Upgraden naar de 8-core Ryzen 7 7730U van onze 6-core Ryzen 5 7530U zal naar verwachting de multi-thread prestaties met ongeveer 15 tot 35 procent verbeteren, gebaseerd op onze tijd met de IdeaPad Flex 5 16. De Core i7-1360P optie op de Intel Inspiron zou nog sneller presteren.
Cinebench R15 Multi Loop
Cinebench R23: Multi Core | Single Core
Cinebench R20: CPU (Multi Core) | CPU (Single Core)
Cinebench R15: CPU Multi 64Bit | CPU Single 64Bit
Blender: v2.79 BMW27 CPU
7-Zip 18.03: 7z b 4 | 7z b 4 -mmt1
Geekbench 5.5: Multi-Core | Single-Core
HWBOT x265 Benchmark v2.2: 4k Preset
LibreOffice : 20 Documents To PDF
R Benchmark 2.5: Overall mean
* ... kleiner is beter
AIDA64: FP32 Ray-Trace | FPU Julia | CPU SHA3 | CPU Queen | FPU SinJulia | FPU Mandel | CPU AES | CPU ZLib | FP64 Ray-Trace | CPU PhotoWorxx
| Performance rating | |
| Acer Swift Edge SFE16-42-R1GM | |
| Lenovo IdeaPad Flex 5 16ABR G8 | |
| Samsung Galaxy Book3 Pro 16 | |
| Dell Inspiron 16 7635 2-in-1 | |
| Gemiddeld AMD Ryzen 5 7530U | |
| Lenovo Yoga 7 16IRL8 | |
| Dell Inspiron 16 7620 2-in-1 | |
| AIDA64 / FP32 Ray-Trace | |
| Lenovo IdeaPad Flex 5 16ABR G8 | |
| Acer Swift Edge SFE16-42-R1GM | |
| Dell Inspiron 16 7635 2-in-1 | |
| Gemiddeld AMD Ryzen 5 7530U (7609 - 10970, n=9) | |
| Samsung Galaxy Book3 Pro 16 | |
| Lenovo Yoga 7 16IRL8 | |
| Dell Inspiron 16 7620 2-in-1 | |
| AIDA64 / FPU Julia | |
| Lenovo IdeaPad Flex 5 16ABR G8 | |
| Acer Swift Edge SFE16-42-R1GM | |
| Dell Inspiron 16 7635 2-in-1 | |
| Gemiddeld AMD Ryzen 5 7530U (48473 - 68384, n=9) | |
| Samsung Galaxy Book3 Pro 16 | |
| Lenovo Yoga 7 16IRL8 | |
| Dell Inspiron 16 7620 2-in-1 | |
| AIDA64 / CPU SHA3 | |
| Samsung Galaxy Book3 Pro 16 | |
| Lenovo IdeaPad Flex 5 16ABR G8 | |
| Acer Swift Edge SFE16-42-R1GM | |
| Lenovo Yoga 7 16IRL8 | |
| Dell Inspiron 16 7635 2-in-1 | |
| Gemiddeld AMD Ryzen 5 7530U (1591 - 2323, n=9) | |
| Dell Inspiron 16 7620 2-in-1 | |
| AIDA64 / CPU Queen | |
| Lenovo IdeaPad Flex 5 16ABR G8 | |
| Acer Swift Edge SFE16-42-R1GM | |
| Samsung Galaxy Book3 Pro 16 | |
| Dell Inspiron 16 7620 2-in-1 | |
| Dell Inspiron 16 7635 2-in-1 | |
| Gemiddeld AMD Ryzen 5 7530U (66646 - 78105, n=8) | |
| Lenovo Yoga 7 16IRL8 | |
| AIDA64 / FPU SinJulia | |
| Acer Swift Edge SFE16-42-R1GM | |
| Lenovo IdeaPad Flex 5 16ABR G8 | |
| Dell Inspiron 16 7635 2-in-1 | |
| Gemiddeld AMD Ryzen 5 7530U (7611 - 9248, n=9) | |
| Samsung Galaxy Book3 Pro 16 | |
| Dell Inspiron 16 7620 2-in-1 | |
| Lenovo Yoga 7 16IRL8 | |
| AIDA64 / FPU Mandel | |
| Lenovo IdeaPad Flex 5 16ABR G8 | |
| Acer Swift Edge SFE16-42-R1GM | |
| Dell Inspiron 16 7635 2-in-1 | |
| Gemiddeld AMD Ryzen 5 7530U (26912 - 37624, n=9) | |
| Samsung Galaxy Book3 Pro 16 | |
| Lenovo Yoga 7 16IRL8 | |
| Dell Inspiron 16 7620 2-in-1 | |
| AIDA64 / CPU AES | |
| Samsung Galaxy Book3 Pro 16 | |
| Gemiddeld AMD Ryzen 5 7530U (33314 - 92360, n=9) | |
| Lenovo Yoga 7 16IRL8 | |
| Lenovo IdeaPad Flex 5 16ABR G8 | |
| Acer Swift Edge SFE16-42-R1GM | |
| Dell Inspiron 16 7620 2-in-1 | |
| Dell Inspiron 16 7635 2-in-1 | |
| AIDA64 / CPU ZLib | |
| Samsung Galaxy Book3 Pro 16 | |
| Lenovo Yoga 7 16IRL8 | |
| Acer Swift Edge SFE16-42-R1GM | |
| Lenovo IdeaPad Flex 5 16ABR G8 | |
| Dell Inspiron 16 7620 2-in-1 | |
| Dell Inspiron 16 7635 2-in-1 | |
| Gemiddeld AMD Ryzen 5 7530U (443 - 612, n=9) | |
| AIDA64 / FP64 Ray-Trace | |
| Lenovo IdeaPad Flex 5 16ABR G8 | |
| Acer Swift Edge SFE16-42-R1GM | |
| Dell Inspiron 16 7635 2-in-1 | |
| Gemiddeld AMD Ryzen 5 7530U (4008 - 5738, n=9) | |
| Samsung Galaxy Book3 Pro 16 | |
| Lenovo Yoga 7 16IRL8 | |
| Dell Inspiron 16 7620 2-in-1 | |
| AIDA64 / CPU PhotoWorxx | |
| Samsung Galaxy Book3 Pro 16 | |
| Lenovo Yoga 7 16IRL8 | |
| Acer Swift Edge SFE16-42-R1GM | |
| Dell Inspiron 16 7635 2-in-1 | |
| Lenovo IdeaPad Flex 5 16ABR G8 | |
| Dell Inspiron 16 7620 2-in-1 | |
| Gemiddeld AMD Ryzen 5 7530U (9832 - 19525, n=9) | |
Systeemprestaties
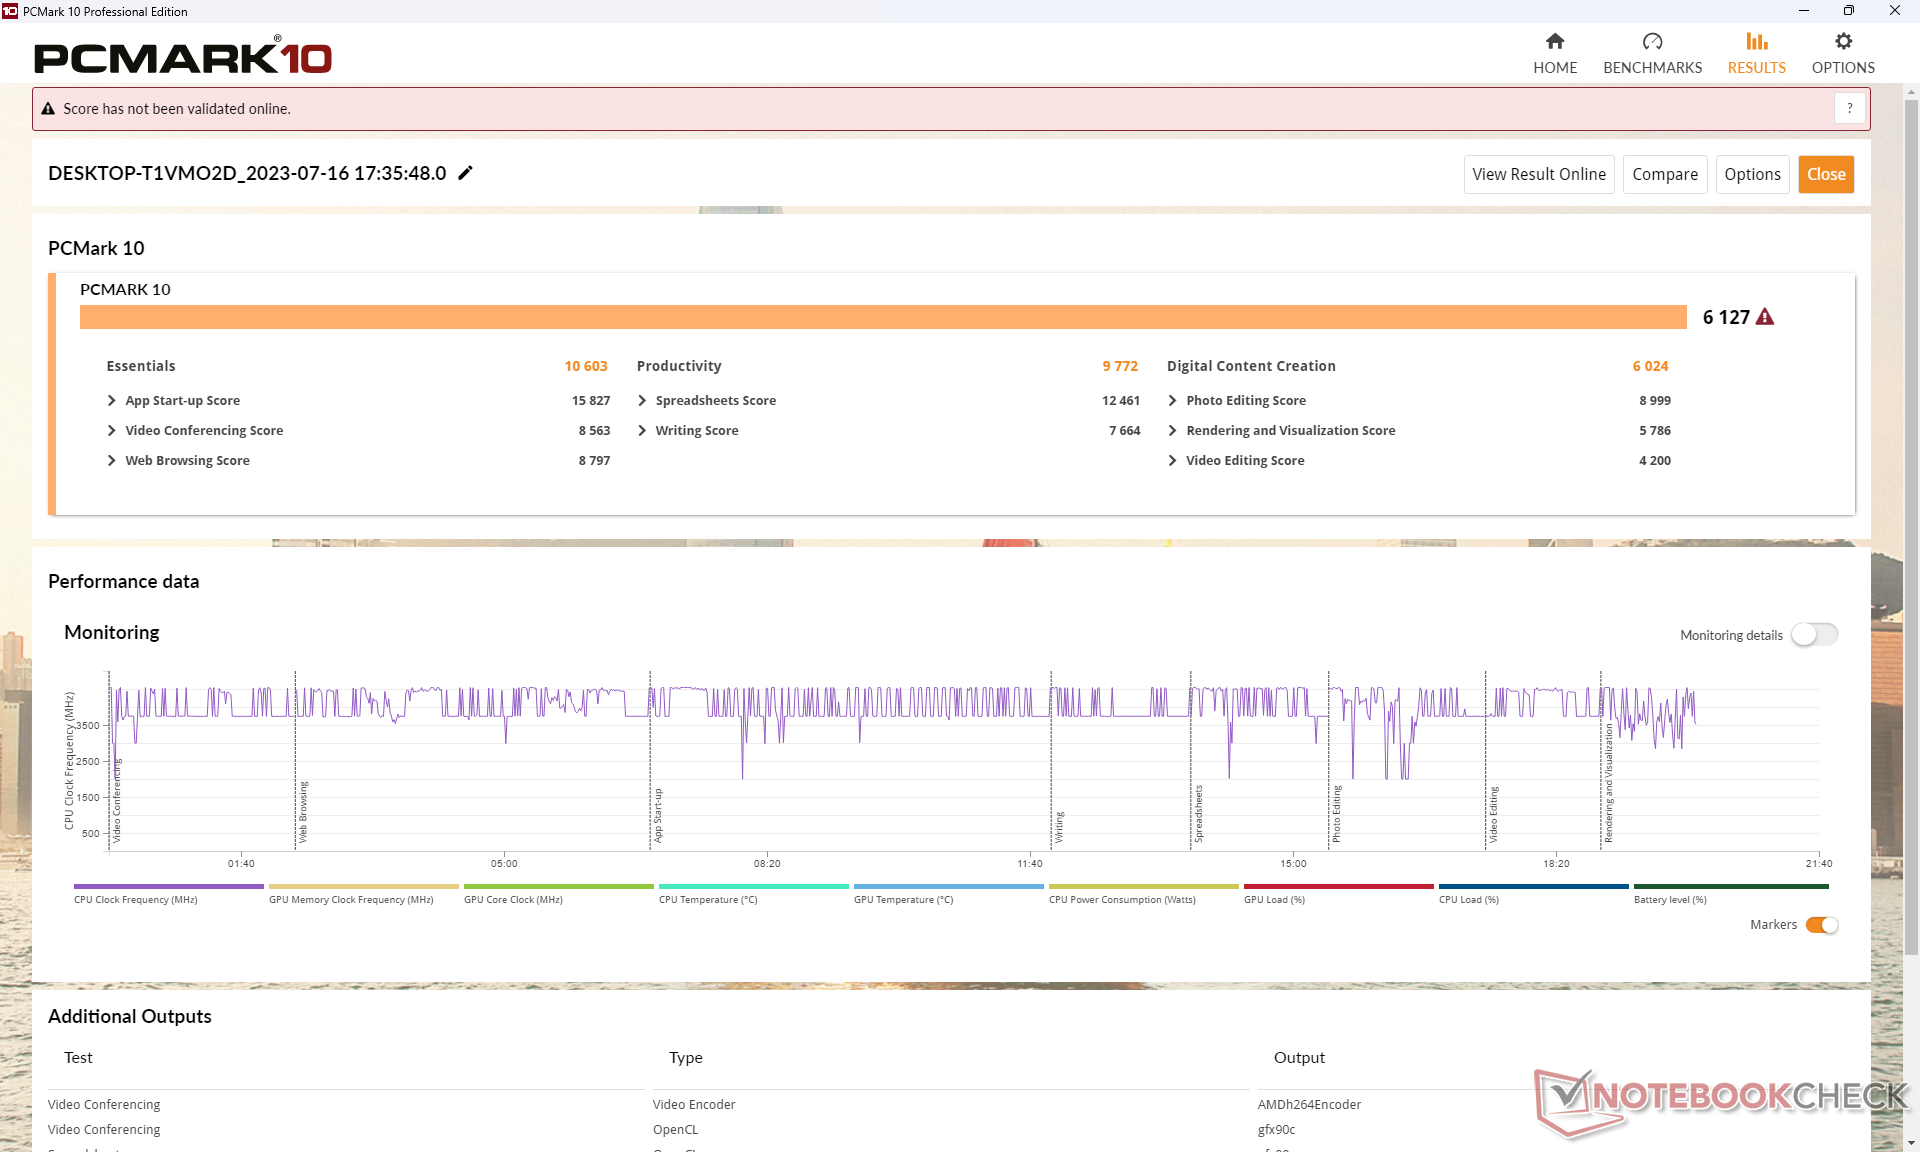
De resultaten van PCMark zijn vergelijkbaar met alternatieven die draaien op Core-U en zelfs Core-P processors, zoals de Samsung Galaxy Book3 Pro 16 of de Dell Inspiron 16 7620 2-in-1 van vorig jaar. Interessant is dat de subtest Productiviteit met grotere marges in het voordeel van ons Dell systeem uitvalt.
CrossMark: Overall | Productivity | Creativity | Responsiveness
| PCMark 10 / Score | |
| Lenovo IdeaPad Flex 5 16ABR G8 | |
| Acer Swift Edge SFE16-42-R1GM | |
| Dell Inspiron 16 7635 2-in-1 | |
| Gemiddeld AMD Ryzen 5 7530U, AMD Radeon RX Vega 7 (5686 - 6209, n=8) | |
| Lenovo Yoga 7 16IRL8 | |
| Samsung Galaxy Book3 Pro 16 | |
| Dell Inspiron 16 7620 2-in-1 | |
| PCMark 10 / Essentials | |
| Lenovo Yoga 7 16IRL8 | |
| Lenovo IdeaPad Flex 5 16ABR G8 | |
| Dell Inspiron 16 7635 2-in-1 | |
| Samsung Galaxy Book3 Pro 16 | |
| Gemiddeld AMD Ryzen 5 7530U, AMD Radeon RX Vega 7 (9183 - 11242, n=8) | |
| Dell Inspiron 16 7620 2-in-1 | |
| Acer Swift Edge SFE16-42-R1GM | |
| PCMark 10 / Productivity | |
| Gemiddeld AMD Ryzen 5 7530U, AMD Radeon RX Vega 7 (8983 - 14037, n=8) | |
| Dell Inspiron 16 7635 2-in-1 | |
| Lenovo IdeaPad Flex 5 16ABR G8 | |
| Acer Swift Edge SFE16-42-R1GM | |
| Lenovo Yoga 7 16IRL8 | |
| Samsung Galaxy Book3 Pro 16 | |
| Dell Inspiron 16 7620 2-in-1 | |
| PCMark 10 / Digital Content Creation | |
| Acer Swift Edge SFE16-42-R1GM | |
| Lenovo Yoga 7 16IRL8 | |
| Samsung Galaxy Book3 Pro 16 | |
| Lenovo IdeaPad Flex 5 16ABR G8 | |
| Dell Inspiron 16 7635 2-in-1 | |
| Dell Inspiron 16 7620 2-in-1 | |
| Gemiddeld AMD Ryzen 5 7530U, AMD Radeon RX Vega 7 (4941 - 6093, n=8) | |
| CrossMark / Overall | |
| Lenovo Yoga 7 16IRL8 | |
| Samsung Galaxy Book3 Pro 16 | |
| Dell Inspiron 16 7620 2-in-1 | |
| Acer Swift Edge SFE16-42-R1GM | |
| Lenovo IdeaPad Flex 5 16ABR G8 | |
| Gemiddeld AMD Ryzen 5 7530U, AMD Radeon RX Vega 7 (1029 - 1336, n=7) | |
| Dell Inspiron 16 7635 2-in-1 | |
| CrossMark / Productivity | |
| Lenovo Yoga 7 16IRL8 | |
| Samsung Galaxy Book3 Pro 16 | |
| Dell Inspiron 16 7620 2-in-1 | |
| Acer Swift Edge SFE16-42-R1GM | |
| Lenovo IdeaPad Flex 5 16ABR G8 | |
| Gemiddeld AMD Ryzen 5 7530U, AMD Radeon RX Vega 7 (1115 - 1370, n=7) | |
| Dell Inspiron 16 7635 2-in-1 | |
| CrossMark / Creativity | |
| Lenovo Yoga 7 16IRL8 | |
| Samsung Galaxy Book3 Pro 16 | |
| Dell Inspiron 16 7620 2-in-1 | |
| Lenovo IdeaPad Flex 5 16ABR G8 | |
| Acer Swift Edge SFE16-42-R1GM | |
| Dell Inspiron 16 7635 2-in-1 | |
| Gemiddeld AMD Ryzen 5 7530U, AMD Radeon RX Vega 7 (992 - 1390, n=7) | |
| CrossMark / Responsiveness | |
| Samsung Galaxy Book3 Pro 16 | |
| Lenovo Yoga 7 16IRL8 | |
| Dell Inspiron 16 7620 2-in-1 | |
| Acer Swift Edge SFE16-42-R1GM | |
| Gemiddeld AMD Ryzen 5 7530U, AMD Radeon RX Vega 7 (900 - 1096, n=7) | |
| Lenovo IdeaPad Flex 5 16ABR G8 | |
| Dell Inspiron 16 7635 2-in-1 | |
| PCMark 10 Score | 6127 punten | |
Help | ||
| AIDA64 / Memory Copy | |
| Samsung Galaxy Book3 Pro 16 | |
| Lenovo Yoga 7 16IRL8 | |
| Acer Swift Edge SFE16-42-R1GM | |
| Dell Inspiron 16 7635 2-in-1 | |
| Lenovo IdeaPad Flex 5 16ABR G8 | |
| Dell Inspiron 16 7620 2-in-1 | |
| Gemiddeld AMD Ryzen 5 7530U (20155 - 42853, n=9) | |
| AIDA64 / Memory Read | |
| Samsung Galaxy Book3 Pro 16 | |
| Lenovo Yoga 7 16IRL8 | |
| Acer Swift Edge SFE16-42-R1GM | |
| Dell Inspiron 16 7620 2-in-1 | |
| Dell Inspiron 16 7635 2-in-1 | |
| Lenovo IdeaPad Flex 5 16ABR G8 | |
| Gemiddeld AMD Ryzen 5 7530U (23068 - 40270, n=9) | |
| AIDA64 / Memory Write | |
| Samsung Galaxy Book3 Pro 16 | |
| Lenovo Yoga 7 16IRL8 | |
| Acer Swift Edge SFE16-42-R1GM | |
| Dell Inspiron 16 7620 2-in-1 | |
| Dell Inspiron 16 7635 2-in-1 | |
| Lenovo IdeaPad Flex 5 16ABR G8 | |
| Gemiddeld AMD Ryzen 5 7530U (22954 - 41838, n=9) | |
| AIDA64 / Memory Latency | |
| Lenovo IdeaPad Flex 5 16ABR G8 | |
| Dell Inspiron 16 7635 2-in-1 | |
| Acer Swift Edge SFE16-42-R1GM | |
| Gemiddeld AMD Ryzen 5 7530U (88.1 - 110.8, n=9) | |
| Lenovo Yoga 7 16IRL8 | |
| Samsung Galaxy Book3 Pro 16 | |
* ... kleiner is beter
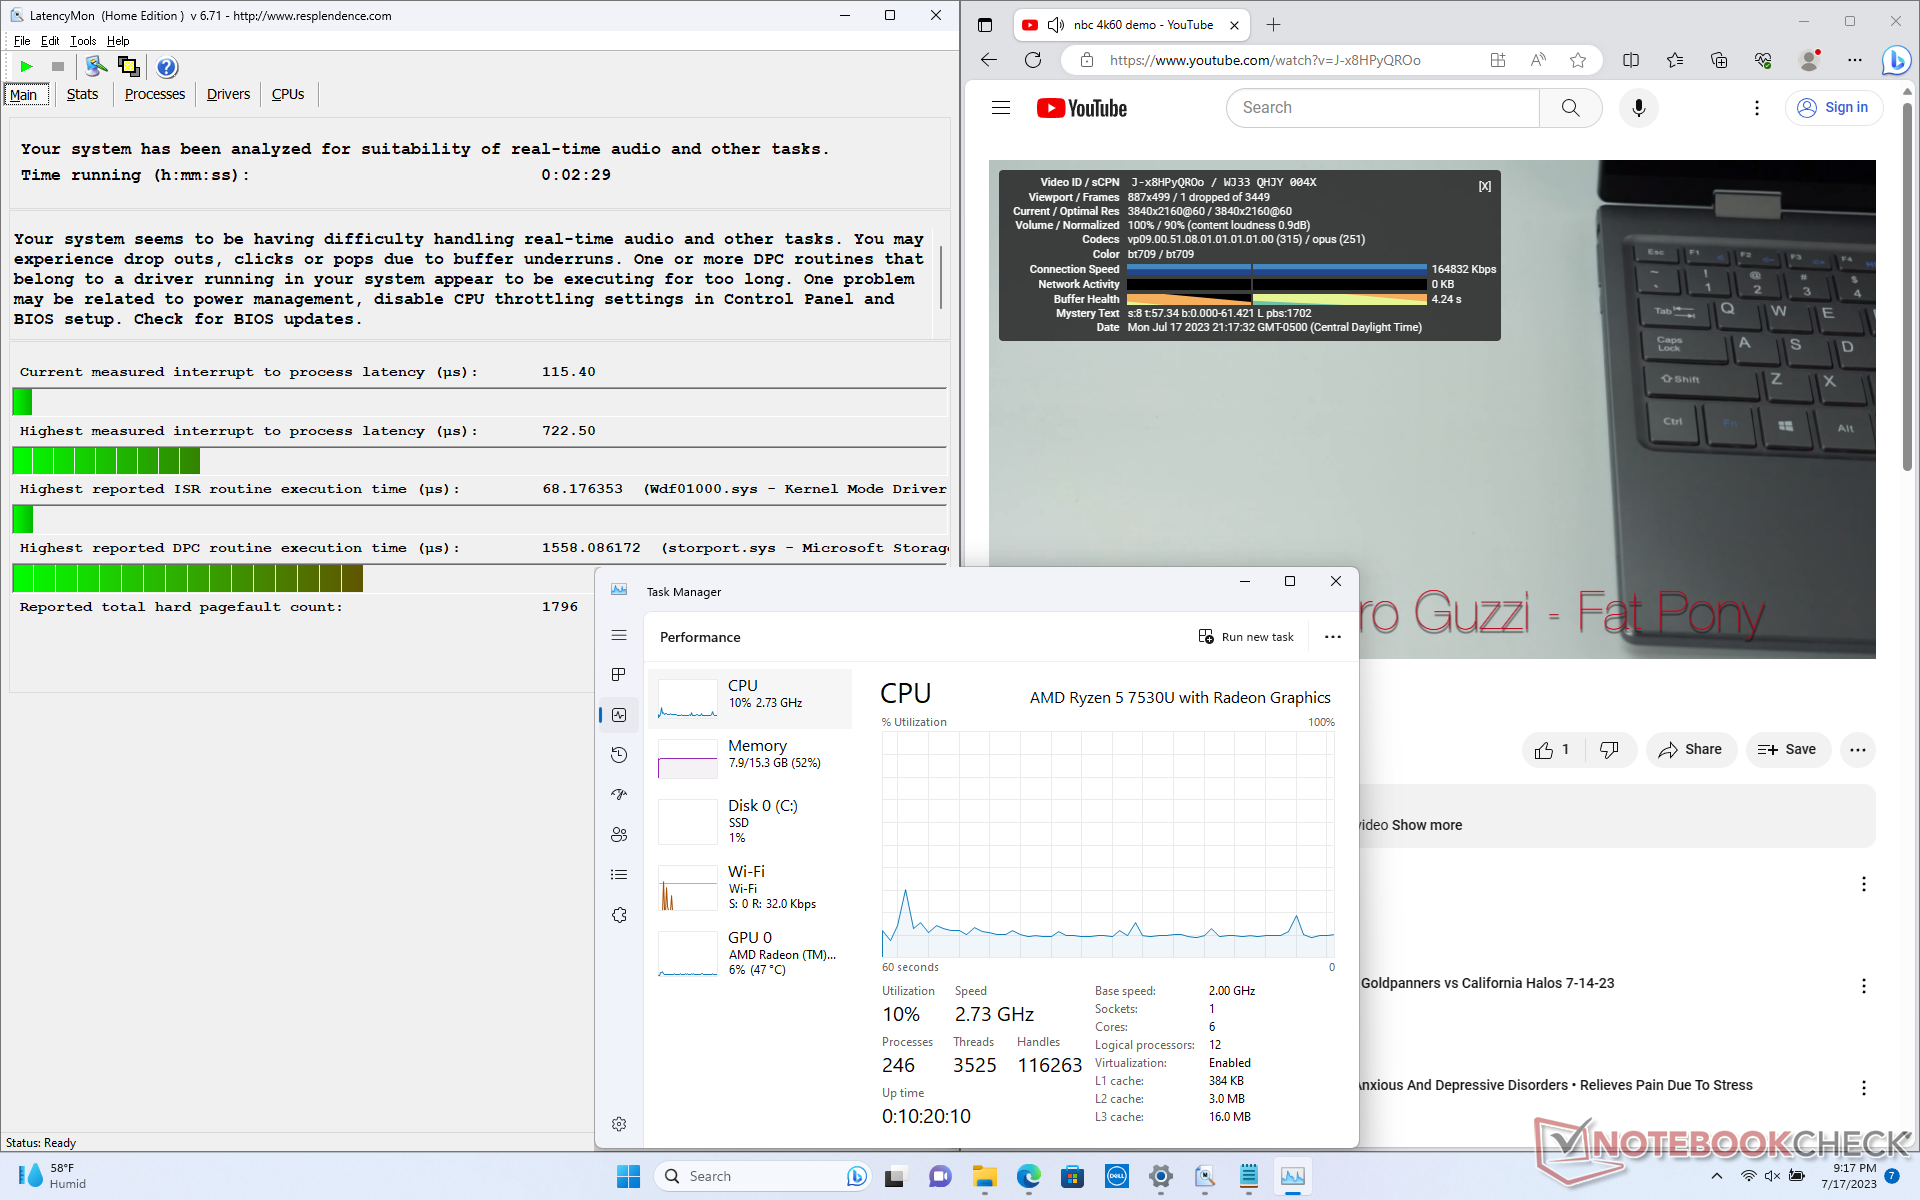
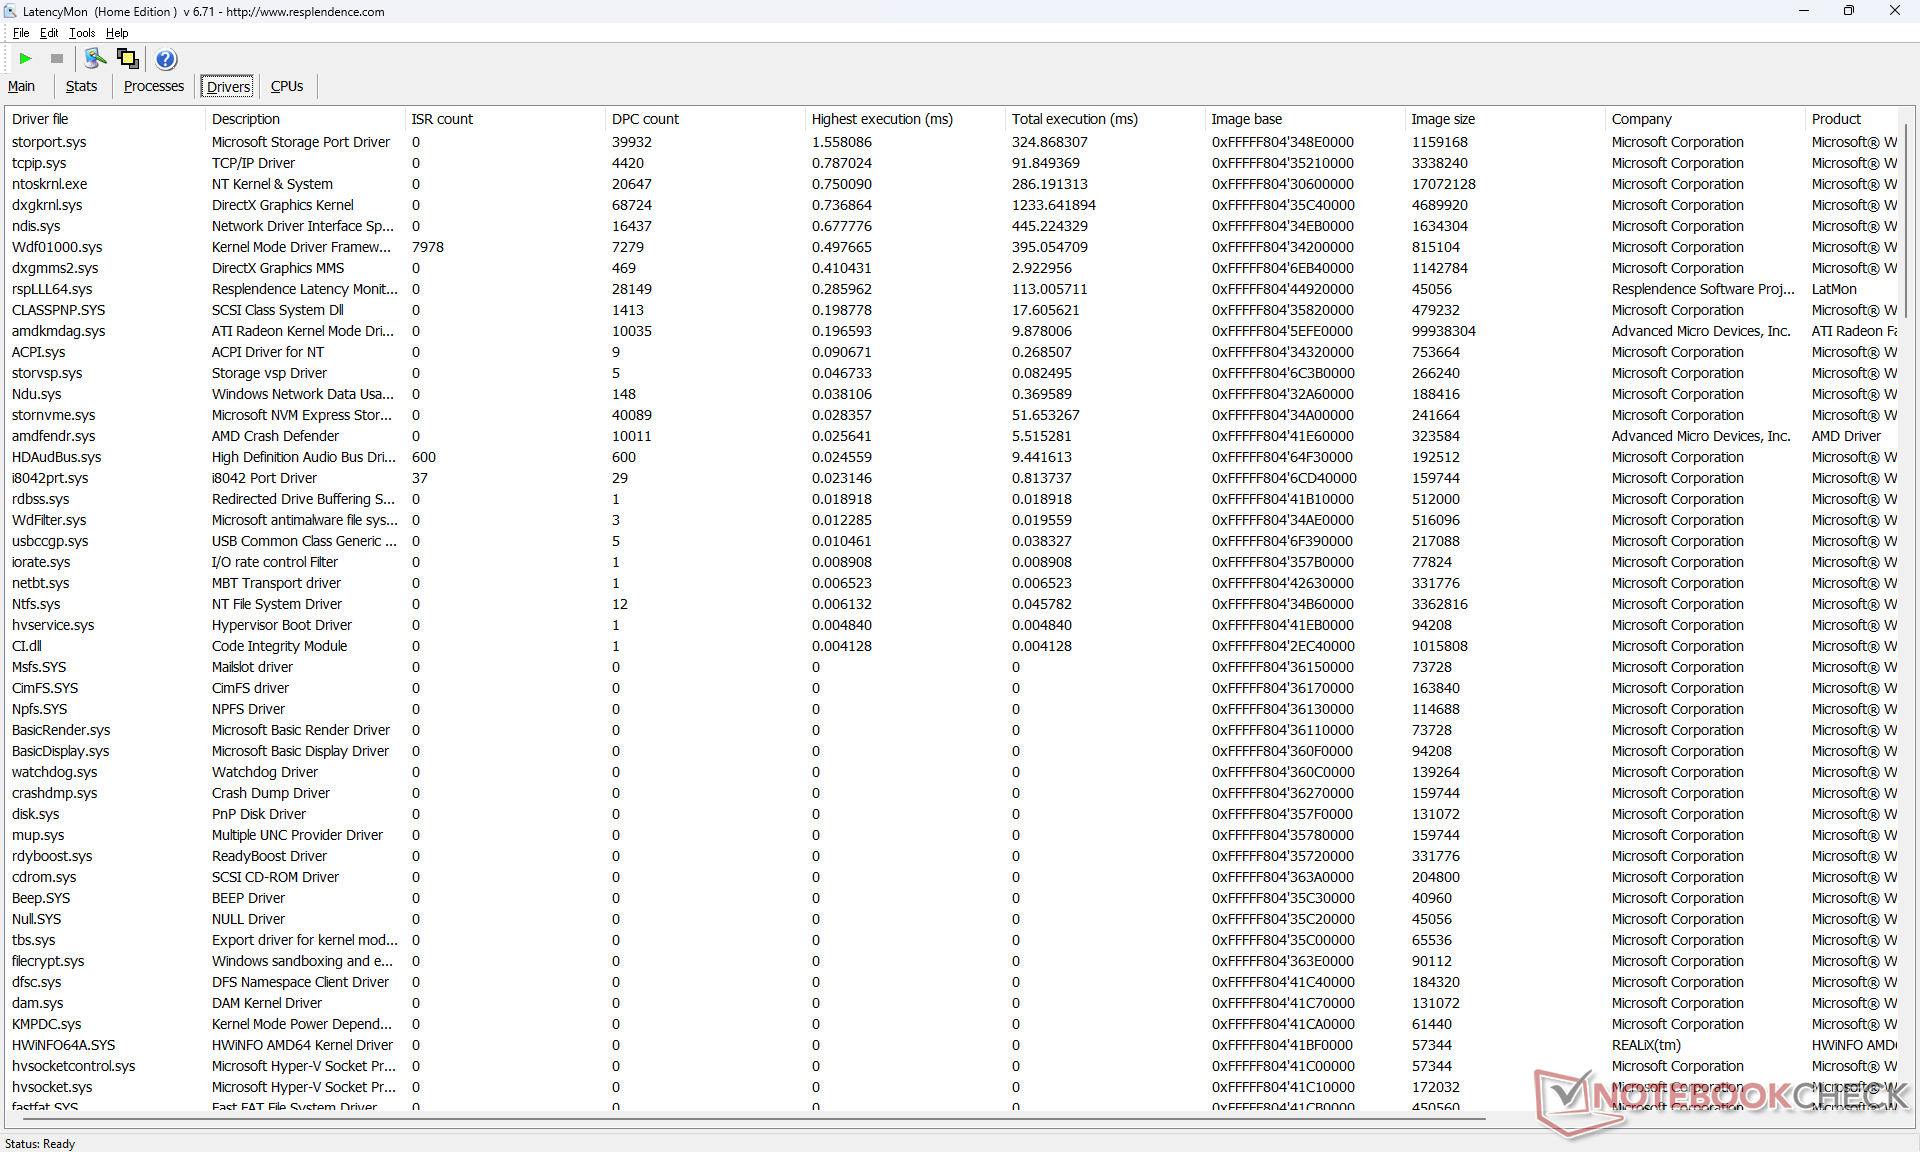
DPC latentie
LatencyMon rapporteert slechts kleine DPC-problemen bij het openen van meerdere tabbladen van onze homepage. het afspelen van 4K-video's met 60 FPS is verder uitstekend met slechts één dropped frame tijdens onze testvideo van een minuut.
| DPC Latencies / LatencyMon - interrupt to process latency (max), Web, Youtube, Prime95 | |
| Acer Swift Edge SFE16-42-R1GM | |
| Lenovo IdeaPad Flex 5 16ABR G8 | |
| Lenovo Yoga 7 16IRL8 | |
| Dell Inspiron 16 7635 2-in-1 | |
| Dell Inspiron 16 7620 2-in-1 | |
| Samsung Galaxy Book3 Pro 16 | |
* ... kleiner is beter
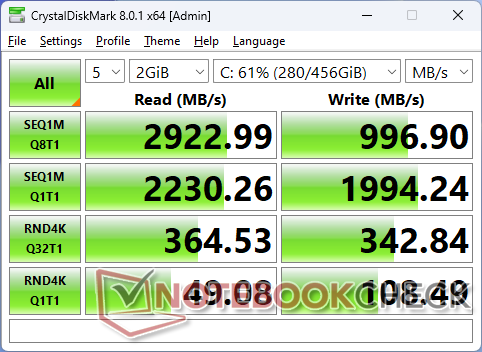
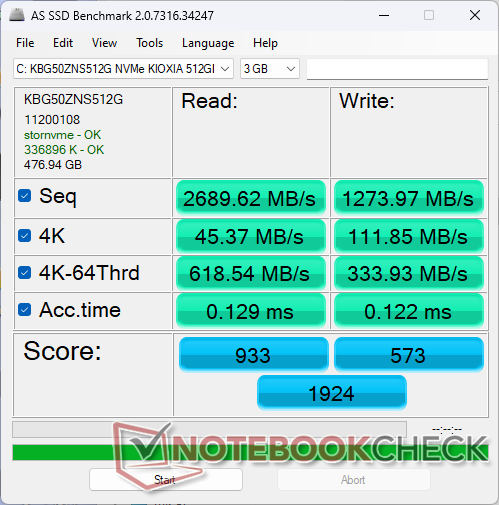
Opslagapparaten
Onze testunit wordt geleverd met een budget Kioxia KBG50ZNS512G PCIe4 x4 NVMe SSD die volgens de fabrikant maximale sequentiële lees- en schrijfsnelheden van respectievelijk 3500 MB/s en 2700 MB/s biedt. In onze stresstests zijn we echter slechts in staat om iets meer dan 2200 MB/s te halen, zelfs na meerdere hertests, wat suggereert dat de schijf problemen kan hebben om de maximale overdrachtsnelheden voor langere perioden vast te houden. Desalniettemin is dit over het algemeen geen probleem voor de meeste multimediascenario's en dagelijkse browserwerkzaamheden.

| Drive Performance rating - Percent | |
| Acer Swift Edge SFE16-42-R1GM | |
| Lenovo Yoga 7 16IRL8 | |
| Samsung Galaxy Book3 Pro 16 | |
| Lenovo IdeaPad Flex 5 16ABR G8 | |
| Dell Inspiron 16 7635 2-in-1 | |
| Dell Inspiron 16 7620 2-in-1 | |
* ... kleiner is beter
Disk Throttling: DiskSpd Read Loop, Queue Depth 8
GPU-prestaties
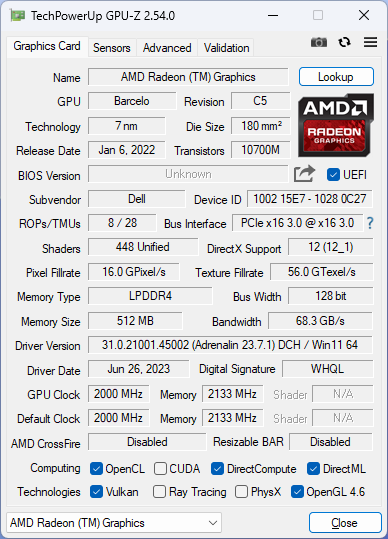
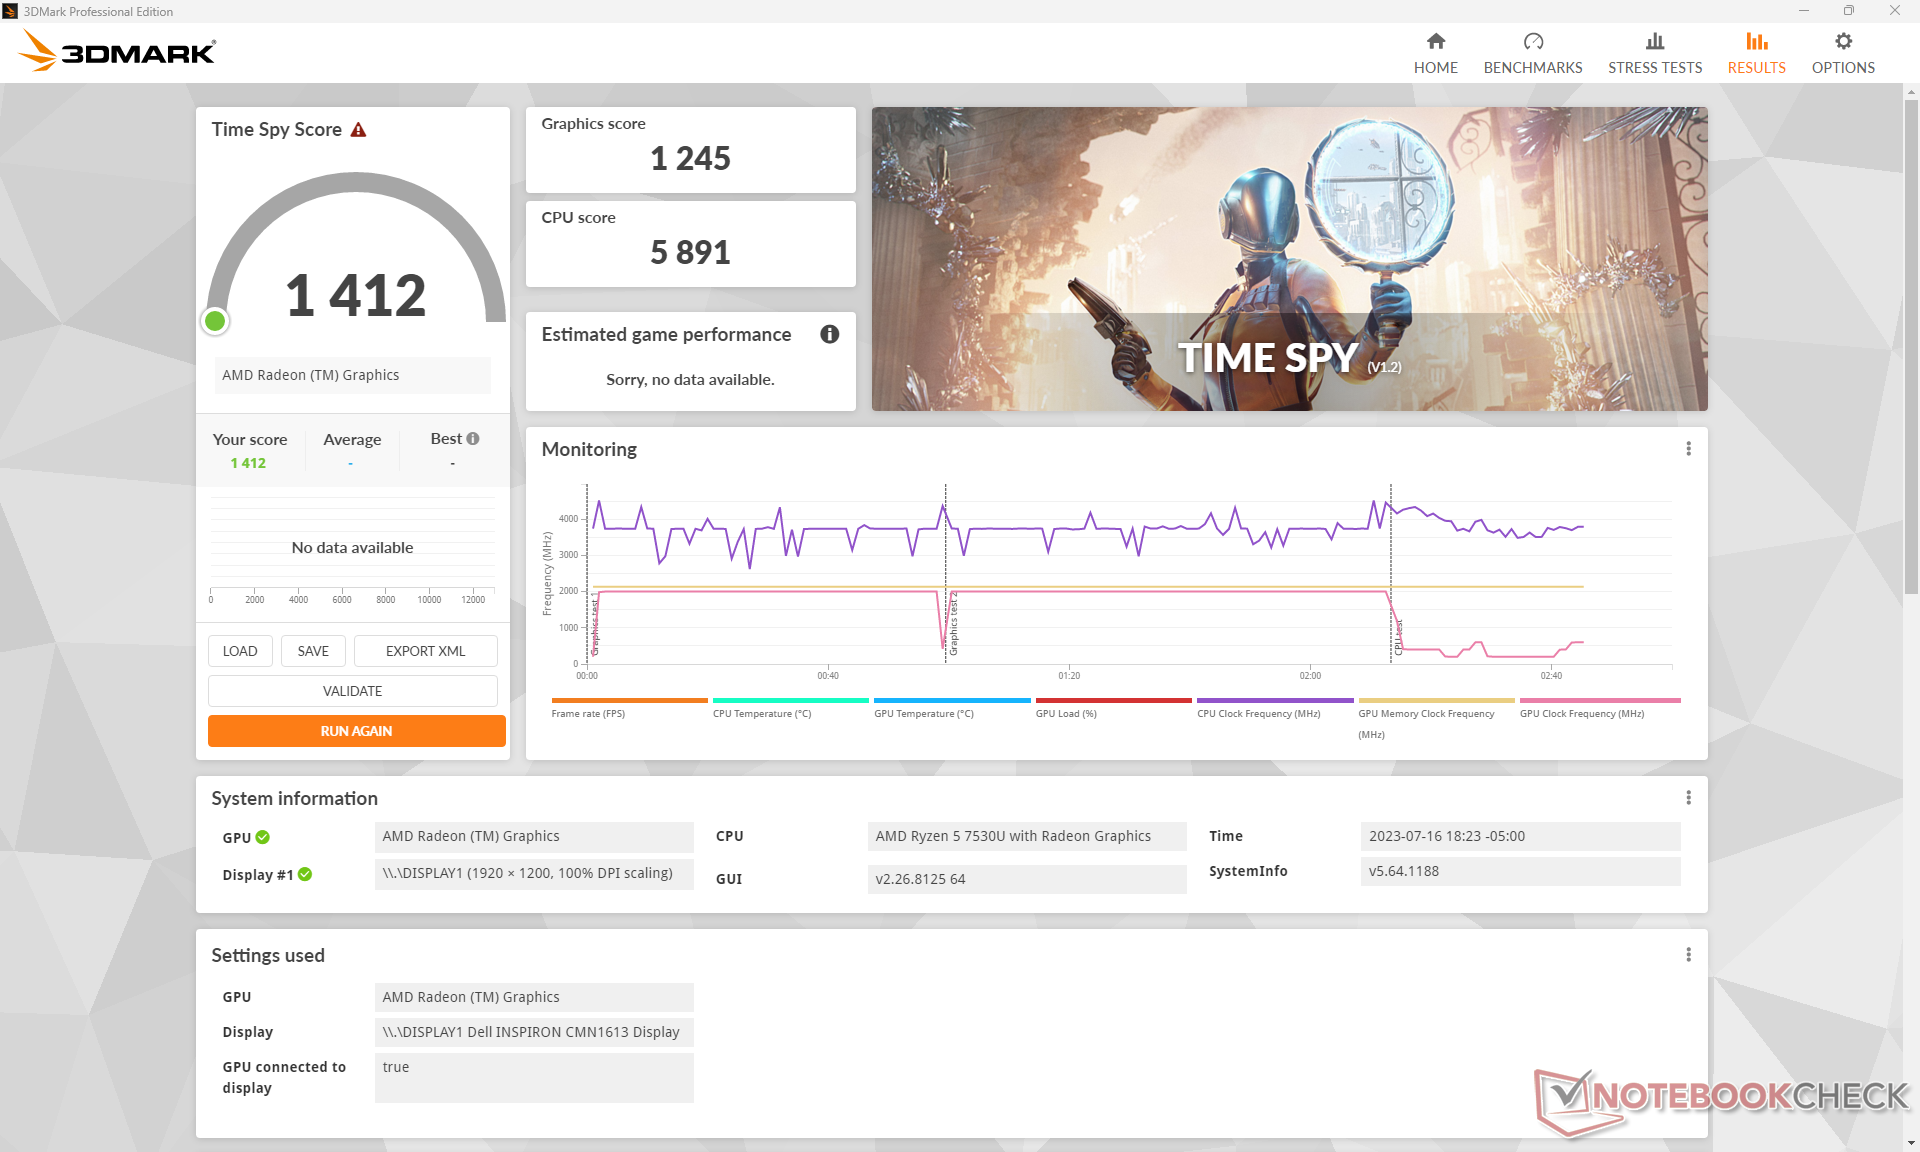
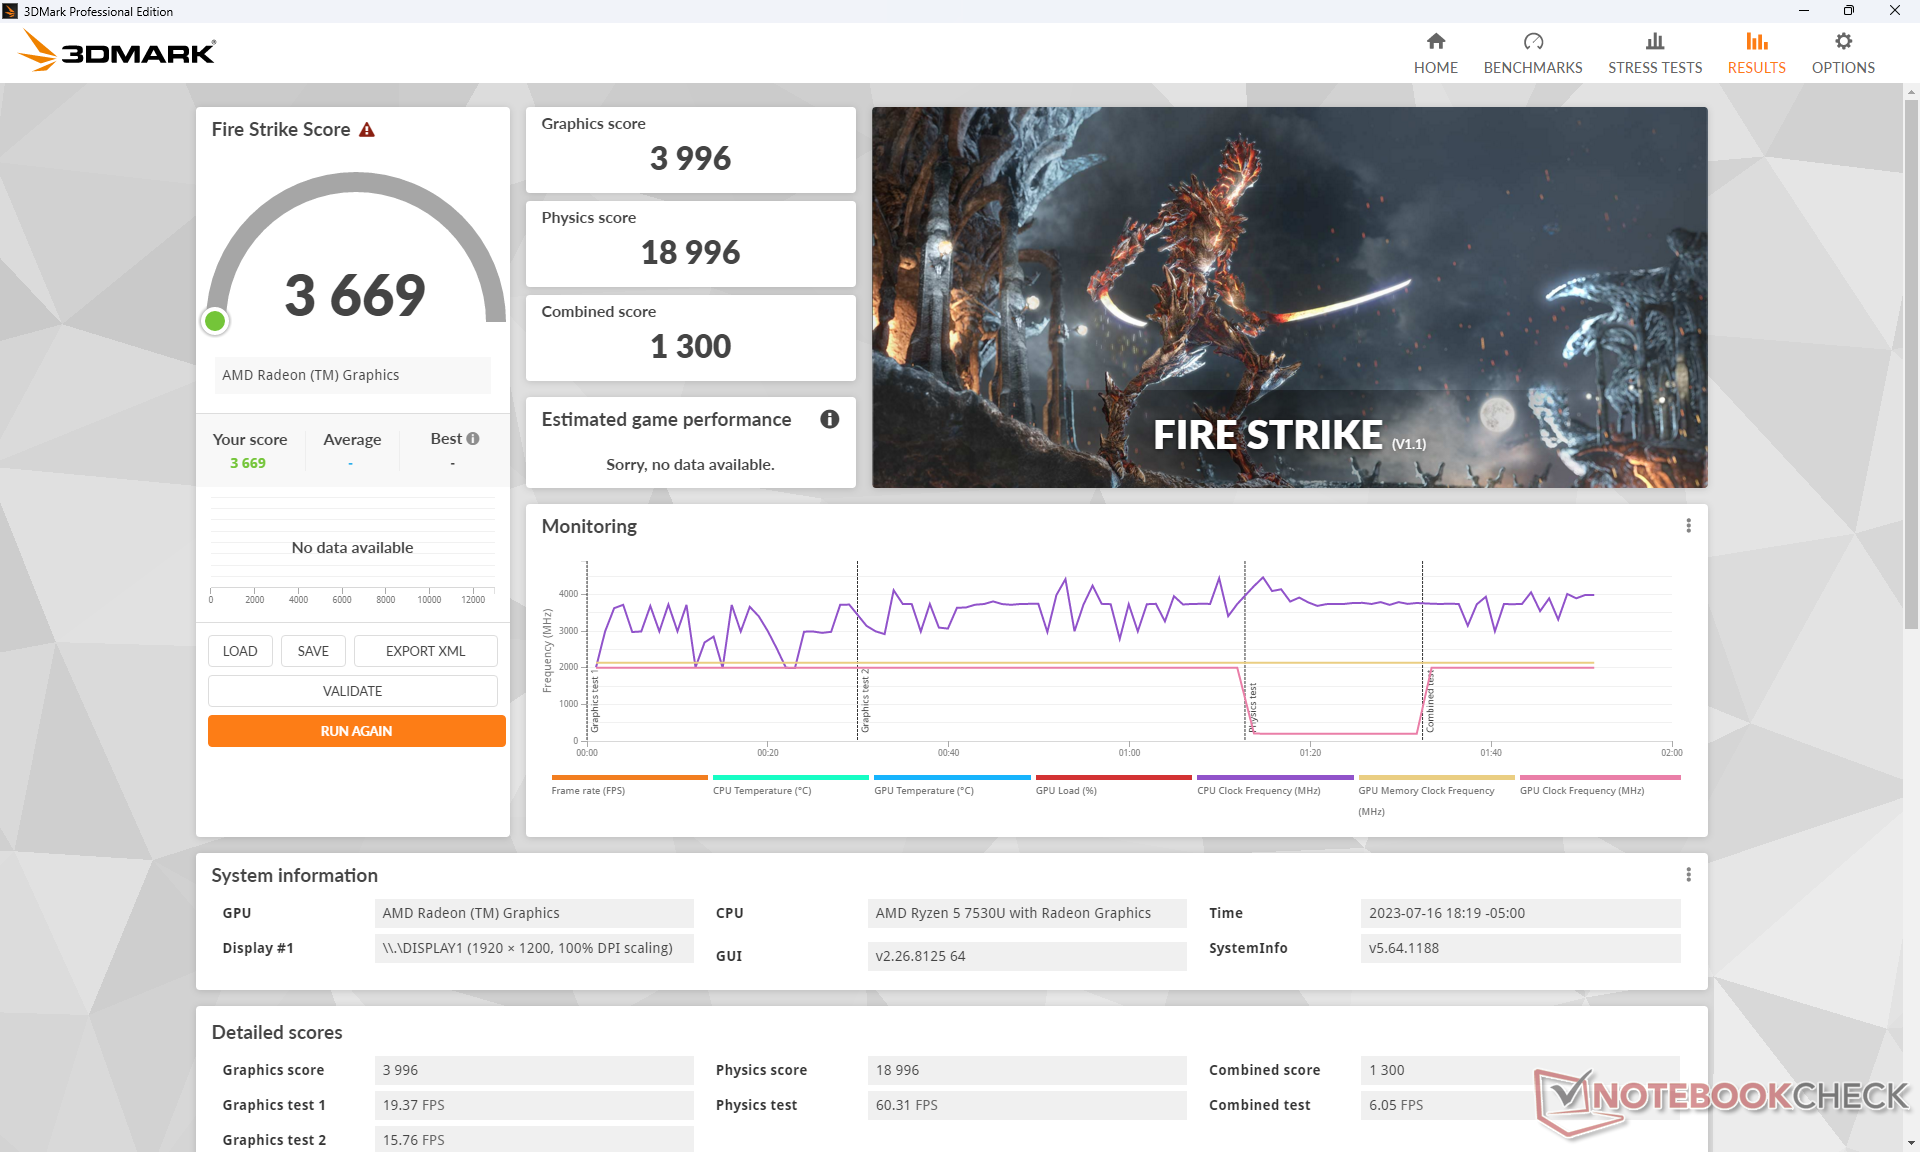
Als Zen 3-processor maakt de Ryzen 5 7530U gebruik van de oudere Radeon RX Vega 7 in plaats van de nieuwere Radeon 680M of 780M zoals die te vinden zijn op respectievelijk Zen 3+ en Zen 4 processors. Dit is jammer, want de Radeon 680M zou de grafische prestaties aanzienlijk hebben verbeterd met 70 tot 80 procent om sneller te zijn dan elke huidige Intel Iris Xe oplossing. In plaats daarvan liggen de algemene grafische prestaties ruwweg 25 procent achter op de verouderende Iris Xe 96 EU's. We verwachten dat de prestaties nog lager zullen zijn als het systeem wordt geconfigureerd met slechts 8 GB gesoldeerd RAM.
Upgraden naar de Radeon RX Vega 8 in de high-end Ryzen 7 7730U configuratie zal de grafische prestaties naar verwachting slechts marginaal verbeteren met 5 procent.
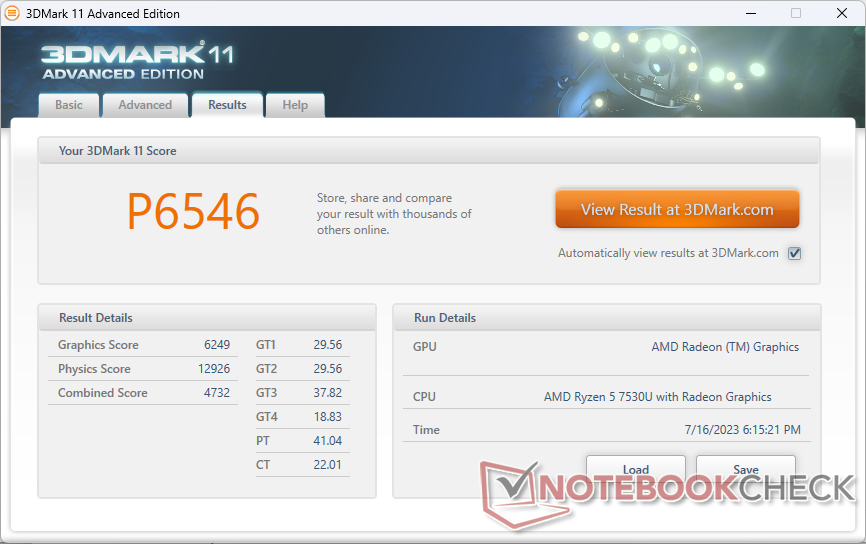
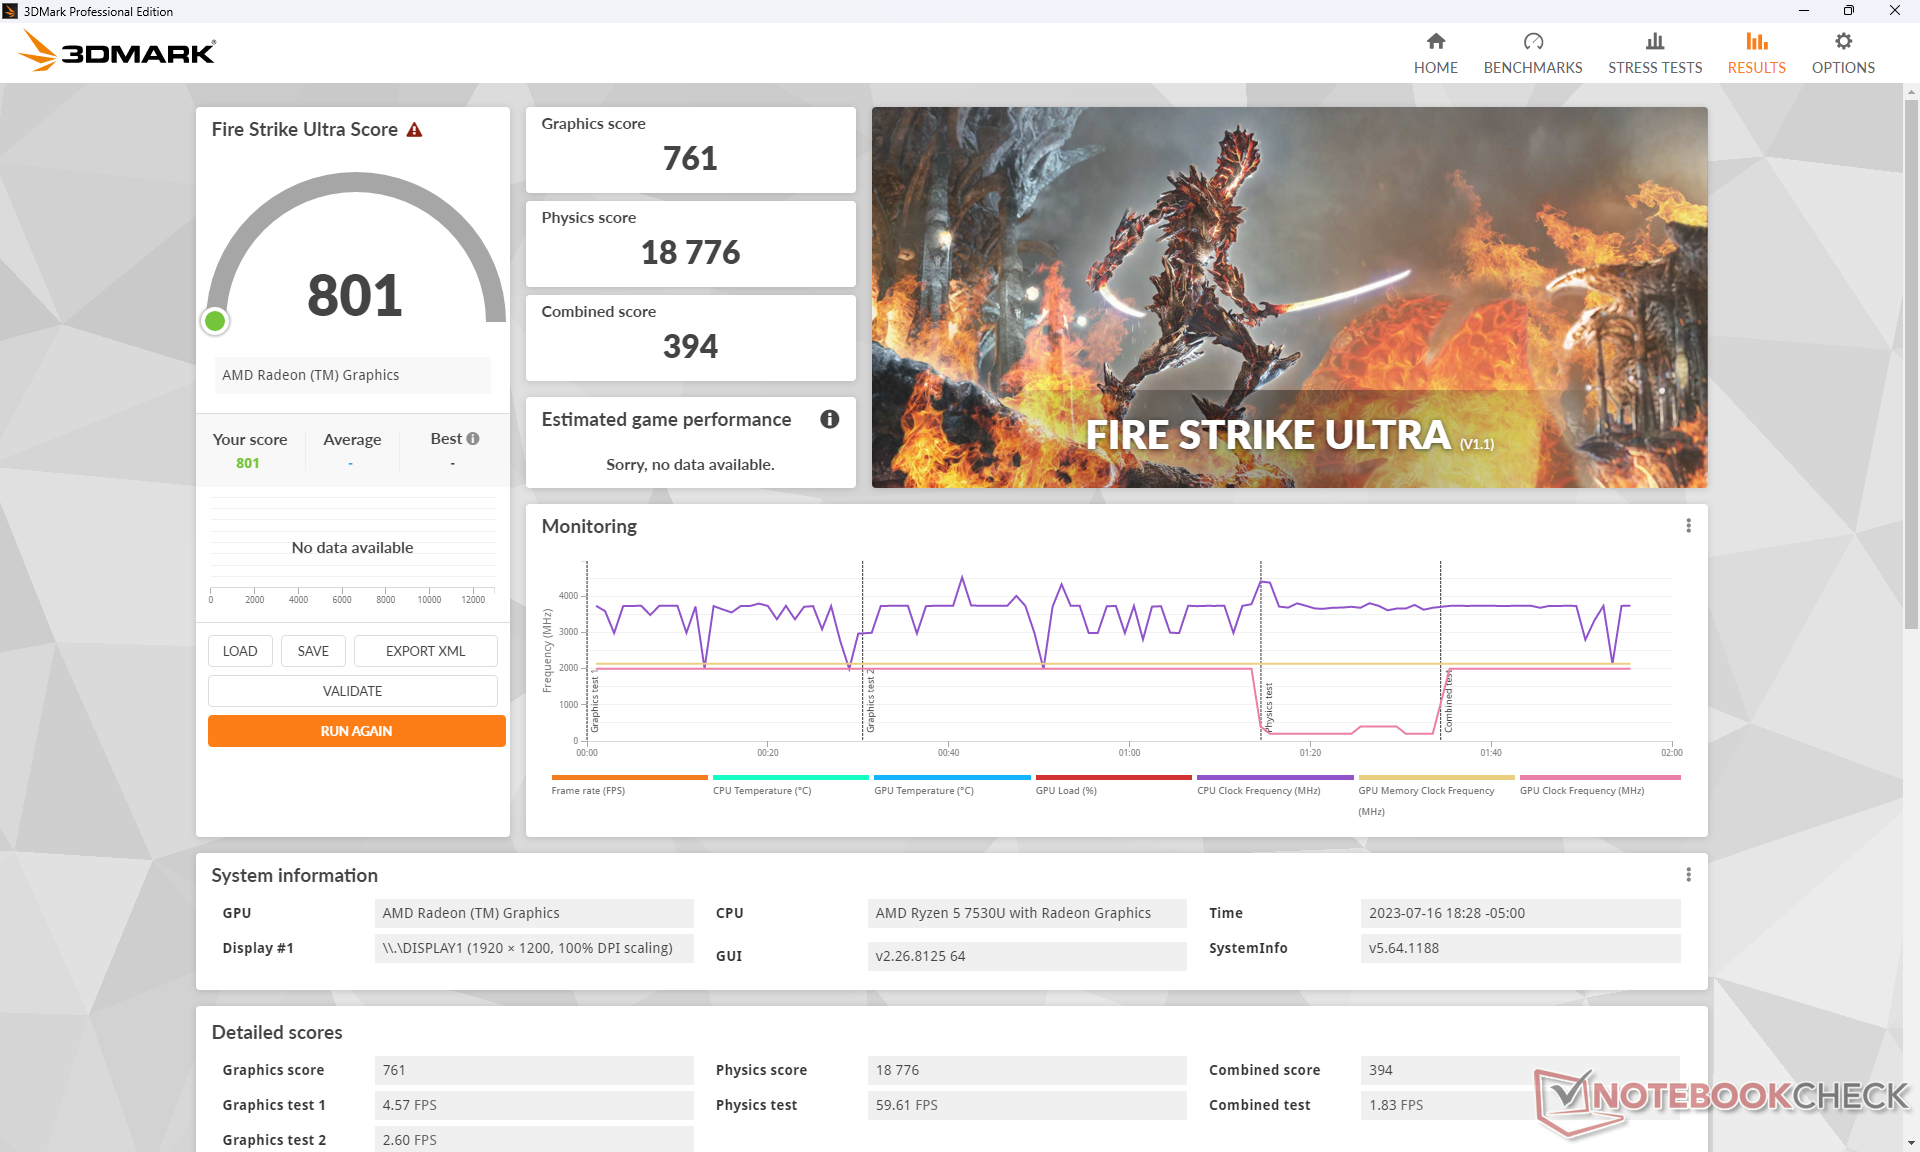
| 3DMark 11 Performance | 6546 punten | |
| 3DMark Fire Strike Score | 3669 punten | |
| 3DMark Time Spy Score | 1412 punten | |
Help | ||
* ... kleiner is beter
| Returnal | |
| 1280x720 Low Preset | |
| Beelink GTR7 7840HS | |
| Dell Inspiron 16 7635 2-in-1 | |
| Gemiddeld AMD Radeon RX Vega 7 (18 - 18, n=2) | |
| 1920x1080 Low Preset | |
| Beelink GTR7 7840HS | |
| Dell Inspiron 16 7635 2-in-1 | |
| Gemiddeld AMD Radeon RX Vega 7 (12 - 13, n=2) | |
| 1920x1080 Medium Preset | |
| Beelink GTR7 7840HS | |
| Dell Inspiron 16 7635 2-in-1 | |
| Gemiddeld AMD Radeon RX Vega 7 (11 - 12, n=2) | |
Framerates bij stationair draaien op Witcher 3 af en toe maar consistent met bijna 15 FPS gedurende korte perioden voordat ze weer normaal werden. Dit gedrag is ongunstig omdat het duidt op problemen met het grafische stuurprogramma of onderbreking van achtergrondactiviteiten op OS-niveau.
Witcher 3 FPS Chart
| lage | gem. | hoge | ultra | |
|---|---|---|---|---|
| GTA V (2015) | 24.1 | 9.55 | ||
| The Witcher 3 (2015) | 79.6 | 24.5 | 15.7 | |
| Dota 2 Reborn (2015) | 109 | 90.7 | 55.4 | 52.4 |
| Final Fantasy XV Benchmark (2018) | 37.5 | 18.8 | 12.9 | |
| X-Plane 11.11 (2018) | 38.4 | 30.4 | 26.3 | |
| Strange Brigade (2018) | 86.8 | 33.8 | 28.1 | 23.2 |
| Cyberpunk 2077 1.6 (2022) | 20.3 | 15.3 | 10.5 | 8.5 |
| Tiny Tina's Wonderlands (2022) | 28.8 | 21.2 | 12.9 | 9.2 |
| F1 22 (2022) | 36.2 | 32.3 | 23.9 | 17.1 |
| Returnal (2023) | 13 | 12 |
Uitstoot
Systeemgeluid
De ventilator is over het algemeen stil tijdens lage belastingen zoals browsen of videostreaming, waar hij rond de 27 dB(A) schommelt tegen een stille achtergrond van 23,6 dB(A). Bij zwaardere belastingen, zoals 3DMark 06, springt het geluid van de ventilator echter snel naar iets meer dan 40 dB(A), zelfs bij het gebalanceerde stroomprofiel. We zijn in staat om een maximaal ventilatorgeluid van iets meer dan 44 dB(A) te registreren bij het uitvoeren van hoge belastingen zoals games, zelfs luider dan wat we registreerden op de oudereInspiron 16 7620 2-in-1.
Geluidsniveau
| Onbelast |
| 23.6 / 23.6 / 23.6 dB (A) |
| Belasting |
| 40.3 / 44.2 dB (A) |
 | ||
30 dB stil 40 dB(A) hoorbaar 50 dB(A) luid |
||
min: | ||
| Dell Inspiron 16 7635 2-in-1 Vega 7, R5 7530U, Kioxia BG5 KBG50ZNS512G | Acer Swift Edge SFE16-42-R1GM Radeon 680M, R7 7735U, Micron 3400 1TB MTFDKBA1T0TFH | Lenovo Yoga 7 16IRL8 Iris Xe G7 96EUs, i7-1355U, WD PC SN740 512GB SDDPMQD-512G-1101 | Samsung Galaxy Book3 Pro 16 Iris Xe G7 80EUs, i5-1340P, WD PC SN740 256GB SDDPNQD-256G | Lenovo IdeaPad Flex 5 16ABR G8 Vega 8, R7 7730U, Samsung PM9B1 1024GB MZAL41T0HBLB | Dell Inspiron 16 7620 2-in-1 Iris Xe G7 96EUs, i7-1260P, Toshiba KBG40ZNS512G NVMe | |
|---|---|---|---|---|---|---|
| Noise | -10% | -0% | -11% | -0% | 8% | |
| uit / omgeving * (dB) | 23.6 | 25.7 -9% | 22.8 3% | 25.2 -7% | 24.2 -3% | 23.2 2% |
| Idle Minimum * (dB) | 23.6 | 25.7 -9% | 22.9 3% | 25.2 -7% | 24.2 -3% | 23.5 -0% |
| Idle Average * (dB) | 23.6 | 27 -14% | 22.9 3% | 25.2 -7% | 24.2 -3% | 23.5 -0% |
| Idle Maximum * (dB) | 23.6 | 29.3 -24% | 26.9 -14% | 29.3 -24% | 28.7 -22% | 23.5 -0% |
| Load Average * (dB) | 40.3 | 42.3 -5% | 41.7 -3% | 46.4 -15% | 33.1 18% | 29.4 27% |
| Witcher 3 ultra * (dB) | 44.2 | 41.5 6% | 41.8 5% | 35.6 19% | ||
| Load Maximum * (dB) | 44.2 | 42.7 3% | 43.6 1% | 46.4 -5% | 41.8 5% | 39.7 10% |
* ... kleiner is beter
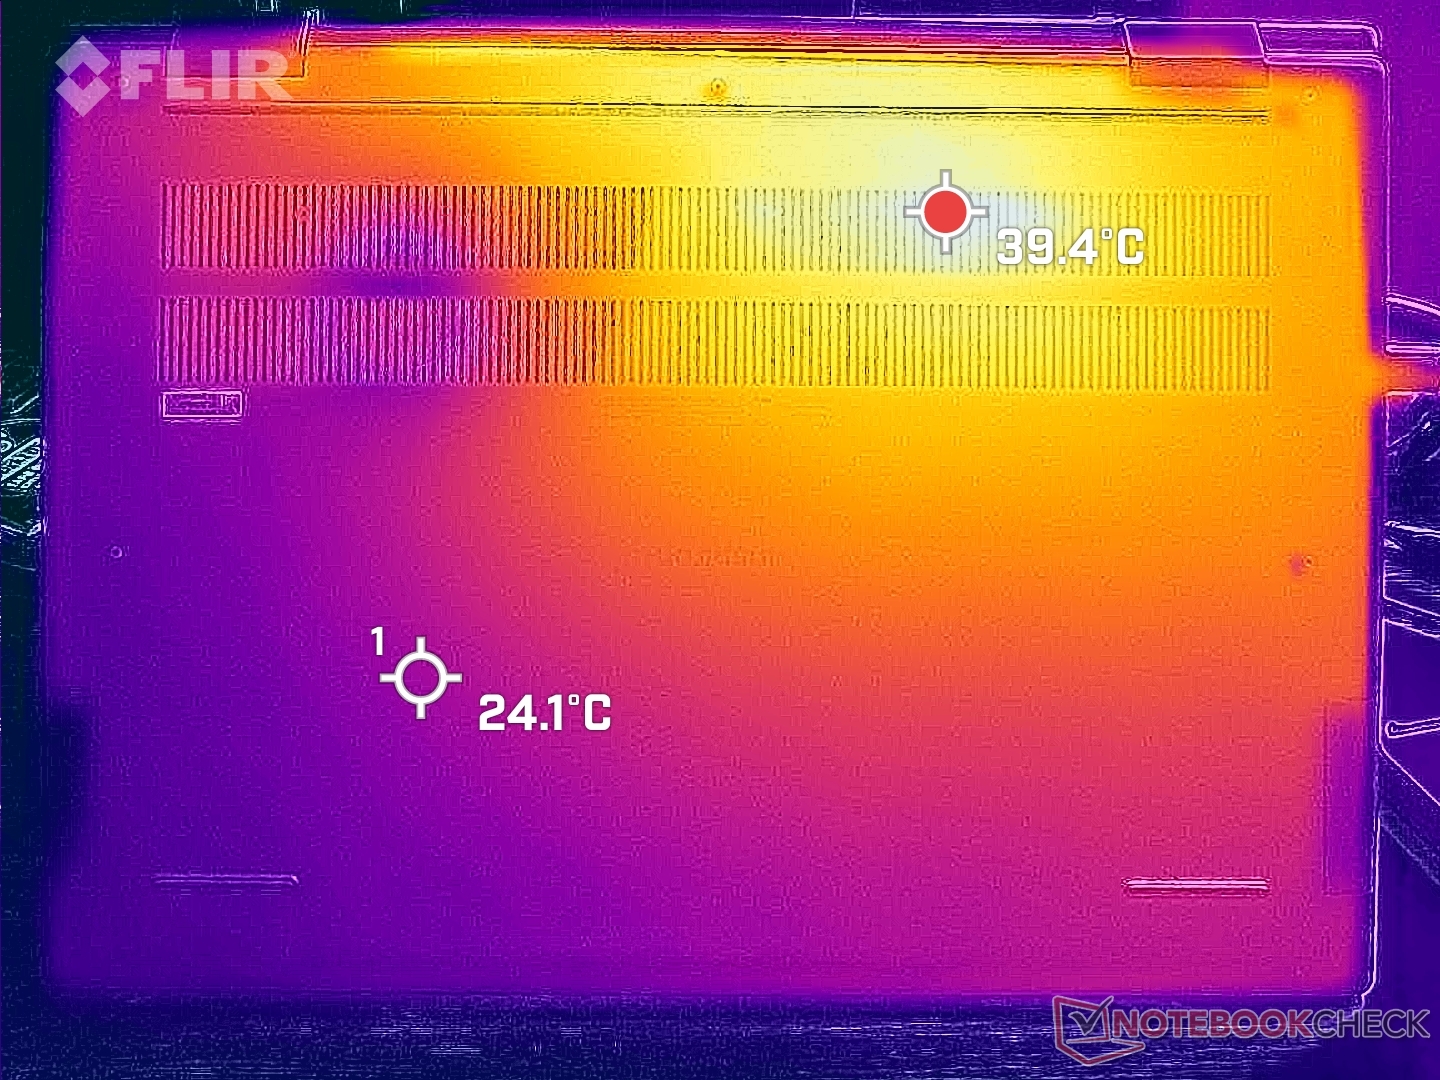
Temperatuur
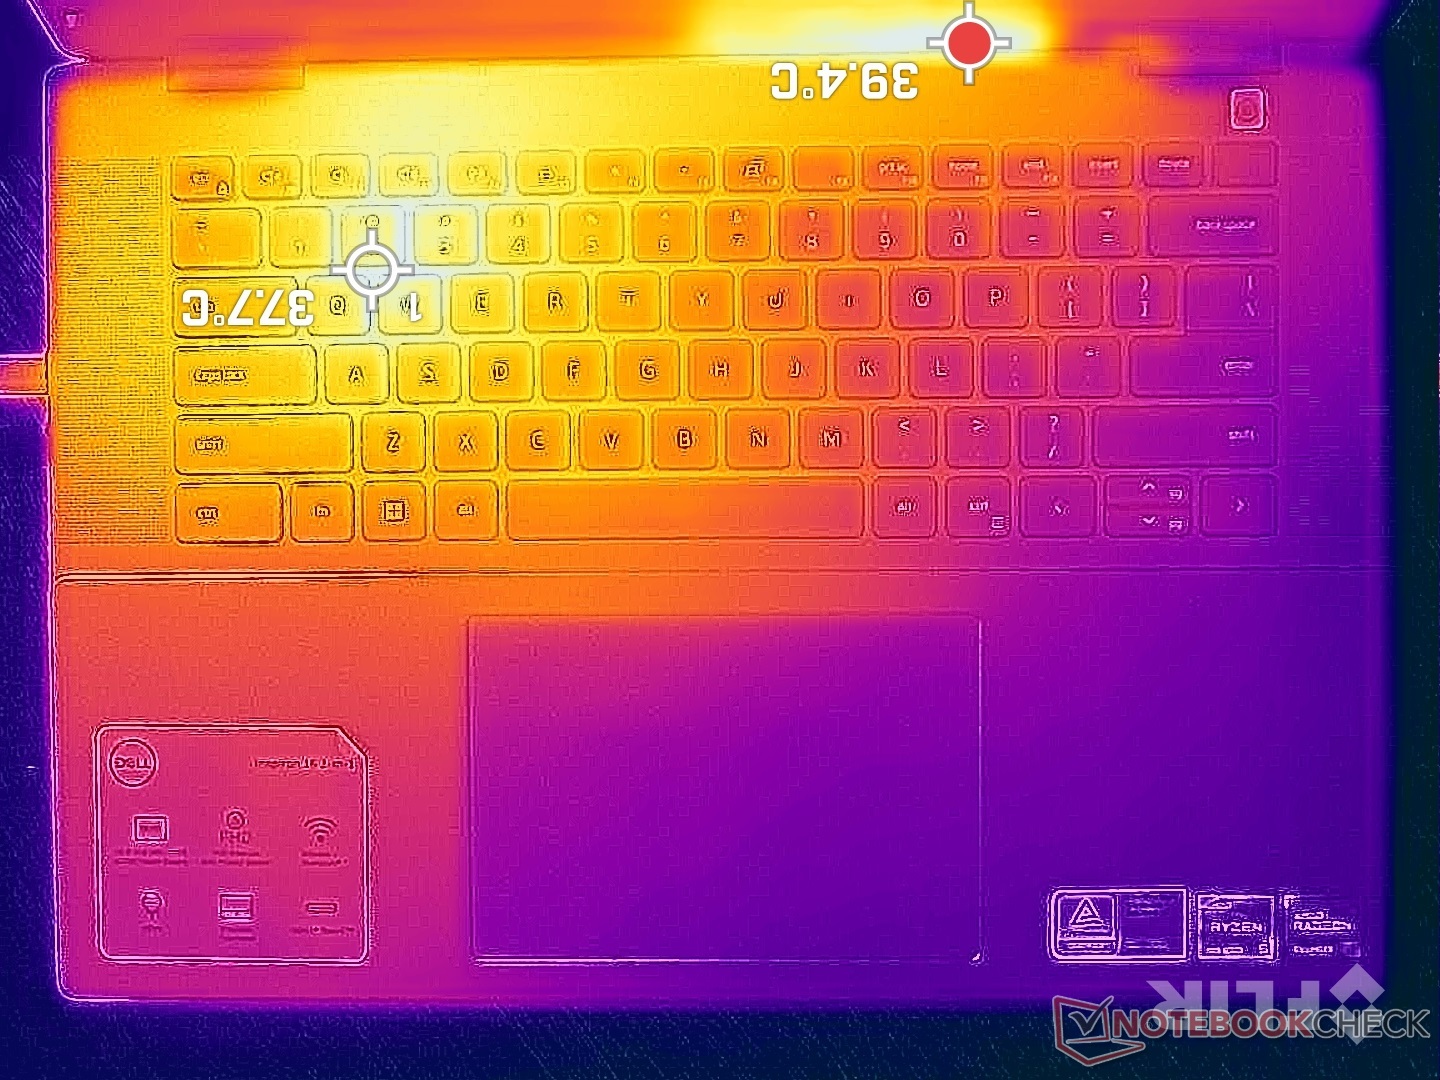
De oppervlaktetemperaturen zijn het warmst op de linkerhelft van het toetsenbord in plaats van in het midden, omdat de plaatsing van de processor is veranderd ten opzichte van het ontwerp van vorig jaar. Hete plekken kunnen oplopen tot iets meer dan 40 C op de bovenste en onderste oppervlakken, wat nog steeds merkbaar koeler is dan op deIdeaPad Flex 5 16 of oudere Inspiron 16 7620 2-in-1 waar de oppervlaktetemperaturen onder belasting kunnen oplopen tot dichter bij 50 C. Het over het algemeen hardere ventilatorgeluid van de Inspiron 16 7635 2-in-1 kan gedeeltelijk verantwoordelijk zijn voor de koelere oppervlaktetemperaturen.
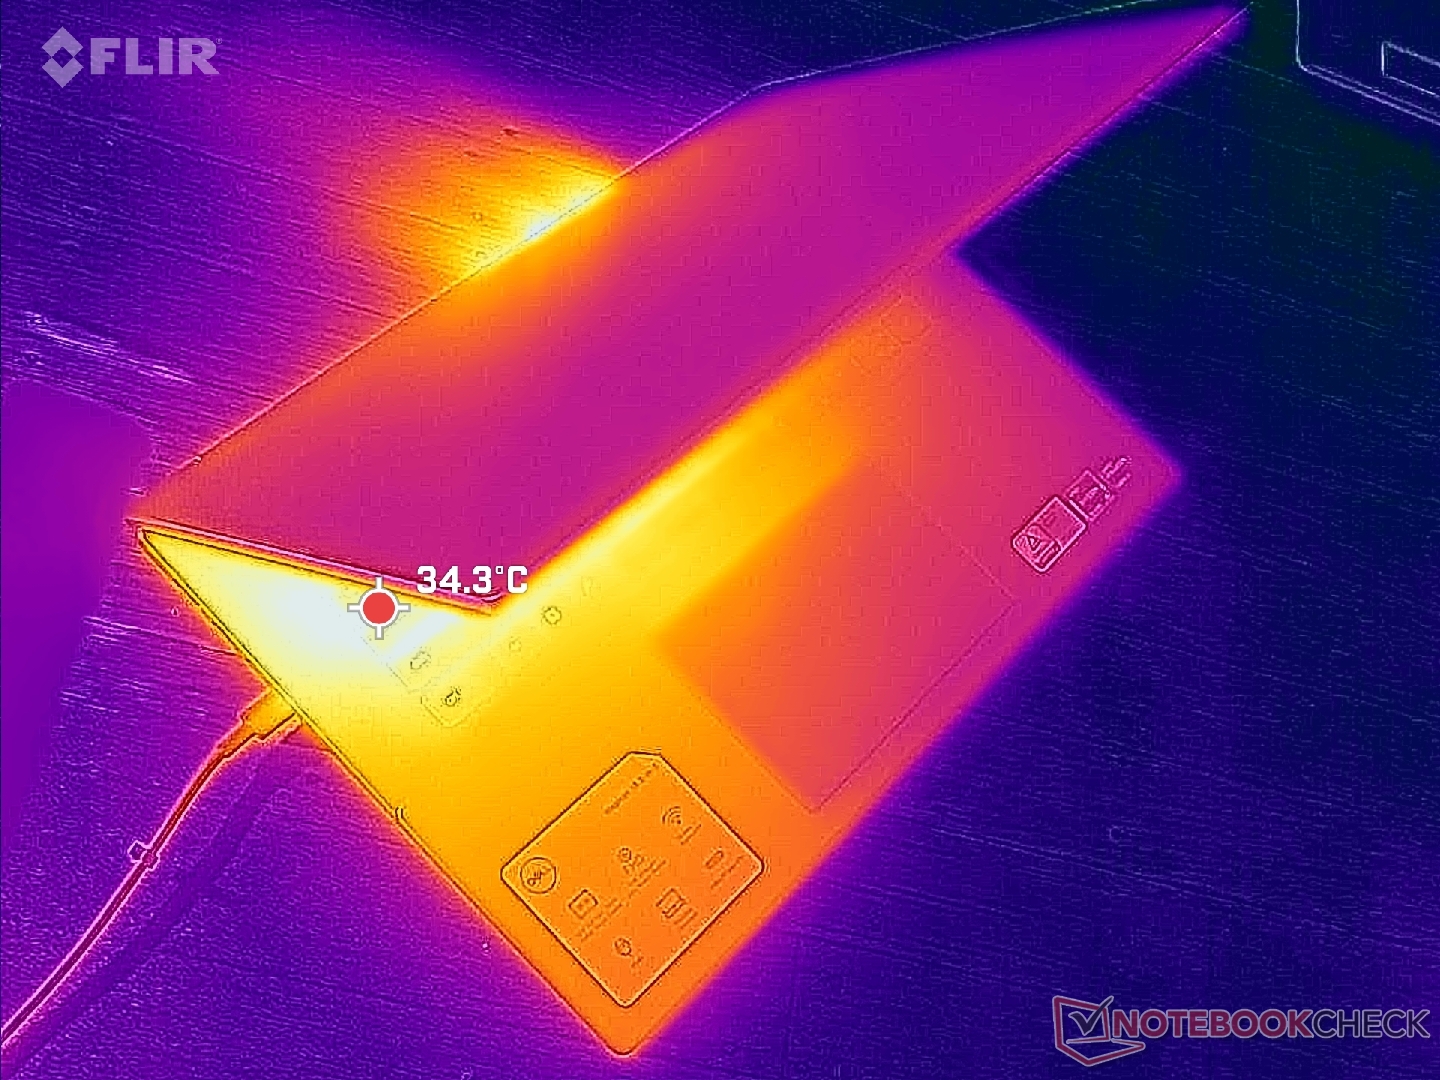
(±) De maximumtemperatuur aan de bovenzijde bedraagt 41.6 °C / 107 F, vergeleken met het gemiddelde van 35.4 °C / 96 F, variërend van 19.6 tot 60 °C voor de klasse Convertible.
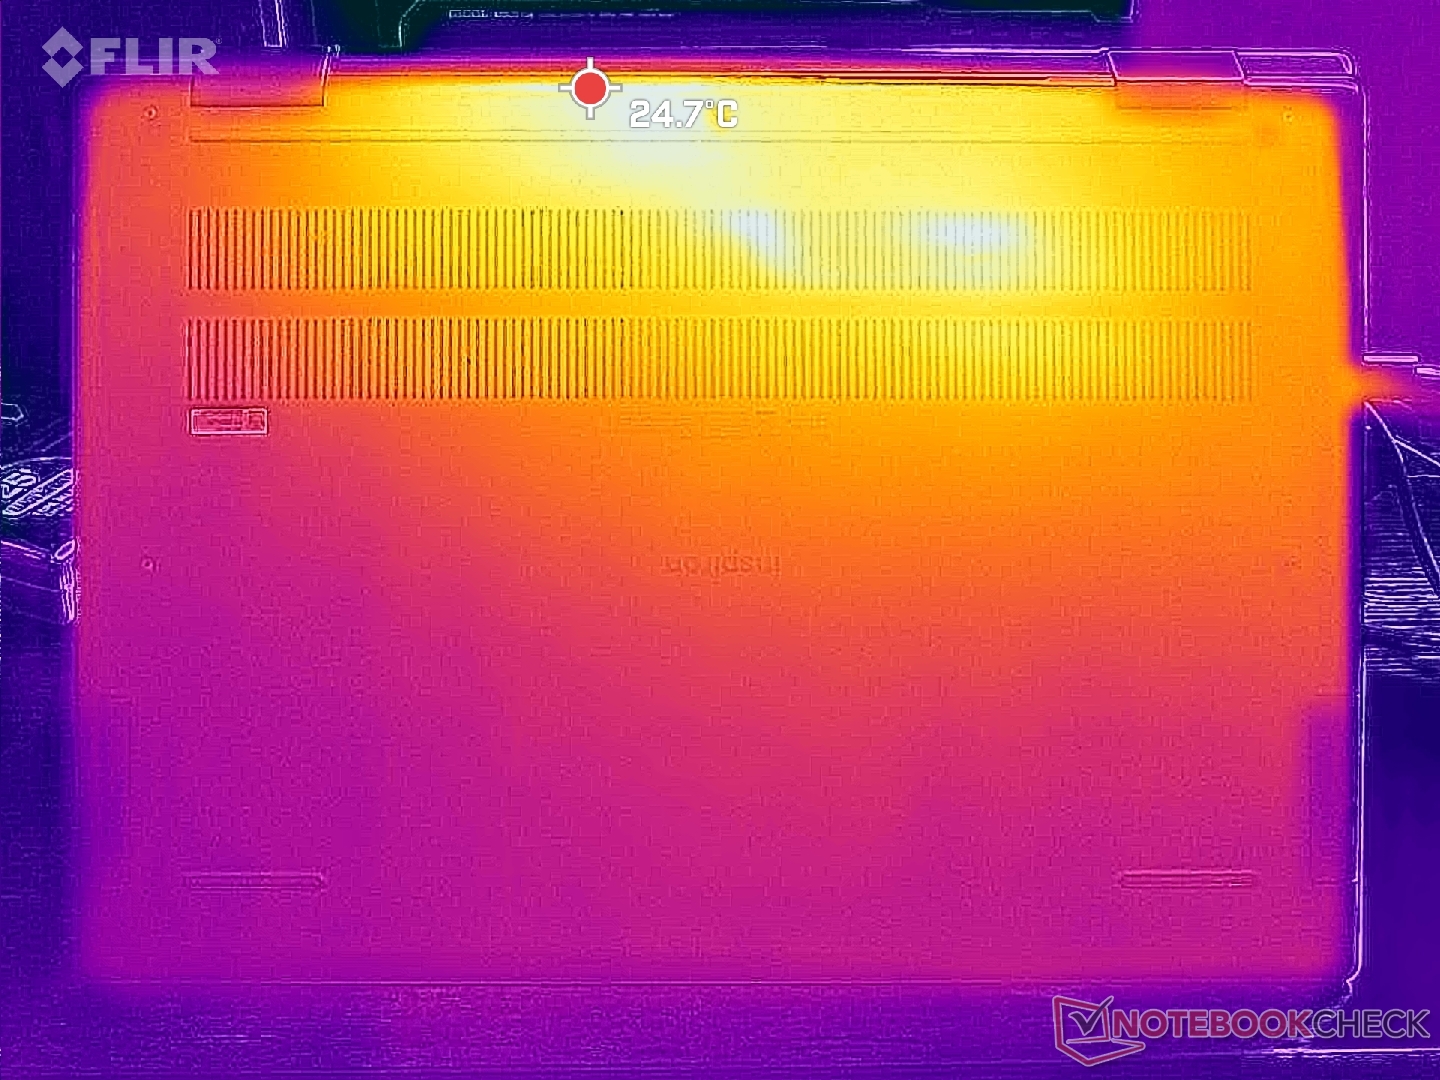
(+) De bodem warmt op tot een maximum van 39 °C / 102 F, vergeleken met een gemiddelde van 36.9 °C / 98 F
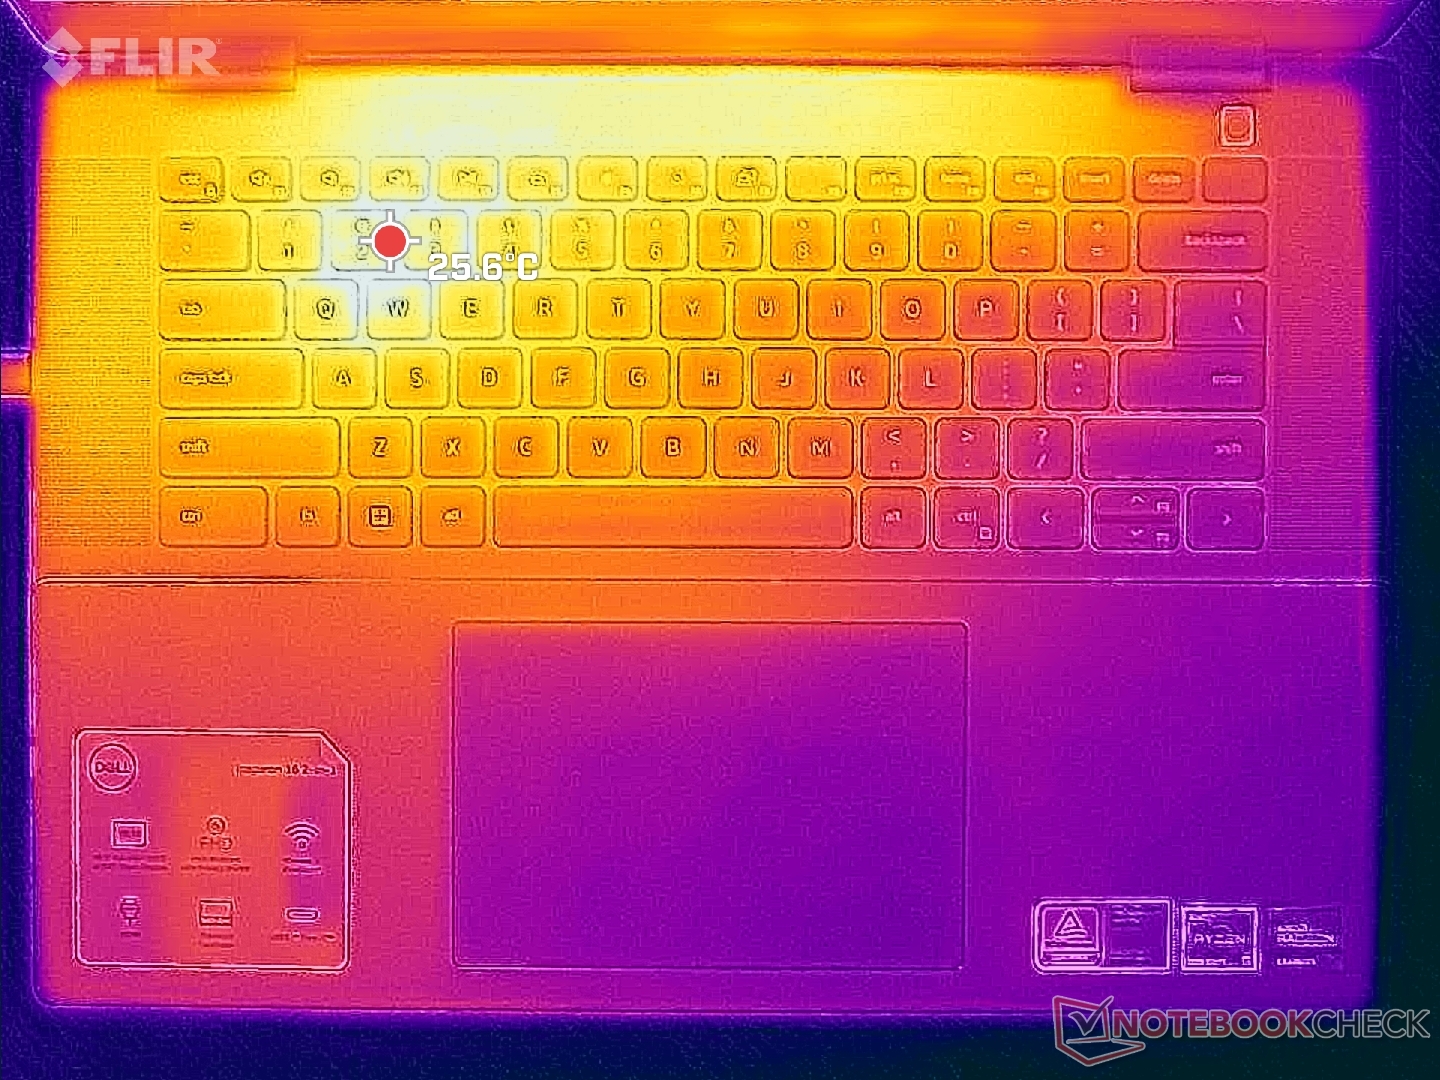
(+) Bij onbelast gebruik bedraagt de gemiddelde temperatuur voor de bovenzijde 25.8 °C / 78 F, vergeleken met het apparaatgemiddelde van 30.3 °C / 87 F.
(+) De palmsteunen en het touchpad zijn met een maximum van ###max## °C / 88.5 F koeler dan de huidtemperatuur en voelen daarom koel aan.
(-) De gemiddelde temperatuur van de handpalmsteun van soortgelijke toestellen bedroeg 28 °C / 82.4 F (-3.4 °C / -6.1 F).
| Dell Inspiron 16 7635 2-in-1 AMD Ryzen 5 7530U, AMD Radeon RX Vega 7 | Acer Swift Edge SFE16-42-R1GM AMD Ryzen 7 7735U, AMD Radeon 680M | Lenovo Yoga 7 16IRL8 Intel Core i7-1355U, Intel Iris Xe Graphics G7 96EUs | Samsung Galaxy Book3 Pro 16 Intel Core i5-1340P, Intel Iris Xe Graphics G7 80EUs | Lenovo IdeaPad Flex 5 16ABR G8 AMD Ryzen 7 7730U, AMD Radeon RX Vega 8 (Ryzen 4000/5000) | Dell Inspiron 16 7620 2-in-1 Intel Core i7-1260P, Intel Iris Xe Graphics G7 96EUs | |
|---|---|---|---|---|---|---|
| Heat | -15% | -1% | -9% | -5% | -13% | |
| Maximum Upper Side * (°C) | 41.6 | 49.4 -19% | 37.6 10% | 41.6 -0% | 51.4 -24% | 42.2 -1% |
| Maximum Bottom * (°C) | 39 | 44.7 -15% | 40 -3% | 45 -15% | 47.8 -23% | 47.4 -22% |
| Idle Upper Side * (°C) | 29.4 | 34 -16% | 30.4 -3% | 31 -5% | 24.8 16% | 32.2 -10% |
| Idle Bottom * (°C) | 28.6 | 31.6 -10% | 30.6 -7% | 33.6 -17% | 24.9 13% | 33.6 -17% |
* ... kleiner is beter
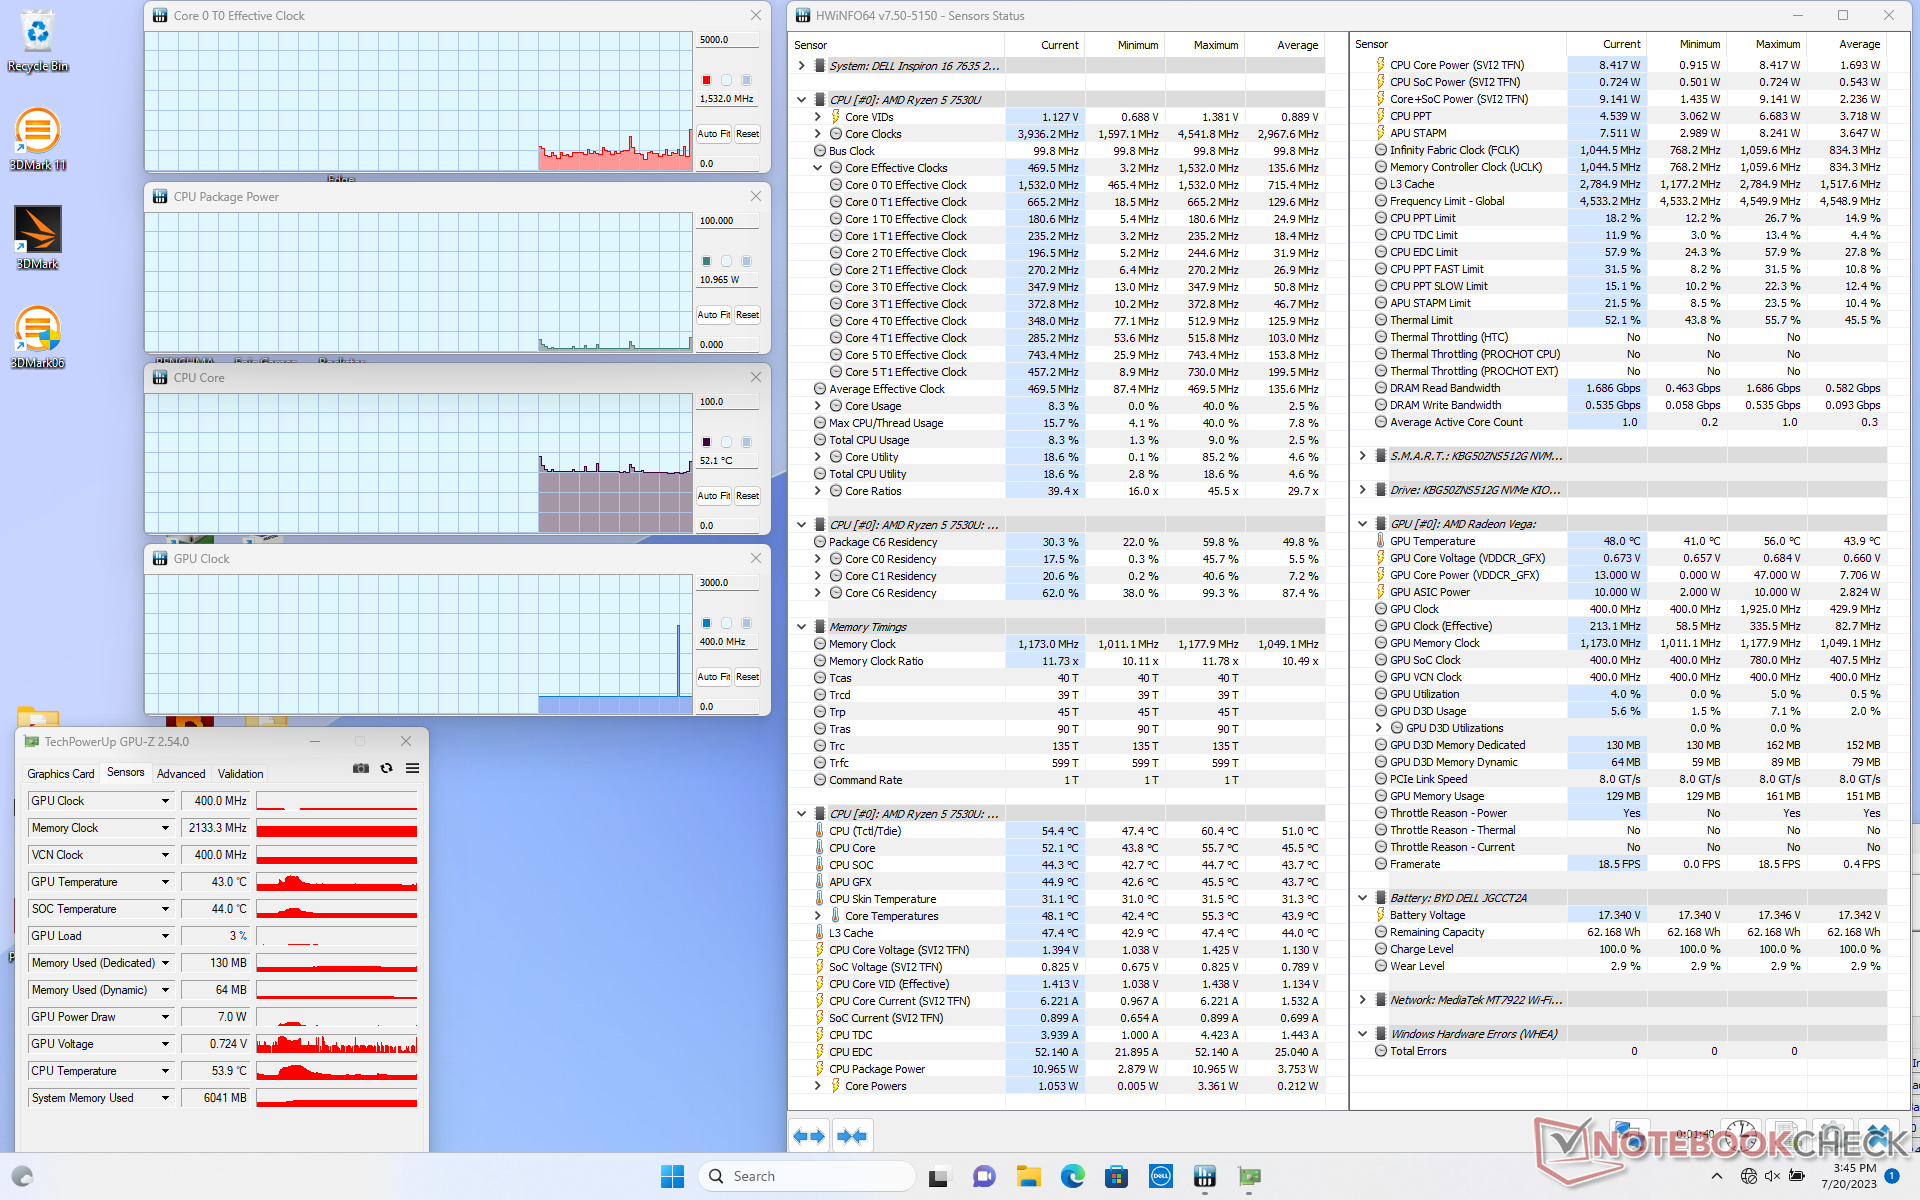
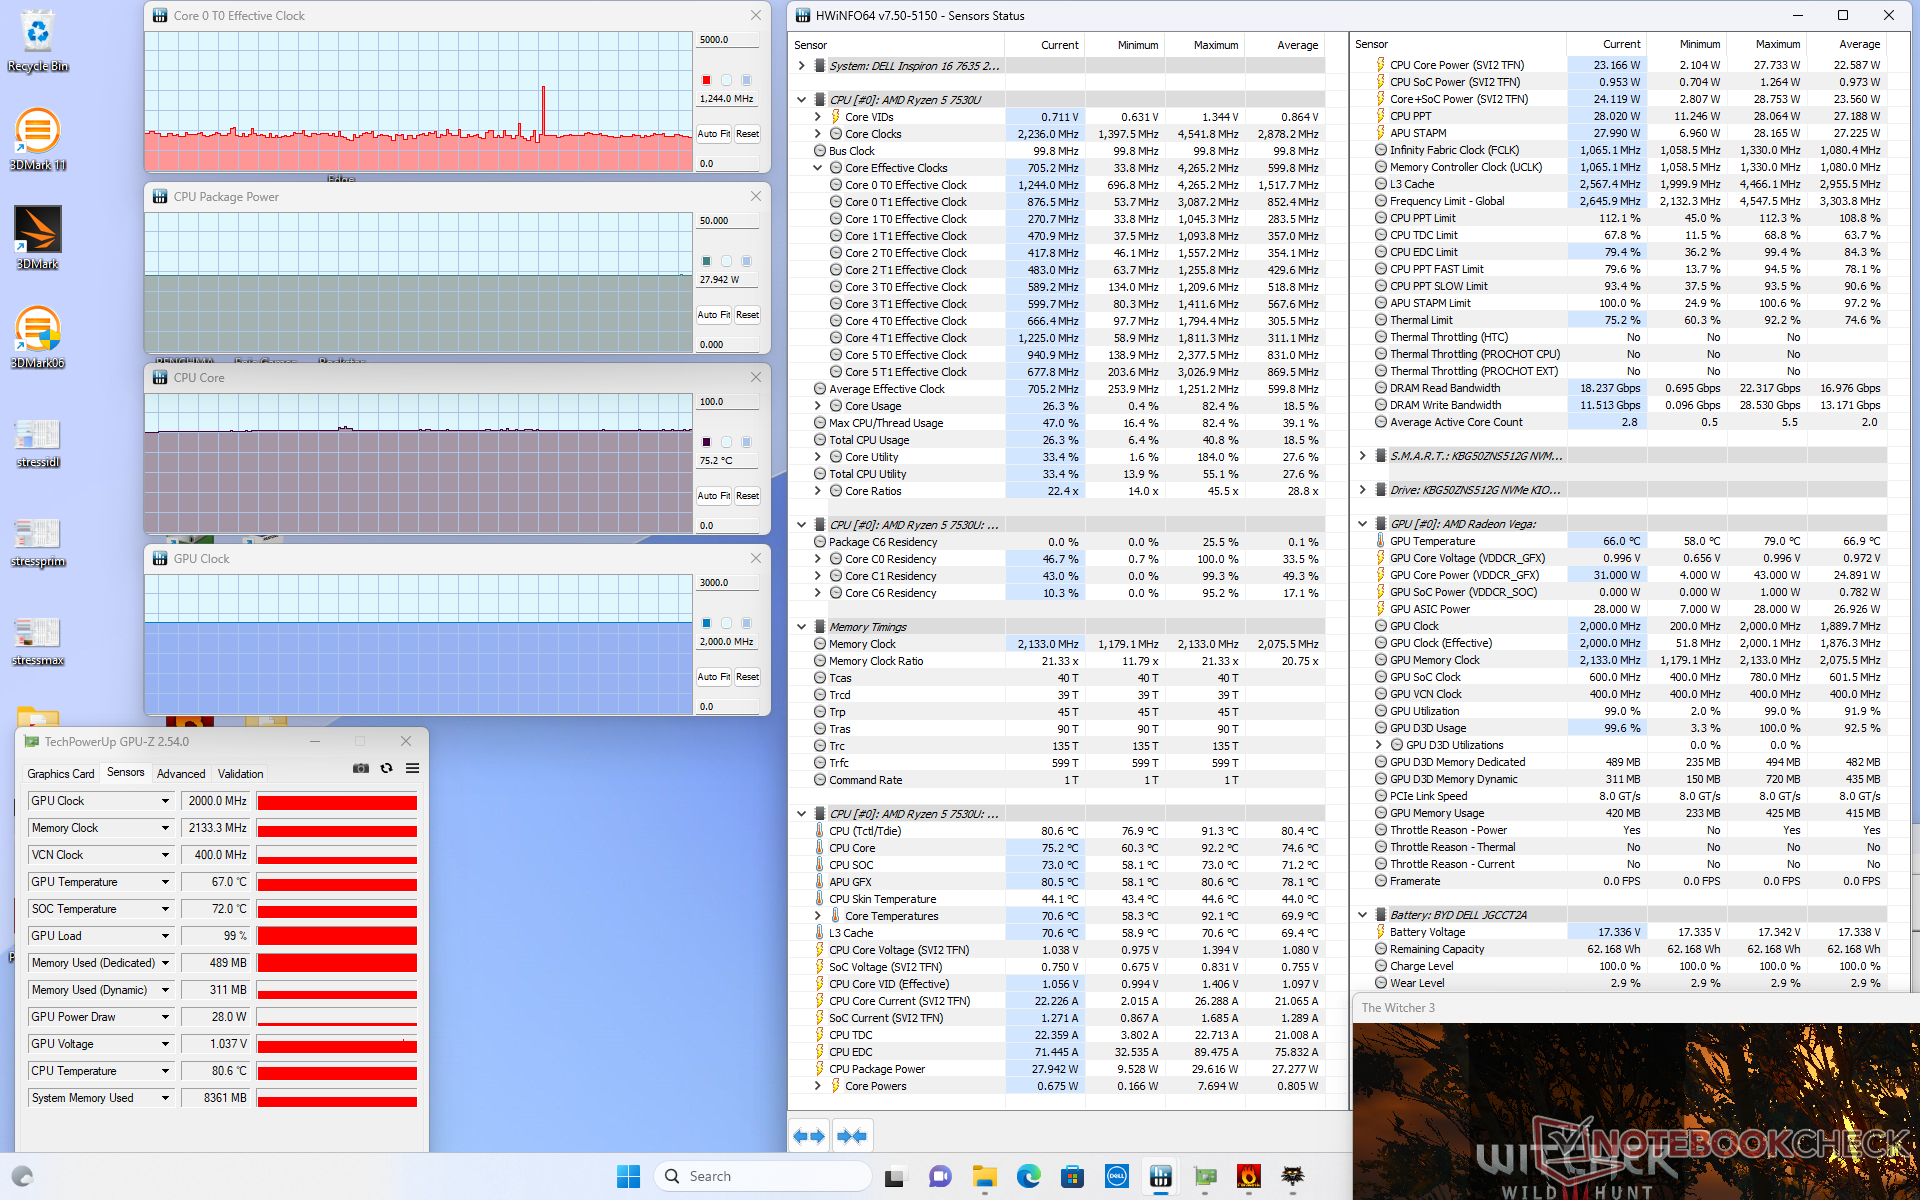
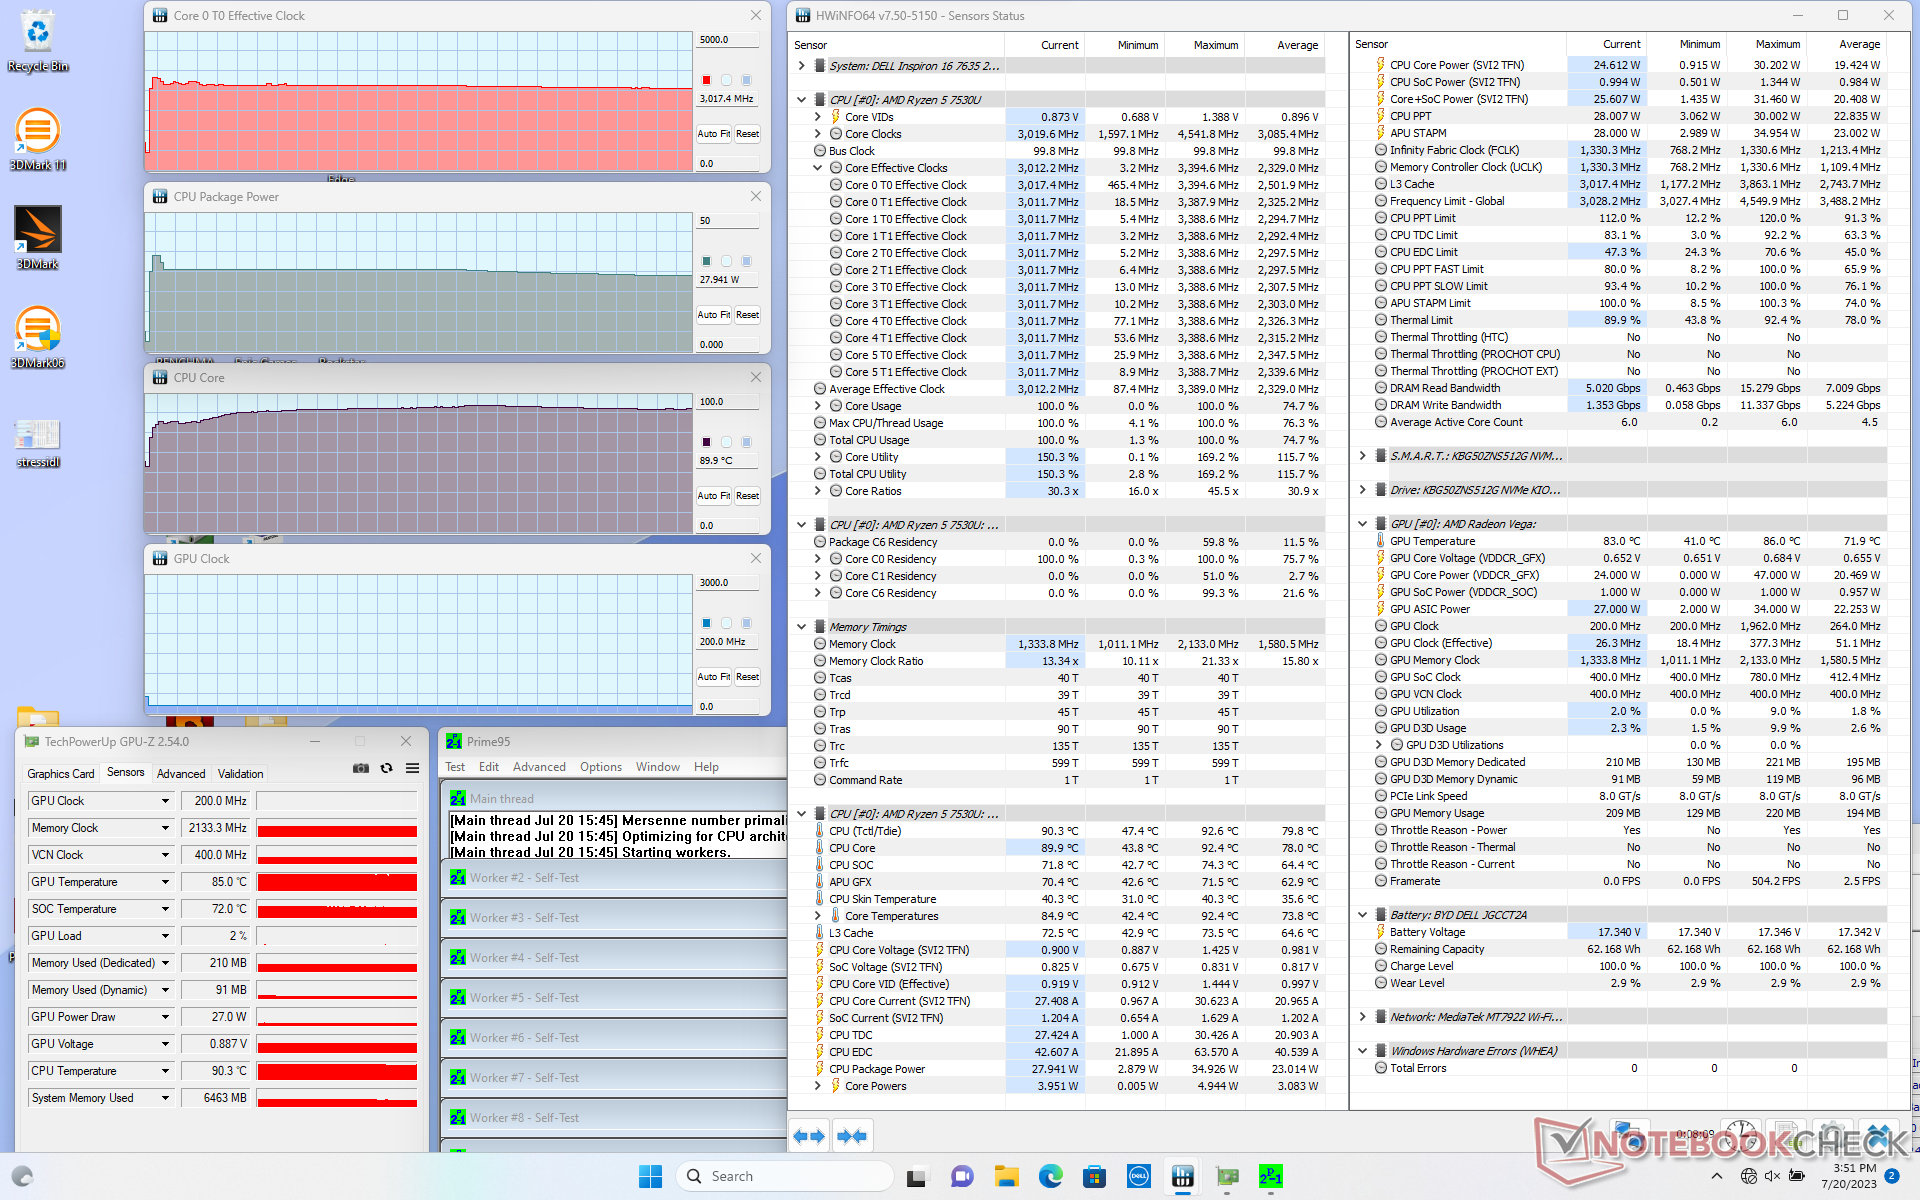
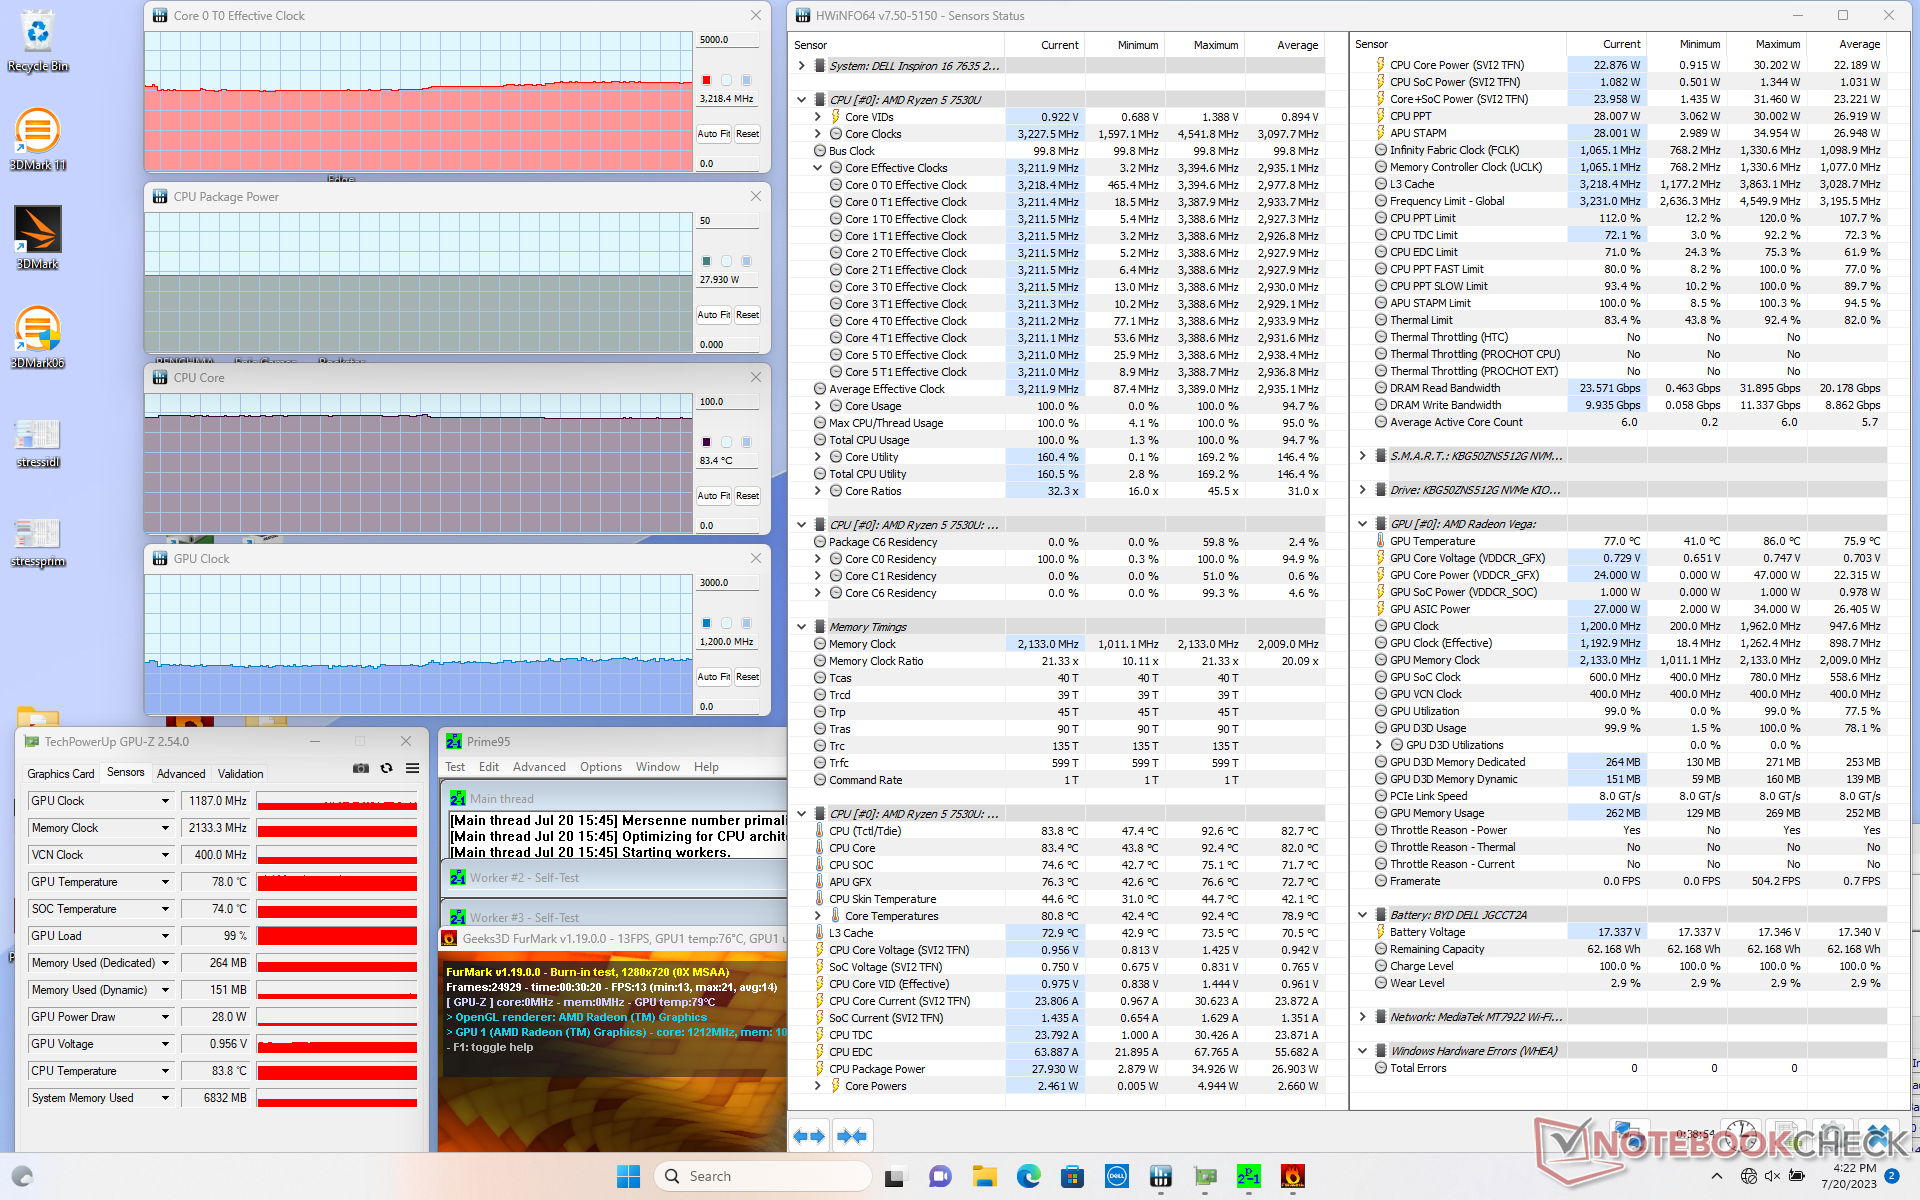
Stresstest
De kloksnelheden van de processor, de stroomopname op het moederbord en de temperatuur tijdens het uitvoeren van Prime95 piekten respectievelijk naar 3,4 GHz, 35 W en 81 C. De CPU stabiliseerde uiteindelijk op 3 GHz, 28 W en 90 C na slechts een minuut of zo, vergeleken met 81 C op de Intel-aangedreven Inspiron 16 7620 2-in-1 van vorig jaar.
Op de batterij werken vermindert de prestaties enigszins. Een 3DMark 11 test op batterijen leverde Physics en Graphics scores op van respectievelijk 12497 en 5935 punten, vergeleken met 12926 en 6249 punten op netstroom.
| CPU-klok (GHz) | GPU-klok (MHz) | Gemiddelde CPU-temperatuur (°C) | |
| Inactief systeem | -- | -- | 52 |
| Prime95 Stress | 3.0 | -- | 90 |
| Prime95 + FurMark-stress | 3.1 - 3.2 | 1187 | 83 |
| Witcher 3 Stress | 1.2 | 2000 | 75 |
Luidsprekers
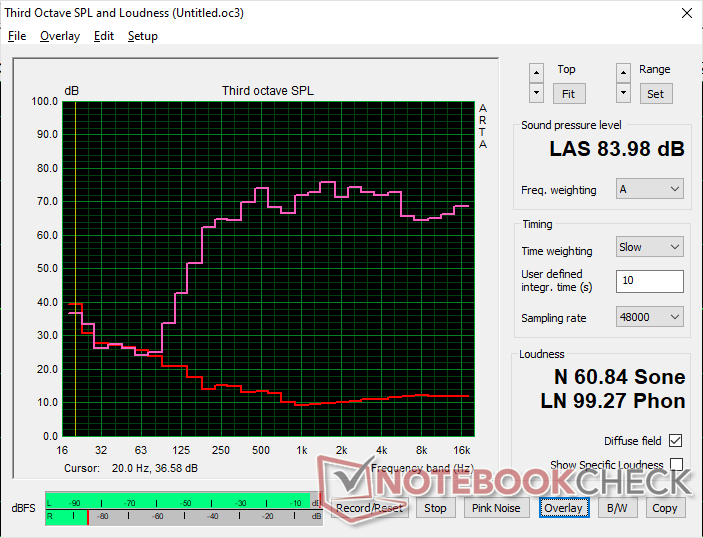
Dell Inspiron 16 7635 2-in-1 audioanalyse
(+) | luidsprekers kunnen relatief luid spelen (84 dB)
Bas 100 - 315 Hz
(±) | verminderde zeebaars - gemiddeld 14.9% lager dan de mediaan
(±) | lineariteit van de lage tonen is gemiddeld (11.9% delta ten opzichte van de vorige frequentie)
Midden 400 - 2000 Hz
(+) | evenwichtige middens - slechts 3.5% verwijderd van de mediaan
(+) | de middentonen zijn lineair (6.9% delta ten opzichte van de vorige frequentie)
Hoog 2 - 16 kHz
(+) | evenwichtige hoogtepunten - slechts 4.1% verwijderd van de mediaan
(+) | de hoge tonen zijn lineair (3.7% delta naar de vorige frequentie)
Algemeen 100 - 16.000 Hz
(+) | het totale geluid is lineair (12.2% verschil met de mediaan)
Vergeleken met dezelfde klasse
» 12% van alle geteste apparaten in deze klasse waren beter, 4% vergelijkbaar, 84% slechter
» De beste had een delta van 6%, het gemiddelde was 20%, de slechtste was 57%
Vergeleken met alle geteste toestellen
» 10% van alle geteste apparaten waren beter, 2% gelijk, 88% slechter
» De beste had een delta van 4%, het gemiddelde was 23%, de slechtste was 134%
Apple MacBook Pro 16 2021 M1 Pro audioanalyse
(+) | luidsprekers kunnen relatief luid spelen (84.7 dB)
Bas 100 - 315 Hz
(+) | goede baars - slechts 3.8% verwijderd van de mediaan
(+) | de lage tonen zijn lineair (5.2% delta naar de vorige frequentie)
Midden 400 - 2000 Hz
(+) | evenwichtige middens - slechts 1.3% verwijderd van de mediaan
(+) | de middentonen zijn lineair (2.1% delta ten opzichte van de vorige frequentie)
Hoog 2 - 16 kHz
(+) | evenwichtige hoogtepunten - slechts 1.9% verwijderd van de mediaan
(+) | de hoge tonen zijn lineair (2.7% delta naar de vorige frequentie)
Algemeen 100 - 16.000 Hz
(+) | het totale geluid is lineair (4.6% verschil met de mediaan)
Vergeleken met dezelfde klasse
» 0% van alle geteste apparaten in deze klasse waren beter, 0% vergelijkbaar, 100% slechter
» De beste had een delta van 5%, het gemiddelde was 17%, de slechtste was 45%
Vergeleken met alle geteste toestellen
» 0% van alle geteste apparaten waren beter, 0% gelijk, 100% slechter
» De beste had een delta van 4%, het gemiddelde was 23%, de slechtste was 134%
Energiebeheer
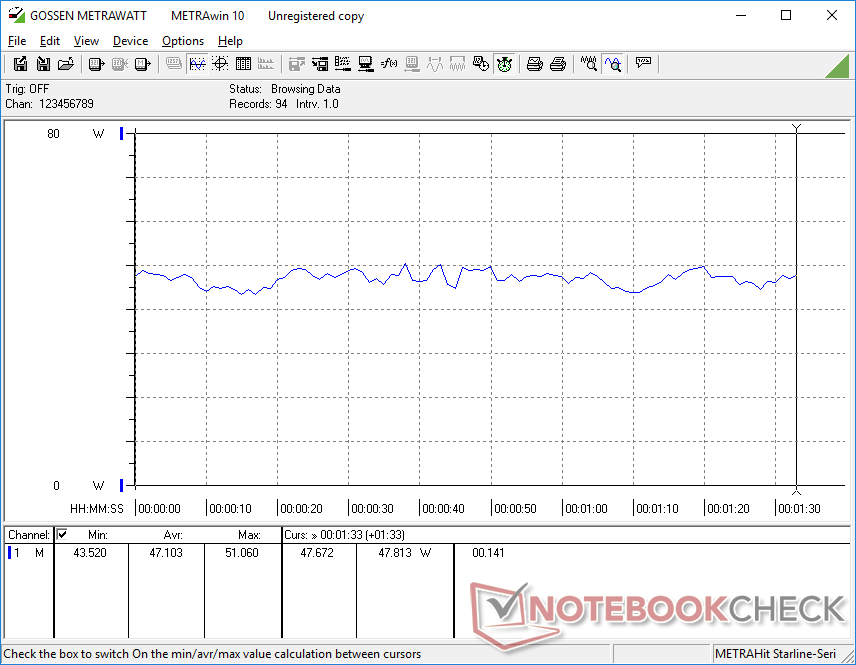
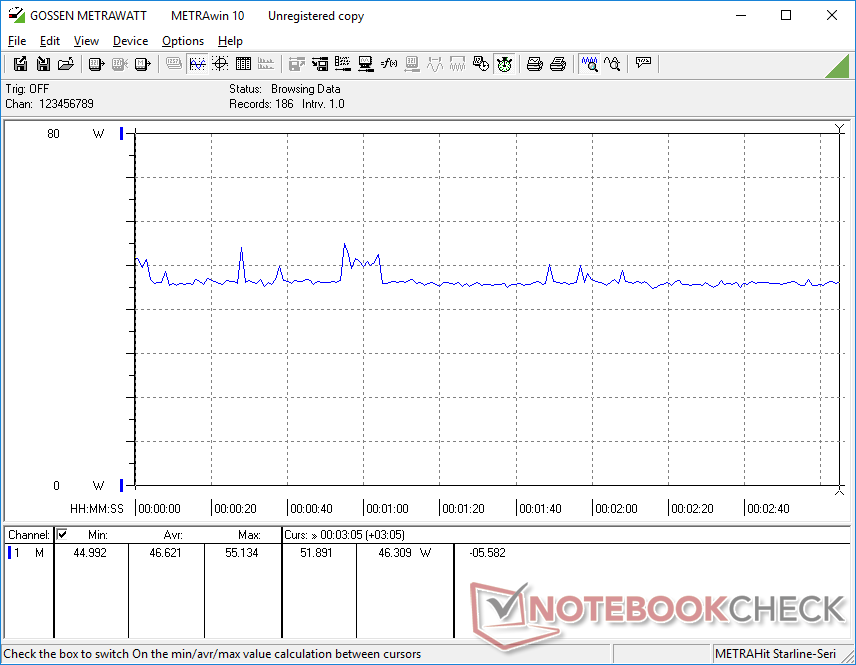
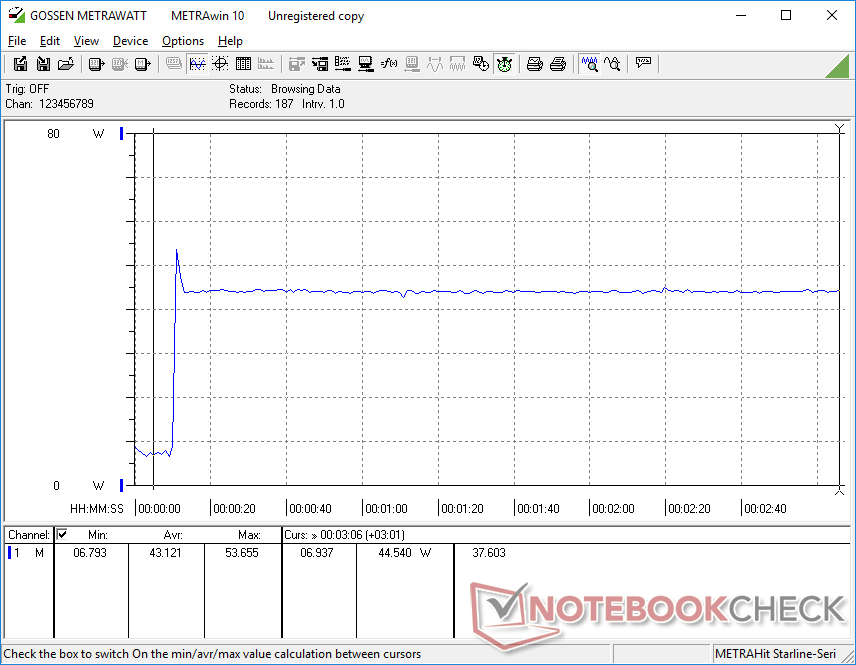
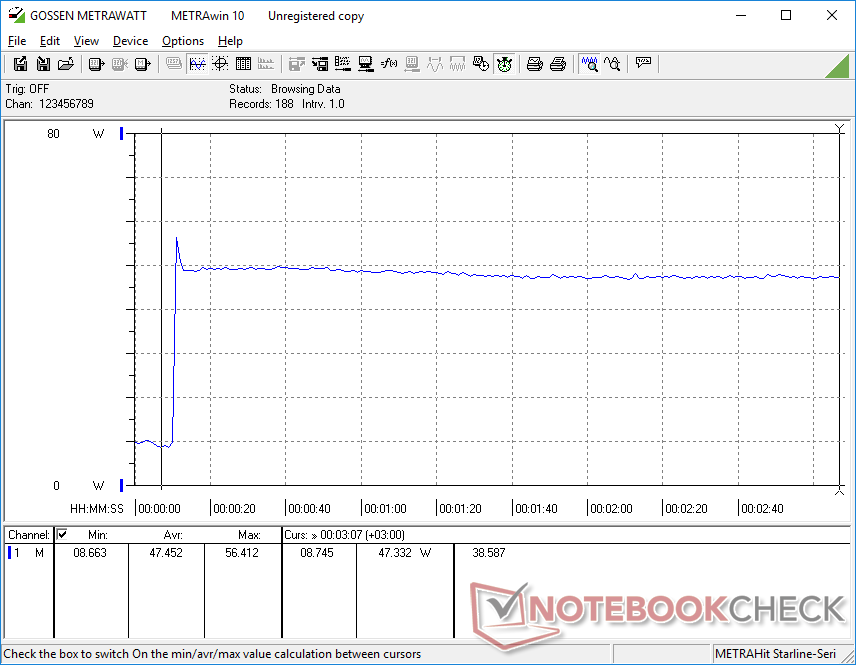
Stroomverbruik
Het stroomverbruik onder de meeste omstandigheden is consistent lager dan op de Core-P-aangedreven Inspiron 16 7620 2-in-1 van vorig jaar, wat verantwoordelijk kan zijn voor de goede resultaten voor de batterijlevensduur in het volgende gedeelte. Het is ook lager dan de Core-U-aangedreven Yoga 7 16IRL8 gemiddeld om uitstekende prestaties-per-watt te laten zien ten opzichte van de concurrentie.
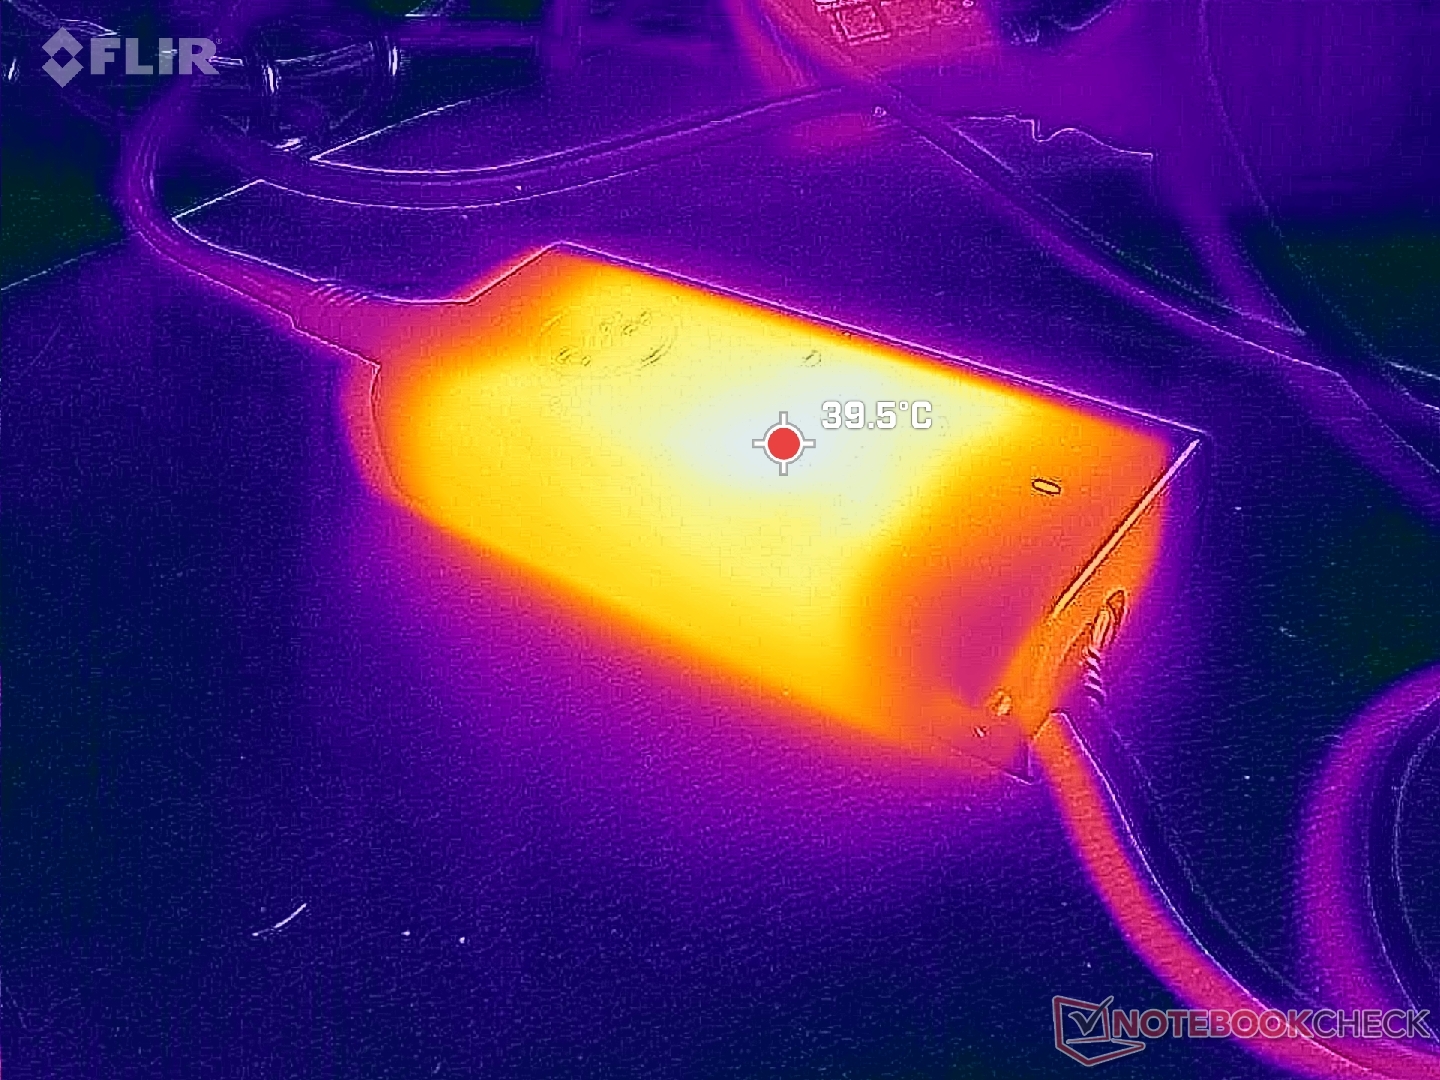
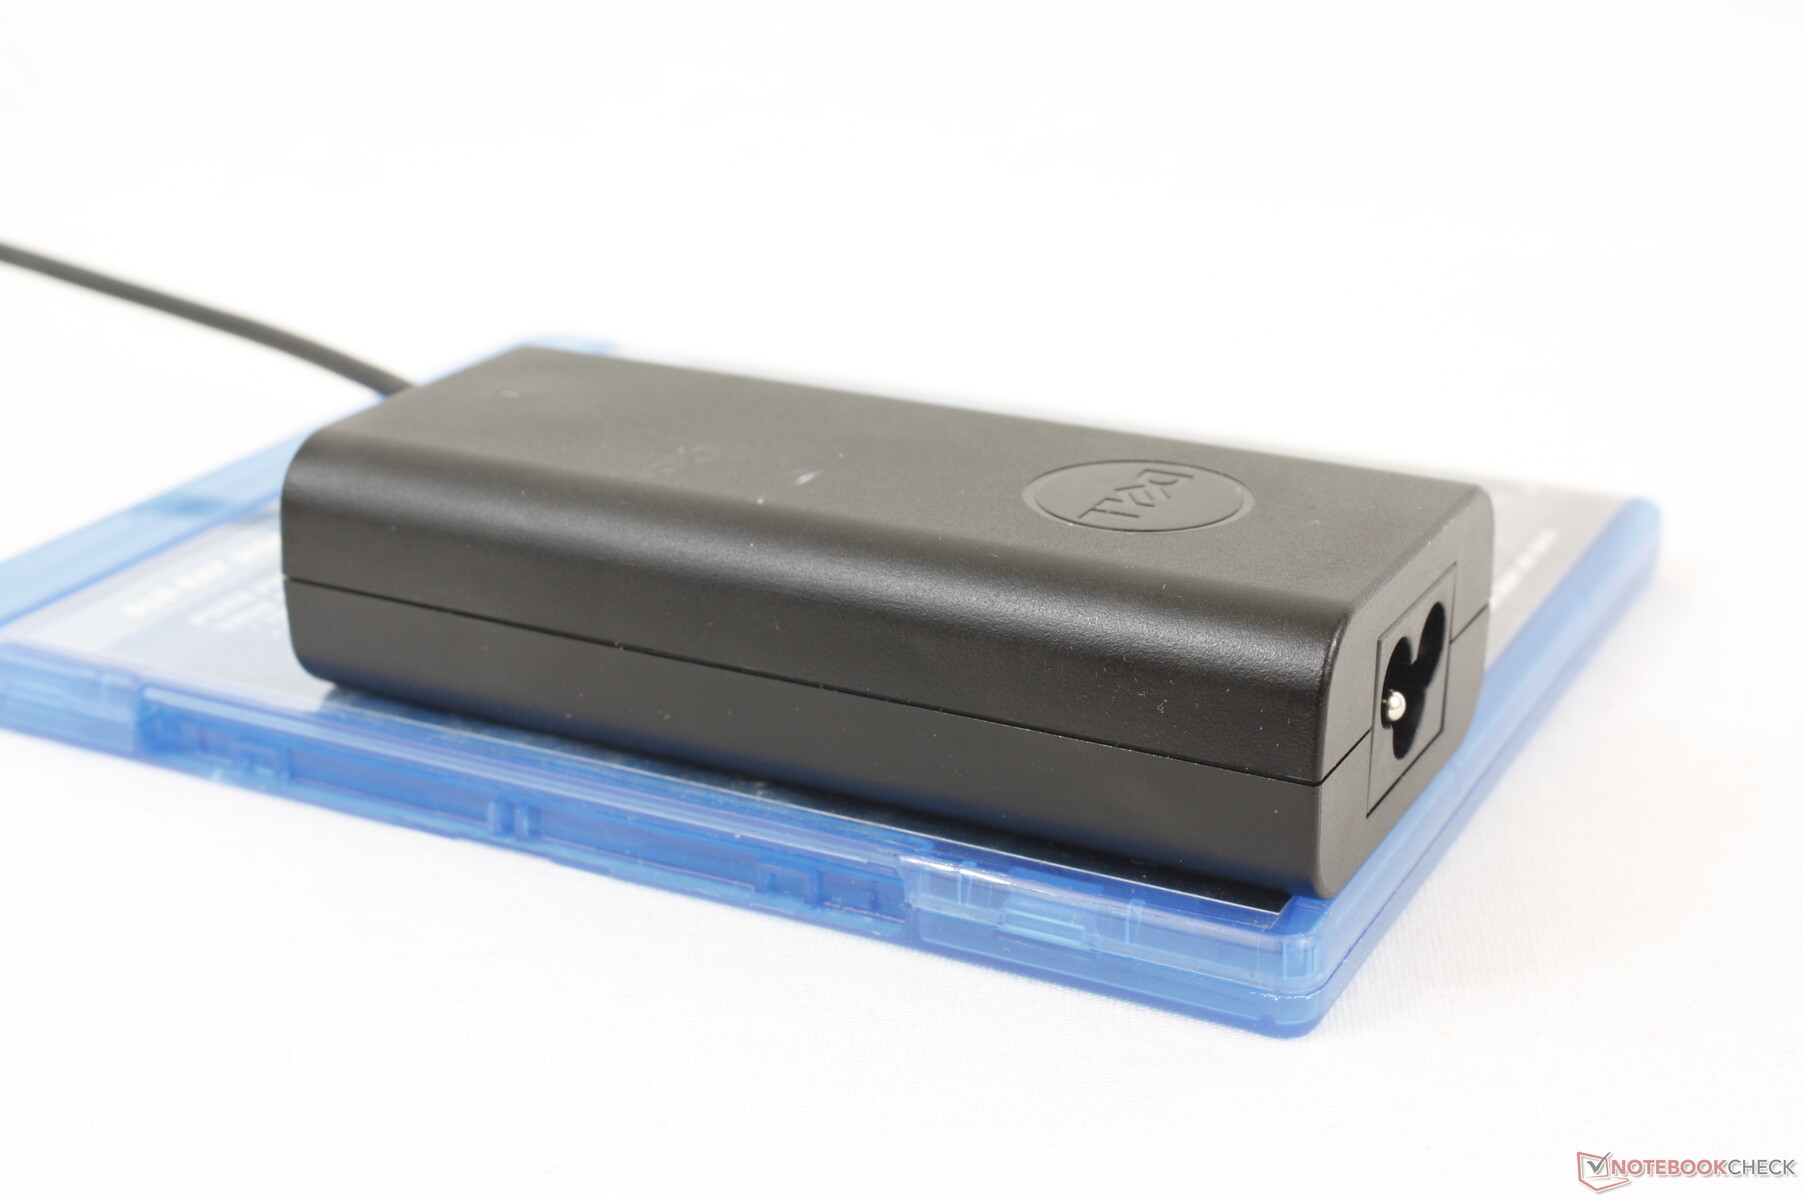
We zijn in staat om een maximale stroomopname van 57 W te meten van de kleine-medium (~11,2 x 5 x 2,8 cm) 65 W AC-adapter wanneer de CPU voor 100% wordt gebruikt. De ruime overhead zorgt ervoor dat het systeem nog steeds kan opladen wanneer er zware belastingen worden uitgevoerd, zelfs als dit langzamer gaat en dat de CPU niet in de knel komt door een onvoldoende grote AC-adapter.
| Uit / Standby | |
| Inactief | |
| Belasting |
|
Key:
min: | |
| Dell Inspiron 16 7635 2-in-1 R5 7530U, Vega 7, Kioxia BG5 KBG50ZNS512G, IPS, 1920x1200, 16" | Acer Swift Edge SFE16-42-R1GM R7 7735U, Radeon 680M, Micron 3400 1TB MTFDKBA1T0TFH, OLED, 3840x2400, 16" | Lenovo Yoga 7 16IRL8 i7-1355U, Iris Xe G7 96EUs, WD PC SN740 512GB SDDPMQD-512G-1101, IPS, 1920x1200, 16" | Samsung Galaxy Book3 Pro 16 i5-1340P, Iris Xe G7 80EUs, WD PC SN740 256GB SDDPNQD-256G, AMOLED, 2880x1800, 16" | Lenovo IdeaPad Flex 5 16ABR G8 R7 7730U, Vega 8, Samsung PM9B1 1024GB MZAL41T0HBLB, IPS, 1920x1200, 16" | Dell Inspiron 16 7620 2-in-1 i7-1260P, Iris Xe G7 96EUs, Toshiba KBG40ZNS512G NVMe, IPS, 1920x1200, 16" | |
|---|---|---|---|---|---|---|
| Power Consumption | -15% | -8% | 8% | -21% | -10% | |
| Idle Minimum * (Watt) | 4.8 | 8.6 -79% | 3.3 31% | 3.9 19% | 5.4 -13% | 5.3 -10% |
| Idle Average * (Watt) | 7.6 | 7.7 -1% | 10.2 -34% | 4.8 37% | 11.1 -46% | 8.3 -9% |
| Idle Maximum * (Watt) | 8.7 | 9.3 -7% | 10.3 -18% | 10 -15% | 11.6 -33% | 9.6 -10% |
| Load Average * (Watt) | 47.1 | 47.9 -2% | 55.2 -17% | 44 7% | 52.7 -12% | 54.3 -15% |
| Witcher 3 ultra * (Watt) | 46.6 | 46.3 1% | 43.8 6% | 42.3 9% | 47.6 -2% | 43.9 6% |
| Load Maximum * (Watt) | 56.4 | 56 1% | 65.7 -16% | 63 -12% | 67 -19% | 70 -24% |
* ... kleiner is beter
Power Consumption Witcher 3 / Stresstest
Power Consumption external Monitor
Levensduur batterij
De Inspiron 16 7635 2-in-1 wordt geleverd met een 64 Wh batterijpakket vergeleken met het grotere 86 Wh pakket voor de Inspiron 16 7630 2-in-1 of 7620 2-in-1. AMD-gebruikers trekken dus aan het kortste eind, aangezien de grotere accu momenteel exclusief is voor de Intel-configuraties.
De batterijlevensduur is desondanks nog steeds erg goed, ondanks het kleinere batterijpakket op ons AMD-toestel. We zijn in staat om 14,5 uur WLAN browsen te registreren, wat bijna hetzelfde is als wat we hebben geregistreerd op de Intel Inspiron 16 7620 2-in-1 van vorig jaar. Het is langer dan de vergelijkbaar uitgeruste IdeaPad Flex 5 16 ook met enkele uren.
Opladen van leeg naar vol met de meegeleverde AC-adapter duurt ongeveer 2 uur.
| Dell Inspiron 16 7635 2-in-1 R5 7530U, Vega 7, 64 Wh | Acer Swift Edge SFE16-42-R1GM R7 7735U, Radeon 680M, 54 Wh | Lenovo Yoga 7 16IRL8 i7-1355U, Iris Xe G7 96EUs, 71 Wh | Samsung Galaxy Book3 Pro 16 i5-1340P, Iris Xe G7 80EUs, 76 Wh | Lenovo IdeaPad Flex 5 16ABR G8 R7 7730U, Vega 8, 52.5 Wh | Dell Inspiron 16 7620 2-in-1 i7-1260P, Iris Xe G7 96EUs, 87 Wh | |
|---|---|---|---|---|---|---|
| Batterijduur | -43% | -17% | -3% | -37% | 11% | |
| Reader / Idle (h) | 26 | 10.9 -58% | 19 -27% | 30.4 17% | 17 -35% | |
| WiFi v1.3 (h) | 14.5 | 7.3 -50% | 9.4 -35% | 10.2 -30% | 9.8 -32% | 14.6 1% |
| Load (h) | 1.9 | 1.5 -21% | 2.1 11% | 2 5% | 1.1 -42% | 3.2 68% |
| H.264 (h) | 8.6 | 14.4 | 13.1 |
Pro
Contra
Verdict - Veel snijhoeken vergeleken met de Inspiron 16 7630 2-in-1
De AMD Inspiron 16 7635 2-in-1 is meer dan alleen een processorruil in vergelijking met de Intel Inspiron 16 7630 2-in-1. Hij mist opties voor een hoger resolutie OLED touchscreen, IR sensor, discrete grafische opties, grotere batterij en Thunder Thundertt. Hij mist opties voor een OLED-touchscreen met een hogere resolutie, IR-sensor, discrete grafische opties, grotere batterij en Thunderbolt-ondersteuning, allemaal om iets goedkoper te zijn. Als je bereid bent om slechts $ 100 meer te betalen, dan raden we je aan om de Core i7-1360P Inspiron 16 7630 2-in-1 te overwegen in plaats van onze Ryzen 5-configuratie, omdat deze zowel snellere CPU- en GPU-prestaties als een verdubbeling van de opslagcapaciteit biedt. Het is een beetje zwaarder met 100 g, maar beide versies van het model zijn al vrij zwaar in de eerste plaats vanaf 2 kg per stuk.
De diepere sRGB-kleuren van de Inspiron 16 7635 2-in-1 geven Dell een voorsprong op de concurrerende Lenovo Flex 5 16.
Voor toekomstige herzieningen zouden we zeker graag Zen 4 of op zijn minst Zen 3+ processoropties zien om de middelmatige grafische prestaties een boost te geven. De Ryzen 7 7730U optie is geen aanrader omdat deze duurder en trager is en minder mogelijkheden biedt dan de Core i7-1360P configuratie. De Inspiron 16 7620 2-in-1 van vorig jaar zou nog steeds het overwegen waard zijn, vooral omdat deze laatste herziening niet lichter of draagbaarder is.
Prijs en beschikbaarheid
De Inspiron 16 7635 2-in-1 en Inspiron 16 7630 2-in-1 worden nu rechtstreeks door Dell geleverd vanaf respectievelijk 650 USD en 800 USD. Onze specifieke configuratie wordt verkocht voor $900.
Dell Inspiron 16 7635 2-in-1
- 23-07-2023 v7 (old)
Allen Ngo
Transparantie
De selectie van te beoordelen apparaten wordt gemaakt door onze redactie. Het testexemplaar werd ten behoeve van deze beoordeling door de fabrikant of detailhandelaar in bruikleen aan de auteur verstrekt. De kredietverstrekker had geen invloed op deze recensie, noch ontving de fabrikant vóór publicatie een exemplaar van deze recensie. Er bestond geen verplichting om deze recensie te publiceren. Als onafhankelijk mediabedrijf is Notebookcheck niet onderworpen aan het gezag van fabrikanten, detailhandelaren of uitgevers.
[transparency_disclaimer]Dit is hoe Notebookcheck test
Elk jaar beoordeelt Notebookcheck onafhankelijk honderden laptops en smartphones met behulp van gestandaardiseerde procedures om ervoor te zorgen dat alle resultaten vergelijkbaar zijn. We hebben onze testmethoden al zo'n 20 jaar voortdurend ontwikkeld en daarbij de industriestandaard bepaald. In onze testlaboratoria wordt gebruik gemaakt van hoogwaardige meetapparatuur door ervaren technici en redacteuren. Deze tests omvatten een validatieproces in meerdere fasen. Ons complexe beoordelingssysteem is gebaseerd op honderden goed onderbouwde metingen en benchmarks, waardoor de objectiviteit behouden blijft. Meer informatie over onze testmethoden kunt u hier vinden.
Price comparison

