Dell Inspiron 16 Plus 7630 laptop review: 60 W GeForce RTX 4060 is zo slecht nog niet

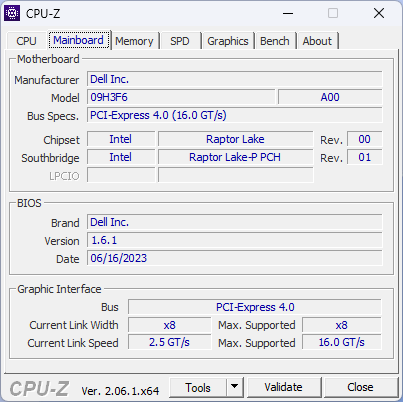
De 2023 Dell Inspiron 16 Plus 7630 volgt vorig jaar 2022 Inspiron 16 Plus 7620 op met bijgewerkte internals en externals ondanks het feit dat het 2022 model al een full-on redesign was van de 2021 Inspiron 16 Plus 7610. Het is zeldzaam om te zien dat een serie drie jaar achter elkaar drie grote redesigns ondergaat, omdat fabrikanten het uiterlijk meestal maar eens in de paar jaar herzien. Net als andere multimedialaptops van 2023 bevat de Inspiron 16 Plus 7630 Intel 13e generatie Raptor Lake-H CPU's en Nvidia Ada Lovelace GPU's.
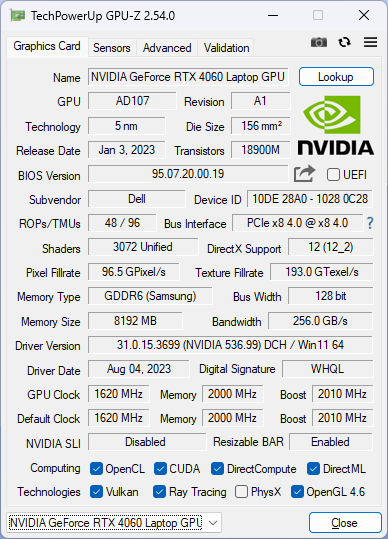
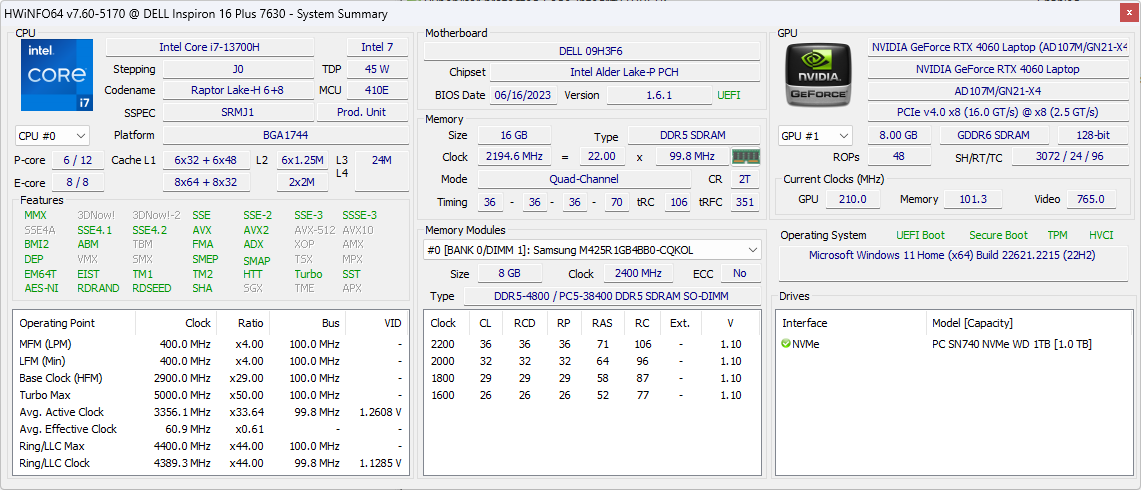
Onze review unit is een high-end configuratie met de Core i7-13700H CPU, GeForce RTX 4060 GPU en 2560 x 1600 120 Hz IPS scherm voor ongeveer $1250 USD. Kleinere SKU's met de Core i5-13500H, geïntegreerde iris Xe, RTX 3050, RTX 4050 of 1200p 60 Hz beeldscherm zijn in de maak. AMD-varianten met de Ryzen 5 7640HS en Ryzen 7 7840HS zijn ook gepland onder de modelnaam Inspiron 16 Plus 7635.
Alternatieven voor de Inspiron 16 Plus 7630 zijn andere 16-inch multimedia laptops zoals de Lenovo Slim Pro 9i 16, Asus VivoBook Pro 16X, HP Envy 16, of MSI Summit E16 Flip. De Inspiron 16 Plus 7630 moet niet worden verward met de standaard langzamere Inspiron 16 of de Inspiron 16 Plus 7630 2-in-1 die zeer verschillende specificaties en functies hebben.
Meer Dell beoordelingen:
Potentiële concurrenten in vergelijking
Evaluatie | Datum | Model | Gewicht | Hoogte | Formaat | Resolutie | Beste prijs |
|---|---|---|---|---|---|---|---|
| 87.1 % v7 (old) | 08-2023 | Dell Inspiron 16 Plus 7630 i7-13700H, GeForce RTX 4060 Laptop GPU | 2.2 kg | 19.95 mm | 16.00" | 2560x1600 | |
| 87.4 % v7 (old) | 08-2022 | Dell Inspiron 16 Plus 7620 i7-12700H, GeForce RTX 3050 Ti Laptop GPU | 2.1 kg | 18.99 mm | 16.00" | 3072x1920 | |
| 88 % v7 (old) | 08-2023 | Lenovo Slim Pro 9i 16IRP8 i9-13905H, GeForce RTX 4050 Laptop GPU | 2.2 kg | 18.2 mm | 16.00" | 3200x2000 | |
| 86.2 % v7 (old) | 07-2023 | Asus Vivobook Pro 16X K6604JV-MX016W i9-13980HX, GeForce RTX 4060 Laptop GPU | 2.1 kg | 22.8 mm | 16.00" | 3200x2000 | |
| 86.9 % v7 (old) | 09-2022 | HP Envy 16 h0112nr i7-12700H, GeForce RTX 3060 Laptop GPU | 2.3 kg | 19.8 mm | 16.00" | 3840x2400 | |
| 84.2 % v7 (old) | 10-2022 | MSI Summit E16 Flip A12UDT-031 i7-1280P, GeForce RTX 3050 Ti Laptop GPU | 1.9 kg | 16.85 mm | 16.00" | 2560x1600 |
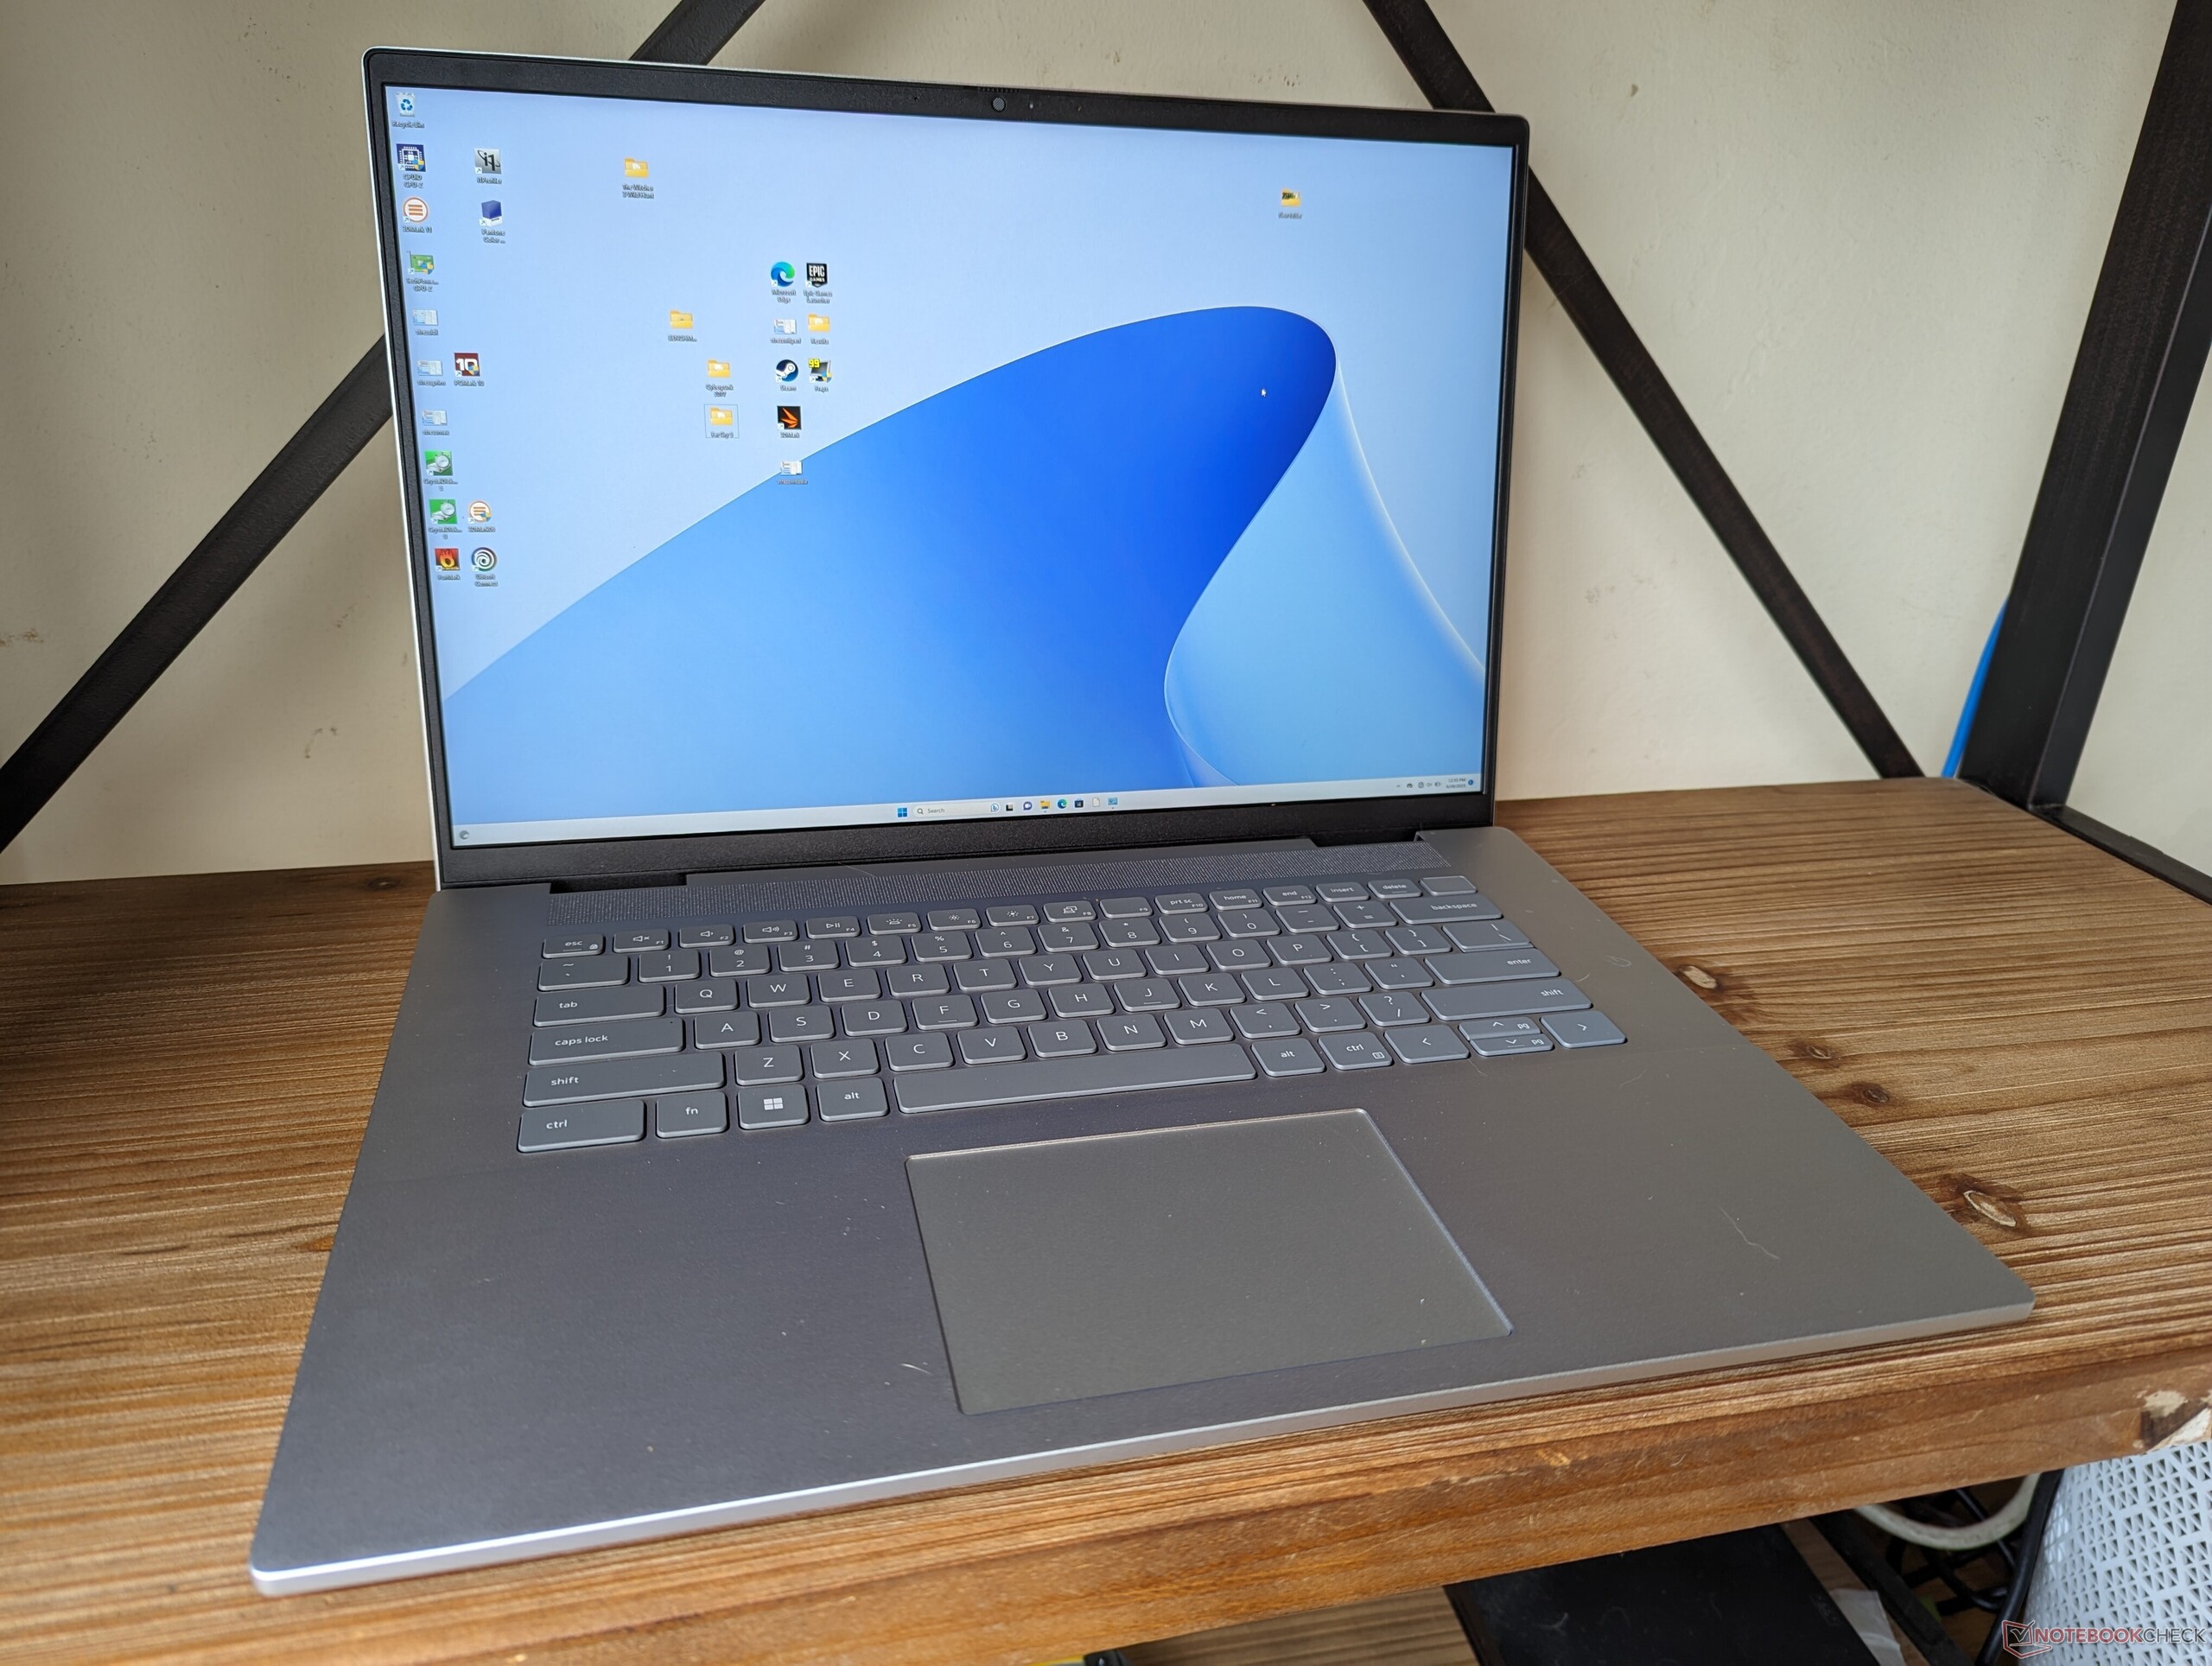
Zaak - Het eenvoudig houden
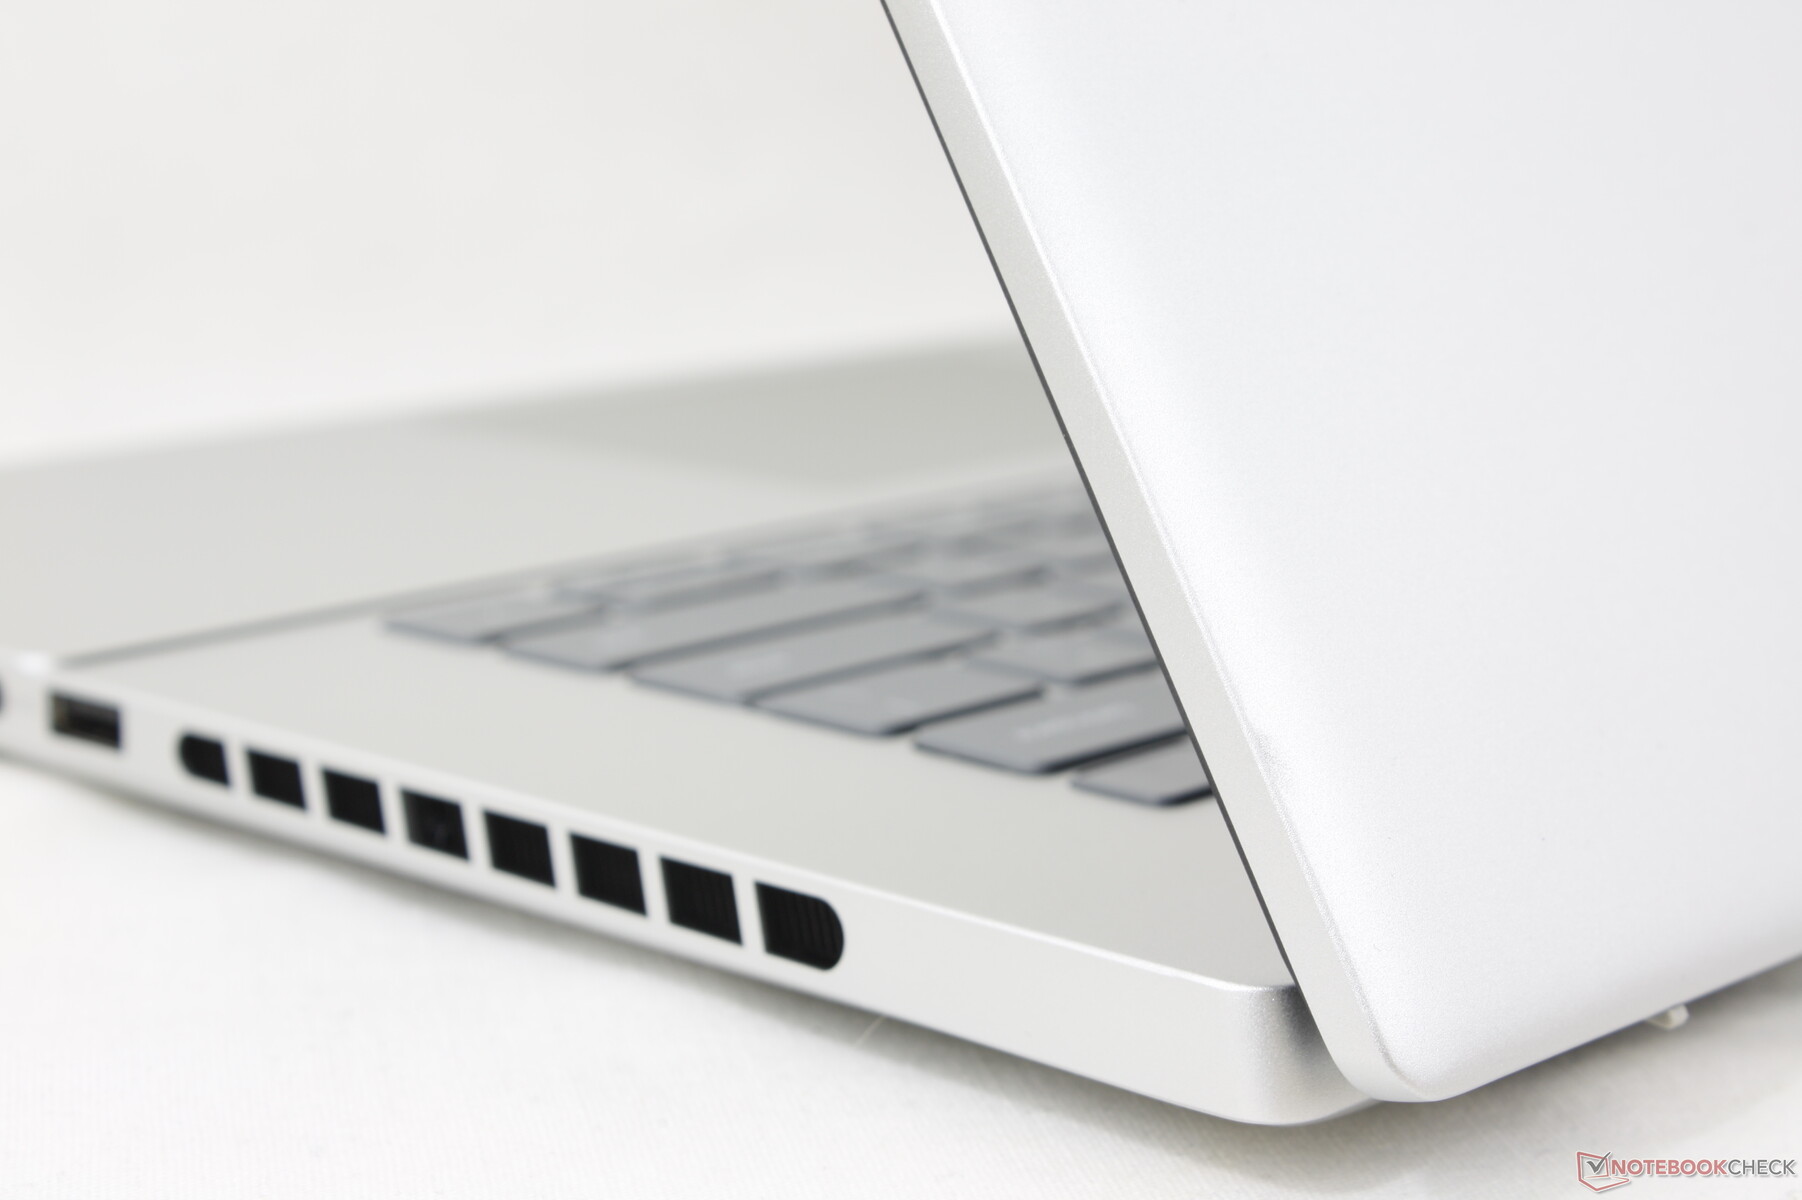
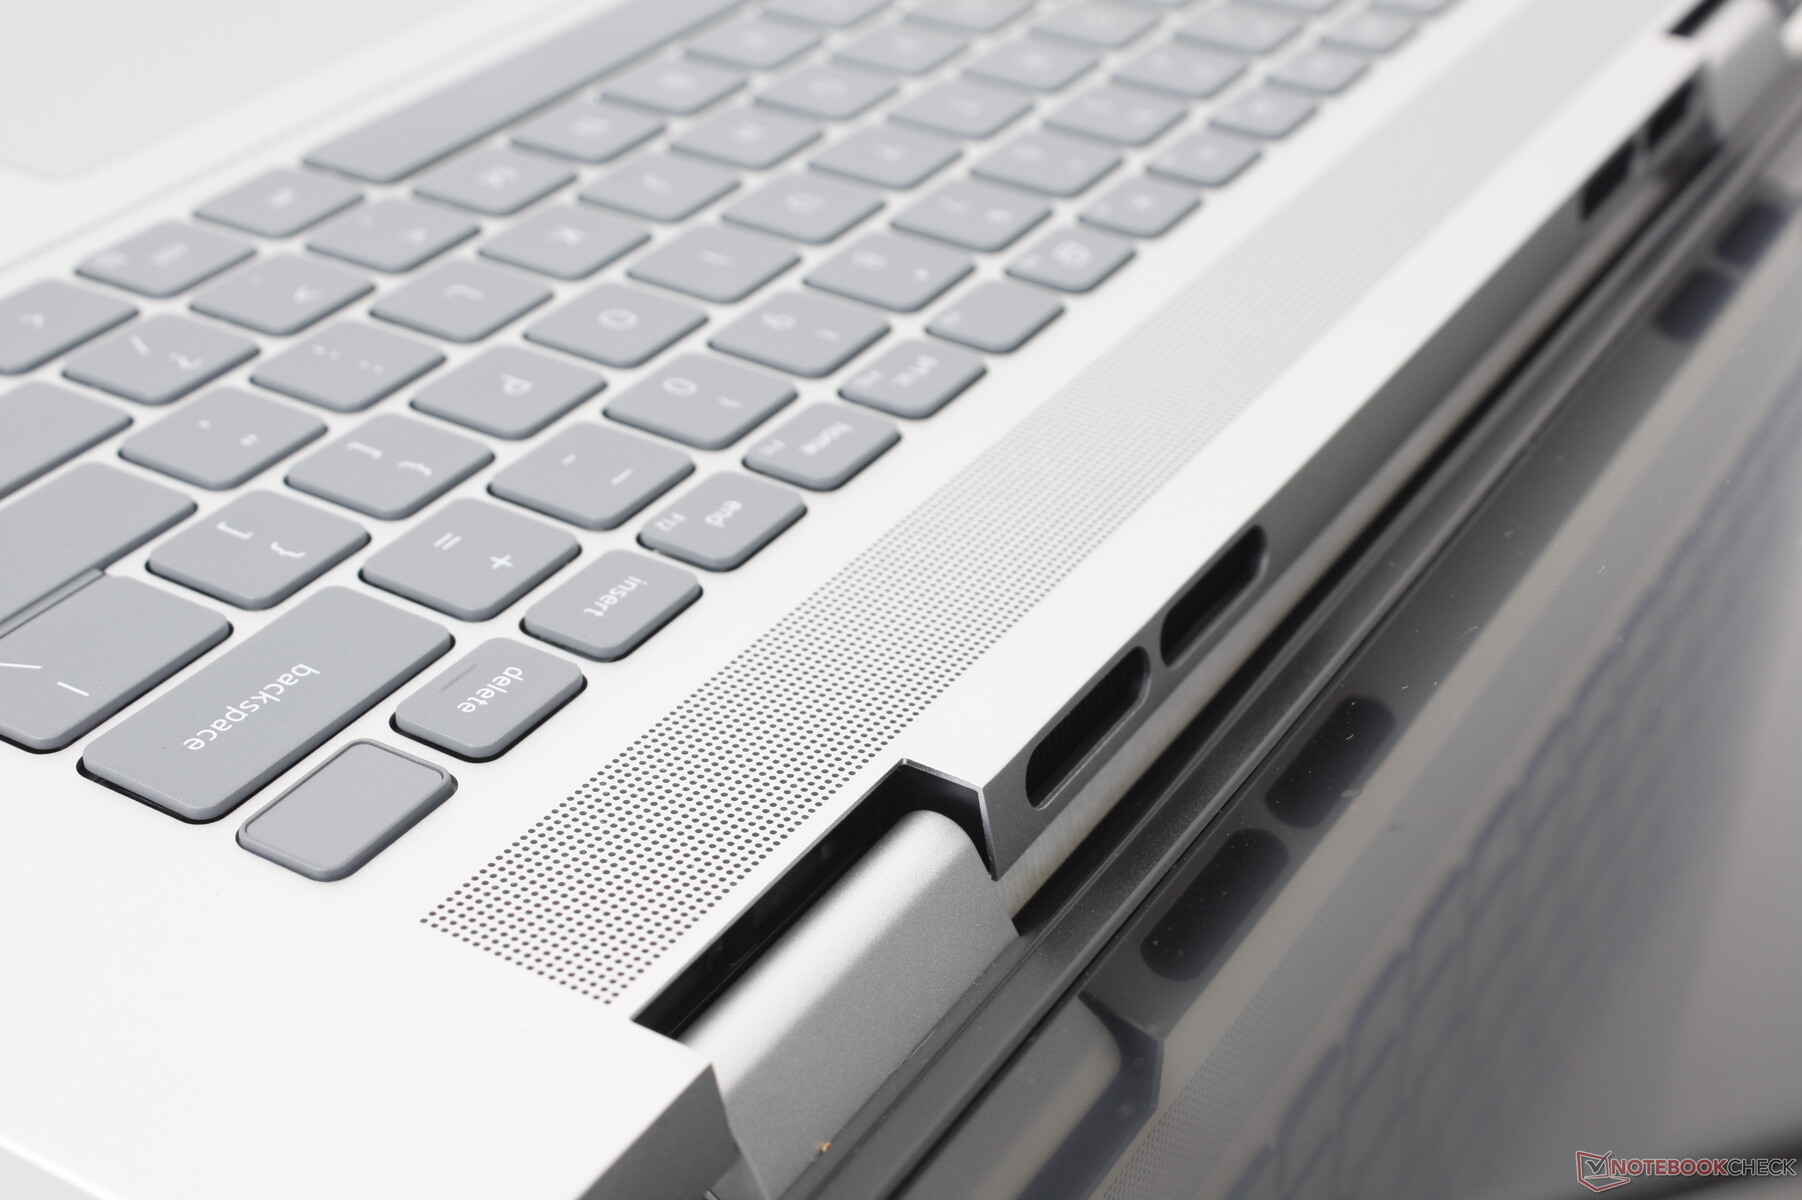
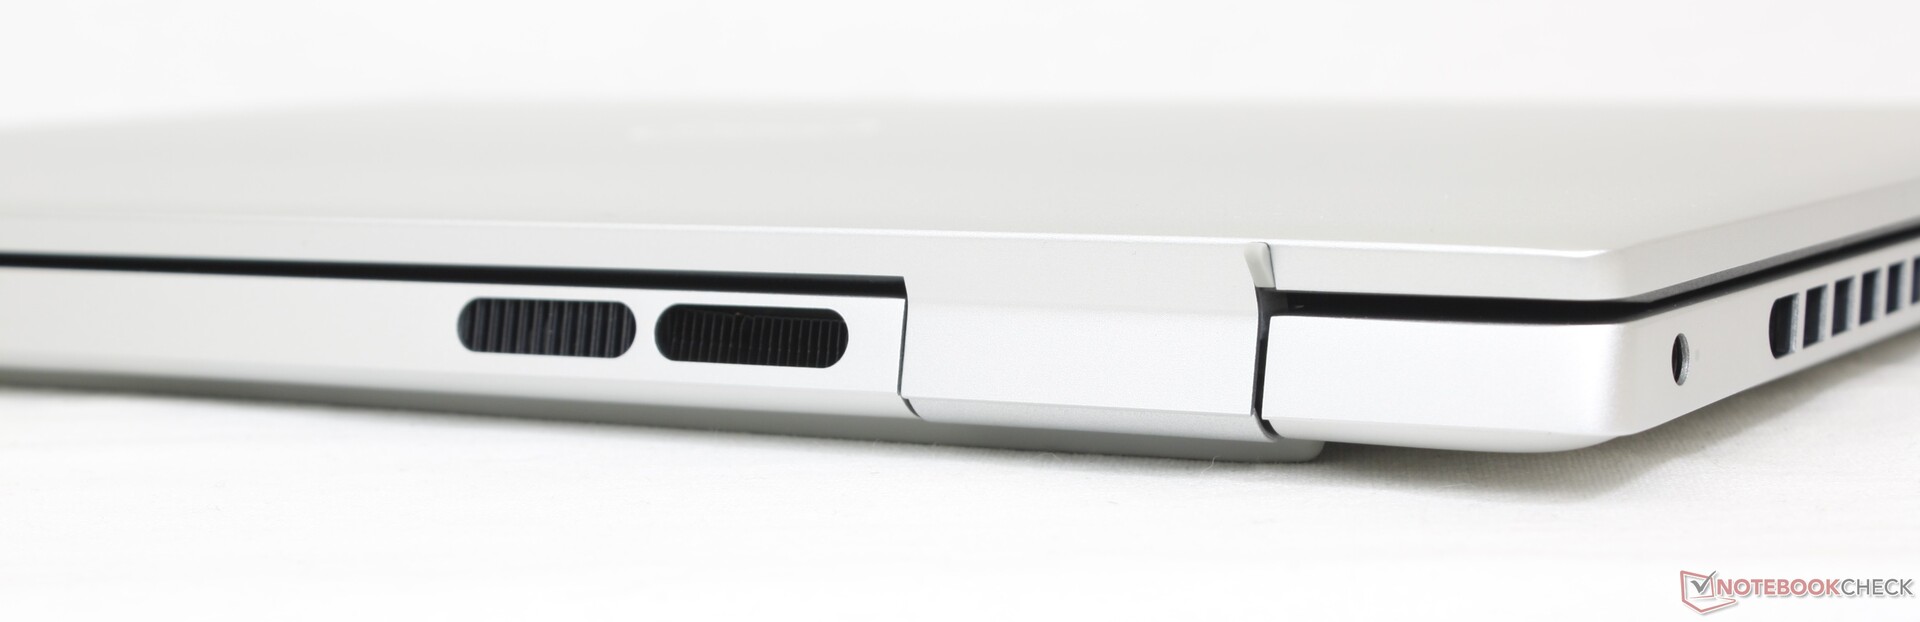
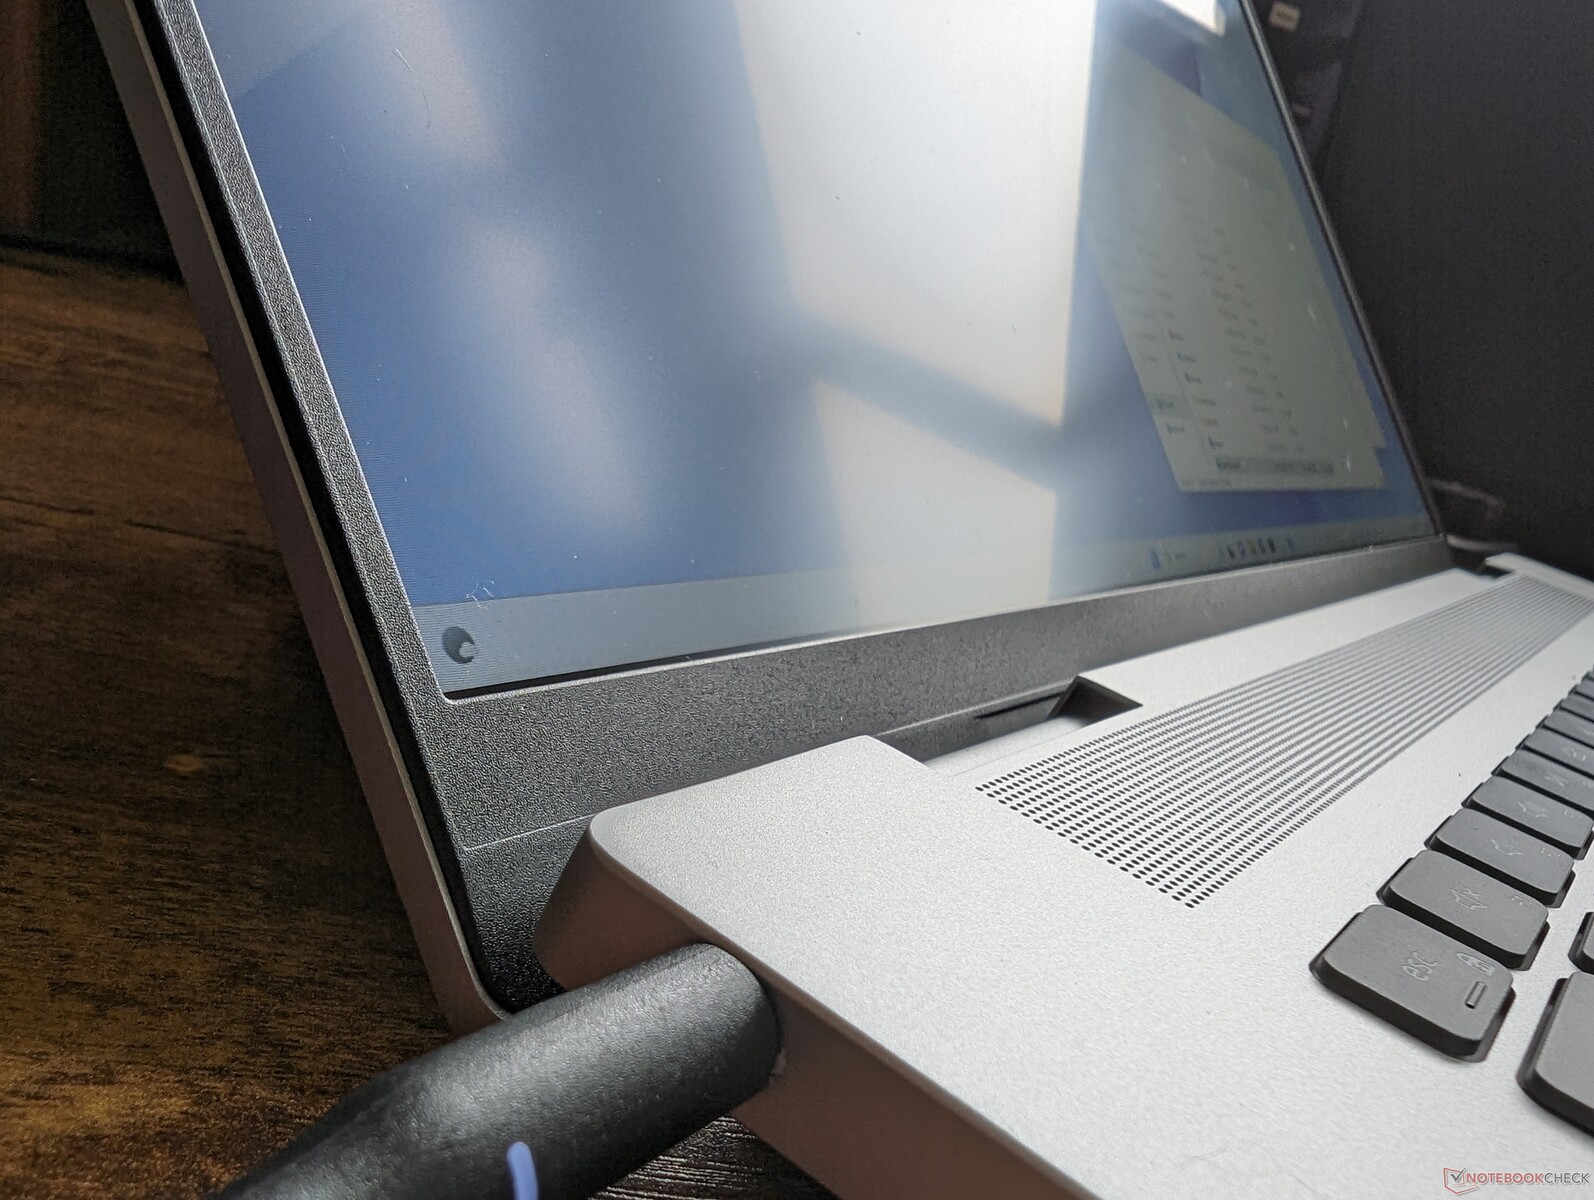
De Inspiron 16 Plus 7630 heeft drie opvallende uiterlijke wijzigingen ten opzichte van het model van vorig jaar. Ten eerste, en misschien wel het belangrijkste, zijn de scharnieren dikker en sterker dan voorheen. Ten tweede zijn er nu extra ventilatieroosters langs de randen om de koeling te bevorderen. En tot slot zijn de Mylar palmsteunen en het clickpad verwijderd, net als op de Inspiron 16 Plus 7635 2-in-1. Vooral de eerste twee moeten hopelijk de levensduur van het systeem verlengen, terwijl de laatste waarschijnlijk een kostenbesparende maatregel is.
De algehele stevigheid van het chassis is verder ongeveer hetzelfde als bij de Inspiron 16 Plus 7620, aangezien de skeletten van dezelfde materialen zijn gemaakt. Het apparaat ligt stevig in de hand, vergelijkbaar met de Envy 16maar met een iets zwakker deksel omdat de Dell geen Gorilla Glass versterking heeft.
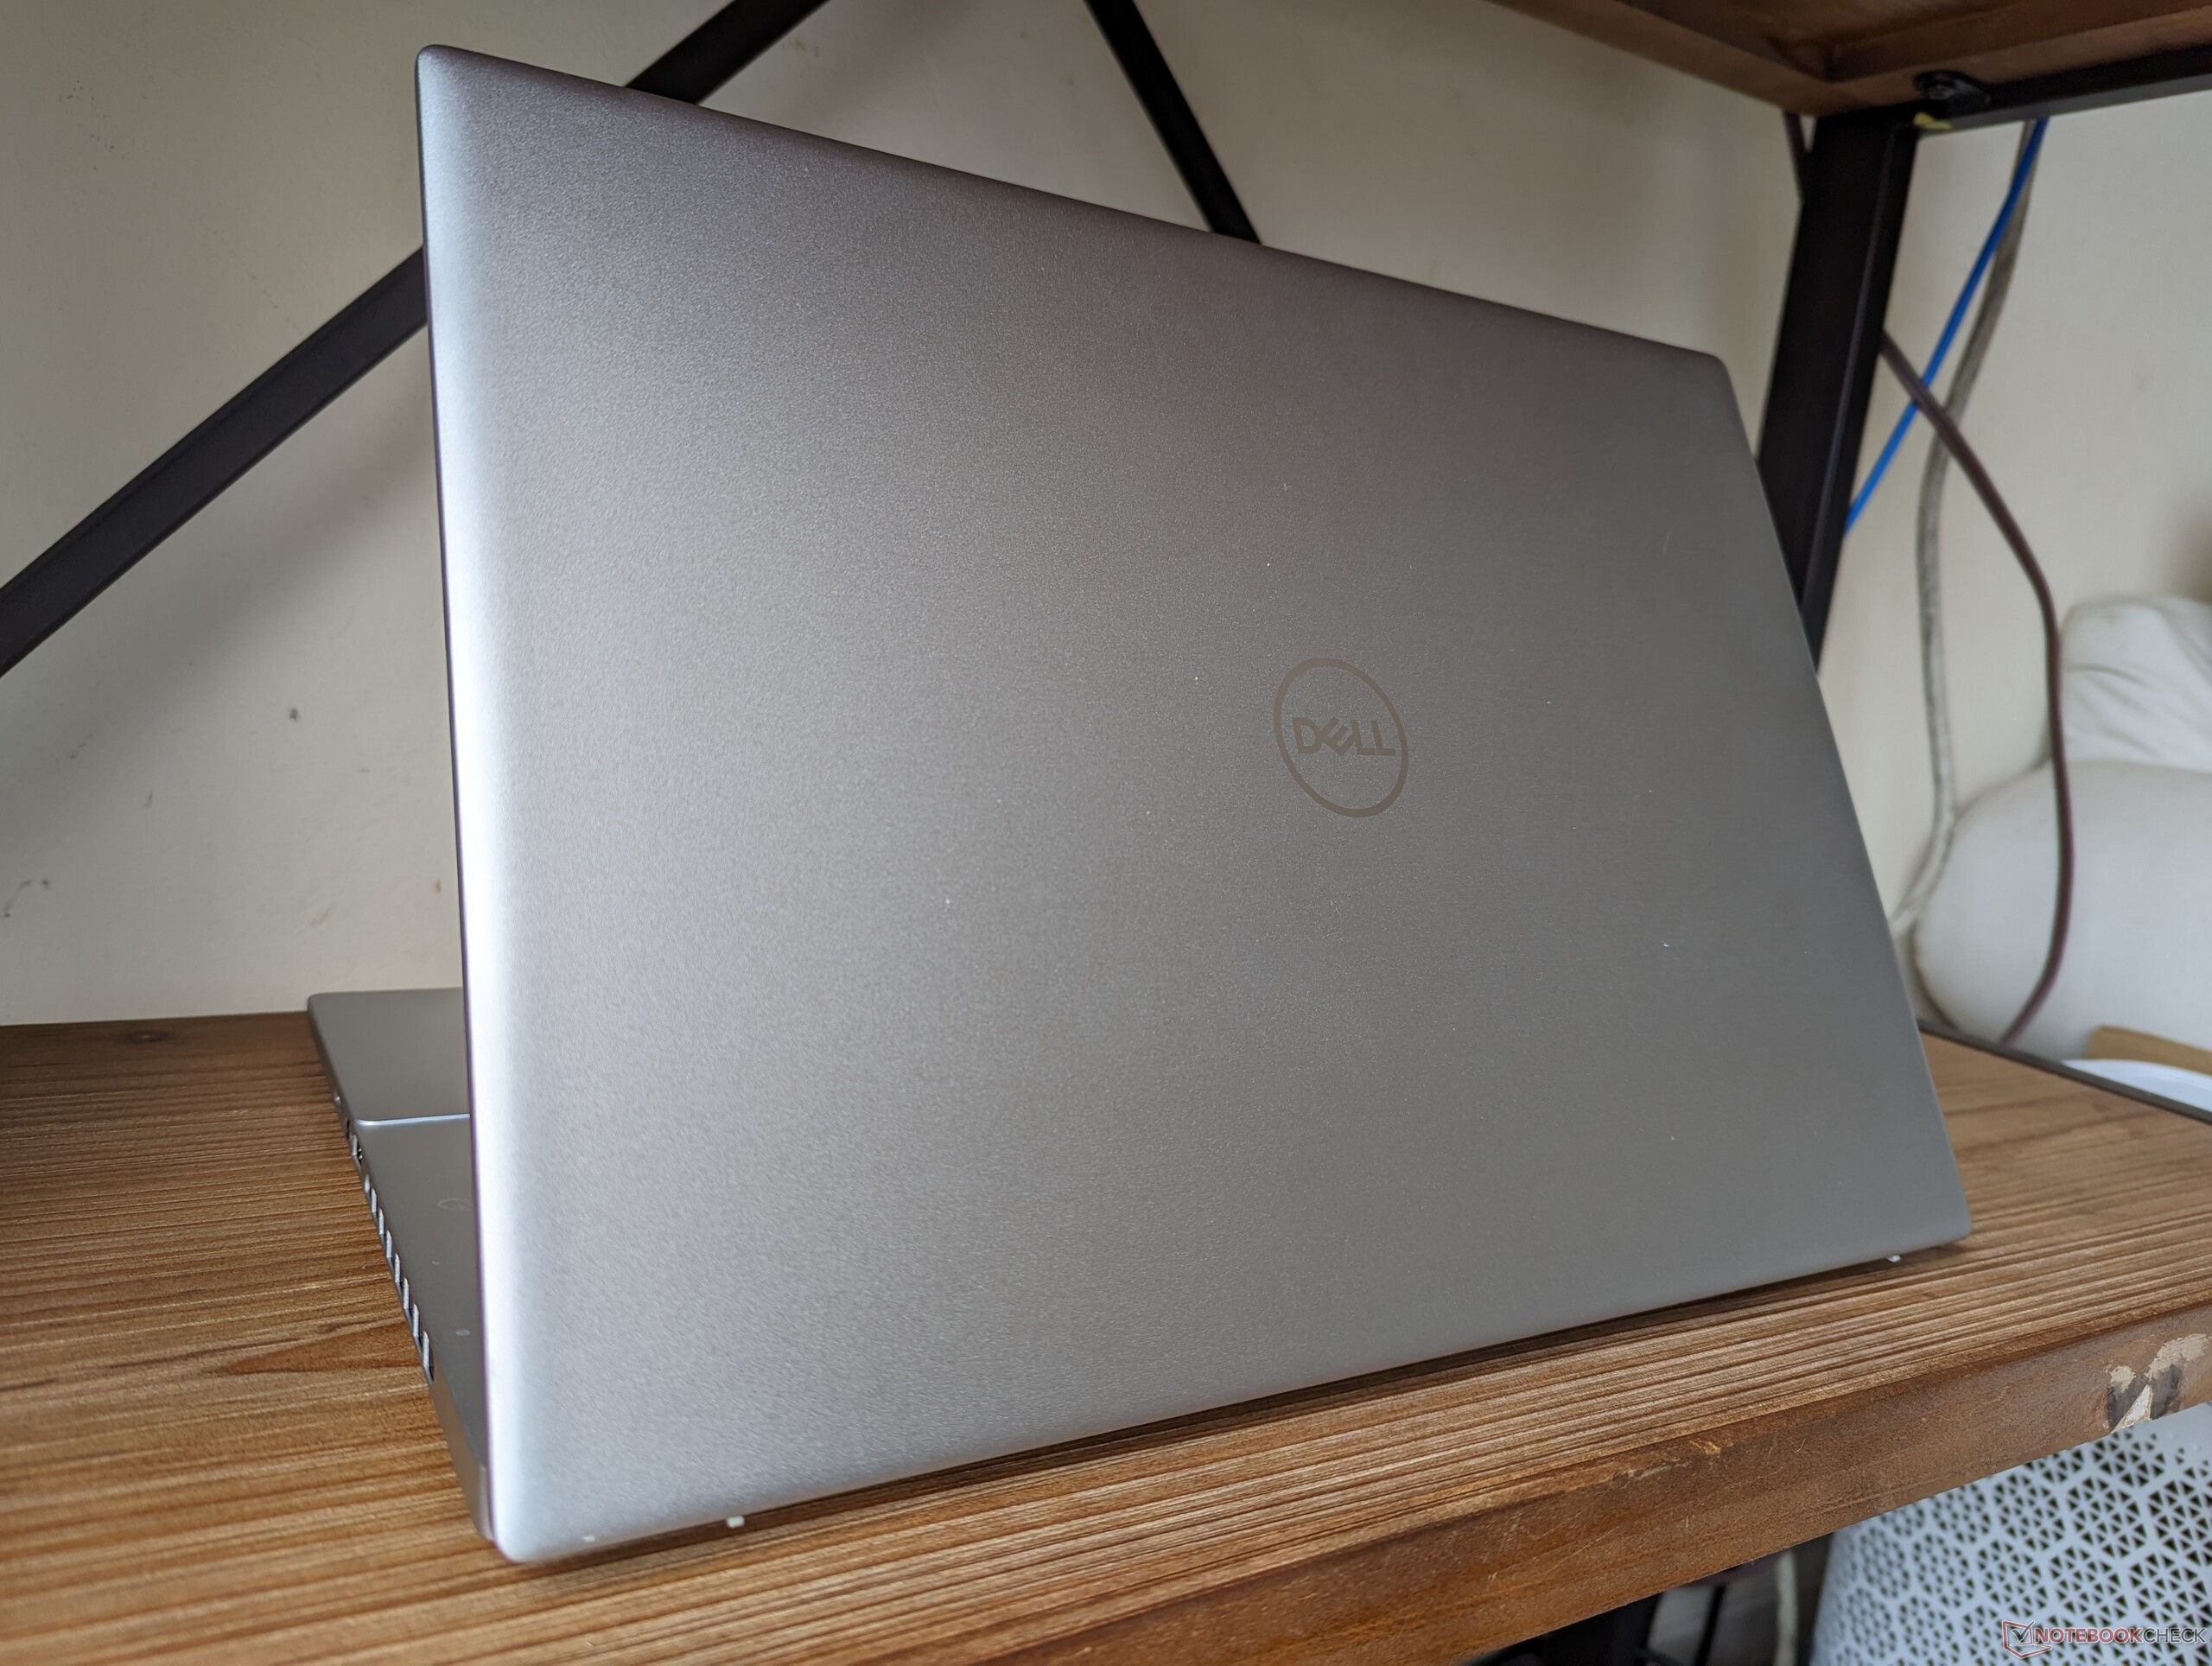
Afmetingen en gewicht blijven ongeveer hetzelfde als bij het ontwerp van vorig jaar, maar zijn wel iets zwaarder (ongeveer 100 g). Hoewel de Dell niet echt lichtgewicht is, is hij nog steeds vergelijkbaar met alternatieven zoals de Slim Pro 9i 16 of Envy 16 in dit opzicht.
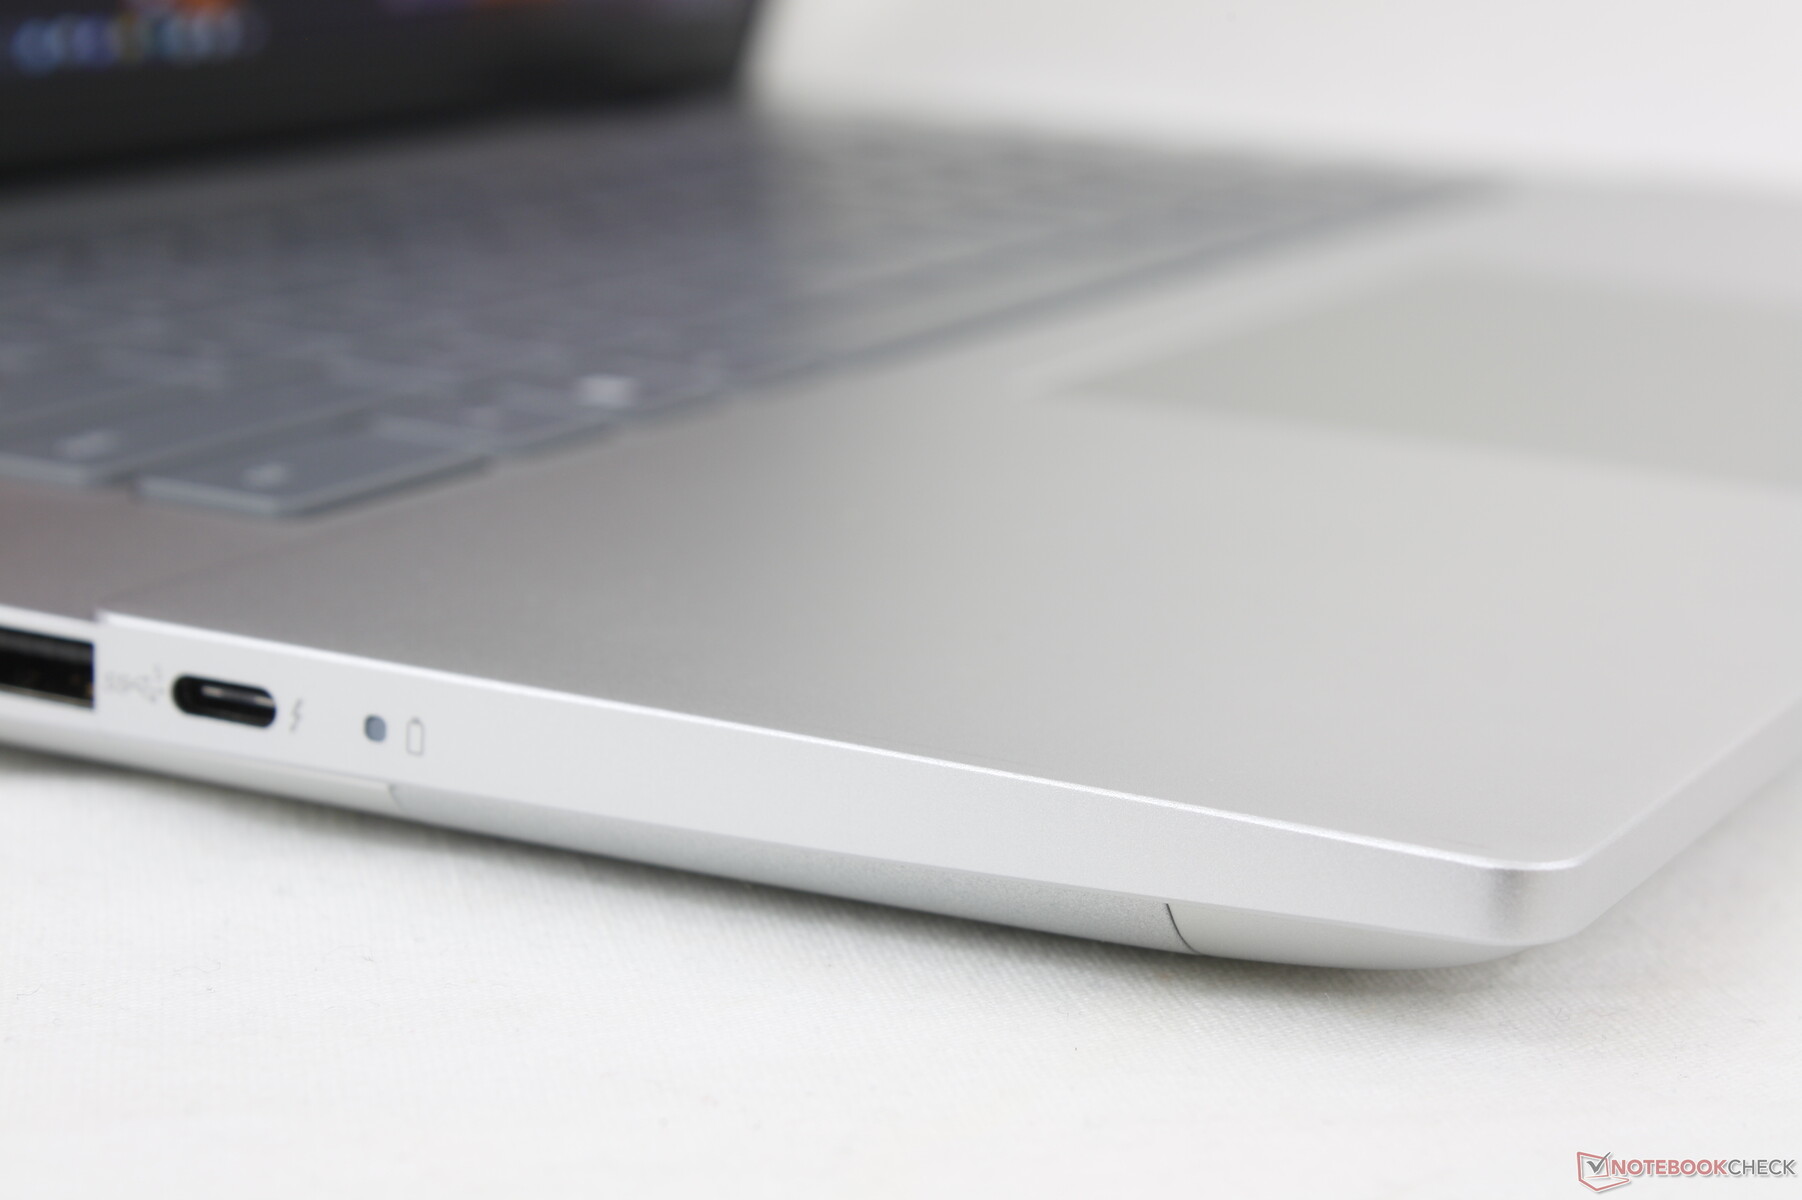
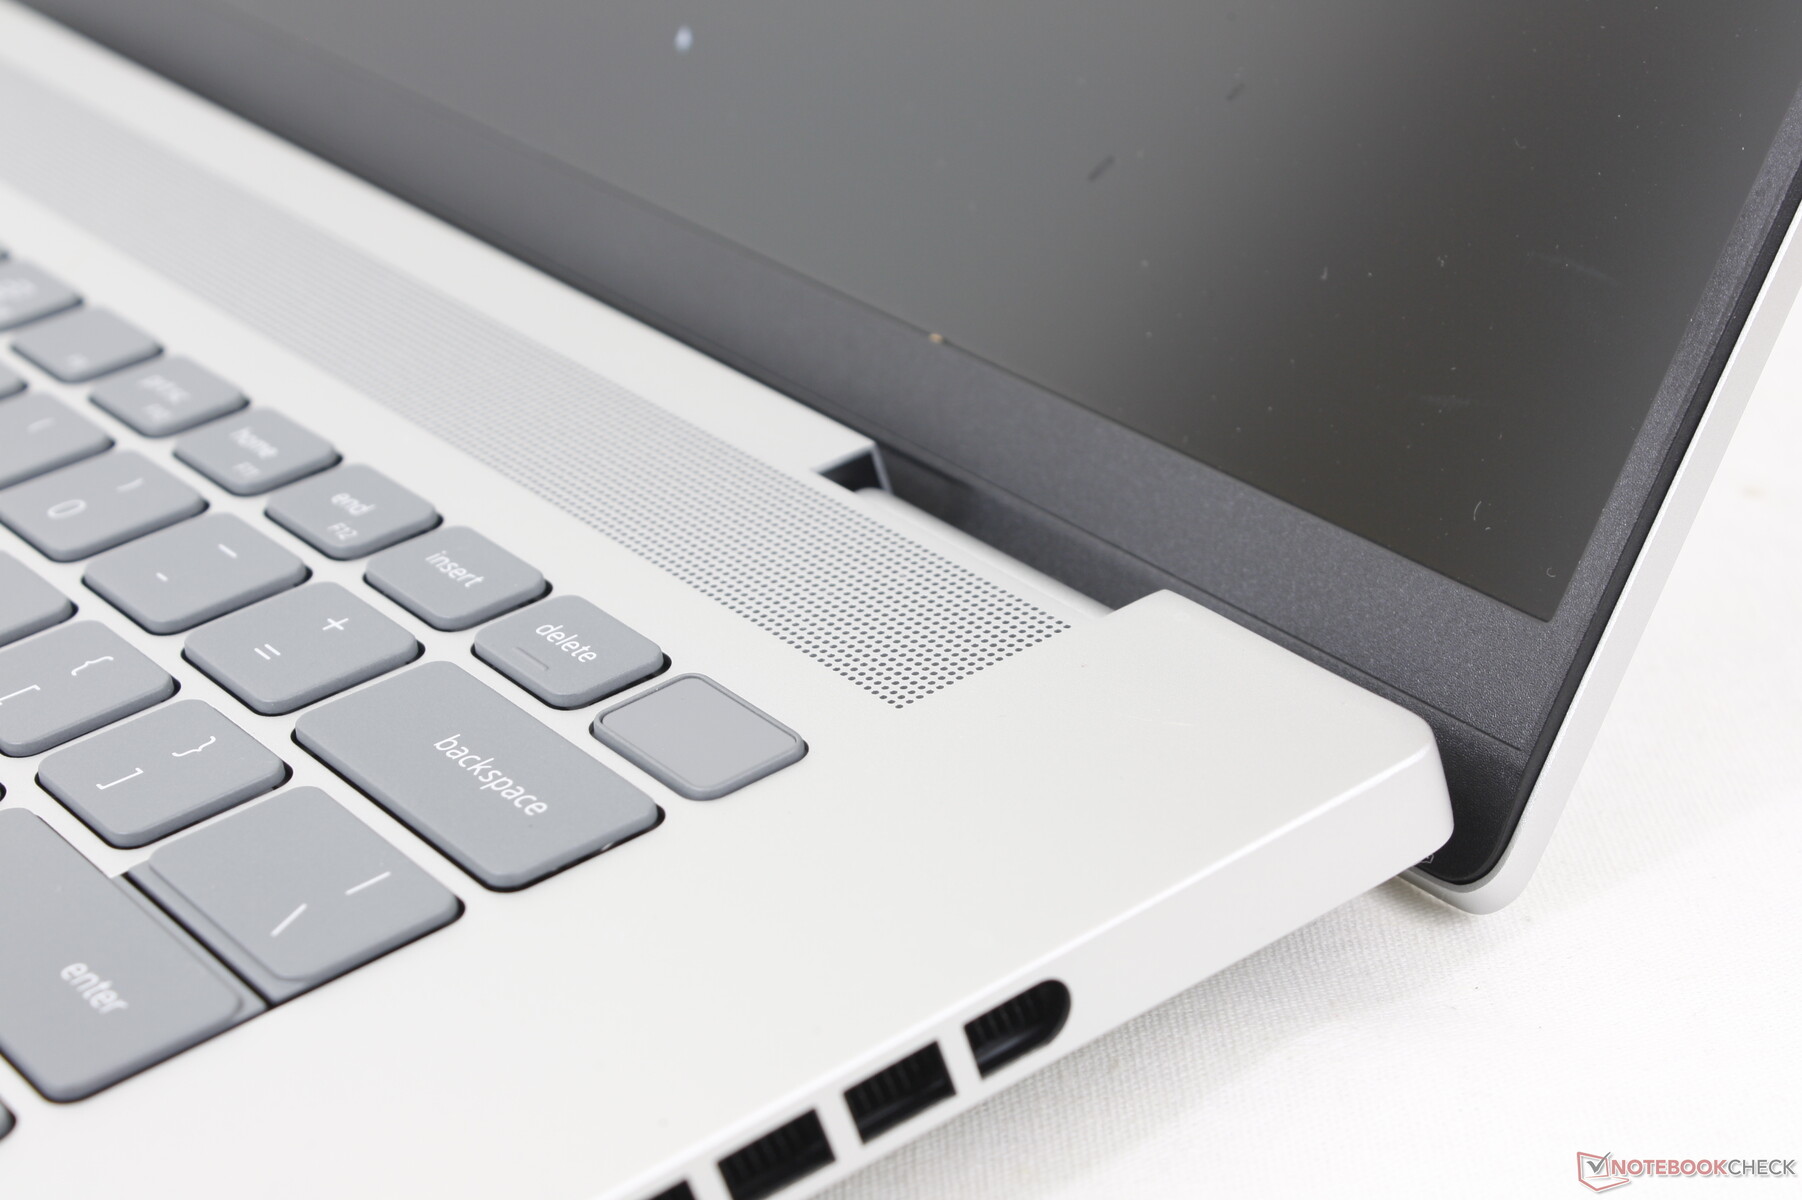

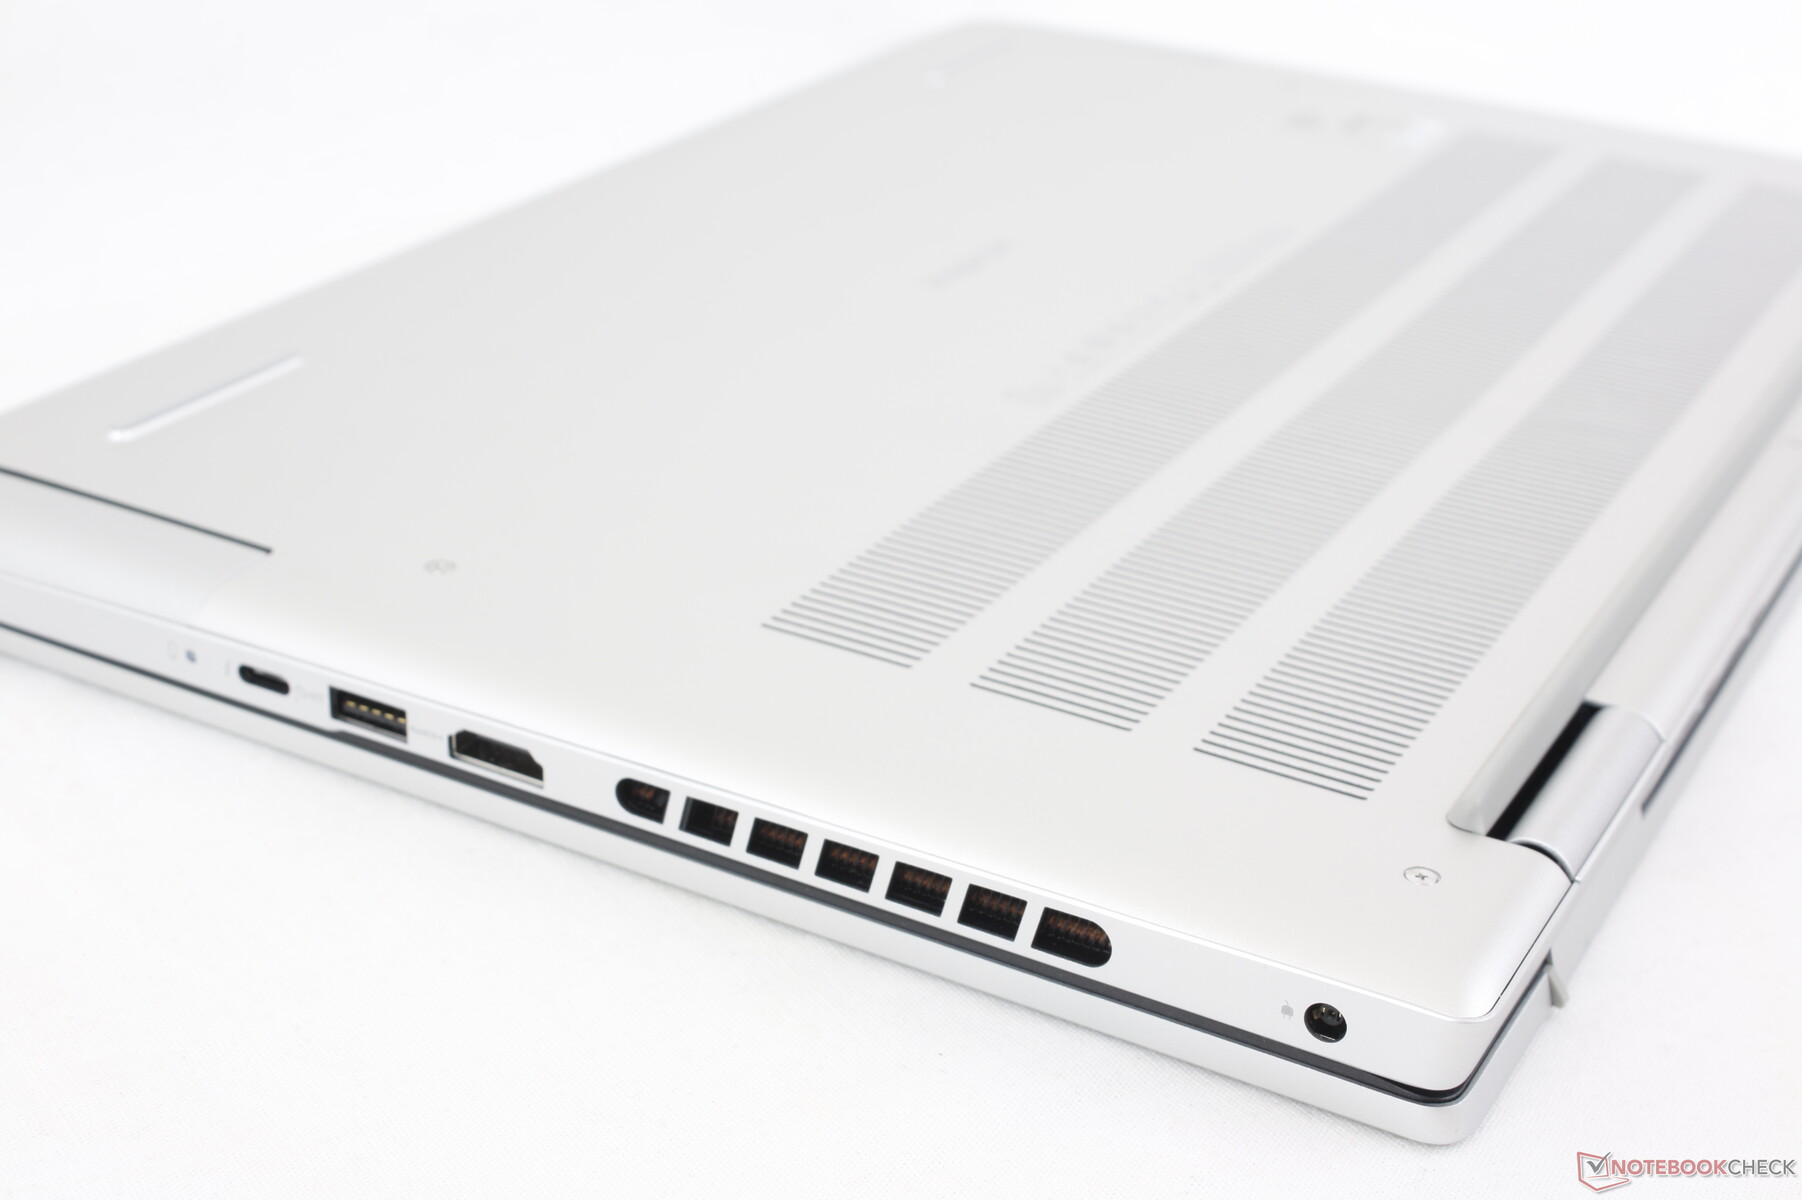
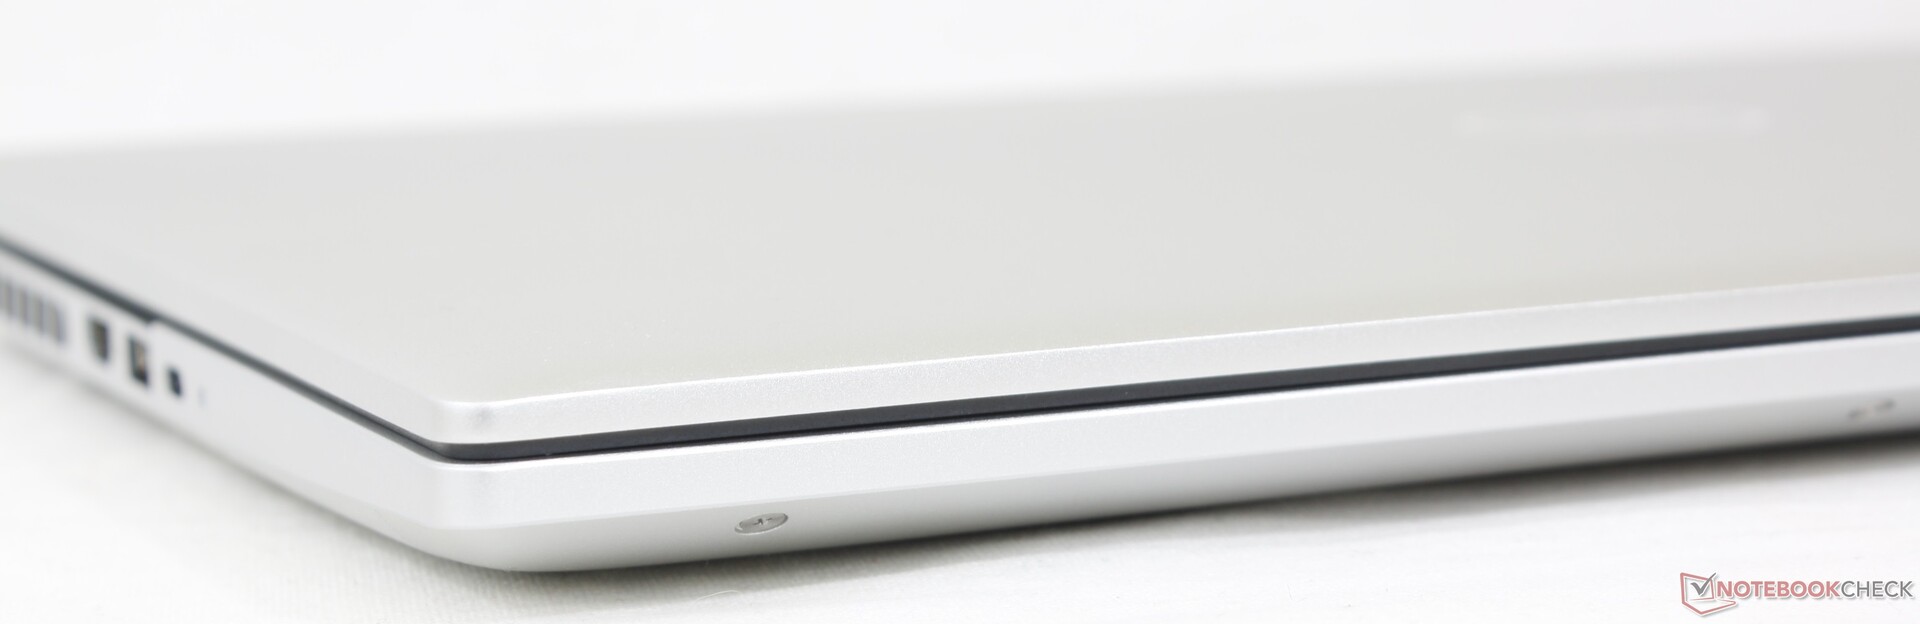
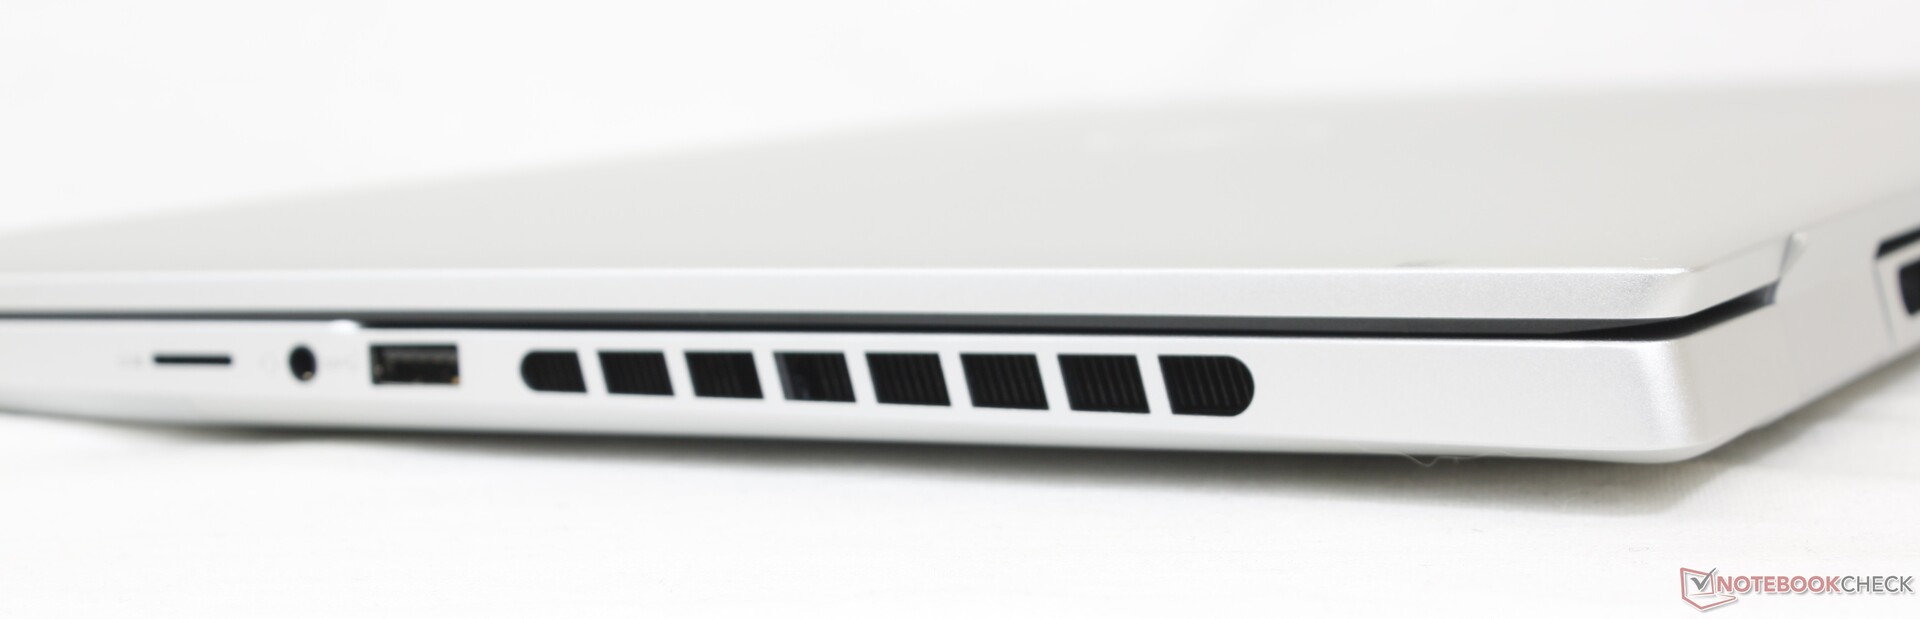
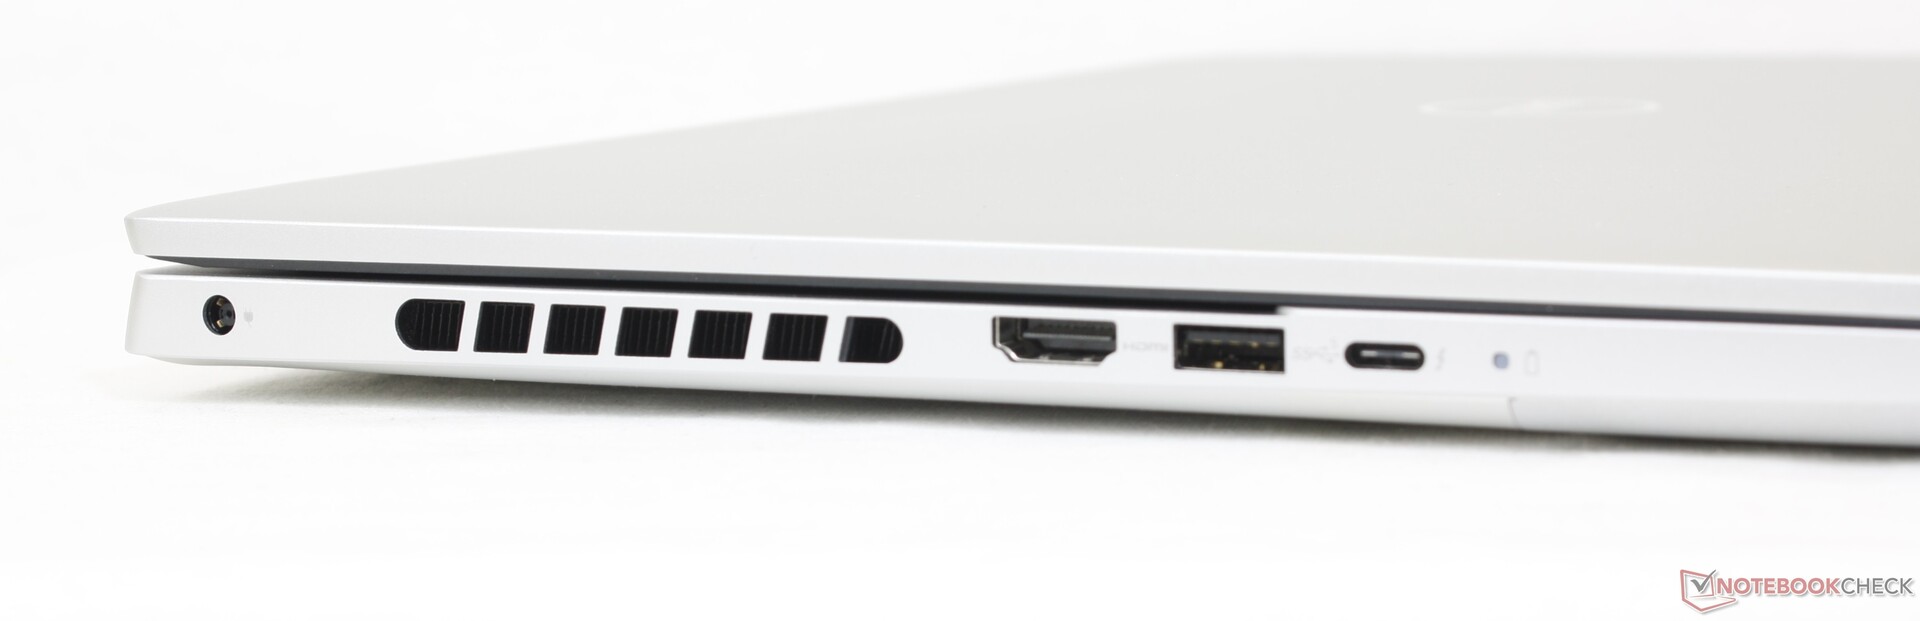
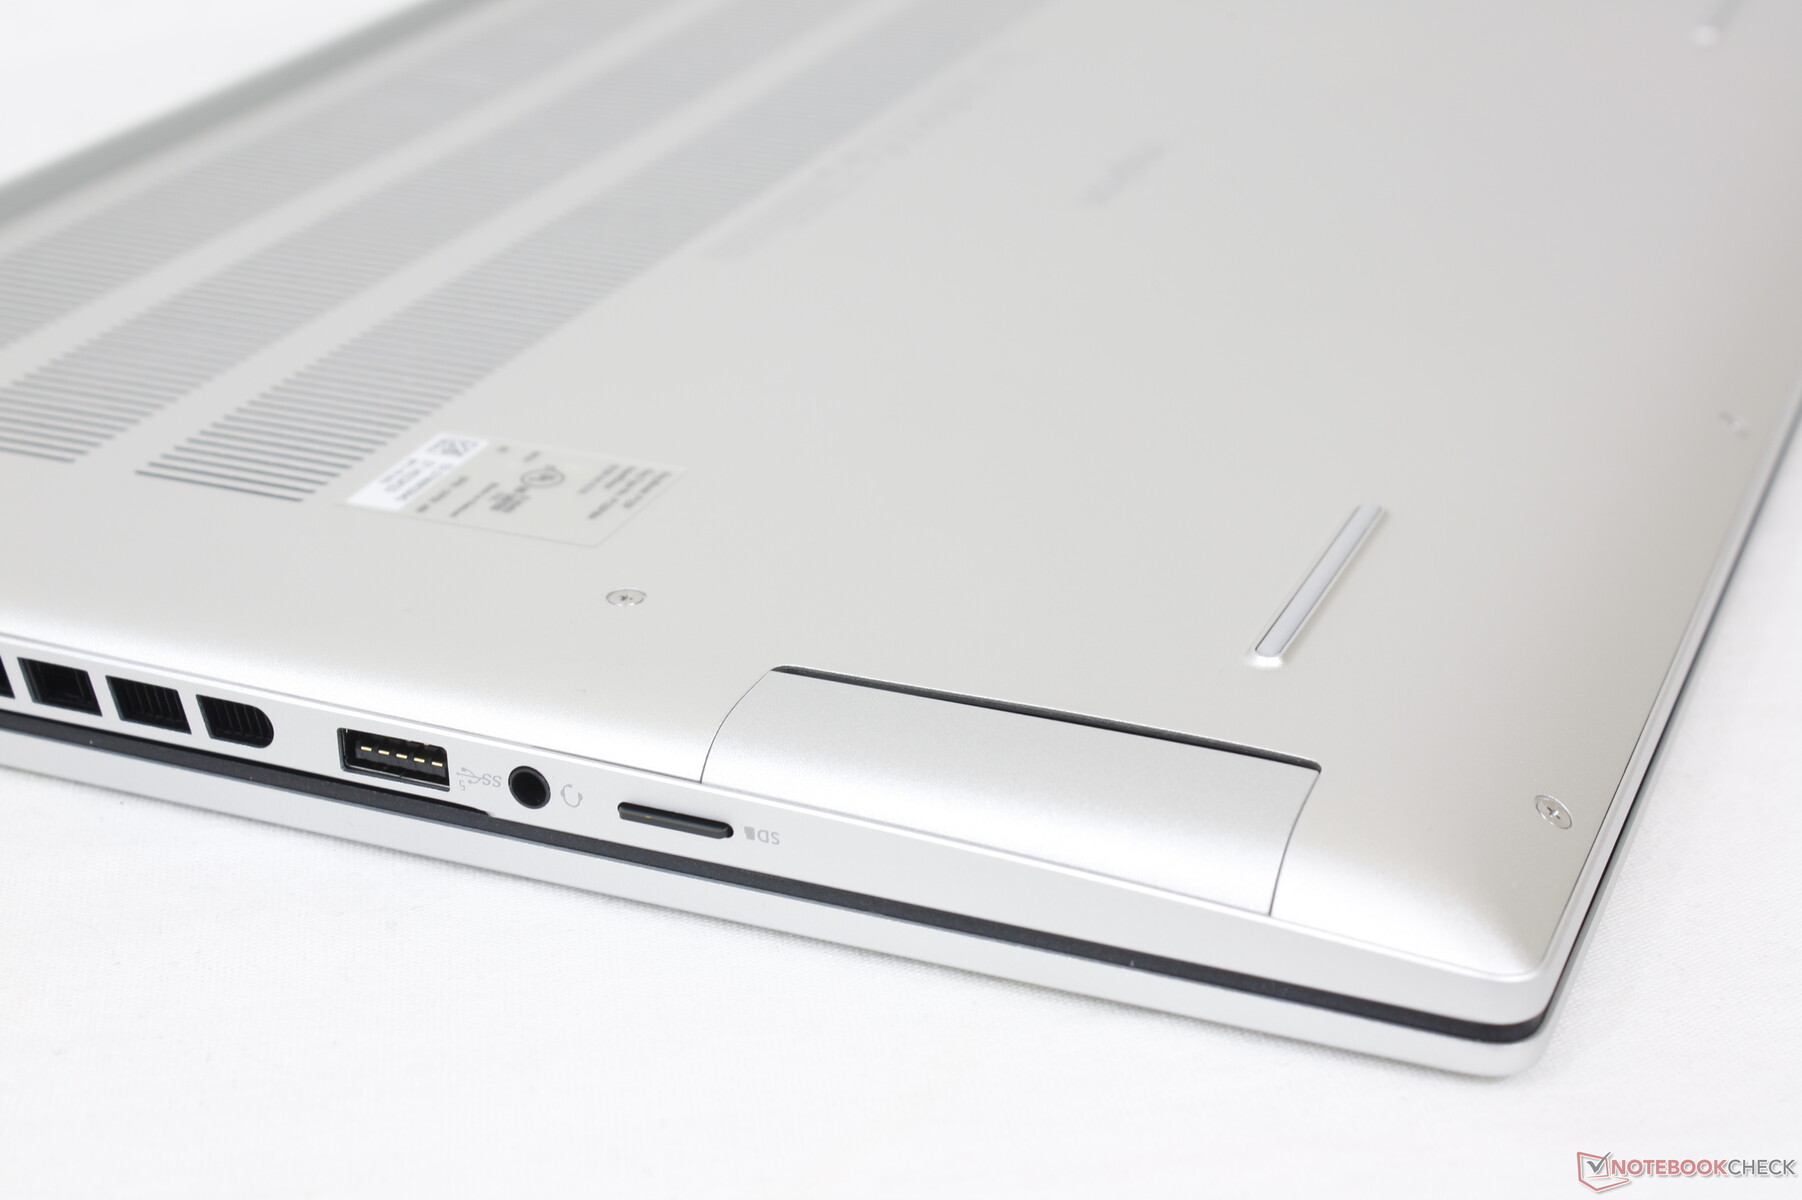
Connectiviteit - Kan meer USB-C gebruiken
De poortpositionering en opties zijn hetzelfde als bij het model van vorig jaar, maar met één opvallende achteruitgang: de full-size SD-kaartlezer is verwijderd en vervangen door een kleinere microSD-lezer op alle RTX 4060 configuraties. Alternatieven zoals de Envy 16 of VivoBook Pro 16X hebben meer USB-C poorten dan onze Dell of hebben SD-kaartlezers van volledig formaat.
We zouden ook graag zien dat toekomstige Inspiron-modellen de eigen AC-adapterpoort laten vallen ten gunste van USB-C opladen, zoals op de XPS 15 en XPS 17 series.
SD-kaartlezer
Terwijl de XPS-serie enkele van de snelste SD-kaartlezers op laptops bevat, heeft de Inspiron-serie enkele van de langzaamste. Het verplaatsen van 1 GB aan foto's van onze UHS-II testkaart naar de desktop duurde meer dan 50 seconden, vergeleken met slechts 5 tot 6 seconden op een XPS 15 of XPS 17.
| SD Card Reader | |
| average JPG Copy Test (av. of 3 runs) | |
| MSI Summit E16 Flip A12UDT-031 (AV Pro SD microSD 128 GB V60) | |
| Asus Vivobook Pro 16X K6604JV-MX016W | |
| Lenovo Slim Pro 9i 16IRP8 (PNY EliteX-Pro60 V60 256 GB) | |
| HP Envy 16 h0112nr (AV Pro SD microSD 128 GB V60) | |
| Dell Inspiron 16 Plus 7620 (Toshiba Exceria Pro SDXC 64 GB UHS-II) | |
| Dell Inspiron 16 Plus 7630 (AV Pro SD microSD 128 GB V60) | |
| maximum AS SSD Seq Read Test (1GB) | |
| MSI Summit E16 Flip A12UDT-031 (AV Pro SD microSD 128 GB V60) | |
| Asus Vivobook Pro 16X K6604JV-MX016W | |
| Lenovo Slim Pro 9i 16IRP8 (PNY EliteX-Pro60 V60 256 GB) | |
| HP Envy 16 h0112nr (AV Pro SD microSD 128 GB V60) | |
| Dell Inspiron 16 Plus 7620 (Toshiba Exceria Pro SDXC 64 GB UHS-II) | |
| Dell Inspiron 16 Plus 7630 (AV Pro SD microSD 128 GB V60) | |
Communicatie
Een Intel AX211 wordt standaard geleverd voor Wi-Fi 6E en Bluetooth 5.3 connectiviteit. We hebben stabiele en betrouwbare prestaties ervaren toen we deze koppelden aan ons Asus AXE11000 6GHz testnetwerk.
In plaats daarvan wordt een MediaTek module meegeleverd als deze wordt geconfigureerd met een AMD CPU.
Webcam
De 2 MP webcam is standaard geworden op de meeste multimedia laptops. Duurdere modellen van HP hebben 5 MP of zelfs 8 MP webcams als de kwaliteit van de webcam prioriteit heeft.
Er zit een fysieke schuifregelaar op voor privacy, maar IR wordt niet ondersteund.


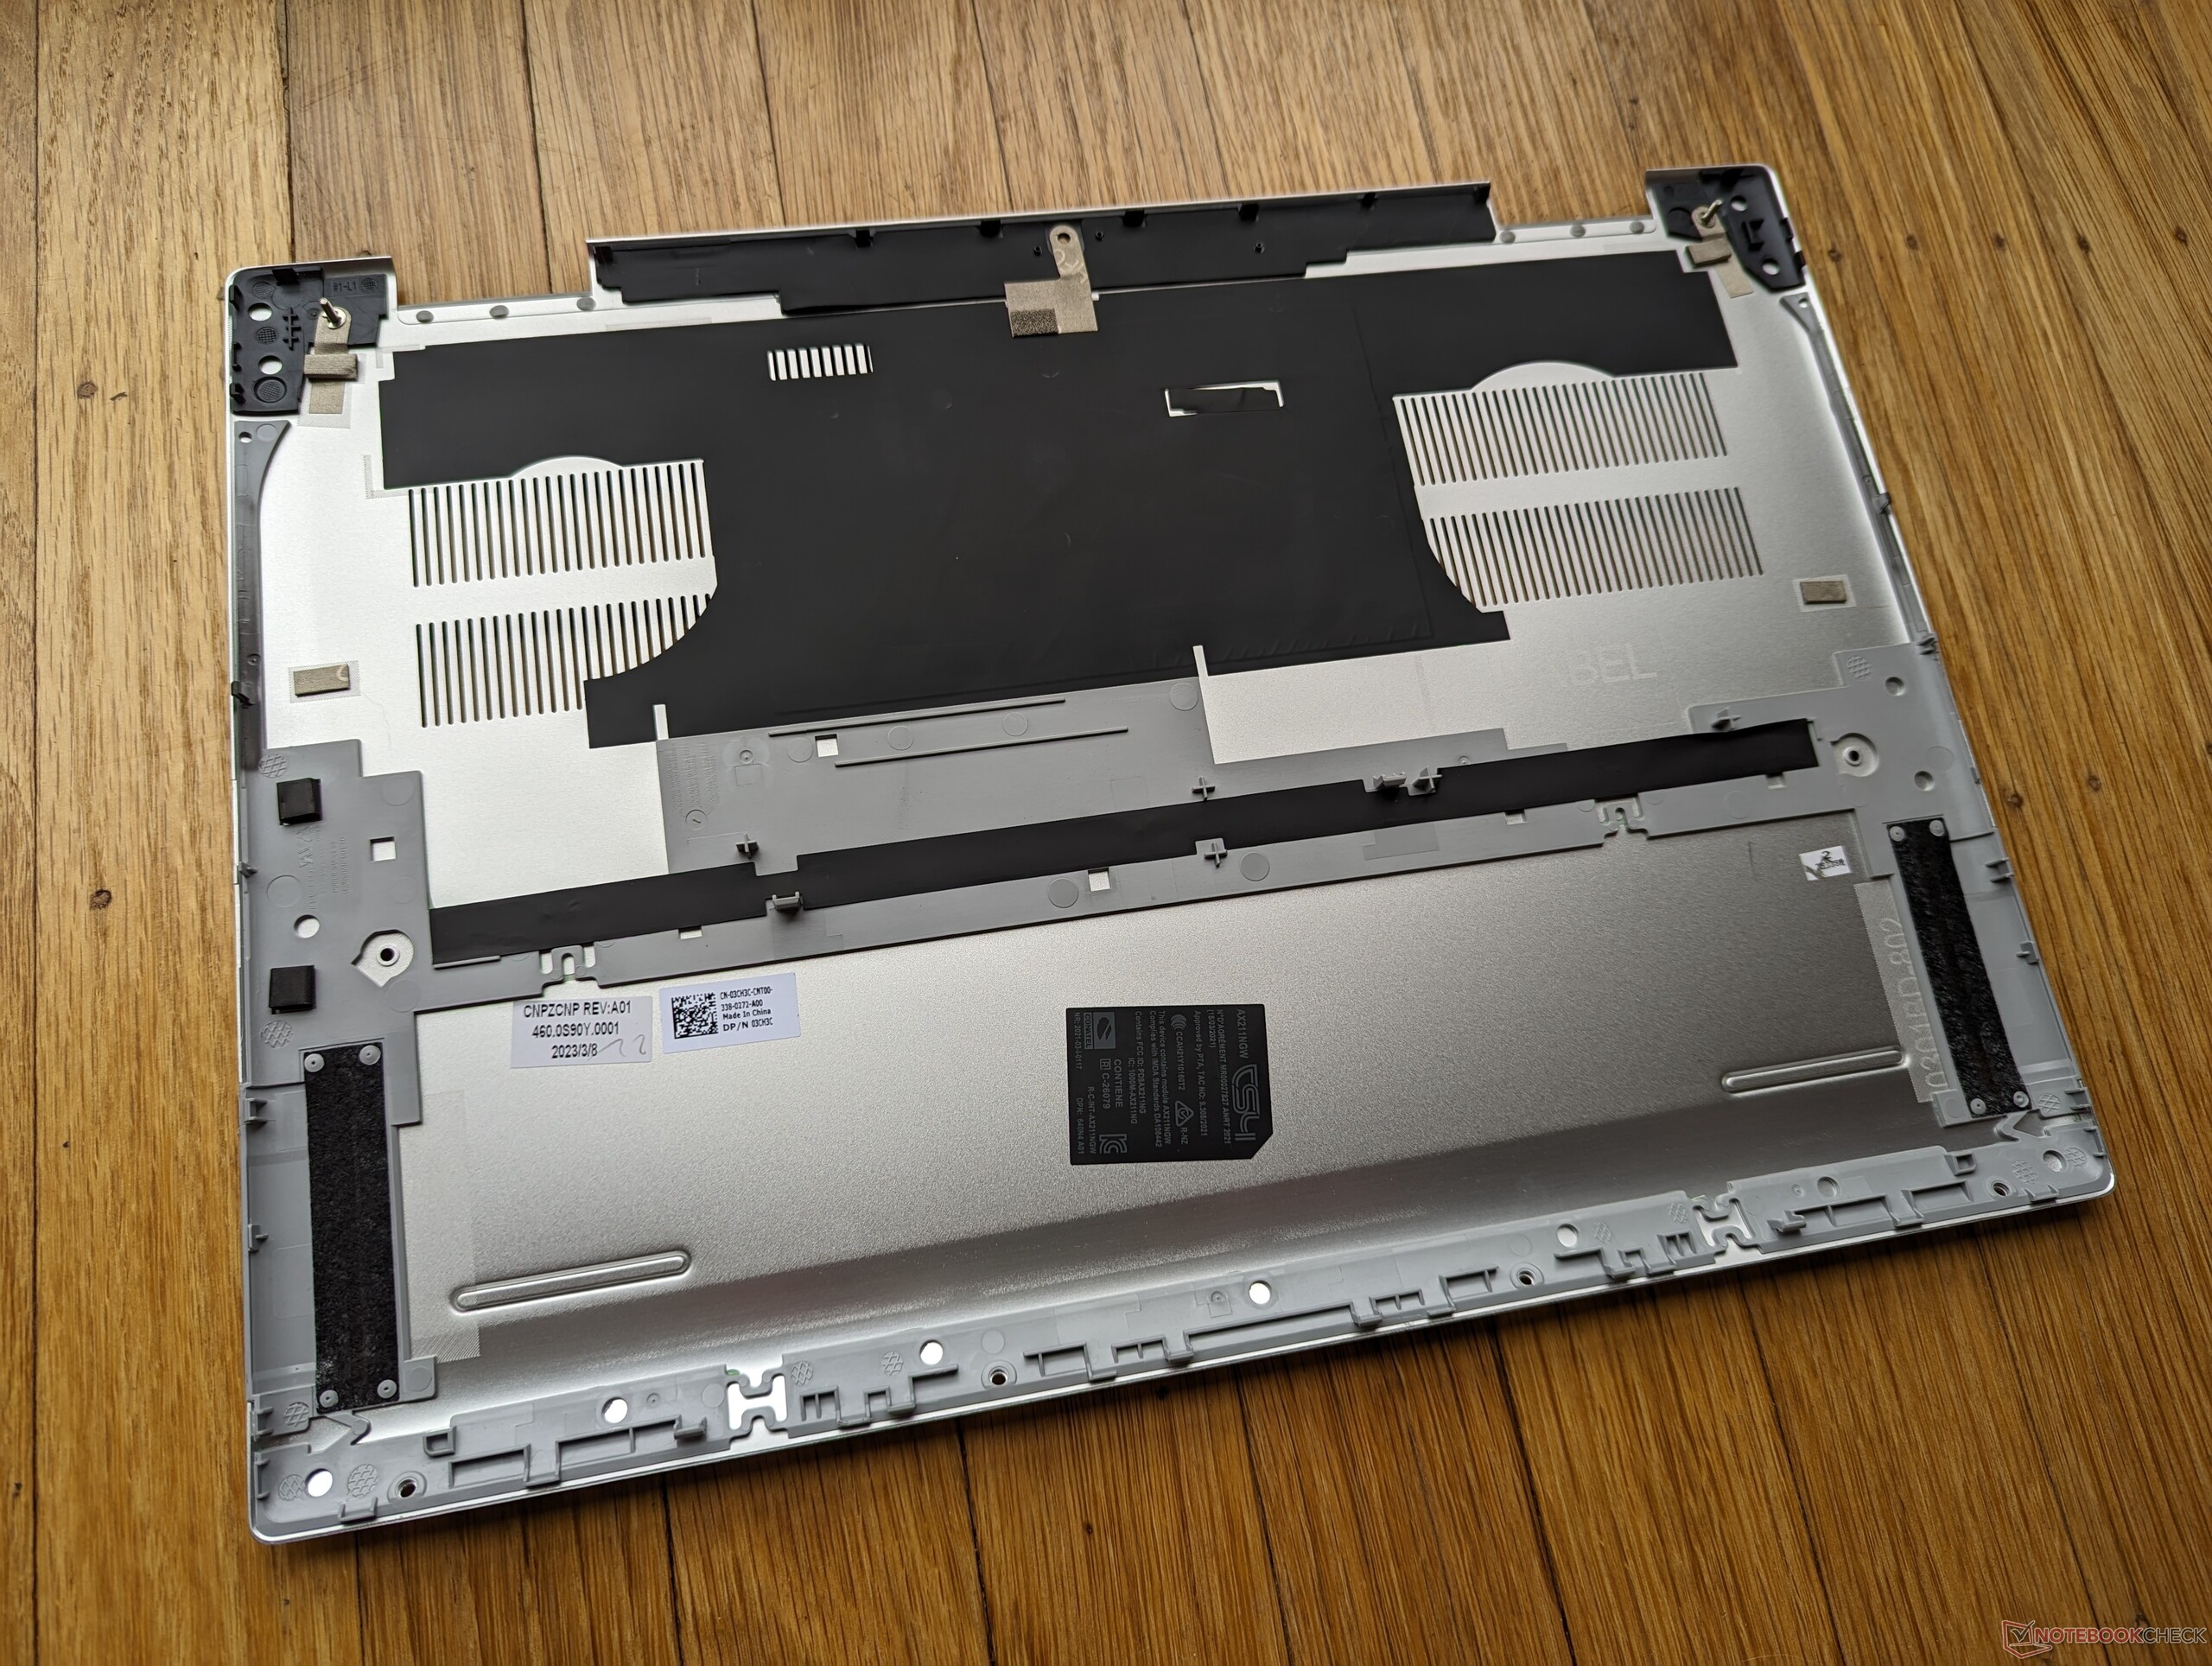
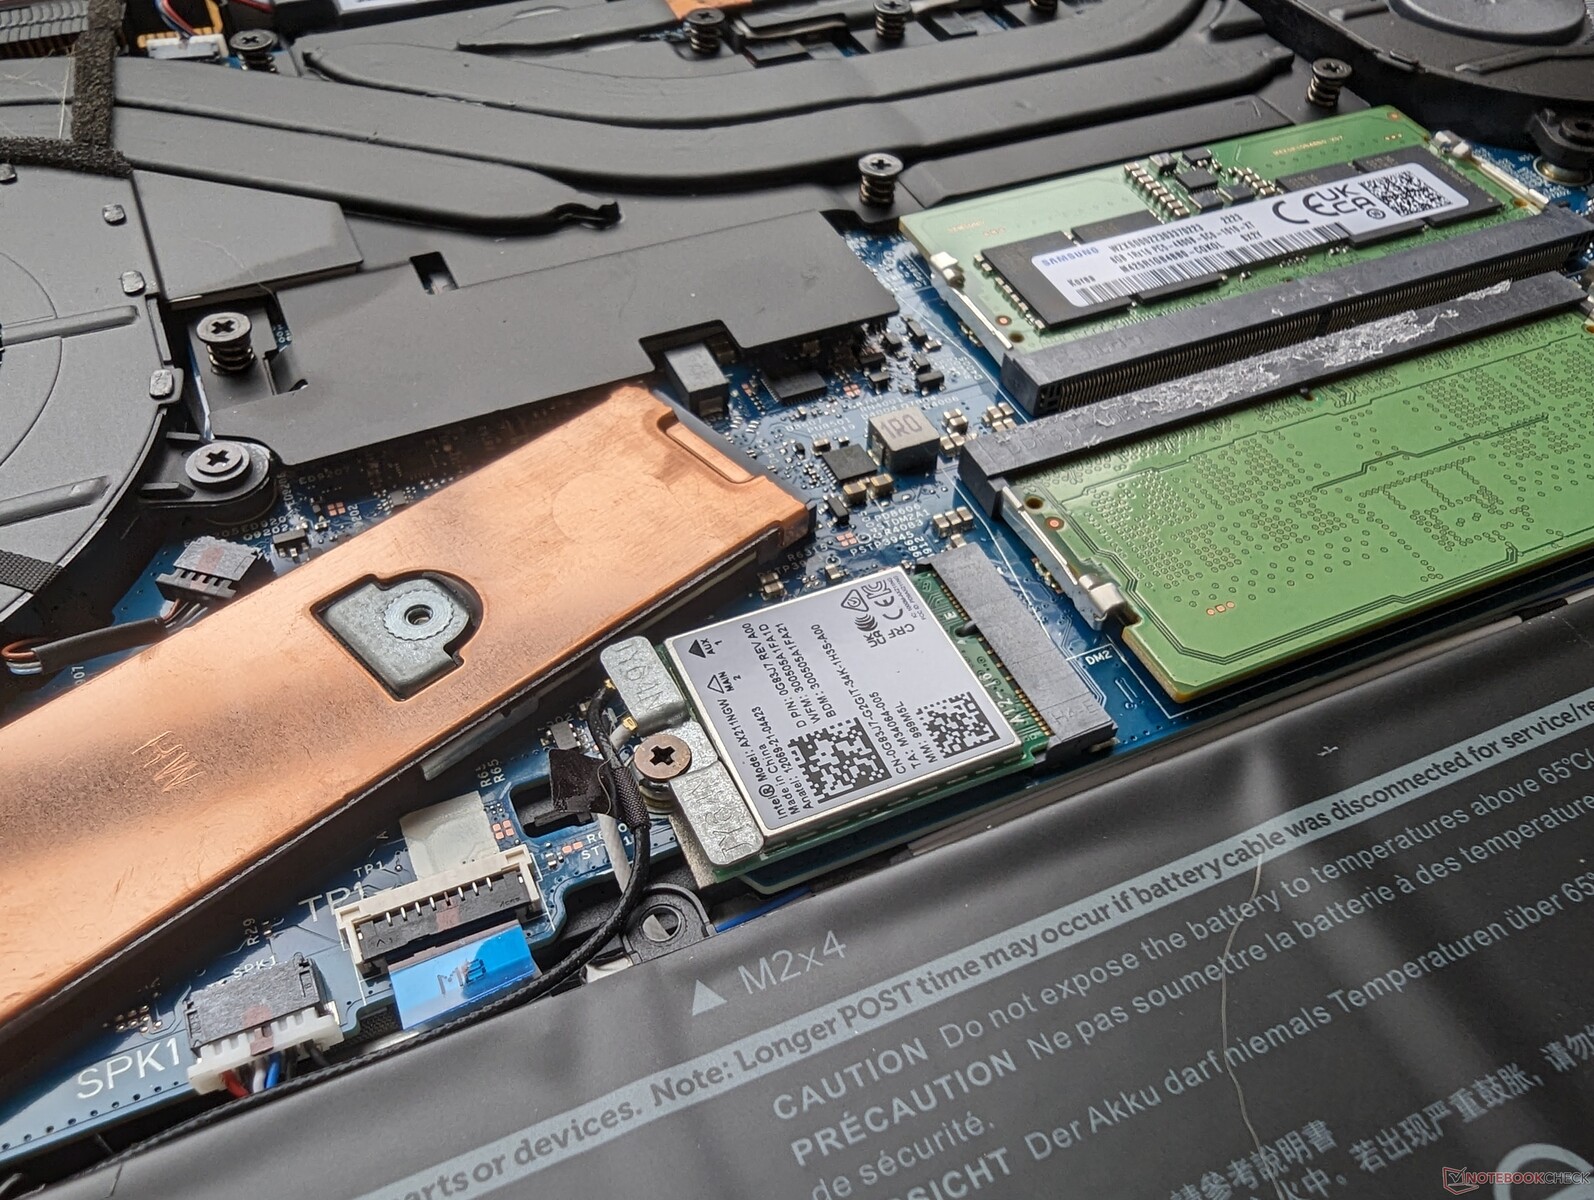
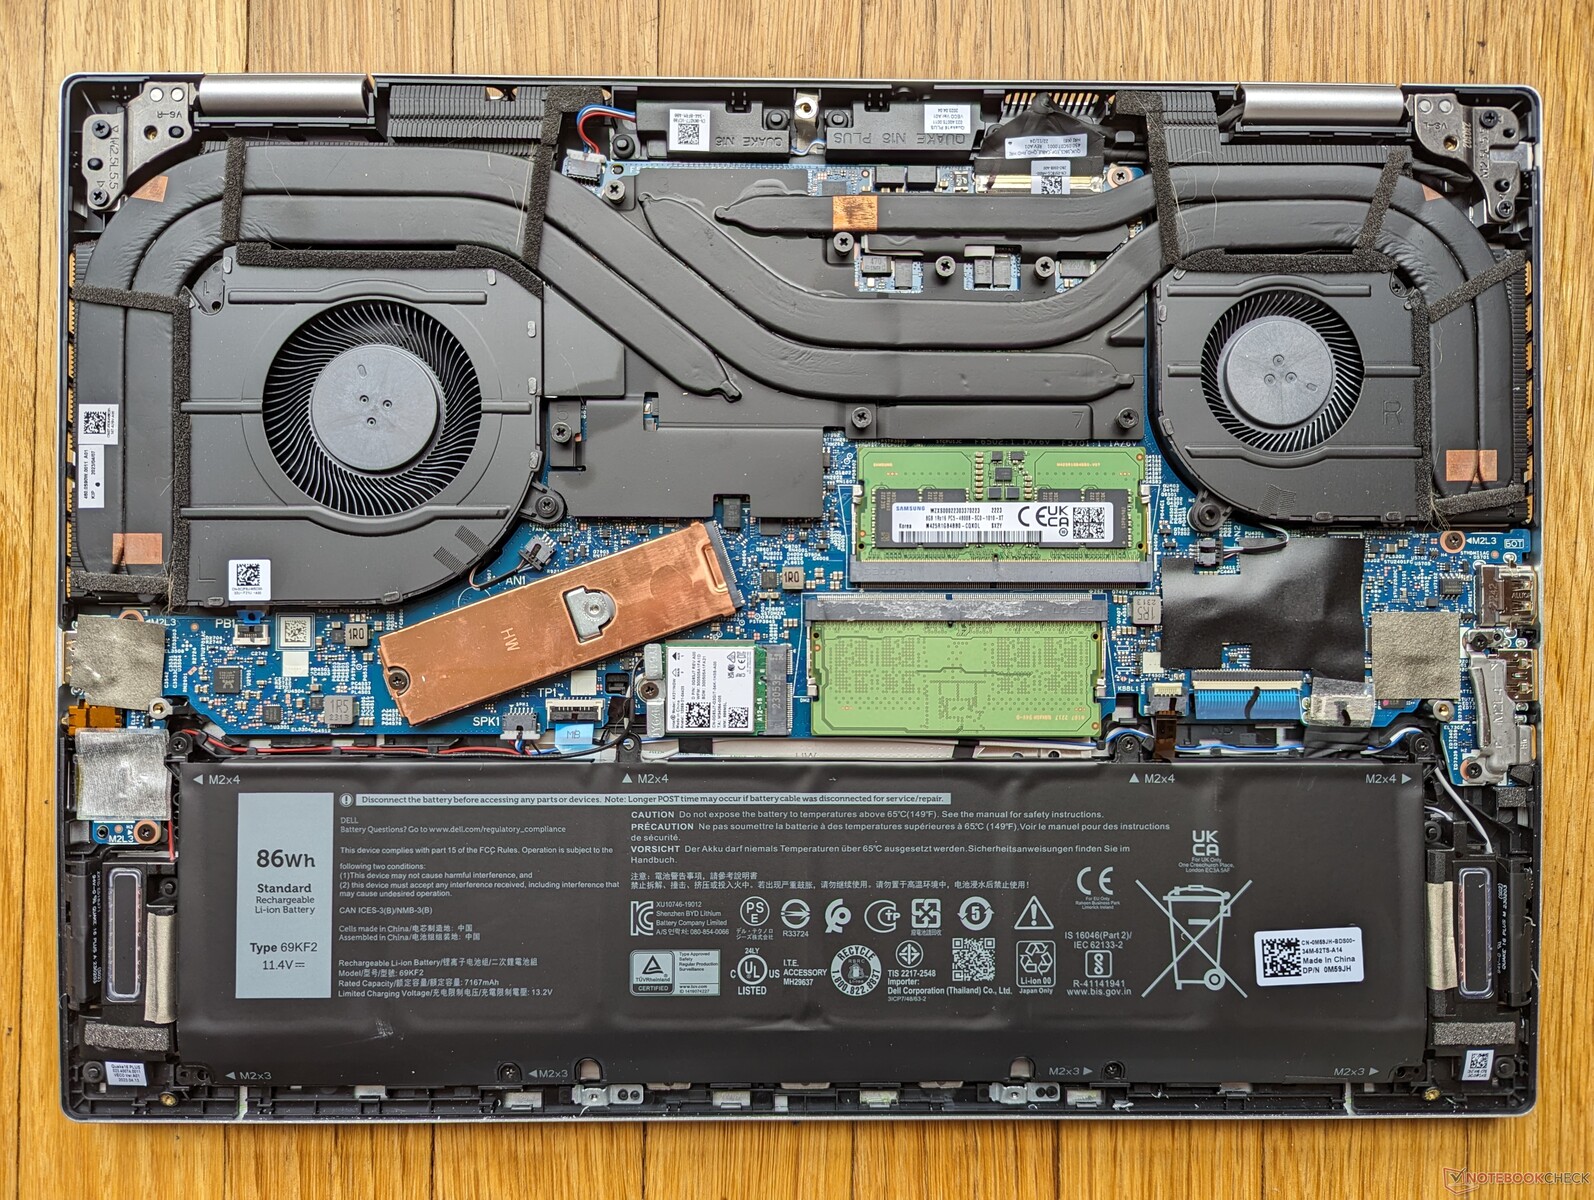
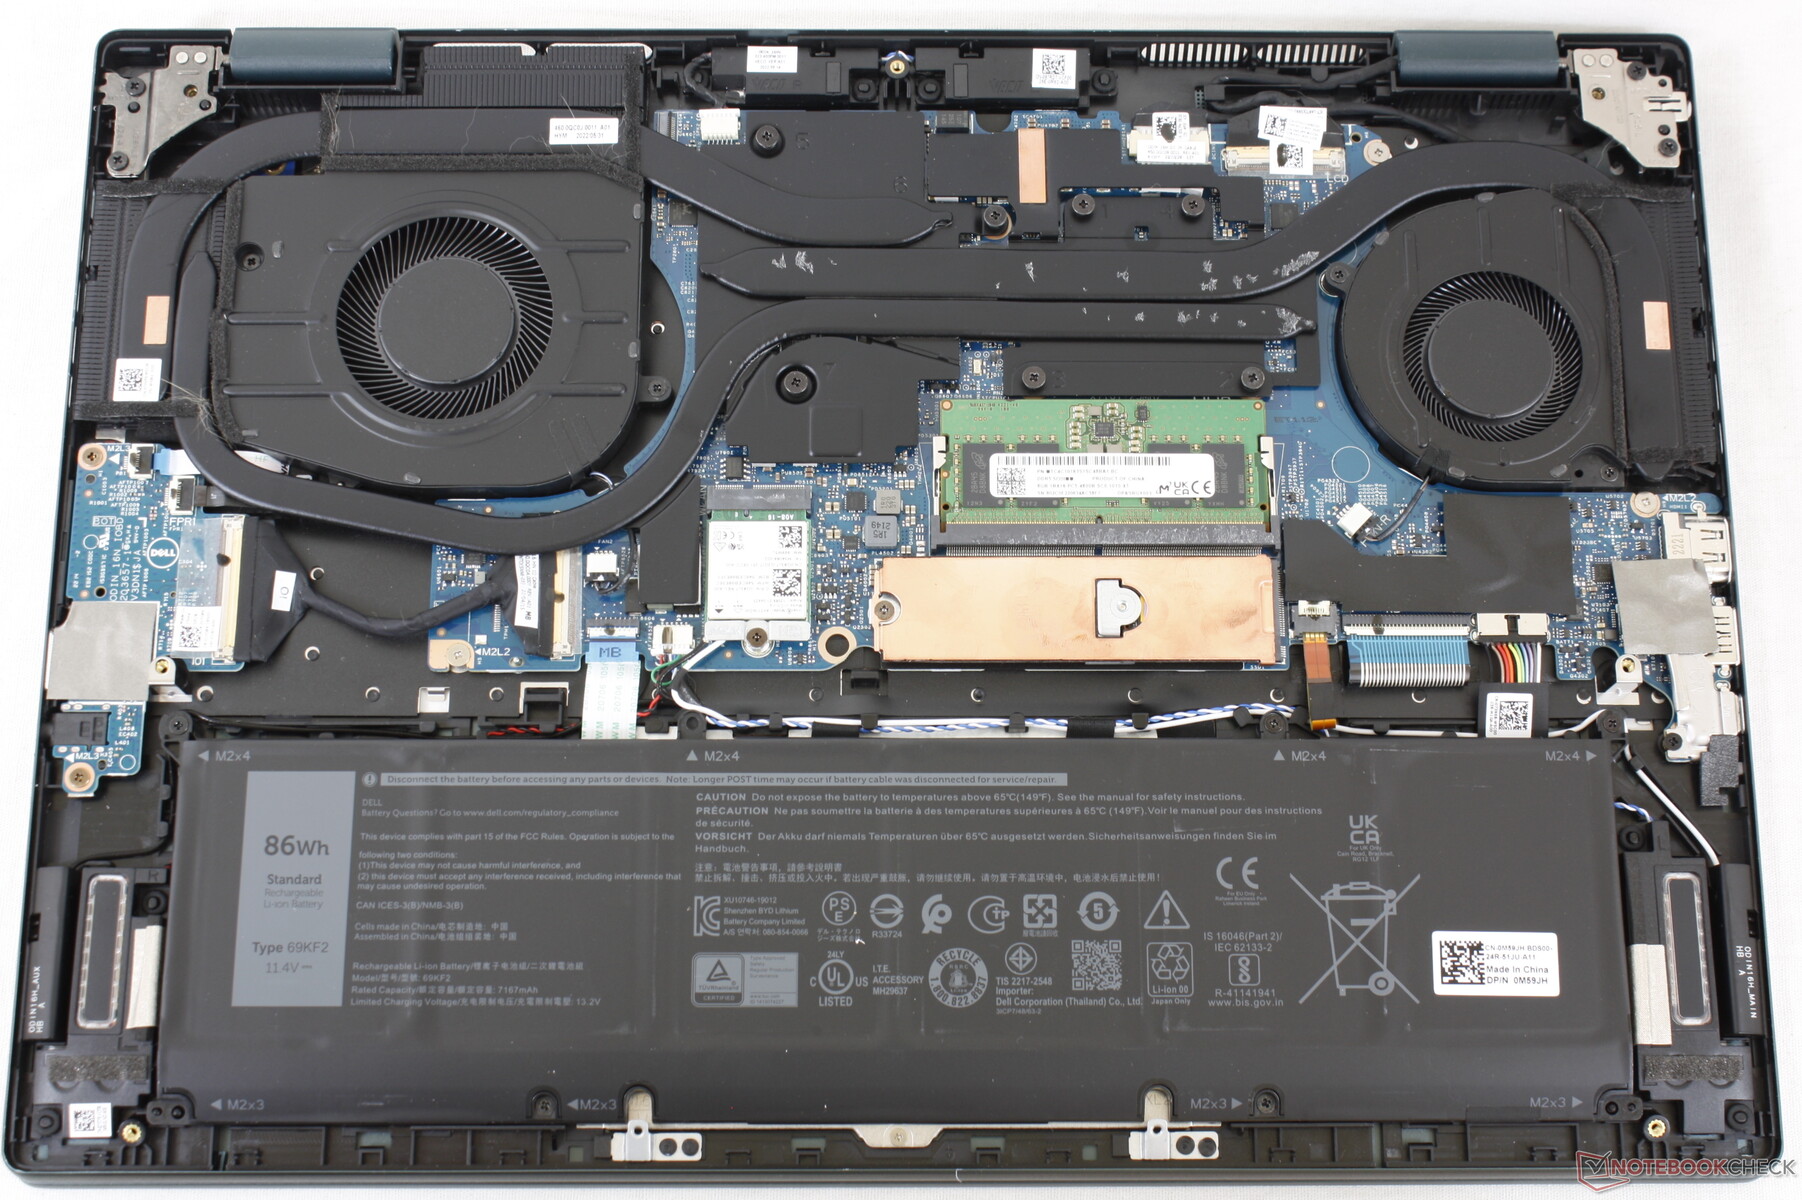
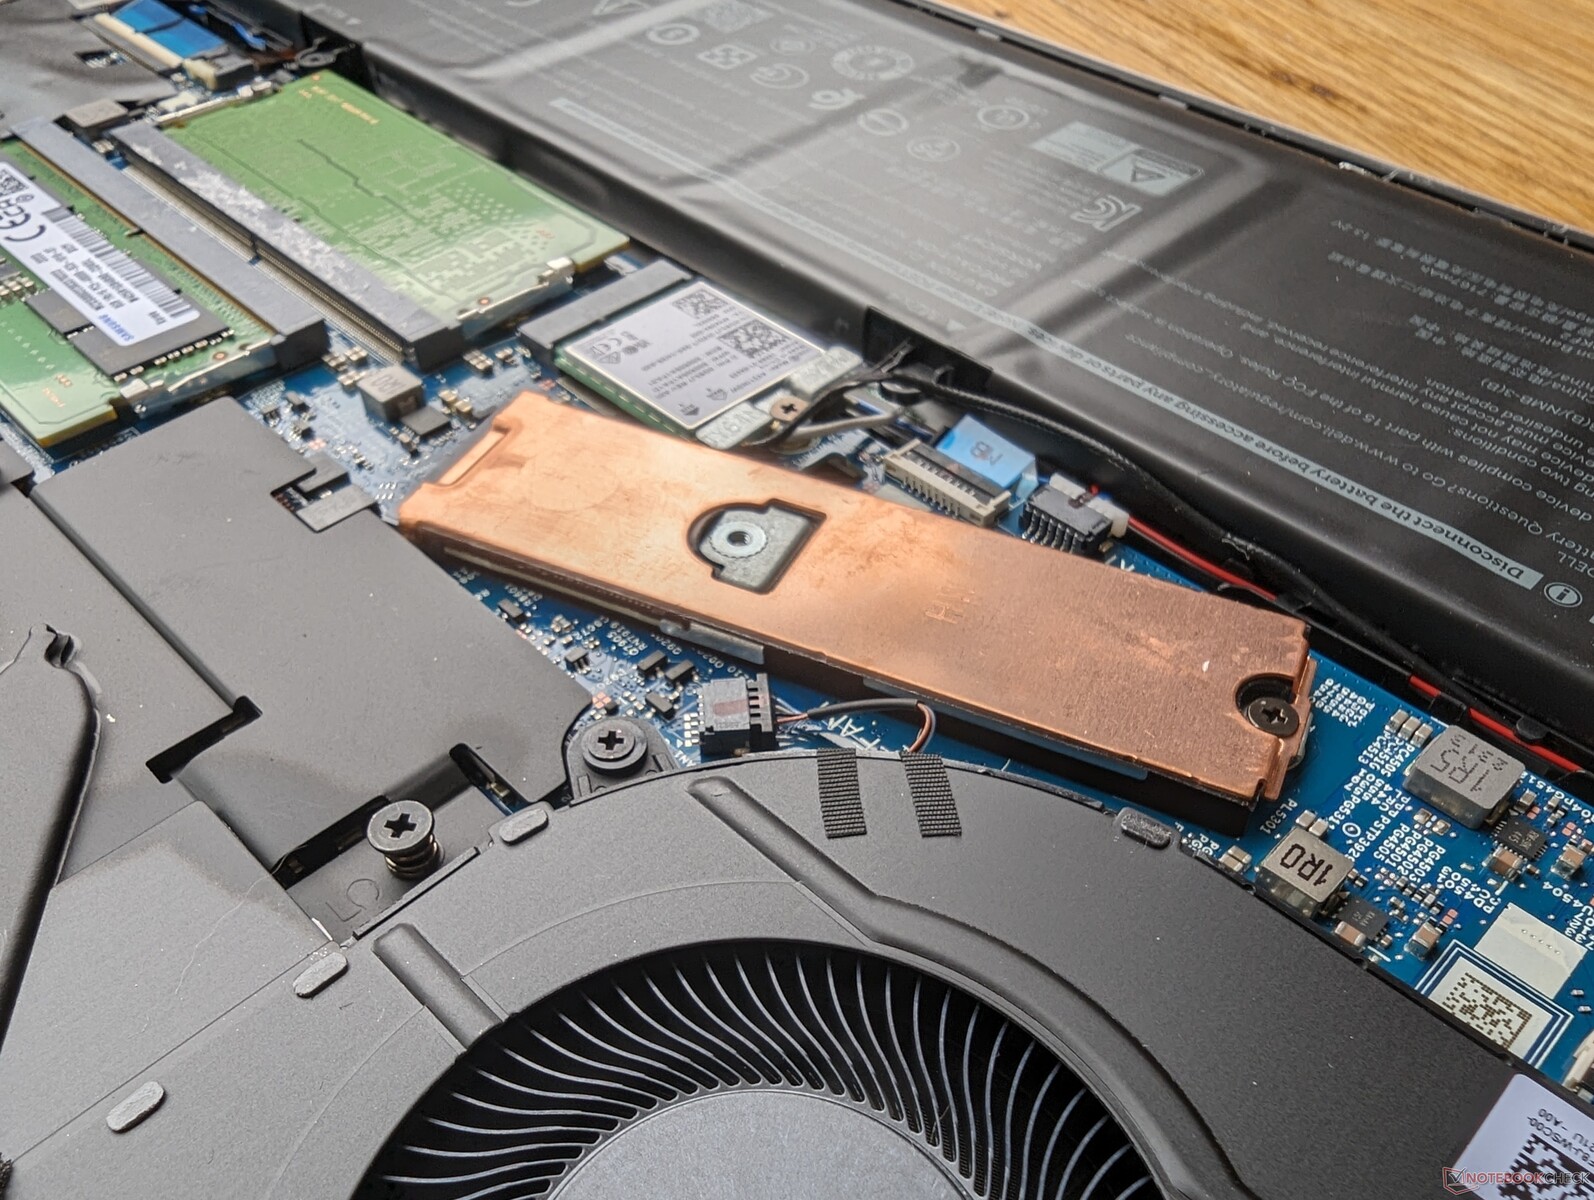
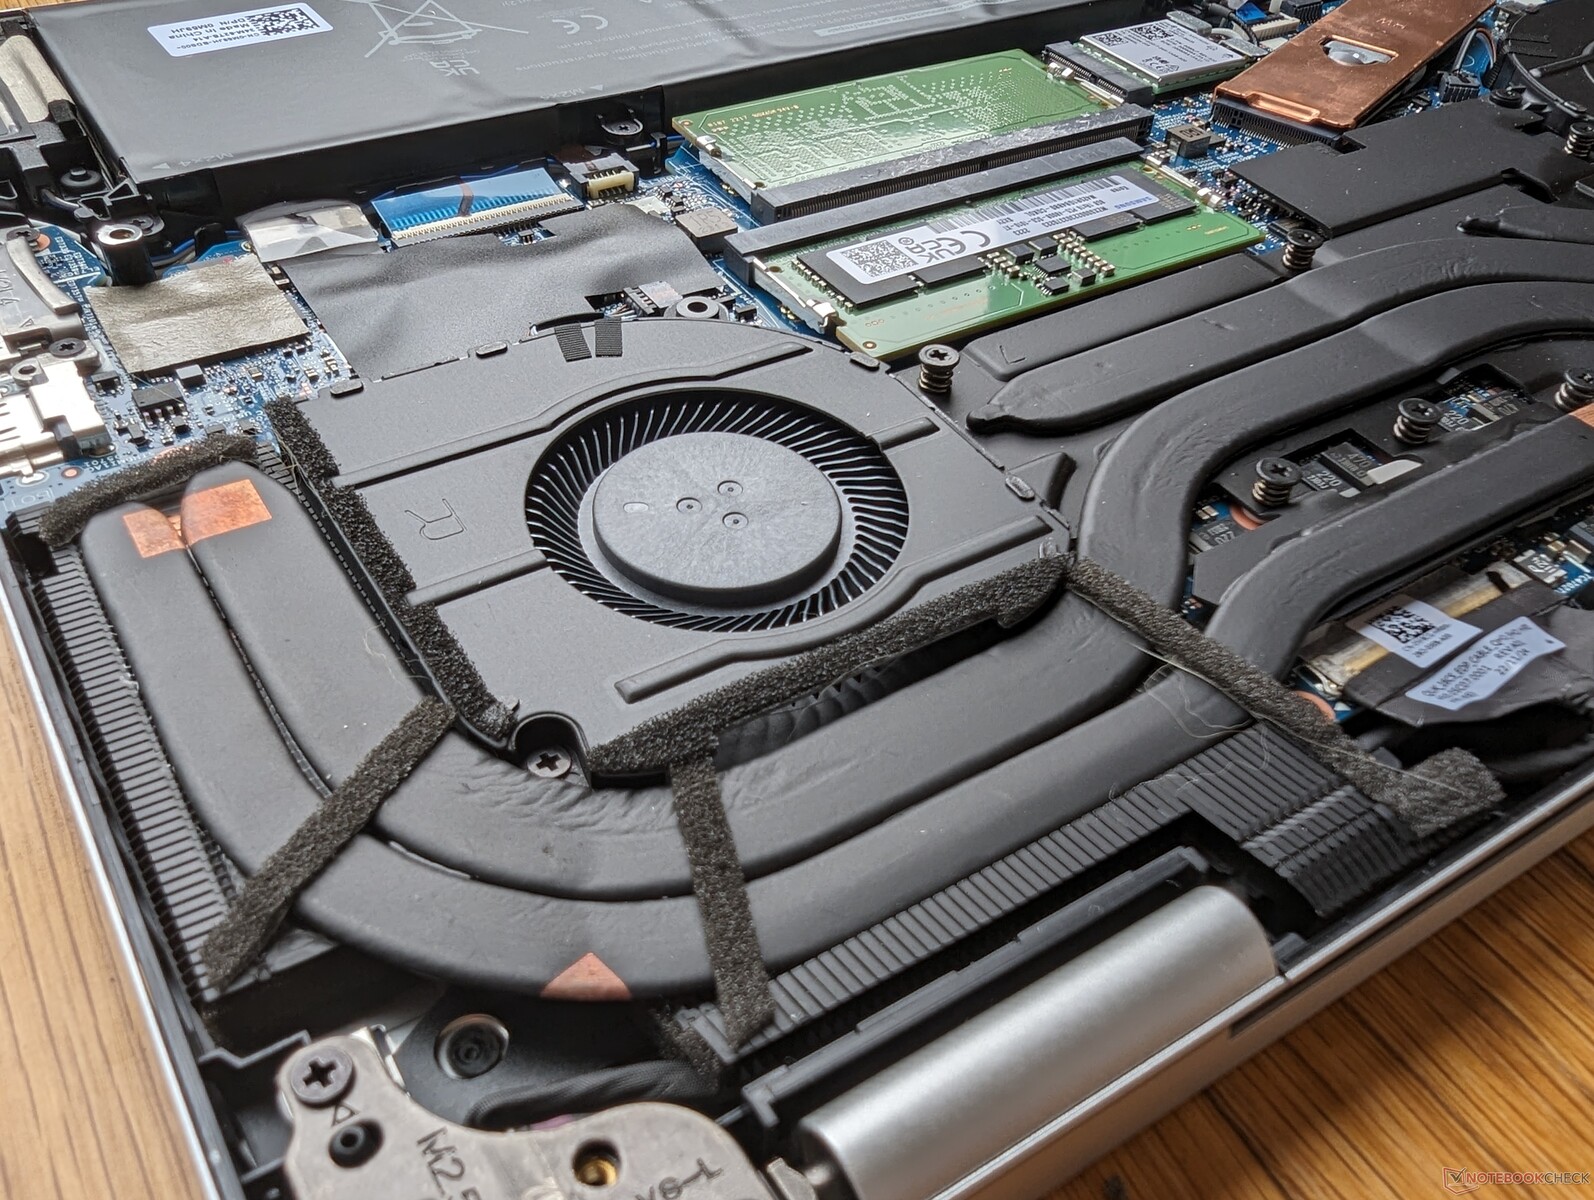
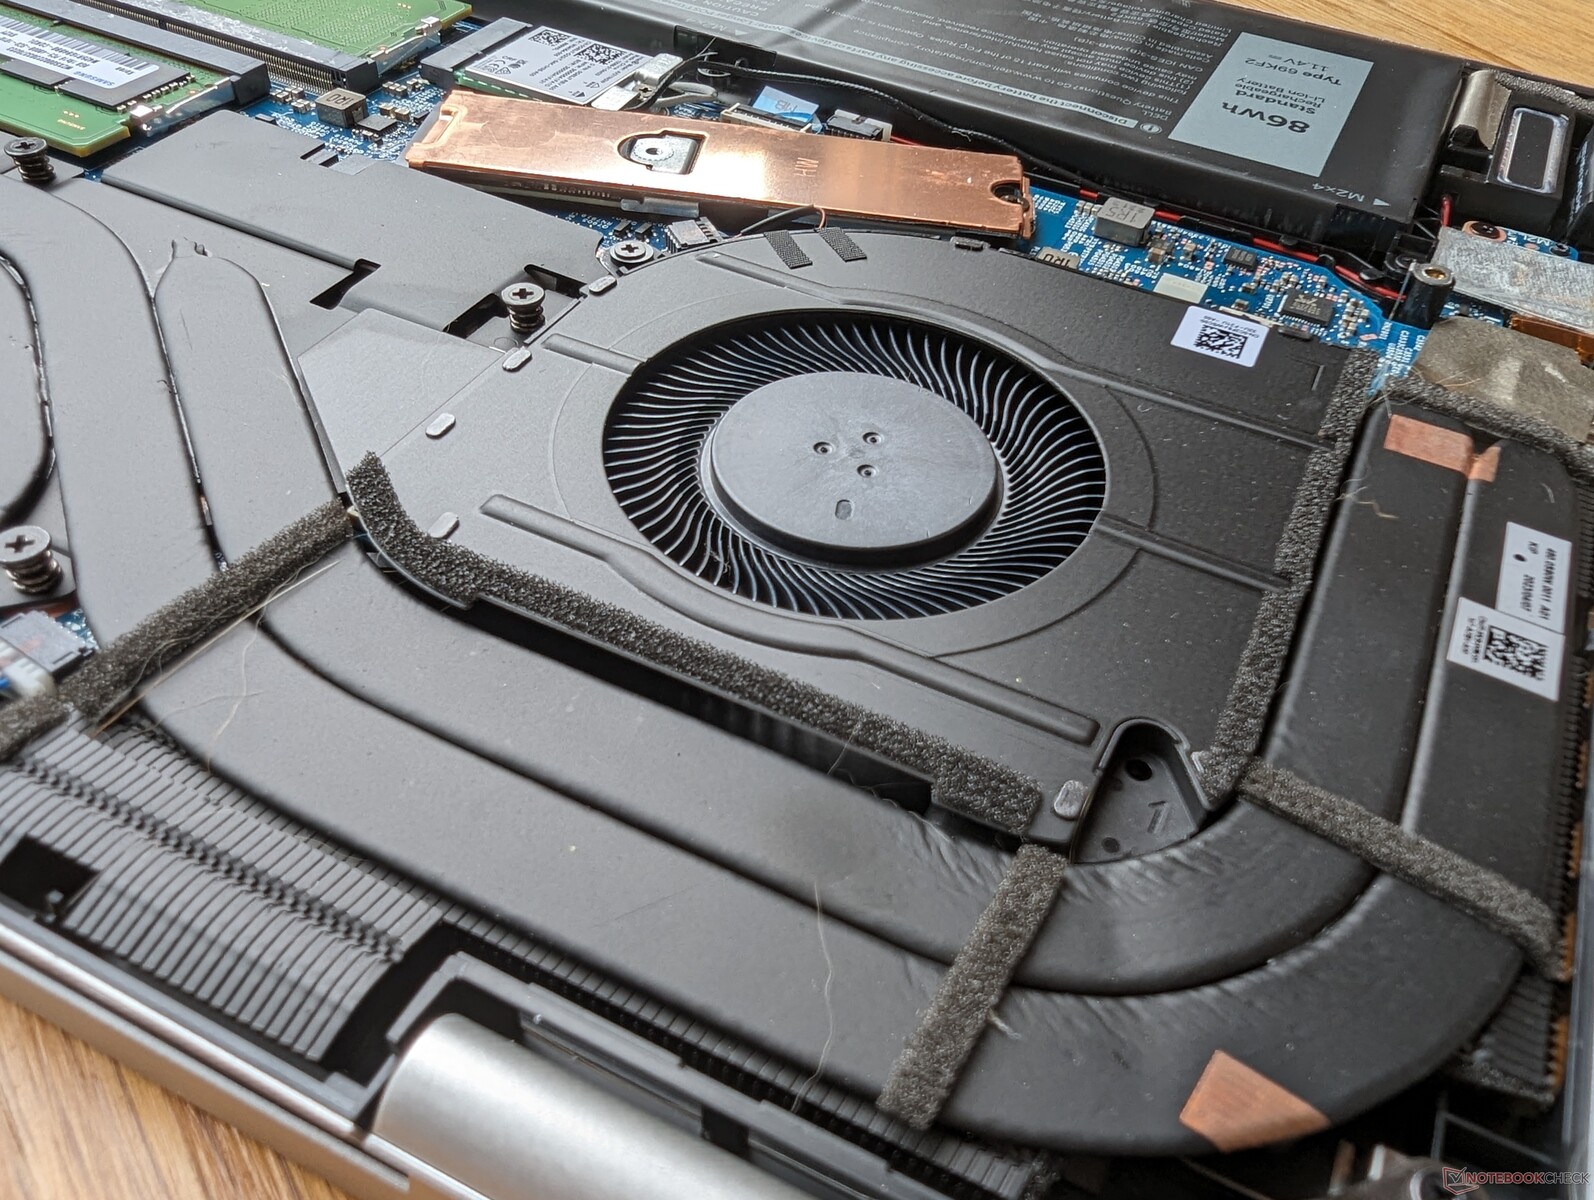
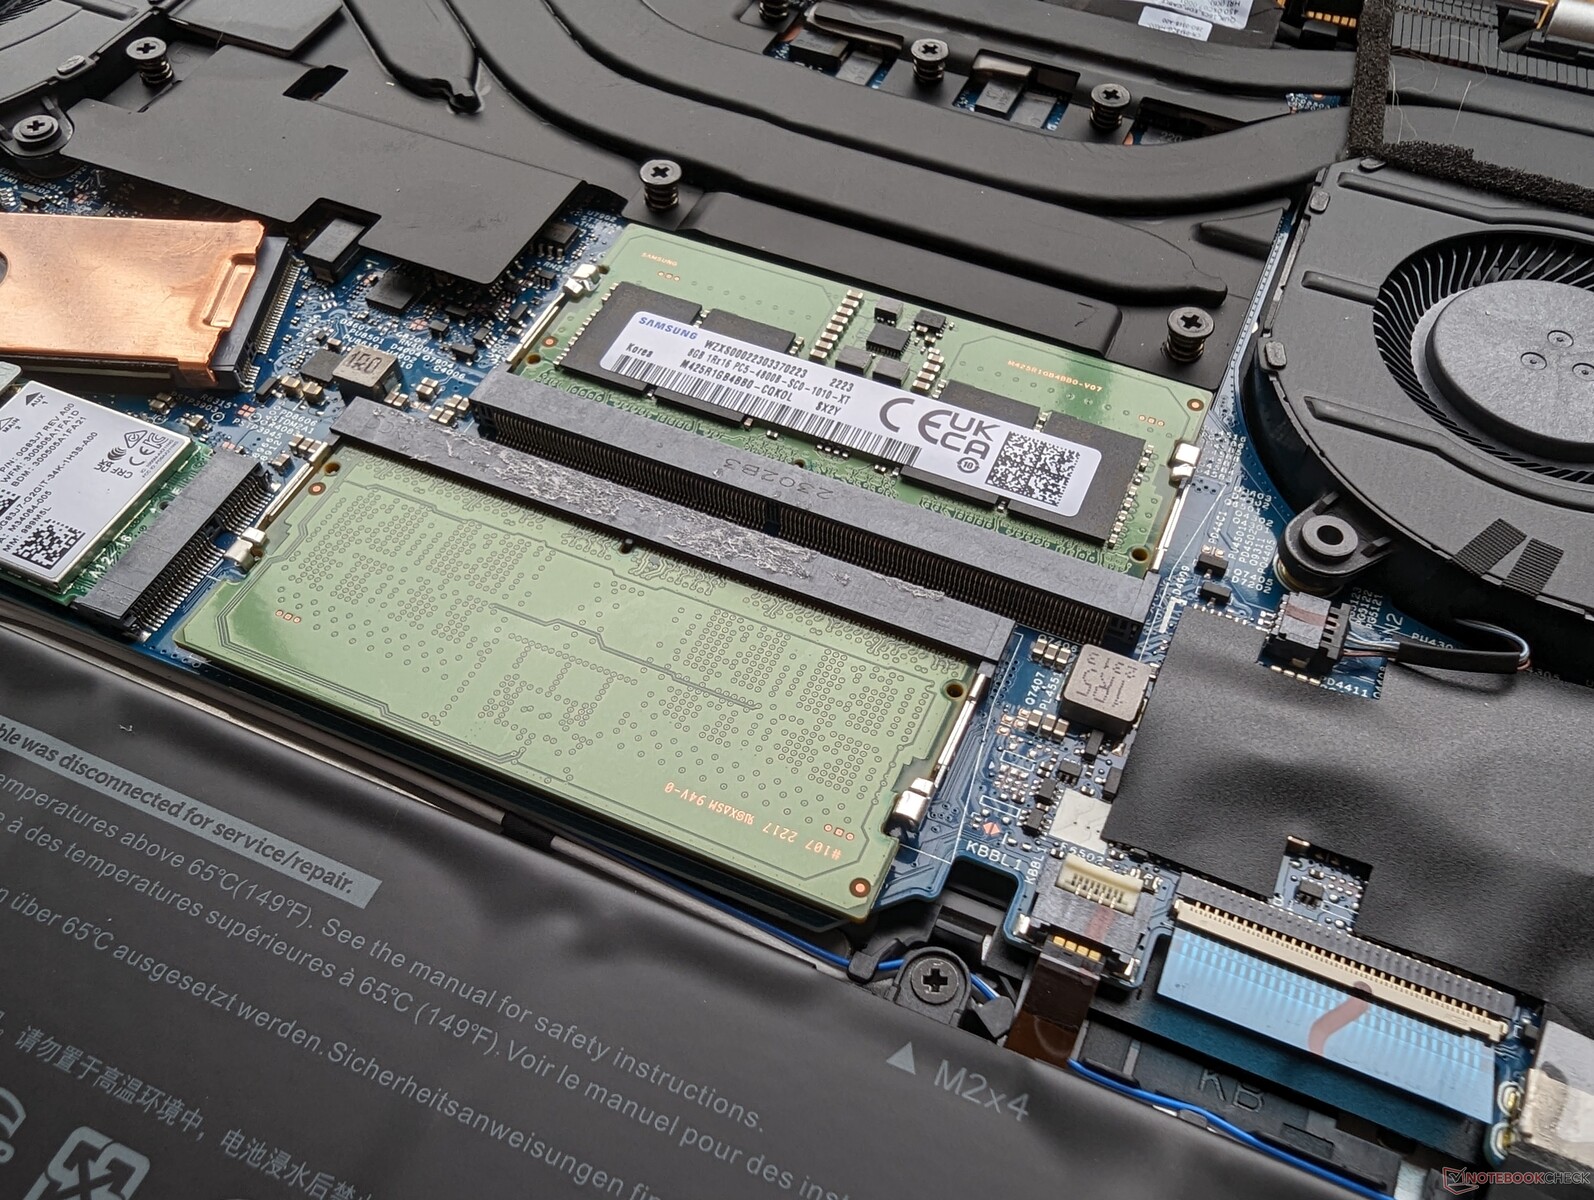
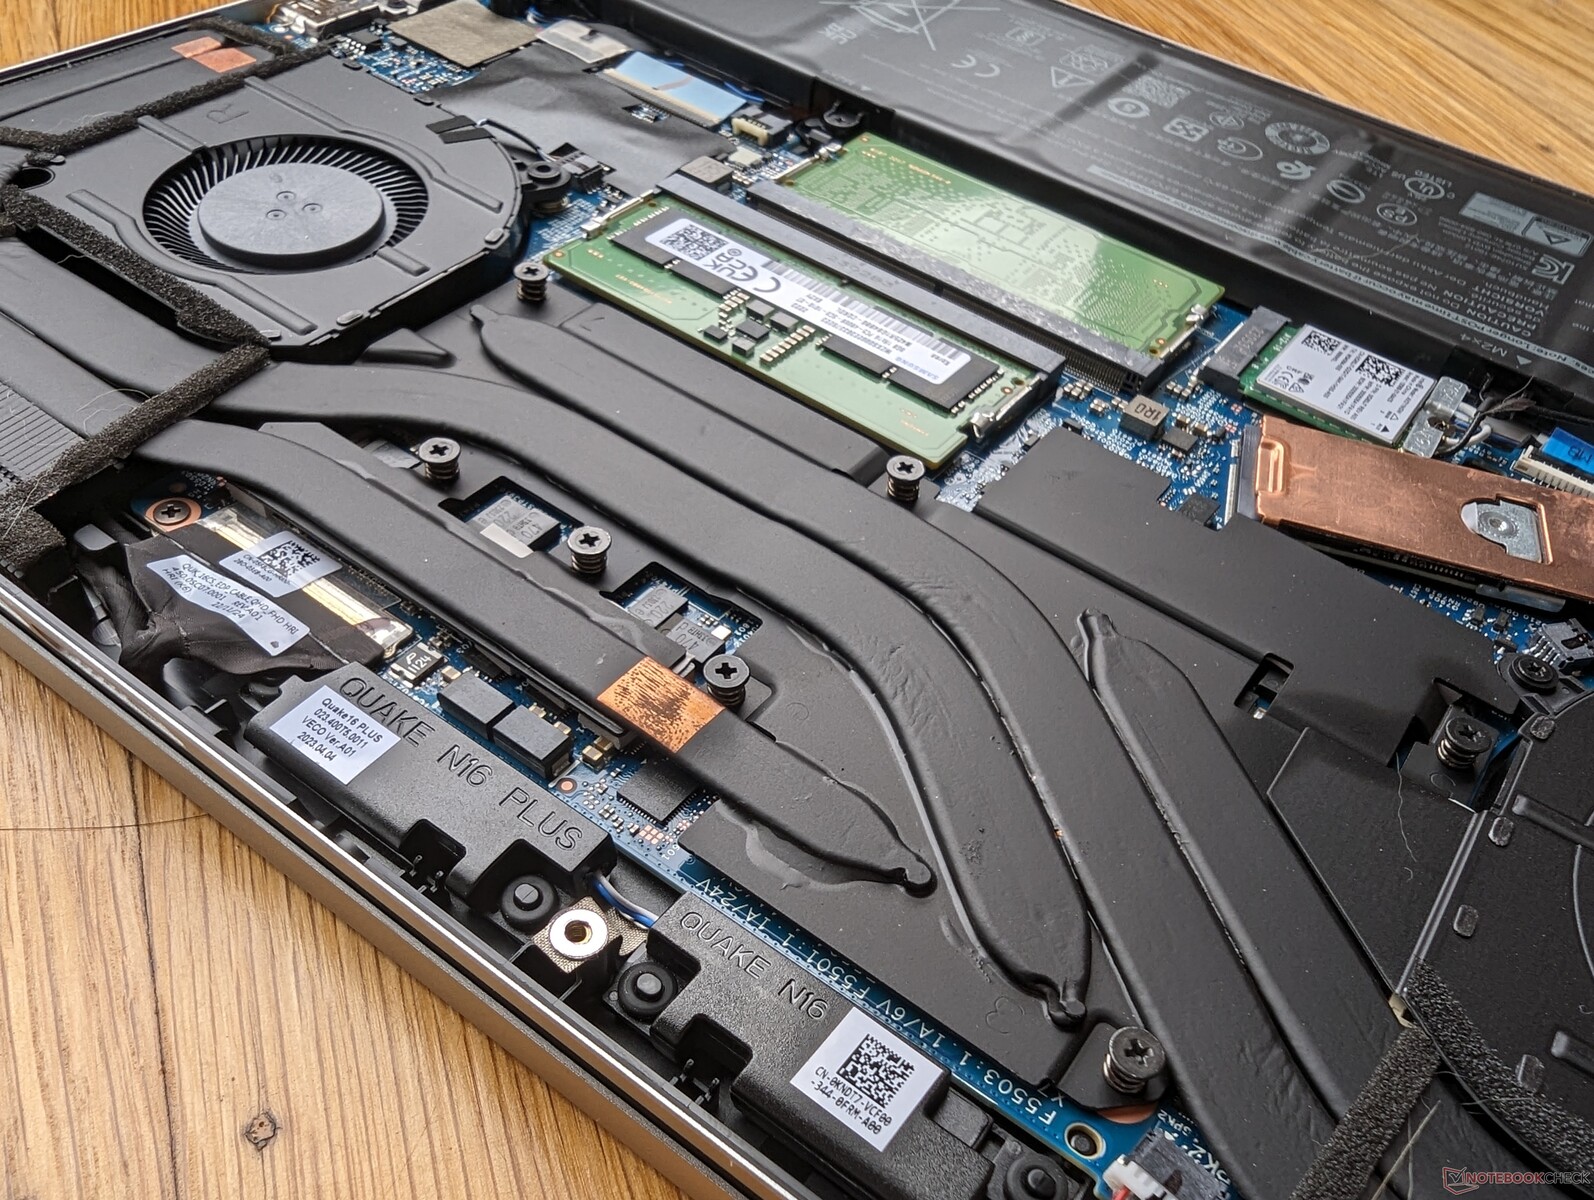
Onderhoud
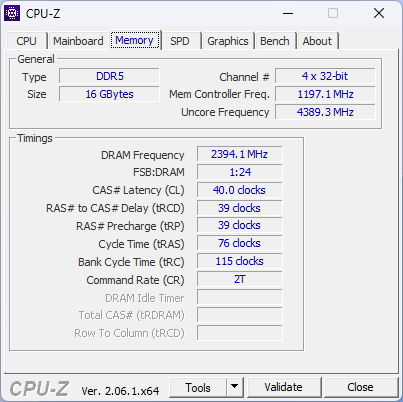
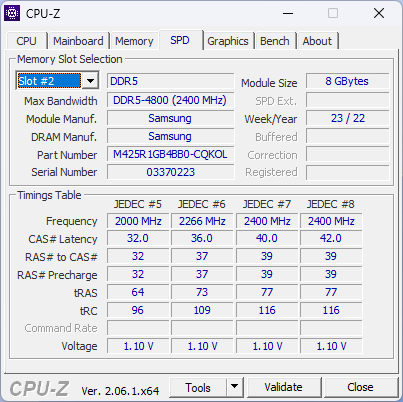
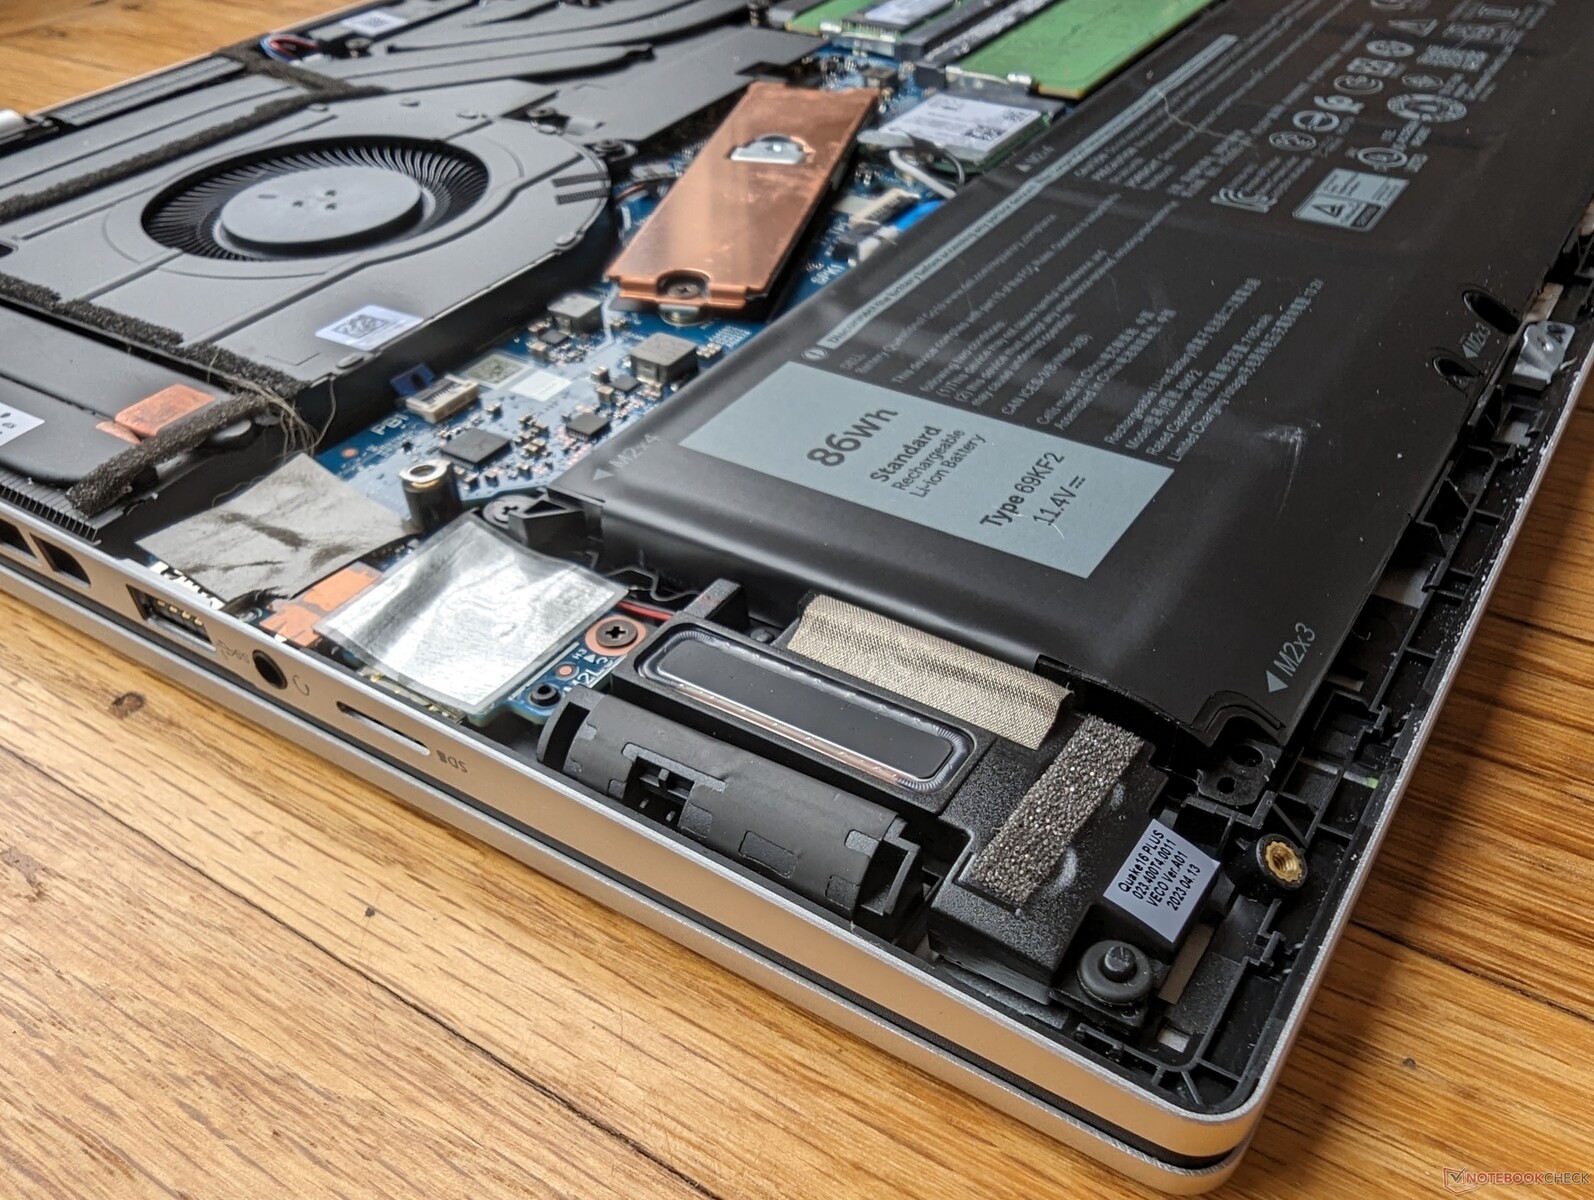
Het onderpaneel vereist alleen een kruiskopschroevendraaier en een scherpe rand voor relatief eenvoudig onderhoud. Eigenaars hebben directe toegang tot de SSD, WLAN en 2x SODIMM-sleuven, terwijl het model van vorig jaar beperkt was tot slechts 1x SODIMM-sleuf, zoals te zien is op de vergelijkingsfoto's hieronder. De ventilatoren zijn deze keer ook groter en hebben dikkere koperen heat pipes voor een betere koeling.
Merk op dat de AMD versie van dit model gebruik maakt van gesoldeerd LPDDR5 RAM in tegenstelling tot de volledig uitbreidbare 2x SODIMM aanpak van onze Intel versie.
Accessoires en garantie
Er zitten geen extra's in de doos behalve de AC-adapter en papierwerk. Bij aankoop in de VS geldt de gebruikelijke beperkte fabrieksgarantie van een jaar.
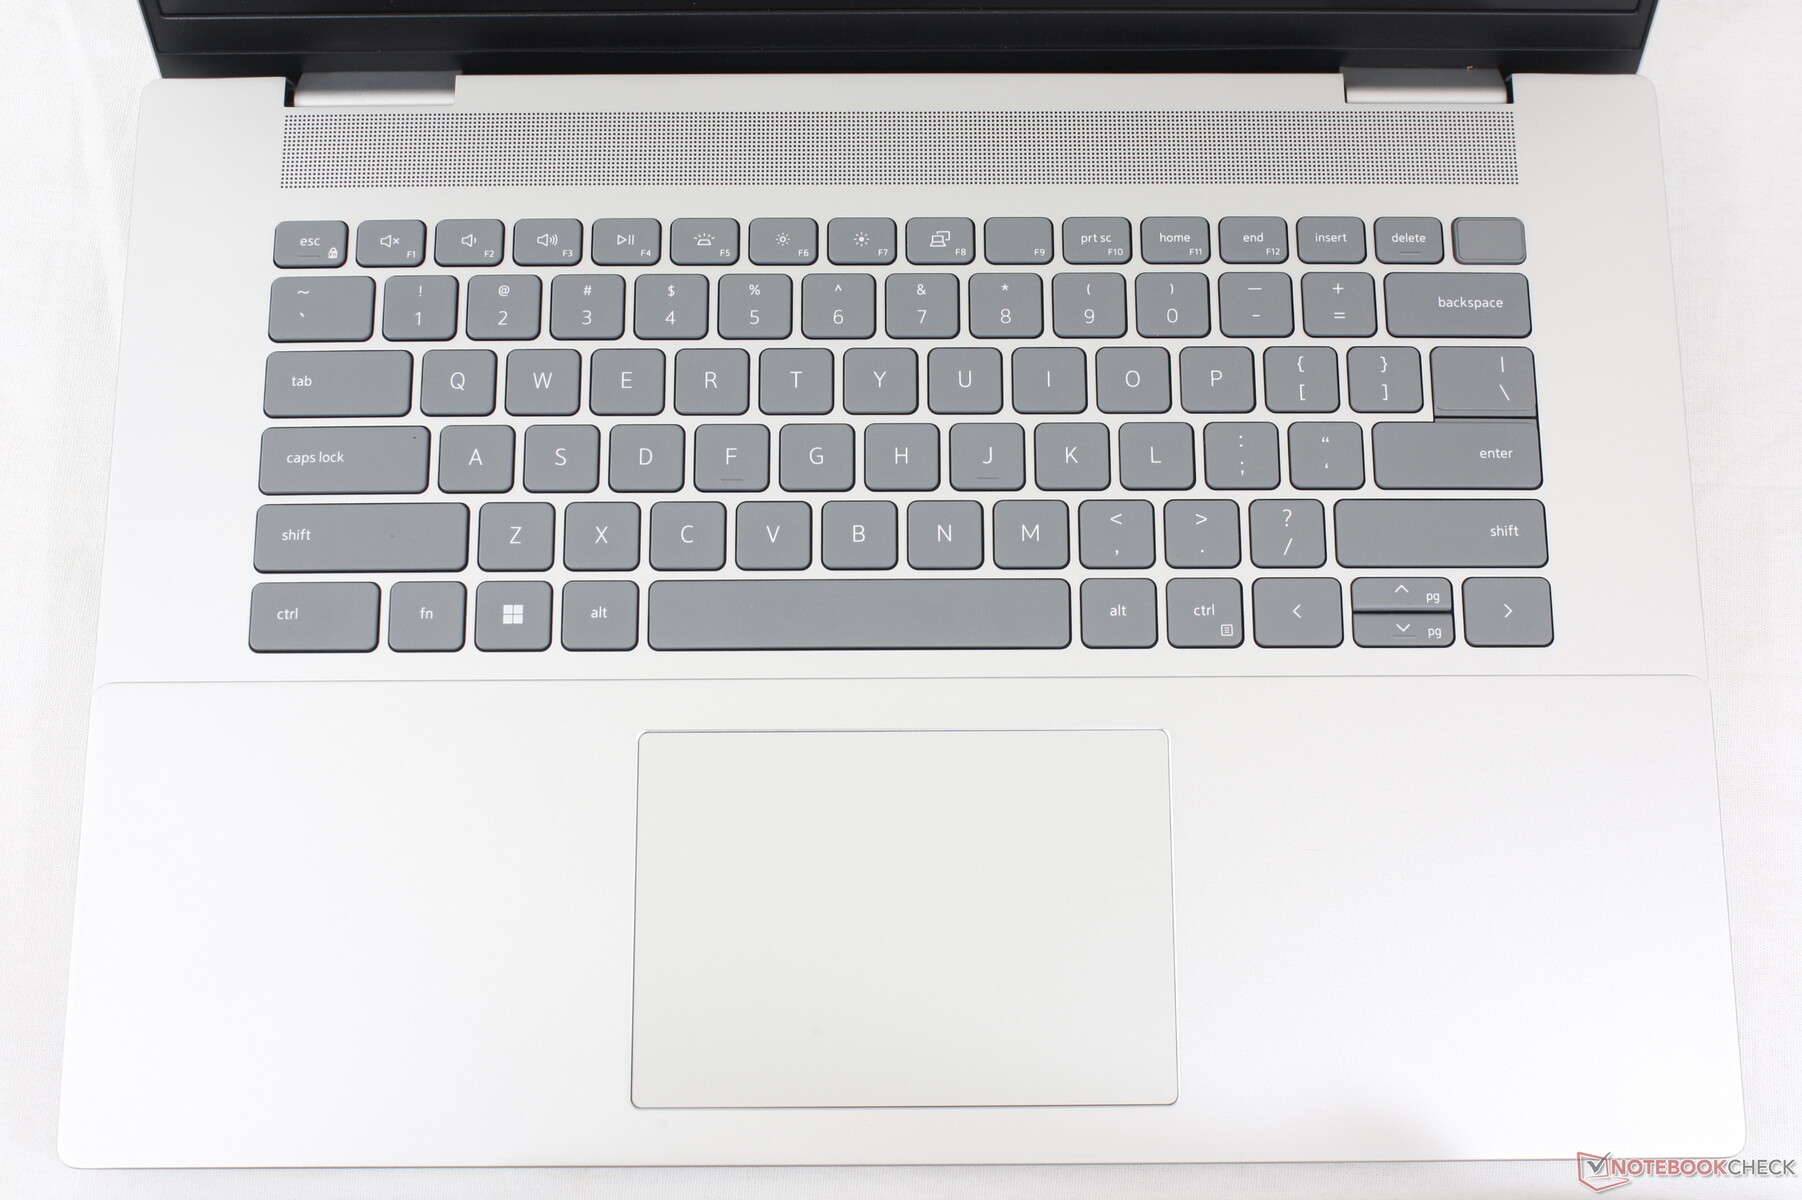
Invoerapparaten - Vertrouwd Inspiron-gevoel
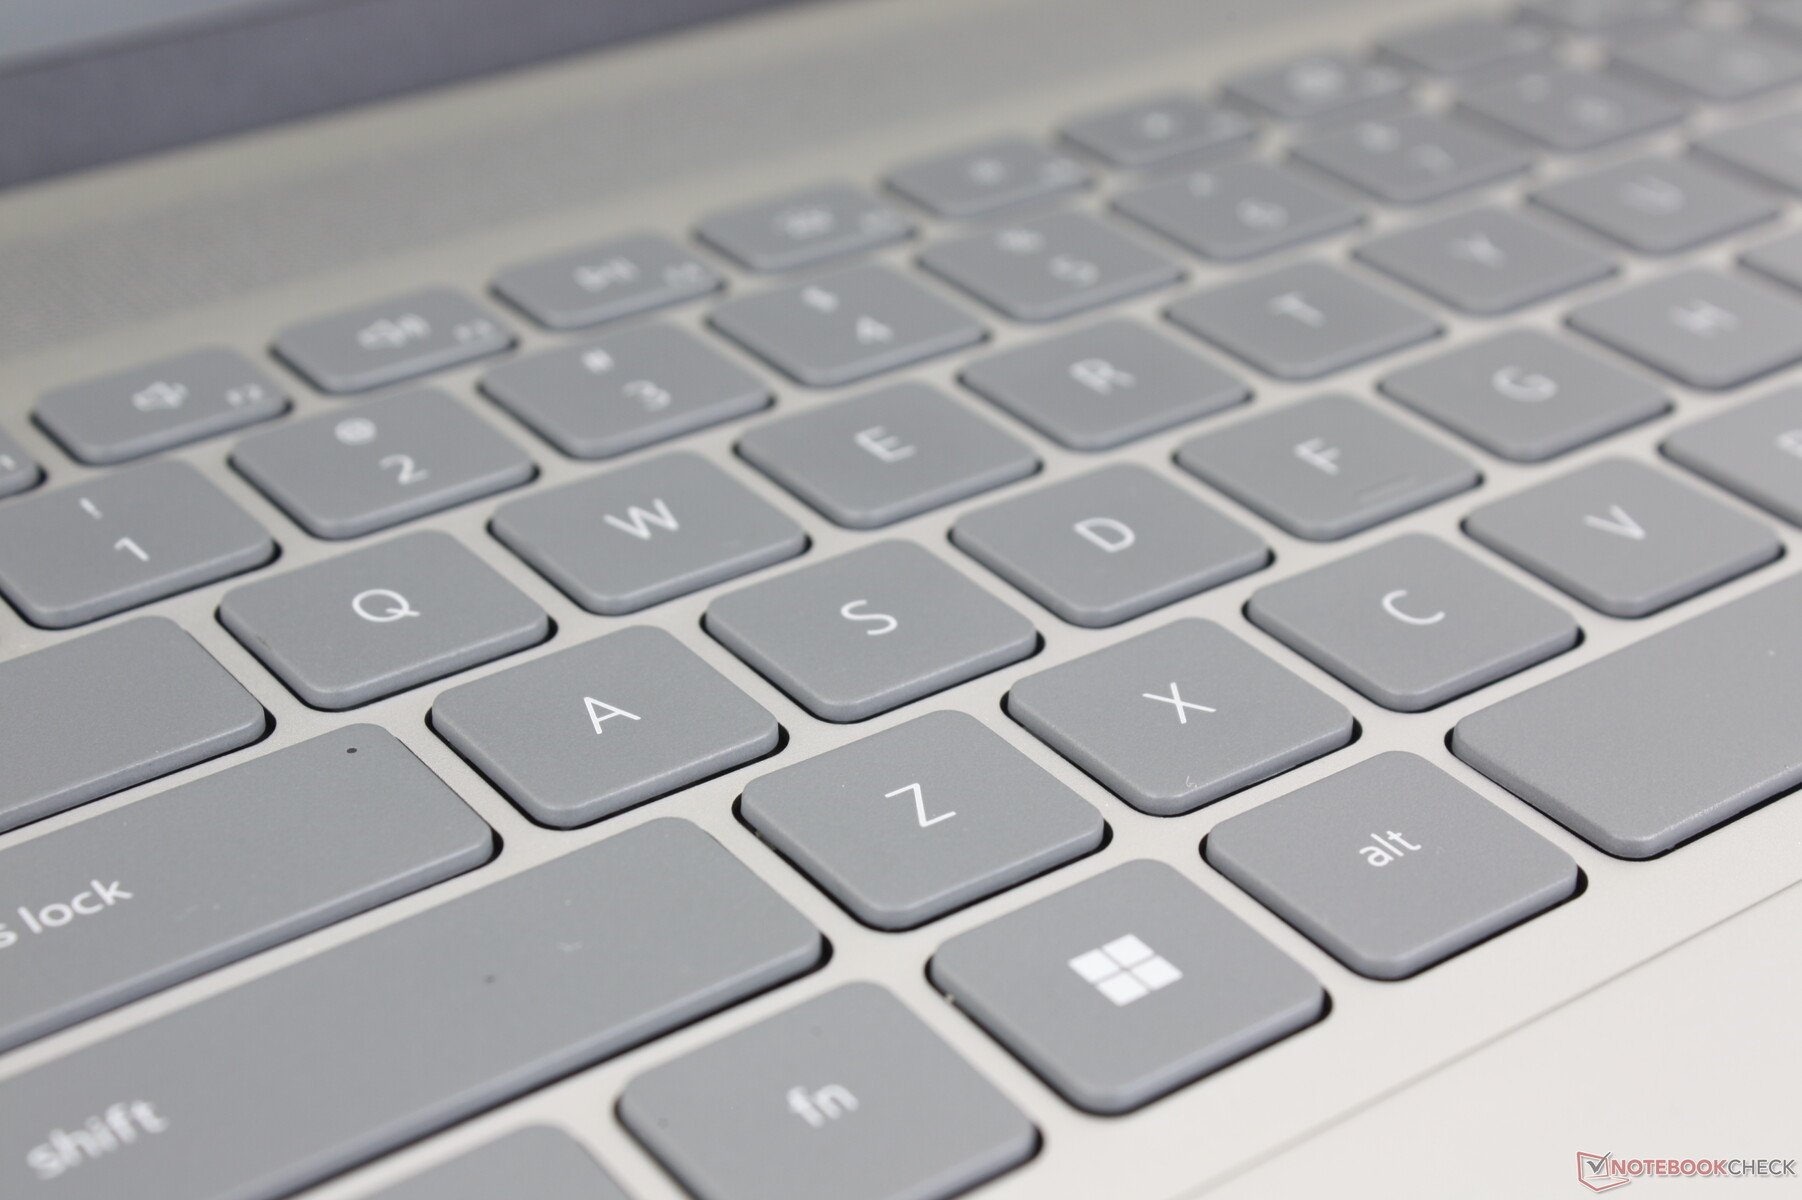
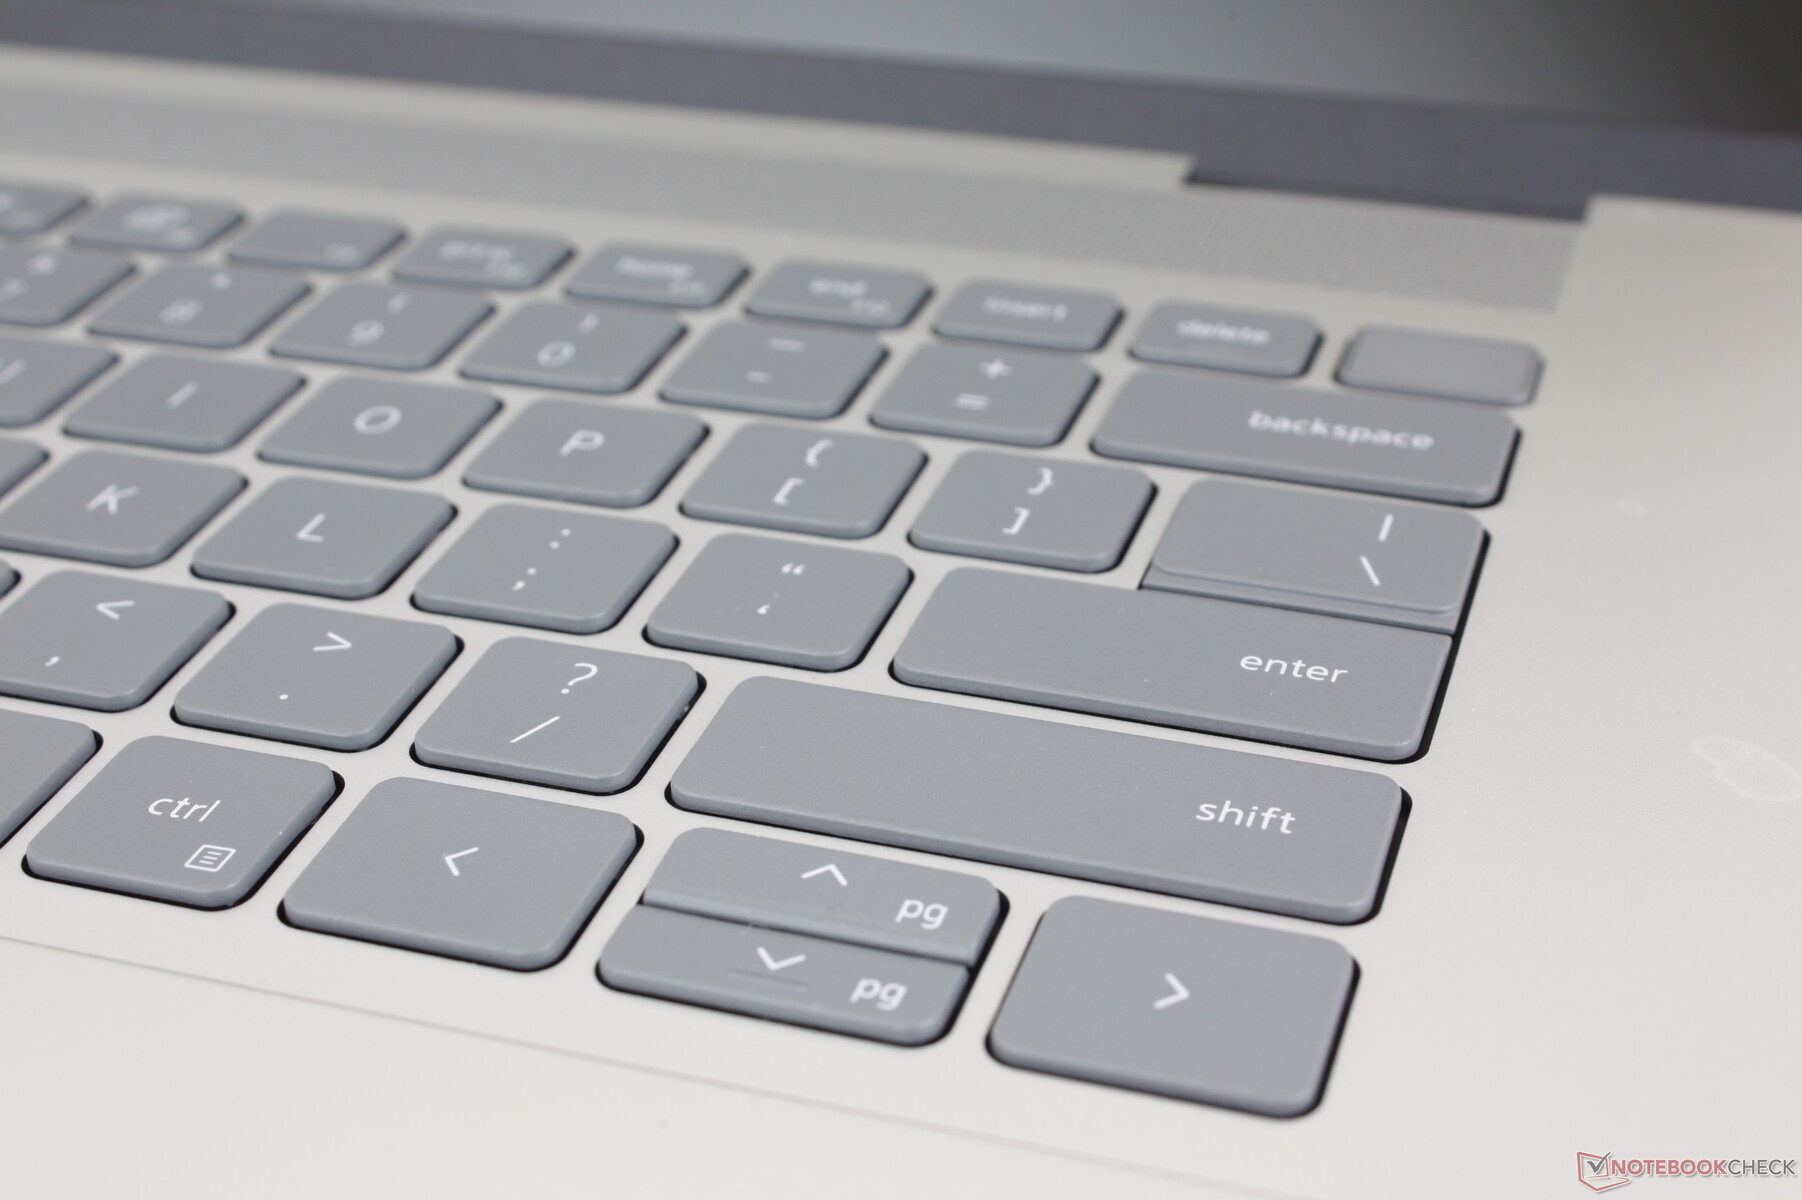
Toetsenbord
De type-ervaring blijft identiek aan de Inspiron 16 Plus 7620 tot aan elke functietoets en secundaire actie. Dit is niet per se een slechte zaak, want de consistentie tussen verschillende Inspiron modellen wordt gewaardeerd. Andere multimedia laptops zoals de LG Gram 16 of de HP Spectre x360 16 hebben merkbaar stevigere en comfortabelere toetsen.
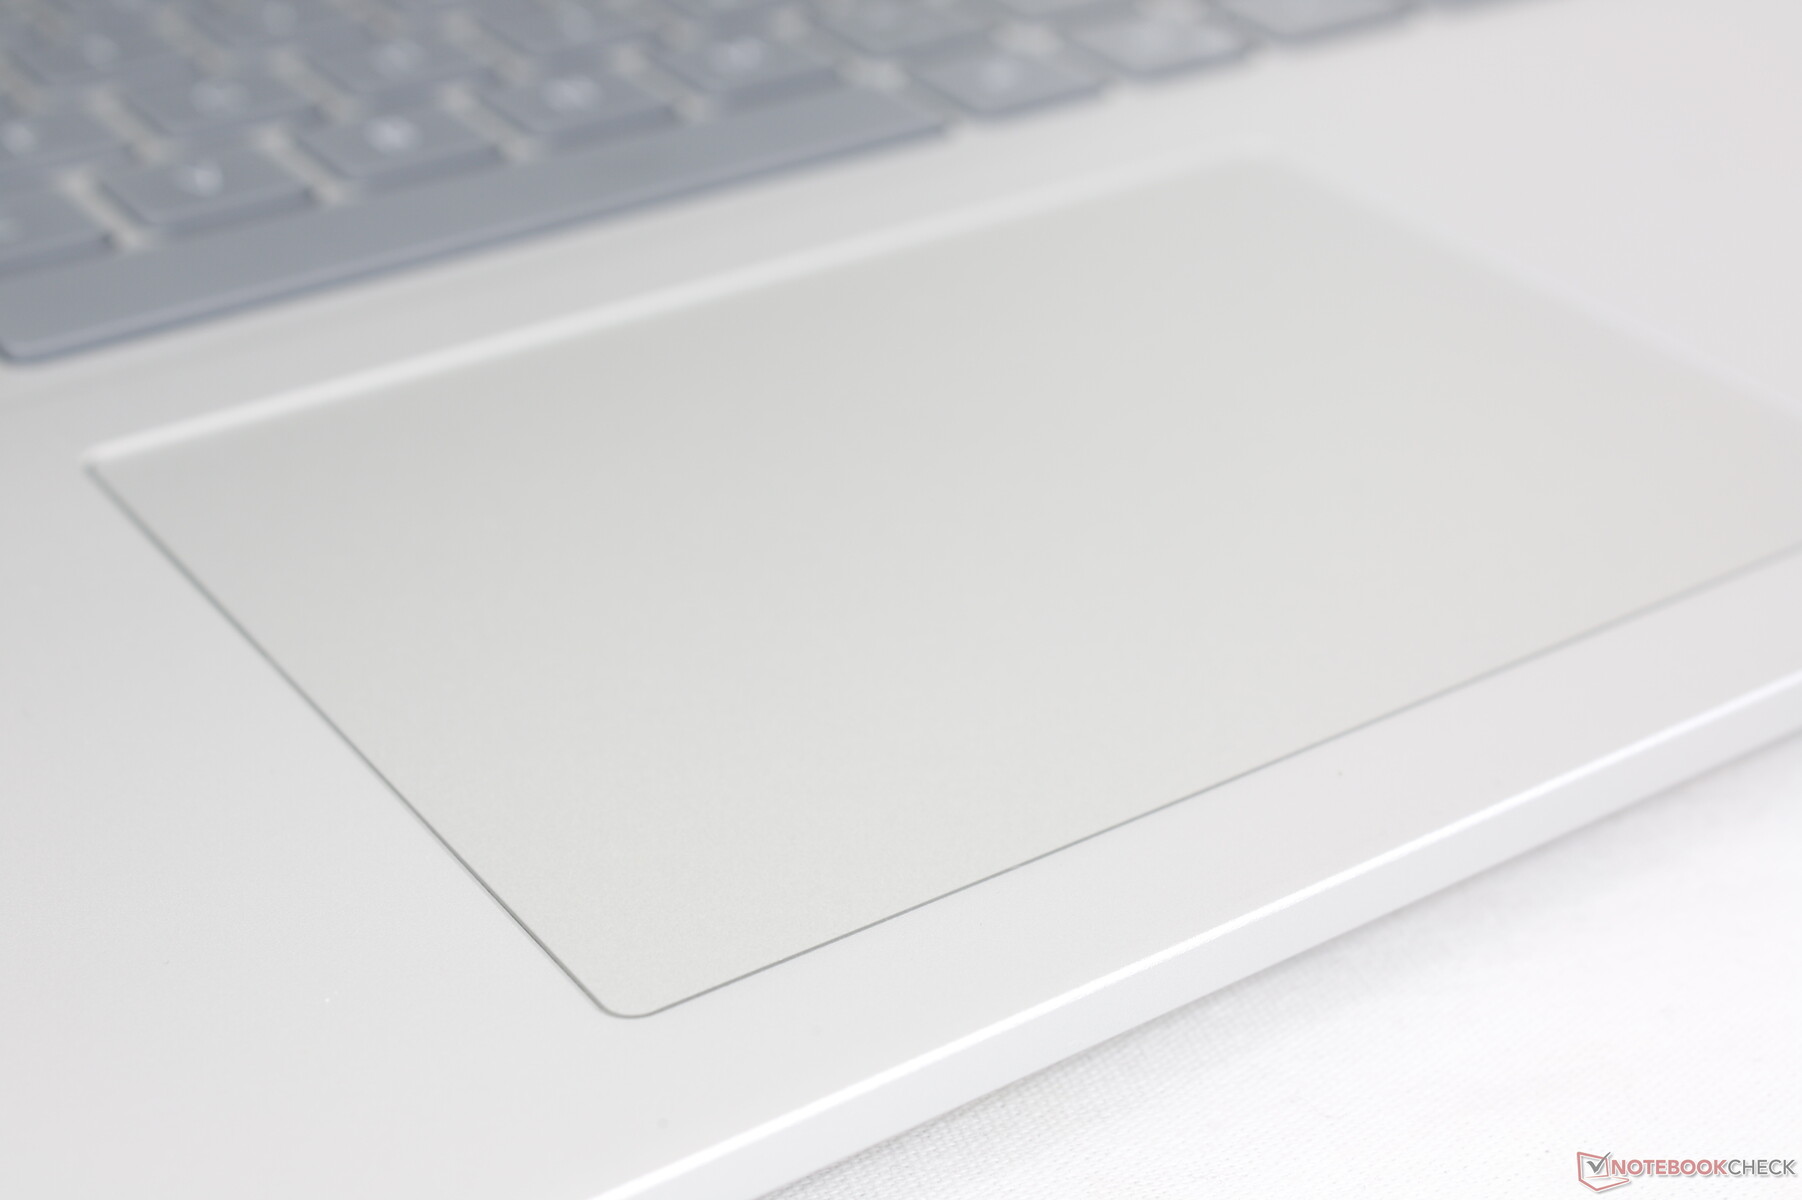
Touchpad
Het clickpad is even groot als dat van het model van vorig jaar (11,5 x 8 cm). Het glijden gaat soepel met een beetje plakkerigheid bij lagere snelheden voor nauwkeurigere invoer. De feedback bij het indrukken van het clickpad is helaas aan de zachte kant, ondanks de luide klik.
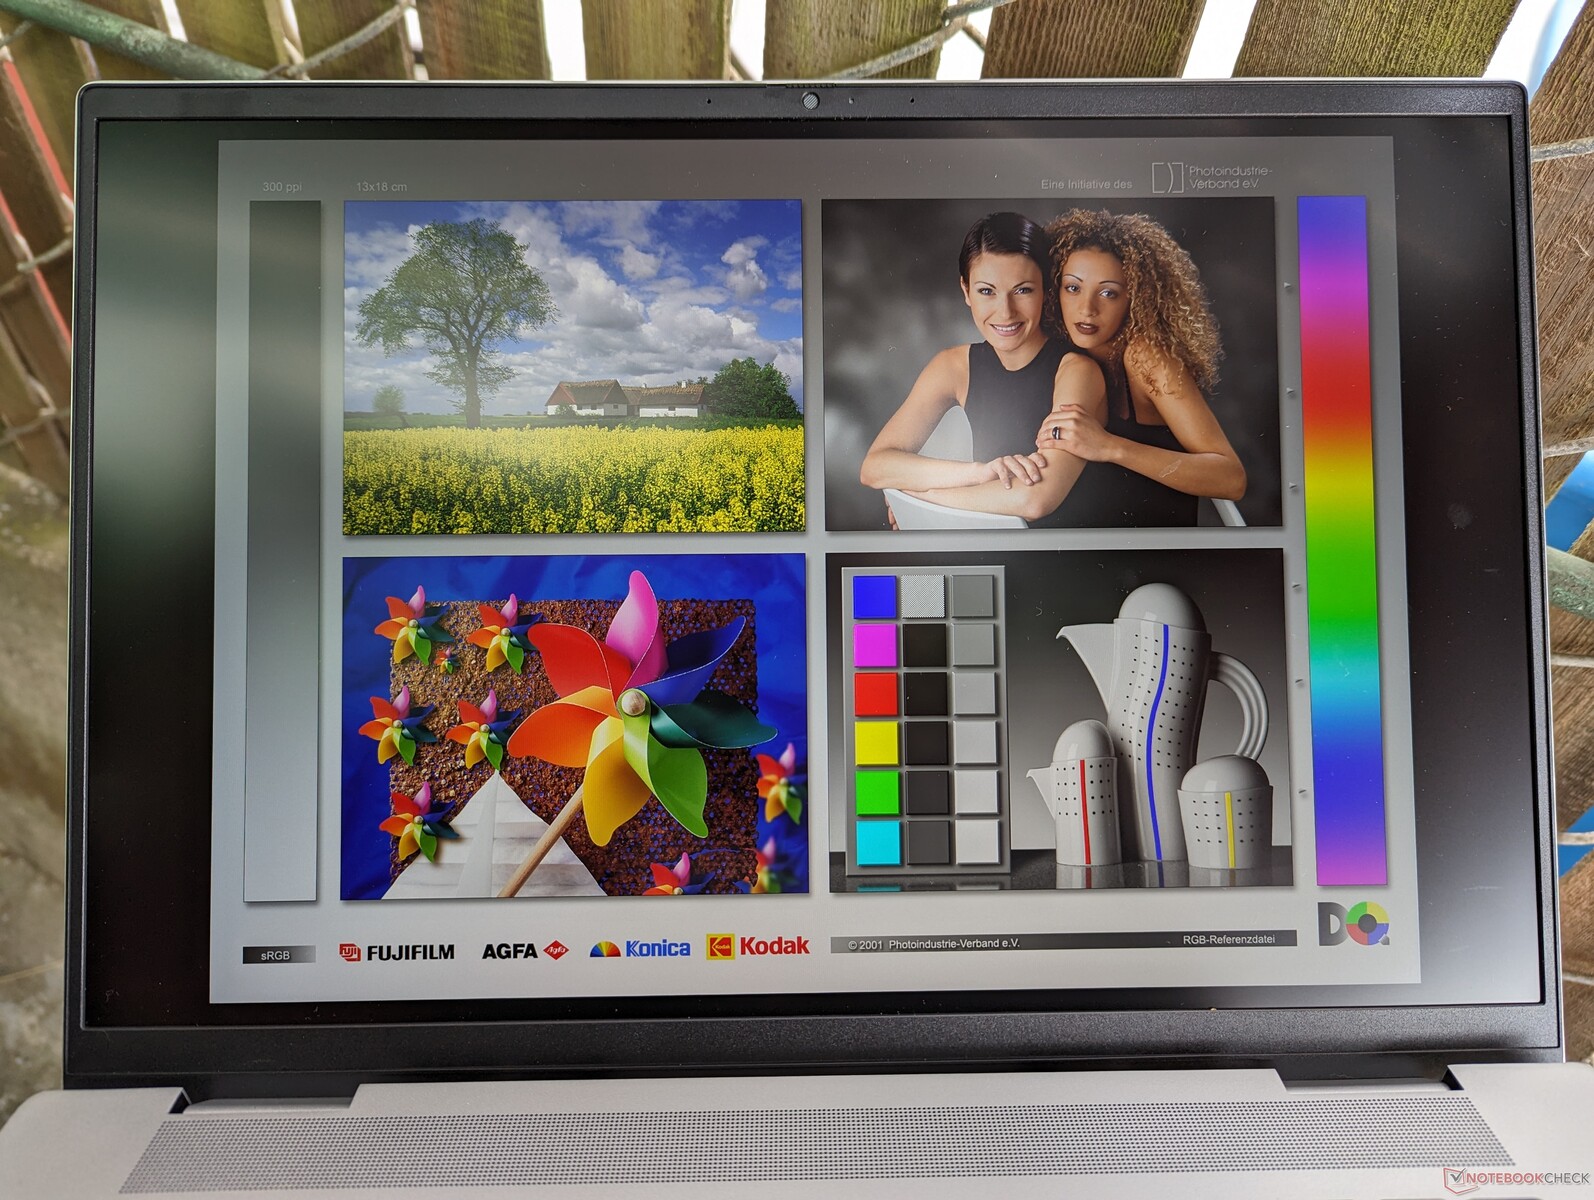
Beeldscherm - Fatsoenlijk maar beperkte opties
De schermopties zijn veranderd ten opzichte van de oudere Inspiron 16 Plus 7620. Weg is het 3K 3072 x 1920 paneel ten gunste van deze twee nieuwe keuzes:
- 2560 x 1600 (2,5K), 120 Hz
- 1920 x 1200, 60 Hz
Beide opties zijn IPS en niet-touch en geen van beide ondersteunt G-Sync. Onze metingen hieronder hebben alleen betrekking op de vetgedrukte 1600p optie.
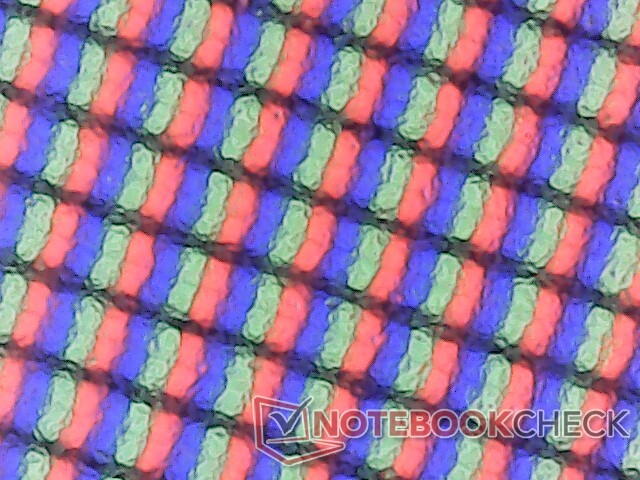
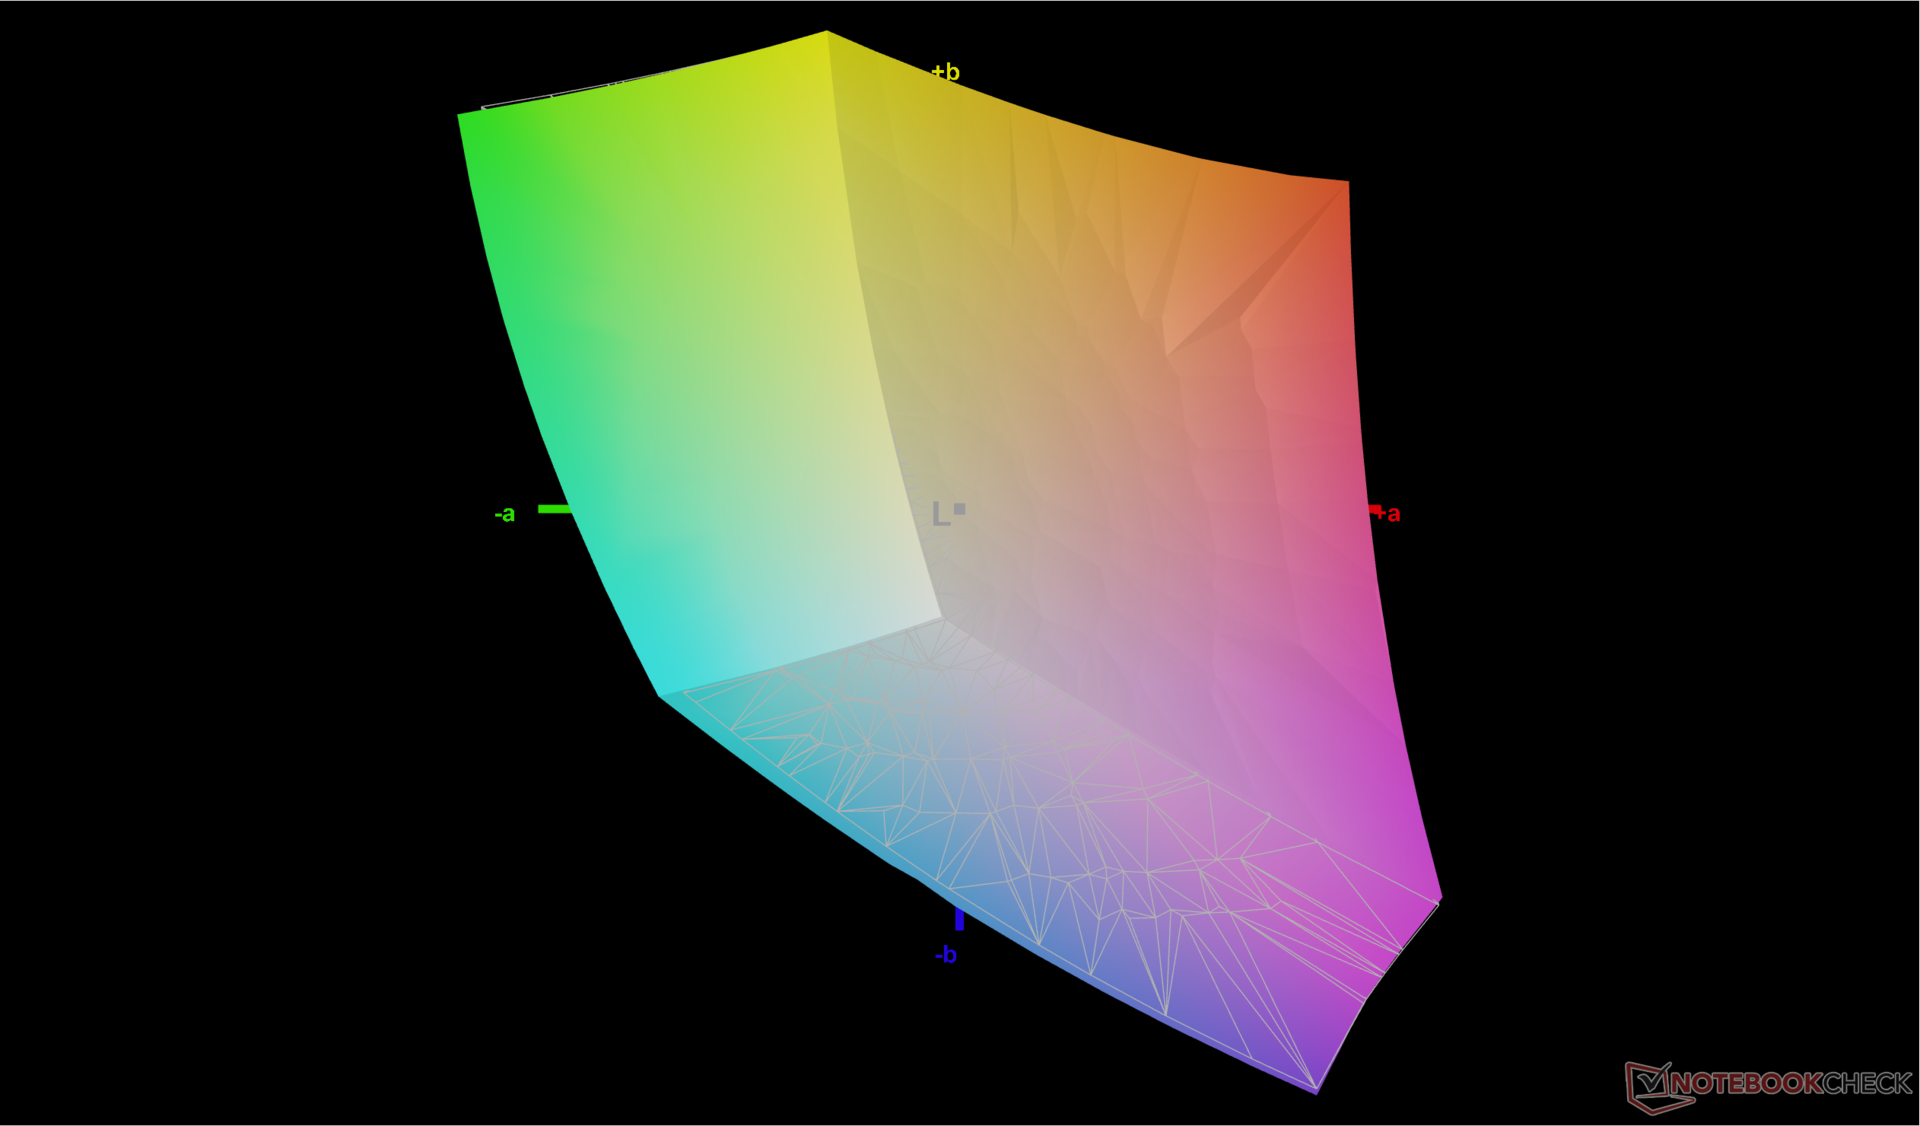
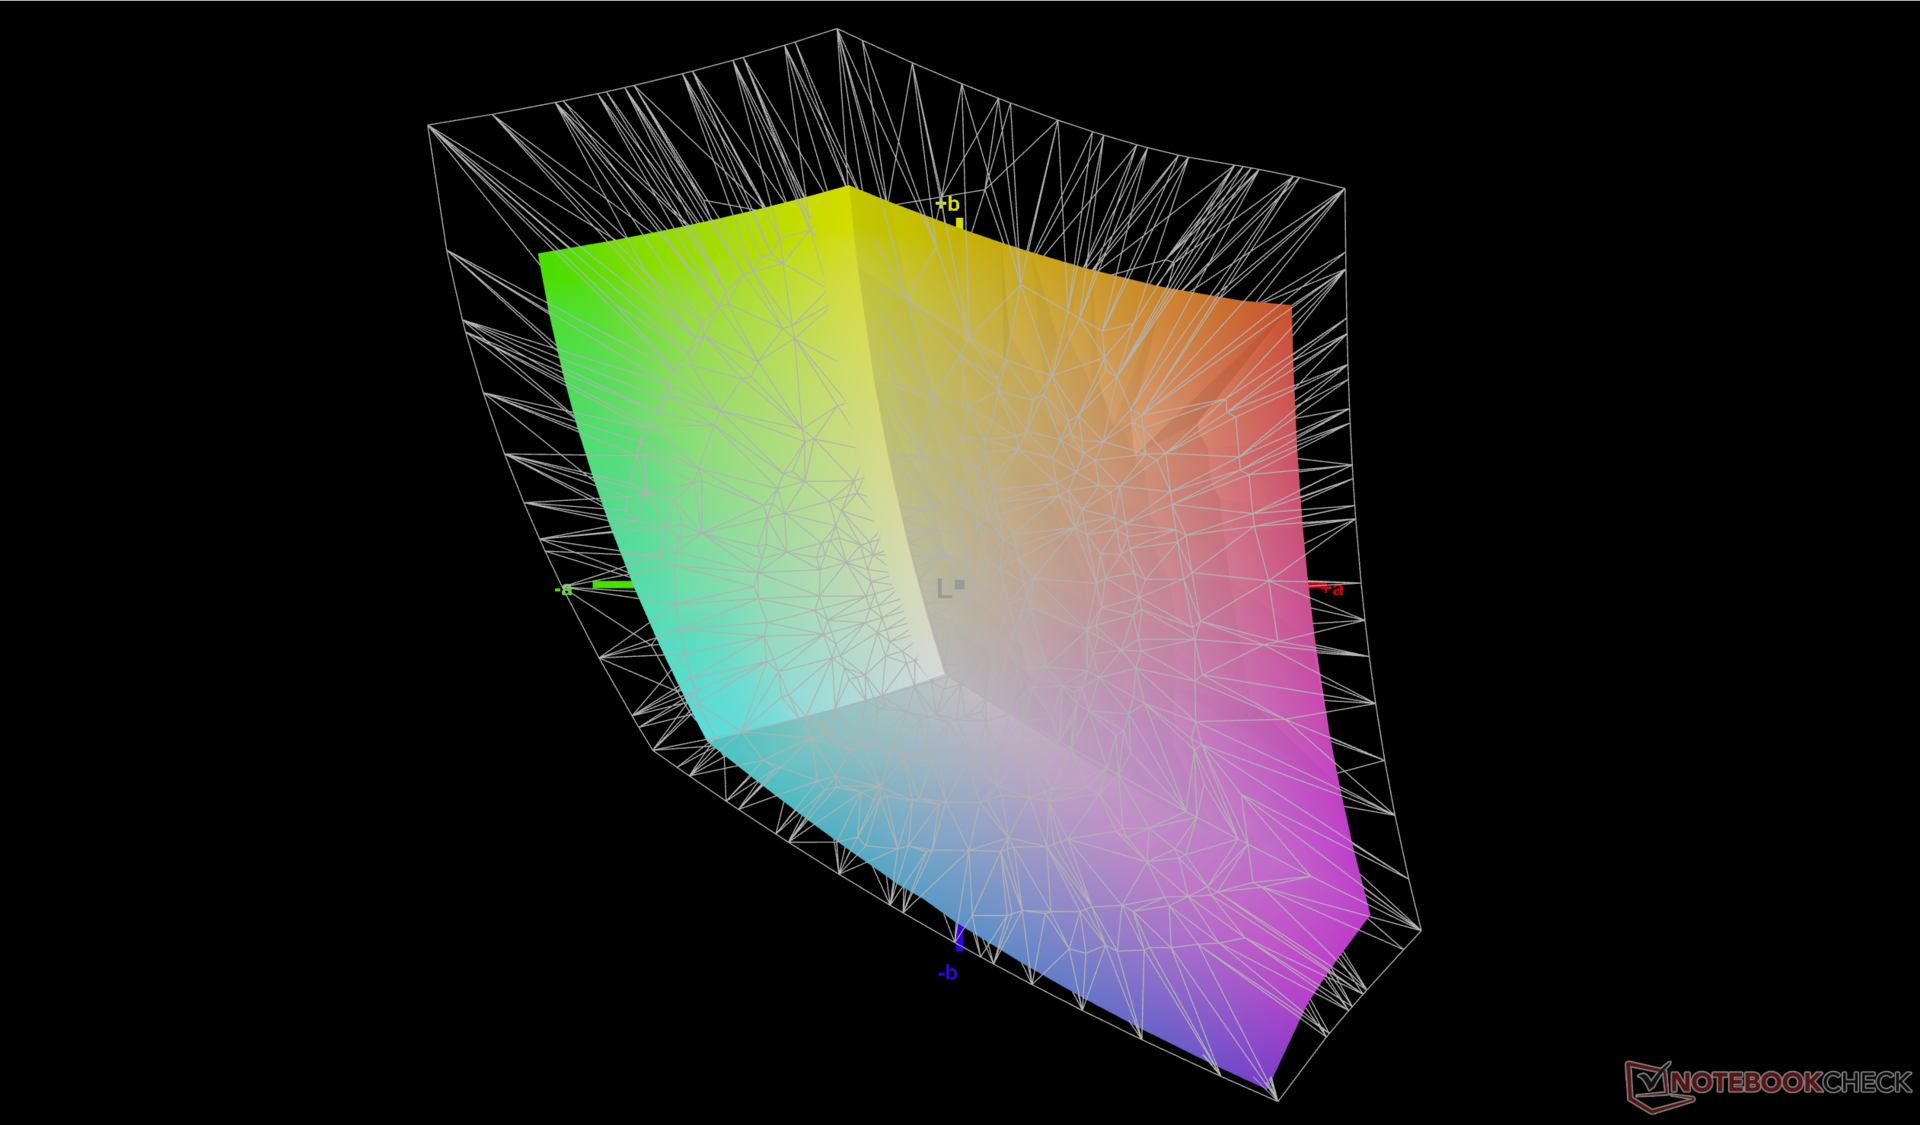
Vergeleken met het BOE 3K-paneel van vorig jaar heeft het nieuwe LG Philips 2,5K-paneel een dubbele eigen verversingssnelheid ten koste van een lagere eigen resolutie. De volledige sRGB dekking, 300-nit helderheid, >1000:1 contrastratio en gemiddelde responstijden zijn verder redelijk vergelijkbaar. Concurrerende modellen zoals de Vivobook Pro 16X of de Envy 16 bieden elk een hogere resolutie met nog diepere kleuren die contentmakers zouden kunnen waarderen. Ons LG Philips-paneel is daarom budgetbewuster.
| |||||||||||||||||||||||||
Helderheidsverdeling: 92 %
Helderheid in Batterij-modus: 299.4 cd/m²
Contrast: 1426:1 (Zwart: 0.21 cd/m²)
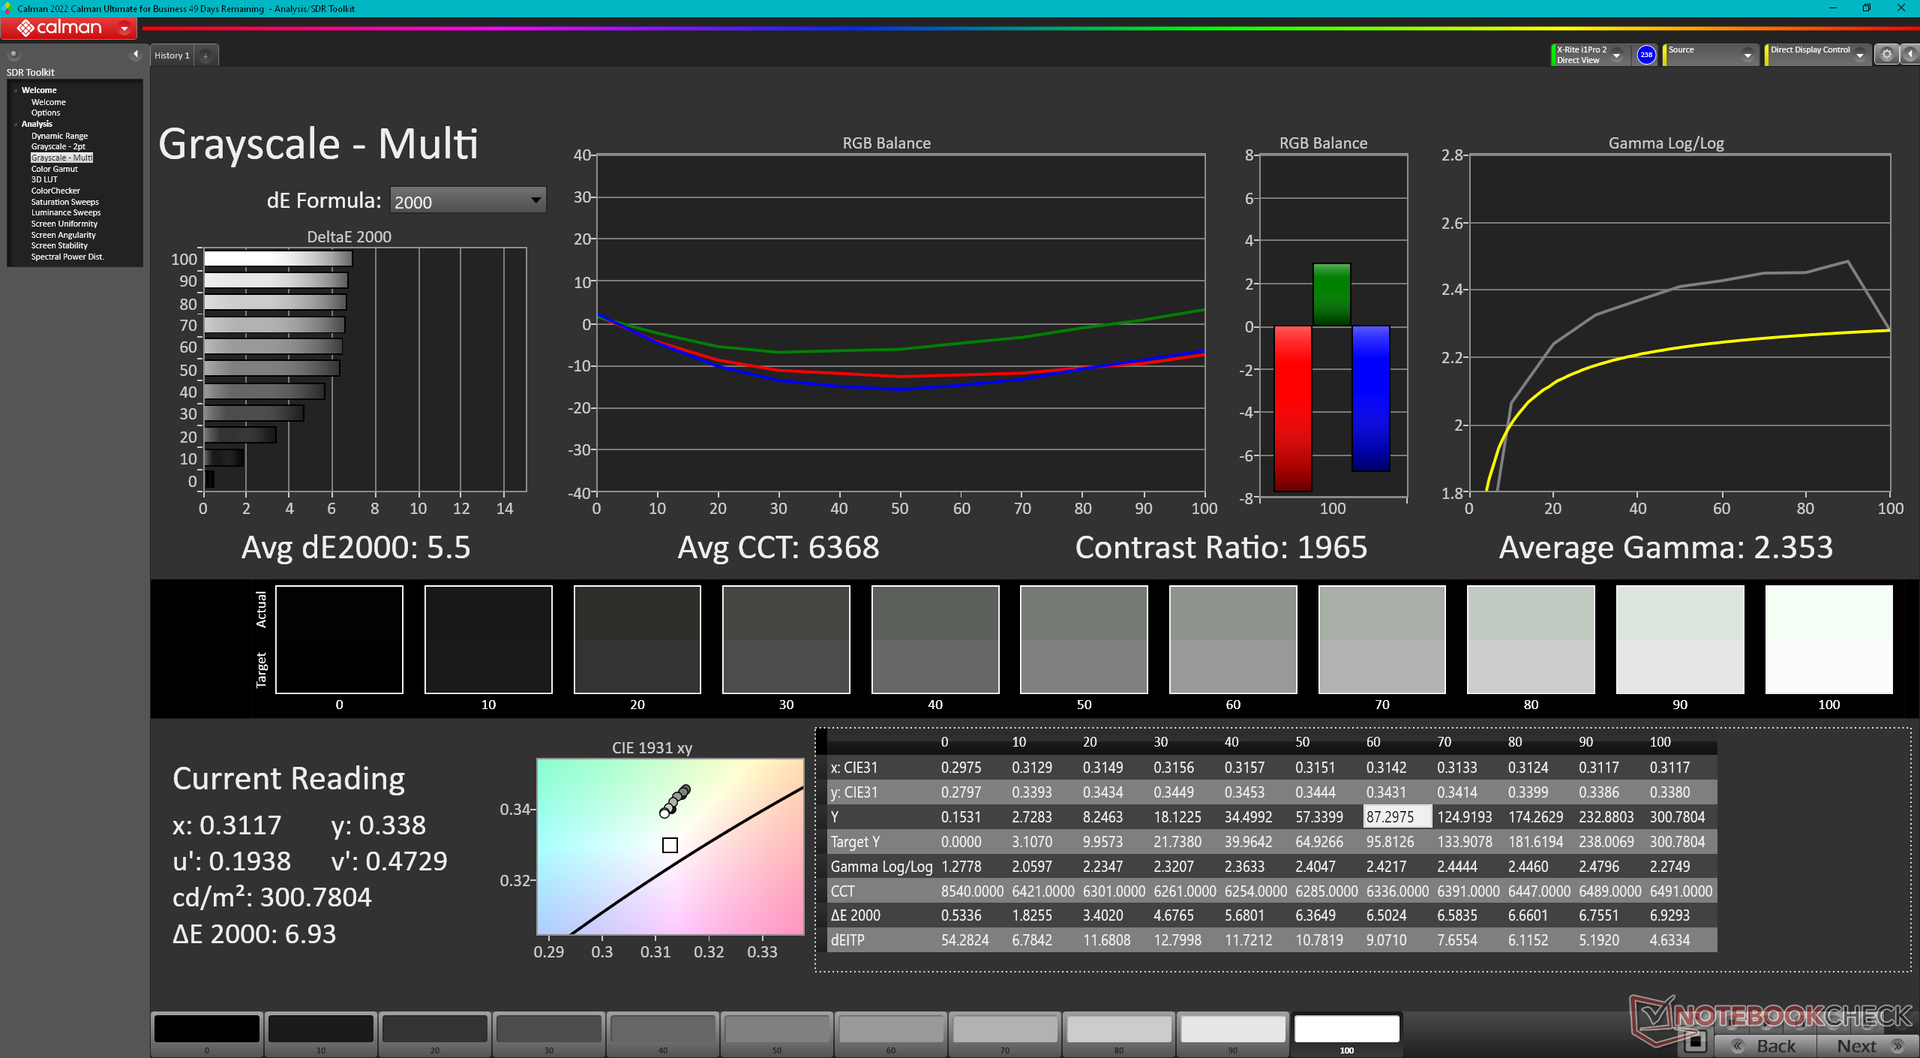
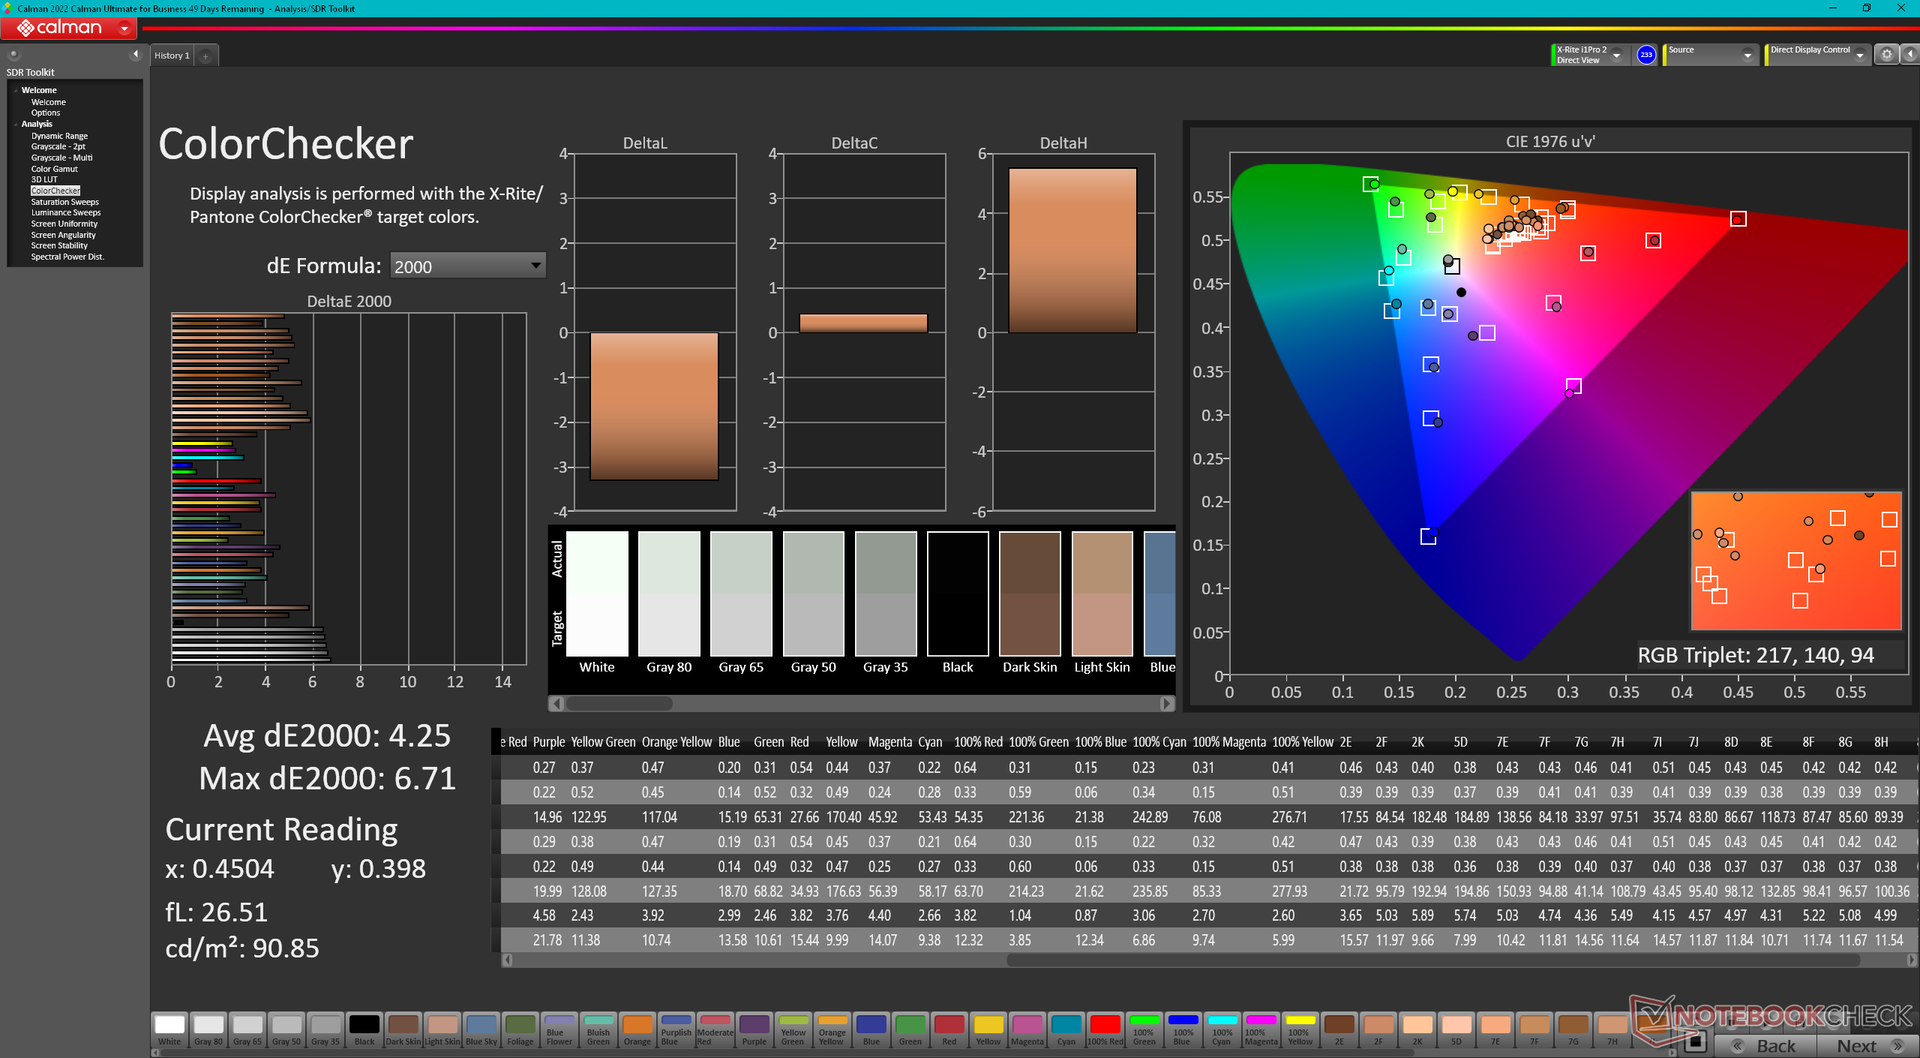
ΔE ColorChecker Calman: 4.25 | ∀{0.5-29.43 Ø4.71}
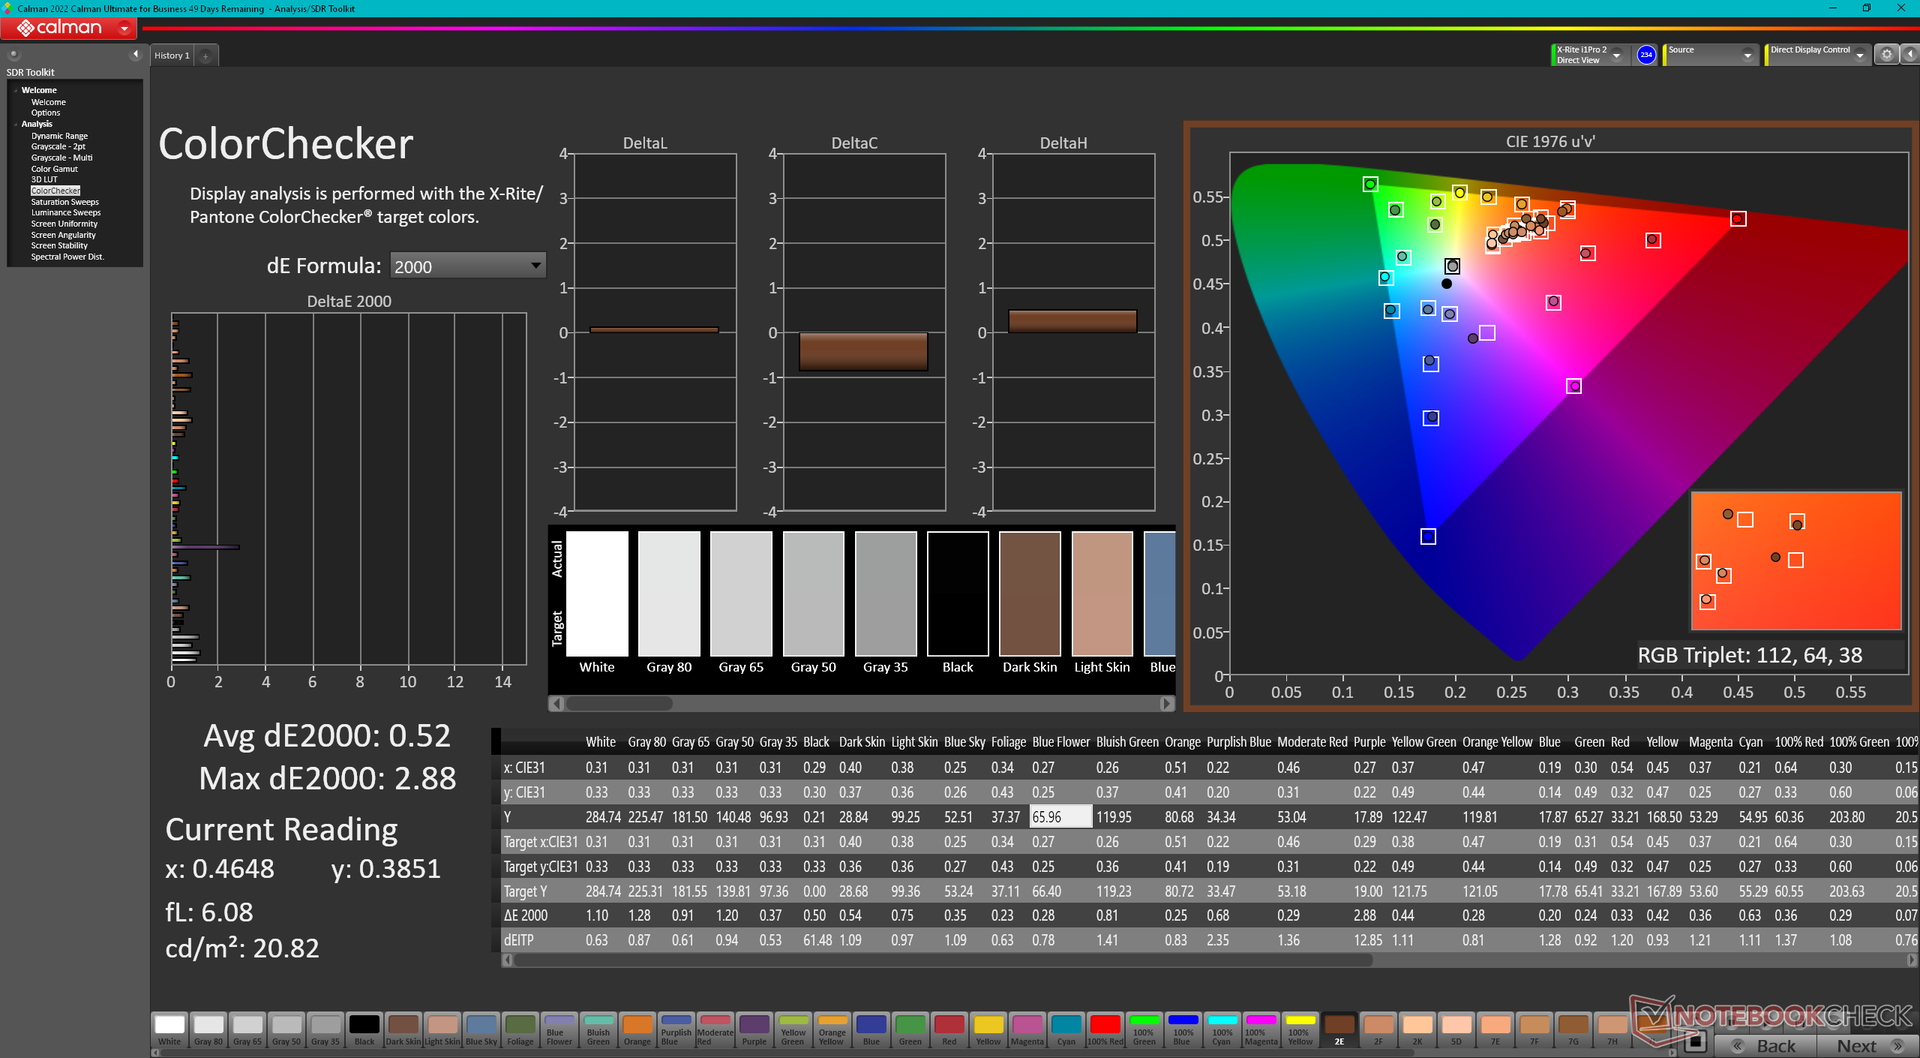
calibrated: 0.52
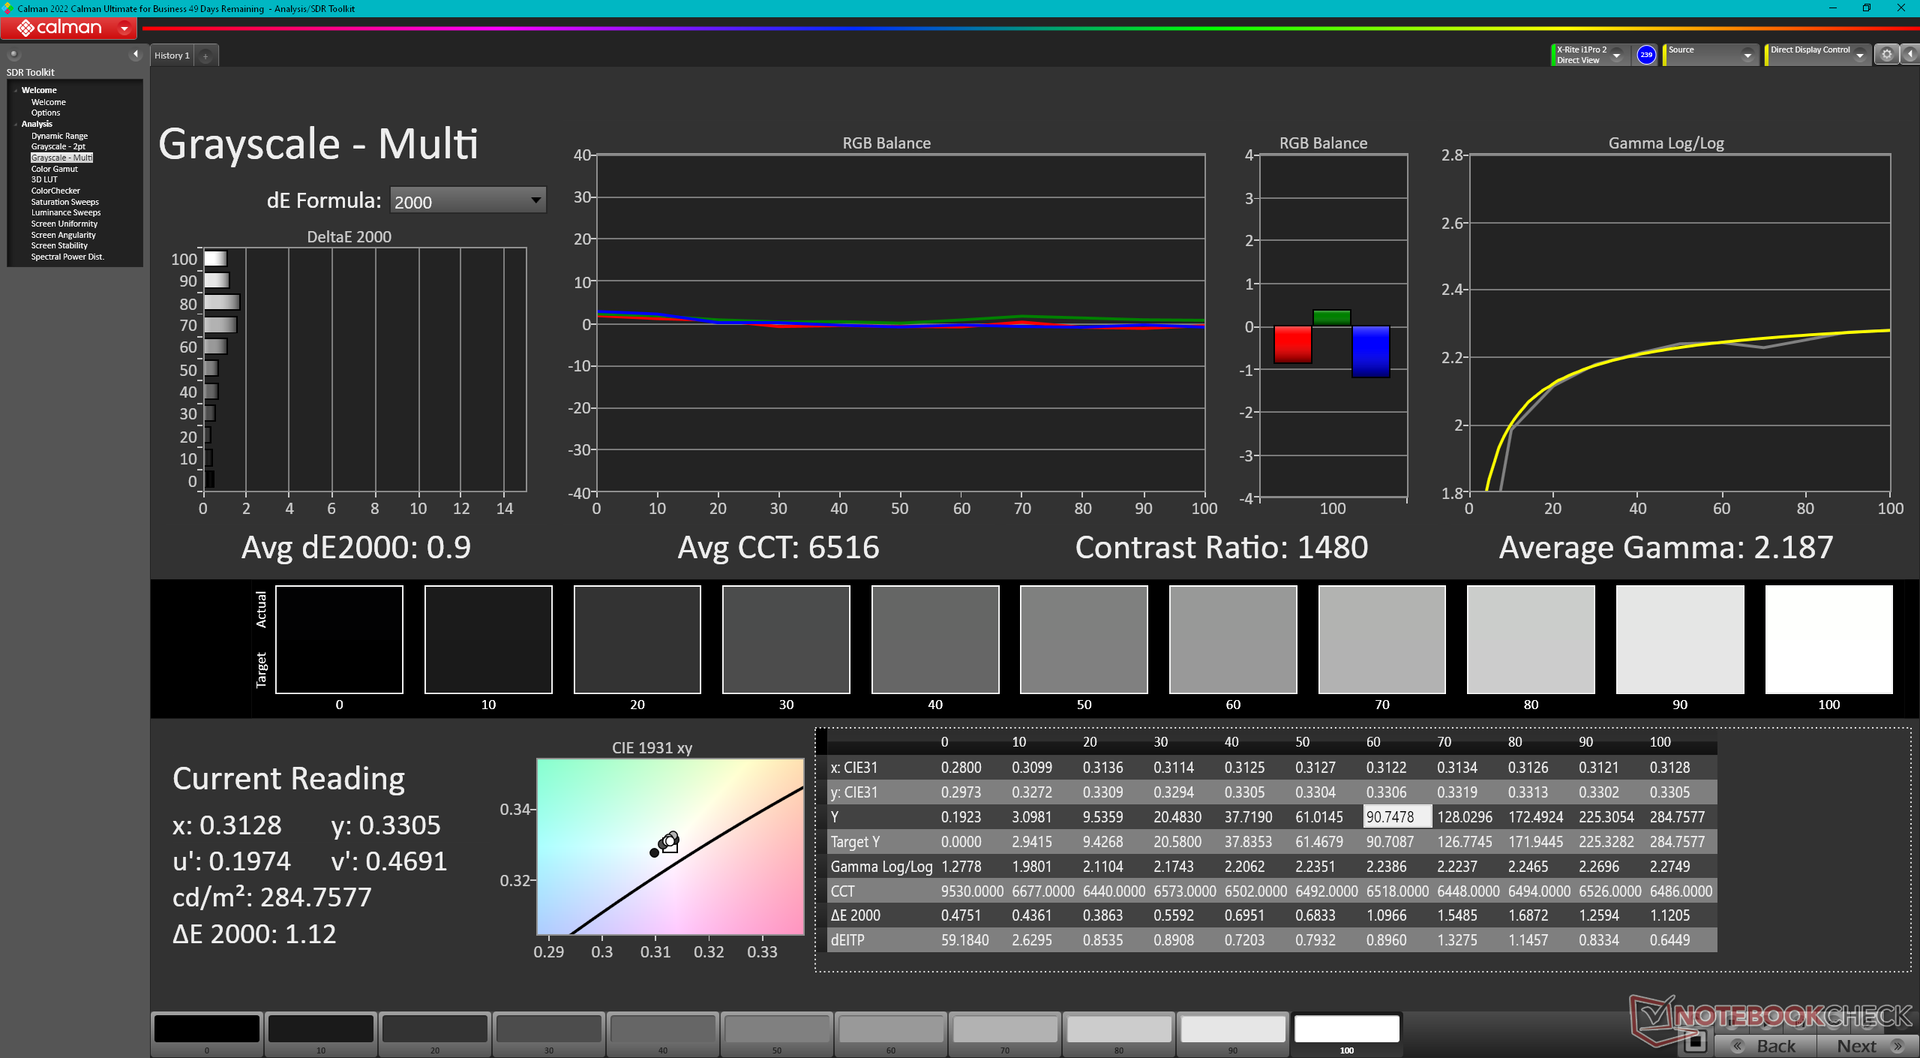
ΔE Greyscale Calman: 5.5 | ∀{0.09-98 Ø4.96}
72.3% AdobeRGB 1998 (Argyll 3D)
99.6% sRGB (Argyll 3D)
70.1% Display P3 (Argyll 3D)
Gamma: 2.35
CCT: 6368 K
| Dell Inspiron 16 Plus 7630 LG Philips 160WQ2, IPS, 2560x1600, 16" | Dell Inspiron 16 Plus 7620 BOE NE16N41, IPS, 3072x1920, 16" | Lenovo Slim Pro 9i 16IRP8 LEN160-3.2K, Mini-LED, 3200x2000, 16" | Asus Vivobook Pro 16X K6604JV-MX016W Samsung SDC4178 ATNA60BX01-1, OLED, 3200x2000, 16" | HP Envy 16 h0112nr Samsung SDC4174, OLED, 3840x2400, 16" | MSI Summit E16 Flip A12UDT-031 AU Optronics B16QAN02.N, IPS, 2560x1600, 16" | |
|---|---|---|---|---|---|---|
| Display | 1% | 18% | 24% | 21% | 20% | |
| Display P3 Coverage (%) | 70.1 | 70.8 1% | 95.1 36% | 98.4 40% | 99.3 42% | 98.9 41% |
| sRGB Coverage (%) | 99.6 | 99.5 0% | 99.9 0% | 99.7 0% | 100 0% | 100 0% |
| AdobeRGB 1998 Coverage (%) | 72.3 | 73.2 1% | 84.6 17% | 95.8 33% | 88 22% | 86.5 20% |
| Response Times | -13% | 61% | 95% | 93% | 63% | |
| Response Time Grey 50% / Grey 80% * (ms) | 35 ? | 38 ? -9% | 14 ? 60% | 1.6 ? 95% | 2 ? 94% | 13 ? 63% |
| Response Time Black / White * (ms) | 24.2 ? | 28 ? -16% | 9.2 ? 62% | 1.4 ? 94% | 1.9 ? 92% | 9 ? 63% |
| PWM Frequency (Hz) | 5784 ? | 120 ? | 240.4 ? | |||
| Screen | 14% | -55% | 35% | 30% | -5% | |
| Brightness middle (cd/m²) | 299.4 | 288.9 -4% | 627.4 110% | 347 16% | 328.8 10% | 314 5% |
| Brightness (cd/m²) | 290 | 276 -5% | 618 113% | 346 19% | 332 14% | 294 1% |
| Brightness Distribution (%) | 92 | 92 0% | 95 3% | 97 5% | 97 5% | 89 -3% |
| Black Level * (cd/m²) | 0.21 | 0.26 -24% | 0.19 10% | 0.06 71% | 0.28 -33% | |
| Contrast (:1) | 1426 | 1111 -22% | 3302 132% | 5783 306% | 1121 -21% | |
| Colorchecker dE 2000 * | 4.25 | 1.88 56% | 5.84 -37% | 1.89 56% | 1.53 64% | 3.08 28% |
| Colorchecker dE 2000 max. * | 6.71 | 4.37 35% | 10.22 -52% | 3.26 51% | 6.04 10% | 5.49 18% |
| Colorchecker dE 2000 calibrated * | 0.52 | 0.42 19% | 4.45 -756% | 1.97 -279% | 0.88 -69% | |
| Greyscale dE 2000 * | 5.5 | 1.4 75% | 6.7 -22% | 1.55 72% | 1.3 76% | 3.99 27% |
| Gamma | 2.35 94% | 2.3 96% | 2.77 79% | 2.39 92% | 2.18 101% | 2.3 96% |
| CCT | 6368 102% | 6634 98% | 5795 112% | 6458 101% | 6362 102% | 6219 105% |
| Totaal Gemiddelde (Programma / Instellingen) | 1% /
8% | 8% /
-23% | 51% /
41% | 48% /
39% | 26% /
10% |
* ... kleiner is beter
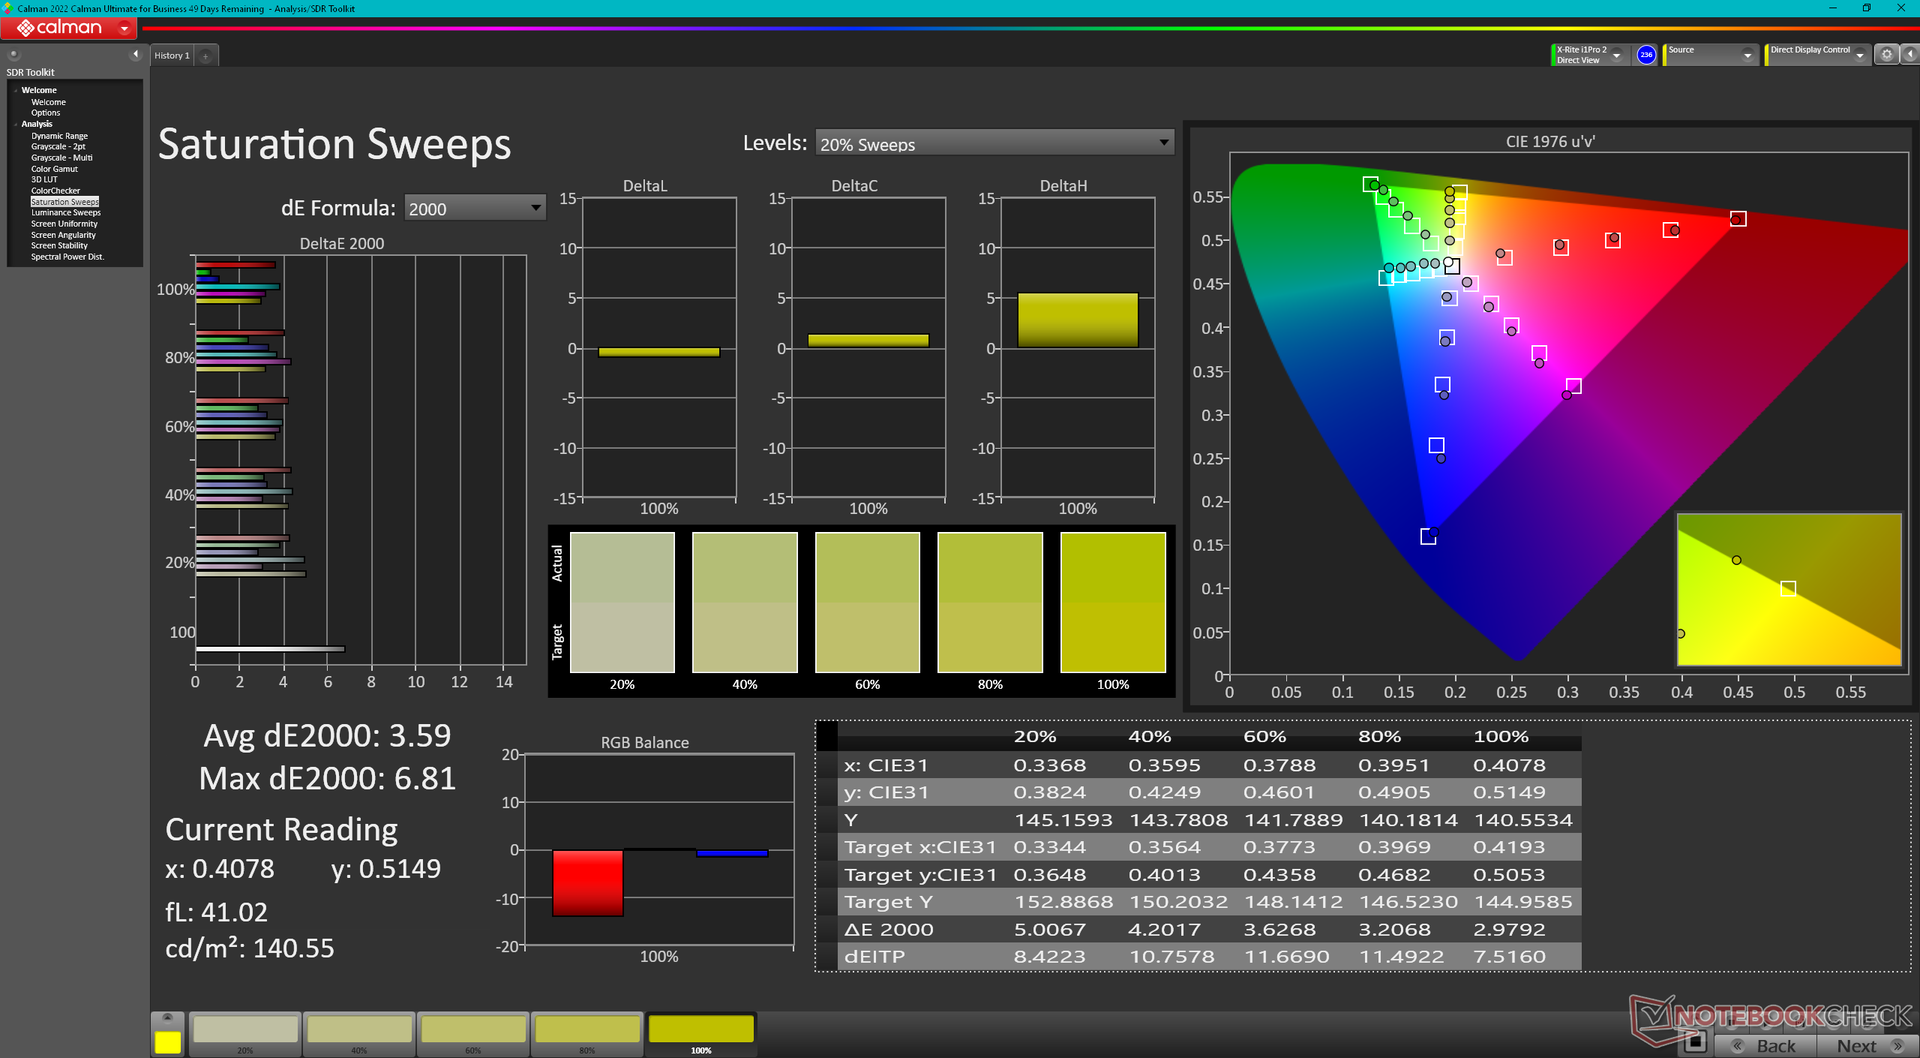
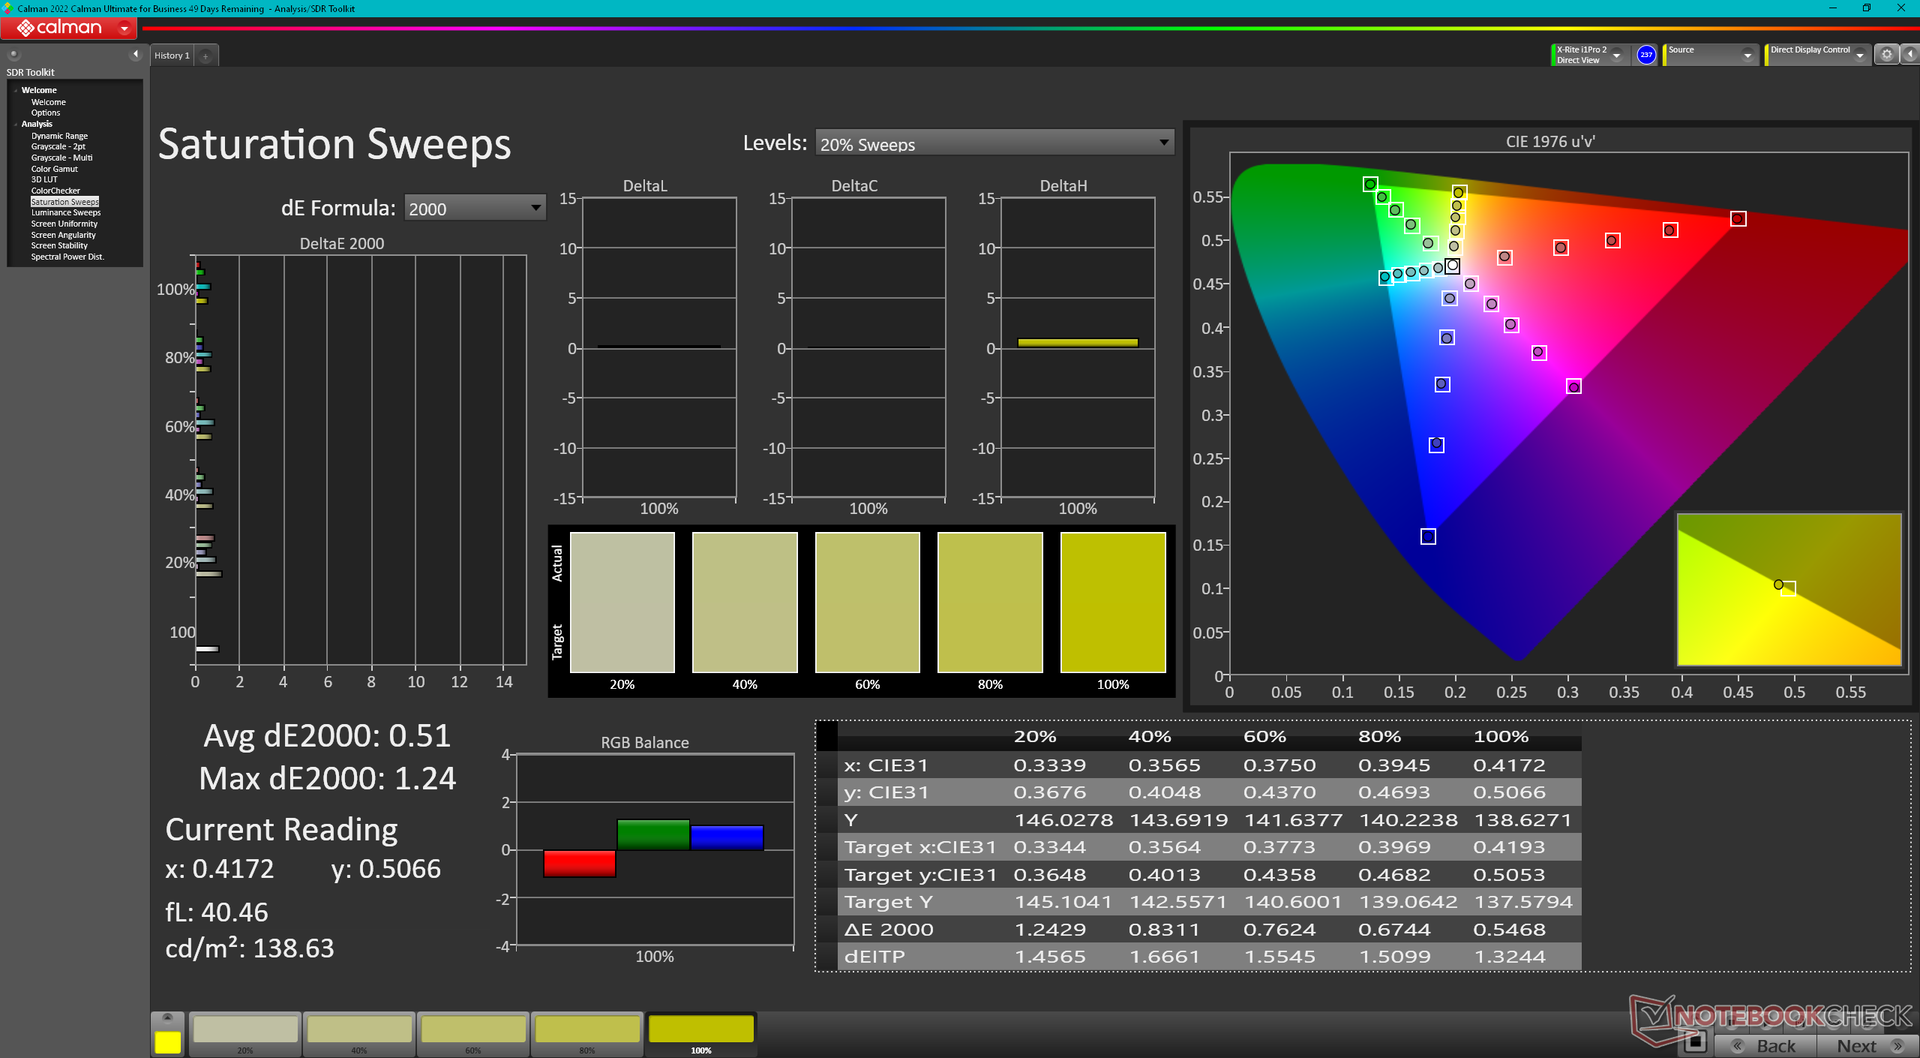
Het scherm is niet vooraf gekalibreerd met gemiddelde grijswaarden en kleurdeltaE waarden van respectievelijk 5,5 en 4,25. De kleurtemperatuur is met 6368 ook warmer dan normaal. Een goede kalibratie met onze X-Rite colorimeter zou al deze problemen oplossen voor een merkbaar nauwkeuriger beeldscherm, zoals blijkt uit onze CalMAN resultaten hieronder. Ons gekalibreerde ICM-profiel kan gratis worden gedownload als eigenaars geen eigen kalibratiegereedschap hebben.
Responstijd Scherm
| ↔ Responstijd Zwart naar Wit | ||
|---|---|---|
| 24.2 ms ... stijging ↗ en daling ↘ gecombineerd | ↗ 10.8 ms stijging | 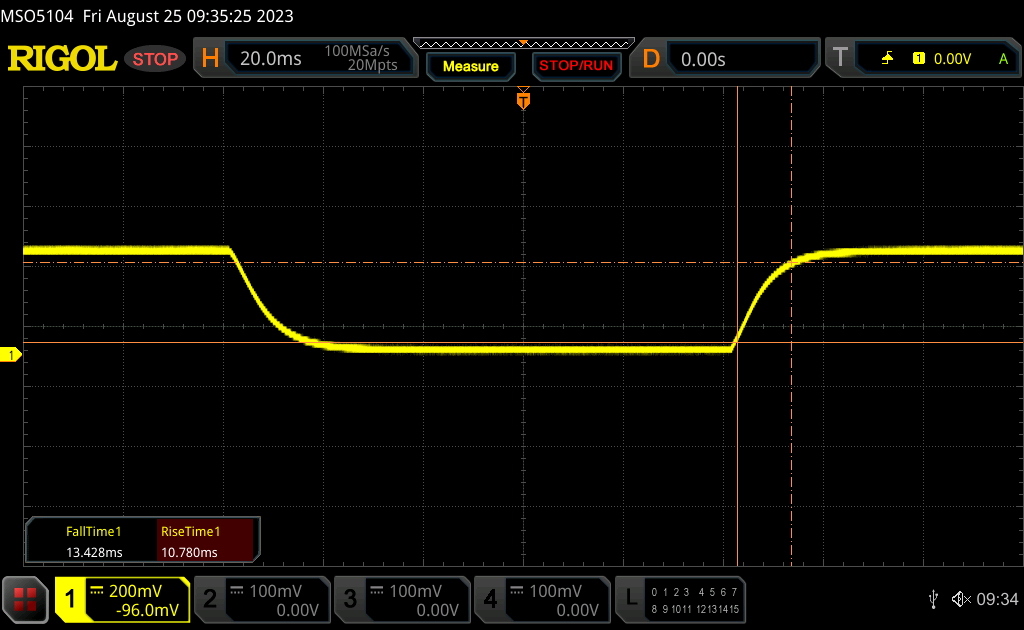 |
| ↘ 13.4 ms daling | ||
| Het scherm vertoonde prima responstijden in onze tests maar is misschien wat te traag voor competitieve games. Ter vergelijking: alle testtoestellen variëren van 0.1 (minimum) tot 240 (maximum) ms. » 57 % van alle toestellen zijn beter. Dit betekent dat de gemeten responstijd slechter is dan het gemiddelde (19.8 ms) van alle geteste toestellen. | ||
| ↔ Responstijd 50% Grijs naar 80% Grijs | ||
| 35 ms ... stijging ↗ en daling ↘ gecombineerd | ↗ 15.7 ms stijging | 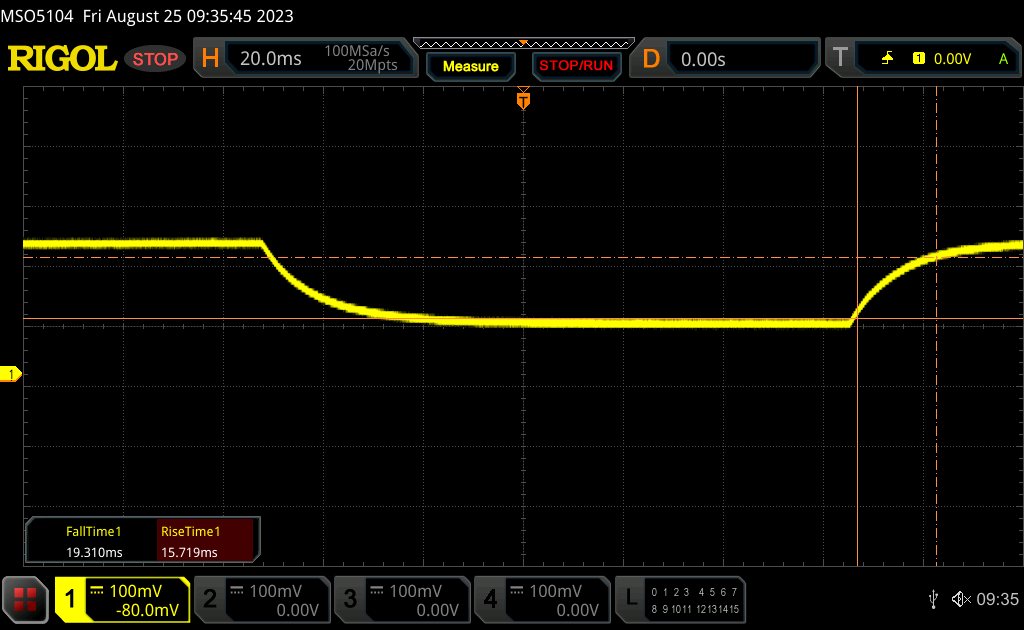 |
| ↘ 19.3 ms daling | ||
| Het scherm vertoonde trage responstijden in onze tests en is misschien te traag voor games. Ter vergelijking: alle testtoestellen variëren van 0.165 (minimum) tot 636 (maximum) ms. » 49 % van alle toestellen zijn beter. Dit betekent dat de gemeten responstijd slechter is dan het gemiddelde (31 ms) van alle geteste toestellen. | ||
Screen Flickering / PWM (Pulse-Width Modulation)
| Screen flickering / PWM niet waargenomen | 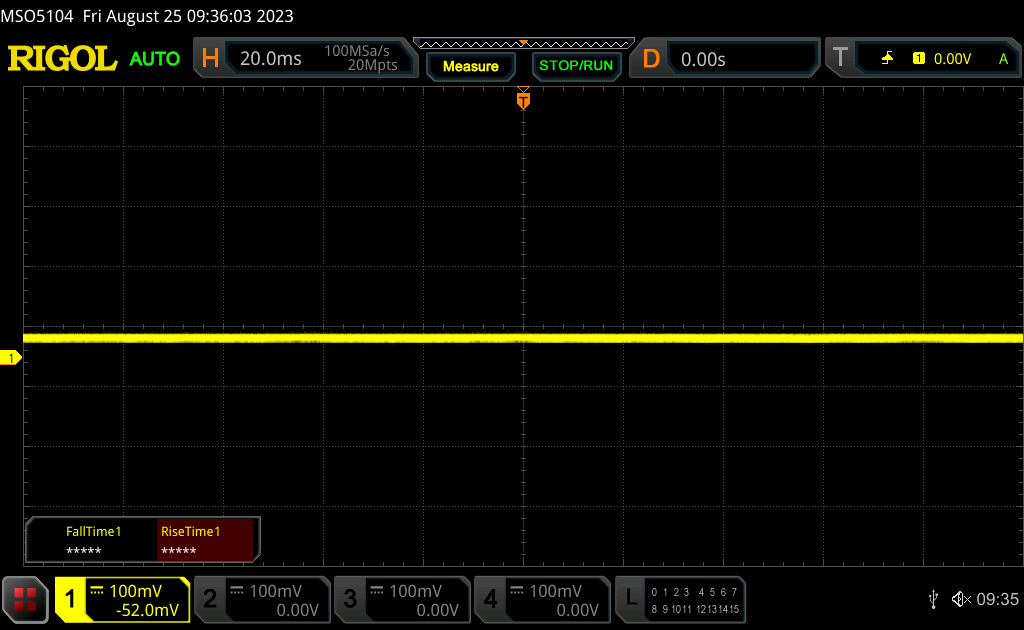 | ||
Ter vergelijking: 52 % van alle geteste toestellen maakten geen gebruik van PWM om de schermhelderheid te verlagen. Als het wel werd gebruikt, werd een gemiddelde van 7754 (minimum: 5 - maximum: 343500) Hz waargenomen. | |||
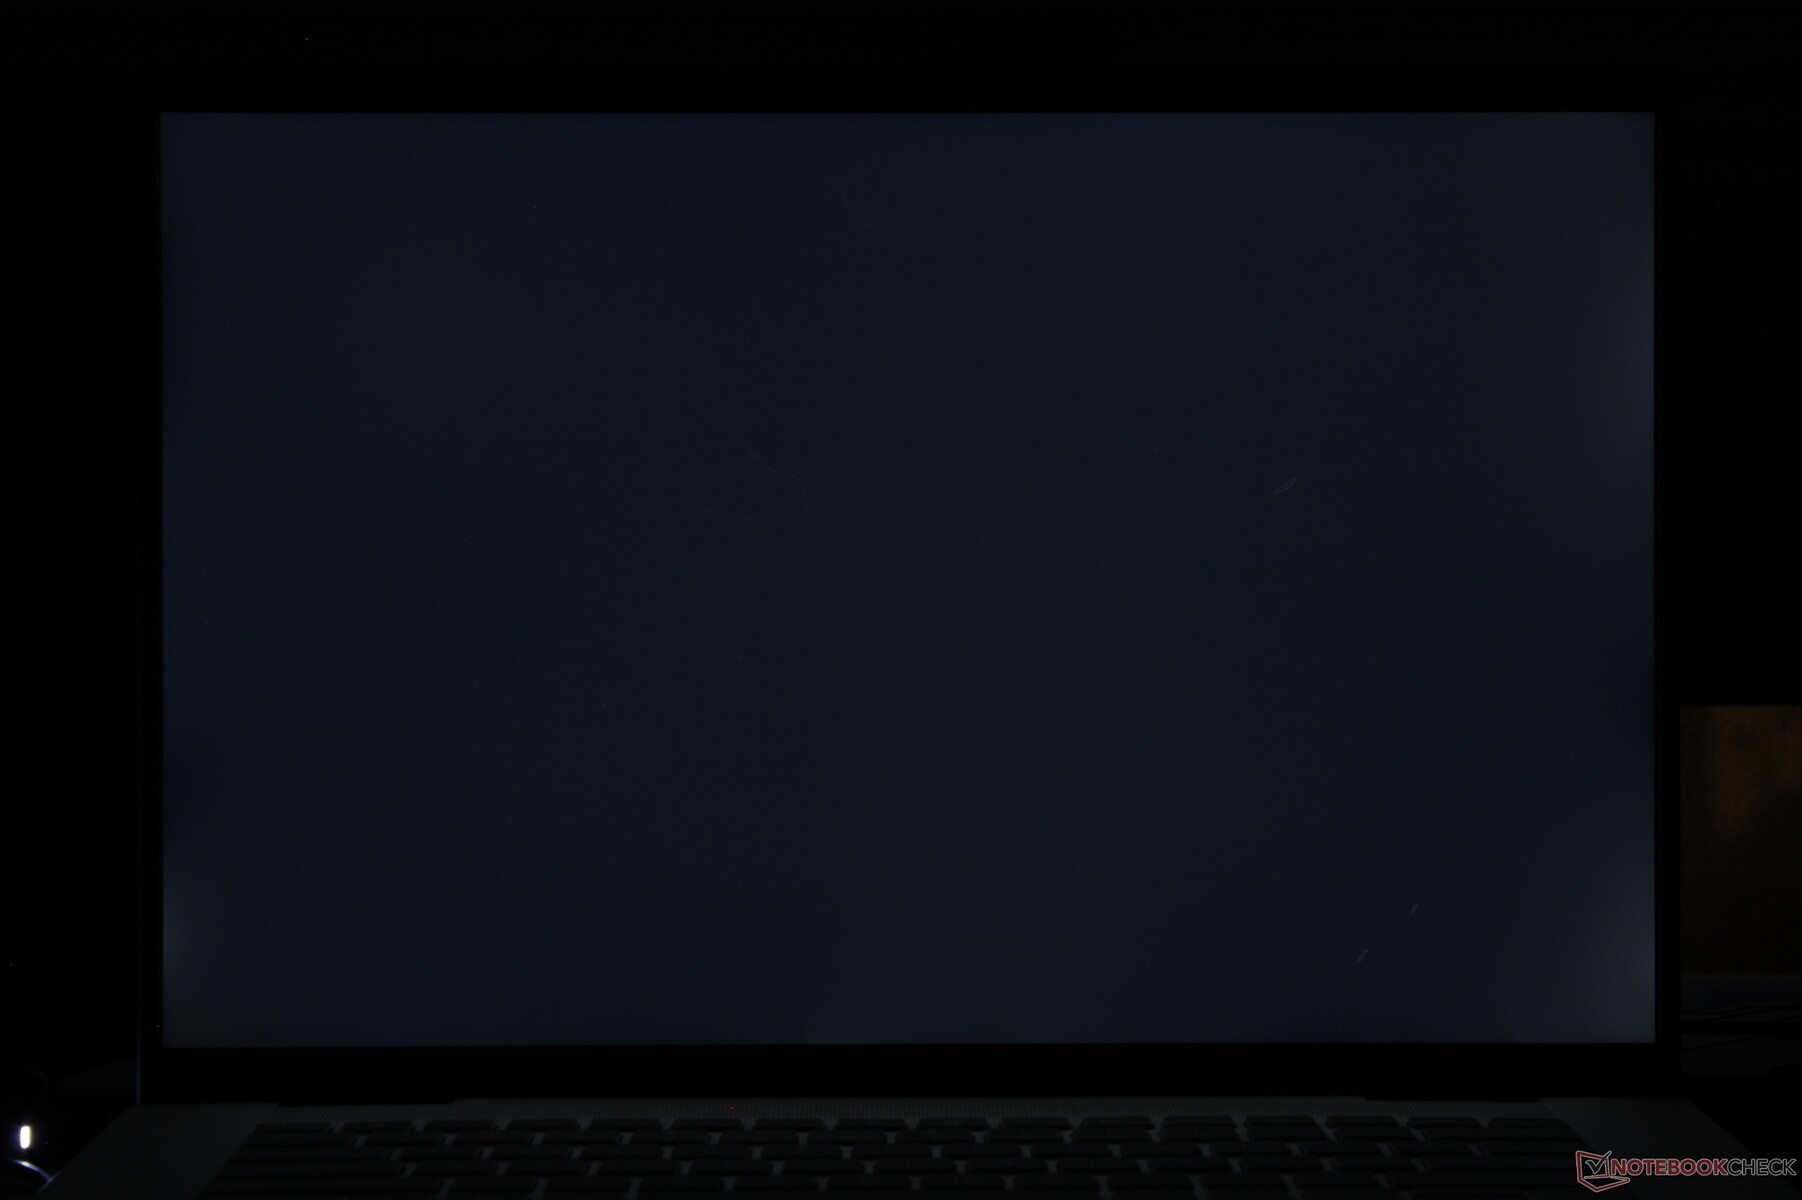
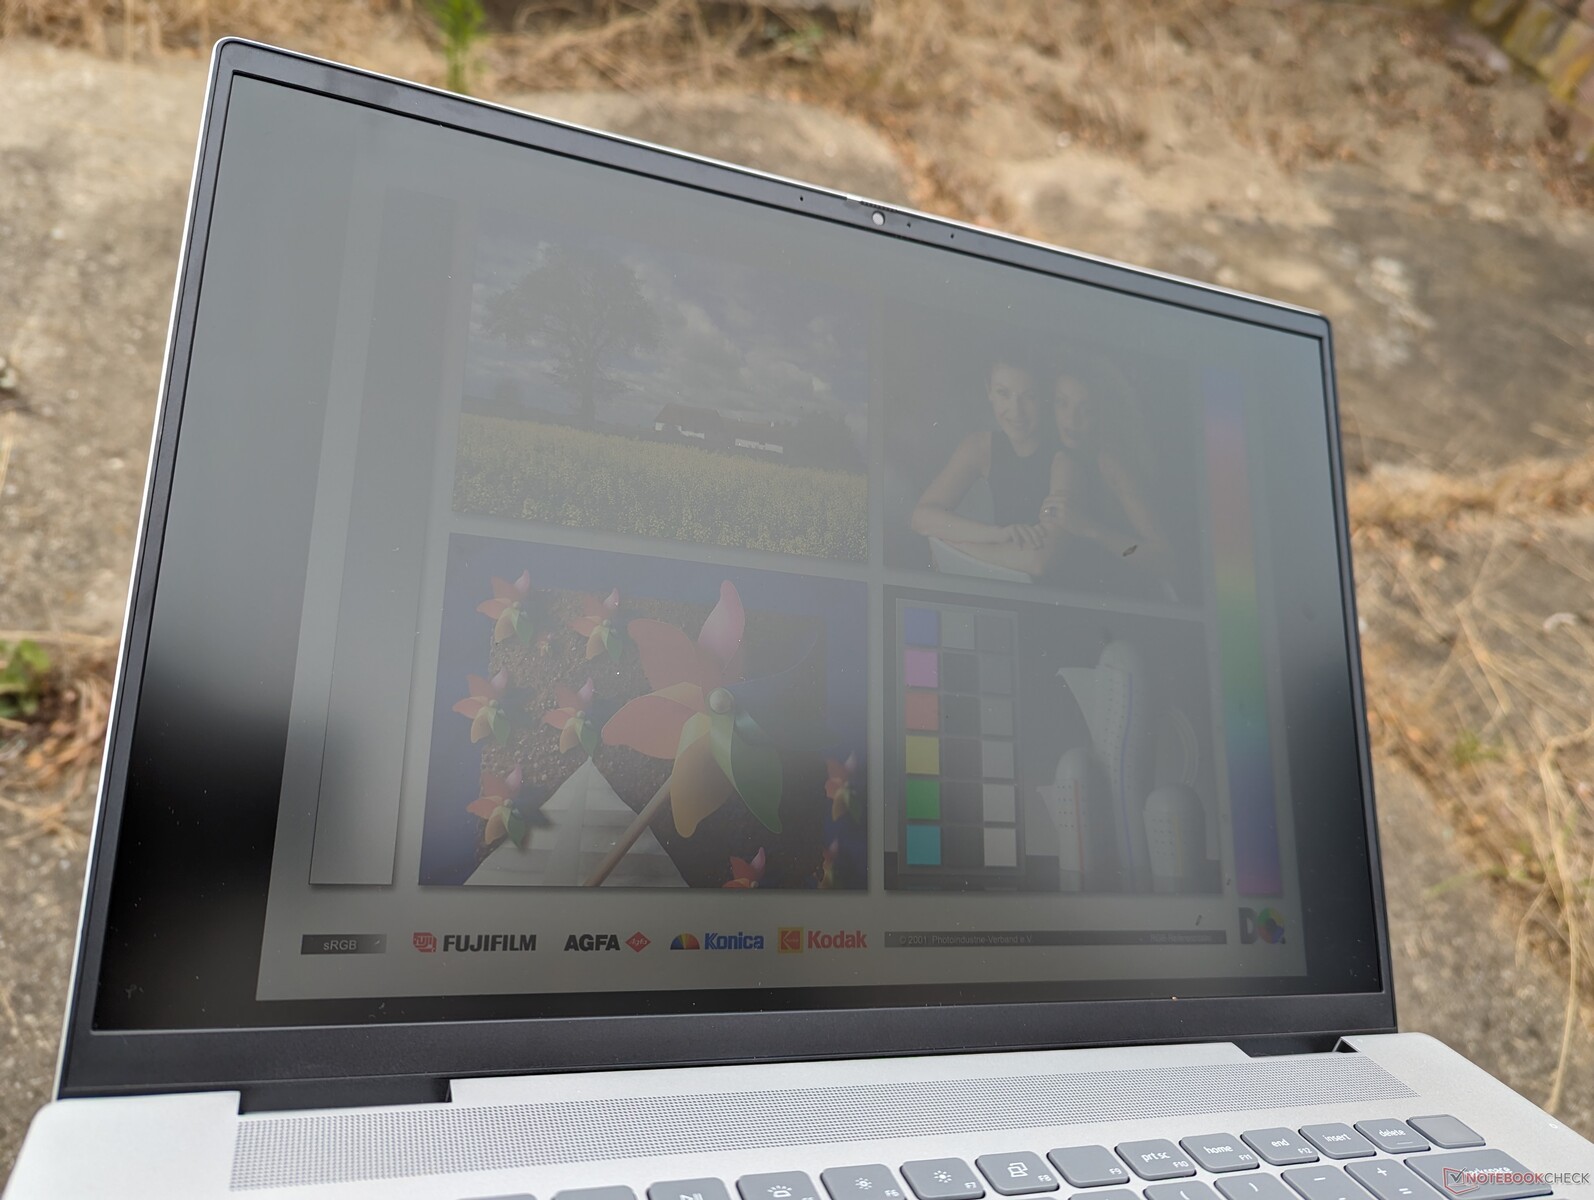
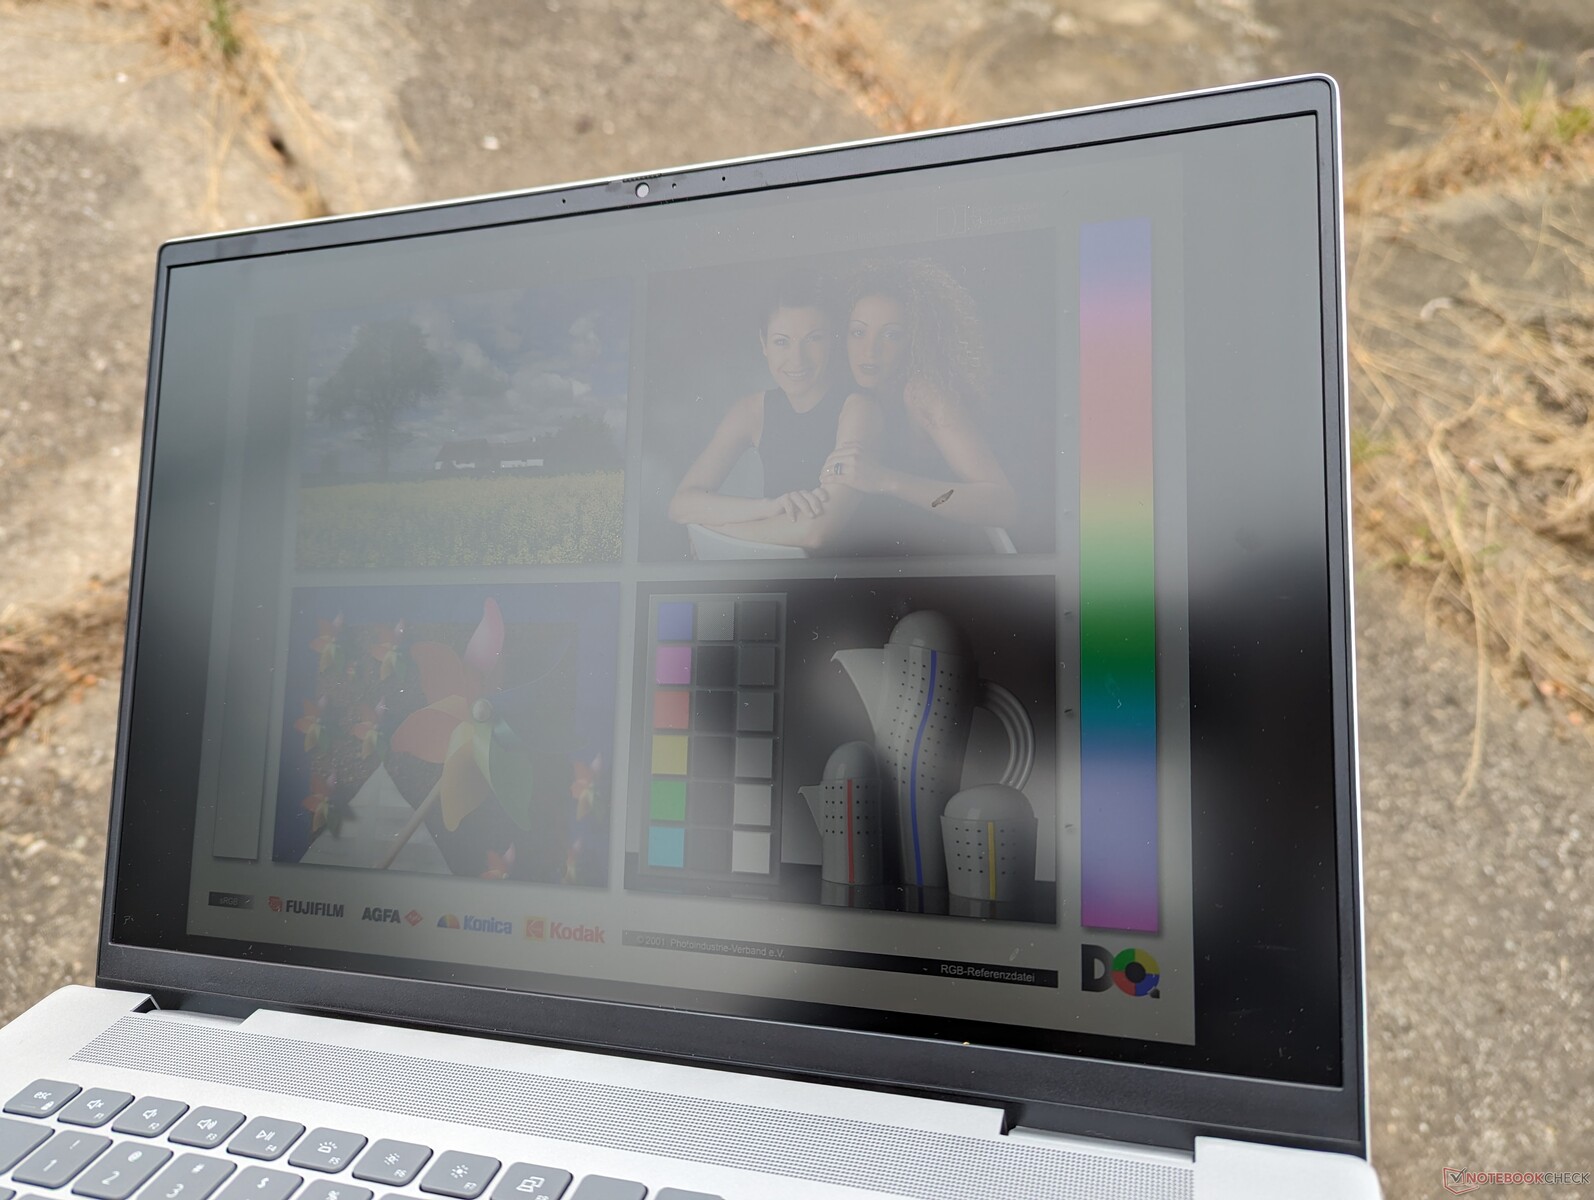
De zichtbaarheid buitenshuis is vergelijkbaar met die van het model van vorig jaar en is alleen fatsoenlijk in de schaduw om schittering te minimaliseren. Andere 16-inch laptops met mini-LED of OLED zoals de Yoga 9i 16 of Razer Blade 16 zijn meestal helderder voor een betere zichtbaarheid buitenshuis, maar ze zijn ook veel duurder dan onze Dell.
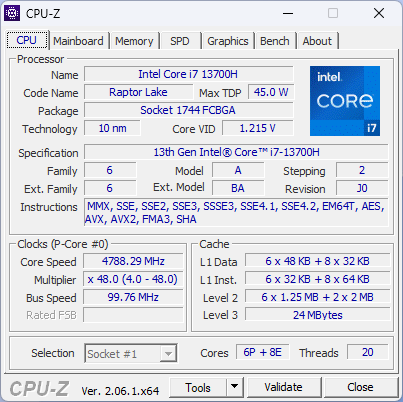
Prestaties - Intel 13e generatie Raptor Lake-H
Testomstandigheden
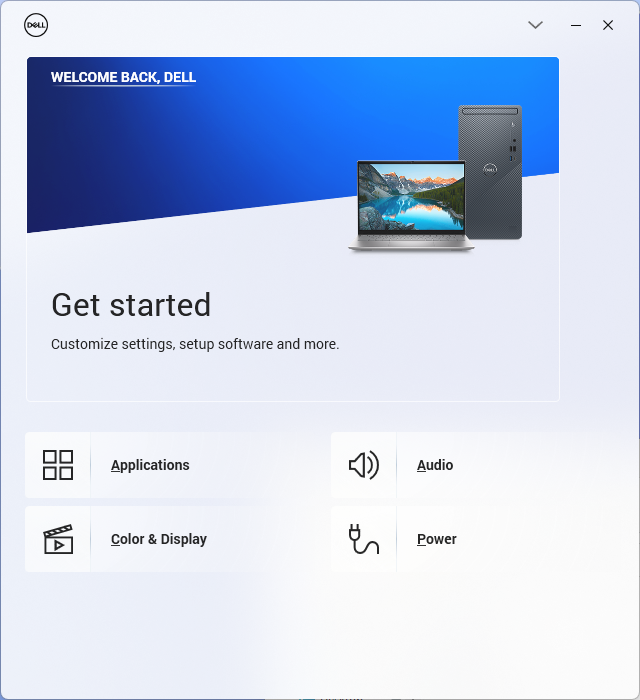
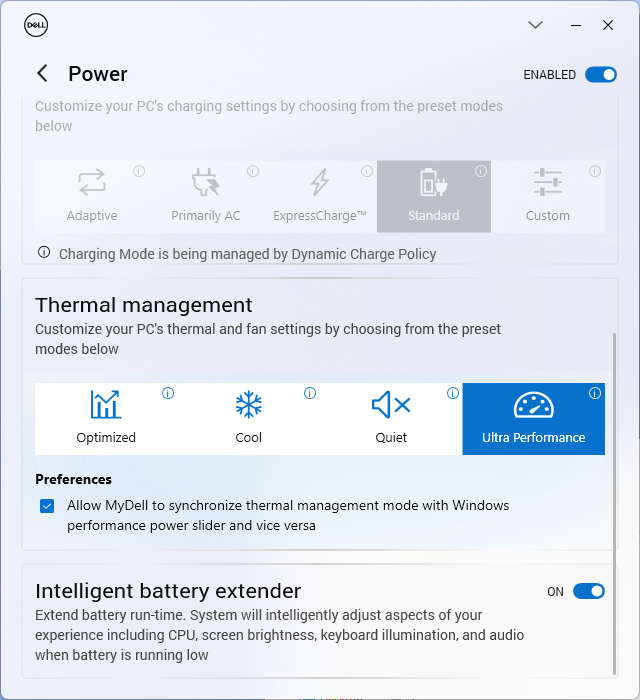
We hebben ons apparaat ingesteld op de modus Prestaties via de vooraf geïnstalleerde MyDell software voordat we de onderstaande benchmarks uitvoerden. De MyDell energieprofielen kunnen worden gesynchroniseerd met de Windows energieprofielen om verwarring te voorkomen en conflicterende instellingen te vermijden.
De Inspiron biedt geen ondersteuning voor Advanced Optimus of MUX, wat in plaats daarvan veel voorkomende functies zijn op speciale gaming modellen uit de Dell G-serie of Alienware-serie.
Processor
CPU-prestaties van onze 13e generatie Core i7-13700H is slechts tot 10 procent sneller dan de 12e generatie Core i7-12700H in de Inspiron 16 Plus 7620 van vorig jaar. Zodra hun respectieve Turbo Boost-voordelen afnemen, worden hun prestatieverschillen echter nog kleiner, zoals blijkt uit onze CineBench R15 xT loop resultaten hieronder. Met andere woorden, de Inspiron 16 Plus 7630 is op zijn best slechts marginaal sneller dan het model van vorig jaar als het gaat om processorprestaties.
Downgraden naar de Core i5-13500H configuratie zal de processorprestaties naar verwachting slechts met ongeveer 10 procent beïnvloeden, gebaseerd op onze ervaring met de Asus VivoBook 14X. Ondertussen heeft de AMD-gebaseerde Ryzen 7 7840HS configuratie naar verwachting nek-aan-nek presteren met onze Core i7-13700H.
Cinebench R15 Multi Loop
Cinebench R23: Multi Core | Single Core
Cinebench R20: CPU (Multi Core) | CPU (Single Core)
Cinebench R15: CPU Multi 64Bit | CPU Single 64Bit
Blender: v2.79 BMW27 CPU
7-Zip 18.03: 7z b 4 | 7z b 4 -mmt1
Geekbench 5.5: Multi-Core | Single-Core
HWBOT x265 Benchmark v2.2: 4k Preset
LibreOffice : 20 Documents To PDF
R Benchmark 2.5: Overall mean
* ... kleiner is beter
AIDA64: FP32 Ray-Trace | FPU Julia | CPU SHA3 | CPU Queen | FPU SinJulia | FPU Mandel | CPU AES | CPU ZLib | FP64 Ray-Trace | CPU PhotoWorxx
| Performance rating | |
| Asus Vivobook Pro 16X K6604JV-MX016W | |
| Lenovo Slim Pro 9i 16IRP8 | |
| Gemiddeld Intel Core i7-13700H | |
| Dell Inspiron 16 Plus 7630 | |
| MSI Summit E16 Flip A12UDT-031 | |
| HP Envy 16 h0112nr | |
| Dell Inspiron 16 Plus 7620 | |
| AIDA64 / FP32 Ray-Trace | |
| Asus Vivobook Pro 16X K6604JV-MX016W | |
| Lenovo Slim Pro 9i 16IRP8 | |
| Gemiddeld Intel Core i7-13700H (4986 - 18908, n=29) | |
| Dell Inspiron 16 Plus 7630 | |
| MSI Summit E16 Flip A12UDT-031 | |
| Dell Inspiron 16 Plus 7620 | |
| HP Envy 16 h0112nr | |
| AIDA64 / FPU Julia | |
| Asus Vivobook Pro 16X K6604JV-MX016W | |
| Lenovo Slim Pro 9i 16IRP8 | |
| Gemiddeld Intel Core i7-13700H (25360 - 92359, n=29) | |
| Dell Inspiron 16 Plus 7630 | |
| MSI Summit E16 Flip A12UDT-031 | |
| Dell Inspiron 16 Plus 7620 | |
| HP Envy 16 h0112nr | |
| AIDA64 / CPU SHA3 | |
| Asus Vivobook Pro 16X K6604JV-MX016W | |
| Lenovo Slim Pro 9i 16IRP8 | |
| Gemiddeld Intel Core i7-13700H (1339 - 4224, n=29) | |
| Dell Inspiron 16 Plus 7630 | |
| MSI Summit E16 Flip A12UDT-031 | |
| Dell Inspiron 16 Plus 7620 | |
| HP Envy 16 h0112nr | |
| AIDA64 / CPU Queen | |
| Asus Vivobook Pro 16X K6604JV-MX016W | |
| Lenovo Slim Pro 9i 16IRP8 | |
| Dell Inspiron 16 Plus 7630 | |
| HP Envy 16 h0112nr | |
| MSI Summit E16 Flip A12UDT-031 | |
| Gemiddeld Intel Core i7-13700H (59324 - 107159, n=29) | |
| Dell Inspiron 16 Plus 7620 | |
| AIDA64 / FPU SinJulia | |
| Asus Vivobook Pro 16X K6604JV-MX016W | |
| Lenovo Slim Pro 9i 16IRP8 | |
| Dell Inspiron 16 Plus 7630 | |
| Gemiddeld Intel Core i7-13700H (4800 - 11050, n=29) | |
| MSI Summit E16 Flip A12UDT-031 | |
| Dell Inspiron 16 Plus 7620 | |
| HP Envy 16 h0112nr | |
| AIDA64 / FPU Mandel | |
| Asus Vivobook Pro 16X K6604JV-MX016W | |
| Lenovo Slim Pro 9i 16IRP8 | |
| Gemiddeld Intel Core i7-13700H (12321 - 45118, n=29) | |
| Dell Inspiron 16 Plus 7630 | |
| MSI Summit E16 Flip A12UDT-031 | |
| Dell Inspiron 16 Plus 7620 | |
| HP Envy 16 h0112nr | |
| AIDA64 / CPU AES | |
| HP Envy 16 h0112nr | |
| Asus Vivobook Pro 16X K6604JV-MX016W | |
| Lenovo Slim Pro 9i 16IRP8 | |
| Gemiddeld Intel Core i7-13700H (28769 - 151254, n=29) | |
| Dell Inspiron 16 Plus 7620 | |
| MSI Summit E16 Flip A12UDT-031 | |
| Dell Inspiron 16 Plus 7630 | |
| AIDA64 / CPU ZLib | |
| Asus Vivobook Pro 16X K6604JV-MX016W | |
| Lenovo Slim Pro 9i 16IRP8 | |
| Dell Inspiron 16 Plus 7620 | |
| Gemiddeld Intel Core i7-13700H (389 - 1215, n=29) | |
| MSI Summit E16 Flip A12UDT-031 | |
| Dell Inspiron 16 Plus 7630 | |
| HP Envy 16 h0112nr | |
| AIDA64 / FP64 Ray-Trace | |
| Asus Vivobook Pro 16X K6604JV-MX016W | |
| Lenovo Slim Pro 9i 16IRP8 | |
| Gemiddeld Intel Core i7-13700H (2540 - 10135, n=29) | |
| Dell Inspiron 16 Plus 7630 | |
| MSI Summit E16 Flip A12UDT-031 | |
| Dell Inspiron 16 Plus 7620 | |
| HP Envy 16 h0112nr | |
| AIDA64 / CPU PhotoWorxx | |
| Lenovo Slim Pro 9i 16IRP8 | |
| Asus Vivobook Pro 16X K6604JV-MX016W | |
| MSI Summit E16 Flip A12UDT-031 | |
| Gemiddeld Intel Core i7-13700H (12872 - 52727, n=29) | |
| Dell Inspiron 16 Plus 7630 | |
| HP Envy 16 h0112nr | |
| Dell Inspiron 16 Plus 7620 | |
Systeemprestaties
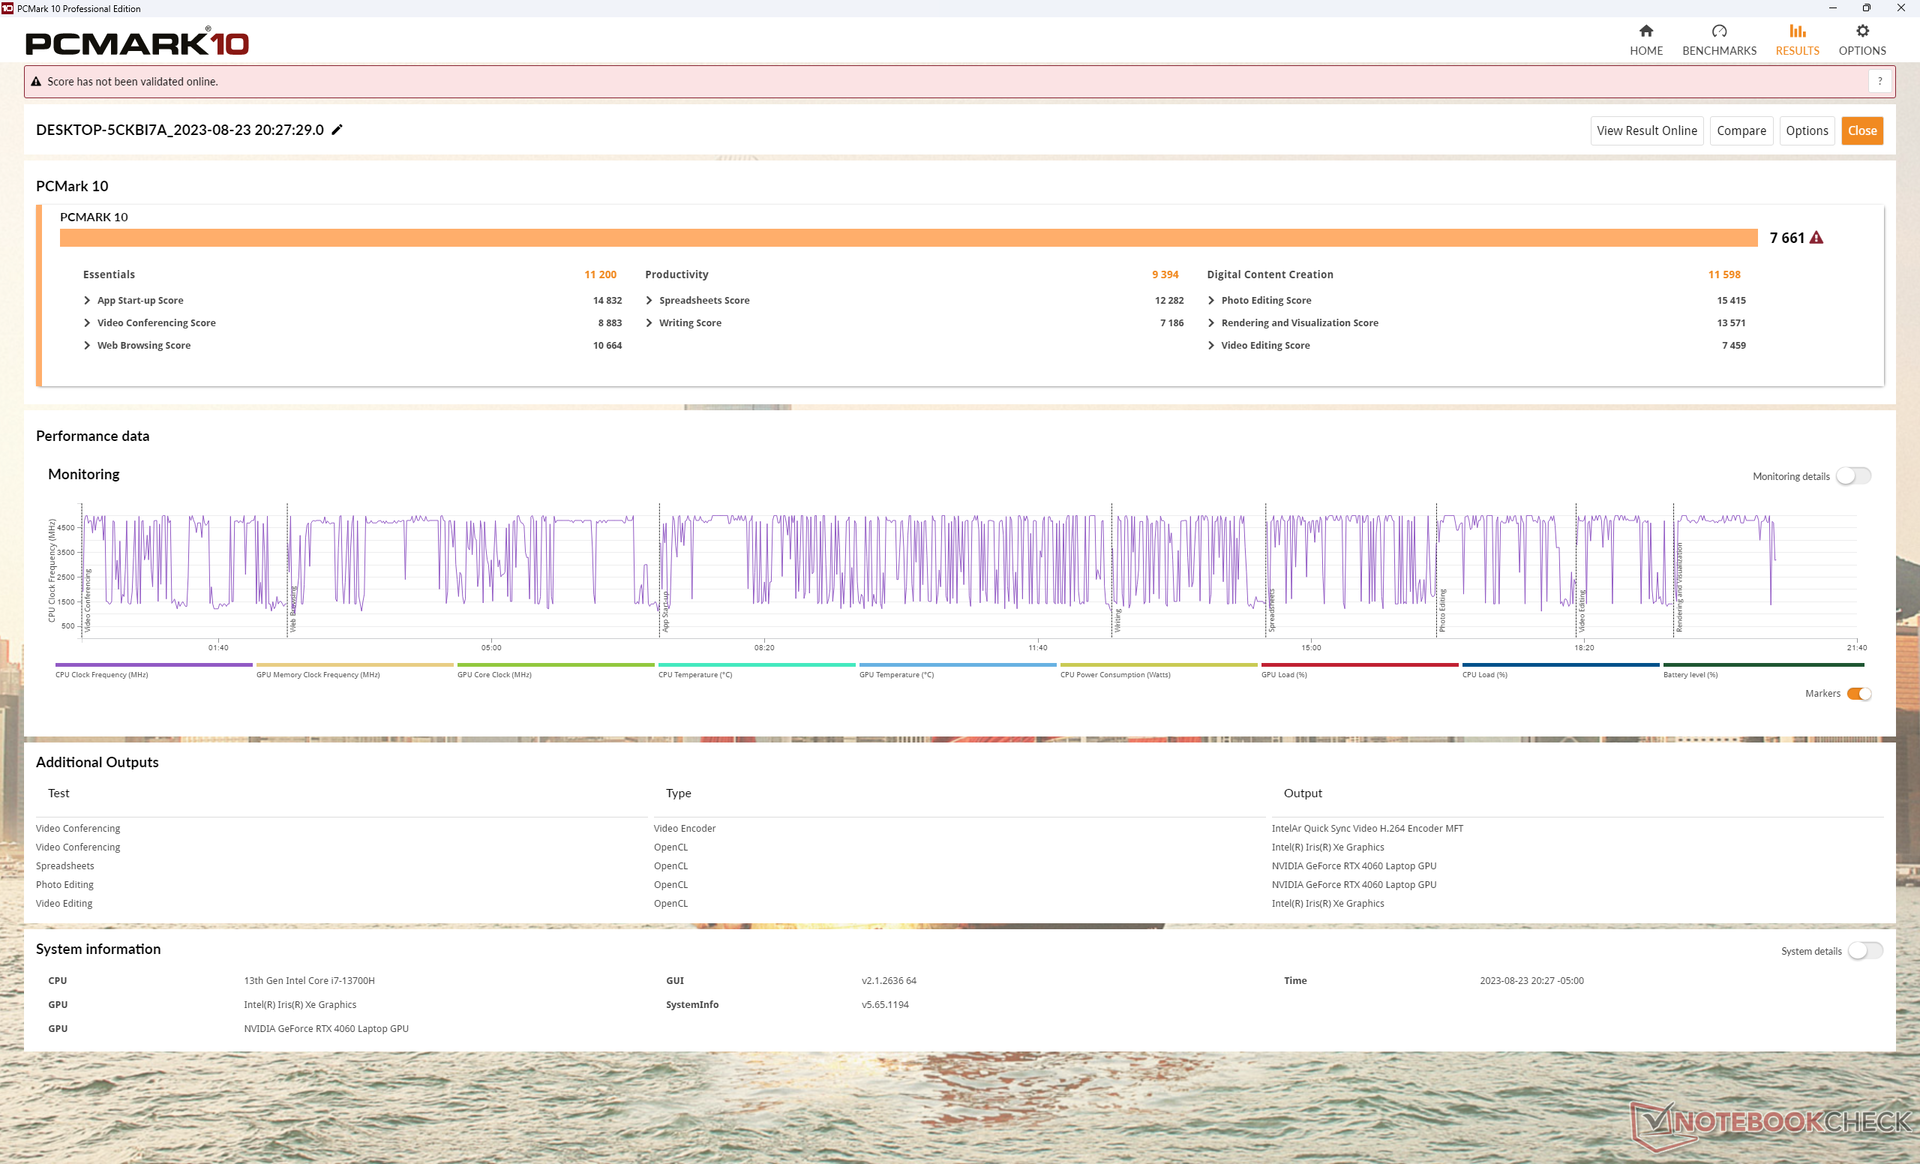
PCMark-scores zijn consistent hoger dan op de Inspiron 16 Plus 7620 van vorig jaar, vooral in de subtest voor het maken van digitale content, waar GPU-prestaties het belangrijkst zijn.
We hebben geen problemen ondervonden met ontwaken uit slaap of BSOD's, in tegenstelling tot de recente Alienware m16 R1.
CrossMark: Overall | Productivity | Creativity | Responsiveness
| PCMark 10 / Score | |
| Lenovo Slim Pro 9i 16IRP8 | |
| Dell Inspiron 16 Plus 7630 | |
| HP Envy 16 h0112nr | |
| Gemiddeld Intel Core i7-13700H, NVIDIA GeForce RTX 4060 Laptop GPU (7157 - 7661, n=5) | |
| Asus Vivobook Pro 16X K6604JV-MX016W | |
| Dell Inspiron 16 Plus 7620 | |
| MSI Summit E16 Flip A12UDT-031 | |
| PCMark 10 / Essentials | |
| HP Envy 16 h0112nr | |
| Lenovo Slim Pro 9i 16IRP8 | |
| Dell Inspiron 16 Plus 7630 | |
| Gemiddeld Intel Core i7-13700H, NVIDIA GeForce RTX 4060 Laptop GPU (10179 - 11200, n=5) | |
| Asus Vivobook Pro 16X K6604JV-MX016W | |
| Dell Inspiron 16 Plus 7620 | |
| MSI Summit E16 Flip A12UDT-031 | |
| PCMark 10 / Productivity | |
| Lenovo Slim Pro 9i 16IRP8 | |
| Gemiddeld Intel Core i7-13700H, NVIDIA GeForce RTX 4060 Laptop GPU (8238 - 10249, n=5) | |
| Dell Inspiron 16 Plus 7630 | |
| HP Envy 16 h0112nr | |
| Dell Inspiron 16 Plus 7620 | |
| Asus Vivobook Pro 16X K6604JV-MX016W | |
| MSI Summit E16 Flip A12UDT-031 | |
| PCMark 10 / Digital Content Creation | |
| Dell Inspiron 16 Plus 7630 | |
| Lenovo Slim Pro 9i 16IRP8 | |
| Gemiddeld Intel Core i7-13700H, NVIDIA GeForce RTX 4060 Laptop GPU (10308 - 11862, n=5) | |
| HP Envy 16 h0112nr | |
| Dell Inspiron 16 Plus 7620 | |
| Asus Vivobook Pro 16X K6604JV-MX016W | |
| MSI Summit E16 Flip A12UDT-031 | |
| CrossMark / Overall | |
| Asus Vivobook Pro 16X K6604JV-MX016W | |
| Dell Inspiron 16 Plus 7630 | |
| HP Envy 16 h0112nr | |
| Lenovo Slim Pro 9i 16IRP8 | |
| Dell Inspiron 16 Plus 7620 | |
| Gemiddeld Intel Core i7-13700H, NVIDIA GeForce RTX 4060 Laptop GPU (1629 - 1849, n=5) | |
| MSI Summit E16 Flip A12UDT-031 | |
| CrossMark / Productivity | |
| Asus Vivobook Pro 16X K6604JV-MX016W | |
| Dell Inspiron 16 Plus 7630 | |
| HP Envy 16 h0112nr | |
| Dell Inspiron 16 Plus 7620 | |
| Lenovo Slim Pro 9i 16IRP8 | |
| Gemiddeld Intel Core i7-13700H, NVIDIA GeForce RTX 4060 Laptop GPU (1561 - 1743, n=5) | |
| MSI Summit E16 Flip A12UDT-031 | |
| CrossMark / Creativity | |
| Asus Vivobook Pro 16X K6604JV-MX016W | |
| Lenovo Slim Pro 9i 16IRP8 | |
| Dell Inspiron 16 Plus 7630 | |
| HP Envy 16 h0112nr | |
| Dell Inspiron 16 Plus 7620 | |
| Gemiddeld Intel Core i7-13700H, NVIDIA GeForce RTX 4060 Laptop GPU (1691 - 2064, n=5) | |
| MSI Summit E16 Flip A12UDT-031 | |
| CrossMark / Responsiveness | |
| Asus Vivobook Pro 16X K6604JV-MX016W | |
| HP Envy 16 h0112nr | |
| Dell Inspiron 16 Plus 7630 | |
| MSI Summit E16 Flip A12UDT-031 | |
| Dell Inspiron 16 Plus 7620 | |
| Gemiddeld Intel Core i7-13700H, NVIDIA GeForce RTX 4060 Laptop GPU (1381 - 1656, n=5) | |
| Lenovo Slim Pro 9i 16IRP8 | |
| PCMark 10 Score | 7661 punten | |
Help | ||
| AIDA64 / Memory Copy | |
| Lenovo Slim Pro 9i 16IRP8 | |
| Asus Vivobook Pro 16X K6604JV-MX016W | |
| MSI Summit E16 Flip A12UDT-031 | |
| Gemiddeld Intel Core i7-13700H (24334 - 78081, n=29) | |
| Dell Inspiron 16 Plus 7630 | |
| HP Envy 16 h0112nr | |
| Dell Inspiron 16 Plus 7620 | |
| AIDA64 / Memory Read | |
| Asus Vivobook Pro 16X K6604JV-MX016W | |
| Lenovo Slim Pro 9i 16IRP8 | |
| Dell Inspiron 16 Plus 7630 | |
| HP Envy 16 h0112nr | |
| MSI Summit E16 Flip A12UDT-031 | |
| Gemiddeld Intel Core i7-13700H (23681 - 79656, n=29) | |
| Dell Inspiron 16 Plus 7620 | |
| AIDA64 / Memory Write | |
| Lenovo Slim Pro 9i 16IRP8 | |
| Asus Vivobook Pro 16X K6604JV-MX016W | |
| Gemiddeld Intel Core i7-13700H (22986 - 99898, n=29) | |
| Dell Inspiron 16 Plus 7630 | |
| HP Envy 16 h0112nr | |
| MSI Summit E16 Flip A12UDT-031 | |
| Dell Inspiron 16 Plus 7620 | |
| AIDA64 / Memory Latency | |
| MSI Summit E16 Flip A12UDT-031 | |
| Lenovo Slim Pro 9i 16IRP8 | |
| Dell Inspiron 16 Plus 7620 | |
| Gemiddeld Intel Core i7-13700H (82.4 - 136.8, n=29) | |
| Dell Inspiron 16 Plus 7630 | |
| HP Envy 16 h0112nr | |
| Asus Vivobook Pro 16X K6604JV-MX016W | |
* ... kleiner is beter
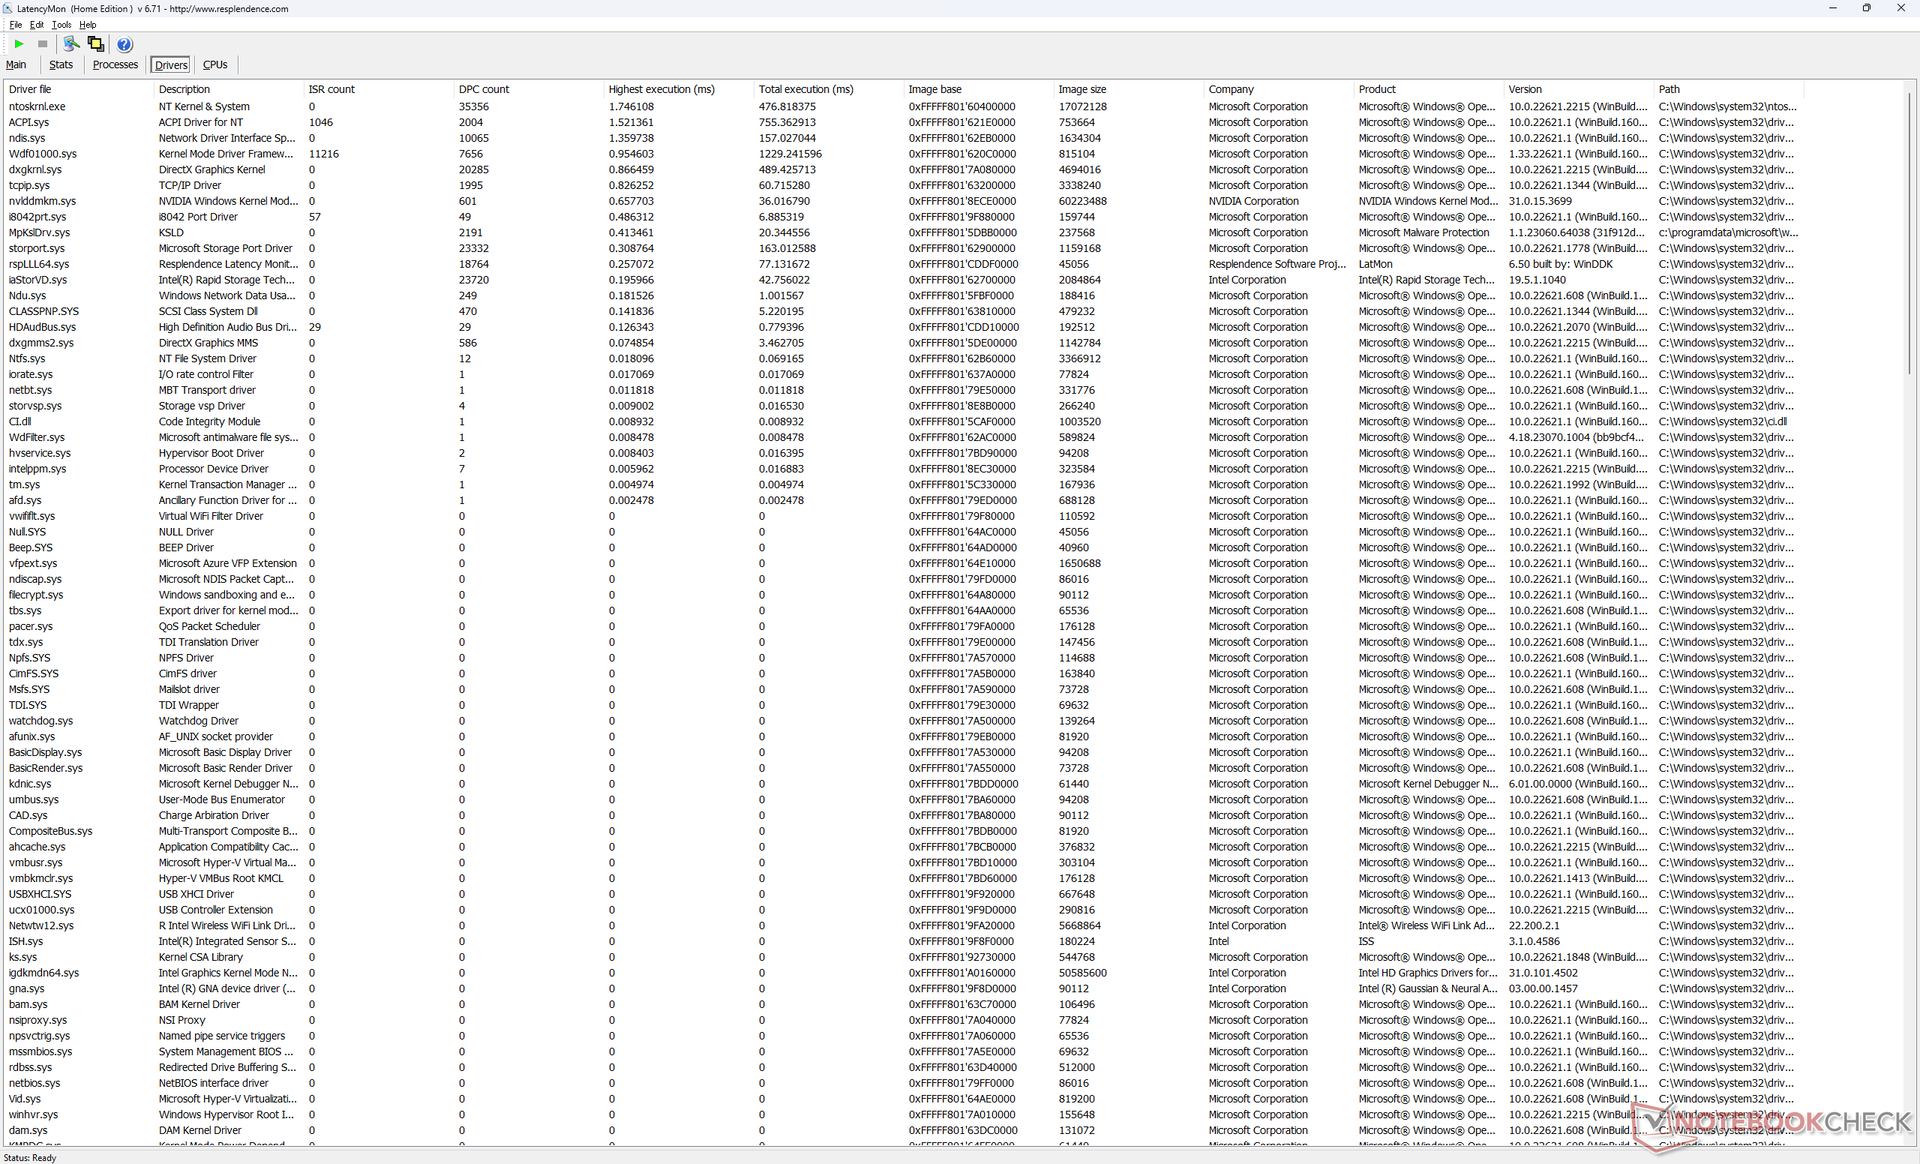
DPC latentie
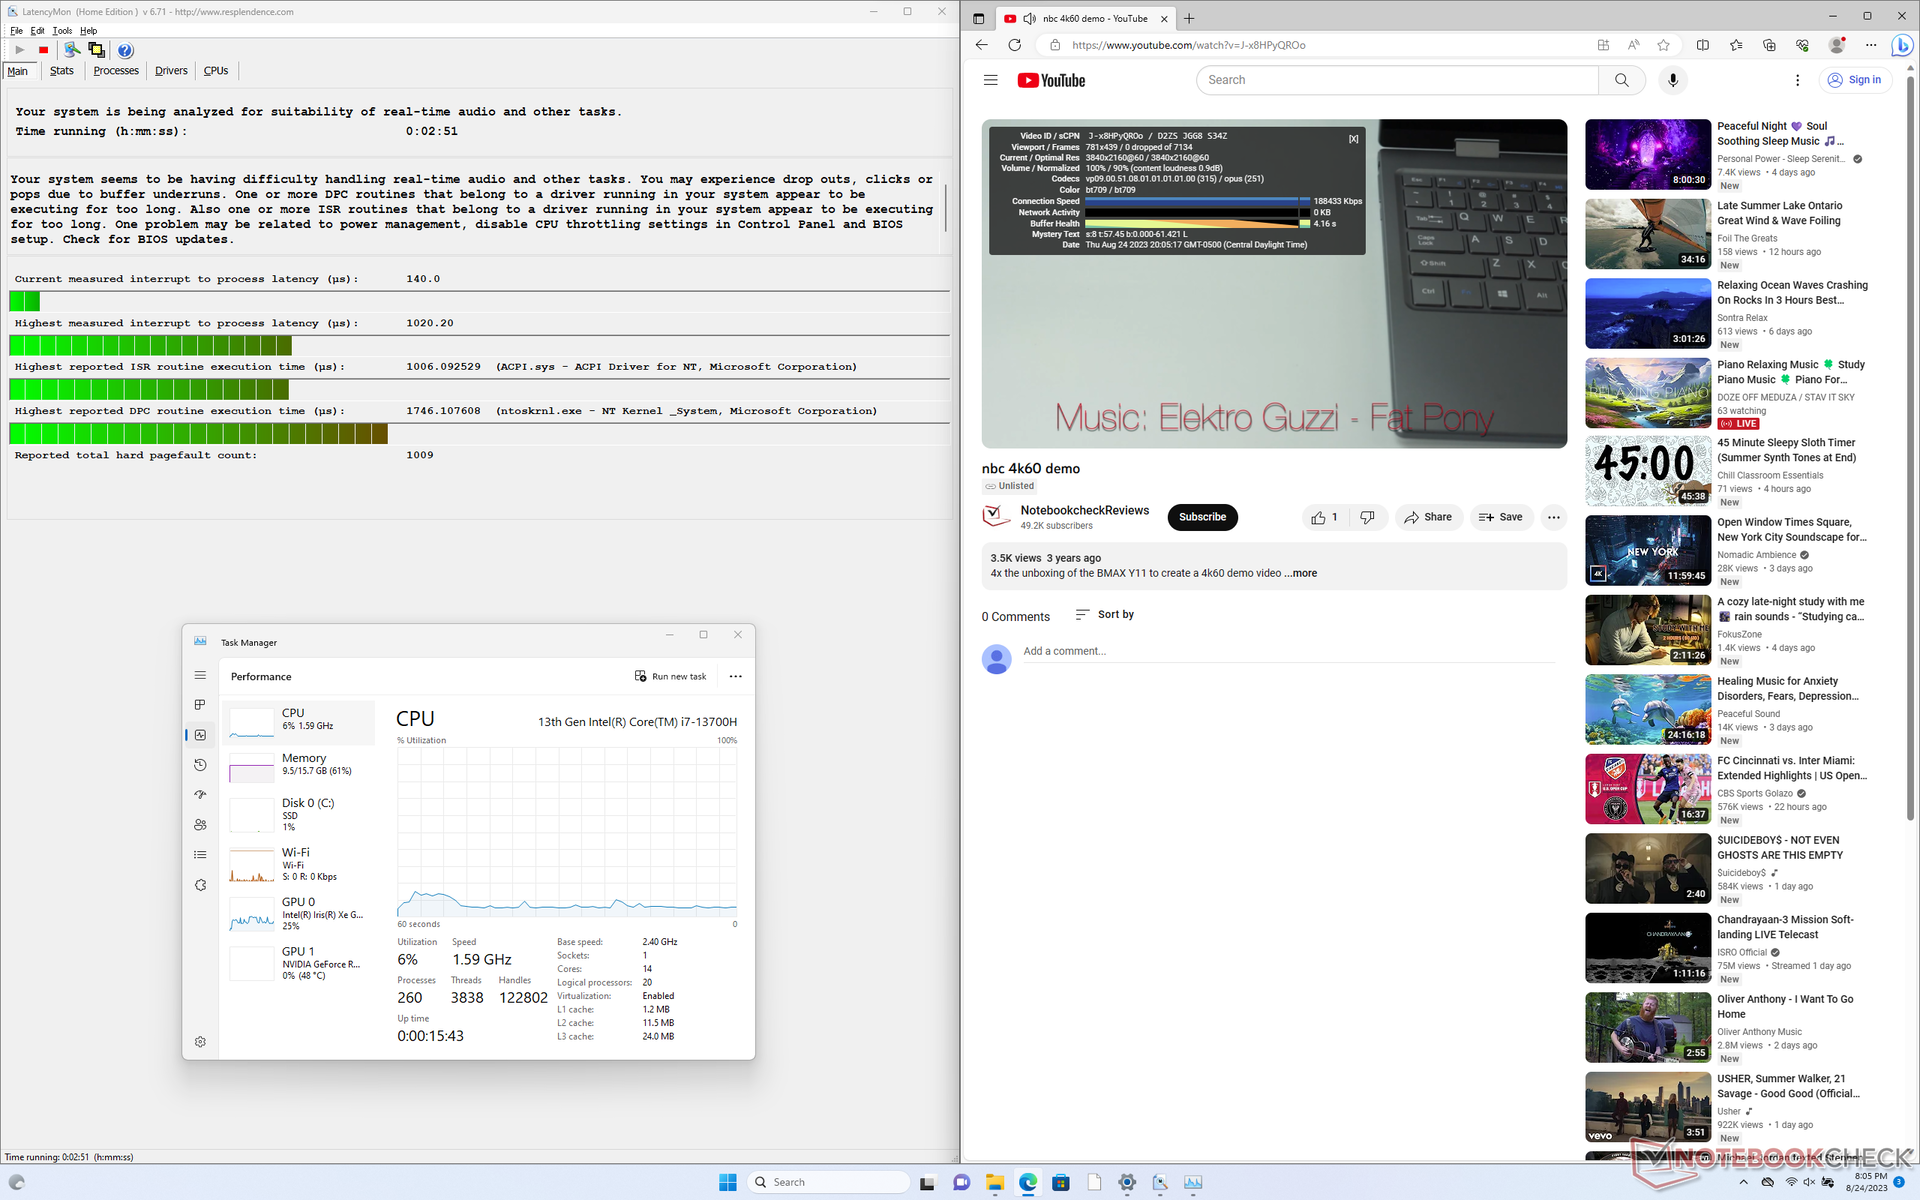
LatencyMon toont slechts kleine DPC-problemen bij het openen van meerdere browsertabbladen van onze startpagina. 4K video afspelen met 60 FPS is verder perfect zonder dropped frames, in tegenstelling tot de recente Alienware m16 R1 waar frame skips hardnekkig waren.
| DPC Latencies / LatencyMon - interrupt to process latency (max), Web, Youtube, Prime95 | |
| Asus Vivobook Pro 16X K6604JV-MX016W | |
| Lenovo Slim Pro 9i 16IRP8 | |
| Dell Inspiron 16 Plus 7630 | |
| Dell Inspiron 16 Plus 7620 | |
| MSI Summit E16 Flip A12UDT-031 | |
| HP Envy 16 h0112nr | |
* ... kleiner is beter
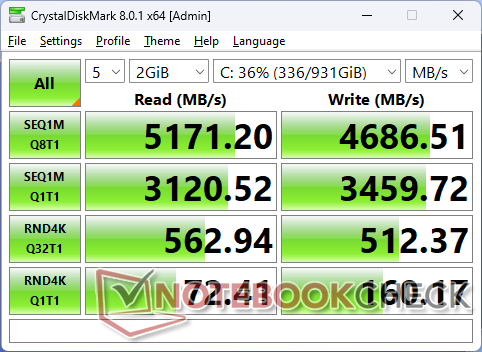
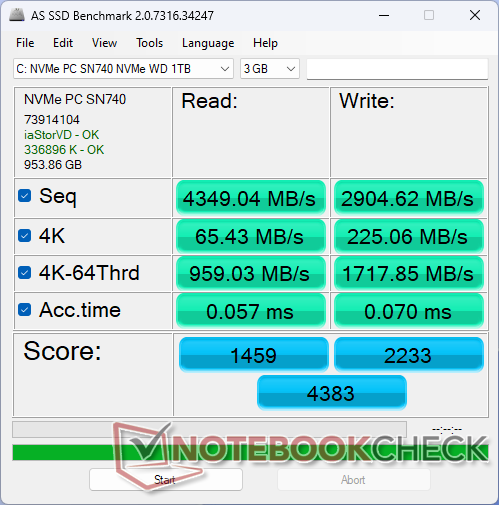
Opslagapparaten - Ondersteunt slechts één SSD
Onze unit wordt geleverd met een midrange Western Digital SN740 PCIe4 x4 NVMe SSD die overdrachtsnelheden tot 5200 MB/s biedt. Dit maximum is echter maar ongeveer een minuut houdbaar, voordat het uiteindelijk afslaat naar de lage 2400 MB/s, zoals blijkt uit onze DiskSpd loop testresultaten hieronder. Deze beperking is geen probleem voor gamingprestaties en de overgrote meerderheid van de gebruiksscenario's.
Het model ondersteunt slechts één interne SSD, terwijl enkele andere 16-inch laptops zoals de Envy 16 tot twee schijven kunnen ondersteunen.

| Drive Performance rating - Percent | |
| MSI Summit E16 Flip A12UDT-031 | |
| Lenovo Slim Pro 9i 16IRP8 | |
| HP Envy 16 h0112nr | |
| Dell Inspiron 16 Plus 7630 | |
| Asus Vivobook Pro 16X K6604JV-MX016W | |
| Dell Inspiron 16 Plus 7620 | |
* ... kleiner is beter
Disk Throttling: DiskSpd Read Loop, Queue Depth 8
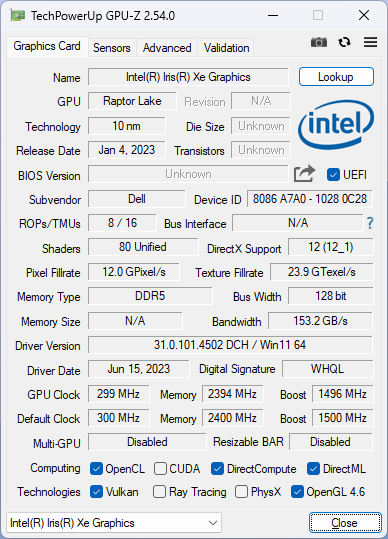
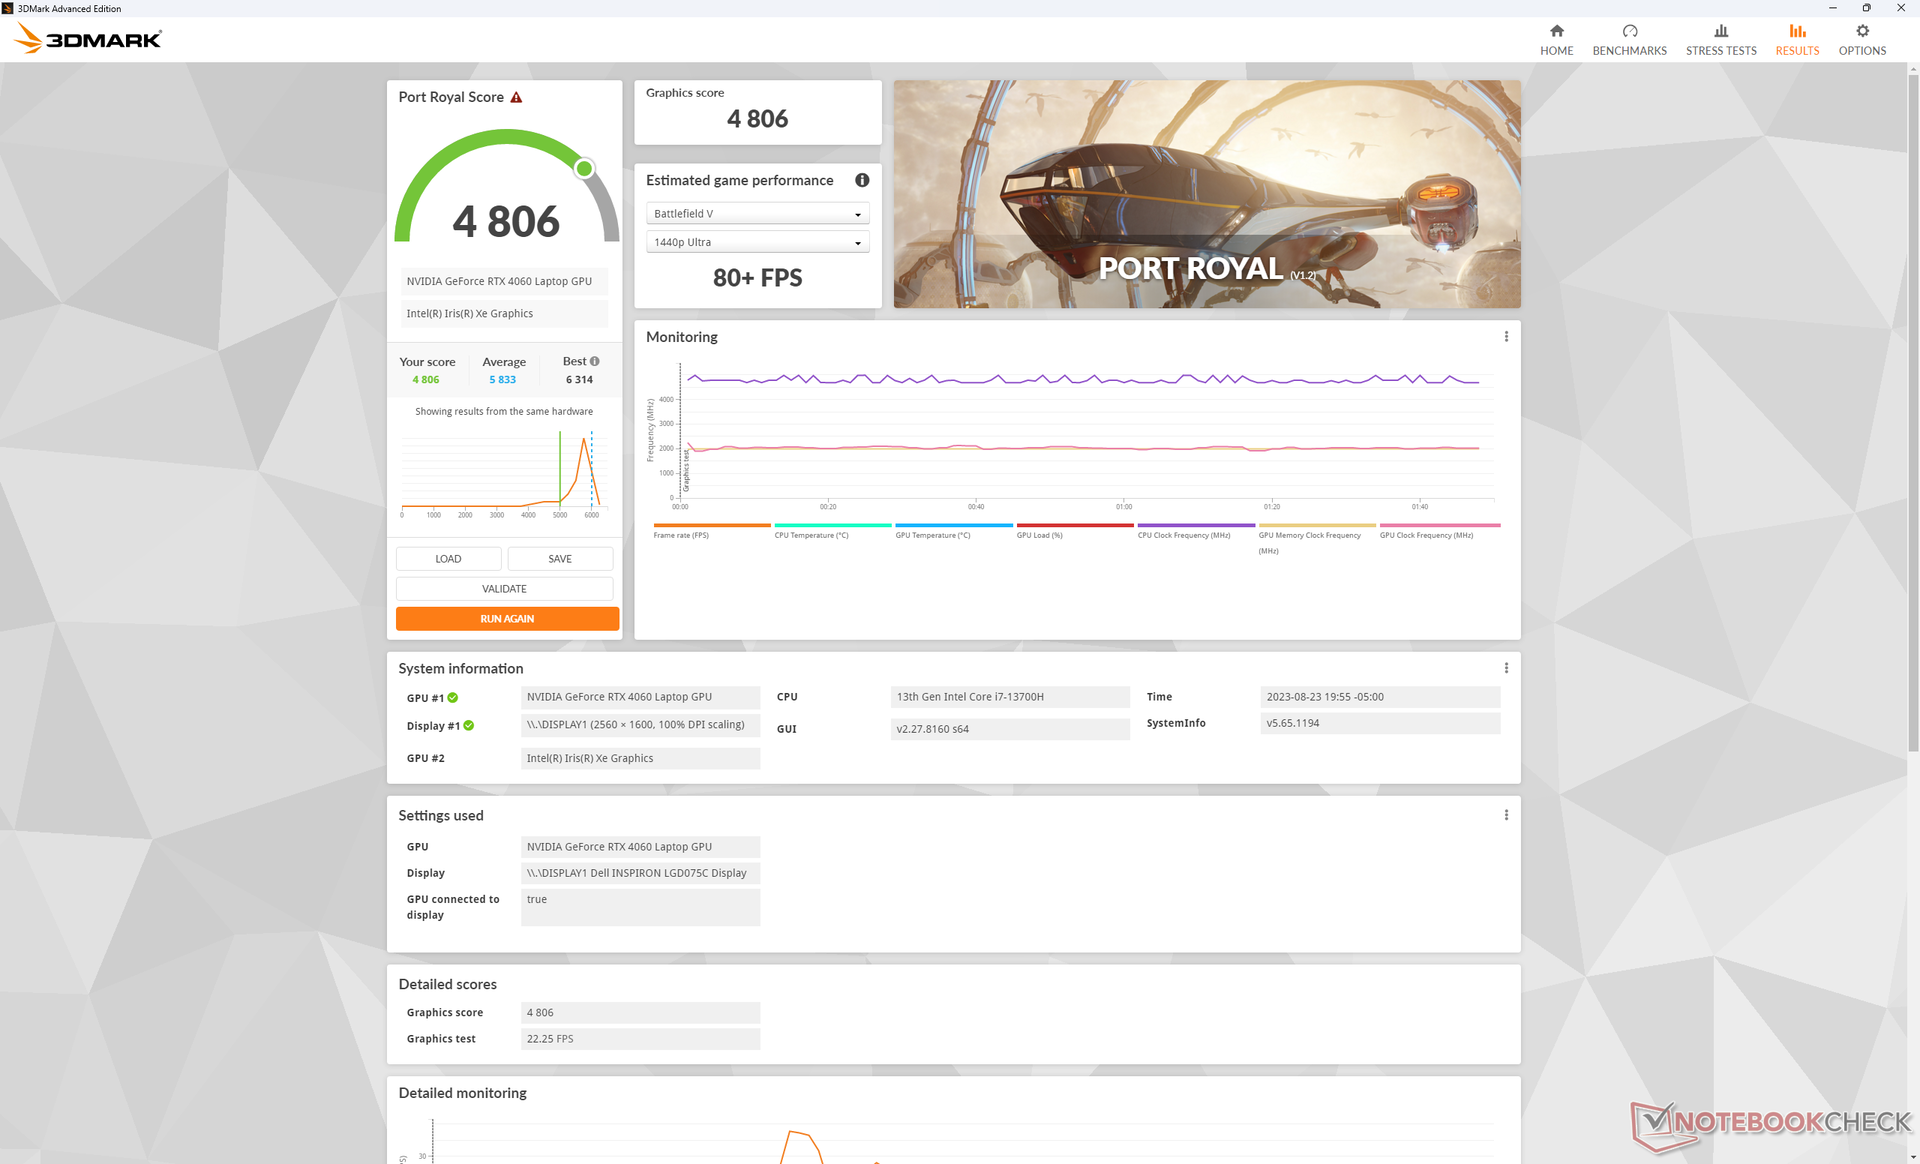
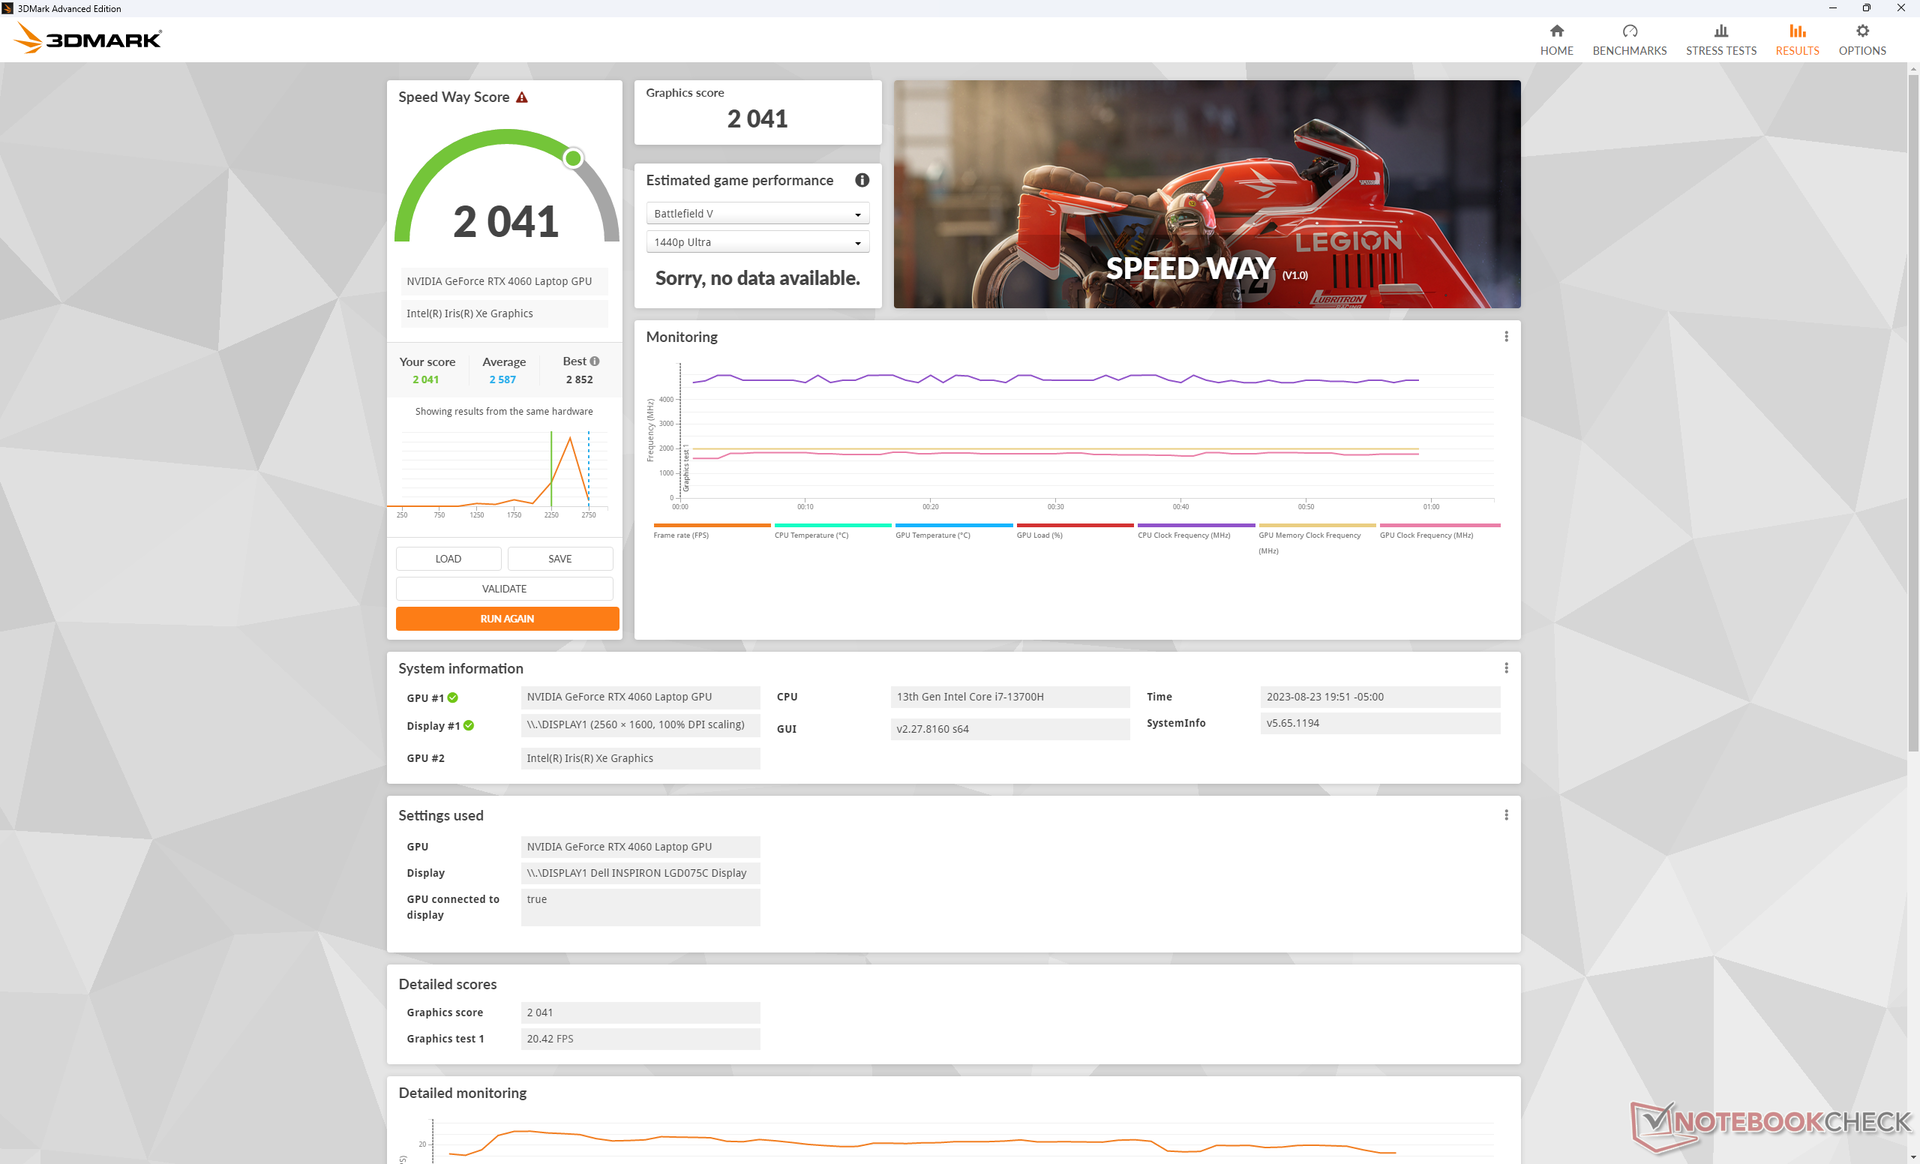
GPU-prestaties
De GeForce RTX 4060 in onze Dell is ongeveer 10 tot 15 procent langzamer dan de gemiddelde laptop in onze database die is uitgerust met dezelfde GPU. De delta is waarschijnlijk te wijten aan de relatief lage 60 W TGP-doelstelling van de Inspiron 16 Plus 7630, aangezien de meeste laptops met de RTX 4060 over het algemeen dedicated gaming laptops zijn die zijn geoptimaliseerd voor hogere GPU-vermogens van 90 W of hoger. De algehele prestaties zijn daarom meer vergelijkbaar met de GeForce RTX 4050 in de Lenovo Slim Pro 9i 16, wat een beetje teleurstellend is om te zien. Desalniettemin is de gen-to-gen prestatie-upgrade ten opzichte van de RTX 3050 Ti in de Inspiron 16 Plus 7620 van vorig jaar met 40 tot 60 procent nog steeds aanzienlijk.
Gebruikers kunnen overwegen om de Inspiron 16 Plus 7630 te configureren met de goedkopere RTX 4050, omdat de RTX 4060 optie ondermaats presteert. Alle GPU-opties zijn gericht op dezelfde TGP van 60 W.
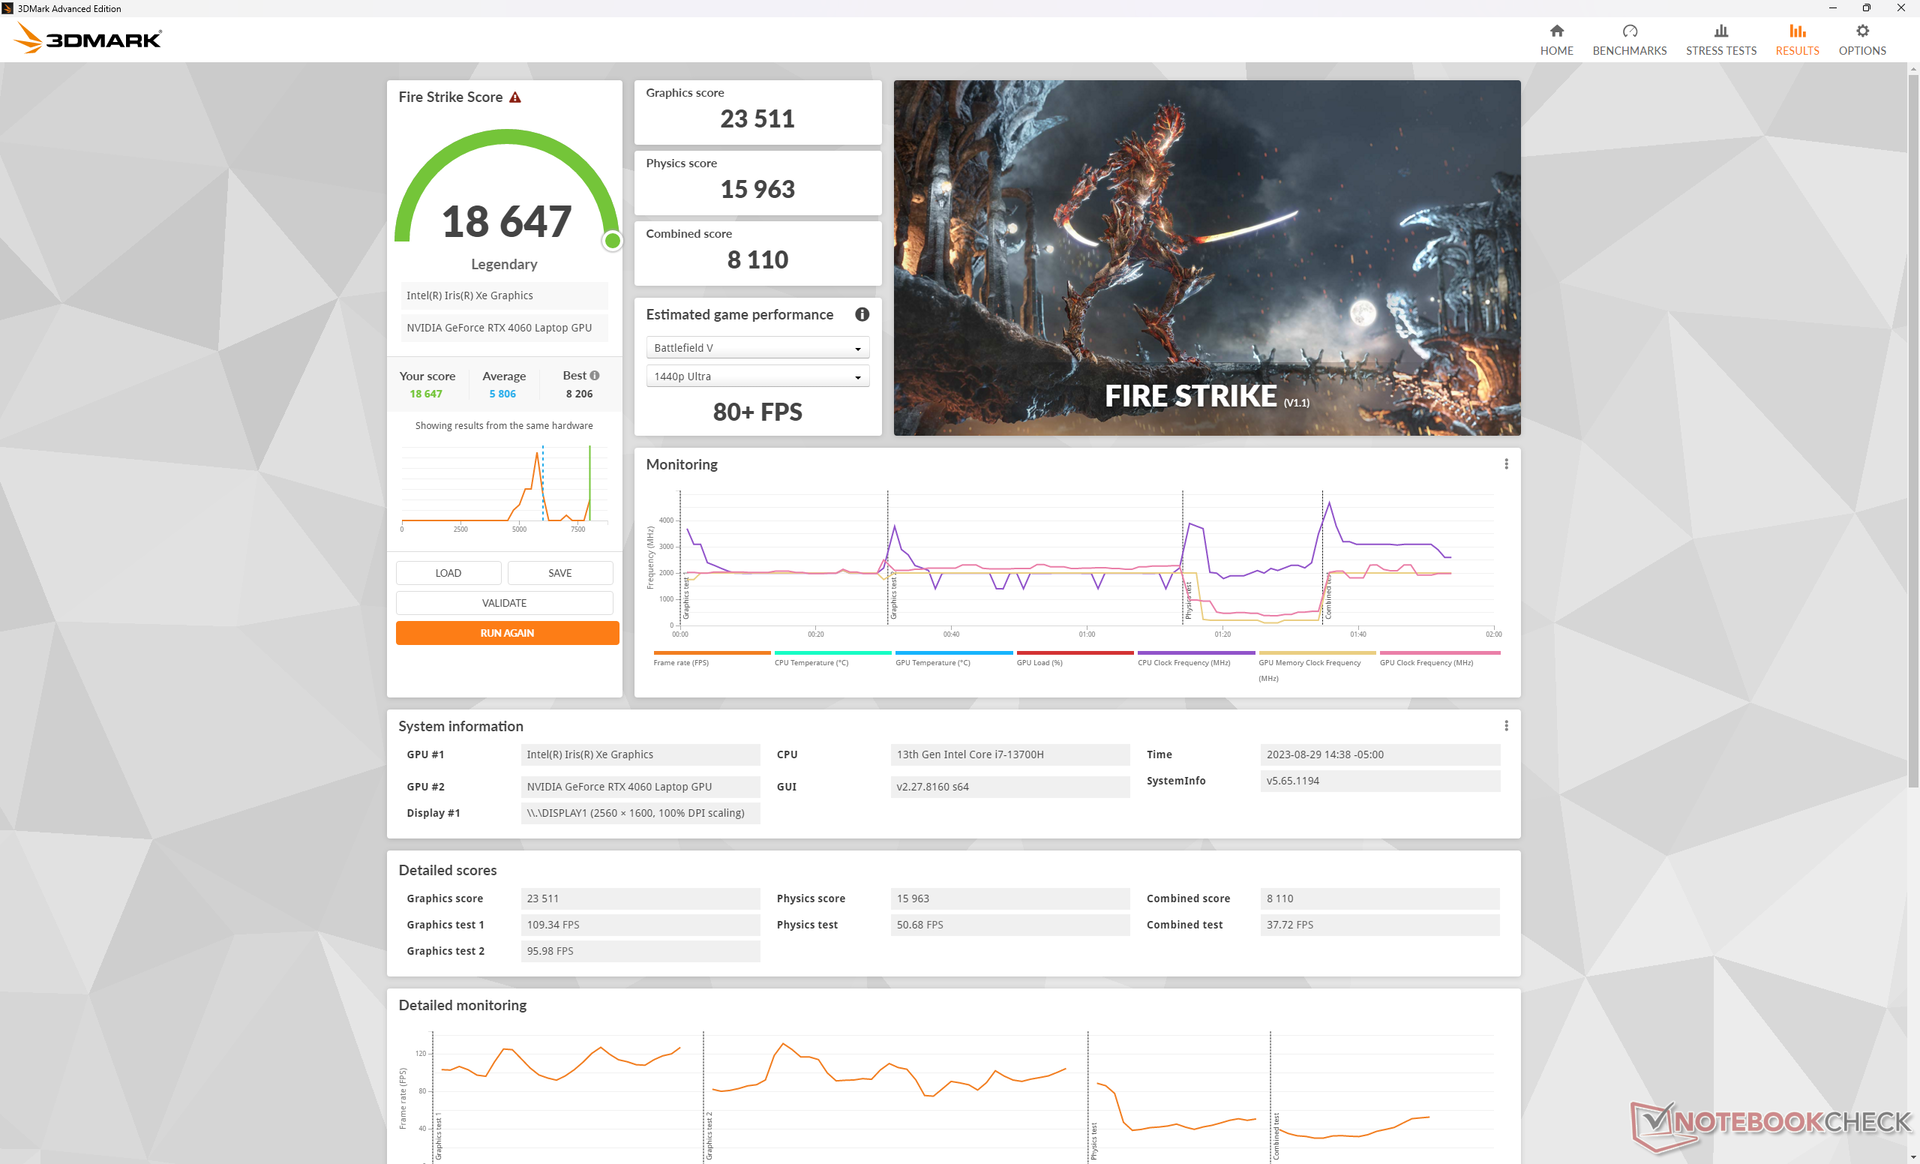
Overschakelen van de Performance-modus naar de Balanced-modus heeft een vrij grote impact op de CPU-prestaties, terwijl de GPU-prestaties bijna gelijk blijven, zoals blijkt uit onze onderstaande Fire Strike resultaten. Zorg ervoor dat je in de modus Prestaties zit als je CPU-intensieve taken uitvoert.
| Vermogen Profiel | Grafische Score | Fysieke Score | Gecombineerde Score |
| Batterijvermogen | 19574 (-9%) | 10010 (-61%) | 4793 (-46%) |
| Gebalanceerde modus | 23511 (-2%) | 15963 (-41%) | 8110 (-21%) |
| Prestatiemodus | 24008 | 26852 | 10239 |

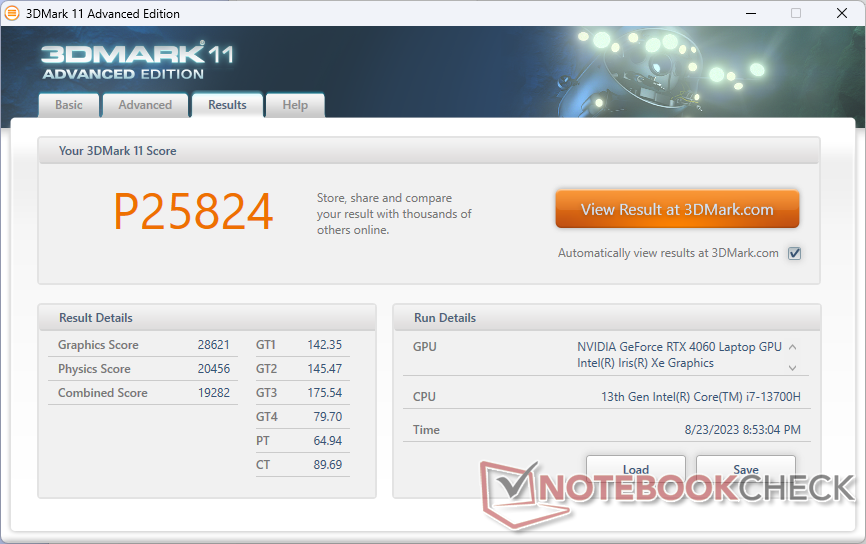
| 3DMark 11 Performance | 25824 punten | |
| 3DMark Fire Strike Score | 19289 punten | |
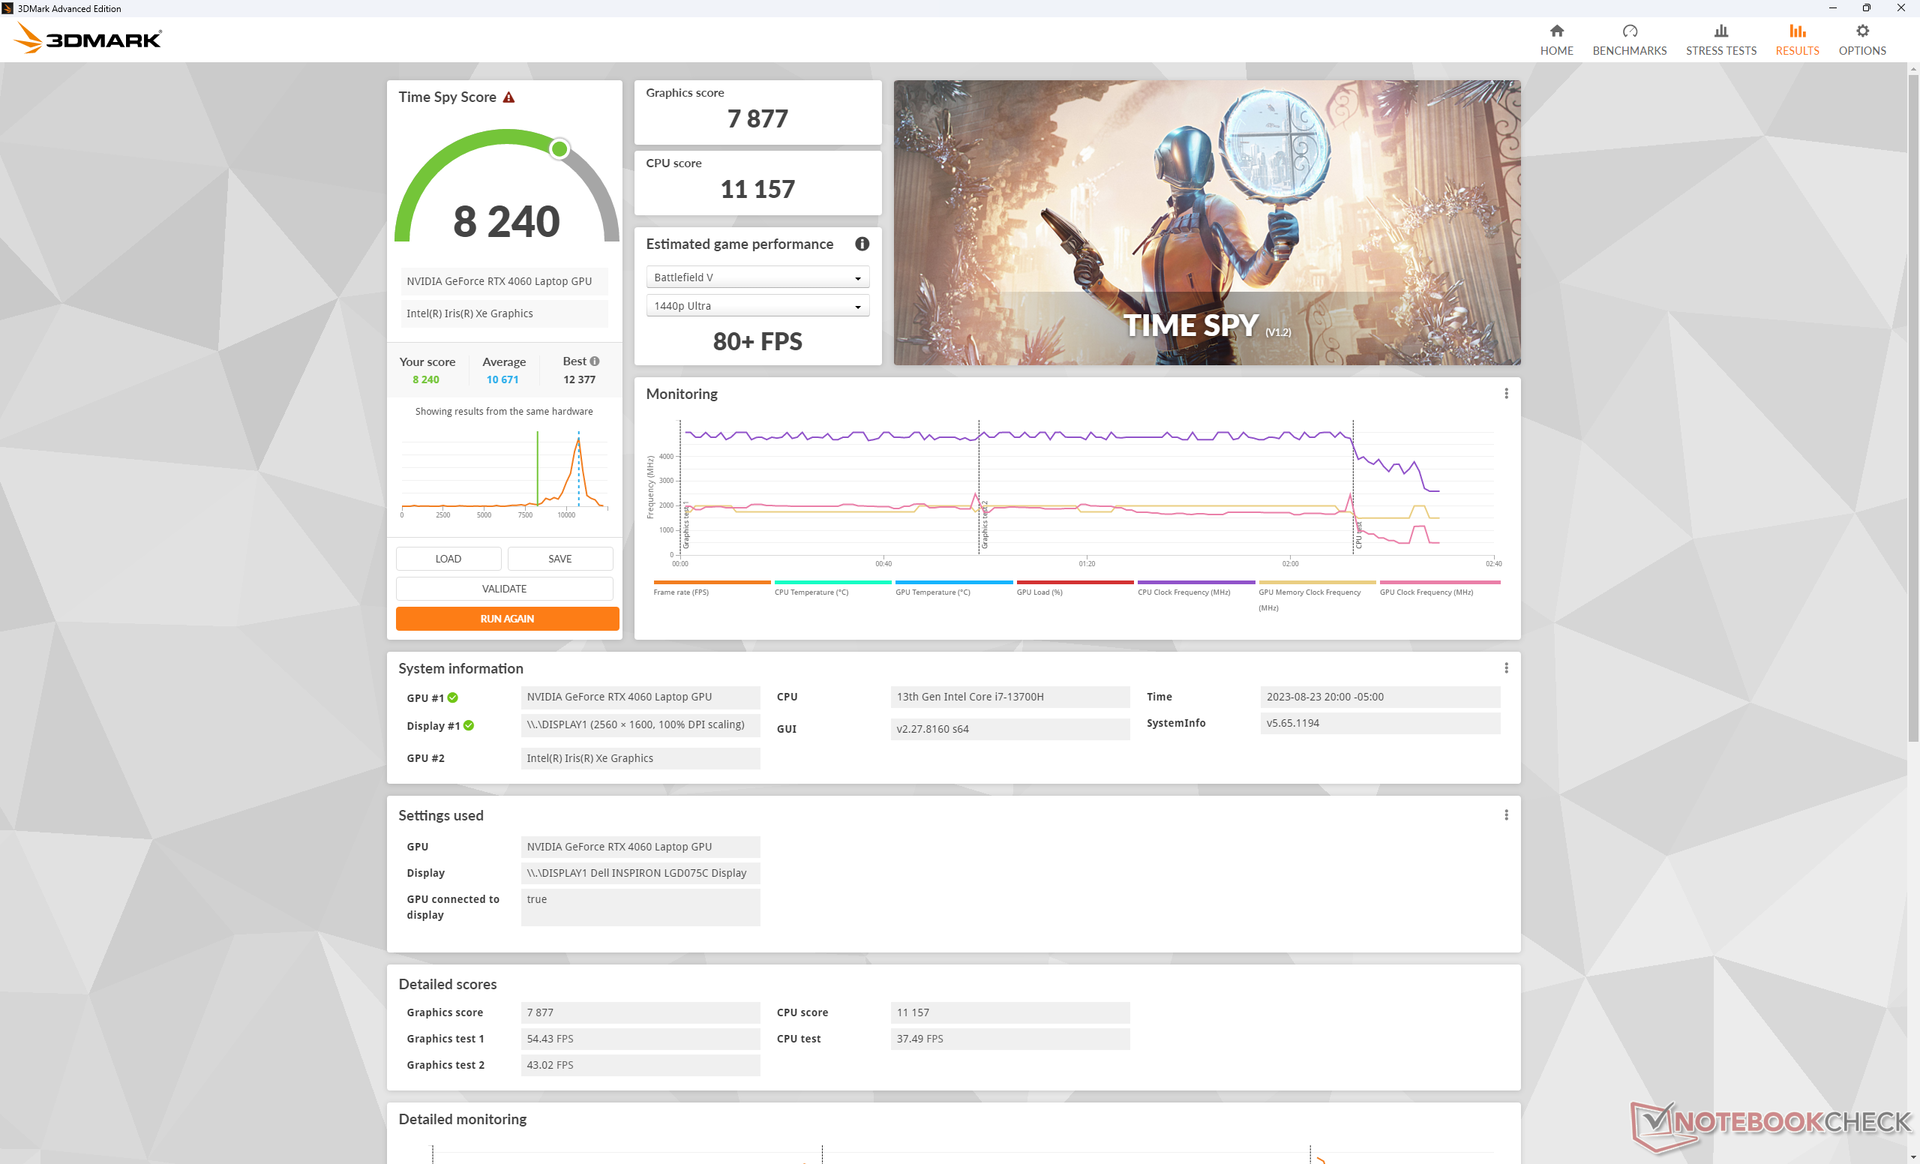
| 3DMark Time Spy Score | 8240 punten | |
Help | ||
* ... kleiner is beter
Spelprestaties
Zoals voorspeld door de 3DMark resultaten hierboven, zijn de algemene gaming prestaties iets onder het gemiddelde voor een laptop met RTX 4060 graphics. Tiny Tina's Wonderlands draait bijvoorbeeld op 48 FPS bij de maximale 1440p instellingen, vergeleken met 57 FPS op de meeste andere RTX 4060 laptops. G-Sync wordt helaas niet ondersteund op de Inspiron 7630 serie, wat het scheuren van frames zou hebben gladgestreken.
Witcher 3 FPS Chart
| lage | gem. | hoge | ultra | QHD | |
|---|---|---|---|---|---|
| The Witcher 3 (2015) | 409.3 | 275.3 | 169.5 | 90.9 | 68 |
| Dota 2 Reborn (2015) | 184.7 | 166.6 | 157.9 | 146.1 | |
| Final Fantasy XV Benchmark (2018) | 172.2 | 122.2 | 88.9 | 64.4 | |
| X-Plane 11.11 (2018) | 153.5 | 135.7 | 109.7 | ||
| Far Cry 5 (2018) | 133 | 120 | 115 | 103 | 83 |
| Strange Brigade (2018) | 378 | 234 | 185.9 | 161 | 110.9 |
| Cyberpunk 2077 1.6 (2022) | 108.1 | 84.2 | 72.9 | 65.7 | 40.8 |
| Tiny Tina's Wonderlands (2022) | 169.5 | 141.5 | 92.1 | 71.4 | 48 |
| F1 22 (2022) | 205 | 201 | 148.4 | 53.8 | 34.1 |
| Returnal (2023) | 71 | 68 | 63 | 57 | 39 |
Uitstoot
Systeemgeluid - stiller en luider dan voorheen
De interne ventilatoren kunnen stil zijn wanneer ze stationair draaien op het bureaublad, maar ze schommelen vaker rond de 26 tot 28 dB(A) wanneer gewone belastingen zoals webbrowsers of videostreams worden uitgevoerd. Wat nog indrukwekkender is, is dat ze een hele tijd relatief stil kunnen blijven, zelfs wanneer er hogere belastingen worden geïntroduceerd, terwijl de ventilatoren in de Inspiron 16 Plus 7620 sneller en sneller zouden pulseren. Bij het uitvoeren van 3DMark 06 bijvoorbeeld, liep het ventilatorgeluid pas op tot 35 dB(A) tegen het einde van de eerste benchmarkscène van 90 seconden.
Het ventilatorgeluid neemt aanzienlijk toe bij het uitvoeren van games. Terwijl de Inspiron 16 Plus 7630 over het algemeen stiller is dan het model van vorig jaar tijdens het uitvoeren van niet-veeleisende belastingen, is het tegenovergestelde waar tijdens het gamen. Het geluid van de ventilator bereikt een piek van bijna 53 dB(A) wanneer Witcher 3 wordt uitgevoerd, vergeleken met iets meer dan 49 dB(A) op de Inspiron 16 Plus 7620. Desalniettemin is de lage 50 dB(A) vergelijkbaar met concurrenten zoals deSlim Pro 9i 16 of Envy 16.
Het is interessant dat het wijzigen van het energieprofiel tussen de Balanced en Performance modi geen invloed heeft op het geluidsplafond van de ventilator tijdens het gamen, omdat deze nog steeds maximaal 52,5 dB(A) bedraagt op beide instellingen.
Geluidsniveau
| Onbelast |
| 23.2 / 23.2 / 23.2 dB (A) |
| Belasting |
| 35.1 / 52.5 dB (A) |
 | ||
30 dB stil 40 dB(A) hoorbaar 50 dB(A) luid |
||
min: | ||
| Dell Inspiron 16 Plus 7630 GeForce RTX 4060 Laptop GPU, i7-13700H, WD PC SN740 SDDPTQD-1T00 | Dell Inspiron 16 Plus 7620 GeForce RTX 3050 Ti Laptop GPU, i7-12700H, Kioxia BG5 KBG50ZNS512G | Lenovo Slim Pro 9i 16IRP8 GeForce RTX 4050 Laptop GPU, i9-13905H, Samsung PM9A1 MZVL21T0HCLR | Asus Vivobook Pro 16X K6604JV-MX016W GeForce RTX 4060 Laptop GPU, i9-13980HX, Solidigm P41 Plus SSDPFKNU010TZ | HP Envy 16 h0112nr GeForce RTX 3060 Laptop GPU, i7-12700H, Micron 3400 1TB MTFDKBA1T0TFH | MSI Summit E16 Flip A12UDT-031 GeForce RTX 3050 Ti Laptop GPU, i7-1280P, Samsung PM9A1 MZVL22T0HBLB | |
|---|---|---|---|---|---|---|
| Noise | -11% | 1% | -21% | -6% | -14% | |
| uit / omgeving * (dB) | 23.2 | 23.3 -0% | 22.7 2% | 25.2 -9% | 22.8 2% | 25 -8% |
| Idle Minimum * (dB) | 23.2 | 25.7 -11% | 22.7 2% | 26.6 -15% | 22.9 1% | 25 -8% |
| Idle Average * (dB) | 23.2 | 26.1 -13% | 22.7 2% | 26.6 -15% | 22.9 1% | 25 -8% |
| Idle Maximum * (dB) | 23.2 | 30.6 -32% | 27.5 -19% | 29.2 -26% | 30.5 -31% | 28.9 -25% |
| Load Average * (dB) | 35.1 | 46.2 -32% | 28.9 18% | 53.4 -52% | 41.4 -18% | 49.3 -40% |
| Witcher 3 ultra * (dB) | 52.5 | 49.2 6% | 52.6 -0% | 51.1 3% | ||
| Load Maximum * (dB) | 52.5 | 49.4 6% | 52.5 -0% | 56.9 -8% | 51.4 2% | 48.2 8% |
* ... kleiner is beter
Temperatuur
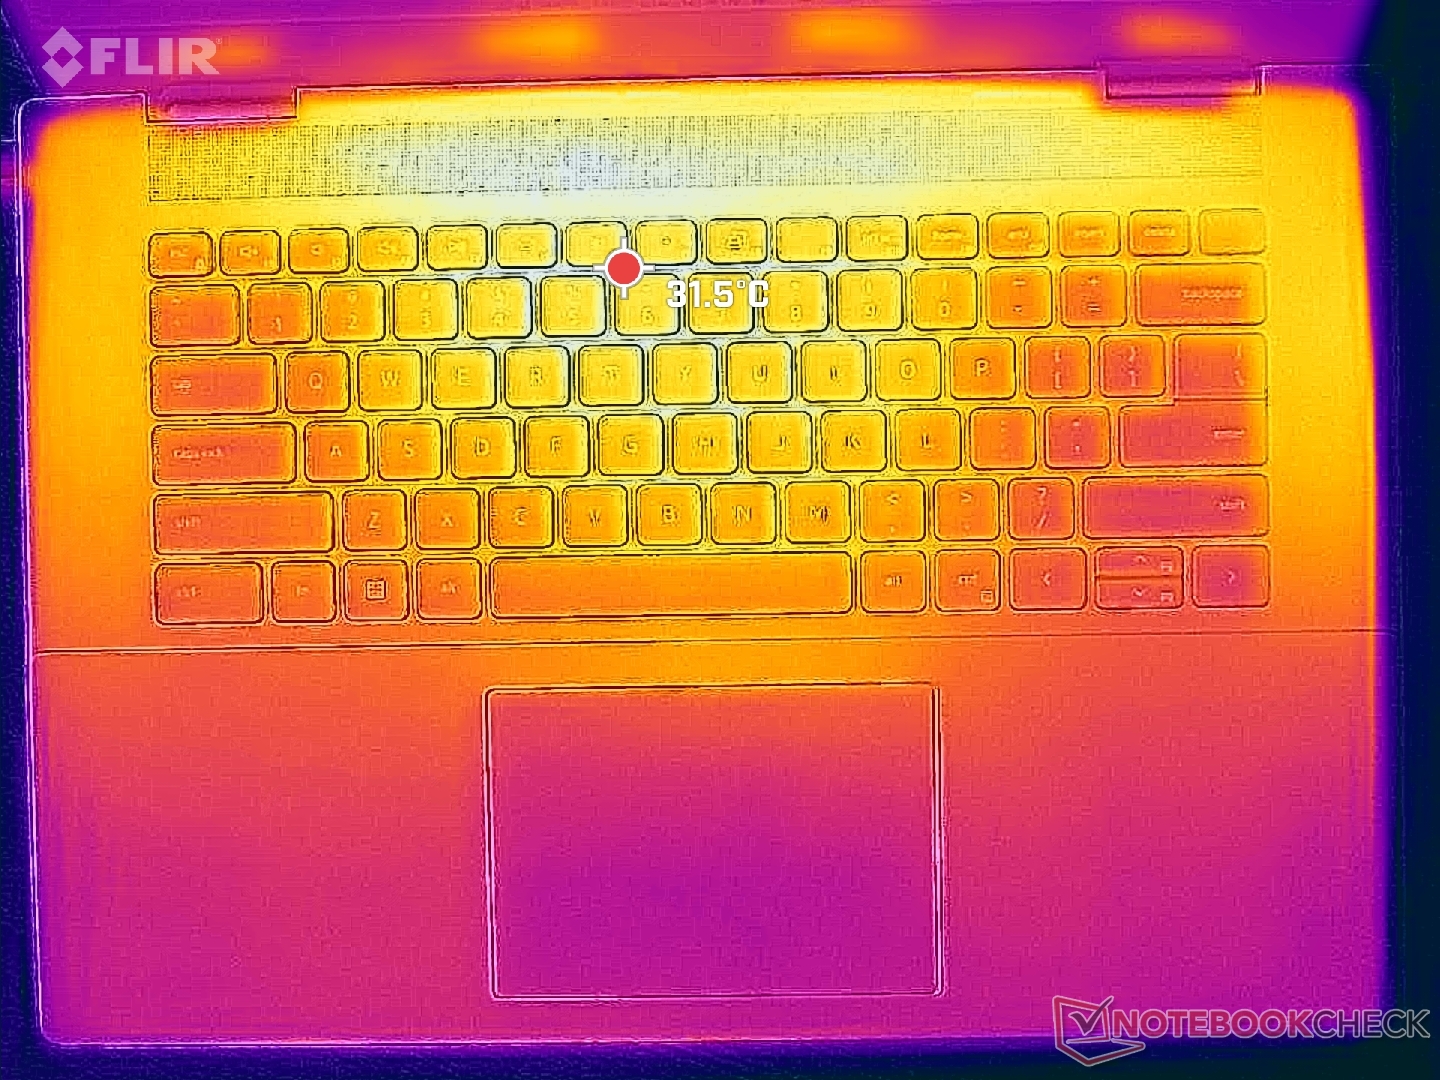
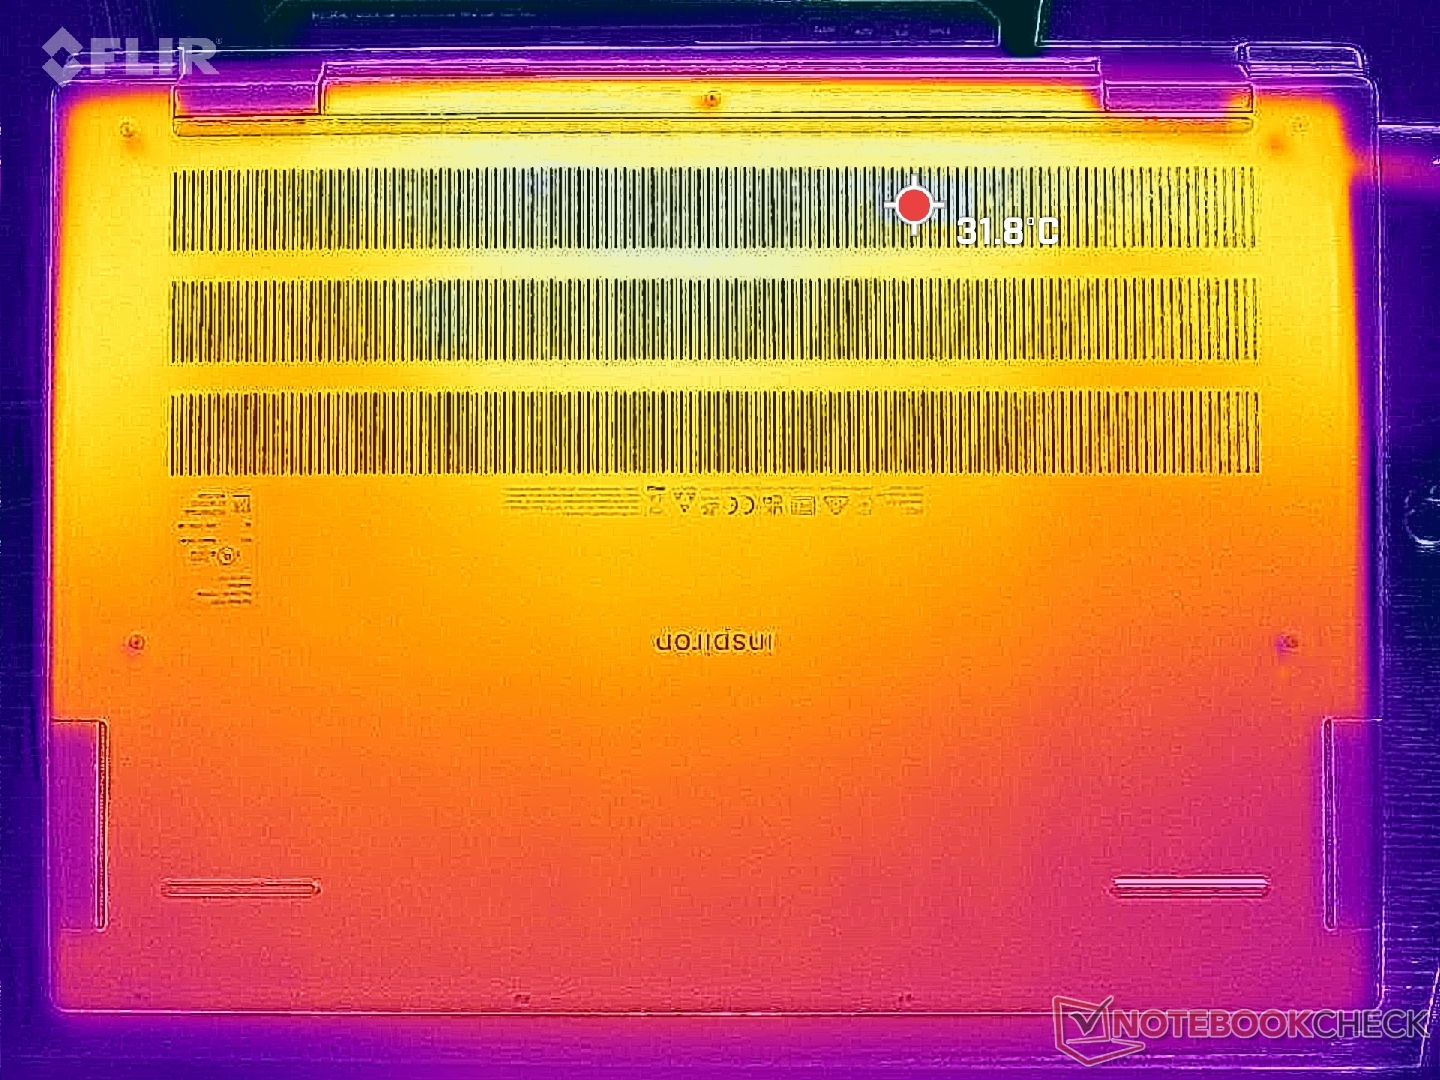
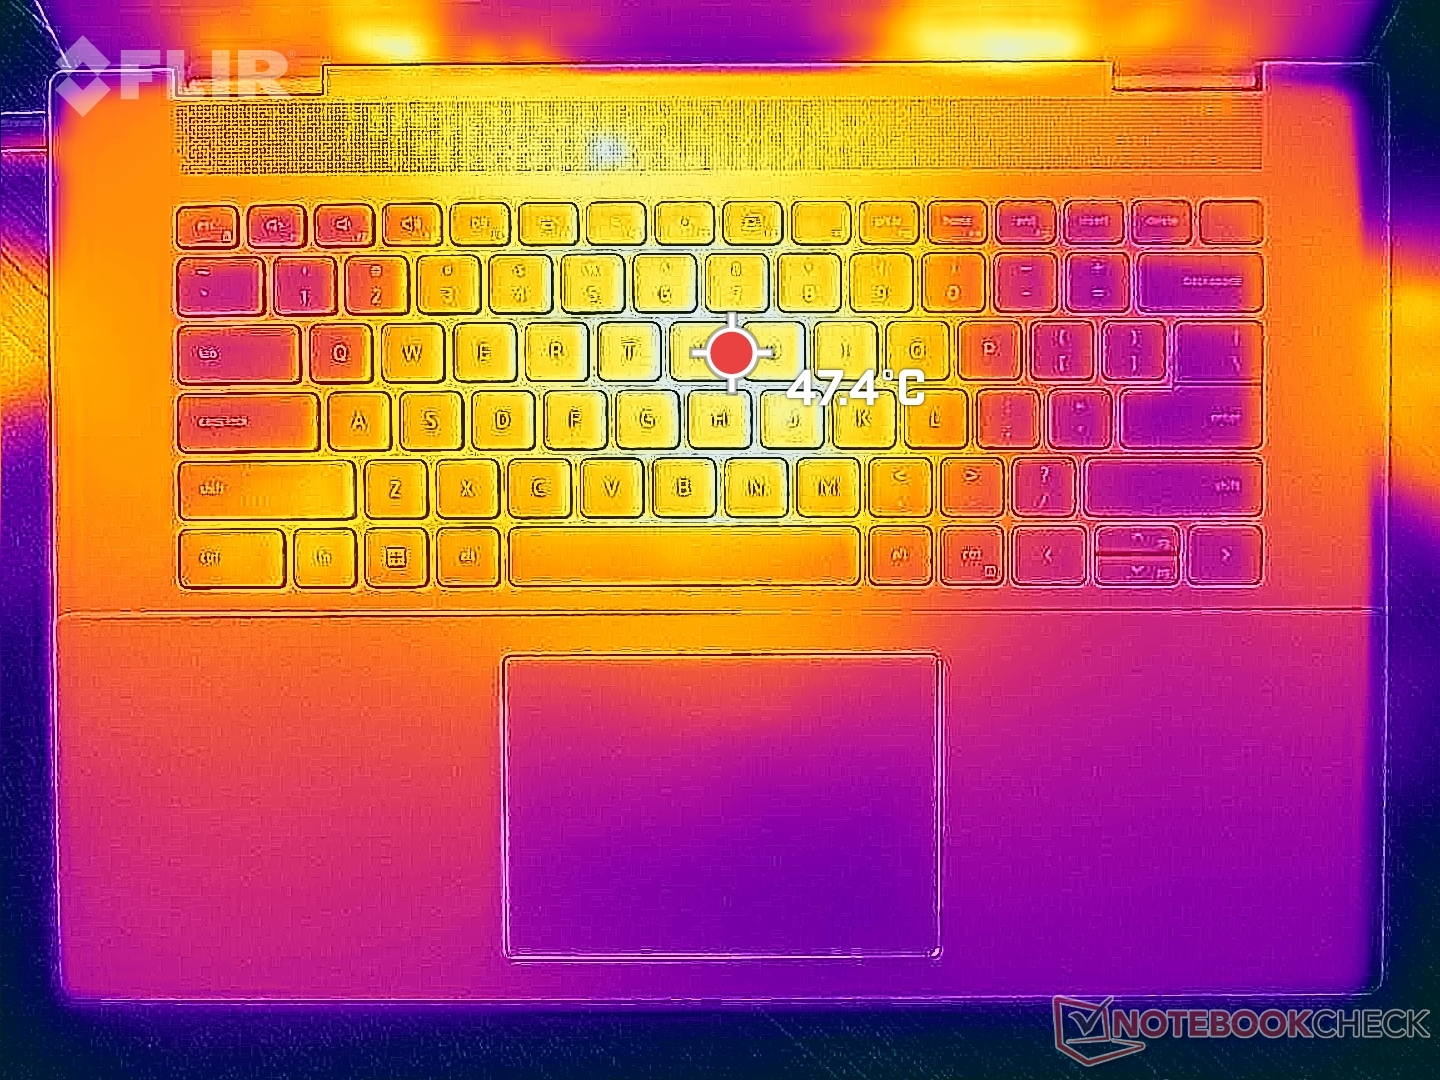
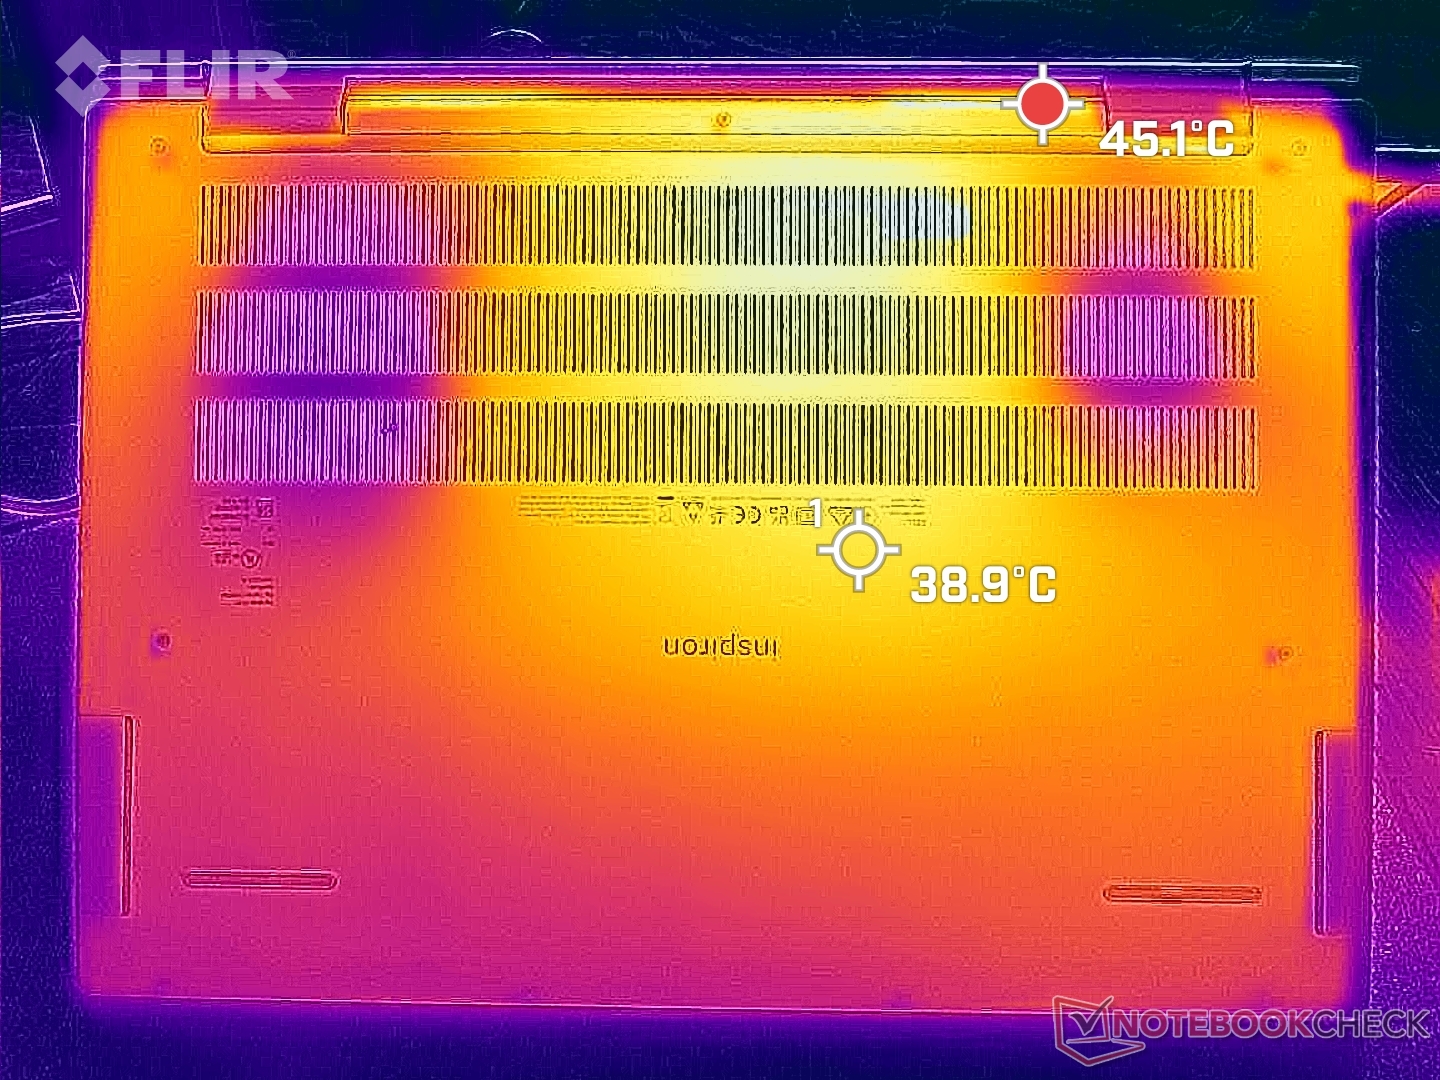
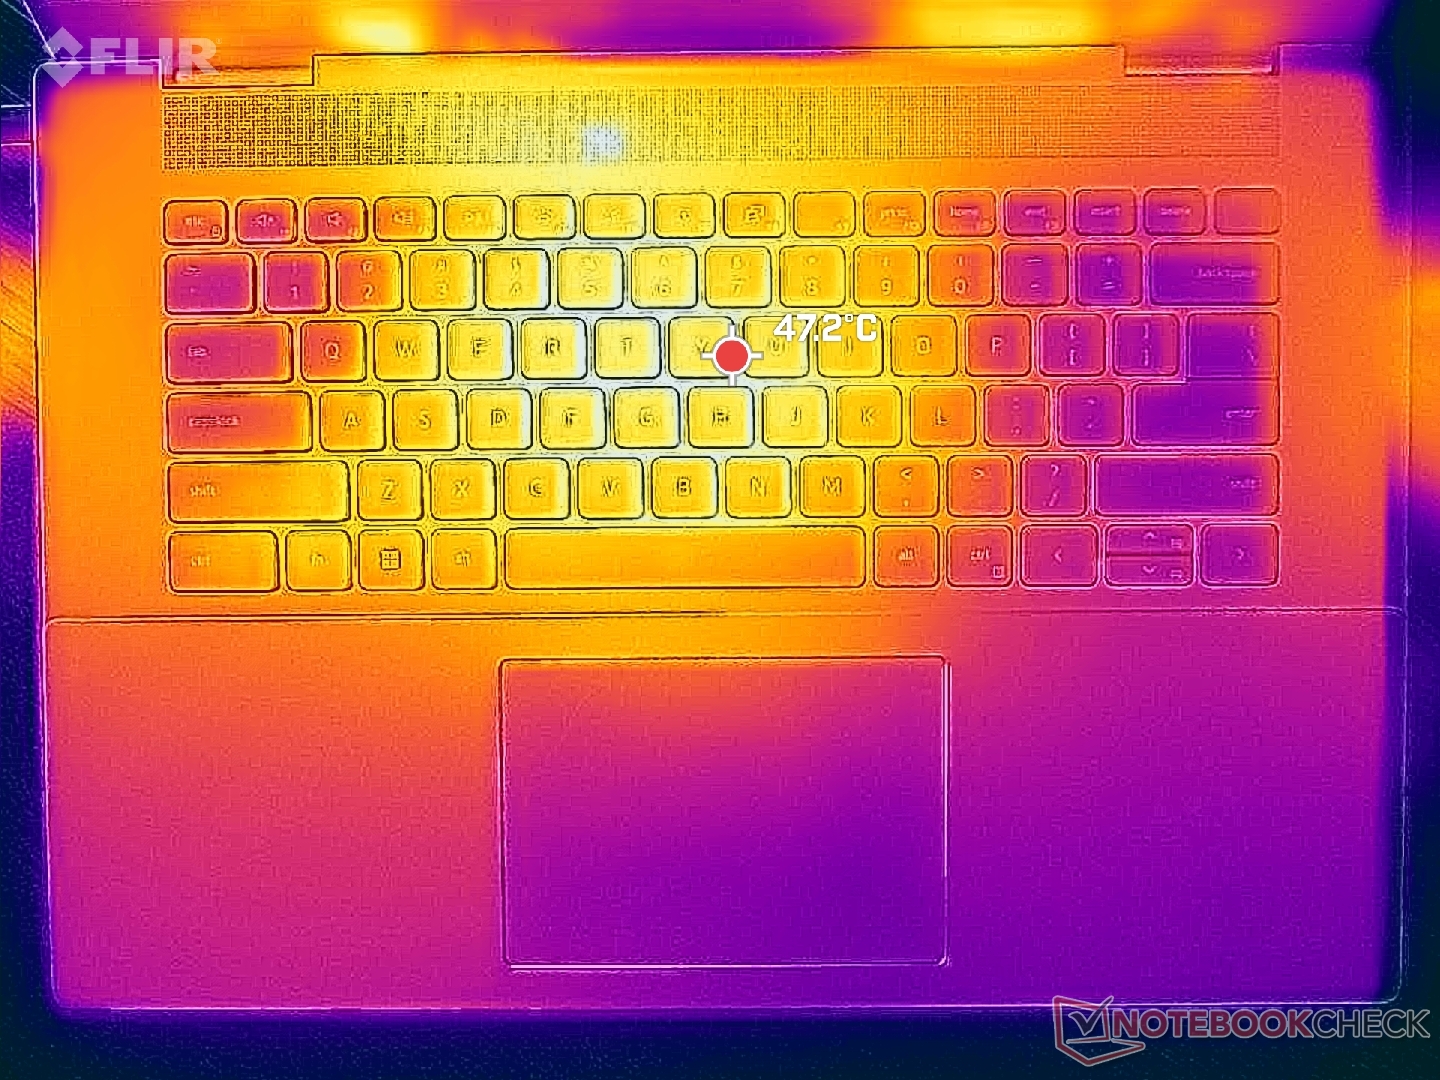
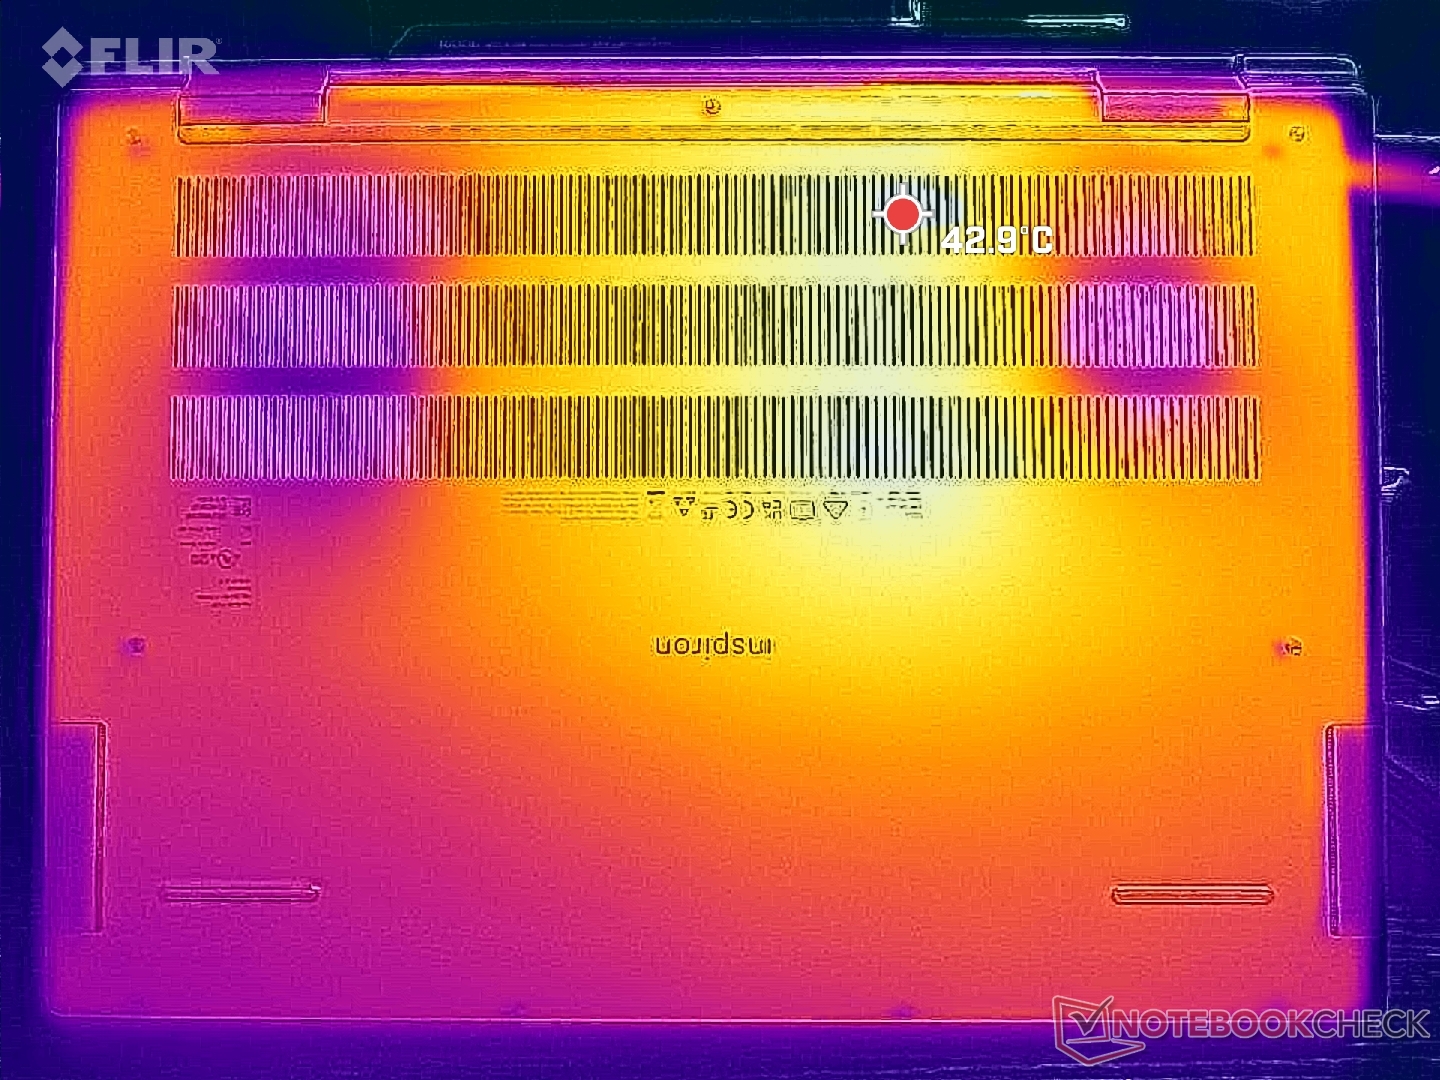
De oppervlaktetemperaturen bij veeleisende belastingen zoals games zijn warmer dan verwacht. Hete plekken aan de boven- en onderkant kunnen oplopen tot respectievelijk 48 C en 43 C in het midden van het toetsenbord. De handpalmsteunen kunnen ook erg warm worden met een temperatuur tot 37 C vergeleken met slechts 31 C op deAsus Vivobook Pro 16X of HP Envy 16. Dit is zeker meer een handwarmer in vergelijking met andere laptops.
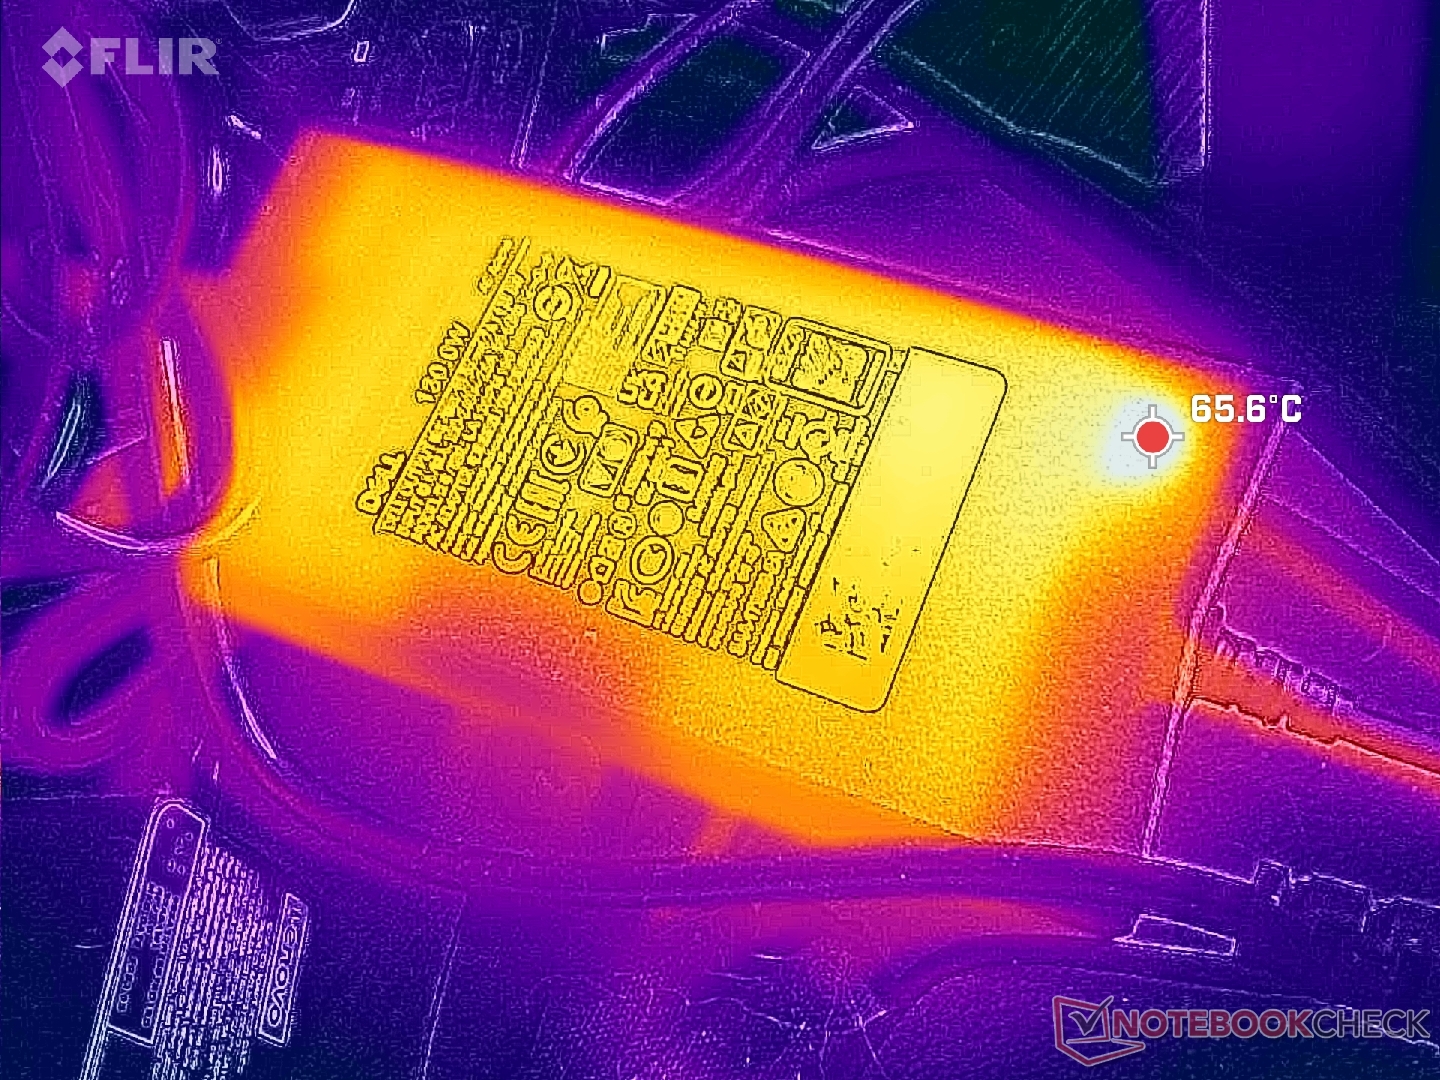
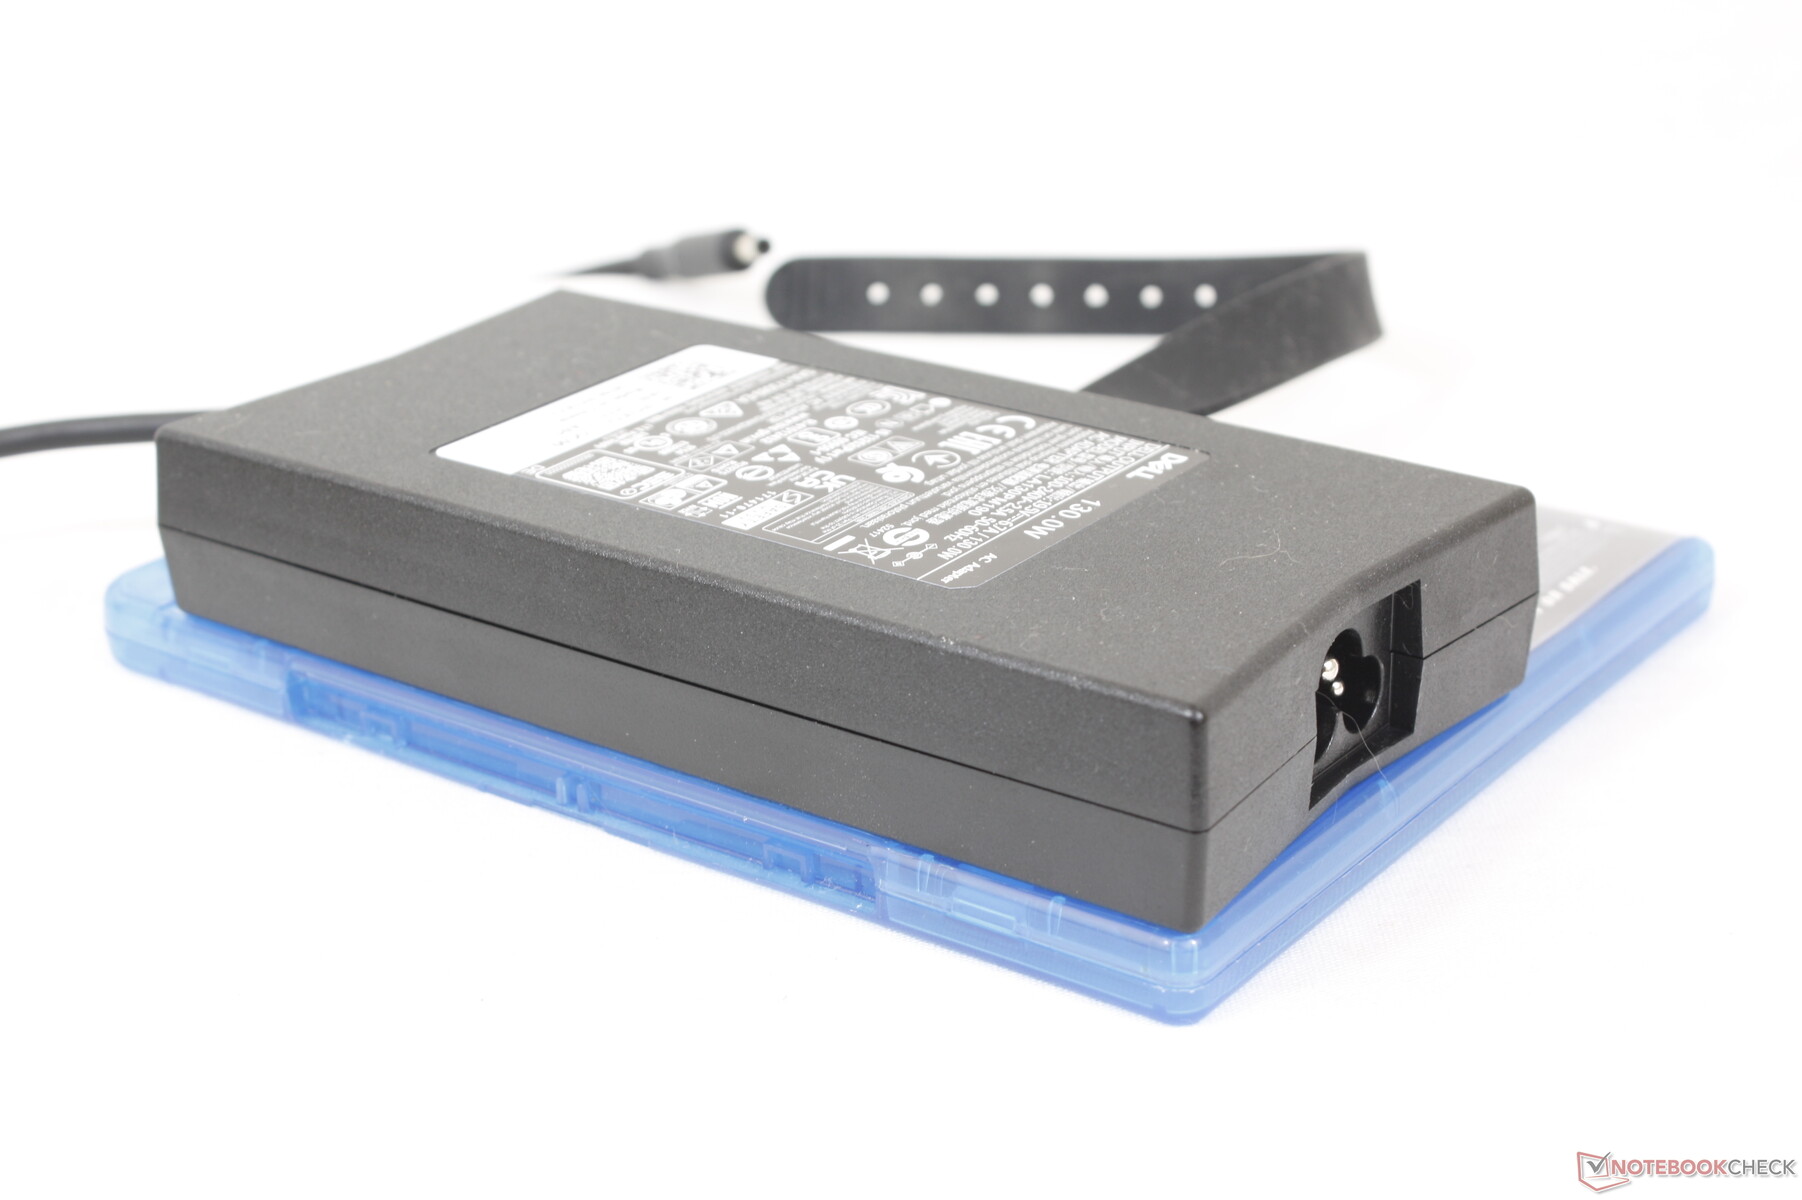
Daarnaast is de AC-adapter merkbaar warmer dan gemiddeld met meer dan 65 C. Je zult voor de zekerheid voldoende ademruimte willen creëren voor de AC-adapter.
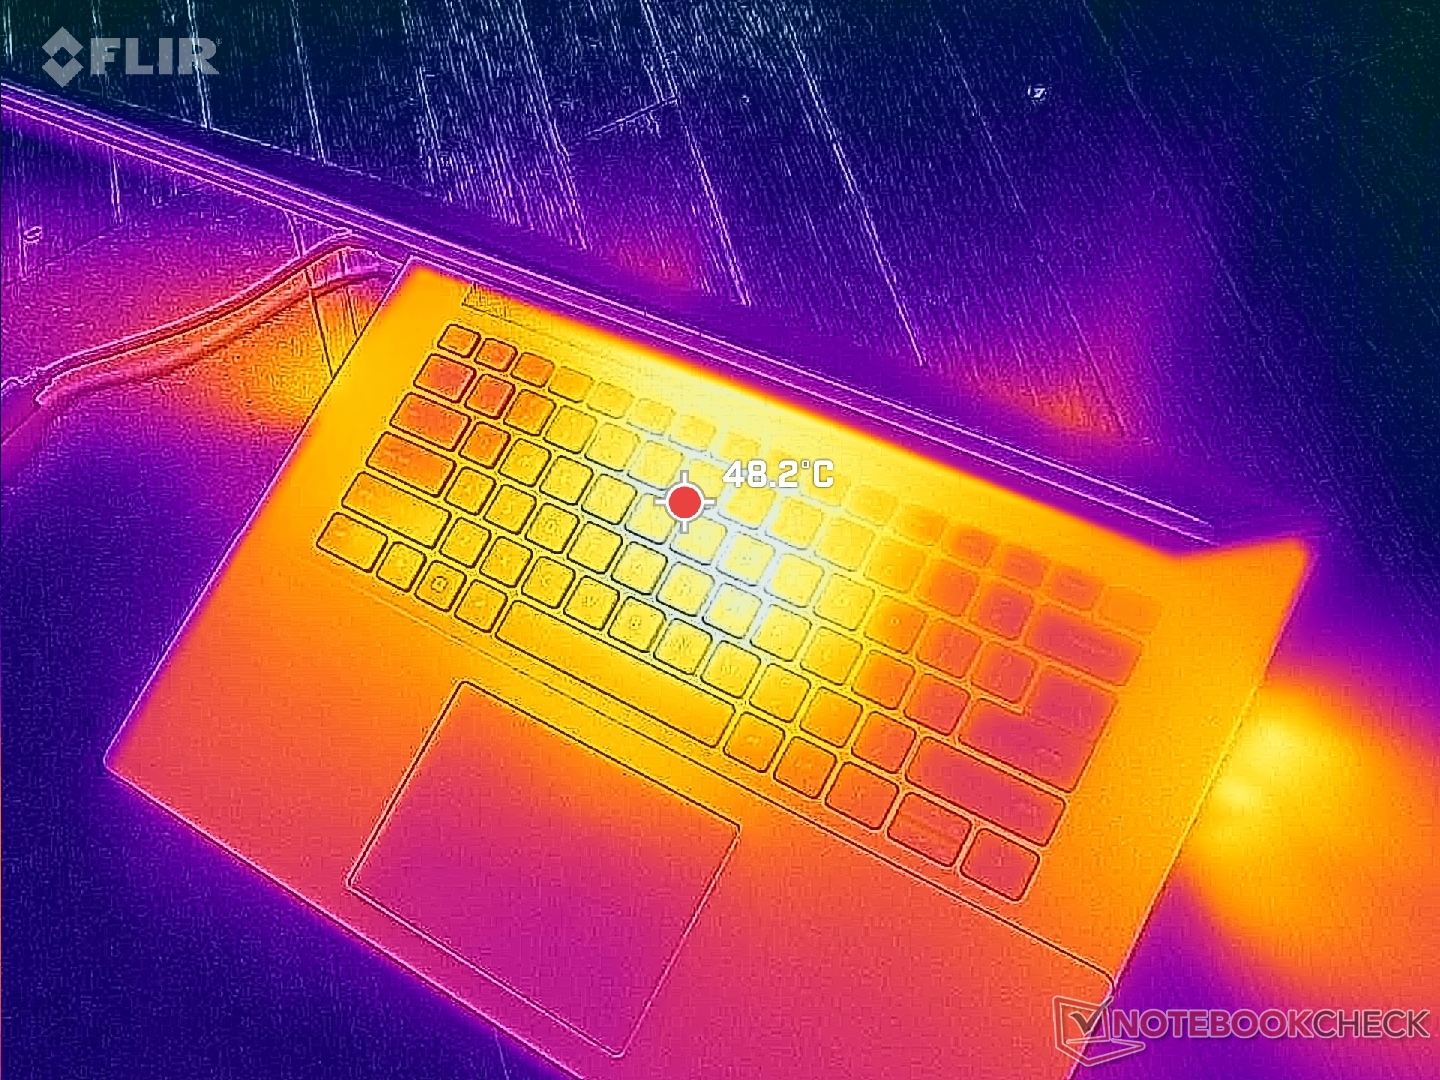
(-) De maximumtemperatuur aan de bovenzijde bedraagt 47.8 °C / 118 F, vergeleken met het gemiddelde van 36.8 °C / 98 F, variërend van 21 tot 71 °C voor de klasse Multimedia.
(±) De bodem warmt op tot een maximum van 42.2 °C / 108 F, vergeleken met een gemiddelde van 39.1 °C / 102 F
(±) Bij onbelast gebruik bedraagt de gemiddelde temperatuur voor de bovenzijde 32 °C / 90 F, vergeleken met het apparaatgemiddelde van 31.3 °C / 88 F.
(-) Bij het spelen van The Witcher 3 is de gemiddelde temperatuur voor de bovenzijde 40.6 °C / 105 F, vergeleken met het apparaatgemiddelde van 31.3 °C / 88 F.
(±) De palmsteunen en het touchpad kunnen zeer heet aanvoelen met een maximum van ###max## °C / 97.9 F.
(-) De gemiddelde temperatuur van de handpalmsteun van soortgelijke toestellen bedroeg 28.7 °C / 83.7 F (-7.9 °C / -14.2 F).
| Dell Inspiron 16 Plus 7630 Intel Core i7-13700H, NVIDIA GeForce RTX 4060 Laptop GPU | Dell Inspiron 16 Plus 7620 Intel Core i7-12700H, NVIDIA GeForce RTX 3050 Ti Laptop GPU | Lenovo Slim Pro 9i 16IRP8 Intel Core i9-13905H, NVIDIA GeForce RTX 4050 Laptop GPU | Asus Vivobook Pro 16X K6604JV-MX016W Intel Core i9-13980HX, NVIDIA GeForce RTX 4060 Laptop GPU | HP Envy 16 h0112nr Intel Core i7-12700H, NVIDIA GeForce RTX 3060 Laptop GPU | MSI Summit E16 Flip A12UDT-031 Intel Core i7-1280P, NVIDIA GeForce RTX 3050 Ti Laptop GPU | |
|---|---|---|---|---|---|---|
| Heat | 6% | 10% | -3% | 3% | 2% | |
| Maximum Upper Side * (°C) | 47.8 | 46 4% | 37.8 21% | 39.7 17% | 45.2 5% | 49.2 -3% |
| Maximum Bottom * (°C) | 42.2 | 45.8 -9% | 44.8 -6% | 60 -42% | 44 -4% | 50.2 -19% |
| Idle Upper Side * (°C) | 35.2 | 29.2 17% | 30.6 13% | 30.9 12% | 33.6 5% | 29.4 16% |
| Idle Bottom * (°C) | 35 | 31 11% | 31 11% | 34.7 1% | 32.6 7% | 30 14% |
* ... kleiner is beter
Stresstest
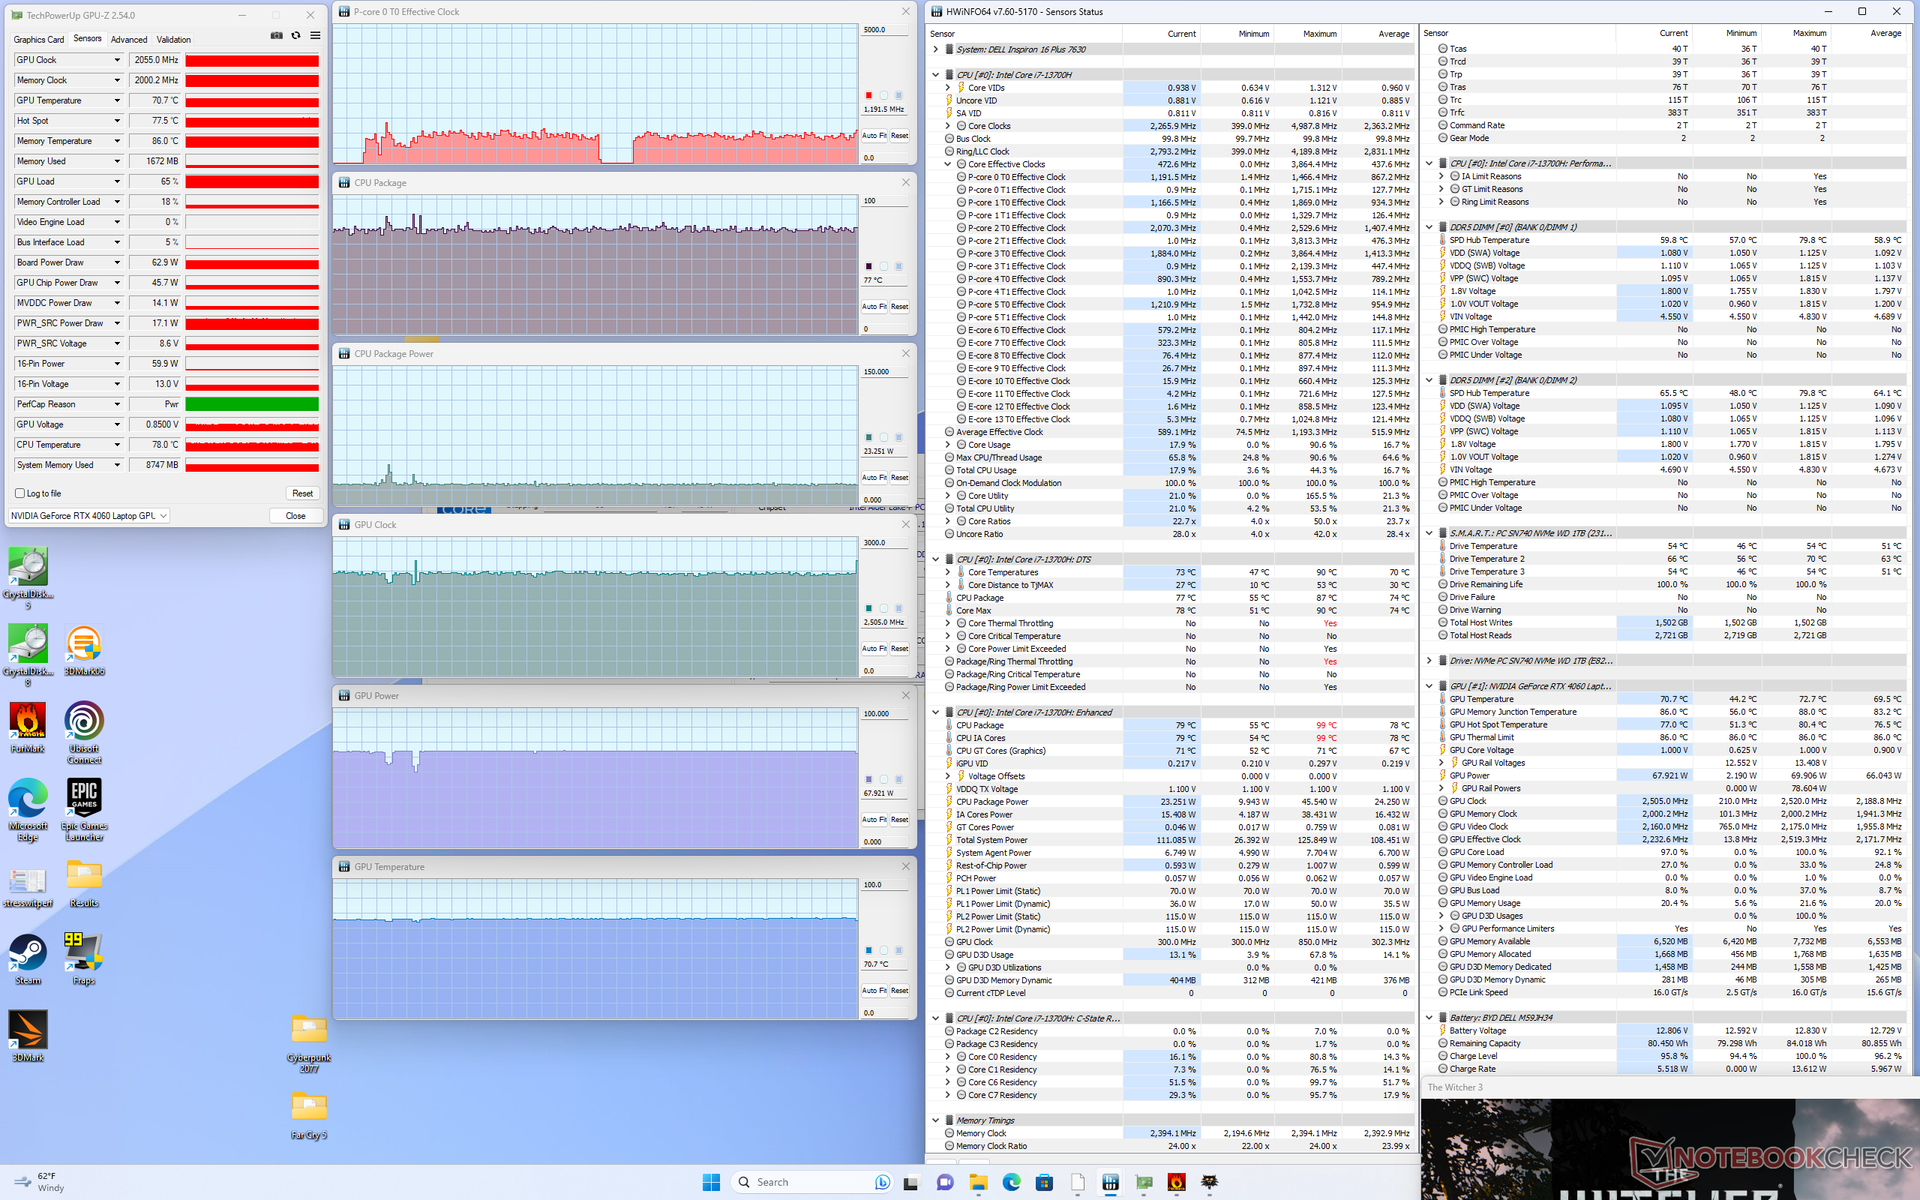
Toen Prime95 werd uitgevoerd, ging de CPU omhoog naar 3,4 GHz, 89 W en een warme 100 C gedurende slechts een paar seconden, voordat hij zich uiteindelijk stabiliseerde op ongeveer 2,3 GHz en 50 W om een meer redelijke kerntemperatuur van 84 C te handhaven. Het model van vorig jaar stabiliseerde zich ook op ongeveer dezelfde waarden toen dezelfde test werd uitgevoerd.
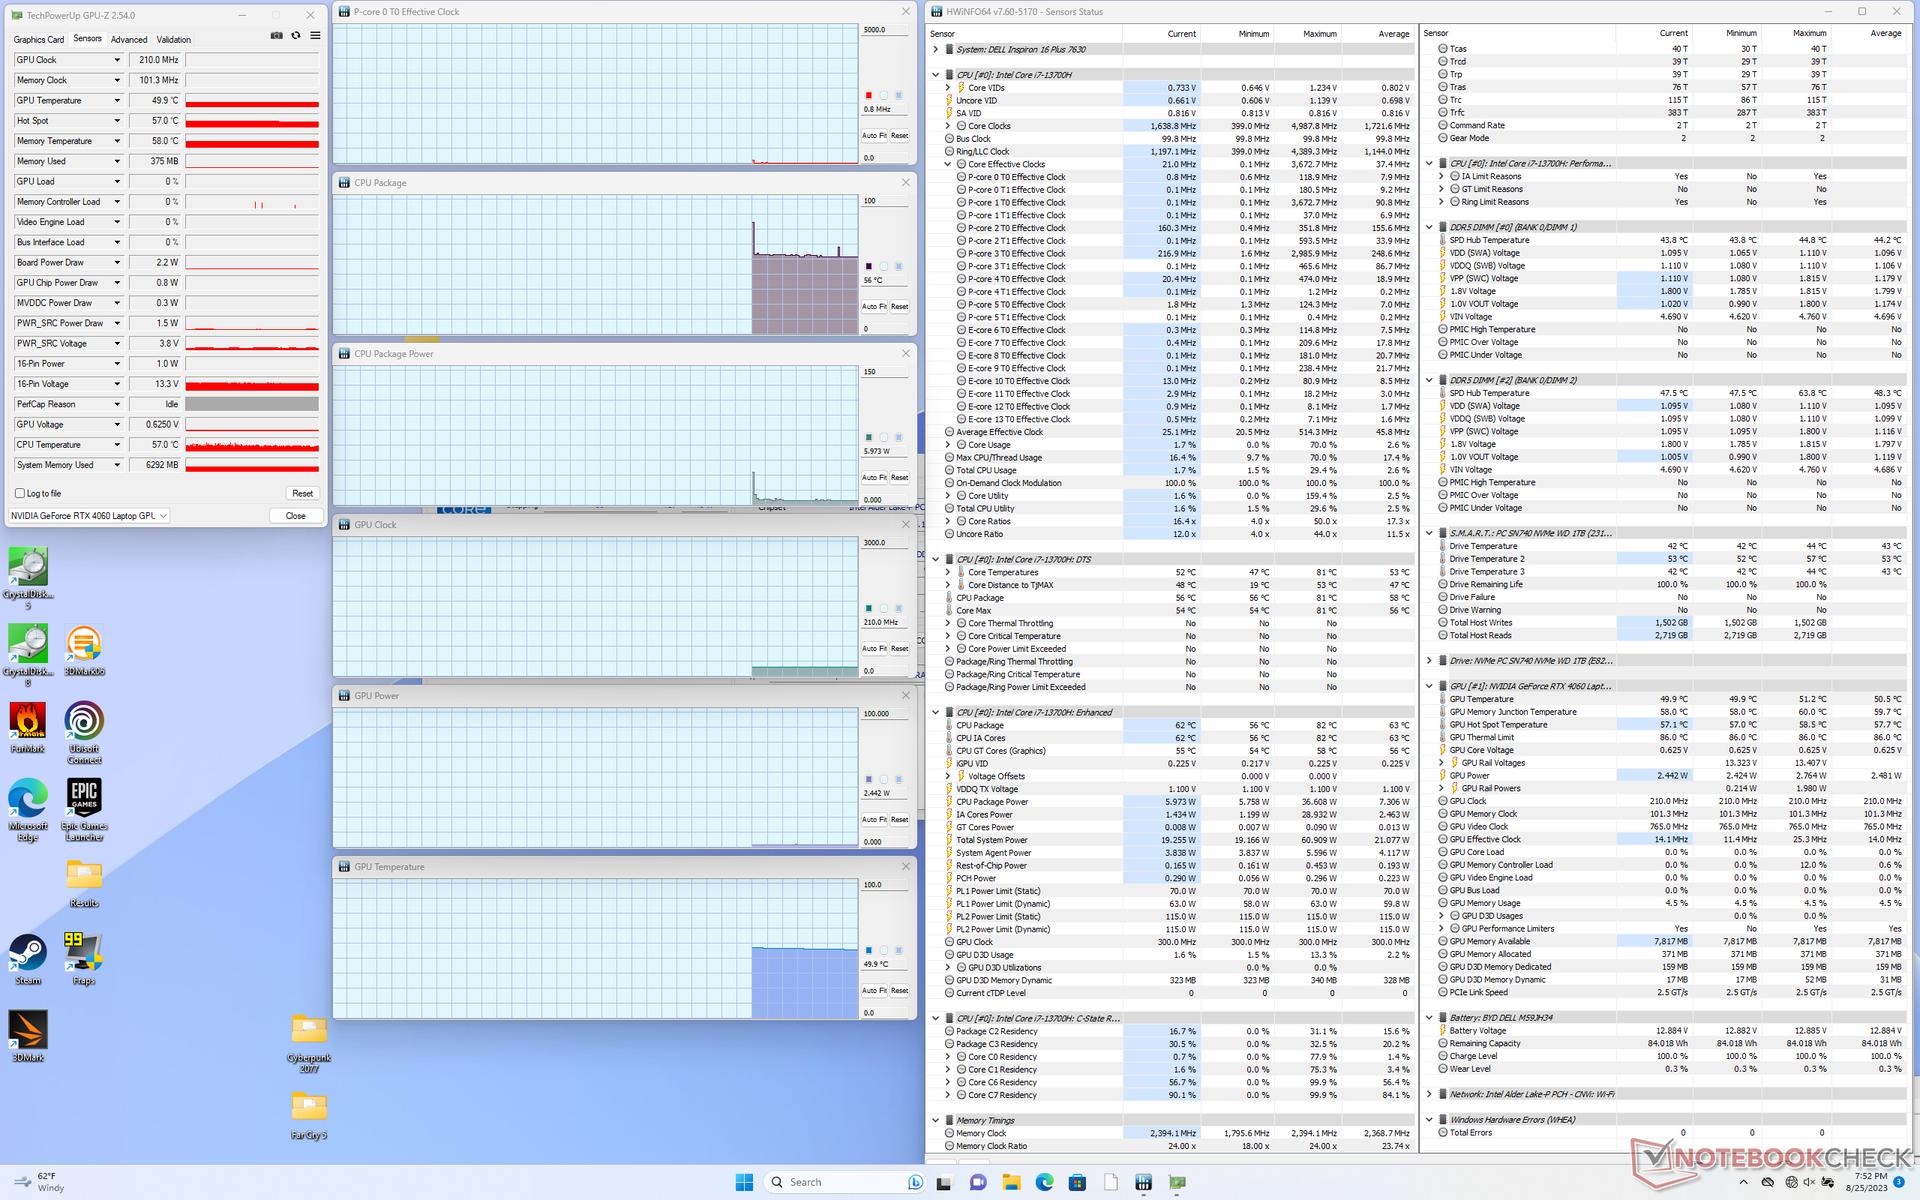
Bij het uitvoeren van Witcher 3 in de modus Prestaties om typische gamingbelastingen weer te geven, stabiliseerde de Nvidia GPU zich volgens HWiNFO op 2235 MHz, 71 C en 69 W. Overschakelen naar de gebalanceerde modus heeft geen significante invloed op deze waarden, wat overeenkomt met onze bovenstaande waarnemingen op Fire Strike. Interessant is dat de kerntemperaturen veel koeler zouden zijn dan wat we registreerden op de Inspiron 16 Plus 7620 bij het draaien van hetzelfde spel, waarschijnlijk door het hardere ventilatorgeluid en algemene verbeteringen aan de koeloplossing.
Merk op dat terwijl HWiNFO een GPU vermogen van 69 W rapporteert tijdens het gamen, Dell een GPU vermogen van slechts 60 W adverteert. Nvidia Control Panel rapporteert een GPU doelvermogen van 70 W.
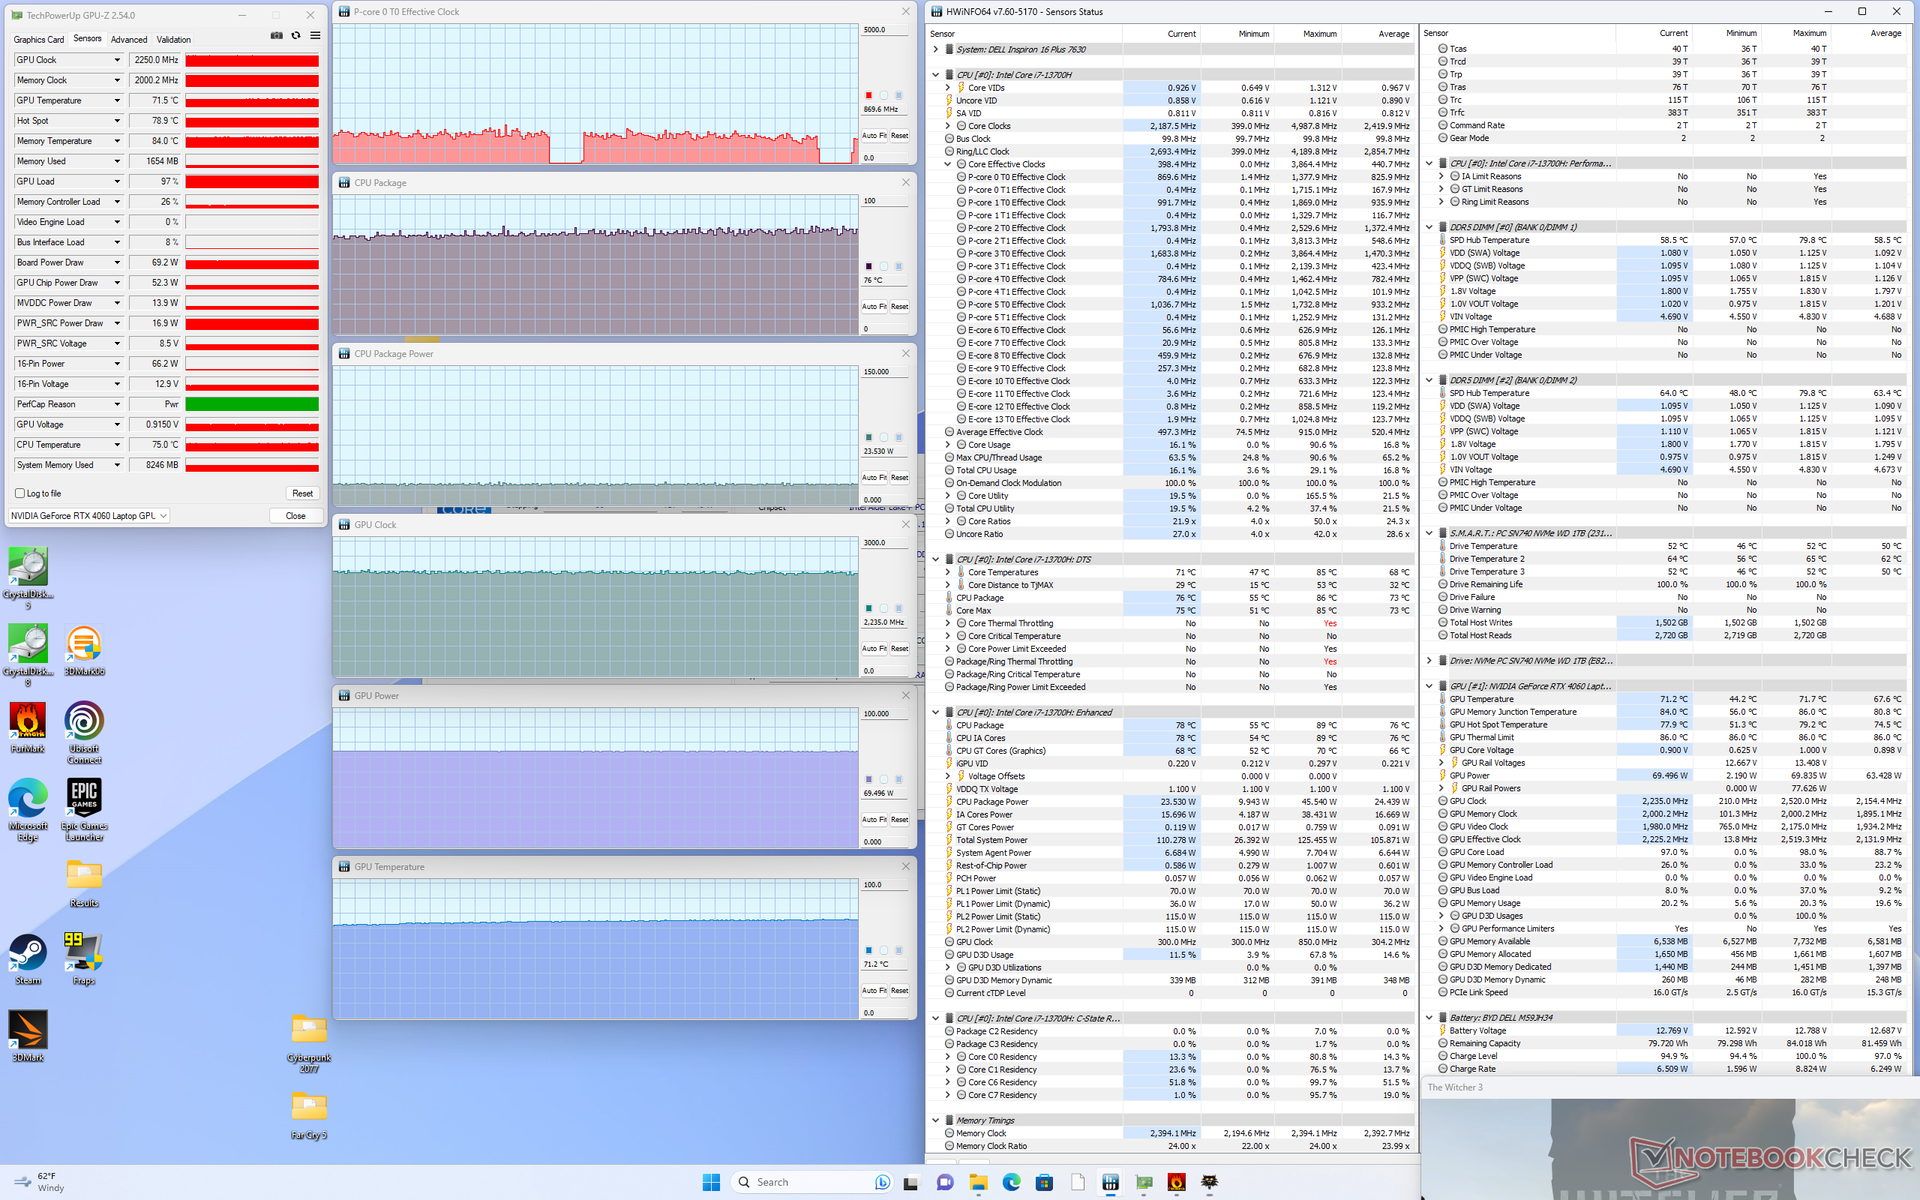
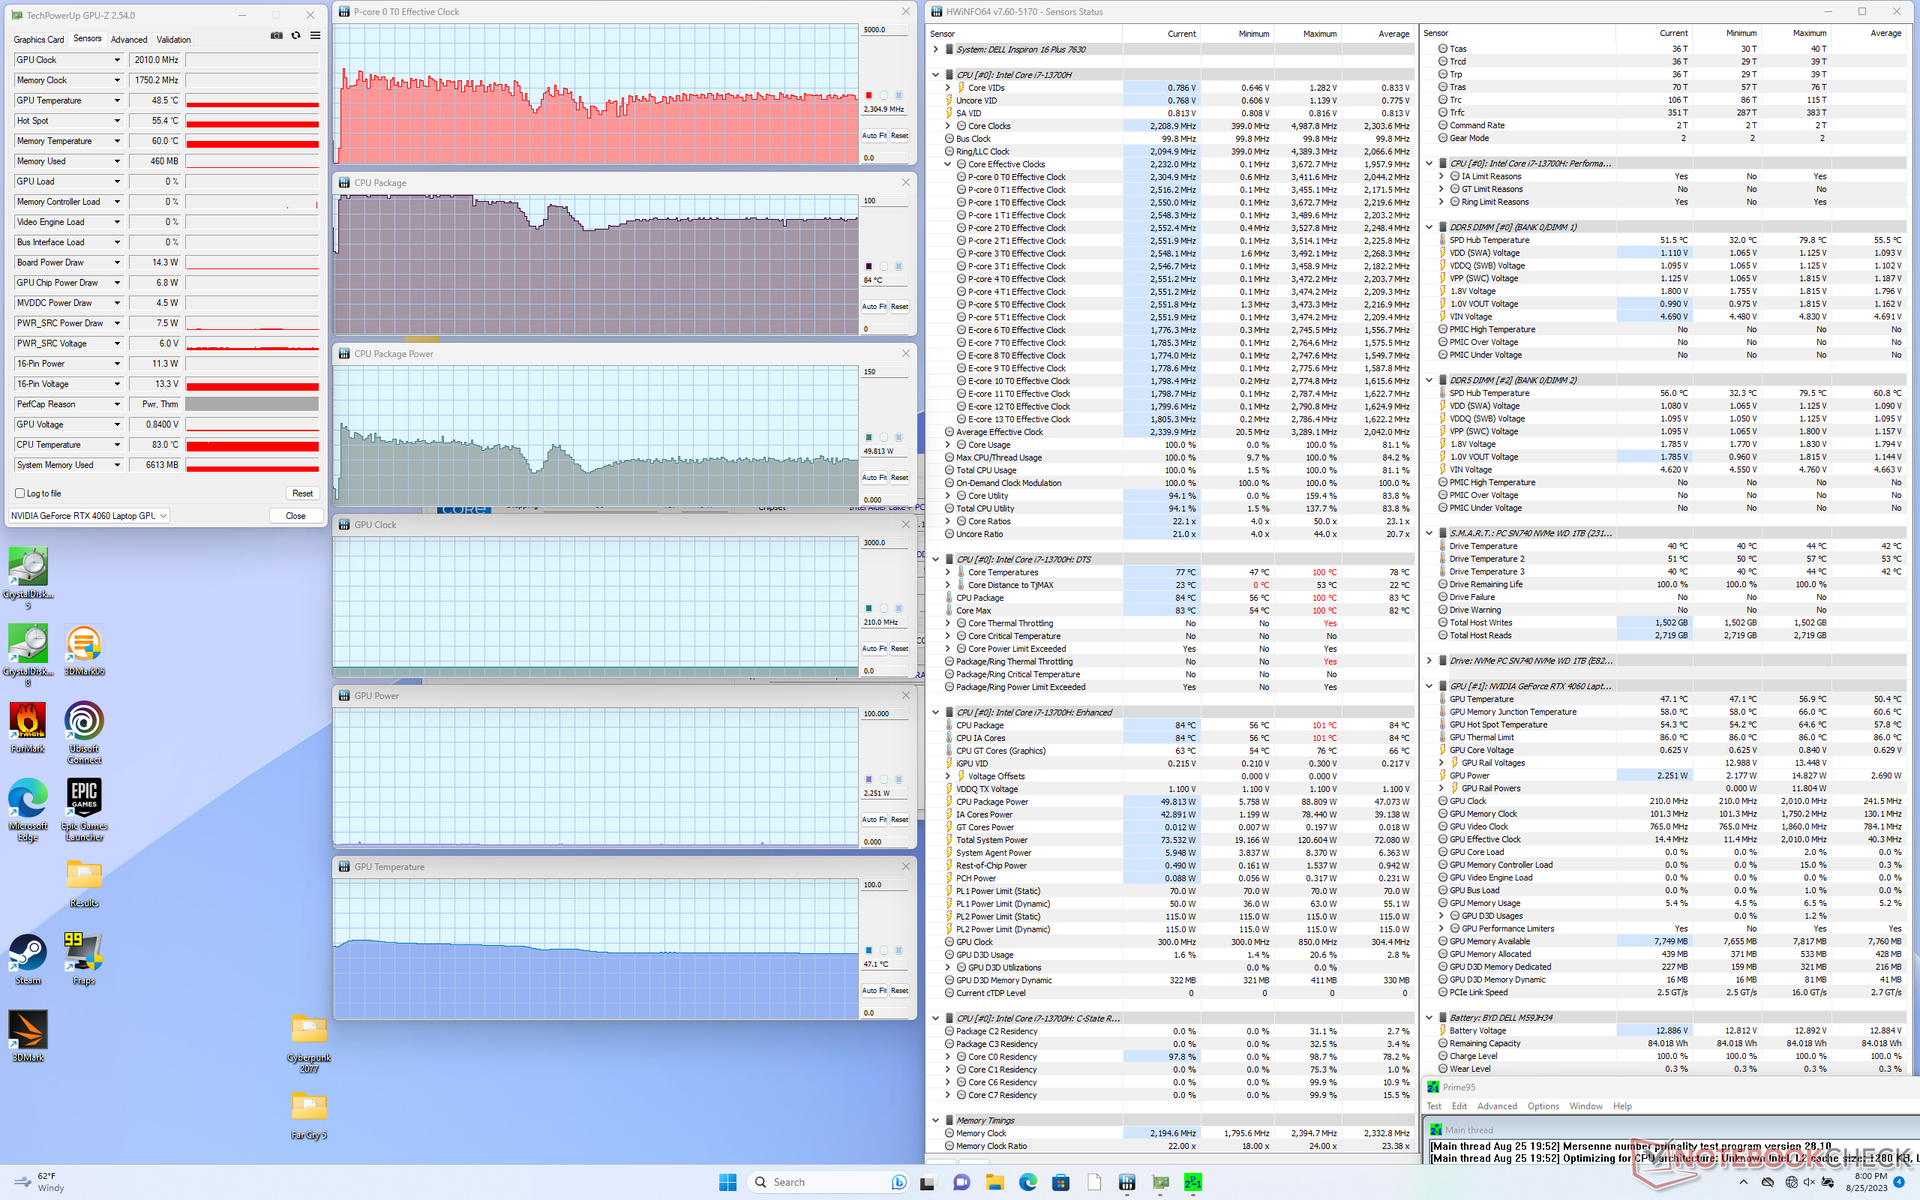
| CPU-klok (GHz) | GPU-klok (MHz) | Gemiddelde CPU-temperatuur (°C) | Gemiddelde GPU-temperatuur (°C) | |
| Systeem inactief | -- | -- | 56 | 50 |
| Prime95 Stress | 2.3 - 2.4 | -- | 84 | 47 |
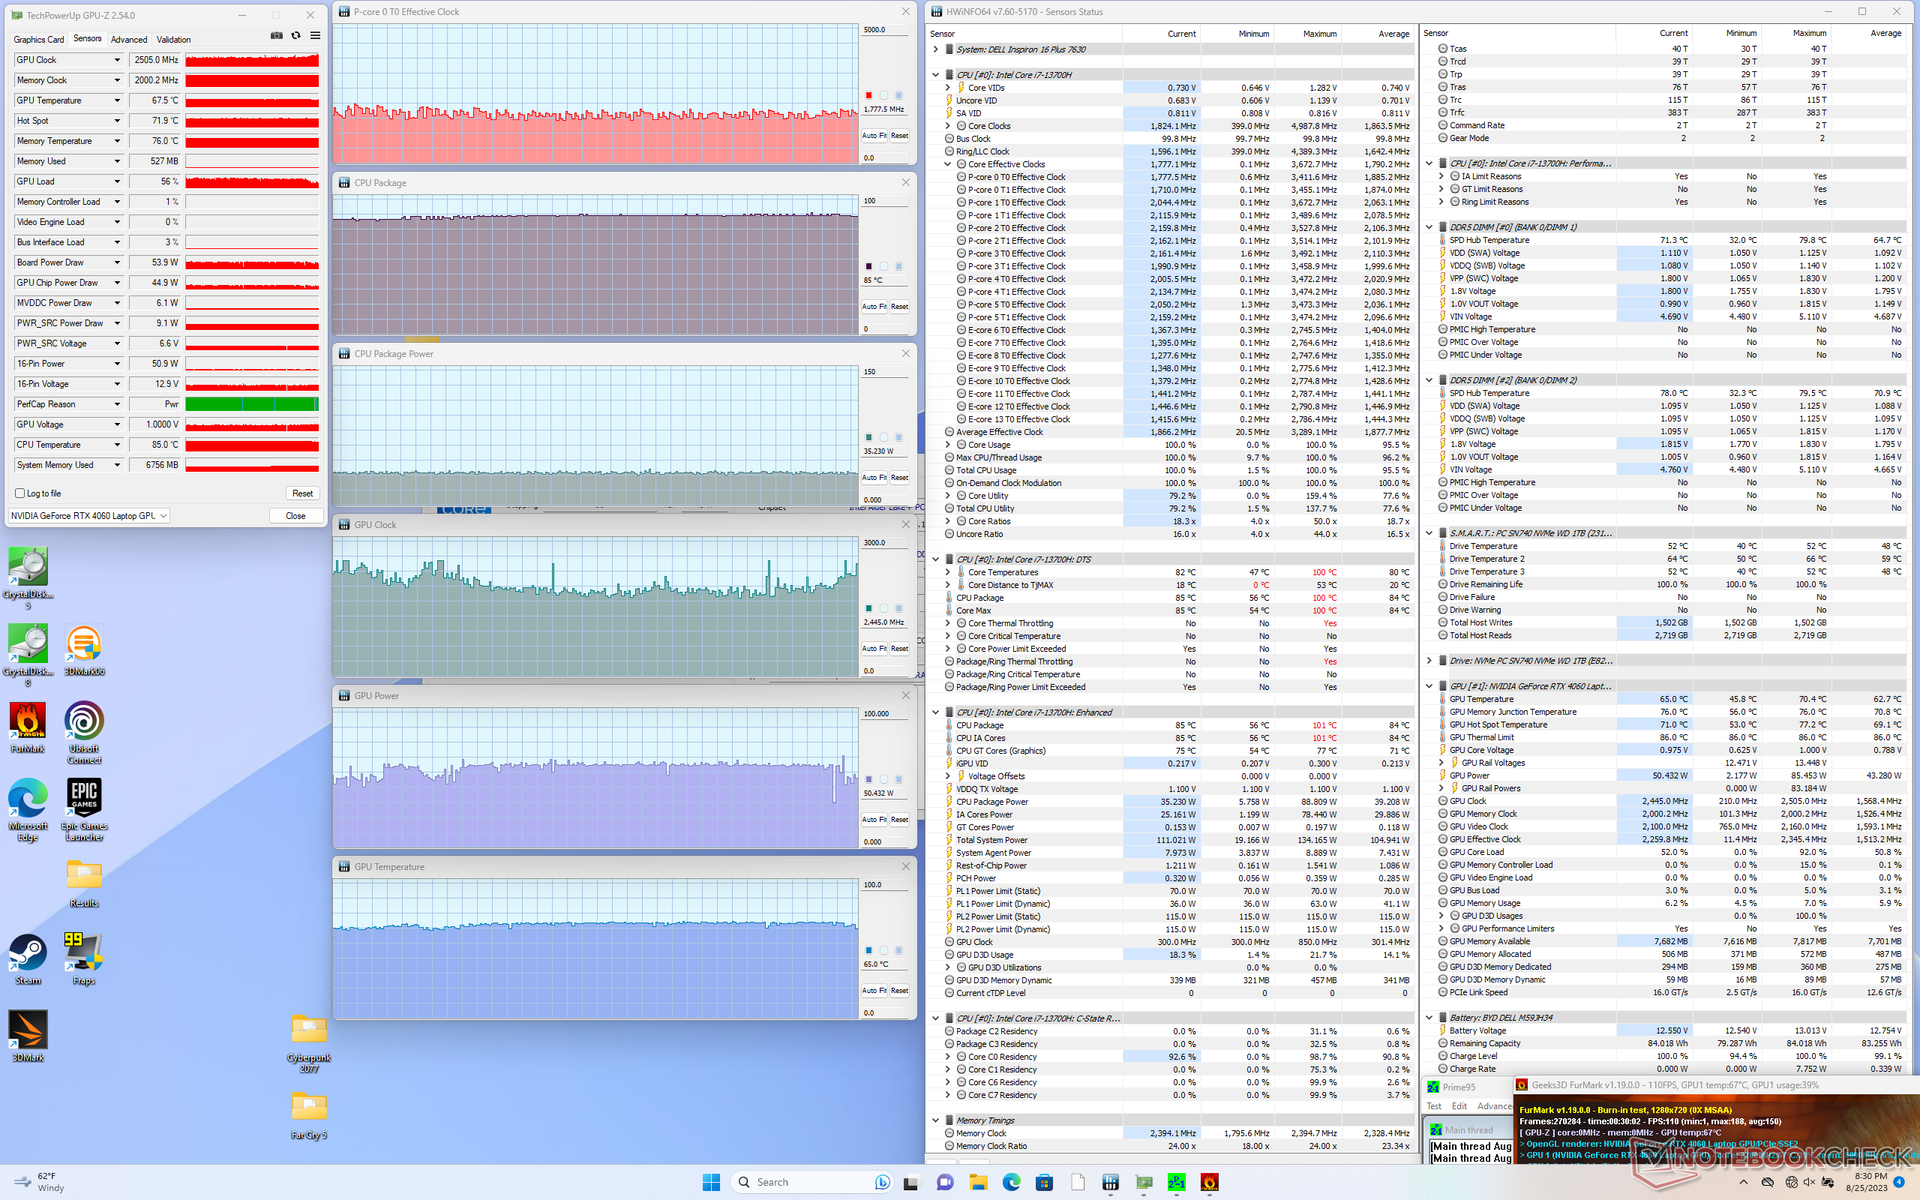
| Prime95 + FurMark-stress | ~1.8 | ~2445 | 85 | 65 |
| Witcher 3 Belasting (evenwichtige modus) | ~1.1 | 2055 | 77 | 71 |
| Witcher 3 Belasting (prestatiemodus) | ~1,1 | 2250 | 76 | 71 |
Luidsprekers
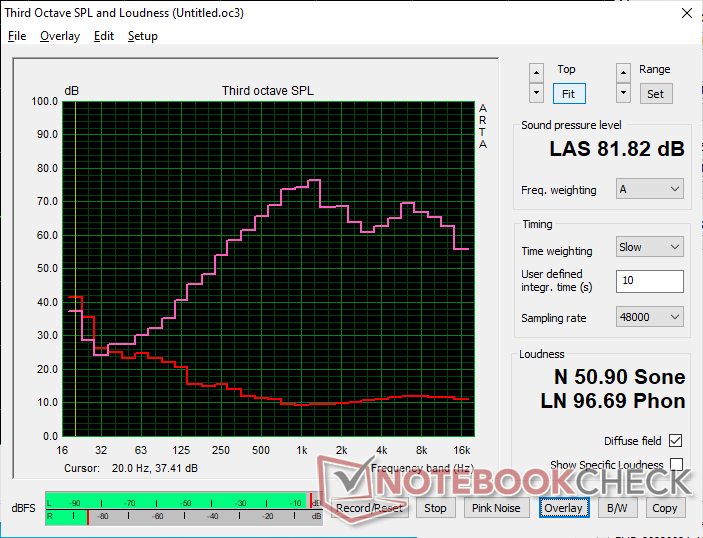
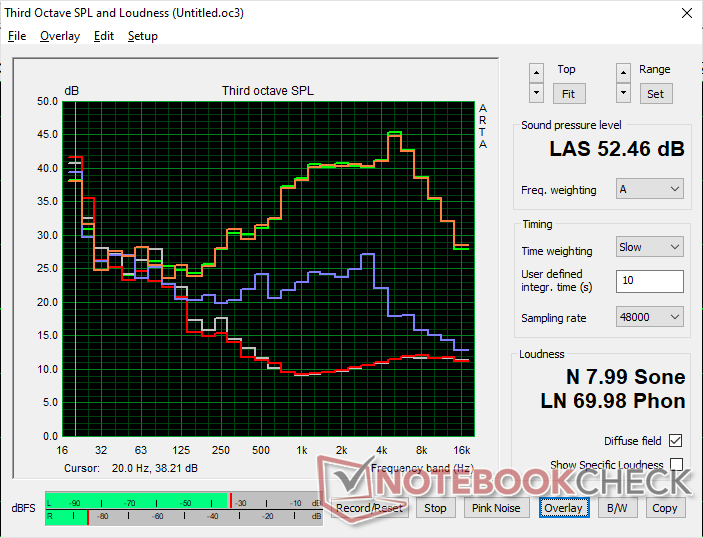
Dell Inspiron 16 Plus 7630 audioanalyse
(±) | luidspreker luidheid is gemiddeld maar goed (81.8 dB)
Bas 100 - 315 Hz
(-) | bijna geen lage tonen - gemiddeld 17% lager dan de mediaan
(±) | lineariteit van de lage tonen is gemiddeld (8.4% delta ten opzichte van de vorige frequentie)
Midden 400 - 2000 Hz
(±) | hogere middens - gemiddeld 6.3% hoger dan de mediaan
(+) | de middentonen zijn lineair (6.2% delta ten opzichte van de vorige frequentie)
Hoog 2 - 16 kHz
(+) | evenwichtige hoogtepunten - slechts 2.2% verwijderd van de mediaan
(+) | de hoge tonen zijn lineair (5.6% delta naar de vorige frequentie)
Algemeen 100 - 16.000 Hz
(±) | lineariteit van het totale geluid is gemiddeld (15.9% verschil met de mediaan)
Vergeleken met dezelfde klasse
» 40% van alle geteste apparaten in deze klasse waren beter, 6% vergelijkbaar, 54% slechter
» De beste had een delta van 5%, het gemiddelde was 17%, de slechtste was 45%
Vergeleken met alle geteste toestellen
» 25% van alle geteste apparaten waren beter, 5% gelijk, 70% slechter
» De beste had een delta van 4%, het gemiddelde was 23%, de slechtste was 134%
Apple MacBook Pro 16 2021 M1 Pro audioanalyse
(+) | luidsprekers kunnen relatief luid spelen (84.7 dB)
Bas 100 - 315 Hz
(+) | goede baars - slechts 3.8% verwijderd van de mediaan
(+) | de lage tonen zijn lineair (5.2% delta naar de vorige frequentie)
Midden 400 - 2000 Hz
(+) | evenwichtige middens - slechts 1.3% verwijderd van de mediaan
(+) | de middentonen zijn lineair (2.1% delta ten opzichte van de vorige frequentie)
Hoog 2 - 16 kHz
(+) | evenwichtige hoogtepunten - slechts 1.9% verwijderd van de mediaan
(+) | de hoge tonen zijn lineair (2.7% delta naar de vorige frequentie)
Algemeen 100 - 16.000 Hz
(+) | het totale geluid is lineair (4.6% verschil met de mediaan)
Vergeleken met dezelfde klasse
» 0% van alle geteste apparaten in deze klasse waren beter, 0% vergelijkbaar, 100% slechter
» De beste had een delta van 5%, het gemiddelde was 17%, de slechtste was 45%
Vergeleken met alle geteste toestellen
» 0% van alle geteste apparaten waren beter, 0% gelijk, 100% slechter
» De beste had een delta van 4%, het gemiddelde was 23%, de slechtste was 134%
Energiebeheer
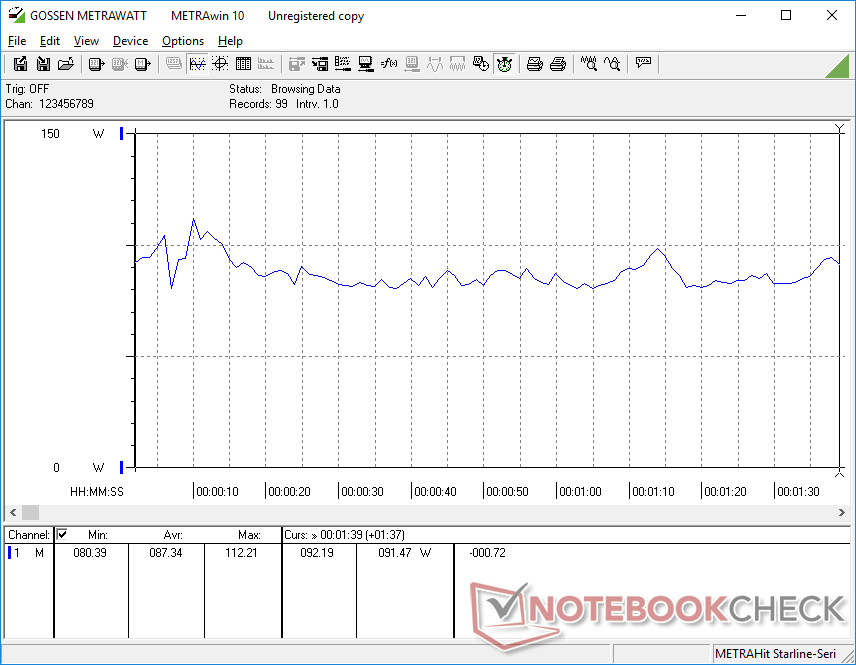
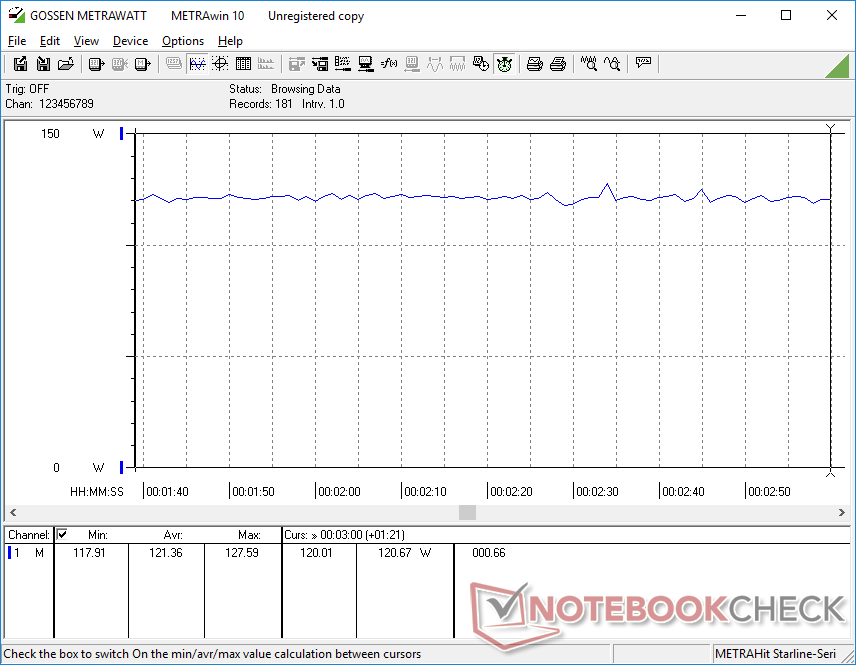
Energieverbruik - Hoge GPU-prestaties per watt
Het verbruik is iets hoger dan bij het model van vorig jaar bij stationair draaien op de desktop of bij het draaien van games. De toename van 8 procent tijdens het spelen van games verbleekt echter bij de toename van 40 tot 60 procent in grafische prestaties ten opzichte van de RTX 3050 Ti. De prestaties-per-watt zijn dus nog steeds in het voordeel van ons nieuwere model, ook al kan het stroomverbruik iets hoger zijn.
Gaming laptops met dezelfde CPU en GPU als onze Dell Inspiron, zoals deAcer Nitro 17hebben de neiging om meer stroom te verbruiken omdat ze gericht zijn op hogere stroomniveaus om meer prestaties uit de processors te persen. Tijdens het gamen bijvoorbeeld, zou de Acer ongeveer 30 W meer verbruiken.
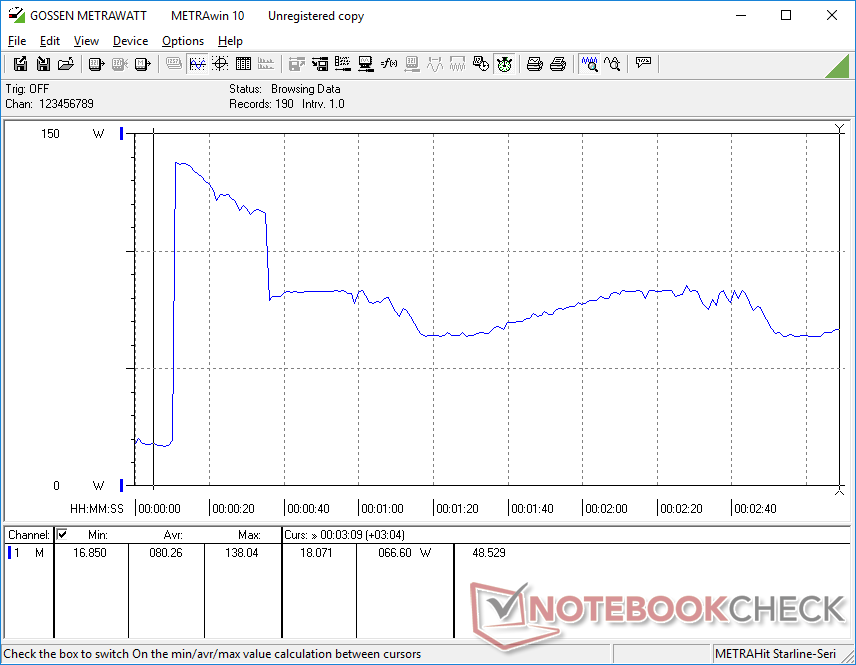
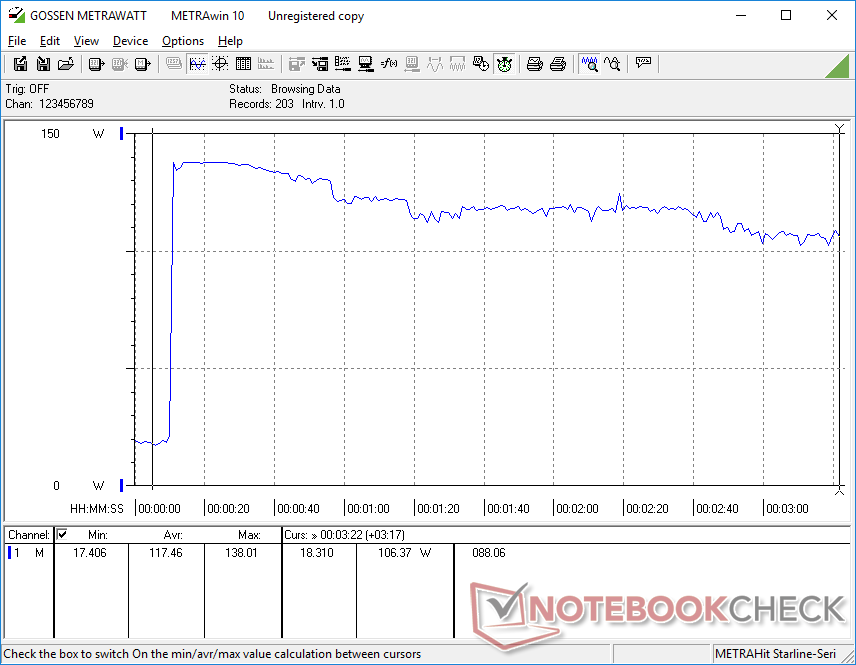
We hebben een tijdelijk maximaal verbruik gemeten van 138 W van de middelgrote (~15 x 7,4 x 2,5 cm) 130 W AC-adapter wanneer de CPU en GPU op 100 procent gebruik staan. Merk op dat configuraties zonder discrete grafische afbeeldingen worden geleverd met een kleinere 90 W AC-adapter.
| Uit / Standby | |
| Inactief | |
| Belasting |
|
Key:
min: | |
| Dell Inspiron 16 Plus 7630 i7-13700H, GeForce RTX 4060 Laptop GPU, WD PC SN740 SDDPTQD-1T00, IPS, 2560x1600, 16" | Dell Inspiron 16 Plus 7620 i7-12700H, GeForce RTX 3050 Ti Laptop GPU, Kioxia BG5 KBG50ZNS512G, IPS, 3072x1920, 16" | Lenovo Slim Pro 9i 16IRP8 i9-13905H, GeForce RTX 4050 Laptop GPU, Samsung PM9A1 MZVL21T0HCLR, Mini-LED, 3200x2000, 16" | Asus Vivobook Pro 16X K6604JV-MX016W i9-13980HX, GeForce RTX 4060 Laptop GPU, Solidigm P41 Plus SSDPFKNU010TZ, OLED, 3200x2000, 16" | HP Envy 16 h0112nr i7-12700H, GeForce RTX 3060 Laptop GPU, Micron 3400 1TB MTFDKBA1T0TFH, OLED, 3840x2400, 16" | MSI Summit E16 Flip A12UDT-031 i7-1280P, GeForce RTX 3050 Ti Laptop GPU, Samsung PM9A1 MZVL22T0HBLB, IPS, 2560x1600, 16" | |
|---|---|---|---|---|---|---|
| Power Consumption | 15% | -28% | -23% | -9% | 22% | |
| Idle Minimum * (Watt) | 15.6 | 6.8 56% | 16 -3% | 13.8 12% | 10 36% | 9.8 37% |
| Idle Average * (Watt) | 17.7 | 9.6 46% | 30 -69% | 16 10% | 10.9 38% | 15.3 14% |
| Idle Maximum * (Watt) | 20.6 | 17 17% | 30.4 -48% | 19 8% | 27.8 -35% | 16.3 21% |
| Load Average * (Watt) | 87.4 | 117.5 -34% | 78.9 10% | 147 -68% | 116.4 -33% | 87 -0% |
| Witcher 3 ultra * (Watt) | 121.7 | 113.1 7% | 155.3 -28% | 147.8 -21% | 133.7 -10% | 86.1 29% |
| Load Maximum * (Watt) | 138 | 137.4 -0% | 180.4 -31% | 244 -77% | 209.8 -52% | 100 28% |
* ... kleiner is beter
Power Consumption Witcher 3 / Stresstest
Power Consumption external Monitor
Levensduur batterij
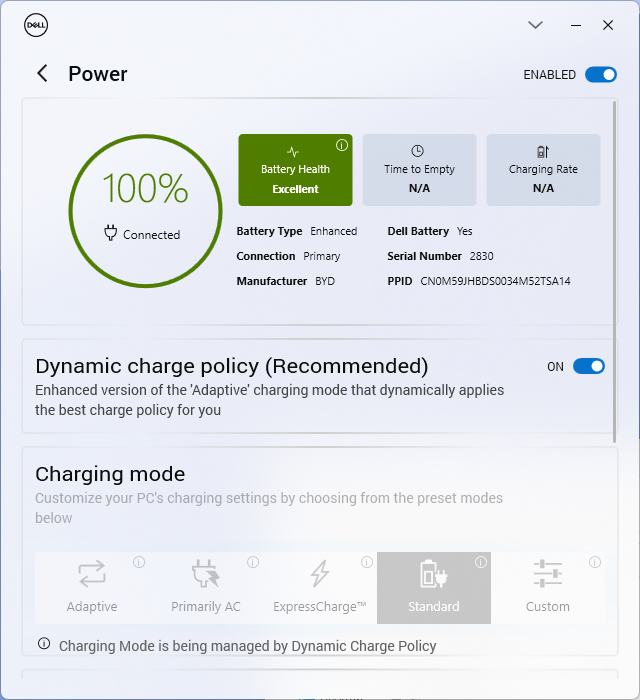
Zowel de batterijcapaciteit als de batterijduur zijn hetzelfde gebleven. We zijn in staat om 9,5 uur WLAN browsen op te nemen in de gebalanceerde modus, wat langer is dan bij concurrerende modellen zoals deLenovo Slim Pro 9i 16IRP8 of de HP Envy 16 met minstens een paar uur elk.
Opladen van leeg naar vol duurt ongeveer 90 minuten met de meegeleverde AC-adapter. Het systeem kan ook worden opgeladen met USB-C adapters zoals die bij de XPS serie worden geleverd.
| Dell Inspiron 16 Plus 7630 i7-13700H, GeForce RTX 4060 Laptop GPU, 86 Wh | Dell Inspiron 16 Plus 7620 i7-12700H, GeForce RTX 3050 Ti Laptop GPU, 86 Wh | Lenovo Slim Pro 9i 16IRP8 i9-13905H, GeForce RTX 4050 Laptop GPU, 75 Wh | Asus Vivobook Pro 16X K6604JV-MX016W i9-13980HX, GeForce RTX 4060 Laptop GPU, 90 Wh | HP Envy 16 h0112nr i7-12700H, GeForce RTX 3060 Laptop GPU, 83 Wh | MSI Summit E16 Flip A12UDT-031 i7-1280P, GeForce RTX 3050 Ti Laptop GPU, 82 Wh | |
|---|---|---|---|---|---|---|
| Batterijduur | -2% | -30% | -12% | -0% | -24% | |
| Reader / Idle (h) | 17.6 | 18.6 6% | 17.8 1% | |||
| WiFi v1.3 (h) | 9.4 | 9.6 2% | 6.6 -30% | 6.5 -31% | 7.9 -16% | 7.1 -24% |
| Load (h) | 1.4 | 1.2 -14% | 1.5 7% | 1.6 14% | ||
| H.264 (h) | 5.3 |
Pro
Contra
Verdict - Upgrade voor de snellere GPU
De upgrades ten opzichte van de Inspiron 16 Plus 7620 zijn in veel opzichten significanter dan aanvankelijk verwacht. Naast de enorme uptick in grafische prestaties bij het overstappen van de RTX 3050 Ti naar de RTX 4060, zijn het stillere en luidere ventilatorgeluid tussen de twee modellen opmerkelijk, evenals de koelere kerntemperaturen op het nieuwere model. Beeldschermopties zijn anders omdat ze nu een optionele 120 Hz verversingssnelheid bevatten, terwijl SODIMM upgrades nu twee slots bieden in plaats van één. De stijvere scharnieren zijn ook een welkome verandering om de kans te verkleinen dat ze te snel afbreken. De gebruikerservaring is voldoende verbeterd, ook al zijn de CPU-prestaties afgezaagd en blijft het toetsenbord hetzelfde als voorheen.
Bij de Inspiron 16 Plus 7630 draait alles om balans. De functies en prestaties zijn precies genoeg om te voldoen aan de meeste multimedia- en gamingdoeleinden zonder dat je er een arm en een been voor hoeft uit te geven.
Als een alleskunner op het gebied van multimedia en gaming mist de Inspiron 16 Plus 7630 echter een aantal functies die hardcore multimedia laptops en hardcore gaming laptops wel hebben. Aan de multimedia kant zullen Inspiron 16 Plus 7630 eigenaren vollere DCi-P3 kleuren, hogere native resoluties en een snelle geïntegreerde SD-kaartlezer missen. Aan de gamingkant ontbreken G-Sync en MUX en de RTX 4060 is over het algemeen langzamer dan gemiddeld. De Inspiron 16 Plus 7630 is geweldig voor het maken van content en gaming, maar gebruikers die meer gericht zijn op het maken van content kunnen beter een HP Envy 16 of Asus ZenBook Pro Duo terwijl zware gamers zullen kijken naar speciale game-machines zoals een Dell G-model of een Asus ROG.
Prijs en beschikbaarheid
Dell levert nu de Inspiron 16 Plus 7630 met de Core i7 en RTX 4060 voor $1250 USD.
Dell Inspiron 16 Plus 7630
- 30-08-2023 v7 (old)
Allen Ngo
Transparantie
De selectie van te beoordelen apparaten wordt gemaakt door onze redactie. Het testexemplaar werd ten behoeve van deze beoordeling door de fabrikant of detailhandelaar in bruikleen aan de auteur verstrekt. De kredietverstrekker had geen invloed op deze recensie, noch ontving de fabrikant vóór publicatie een exemplaar van deze recensie. Er bestond geen verplichting om deze recensie te publiceren. Als onafhankelijk mediabedrijf is Notebookcheck niet onderworpen aan het gezag van fabrikanten, detailhandelaren of uitgevers.
[transparency_disclaimer]Dit is hoe Notebookcheck test
Elk jaar beoordeelt Notebookcheck onafhankelijk honderden laptops en smartphones met behulp van gestandaardiseerde procedures om ervoor te zorgen dat alle resultaten vergelijkbaar zijn. We hebben onze testmethoden al zo'n 20 jaar voortdurend ontwikkeld en daarbij de industriestandaard bepaald. In onze testlaboratoria wordt gebruik gemaakt van hoogwaardige meetapparatuur door ervaren technici en redacteuren. Deze tests omvatten een validatieproces in meerdere fasen. Ons complexe beoordelingssysteem is gebaseerd op honderden goed onderbouwde metingen en benchmarks, waardoor de objectiviteit behouden blijft. Meer informatie over onze testmethoden kunt u hier vinden.
Price comparison

