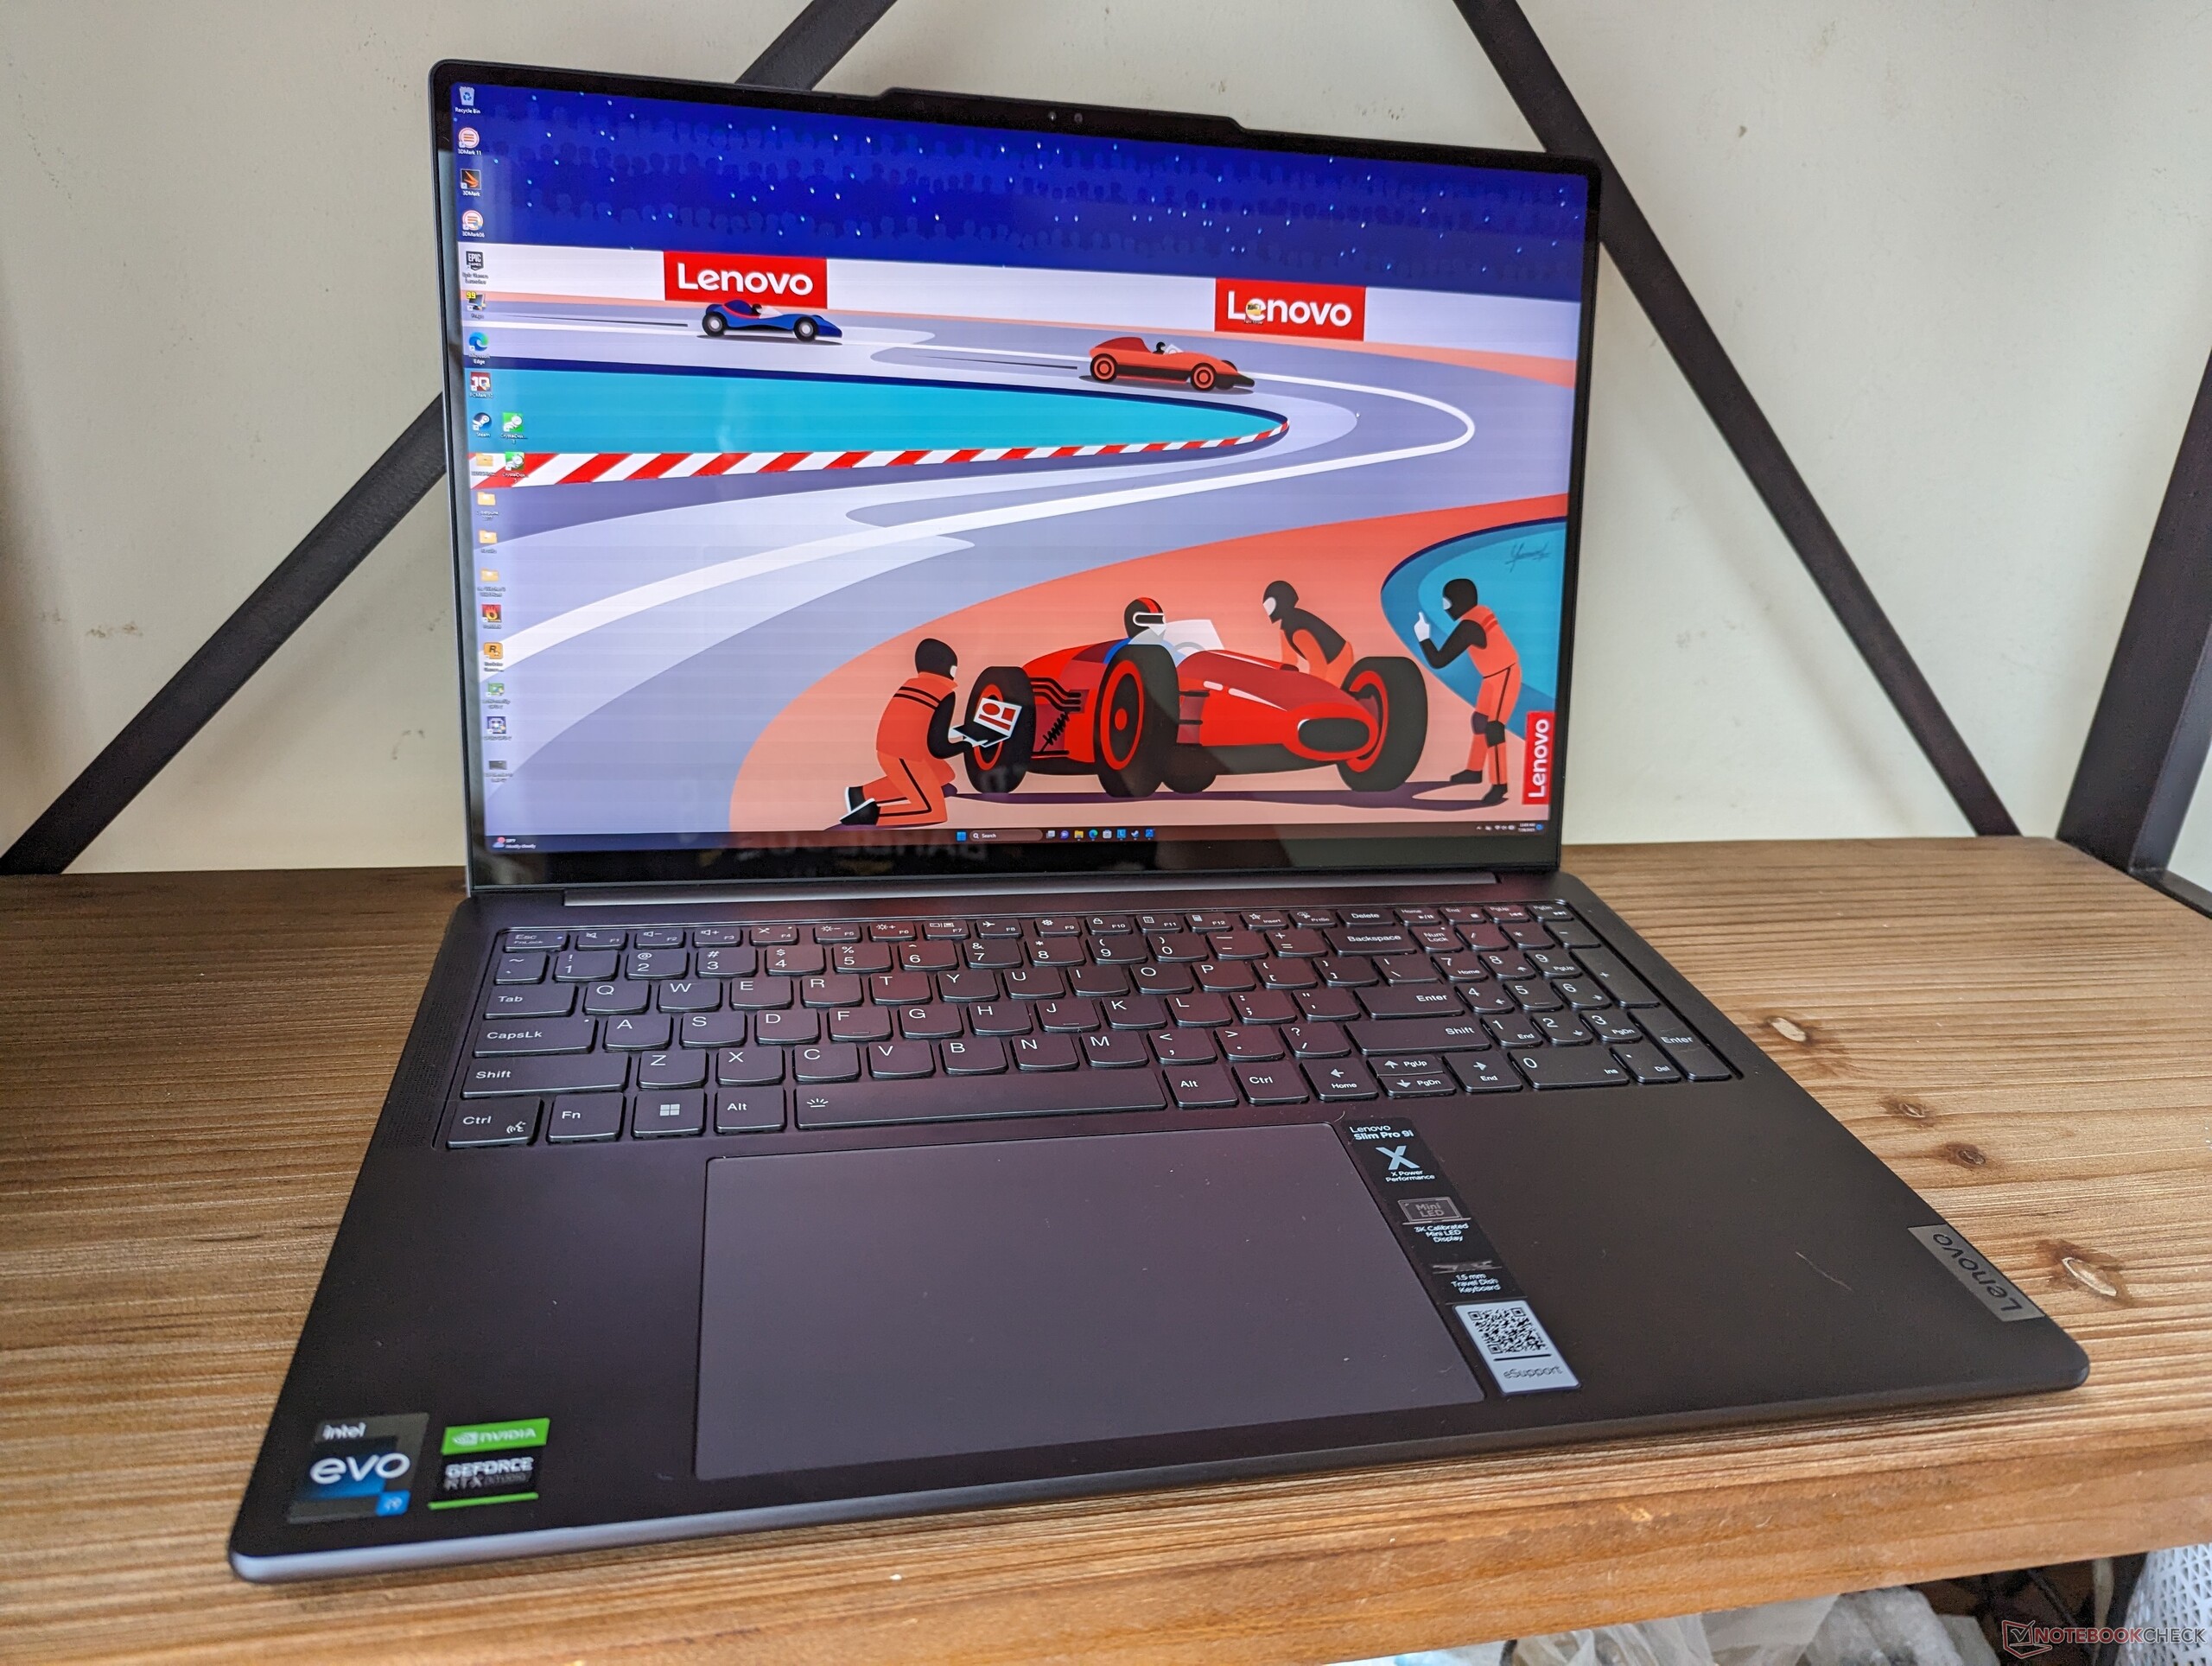
Lenovo Slim Pro 9i 16IRP8 laptop review: Het Apple MacBook Pro 16 alternatief

De Lenovo Slim Pro 9i 16 G8 is een high-end laptop die is ontworpen voor het maken van content en multimediadoeleinden. Het concurreert met 16-inch creator-gerichte modellen zoals de MSI CreatorPro Z16P, Apple MacBook Pro 16, HP Envy 16of de Asus ProArt StudioBook 16.
Verwarrend genoeg verschilt de naam van dit model per regio. In Europa staat dit model bijvoorbeeld bekend als de Yoga Pro 9i 16, terwijl het in Noord-Amerika de Slim Pro 9i 16 is. We raden je aan om onze recensie van de Yoga Pro 9i 16 om meer te weten te komen over de fysieke kenmerken van deze laptop.
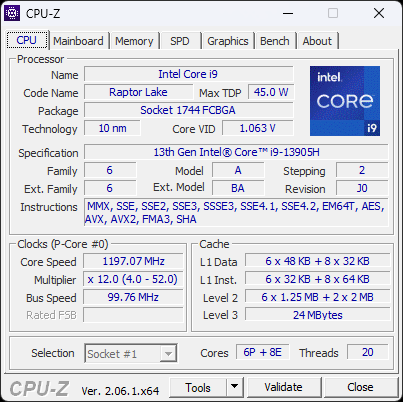
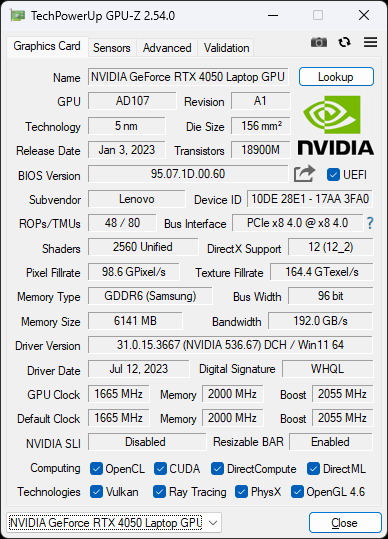
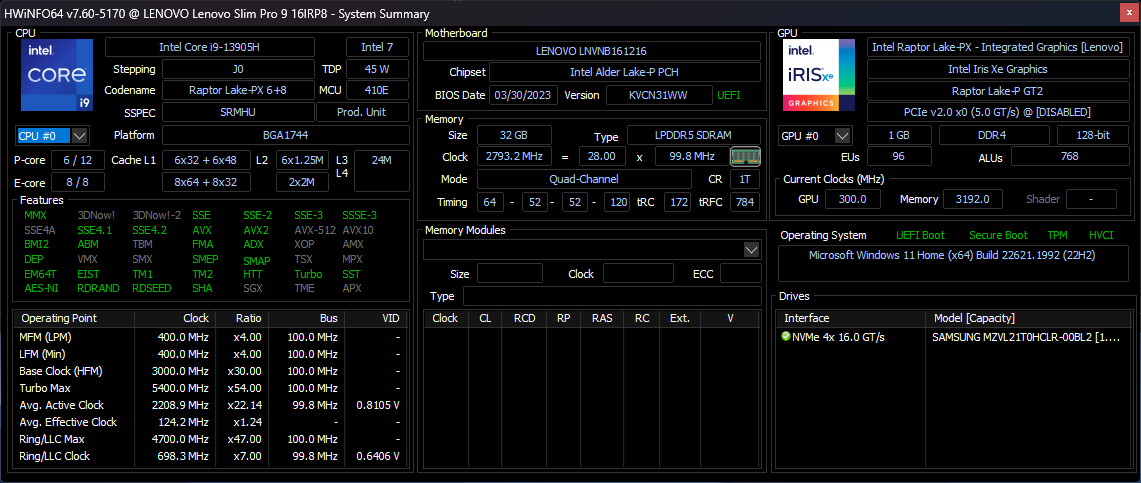
Onze reviewconfiguratie wordt geleverd met de ongebruikelijke 13e gen Raptor Lake Core i9-13905H CPU en 100 W GeForce RTX 4050, in tegenstelling tot de Core i7-13705H en RTX 4060 op onze Yoga Pro 9i 16. Beide configuraties worden verder geleverd met dezelfde standaard 13e gen Raptor Lake Core i9-13905H CPU en 100 W RTX 4050. Beide configuraties zijn verder uitgerust met hetzelfde 3.2K (3200 x 2000) mini-LED touchscreen met volledige DCI-P3 kleuren.
Er is ook een 14-inch versie van dit model beschikbaar, genaamd de Slim Pro 9i 14 of Yoga Pro 9i 14.
Meer Lenovo beoordelingen:
Potentiële concurrenten in vergelijking
Evaluatie | Datum | Model | Gewicht | Hoogte | Formaat | Resolutie | Beste prijs |
|---|---|---|---|---|---|---|---|
| 88 % v7 (old) | 08-2023 | Lenovo Slim Pro 9i 16IRP8 i9-13905H, GeForce RTX 4050 Laptop GPU | 2.2 kg | 18.2 mm | 16.00" | 3200x2000 | |
| 88.4 % v7 (old) | 08-2023 | Lenovo Yoga Pro 9 16-IRP G8 i7-13705H, GeForce RTX 4060 Laptop GPU | 2.2 kg | 18.2 mm | 16.00" | 3200x2000 | |
| 86.3 % v7 (old) | 05-2023 | Asus VivoBook Pro 16 i7-12700H, GeForce RTX 3050 Ti Laptop GPU | 1.9 kg | 20 mm | 16.00" | 2560x1600 | |
| 87.5 % v7 (old) | 06-2023 | Acer Swift Edge SFE16-42-R1GM R7 7735U, Radeon 680M | 1.2 kg | 13.95 mm | 16.00" | 3840x2400 | |
| 87.4 % v7 (old) | 08-2022 | Dell Inspiron 16 Plus 7620 i7-12700H, GeForce RTX 3050 Ti Laptop GPU | 2.1 kg | 18.99 mm | 16.00" | 3072x1920 | |
| 86.9 % v7 (old) | 09-2022 | HP Envy 16 h0112nr i7-12700H, GeForce RTX 3060 Laptop GPU | 2.3 kg | 19.8 mm | 16.00" | 3840x2400 |
Zaak
SD-kaartlezer
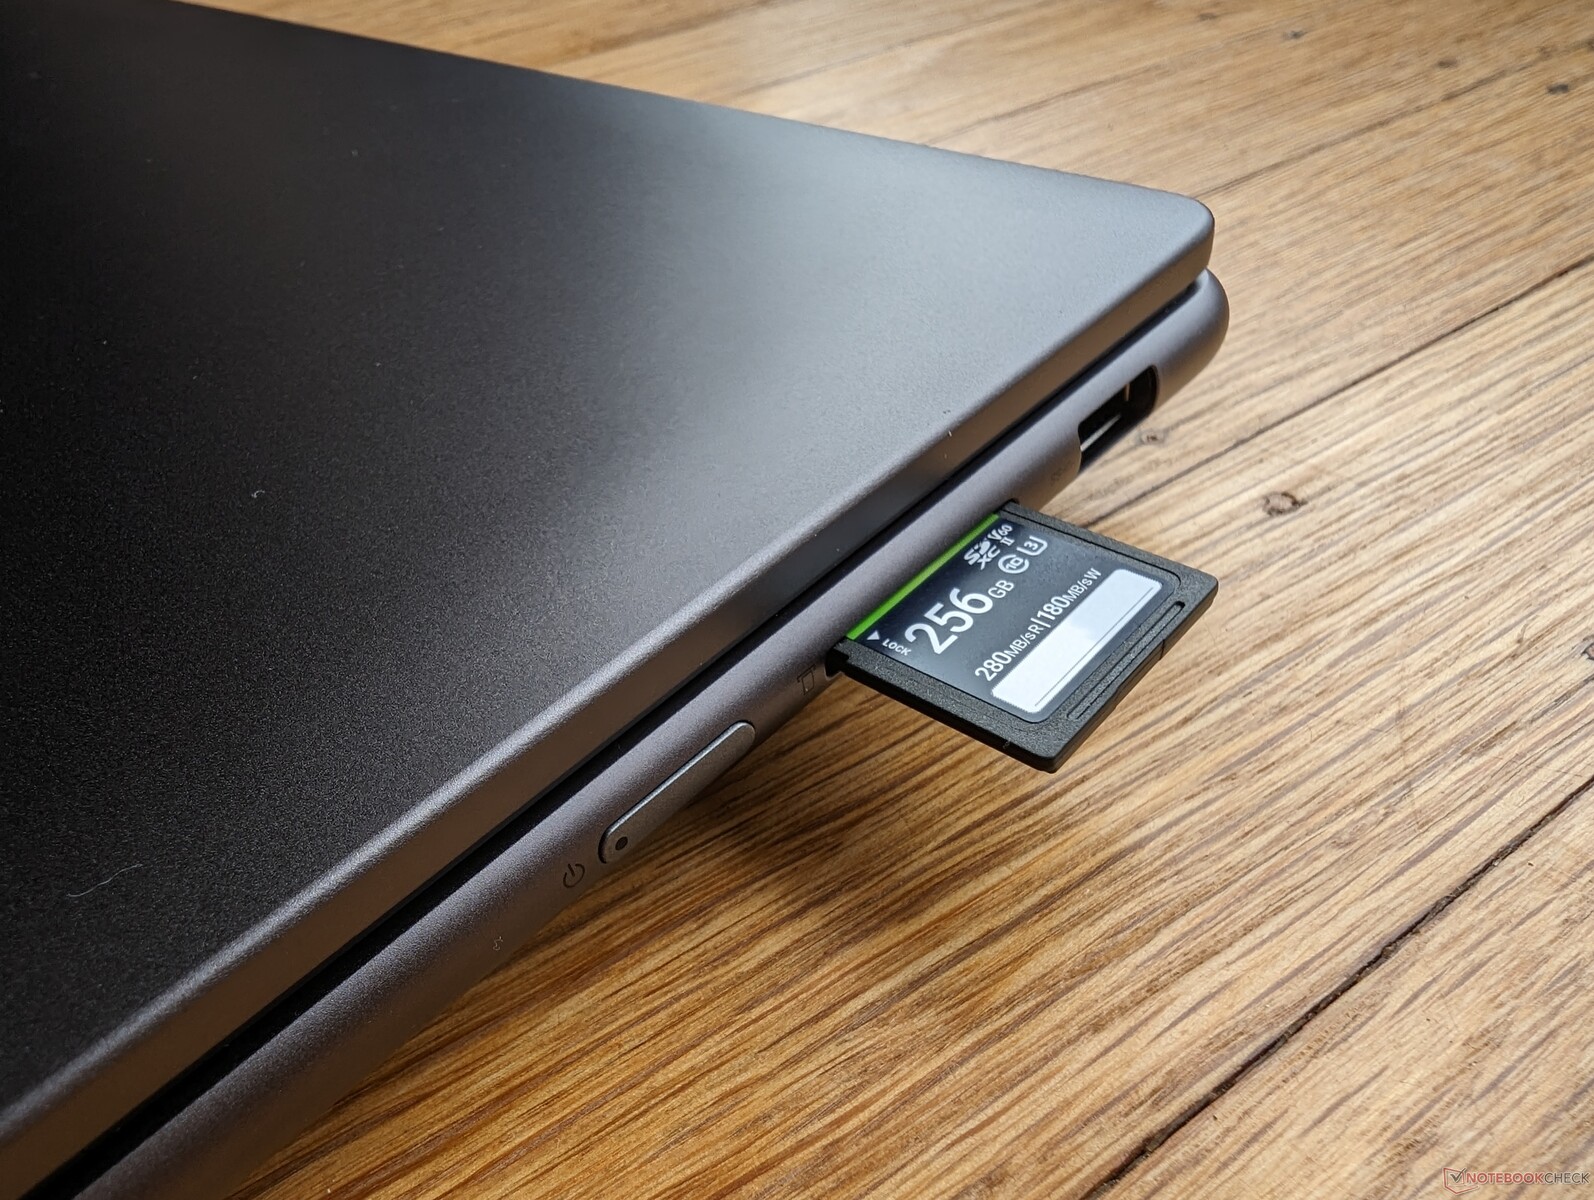
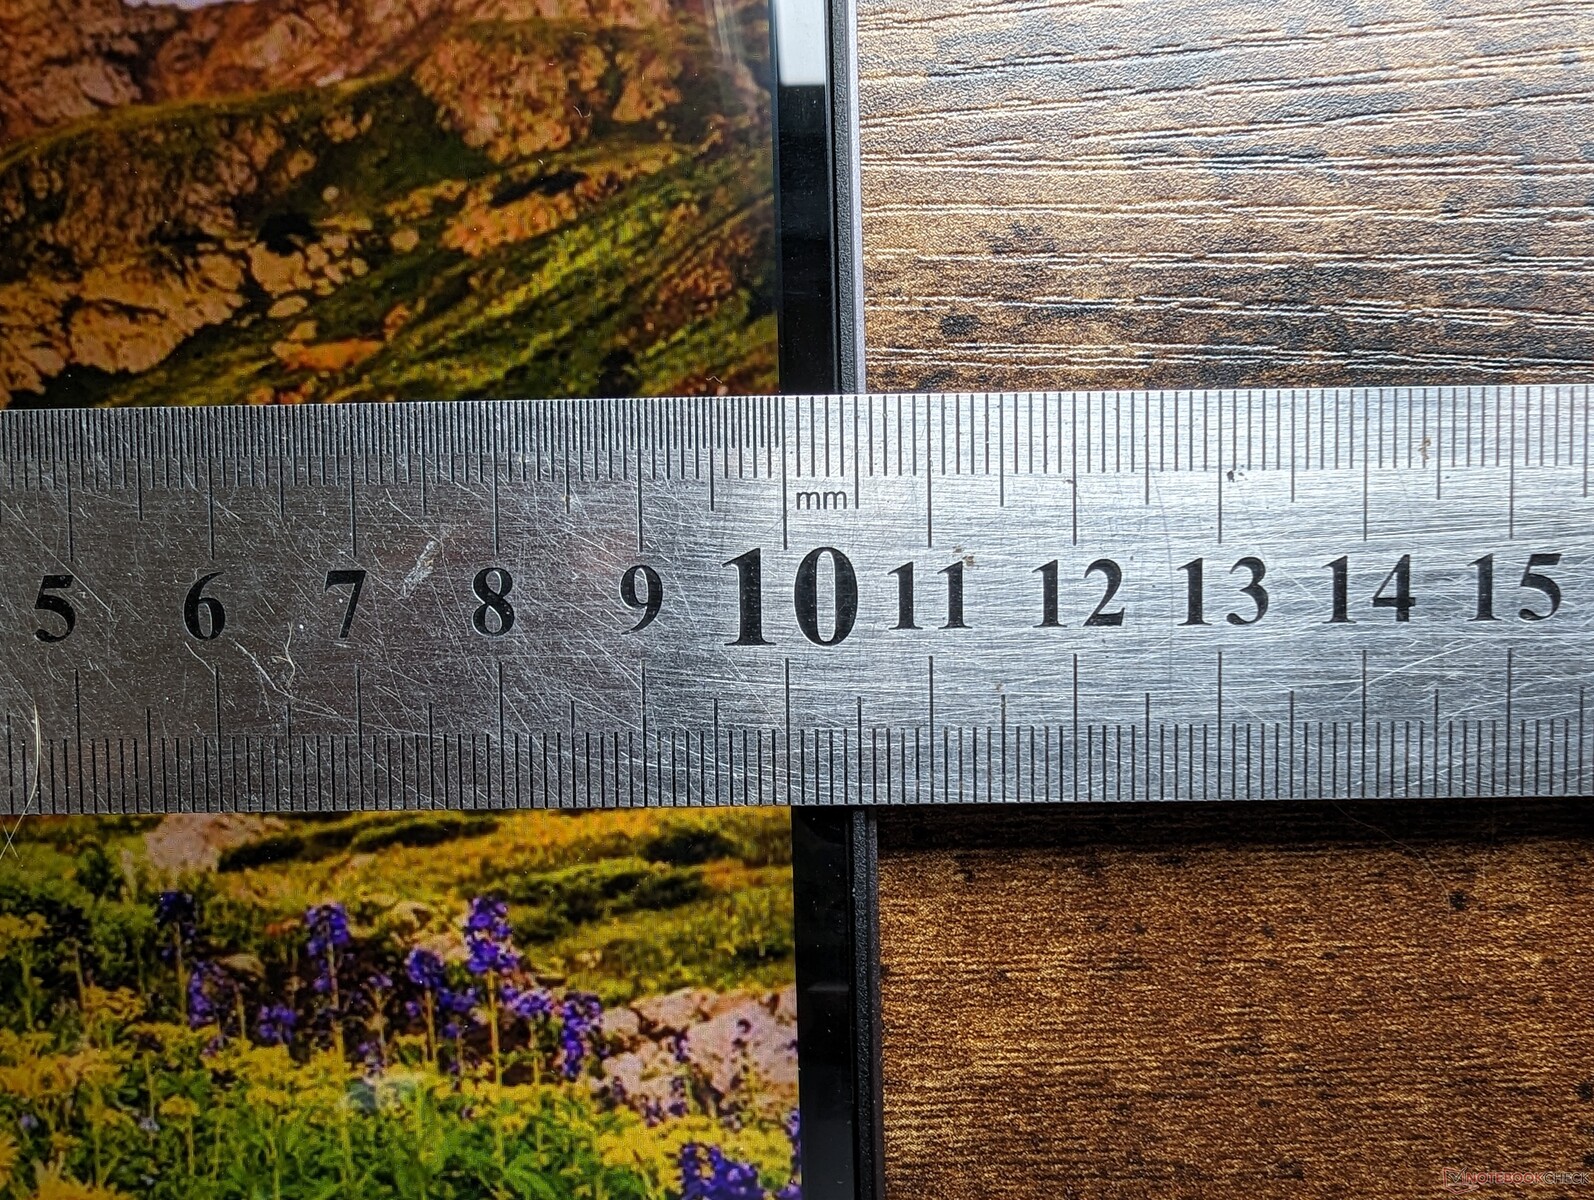
De overdrachtsnelheden zijn gemiddeld voor deze categorie met onze PNY EliteX-Pro60 V60 UHS-II testkaart. Helaas is de kaartlezer op de Lenovo ondiep, waardoor de SD-kaart meer dan de helft van zijn lengte uitsteekt en niet veilig vervoerd kan worden.
| SD Card Reader | |
| average JPG Copy Test (av. of 3 runs) | |
| Lenovo Slim Pro 9i 16IRP8 (PNY EliteX-Pro60 V60 256 GB) | |
| Lenovo Yoga Pro 9 16-IRP G8 (Angelibird AV Pro V60) | |
| Asus VivoBook Pro 16 (AV Pro SD microSD 128 GB V60) | |
| HP Envy 16 h0112nr (AV Pro SD microSD 128 GB V60) | |
| Dell Inspiron 16 Plus 7620 (Toshiba Exceria Pro SDXC 64 GB UHS-II) | |
| maximum AS SSD Seq Read Test (1GB) | |
| Lenovo Slim Pro 9i 16IRP8 (PNY EliteX-Pro60 V60 256 GB) | |
| HP Envy 16 h0112nr (AV Pro SD microSD 128 GB V60) | |
| Lenovo Yoga Pro 9 16-IRP G8 (Angelibird AV Pro V60) | |
| Asus VivoBook Pro 16 (AV Pro SD microSD 128 GB V60) | |
| Dell Inspiron 16 Plus 7620 (Toshiba Exceria Pro SDXC 64 GB UHS-II) | |
Communicatie
| Networking | |
| iperf3 transmit AXE11000 | |
| Lenovo Yoga Pro 9 16-IRP G8 | |
| Asus VivoBook Pro 16 | |
| Lenovo Slim Pro 9i 16IRP8 | |
| Acer Swift Edge SFE16-42-R1GM | |
| iperf3 receive AXE11000 | |
| Lenovo Yoga Pro 9 16-IRP G8 | |
| Lenovo Slim Pro 9i 16IRP8 | |
| Acer Swift Edge SFE16-42-R1GM | |
| iperf3 transmit AXE11000 6GHz | |
| Lenovo Slim Pro 9i 16IRP8 | |
| Acer Swift Edge SFE16-42-R1GM | |
| HP Envy 16 h0112nr | |
| Dell Inspiron 16 Plus 7620 | |
| iperf3 receive AXE11000 6GHz | |
| Asus VivoBook Pro 16 | |
| Acer Swift Edge SFE16-42-R1GM | |
| Lenovo Slim Pro 9i 16IRP8 | |
| HP Envy 16 h0112nr | |
| Dell Inspiron 16 Plus 7620 | |
Webcam
De 5 MP sensor is van hogere kwaliteit dan de webcams op de meeste andere laptops waar 2 MP of 1 MP nog steeds gebruikelijk zijn. Zowel IR als een uitschakelaar voor de camera zijn inbegrepen.


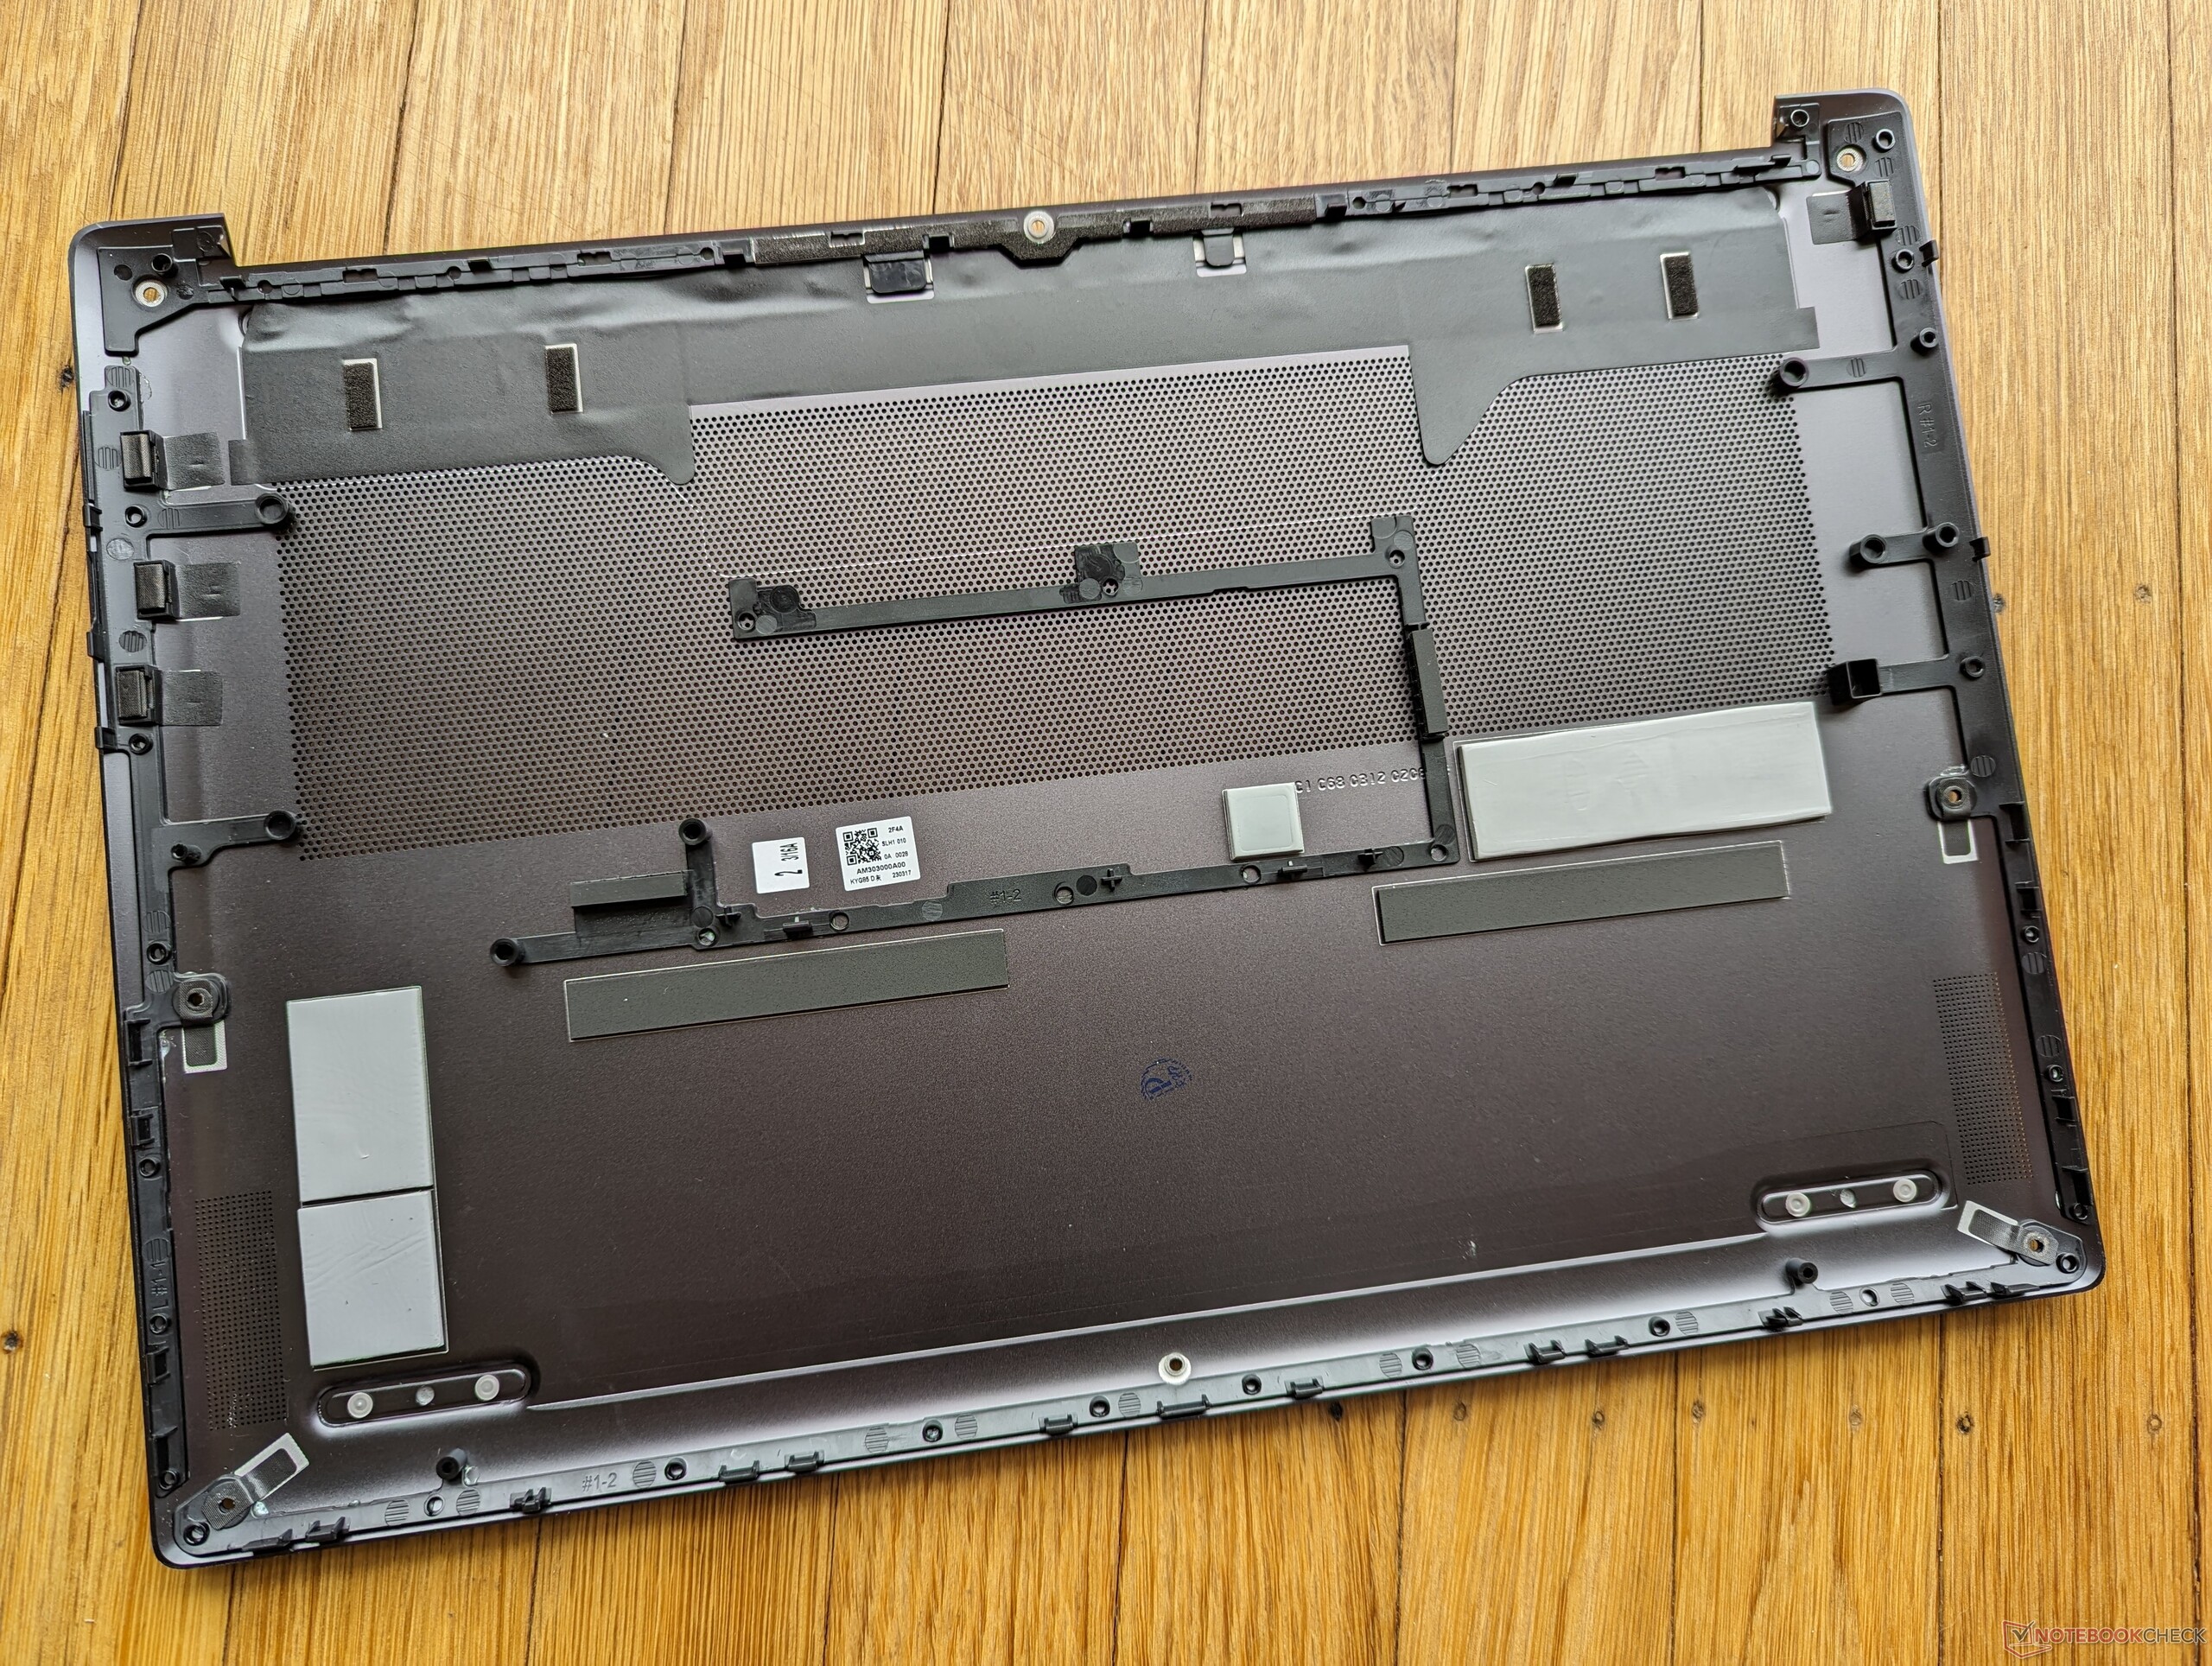
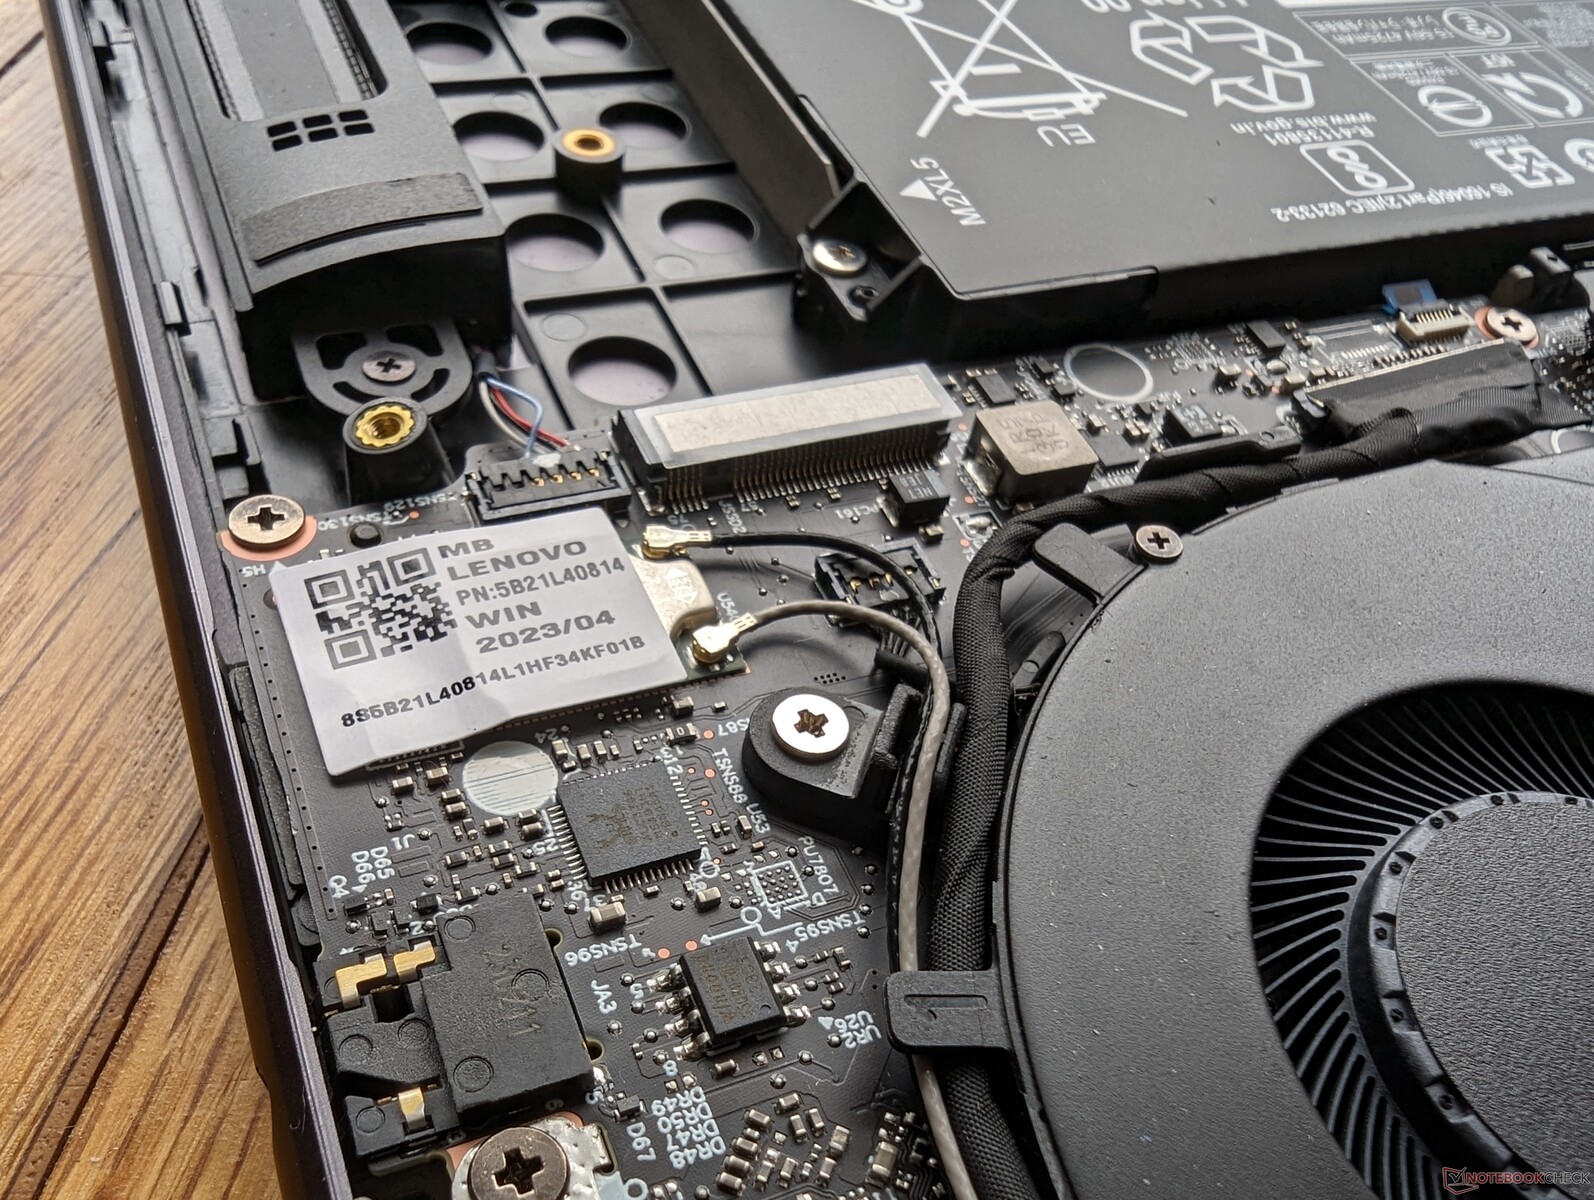
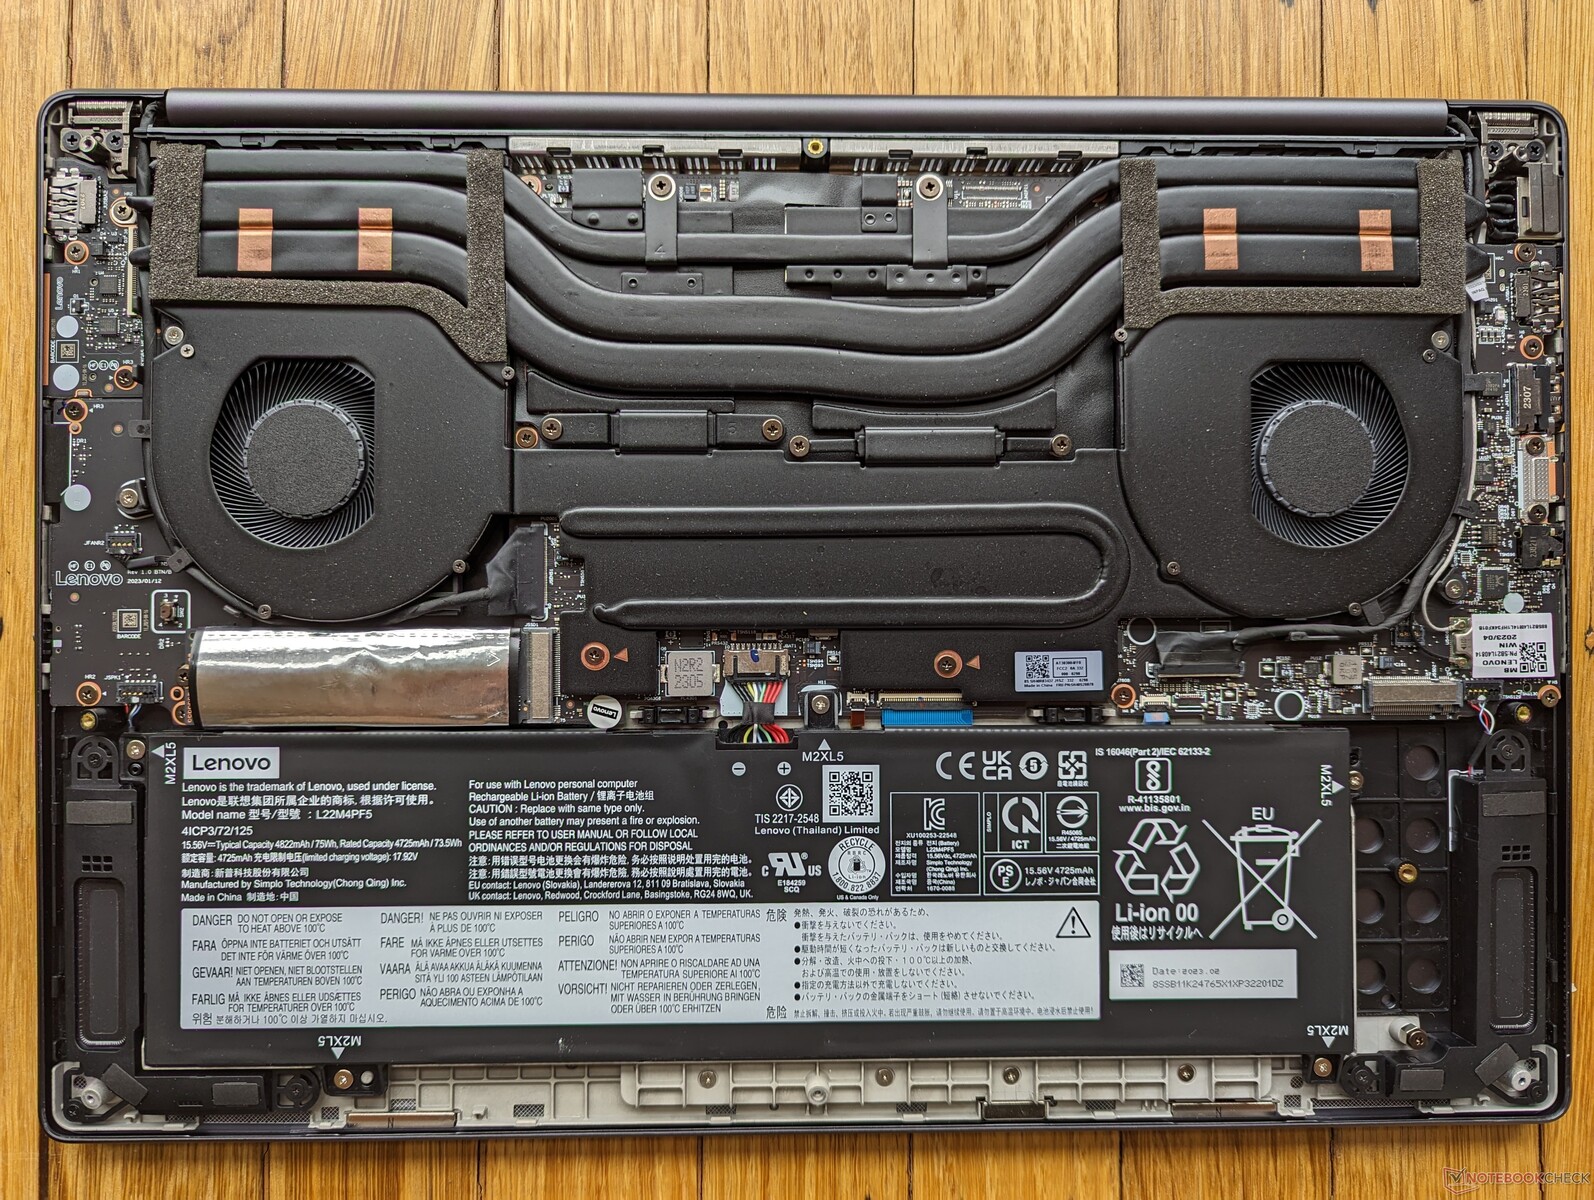
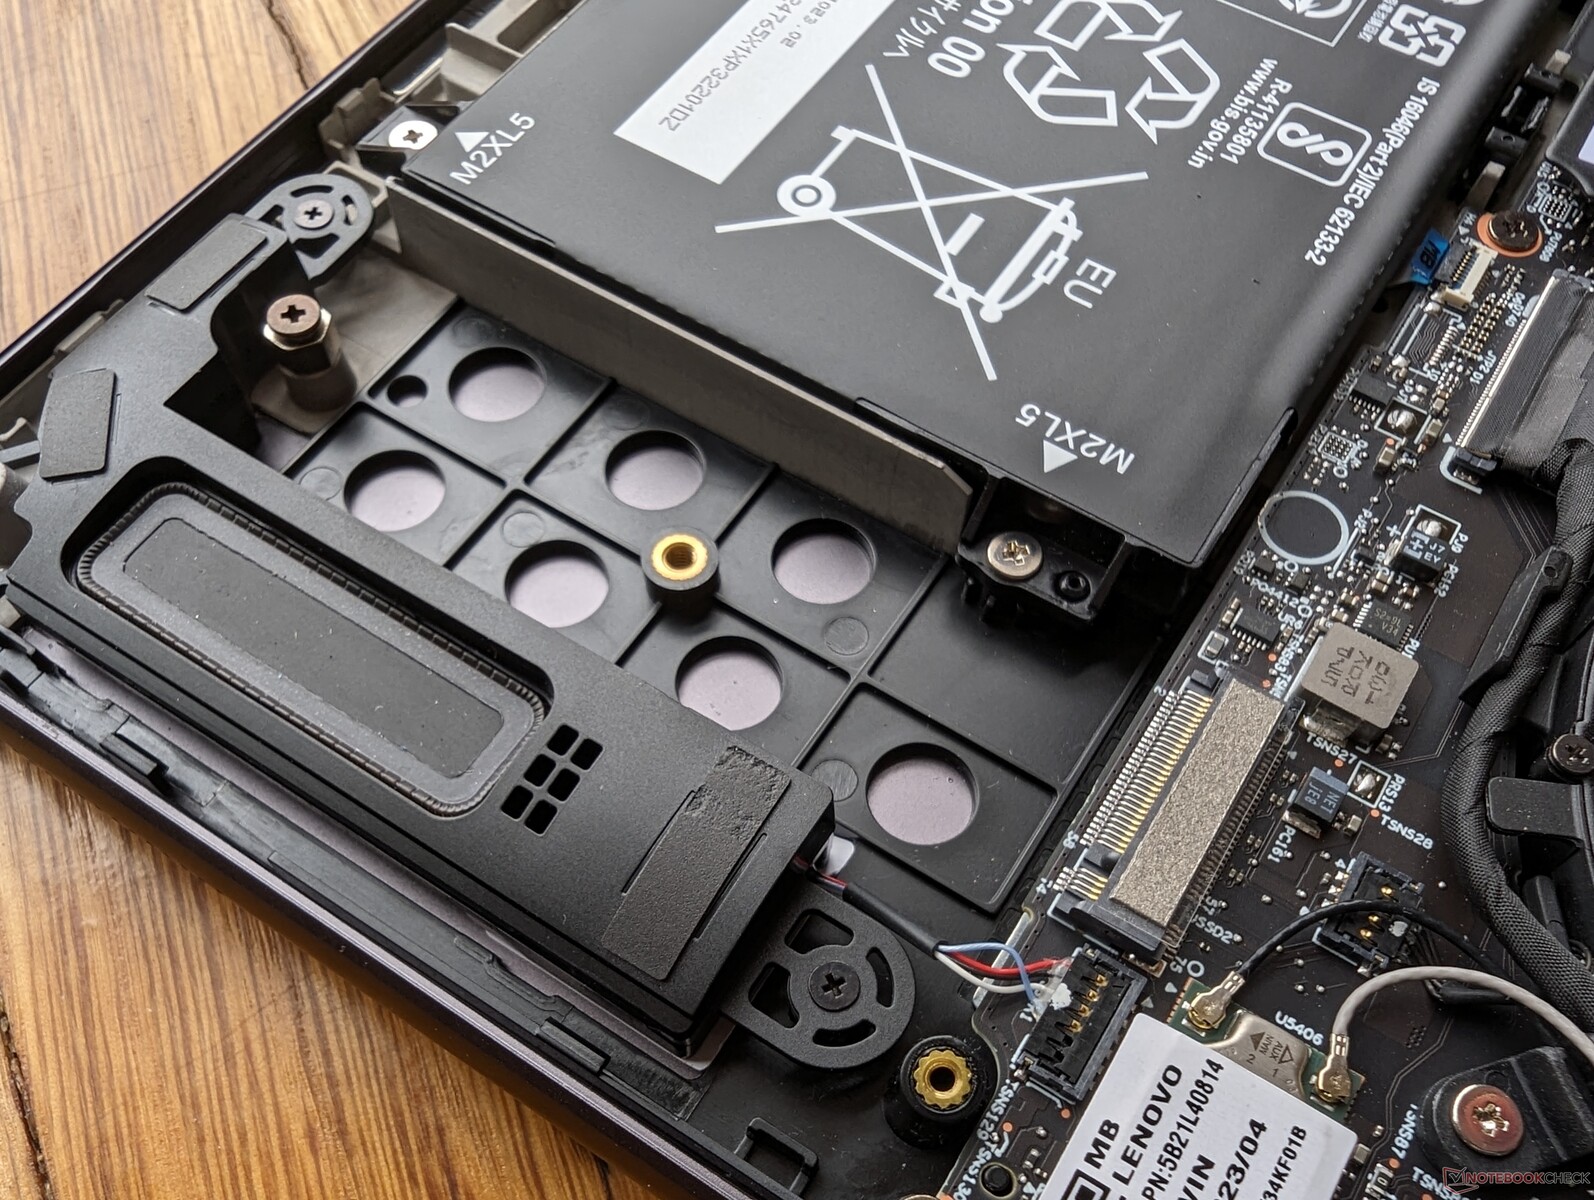
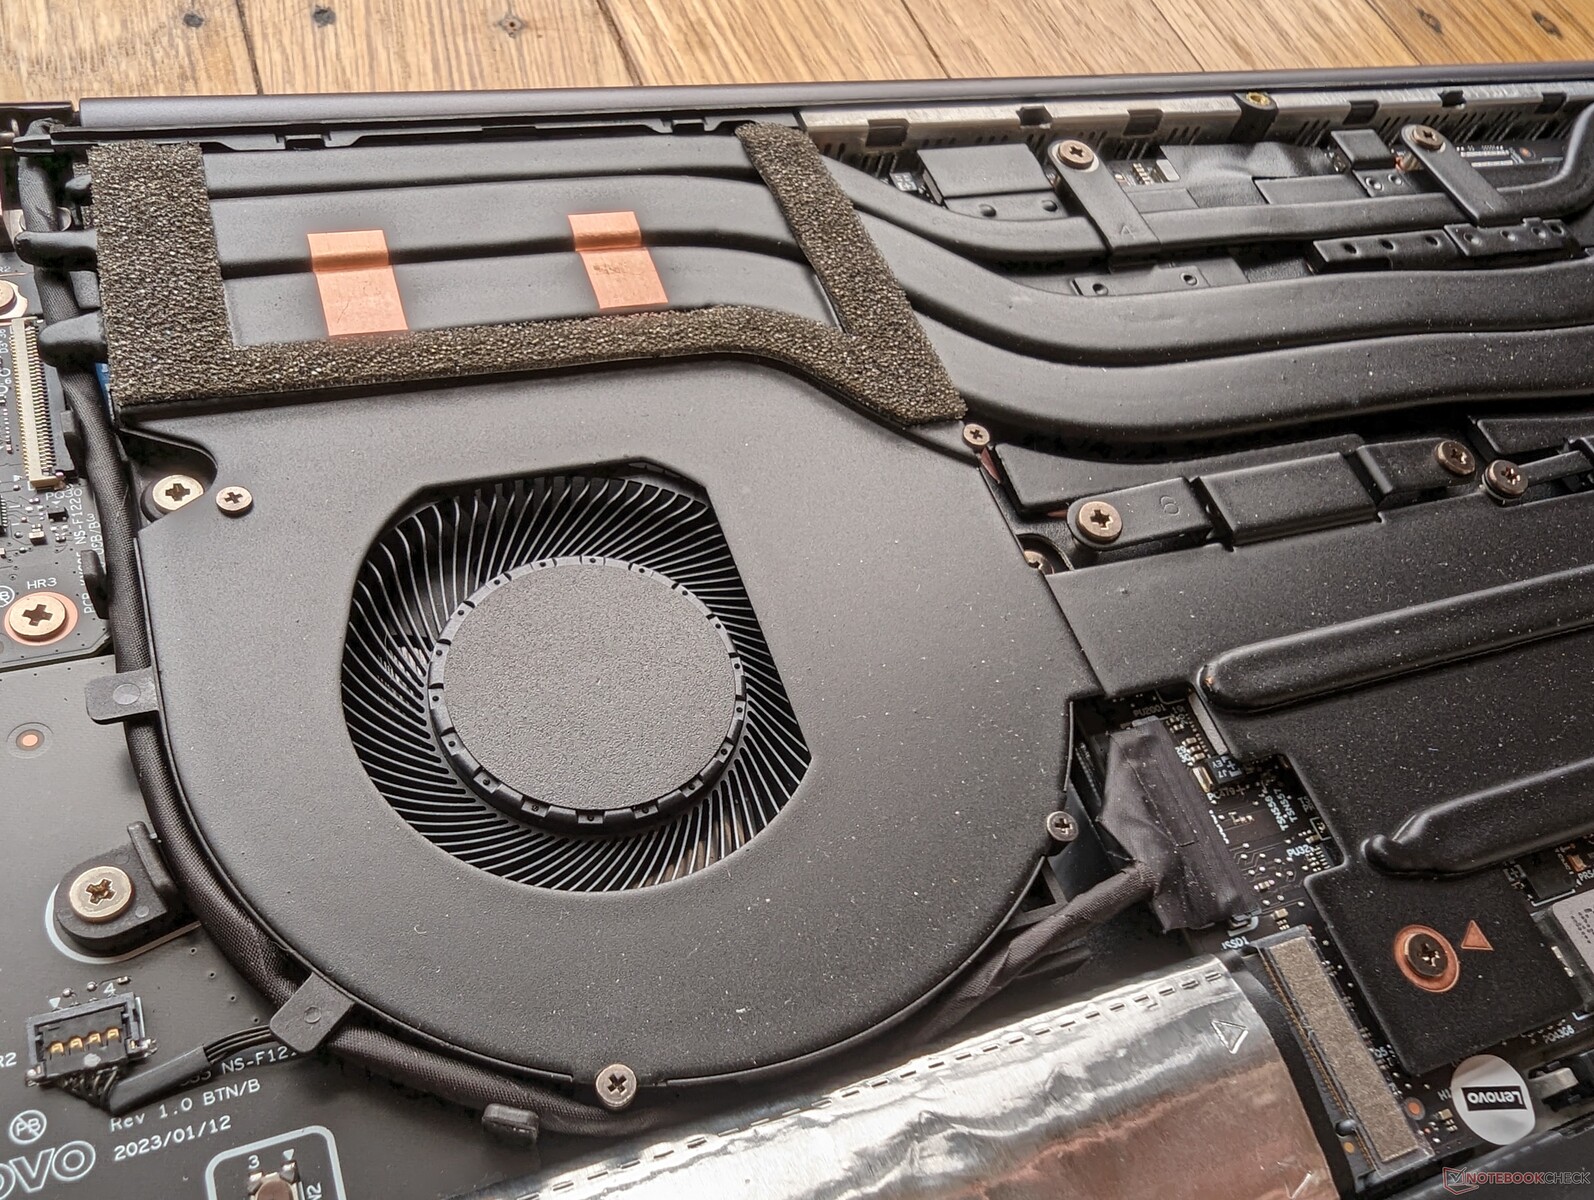
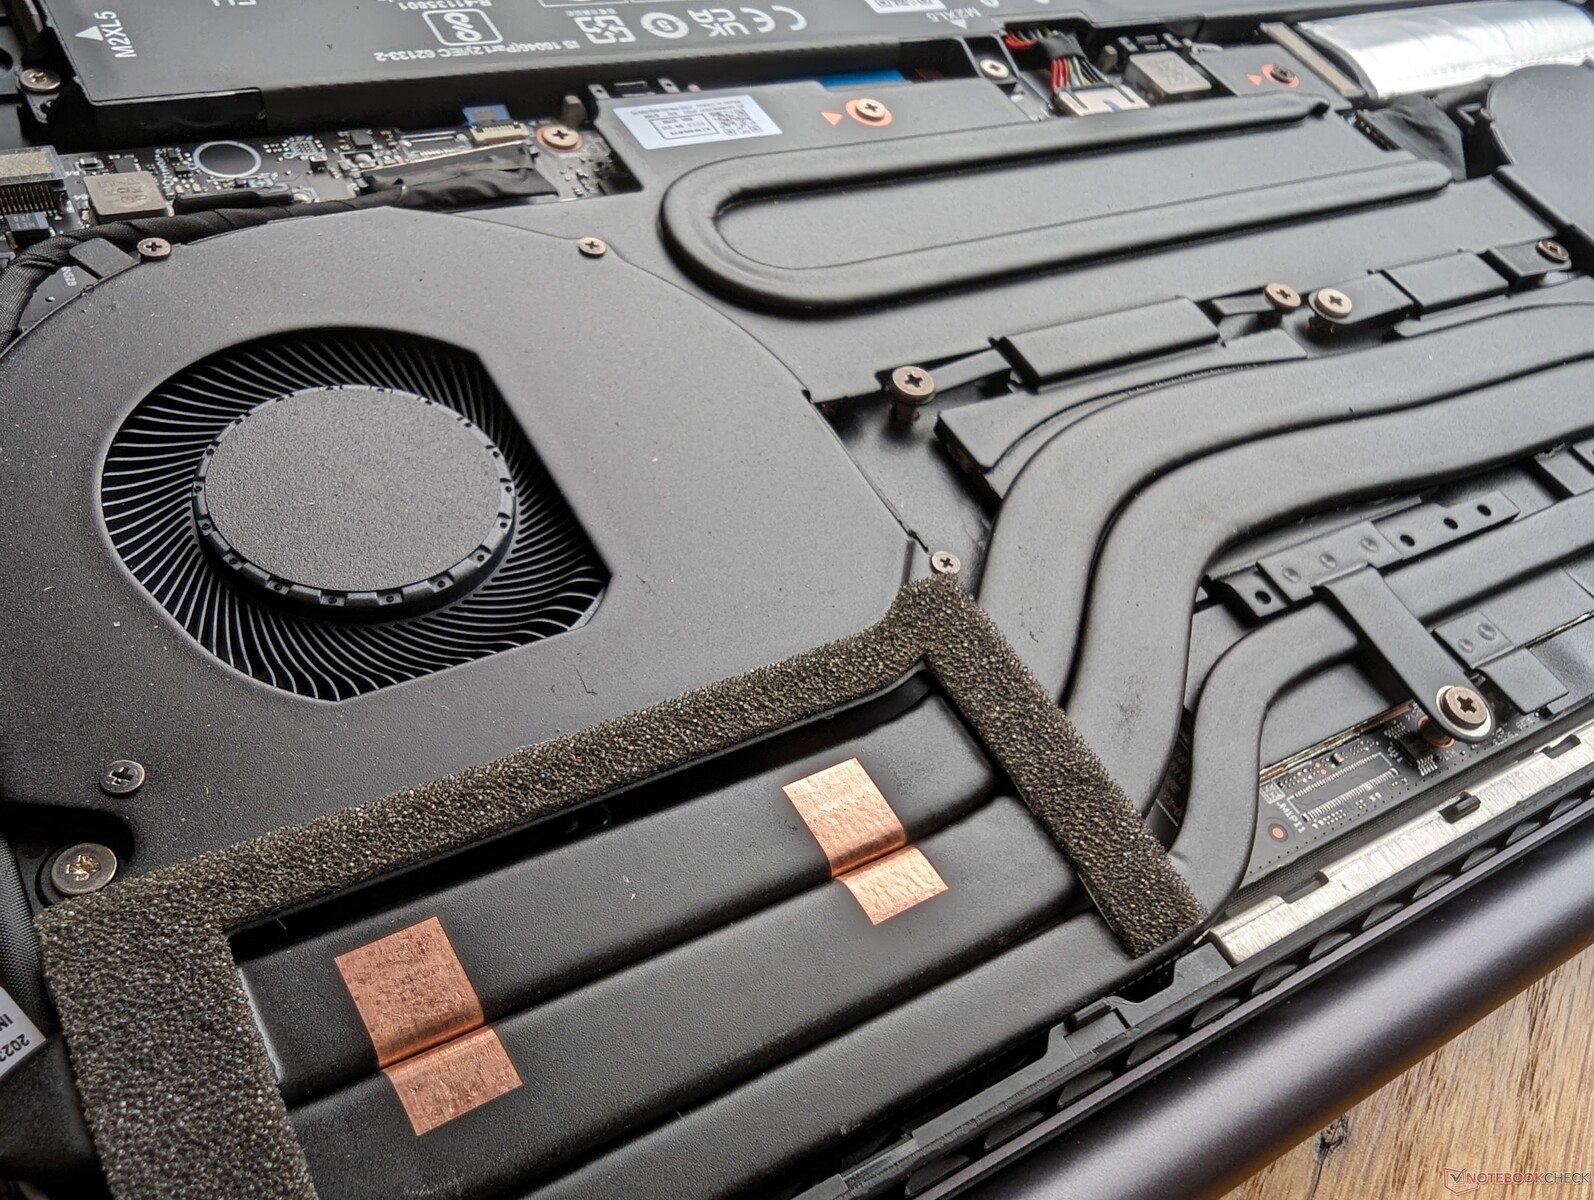
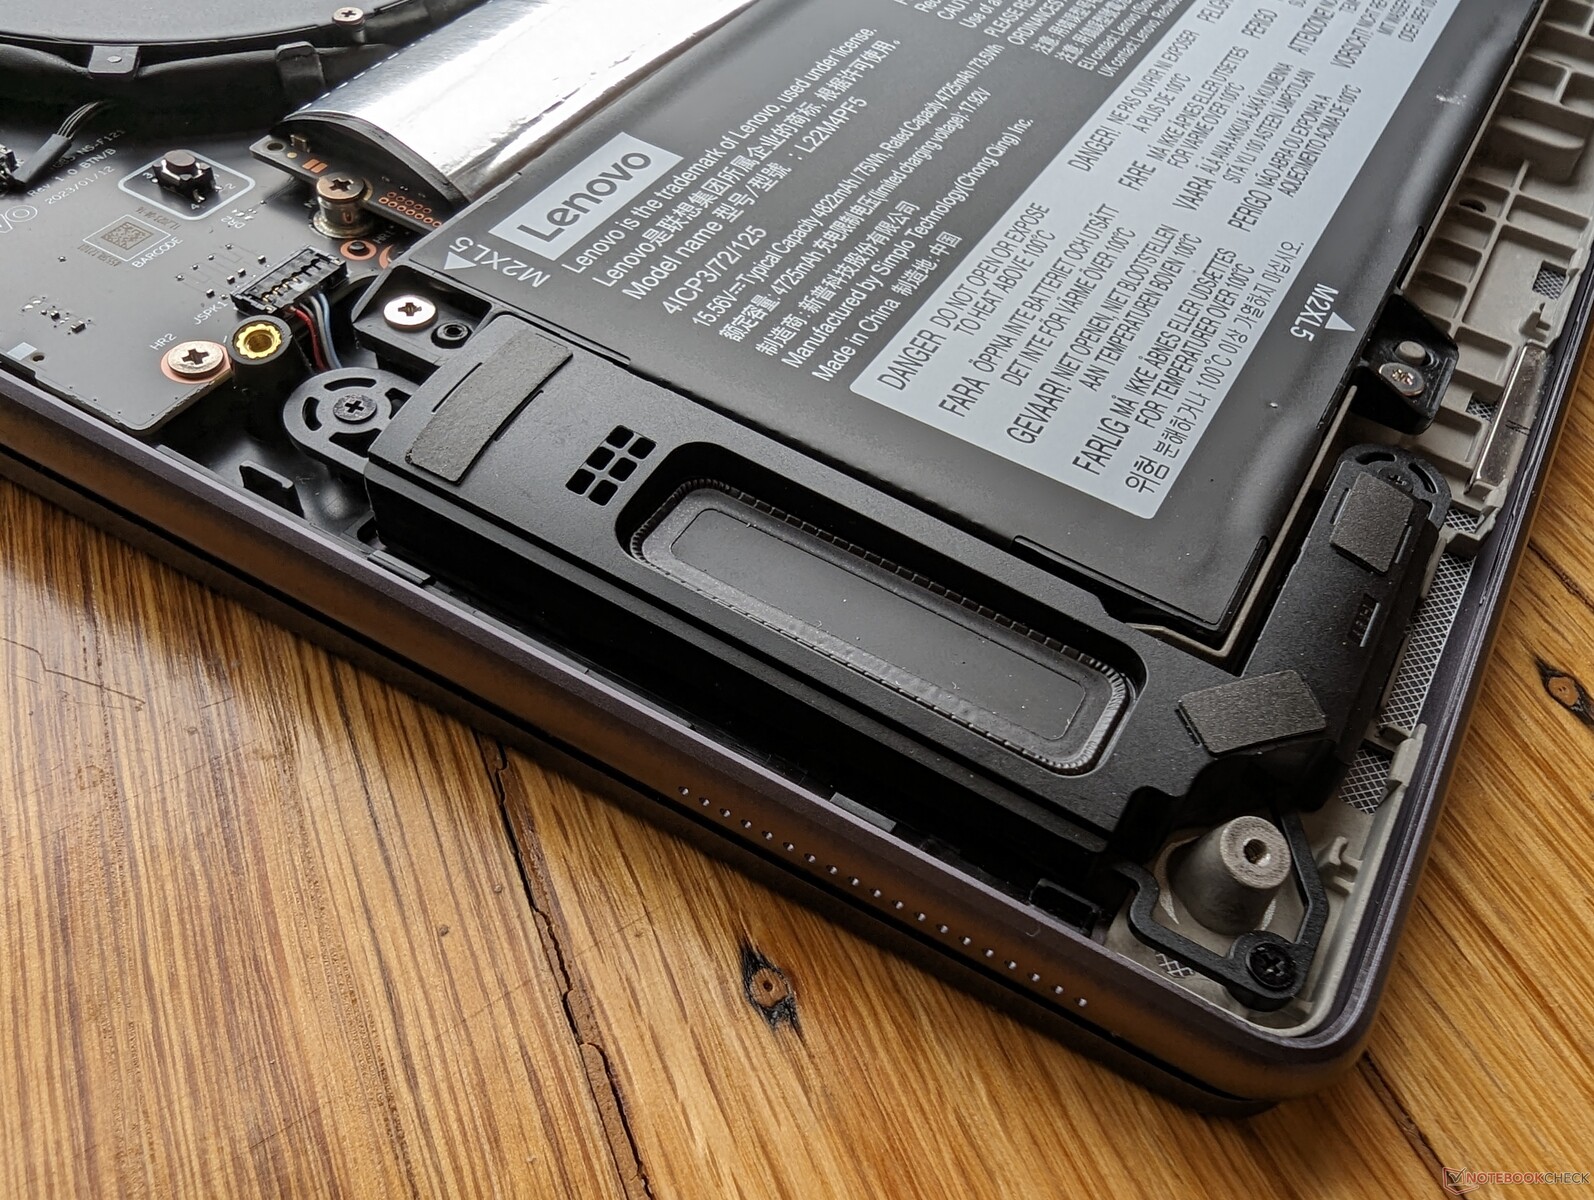
Onderhoud
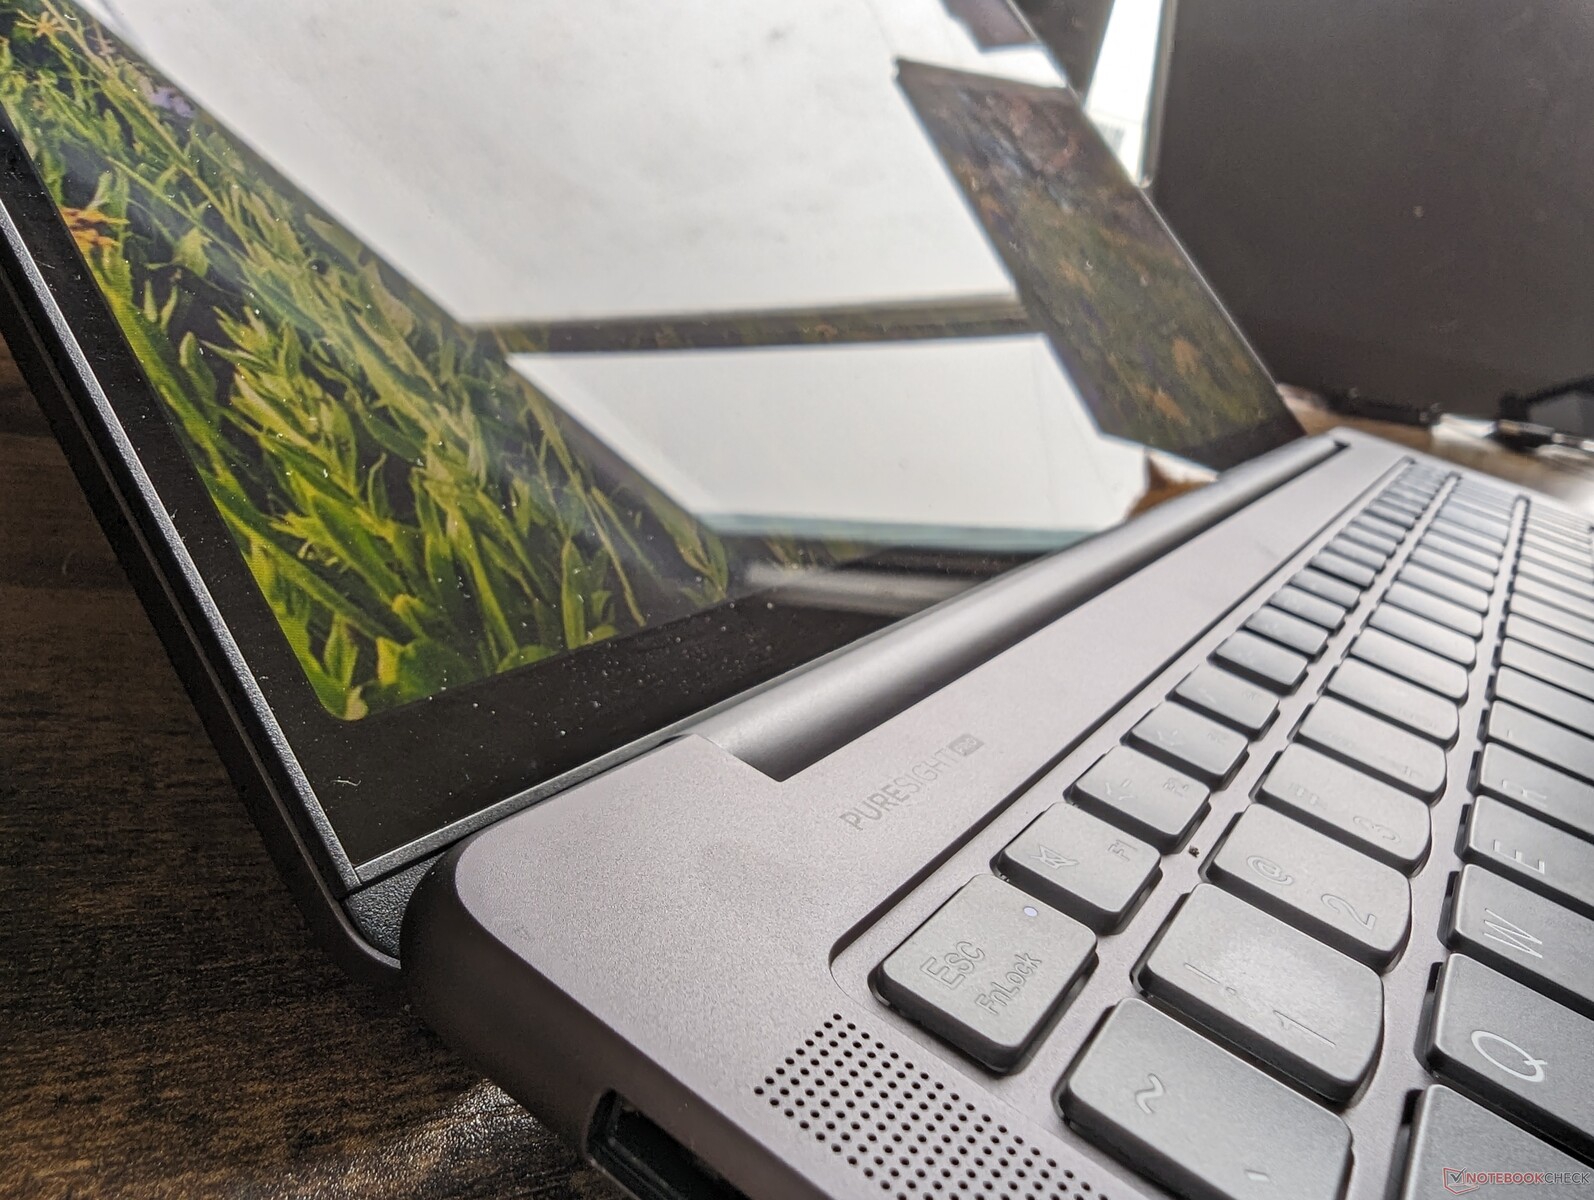
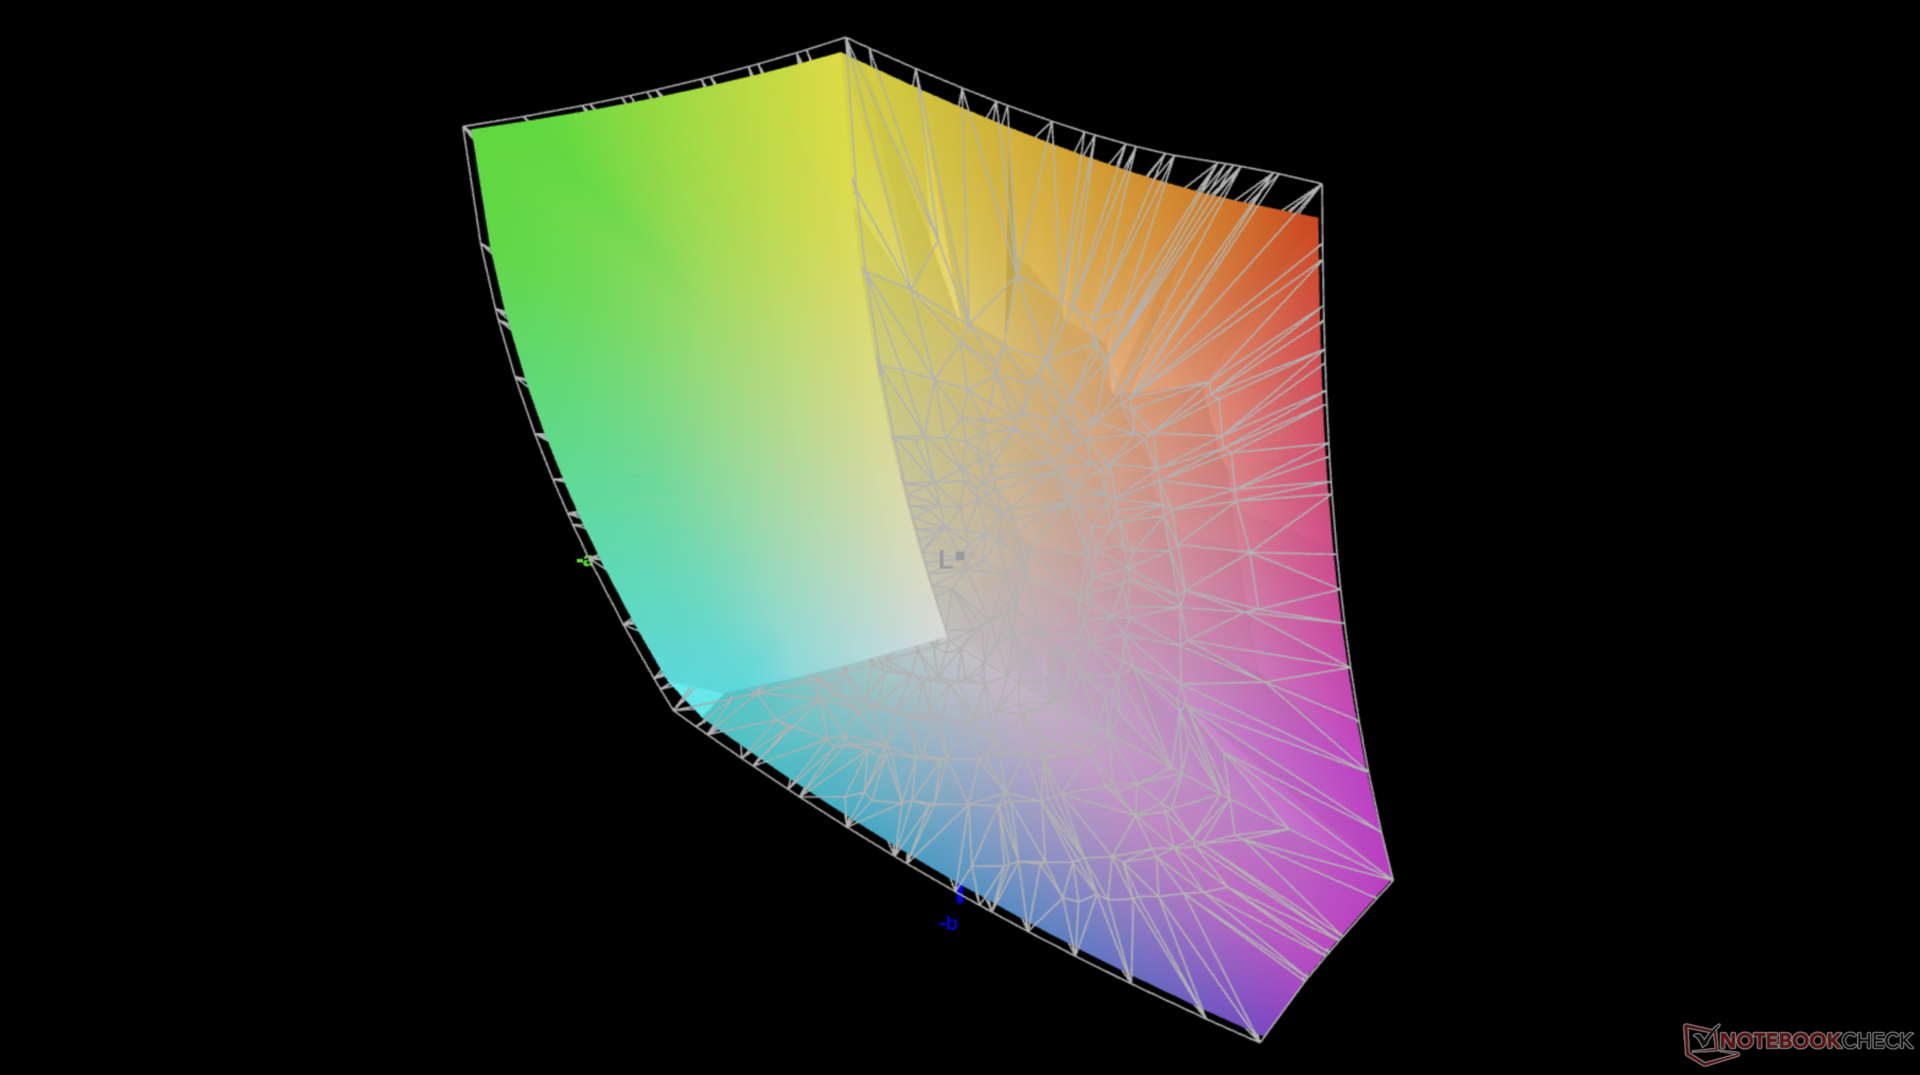
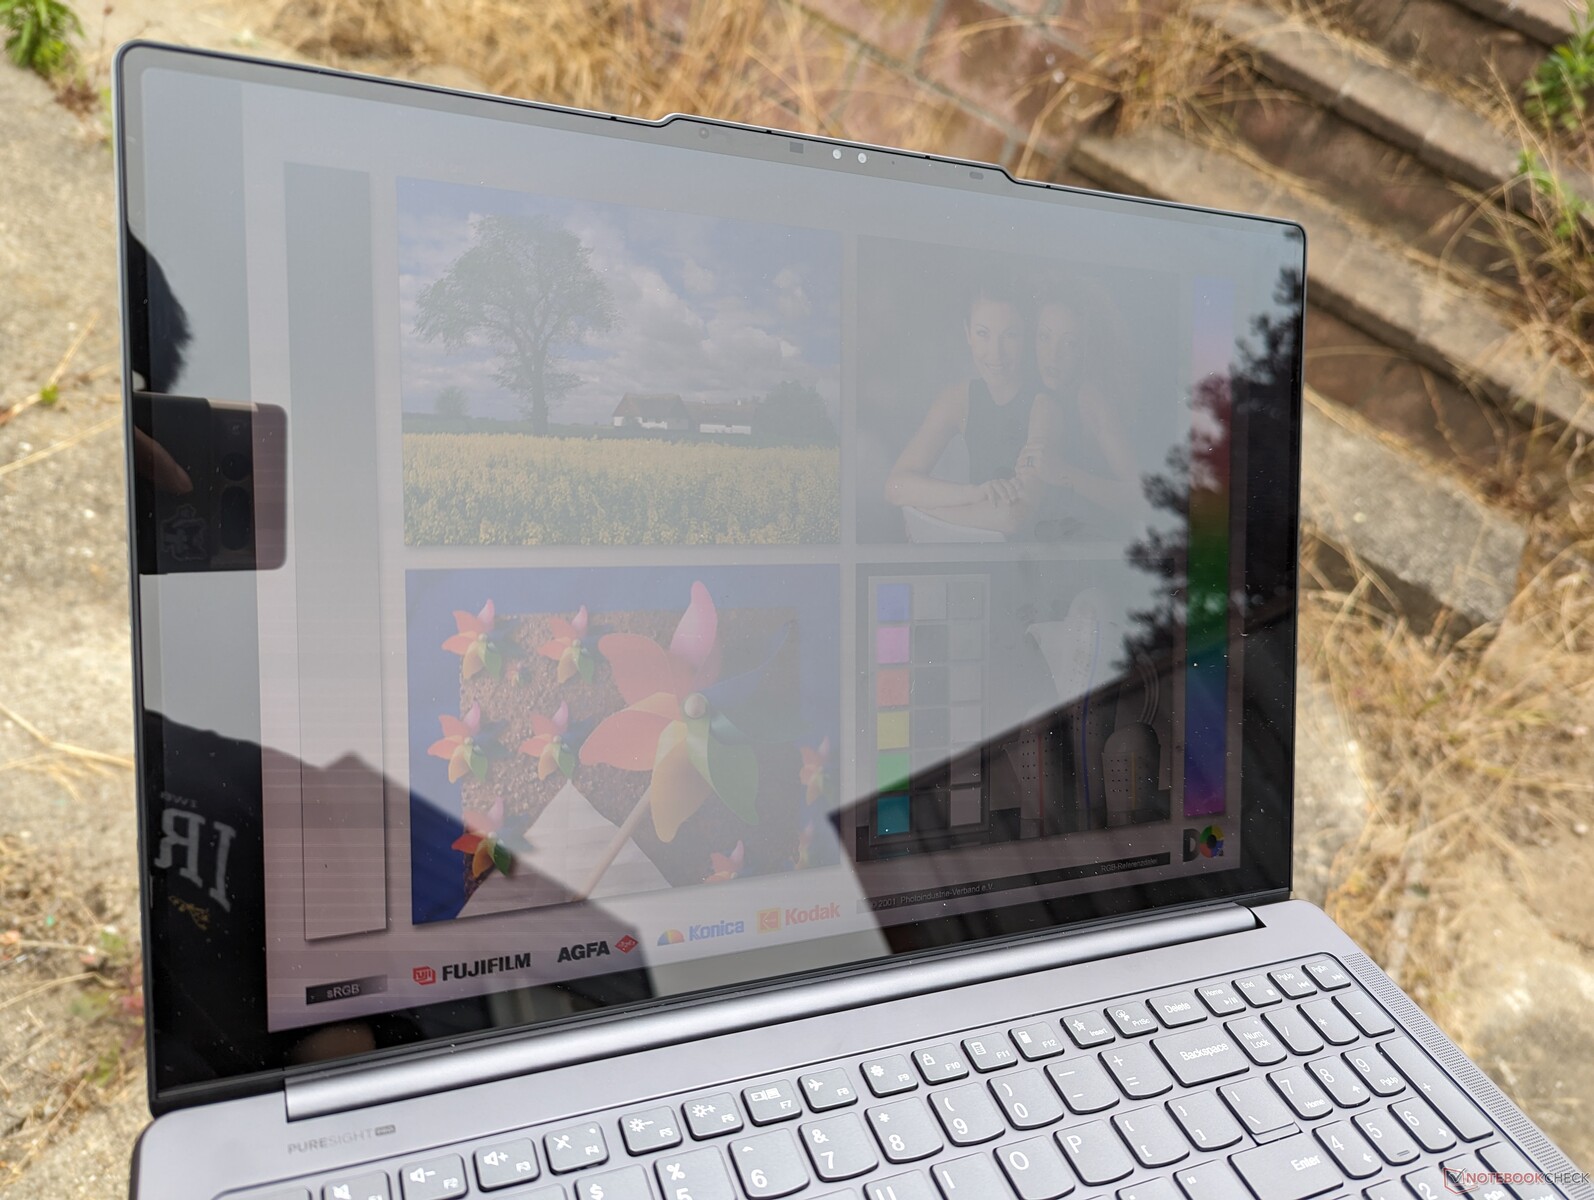
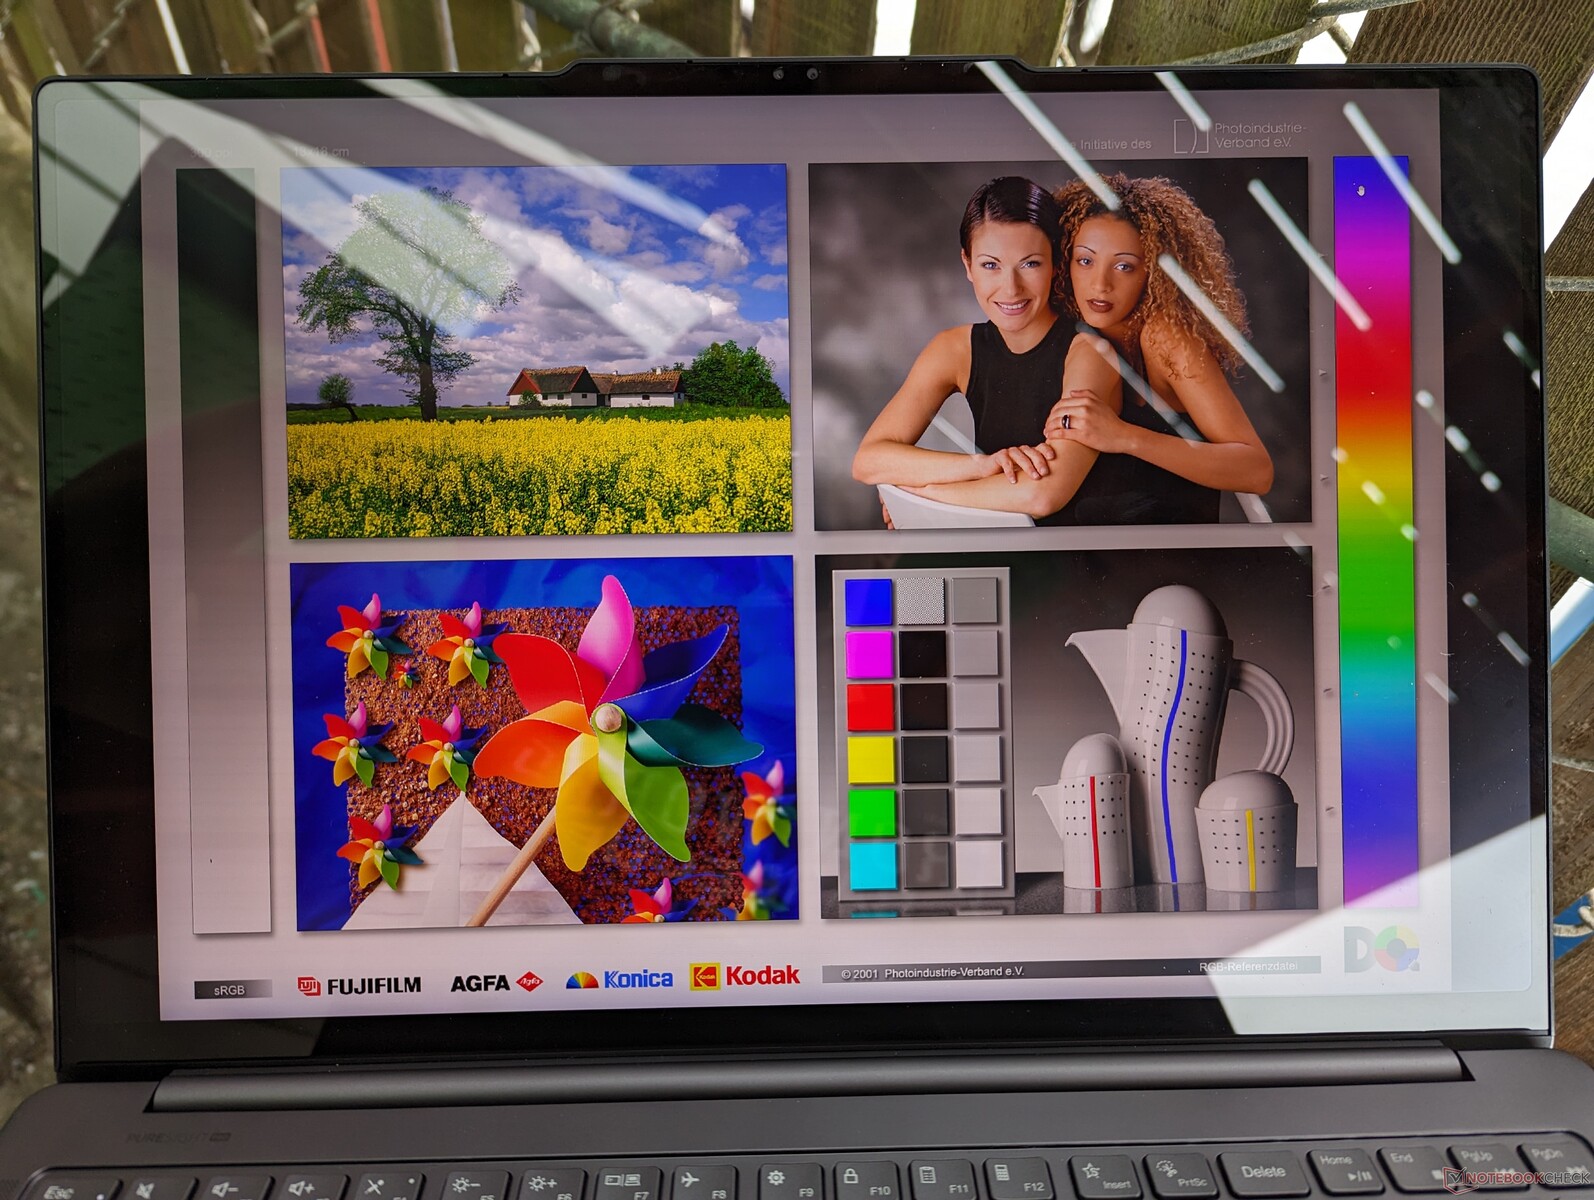
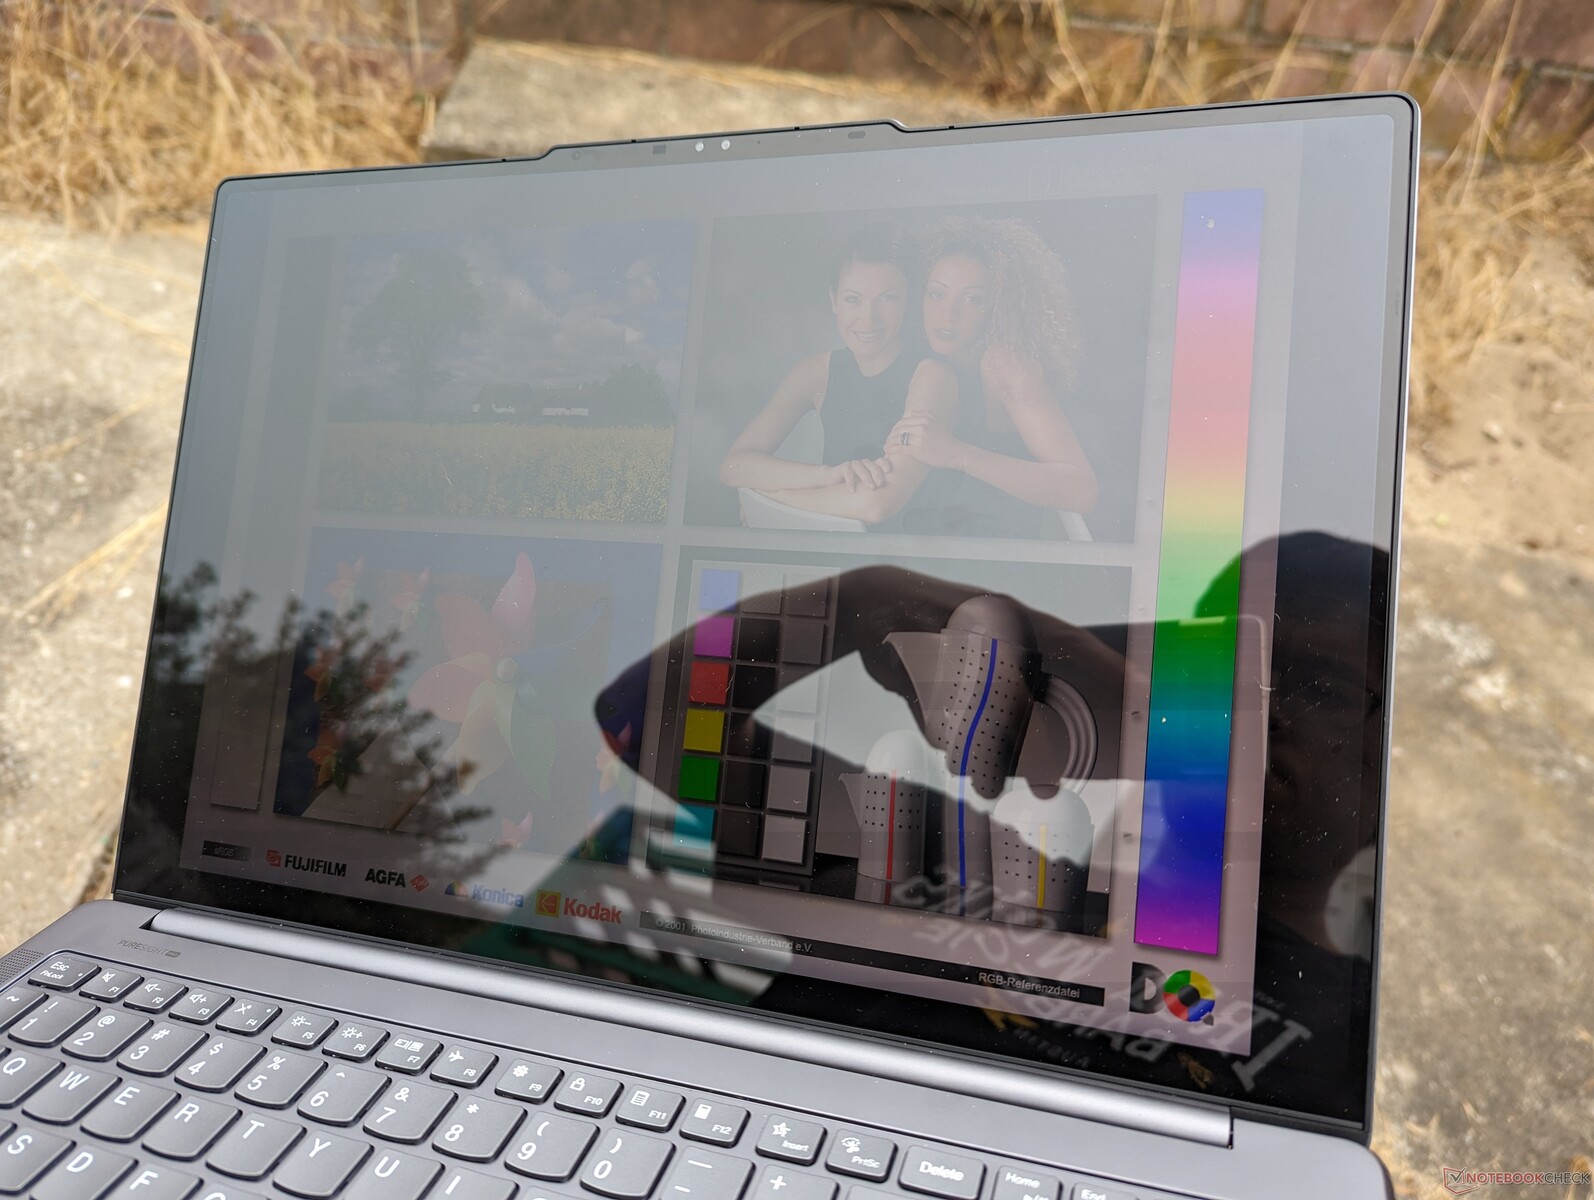
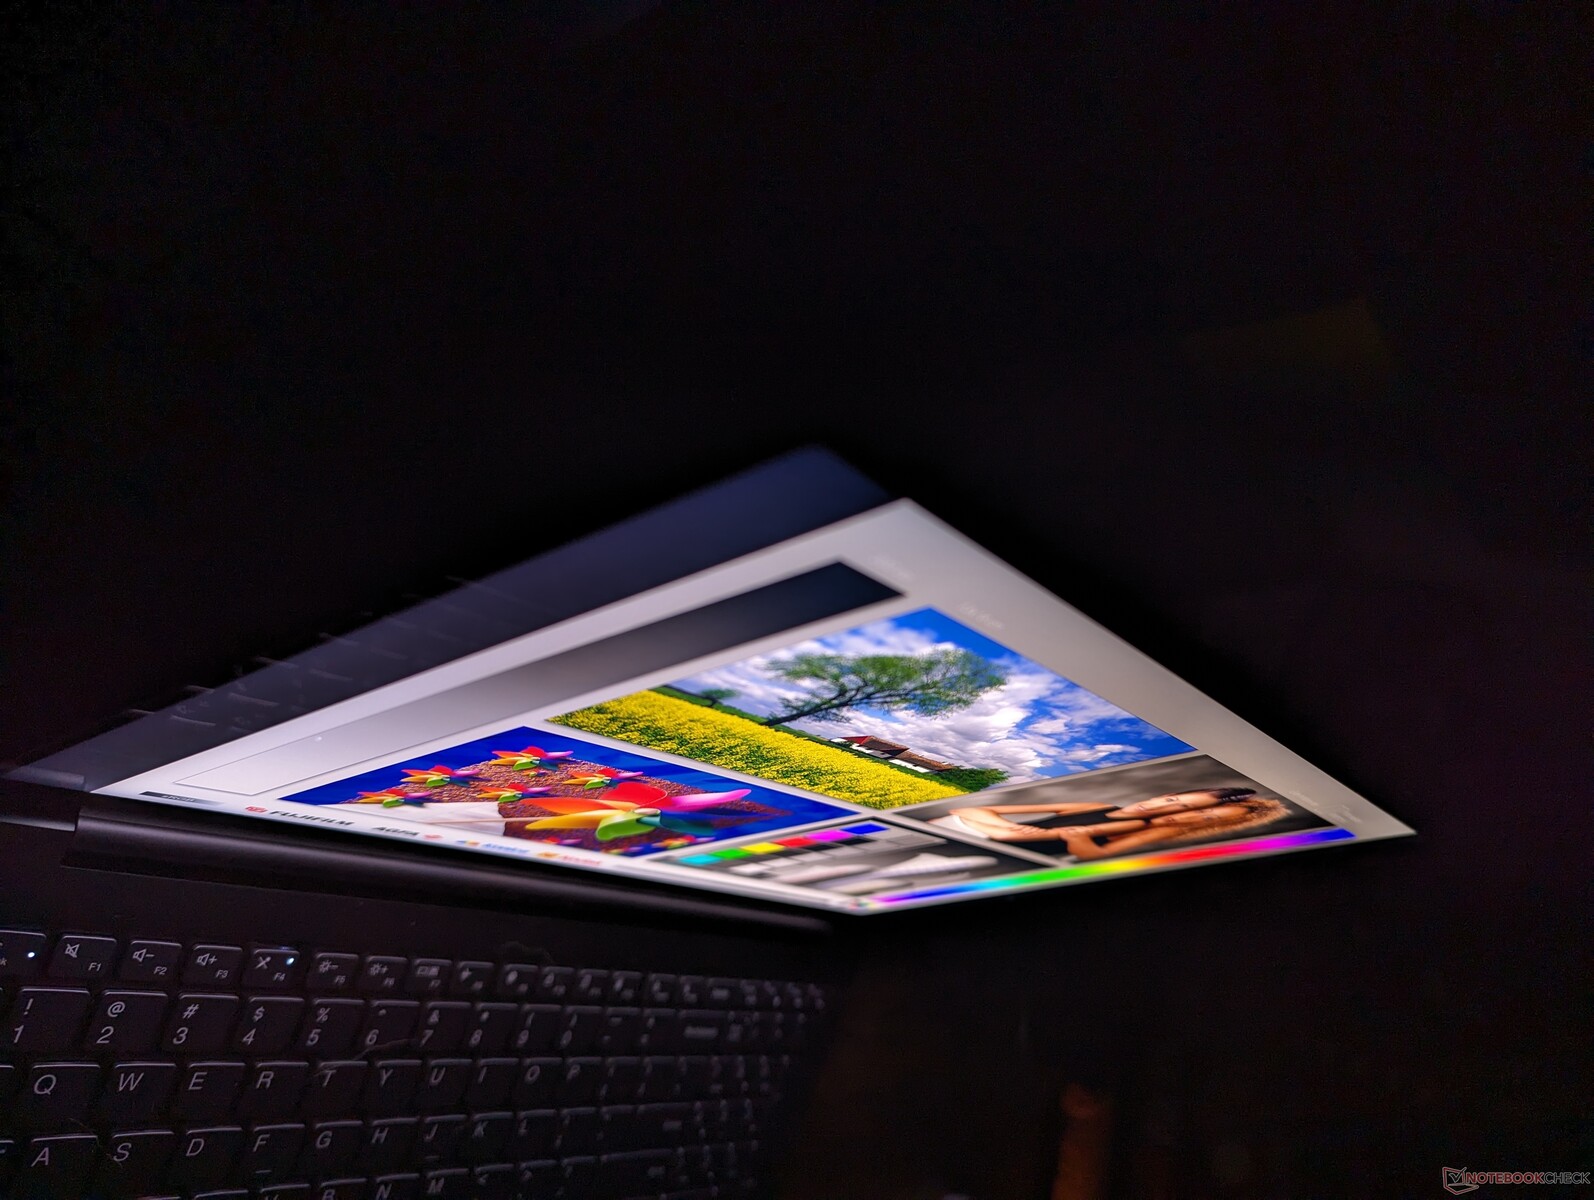
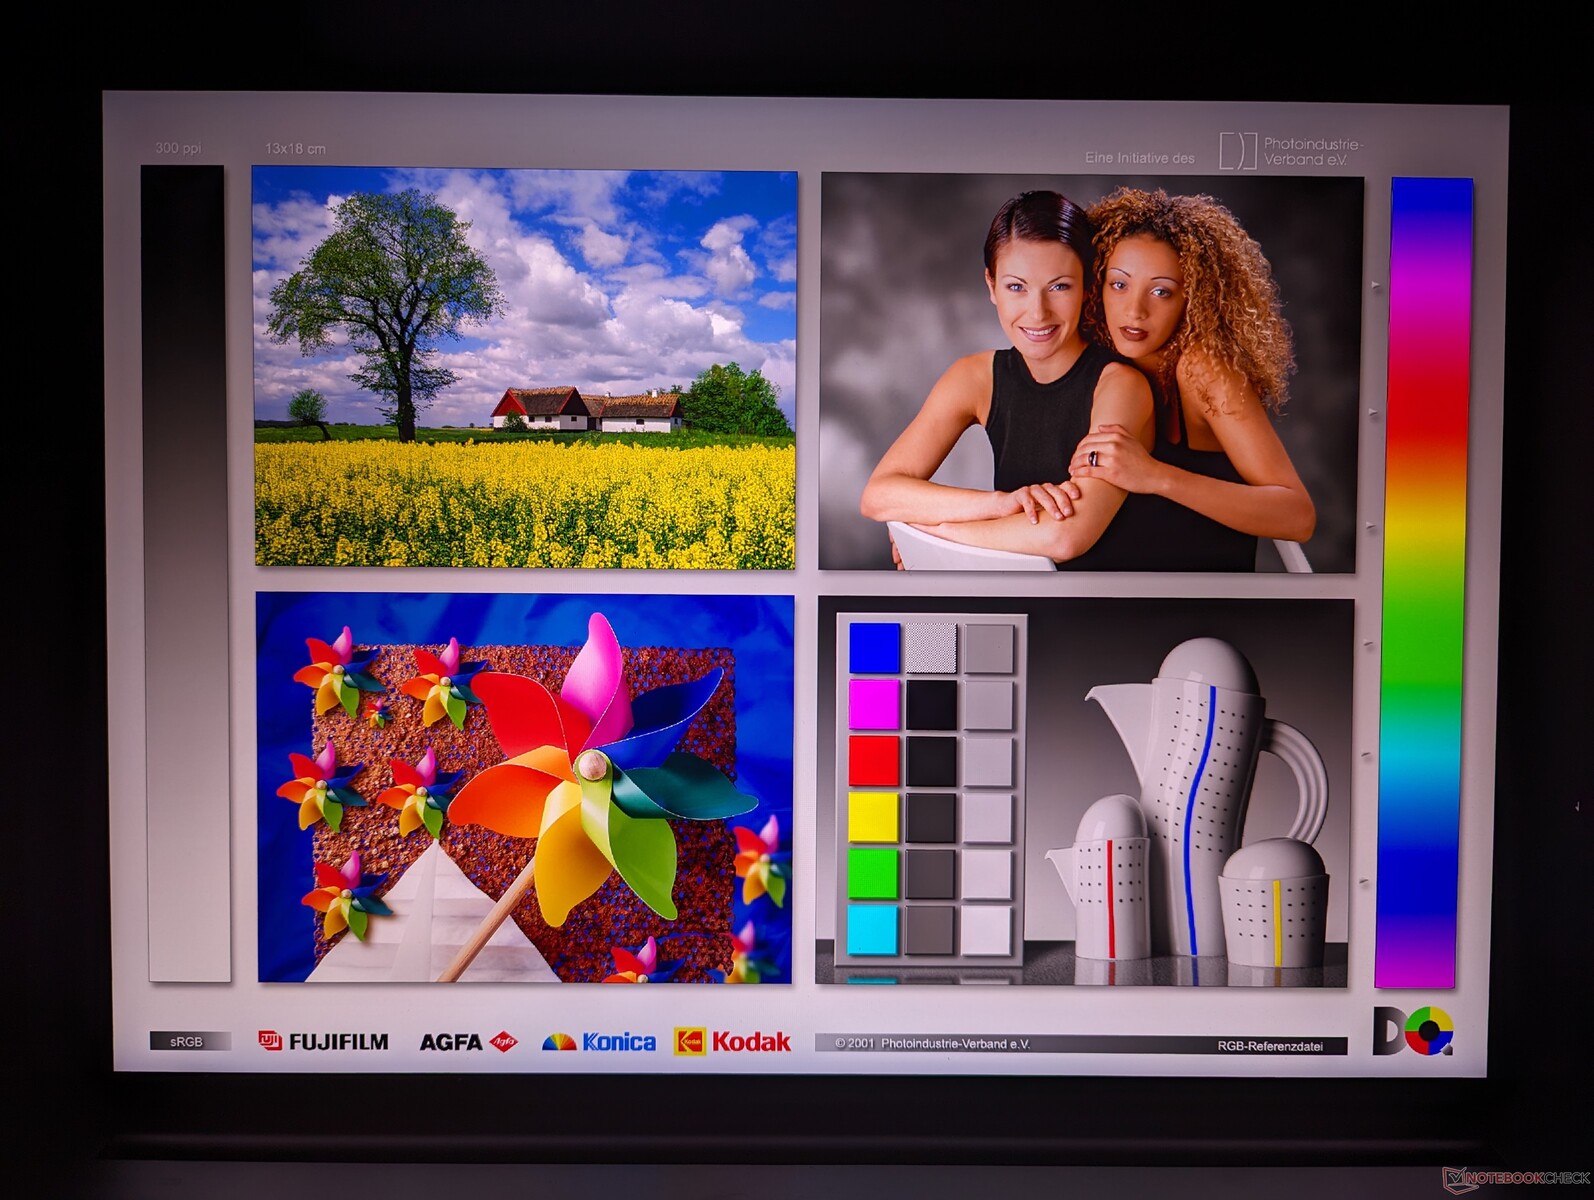
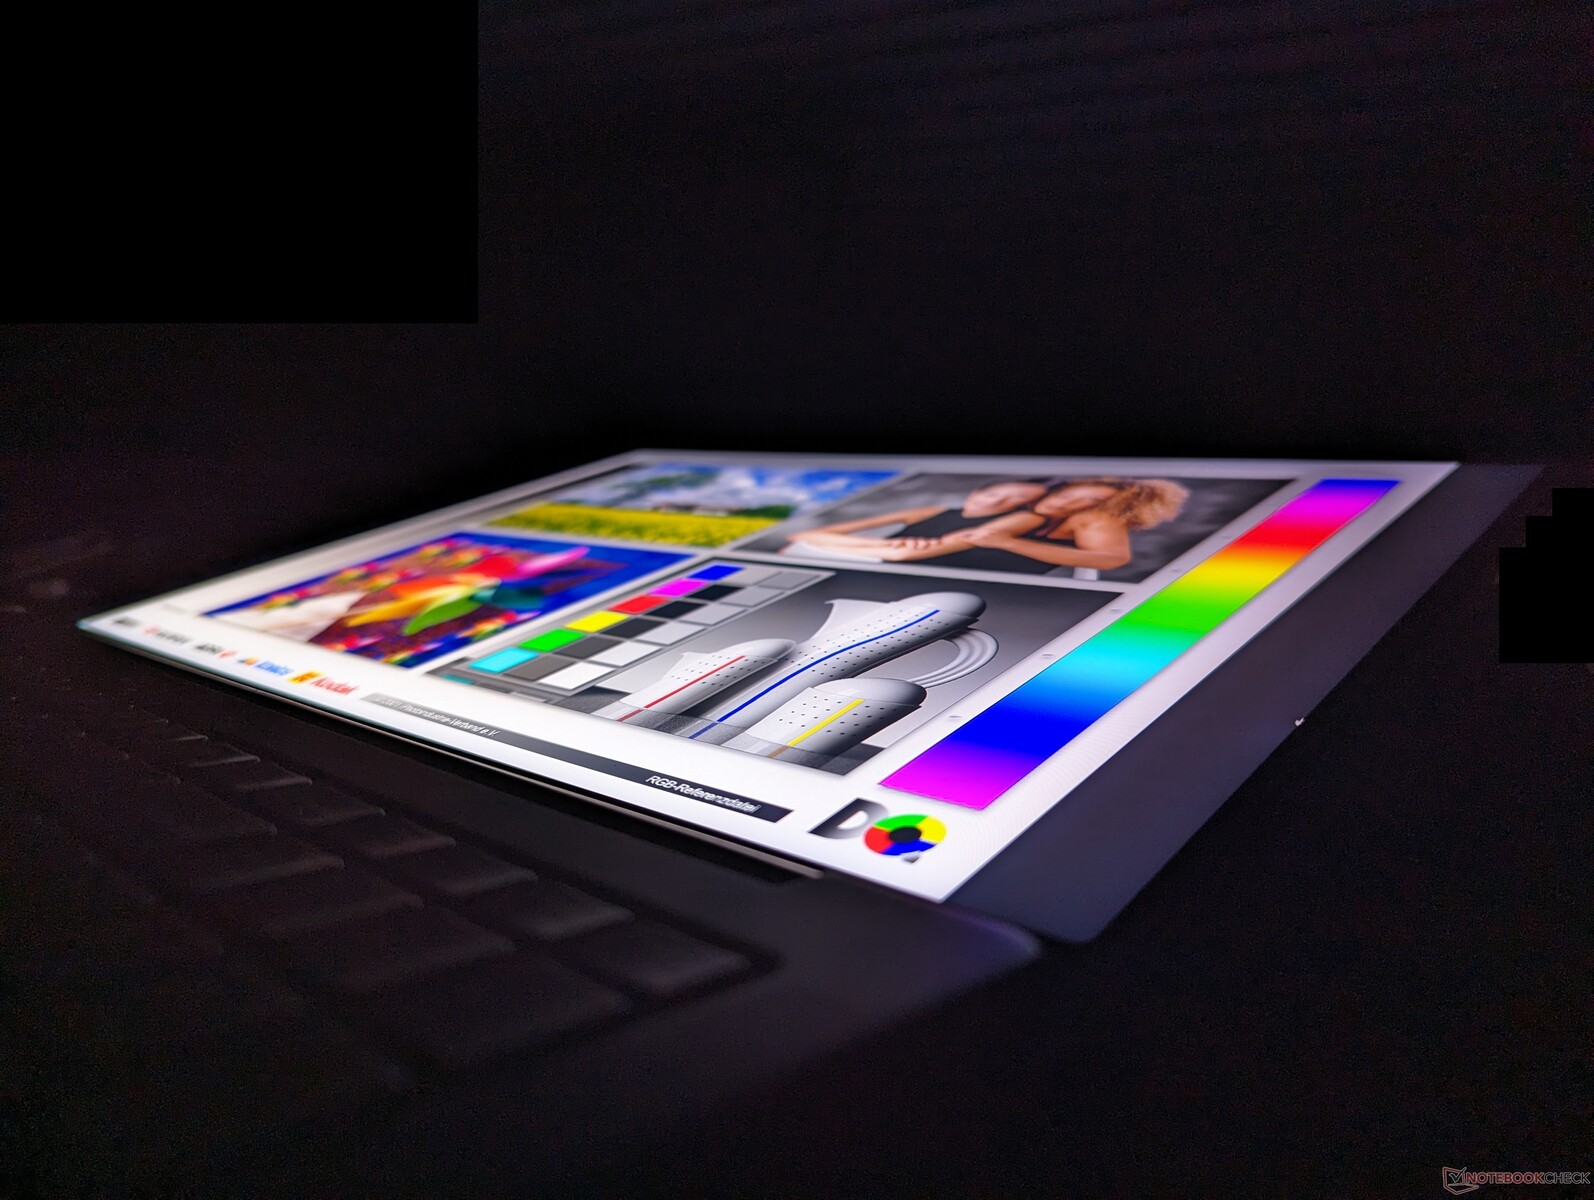
Beeldscherm - 100% DCI-P3, 165 Hz, mini-LED, weinig blauw licht, 3,2K
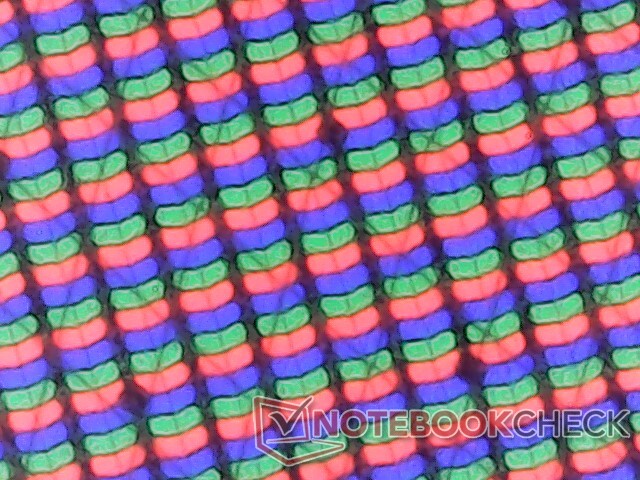
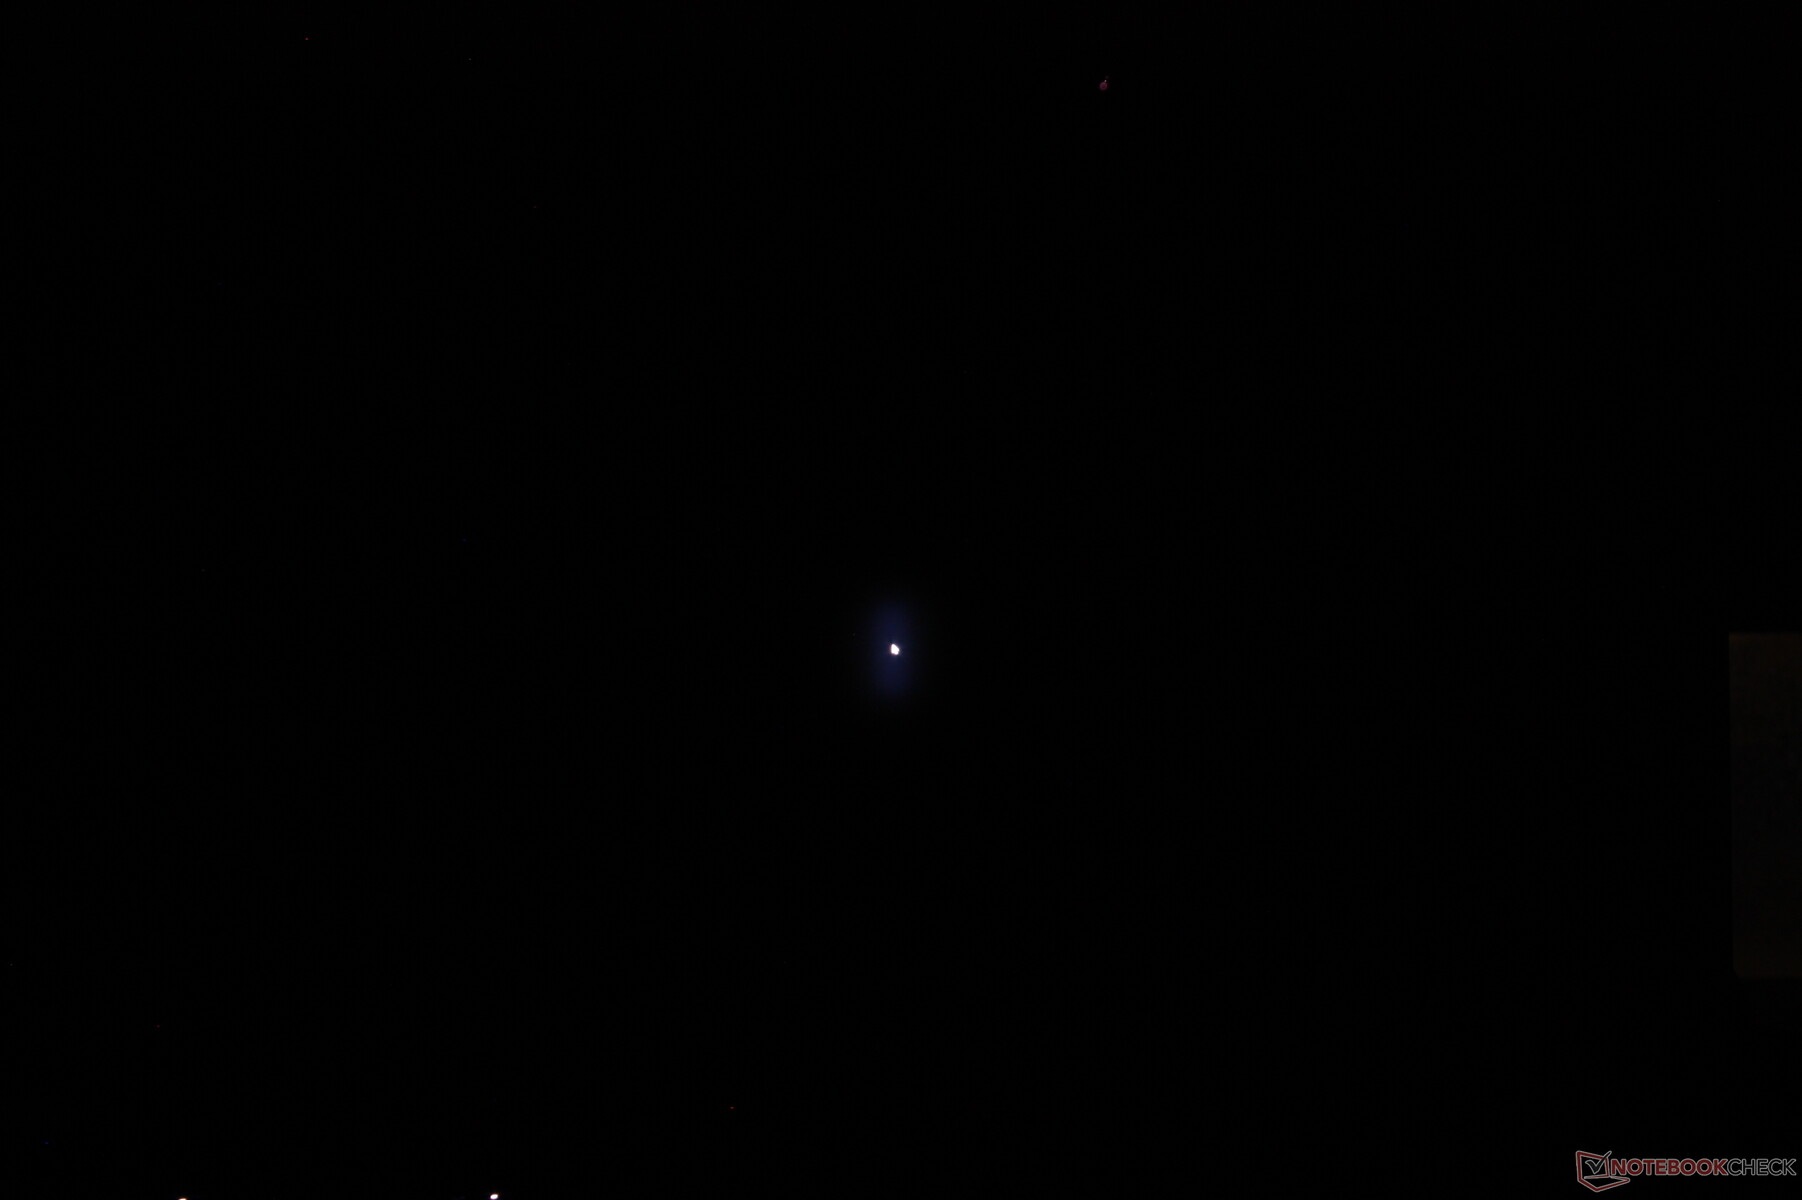
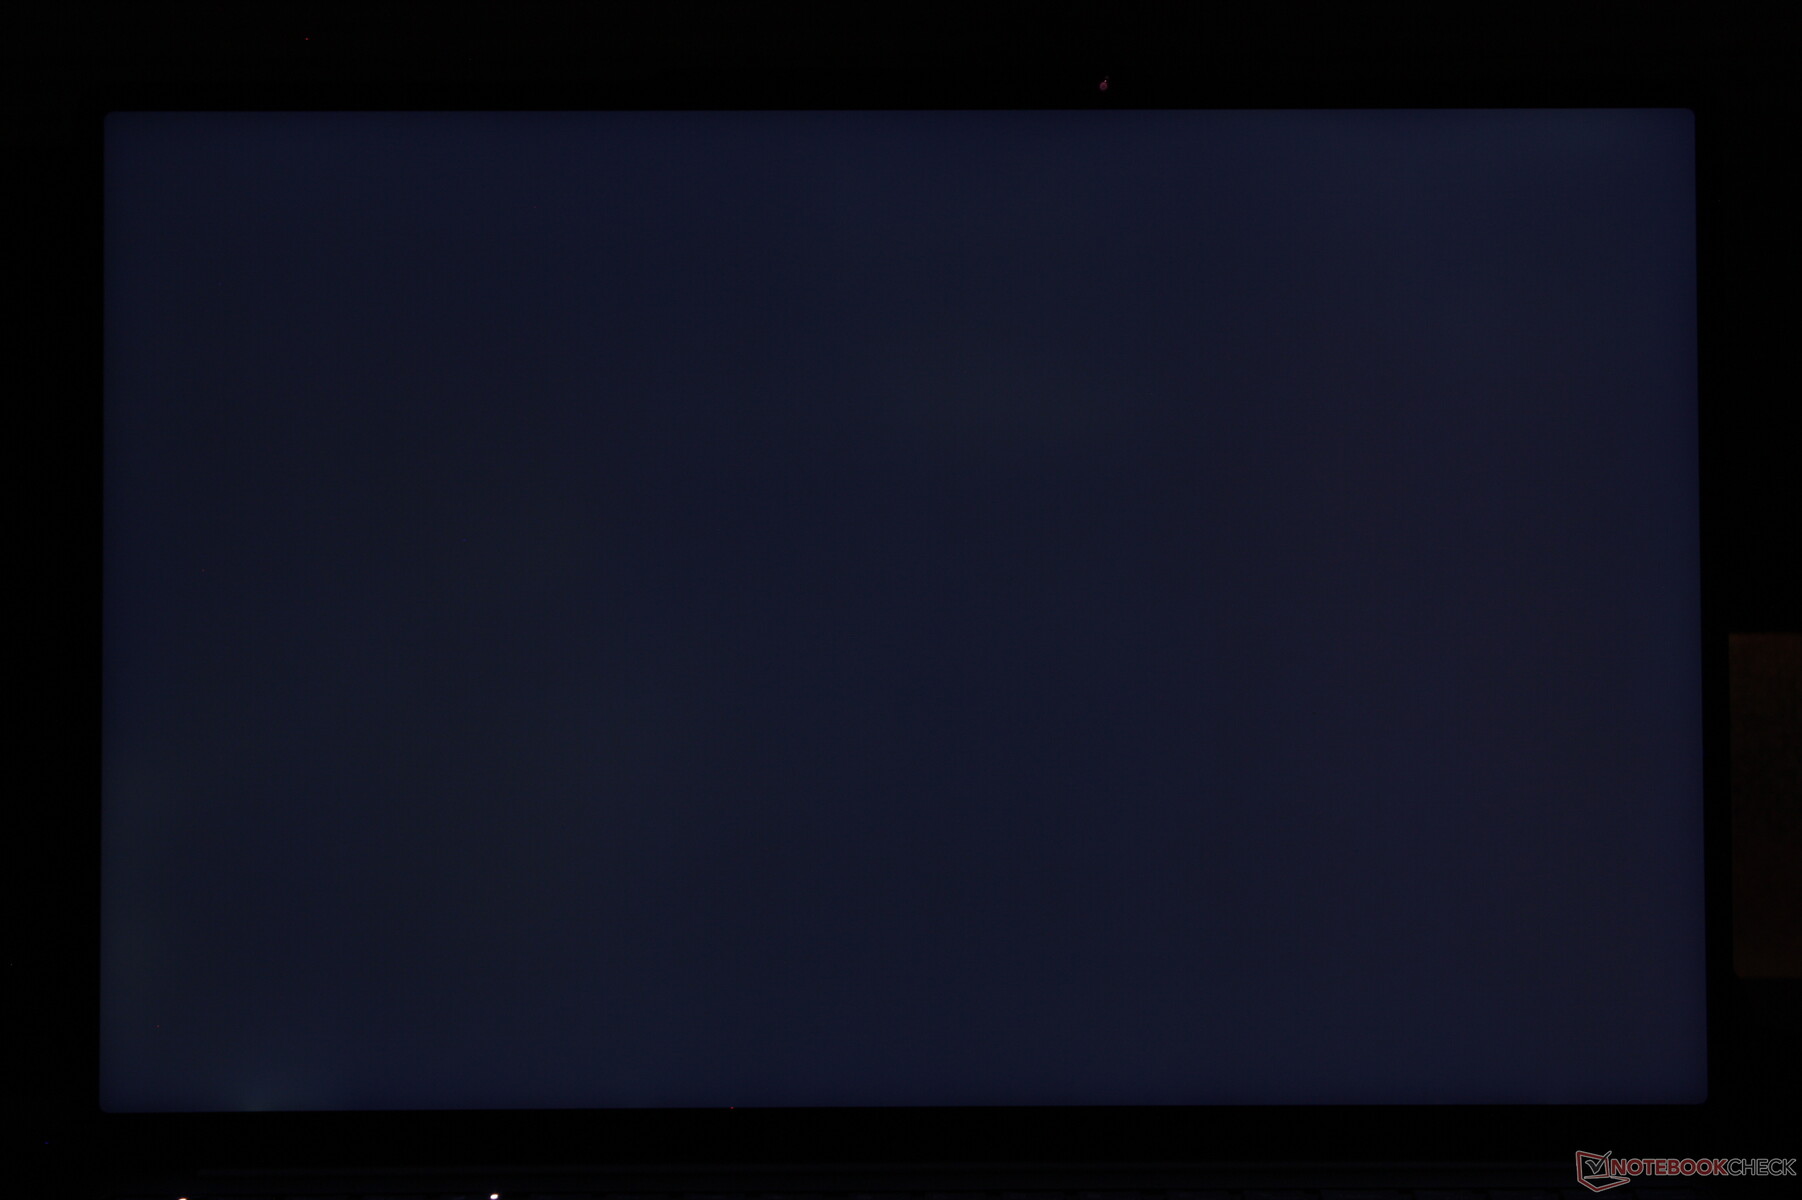
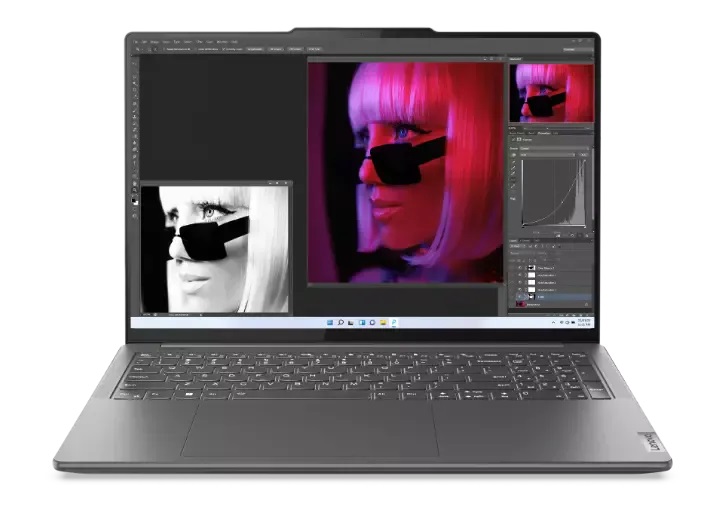
Mini-LED combineert de voordelen van goedkopere IPS en duurdere OLED. Het biedt zeer snelle oorspronkelijke vernieuwingsfrequenties van IPS met de hogere maximale helderheid van OLED via lokaal dimmen voor levendigere kleuren. Het nadeel is echter een merkbaar "halo" effect bij het weergeven van een zeer helder object tegen een zeer donkere achtergrond. Onze schermafbeelding hieronder toont bijvoorbeeld een witte muiscursor tegen een volledig zwarte achtergrond. De cursor zou scherp zijn met gedefinieerde randen op een OLED-paneel, maar in plaats daarvan gloeit hij op mini-LED omdat het lokale dimmen niet perfect is.
De maximale helderheid is beperkt tot ongeveer 600 nits bij weergave van een volledig wit beeld. Bij het uitvoeren van deze HDR-testkunnen we echter een hogere maximale helderheid van 1330 nits meten, wat in lijn is met Lenovo's claim van 1200 nits.
| |||||||||||||||||||||||||
Helderheidsverdeling: 95 %
Helderheid in Batterij-modus: 627.4 cd/m²
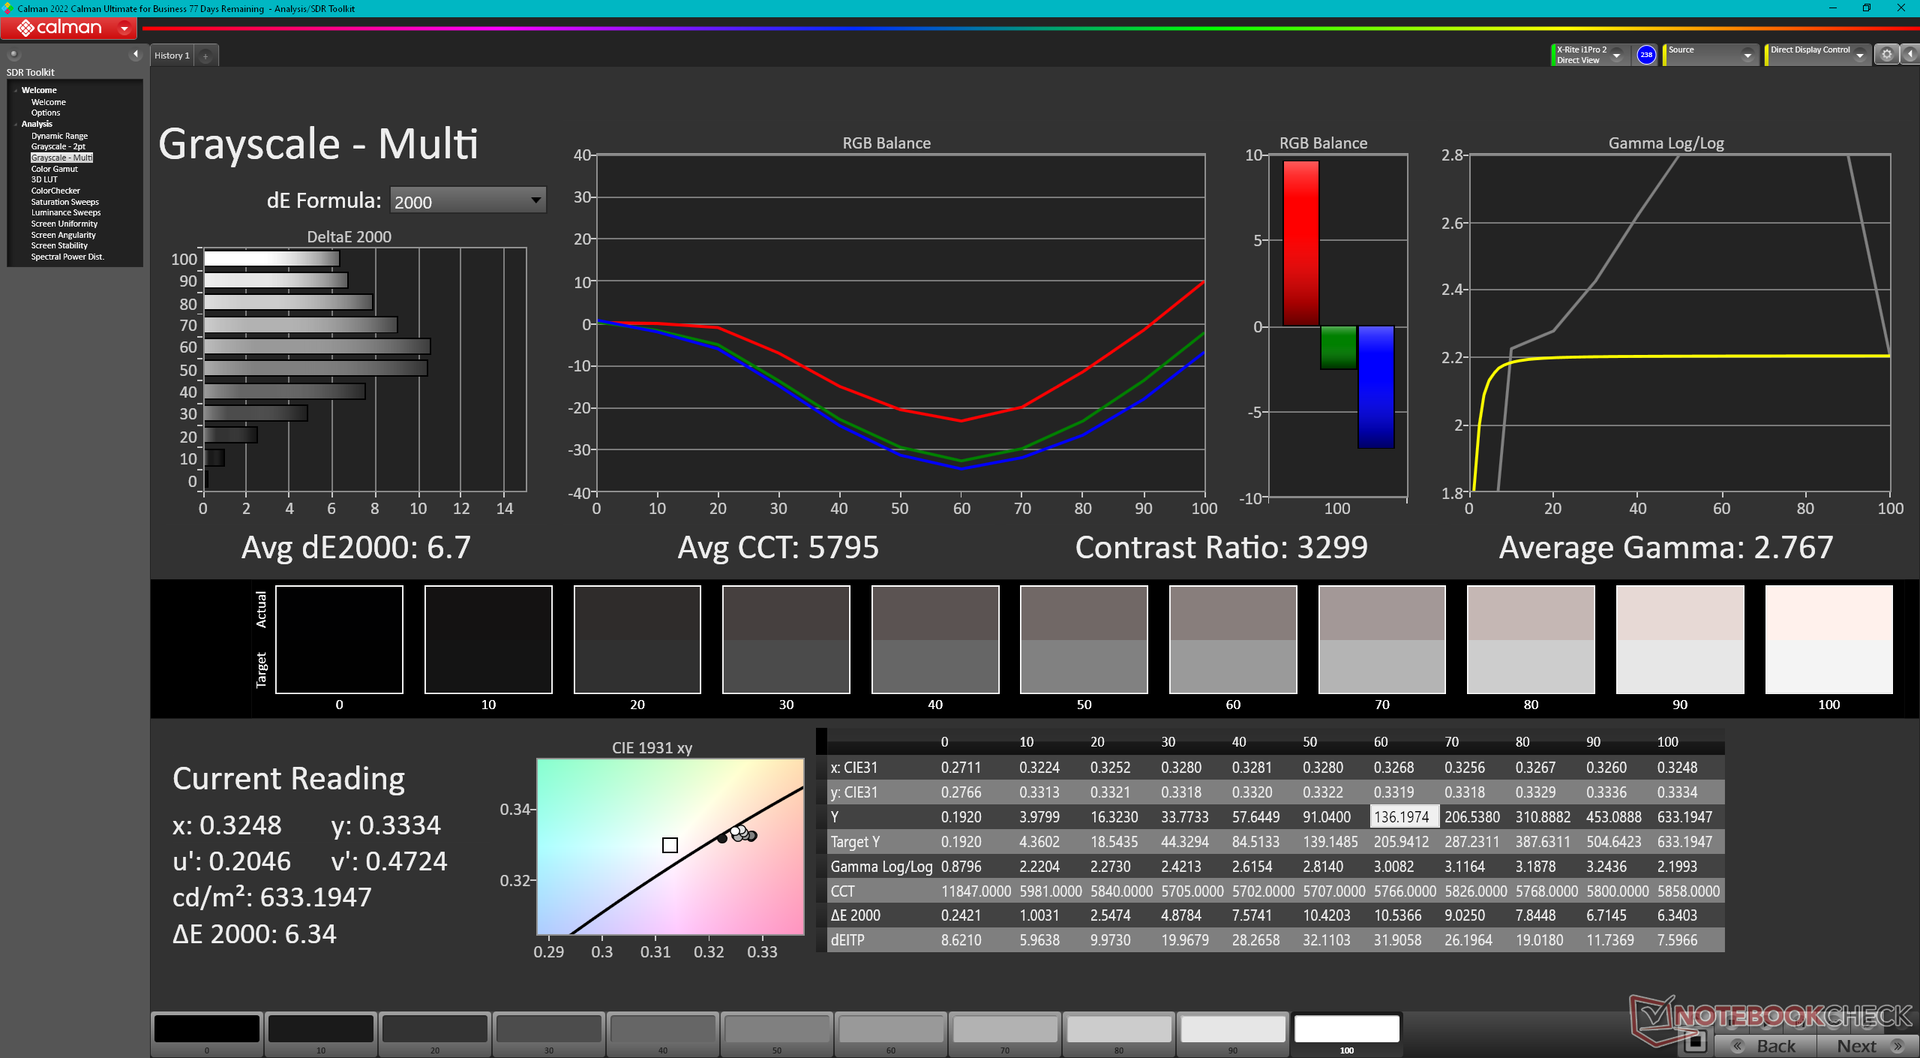
Contrast: 3302:1 (Zwart: 0.19 cd/m²)
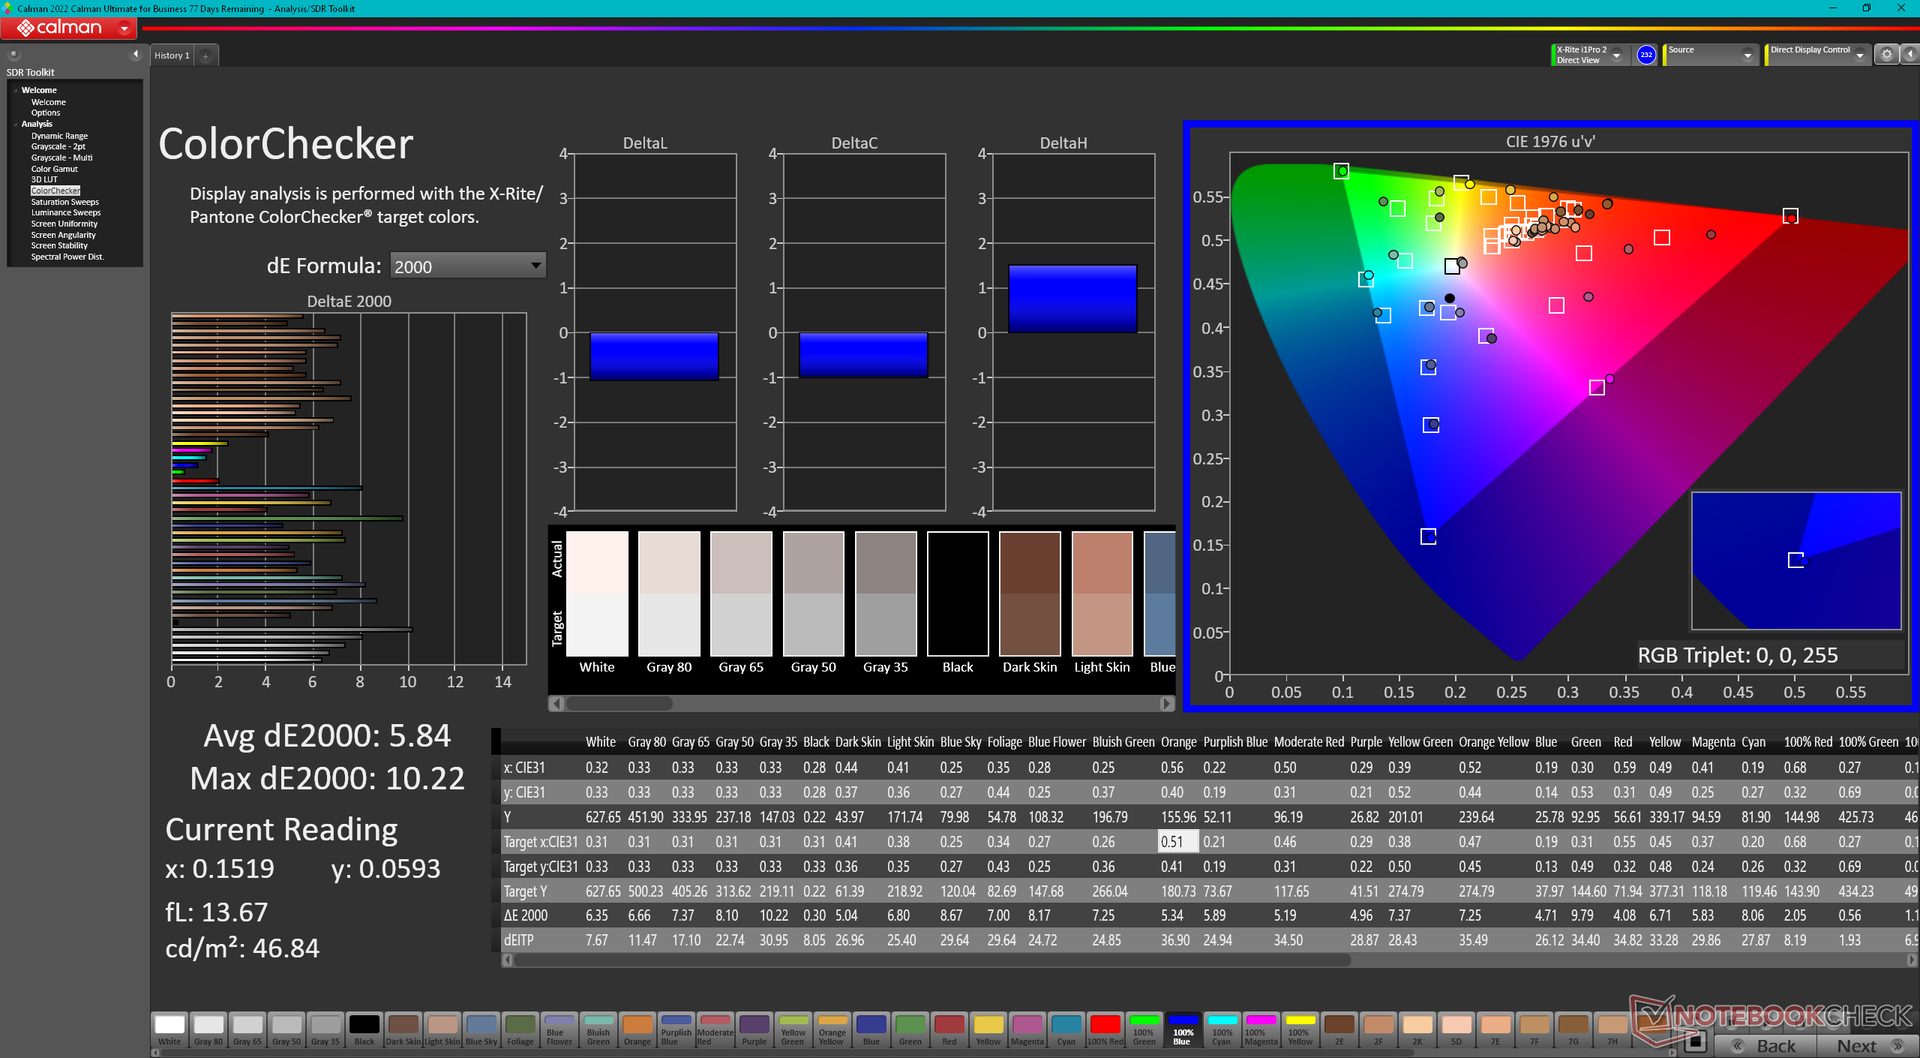
ΔE ColorChecker Calman: 5.84 | ∀{0.5-29.43 Ø4.71}
calibrated: 4.45
ΔE Greyscale Calman: 6.7 | ∀{0.09-98 Ø4.96}
84.6% AdobeRGB 1998 (Argyll 3D)
99.9% sRGB (Argyll 3D)
95.1% Display P3 (Argyll 3D)
Gamma: 2.77
CCT: 5795 K
| Lenovo Slim Pro 9i 16IRP8 LEN160-3.2K, Mini-LED, 3200x2000, 16" | Lenovo Yoga Pro 9 16-IRP G8 LEN160-3.2K, Mini-LED, 3200x2000, 16" | Asus VivoBook Pro 16 Au Optronics B160QAN02.L, IPS, 2560x1600, 16" | Acer Swift Edge SFE16-42-R1GM Samsung SDC4168, OLED, 3840x2400, 16" | Dell Inspiron 16 Plus 7620 BOE NE16N41, IPS, 3072x1920, 16" | HP Envy 16 h0112nr Samsung SDC4174, OLED, 3840x2400, 16" | |
|---|---|---|---|---|---|---|
| Display | 5% | 2% | 7% | -13% | 3% | |
| Display P3 Coverage (%) | 95.1 | 97 2% | 98.5 4% | 99.7 5% | 70.8 -26% | 99.3 4% |
| sRGB Coverage (%) | 99.9 | 99.8 0% | 99.9 0% | 100 0% | 99.5 0% | 100 0% |
| AdobeRGB 1998 Coverage (%) | 84.6 | 95.1 12% | 86.1 2% | 97.2 15% | 73.2 -13% | 88 4% |
| Response Times | 0% | 50% | 77% | -188% | 83% | |
| Response Time Grey 50% / Grey 80% * (ms) | 14 ? | 14 ? -0% | 2 ? 86% | 2 ? 86% | 38 ? -171% | 2 ? 86% |
| Response Time Black / White * (ms) | 9.2 ? | 9.2 ? -0% | 8 ? 13% | 3 ? 67% | 28 ? -204% | 1.9 ? 79% |
| PWM Frequency (Hz) | 5784 ? | 5800 ? | 239 ? | 240.4 ? | ||
| Screen | 24% | 5% | 21% | 9% | 17% | |
| Brightness middle (cd/m²) | 627.4 | 539 -14% | 504 -20% | 369 -41% | 288.9 -54% | 328.8 -48% |
| Brightness (cd/m²) | 618 | 546 -12% | 465 -25% | 371 -40% | 276 -55% | 332 -46% |
| Brightness Distribution (%) | 95 | 96 1% | 87 -8% | 97 2% | 92 -3% | 97 2% |
| Black Level * (cd/m²) | 0.19 | 0.18 5% | 0.35 -84% | 0.26 -37% | ||
| Contrast (:1) | 3302 | 2994 -9% | 1440 -56% | 1111 -66% | ||
| Colorchecker dE 2000 * | 5.84 | 1.4 76% | 1.83 69% | 2.3 61% | 1.88 68% | 1.53 74% |
| Colorchecker dE 2000 max. * | 10.22 | 2.1 79% | 5.51 46% | 4.37 57% | 4.37 57% | 6.04 41% |
| Colorchecker dE 2000 calibrated * | 4.45 | 1.34 70% | 2.87 36% | 0.42 91% | ||
| Greyscale dE 2000 * | 6.7 | 2.2 67% | 3.02 55% | 1.83 73% | 1.4 79% | 1.3 81% |
| Gamma | 2.77 79% | 2.19 100% | 2.39 92% | 2.39 92% | 2.3 96% | 2.18 101% |
| CCT | 5795 112% | 6479 100% | 6688 97% | 6392 102% | 6634 98% | 6362 102% |
| Totaal Gemiddelde (Programma / Instellingen) | 10% /
16% | 19% /
11% | 35% /
27% | -64% /
-24% | 34% /
25% |
* ... kleiner is beter
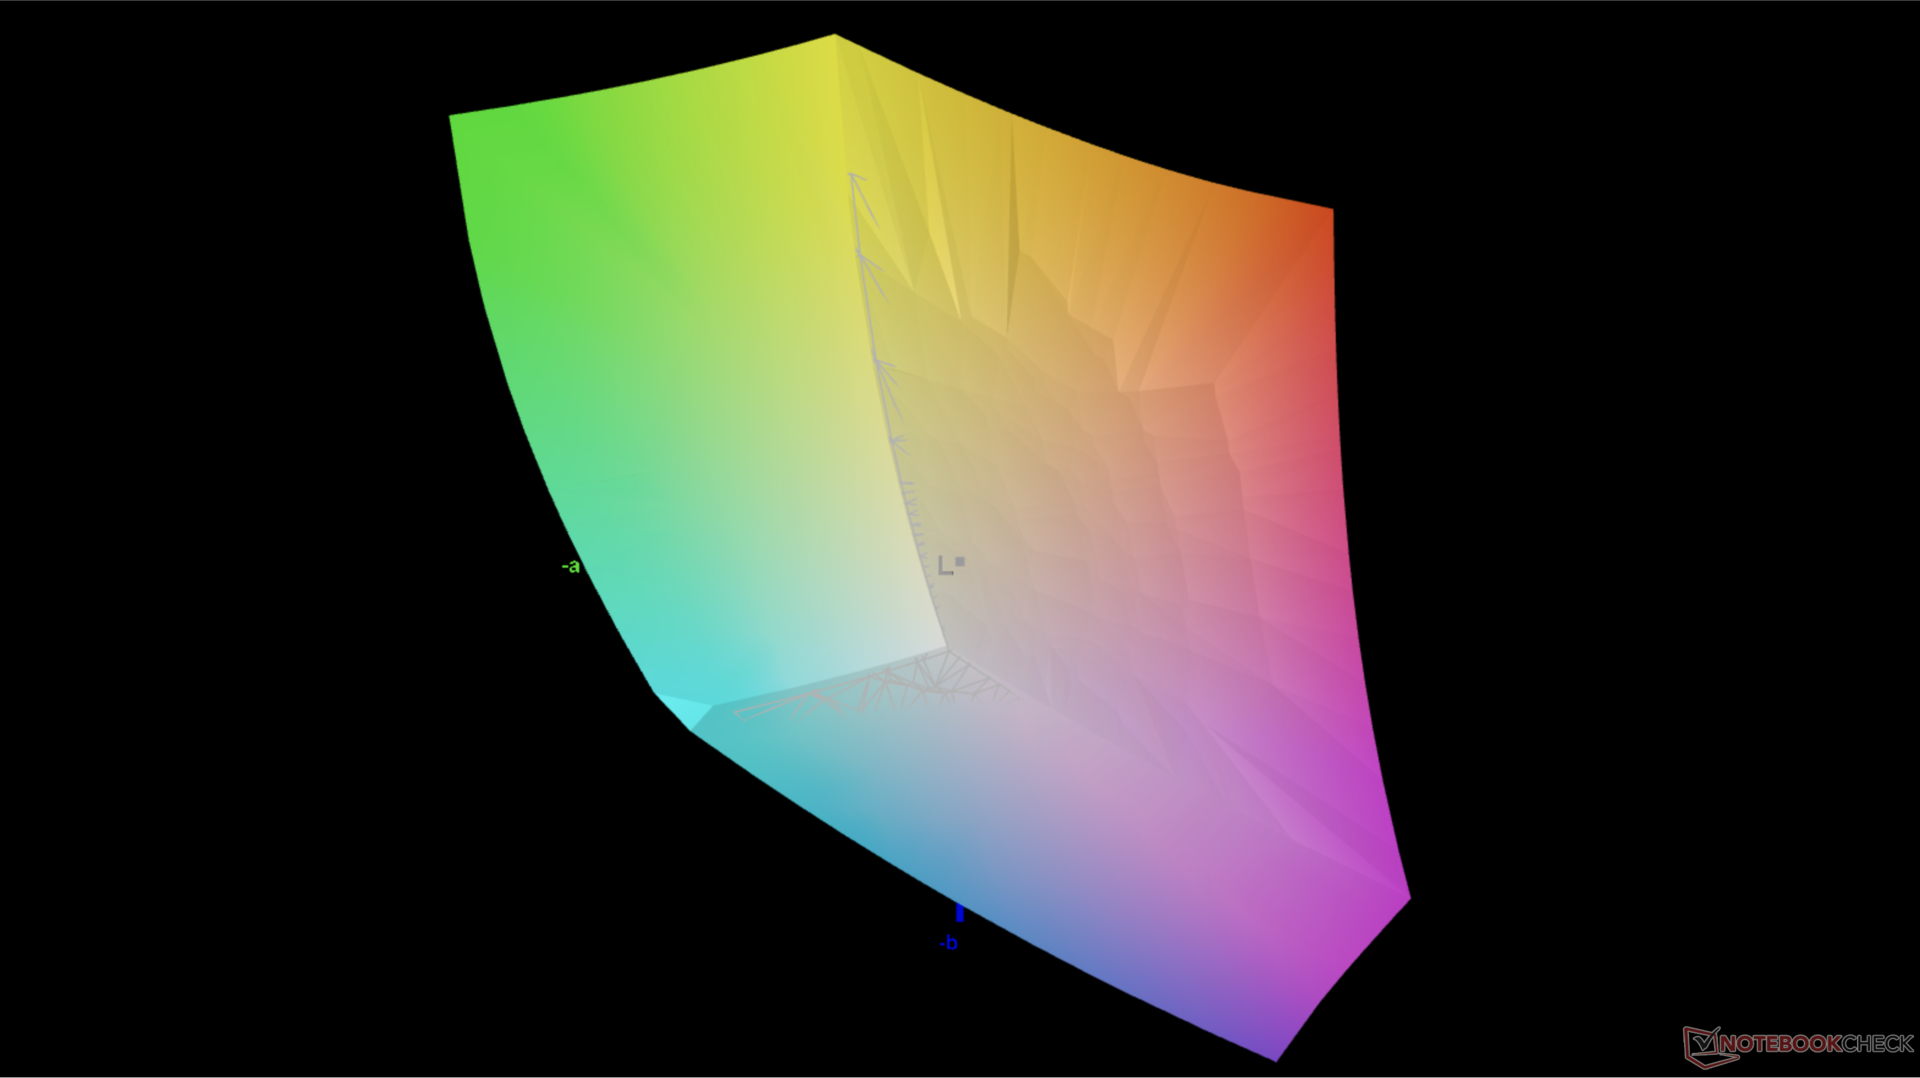
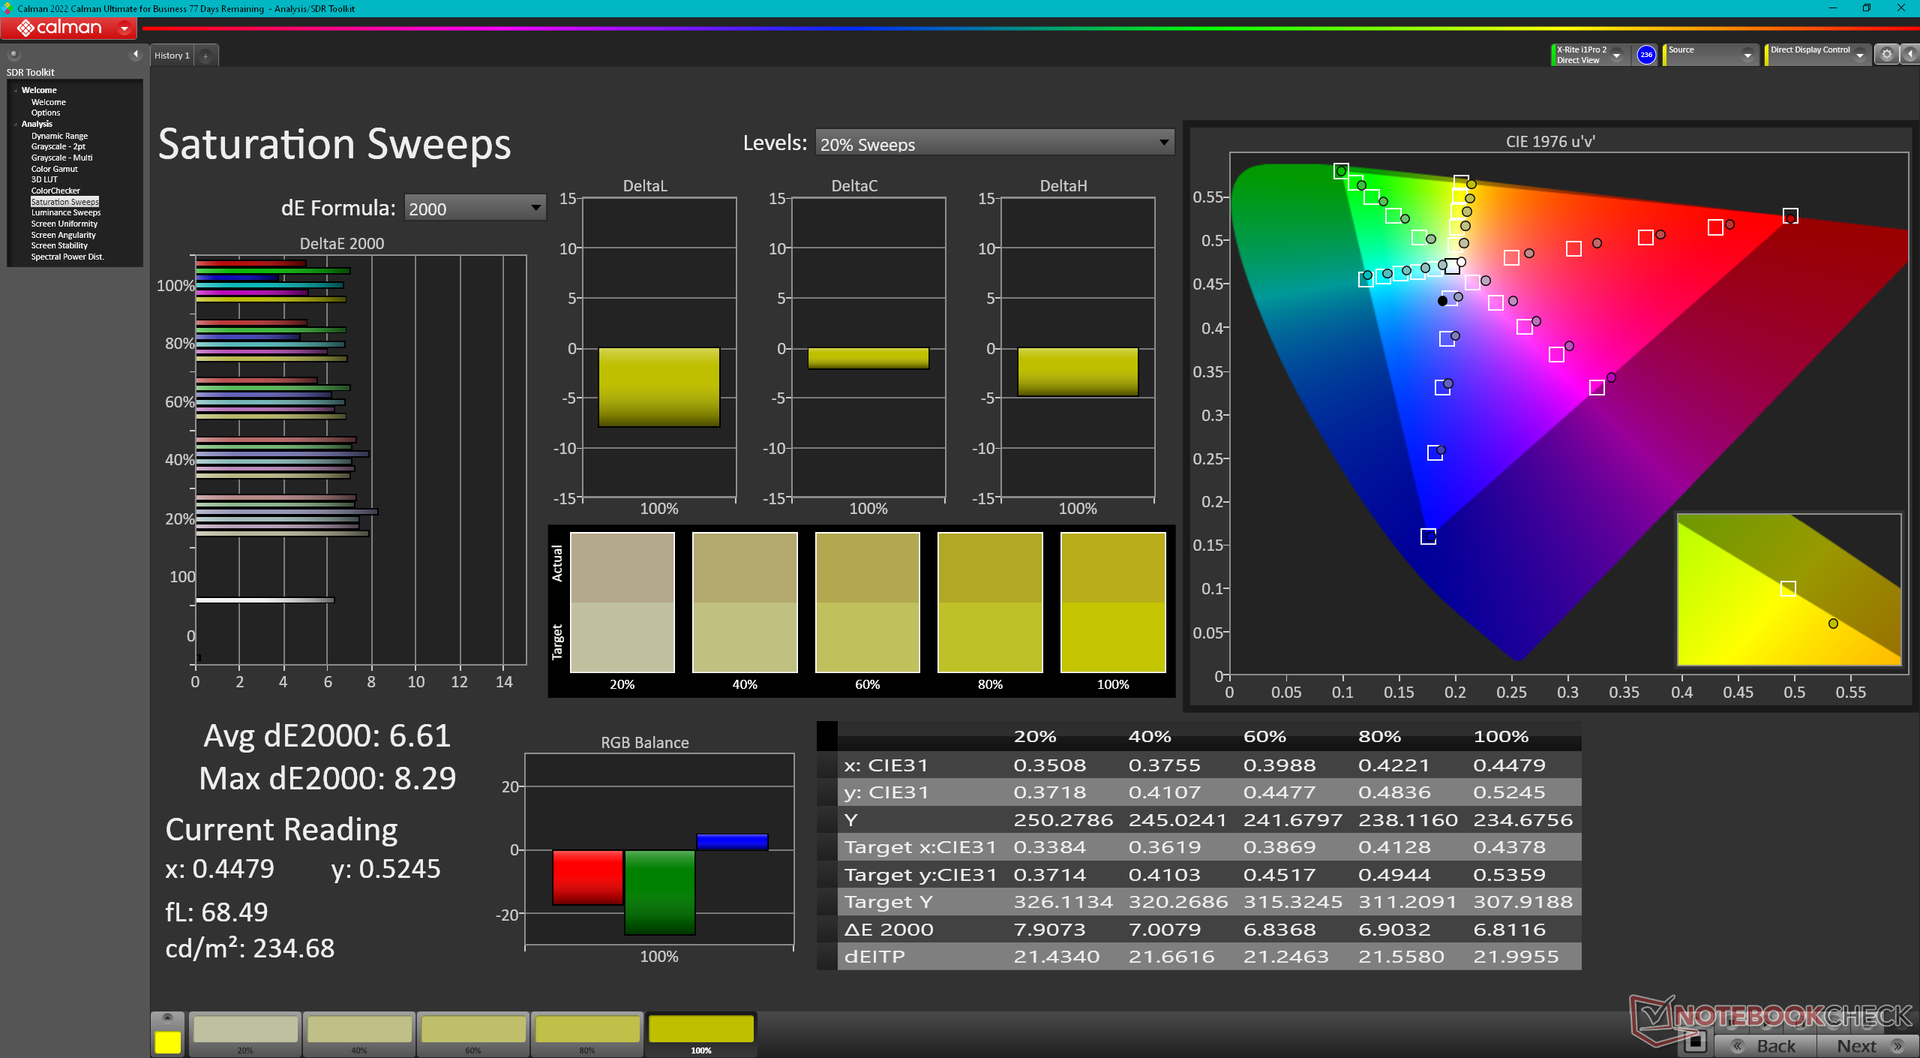
Kleurtemperatuur is warmer dan verwacht wanneer deze is ingesteld op de P3-modus. In tegenstelling tot veel MSI modellen heeft de Lenovo Vantage software geen schuifknop om de kleurtemperatuur aan te passen.
Responstijd Scherm
| ↔ Responstijd Zwart naar Wit | ||
|---|---|---|
| 9.2 ms ... stijging ↗ en daling ↘ gecombineerd | ↗ 2.2 ms stijging | 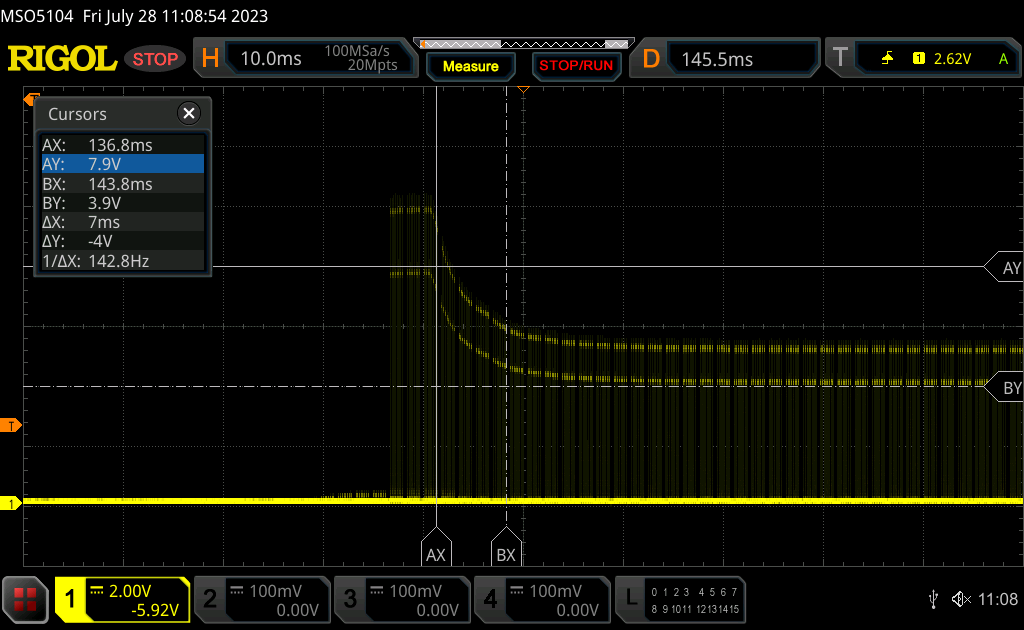 |
| ↘ 7 ms daling | ||
| Het scherm vertoonde snelle responstijden in onze tests en zou geschikt moeten zijn voor games. Ter vergelijking: alle testtoestellen variëren van 0.1 (minimum) tot 240 (maximum) ms. » 26 % van alle toestellen zijn beter. Dit betekent dat de gemeten responstijd beter is dan het gemiddelde (19.8 ms) van alle geteste toestellen. | ||
| ↔ Responstijd 50% Grijs naar 80% Grijs | ||
| 14 ms ... stijging ↗ en daling ↘ gecombineerd | ↗ 7.4 ms stijging | 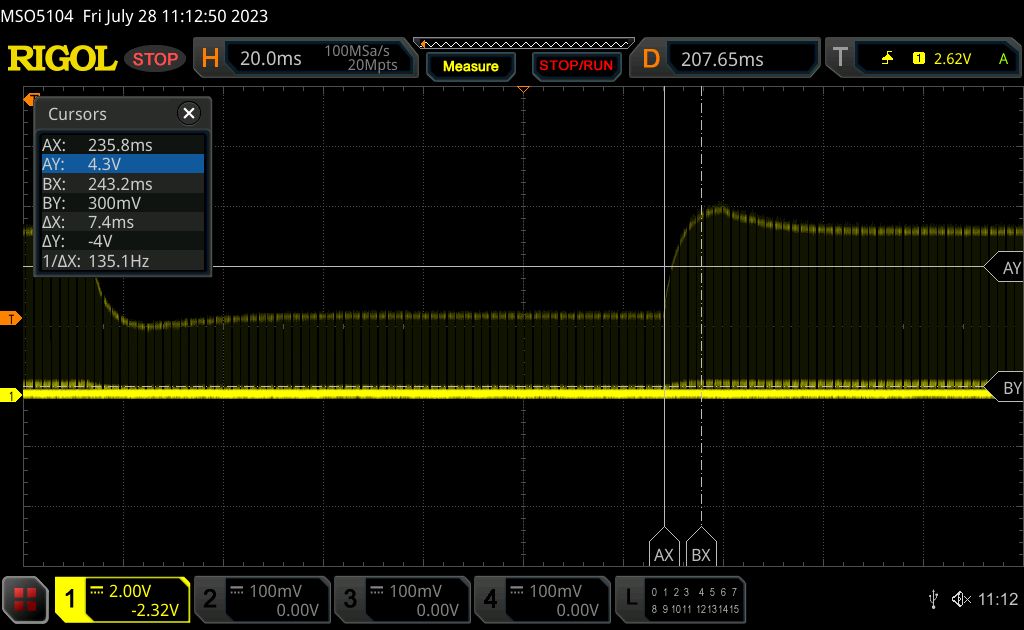 |
| ↘ 6.6 ms daling | ||
| Het scherm vertoonde prima responstijden in onze tests maar is misschien wat te traag voor competitieve games. Ter vergelijking: alle testtoestellen variëren van 0.165 (minimum) tot 636 (maximum) ms. » 28 % van alle toestellen zijn beter. Dit betekent dat de gemeten responstijd beter is dan het gemiddelde (31 ms) van alle geteste toestellen. | ||
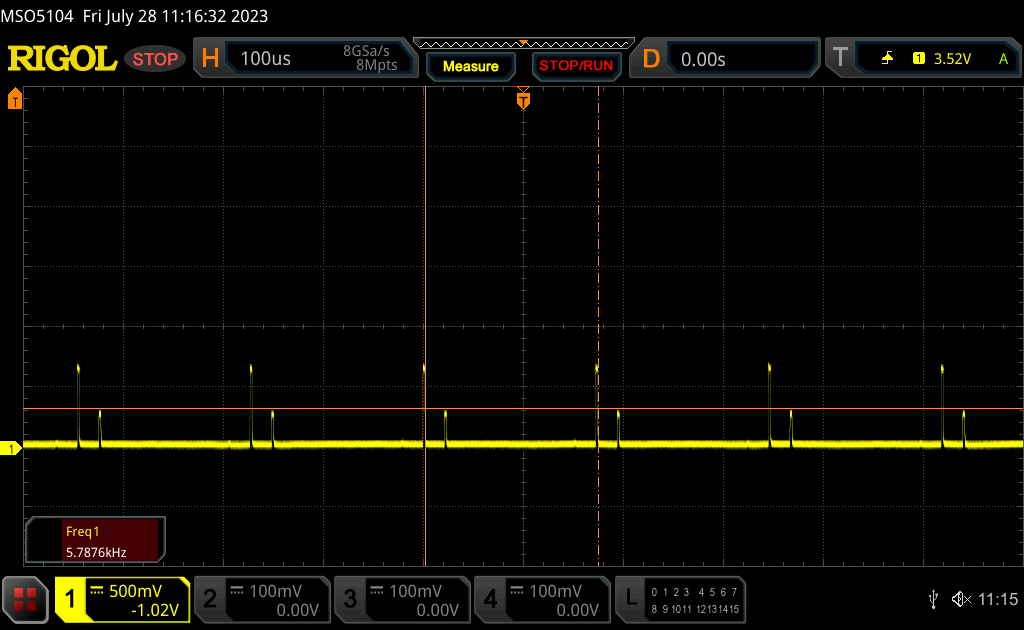
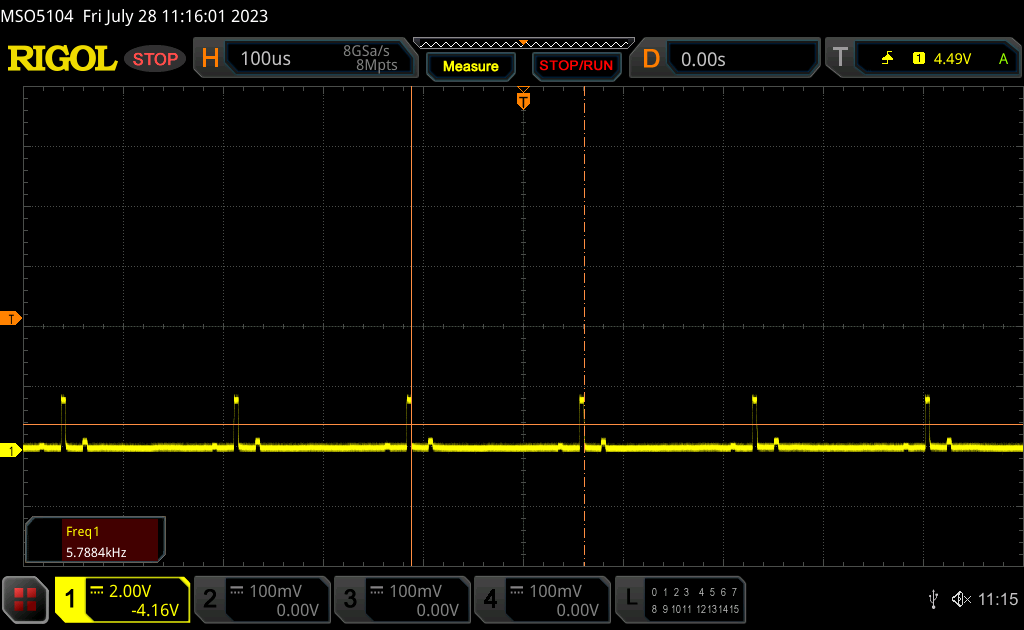
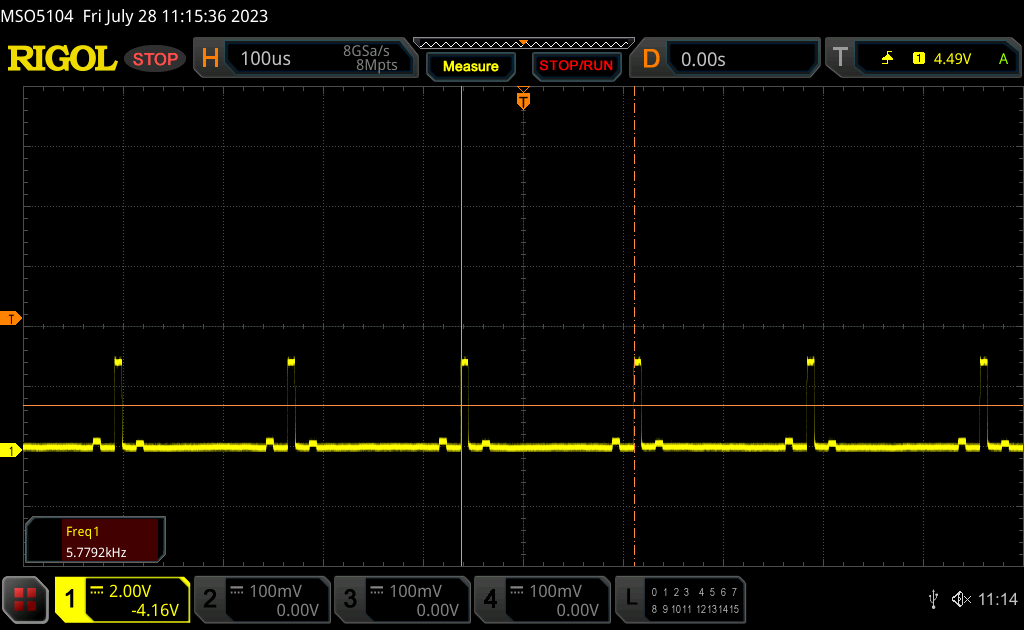
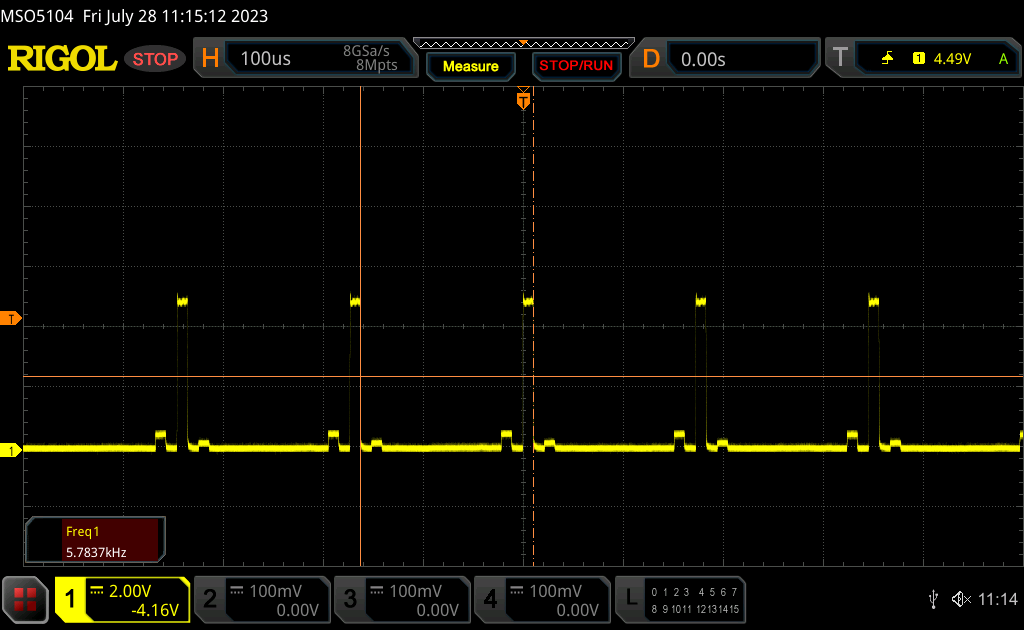
Screen Flickering / PWM (Pulse-Width Modulation)
| Screen flickering / PWM waargenomen | 5784 Hz | ≤ 100 % helderheid instelling | 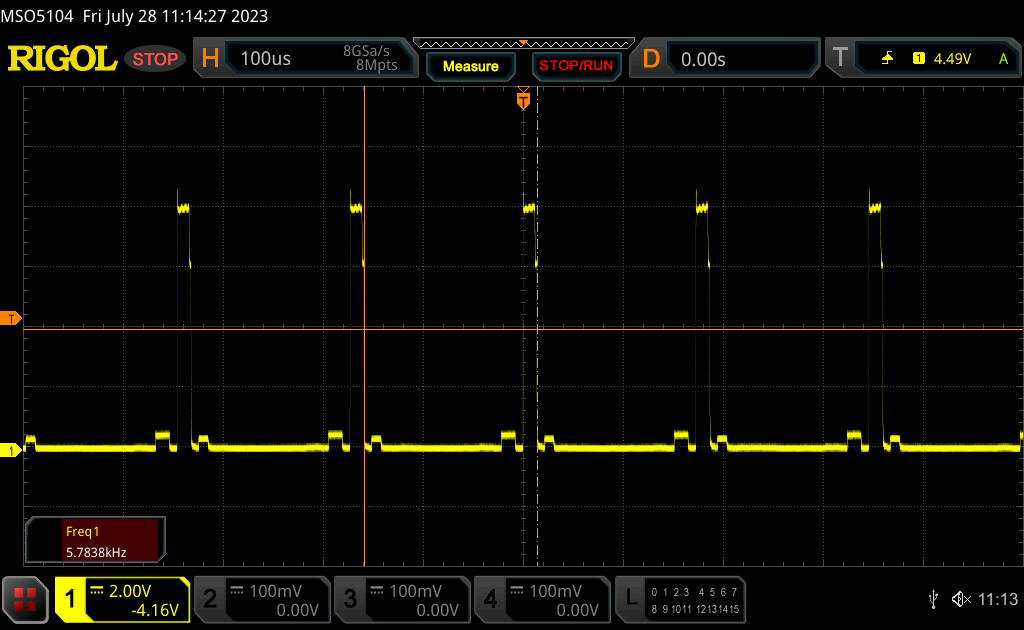 |
De achtergrondverlichting van het scherm flikkert op 5784 Hz (in het slechtste geval, bijvoorbeeld bij gebruik van PWM) aan een helderheid van 100 % en lager. Boven deze helderheid zou er geen flickering / PWM mogen optreden. De frequentie van 5784 Hz is redelijk hoog en de meeste mensen die gevoelig zijn aan flickering zouden dit dus niet mogen waarnemen of geïrriteerde ogen krijgen. Ter vergelijking: 52 % van alle geteste toestellen maakten geen gebruik van PWM om de schermhelderheid te verlagen. Als het wel werd gebruikt, werd een gemiddelde van 7757 (minimum: 5 - maximum: 343500) Hz waargenomen. | |||
Flikkering is aanwezig op alle helderheidsniveaus in SDR-modus. De frequentie is met 5784 Hz echter relatief hoog, dus dit zou voor de meeste gebruikers geen probleem moeten zijn.
Prestaties - 13e generatie Raptor Lake-H
Testomstandigheden
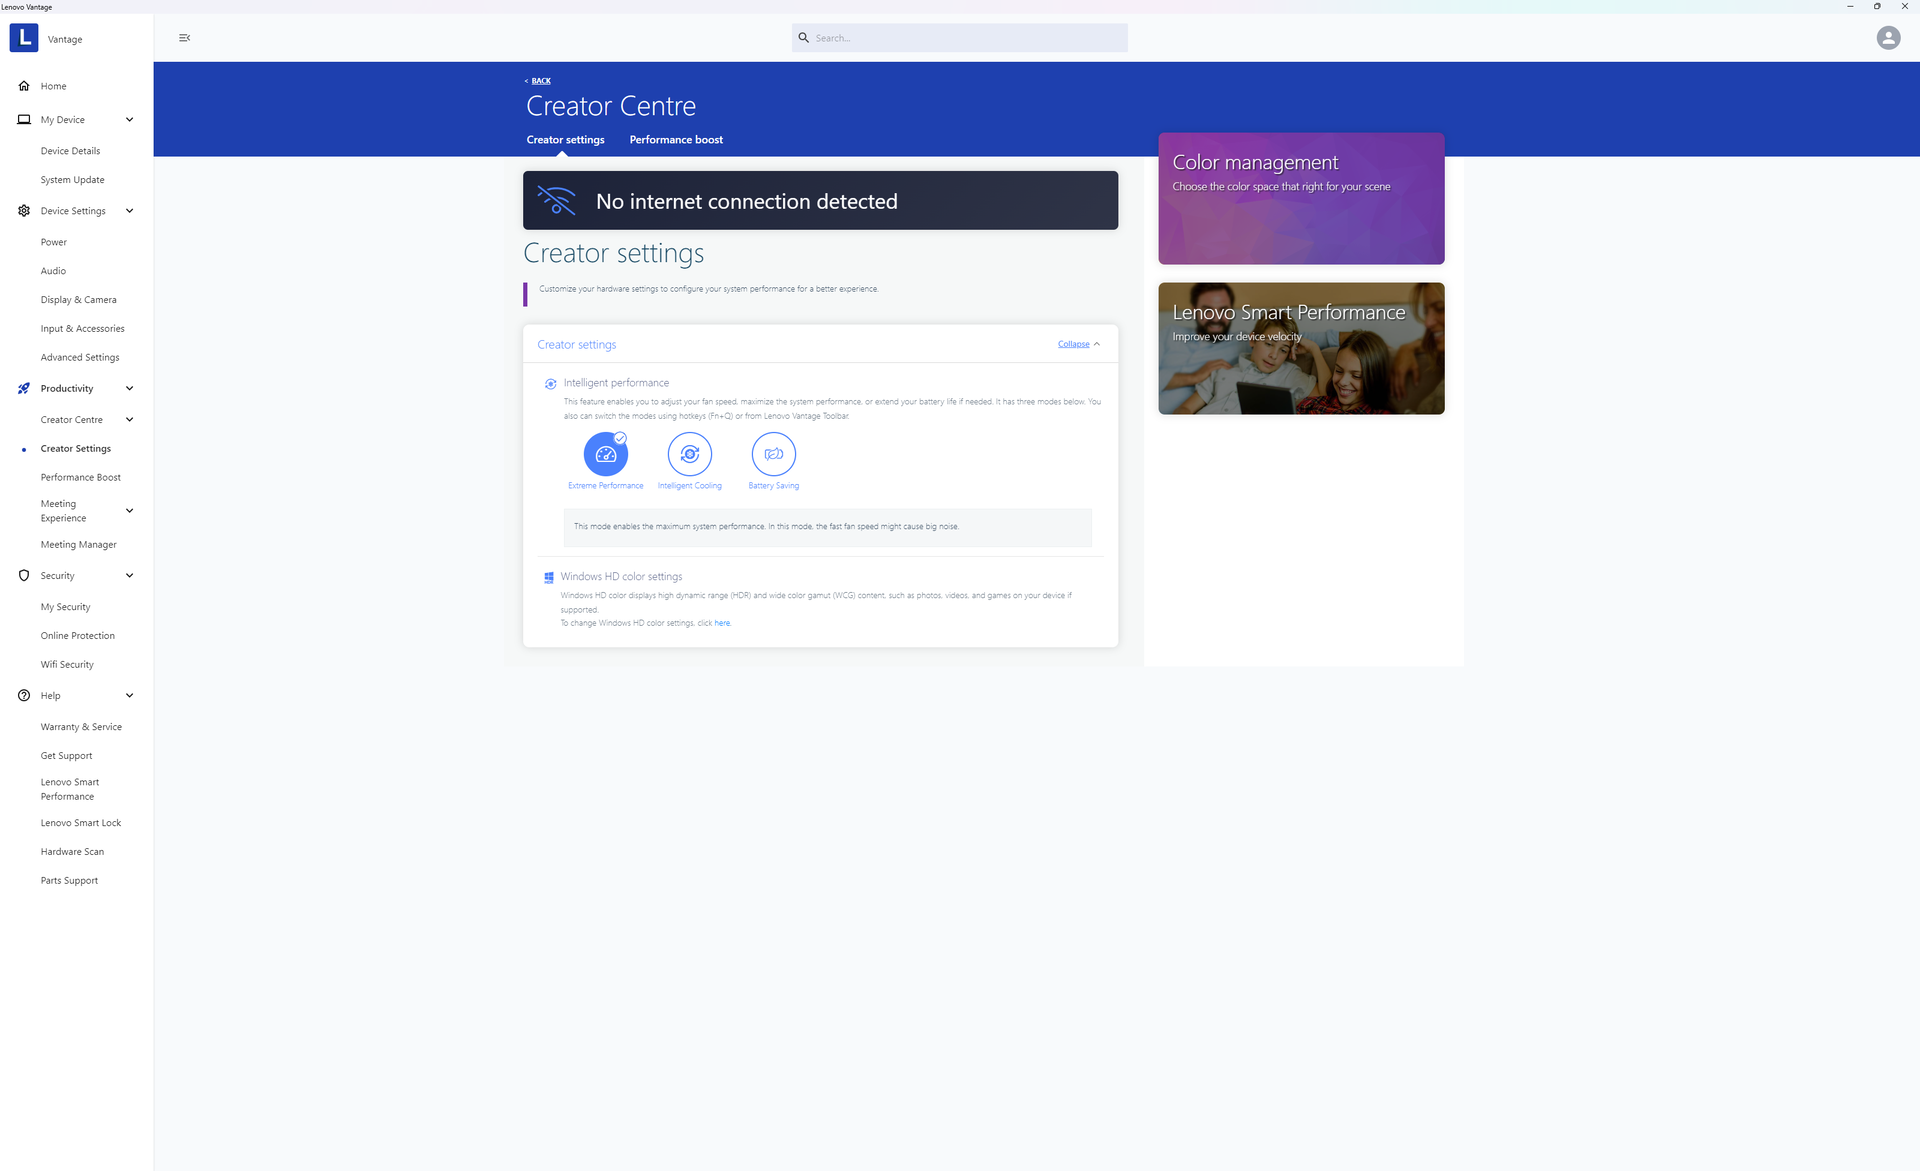
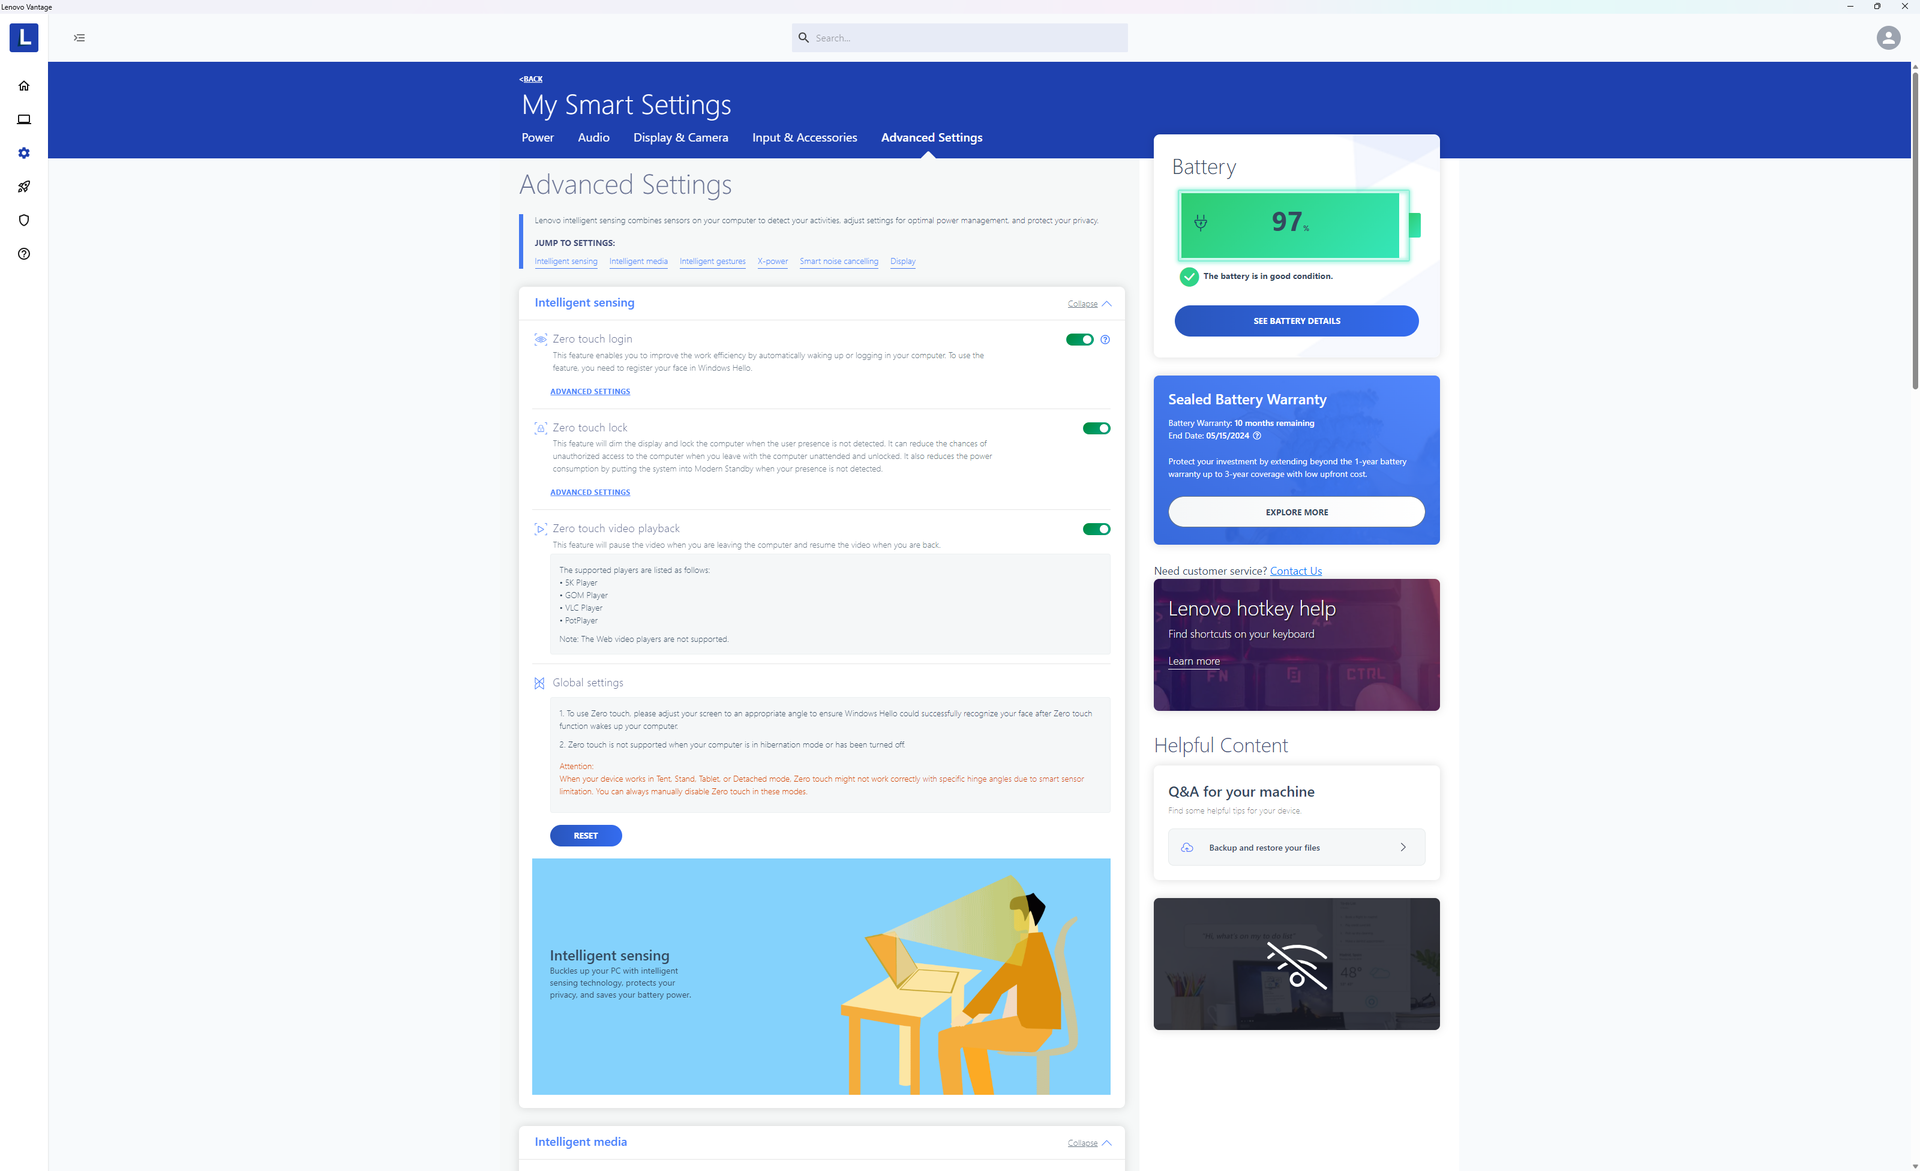
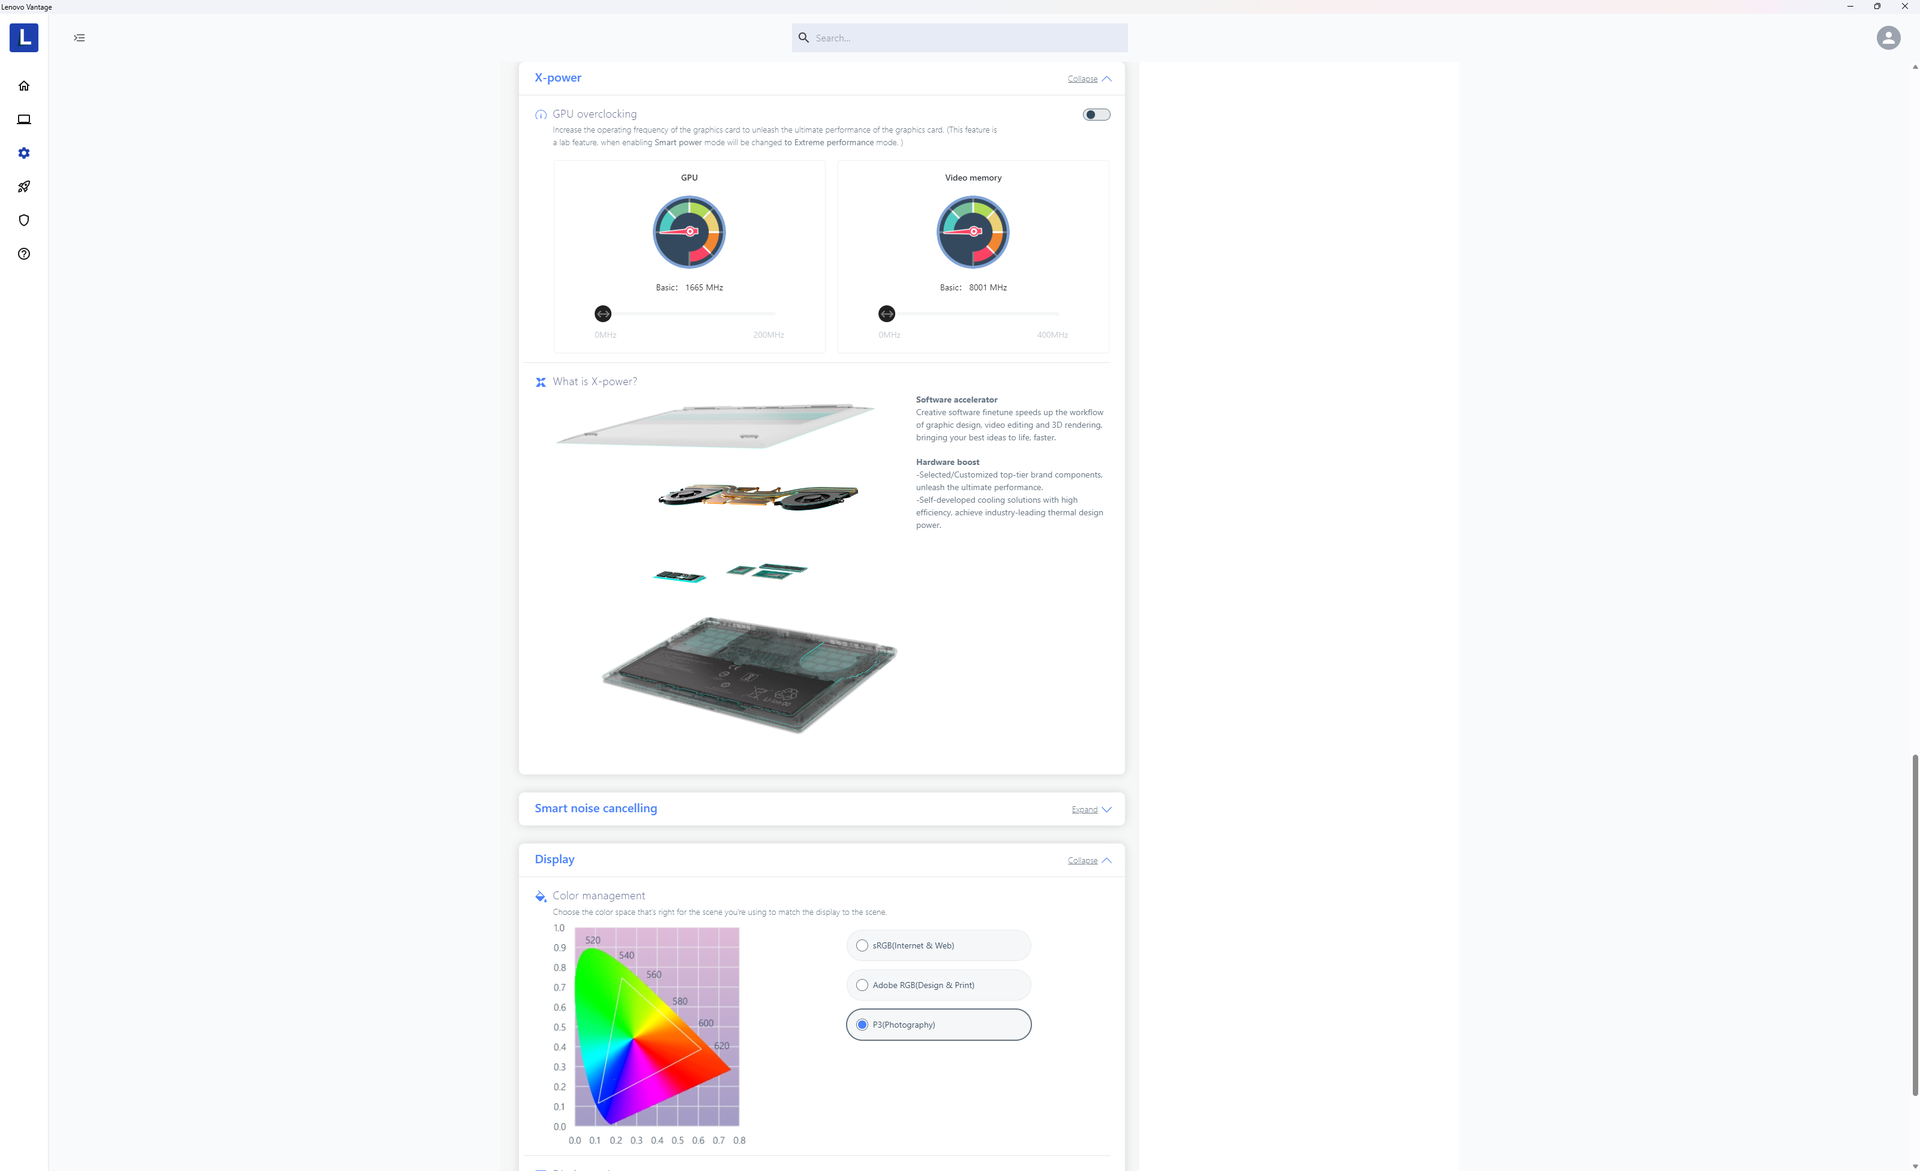
We hebben ons apparaat via Windows ingesteld op de modus Prestaties en via Lenovo Vantage op de modus Extreme prestaties voordat we de onderstaande benchmarks uitvoerden. Vervelend genoeg herontwerpt Lenovo zijn Vantage UI nogal vaak en dus staan alle instellingen onder verschillende submenu's in vergelijking met dezelfde software op andere Lenovo laptops.
Processor
DeCore i9-13905H kan sneller zijn dan deCore i7-13705H op papier, maar de voordelen zijn op zijn best klein. Multi-thread prestaties zijn bijna identiek tussen beide, terwijl single-thread prestaties slechts 5 tot 10 procent sneller zijn met onze Core i9.
Cinebench R15 Multi Loop
Cinebench R23: Multi Core | Single Core
Cinebench R20: CPU (Multi Core) | CPU (Single Core)
Cinebench R15: CPU Multi 64Bit | CPU Single 64Bit
Blender: v2.79 BMW27 CPU
7-Zip 18.03: 7z b 4 | 7z b 4 -mmt1
Geekbench 5.5: Multi-Core | Single-Core
HWBOT x265 Benchmark v2.2: 4k Preset
LibreOffice : 20 Documents To PDF
R Benchmark 2.5: Overall mean
* ... kleiner is beter
AIDA64: FP32 Ray-Trace | FPU Julia | CPU SHA3 | CPU Queen | FPU SinJulia | FPU Mandel | CPU AES | CPU ZLib | FP64 Ray-Trace | CPU PhotoWorxx
| Performance rating | |
| Lenovo Slim Pro 9i 16IRP8 | |
| Gemiddeld Intel Core i9-13905H | |
| Lenovo Yoga Pro 9 16-IRP G8 | |
| HP Envy 16 h0112nr | |
| Asus VivoBook Pro 16 | |
| Dell Inspiron 16 Plus 7620 | |
| Acer Swift Edge SFE16-42-R1GM | |
| AIDA64 / FP32 Ray-Trace | |
| Gemiddeld Intel Core i9-13905H (17642 - 19900, n=3) | |
| Lenovo Slim Pro 9i 16IRP8 | |
| Lenovo Yoga Pro 9 16-IRP G8 | |
| Asus VivoBook Pro 16 | |
| Dell Inspiron 16 Plus 7620 | |
| HP Envy 16 h0112nr | |
| Acer Swift Edge SFE16-42-R1GM | |
| AIDA64 / FPU Julia | |
| Lenovo Yoga Pro 9 16-IRP G8 | |
| Lenovo Slim Pro 9i 16IRP8 | |
| Gemiddeld Intel Core i9-13905H (89198 - 94350, n=3) | |
| Asus VivoBook Pro 16 | |
| Acer Swift Edge SFE16-42-R1GM | |
| Dell Inspiron 16 Plus 7620 | |
| HP Envy 16 h0112nr | |
| AIDA64 / CPU SHA3 | |
| Lenovo Slim Pro 9i 16IRP8 | |
| Lenovo Yoga Pro 9 16-IRP G8 | |
| Gemiddeld Intel Core i9-13905H (3945 - 4296, n=3) | |
| Asus VivoBook Pro 16 | |
| Dell Inspiron 16 Plus 7620 | |
| HP Envy 16 h0112nr | |
| Acer Swift Edge SFE16-42-R1GM | |
| AIDA64 / CPU Queen | |
| Lenovo Slim Pro 9i 16IRP8 | |
| Lenovo Yoga Pro 9 16-IRP G8 | |
| Gemiddeld Intel Core i9-13905H (94506 - 117697, n=3) | |
| Asus VivoBook Pro 16 | |
| HP Envy 16 h0112nr | |
| Dell Inspiron 16 Plus 7620 | |
| Acer Swift Edge SFE16-42-R1GM | |
| AIDA64 / FPU SinJulia | |
| Lenovo Slim Pro 9i 16IRP8 | |
| Lenovo Yoga Pro 9 16-IRP G8 | |
| Acer Swift Edge SFE16-42-R1GM | |
| Gemiddeld Intel Core i9-13905H (10478 - 11328, n=3) | |
| Asus VivoBook Pro 16 | |
| Dell Inspiron 16 Plus 7620 | |
| HP Envy 16 h0112nr | |
| AIDA64 / FPU Mandel | |
| Gemiddeld Intel Core i9-13905H (43922 - 48884, n=3) | |
| Lenovo Slim Pro 9i 16IRP8 | |
| Lenovo Yoga Pro 9 16-IRP G8 | |
| Acer Swift Edge SFE16-42-R1GM | |
| Asus VivoBook Pro 16 | |
| Dell Inspiron 16 Plus 7620 | |
| HP Envy 16 h0112nr | |
| AIDA64 / CPU AES | |
| HP Envy 16 h0112nr | |
| Lenovo Slim Pro 9i 16IRP8 | |
| Lenovo Yoga Pro 9 16-IRP G8 | |
| Gemiddeld Intel Core i9-13905H (80275 - 86469, n=3) | |
| Asus VivoBook Pro 16 | |
| Dell Inspiron 16 Plus 7620 | |
| Acer Swift Edge SFE16-42-R1GM | |
| AIDA64 / CPU ZLib | |
| Lenovo Slim Pro 9i 16IRP8 | |
| Lenovo Yoga Pro 9 16-IRP G8 | |
| Gemiddeld Intel Core i9-13905H (1154 - 1234, n=3) | |
| Dell Inspiron 16 Plus 7620 | |
| Asus VivoBook Pro 16 | |
| HP Envy 16 h0112nr | |
| Acer Swift Edge SFE16-42-R1GM | |
| AIDA64 / FP64 Ray-Trace | |
| Gemiddeld Intel Core i9-13905H (9483 - 10804, n=3) | |
| Lenovo Slim Pro 9i 16IRP8 | |
| Lenovo Yoga Pro 9 16-IRP G8 | |
| Asus VivoBook Pro 16 | |
| Dell Inspiron 16 Plus 7620 | |
| HP Envy 16 h0112nr | |
| Acer Swift Edge SFE16-42-R1GM | |
| AIDA64 / CPU PhotoWorxx | |
| Gemiddeld Intel Core i9-13905H (51720 - 60161, n=3) | |
| Lenovo Slim Pro 9i 16IRP8 | |
| Lenovo Yoga Pro 9 16-IRP G8 | |
| HP Envy 16 h0112nr | |
| Dell Inspiron 16 Plus 7620 | |
| Acer Swift Edge SFE16-42-R1GM | |
| Asus VivoBook Pro 16 | |
Systeemprestaties
Tijdens het testen hebben we problemen ondervonden met ontwaken uit de slaapstand en zelfs een BSOD. Het scherm bleef soms leeg bij het ontwaken uit de slaapstand en dan was een harde herstart nodig om terug te keren naar Windows.
CrossMark: Overall | Productivity | Creativity | Responsiveness
| PCMark 10 / Score | |
| Lenovo Slim Pro 9i 16IRP8 | |
| HP Envy 16 h0112nr | |
| Lenovo Yoga Pro 9 16-IRP G8 | |
| Dell Inspiron 16 Plus 7620 | |
| Asus VivoBook Pro 16 | |
| Acer Swift Edge SFE16-42-R1GM | |
| PCMark 10 / Essentials | |
| HP Envy 16 h0112nr | |
| Lenovo Slim Pro 9i 16IRP8 | |
| Lenovo Yoga Pro 9 16-IRP G8 | |
| Dell Inspiron 16 Plus 7620 | |
| Asus VivoBook Pro 16 | |
| Acer Swift Edge SFE16-42-R1GM | |
| PCMark 10 / Productivity | |
| Lenovo Slim Pro 9i 16IRP8 | |
| HP Envy 16 h0112nr | |
| Acer Swift Edge SFE16-42-R1GM | |
| Dell Inspiron 16 Plus 7620 | |
| Asus VivoBook Pro 16 | |
| Lenovo Yoga Pro 9 16-IRP G8 | |
| PCMark 10 / Digital Content Creation | |
| Lenovo Slim Pro 9i 16IRP8 | |
| Lenovo Yoga Pro 9 16-IRP G8 | |
| HP Envy 16 h0112nr | |
| Dell Inspiron 16 Plus 7620 | |
| Asus VivoBook Pro 16 | |
| Acer Swift Edge SFE16-42-R1GM | |
| CrossMark / Overall | |
| Lenovo Yoga Pro 9 16-IRP G8 | |
| HP Envy 16 h0112nr | |
| Lenovo Slim Pro 9i 16IRP8 | |
| Dell Inspiron 16 Plus 7620 | |
| Asus VivoBook Pro 16 | |
| Acer Swift Edge SFE16-42-R1GM | |
| CrossMark / Productivity | |
| HP Envy 16 h0112nr | |
| Lenovo Yoga Pro 9 16-IRP G8 | |
| Asus VivoBook Pro 16 | |
| Dell Inspiron 16 Plus 7620 | |
| Lenovo Slim Pro 9i 16IRP8 | |
| Acer Swift Edge SFE16-42-R1GM | |
| CrossMark / Creativity | |
| Lenovo Yoga Pro 9 16-IRP G8 | |
| Lenovo Slim Pro 9i 16IRP8 | |
| HP Envy 16 h0112nr | |
| Dell Inspiron 16 Plus 7620 | |
| Asus VivoBook Pro 16 | |
| Acer Swift Edge SFE16-42-R1GM | |
| CrossMark / Responsiveness | |
| Asus VivoBook Pro 16 | |
| HP Envy 16 h0112nr | |
| Lenovo Yoga Pro 9 16-IRP G8 | |
| Dell Inspiron 16 Plus 7620 | |
| Lenovo Slim Pro 9i 16IRP8 | |
| Acer Swift Edge SFE16-42-R1GM | |
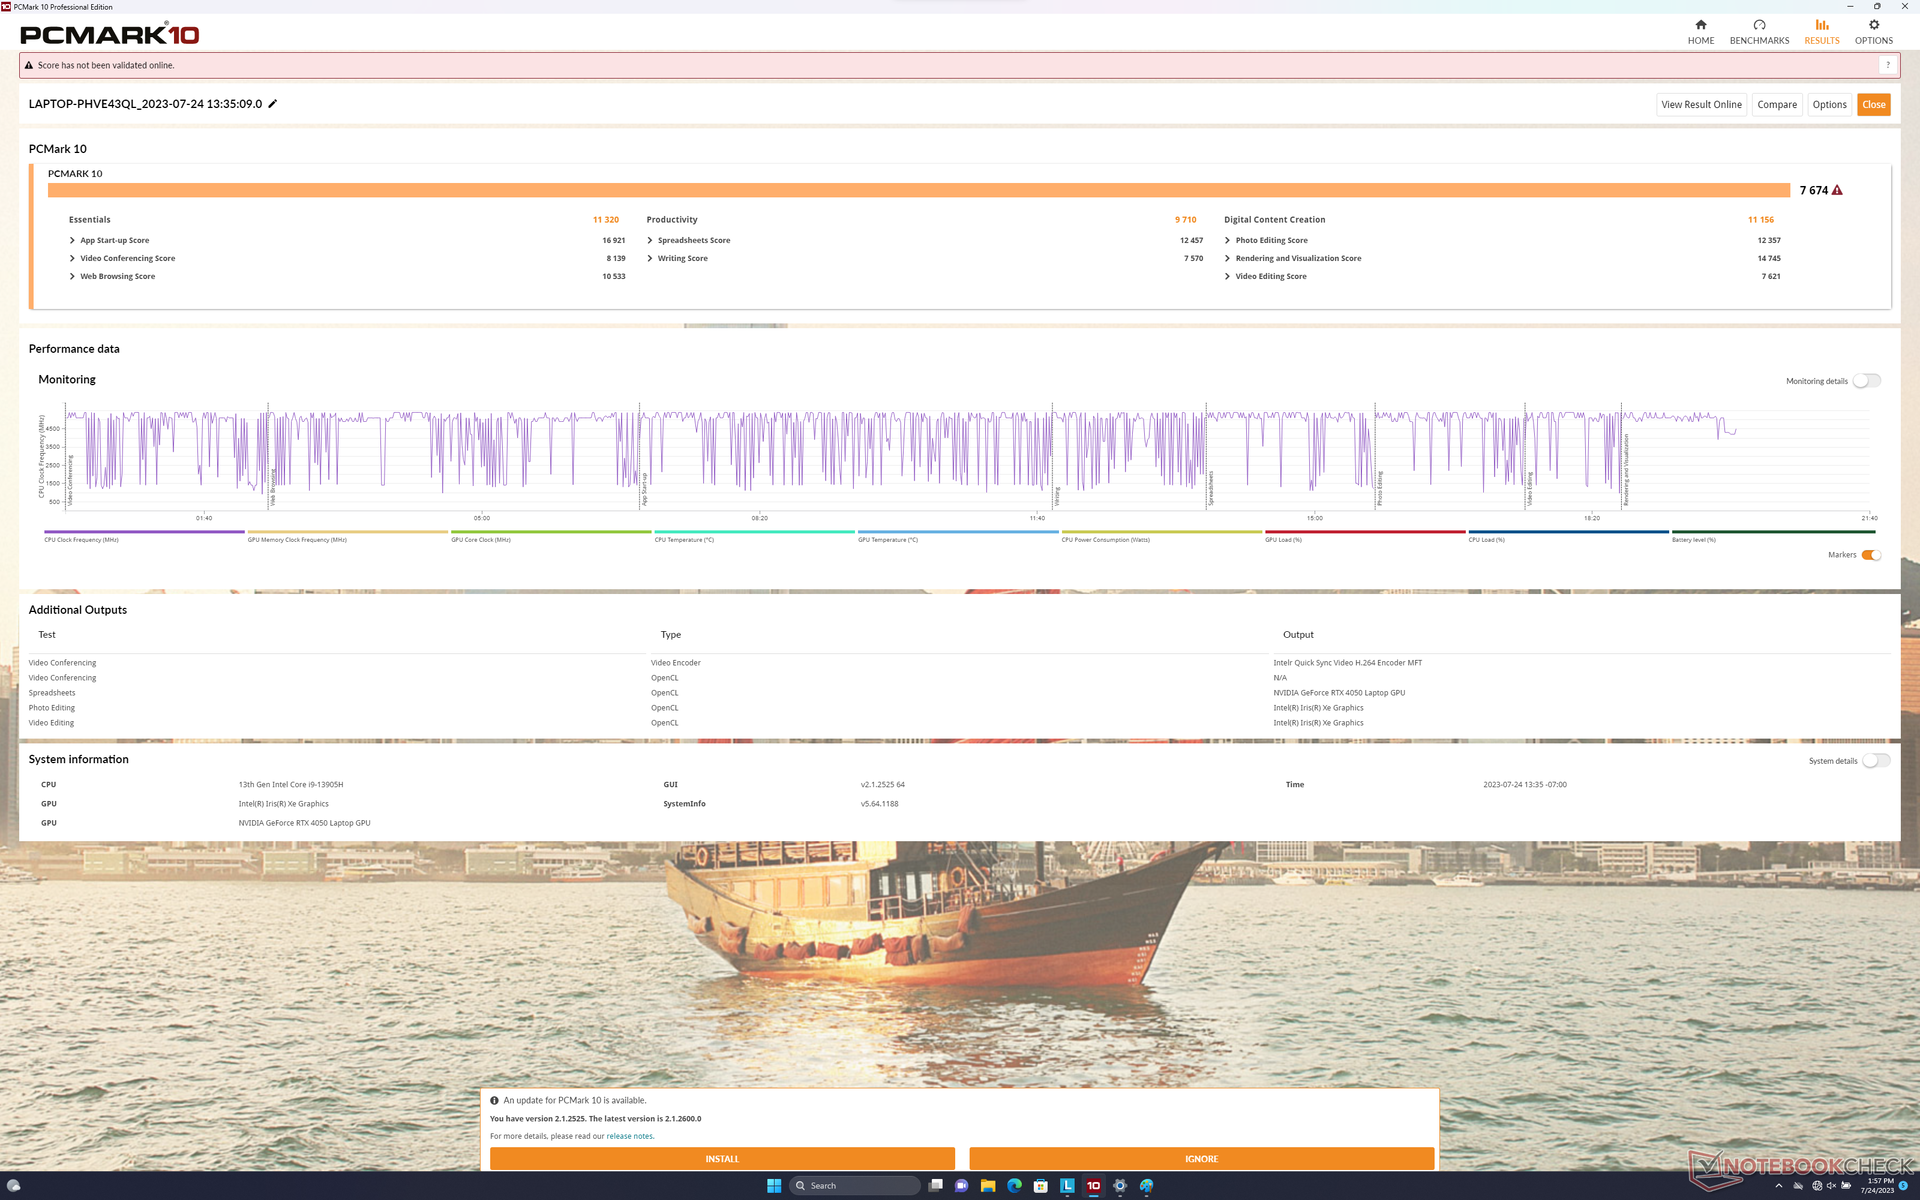
| PCMark 10 Score | 7674 punten | |
Help | ||
| AIDA64 / Memory Copy | |
| Gemiddeld Intel Core i9-13905H (76905 - 88014, n=3) | |
| Lenovo Slim Pro 9i 16IRP8 | |
| Lenovo Yoga Pro 9 16-IRP G8 | |
| HP Envy 16 h0112nr | |
| Dell Inspiron 16 Plus 7620 | |
| Acer Swift Edge SFE16-42-R1GM | |
| Asus VivoBook Pro 16 | |
| AIDA64 / Memory Read | |
| Lenovo Yoga Pro 9 16-IRP G8 | |
| Gemiddeld Intel Core i9-13905H (68837 - 79123, n=3) | |
| Lenovo Slim Pro 9i 16IRP8 | |
| HP Envy 16 h0112nr | |
| Dell Inspiron 16 Plus 7620 | |
| Acer Swift Edge SFE16-42-R1GM | |
| Asus VivoBook Pro 16 | |
| AIDA64 / Memory Write | |
| Lenovo Yoga Pro 9 16-IRP G8 | |
| Gemiddeld Intel Core i9-13905H (89545 - 103259, n=3) | |
| Lenovo Slim Pro 9i 16IRP8 | |
| HP Envy 16 h0112nr | |
| Dell Inspiron 16 Plus 7620 | |
| Acer Swift Edge SFE16-42-R1GM | |
| Asus VivoBook Pro 16 | |
| AIDA64 / Memory Latency | |
| Lenovo Yoga Pro 9 16-IRP G8 | |
| Gemiddeld Intel Core i9-13905H (101.4 - 134.8, n=3) | |
| Lenovo Slim Pro 9i 16IRP8 | |
| Acer Swift Edge SFE16-42-R1GM | |
| Dell Inspiron 16 Plus 7620 | |
| HP Envy 16 h0112nr | |
| Asus VivoBook Pro 16 | |
* ... kleiner is beter
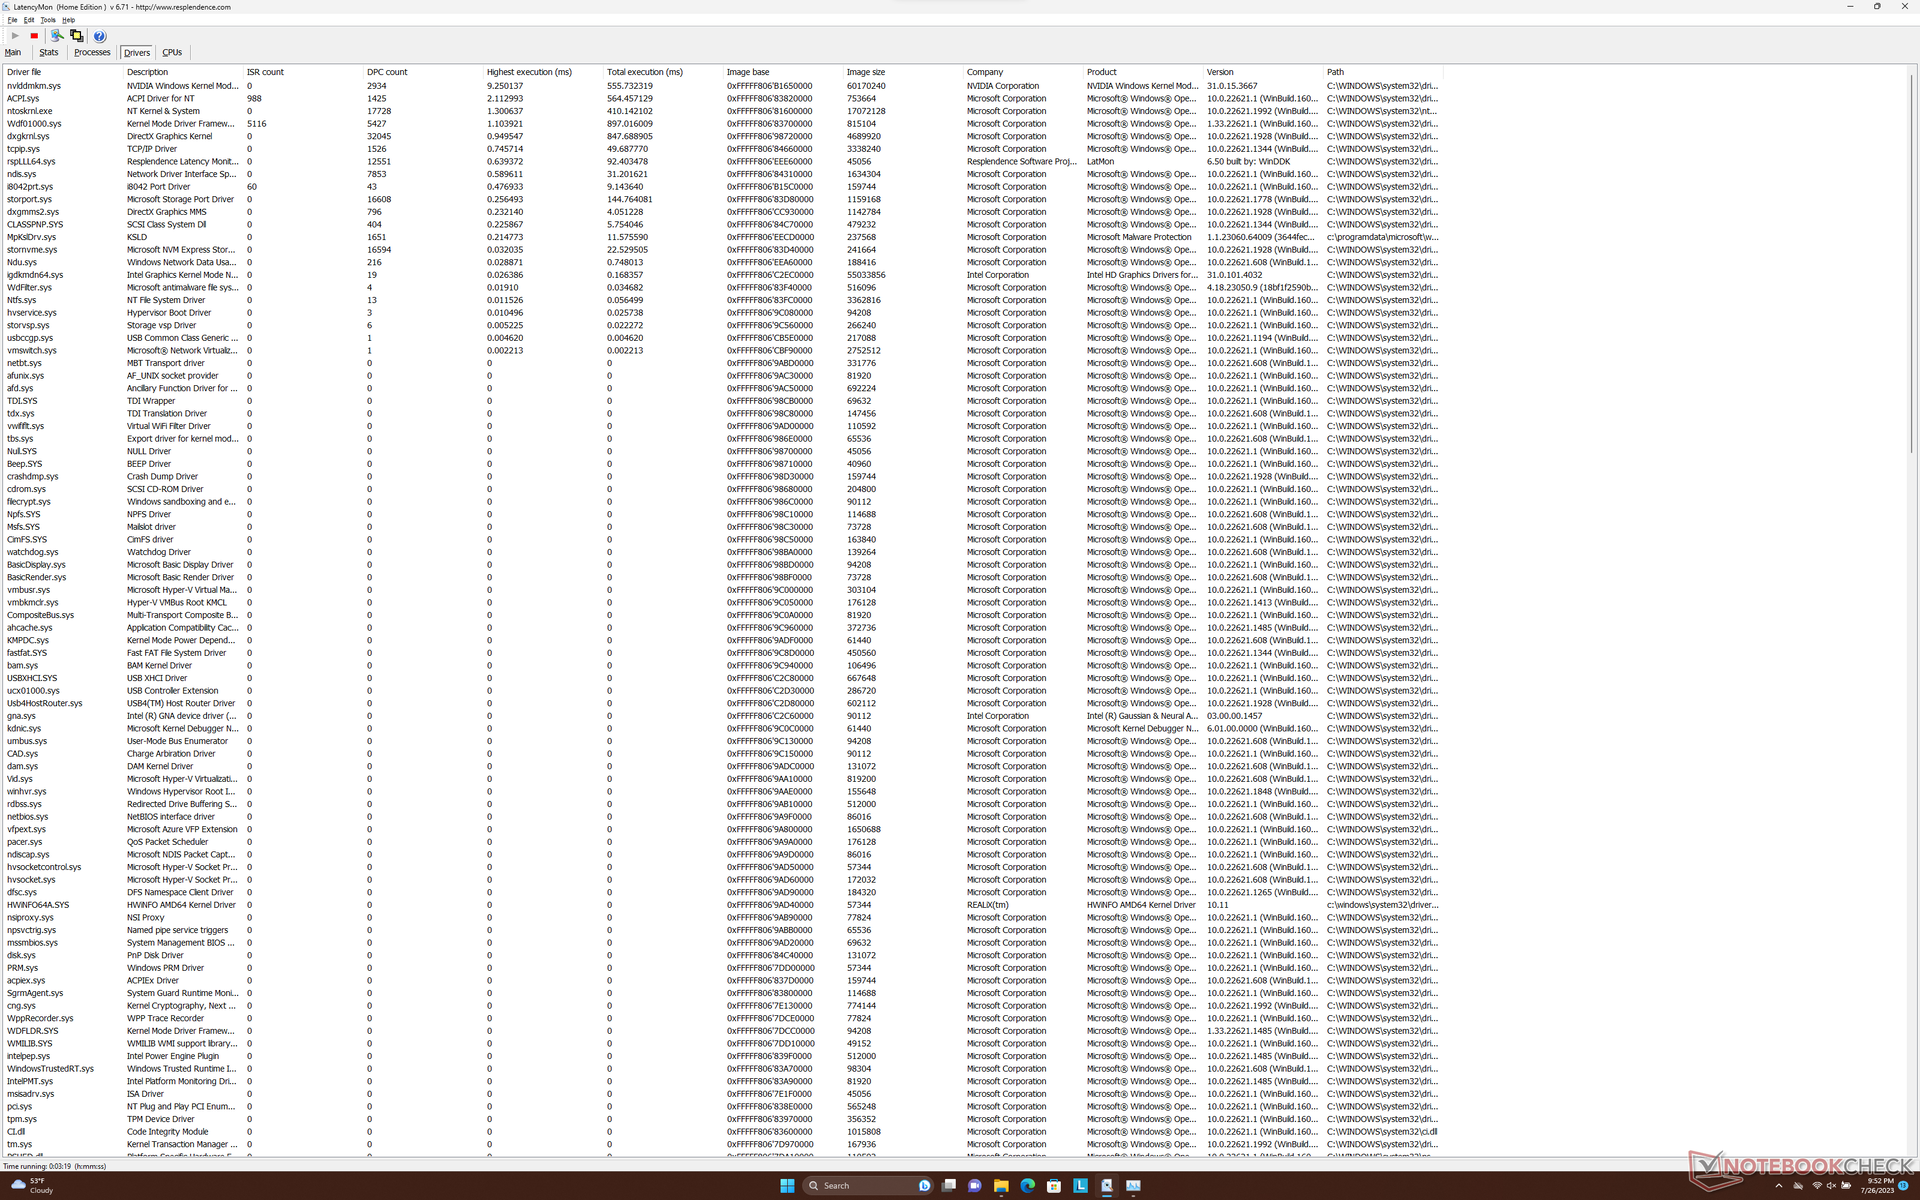
DPC latentie
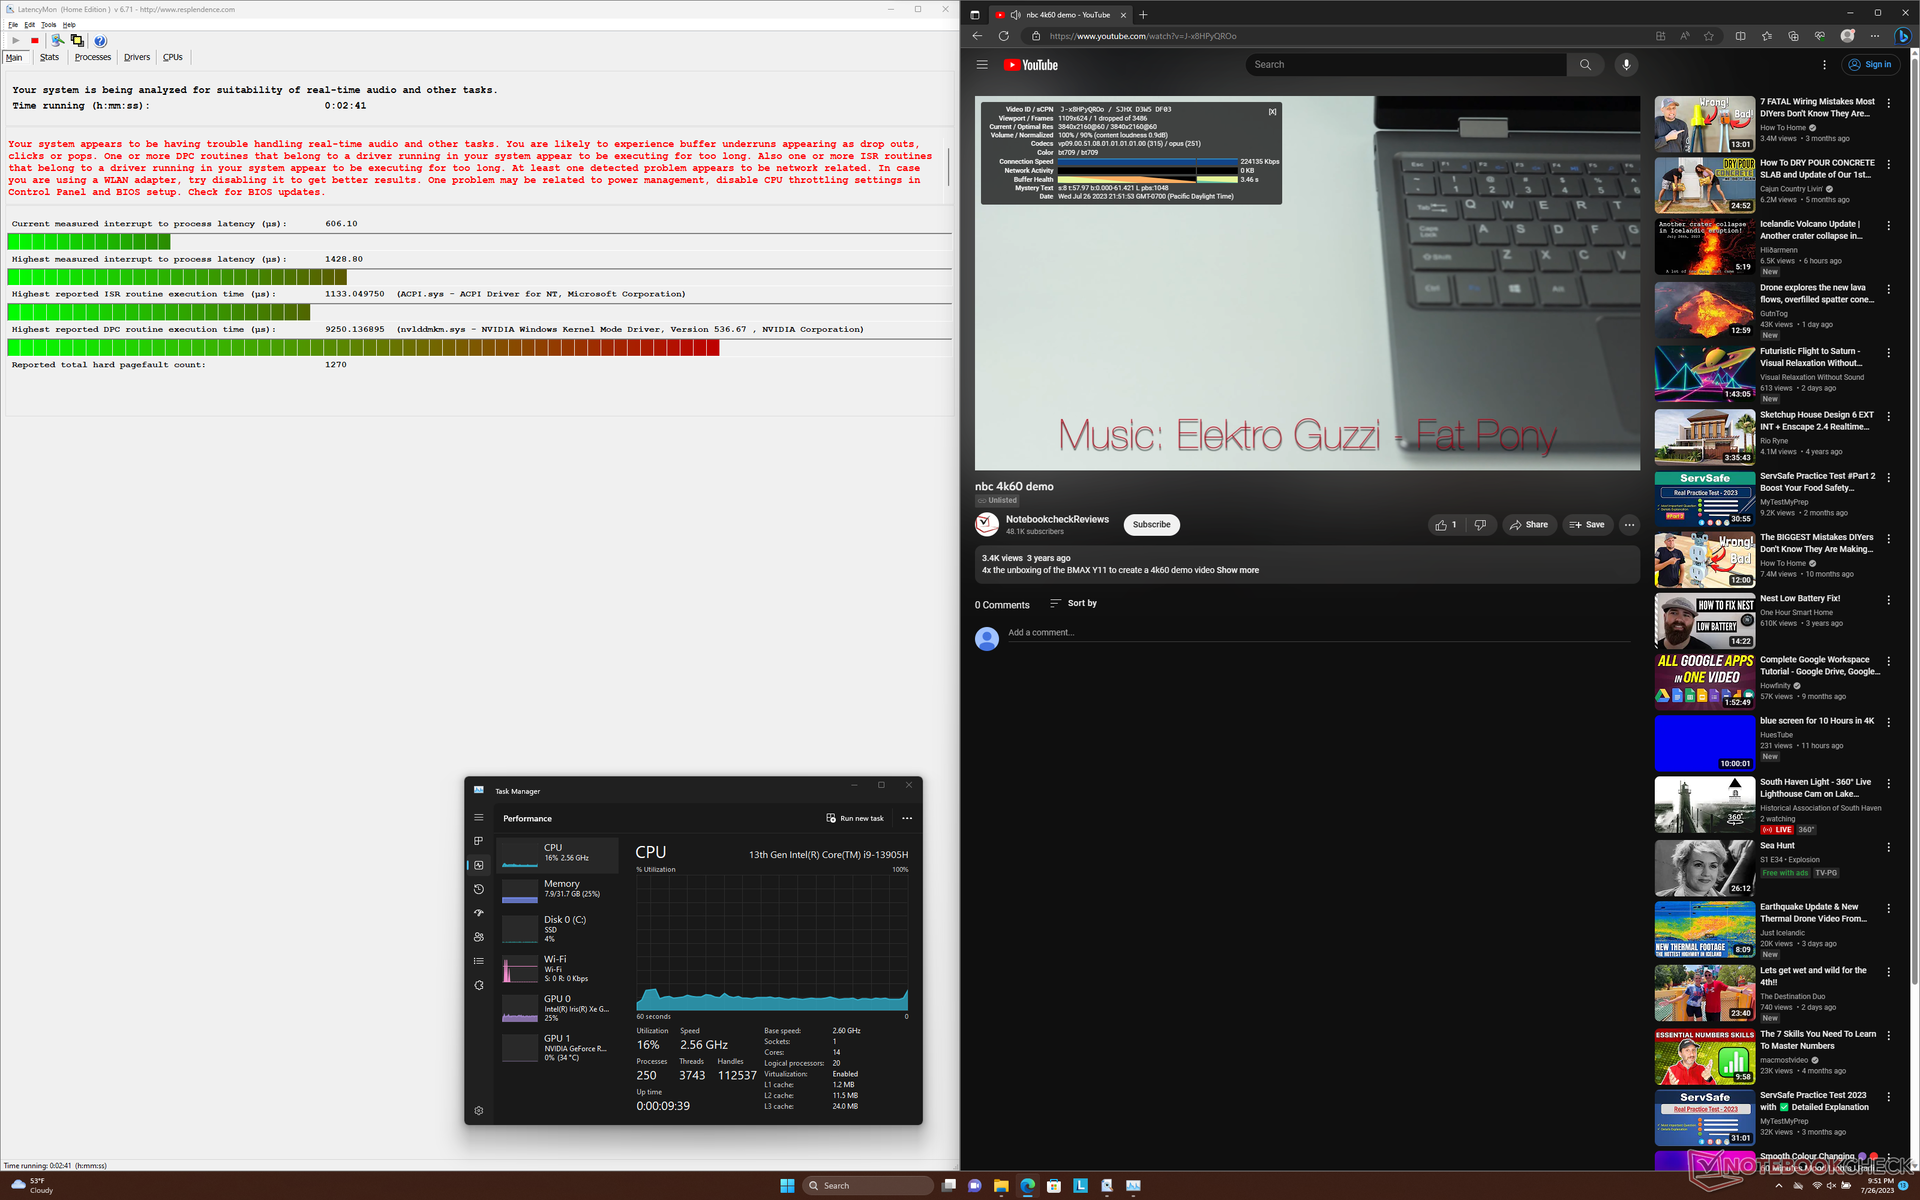
LatencyMon onthult DPC-problemen bij het openen van meerdere browsertabbladen van onze startpagina. het afspelen van 4K-video's met 60 FPS is verder uitstekend met slechts één dropped frame tijdens een tijdsbestek van 60 seconden.
| DPC Latencies / LatencyMon - interrupt to process latency (max), Web, Youtube, Prime95 | |
| Lenovo Yoga Pro 9 16-IRP G8 | |
| Acer Swift Edge SFE16-42-R1GM | |
| Asus VivoBook Pro 16 | |
| Lenovo Slim Pro 9i 16IRP8 | |
| Dell Inspiron 16 Plus 7620 | |
| HP Envy 16 h0112nr | |
* ... kleiner is beter
Opslagapparaten
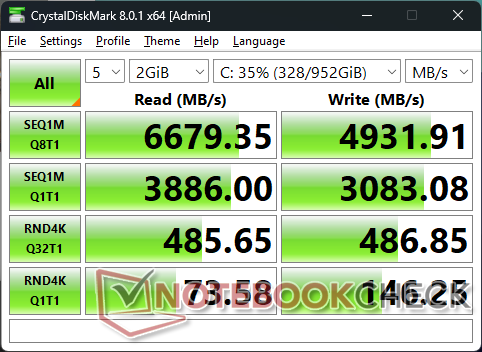
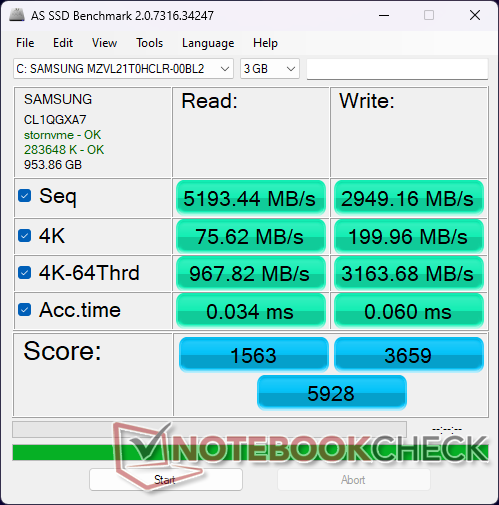

| Drive Performance rating - Percent | |
| Acer Swift Edge SFE16-42-R1GM | |
| Lenovo Yoga Pro 9 16-IRP G8 | |
| Lenovo Slim Pro 9i 16IRP8 | |
| HP Envy 16 h0112nr | |
| Asus VivoBook Pro 16 | |
| Dell Inspiron 16 Plus 7620 | |
* ... kleiner is beter
Disk Throttling: DiskSpd Read Loop, Queue Depth 8
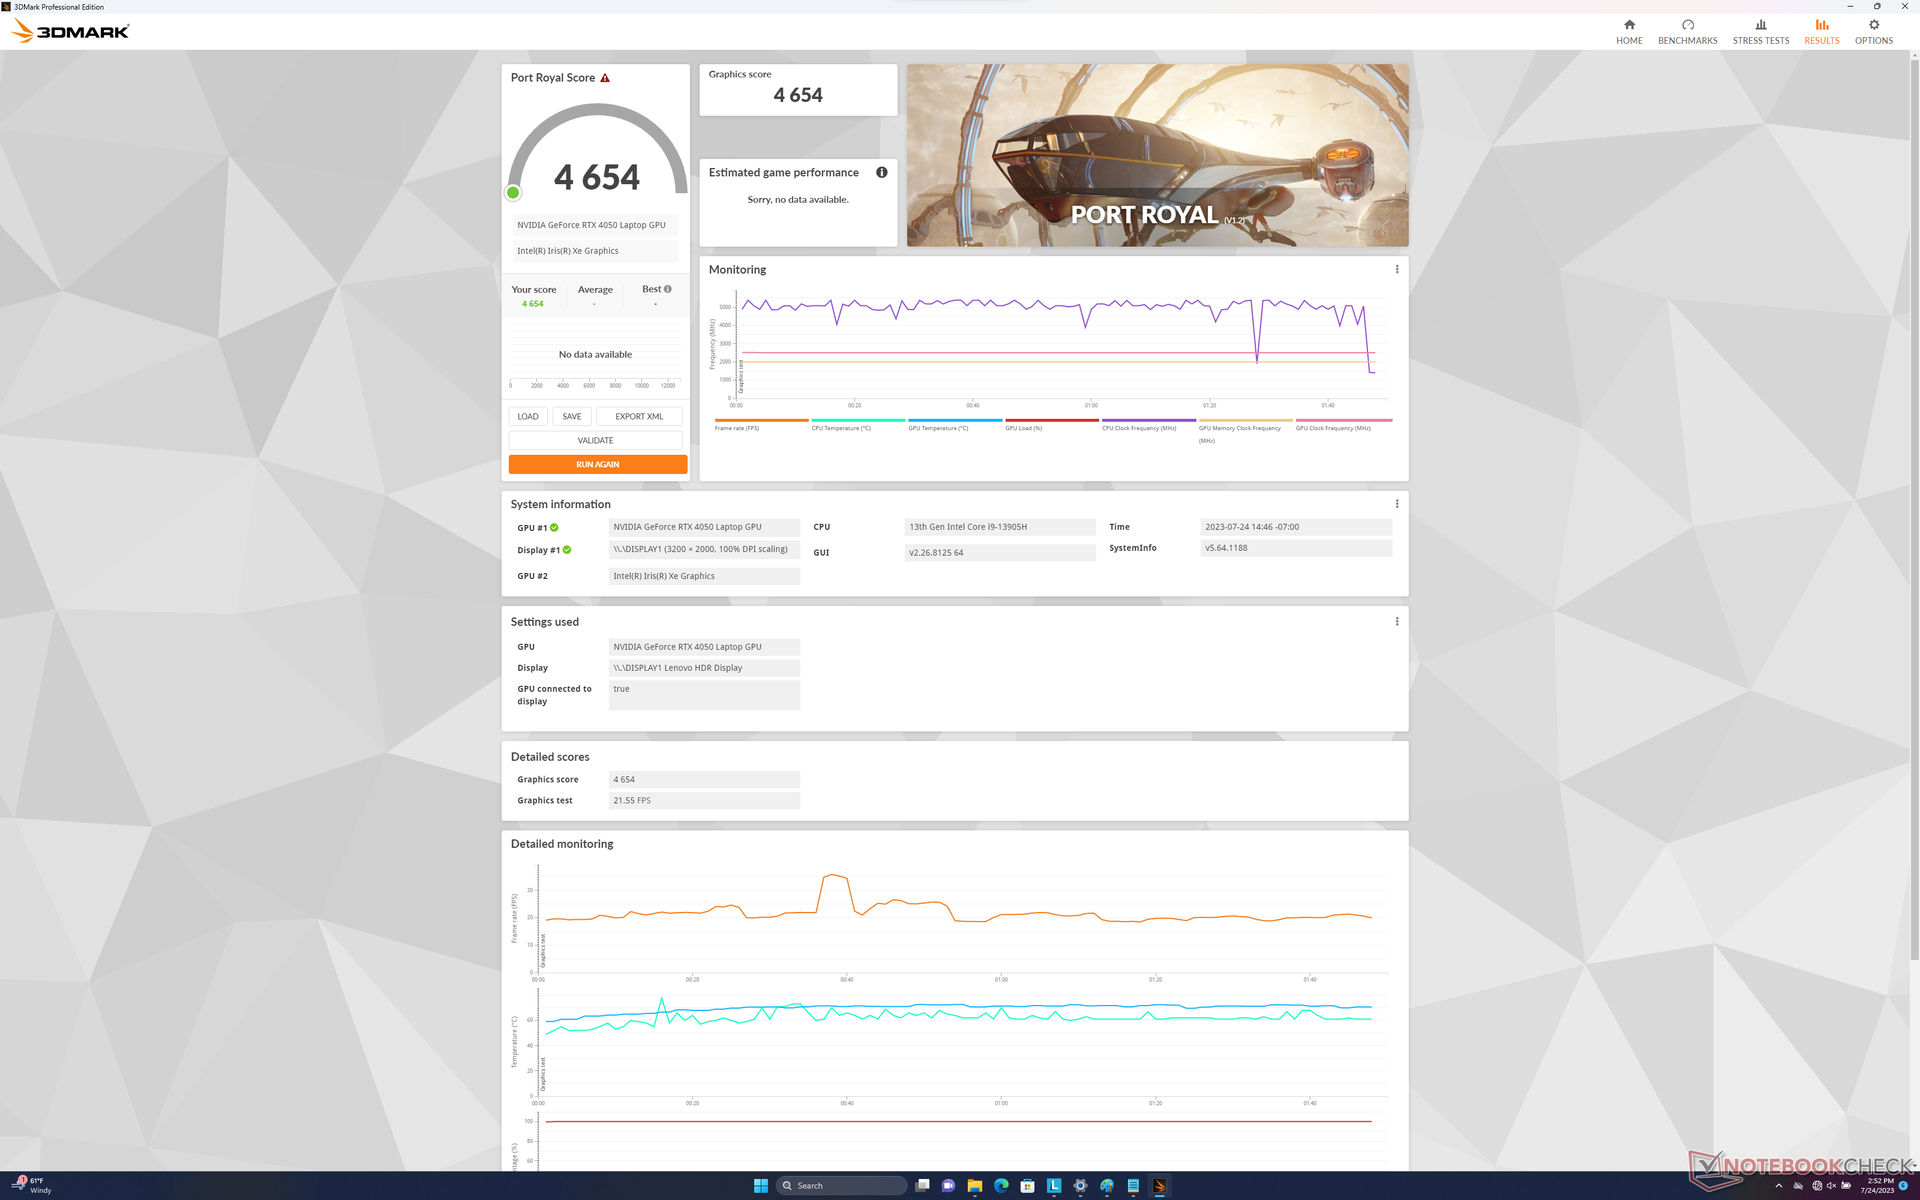
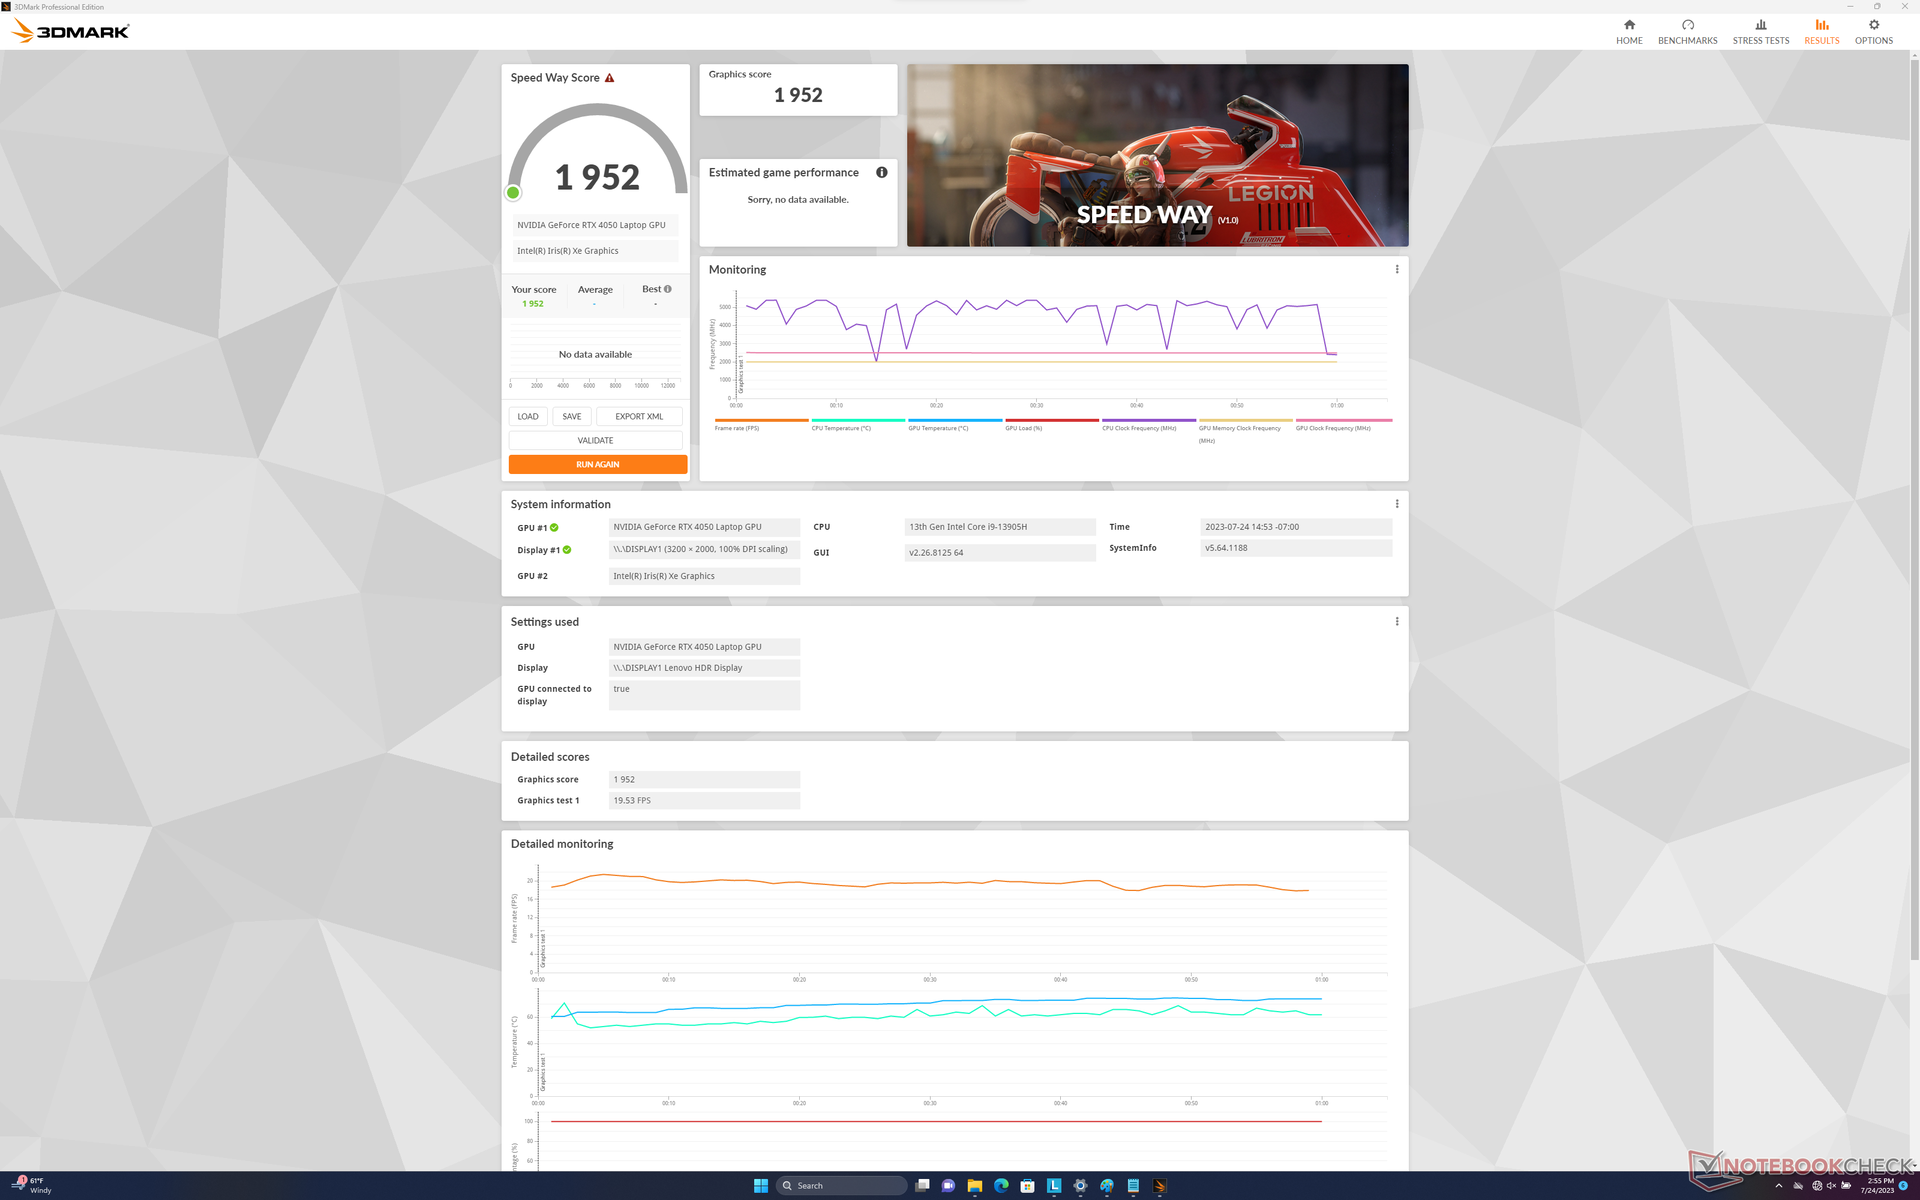
GPU-prestaties
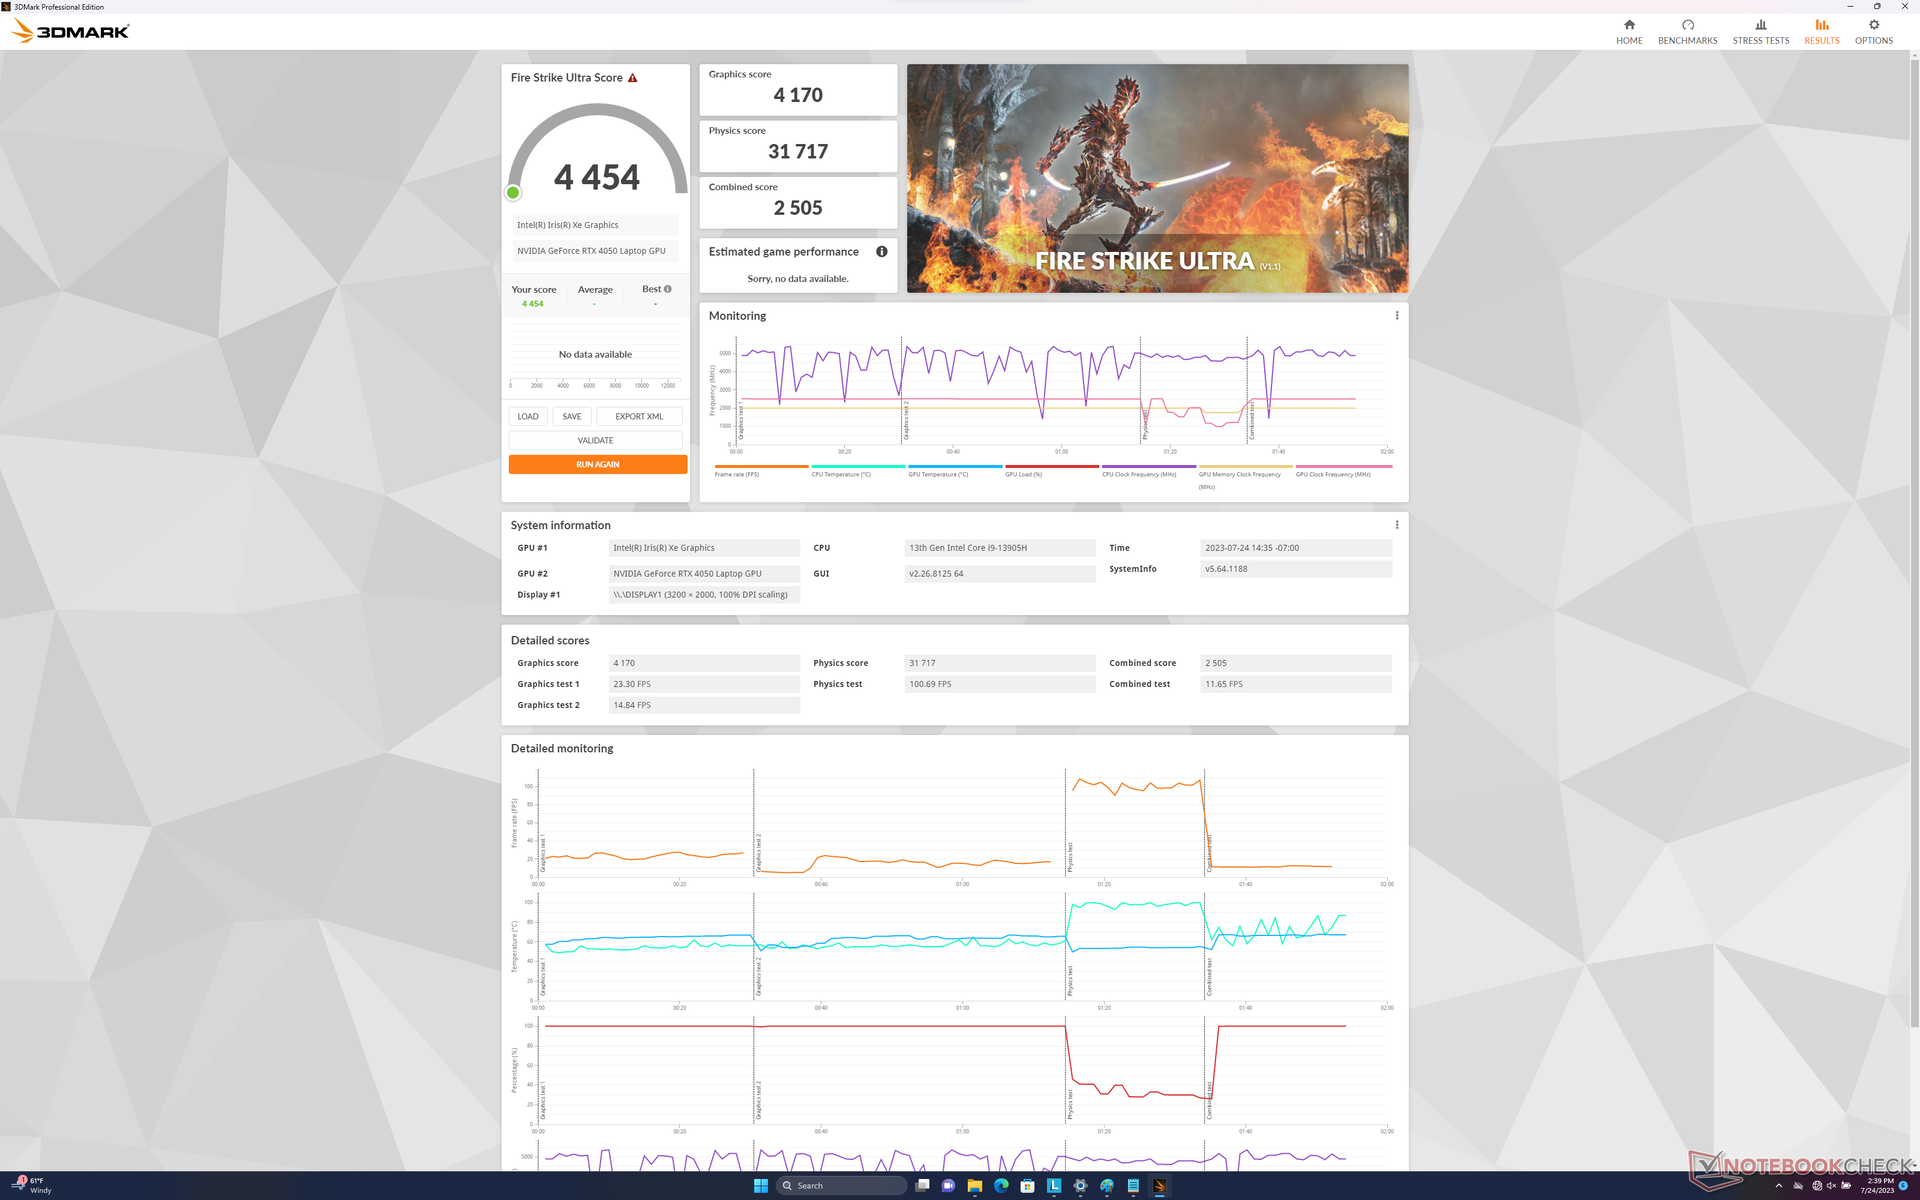
De mobiele GeForce RTX 4050 is een aanzienlijke upgrade ten opzichte van de teleurstellende mobiele RTX 3050 serie. De ruwe grafische prestaties zijn ongeveer 50 tot 60 procent sneller dan de RTX 3050 Ti om op gelijke hoogte te komen met de mobiele RTX 3060.
Opwaarderen naar de RTX 4060 configuratie zal de prestaties naar verwachting met ongeveer 20 procent verbeteren.
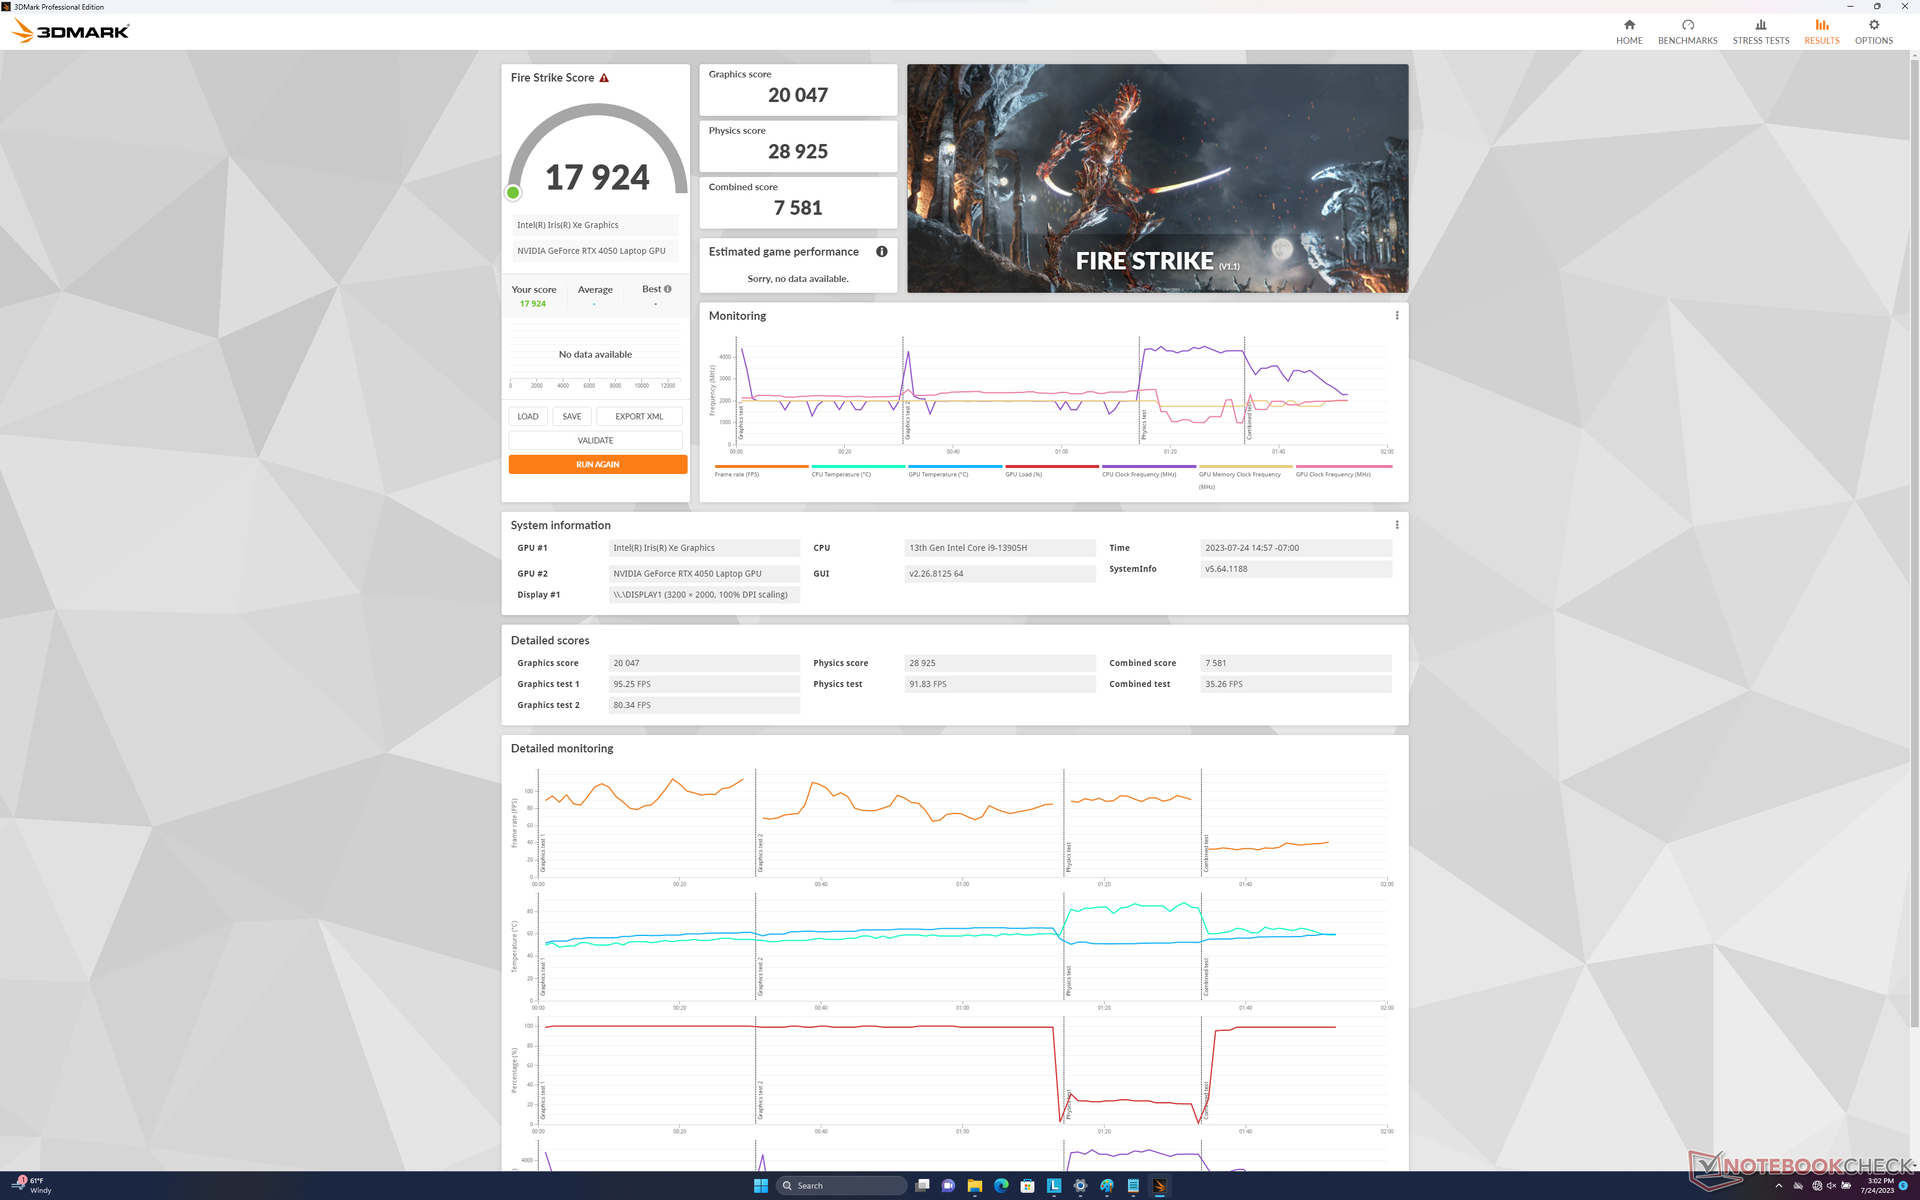
Het draaien in de Balanced-modus in plaats van de Performance-modus heeft een kleine impact op de prestaties, zoals blijkt uit onze Fire Strike resultaten in de tabel hieronder.
| Vermogen Profiel | Fire Strike Fysieke Score | Grafische Score | Gecombineerde score |
| Batterij | 30199 (-4%) | 12900 (-39%) | 5642 (-43%) |
| Gebalanceerd | 28925 (-8%) | 20047 (-6%) | 7581 (-24%) |
| Prestaties | 31606 | 21212 | 9969 |

| 3DMark 11 Performance | 28168 punten | |
| 3DMark Fire Strike Score | 19946 punten | |
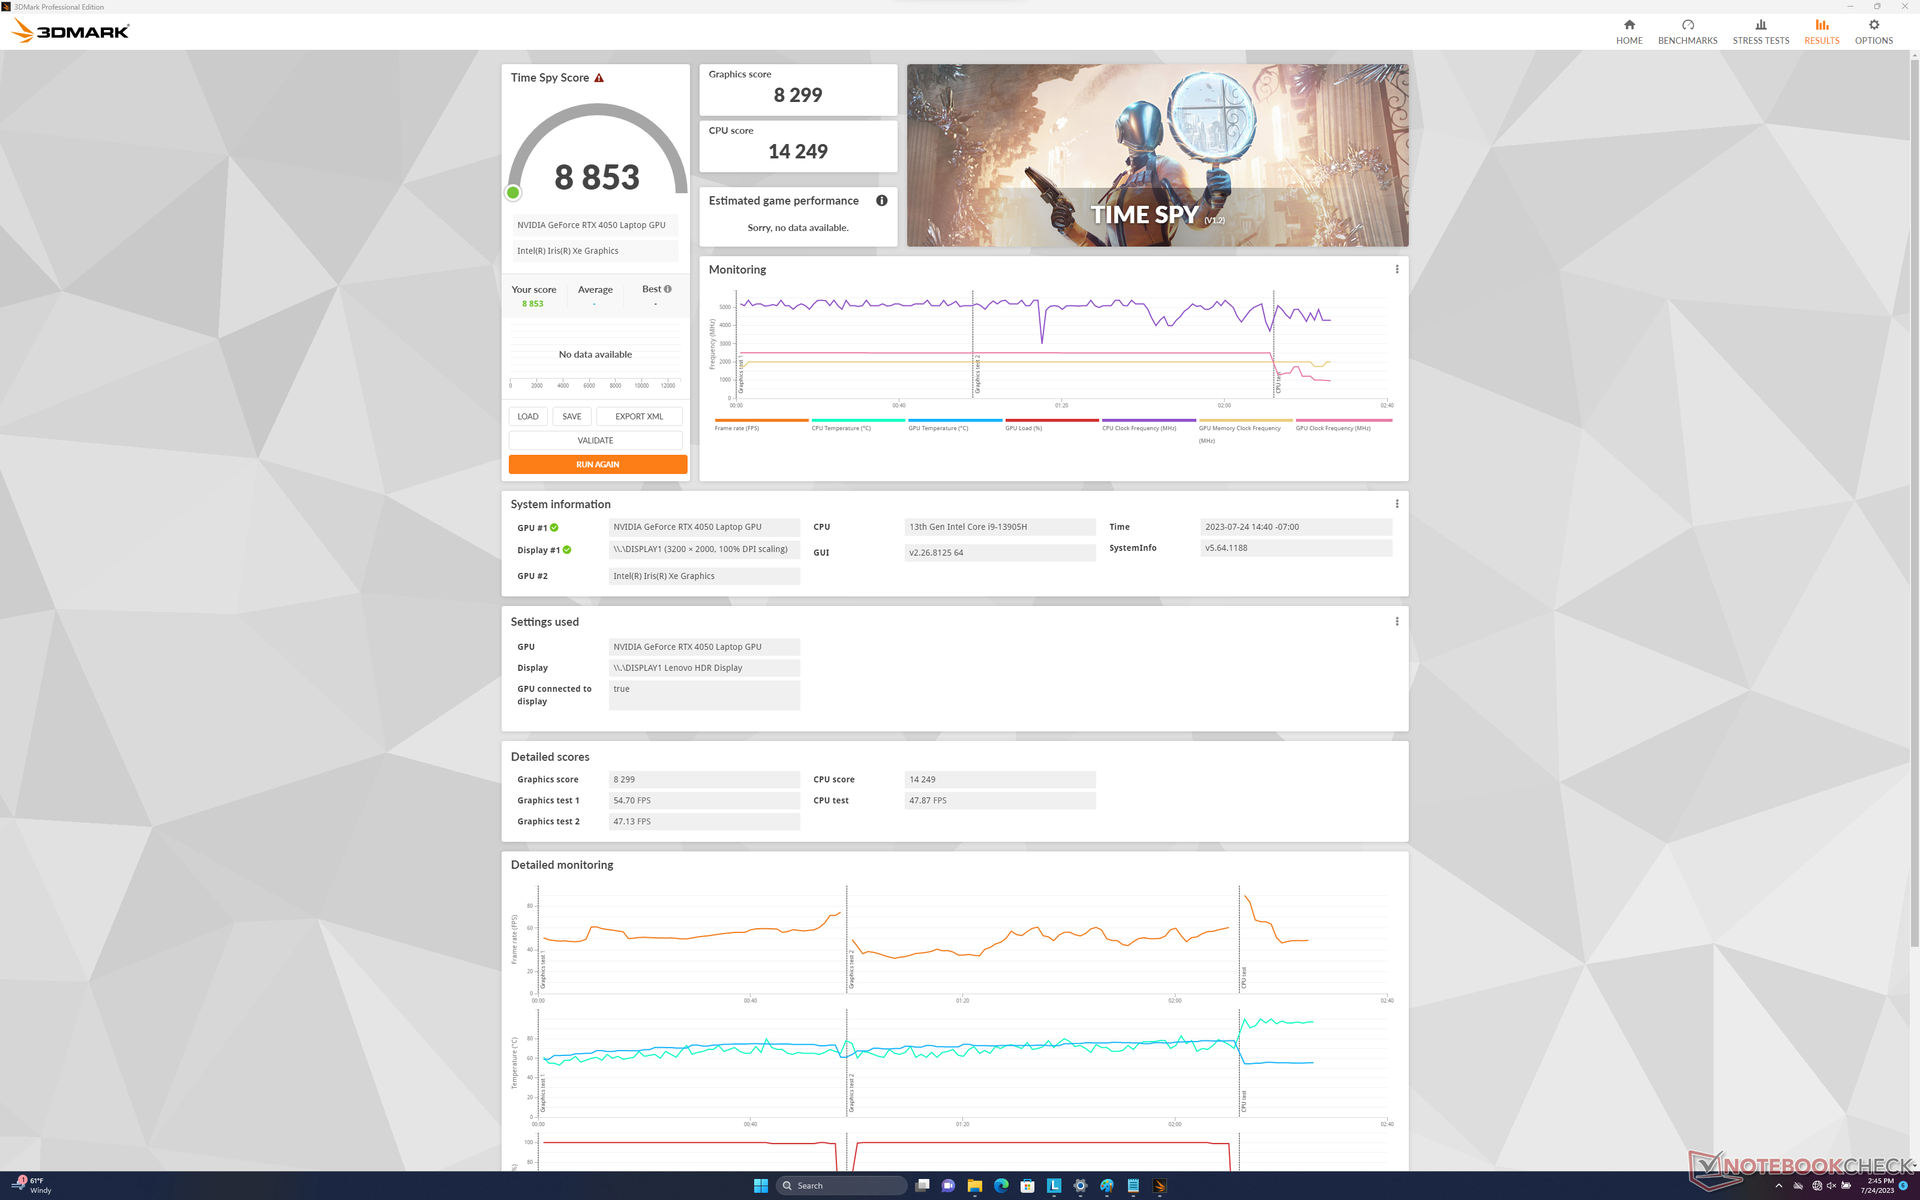
| 3DMark Time Spy Score | 8853 punten | |
Help | ||
* ... kleiner is beter
Spelprestaties
Hoewel het technisch gezien geen spelcomputer is, is het systeem meer dan geschikt om de nieuwste titels te spelen, zelfs op de native QHD+ resolutie. Nieuwere en veeleisendere titels zoals Returnal kunnen op maximale instellingen worden afgespeeld, maar DLSS wordt aanbevolen voor beter verdraagbare framerates.
G-Sync wordt helaas niet ondersteund op het interne beeldscherm.
Witcher 3 FPS Chart
| lage | gem. | hoge | ultra | QHD | |
|---|---|---|---|---|---|
| GTA V (2015) | 183.7 | 180.6 | 167.8 | 96.8 | 67.5 |
| The Witcher 3 (2015) | 410.2 | 271.1 | 164.7 | 84.9 | 59.2 |
| Dota 2 Reborn (2015) | 180 | 162.5 | 155 | 138.6 | |
| Final Fantasy XV Benchmark (2018) | 186.9 | 118.6 | 83.5 | 60 | |
| X-Plane 11.11 (2018) | 153 | 130.6 | 103.2 | ||
| Strange Brigade (2018) | 429 | 202 | 164.7 | 144.1 | 96.3 |
| Cyberpunk 2077 1.6 (2022) | 121.3 | 105.9 | 78.7 | 64.1 | 38.5 |
| Tiny Tina's Wonderlands (2022) | 183.3 | 142.8 | 91.5 | 70.2 | 47.7 |
| F1 22 (2022) | 214 | 199.8 | 150.8 | 52.6 | 32.3 |
| Returnal (2023) | 64 | 63 | 59 | 52 | 34 |
Uitstoot
Systeemgeluid
Het ventilatorgeluid neigt zich te nestelen in het stille 25 tot 27 dB(A) bereik tegen een stille achtergrond van 22.7 dB(A) bij het uitvoeren van niet veeleisende belastingen zoals browsers of videostreams. Wanneer er echter hogere belastingen zoals games worden geïntroduceerd, nemen de ventilatoren gestaag toe tot een maximum van 52,6 dB(A) en zijn ze net zo luid als veel gaming laptops.
Het is de moeite waard om op te merken dat het ventilatorgeluid aanzienlijk daalt tot slechts 44,2 dB(A) wanneer games in de modus Gebalanceerd worden uitgevoerd in plaats van in de modus Prestaties. Het lagere ventilatorgeluid kan daarom de lichte afname in prestaties waard zijn, afhankelijk van de voorkeur van de gebruiker.
Geluidsniveau
| Onbelast |
| 22.7 / 22.7 / 27.5 dB (A) |
| Belasting |
| 28.9 / 52.5 dB (A) |
 | ||
30 dB stil 40 dB(A) hoorbaar 50 dB(A) luid |
||
min: | ||
| Lenovo Slim Pro 9i 16IRP8 GeForce RTX 4050 Laptop GPU, i9-13905H, Samsung PM9A1 MZVL21T0HCLR | Lenovo Yoga Pro 9 16-IRP G8 GeForce RTX 4060 Laptop GPU, i7-13705H, Samsung PM9A1 MZVL21T0HCLR | Asus VivoBook Pro 16 GeForce RTX 3050 Ti Laptop GPU, i7-12700H, Intel SSD 670p SSDPEKNU010TZ | Acer Swift Edge SFE16-42-R1GM Radeon 680M, R7 7735U, Micron 3400 1TB MTFDKBA1T0TFH | Dell Inspiron 16 Plus 7620 GeForce RTX 3050 Ti Laptop GPU, i7-12700H, Kioxia BG5 KBG50ZNS512G | HP Envy 16 h0112nr GeForce RTX 3060 Laptop GPU, i7-12700H, Micron 3400 1TB MTFDKBA1T0TFH | |
|---|---|---|---|---|---|---|
| Noise | -10% | -22% | -13% | -13% | -7% | |
| uit / omgeving * (dB) | 22.7 | 24.7 -9% | 25.2 -11% | 25.7 -13% | 23.3 -3% | 22.8 -0% |
| Idle Minimum * (dB) | 22.7 | 24.7 -9% | 25.2 -11% | 25.7 -13% | 25.7 -13% | 22.9 -1% |
| Idle Average * (dB) | 22.7 | 26.2 -15% | 25.2 -11% | 27 -19% | 26.1 -15% | 22.9 -1% |
| Idle Maximum * (dB) | 27.5 | 26.2 5% | 25.2 8% | 29.3 -7% | 30.6 -11% | 30.5 -11% |
| Load Average * (dB) | 28.9 | 39.7 -37% | 55.1 -91% | 42.3 -46% | 46.2 -60% | 41.4 -43% |
| Witcher 3 ultra * (dB) | 52.6 | 53.2 -1% | 49.2 6% | 51.1 3% | ||
| Load Maximum * (dB) | 52.5 | 53.2 -1% | 61.5 -17% | 42.7 19% | 49.4 6% | 51.4 2% |
* ... kleiner is beter
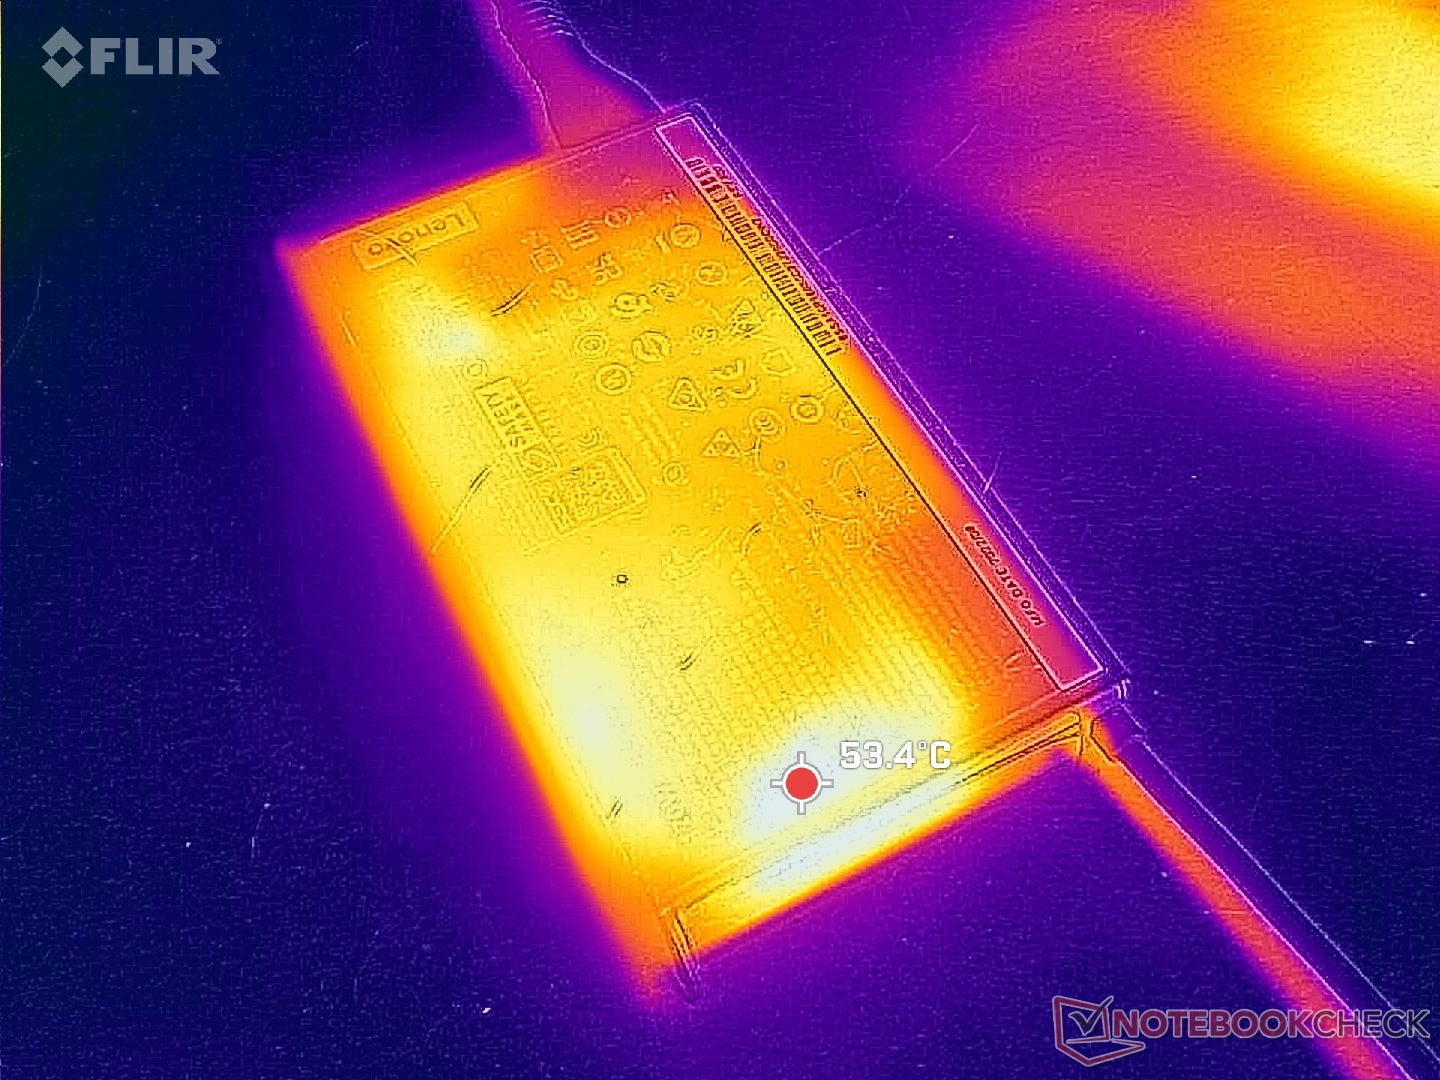
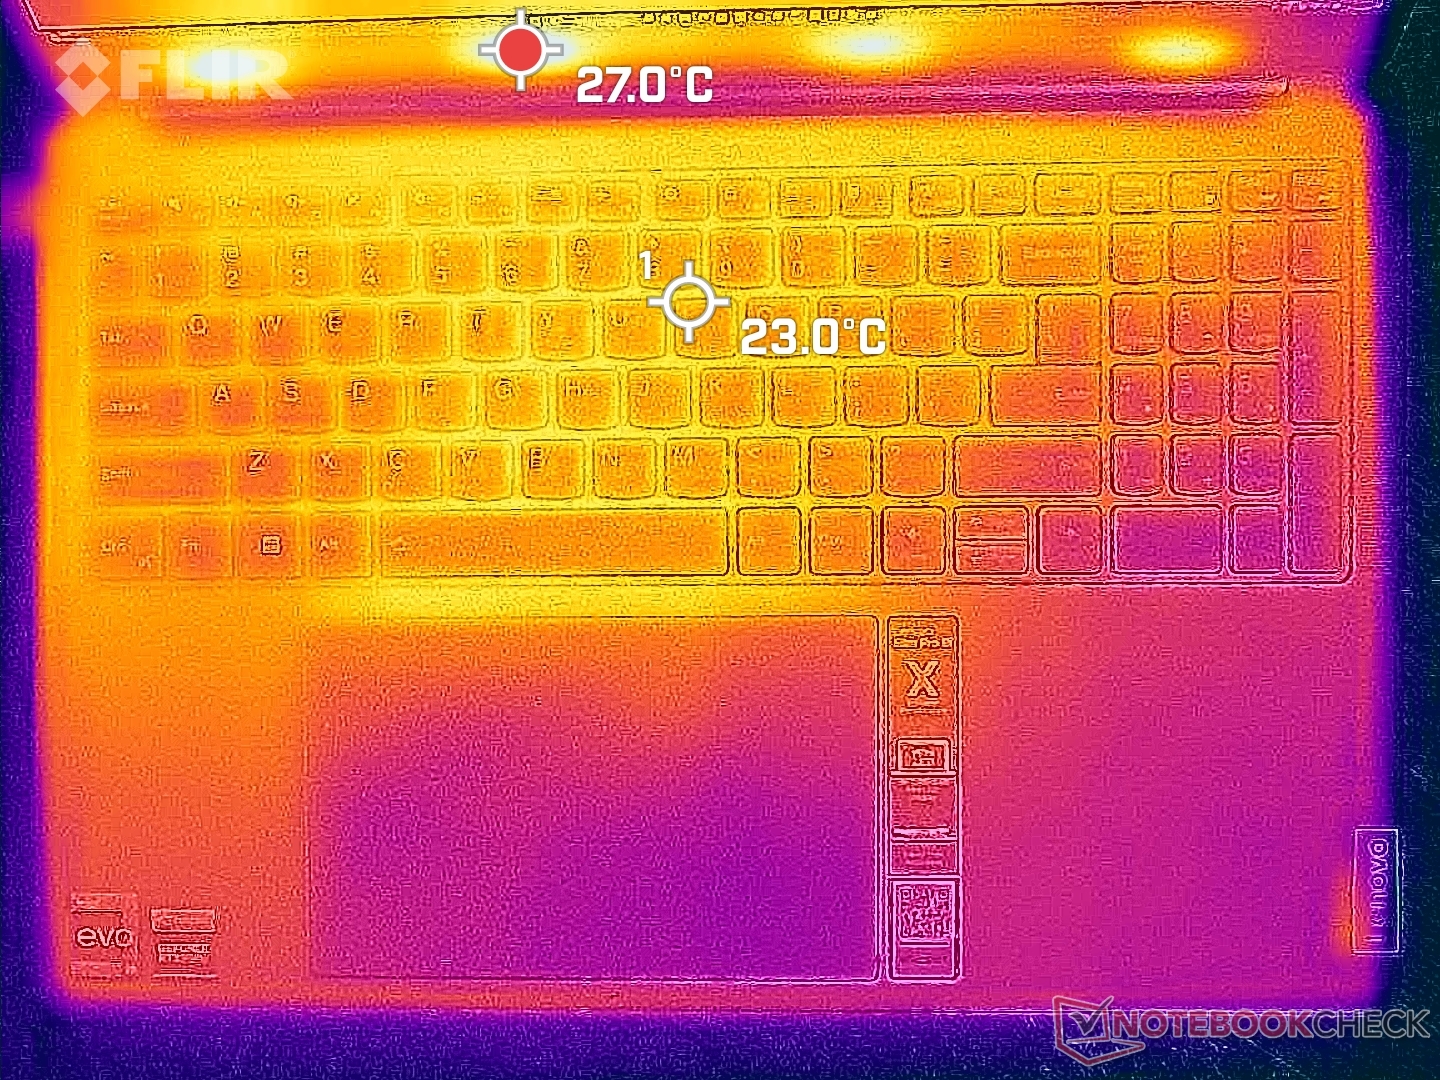
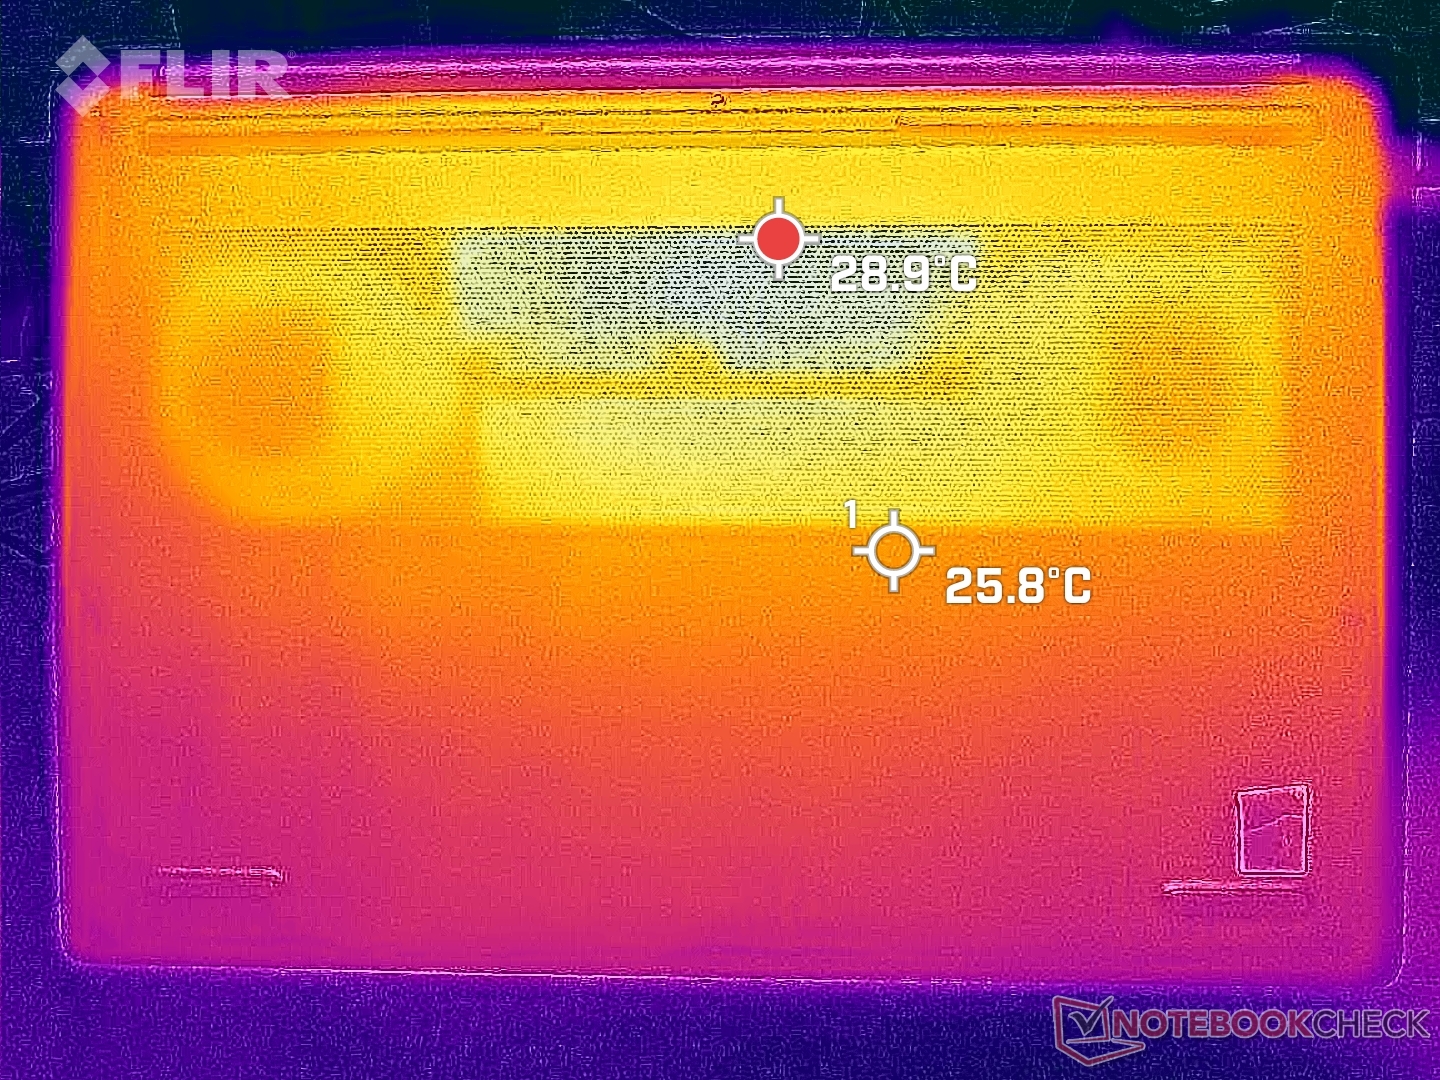
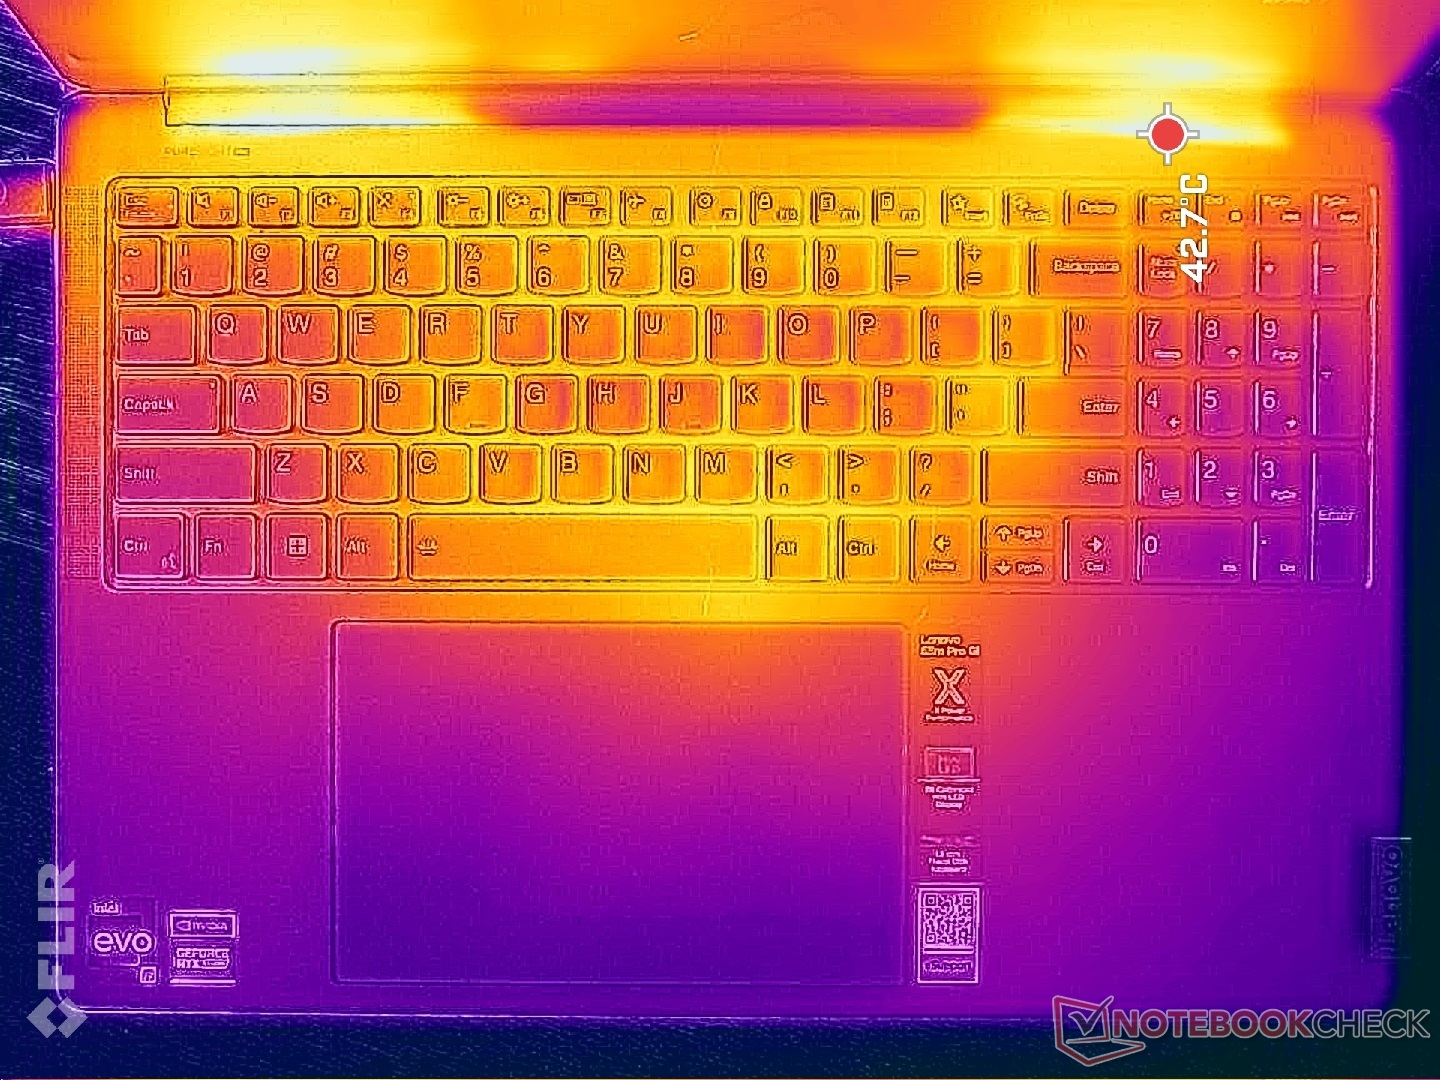
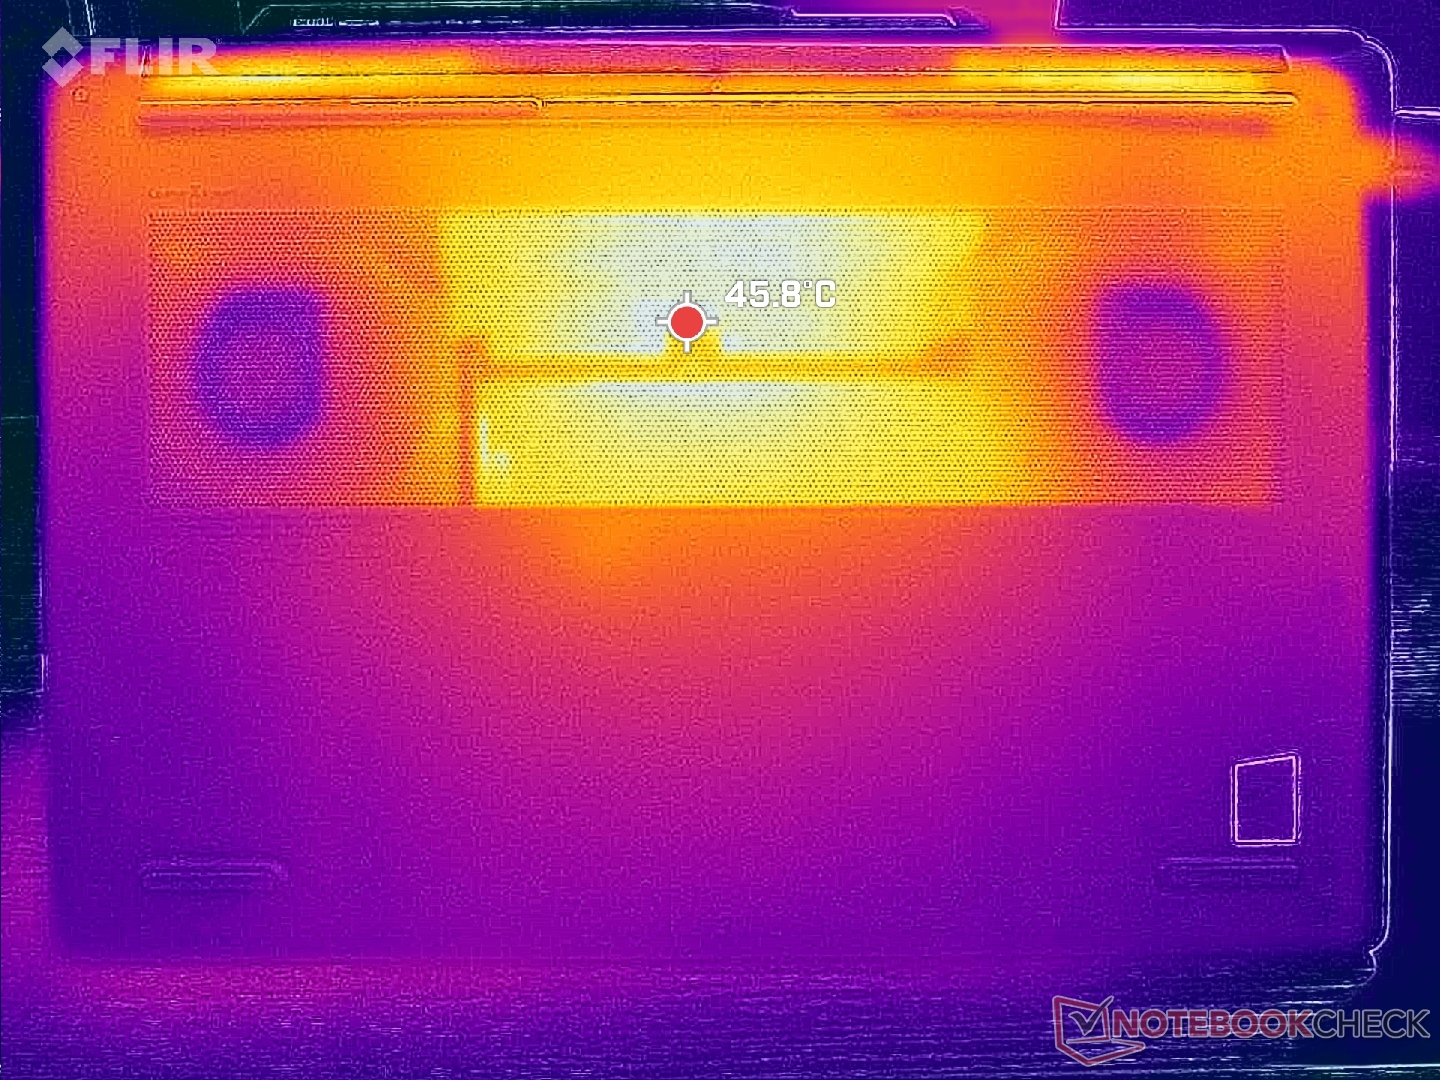
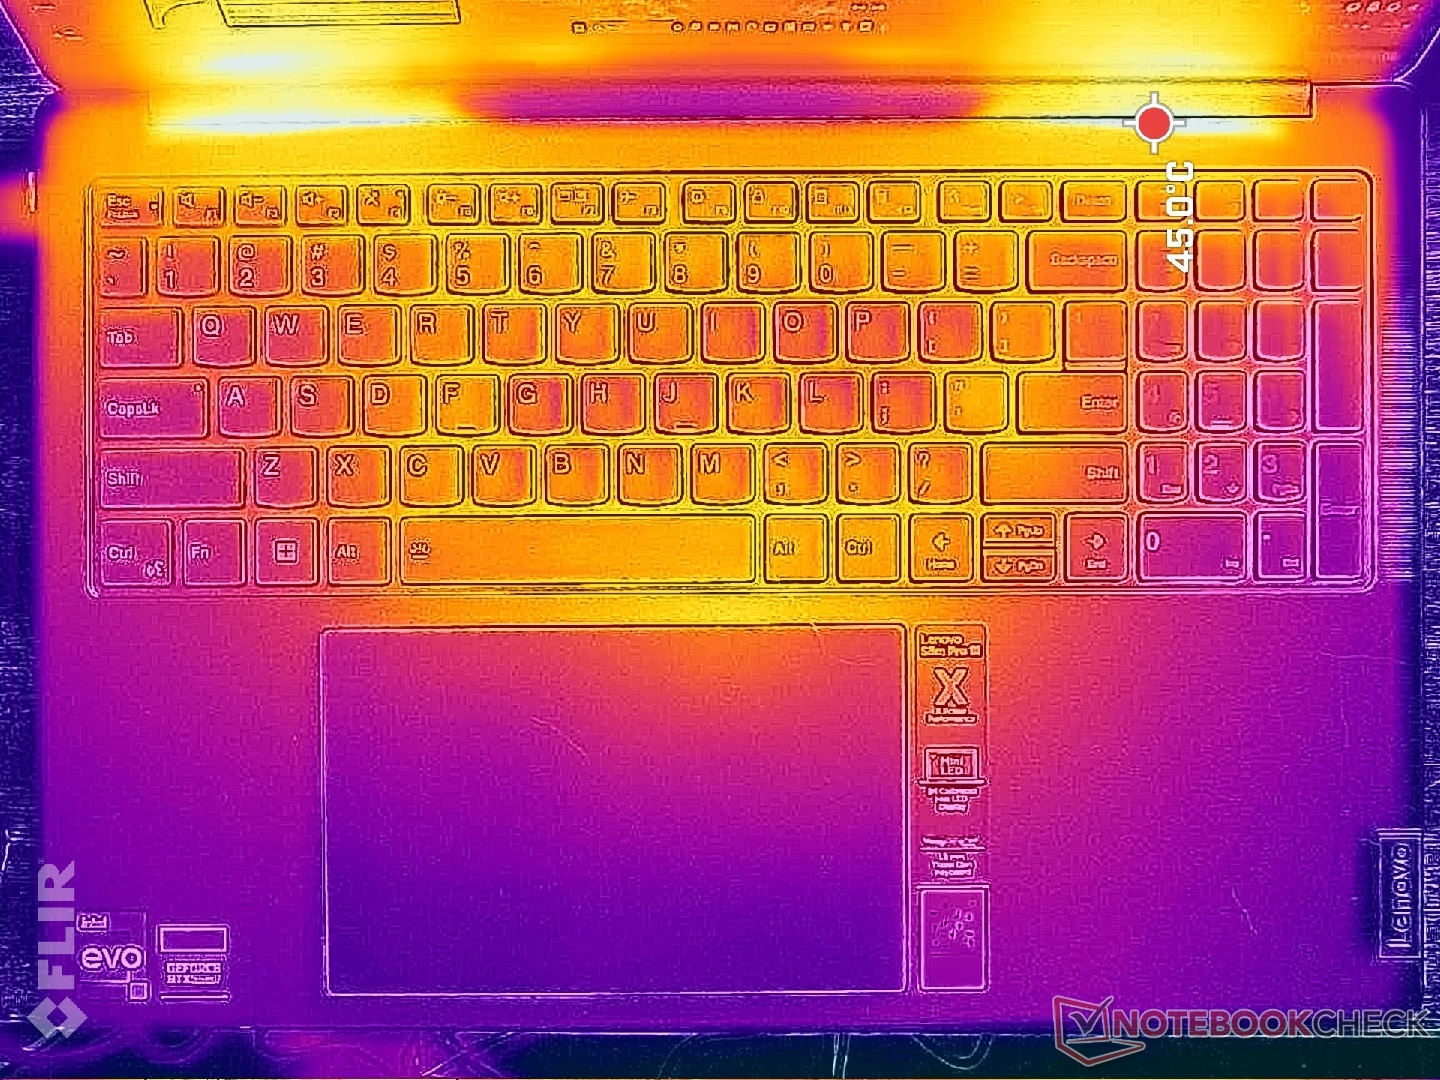
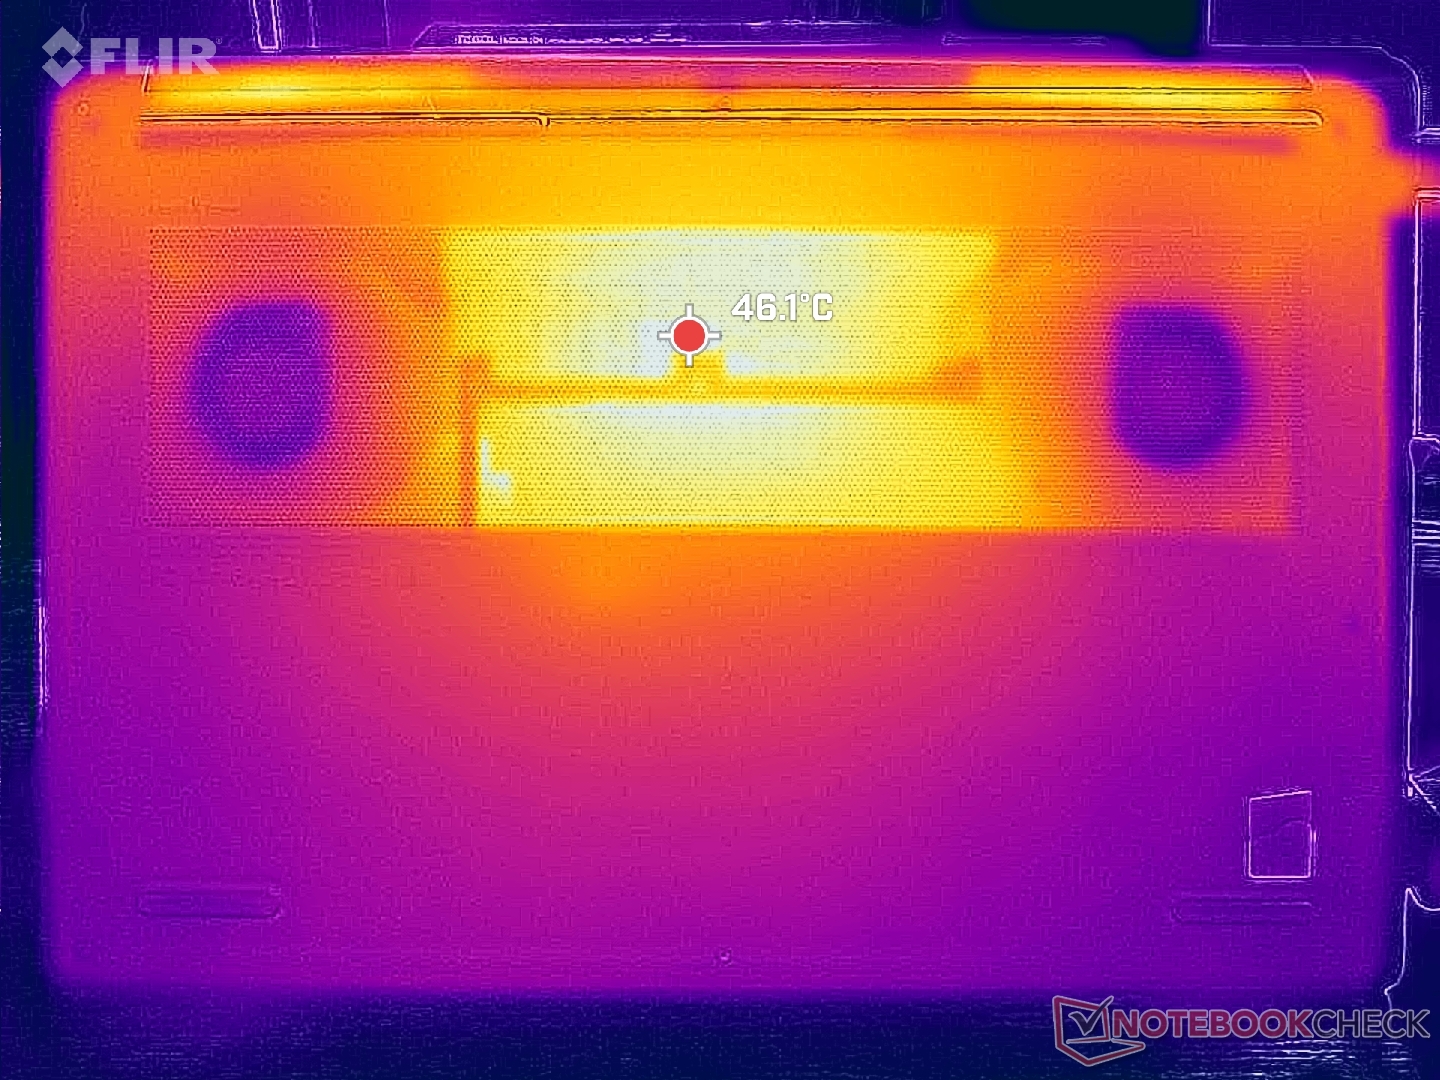
Temperatuur
De oppervlaktetemperaturen zijn het warmst in het midden, waar hete plekken kunnen oplopen tot respectievelijk meer dan 38 C en 44 C aan de boven- en onderkant. Het toetsenbord van de Lenovo is niet zo warm als dat van deInspiron 16 Plus 7620 waar het midden 50 C kan bereiken bij belasting.
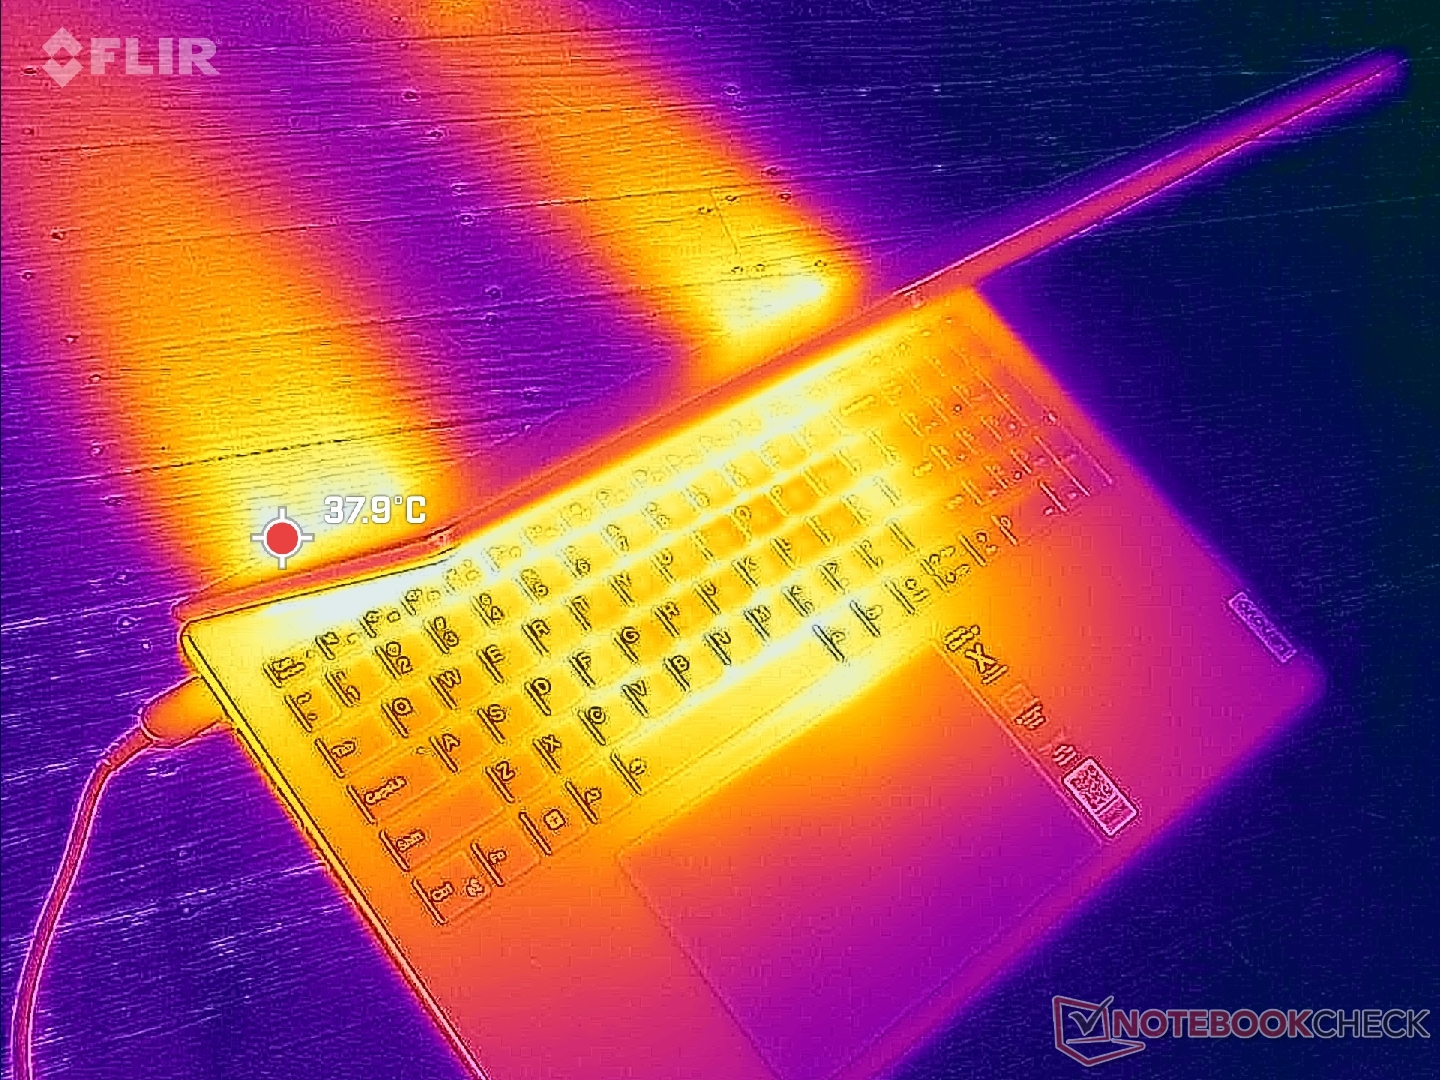
(+) De maximumtemperatuur aan de bovenzijde bedraagt 37.8 °C / 100 F, vergeleken met het gemiddelde van 36.8 °C / 98 F, variërend van 21 tot 71 °C voor de klasse Multimedia.
(±) De bodem warmt op tot een maximum van 44.8 °C / 113 F, vergeleken met een gemiddelde van 39.1 °C / 102 F
(+) Bij onbelast gebruik bedraagt de gemiddelde temperatuur voor de bovenzijde 28.8 °C / 84 F, vergeleken met het apparaatgemiddelde van 31.3 °C / 88 F.
(±) Bij het spelen van The Witcher 3 is de gemiddelde temperatuur voor de bovenzijde 35.4 °C / 96 F, vergeleken met het apparaatgemiddelde van 31.3 °C / 88 F.
(+) De handpalmsteunen en het touchpad bereiken maximaal de huidtemperatuur (32 °C / 89.6 F) en zijn dus niet heet.
(-) De gemiddelde temperatuur van de handpalmsteun van soortgelijke toestellen bedroeg 28.7 °C / 83.7 F (-3.3 °C / -5.9 F).
| Lenovo Slim Pro 9i 16IRP8 Intel Core i9-13905H, NVIDIA GeForce RTX 4050 Laptop GPU | Lenovo Yoga Pro 9 16-IRP G8 Intel Core i7-13705H, NVIDIA GeForce RTX 4060 Laptop GPU | Asus VivoBook Pro 16 Intel Core i7-12700H, NVIDIA GeForce RTX 3050 Ti Laptop GPU | Acer Swift Edge SFE16-42-R1GM AMD Ryzen 7 7735U, AMD Radeon 680M | Dell Inspiron 16 Plus 7620 Intel Core i7-12700H, NVIDIA GeForce RTX 3050 Ti Laptop GPU | HP Envy 16 h0112nr Intel Core i7-12700H, NVIDIA GeForce RTX 3060 Laptop GPU | |
|---|---|---|---|---|---|---|
| Heat | 0% | -16% | -11% | -5% | -8% | |
| Maximum Upper Side * (°C) | 37.8 | 41.6 -10% | 44.2 -17% | 49.4 -31% | 46 -22% | 45.2 -20% |
| Maximum Bottom * (°C) | 44.8 | 50 -12% | 53 -18% | 44.7 -0% | 45.8 -2% | 44 2% |
| Idle Upper Side * (°C) | 30.6 | 26.8 12% | 32.1 -5% | 34 -11% | 29.2 5% | 33.6 -10% |
| Idle Bottom * (°C) | 31 | 27.9 10% | 38.4 -24% | 31.6 -2% | 31 -0% | 32.6 -5% |
* ... kleiner is beter
Stresstest
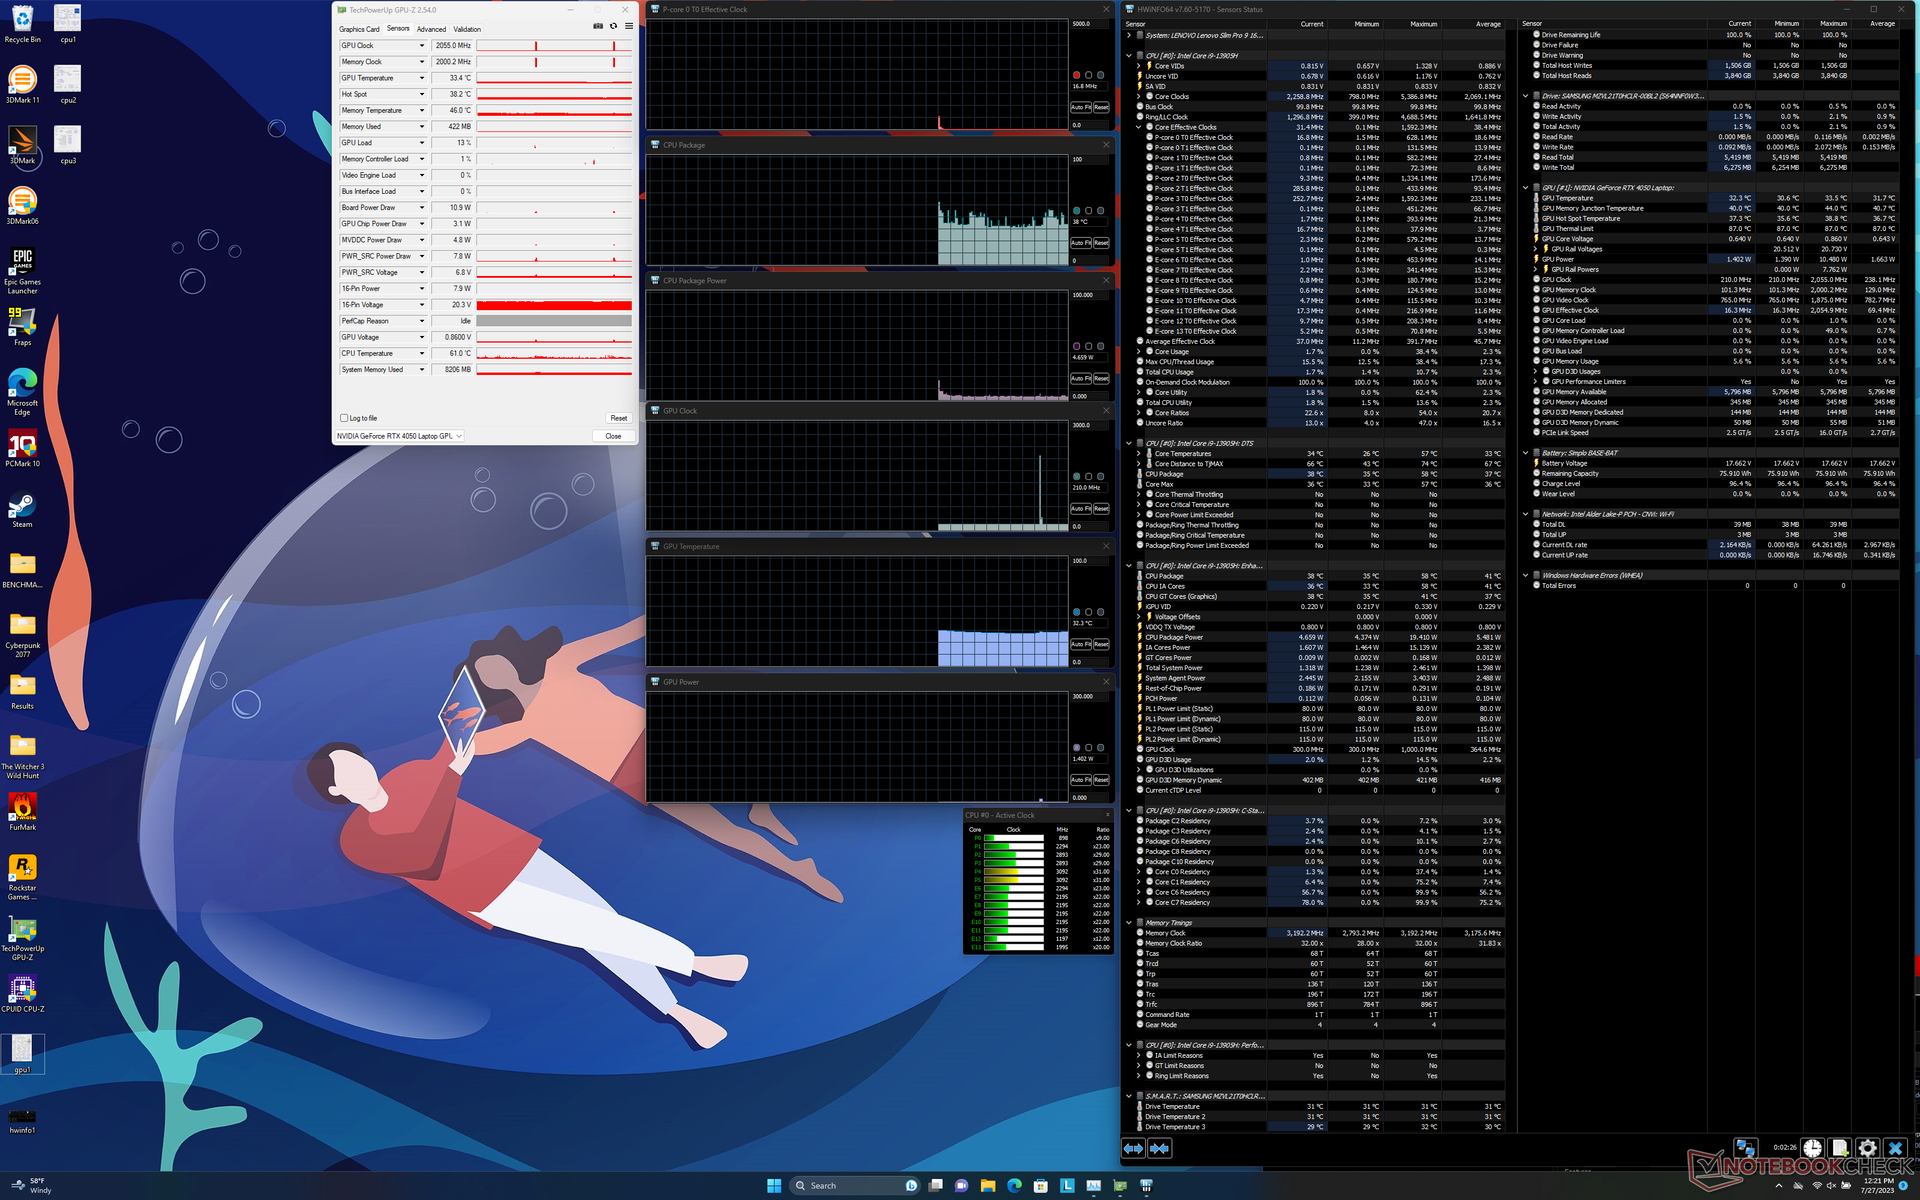
De CPU boostte naar 4 GHz, 120 W en 100 C gedurende de eerste 40 seconden bij het starten van Prime95 stress. Omdat 100 C niet ideaal is, daalden de kloksnelheden en het opgenomen vermogen snel naar slechts 3,0 tot 3,2 GHz en 85 W, respectievelijk, om een redelijkere kerntemperatuur van 82 C te handhaven. De hoge Turbo Boost kloksnelheden van de Core i9-13905H zijn dus niet houdbaar op de Slim Pro 9i vanwege koelbeperkingen.
De Nvidia GPU zou zich stabiliseren op 2505 MHz, 70 C en 72 W wanneer deze in de Witcher 3 in de modus Prestaties vergeleken met 2460 MHz, 62 C en 56 W in de modus Gebalanceerd. Het stroomverbruik van de GPU kan op zijn piek 92 W benaderen, terwijl de TGP-doelstelling 100 W is.
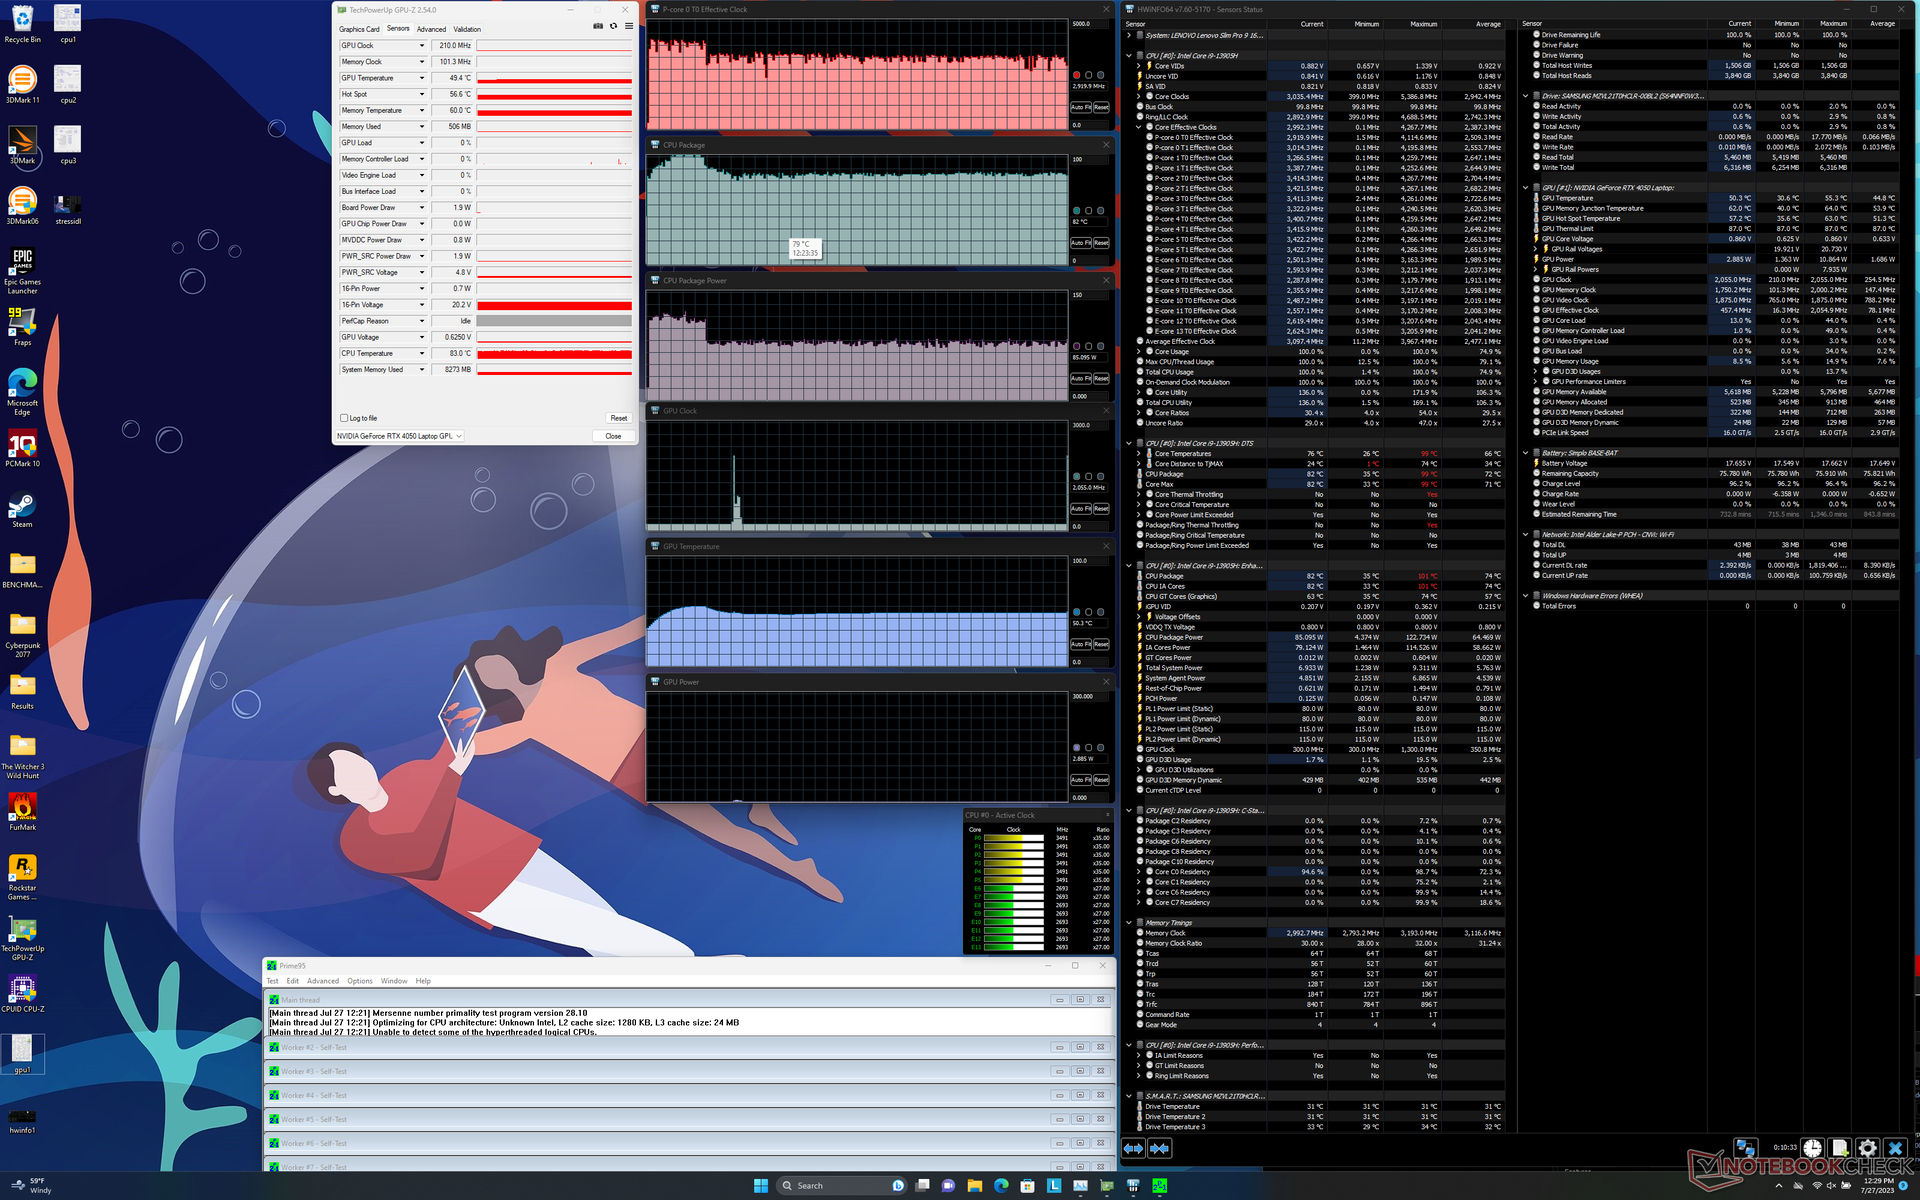
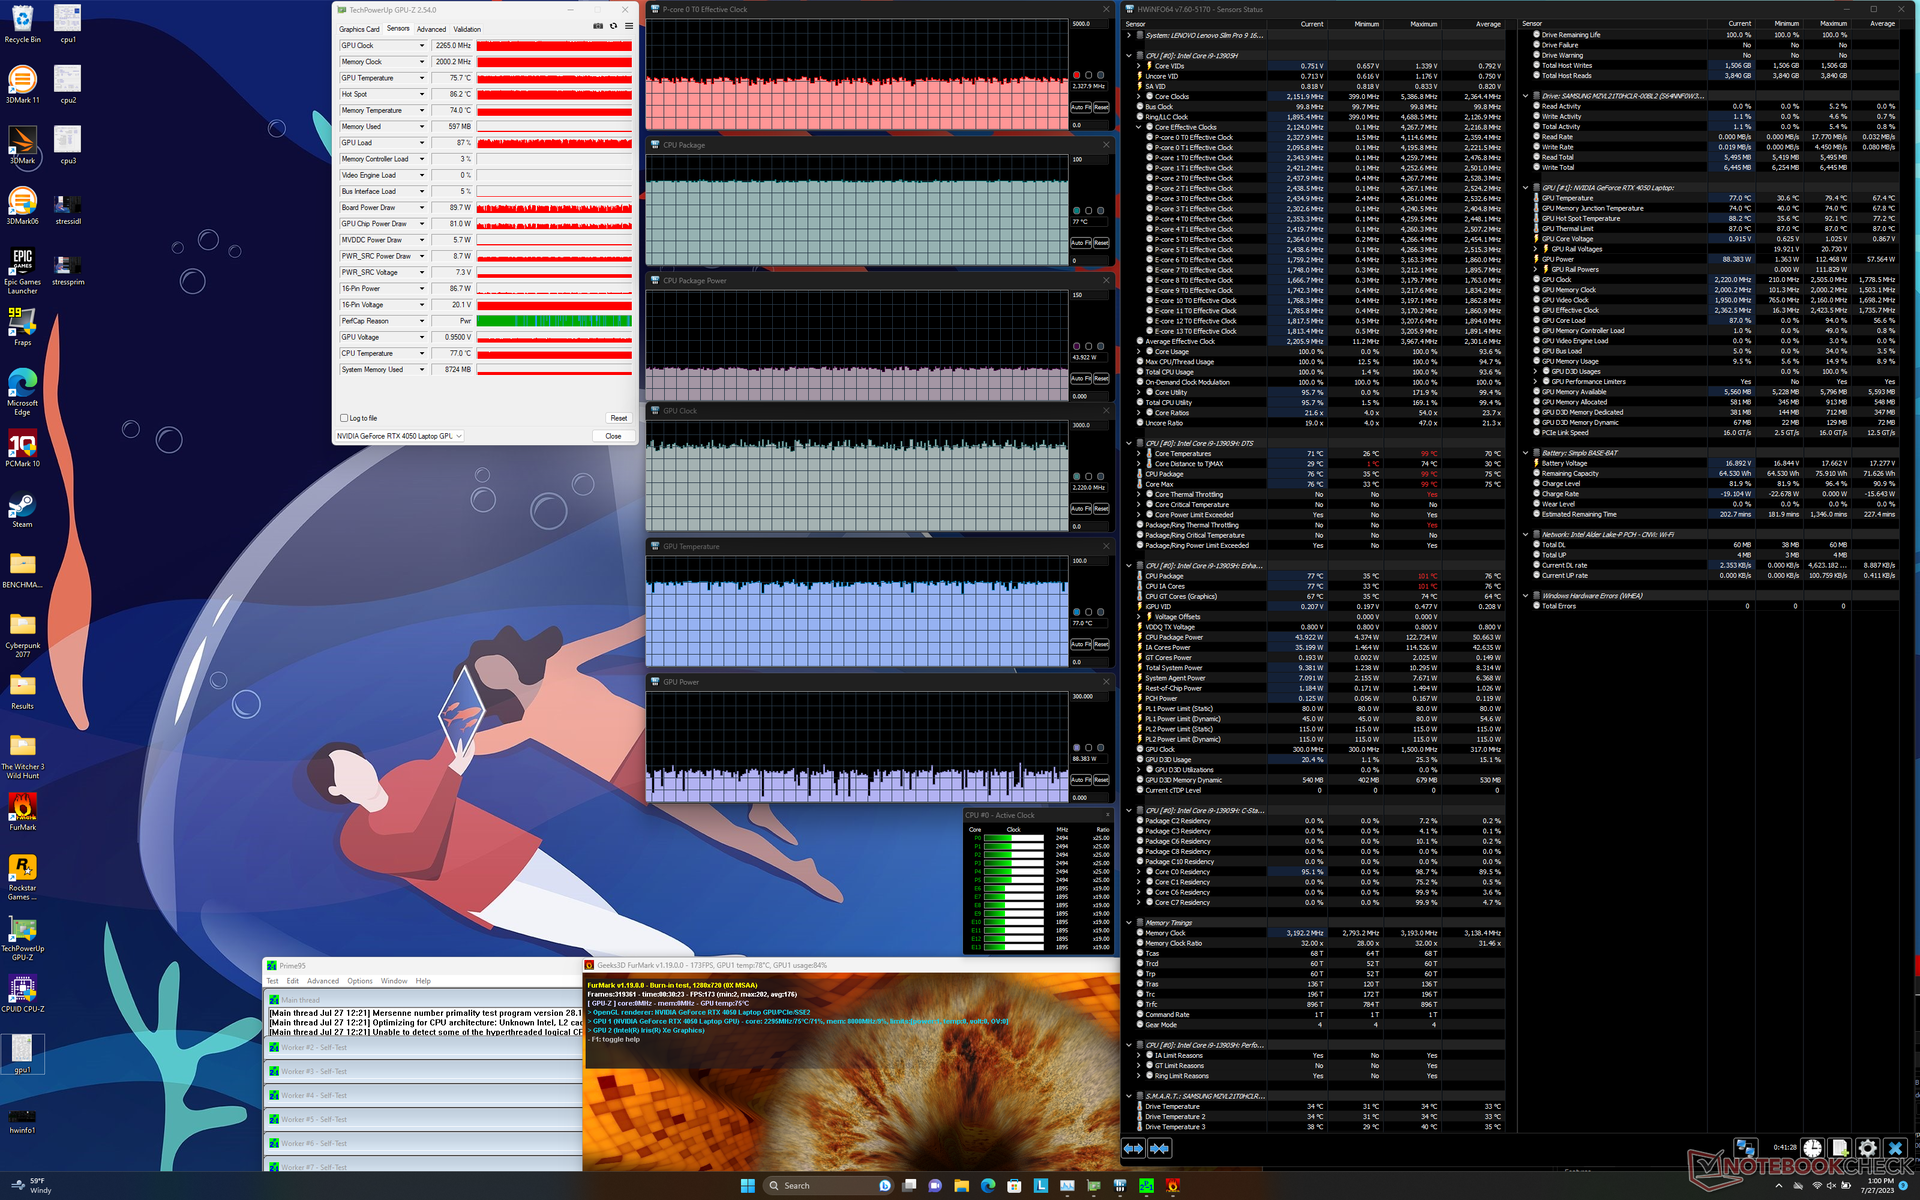
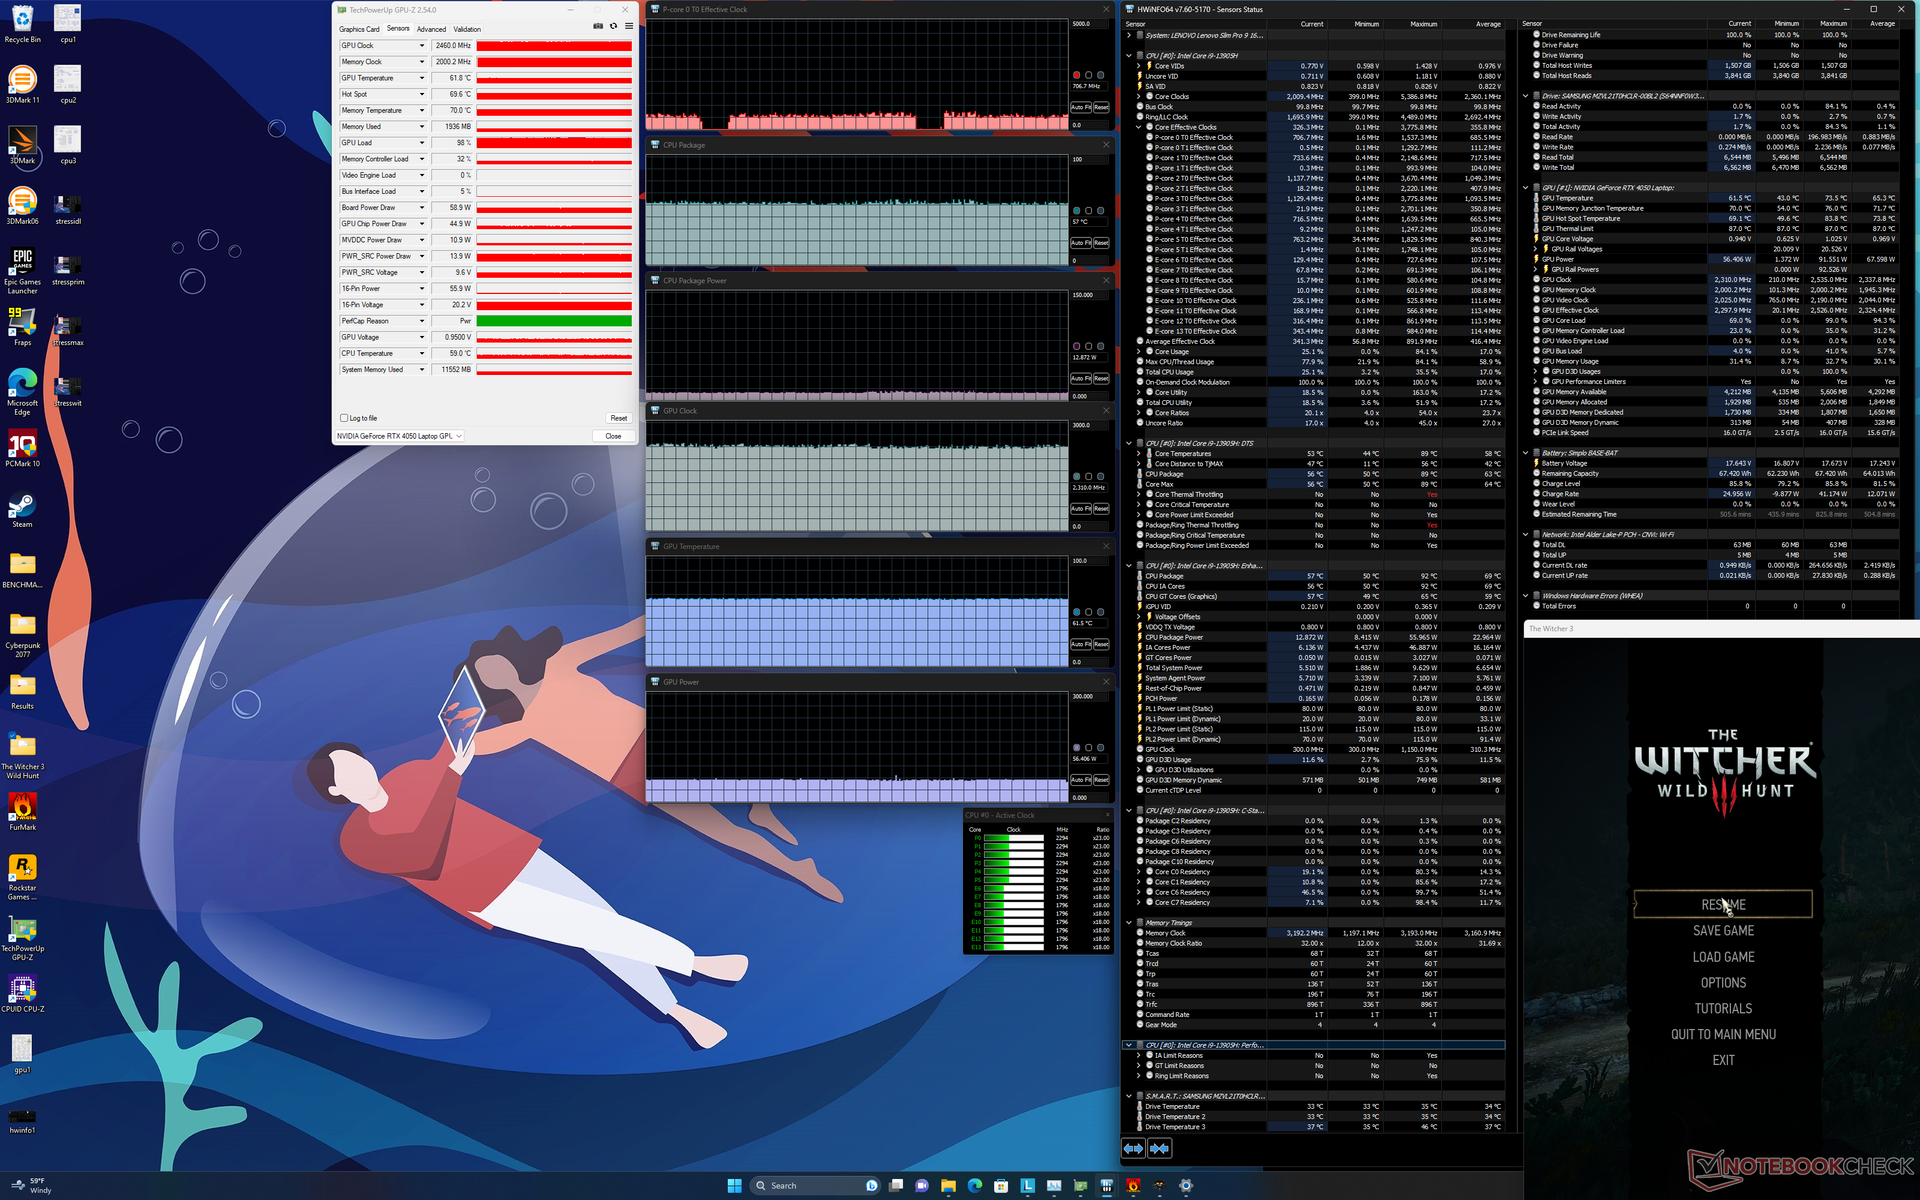
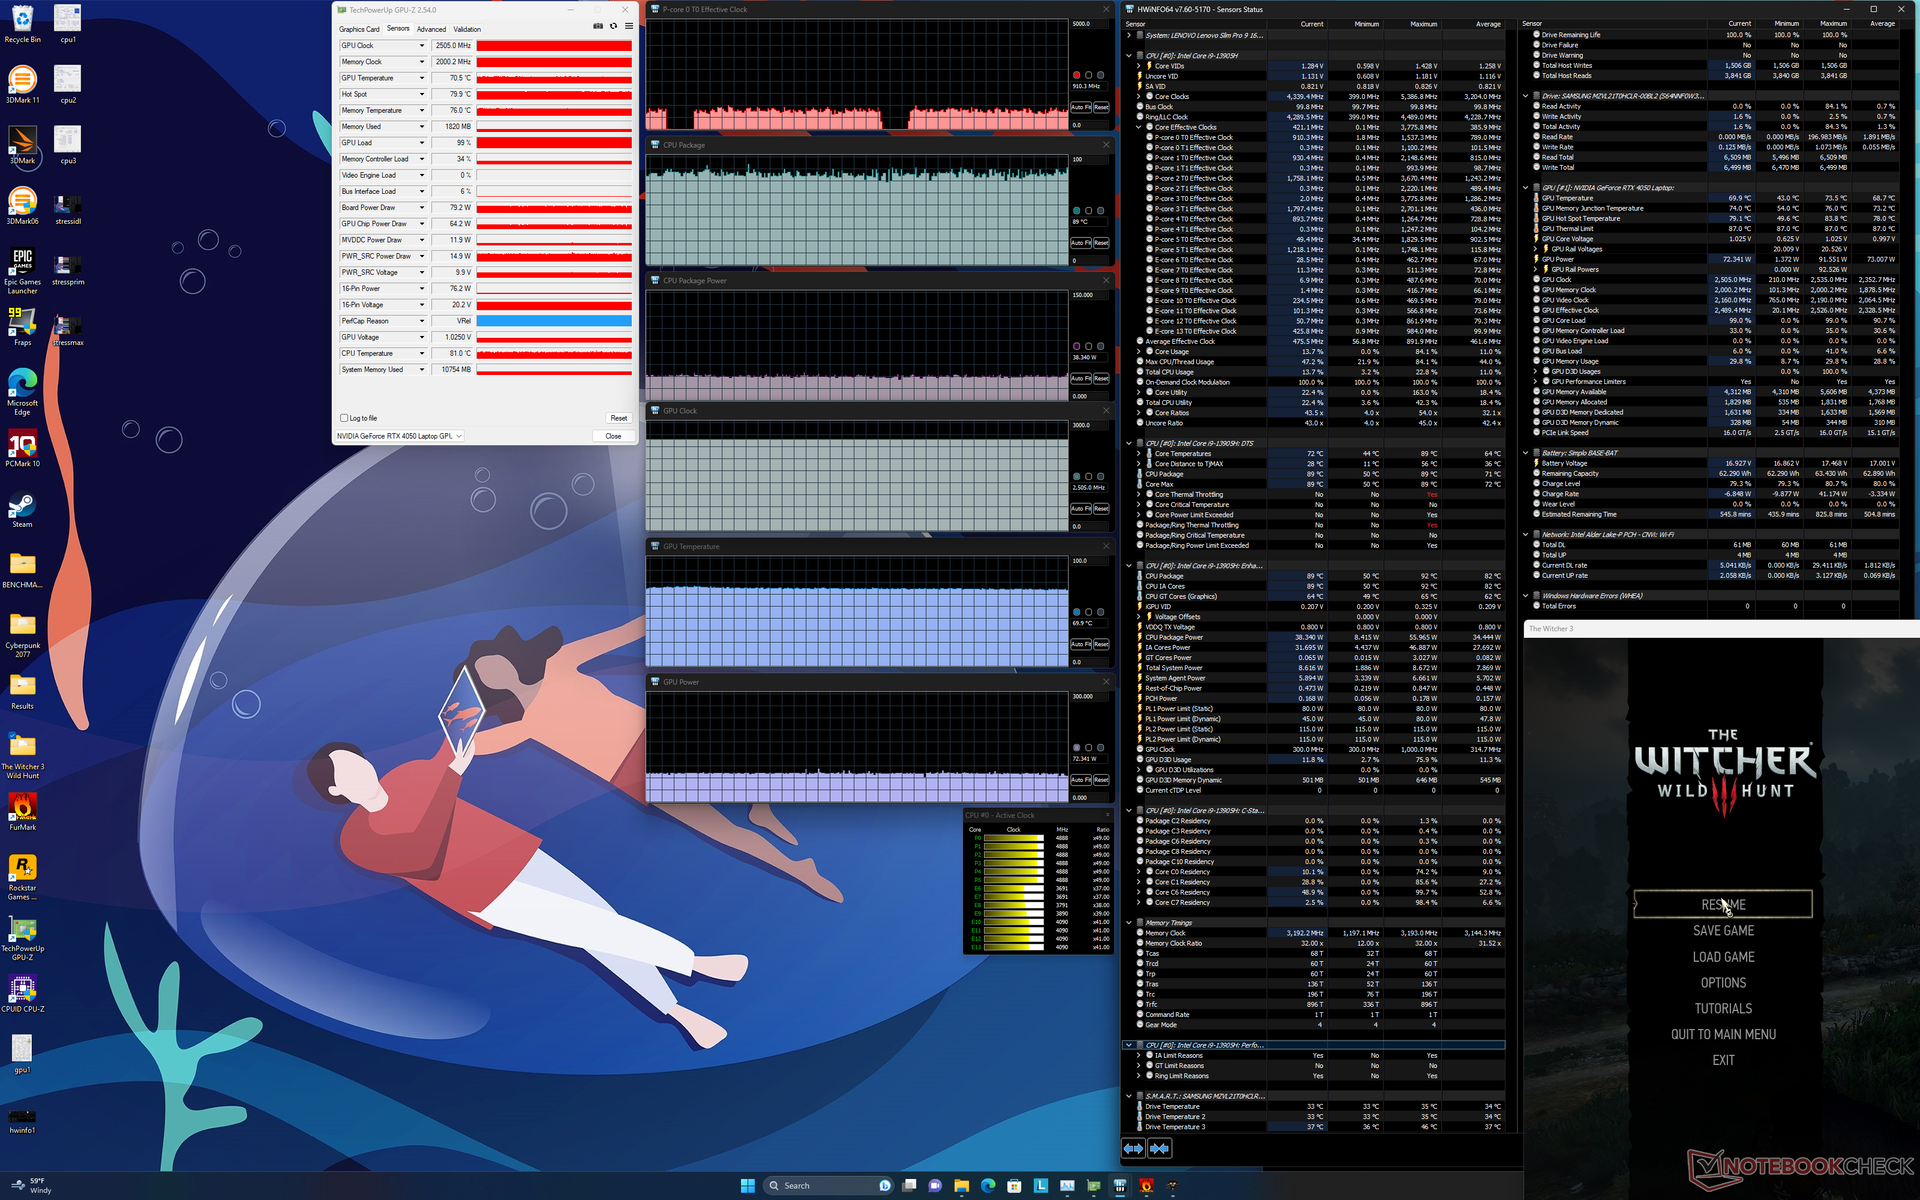
| CPU-klok (GHz) | GPU-klok (MHz) | Gemiddelde CPU-temperatuur (°C) | Gemiddelde GPU-temperatuur (°C) | |
| Systeem inactief | -- | -- | 38 | 32 |
| Prime95-stress | ~3.0 | -- | 82 | 50 |
| Prime95 + FurMark Stress | ~2.4 | 2265 | 77 | 77 |
| Witcher 3 Stress (prestatiemodus) | ~0,9 | 2505 | 89 | 70 |
| Witcher 3 Stress (evenwichtige modus) | ~0,7 | 2460 | 57 | 62 |
Luidsprekers
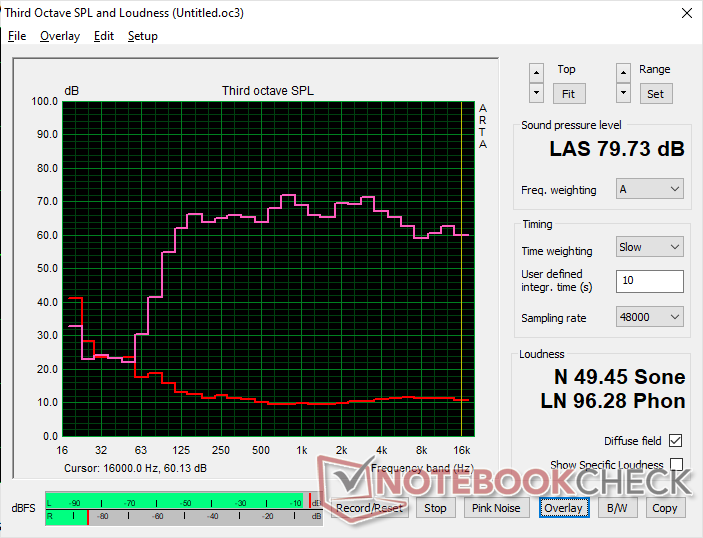
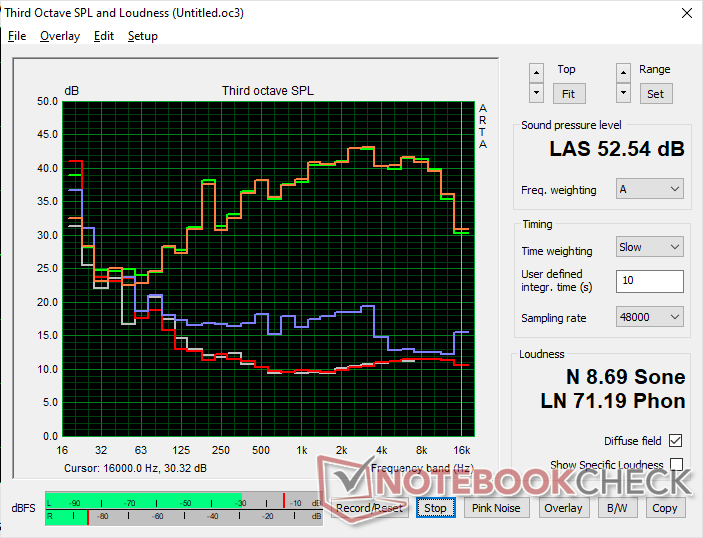
Lenovo Slim Pro 9i 16IRP8 audioanalyse
(±) | luidspreker luidheid is gemiddeld maar goed (79.7 dB)
Bas 100 - 315 Hz
(+) | goede baars - slechts 2.8% verwijderd van de mediaan
(±) | lineariteit van de lage tonen is gemiddeld (8.9% delta ten opzichte van de vorige frequentie)
Midden 400 - 2000 Hz
(+) | evenwichtige middens - slechts 2.4% verwijderd van de mediaan
(+) | de middentonen zijn lineair (4.9% delta ten opzichte van de vorige frequentie)
Hoog 2 - 16 kHz
(+) | evenwichtige hoogtepunten - slechts 3.6% verwijderd van de mediaan
(+) | de hoge tonen zijn lineair (4.3% delta naar de vorige frequentie)
Algemeen 100 - 16.000 Hz
(+) | het totale geluid is lineair (7.3% verschil met de mediaan)
Vergeleken met dezelfde klasse
» 6% van alle geteste apparaten in deze klasse waren beter, 1% vergelijkbaar, 94% slechter
» De beste had een delta van 5%, het gemiddelde was 17%, de slechtste was 45%
Vergeleken met alle geteste toestellen
» 1% van alle geteste apparaten waren beter, 0% gelijk, 99% slechter
» De beste had een delta van 4%, het gemiddelde was 23%, de slechtste was 134%
Apple MacBook Pro 16 2021 M1 Pro audioanalyse
(+) | luidsprekers kunnen relatief luid spelen (84.7 dB)
Bas 100 - 315 Hz
(+) | goede baars - slechts 3.8% verwijderd van de mediaan
(+) | de lage tonen zijn lineair (5.2% delta naar de vorige frequentie)
Midden 400 - 2000 Hz
(+) | evenwichtige middens - slechts 1.3% verwijderd van de mediaan
(+) | de middentonen zijn lineair (2.1% delta ten opzichte van de vorige frequentie)
Hoog 2 - 16 kHz
(+) | evenwichtige hoogtepunten - slechts 1.9% verwijderd van de mediaan
(+) | de hoge tonen zijn lineair (2.7% delta naar de vorige frequentie)
Algemeen 100 - 16.000 Hz
(+) | het totale geluid is lineair (4.6% verschil met de mediaan)
Vergeleken met dezelfde klasse
» 0% van alle geteste apparaten in deze klasse waren beter, 0% vergelijkbaar, 100% slechter
» De beste had een delta van 5%, het gemiddelde was 17%, de slechtste was 45%
Vergeleken met alle geteste toestellen
» 0% van alle geteste apparaten waren beter, 0% gelijk, 100% slechter
» De beste had een delta van 4%, het gemiddelde was 23%, de slechtste was 134%
Energiebeheer
Stroomverbruik
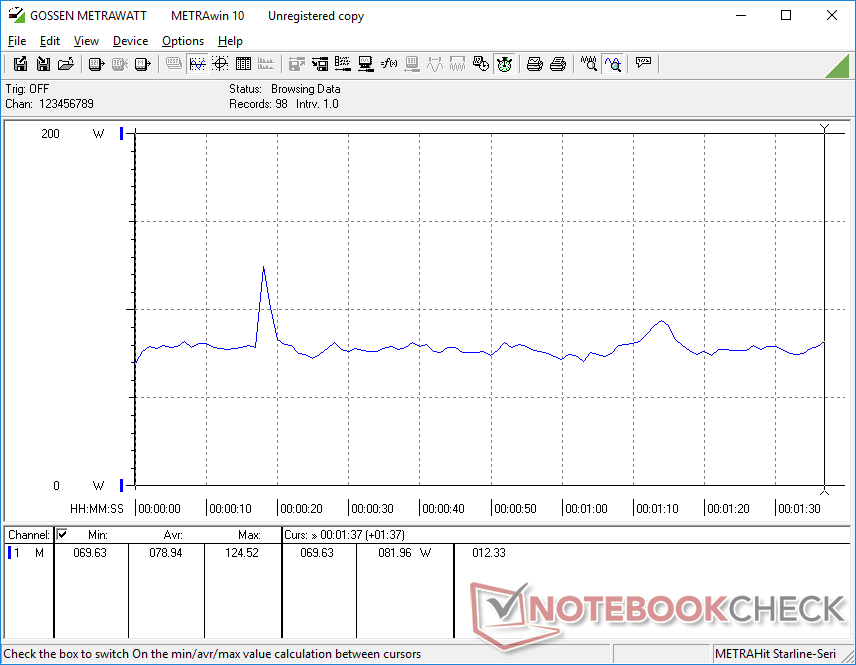
Het stroomverbruik kan variëren van 16 W bij de minimale helderheidsinstelling met de iGPU actief tot 30 W bij weergave van een volledig wit beeld op de maximale helderheidsinstelling met de dGPU actief. Het is daarom aan te raden om meer rekening te houden met de helderheidsinstellingen en kleuren als de levensduur van de batterij een punt van zorg is, net als bij OLED-panelen.
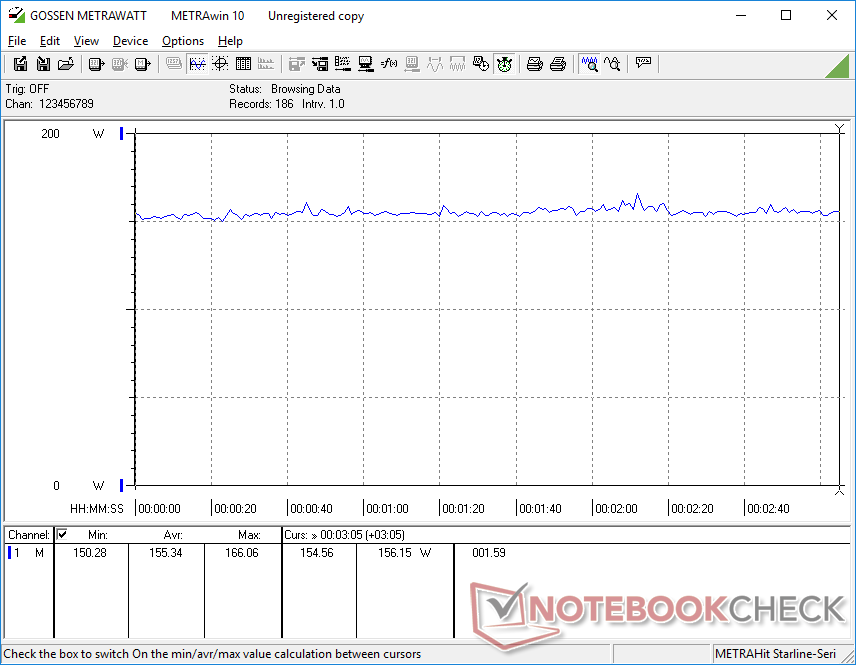
Het stroomverbruik tijdens het gamen is bijna identiek aan wat we registreerden op de Yoga Pro 9i, ook al biedt deze laatste tot 20 procent snellere grafische prestaties. Zowel de RTX 4050 als RTX 4060 configuraties streven elk naar 100 W TGP, wat hun vergelijkbare verbruiksniveaus zou verklaren wanneer de GPU wordt belast.
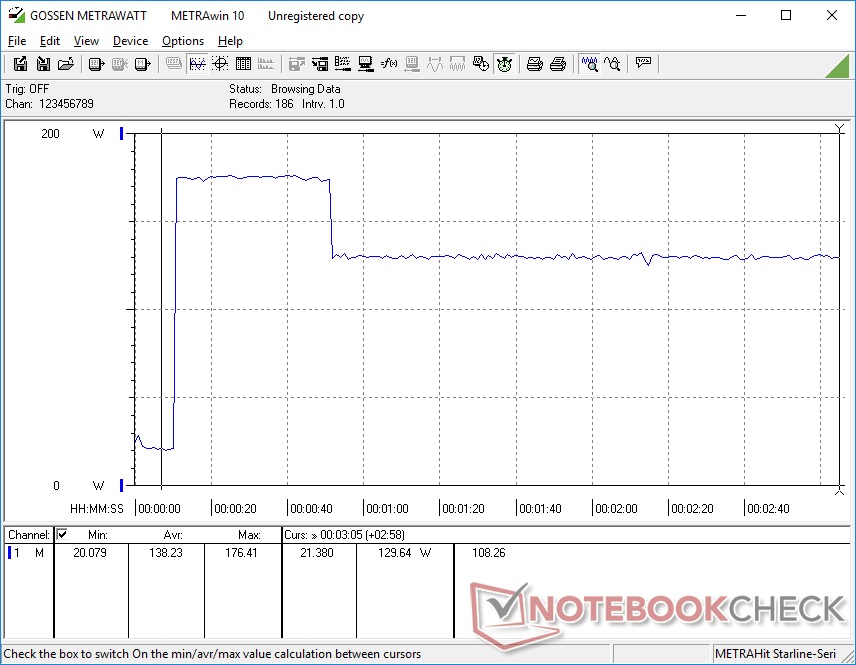
Onze Core i9-13905H piekt iets hoger dan de Core i7-13705H bij het opstarten van Prime95 voordat hij zich uiteindelijk stabiliseert op vergelijkbare niveaus.
| Uit / Standby | |
| Inactief | |
| Belasting |
|
Key:
min: | |
| Lenovo Slim Pro 9i 16IRP8 i9-13905H, GeForce RTX 4050 Laptop GPU, Samsung PM9A1 MZVL21T0HCLR, Mini-LED, 3200x2000, 16" | Lenovo Yoga Pro 9 16-IRP G8 i7-13705H, GeForce RTX 4060 Laptop GPU, Samsung PM9A1 MZVL21T0HCLR, Mini-LED, 3200x2000, 16" | Asus VivoBook Pro 16 i7-12700H, GeForce RTX 3050 Ti Laptop GPU, Intel SSD 670p SSDPEKNU010TZ, IPS, 2560x1600, 16" | Acer Swift Edge SFE16-42-R1GM R7 7735U, Radeon 680M, Micron 3400 1TB MTFDKBA1T0TFH, OLED, 3840x2400, 16" | Dell Inspiron 16 Plus 7620 i7-12700H, GeForce RTX 3050 Ti Laptop GPU, Kioxia BG5 KBG50ZNS512G, IPS, 3072x1920, 16" | HP Envy 16 h0112nr i7-12700H, GeForce RTX 3060 Laptop GPU, Micron 3400 1TB MTFDKBA1T0TFH, OLED, 3840x2400, 16" | |
|---|---|---|---|---|---|---|
| Power Consumption | 12% | 22% | 61% | 29% | 10% | |
| Idle Minimum * (Watt) | 16 | 10.9 32% | 8.7 46% | 8.6 46% | 6.8 57% | 10 37% |
| Idle Average * (Watt) | 30 | 22.6 25% | 13.1 56% | 7.7 74% | 9.6 68% | 10.9 64% |
| Idle Maximum * (Watt) | 30.4 | 23.5 23% | 18.3 40% | 9.3 69% | 17 44% | 27.8 9% |
| Load Average * (Watt) | 78.9 | 84.6 -7% | 116 -47% | 47.9 39% | 117.5 -49% | 116.4 -48% |
| Witcher 3 ultra * (Watt) | 155.3 | 159.5 -3% | 117.6 24% | 46.3 70% | 113.1 27% | 133.7 14% |
| Load Maximum * (Watt) | 180.4 | 177.3 2% | 162 10% | 56 69% | 137.4 24% | 209.8 -16% |
* ... kleiner is beter
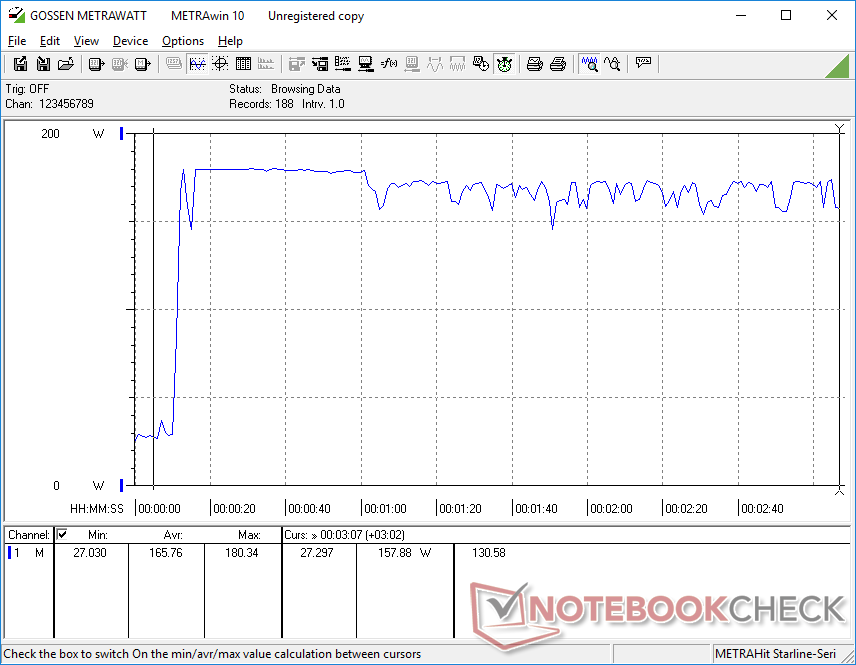
Power Consumption Witcher 3 / Stresstest
Power Consumption external Monitor
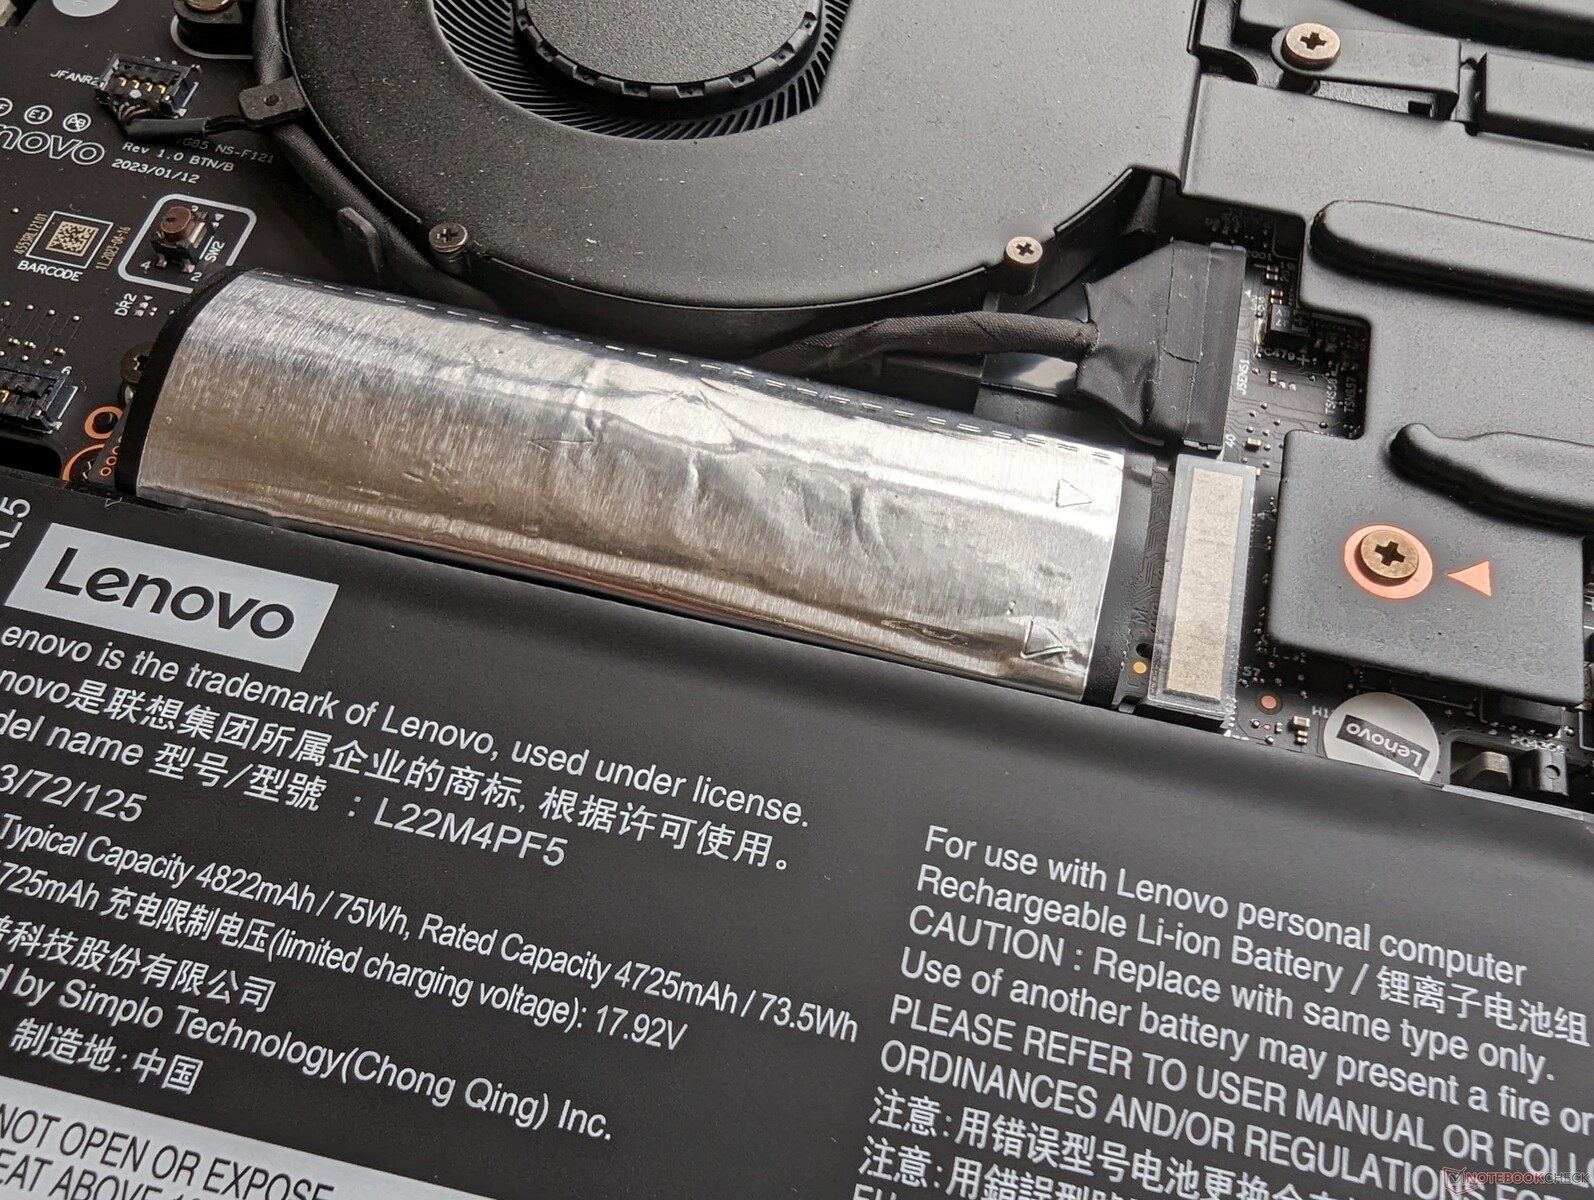
Levensduur batterij
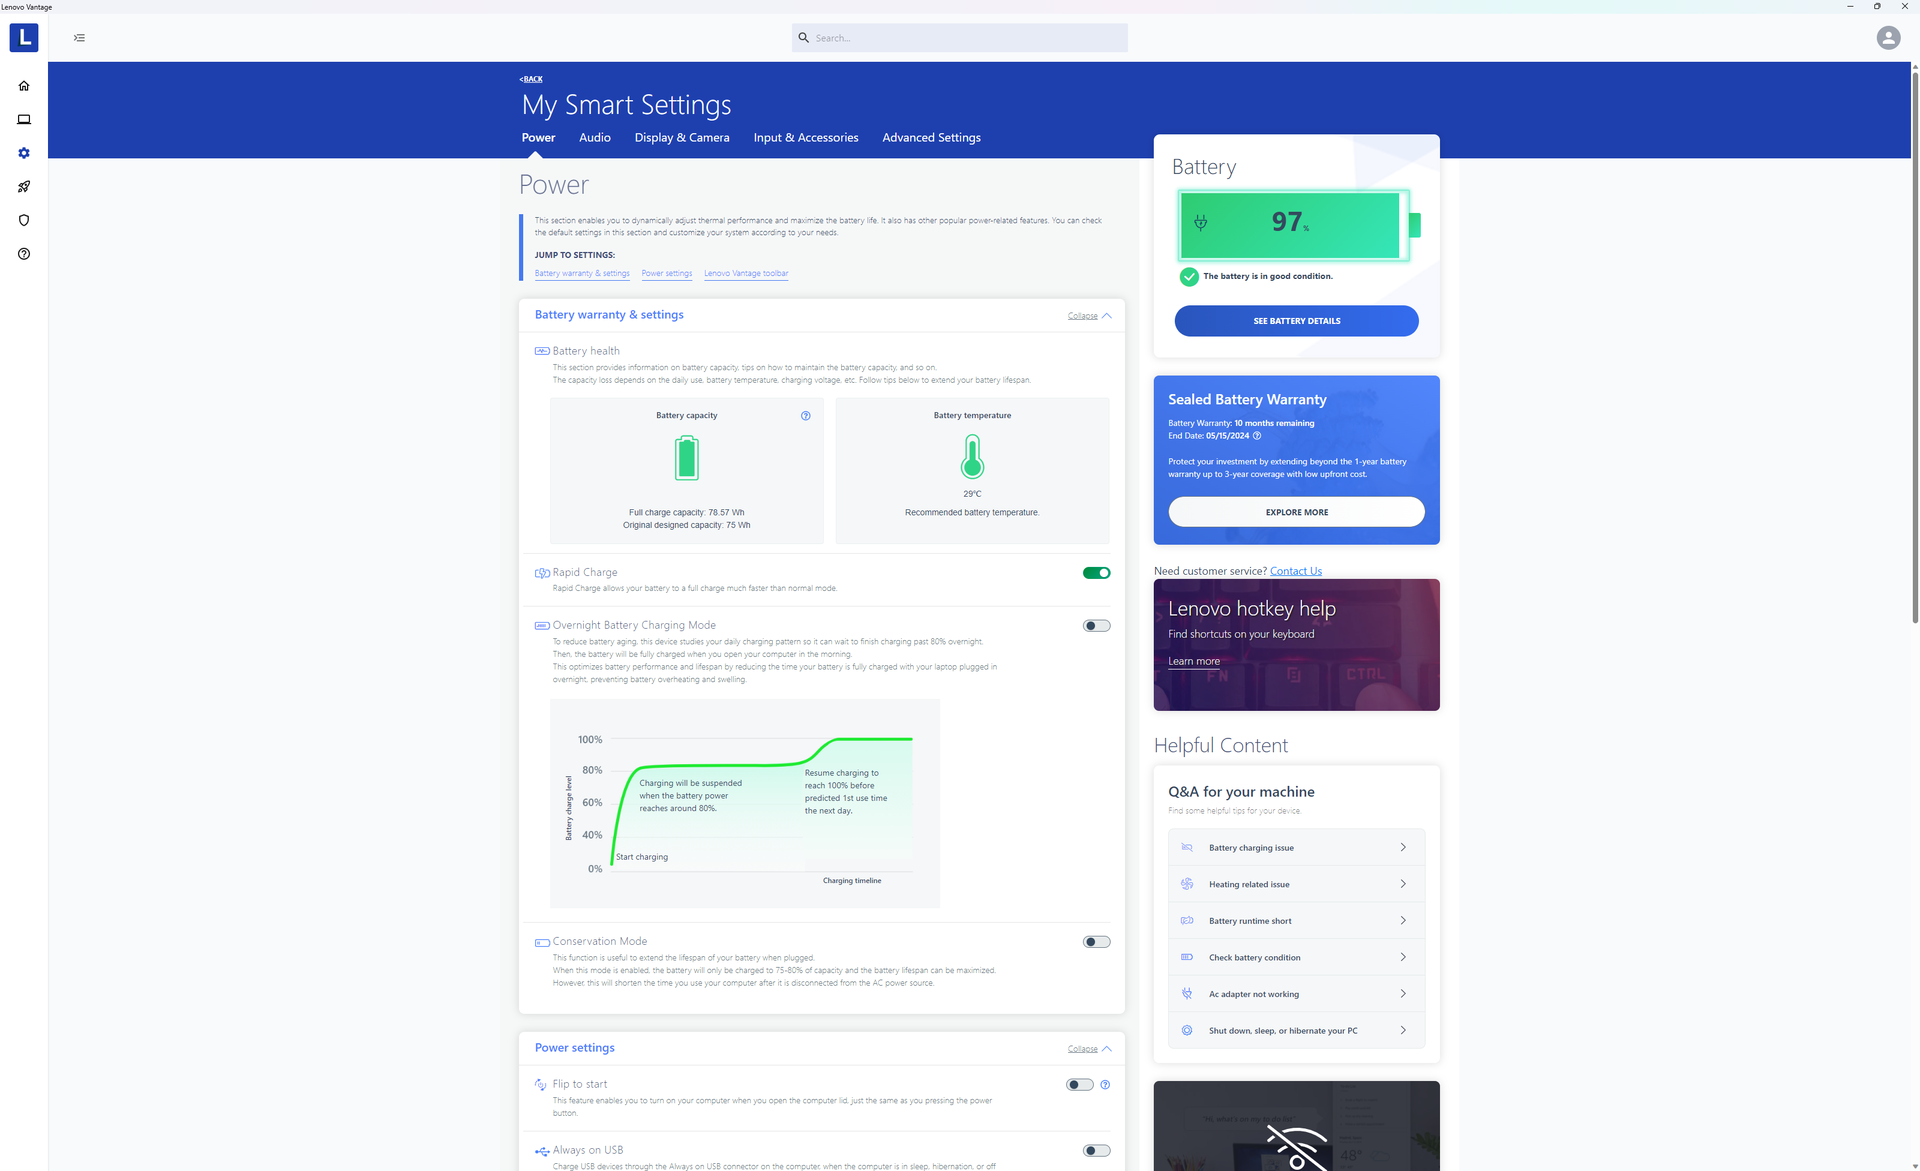
De looptijden zijn in wezen identiek aan wat we hebben geregistreerd op de Yoga Pro 9 16 met ongeveer 6,5 uur surfen in de echte wereld. Opladen van leeg naar vol duurt ongeveer 90 minuten, zelfs met Rapid Charge ingeschakeld.
De acculading kan afnemen als er zware belastingen worden uitgevoerd, zelfs als deze is aangesloten op het lichtnet. Tijdens onze Prime95 en FurMark test van een uur daalde de acculading bijvoorbeeld van 100 procent naar 79 procent, wat aangeeft dat het model baat zou kunnen hebben gehad bij een netstroomadapter met een hogere capaciteit.
Bepaalde USB-C adapters kunnen het systeem opladen. Onze 130 W Dell XPS 15 USB-C adapter lijkt bijvoorbeeld niet compatibel te zijn, terwijl de 140 W Lenovo USB-C adapter zonder problemen zou werken.
| Lenovo Slim Pro 9i 16IRP8 i9-13905H, GeForce RTX 4050 Laptop GPU, 75 Wh | Lenovo Yoga Pro 9 16-IRP G8 i7-13705H, GeForce RTX 4060 Laptop GPU, 75 Wh | Asus VivoBook Pro 16 i7-12700H, GeForce RTX 3050 Ti Laptop GPU, 70 Wh | Acer Swift Edge SFE16-42-R1GM R7 7735U, Radeon 680M, 54 Wh | Dell Inspiron 16 Plus 7620 i7-12700H, GeForce RTX 3050 Ti Laptop GPU, 86 Wh | HP Envy 16 h0112nr i7-12700H, GeForce RTX 3060 Laptop GPU, 83 Wh | |
|---|---|---|---|---|---|---|
| Batterijduur | -3% | 11% | 11% | 45% | 20% | |
| WiFi v1.3 (h) | 6.6 | 6.4 -3% | 7.3 11% | 7.3 11% | 9.6 45% | 7.9 20% |
| H.264 (h) | 7.5 | 8.6 | ||||
| Load (h) | 0.7 | 1.5 | 1.2 | 1.6 | ||
| Reader / Idle (h) | 10.9 | 18.6 | 17.8 |
Pro
Contra
Verdict - Core i7 met GeForce RTX 4060 is de betere deal
Er zijn op dit moment ten minste twee configuraties van de Slim Pro 9i 16 beschikbaar: één met de Core i7-13705H en GeForce RTX 4060 en één met de Core i9-13905H en GeForce RTX 4050. Omdat de prijzen van beide zo vergelijkbaar zijn, is de Core i7 met RTX 4060 optie sterk aan te raden boven de Core i9 met RTX 4050 optie, omdat de Core i7 bijna identiek presteert als de Core i9. Ondertussen zorgt de overstap van de RTX 4050 naar de RTX 4060 voor een grotere en meer merkbare boost in grafische prestaties.
De Core i7 en GeForce RTX 4060 configuratie is de sweet spot voor wie de Lenovo Slim Pro 9i 16 overweegt.
Andere aspecten van het model zijn vergelijkbaar met alternatieven zoals deHP Envy 16 of MacBook Pro 16 variërend van de brede poortopties tot de algehele snelle prestaties, het compacte gewicht en de redelijke afmetingen. Je krijgt echter niet het door de gebruiker uitbreidbare RAM van de Envy 16 of het voorgekalibreerde beeldscherm en de langere batterijduur van de MacBook Pro.
Prijs en beschikbaarheid
Lenovo levert nu zijn Slim Pro 9i 16 voor $2200 USD met de duurdere GeForce RTX 4060. Het model is ook verkrijgbaar bij Best Buy.
Lenovo Slim Pro 9i 16IRP8
- 10-08-2023 v7 (old)
Allen Ngo
Transparantie
De selectie van te beoordelen apparaten wordt gemaakt door onze redactie. Het testexemplaar werd ten behoeve van deze beoordeling door de fabrikant of detailhandelaar in bruikleen aan de auteur verstrekt. De kredietverstrekker had geen invloed op deze recensie, noch ontving de fabrikant vóór publicatie een exemplaar van deze recensie. Er bestond geen verplichting om deze recensie te publiceren. Als onafhankelijk mediabedrijf is Notebookcheck niet onderworpen aan het gezag van fabrikanten, detailhandelaren of uitgevers.
[transparency_disclaimer]Dit is hoe Notebookcheck test
Elk jaar beoordeelt Notebookcheck onafhankelijk honderden laptops en smartphones met behulp van gestandaardiseerde procedures om ervoor te zorgen dat alle resultaten vergelijkbaar zijn. We hebben onze testmethoden al zo'n 20 jaar voortdurend ontwikkeld en daarbij de industriestandaard bepaald. In onze testlaboratoria wordt gebruik gemaakt van hoogwaardige meetapparatuur door ervaren technici en redacteuren. Deze tests omvatten een validatieproces in meerdere fasen. Ons complexe beoordelingssysteem is gebaseerd op honderden goed onderbouwde metingen en benchmarks, waardoor de objectiviteit behouden blijft. Meer informatie over onze testmethoden kunt u hier vinden.
Price comparison

