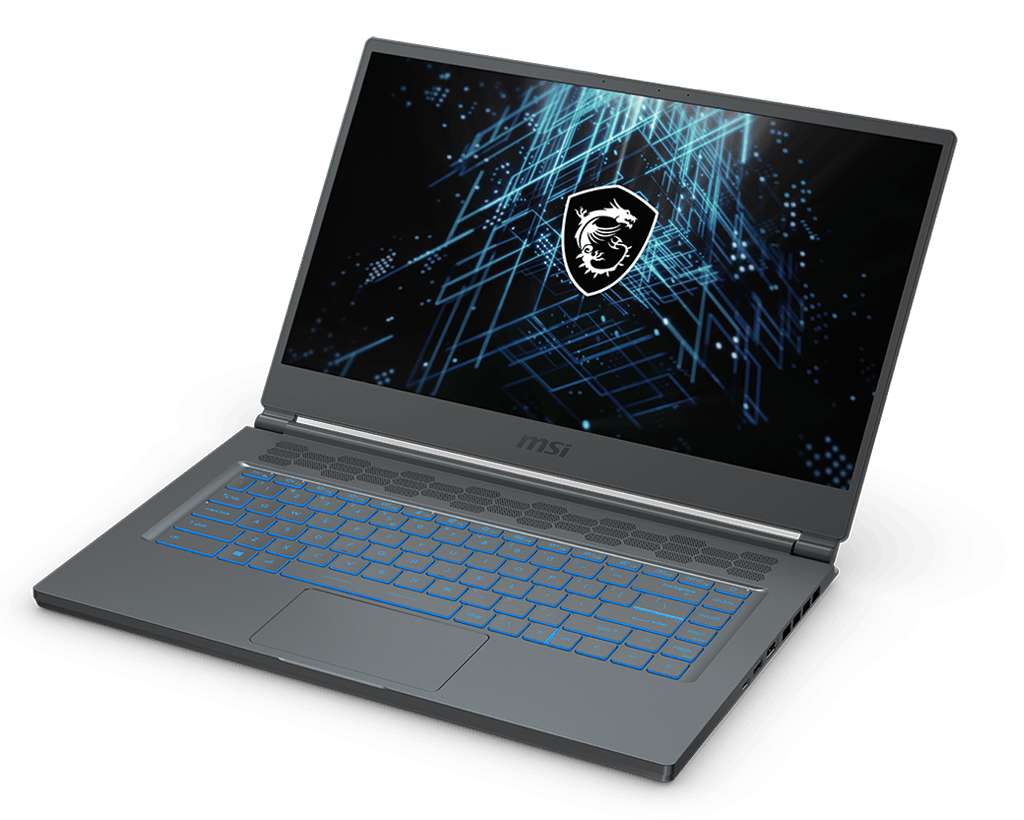
MSI Stealth 15M GeForce RTX Laptop Review: Snellere graphics dan de Dell XPS 15, HP Spectre x360, of Asus ZenBook
Niet te verwarren met de 15,6-inch MSI GS66 Stealth, de 15,6-inch MSI Stealth 15M is een compleet ander model ontworpen voor content creators, kantoor, of professioneel gebruik. Het is in dezelfde categorie als de bestaande MSI Prestige, Creator, Summit, of Modern serie laptops, maar met belangrijke specificatie verschillen.
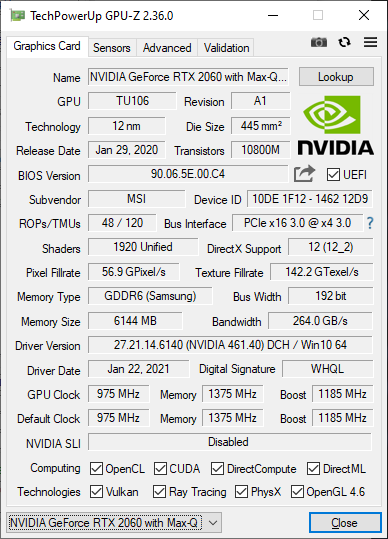
Het onderscheidende kenmerk van de Stealth 15M is zijn snelle GeForce RTX 2060 Max-Q of RTX 3060 graphics gekoppeld aan een 11e generatie Core U-serie CPU. De meeste andere laptops in deze categorie zijn beperkt tot Geforce GTX of MX graphics en worden in plaats daarvan geleverd met Core H-serie CPU's zoals de Dell XPS 15, HP Spectre x360 15, of Asus ZenBook 15. Het MSI systeem zal daarom aanzienlijk snellere grafische prestaties bieden dan de meeste van zijn directe concurrenten - althans op papier. Zijn naaste concurrent is de 2020 HP Envy 15, die wordt geleverd met dezelfde RTX 2060 Max-Q GPU, maar een nog snellere Core H-processor.
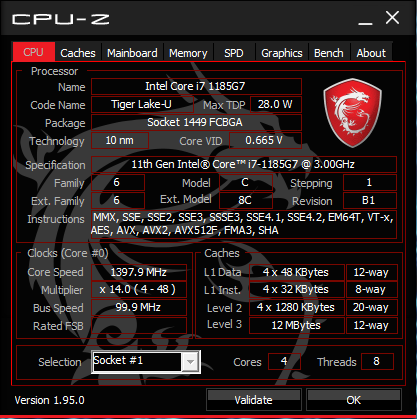
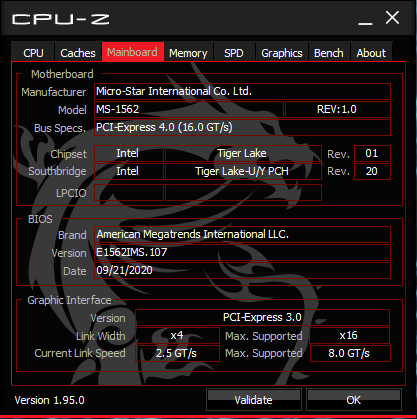
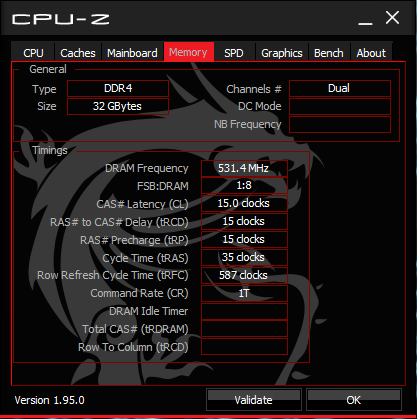
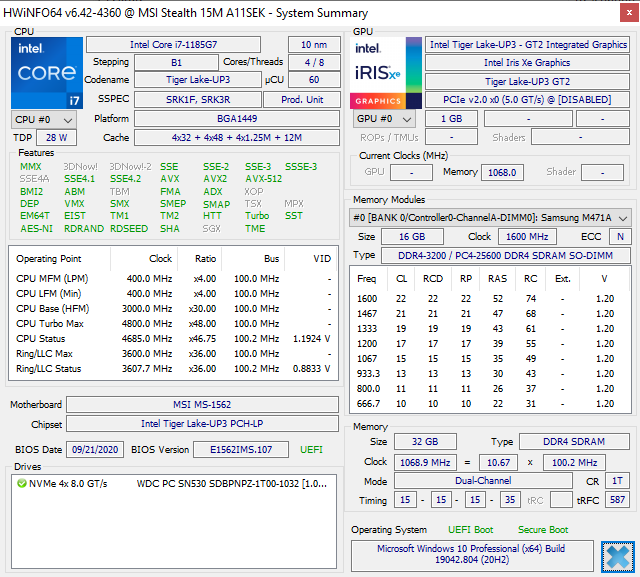
Onze configuratie in review is uitgerust met de Tiger Lake Core i7-1185G7 CPU, 32 GB RAM, GeForce RTX 2060 Max-Q GPU, 60 Hz FHD beeldscherm, en 1 TB NVMe SSD voor ongeveer $1500 USD bij retail. De bijgewerkte configuraties die in maart 2021 op de markt komen, zijn in plaats daarvan uitgerust met de Core i7-11375H CPU, 144 Hz beeldscherm en GeForce RTX 3060 GPU. Alle opties tot nu toe hebben een vaste 1080p resolutie display.
Meer MSI reviews:
potential competitors in comparison
Evaluatie | Datum | Model | Gewicht | Hoogte | Formaat | Resolutie | Beste prijs |
|---|---|---|---|---|---|---|---|
| 82.4 % v7 (old) | 02-2021 | MSI Stealth 15M A11SEK i7-1185G7, GeForce RTX 2060 Max-Q | 1.7 kg | 16.15 mm | 15.60" | 1920x1080 | |
| 85 % v7 (old) | 01-2020 | HP Spectre X360 15-5ZV31AV i7-10510U, GeForce MX250 | 2.1 kg | 19.3 mm | 15.60" | 3840x2160 | |
| 90.1 % v7 (old) | 06-2020 | Dell XPS 15 9500 Core i7 4K UHD i7-10875H, GeForce GTX 1650 Ti Mobile | 2 kg | 18 mm | 15.60" | 3840x2400 | |
| 86.6 % v7 (old) | 02-2021 | Lenovo ThinkPad T15p-20TN0006GE i7-10750H, GeForce GTX 1050 Mobile | 2.2 kg | 22.7 mm | 15.60" | 3840x2160 | |
| 87 % v7 (old) | 12-2020 | Asus ZenBook UX535-M01440 i7-10750H, GeForce GTX 1650 Ti Max-Q | 2 kg | 20 mm | 15.60" | 3840x2160 | |
| 85.2 % v7 (old) | 11-2019 | MSI Prestige 15 A10SC i7-10710U, GeForce GTX 1650 Max-Q | 1.7 kg | 16 mm | 15.60" | 3840x2160 |
Zaak
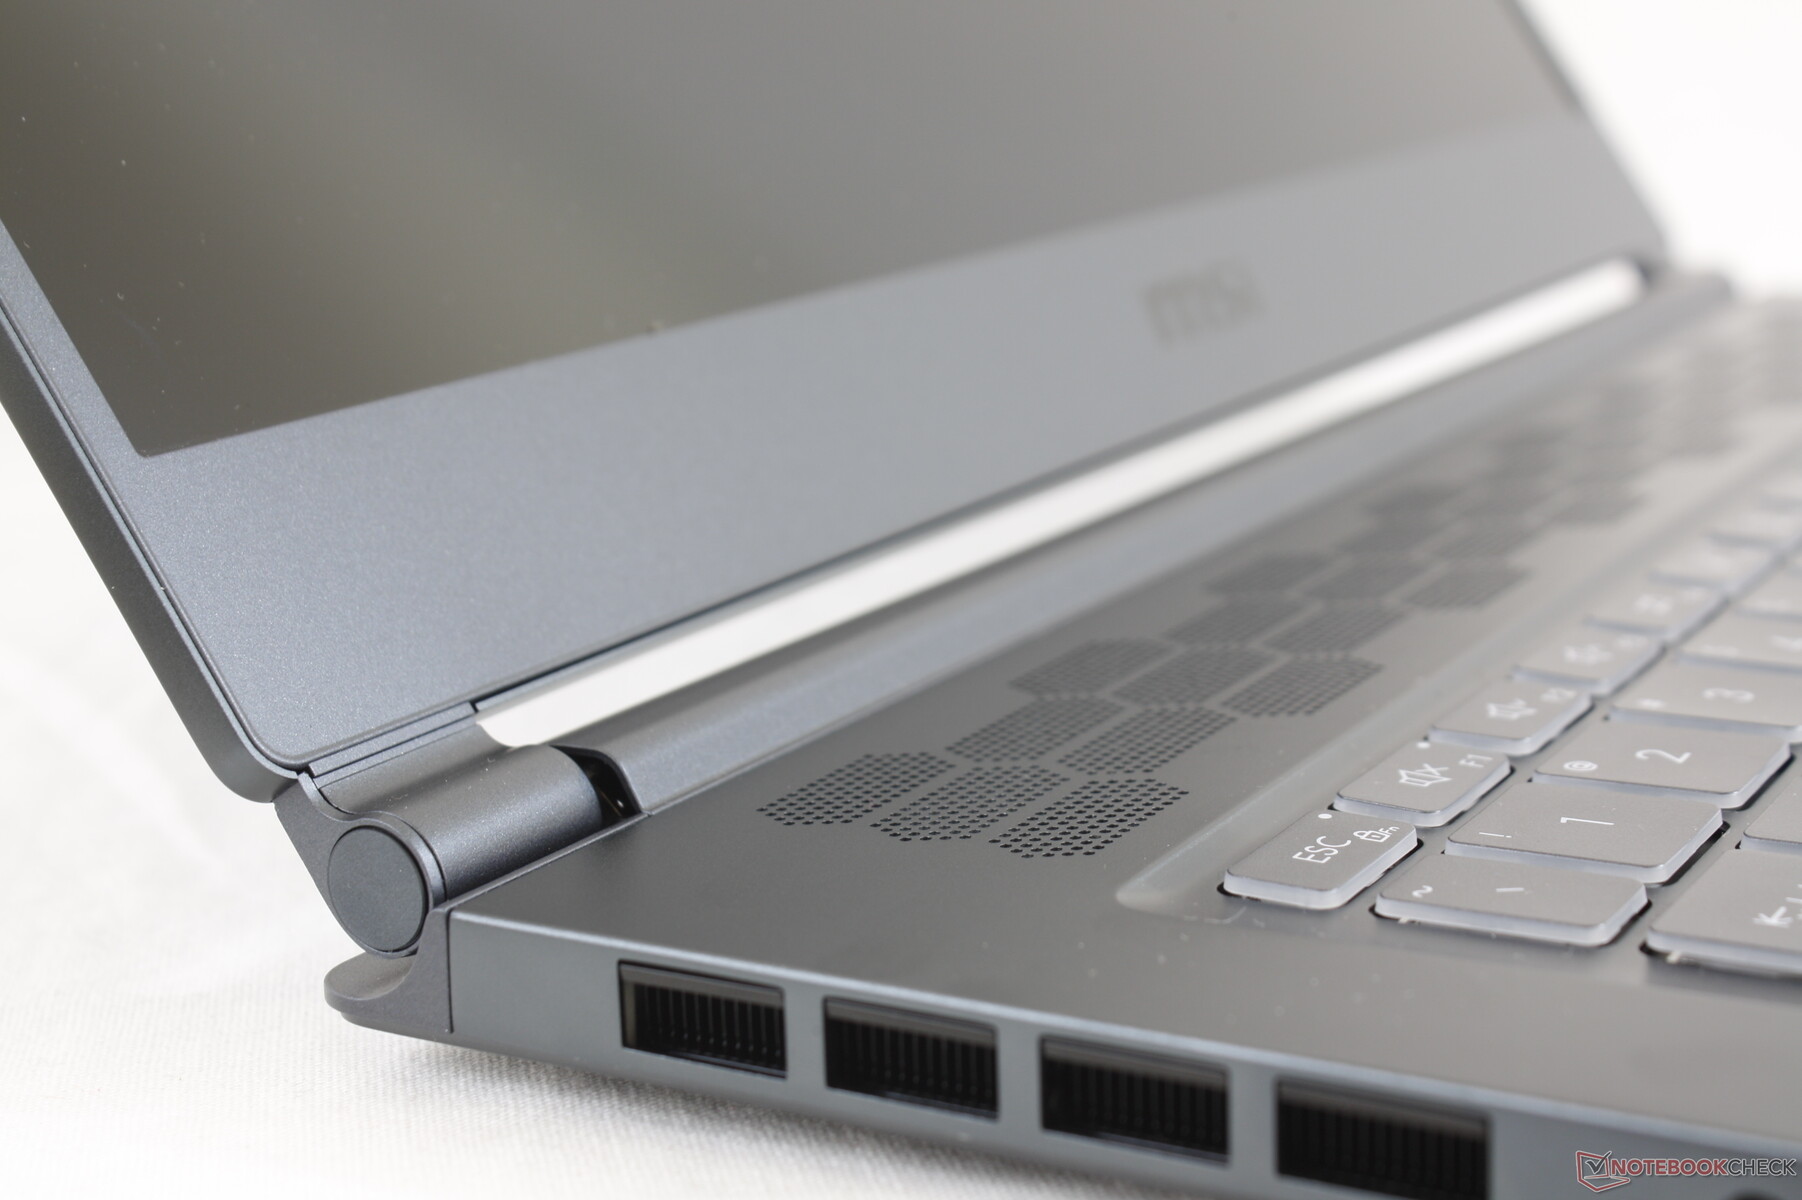
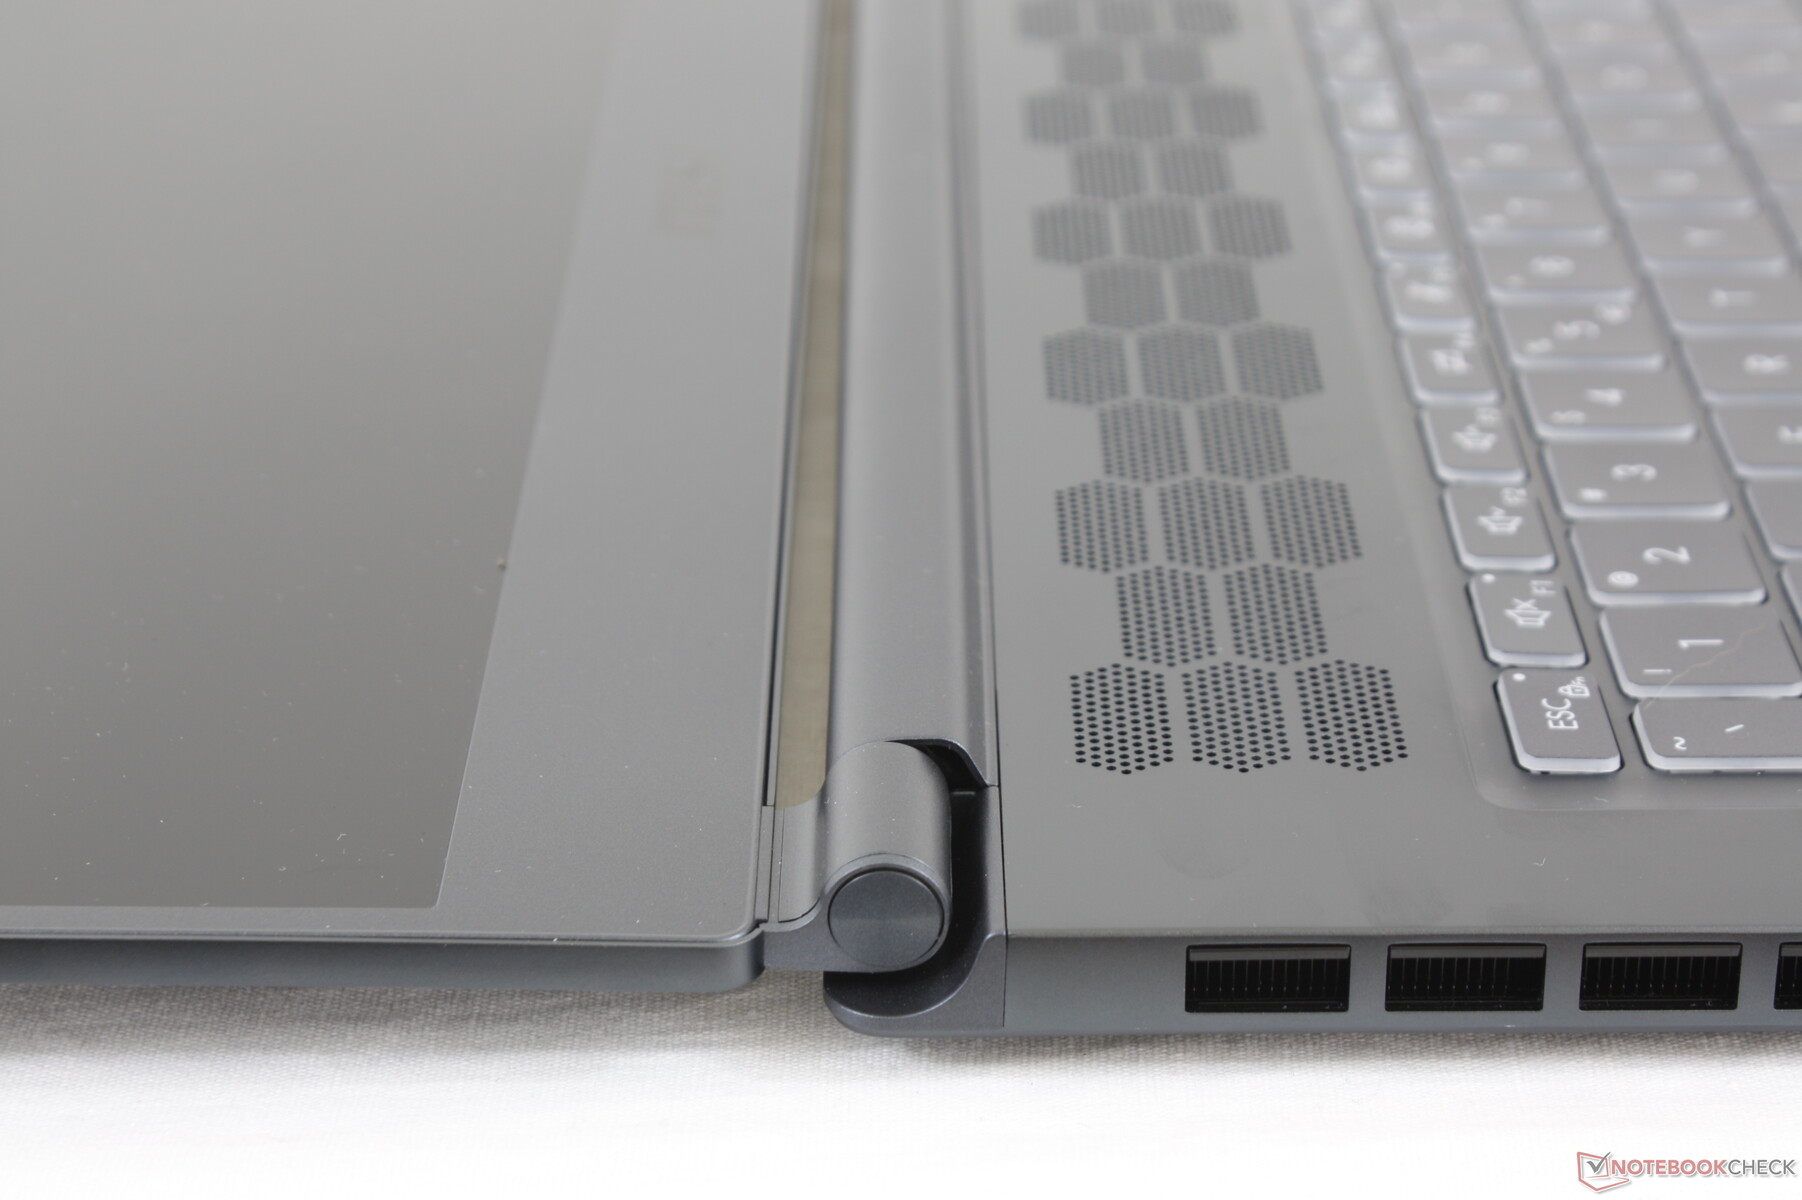
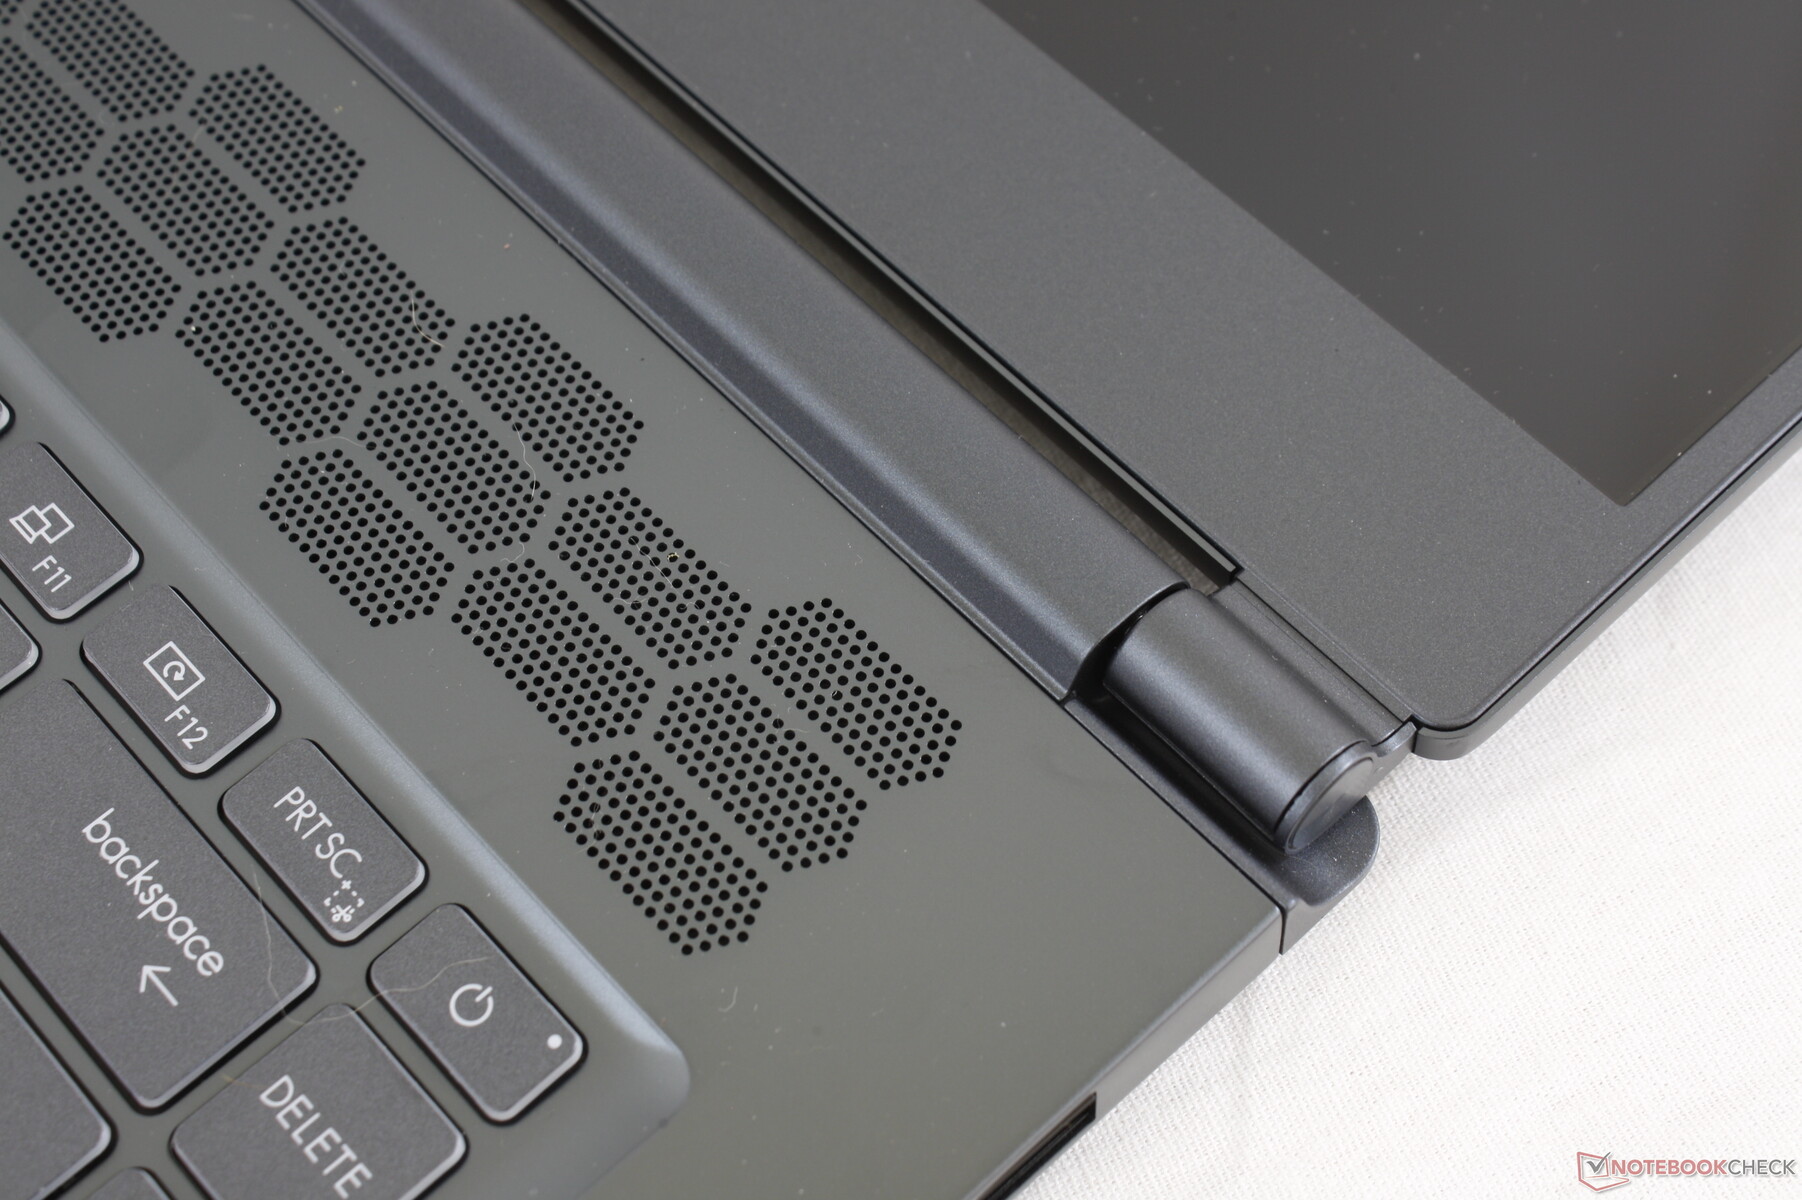
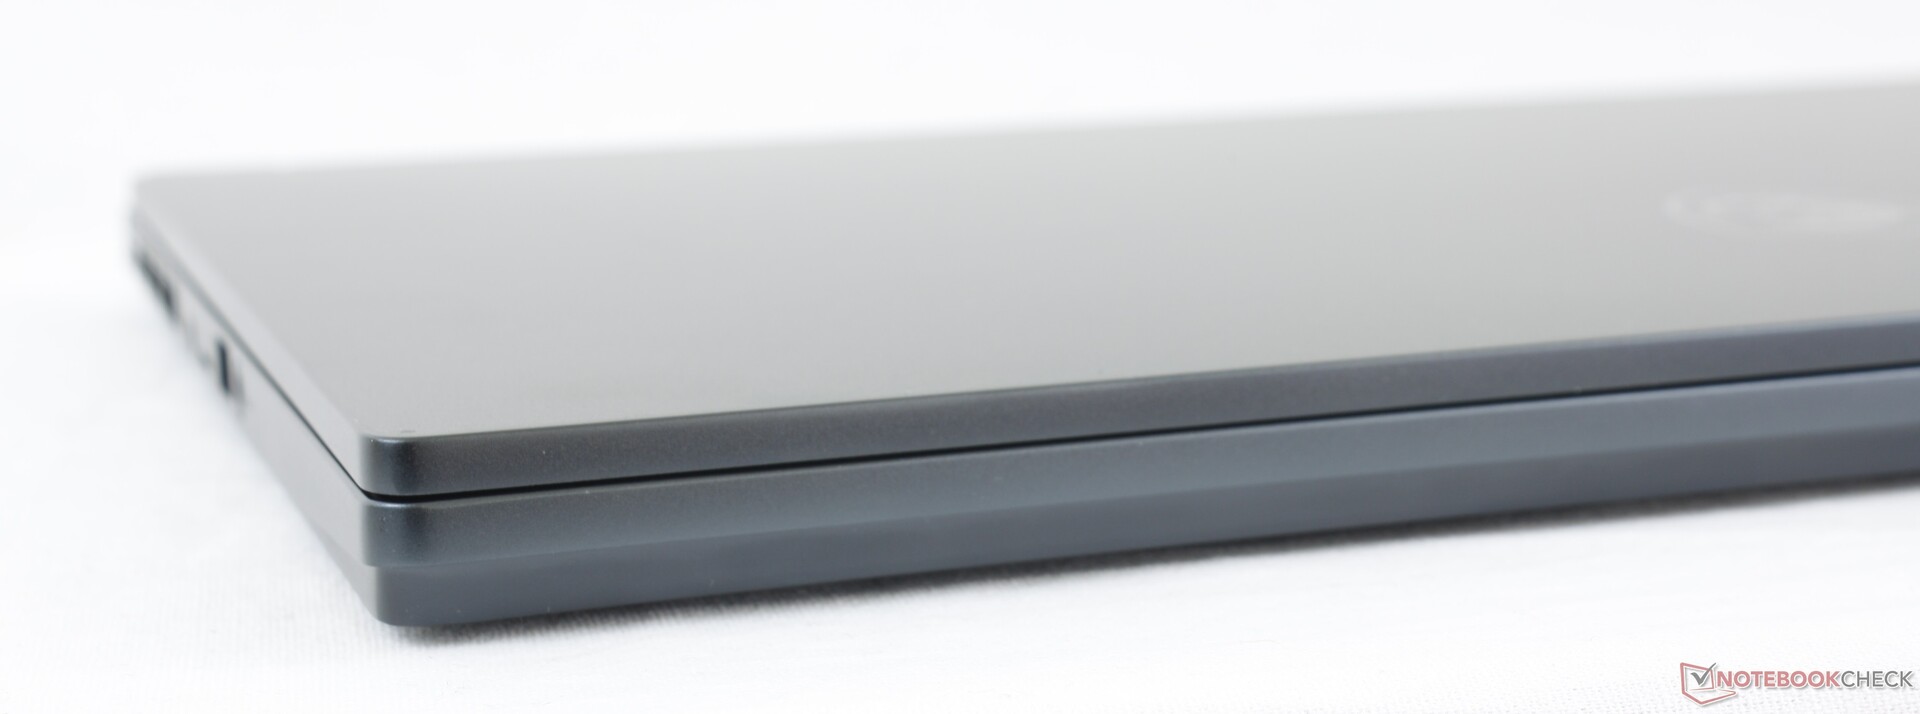
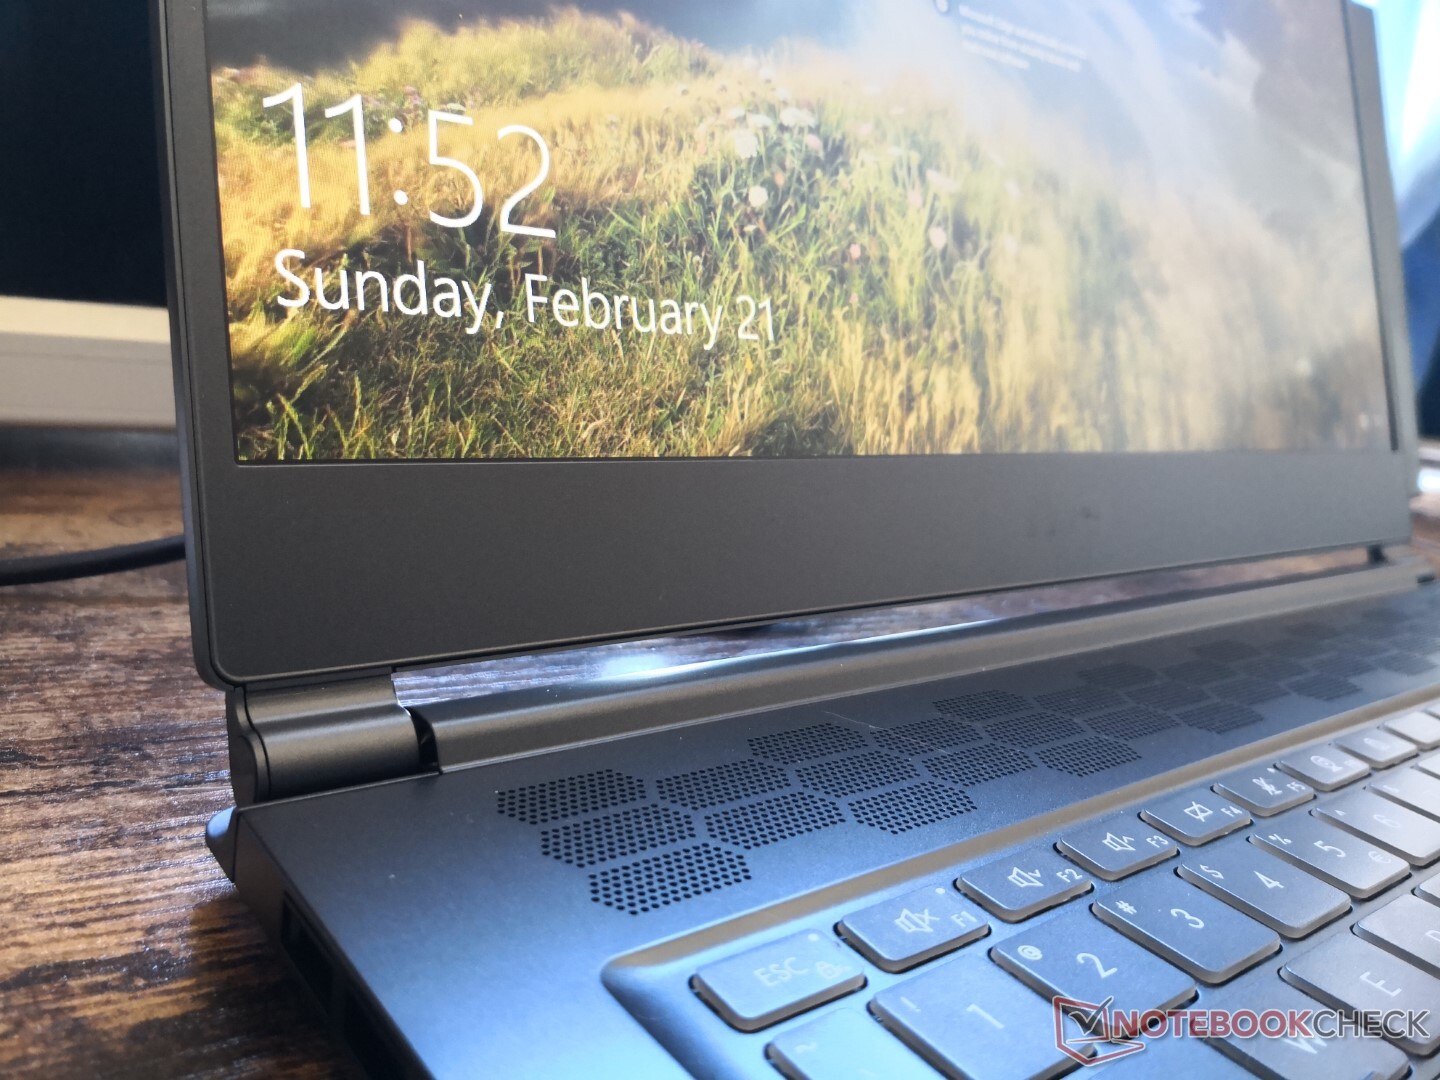
Het ontwerp van het chassis verschilt van dat van de Modern, Creator en Prestige modellen. Toch maakt de Stealth 15M gebruik van vergelijkbare metalen chassismaterialen voor een vergelijkbare look en feel. Dit betekent ook dat hij te maken heeft met dezelfde voor- en nadelen, in goede en slechte tijden. Het slanke en gestroomlijnde ontwerp is aantoonbaar aantrekkelijk, maar de basis en het deksel zijn erg gevoelig voor buigen in vergelijking met de XPS 15, Envy 15, Spectre x360 15, en de meeste andere vlaggenschip 15.6-inch multimedia laptops voor die kwestie. We hebben er ook niet veel vertrouwen in dat de zwakke scharnieren het langer dan een paar jaar zullen uithouden.
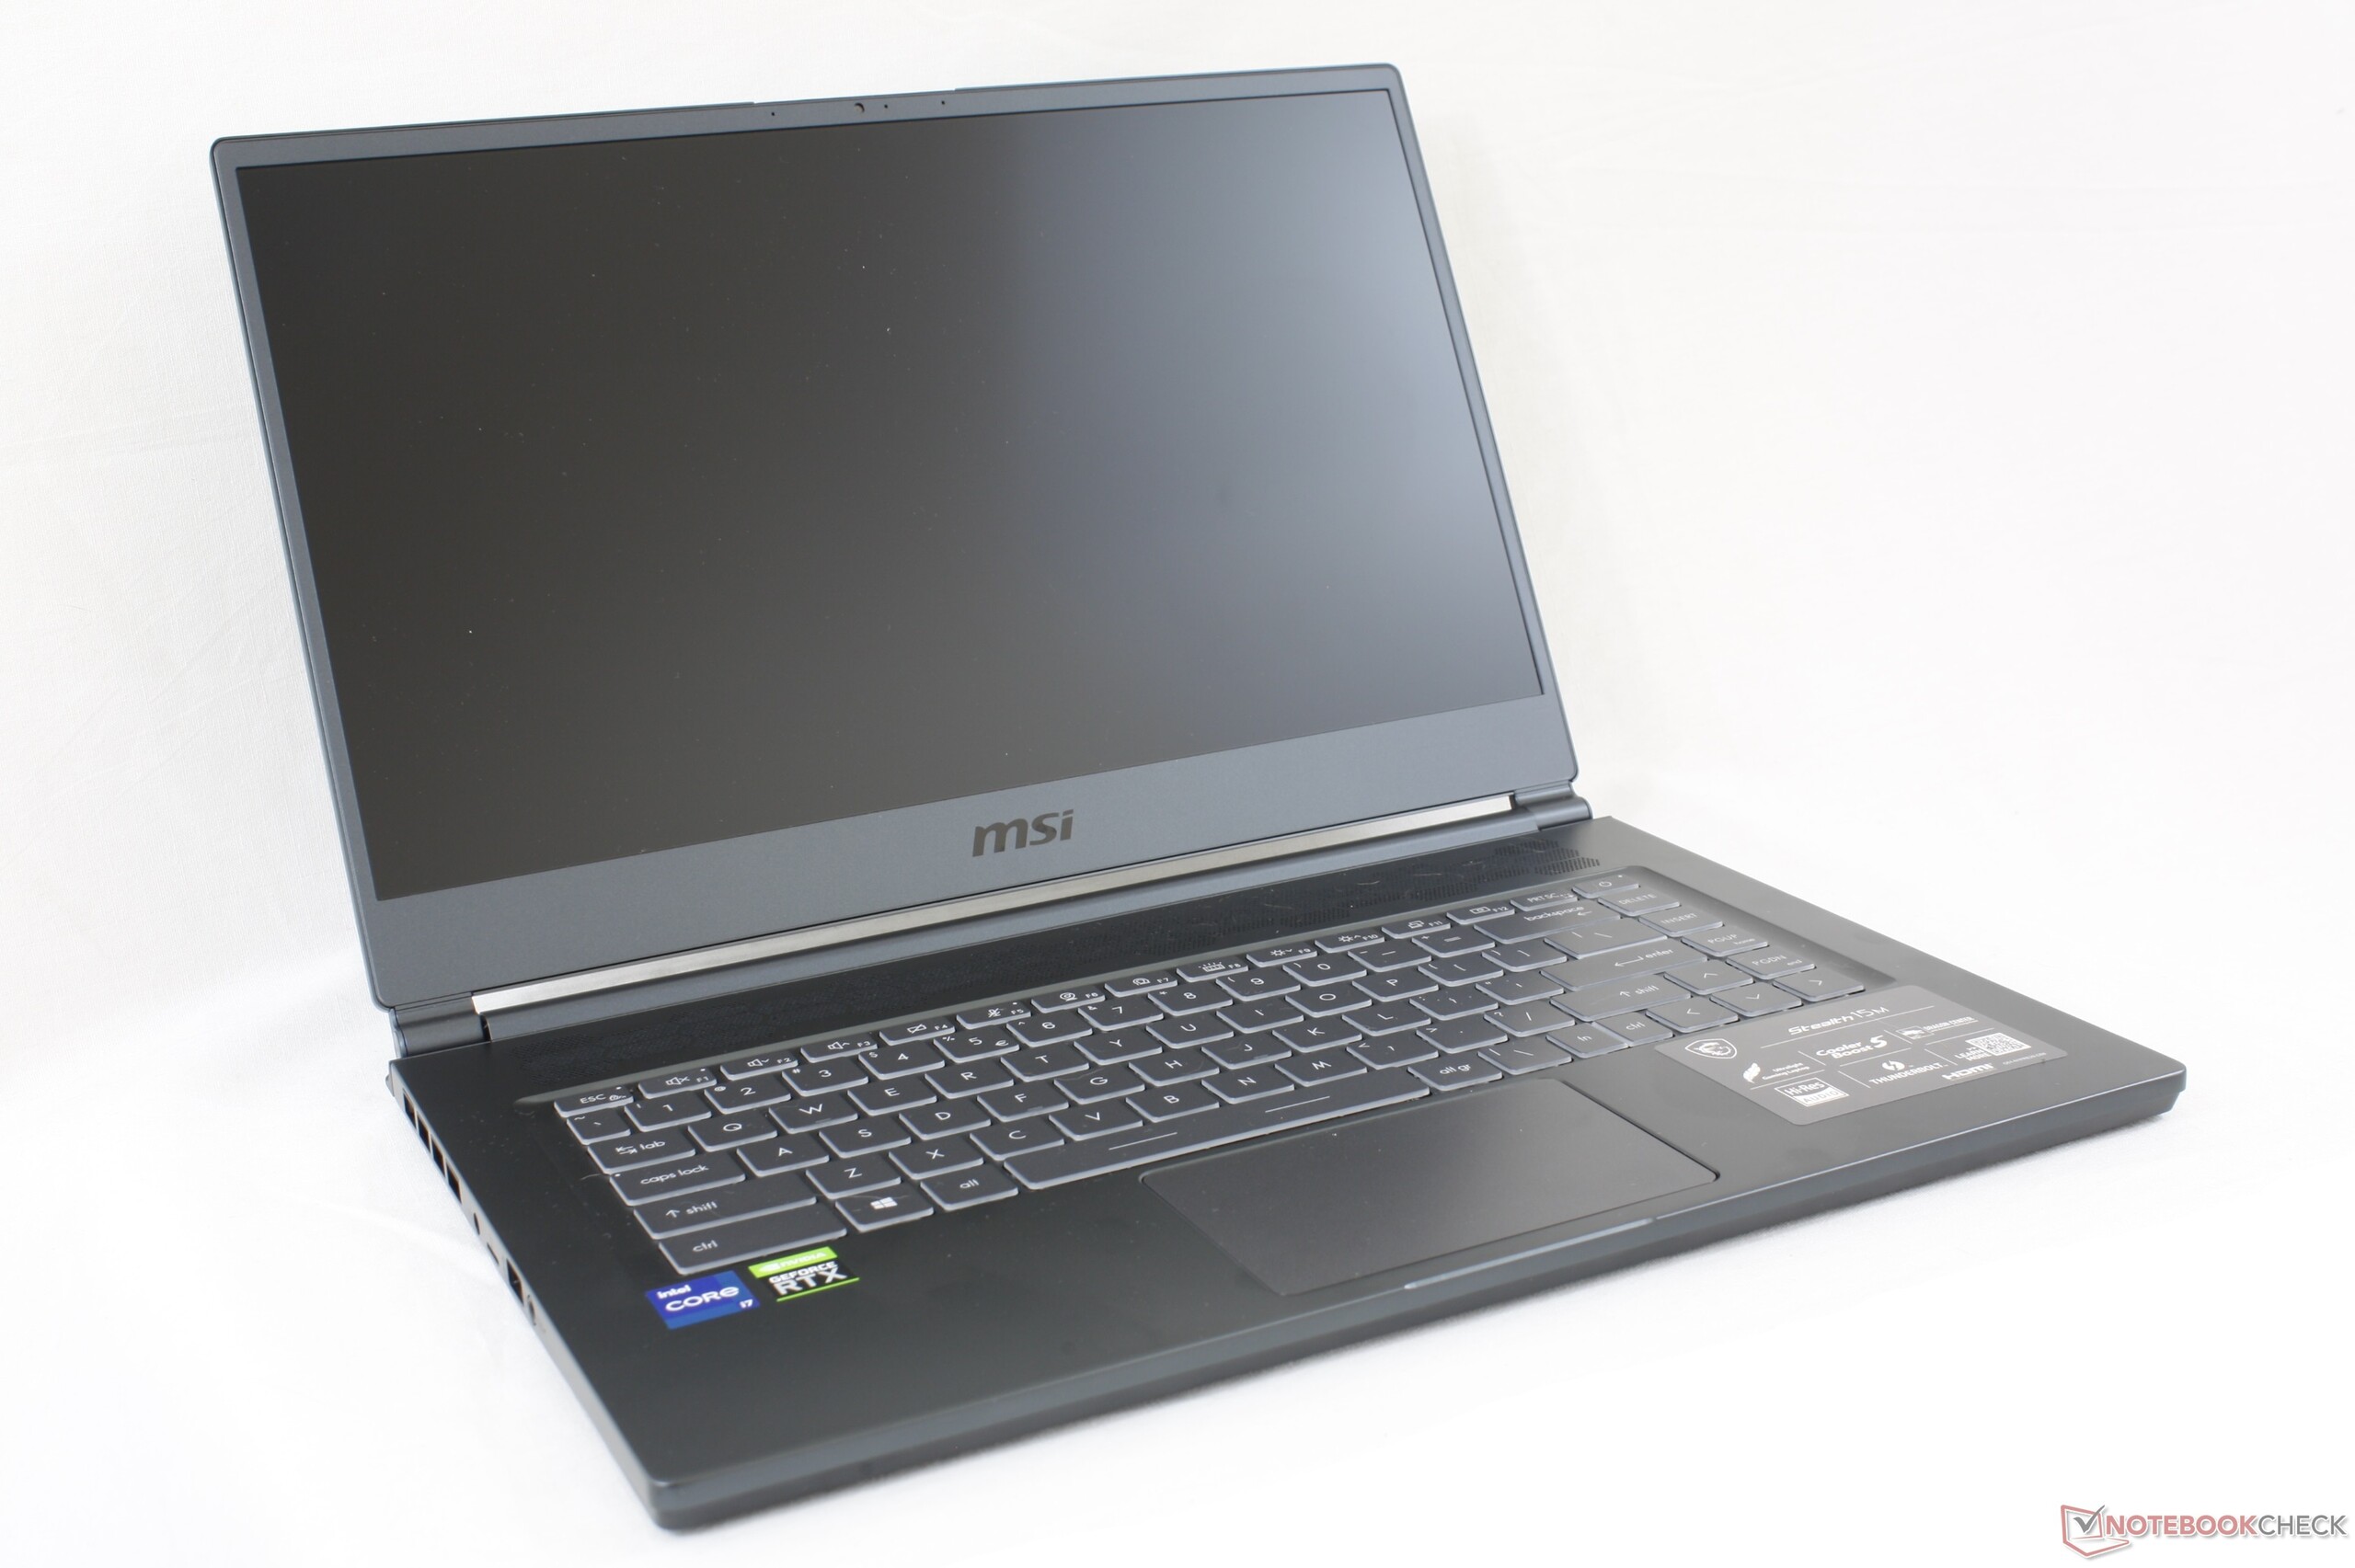
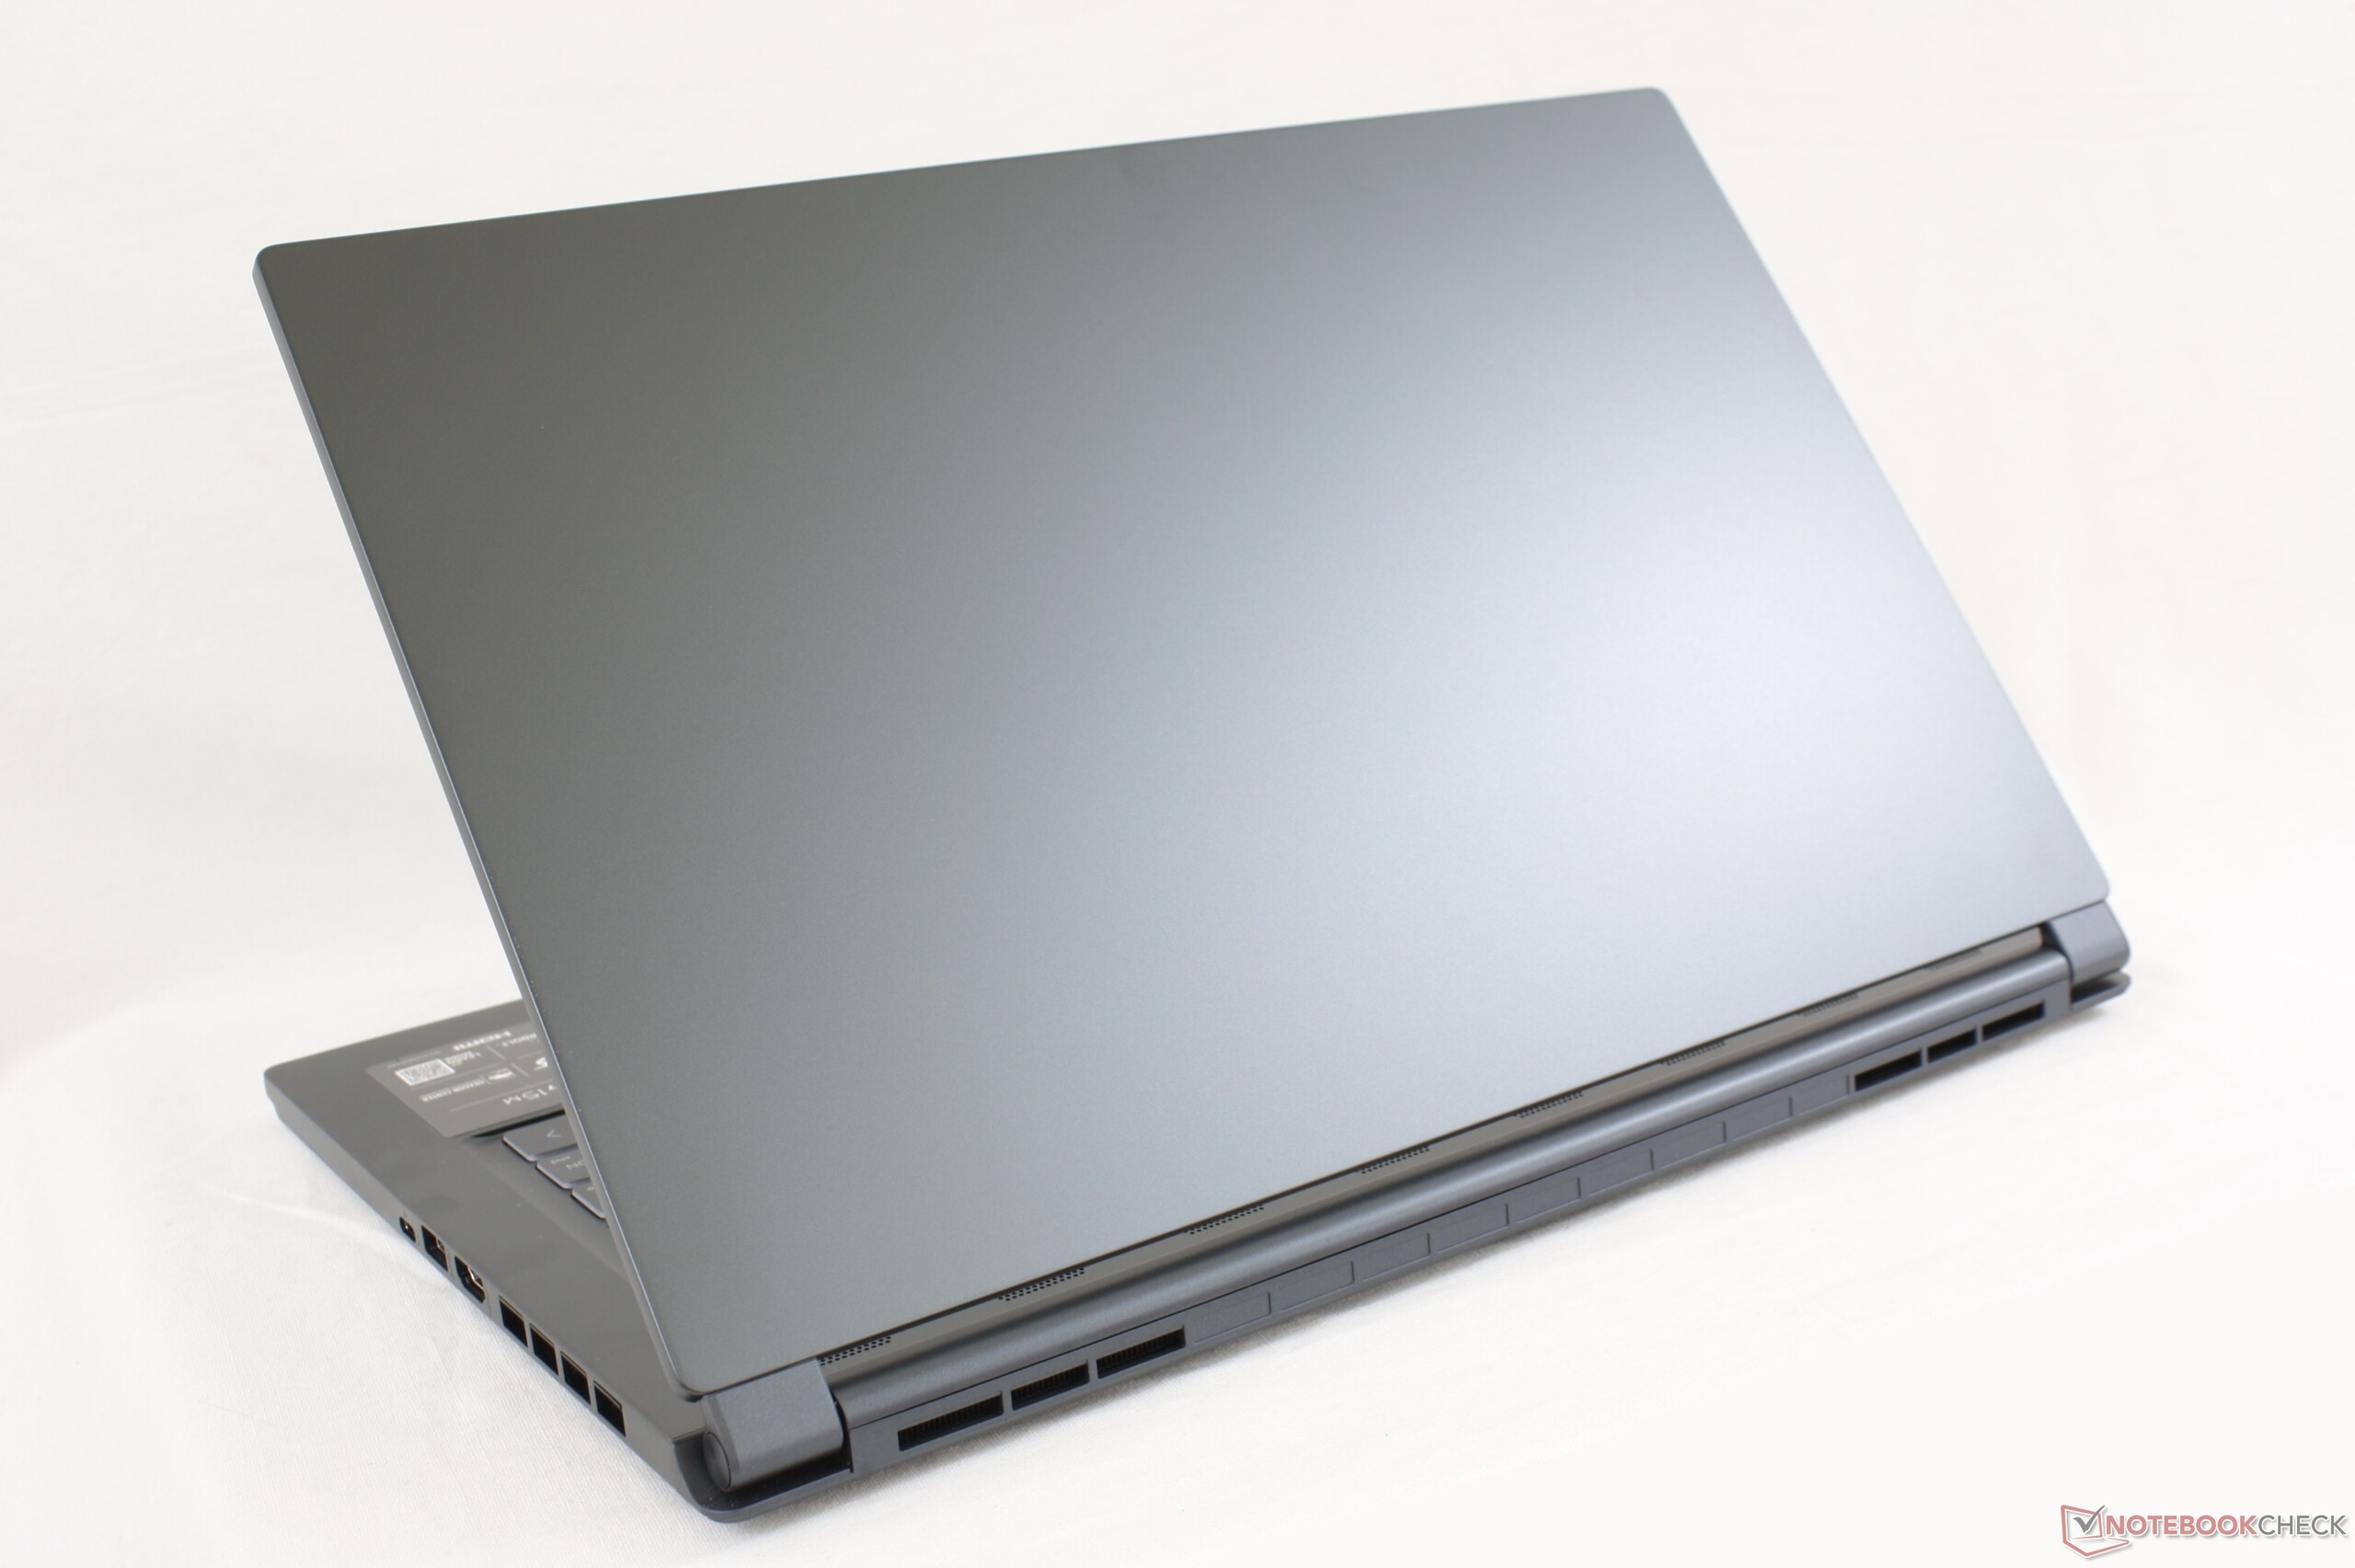
Het lage gewicht is een belangrijke eigenschap van de Stealth 15M, aangezien het systeem ruwweg 300 g lichter is dan veel van zijn 15,6-inch concurrenten, waaronder de XPS 15. Wat het gewichtsverschil nog opmerkelijker maakt, is dat de MSI ook wordt geleverd met aanzienlijk snellere grafische opties dan elk van deze zwaardere alternatieven. Het is een hoop kracht voor niet veel gewicht.
De totale afmetingen van de MSI zijn groter dan die van zowel de XPS 15 als de Prestige 15 door de dikkere kinrand.
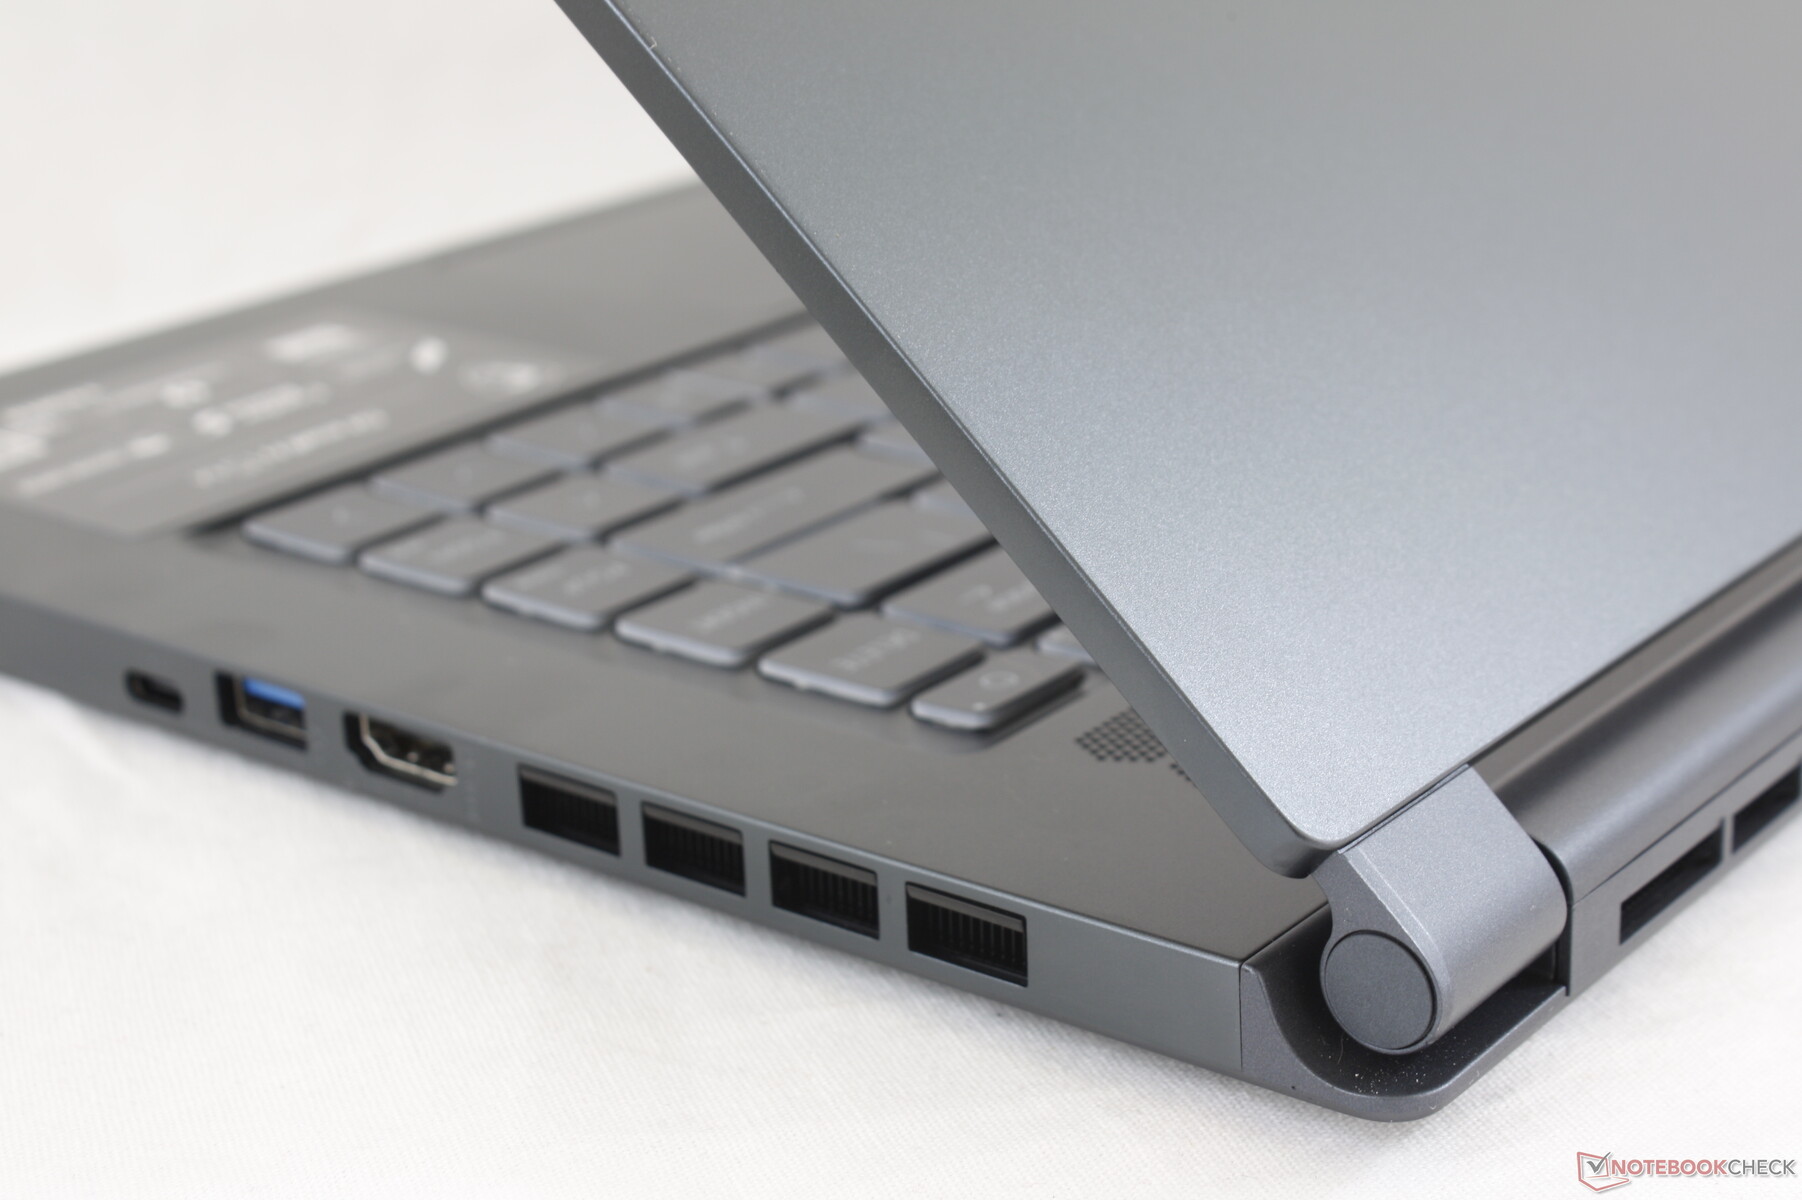
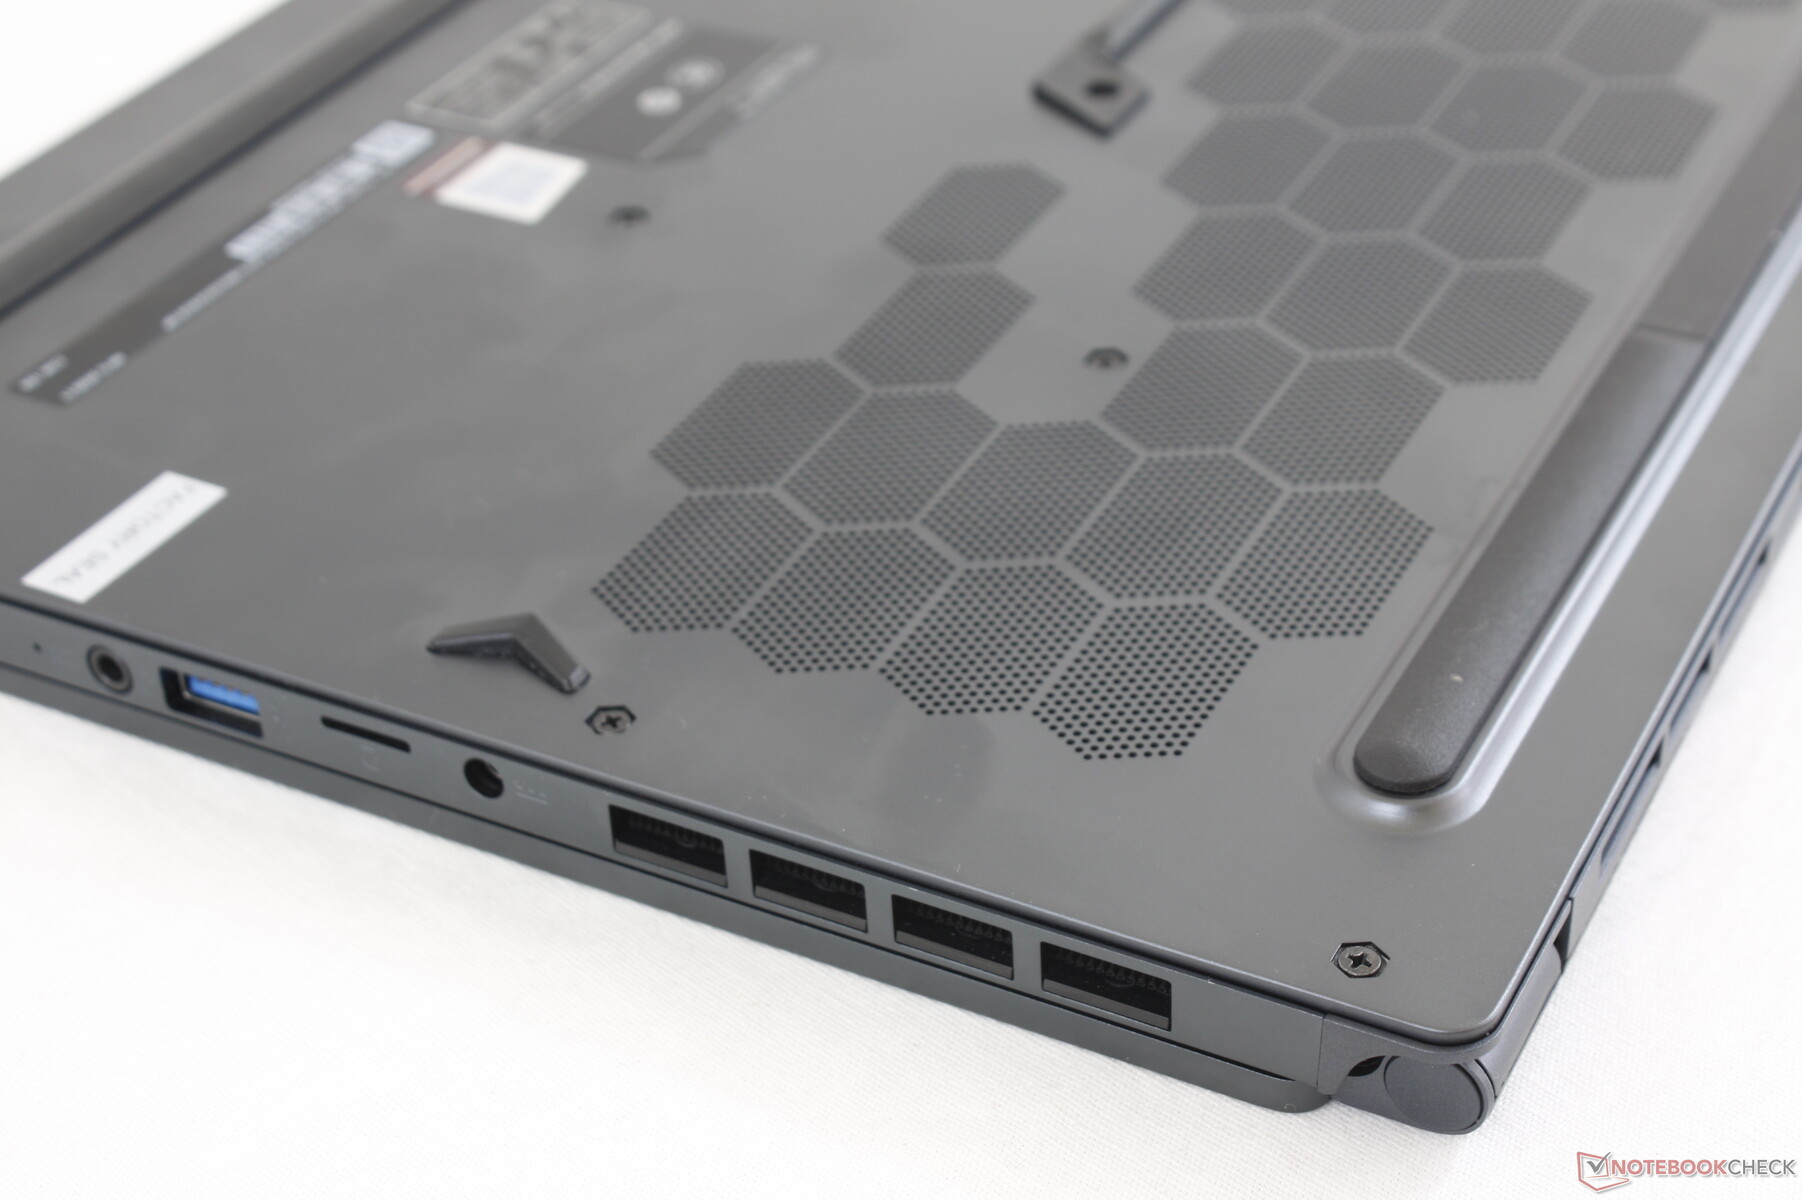
Connectiviteit
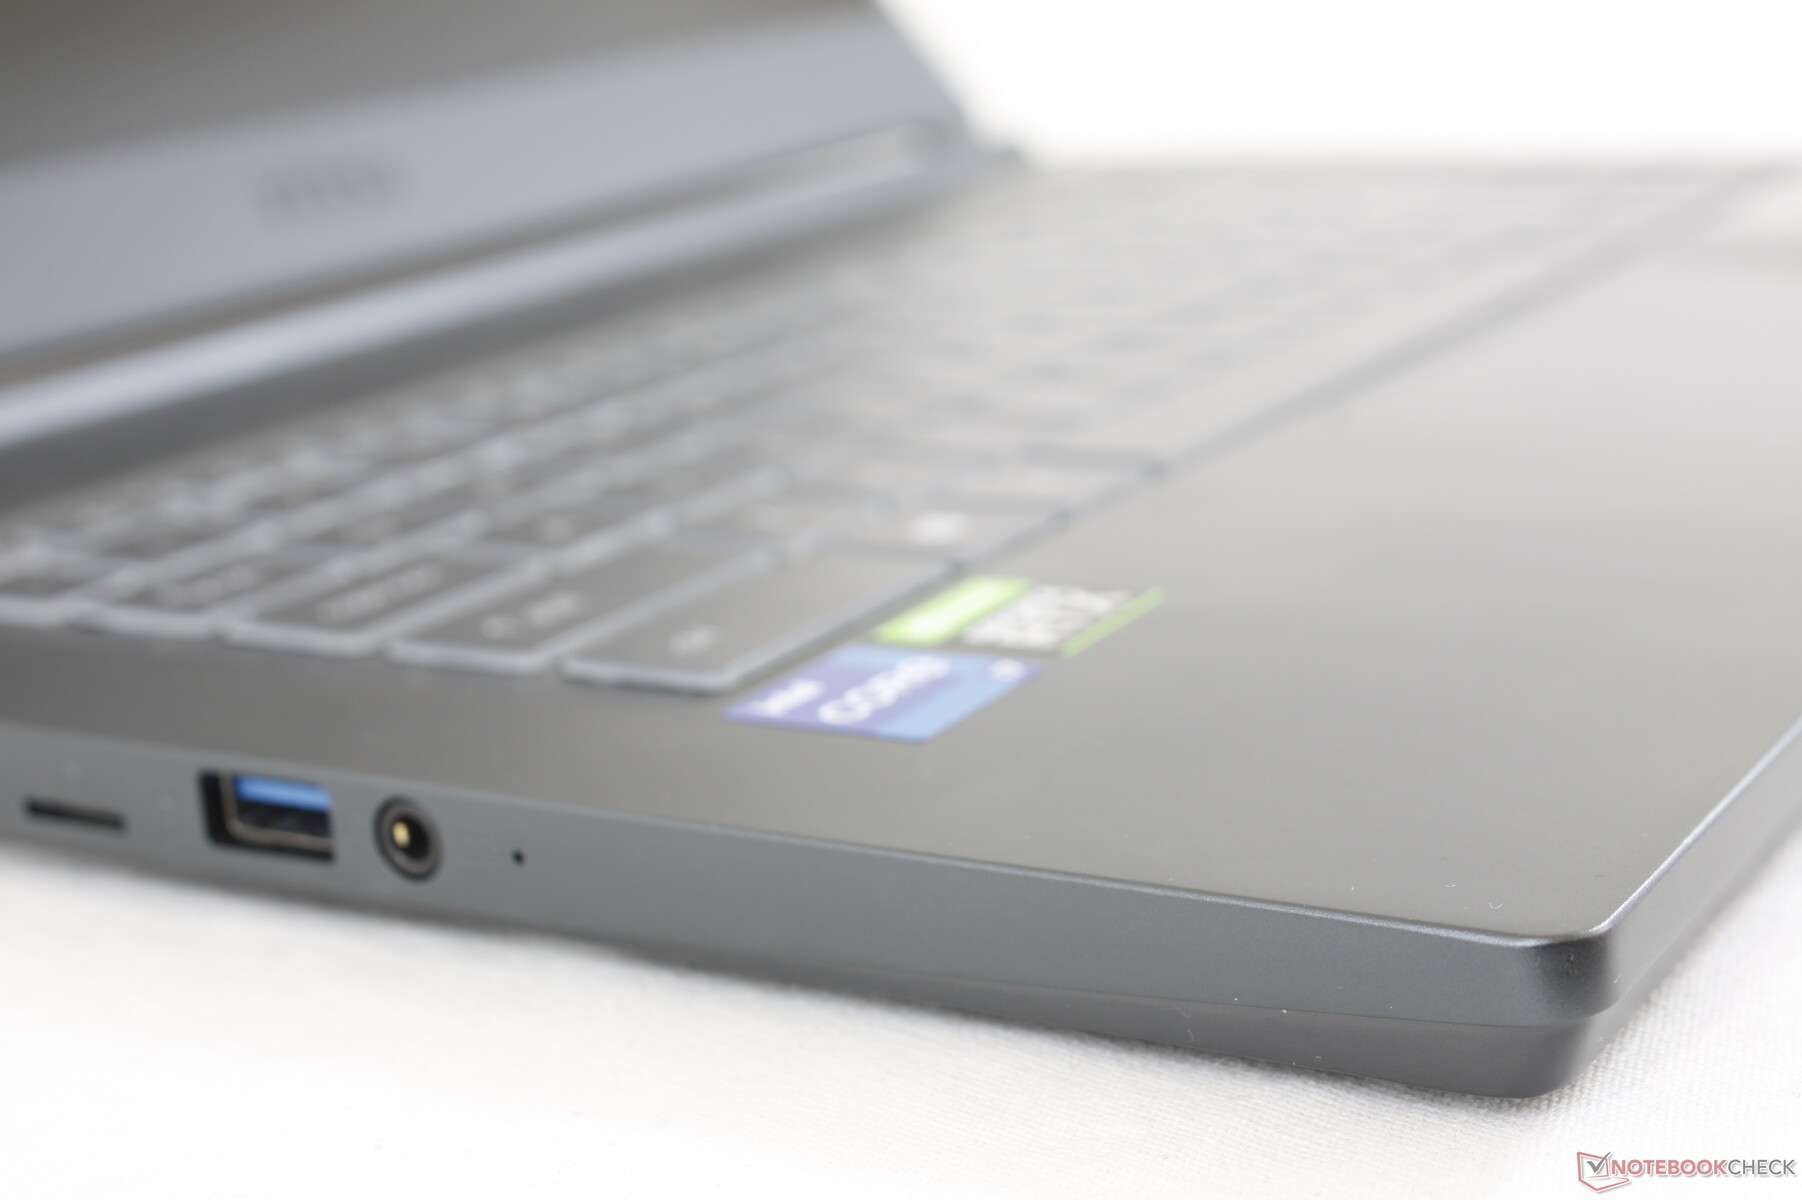
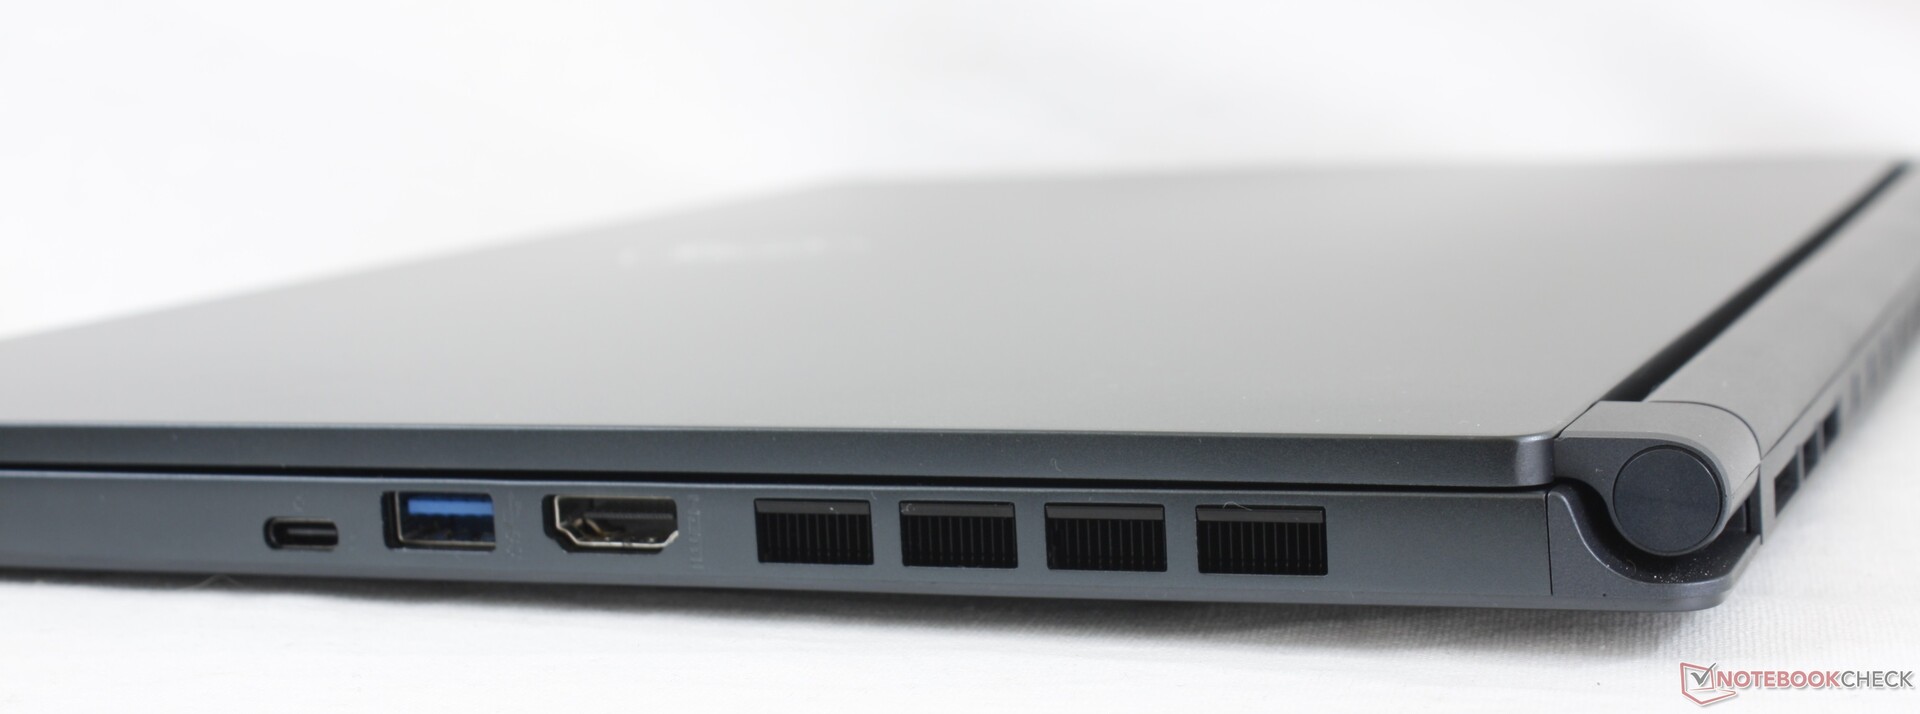
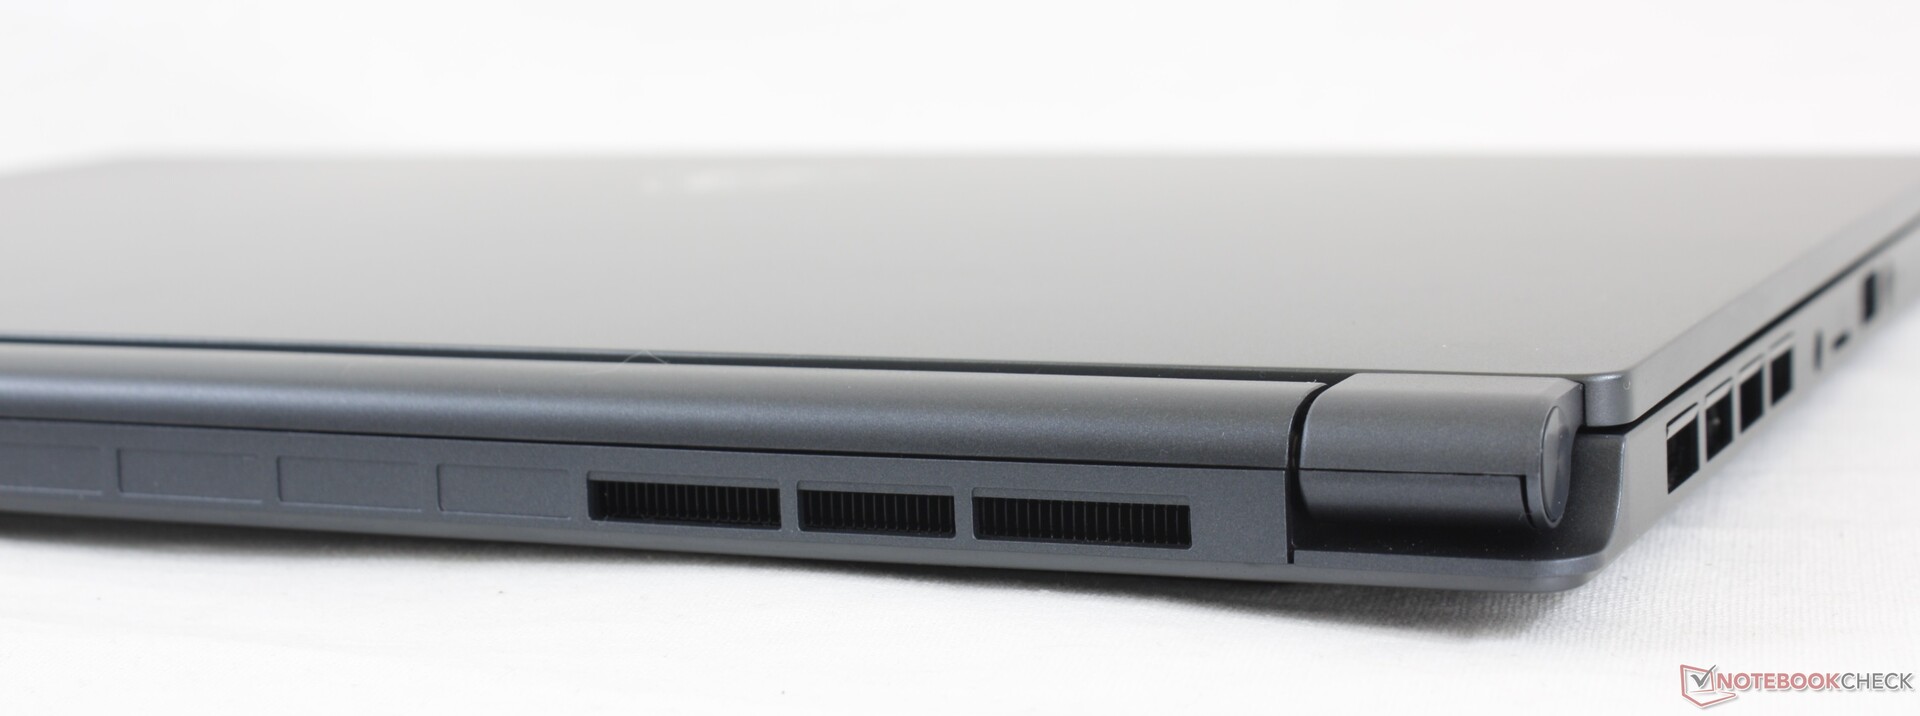
De poortopties zijn vergelijkbaar met die van de Prestige 15, maar met een eigen vat-laadpoort in plaats van een van de USB-C poorten. MSI kon hier waarschijnlijk niet volledig vertrouwen op USB-C opladen vanwege de hogere stroomvereisten van de GeForce RTX 2060 Max-Q in vergelijking met de GTX 1650 Max-Q van het Prestige model. De poorten hier zijn dicht opeengepakt langs de linker- en rechterrand.
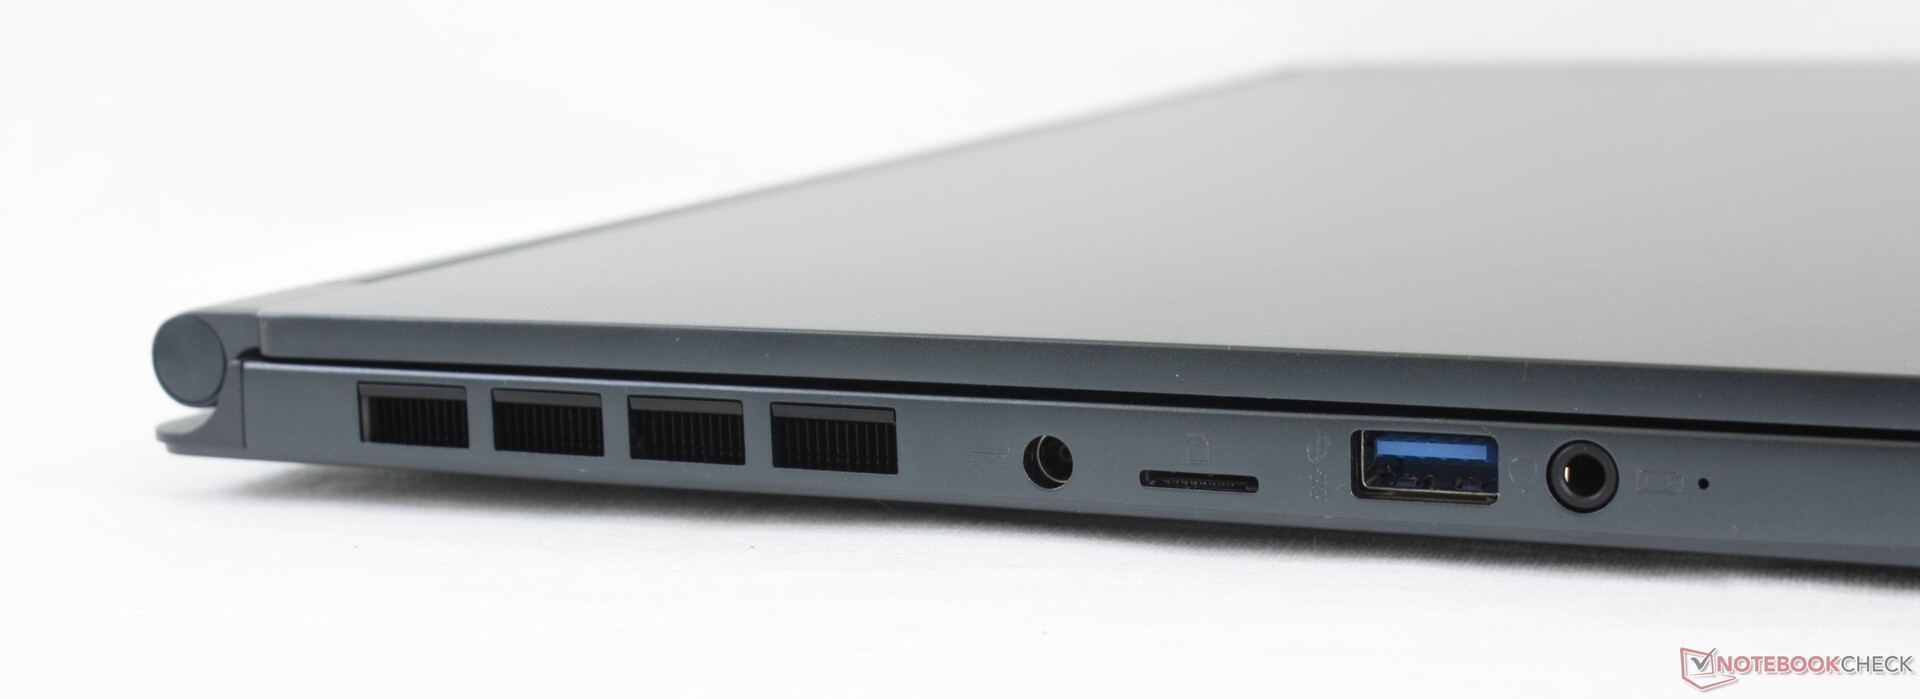
SD-kaartlezer
De veerbelaste MicroSD-lezer biedt zeer hoge overdrachtssnelheden van ongeveer 200 MB/s. Het verplaatsen van 1 GB aan foto's van onze UHS-II testkaart naar de desktop duurt ongeveer 6 seconden.
| SD Card Reader | |
| average JPG Copy Test (av. of 3 runs) | |
| Dell XPS 15 9500 Core i7 4K UHD (Toshiba Exceria Pro SDXC 64 GB UHS-II) | |
| MSI Stealth 15M A11SEK (Toshiba Exceria Pro M501 microSDXC 32GB) | |
| HP Spectre X360 15-5ZV31AV (Toshiba Exceria Pro M501 UHS-II) | |
| MSI Prestige 15 A10SC (Toshiba Exceria Pro M501 UHS-II) | |
| Lenovo ThinkPad T15p-20TN0006GE (Toshiba Exceria Pro SDXC 64 GB UHS-II) | |
| Asus ZenBook UX535-M01440 (Toshiba Exceria Pro M501 microSDXC 64GB) | |
| maximum AS SSD Seq Read Test (1GB) | |
| MSI Stealth 15M A11SEK (Toshiba Exceria Pro M501 microSDXC 32GB) | |
| Dell XPS 15 9500 Core i7 4K UHD (Toshiba Exceria Pro SDXC 64 GB UHS-II) | |
| MSI Prestige 15 A10SC (Toshiba Exceria Pro M501 UHS-II) | |
| HP Spectre X360 15-5ZV31AV (Toshiba Exceria Pro M501 UHS-II) | |
| Lenovo ThinkPad T15p-20TN0006GE (Toshiba Exceria Pro SDXC 64 GB UHS-II) | |
| Asus ZenBook UX535-M01440 (Toshiba Exceria Pro M501 microSDXC 64GB) | |
Communicatie
Een Intel AX201 wordt standaard geleverd voor Wi-Fi 6 en Bluetooth 5.1 connectiviteit. We hebben geen problemen ondervonden bij het koppelen met onze Netgear RAX200-testrouter, hoewel de overdrachtssnelheden veel trager zijn dan verwacht.
Webcam


Onderhoud
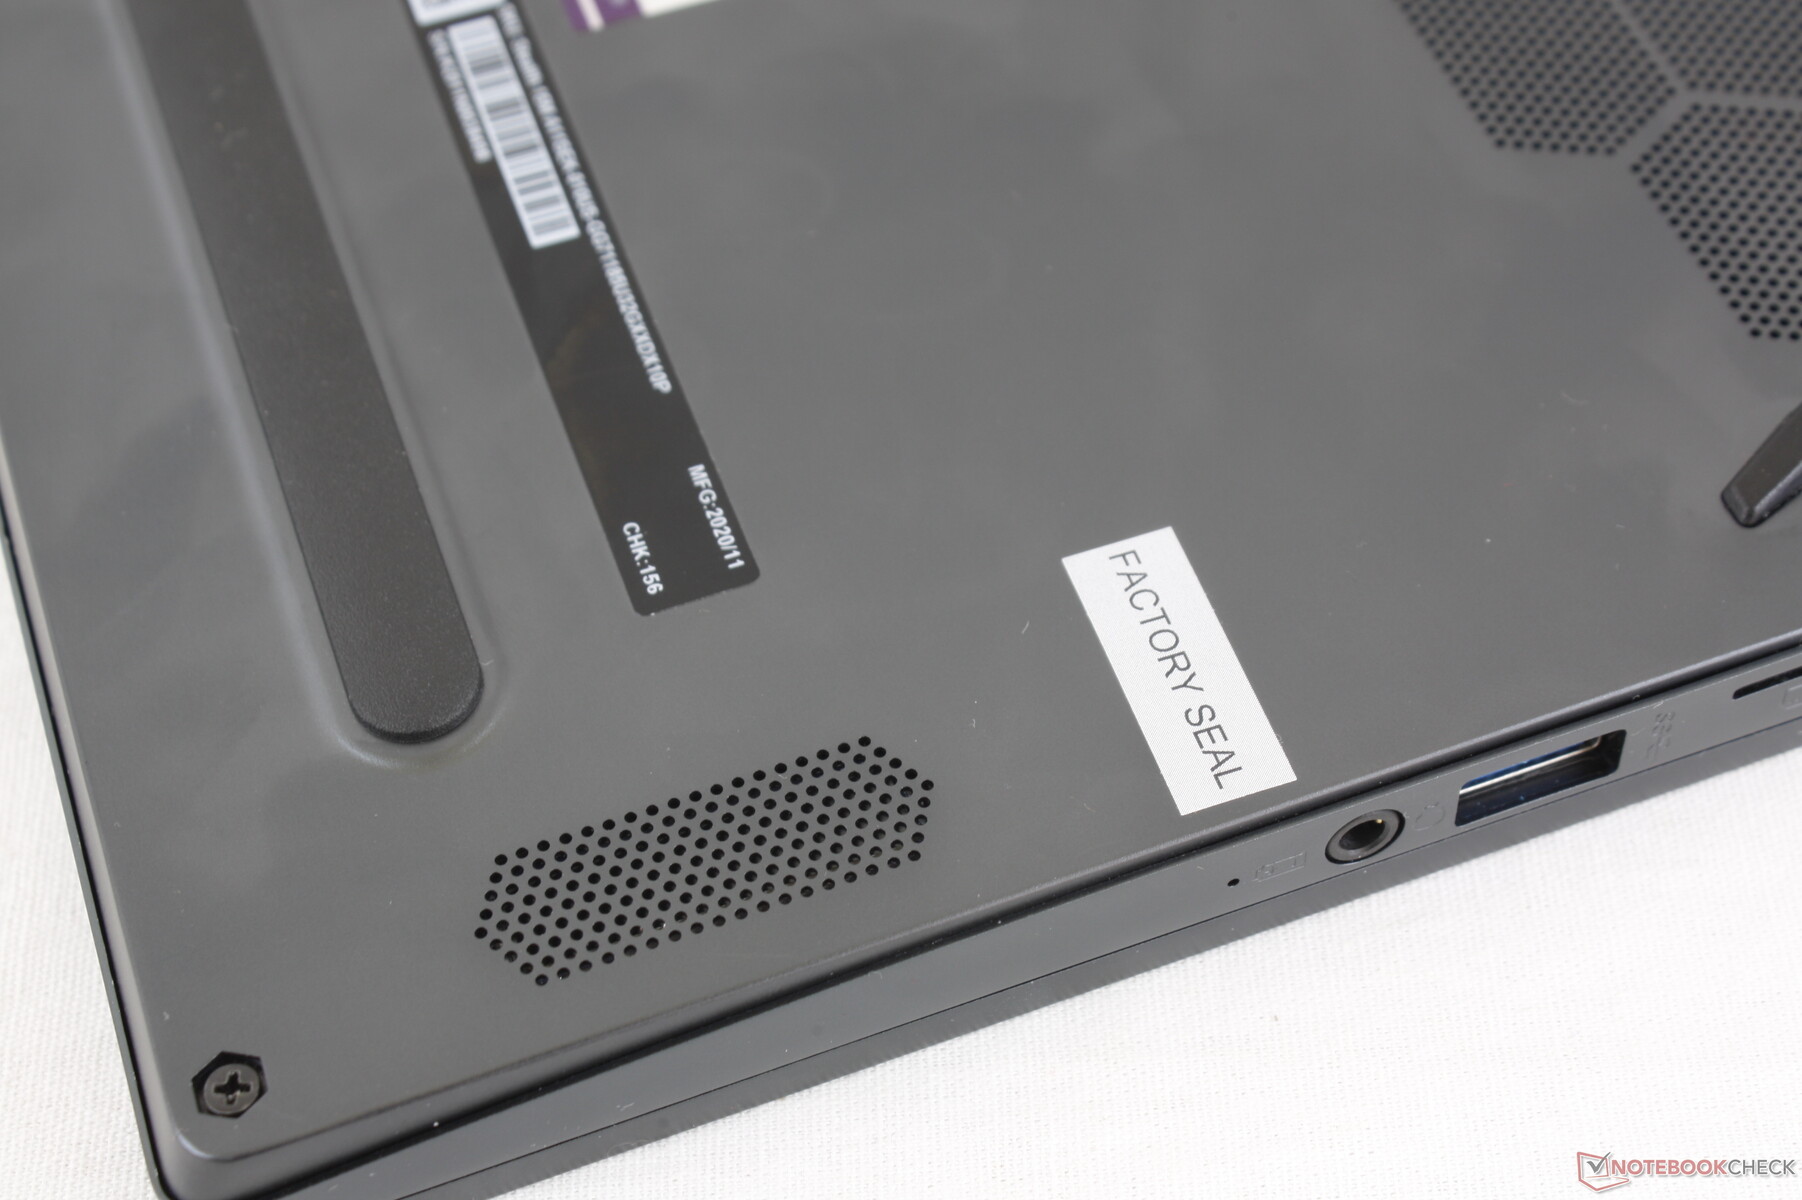
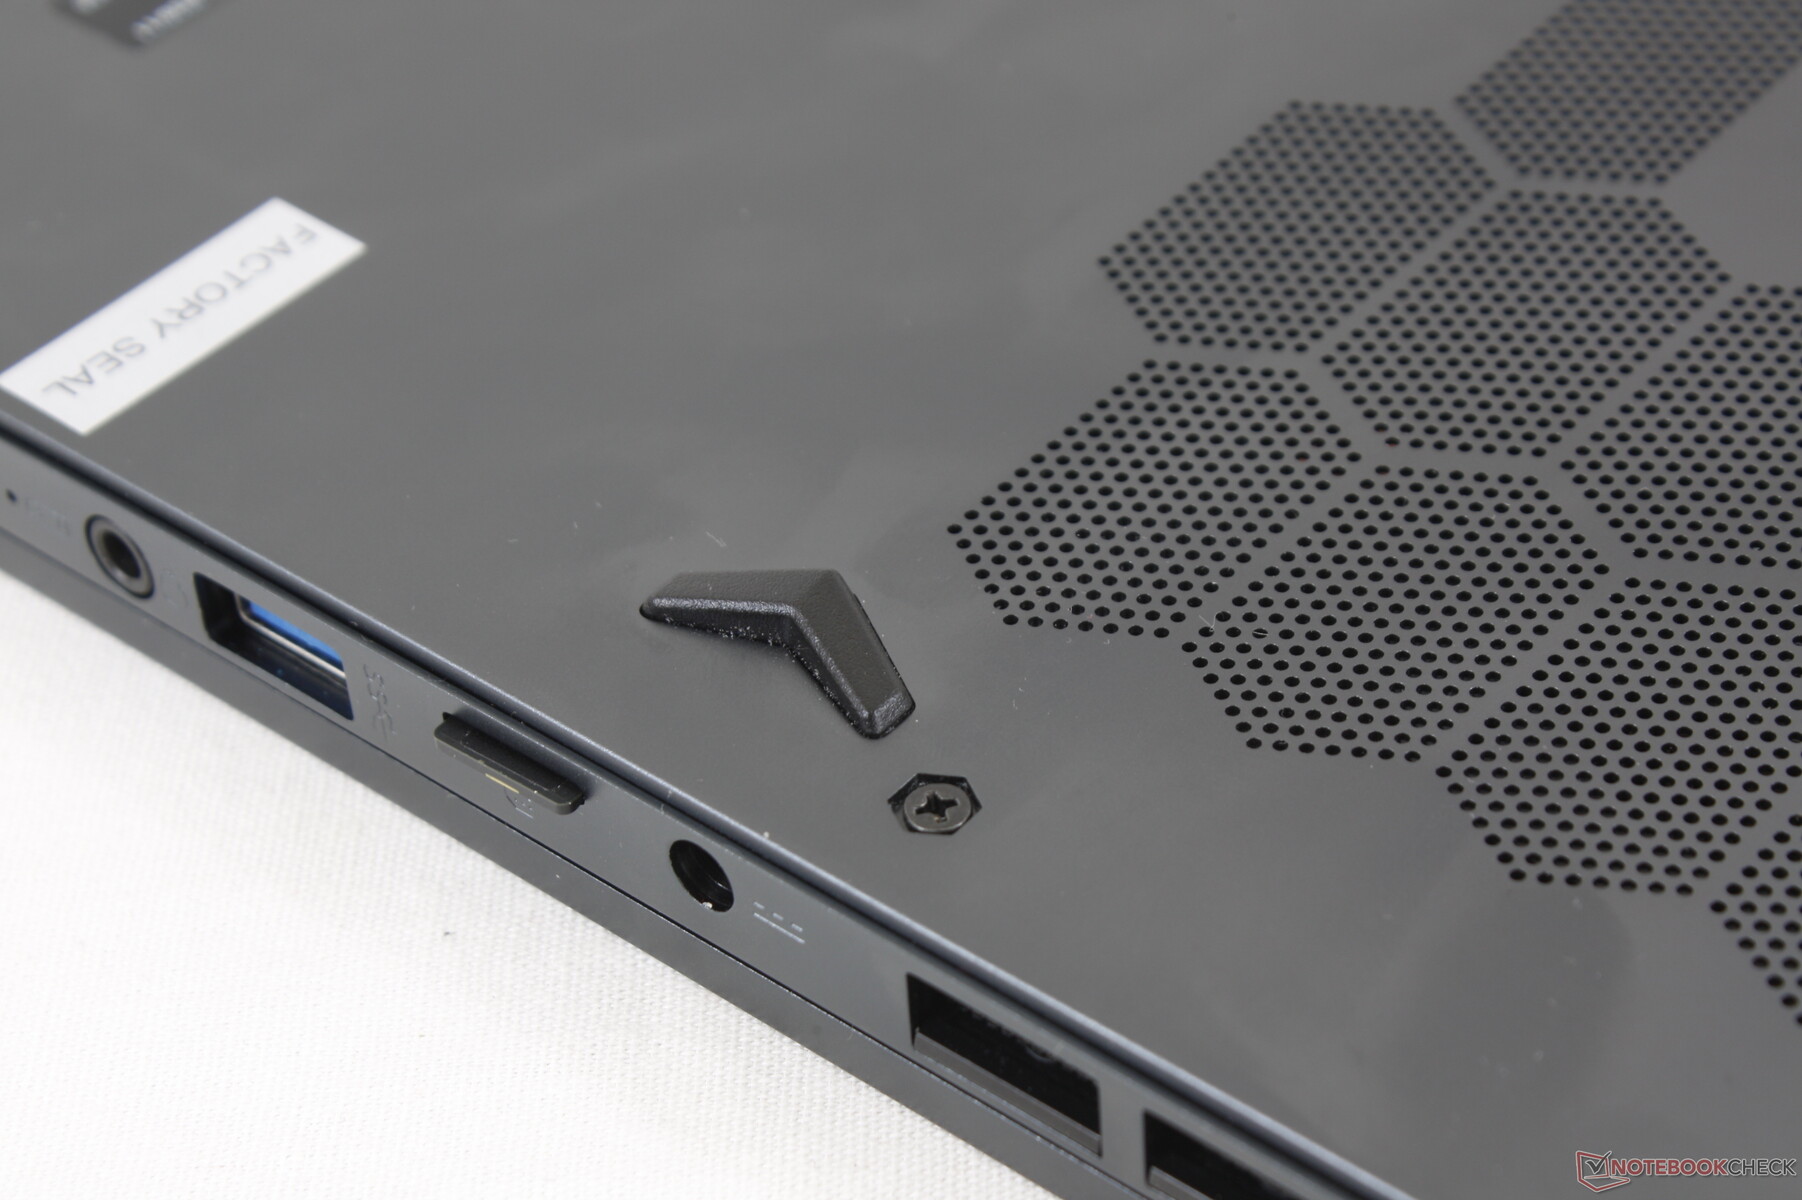
Ondanks onze kreten blijft MSI eindgebruiker upgrades ontmoedigen met een 'fabriekszegel' sticker over een van de schroeven op de bodemplaat. Aanspraak maken op garantie of retourzendingen kan moeilijk zijn omdat verkopers het verbroken zegel tegen je kunnen gebruiken.
Accessoires en garantie
De detailhandelsdoos bevat een USB-A naar RJ-45 adapter naast het papierwerk en de netstroomadapter. In tegenstelling tot de GS66 zit er geen fluwelen reinigingsdoekje in de doos.
Een fabrieksgarantie van twee jaar wordt standaard meegeleverd.
Invoerapparaten
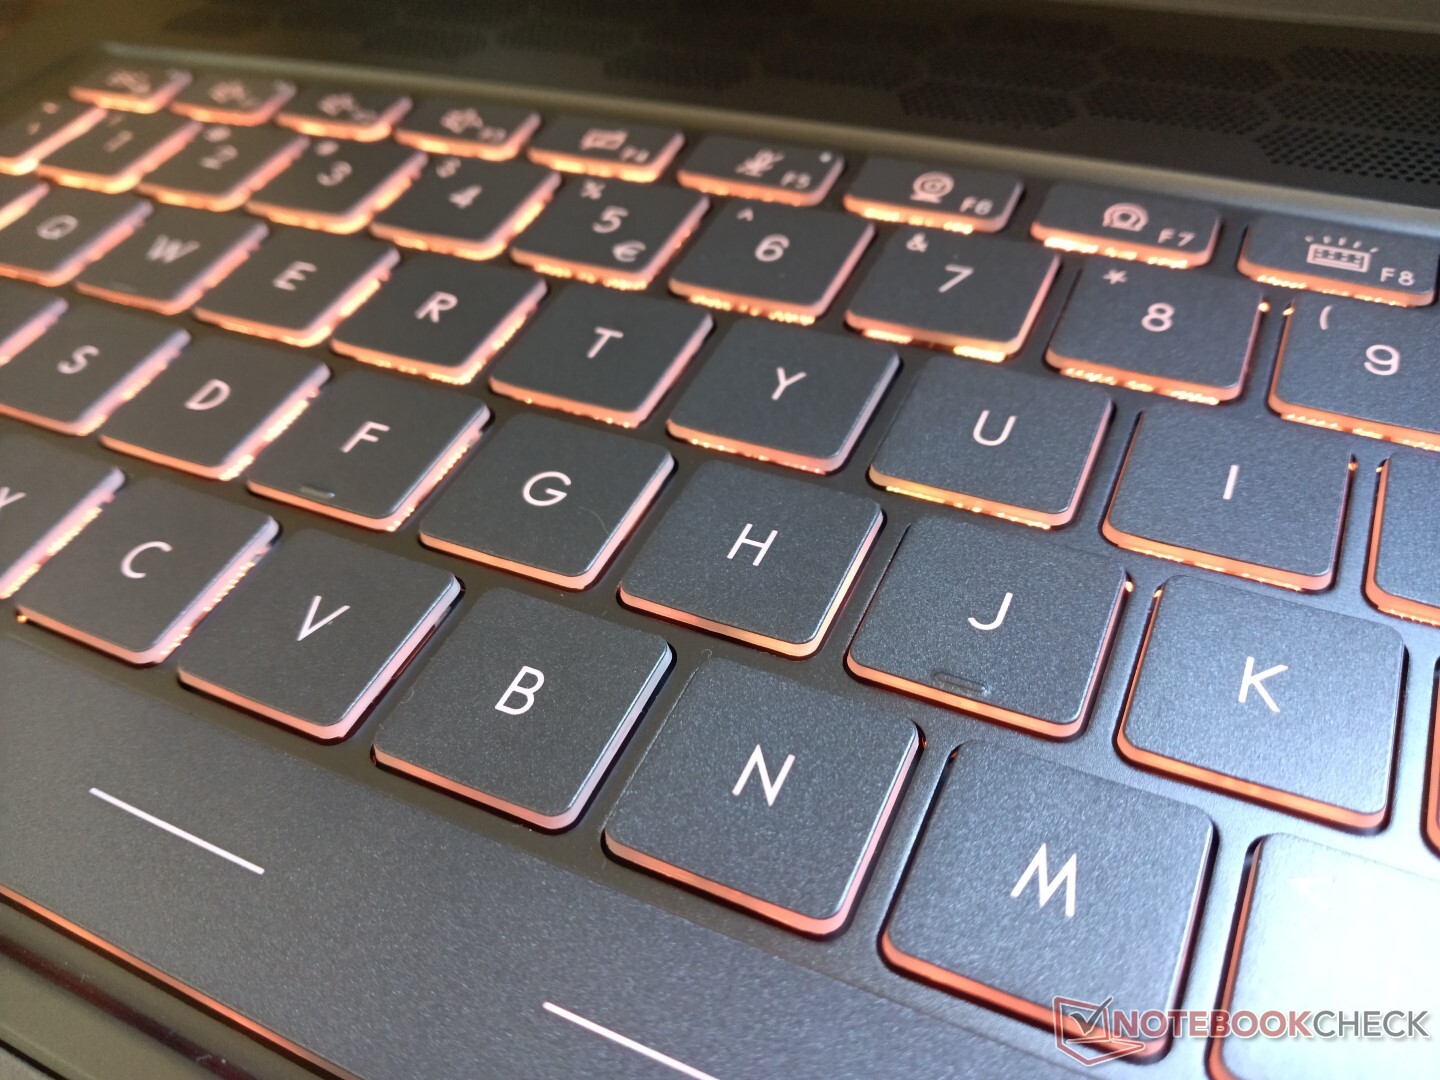
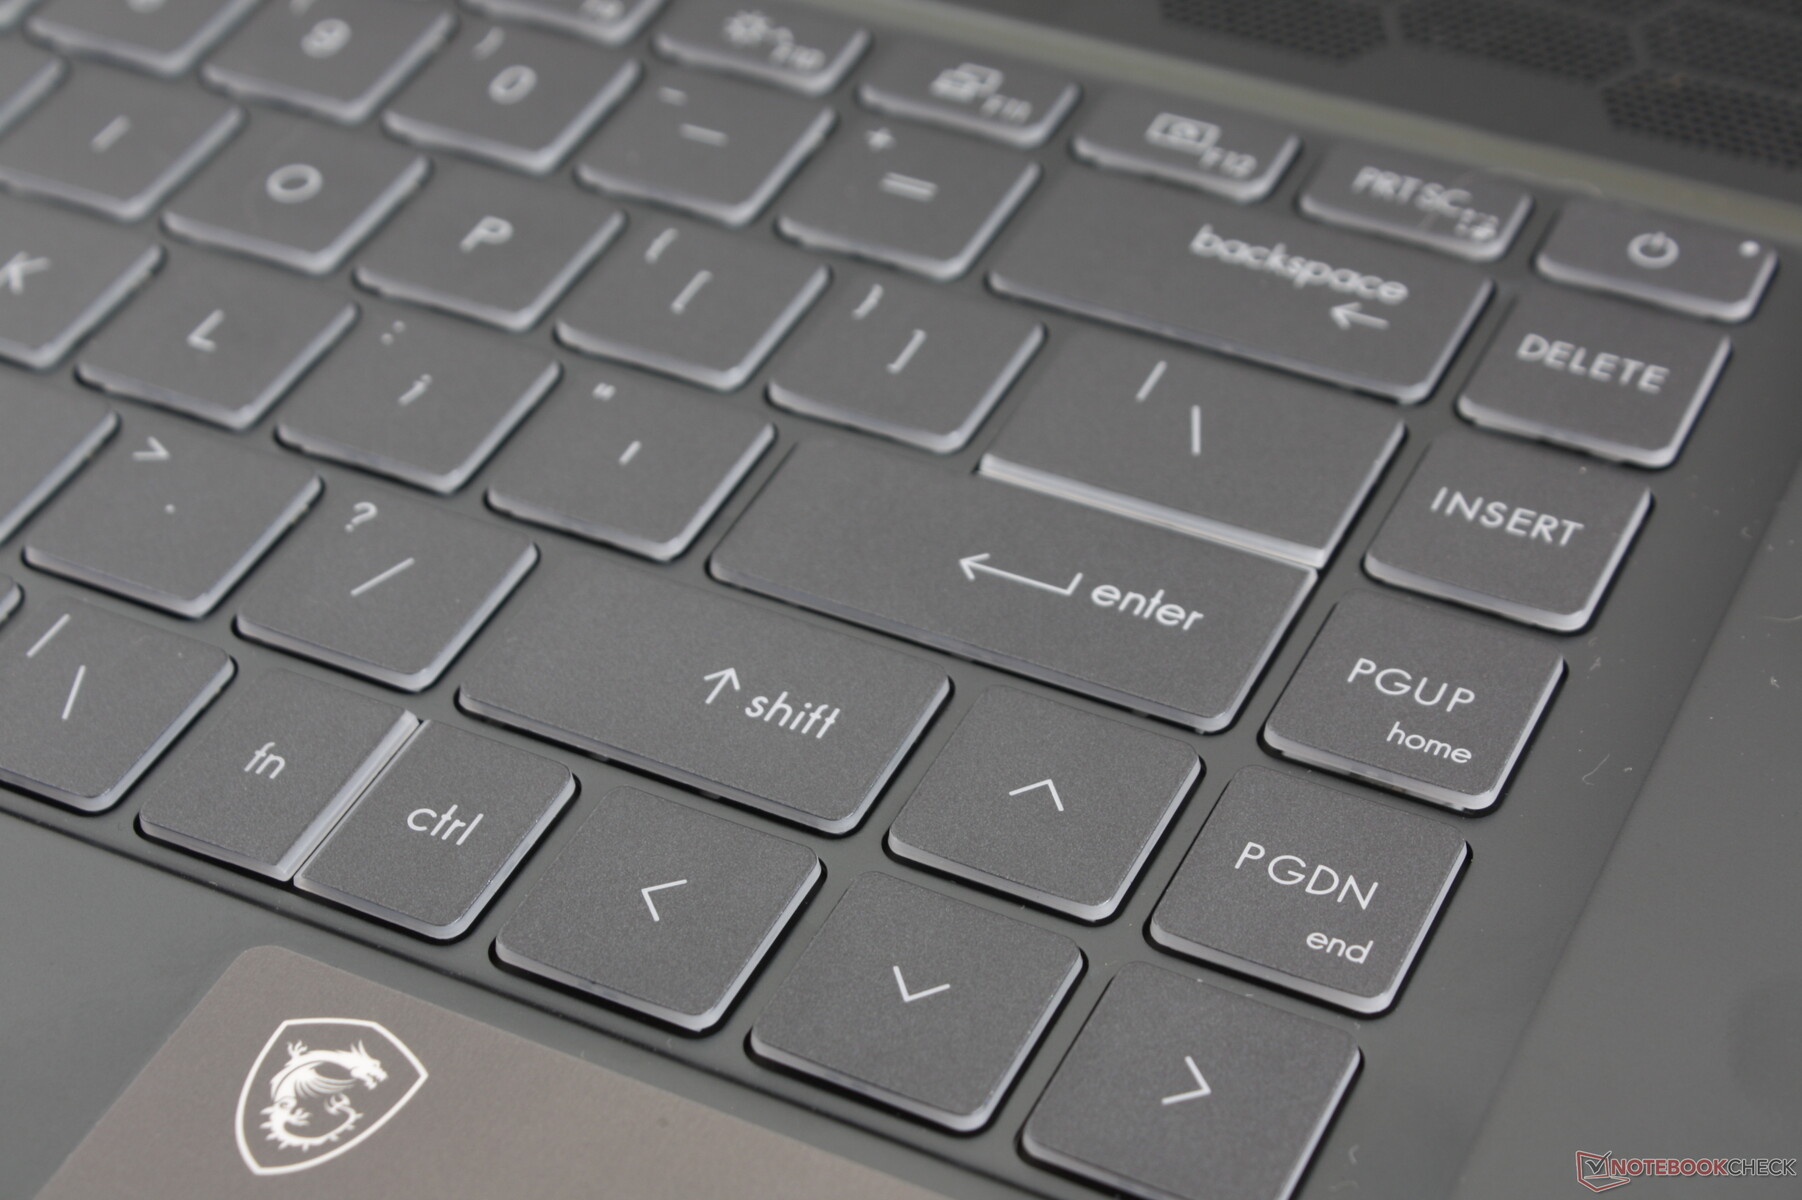
Toetsenbord
De feedback en indeling van het toetsenbord zijn identiek aan die van de Prestige 15, met uitzondering van de gesplitste FN/Ctrl-toetsen rechtsonder. Onze eerdere opmerkingen over het Prestige-toetsenbord zijn hier dus van toepassing, inclusief de lichte en ondiepe toetsen ten opzichte van de stevigere toetsen van de HP Spectre of Lenovo ThinkPad-toetsen. Gebruikers die gewend zijn om te typen op een Asus ZenBook of VivoBook zullen een vertrouwde type-ervaring vinden op de Stealth 15M
In tegenstelling tot de MSI Prestige, Modern, of Creator, is de achtergrondverlichting van het toetsenbord hier compatibel met RGB kleuren via MSI Mystic Light. De opties zijn beperkt tot slechts één zone, in tegenstelling tot de RGB-instellingen per toets op de GS66-serie.
Touchpad
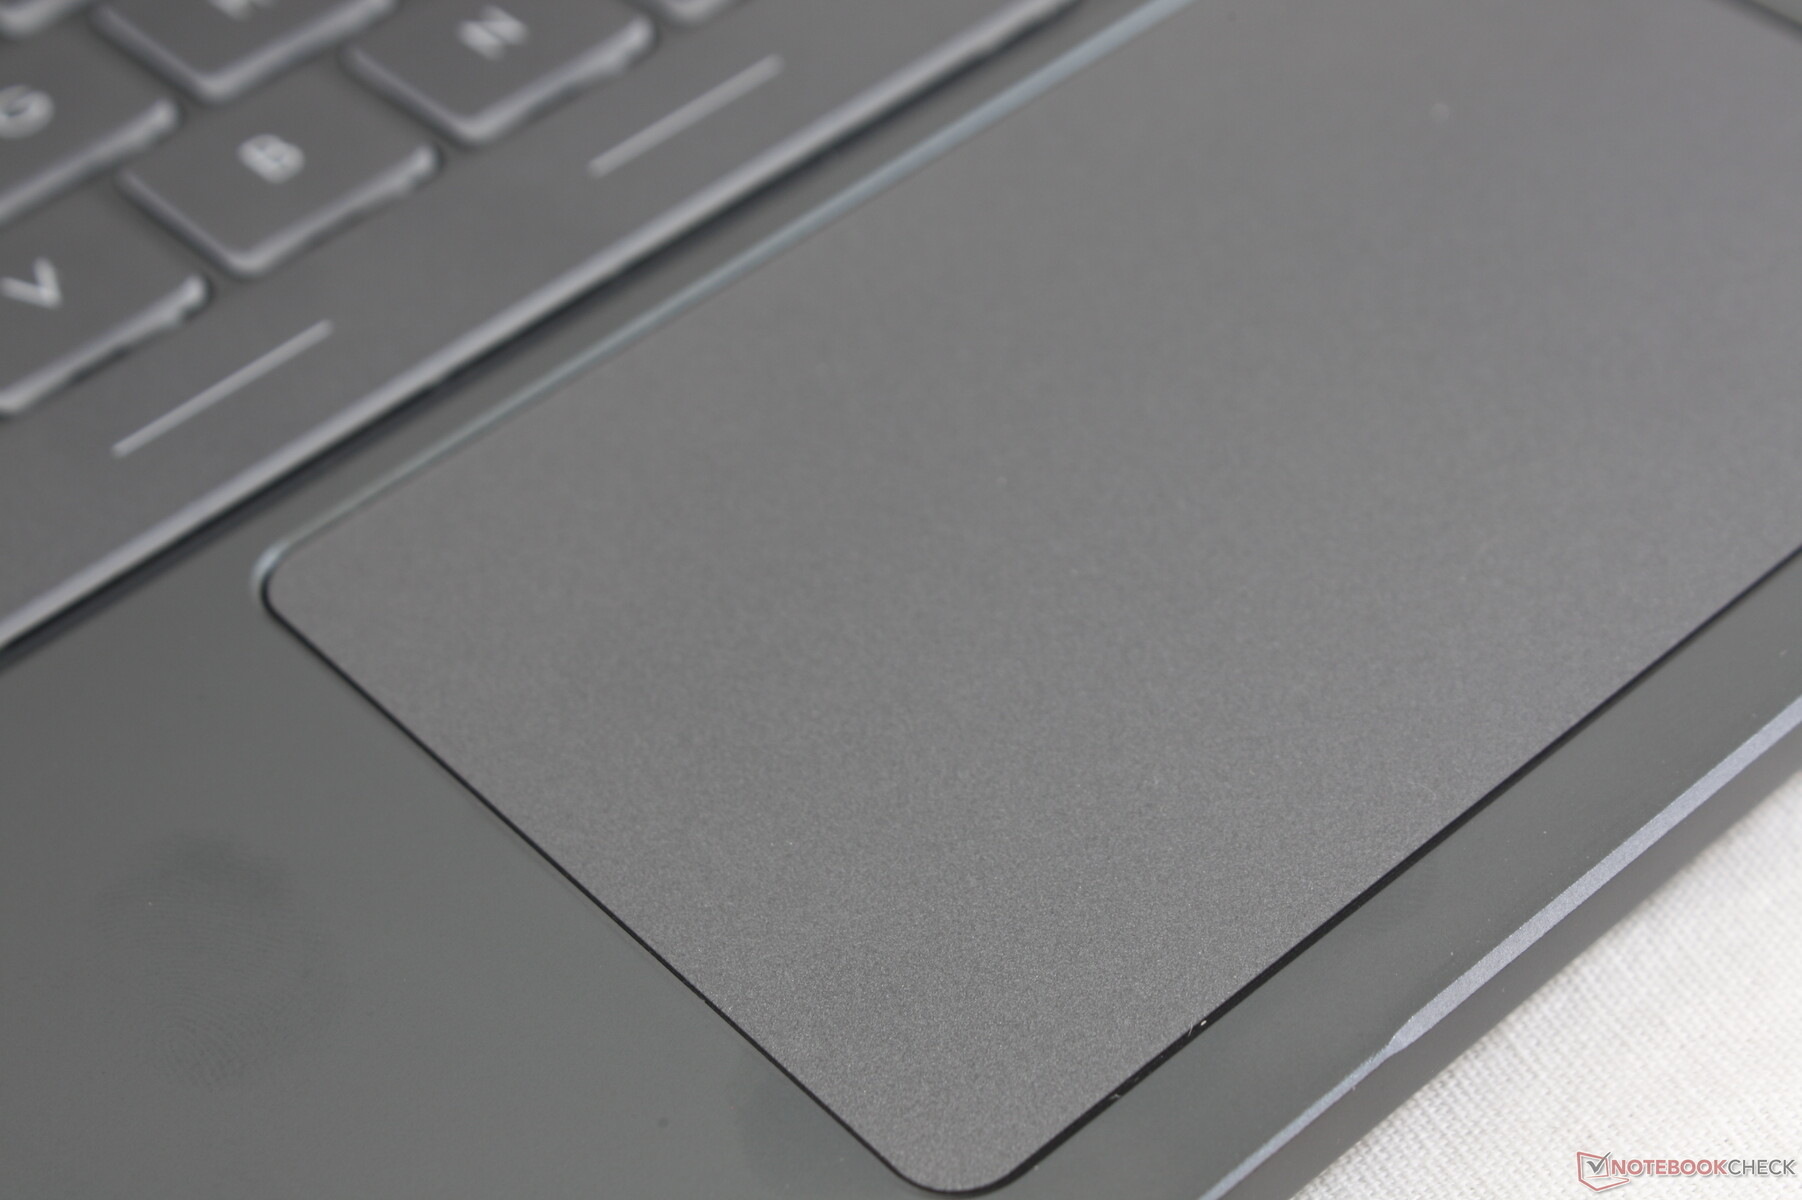
Het clickpad (10,5 x 6,5 cm) is kleiner dan dat van de XPS 15 (15,1 x 9 cm) of HP Spectre x360 15 (12 x 6 cm). De cursorbesturing verloopt soepel en blijft bijna niet hangen, zelfs niet als je heel langzaam over het oppervlak glijdt. De geïntegreerde clickpad knoppen zijn echter sponzig en moeilijk te gebruiken voor langere periodes. Een externe muis wordt sterk aanbevolenals u veel moet klikken.

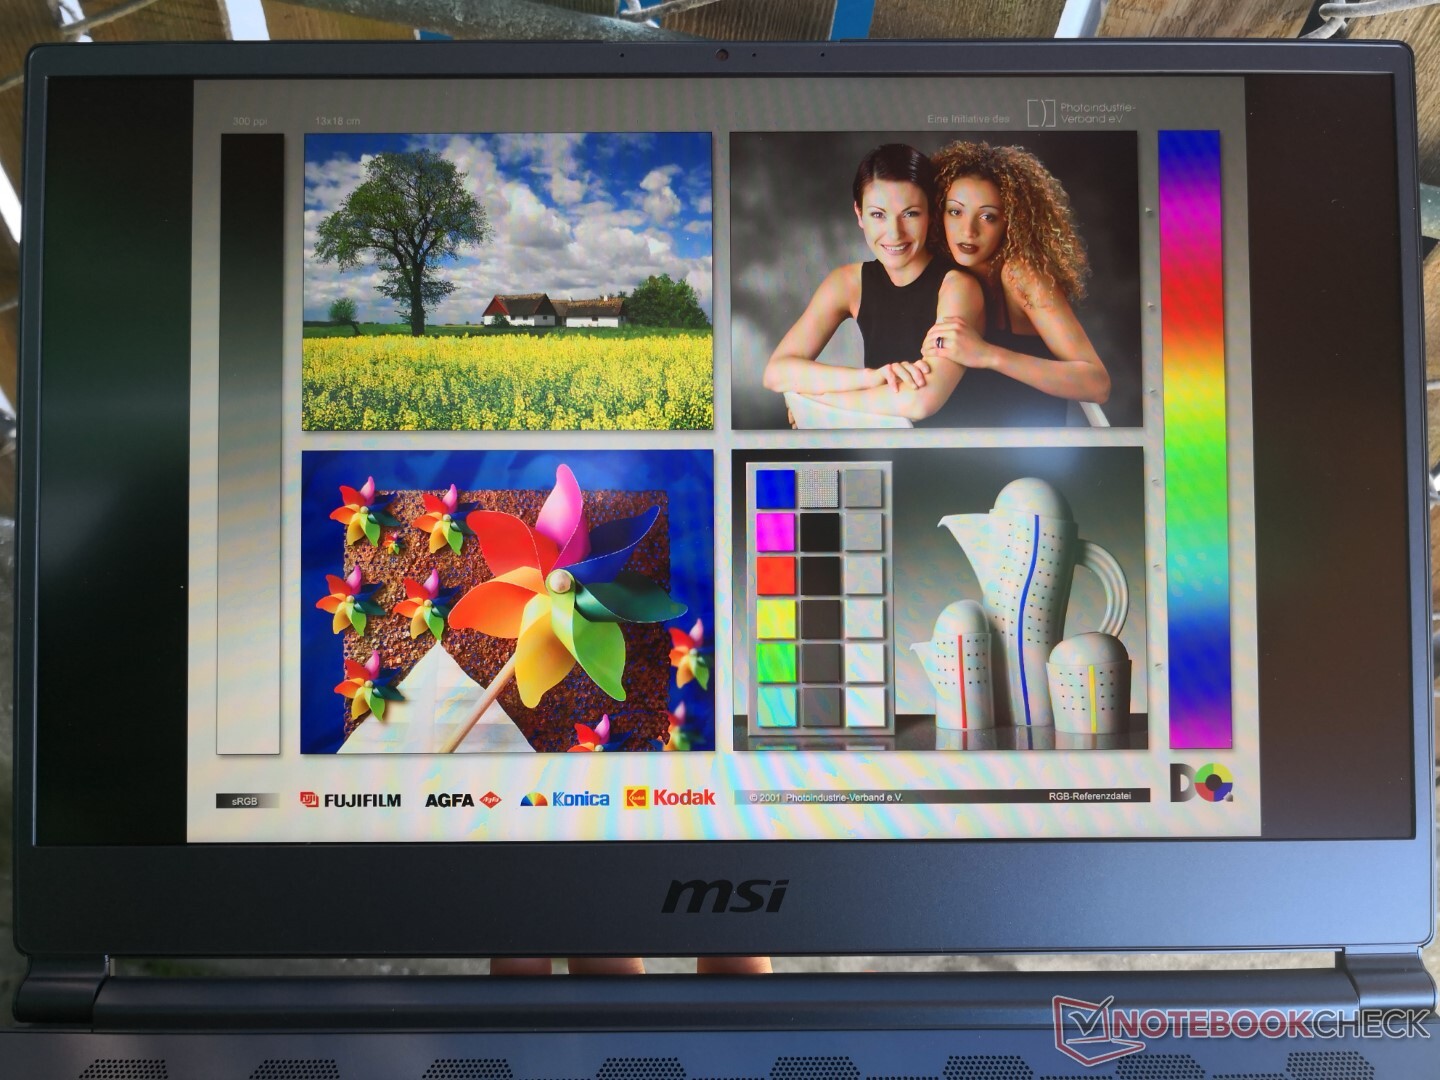
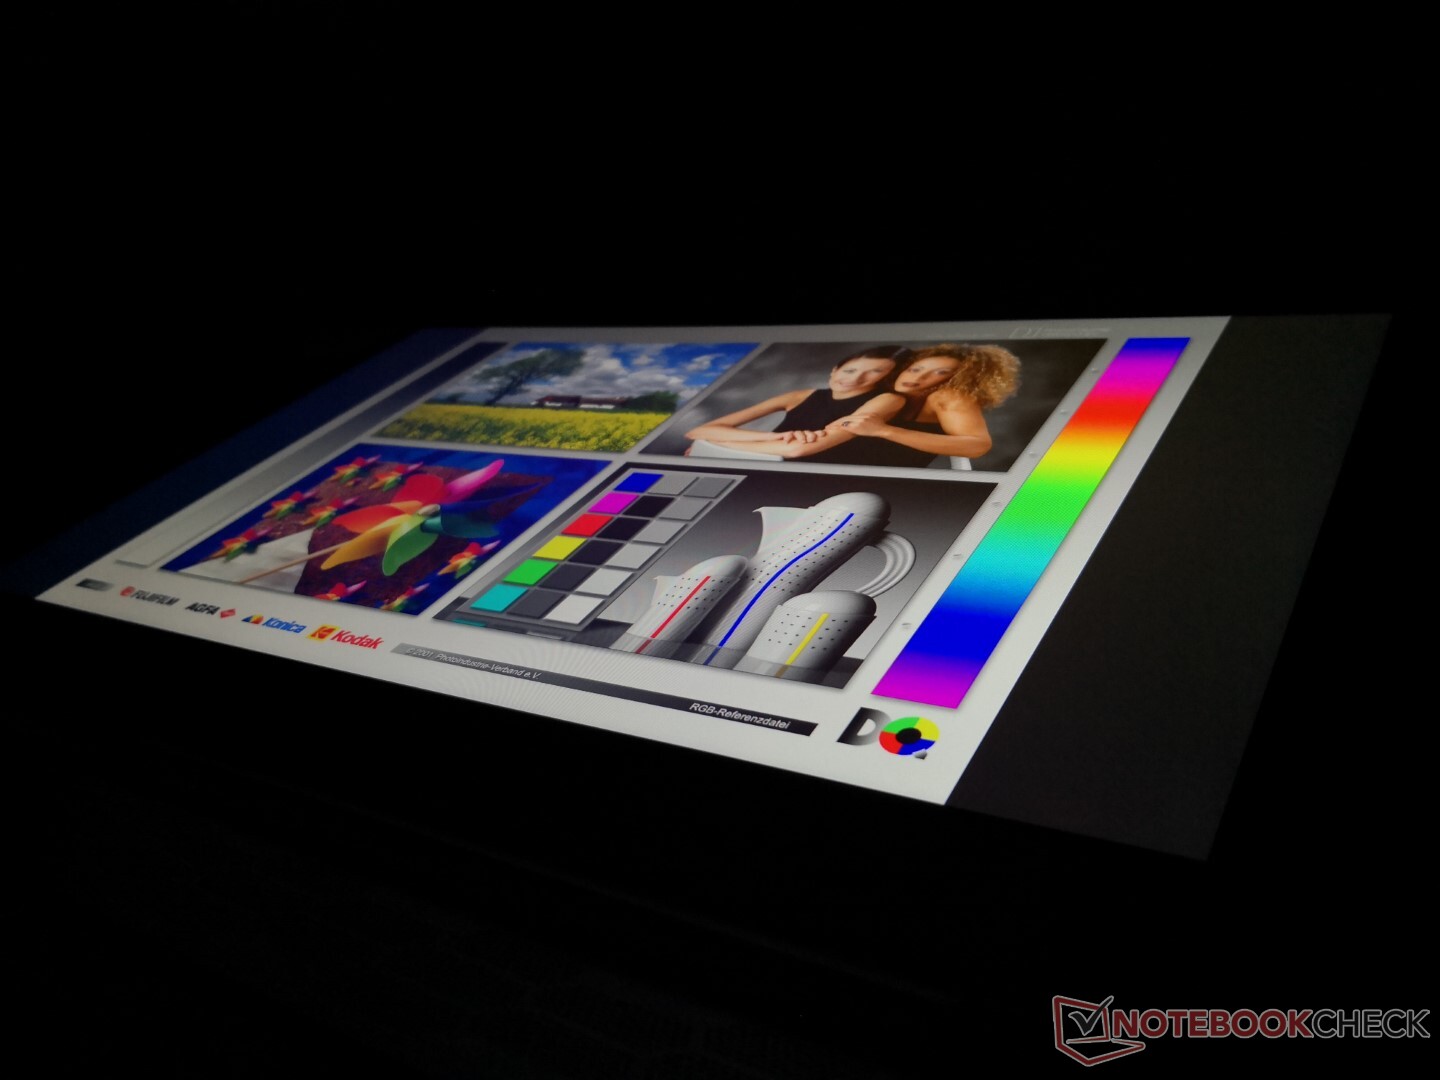
Weergave
De Stealth 15M wordt geleverd met hetzelfde 60 Hz Chi Mei N156HCE-EN1 IPS paneel als te vinden is op de Lenovo ThinkPad P52, Yoga 720-15IKB, Asus ZenBook Pro UX550, en zelfs MSI's eigen Modern 15. Inheemse kenmerken zoals de fatsoenlijke contrast ratio, kleurruimte, zwart-wit responstijden, en de algehele visuele kwaliteit zijn daarom vrij vergelijkbaar tussen deze systemen, vooral bij de Modern 15.
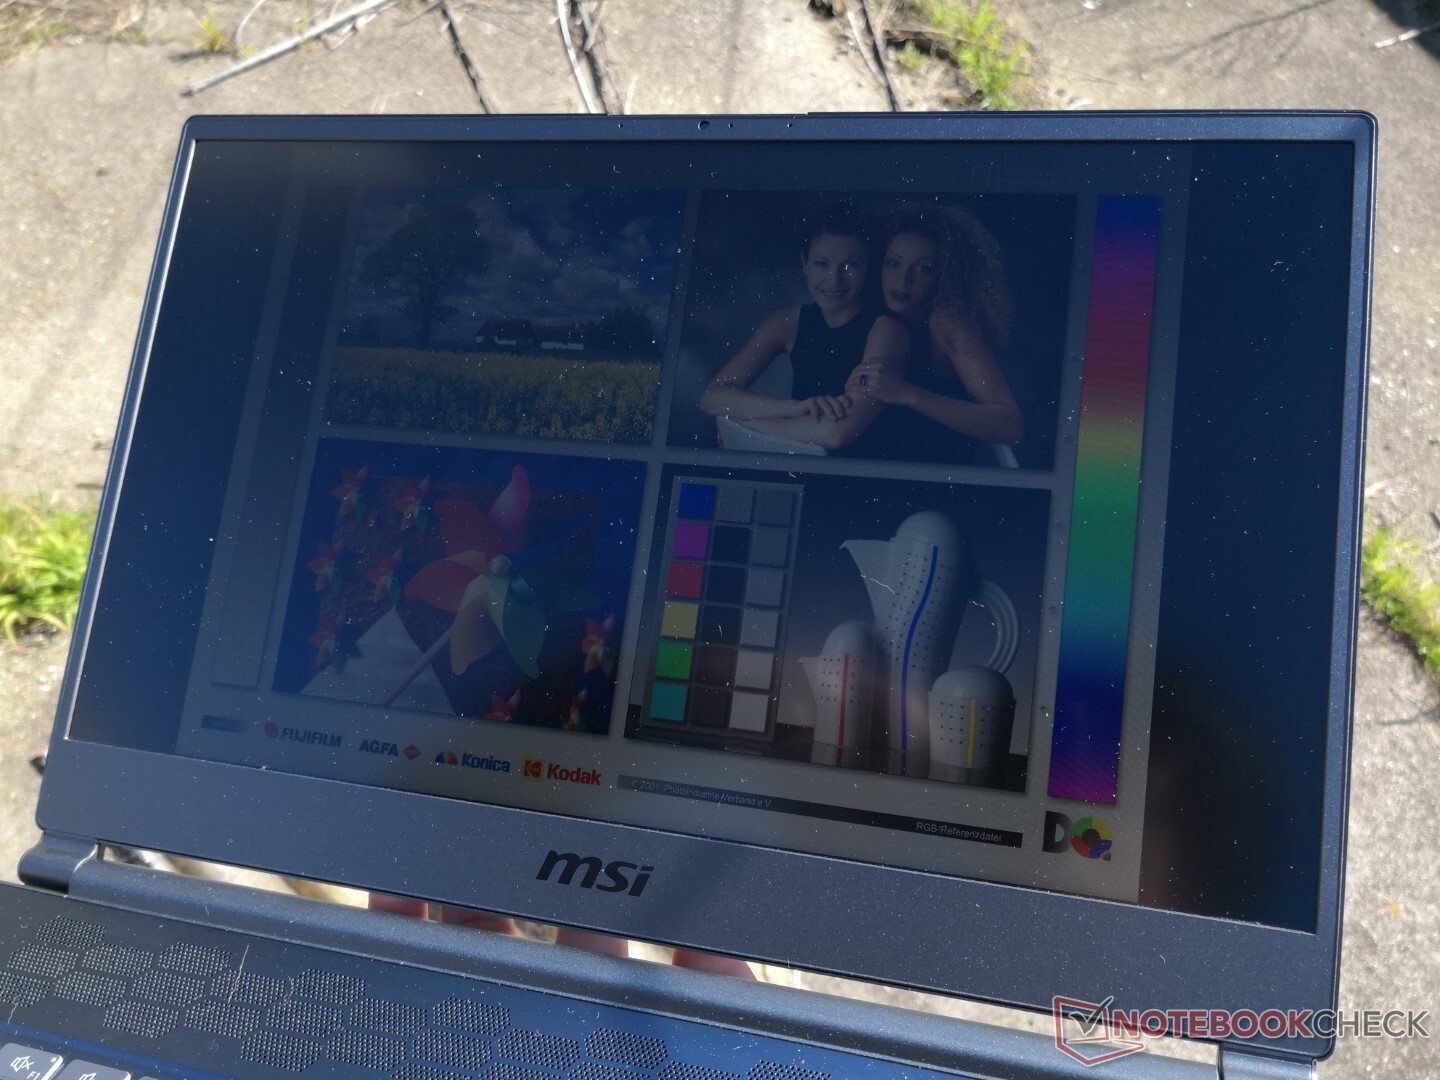
Een opmerkelijk nadeel van het beeldscherm is de matige maximale helderheid van slechts 279 nits. Hoewel bruikbaar voor omstandigheden binnenshuis, is dit veel lager dan de meeste andere 15,6 inch multimedia laptops in dezelfde prijsklasse, zoals blijkt uit de onderstaande tabel.


| |||||||||||||||||||||||||
Helderheidsverdeling: 82 %
Helderheid in Batterij-modus: 279 cd/m²
Contrast: 872:1 (Zwart: 0.32 cd/m²)
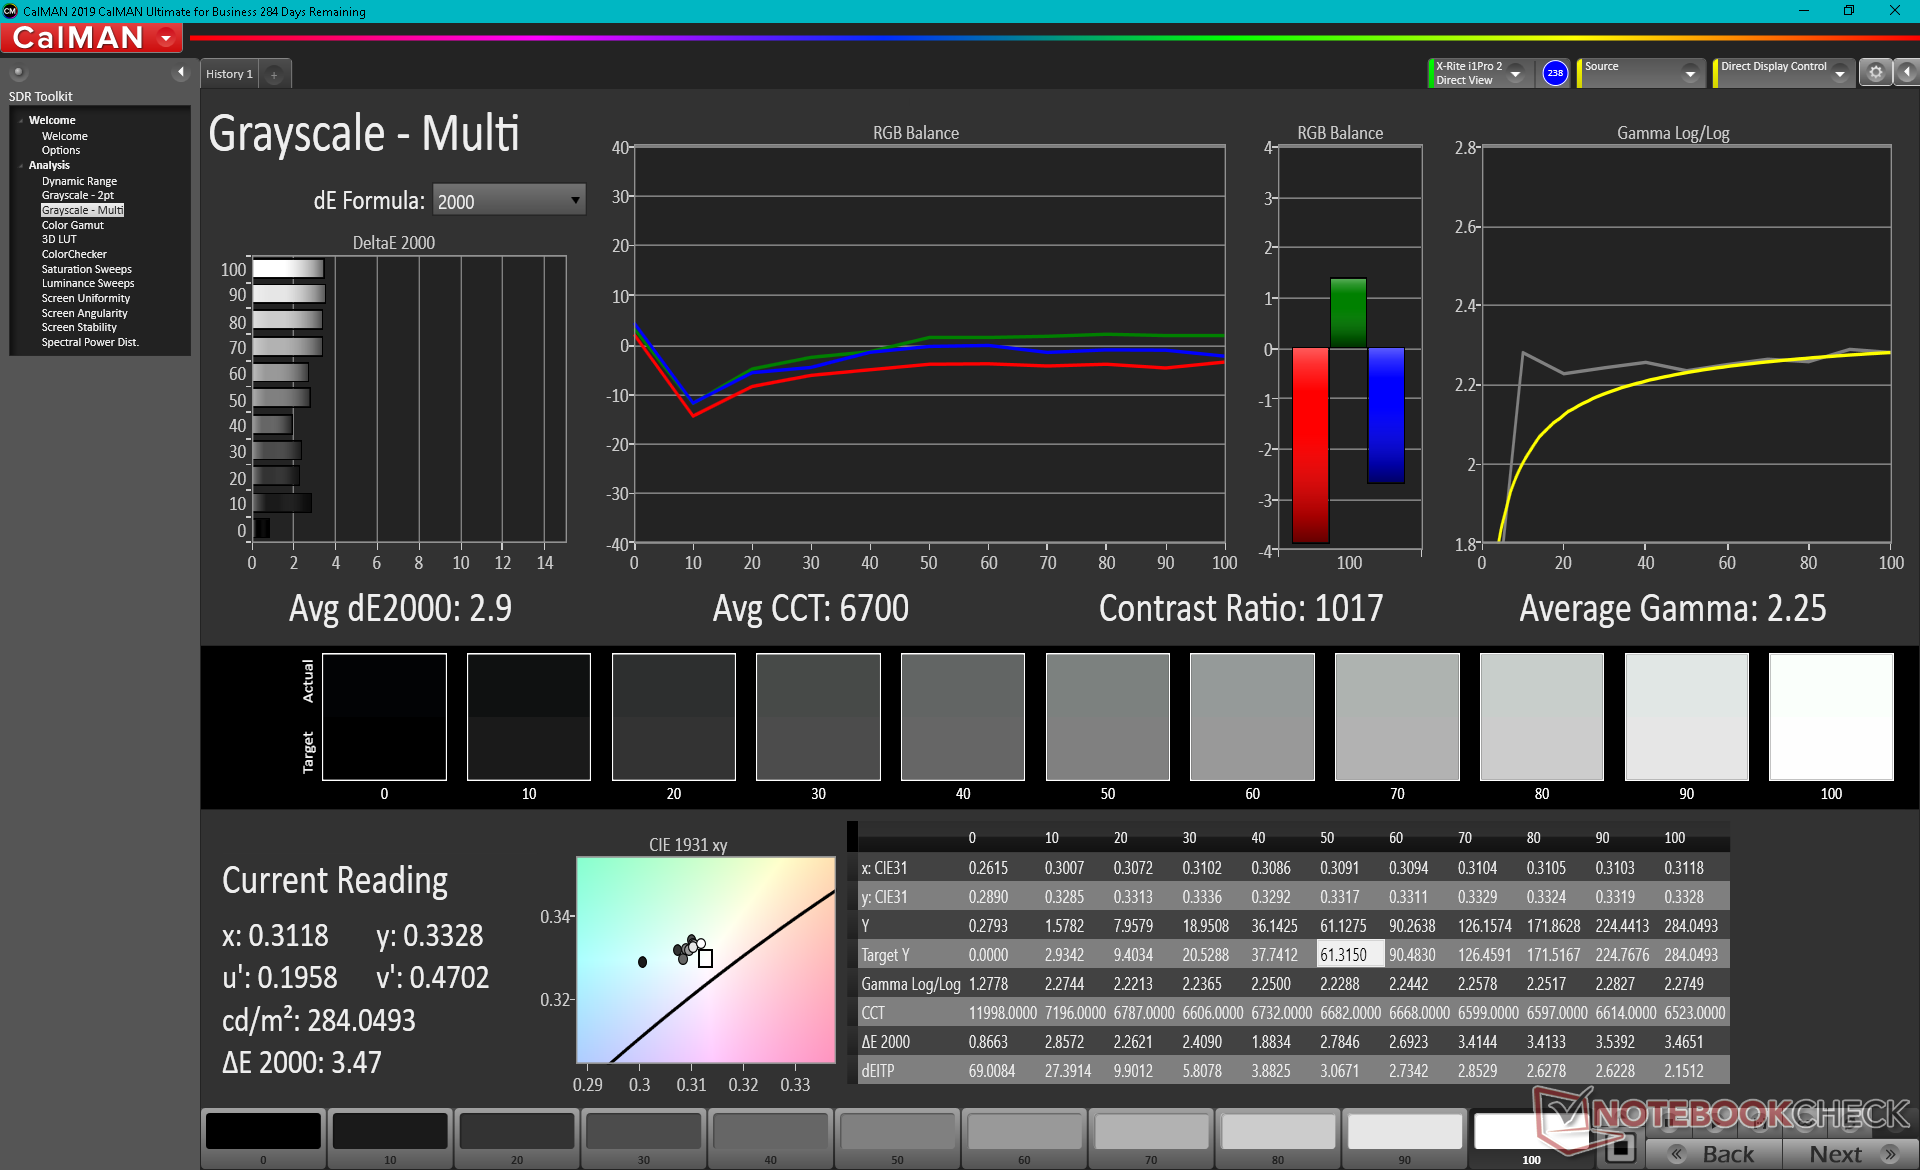
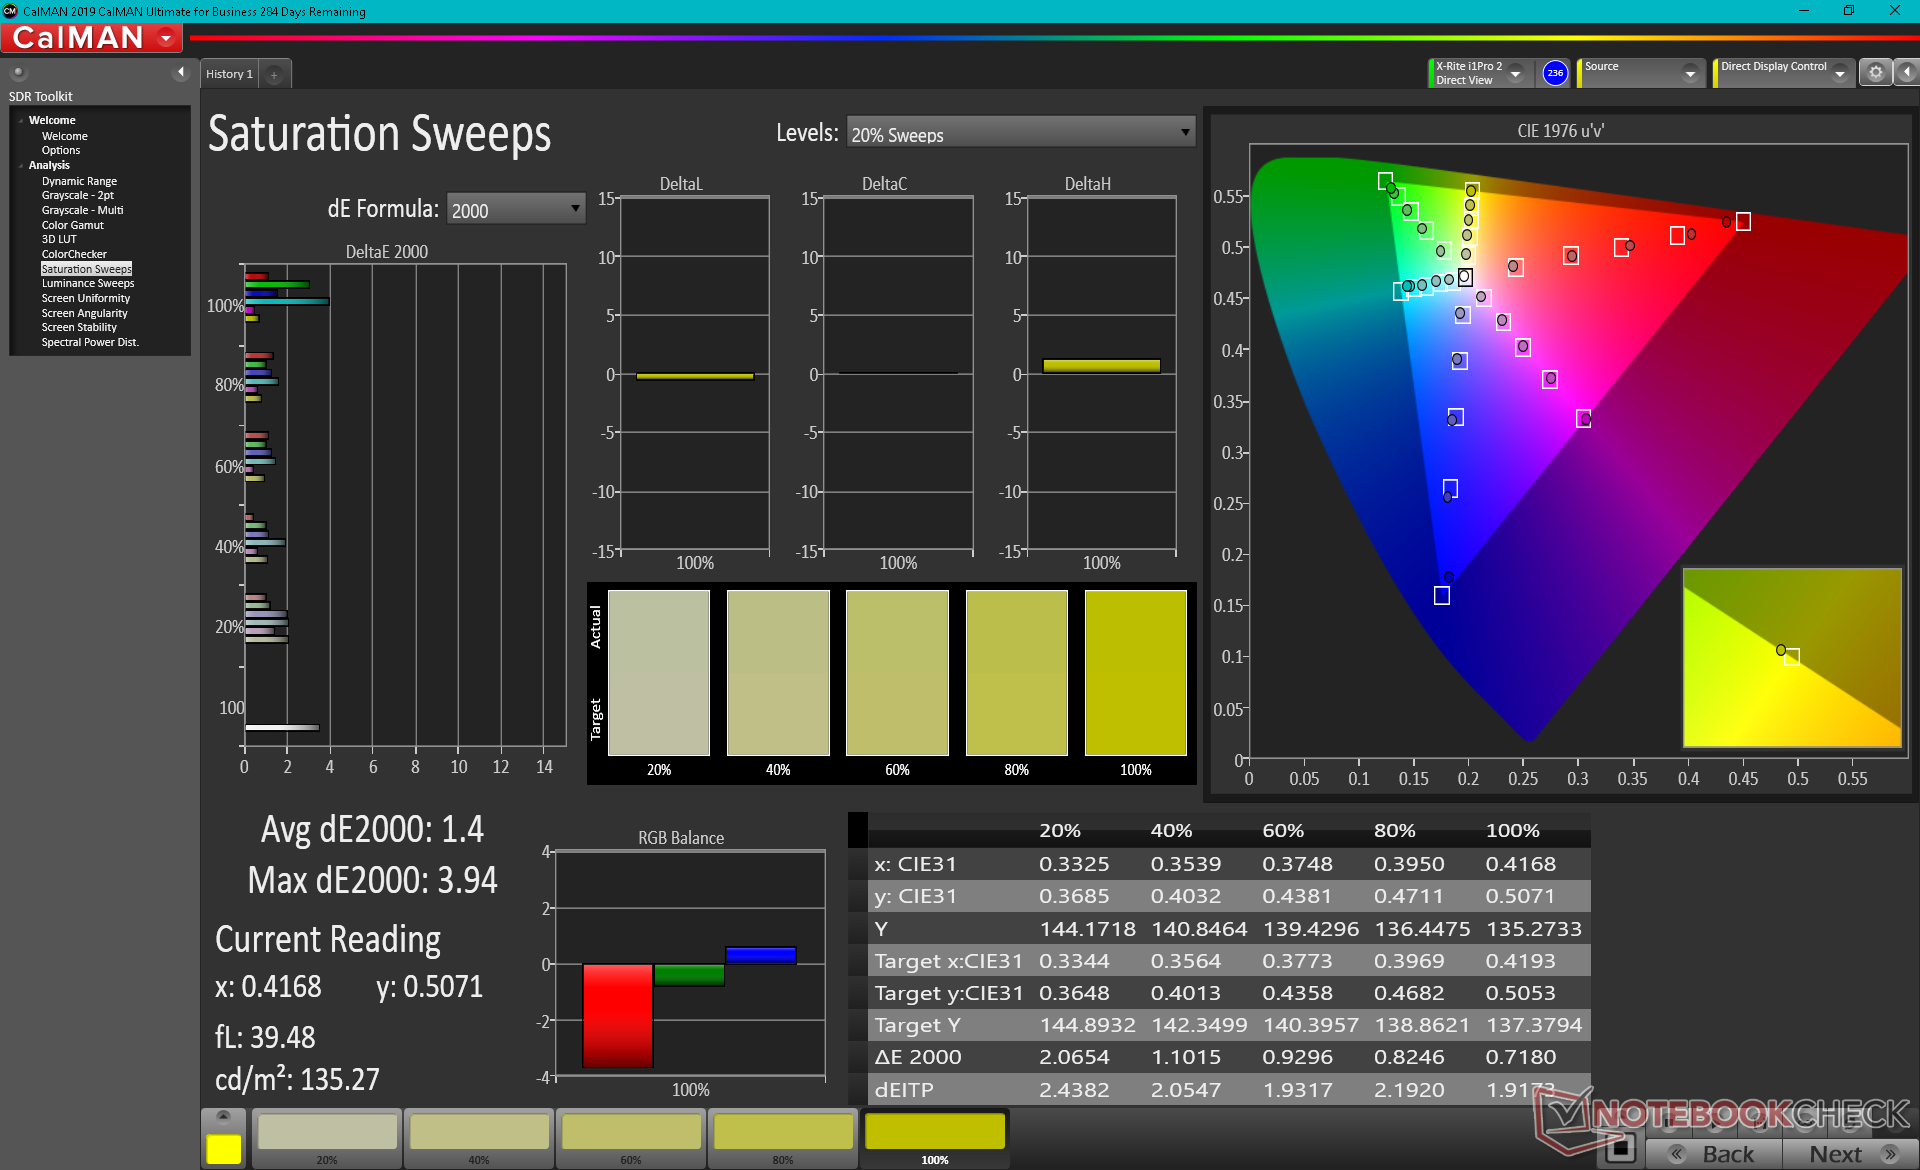
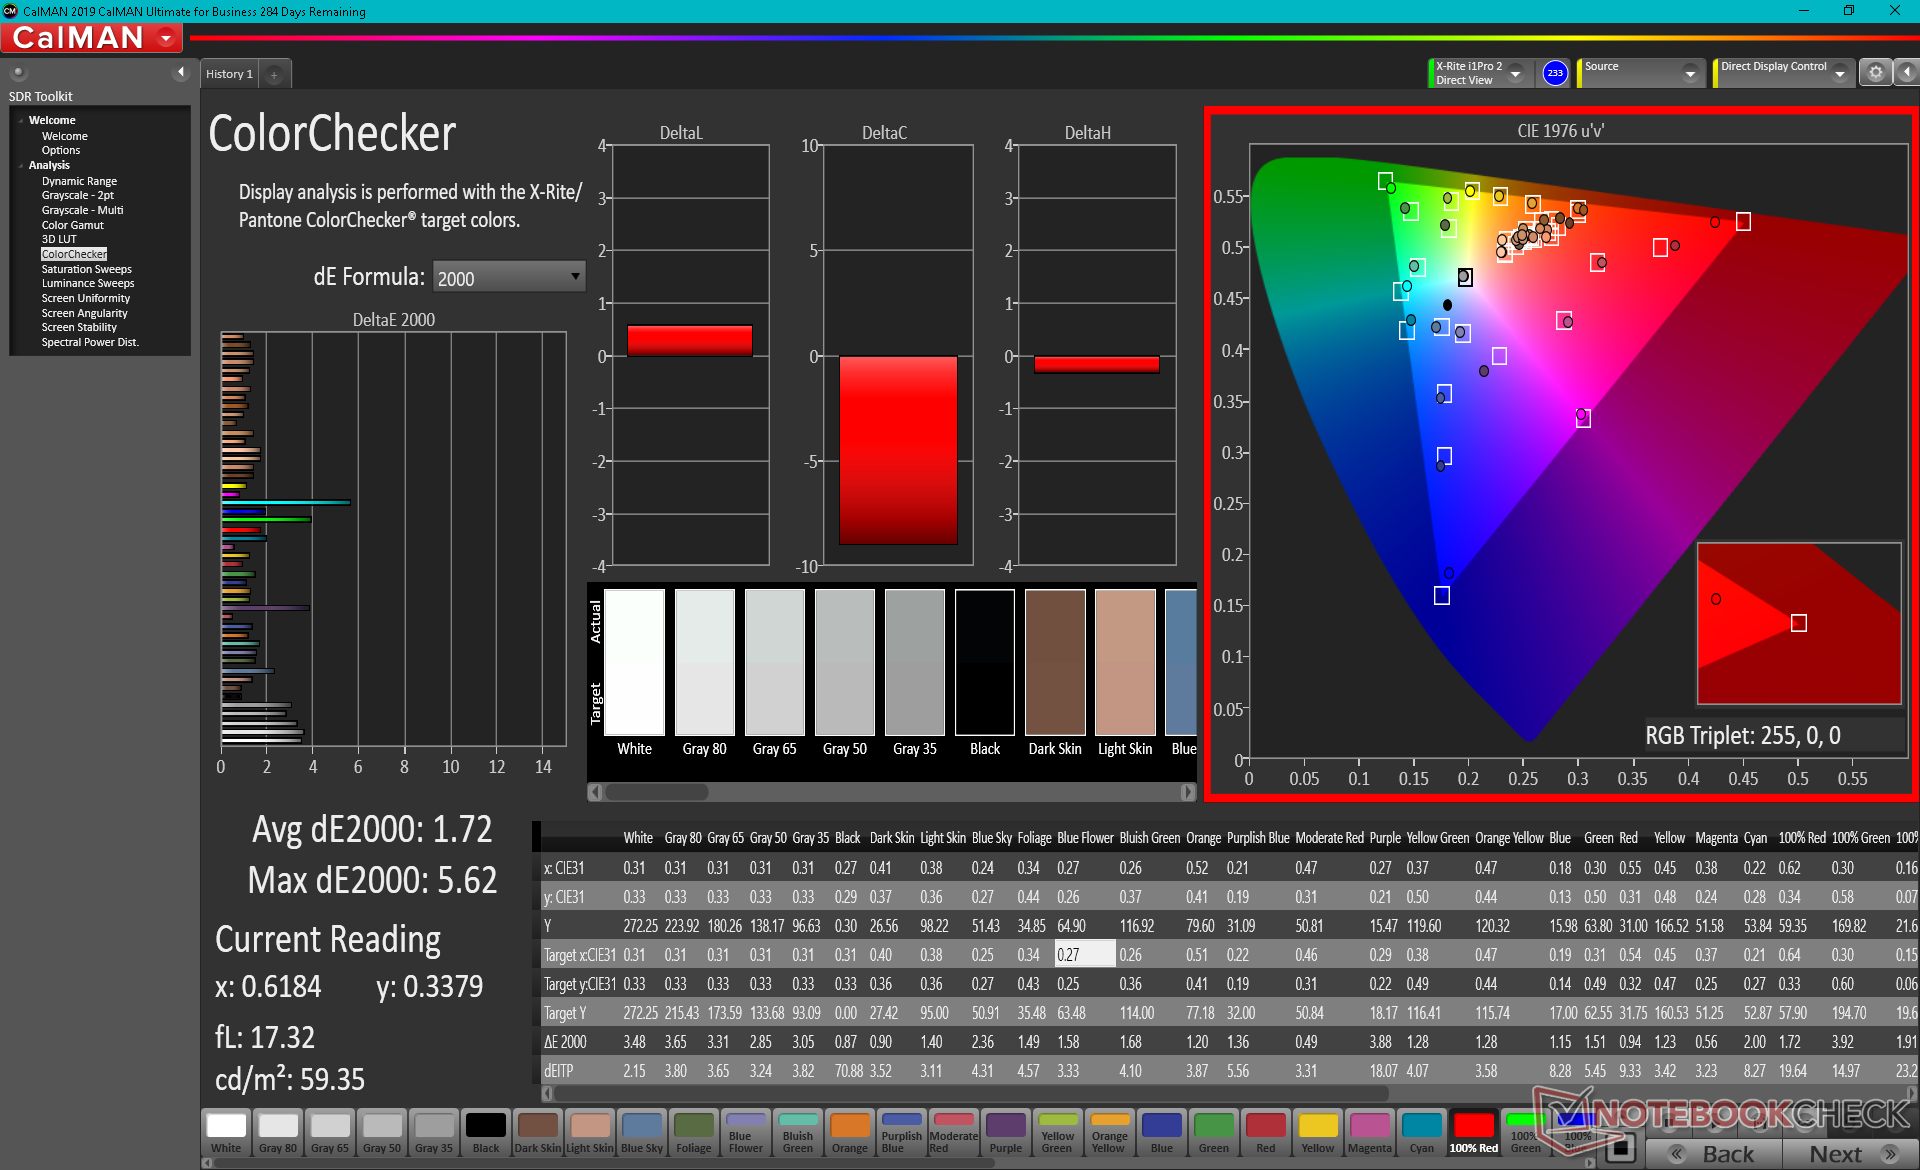
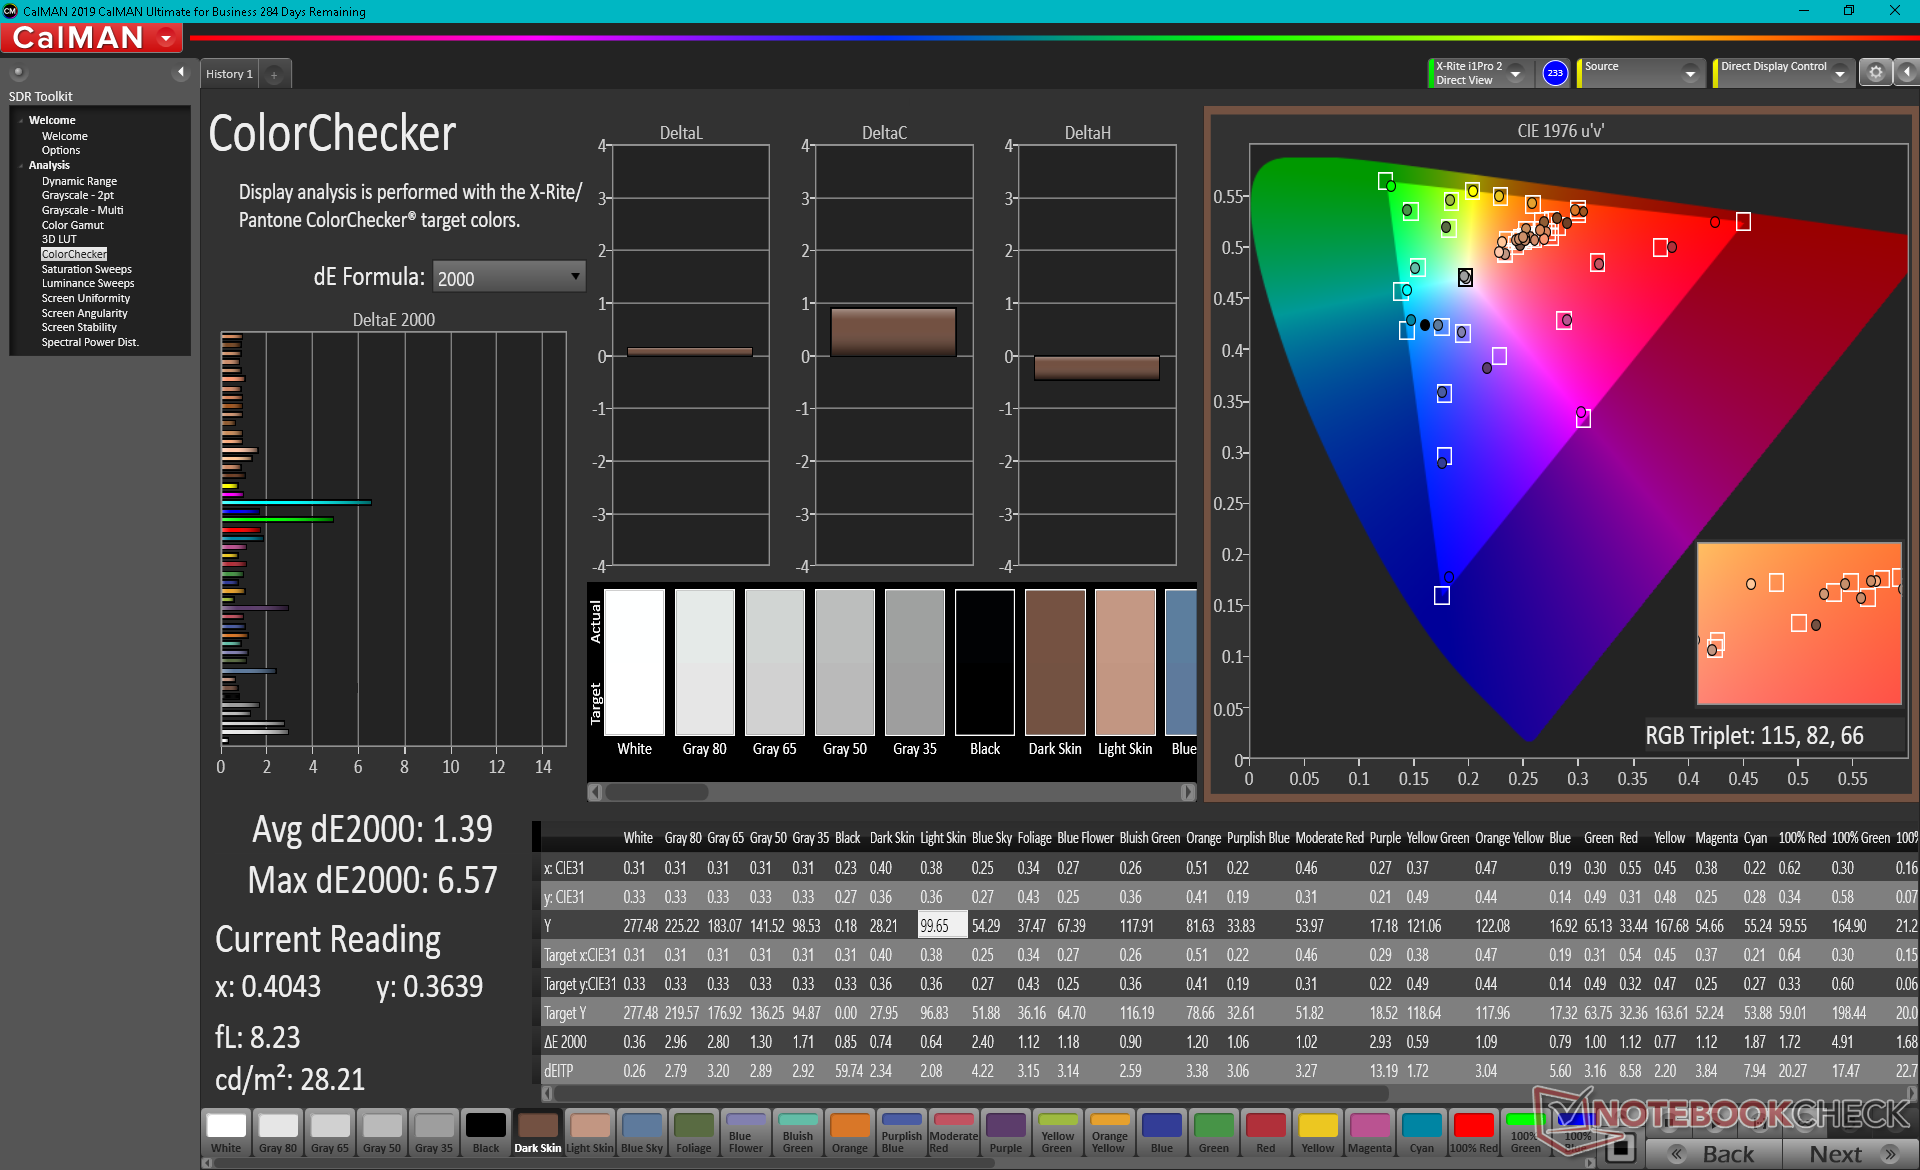
ΔE ColorChecker Calman: 1.72 | ∀{0.5-29.43 Ø4.72}
calibrated: 1.39
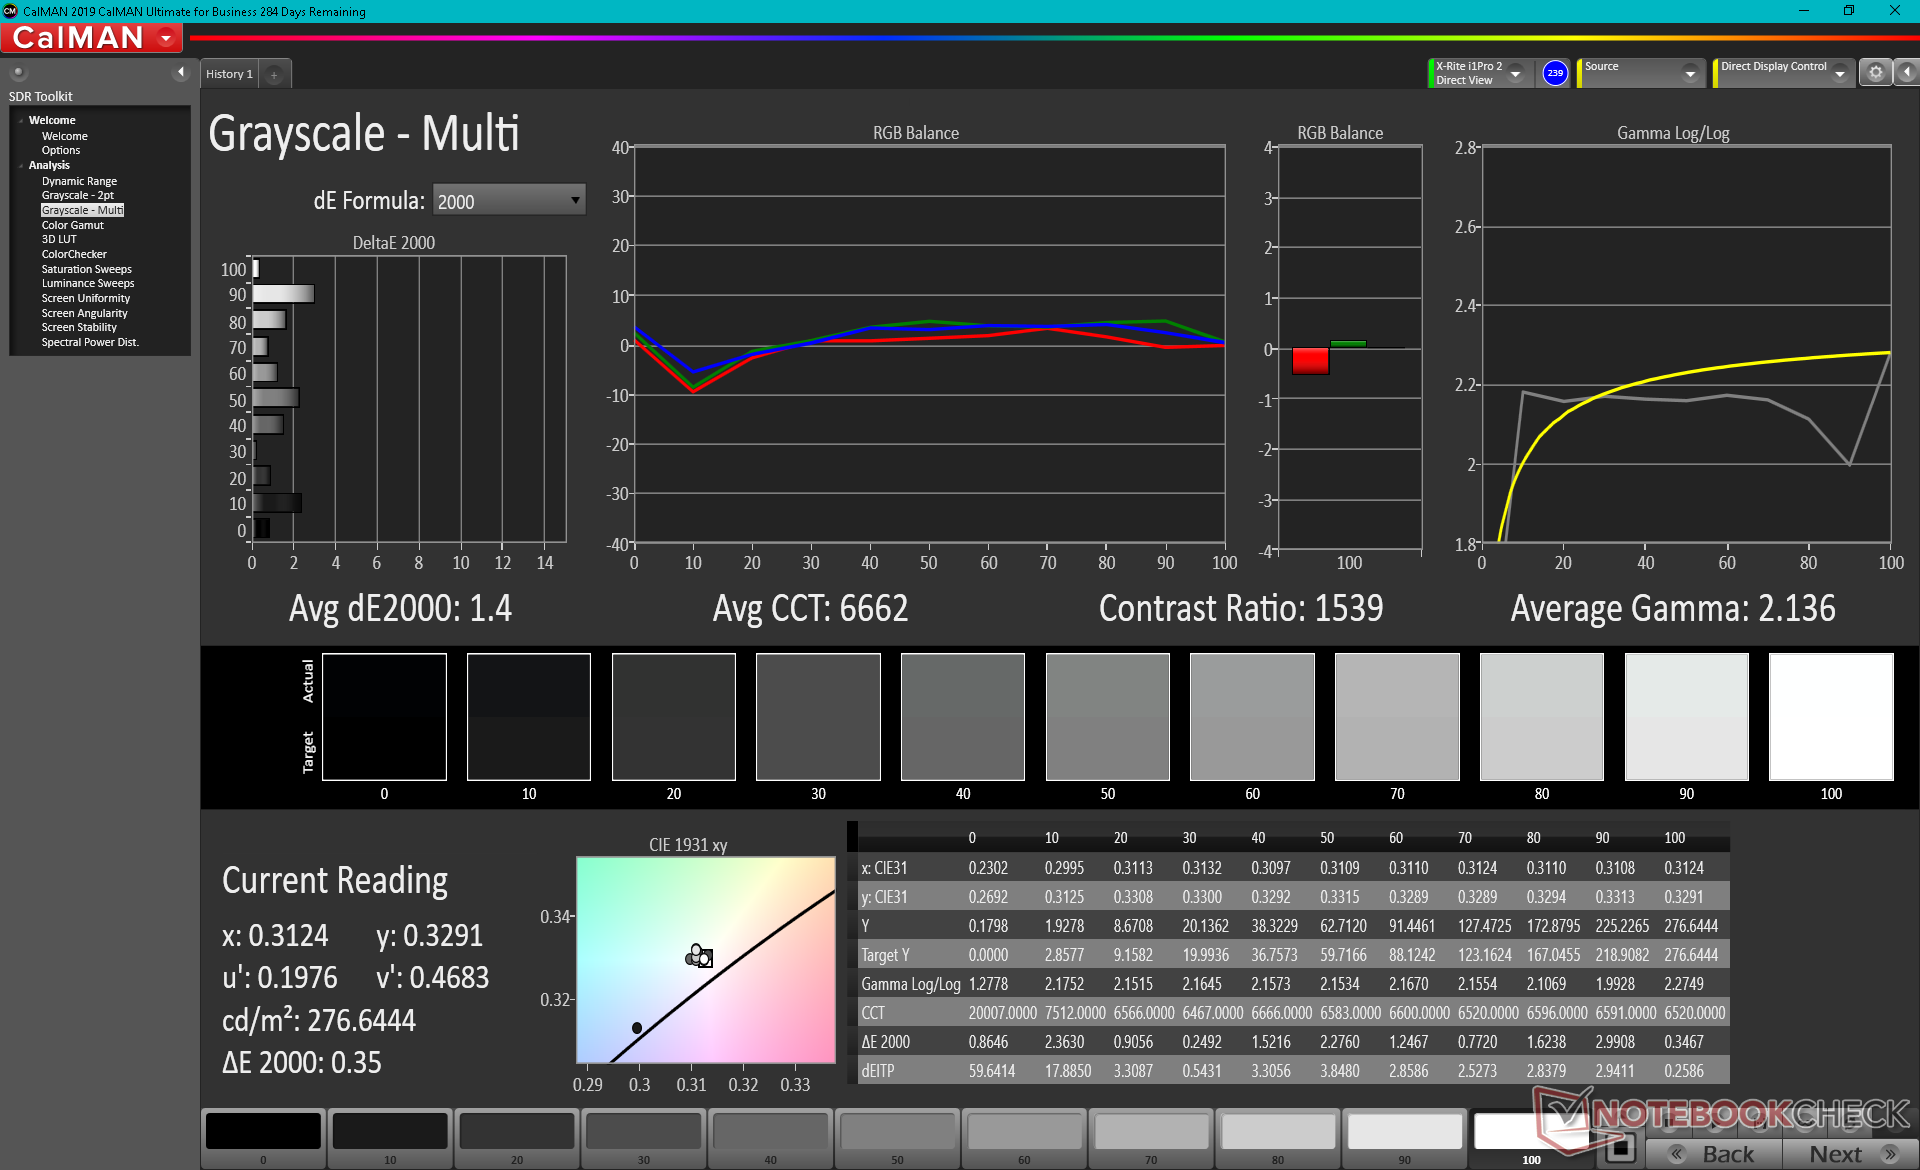
ΔE Greyscale Calman: 2.9 | ∀{0.09-98 Ø4.97}
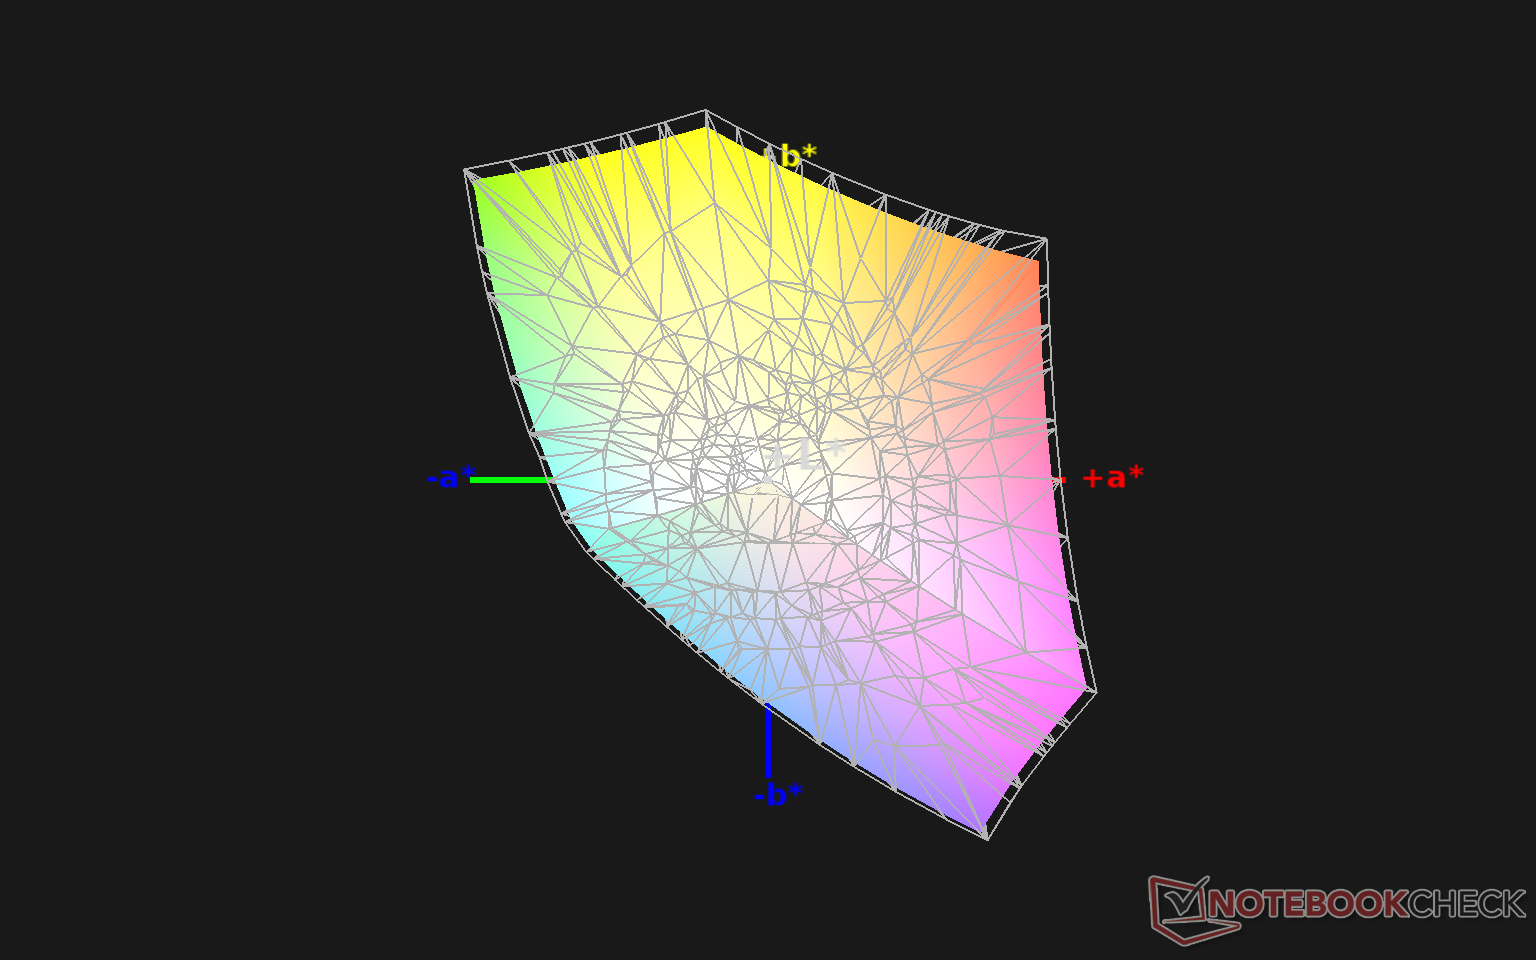
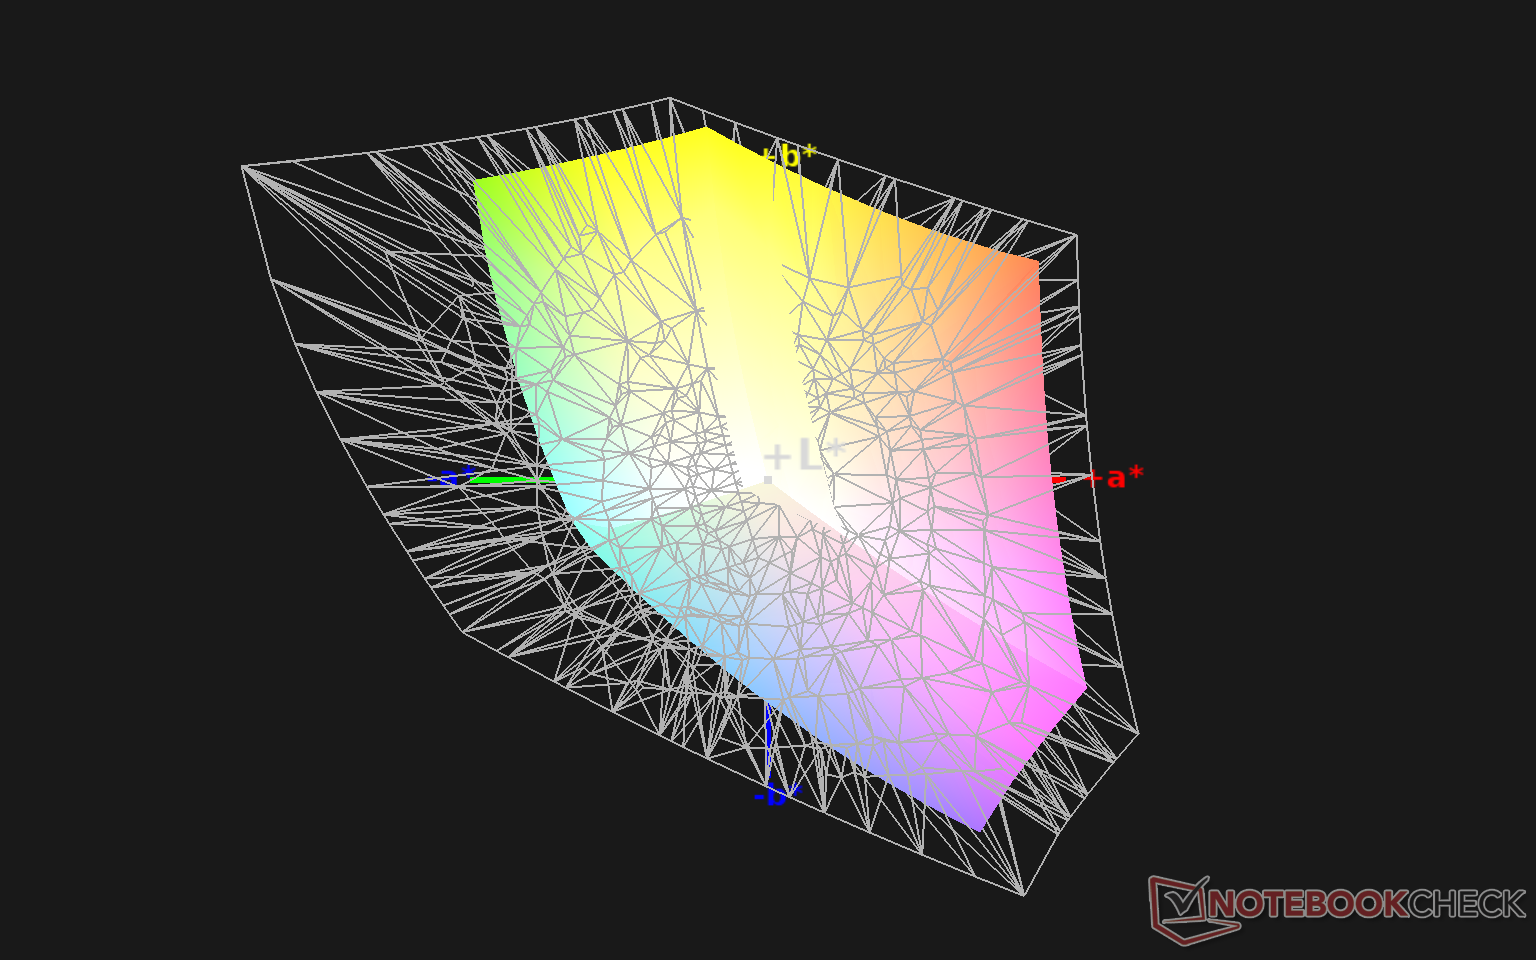
93.2% sRGB (Argyll 1.6.3 3D)
59% AdobeRGB 1998 (Argyll 1.6.3 3D)
64.1% AdobeRGB 1998 (Argyll 3D)
93.4% sRGB (Argyll 3D)
62% Display P3 (Argyll 3D)
Gamma: 2.3
CCT: 6700 K
| MSI Stealth 15M A11SEK Chi Mei N156HCE-EN1, IPS, 15.6", 1920x1080 | Dell XPS 15 9500 Core i7 4K UHD Sharp LQ156R1, IPS, 15.6", 3840x2400 | Lenovo ThinkPad T15p-20TN0006GE MNF601EA1-1, IPS LED, 15.6", 3840x2160 | Asus ZenBook UX535-M01440 BOE0866, IPS, 15.6", 3840x2160 | MSI Prestige 15 A10SC Sharp LQ156D1JW42, IPS, 15.6", 3840x2160 | HP Envy 15-ep0098nr Samsung SDC4145, AMOLED, 15.6", 3840x2160 | |
|---|---|---|---|---|---|---|
| Display | 36% | 33% | 9% | 29% | 35% | |
| Display P3 Coverage (%) | 62 | 89.7 45% | 86.8 40% | 68.8 11% | 82 32% | 88.5 43% |
| sRGB Coverage (%) | 93.4 | 100 7% | 99.3 6% | 99.5 7% | 98.3 5% | 100 7% |
| AdobeRGB 1998 Coverage (%) | 64.1 | 99.8 56% | 98.5 54% | 70.1 9% | 96.2 50% | 99.9 56% |
| Response Times | -4% | 27% | 31% | -22% | 95% | |
| Response Time Grey 50% / Grey 80% * (ms) | 47.6 ? | 54 ? -13% | 41.6 ? 13% | 34 ? 29% | 60 ? -26% | 0.8 ? 98% |
| Response Time Black / White * (ms) | 35.2 ? | 33.2 ? 6% | 21.2 ? 40% | 24 ? 32% | 41.2 ? -17% | 2.7 ? 92% |
| PWM Frequency (Hz) | 25000 ? | 26040 ? | 242.7 ? | |||
| Screen | -6% | 54% | 12% | -5% | -36% | |
| Brightness middle (cd/m²) | 279 | 557.9 100% | 595 113% | 402 44% | 464.5 66% | 374.3 34% |
| Brightness (cd/m²) | 252 | 541 115% | 594 136% | 375 49% | 451 79% | 379 50% |
| Brightness Distribution (%) | 82 | 91 11% | 94 15% | 84 2% | 92 12% | 91 11% |
| Black Level * (cd/m²) | 0.32 | 0.39 -22% | 0.32 -0% | 0.35 -9% | 0.5 -56% | |
| Contrast (:1) | 872 | 1431 64% | 1859 113% | 1149 32% | 929 7% | |
| Colorchecker dE 2000 * | 1.72 | 4.54 -164% | 1.2 30% | 2.47 -44% | 3.36 -95% | 5.47 -218% |
| Colorchecker dE 2000 max. * | 5.62 | 7.92 -41% | 2.5 56% | 4.32 23% | 7.06 -26% | 8.22 -46% |
| Colorchecker dE 2000 calibrated * | 1.39 | 3.82 -175% | 1 28% | 2.36 -70% | 3.42 -146% | 4.61 -232% |
| Greyscale dE 2000 * | 2.9 | 3.2 -10% | 1.4 52% | 2.26 22% | 1.3 55% | 2.3 21% |
| Gamma | 2.3 96% | 1.99 111% | 2.1 105% | 2.49 88% | 2.14 103% | 2.09 105% |
| CCT | 6700 97% | 6451 101% | 6492 100% | 6285 103% | 6596 99% | 6340 103% |
| Color Space (Percent of AdobeRGB 1998) (%) | 59 | 89.5 52% | 85.3 45% | 99 68% | 84.8 44% | 87.8 49% |
| Color Space (Percent of sRGB) (%) | 93.2 | 100 7% | 99.2 6% | 98.3 5% | 100 7% | |
| Totaal Gemiddelde (Programma / Instellingen) | 9% /
2% | 38% /
47% | 17% /
14% | 1% /
-1% | 31% /
-2% |
* ... kleiner is beter
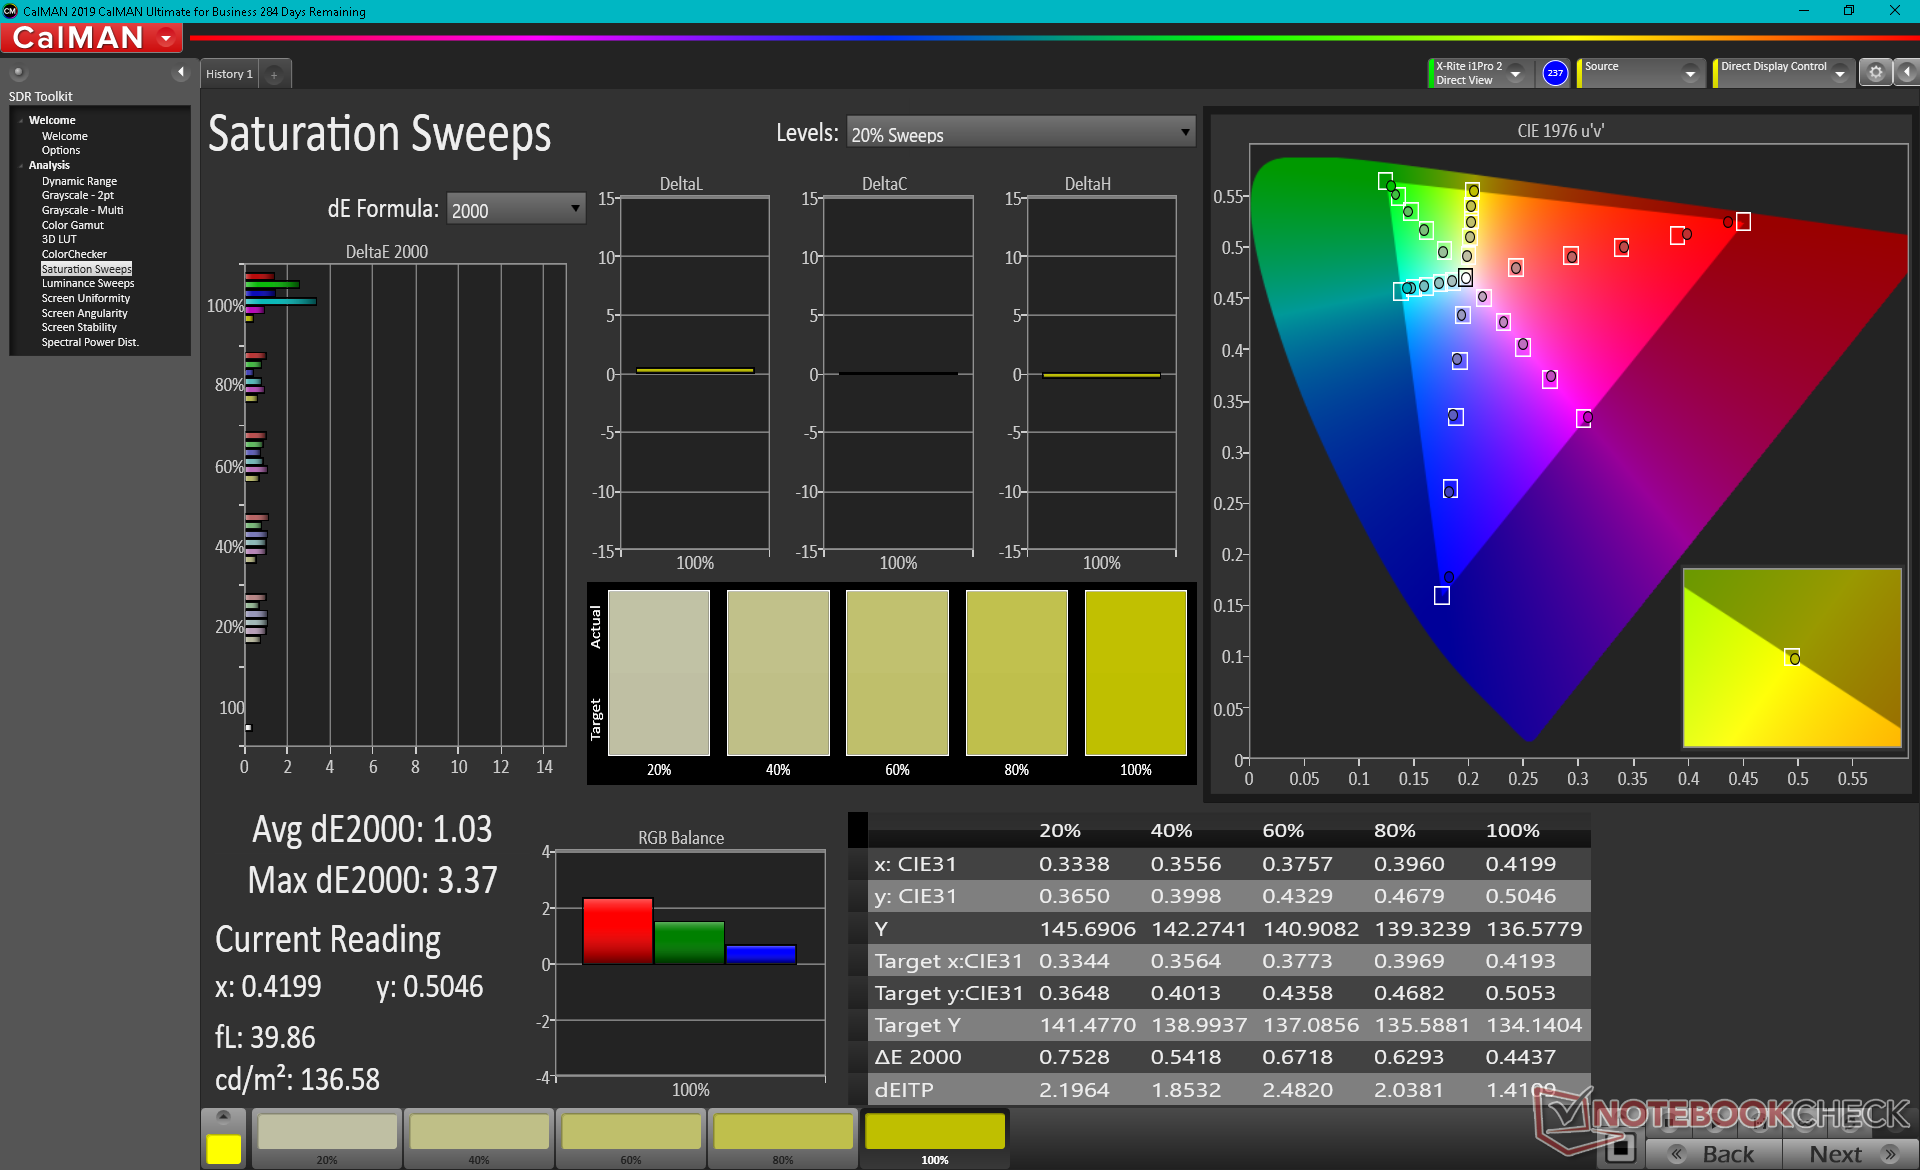
Het paneel dekt bijna alle sRGB en ongeveer 60 procent van AdobeRGB, wat standaard is op de meeste vlaggenschip Ultrabooks met 1080p beeldschermen. Andere laptops met 4K-schermopties, zoals MSI's eigen Prestige 15, bieden meestal diepere kleuren door zich in plaats daarvan op AdobeRGB te richten.
Het systeem is uit de doos goed gekalibreerd met gemiddelde grijswaarden en ColorChecker deltaE waarden van respectievelijk slechts 2,9 en 1,72. Door het beeldscherm nog verder te kalibreren met onze X-Rite colorimeter zouden de gemiddelden slechts marginaal verbeteren. Interessant is dat groenblauw en groene kleuren zelfs na kalibratie veel onnauwkeuriger worden weergegeven dan alle andere kleuren.
Responstijd Scherm
| ↔ Responstijd Zwart naar Wit | ||
|---|---|---|
| 35.2 ms ... stijging ↗ en daling ↘ gecombineerd | ↗ 22 ms stijging | 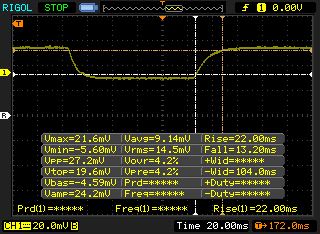 |
| ↘ 13.2 ms daling | ||
| Het scherm vertoonde trage responstijden in onze tests en is misschien te traag voor games. Ter vergelijking: alle testtoestellen variëren van 0.1 (minimum) tot 240 (maximum) ms. » 93 % van alle toestellen zijn beter. Dit betekent dat de gemeten responstijd slechter is dan het gemiddelde (19.9 ms) van alle geteste toestellen. | ||
| ↔ Responstijd 50% Grijs naar 80% Grijs | ||
| 47.6 ms ... stijging ↗ en daling ↘ gecombineerd | ↗ 25.2 ms stijging | 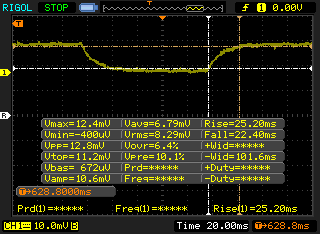 |
| ↘ 22.4 ms daling | ||
| Het scherm vertoonde trage responstijden in onze tests en is misschien te traag voor games. Ter vergelijking: alle testtoestellen variëren van 0.165 (minimum) tot 636 (maximum) ms. » 82 % van alle toestellen zijn beter. Dit betekent dat de gemeten responstijd slechter is dan het gemiddelde (31.1 ms) van alle geteste toestellen. | ||
Screen Flickering / PWM (Pulse-Width Modulation)
| Screen flickering / PWM waargenomen | 25000 Hz | ≤ 25 % helderheid instelling | 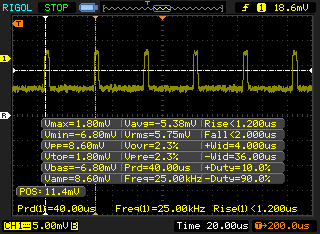 |
De achtergrondverlichting van het scherm flikkert op 25000 Hz (in het slechtste geval, bijvoorbeeld bij gebruik van PWM) aan een helderheid van 25 % en lager. Boven deze helderheid zou er geen flickering / PWM mogen optreden. De frequentie van 25000 Hz is redelijk hoog en de meeste mensen die gevoelig zijn aan flickering zouden dit dus niet mogen waarnemen of geïrriteerde ogen krijgen. Ter vergelijking: 52 % van alle geteste toestellen maakten geen gebruik van PWM om de schermhelderheid te verlagen. Als het wel werd gebruikt, werd een gemiddelde van 7784 (minimum: 5 - maximum: 343500) Hz waargenomen. | |||
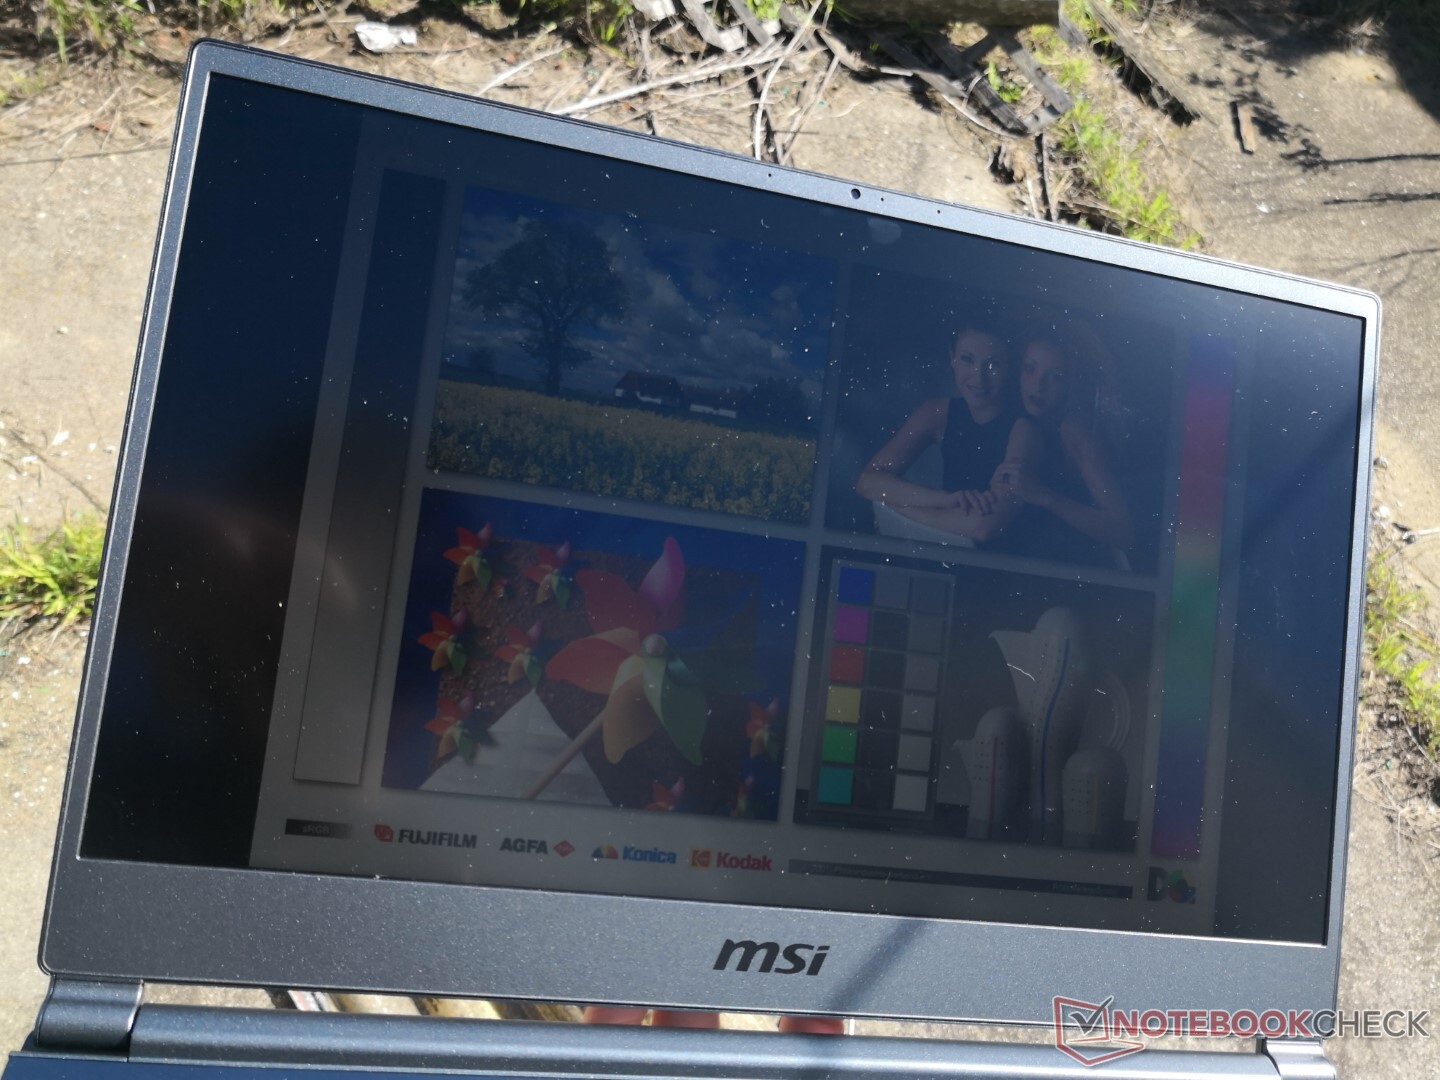
De zichtbaarheid buitenshuis is slechts gemiddeld door het relatief lage maximale helderheidsniveau. Dit is jammer, want het lichtgewicht chassisontwerp zou eigenaars juist kunnen aanmoedigen om de Stealth 15M vaker buitenshuis te gebruiken.
Prestaties
Het MSI-systeem is uniek omdat gebruikers de optie hebben om de GeForce RTX 2060 Max-Q GPU te koppelen aan een Core U-serie CPU in plaats van de meer gebruikelijke Core H-serie. De nieuwste configuraties worden geleverd met nog snellere processoren, waaronder de 11e gen Core i7-11375H en Nvidia Ampere GeForce RTX 3060 ter vervanging van de oudere 10e gen CPU's en Turing GPU's.
Ons toestel werd ingesteld op Extreme Performance mode via MSI Dragon Center alvorens enige prestatie benchmarks uit te voeren.
Processor
Van het tiental laptops dat we tot nu toe hebben getest met dezelfde Core i7-1185G7 CPU, is onze Stealth 15M een van de snelste met CineBench xT scores die 12 tot 16 procent hoger liggen dan het gemiddelde. De uitstekende prestaties kunnen worden toegeschreven aan de goede Turbo Boost duurzaamheid van de CPU, zoals blijkt uit onze grafiek hieronder. De Summit E15, uitgerust met dezelfde CPU, zou bijvoorbeeld ongeveer 15 procent langzamer draaien dan onze Stealth 15M, rekening houdend met eventuele prestatiebeperking op beide systemen. Single-thread prestaties zijn zelfs nog indrukwekkender met CineBench scores die zelfs de Corei7-10875H overtreffen.
De algehele multi-thread prestaties zijn nog steeds zo'n 23 tot 27 procent langzamer dan de meer energie verbruikende octa-core Core i7-10875H of hexa-core Core i7-10750H zoals te vinden op de meeste high-performance laptops.
Cinebench R15: CPU Multi 64Bit | CPU Single 64Bit
Blender: v2.79 BMW27 CPU
7-Zip 18.03: 7z b 4 -mmt1 | 7z b 4
Geekbench 5.5: Single-Core | Multi-Core
HWBOT x265 Benchmark v2.2: 4k Preset
LibreOffice : 20 Documents To PDF
R Benchmark 2.5: Overall mean
Cinebench R15: CPU Multi 64Bit | CPU Single 64Bit
Blender: v2.79 BMW27 CPU
7-Zip 18.03: 7z b 4 -mmt1 | 7z b 4
Geekbench 5.5: Single-Core | Multi-Core
HWBOT x265 Benchmark v2.2: 4k Preset
LibreOffice : 20 Documents To PDF
R Benchmark 2.5: Overall mean
* ... kleiner is beter
Systeemprestaties
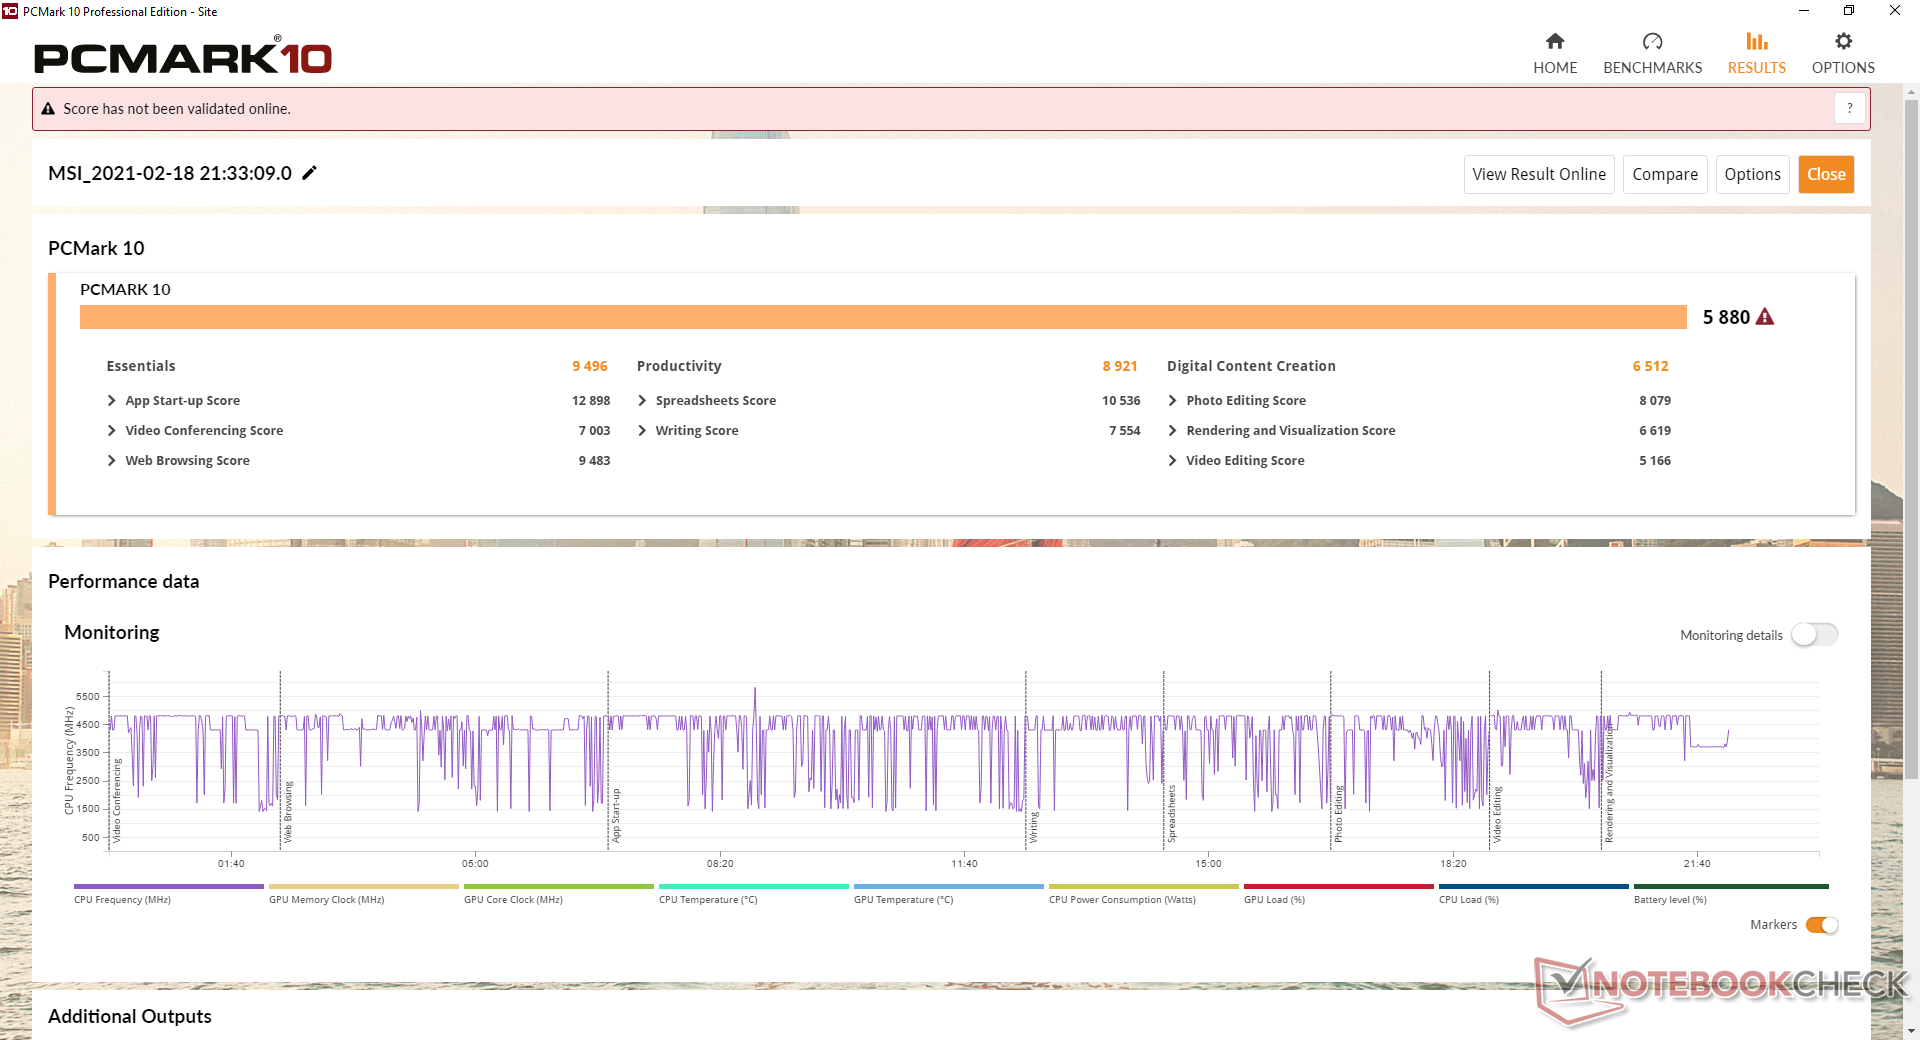
PCMark benchmarks zijn hoger dan de meeste andere Core H-serie multimedia laptops, dankzij de snellere GeForce RTX GPU en de hoge prestaties-per-watt van de CPU.
We hebben geen softwareproblemen ondervonden tijdens onze tijd met de testeenheid. Eigenaars zouden vertrouwd moeten raken met de MSI Dragon Center software, aangezien het een controlecentrum is voor de meeste instellingen van het systeem
| PCMark 10 Score | 5880 punten | |
Help | ||
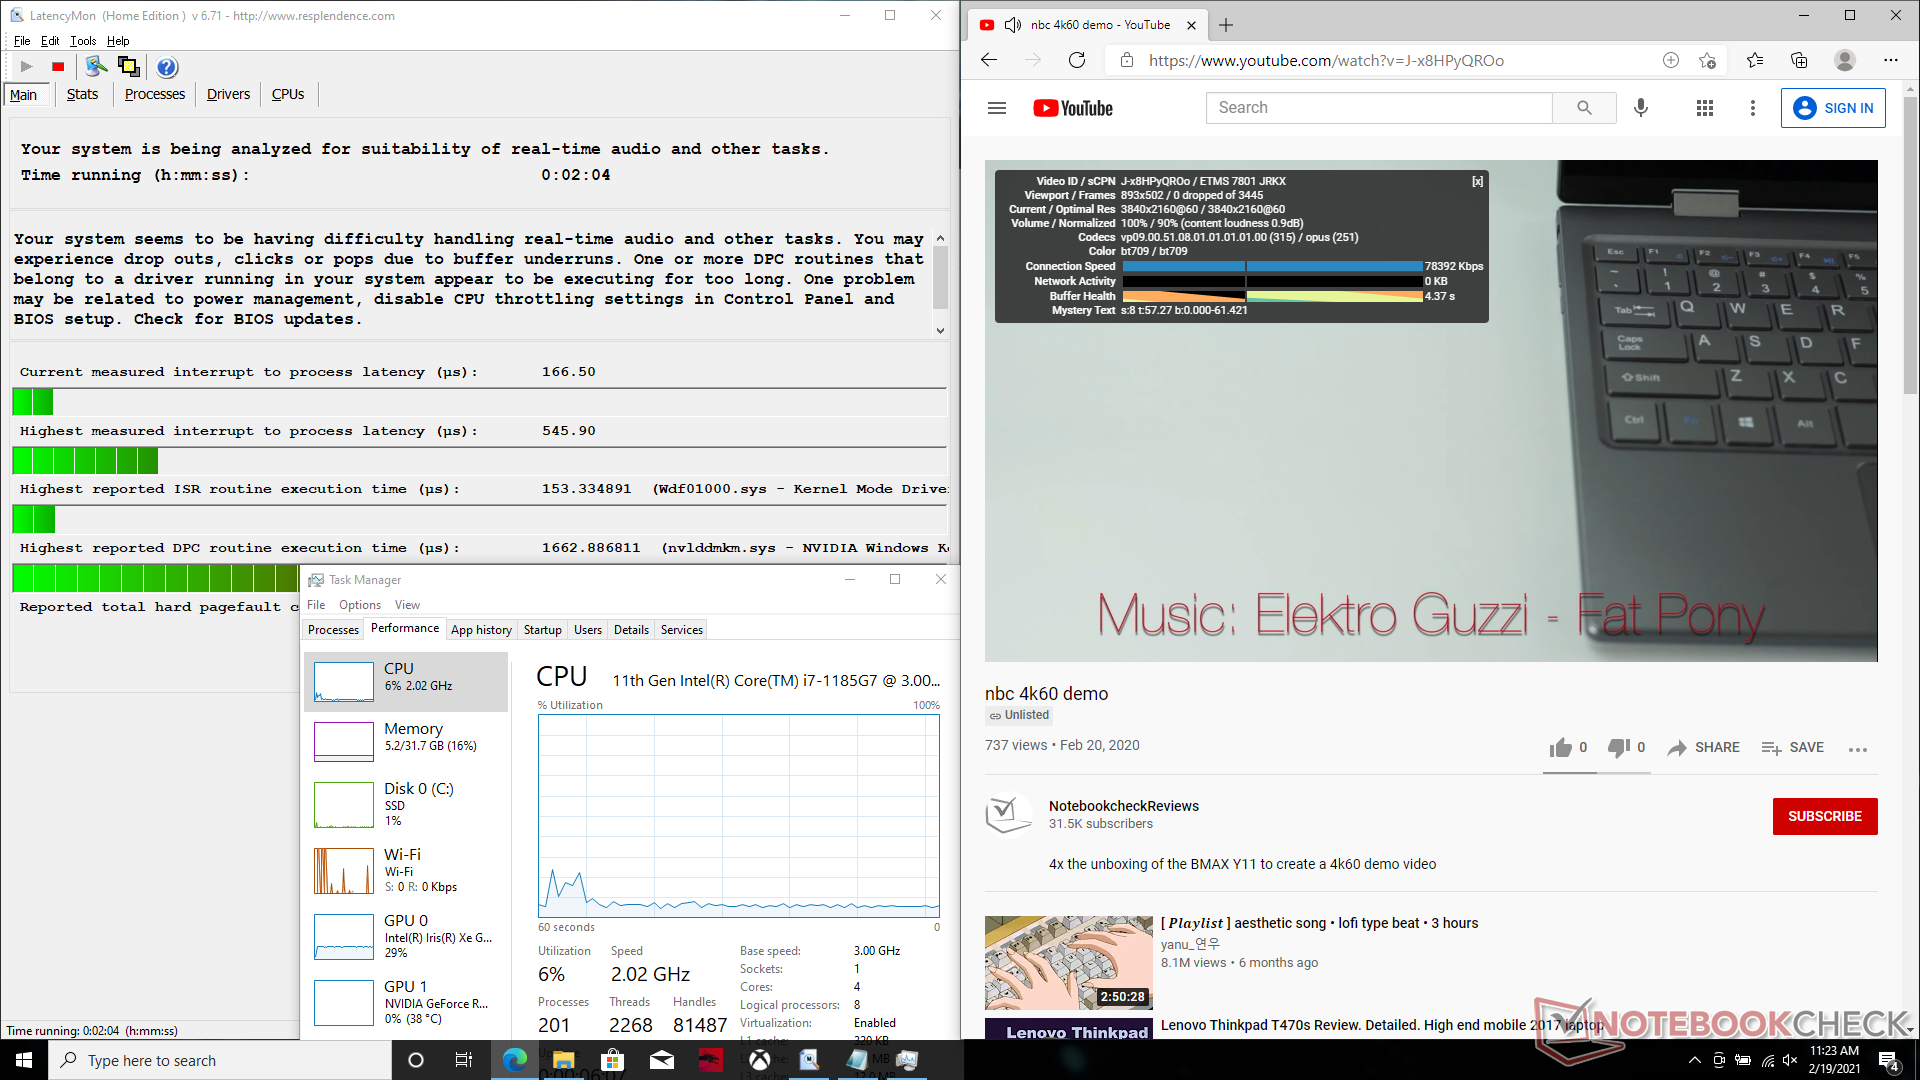
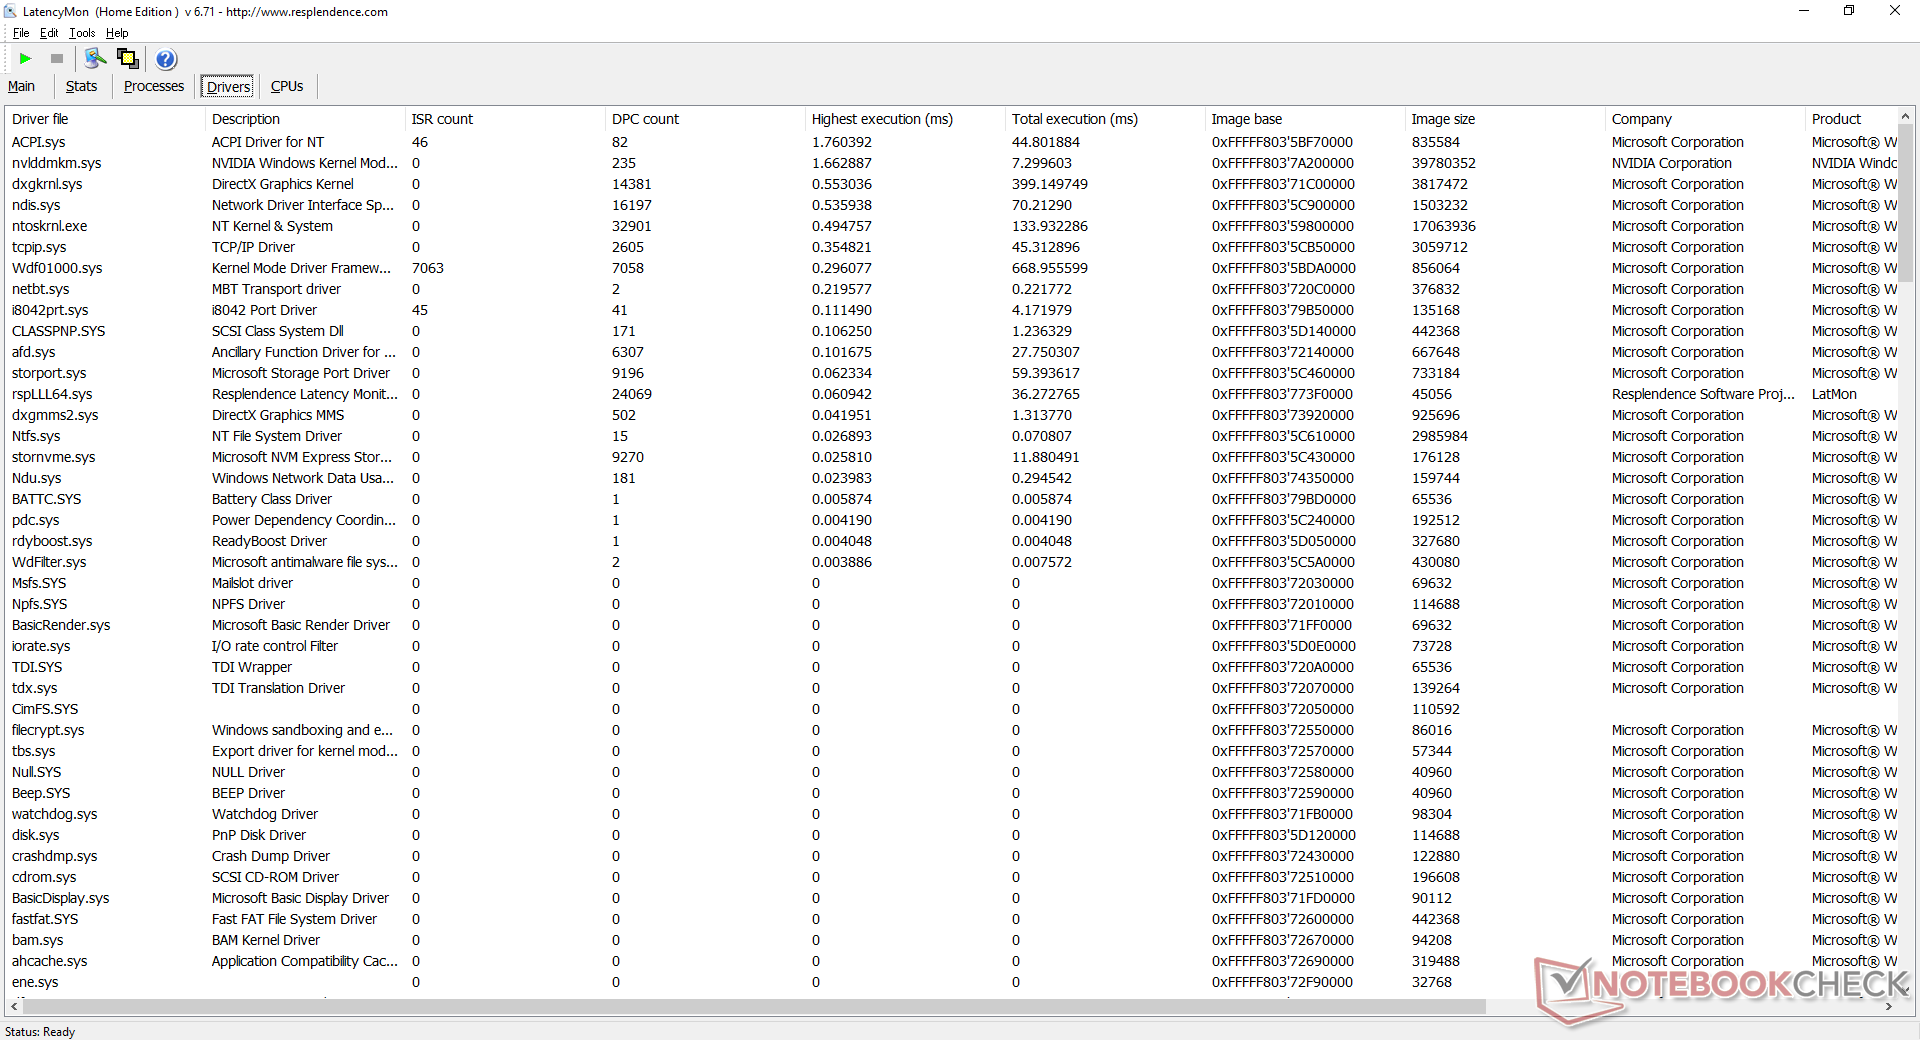
DPC latentie
LatencyMon onthult DPC latency problemen gerelateerd aan nvlddmkm.sys bij het openen van meerdere browser tabbladen op onze homepage. Het afspelen van 4K-video's met 60 FPS verloopt verder vloeiend en zonder wegvallende frames.
| DPC Latencies / LatencyMon - interrupt to process latency (max), Web, Youtube, Prime95 | |
| Dell XPS 15 9500 Core i7 4K UHD | |
| Lenovo ThinkPad T15p-20TN0006GE | |
| Asus ZenBook UX535-M01440 | |
| MSI Stealth 15M A11SEK | |
* ... kleiner is beter
Opslagapparaten
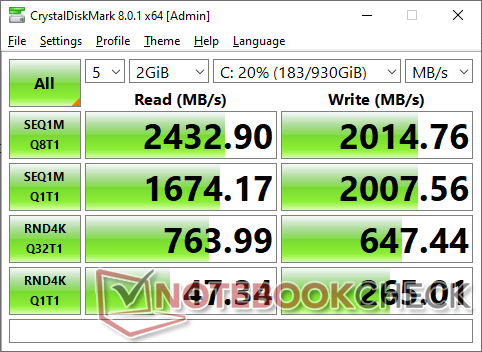
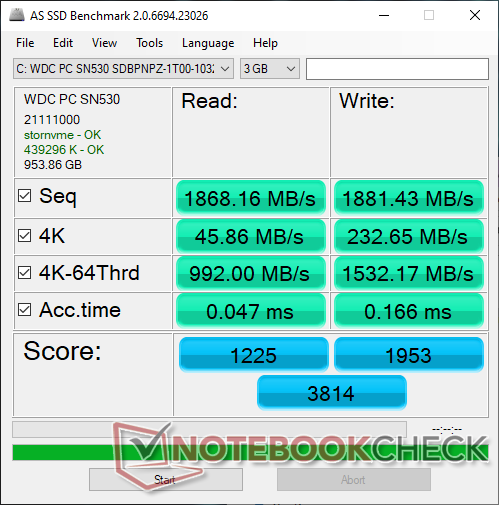
Interne opslagopties zijn beperkt tot slechts een enkel M.2 PCIe 3.0 x4 slot. Onze testeenheid wordt geleverd met een 1 TB WD SN530, wat een mid-range NVMe SSD is in tegenstelling tot de higher-end SN750-serie. Sequentiële lees- en schrijfsnelheden zijn nog steeds erg goed met respectievelijk ongeveer 2400 MB/s en 2000 MB/s, vergeleken met >3000 MB/s op duurdere schijven.
| MSI Stealth 15M A11SEK WDC PC SN530 SDBPNPZ-1T00 | HP Spectre X360 15-5ZV31AV Intel SSD 660p 2TB SSDPEKNW020T8 | Dell XPS 15 9500 Core i7 4K UHD SK Hynix PC611 512GB | Asus ZenBook UX535-M01440 WDC PC SN730 SDBPNTY-1T00 | MSI Prestige 15 A10SC Samsung SSD PM981 MZVLB1T0HALR | |
|---|---|---|---|---|---|
| AS SSD | -26% | -16% | -11% | 4% | |
| Seq Read (MB/s) | 1868 | 1220 -35% | 2072 11% | 1886 1% | 1274 -32% |
| Seq Write (MB/s) | 1881 | 1152 -39% | 1486 -21% | 1221 -35% | 1395 -26% |
| 4K Read (MB/s) | 45.86 | 52.3 14% | 47.41 3% | 41.16 -10% | 50.3 10% |
| 4K Write (MB/s) | 232.6 | 146.6 -37% | 117.6 -49% | 101.2 -56% | 119.8 -48% |
| 4K-64 Read (MB/s) | 992 | 652 -34% | 967 -3% | 1022 3% | 1599 61% |
| 4K-64 Write (MB/s) | 1532 | 847 -45% | 715 -53% | 1618 6% | 1455 -5% |
| Access Time Read * (ms) | 0.047 | 0.077 -64% | 0.057 -21% | 0.058 -23% | 0.044 6% |
| Access Time Write * (ms) | 0.166 | 0.106 36% | 0.096 42% | 0.037 78% | 0.092 45% |
| Score Read (Points) | 1225 | 826 -33% | 1222 0% | 1252 2% | 1777 45% |
| Score Write (Points) | 1953 | 1109 -43% | 981 -50% | 1841 -6% | 1714 -12% |
| Score Total (Points) | 3814 | 2371 -38% | 2809 -26% | 3706 -3% | 4411 16% |
| Copy ISO MB/s (MB/s) | 2320 | 2070 -11% | 1999 -14% | 1611 -31% | 2830 22% |
| Copy Program MB/s (MB/s) | 681 | 571 -16% | 627 -8% | 509 -25% | 609 -11% |
| Copy Game MB/s (MB/s) | 1588 | 1219 -23% | 1001 -37% | 677 -57% | 1424 -10% |
| CrystalDiskMark 5.2 / 6 | -20% | -9% | -10% | -30% | |
| Write 4K (MB/s) | 262.6 | 151.5 -42% | 123.3 -53% | 110 -58% | 150.8 -43% |
| Read 4K (MB/s) | 45.41 | 59.3 31% | 41.85 -8% | 43.44 -4% | 47.3 4% |
| Write Seq (MB/s) | 2001 | 1424 -29% | 2054 3% | 1957 -2% | 981 -51% |
| Read Seq (MB/s) | 1659 | 1609 -3% | 1617 -3% | 1615 -3% | 976 -41% |
| Write 4K Q32T1 (MB/s) | 648 | 393.6 -39% | 413 -36% | 341.6 -47% | 442.7 -32% |
| Read 4K Q32T1 (MB/s) | 767 | 369.4 -52% | 377.5 -51% | 364.3 -53% | 499.7 -35% |
| Write Seq Q32T1 (MB/s) | 2002 | 1946 -3% | 2705 35% | 3081 54% | 1706 -15% |
| Read Seq Q32T1 (MB/s) | 2415 | 1934 -20% | 3442 43% | 3251 35% | 1758 -27% |
| Totaal Gemiddelde (Programma / Instellingen) | -23% /
-24% | -13% /
-13% | -11% /
-11% | -13% /
-8% |
* ... kleiner is beter

Disk Throttling: DiskSpd Read Loop, Queue Depth 8
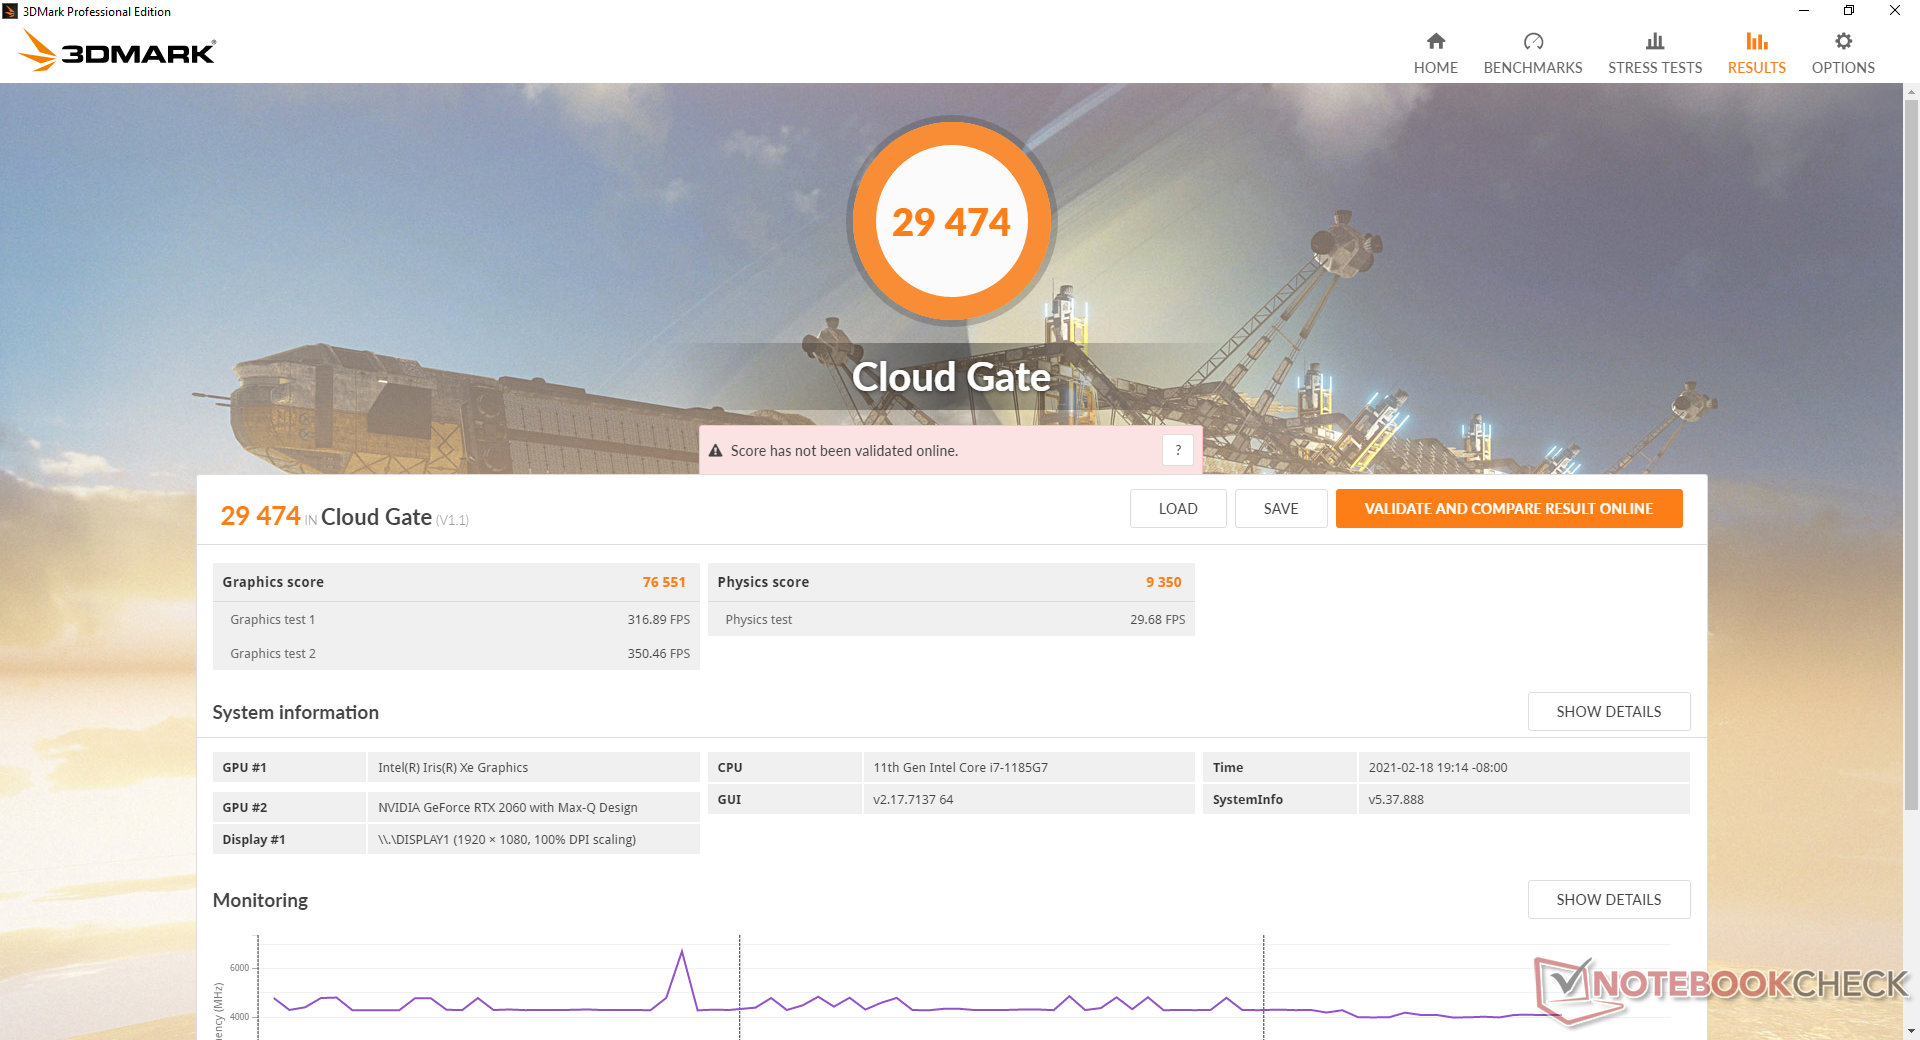
GPU prestatie
degrafische prestaties zijn vergelijkbaar met die van veel gaminglaptops en overtreffen met gemak bijna alle andere ultradunne 15,6-inch multimedialaptops. Upgraden naar de GeForce RTX 3060-configuratie zou nog grotere prestatievoordelen opleveren, maar we kunnen de toename op dit moment niet inschatten omdat we de RTX 3060 SKU nog moeten testen.
Zie onze speciale pagina over de GeForce RTX 2060 Max-Q voor meer technische informatie en benchmarkvergelijkingen.
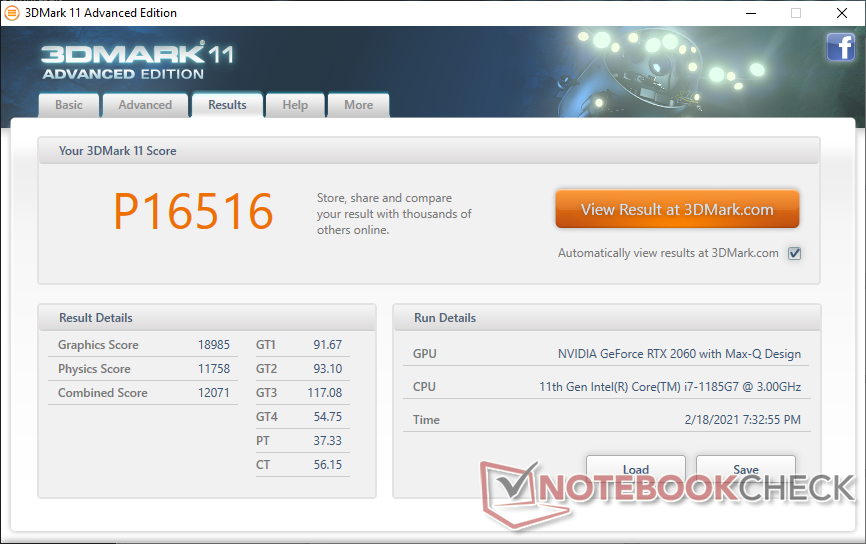
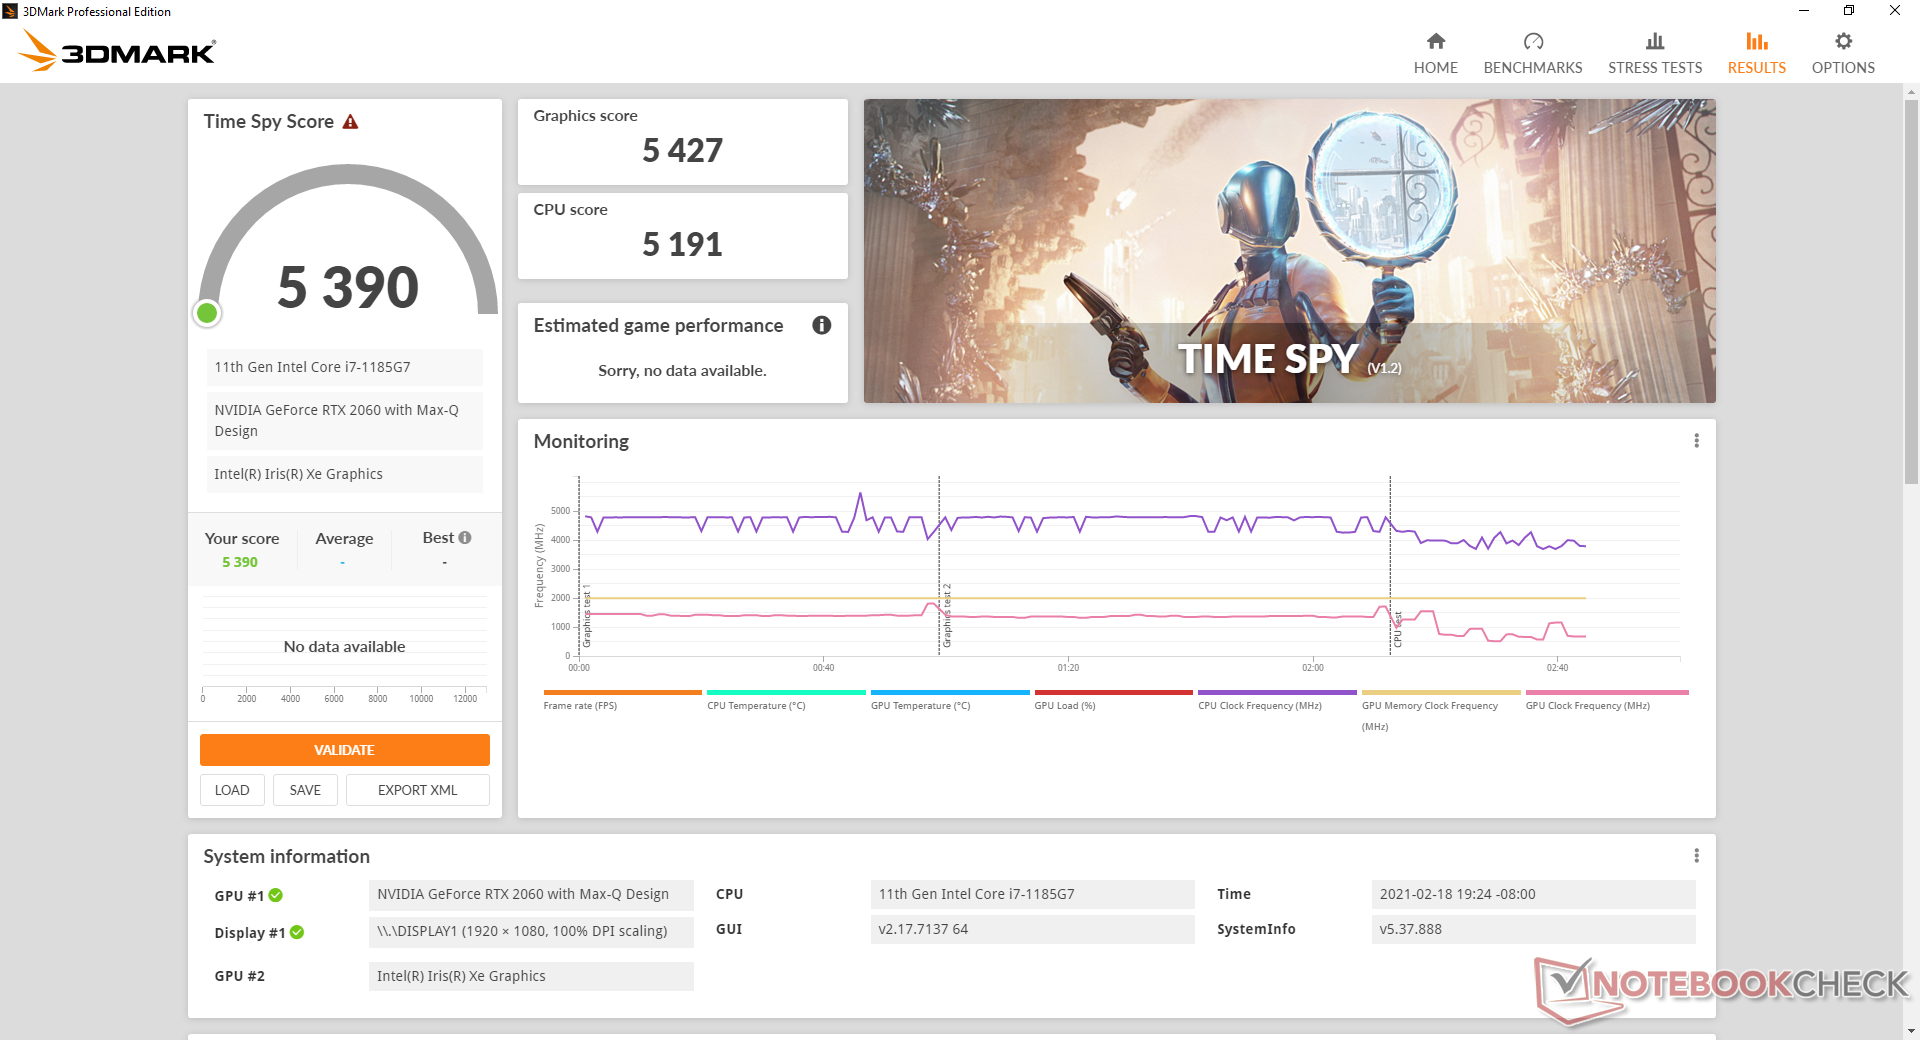
| 3DMark 11 Performance | 16516 punten | |
| 3DMark Cloud Gate Standard Score | 29474 punten | |
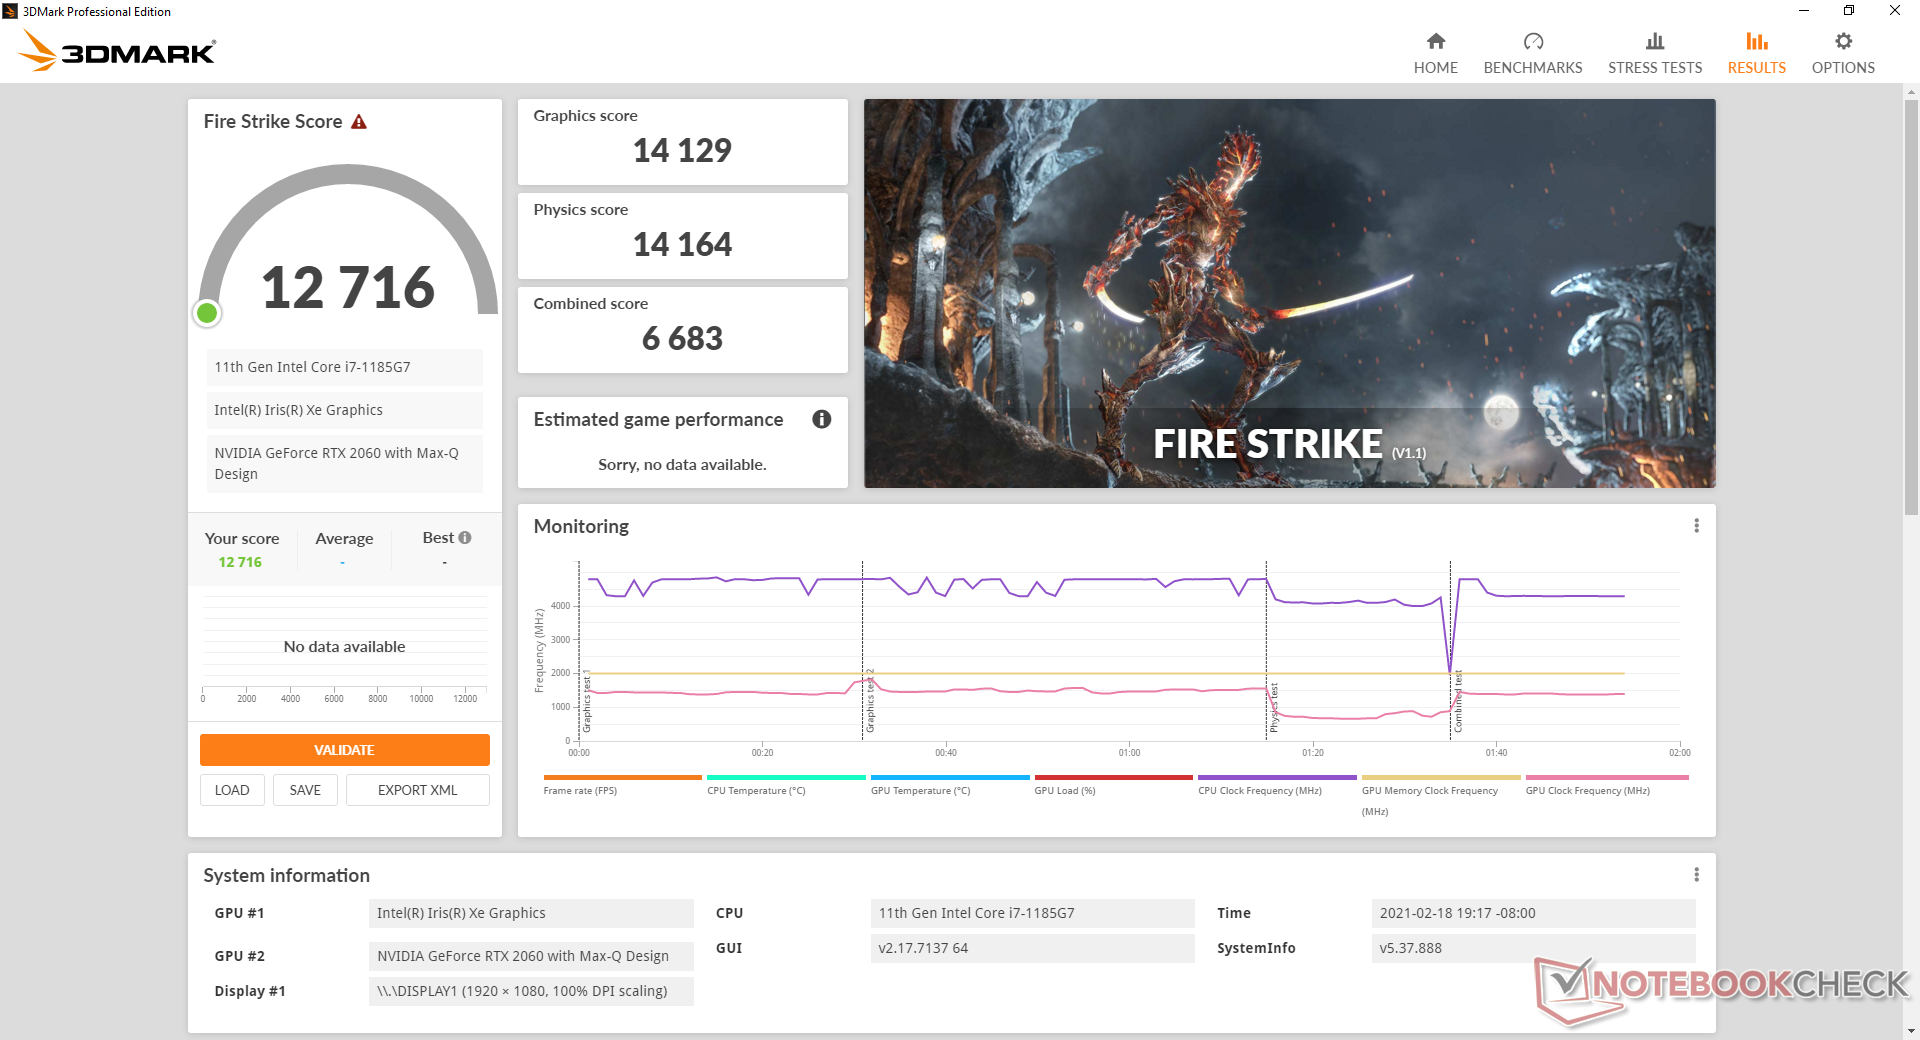
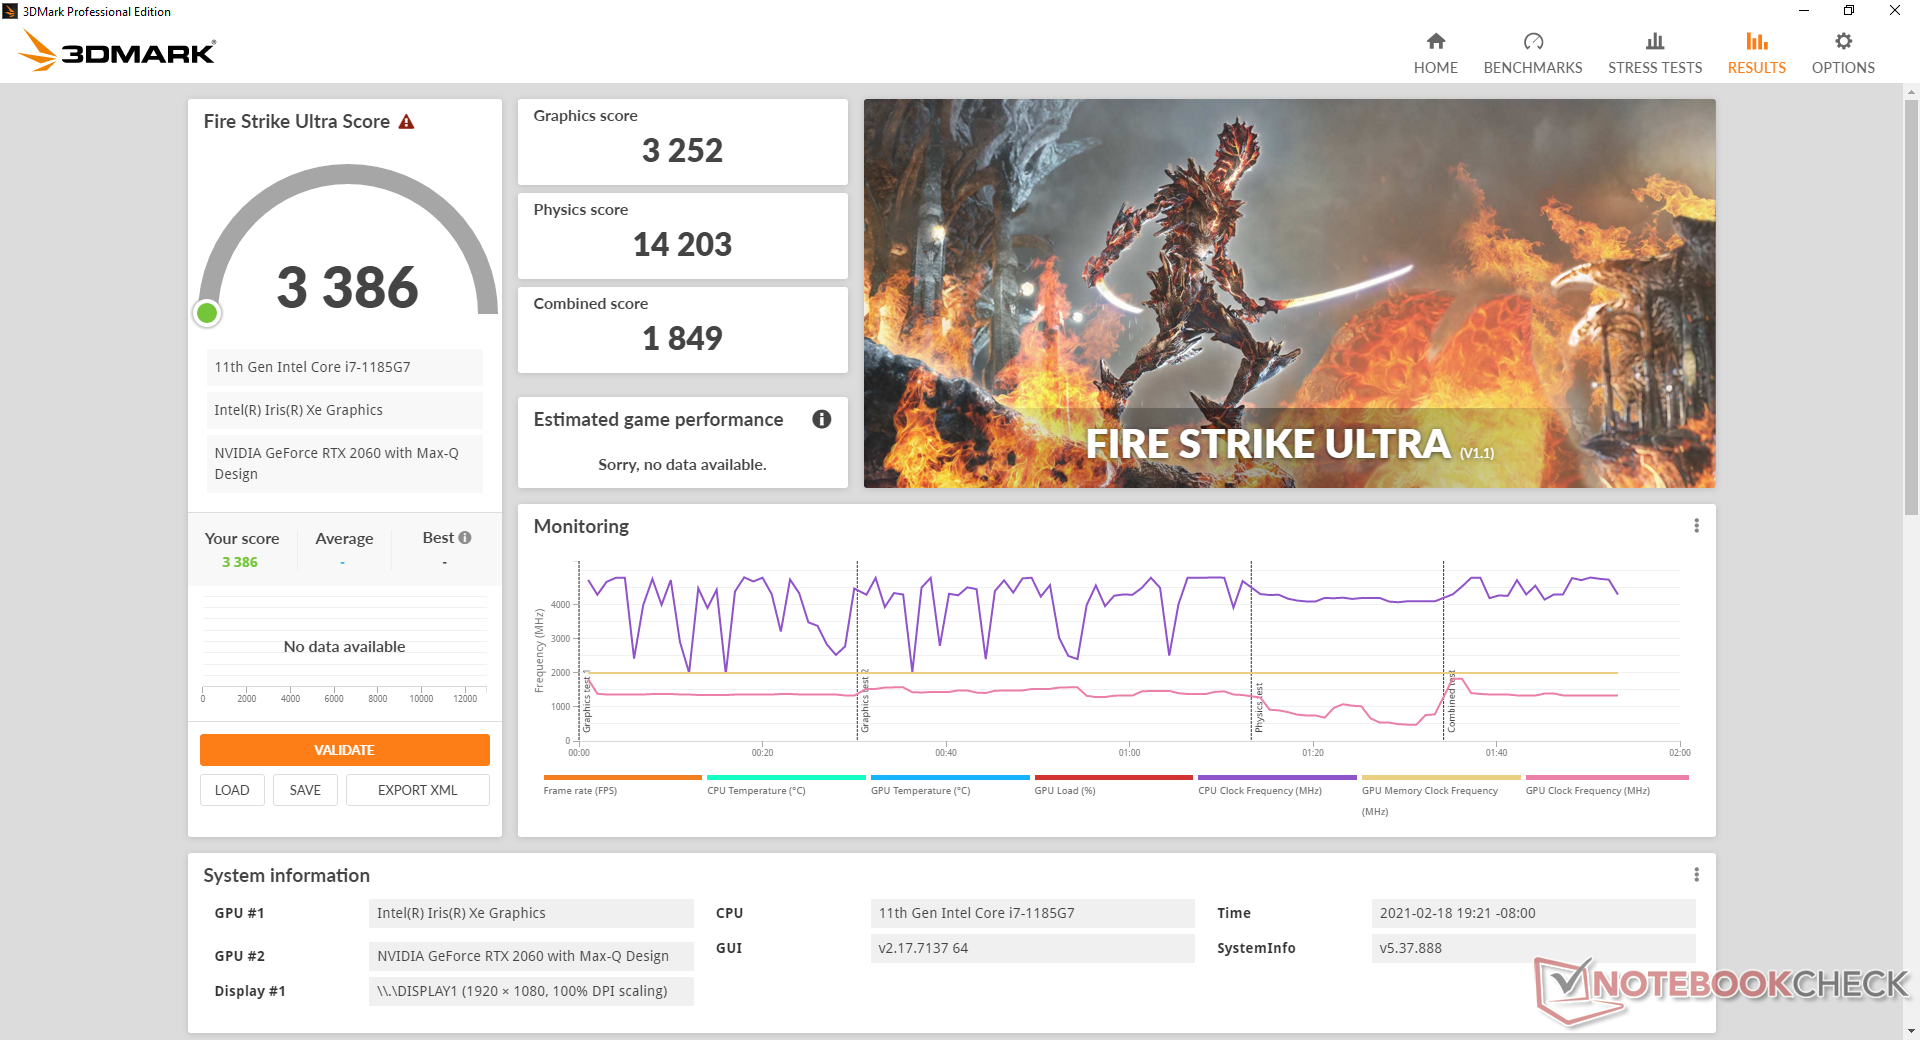
| 3DMark Fire Strike Score | 12716 punten | |
| 3DMark Time Spy Score | 5390 punten | |
Help | ||
| GTA V | |
| 1920x1080 Lowest Settings possible | |
| MSI Stealth 15M A11SEK | |
| Gemiddeld NVIDIA GeForce RTX 2060 Max-Q (n=1) | |
| Lenovo Yoga Slim 7-14ARE | |
| Acer Swift 3 SF314-42-R27B | |
| 1366x768 Normal/Off AF:4x | |
| MSI RTX 2060 Gaming Z 6G | |
| MSI Stealth 15M A11SEK | |
| Gemiddeld NVIDIA GeForce RTX 2060 Max-Q (n=1) | |
| Acer Swift 3 SF314-42-R27B | |
| 1920x1080 Highest AA:4xMSAA + FX AF:16x | |
| MSI RTX 2060 Gaming Z 6G | |
| MSI Stealth 15M A11SEK | |
| Gemiddeld NVIDIA GeForce RTX 2060 Max-Q (n=1) | |
| Lenovo Yoga Slim 7-14ARE | |
| Acer Swift 3 SF314-42-R27B | |
| Strange Brigade | |
| 1280x720 lowest AF:1 | |
| MSI Stealth 15M A11SEK | |
| Gemiddeld NVIDIA GeForce RTX 2060 Max-Q (n=1) | |
| Lenovo Yoga Slim 7-14ARE | |
| 1920x1080 medium AA:medium AF:4 | |
| MSI Stealth 15M A11SEK | |
| Gemiddeld NVIDIA GeForce RTX 2060 Max-Q (n=1) | |
| Lenovo Yoga Slim 7-14ARE | |
| 1920x1080 high AA:high AF:8 | |
| MSI Stealth 15M A11SEK | |
| Gemiddeld NVIDIA GeForce RTX 2060 Max-Q (n=1) | |
| Lenovo Yoga Slim 7-14ARE | |
| 1920x1080 ultra AA:ultra AF:16 | |
| MSI Stealth 15M A11SEK | |
| Gemiddeld NVIDIA GeForce RTX 2060 Max-Q (n=1) | |
| Lenovo Yoga Slim 7-14ARE | |
| lage | gem. | hoge | ultra | |
|---|---|---|---|---|
| GTA V (2015) | 173 | 164 | 119 | 68.2 |
| The Witcher 3 (2015) | 235.1 | 139.9 | 88.9 | 51.2 |
| Dota 2 Reborn (2015) | 144 | 130 | 119 | 116 |
| Final Fantasy XV Benchmark (2018) | 126 | 74.1 | 55.7 | |
| X-Plane 11.11 (2018) | 102 | 90 | 75.6 | |
| Strange Brigade (2018) | 276 | 130 | 106 | 93.1 |
Emissions
Systeemgeluid
Ventilatorgeluid is altijd aanwezig wanneer aangesloten op een stopcontact met 32 dB(A) tegen een achtergrond van 28 dB(A), zelfs als het systeem is ingesteld op de stille modus via Dragon Center. Pas als de netstroomadapter wordt losgekoppeld, gaan de ventilatoren echt stationair draaien voor een stille ervaring. We zouden dit graag veranderd zien bij toekomstige revisies, aangezien de "Stille" modus zich hetzelfde zou moeten gedragen, ongeacht of de AC-adapter is aangesloten of niet.
Tijdens het gamen kan het geluid van de ventilator variëren van 41 tot 46 dB(A), afhankelijk van de belasting van de CPU. Het ventilatorgeluid is bijvoorbeeld stabiel op 41 dB(A) wanneer Witcher 3 wordt uitgevoerd, maar het is luider wanneer 3DMark 06 wordt uitgevoerd, hoewel Witcher 3 meer GPU-intensief kan zijn. Dit bereik is vergelijkbaar met wat we registreerden op de Dell XPS 15, terwijl hij stiller is dan de Envy 15.
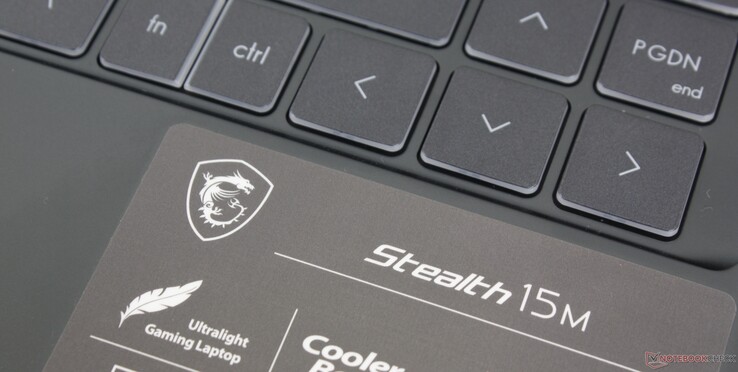
Het inschakelen van de Cooler Boost modus zal het ventilatorgeluid naar het maximum van 56 dB(A) brengen, ongeacht de belasting op het scherm. Deze modus is over het algemeen niet nodig of wordt aanbevolen in de meeste gevallen, inclusief gaming, omdat het bijna geen prestatieverbetering biedt - alleen koelere temperaturen.
We kunnen geen spoelgejank waarnemen van onze test unit.
| MSI Stealth 15M A11SEK GeForce RTX 2060 Max-Q, i7-1185G7, WDC PC SN530 SDBPNPZ-1T00 | Dell XPS 15 9500 Core i7 4K UHD GeForce GTX 1650 Ti Mobile, i7-10875H, SK Hynix PC611 512GB | Lenovo ThinkPad T15p-20TN0006GE GeForce GTX 1050 Mobile, i7-10750H, WDC PC SN730 SDBQNTY-512GB | Asus ZenBook UX535-M01440 GeForce GTX 1650 Ti Max-Q, i7-10750H, WDC PC SN730 SDBPNTY-1T00 | MSI Prestige 15 A10SC GeForce GTX 1650 Max-Q, i7-10710U, Samsung SSD PM981 MZVLB1T0HALR | HP Envy 15-ep0098nr GeForce RTX 2060 Max-Q, i7-10750H, Intel Optane Memory H10 with Solid State Storage 32GB + 512GB HBRPEKNX0202A(L/H) | |
|---|---|---|---|---|---|---|
| Noise | 7% | 7% | 17% | 11% | -4% | |
| uit / omgeving * (dB) | 27.5 | 28.4 -3% | 29.3 -7% | 24.6 11% | 29.3 -7% | 26.4 4% |
| Idle Minimum * (dB) | 32.3 | 28.4 12% | 29.3 9% | 24.6 24% | 30.1 7% | 32.2 -0% |
| Idle Average * (dB) | 32.3 | 28.4 12% | 29.3 9% | 24.6 24% | 30.2 7% | 32.2 -0% |
| Idle Maximum * (dB) | 33.7 | 28.4 16% | 30.6 9% | 24.6 27% | 30.2 10% | 32.2 4% |
| Load Average * (dB) | 46.3 | 46 1% | 42.7 8% | 41.3 11% | 31.5 32% | 48.3 -4% |
| Witcher 3 ultra * (dB) | 41.3 | 42 -2% | 42.7 -3% | 42 -2% | 37 10% | 53.7 -30% |
| Load Maximum * (dB) | 56.2 | 47.1 16% | 42.7 24% | 41.4 26% | 47 16% | 58.8 -5% |
* ... kleiner is beter
Geluidsniveau
| Onbelast |
| 32.3 / 32.3 / 33.7 dB (A) |
| Belasting |
| 46.3 / 56.2 dB (A) |
 | ||
30 dB stil 40 dB(A) hoorbaar 50 dB(A) luid |
||
min: | ||
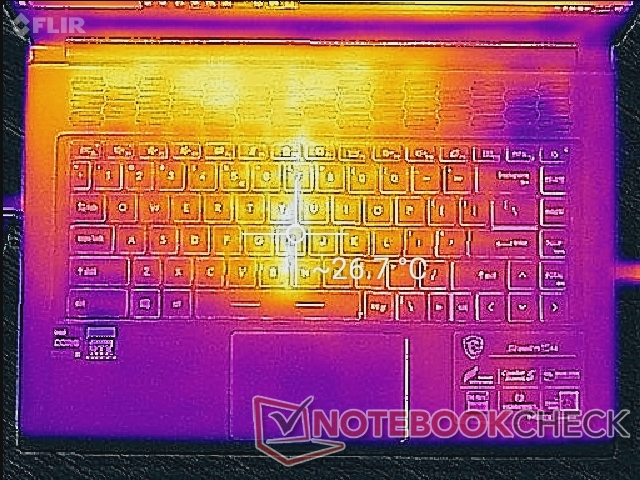
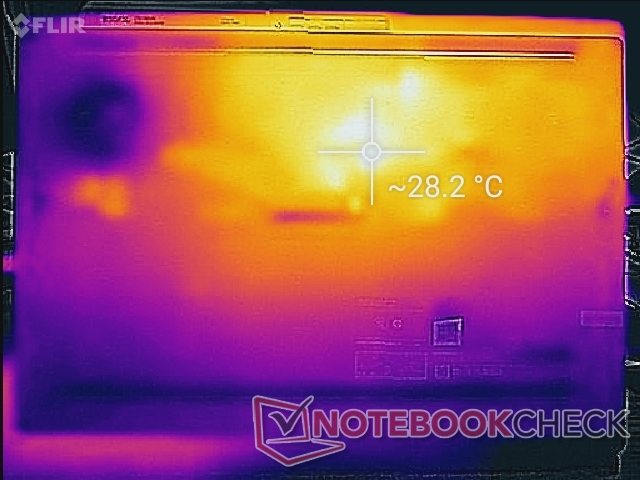
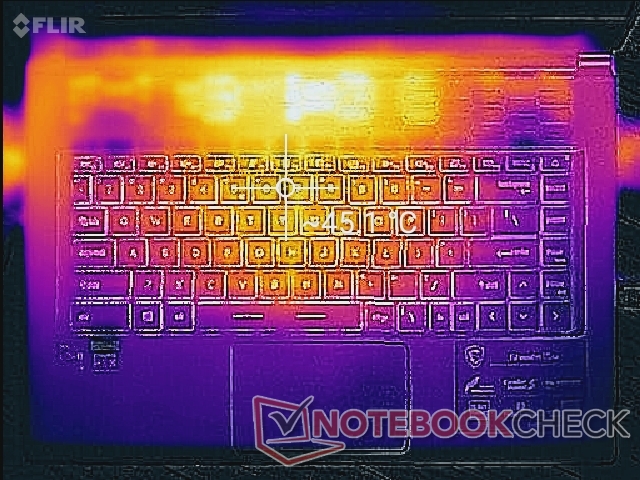
Temperatuur
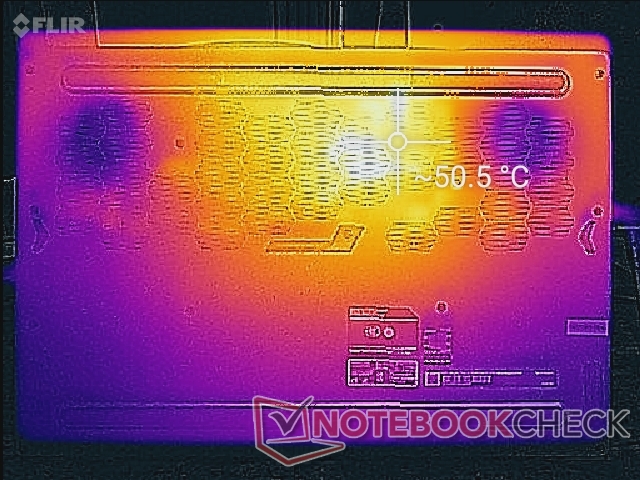
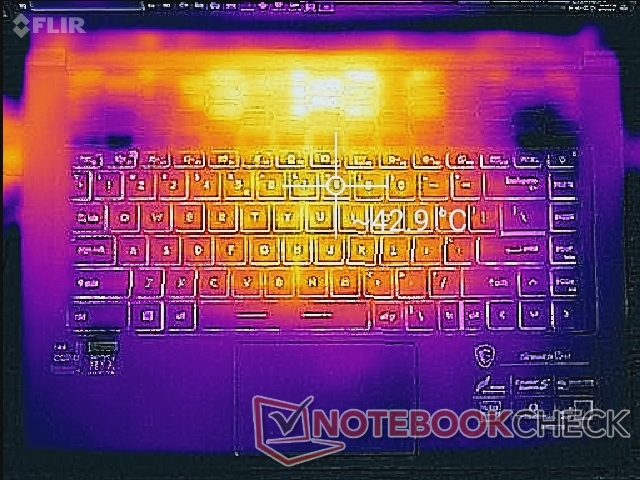
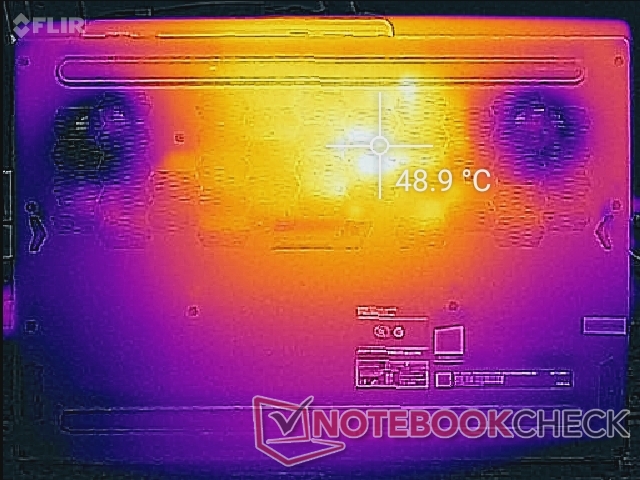
De ontwikkeling van de oppervlaktetemperatuur is grotendeels symmetrisch. De hot spot op het toetsenbord centrum kan zo warm als 43 C tot 45 C bij het uitvoeren van veeleisende belastingen zoals games te zijn vergelijkbaar met wat we waargenomen op de GS66 , maar nog steeds koeler dan op zowel de XPS 15 en Lenovo ThinkPad T15p. Dus, de MSI is in staat om snellere grafische prestaties te bieden dan zijn concurrenten zonder noodzakelijkerwijs warmer te worden.
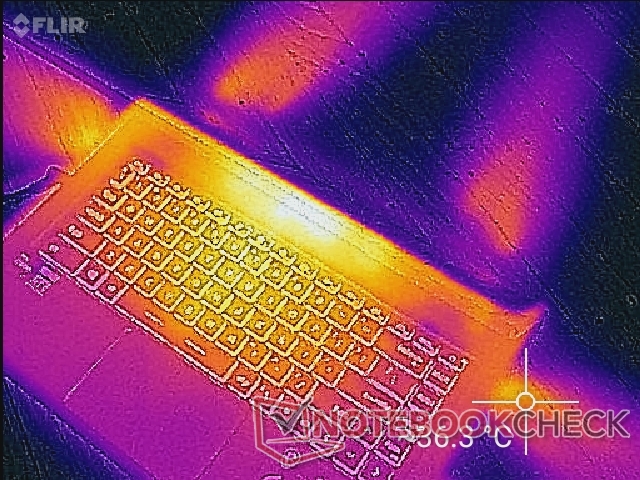
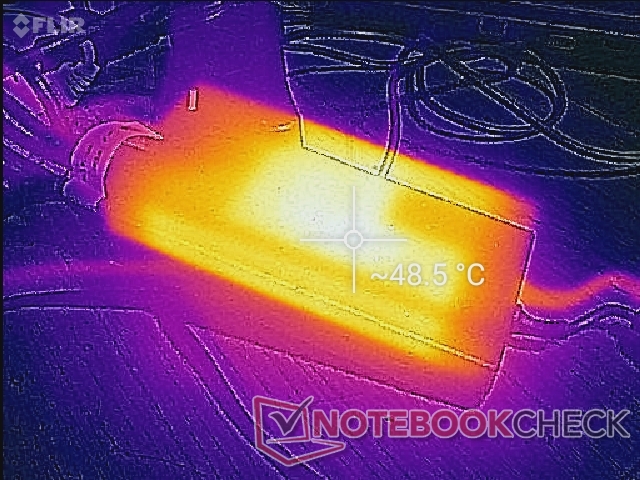
(-) De maximumtemperatuur aan de bovenzijde bedraagt 47.2 °C / 117 F, vergeleken met het gemiddelde van 36.8 °C / 98 F, variërend van 21 tot 71 °C voor de klasse Multimedia.
(-) De bodem warmt op tot een maximum van 47.4 °C / 117 F, vergeleken met een gemiddelde van 39.1 °C / 102 F
(+) Bij onbelast gebruik bedraagt de gemiddelde temperatuur voor de bovenzijde 22.6 °C / 73 F, vergeleken met het apparaatgemiddelde van 31.3 °C / 88 F.
(±) Bij het spelen van The Witcher 3 is de gemiddelde temperatuur voor de bovenzijde 34.4 °C / 94 F, vergeleken met het apparaatgemiddelde van 31.3 °C / 88 F.
(+) De palmsteunen en het touchpad zijn met een maximum van ###max## °C / 80.2 F koeler dan de huidtemperatuur en voelen daarom koel aan.
(±) De gemiddelde temperatuur van de handpalmsteun van soortgelijke toestellen bedroeg 28.7 °C / 83.7 F (+1.9 °C / 3.5 F).
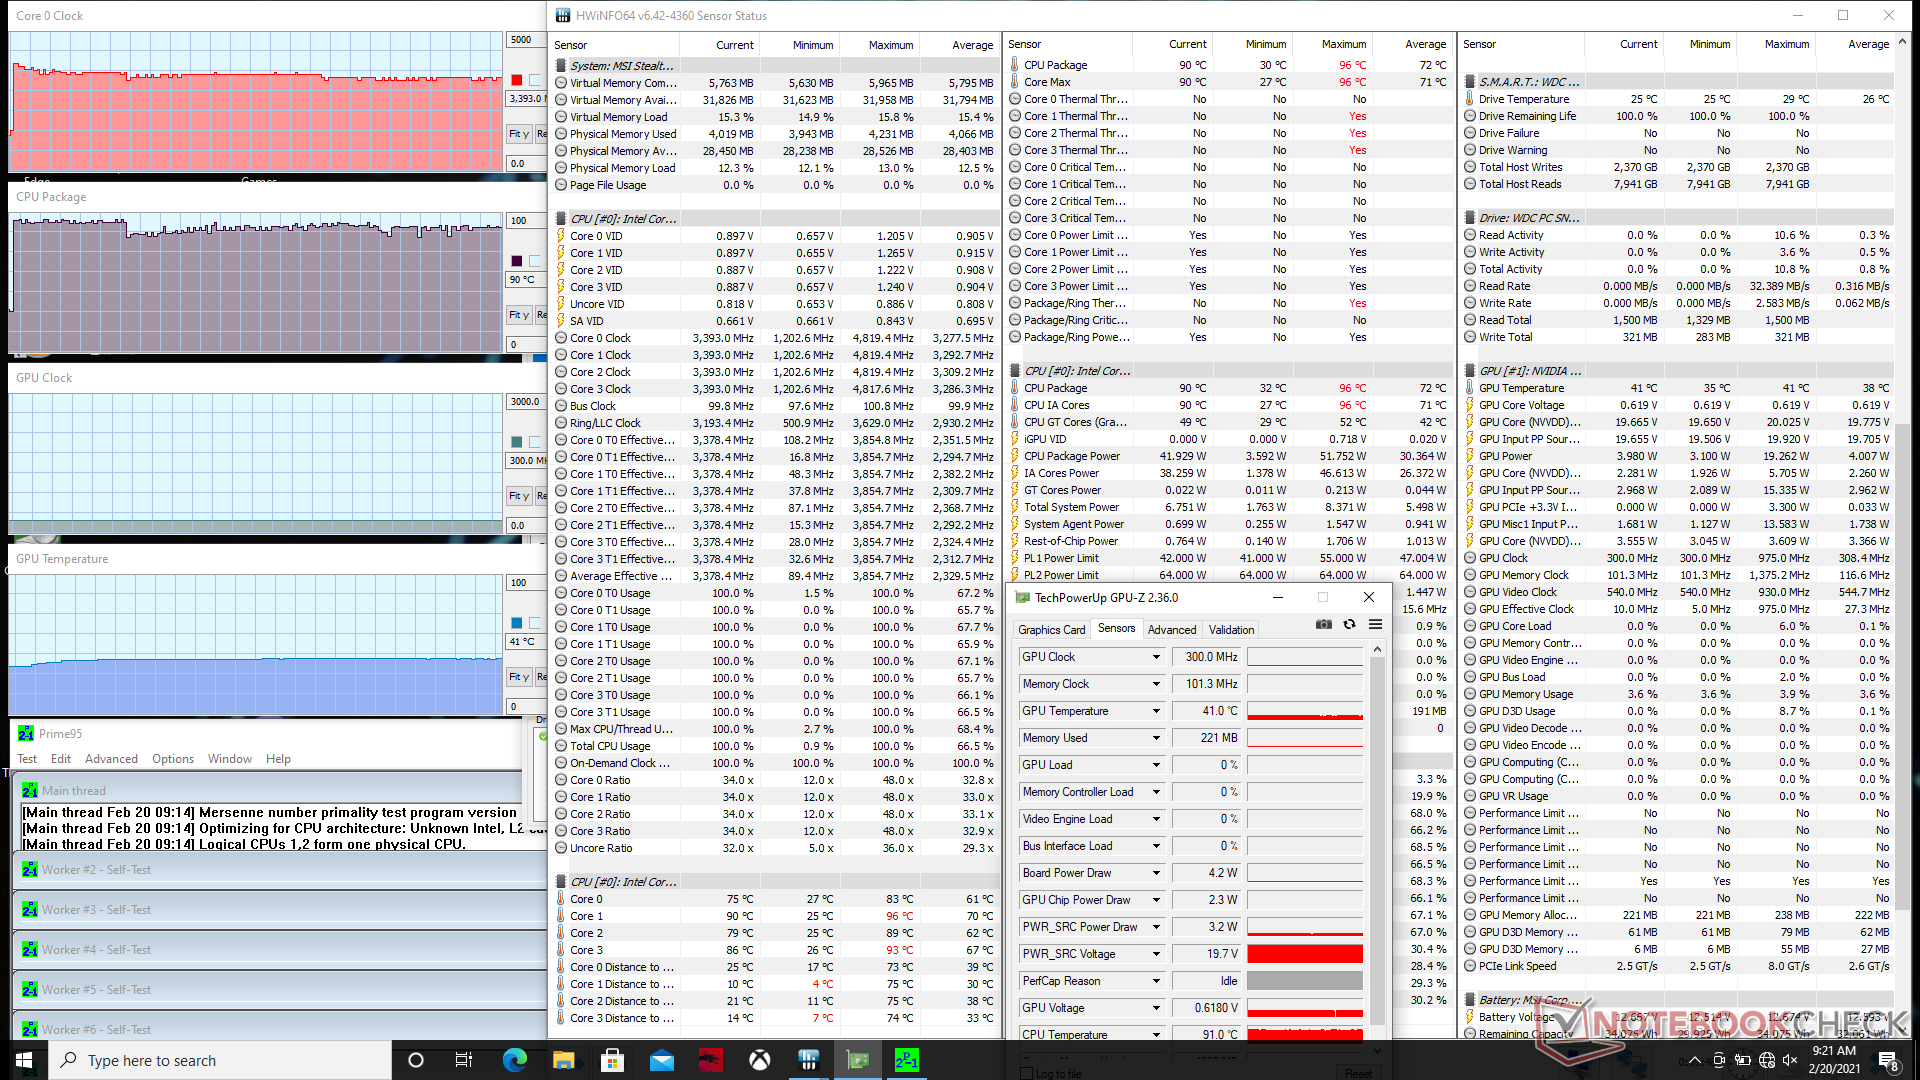
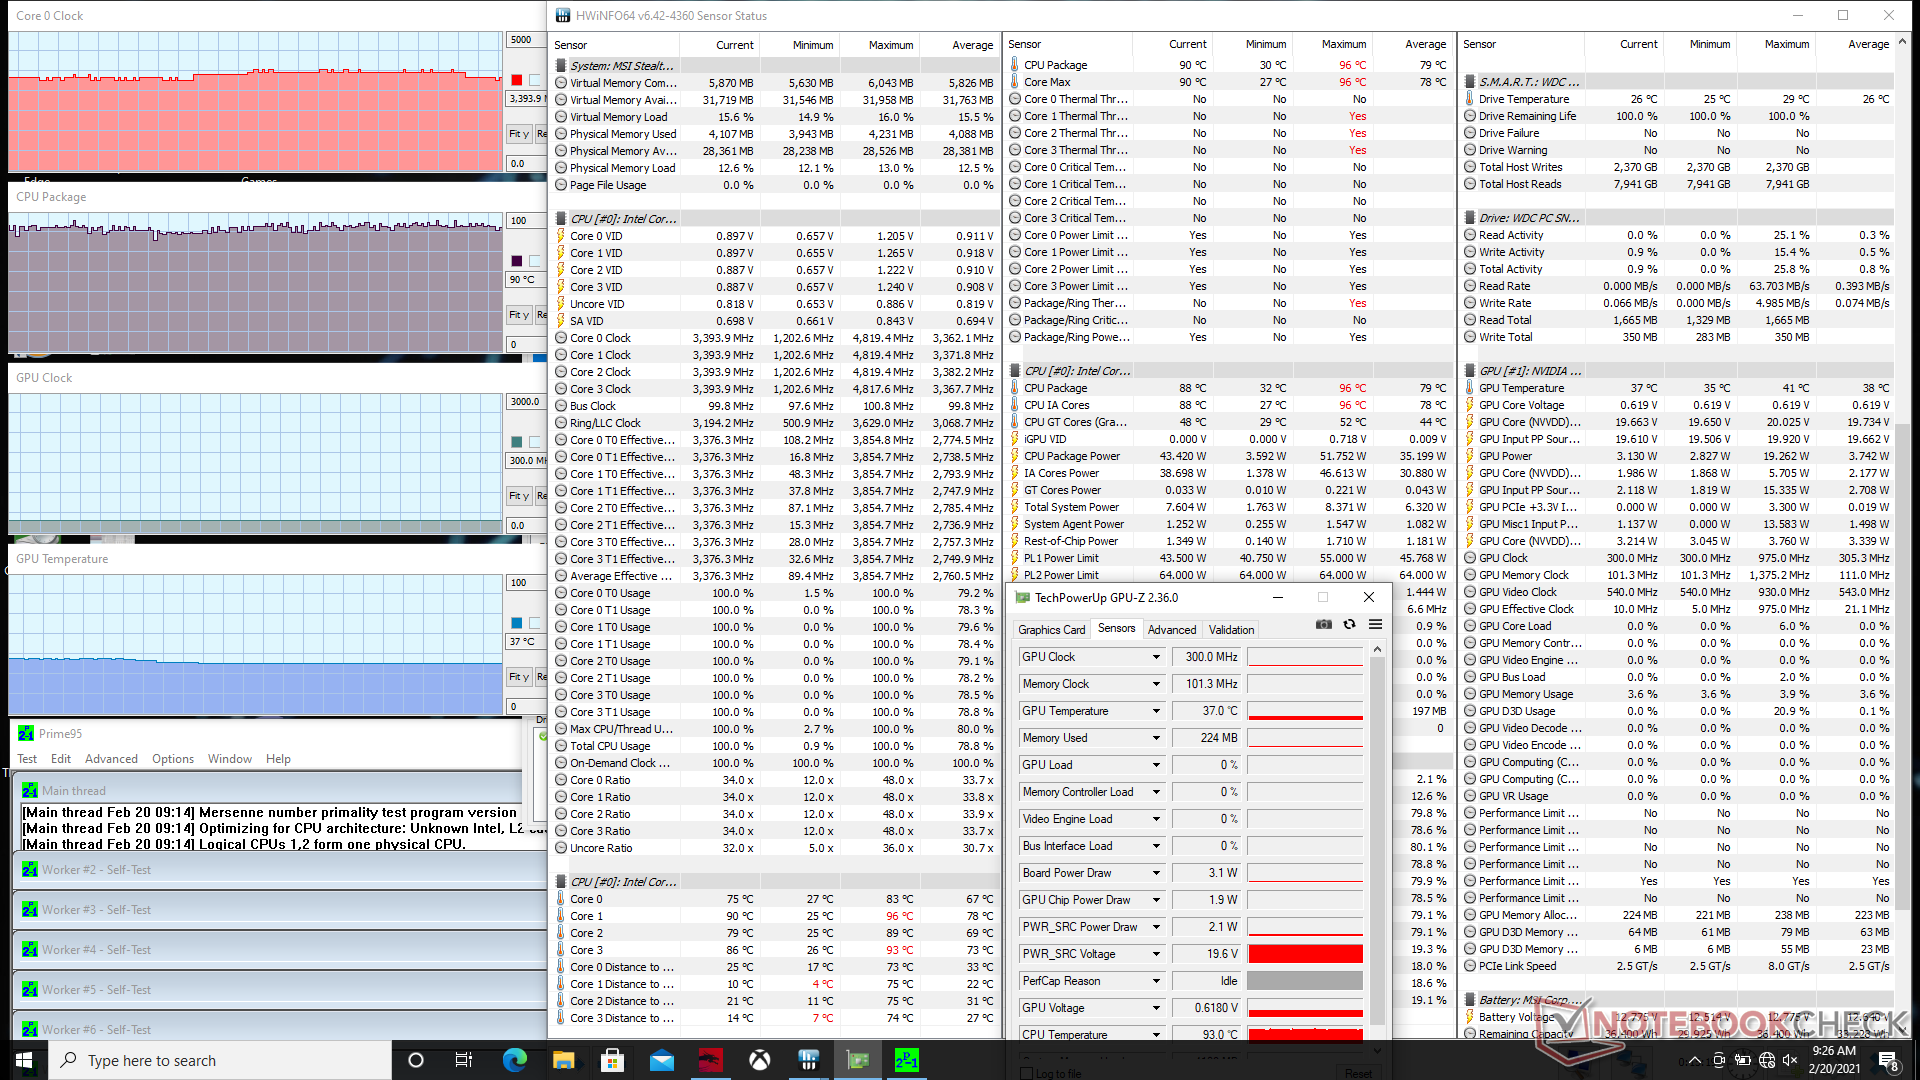
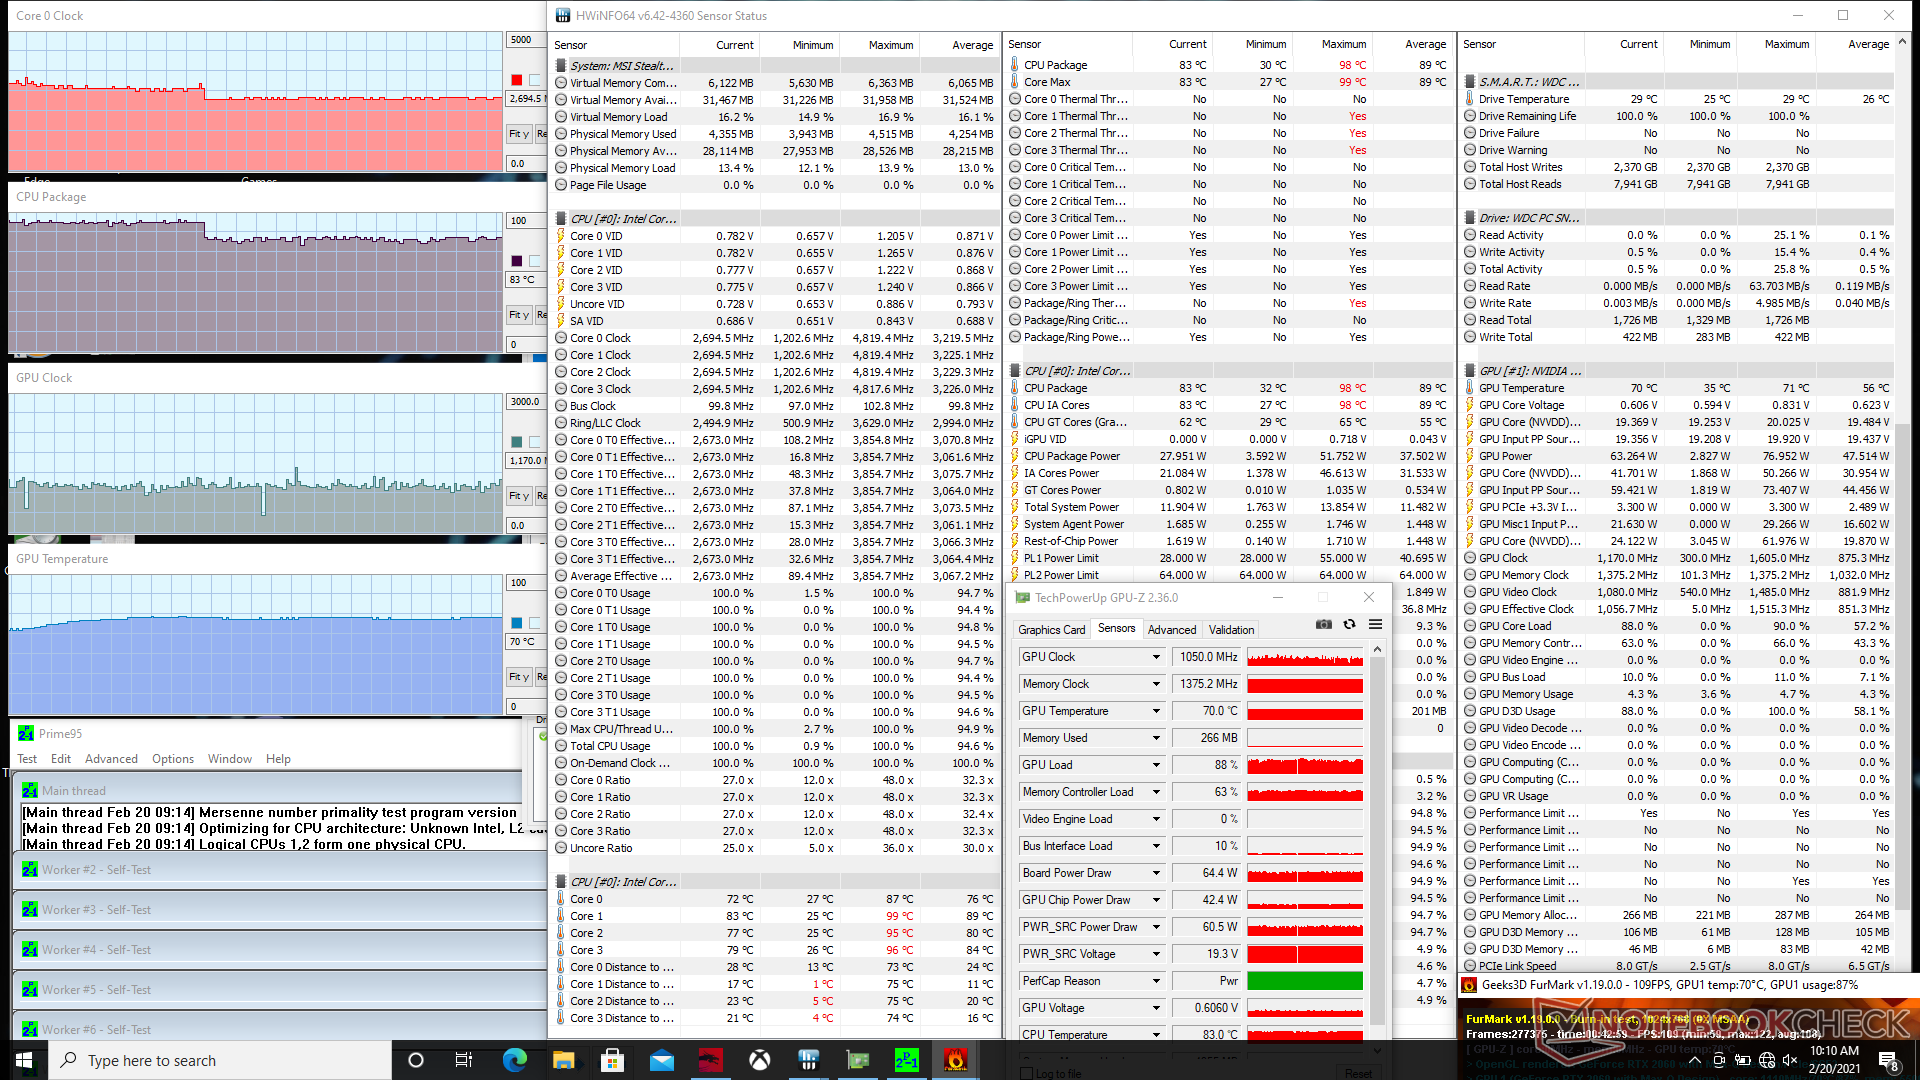
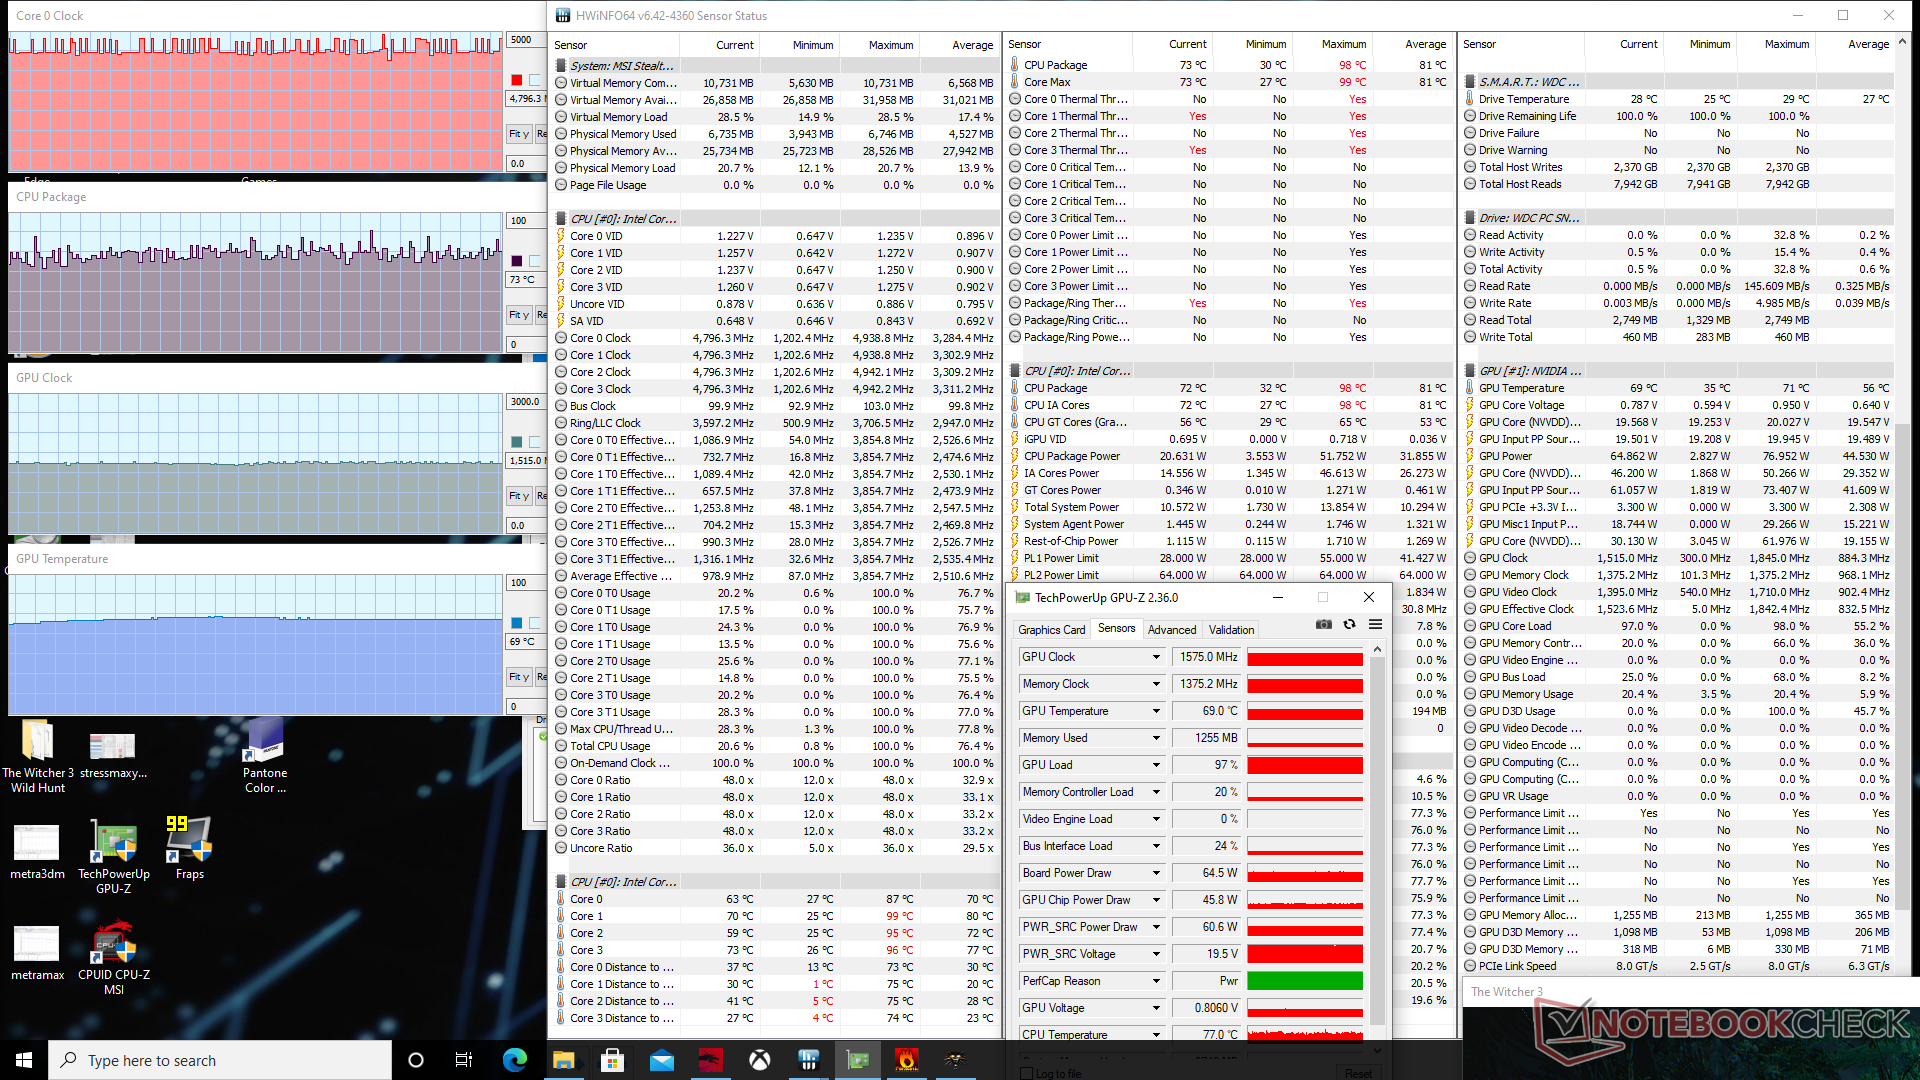
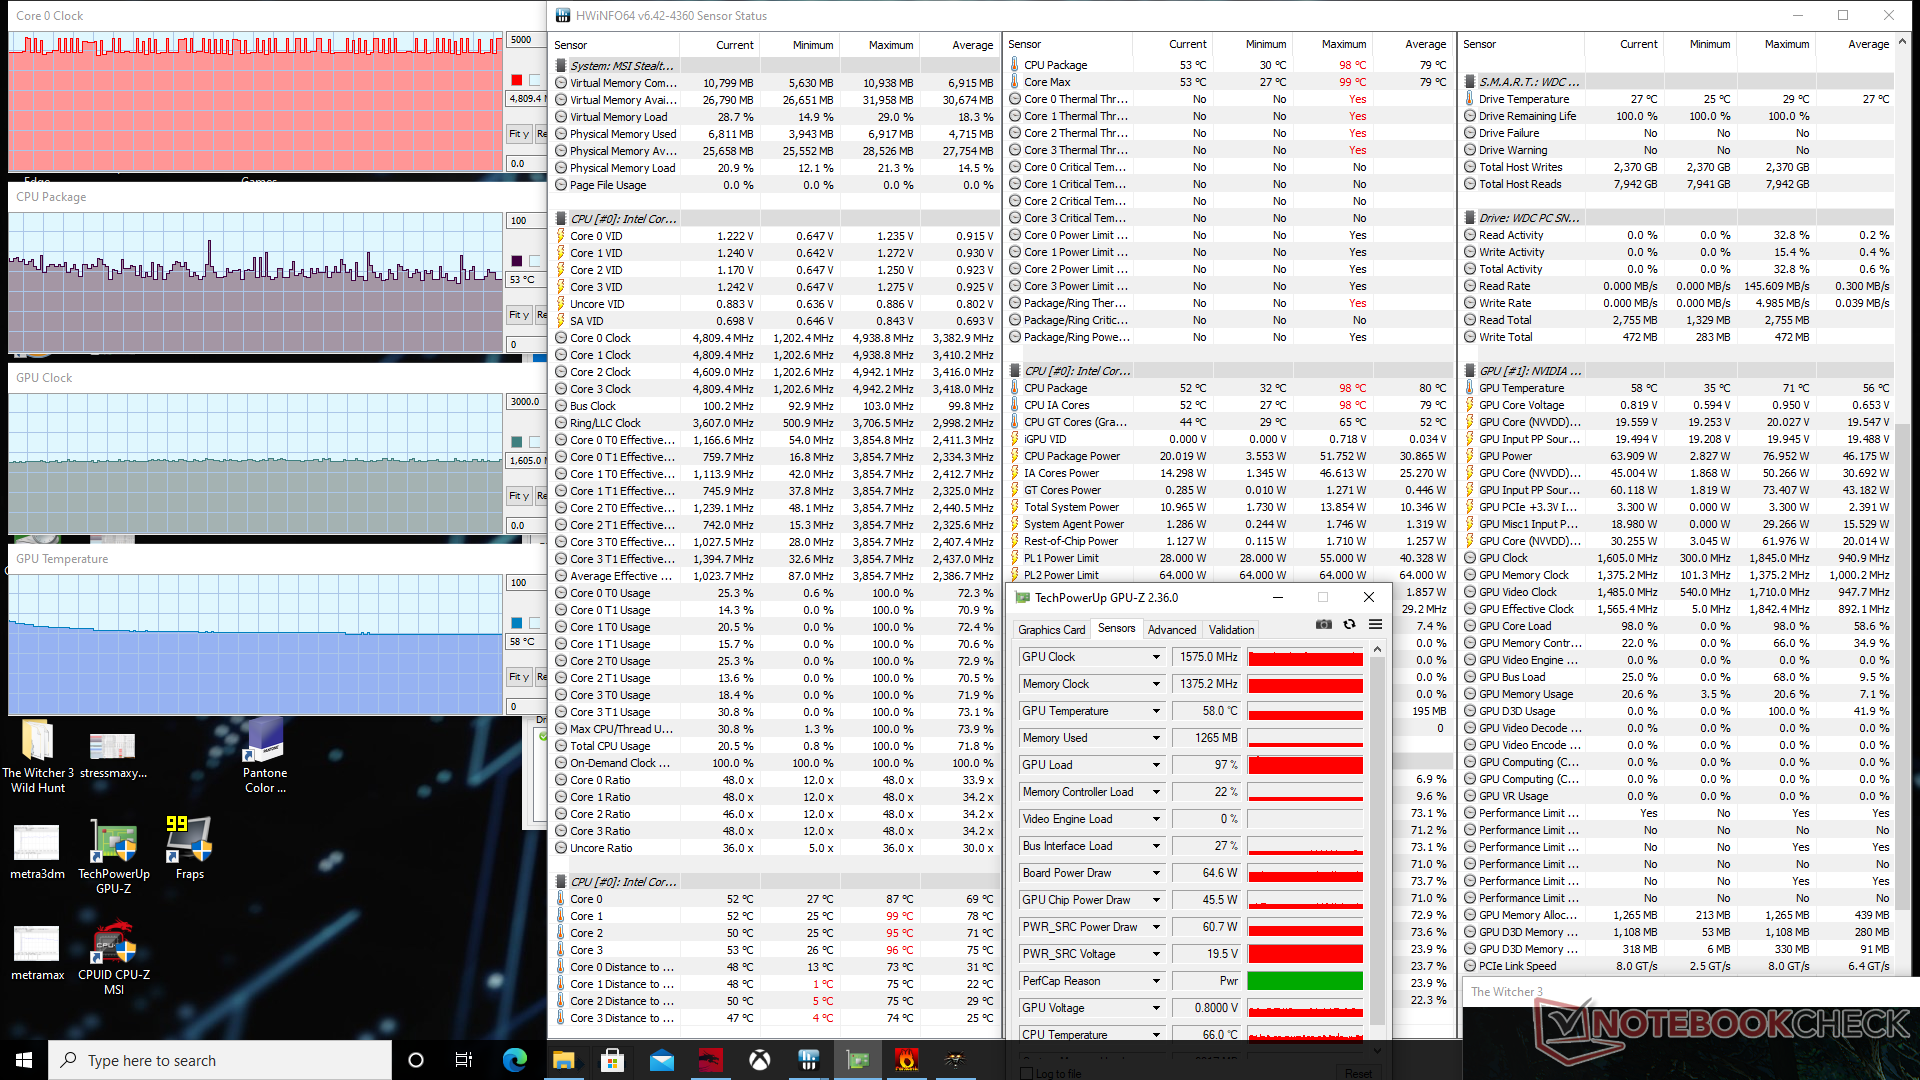
Stresstest
Wanneer de processor werd belast met Prime95, steeg de kloksnelheid van de CPU de eerste paar seconden tot 3,9 GHz, om daarna terug te vallen tot 3,5 GHz. De processor zou zich uiteindelijk stabiliseren op 3,3 tot 3,4 GHz en bij een kerntemperatuur van 90 C. Het inschakelen van Cooler Boost zou bijna verschil maken.
Wanneer de processor gelijktijdig werd belast met zowel Prime95 als FurMark, stabiliseerden de CPU en GPU temperaturen op respectievelijk 83 C en 70 C. Interessant is dat het inschakelen van Cooler Boost de CPU kloksnelheid zou verhogen van 2,6 GHz naar 3,3 GHz, terwijl de kerntemperatuur zou stijgen naar 92 C. Omgekeerd zou de GPU temperatuur dalen van 70 C naar 63 C.
Het draaien van Witcher 3 zorgt ervoor dat de CPU en GPU temperaturen stabiliseren op respectievelijk 73 C en 69 C. Het inschakelen van Turbo Boost zou hun kerntemperaturen aanzienlijk verlagen tot slechts 53 C en 58 C. Kloksnelheden blijven echter in wezen ongewijzigd. Het stroomverbruik van de GPU blijft stabiel op iets minder dan 65 W.
Werken op batterijen beperkt de prestaties. Een Fire Strike run op batterijvoeding zou fysica- en grafische scores opleveren van respectievelijk 12781 en 4423 punten, vergeleken met 14164 en 14129 punten op netstroom.

| CPUklok (GHz) GPUklok (MHz) GemiddeldeCPU temperatuur (°C) GemiddeldeGPU temperatuur (°C) |
| Systeem in ruststand |
| Prime95 Stress (Turbo uit) |
| Prime95 Stress (Turbo aan) |
| Prime95 + FurMark Stress (Turbo uit) |
| Prime95 + FurMark Stress (Turbo aan) |
| Witcher 3 Stress (Turbo uit) |
| Witcher 3 Stress (Turbo aan) |
Sprekers


MSI Stealth 15M A11SEK audioanalyse
(+) | luidsprekers kunnen relatief luid spelen (82.3 dB)
Bas 100 - 315 Hz
(-) | bijna geen lage tonen - gemiddeld 18.9% lager dan de mediaan
(±) | lineariteit van de lage tonen is gemiddeld (9.8% delta ten opzichte van de vorige frequentie)
Midden 400 - 2000 Hz
(+) | evenwichtige middens - slechts 4.6% verwijderd van de mediaan
(+) | de middentonen zijn lineair (4.4% delta ten opzichte van de vorige frequentie)
Hoog 2 - 16 kHz
(+) | evenwichtige hoogtepunten - slechts 3.2% verwijderd van de mediaan
(+) | de hoge tonen zijn lineair (3.7% delta naar de vorige frequentie)
Algemeen 100 - 16.000 Hz
(±) | lineariteit van het totale geluid is gemiddeld (17.6% verschil met de mediaan)
Vergeleken met dezelfde klasse
» 51% van alle geteste apparaten in deze klasse waren beter, 7% vergelijkbaar, 42% slechter
» De beste had een delta van 5%, het gemiddelde was 17%, de slechtste was 45%
Vergeleken met alle geteste toestellen
» 35% van alle geteste apparaten waren beter, 8% gelijk, 57% slechter
» De beste had een delta van 4%, het gemiddelde was 24%, de slechtste was 134%
Apple MacBook 12 (Early 2016) 1.1 GHz audioanalyse
(+) | luidsprekers kunnen relatief luid spelen (83.6 dB)
Bas 100 - 315 Hz
(±) | verminderde zeebaars - gemiddeld 11.3% lager dan de mediaan
(±) | lineariteit van de lage tonen is gemiddeld (14.2% delta ten opzichte van de vorige frequentie)
Midden 400 - 2000 Hz
(+) | evenwichtige middens - slechts 2.4% verwijderd van de mediaan
(+) | de middentonen zijn lineair (5.5% delta ten opzichte van de vorige frequentie)
Hoog 2 - 16 kHz
(+) | evenwichtige hoogtepunten - slechts 2% verwijderd van de mediaan
(+) | de hoge tonen zijn lineair (4.5% delta naar de vorige frequentie)
Algemeen 100 - 16.000 Hz
(+) | het totale geluid is lineair (10.2% verschil met de mediaan)
Vergeleken met dezelfde klasse
» 7% van alle geteste apparaten in deze klasse waren beter, 2% vergelijkbaar, 91% slechter
» De beste had een delta van 5%, het gemiddelde was 18%, de slechtste was 53%
Vergeleken met alle geteste toestellen
» 5% van alle geteste apparaten waren beter, 1% gelijk, 94% slechter
» De beste had een delta van 4%, het gemiddelde was 24%, de slechtste was 134%
Energy Management
Stroomverbruik
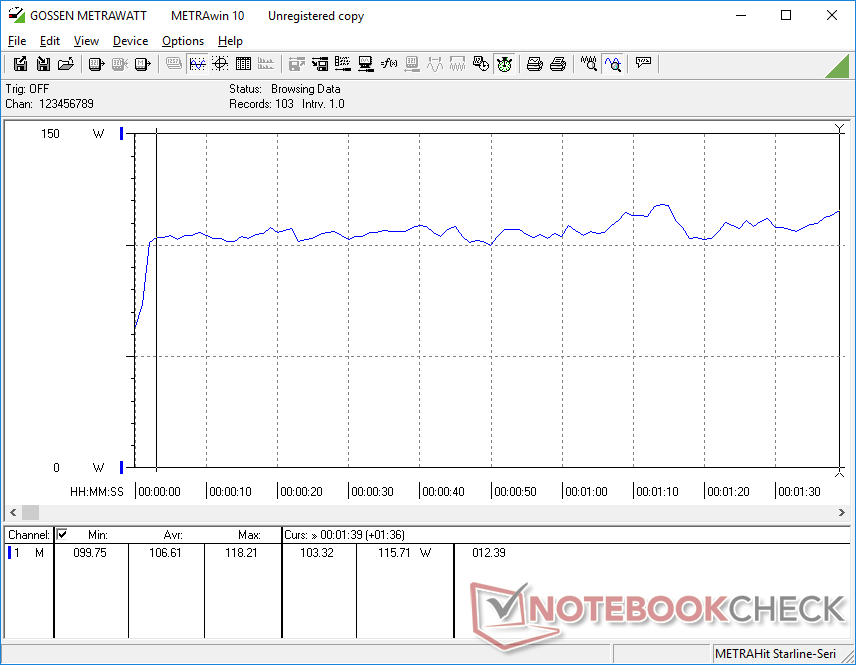
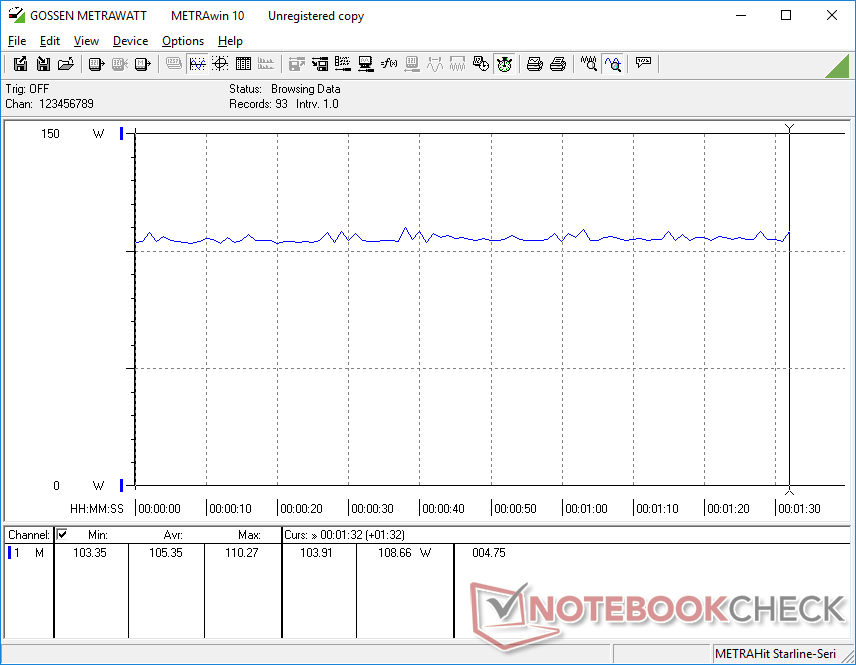
Stationair draaien op het bureaublad verbruikt slechts 7 W bij de laagste helderheidsinstelling en het energiebesparingsprofiel en 18 W bij de maximale helderheid en het krachtige profiel. Met Witcher 3 verbruikt ongeveer 105 W en is daarmee veel hoger dan de meeste Core U-serie Ultrabooks en zelfs sommige entry-level gaming laptops zoals de Lenovo Legion 5 dankzij onze GeForce RTX GPU. MSI eigenaren krijgen ongeveer 70 procent hogere grafische prestaties dan de Dell XPS 15 9500 voor een 13 procent hoger stroomverbruik.
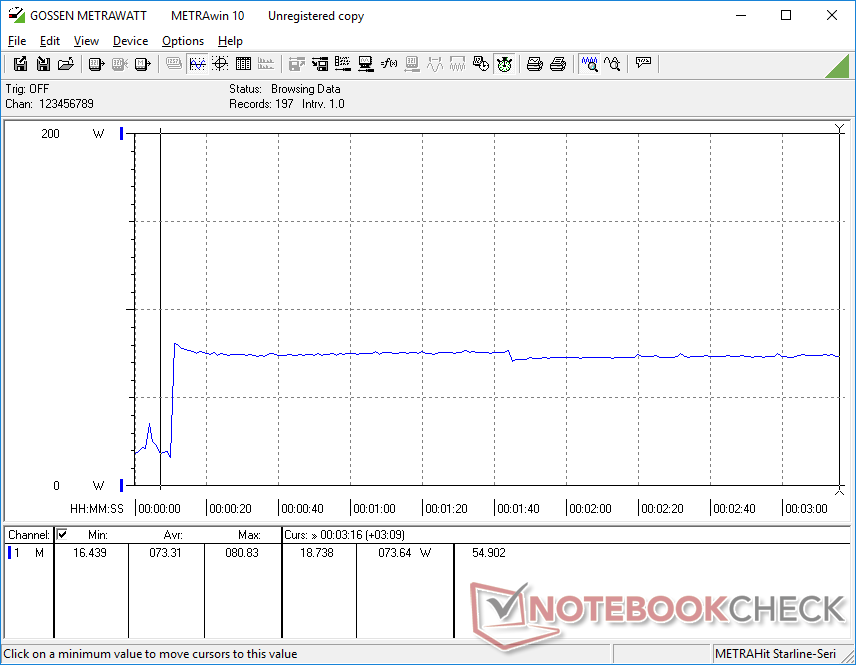
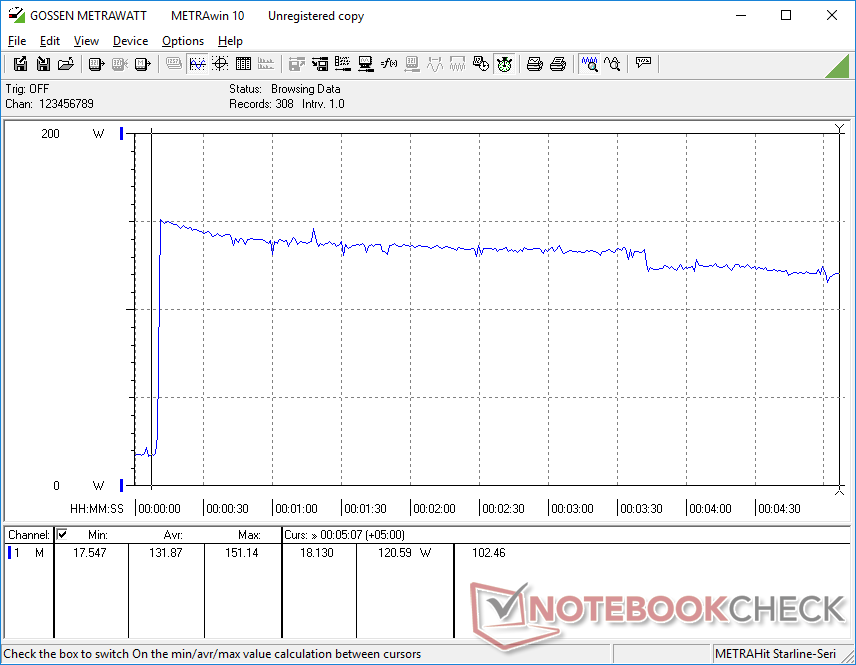
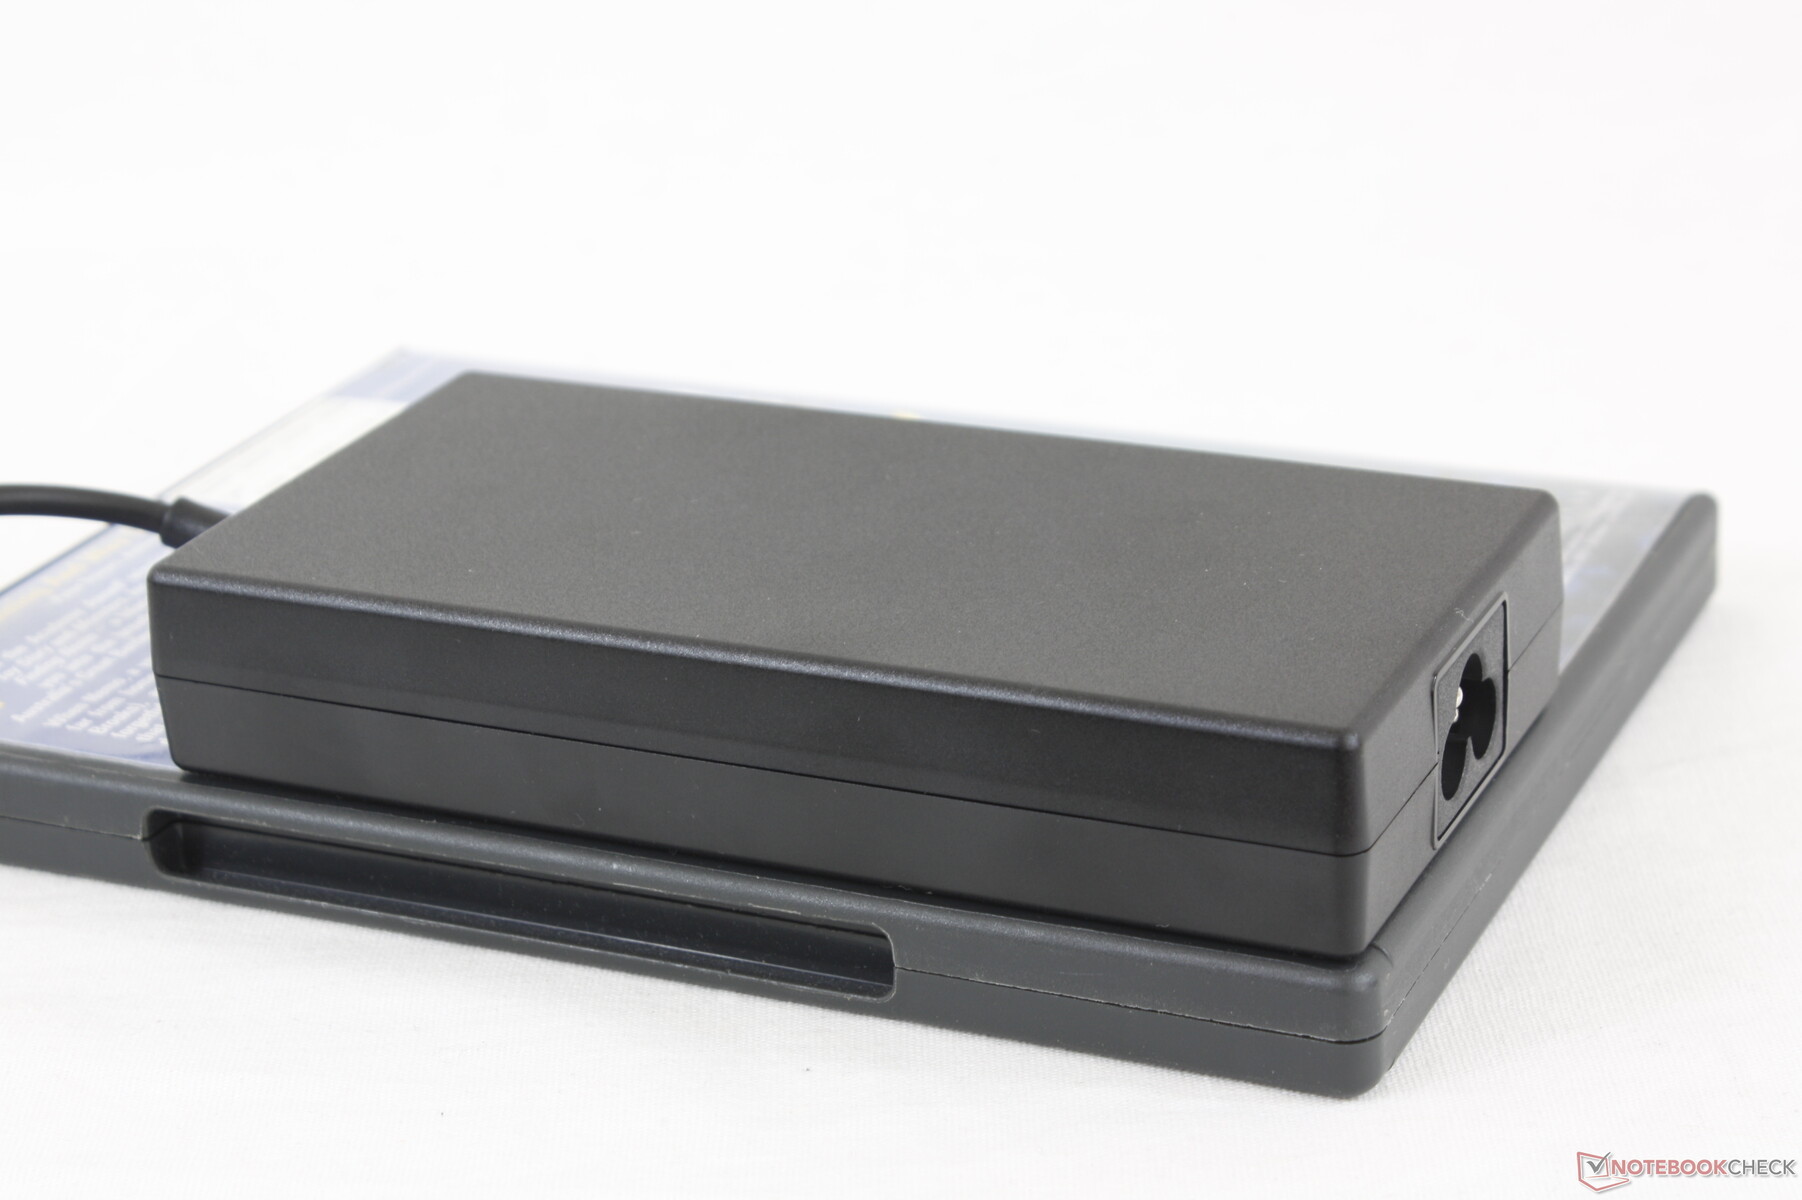
We zijn in staat om een maximaal verbruik van 151 W te meten van de klein-medium (13,6 x 6,8 x 1,9 cm) 150 W AC adapter wanneer we Prime95 en FurMark tegelijkertijd draaien. Dit percentage daalt uiteindelijk en stabiliseert zich rond 120 W, zoals blijkt uit onze grafiek hieronder, als gevolg van thermische beperkingen.
| Uit / Standby | |
| Inactief | |
| Belasting |
|
Key:
min: | |
| MSI Stealth 15M A11SEK i7-1185G7, GeForce RTX 2060 Max-Q, WDC PC SN530 SDBPNPZ-1T00, IPS, 1920x1080, 15.6" | Dell XPS 15 9500 Core i7 4K UHD i7-10875H, GeForce GTX 1650 Ti Mobile, SK Hynix PC611 512GB, IPS, 3840x2400, 15.6" | Lenovo ThinkPad T15p-20TN0006GE i7-10750H, GeForce GTX 1050 Mobile, WDC PC SN730 SDBQNTY-512GB, IPS LED, 3840x2160, 15.6" | Asus ZenBook UX535-M01440 i7-10750H, GeForce GTX 1650 Ti Max-Q, WDC PC SN730 SDBPNTY-1T00, IPS, 3840x2160, 15.6" | HP Envy 15-ep0098nr i7-10750H, GeForce RTX 2060 Max-Q, Intel Optane Memory H10 with Solid State Storage 32GB + 512GB HBRPEKNX0202A(L/H), AMOLED, 3840x2160, 15.6" | |
|---|---|---|---|---|---|
| Power Consumption | -1% | 7% | 23% | -21% | |
| Idle Minimum * (Watt) | 7.3 | 5.7 22% | 6 18% | 4.4 40% | 9.2 -26% |
| Idle Average * (Watt) | 10.1 | 13.5 -34% | 12.8 -27% | 9.8 3% | 14.5 -44% |
| Idle Maximum * (Watt) | 17.6 | 19.6 -11% | 16.1 9% | 14.5 18% | 18 -2% |
| Load Average * (Watt) | 106.6 | 114.1 -7% | 95.6 10% | 83 22% | 110.9 -4% |
| Witcher 3 ultra * (Watt) | 105.4 | 93 12% | 84 20% | 67 36% | 125.5 -19% |
| Load Maximum * (Watt) | 151.2 | 135.2 11% | 131.1 13% | 123 19% | 194.6 -29% |
* ... kleiner is beter
Levensduur batterij
De gebruikstijd is gemiddeld iets meer dan 6 uur bij echt WLAN-gebruik op de kleine interne batterij van 52 Wh. De concurrerende XPS 15 gaat bijna 3 uur langer mee onder vergelijkbare testomstandigheden. Het opladen van leeg naar vol gaat echter relatief snel met slechts 1 tot 1,5 uur. Generieke USB-C adapters kunnen ook worden gebruikt om het systeem op te laden, zij het in een langzamer tempo.
| MSI Stealth 15M A11SEK i7-1185G7, GeForce RTX 2060 Max-Q, 52 Wh | Dell XPS 15 9500 Core i7 4K UHD i7-10875H, GeForce GTX 1650 Ti Mobile, 86 Wh | Lenovo ThinkPad T15p-20TN0006GE i7-10750H, GeForce GTX 1050 Mobile, 68 Wh | Asus ZenBook UX535-M01440 i7-10750H, GeForce GTX 1650 Ti Max-Q, 96 Wh | MSI Prestige 15 A10SC i7-10710U, GeForce GTX 1650 Max-Q, 82 Wh | HP Envy 15-ep0098nr i7-10750H, GeForce RTX 2060 Max-Q, 83 Wh | |
|---|---|---|---|---|---|---|
| Batterijduur | 88% | 13% | 78% | 71% | 33% | |
| Reader / Idle (h) | 10.5 | 23 119% | 18.3 74% | 19.1 82% | 15 43% | |
| WiFi v1.3 (h) | 6.3 | 9.1 44% | 7.3 16% | 10.1 60% | 7.6 21% | 6 -5% |
| Load (h) | 1 | 2 100% | 1.1 10% | 2 100% | 2.1 110% | 1.6 60% |
Pro
Contra
Uitspraak
De Stealth 15M heeft een aantal pluspunten in vergelijking met andere ultradunne 15,6-inch Ultrabooks. Zijn GeForce RTX-opties stuwen het systeem meteen naar een van de snelste in zijn categorie als het op graphics aankomt. Hij slaagt er ook in lichter te zijn dan zijn concurrenten, ondanks de hogere GPU-prestaties. Temperaturen en ventilatorgeluid bij belasting zijn ook niet veel warmer of luider.
Superlicht en supersnel. De Stealth 15M kan de meeste multimedialaptops in zijn klasse overtreffen, maar hij is ook kwetsbaarder en na verloop van tijd vatbaar voor schade.
De grootste nadelen van het systeem zijn moeilijk te negeren. In het bijzonder is het chassis of skelet veel vatbaarder voor kromtrekken, buigen en kraken dan de skeletten van de XPS 15, Spectre, ZenBook, of Yoga laptops die allemaal ongeveer hetzelfde kosten als onze MSI. Dit geldt ook voor de scharnieren, die bij de MSI erg zwak zijn. Het is een geweldig uitziende laptop met gaming-level prestaties, maar de broze bouwkwaliteit heeft ons bezorgd over zijn lange levensduur.
Prijs en beschikbaarheid
MSI Stealth 15M A11SEK
- 24-02-2021 v7 (old)
Allen Ngo
Price comparison

