2022 HP Envy 16 laptop review: Voor multimedia, gamers, makers en iedereen daartussenin
De Envy 16 vervangt de 15.6-inch Envy 15 door over te stappen op een nieuwe 16-inch vormfactor naast de nieuwste Intel 12e generatie CPU's en Nvidia en Intel discrete grafische opties. In tegenstelling tot de minder dure Pavilion serie, bevat de Envy serie high-end prosumer modellen met over het algemeen hogere prestaties, minder plastic en een betere bouwkwaliteit
Onze specifieke configuratie is een high-end SKU met de Core i7-12700H, GeForce RTX 3060, en 2400p OLED touchscreen voor ongeveer $1700 USD. Andere configuraties zijn beschikbaar met de langzamere Core i5-12500H, snellere i9-12900H, Intel Arc A370M graphics, of 1600p IPS scherm variërend van $1180 tot $2380 USD
Alternatieven voor de Envy 16 zijn andere high-end prosumer laptops zoals de Dell XPS 15 serie, MacBook Pro 16,Huawei MateBook 16sof deLG Gram 16.
Meer HP beoordelingen:
Potentiële concurrenten in vergelijking
Evaluatie | Datum | Model | Gewicht | Hoogte | Formaat | Resolutie | Beste prijs |
|---|---|---|---|---|---|---|---|
| 86.9 % v7 (old) | 09-2022 | HP Envy 16 h0112nr i7-12700H, GeForce RTX 3060 Laptop GPU | 2.3 kg | 19.8 mm | 16.00" | 3840x2400 | |
| 88.4 % v7 (old) | 09-2022 | Lenovo ThinkBook 16 G4+ IAP i7-12700H, GeForce RTX 2050 Mobile | 1.8 kg | 16.5 mm | 16.00" | 2560x1600 | |
| 83.7 % v7 (old) | 06-2022 | MSI Creator Z16P B12UHST i9-12900H, GeForce RTX 3080 Ti Laptop GPU | 2.4 kg | 20.4 mm | 16.00" | 2560x1600 | |
| 82.6 % v7 (old) | 11-2021 | Dell Inspiron 16 Plus 7610-MHJ8F i7-11800H, UHD Graphics Xe 32EUs (Tiger Lake-H) | 2 kg | 19 mm | 16.00" | 3072x1920 | |
| 93.2 % v7 (old) | 11-2021 | Apple MacBook Pro 16 2021 M1 Pro M1 Pro, M1 Pro 16-Core GPU | 2.2 kg | 16.8 mm | 16.20" | 3456x2234 | |
| 86.4 % v7 (old) | 07-2022 | Huawei MateBook 16s i7 i7-12700H, Iris Xe G7 96EUs | 2 kg | 17.8 mm | 16.00" | 2520x1680 |
Dezelfde kleuren met veel aanpassingen
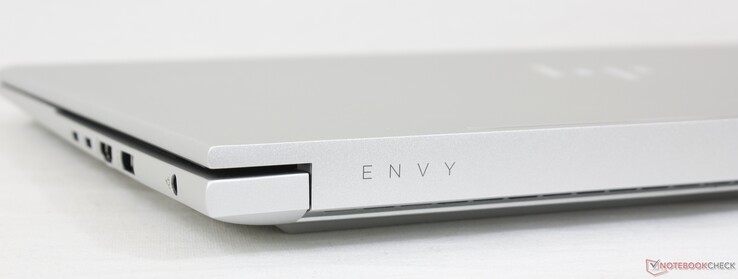
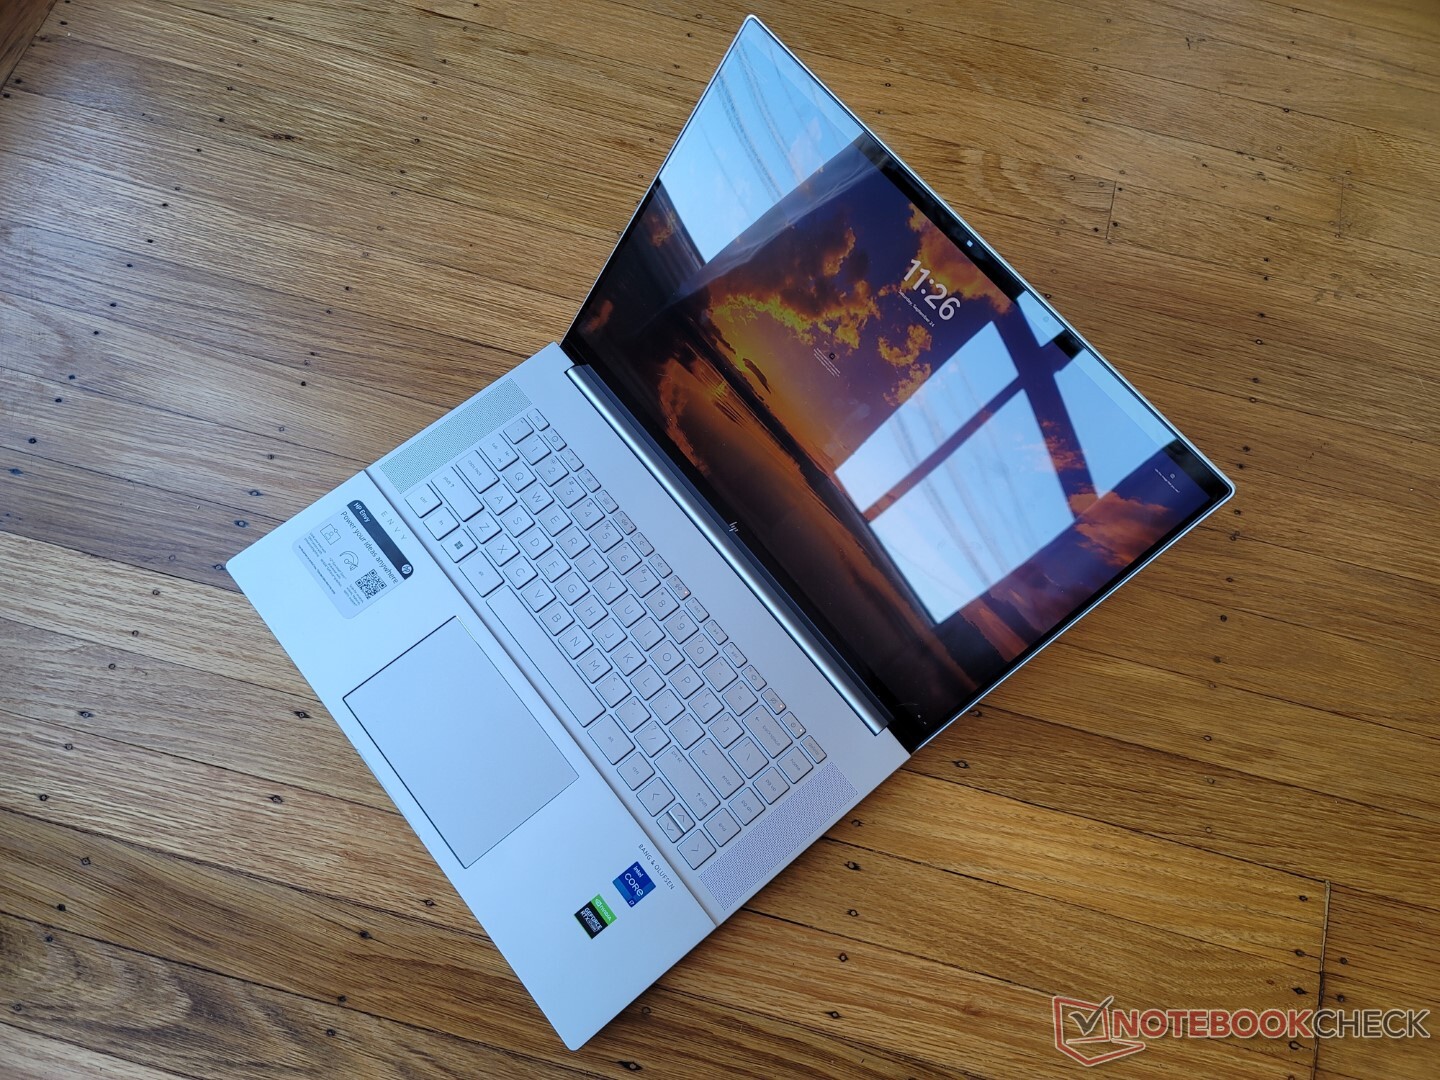
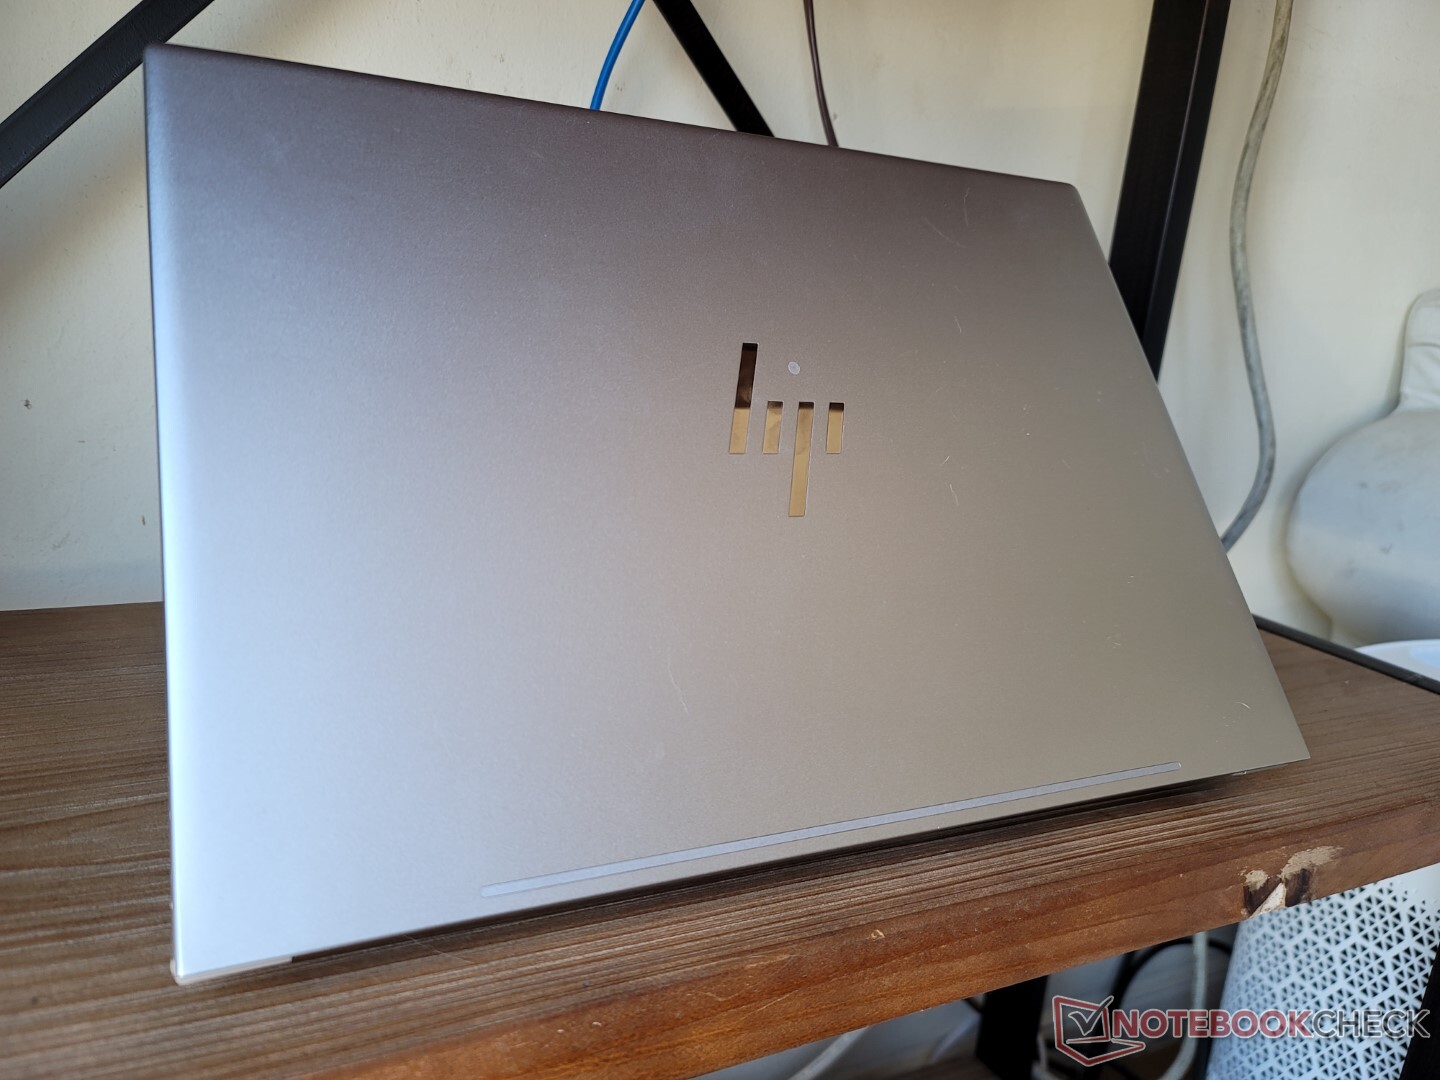
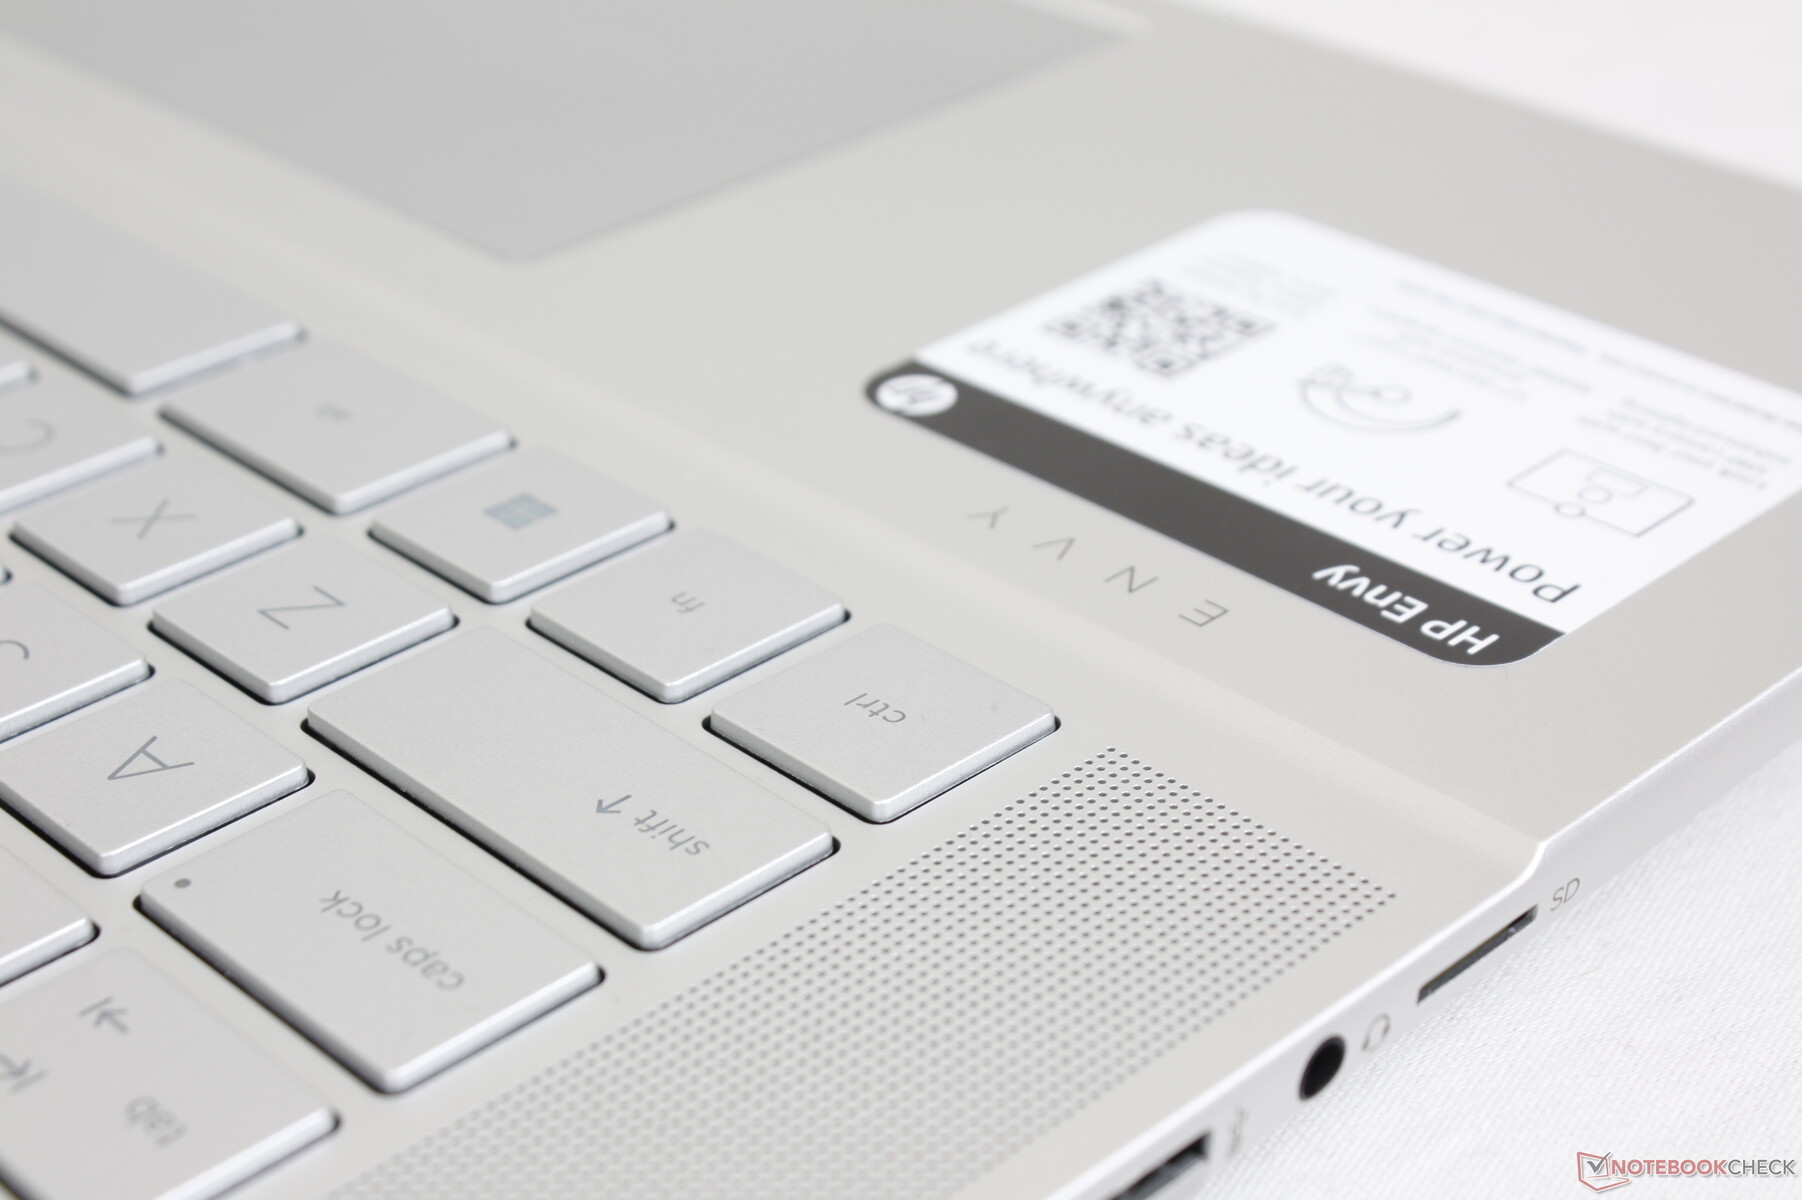
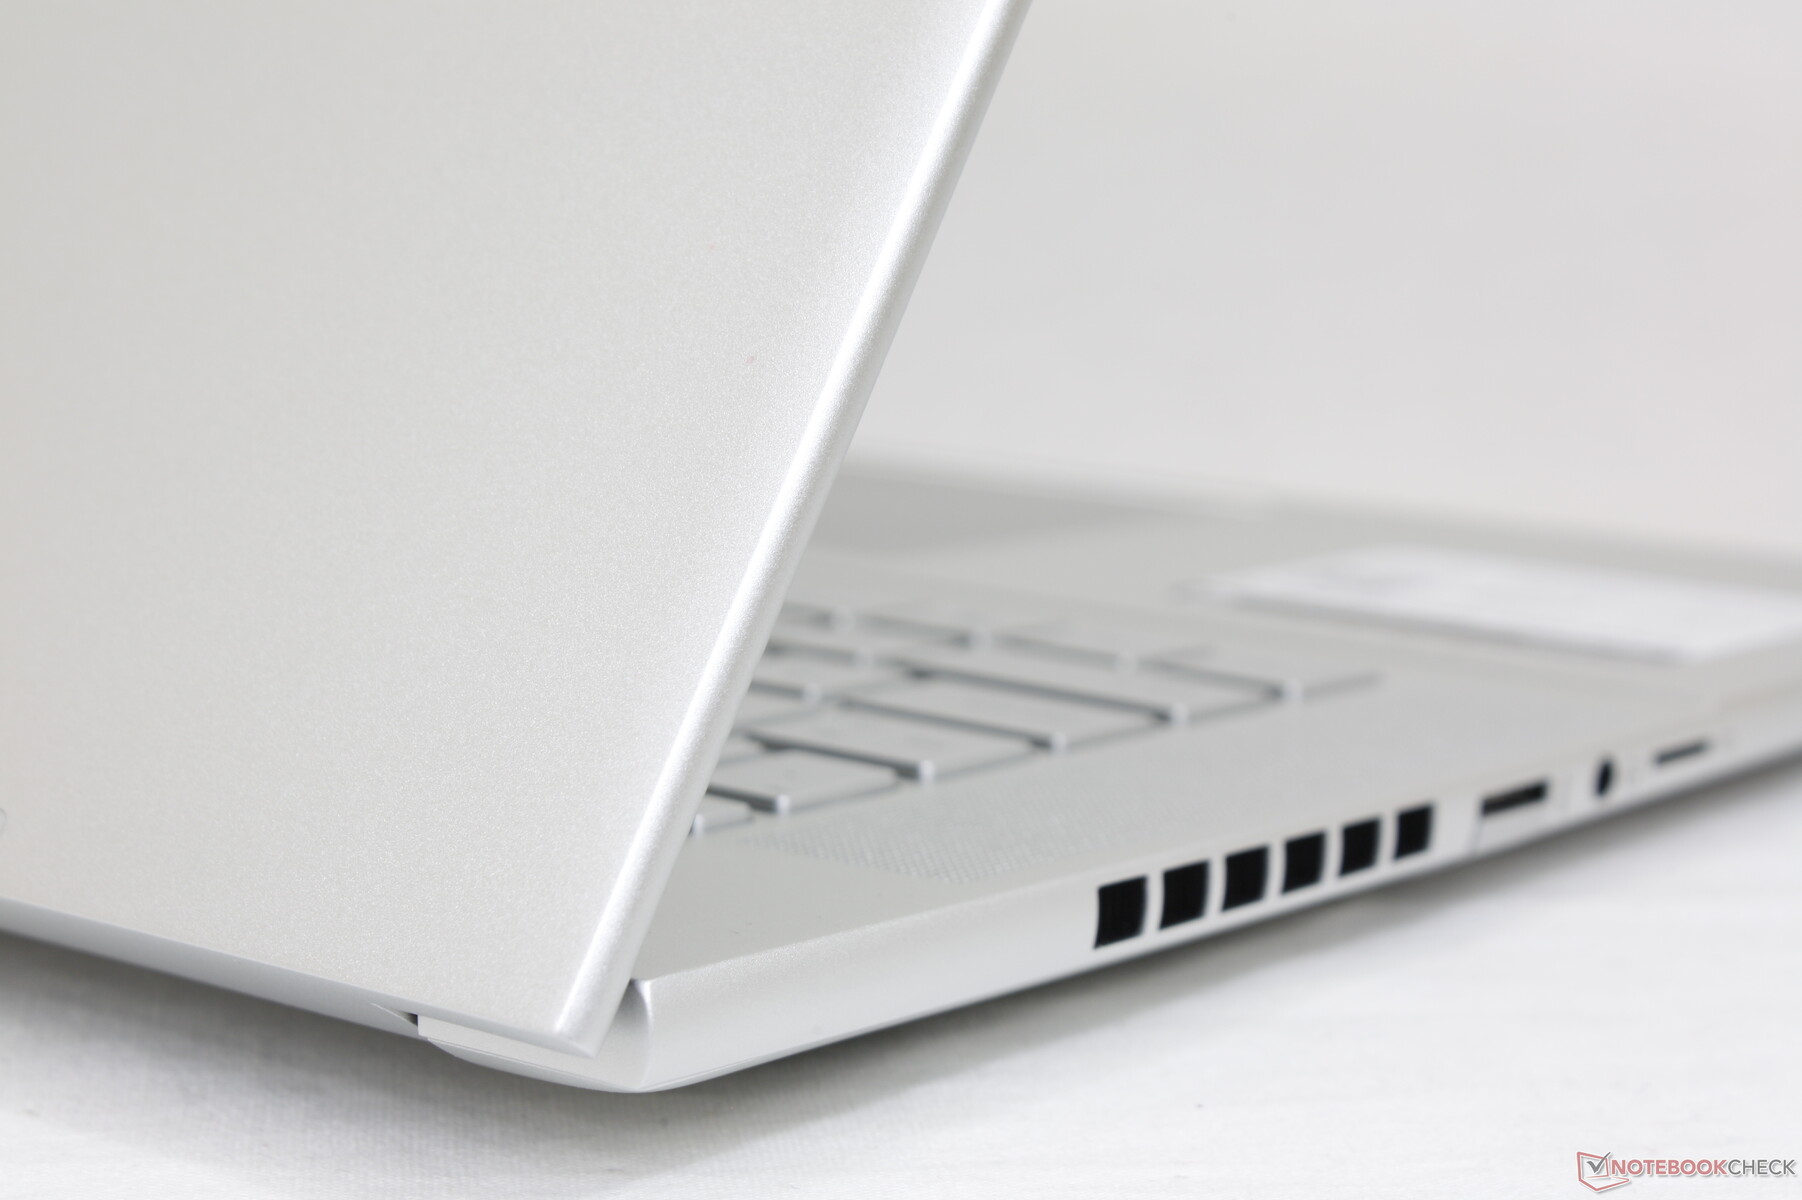
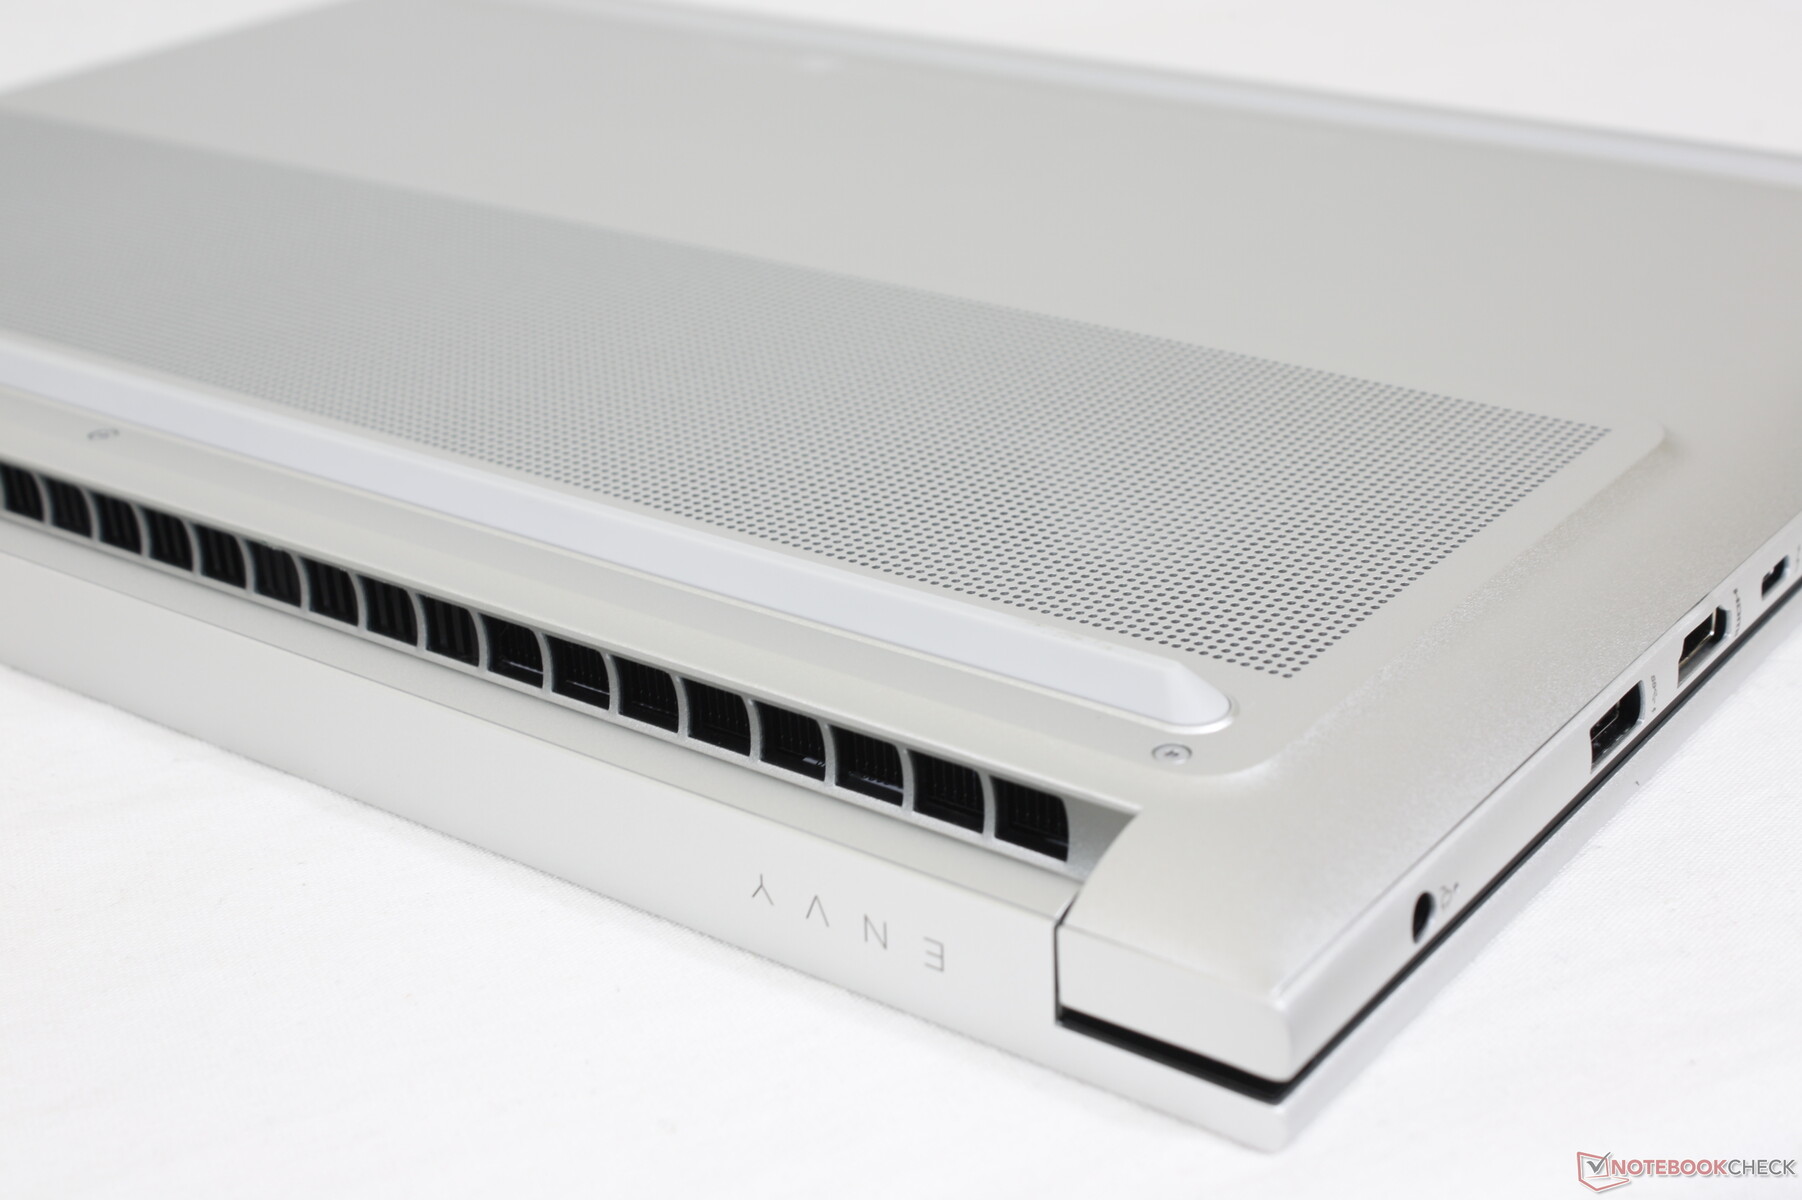
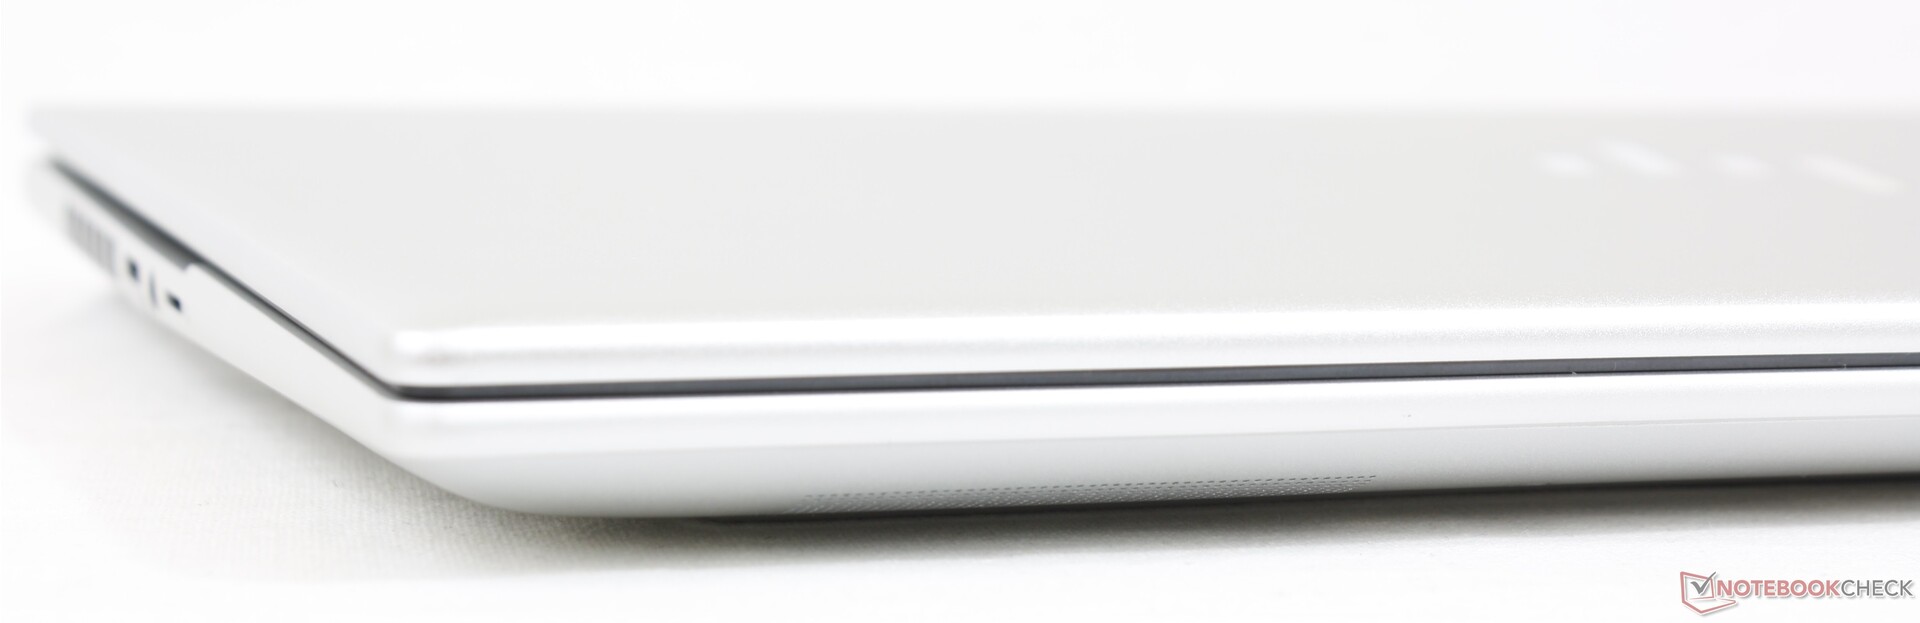
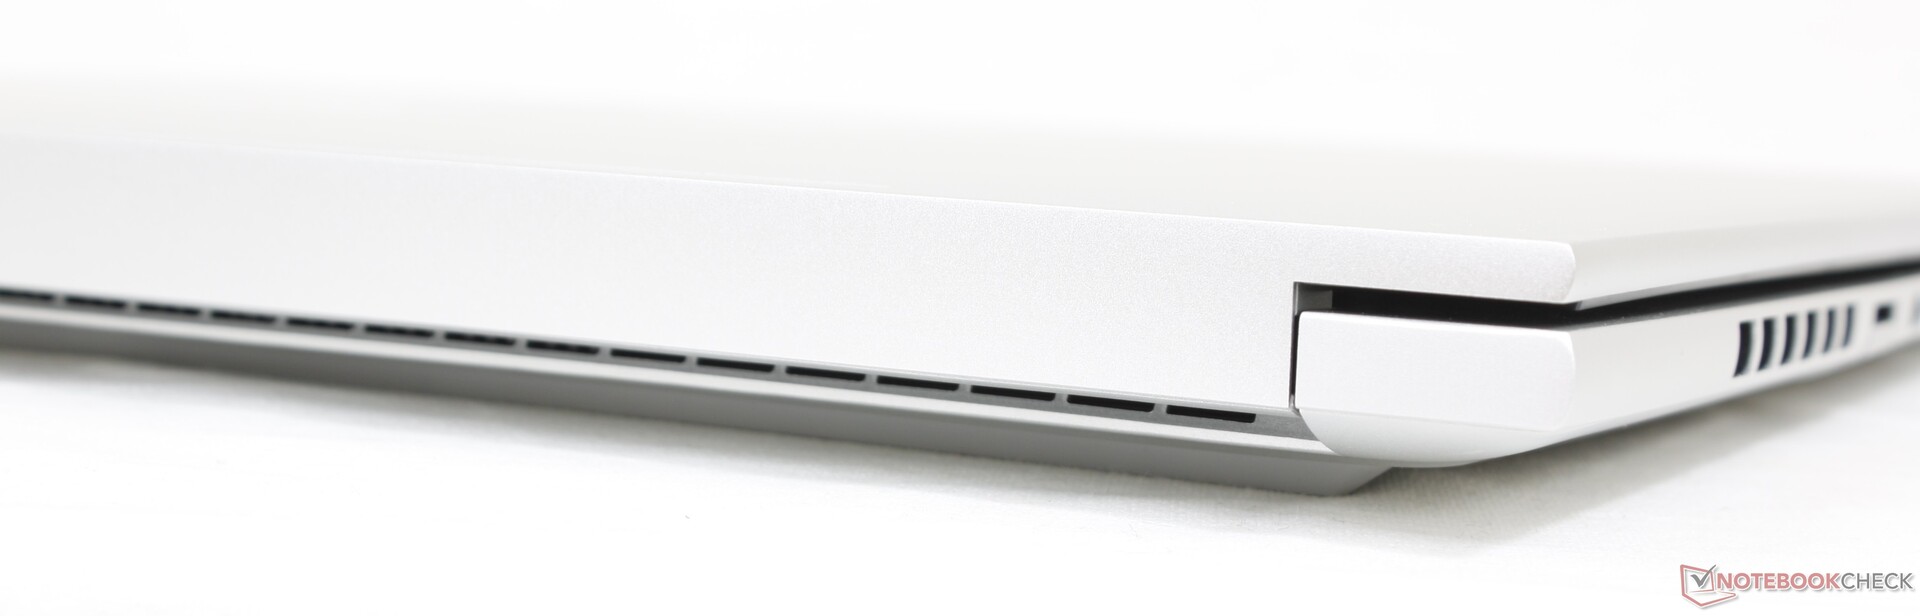
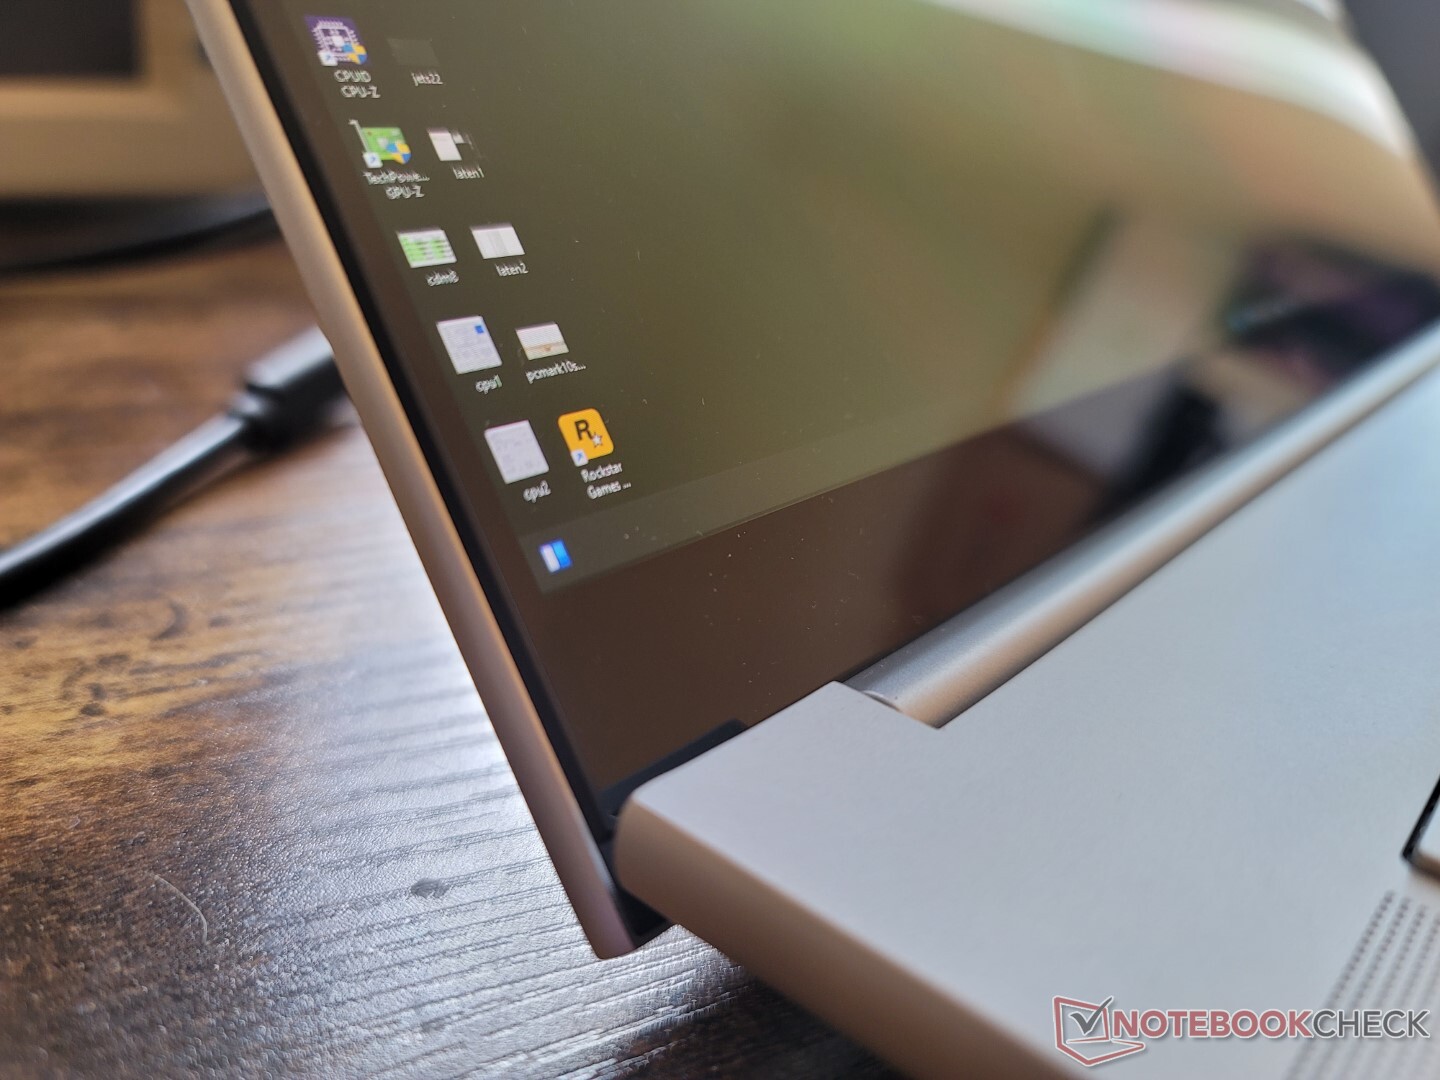
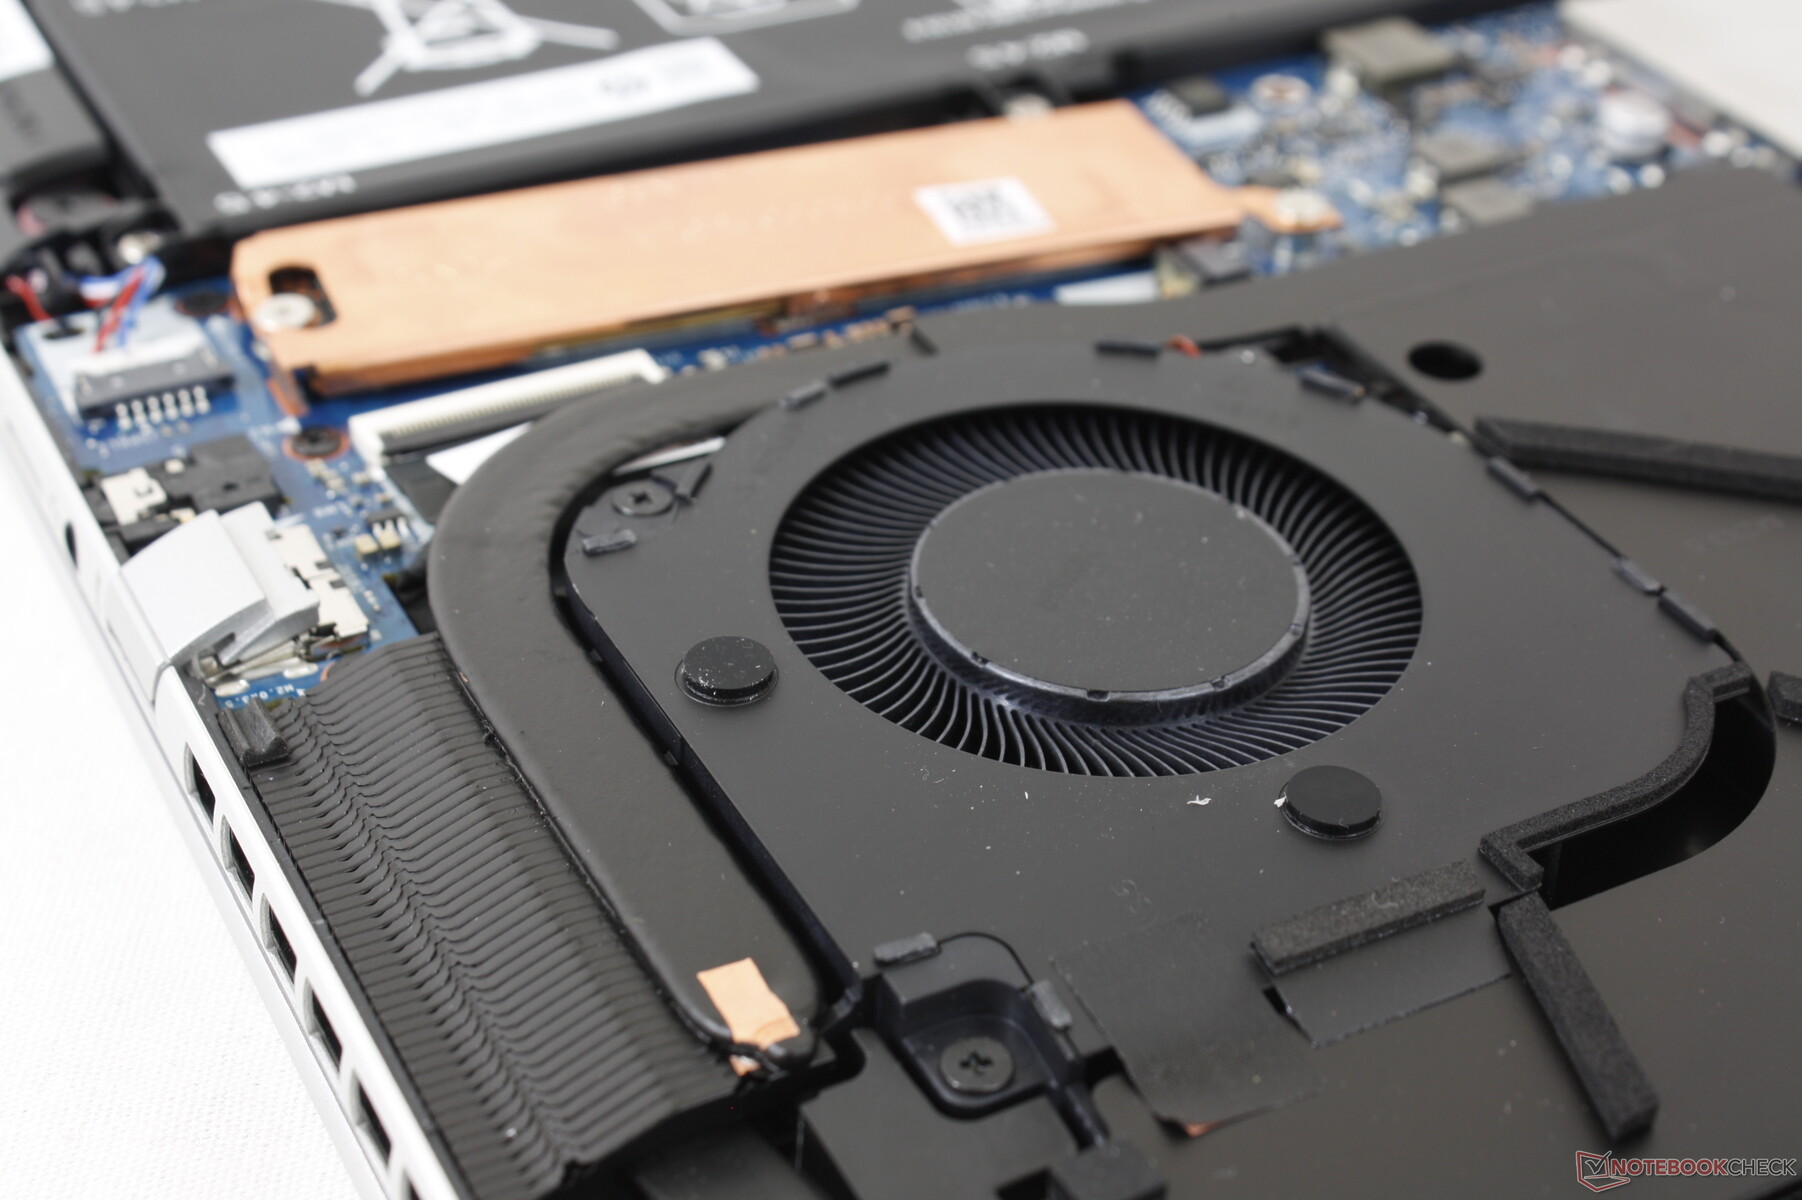
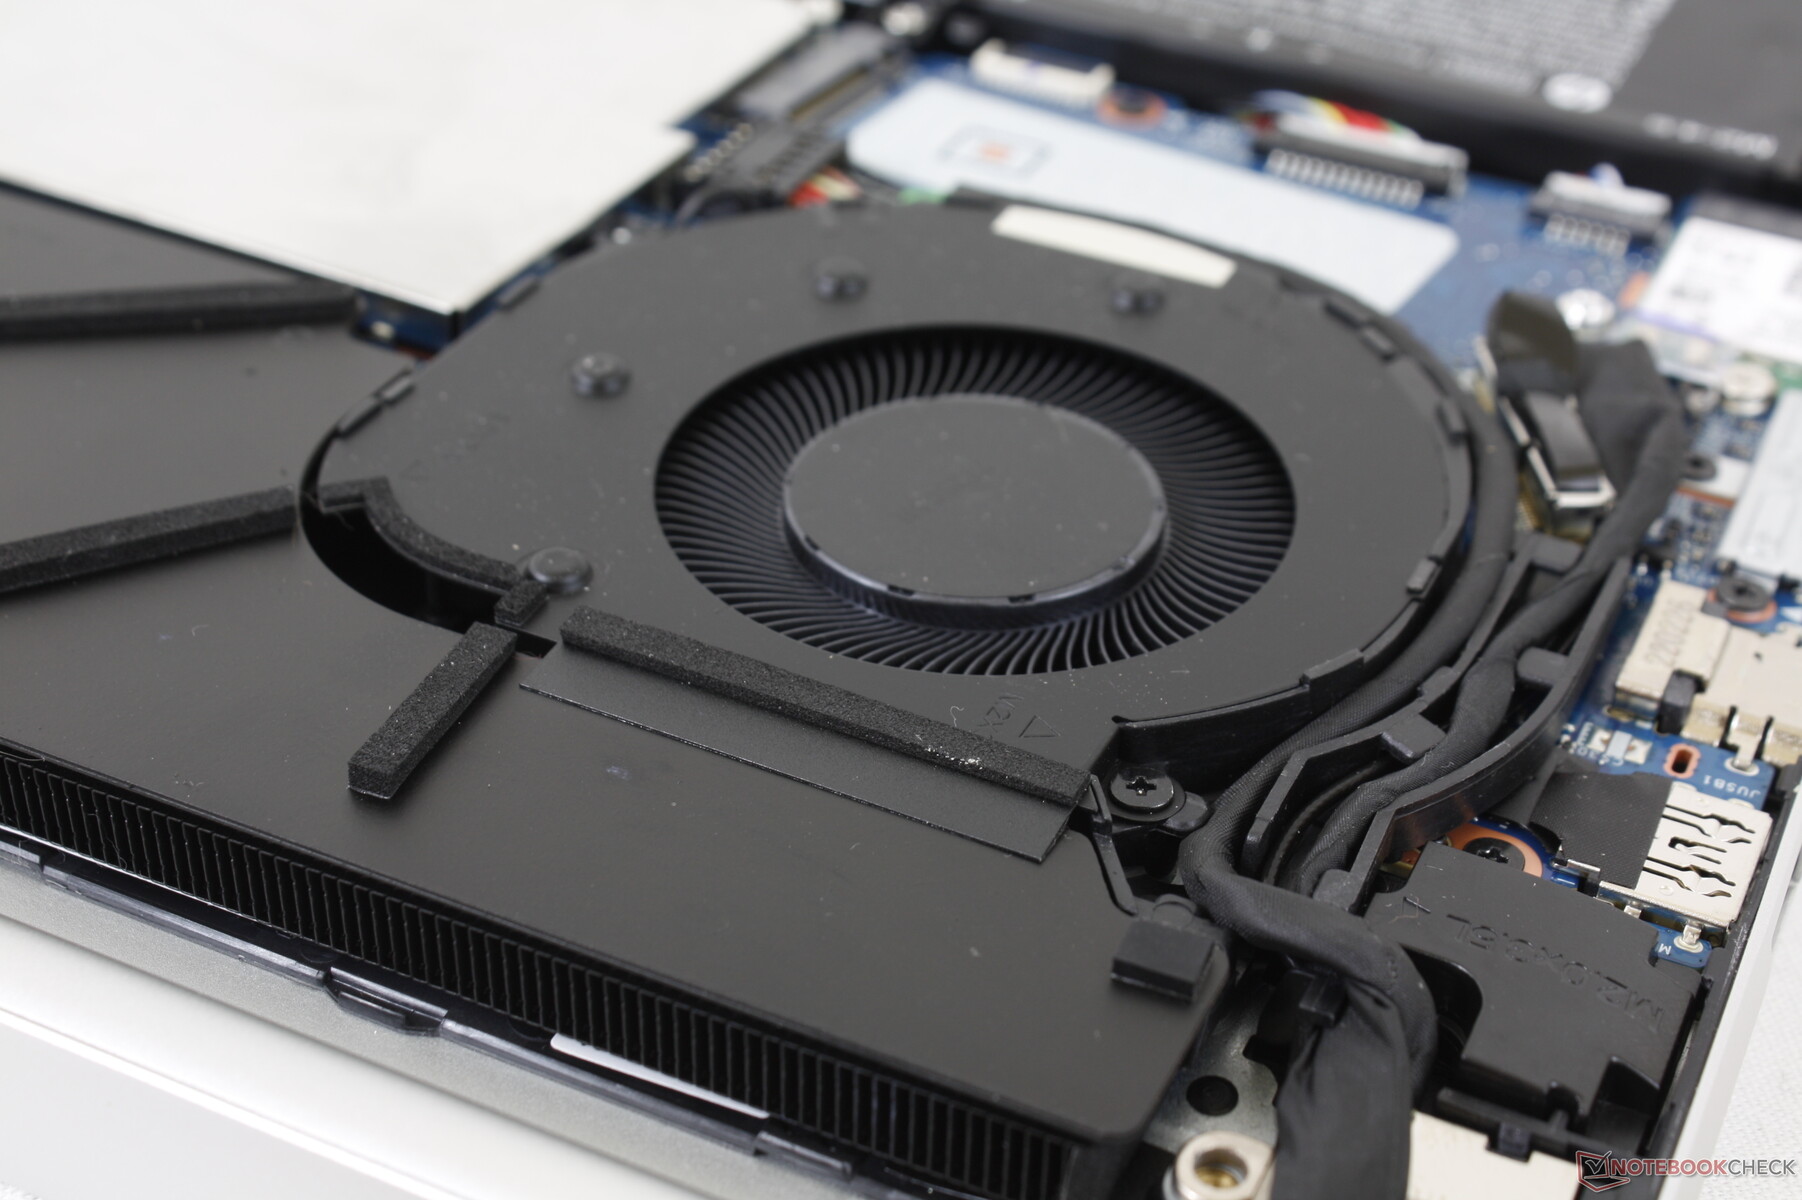
De Envy 16 kan op het eerste gezicht lijken op de Envy 15 vanwege de vergelijkbare kleurstellingen, maar er zijn in feite tal van veranderingen, zowel van binnen als van buiten. Het meest opvallende is dat de Envy 16 ronder is langs de randen en hoeken in tegenstelling tot het scherpere en plattere Envy 15 ontwerp. Ondertussen is het ventilatiegedeelte van het onderpaneel verhoogd in plaats van plat, zoals de foto's hieronder laten zien. De palmsteun en luidsprekerroosters zijn ook opnieuw ontworpen. Sommige van deze veranderingen lijken oppervlakkig, terwijl andere de koelingsmogelijkheden van het model moeten verbeteren.
De kwaliteit van het chassis blijft even sterk als de 2020 Envy 15 ondanks de grootte toename. De basis vertoont slechts een kleine verdraaiing en kromming en het deksel is vrij stijf vanwege het glas van rand tot rand en de aluminium achterkant. De scharnieren hadden echter stijver kunnen zijn, omdat het deksel meer wankelt bij het aanpassen van hoeken dan bij de ZenBook Pro serie of Razer Blade 15.
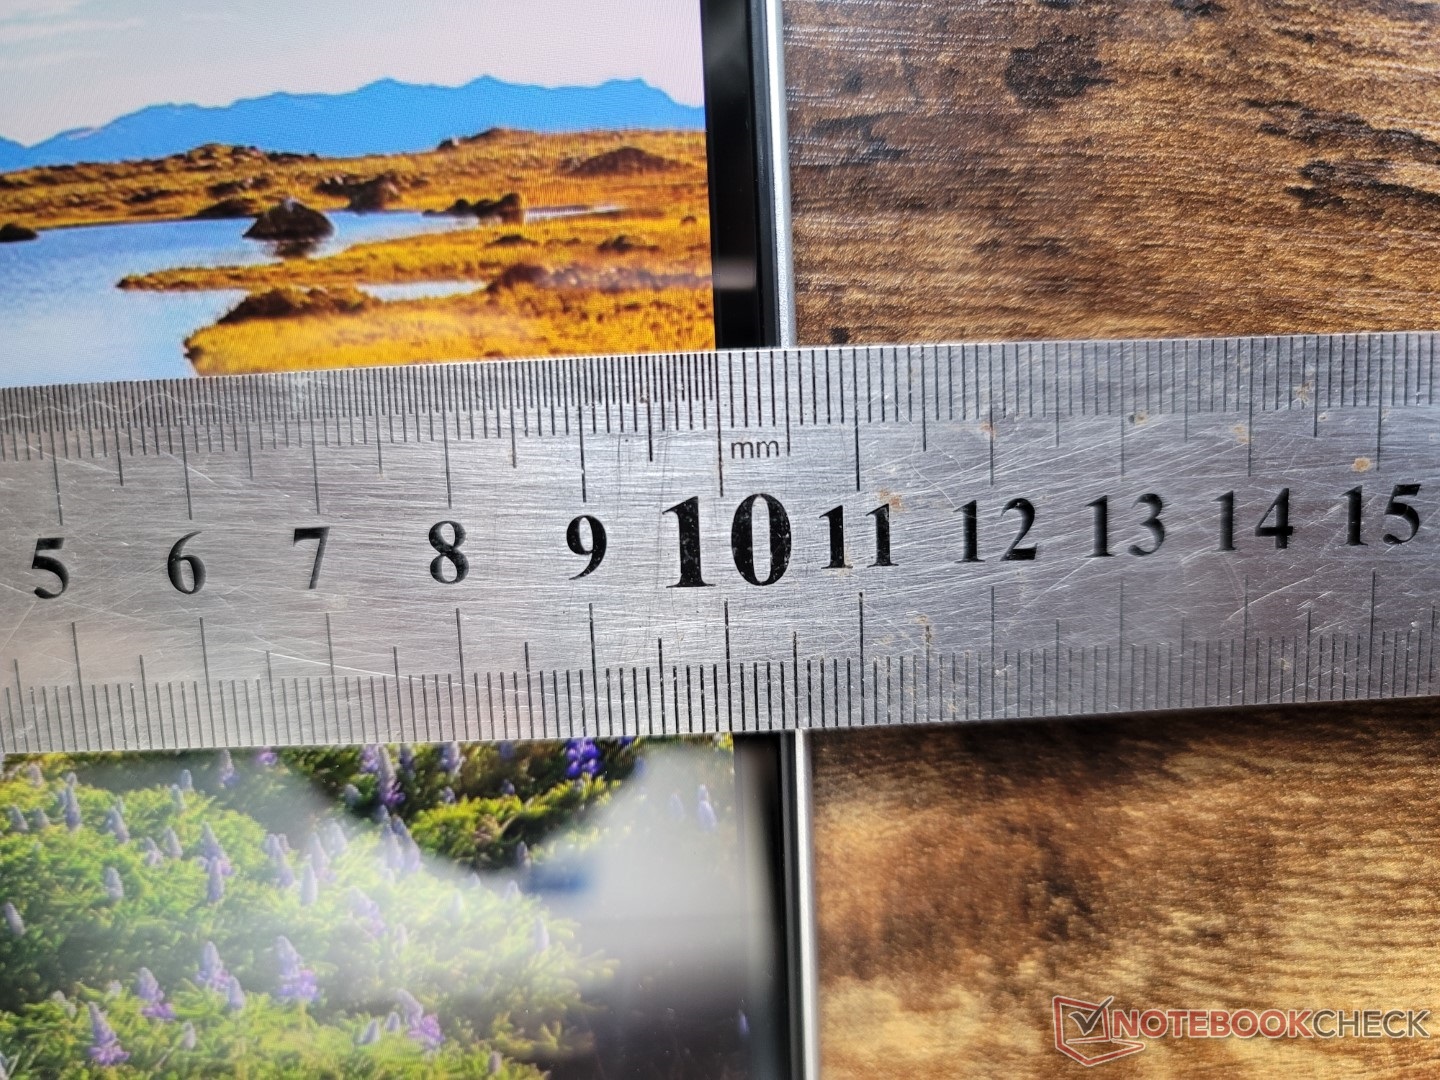
Het 2022-model is dikker, zwaarder en groter dan het 2020-model, zoals blijkt uit de onderstaande vergelijkingstabel. Het grotere formaat is misschien niet onverwacht gezien de sprong van een 15,6-inch vormfactor naar een 16-inch vormfactor. Toch is de HP nog steeds iets groter en zwaarder dan veel concurrerende 16-inch multimedia laptops, waaronder de MacBook Pro 16, Huawei MateBook 16s, ofDell Inspiron 16 Plus 7610.
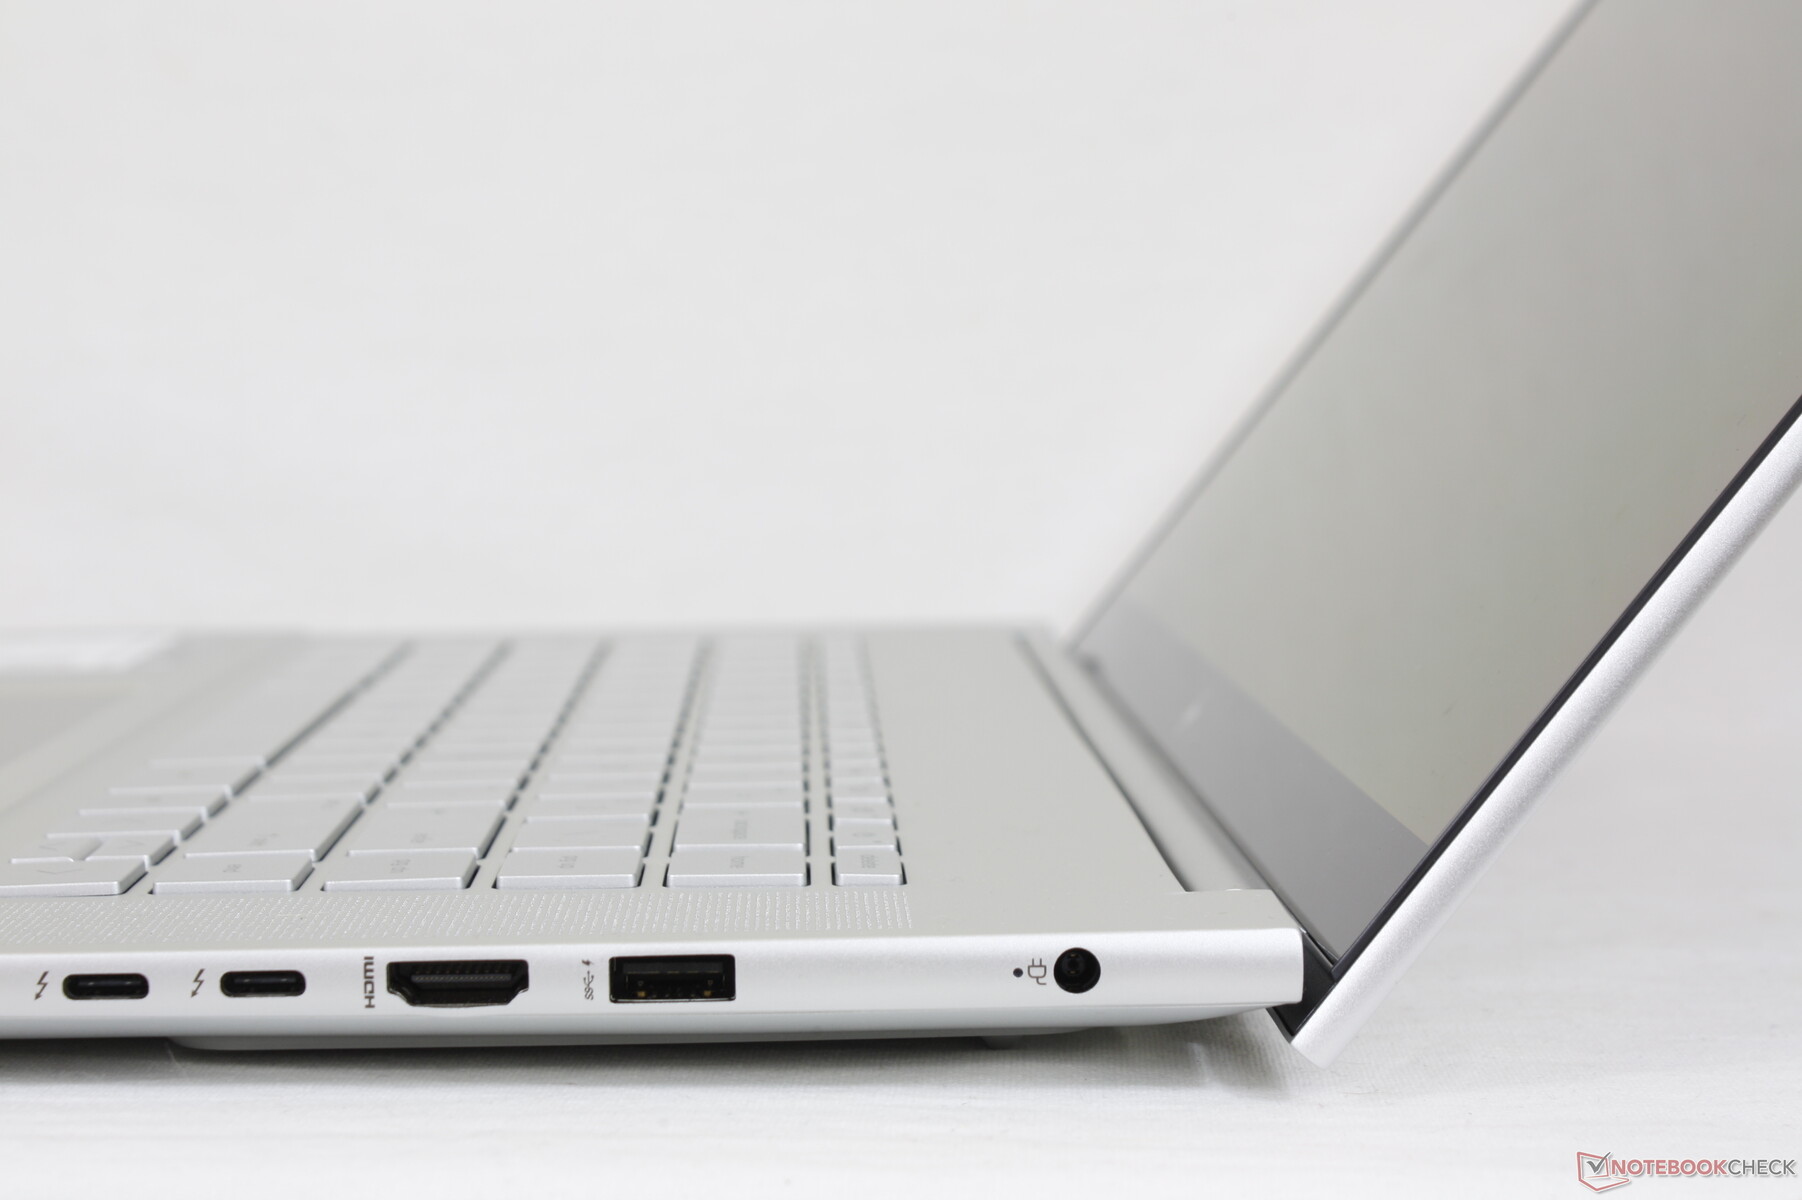
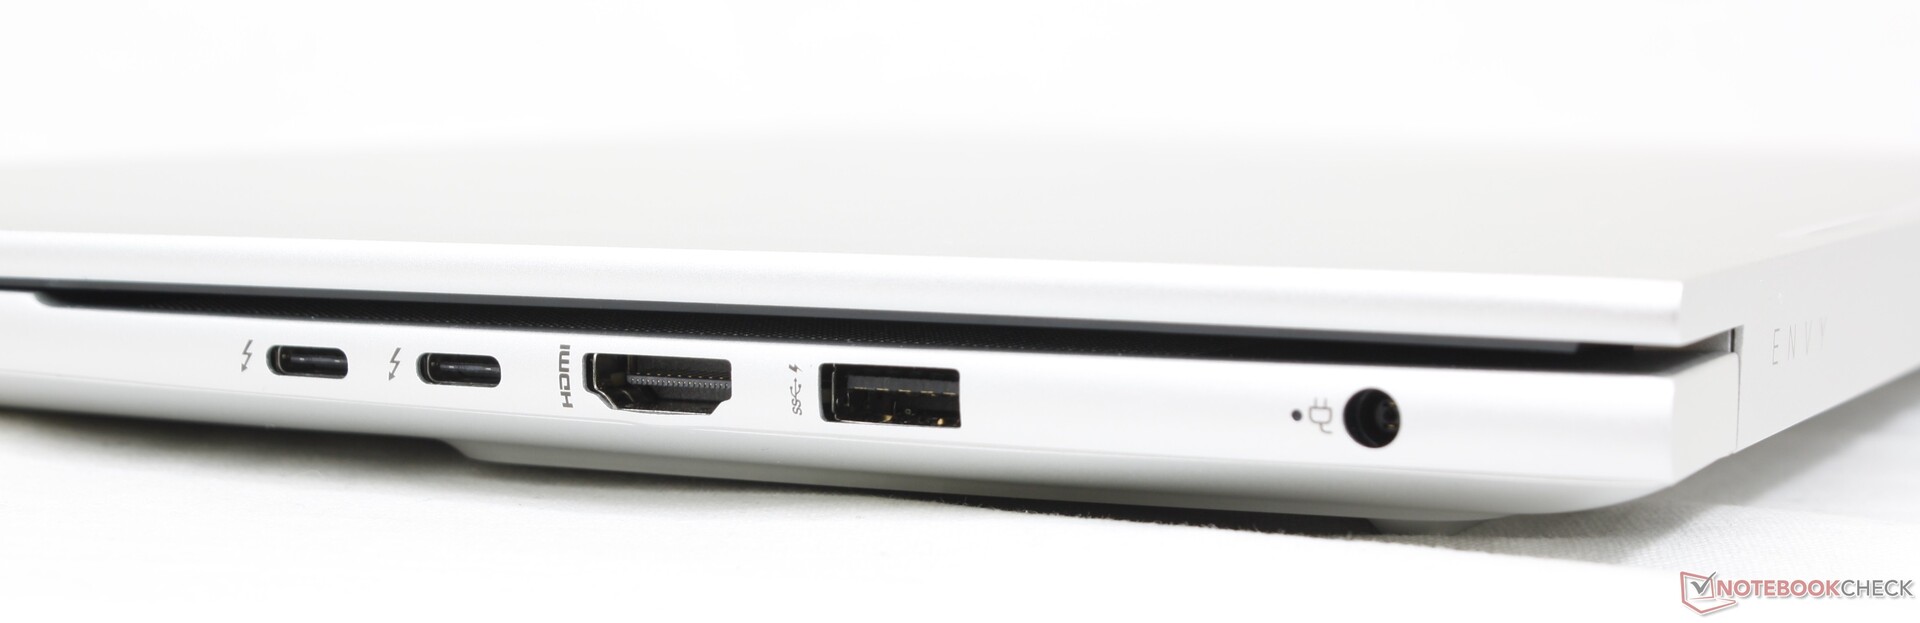
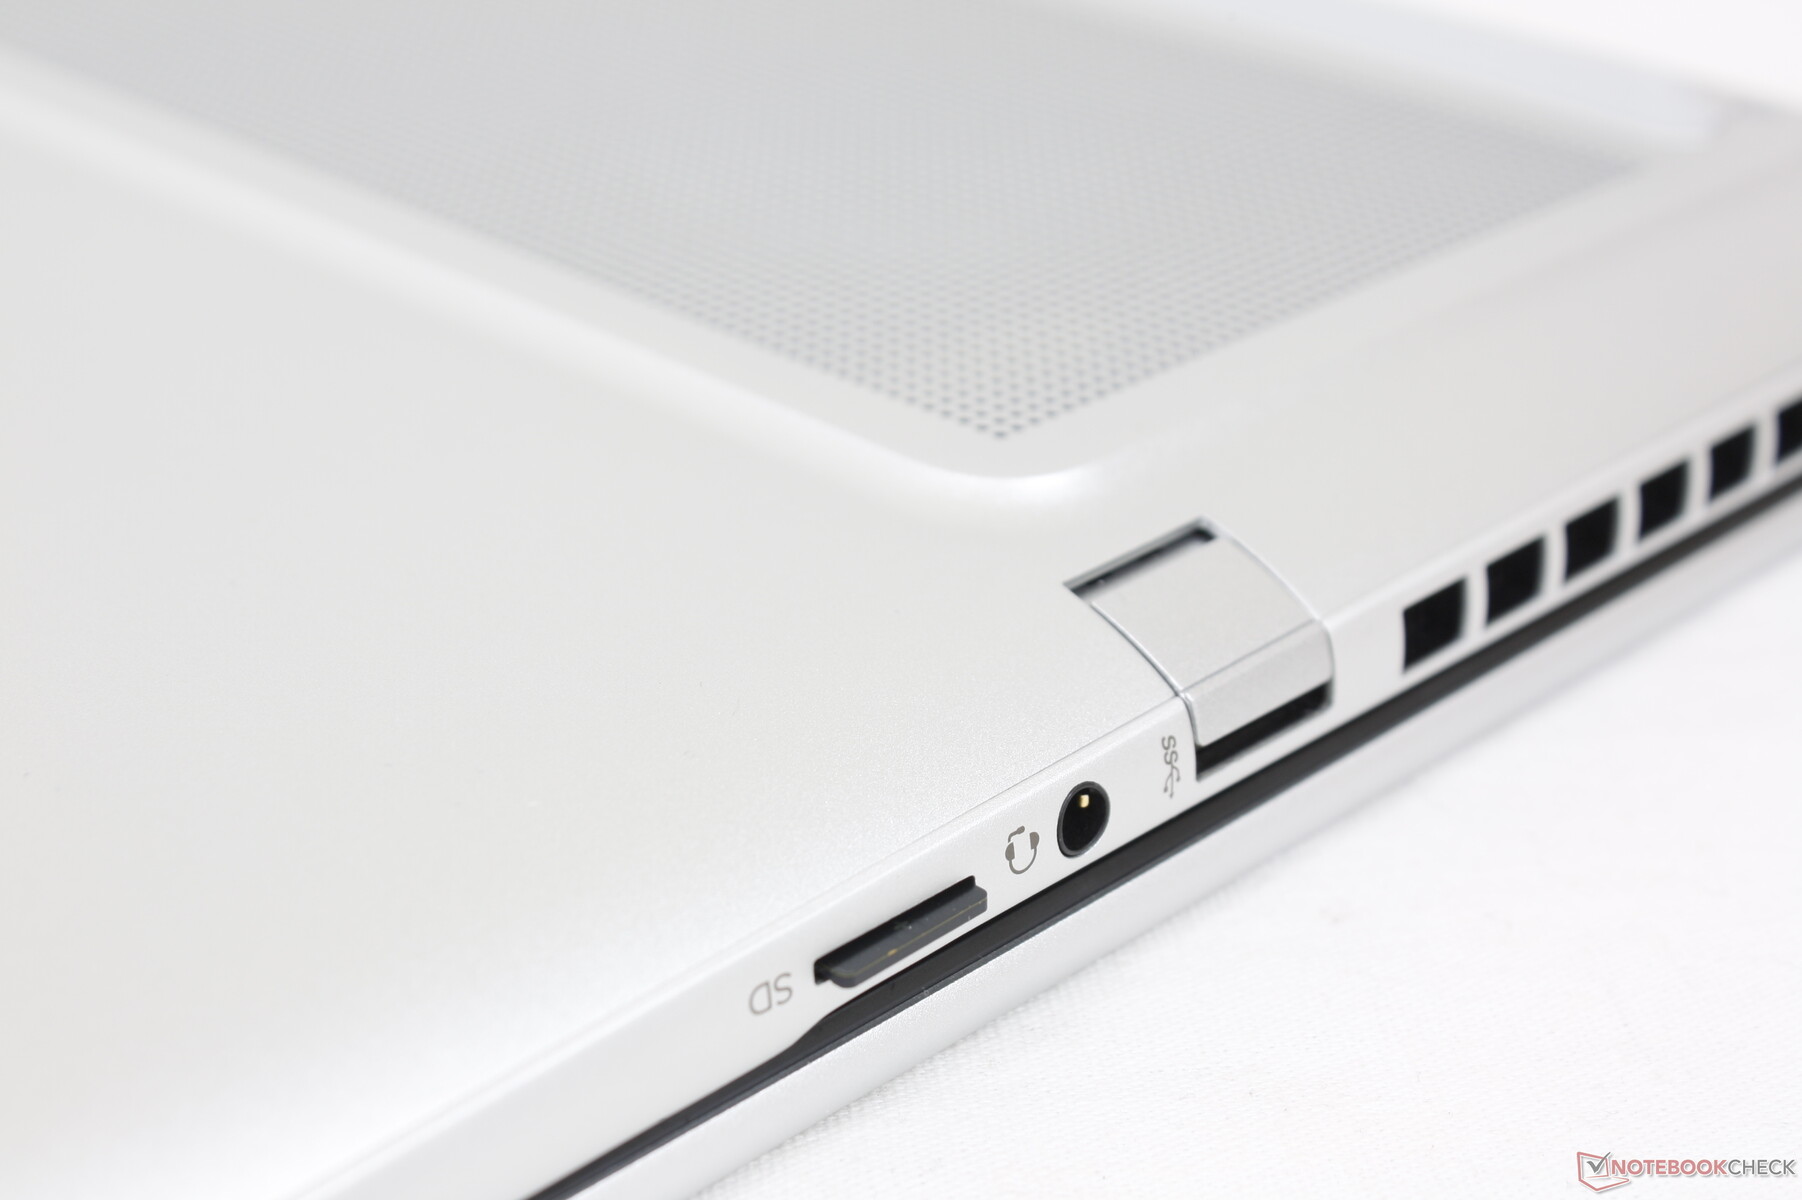
Connectiviteit - Thunderbolt 4-ondersteuning standaard
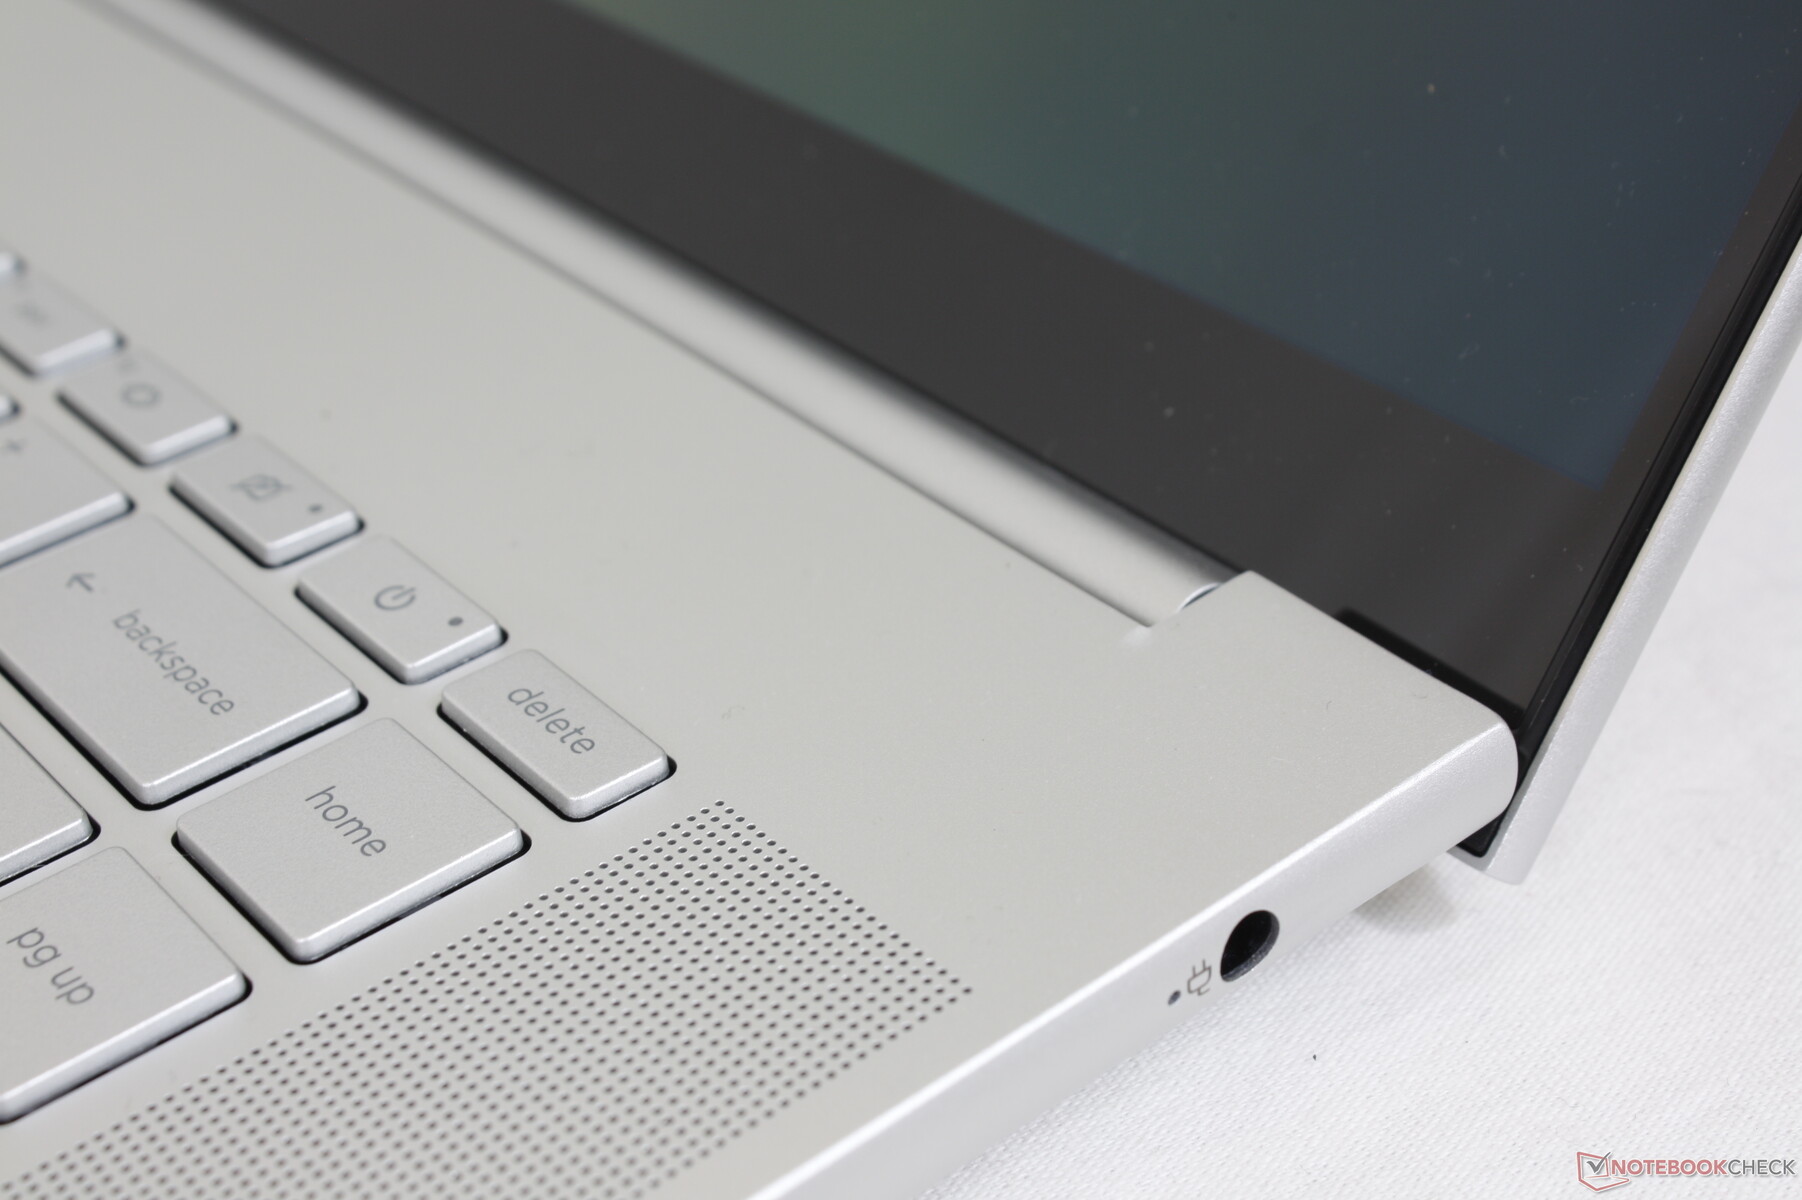
Alle poorten van de 2020 Envy 15 zijn teruggekeerd op deze 2022 herziening, zij het herschikt. De meeste poorten zitten nu aan de rechterkant van het chassis in plaats van aan de linkerkant. Er is vervelend genoeg nog steeds geen Kensington slot.
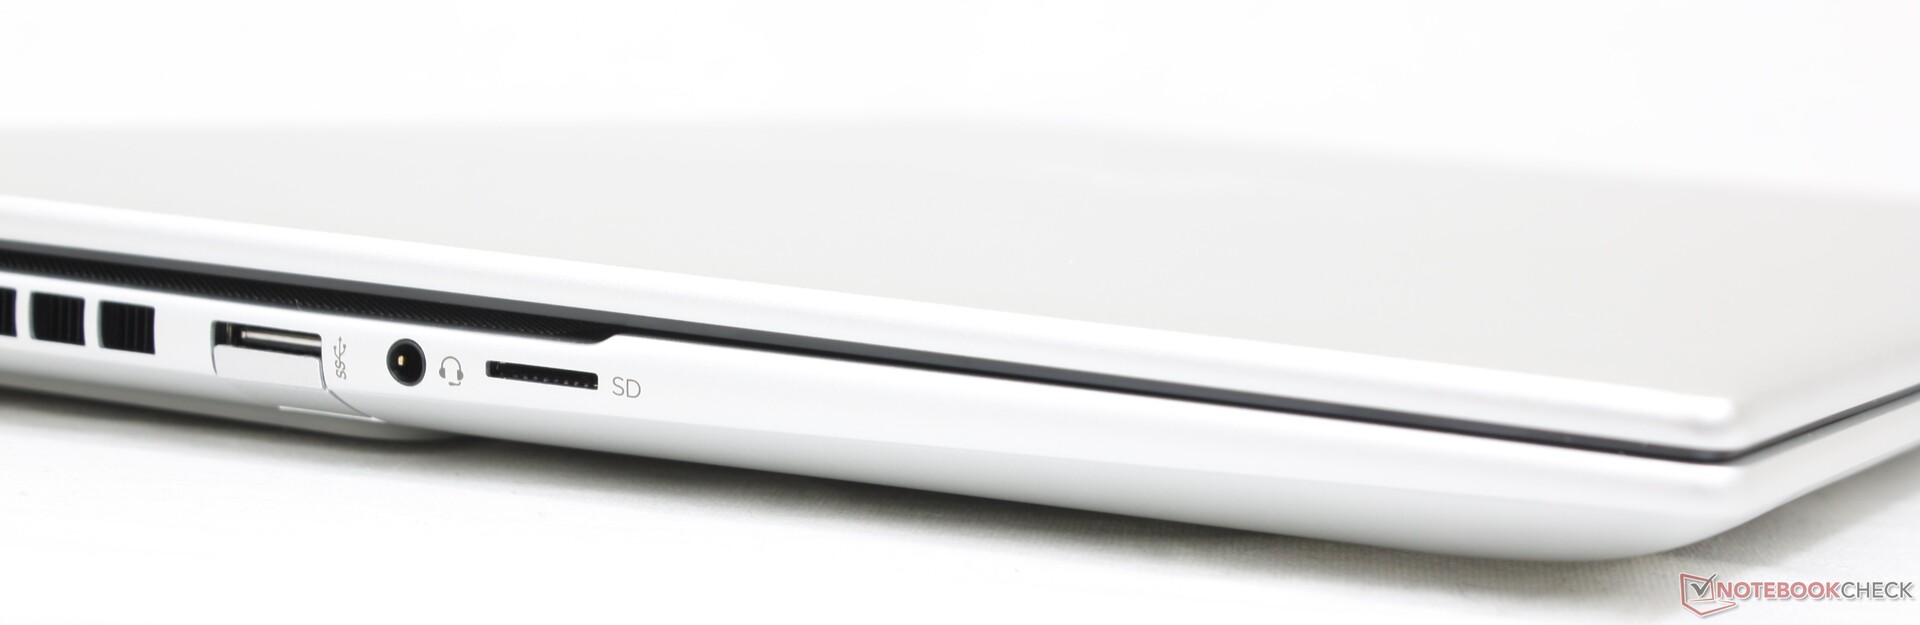
SD-kaartlezer
De overdrachtsnelheden van de geïntegreerde MicroSD-lezer zijn gemiddeld. Het verplaatsen van 1 GB aan foto's van onze UHS-II testkaart naar het bureaublad duurt ongeveer 17 seconden.
| SD Card Reader | |
| average JPG Copy Test (av. of 3 runs) | |
| Apple MacBook Pro 16 2021 M1 Pro (Angelbird AV Pro V60) | |
| Lenovo ThinkBook 16 G4+ IAP (Angelbird AV Pro V60) | |
| MSI Creator Z16P B12UHST (AV PRO microSD 128 GB V60) | |
| HP Envy 16 h0112nr (AV Pro SD microSD 128 GB V60) | |
| Dell Inspiron 16 Plus 7610-MHJ8F (AV Pro SD microSD 128 GB V60) | |
| maximum AS SSD Seq Read Test (1GB) | |
| Lenovo ThinkBook 16 G4+ IAP (Angelbird AV Pro V60) | |
| HP Envy 16 h0112nr (AV Pro SD microSD 128 GB V60) | |
| Dell Inspiron 16 Plus 7610-MHJ8F (AV Pro SD microSD 128 GB V60) | |
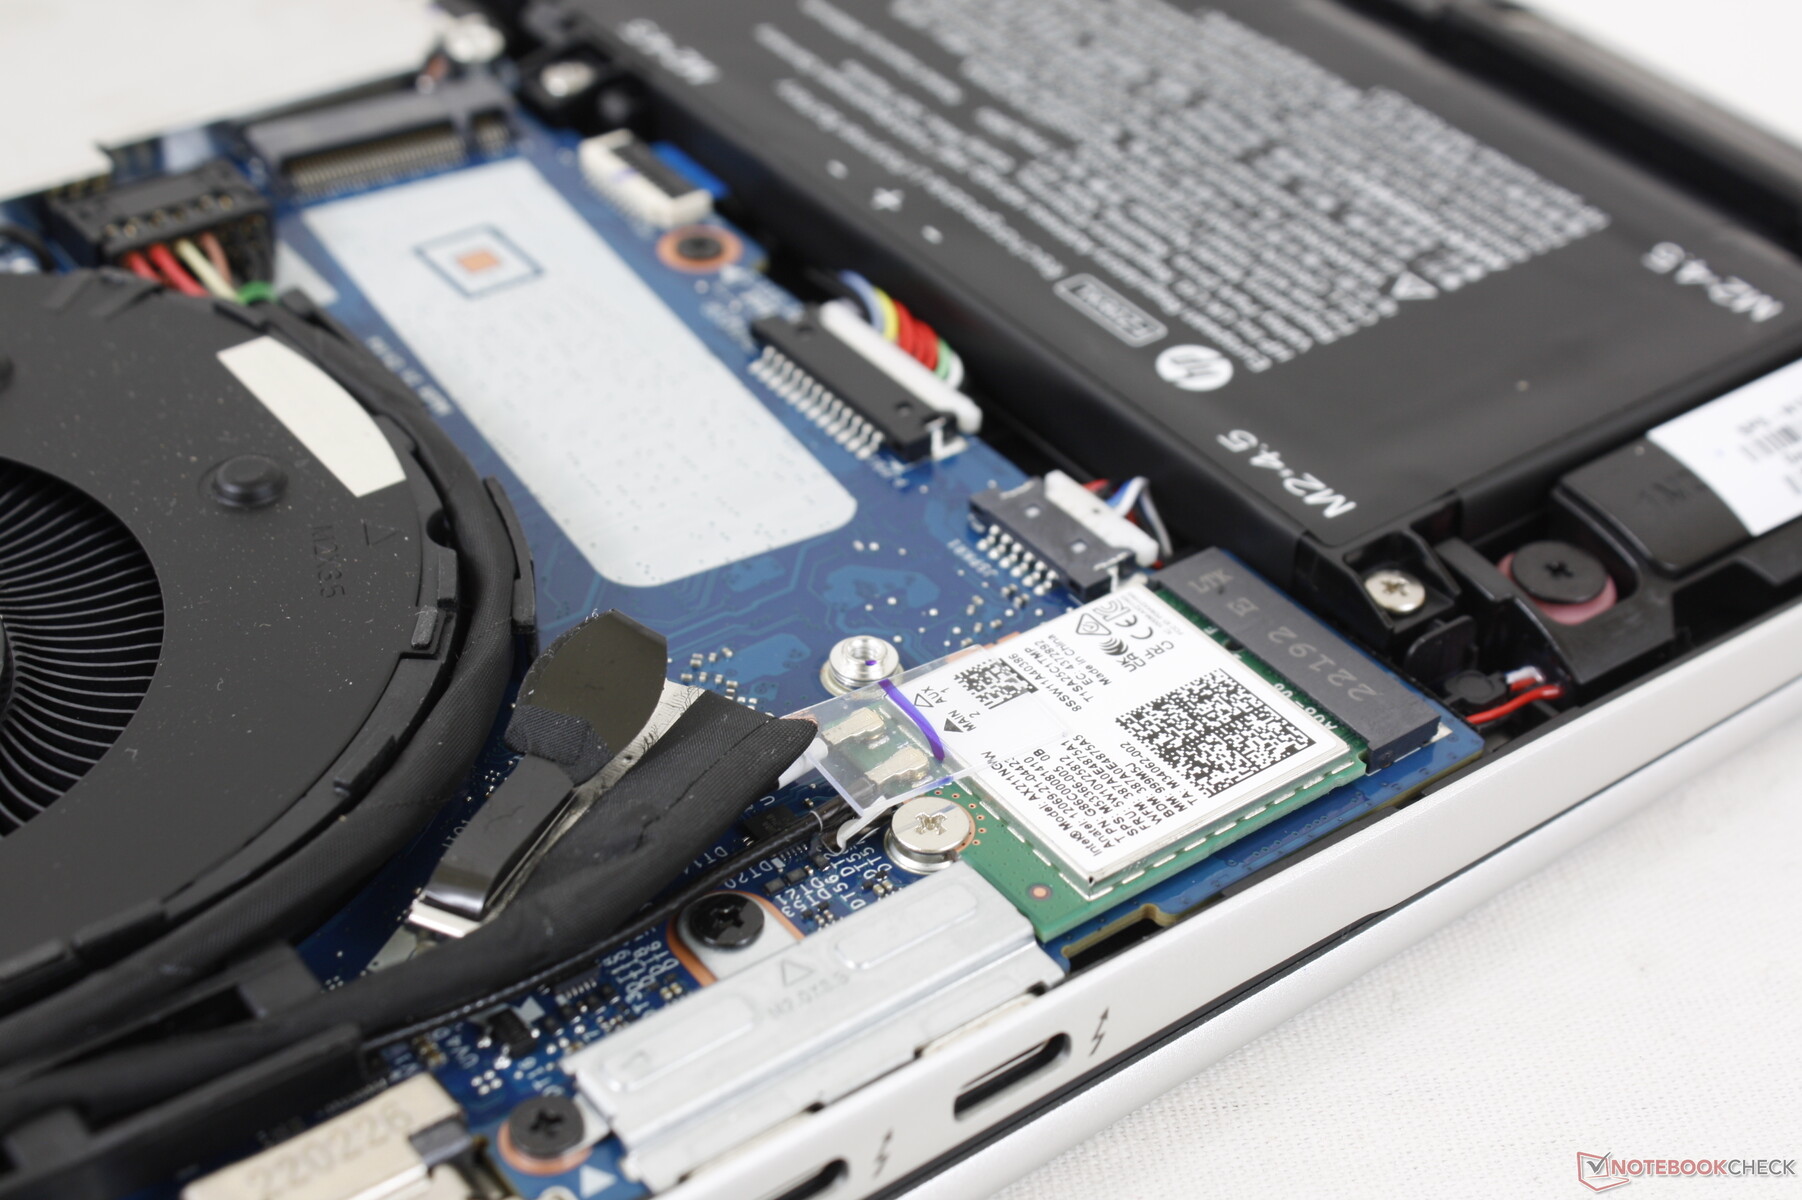
Communicatie
Een Intel AX211 wordt standaard geleverd voor Wi-Fi 6E en Bluetooth 5.2 connectiviteit. We ondervonden geen betrouwbaarheidsproblemen bij het koppelen aan ons 6 GHz netwerk.
| Networking | |
| iperf3 transmit AX12 | |
| Dell Inspiron 16 Plus 7610-MHJ8F | |
| Apple MacBook Pro 16 2021 M1 Pro | |
| iperf3 receive AX12 | |
| Dell Inspiron 16 Plus 7610-MHJ8F | |
| Apple MacBook Pro 16 2021 M1 Pro | |
| iperf3 receive AXE11000 6GHz | |
| Huawei MateBook 16s i7 | |
| HP Envy 16 h0112nr | |
| iperf3 receive AXE11000 | |
| MSI Creator Z16P B12UHST | |
| Lenovo ThinkBook 16 G4+ IAP | |
| Apple MacBook Pro 16 2021 M1 Pro | |
| iperf3 transmit AXE11000 6GHz | |
| Huawei MateBook 16s i7 | |
| HP Envy 16 h0112nr | |
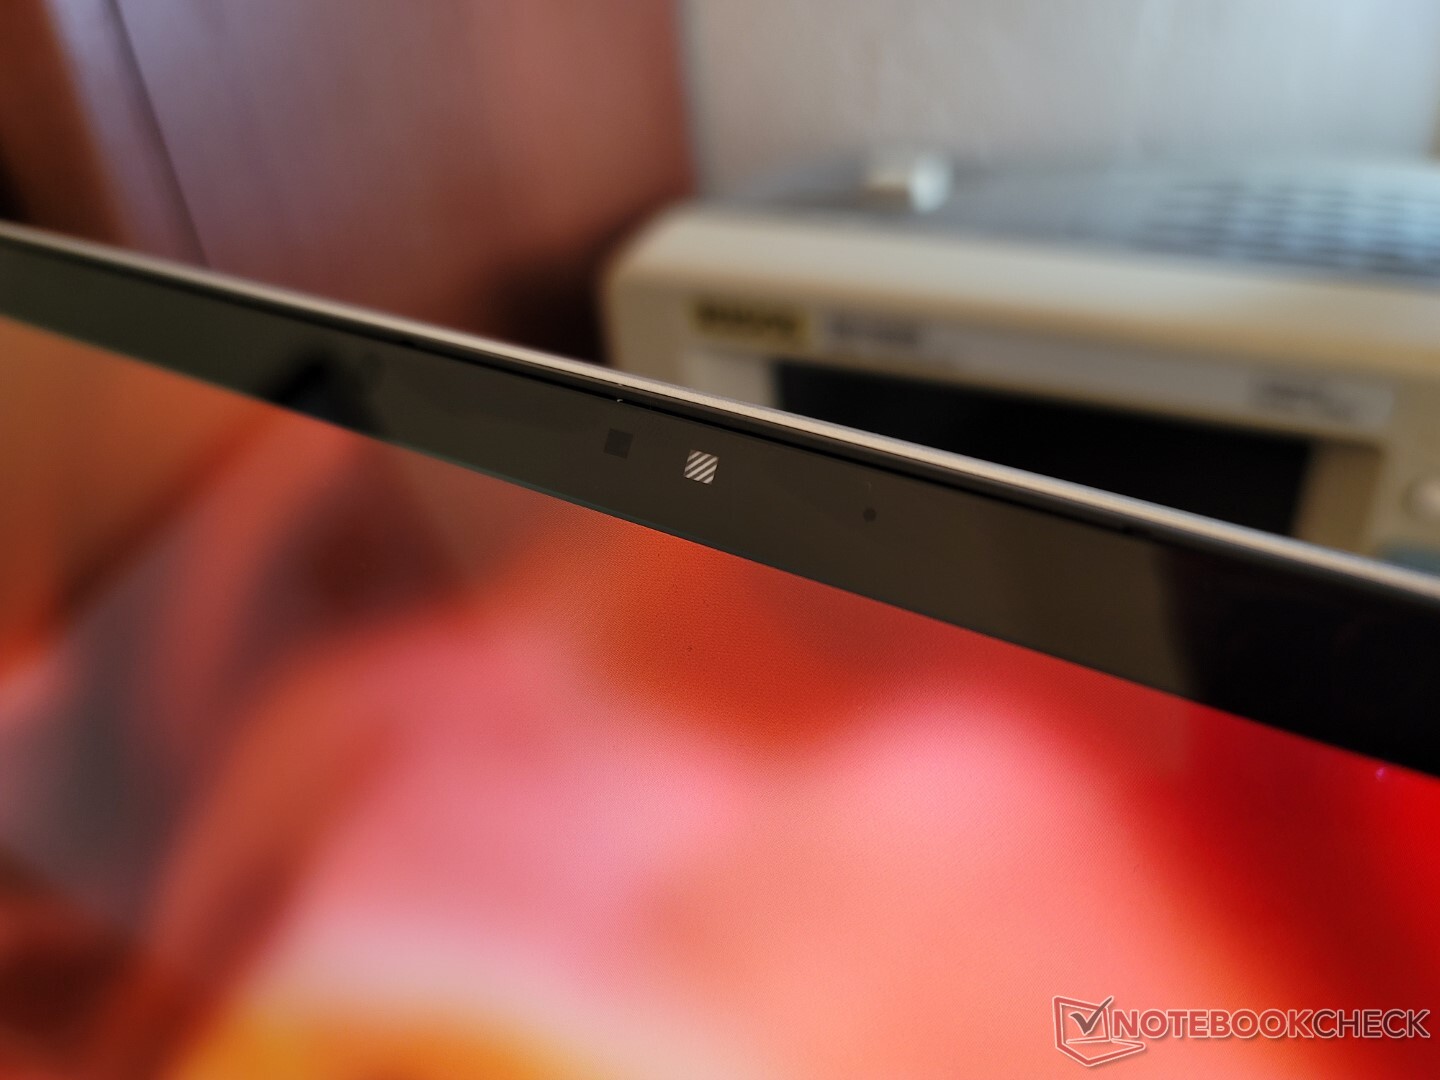
Webcam - 5 MP!
Het systeem integreert een 5 MP camera vergelijkbaar met de nieuwste Spectre en EliteBook modellen. De beeldkwaliteit is merkbaar scherper dan op de meeste andere laptops waar 1 MP en 2 MP webcams nog steeds de norm zijn.
Een webcam shutter is standaard, evenals IR voor Hello ondersteuning.


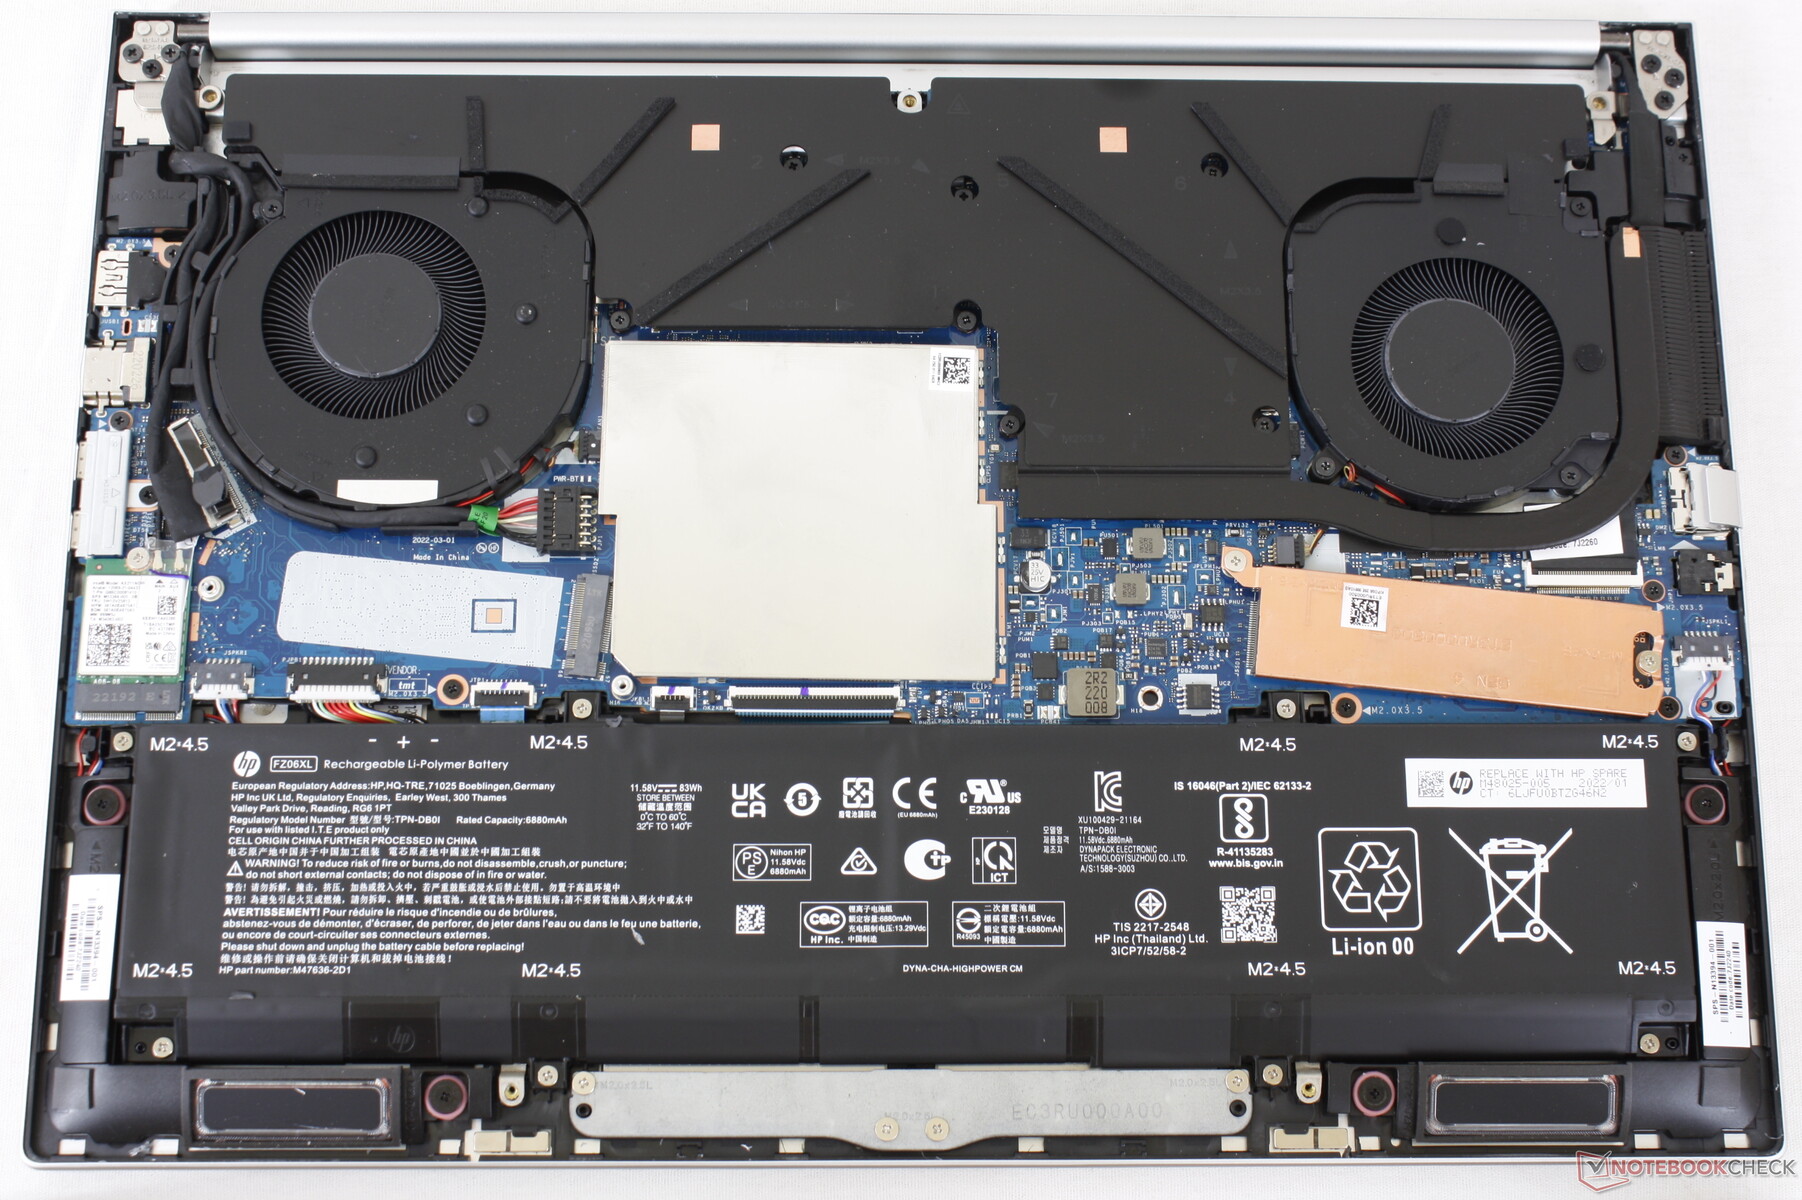
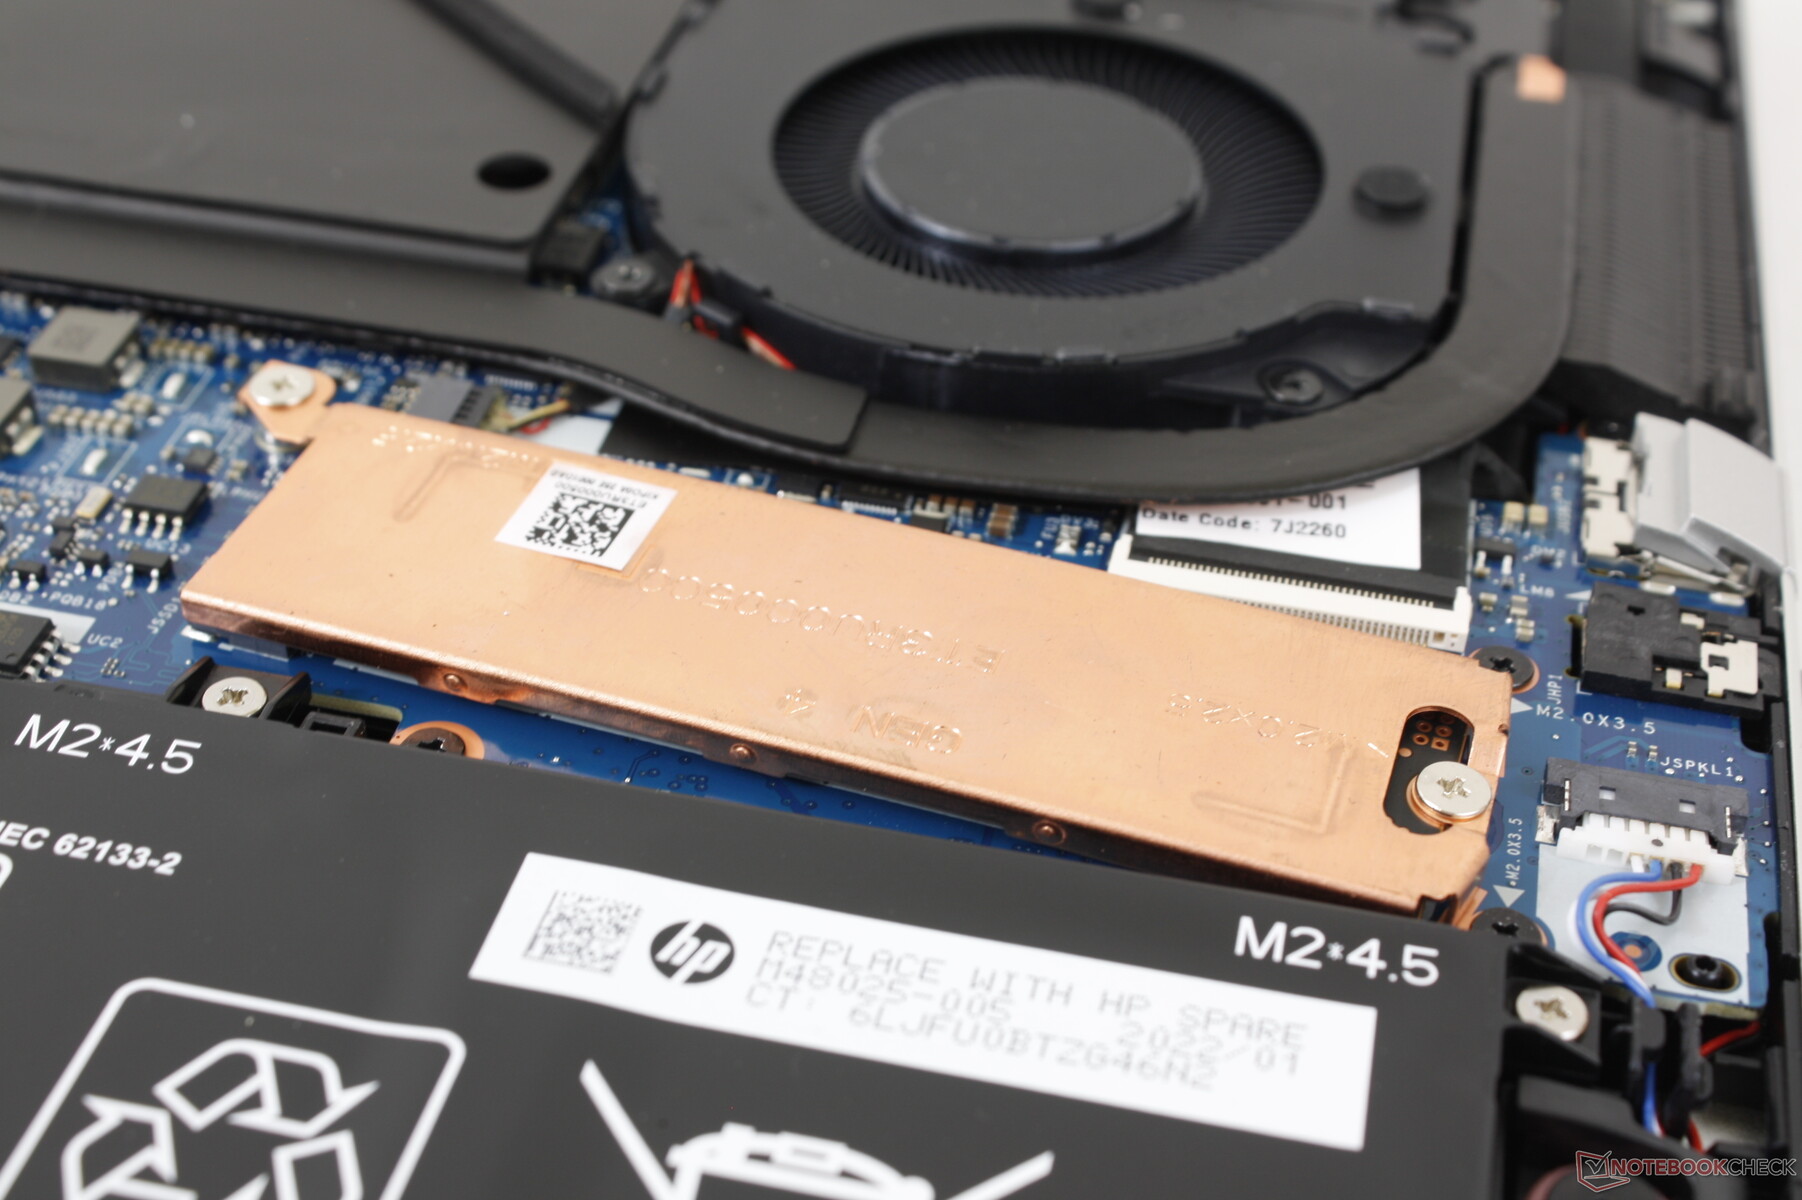
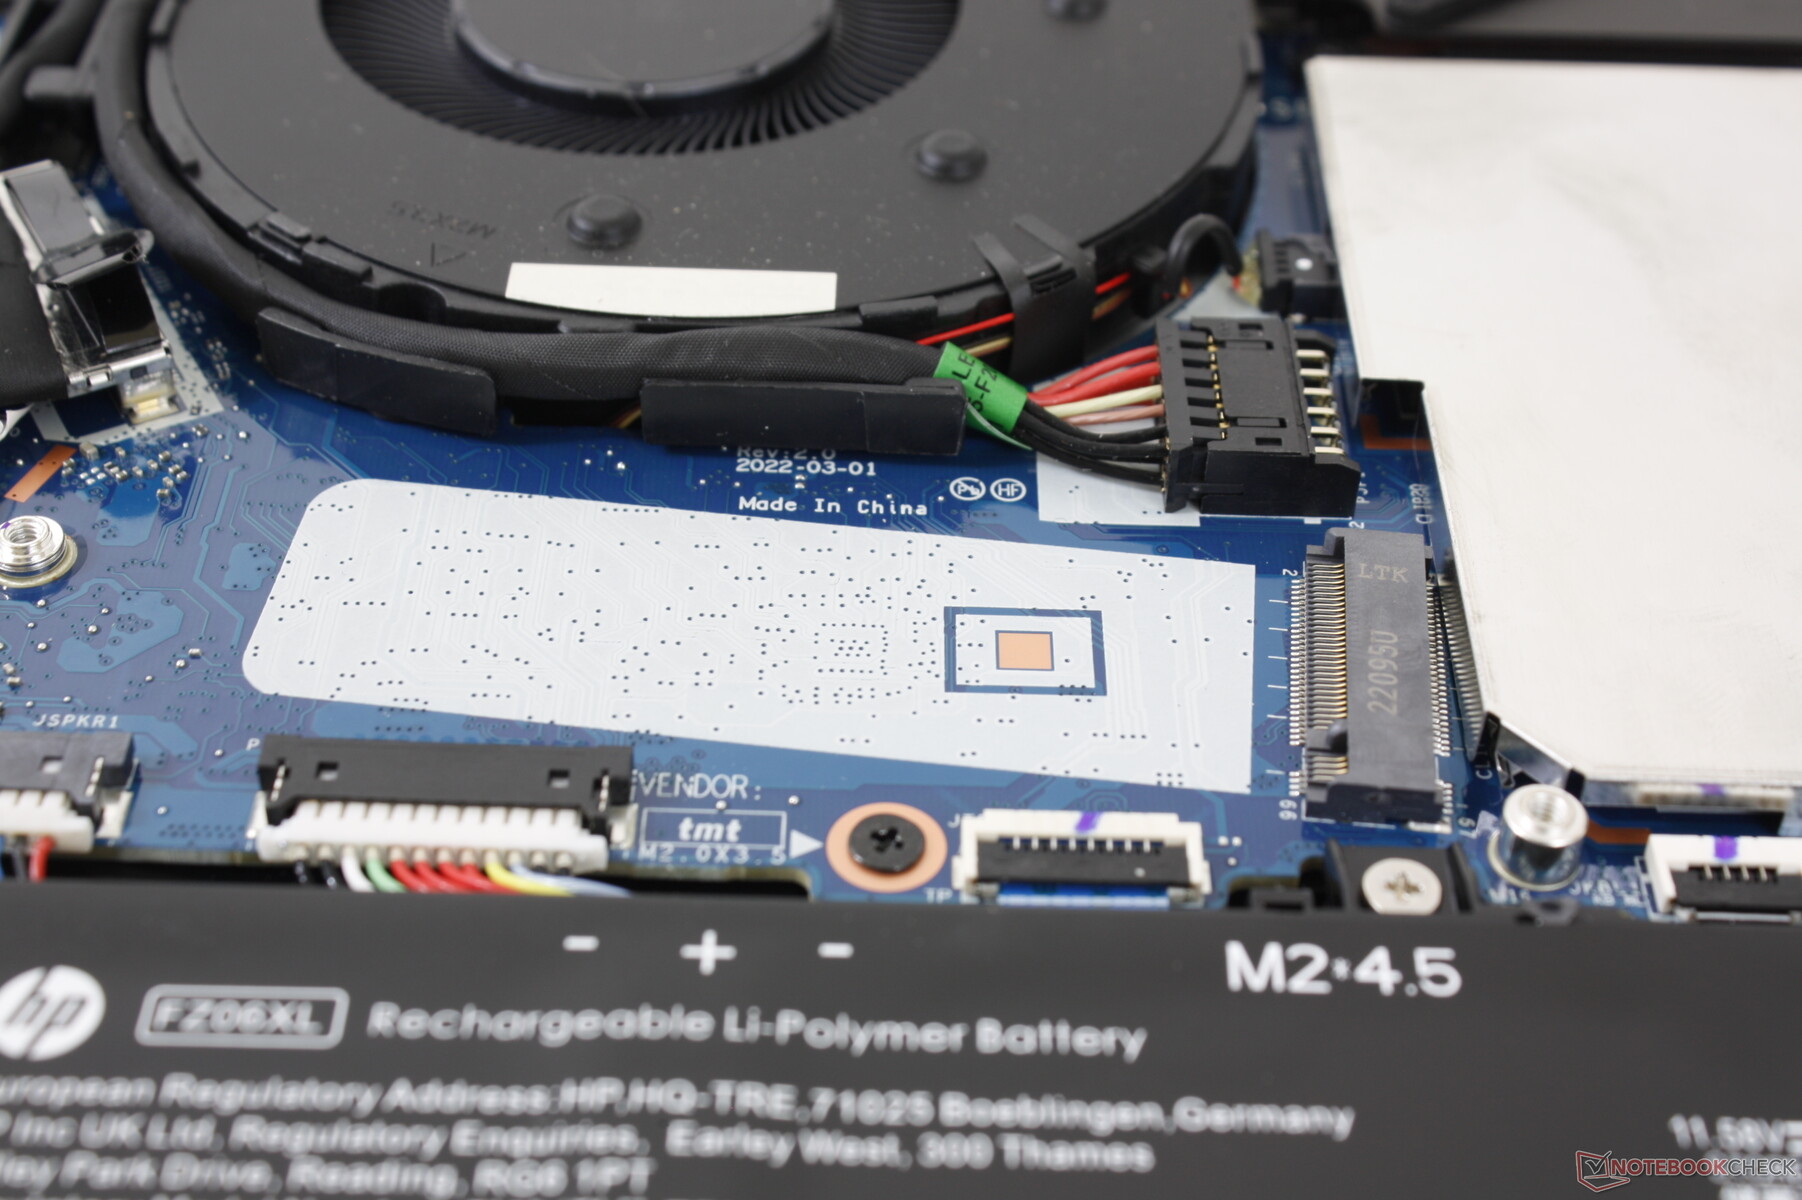
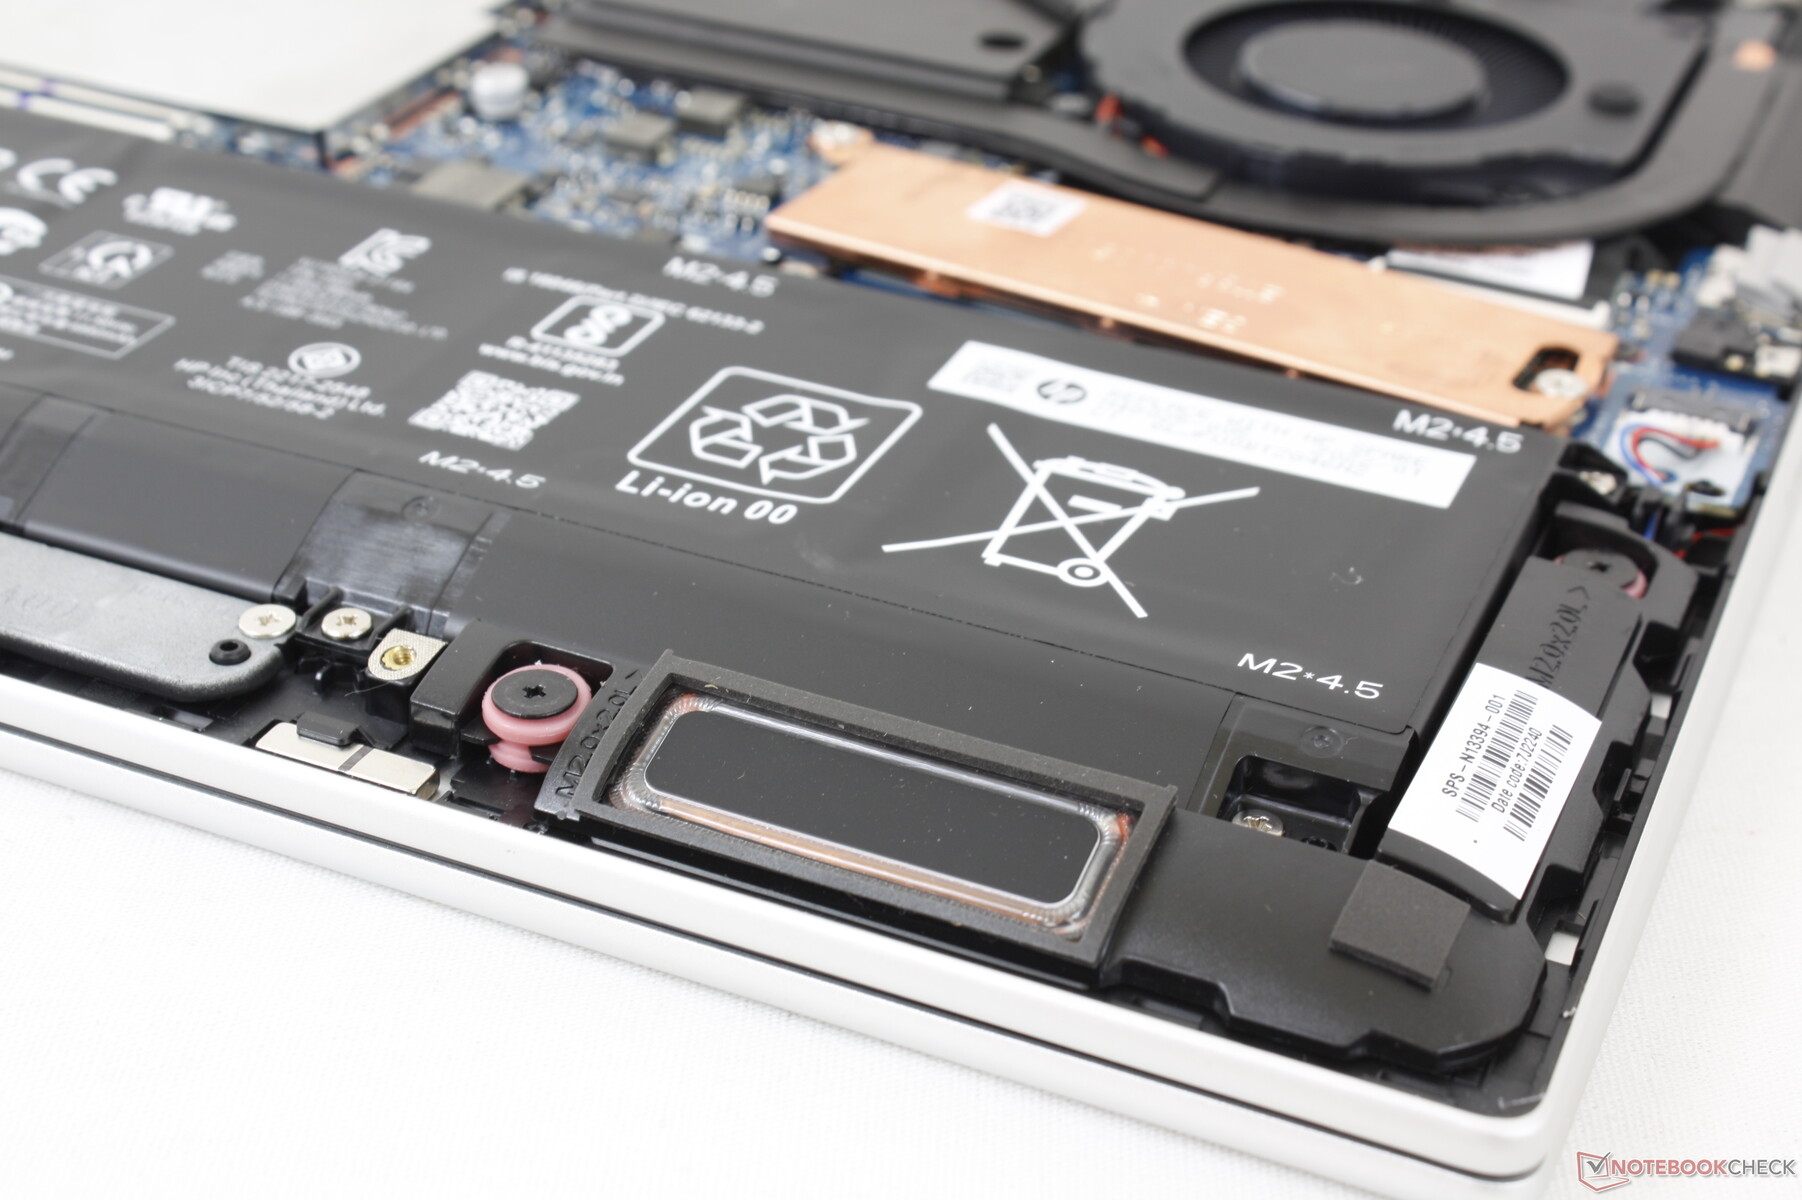
Onderhoud
Het bodempaneel is beveiligd met slechts 5 Torx-schroeven voor eenvoudig onderhoud. In feite heeft HP een zeer nuttige YouTube video over hoe de laptop stap voor stap te demonteren. Gebruikers hebben toegang tot de 2x SODIMM slots, 2x opslag slots, en WLAN module eenmaal binnen.
Accessoires en garantie
Er zitten geen extra's in de verpakking behalve de AC-adapter en het papierwerk. Bij aankoop in de VS geldt de gebruikelijke beperkte garantie van een jaar.
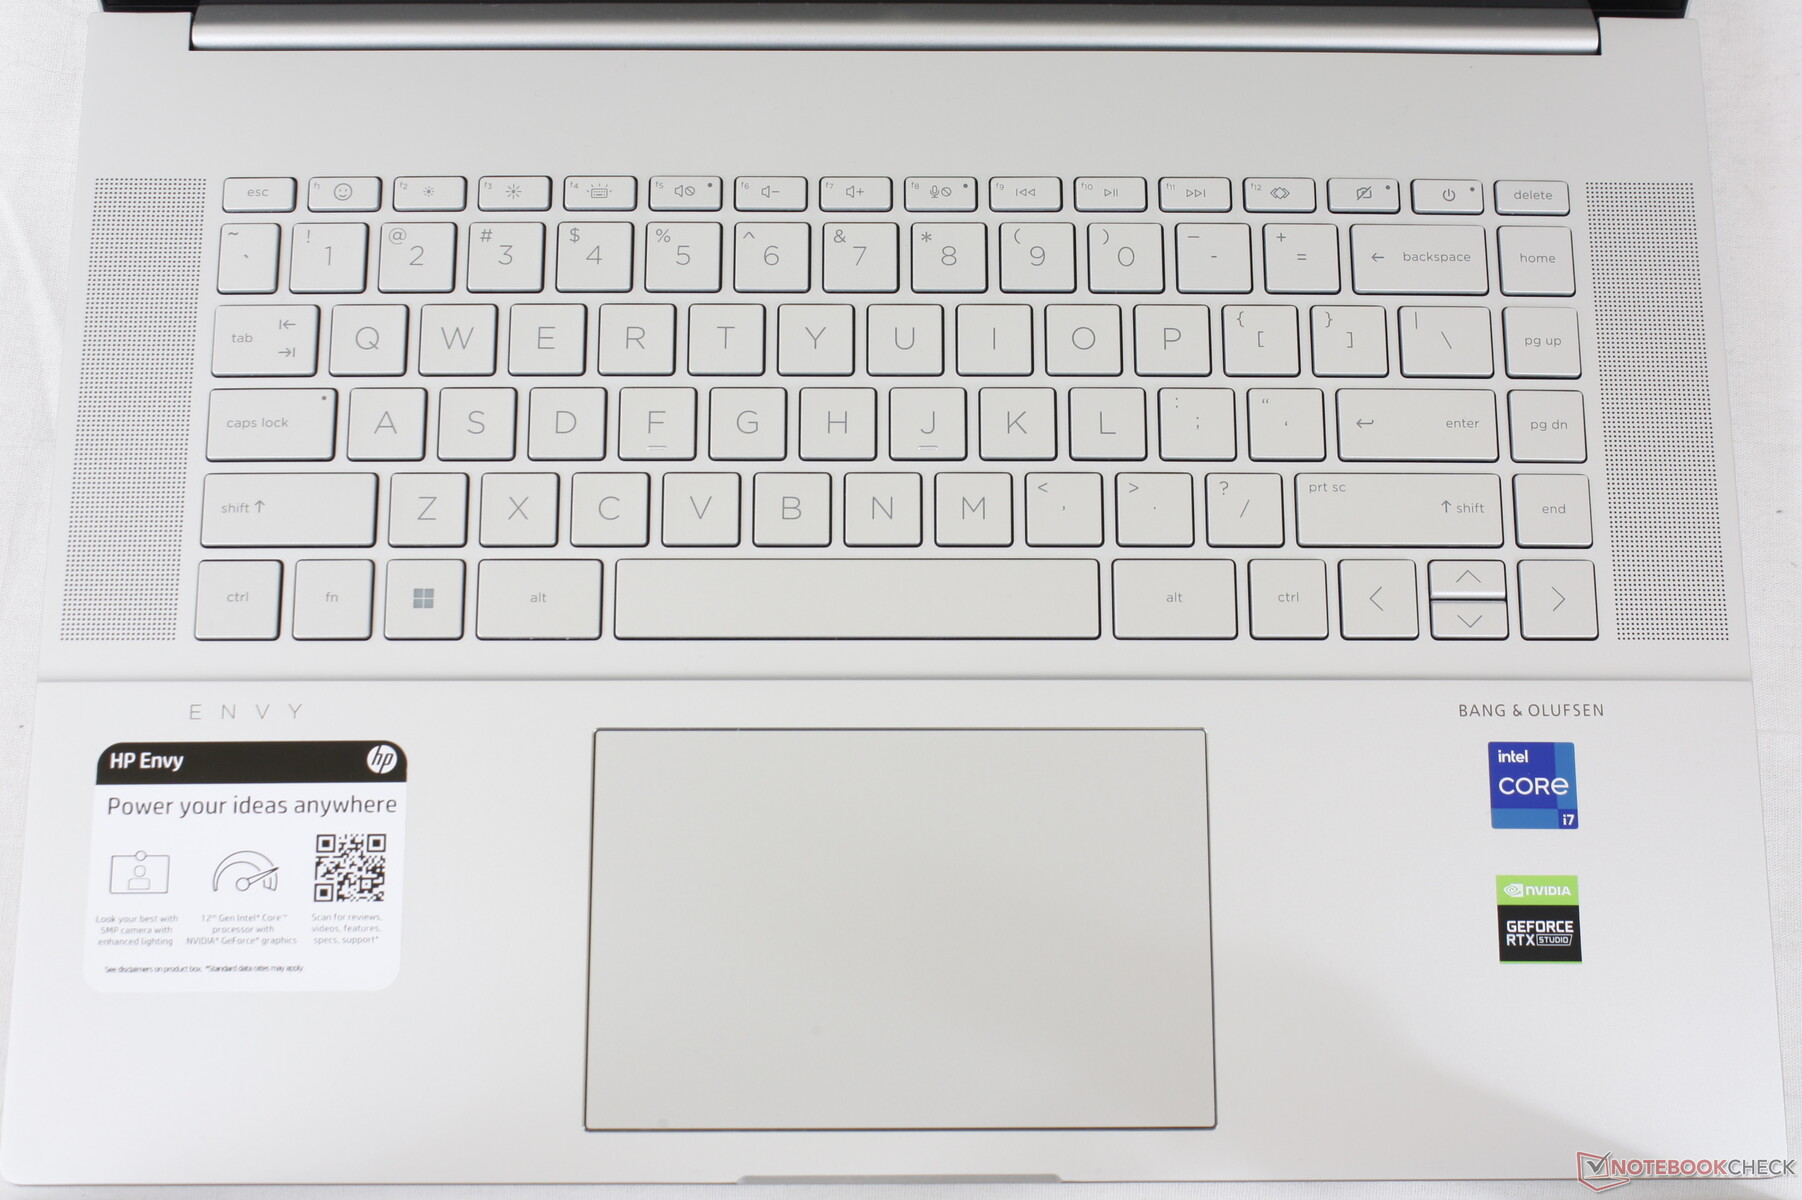
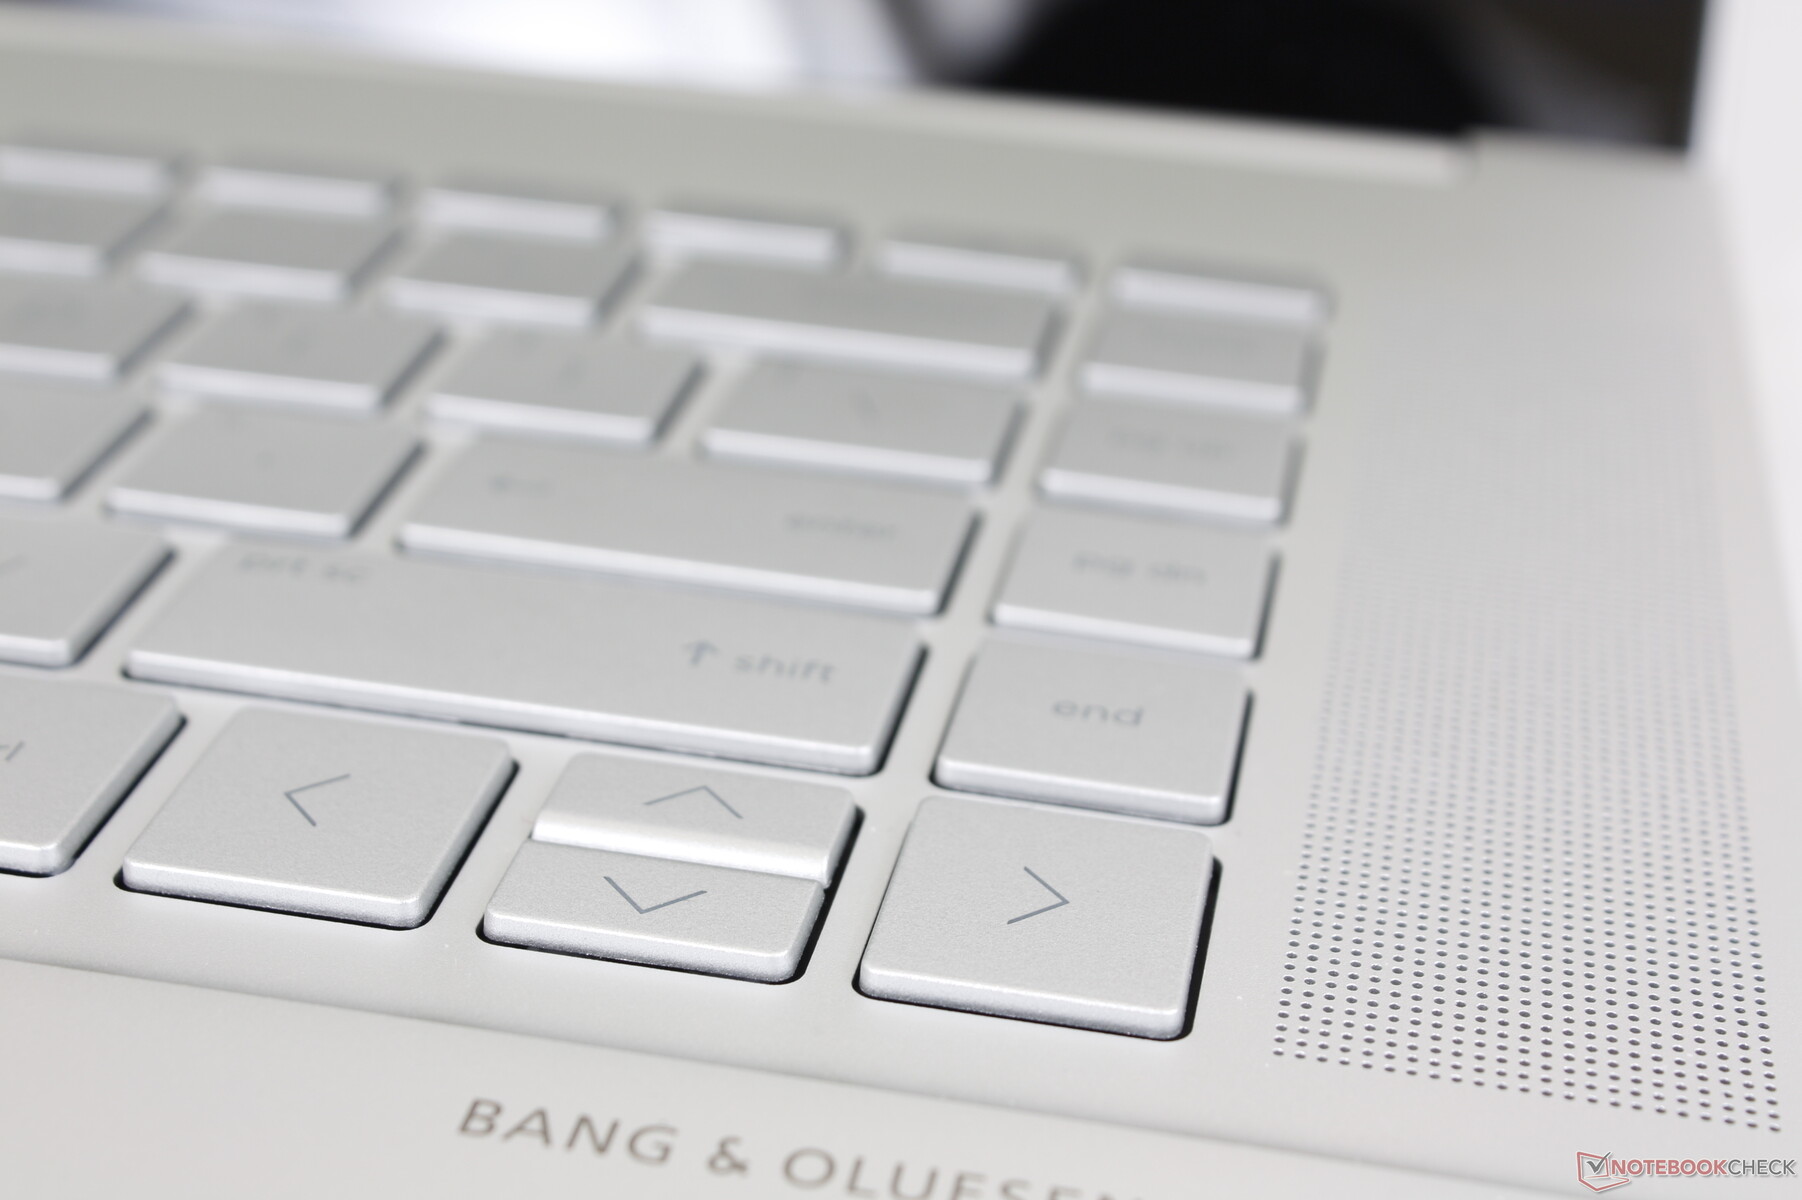
Invoerapparaten - groter touchpad, vertrouwd toetsenbord
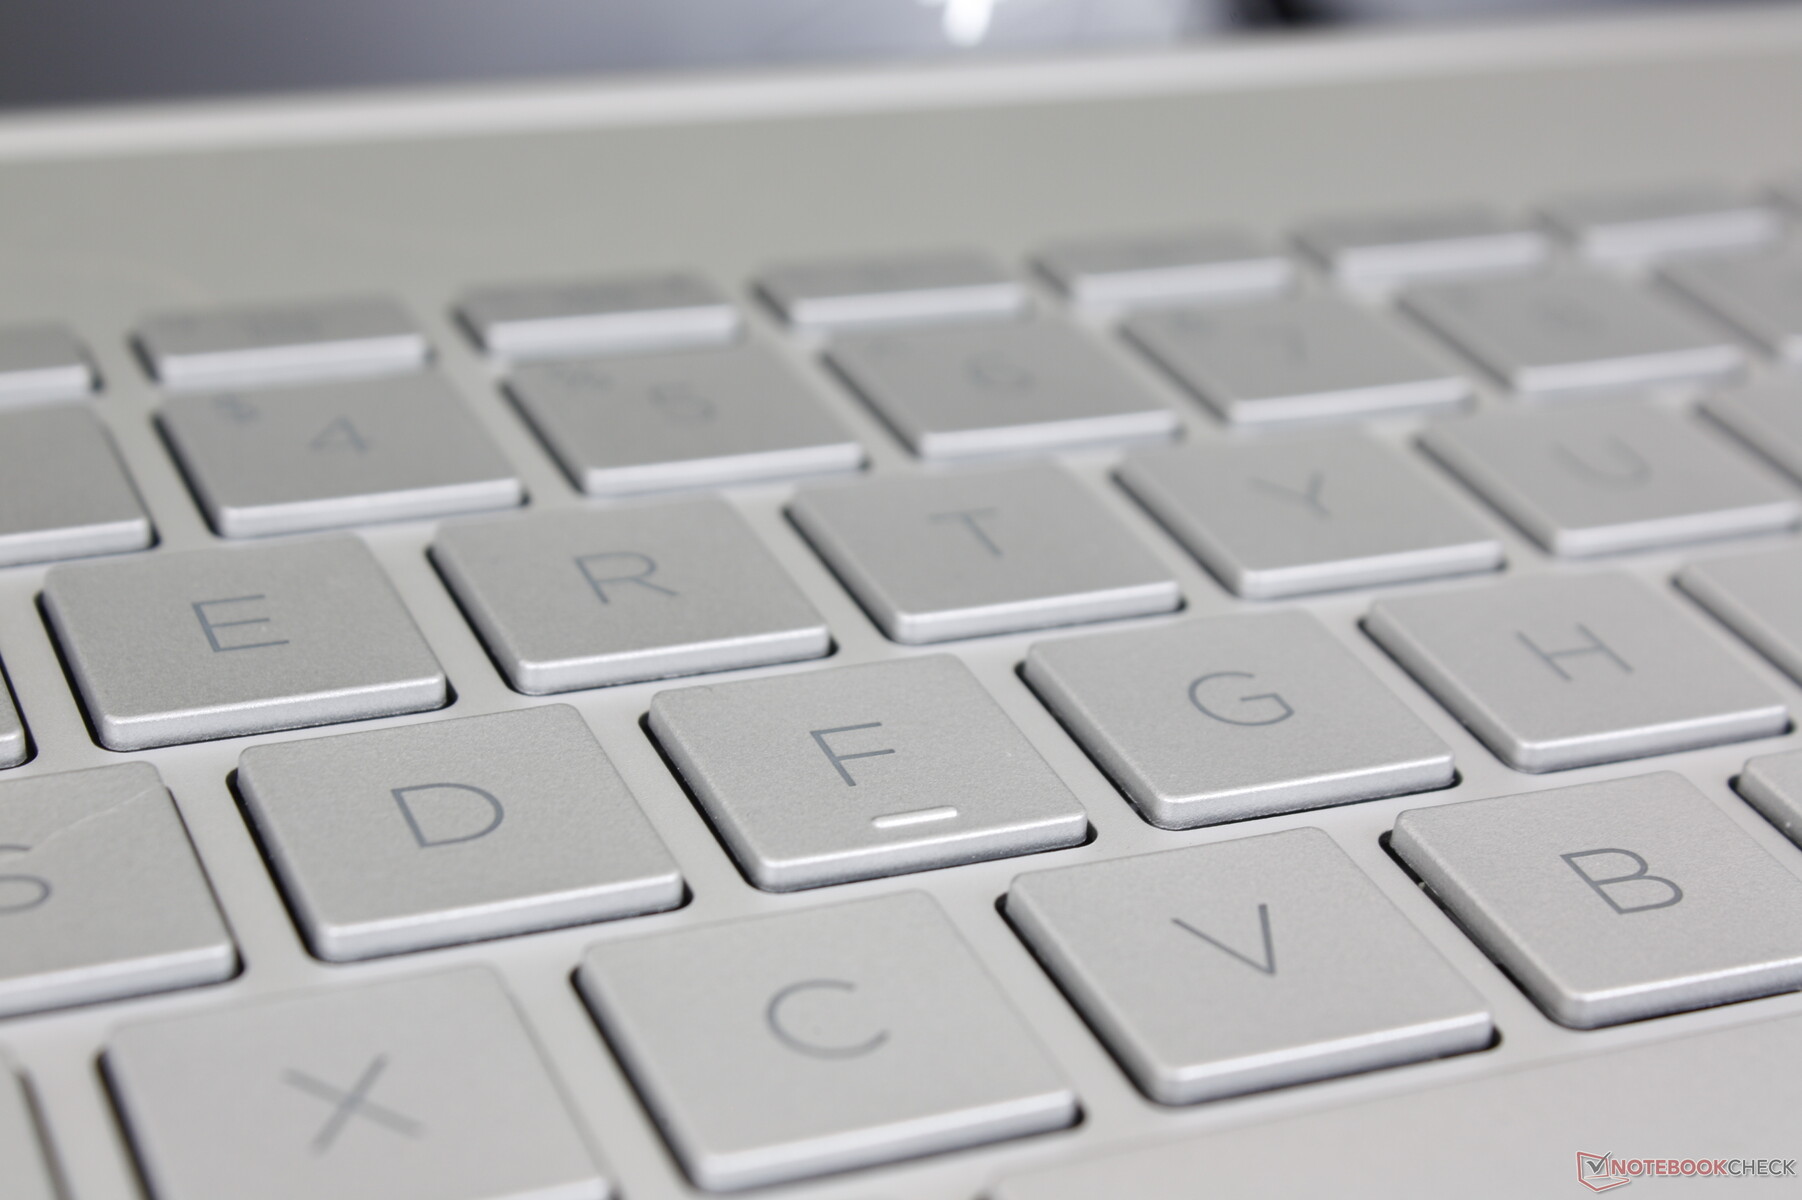
Toetsenbord
HP heeft geen wijzigingen aangebracht aan de feedback of het gevoel van het toetsenbord in vergelijking met de 2020 Envy 15. Aan de ene kant zullen gebruikers die gewend zijn aan Envy-toetsenborden geen problemen hebben, maar aan de andere kant hadden we liever een type-ervaring gehad die dichter bij de stevigere en meer bevredigende toetsen van een Spectre 15 of EliteBook model
Er zijn twee kleine oppervlakkige veranderingen die het vermelden waard zijn. De secundaire functie van de F12 toets is nu veranderd in een 'System Event Utility' functie die in wezen een Quick Launch toets is voor HP Command Center, Omen Gaming Hub, myHP en HP Palette. Ten tweede lanceert de secundaire functie van de F1-toets nu een popup voor het selecteren van emoji's en GIF's, net als op de nieuwste Pavilion.
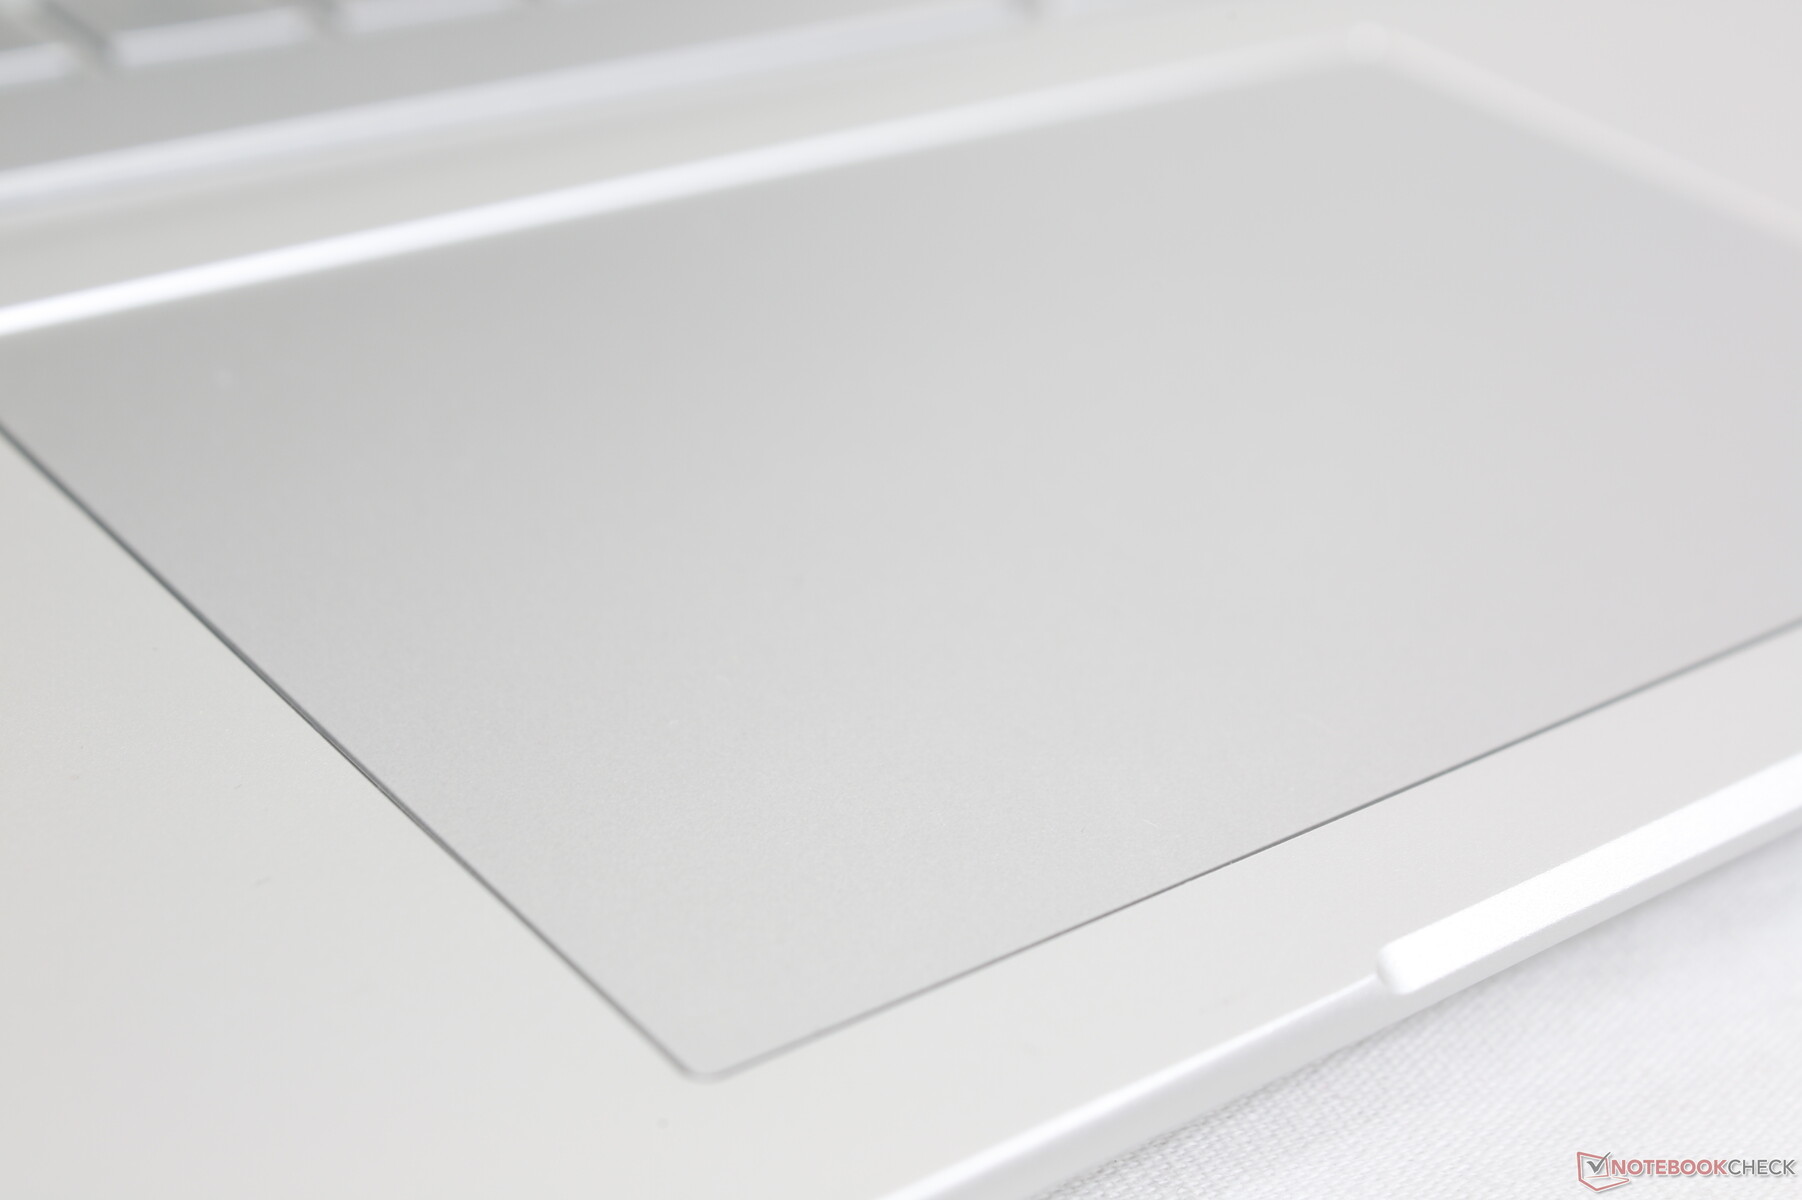
Touchpad
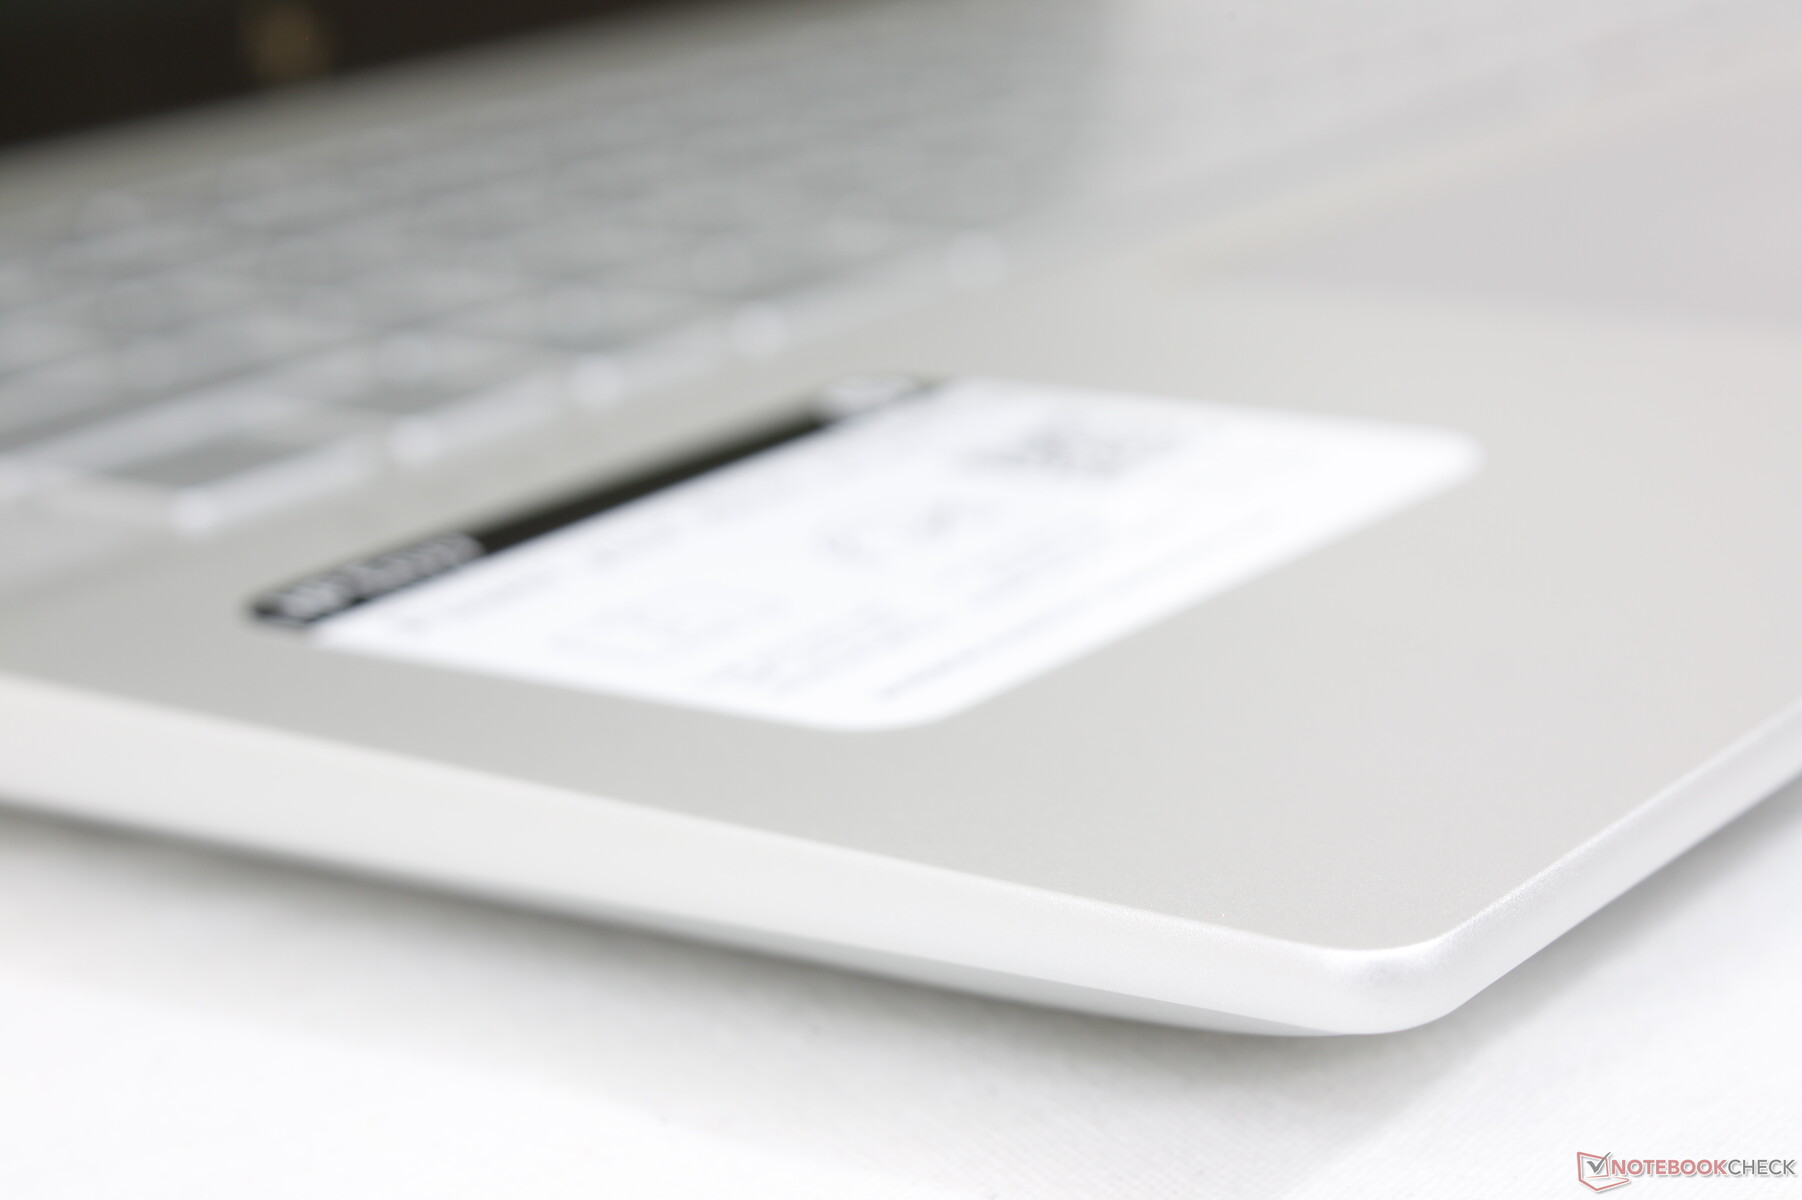
Het clickpad is groter dan het clickpad op de uitgaande Envy 15 (12,5 x 8 cm tegen 11,5 x 7,5 cm). Het oppervlak is glad en bijna textuurloos met slechts een minimale plakkerigheid bij het glijden op lagere snelheden voor nauwkeuriger klikken. Ondertussen is de feedback bij het klikken op het clickpad relatief zacht en stil voor een sponsachtig gevoel. Een sterkere en meer bevredigende klik zou het clickpad gemakkelijker te gebruiken hebben gemaakt.
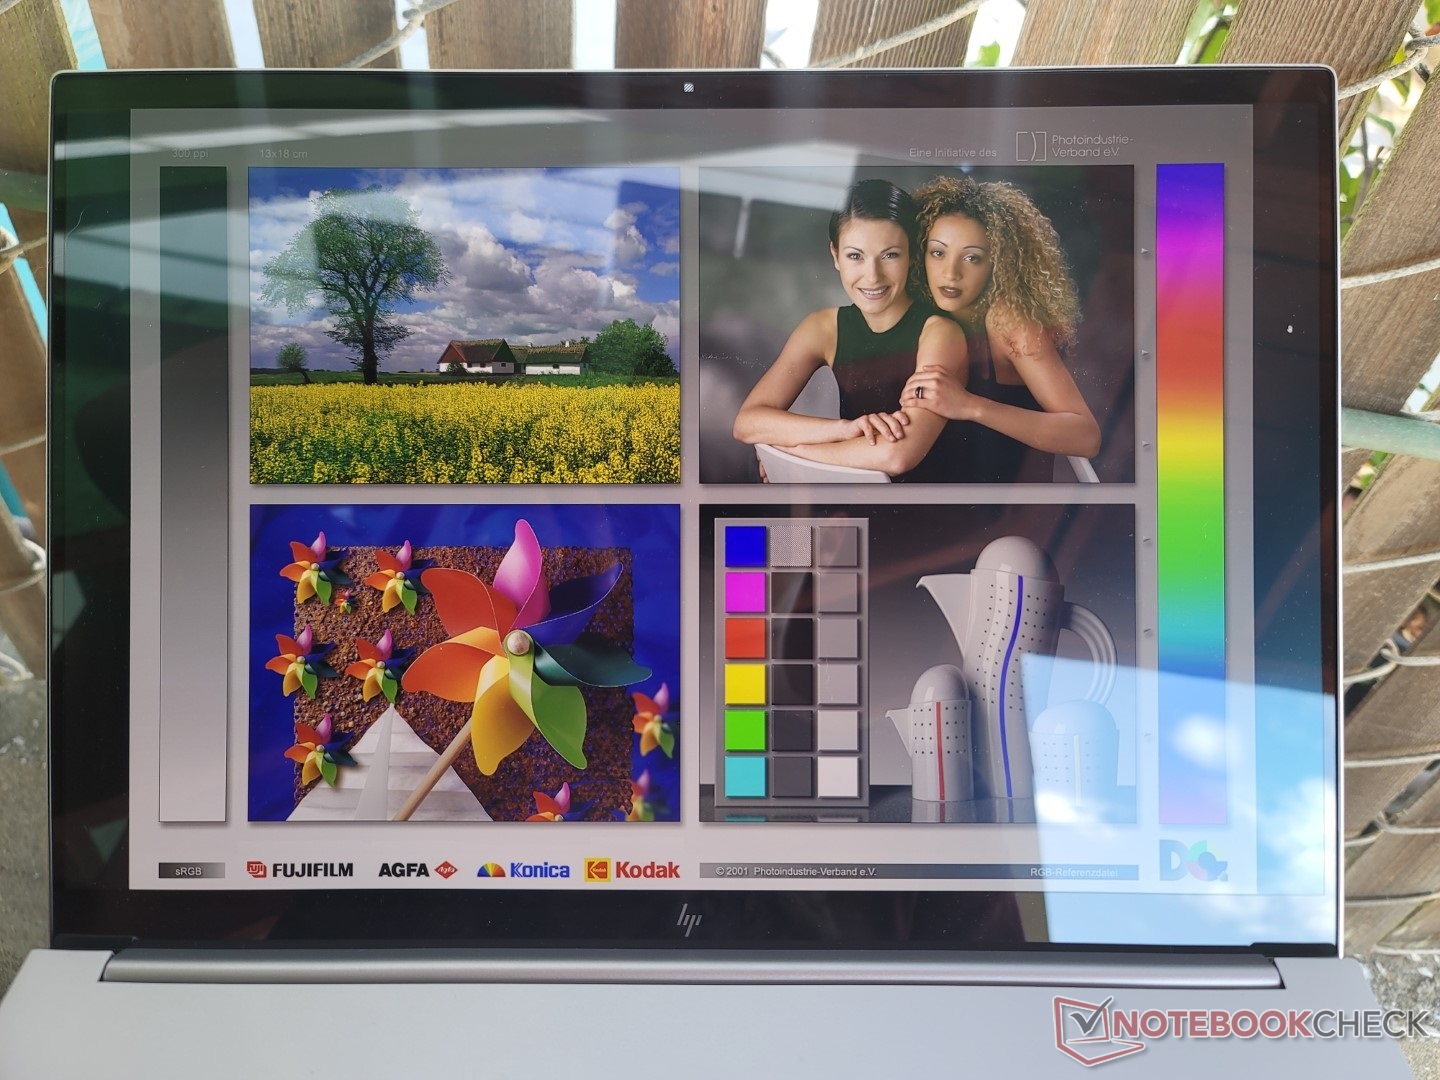
Beeldscherm - IPS of OLED?
Er zijn twee schermopties beschikbaar
- 2560 x 1600, 120 Hz, IPS, 100% sRGB
- 3840 x 2400, 60 Hz, OLED, 100% P3
Onze metingen hieronder geven alleen de OLED-optie weer. De belangrijkste voordelen zijn de diepere kleuren, de pikzwarte contrastverhouding en de aanzienlijk snellere zwart-wit en grijs-grijs reactietijden dan IPS, ten koste van een hoger energieverbruik en schermflikkering waar een kleine subgroep van gebruikers last van kan hebben.
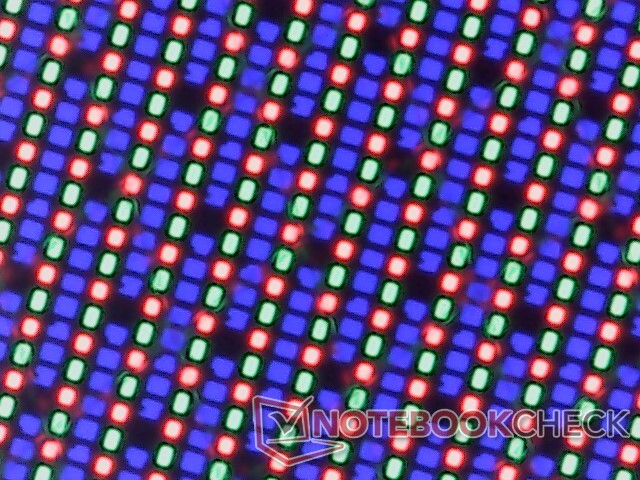
De beeldkwaliteit is scherp, maar met merkbare kleurkorrels die duidelijker worden bij de weergave van witte kleuren bij hoge helderheidsinstellingen. De IPS optie kan de voorkeur hebben voor degenen die geen P3 kleuren nodig hebben, omdat de 120 Hz refresh rate een veel soepelere ervaring biedt.
| |||||||||||||||||||||||||
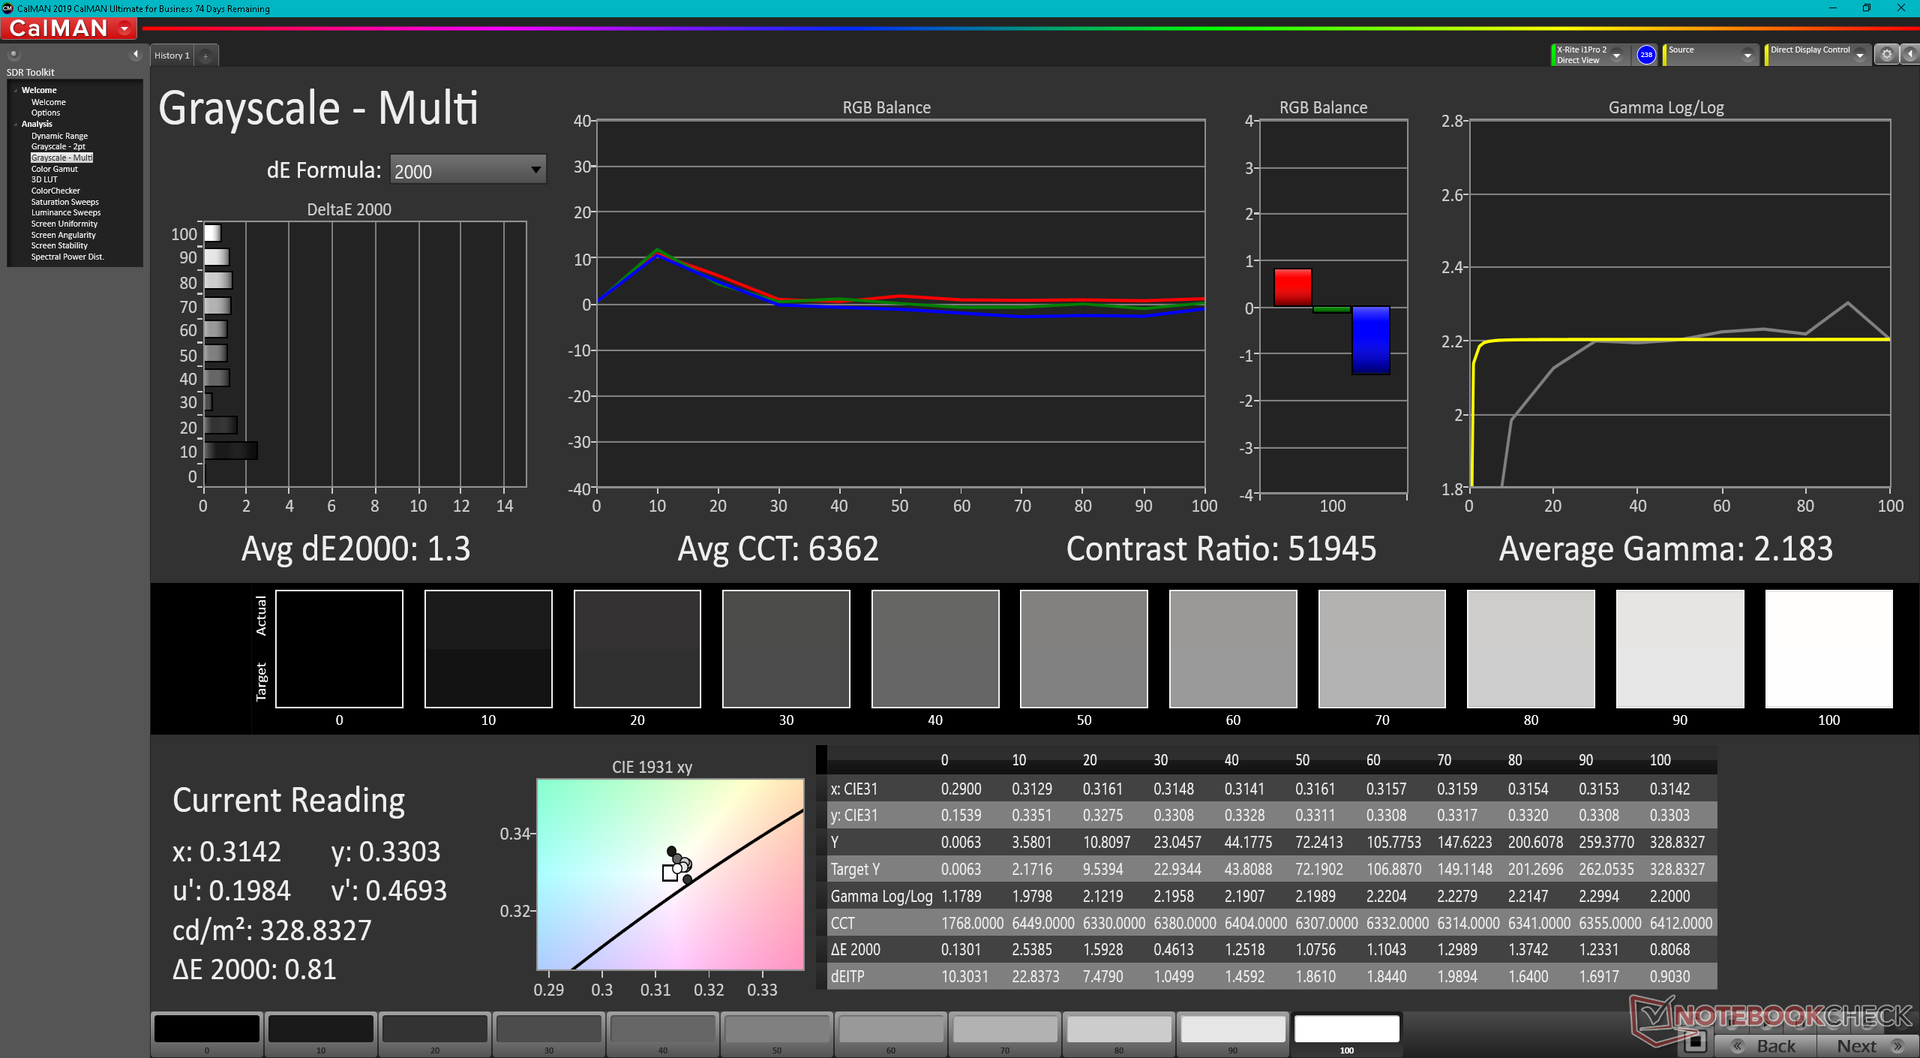
Helderheidsverdeling: 97 %
Helderheid in Batterij-modus: 328.8 cd/m²
Contrast: ∞:1 (Zwart: 0 cd/m²)
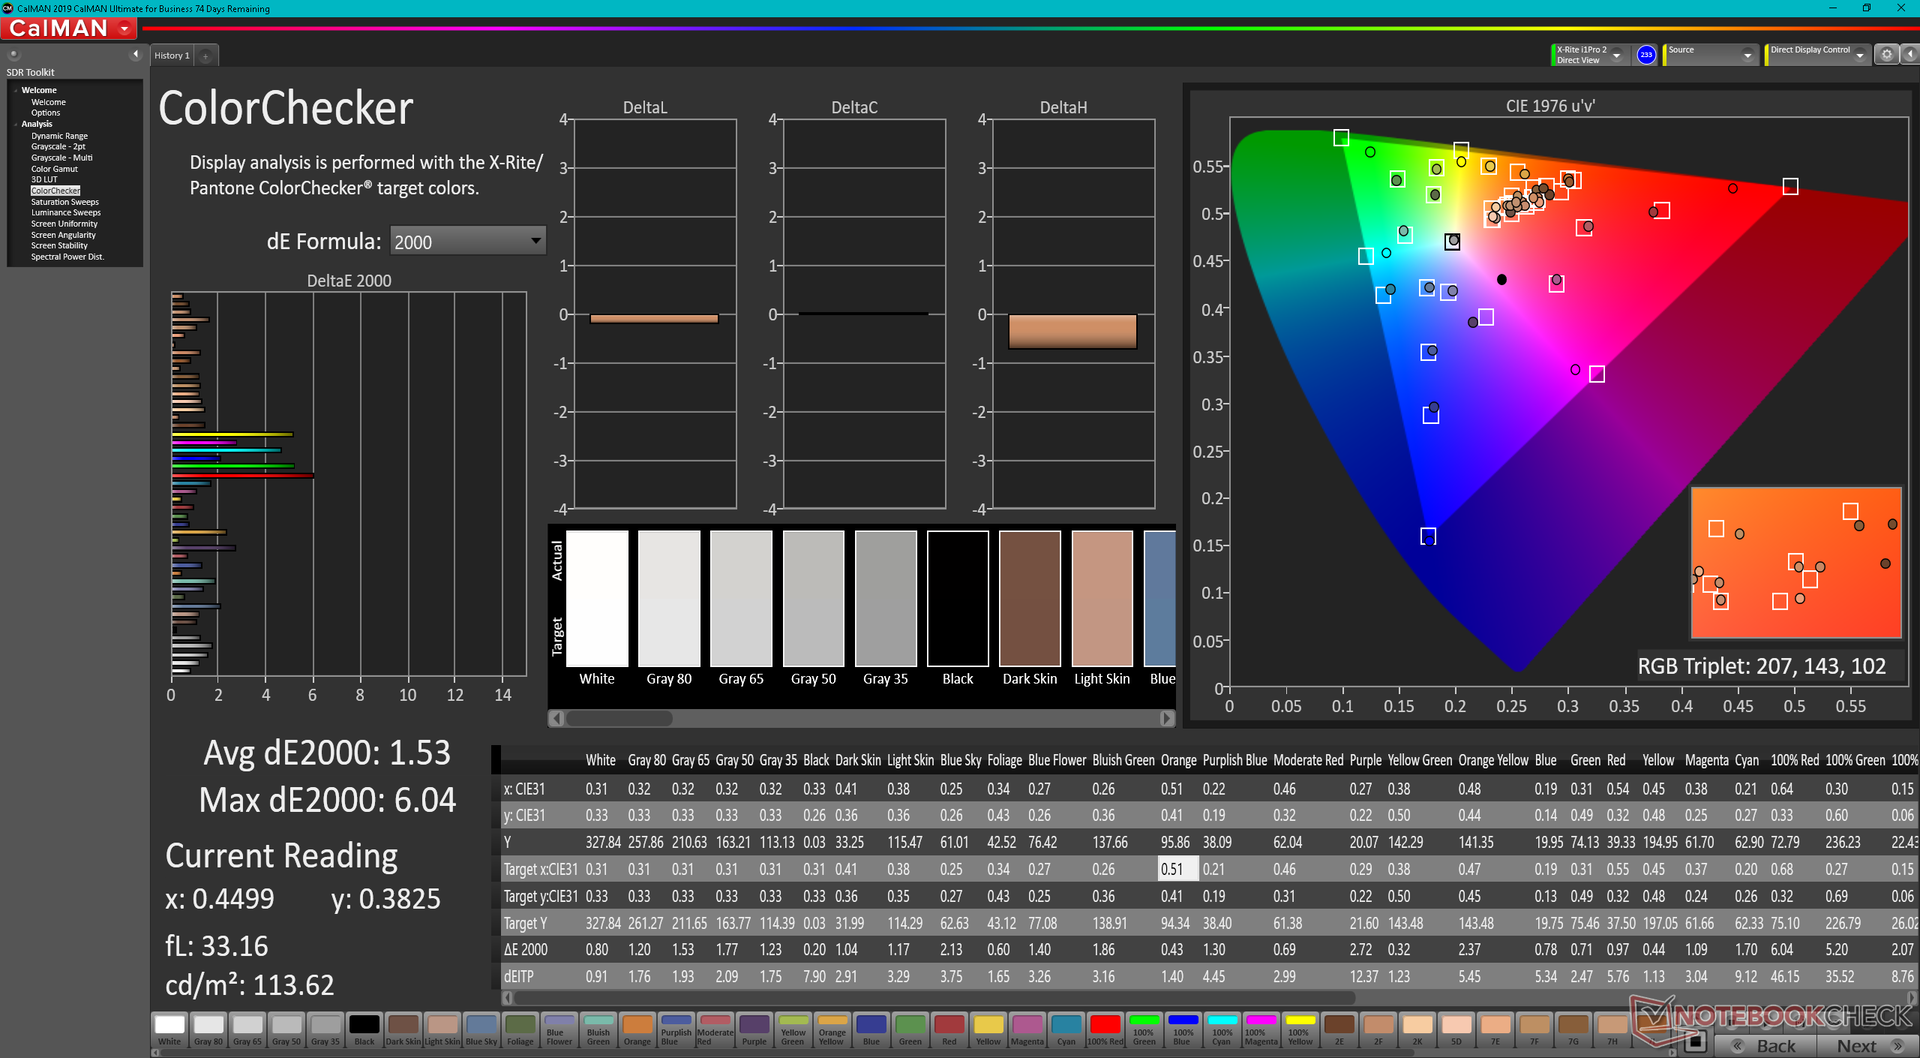
ΔE ColorChecker Calman: 1.53 | ∀{0.5-29.43 Ø4.71}
ΔE Greyscale Calman: 1.3 | ∀{0.09-98 Ø4.96}
88% AdobeRGB 1998 (Argyll 3D)
100% sRGB (Argyll 3D)
99.3% Display P3 (Argyll 3D)
Gamma: 2.18
CCT: 6362 K
| HP Envy 16 h0112nr Samsung SDC4174, OLED, 3840x2400, 16" | Lenovo ThinkBook 16 G4+ IAP LEN160WQXGA, IPS, 2560x1600, 16" | MSI Creator Z16P B12UHST AUOD298, IPS True Pixel (~100% DCI-P3), 2560x1600, 16" | Dell Inspiron 16 Plus 7610-MHJ8F AU Optronics B160QAN, AUO9F91, IPS, 3072x1920, 16" | Apple MacBook Pro 16 2021 M1 Pro Liquid Retina XDR, Mini-LED, 3456x2234, 16.2" | Huawei MateBook 16s i7 BOE XS TV160DKT-NH0, IPS, 2520x1680, 16" | |
|---|---|---|---|---|---|---|
| Display | -17% | -1% | -13% | 0% | -21% | |
| Display P3 Coverage (%) | 99.3 | 69.6 -30% | 97.6 -2% | 75 -24% | 99.1 0% | 64.5 -35% |
| sRGB Coverage (%) | 100 | 97.5 -2% | 99.9 0% | 100 0% | 100 0% | 96.7 -3% |
| AdobeRGB 1998 Coverage (%) | 88 | 71.7 -19% | 86.8 -1% | 76 -14% | 88 0% | 66.6 -24% |
| Response Times | -1160% | -391% | -2092% | -3381% | -1403% | |
| Response Time Grey 50% / Grey 80% * (ms) | 2 ? | 32.7 ? -1535% | 12.9 ? -545% | 54 ? -2600% | 42.8 ? -2040% | 35.7 ? -1685% |
| Response Time Black / White * (ms) | 1.9 ? | 16.8 ? -784% | 6.4 ? -237% | 32 ? -1584% | 91.6 ? -4721% | 23.2 ? -1121% |
| PWM Frequency (Hz) | 240.4 ? | 14880 | ||||
| Screen | -36% | -17% | -37% | 15% | 13% | |
| Brightness middle (cd/m²) | 328.8 | 371 13% | 428 30% | 290 -12% | 514 56% | 311 -5% |
| Brightness (cd/m²) | 332 | 357 8% | 394 19% | 285 -14% | 497 50% | 319 -4% |
| Brightness Distribution (%) | 97 | 91 -6% | 86 -11% | 88 -9% | 95 -2% | 91 -6% |
| Black Level * (cd/m²) | 0.23 | 0.42 | 0.21 | 0.02 | 0.17 | |
| Colorchecker dE 2000 * | 1.53 | 2.6 -70% | 1.67 -9% | 2.57 -68% | 1.4 8% | 1 35% |
| Colorchecker dE 2000 max. * | 6.04 | 4.4 27% | 5.71 5% | 4.78 21% | 2.8 54% | 1.7 72% |
| Greyscale dE 2000 * | 1.3 | 3.7 -185% | 3.1 -138% | 3.14 -142% | 2.3 -77% | 1.5 -15% |
| Gamma | 2.18 101% | 2.32 95% | 2.195 100% | 2.34 94% | 2.27 97% | 2.15 102% |
| CCT | 6362 102% | 7271 89% | 6498 100% | 6408 101% | 6792 96% | 6432 101% |
| Contrast (:1) | 1613 | 1019 | 1381 | 25700 | 1829 | |
| Colorchecker dE 2000 calibrated * | 1.3 | 0.71 | 1.89 | 0.8 | ||
| Totaal Gemiddelde (Programma / Instellingen) | -404% /
-235% | -136% /
-81% | -714% /
-404% | -1122% /
-607% | -470% /
-254% |
* ... kleiner is beter
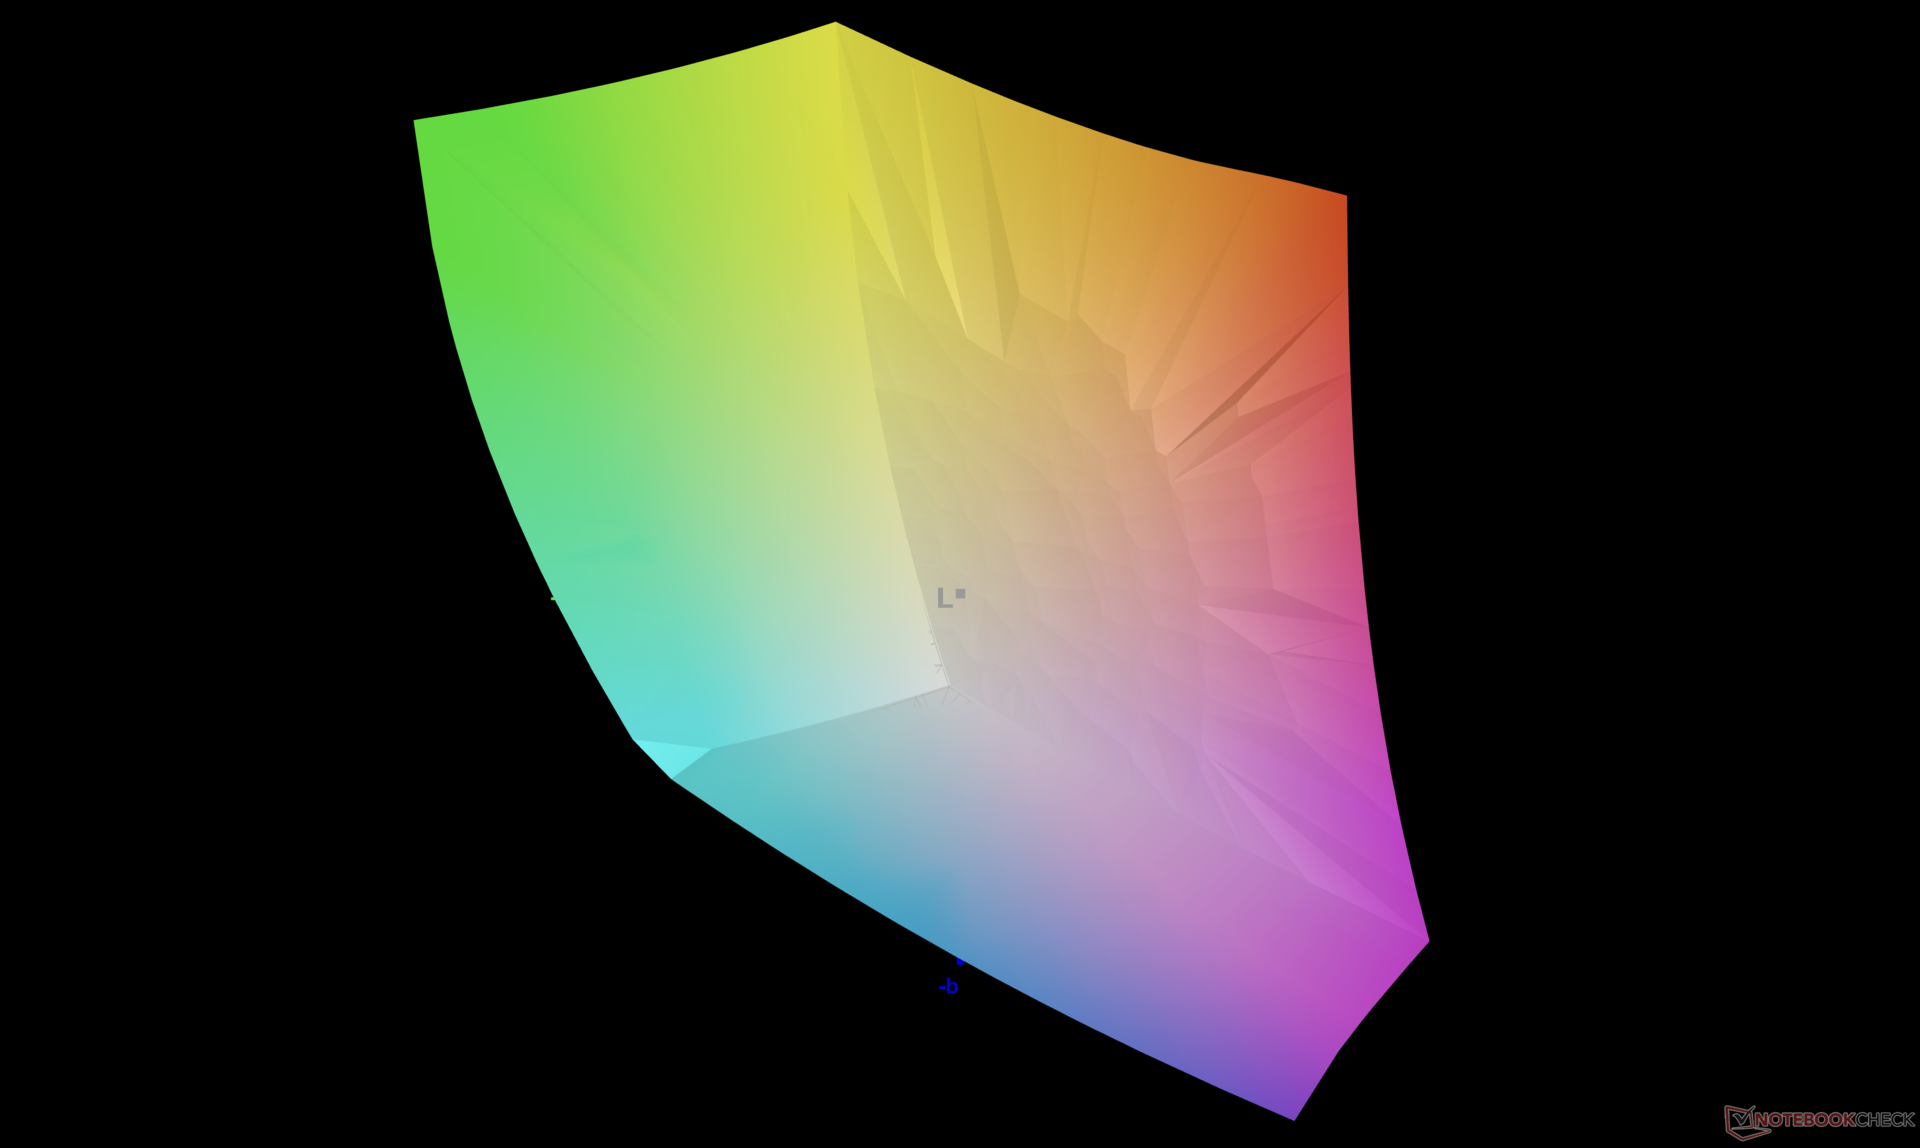
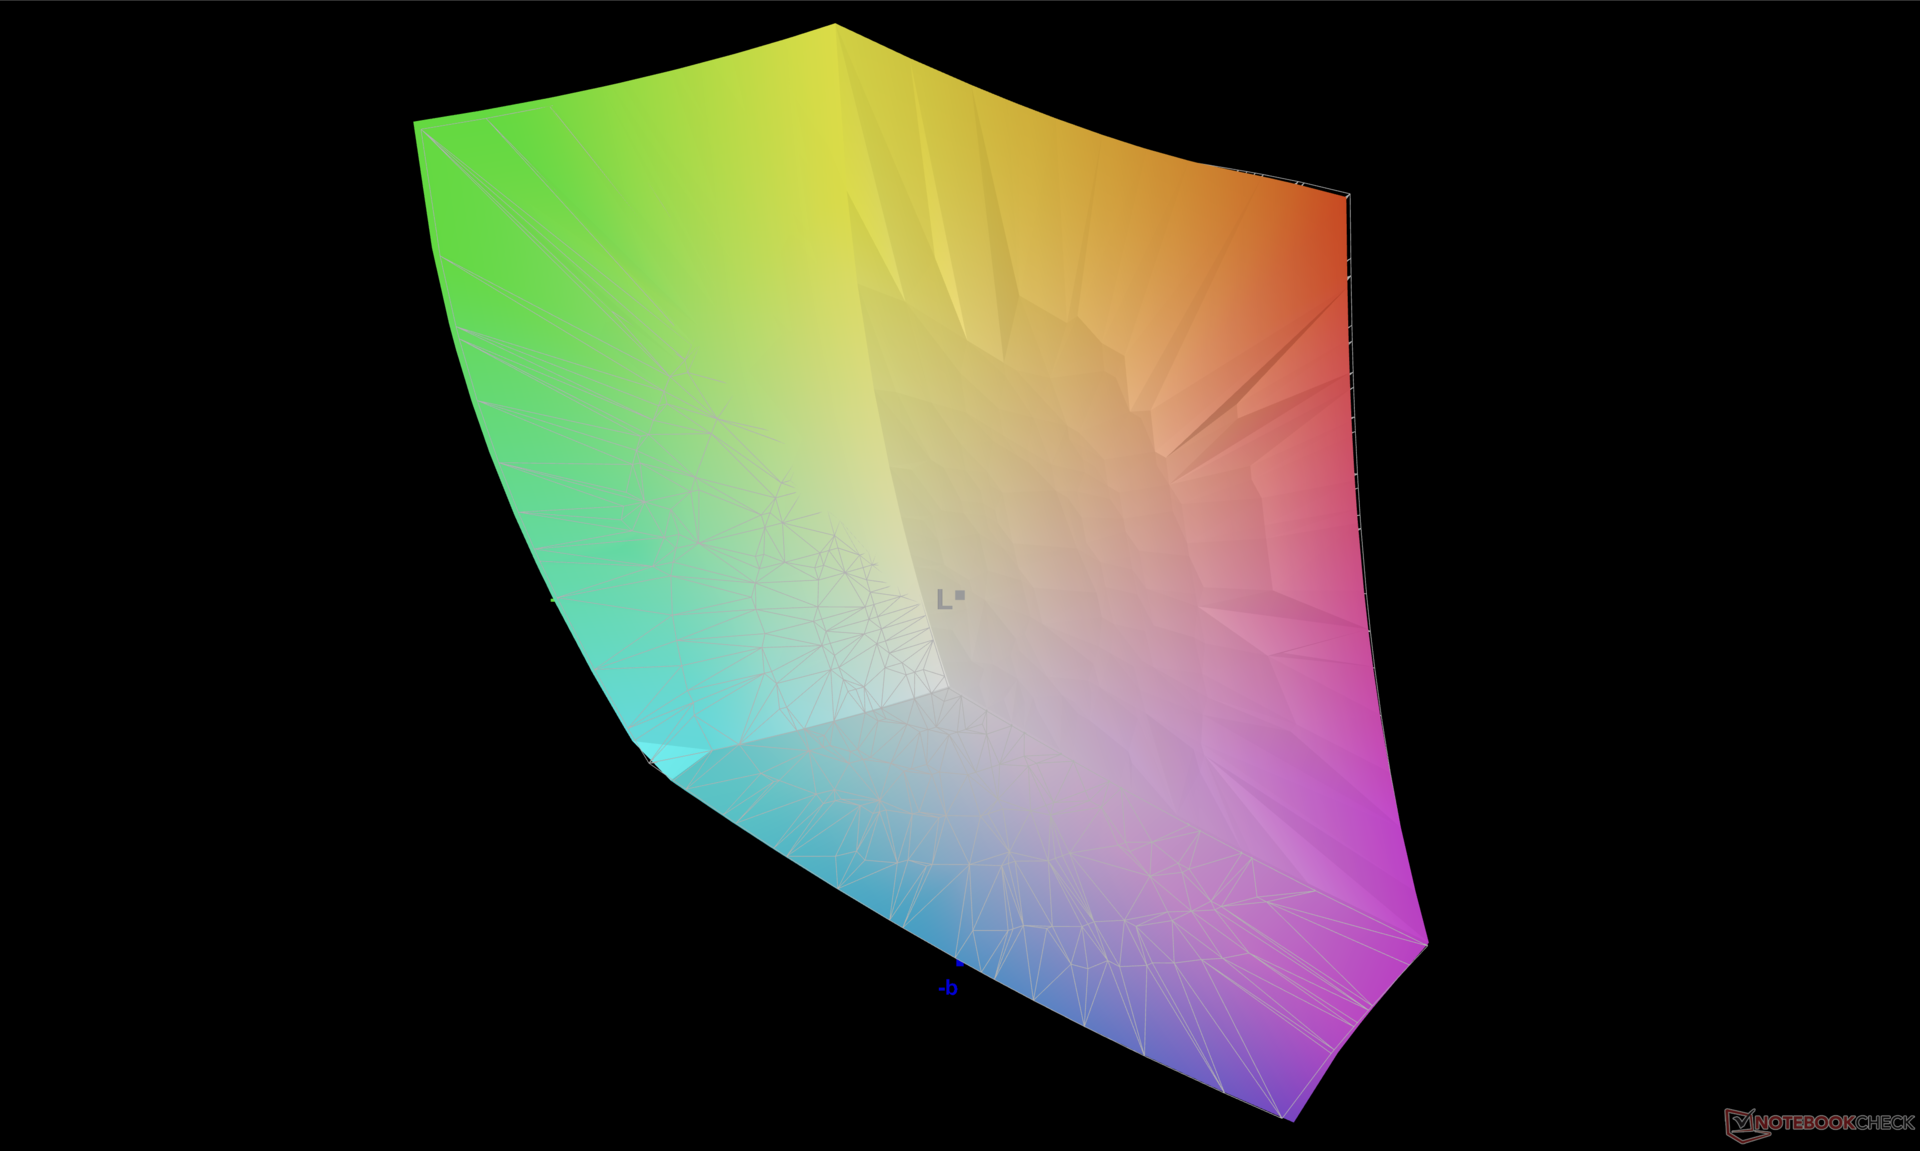
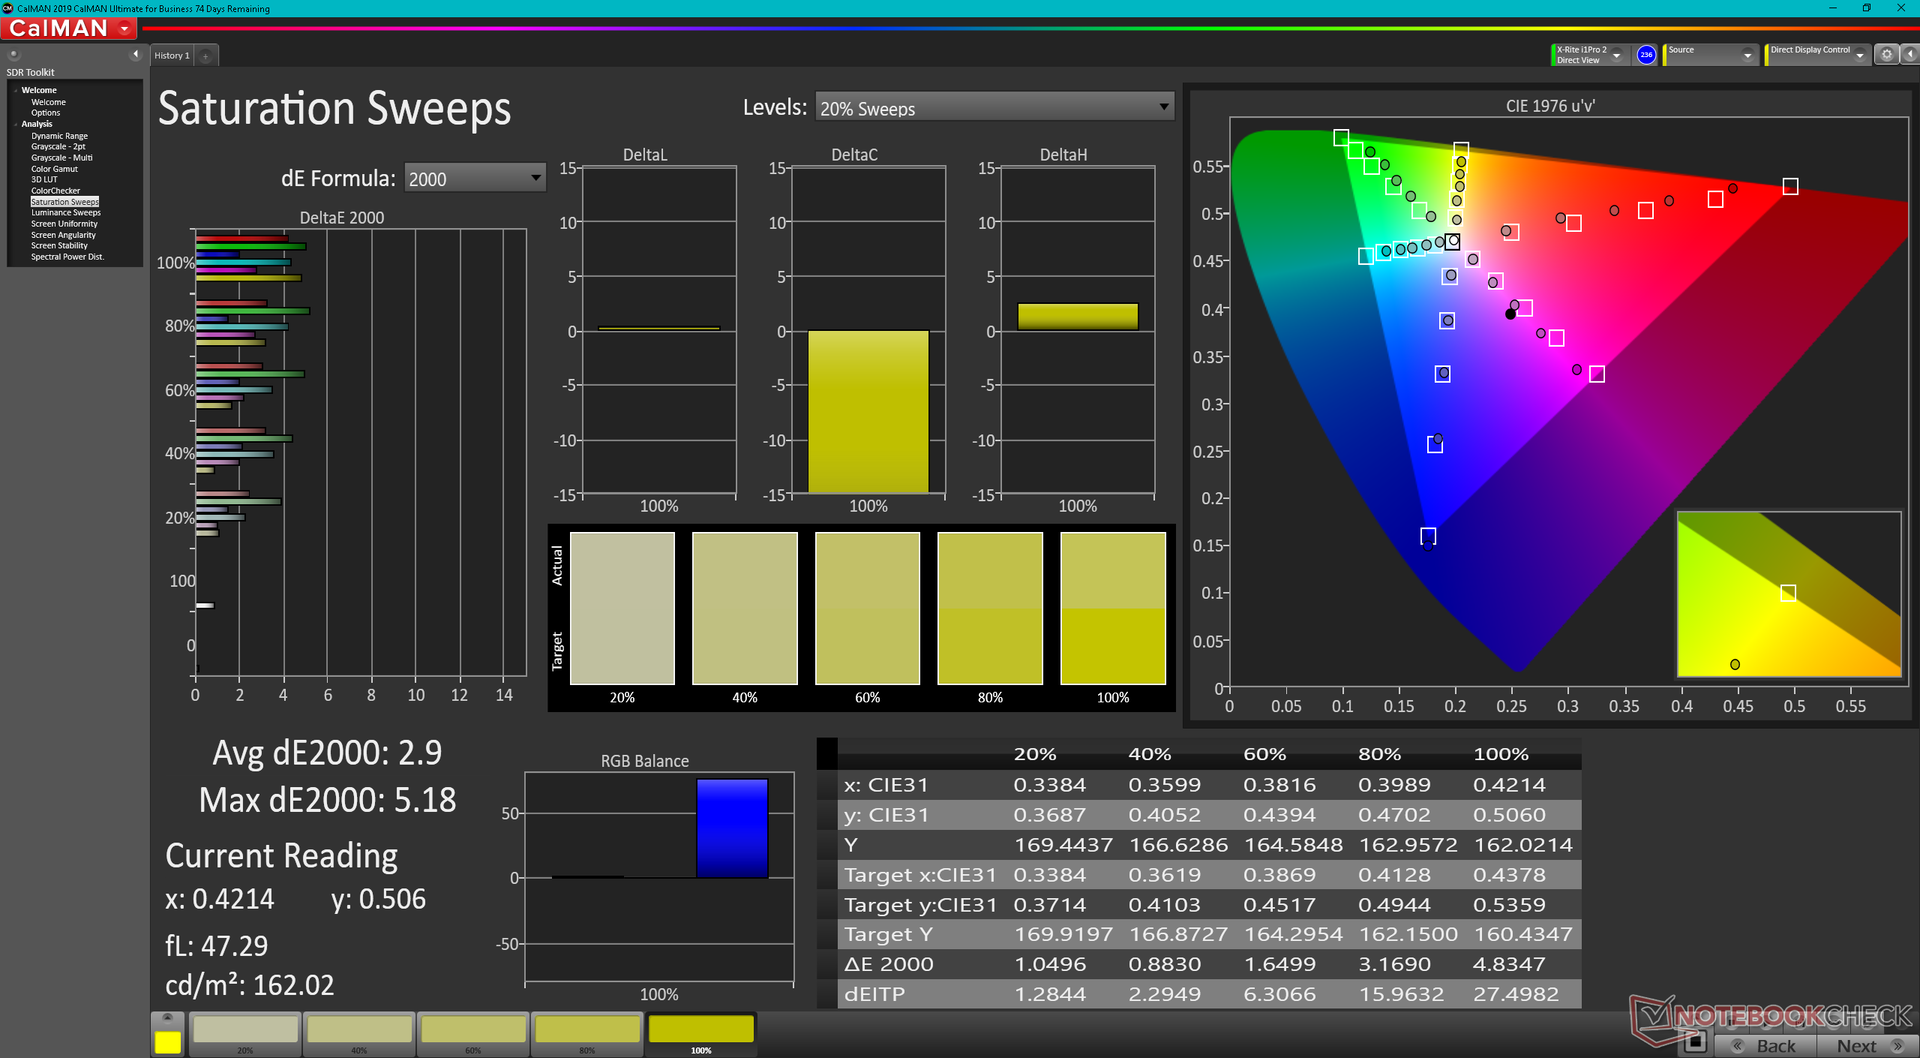
Het paneel is out of the box gekalibreerd tegen de P3 standaard met gemiddelde grijswaarden en kleur DeltaE waarden van slechts 1,3 en 1,53, respectievelijk. Kleuren lijken onnauwkeuriger te zijn bij hogere verzadigingsniveaus dan bij lagere verzadigingsniveaus.
Responstijd Scherm
| ↔ Responstijd Zwart naar Wit | ||
|---|---|---|
| 1.9 ms ... stijging ↗ en daling ↘ gecombineerd | ↗ 0.8 ms stijging | 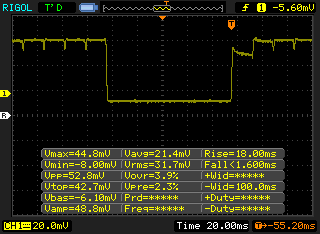 |
| ↘ 1.1 ms daling | ||
| Het scherm vertoonde erg snelle responstijden in onze tests en zou zeer geschikt moeten zijn voor snelle games. Ter vergelijking: alle testtoestellen variëren van 0.1 (minimum) tot 240 (maximum) ms. » 11 % van alle toestellen zijn beter. Dit betekent dat de gemeten responstijd beter is dan het gemiddelde (19.8 ms) van alle geteste toestellen. | ||
| ↔ Responstijd 50% Grijs naar 80% Grijs | ||
| 2 ms ... stijging ↗ en daling ↘ gecombineerd | ↗ 1 ms stijging | 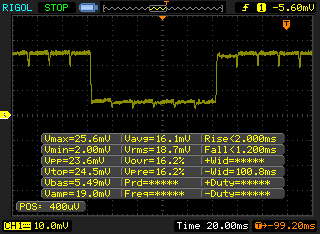 |
| ↘ 1 ms daling | ||
| Het scherm vertoonde erg snelle responstijden in onze tests en zou zeer geschikt moeten zijn voor snelle games. Ter vergelijking: alle testtoestellen variëren van 0.165 (minimum) tot 636 (maximum) ms. » 10 % van alle toestellen zijn beter. Dit betekent dat de gemeten responstijd beter is dan het gemiddelde (31 ms) van alle geteste toestellen. | ||
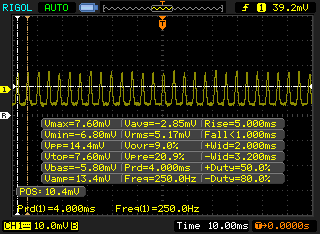
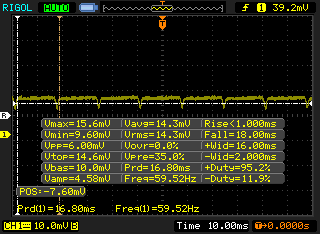
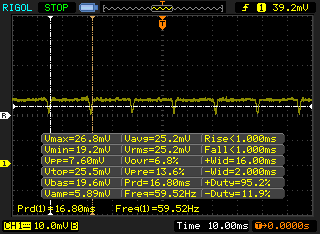
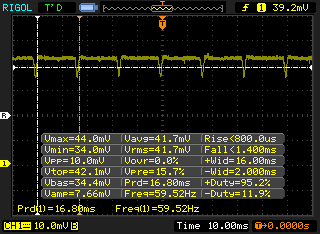
Screen Flickering / PWM (Pulse-Width Modulation)
| Screen flickering / PWM waargenomen | 240.4 Hz | ≤ 100 % helderheid instelling |  |
De achtergrondverlichting van het scherm flikkert op 240.4 Hz (in het slechtste geval, bijvoorbeeld bij gebruik van PWM) aan een helderheid van 100 % en lager. Boven deze helderheid zou er geen flickering / PWM mogen optreden. De frequentie van 240.4 Hz is redelijk laag en de meeste mensen die gevoelig zijn aan flickering kunnen dit dus waarnemen of geïrriteerde ogen krijgen (gebruikmakend van de vermelde helderheid en lager). Ter vergelijking: 52 % van alle geteste toestellen maakten geen gebruik van PWM om de schermhelderheid te verlagen. Als het wel werd gebruikt, werd een gemiddelde van 7754 (minimum: 5 - maximum: 343500) Hz waargenomen. | |||
Flikkering of pulsbreedtemodulatie is aanwezig op alle helderheidsniveaus, net als op de OLED-panelen voor de nieuwste Asus VivoBook of ZenBook laptops. De frequentie is 240,4 Hz van 0 tot 40 procent helderheid en 60 Hz van 41 tot 100 procent helderheid.

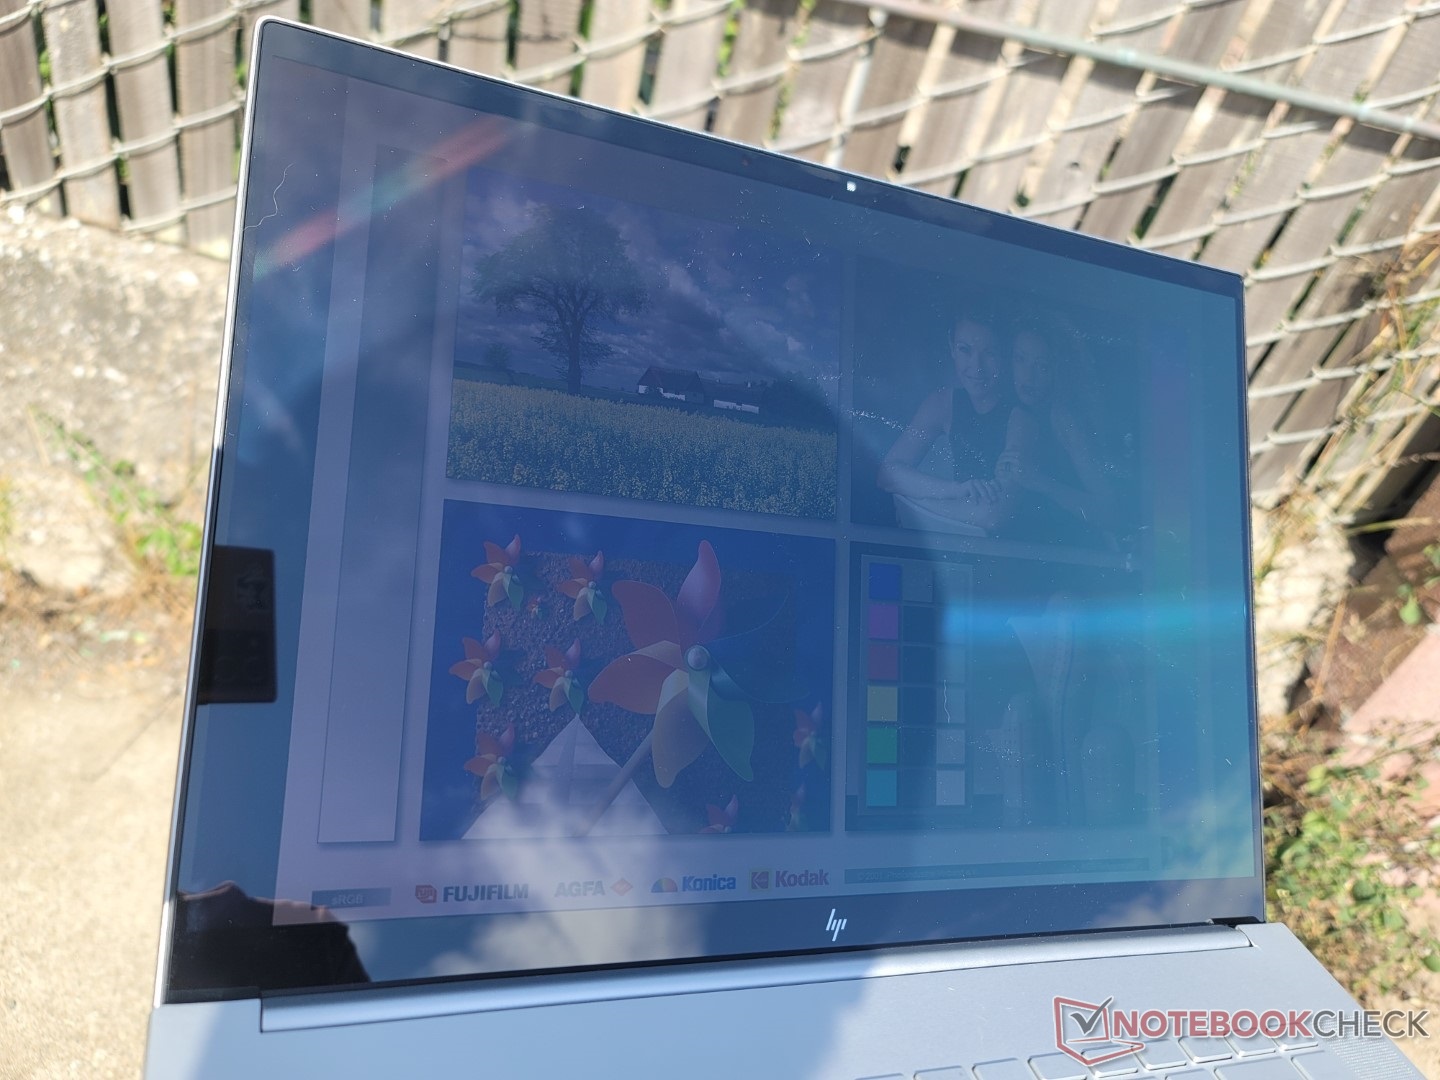
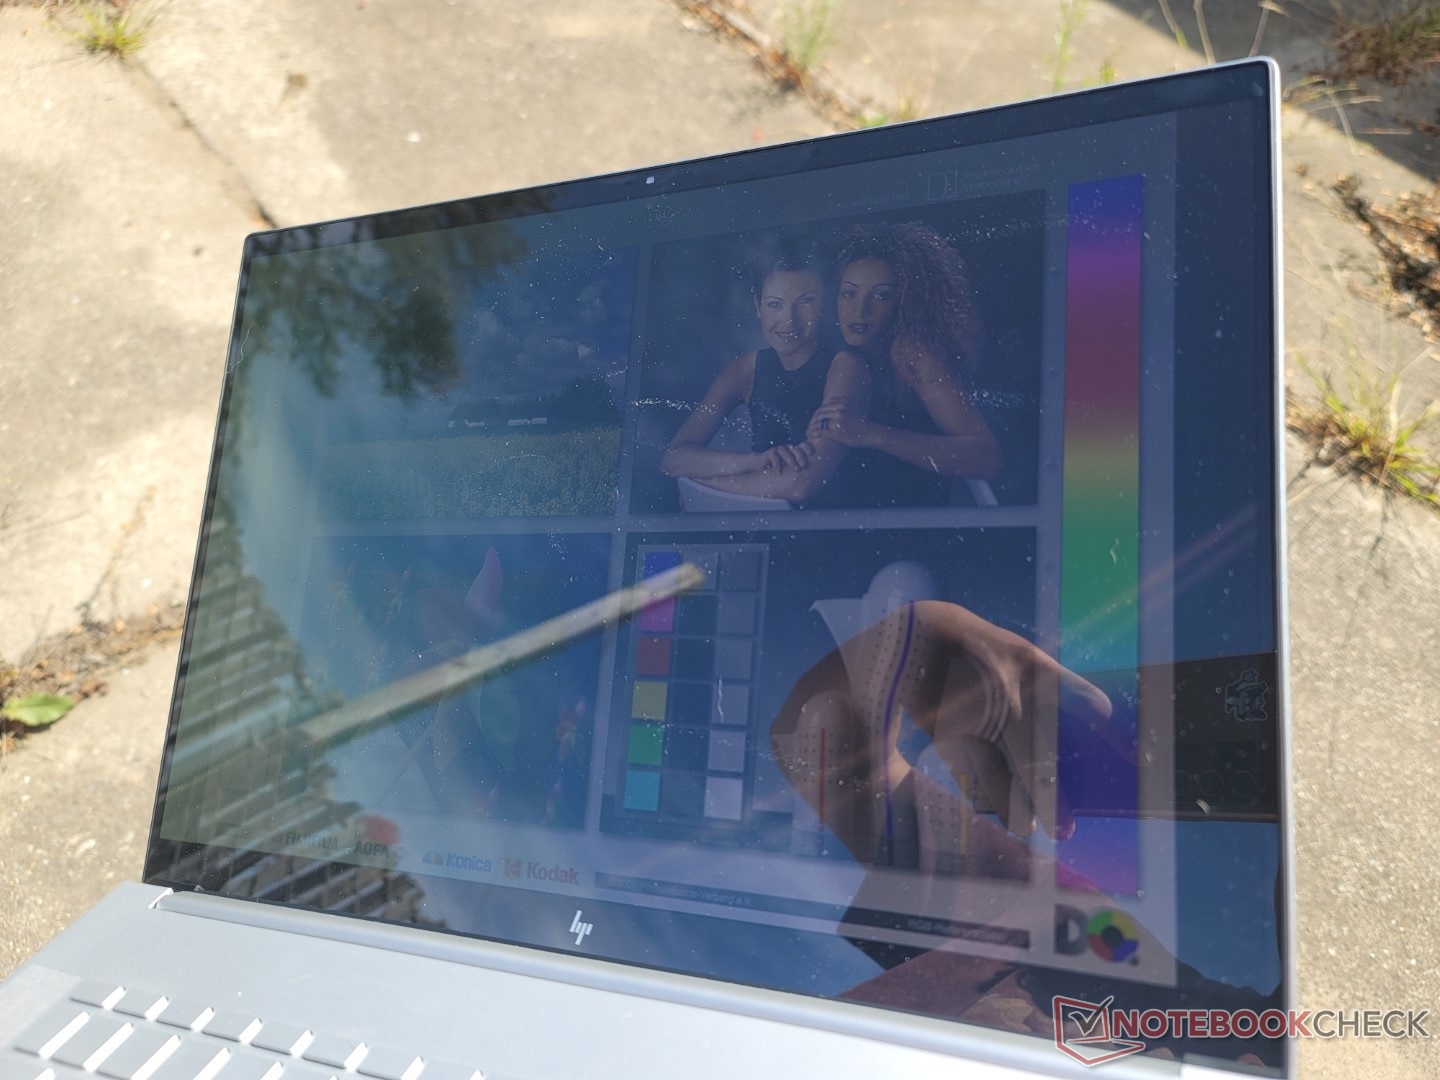
Verblinding is onvermijdelijk in de meeste omstandigheden buiten. Het glanzende display is lang niet zo helder als het display van de MacBook Pro 16. Met iets meer dan 320 nits maximaal is dit een van de zwakkere OLED-panelen op de markt.
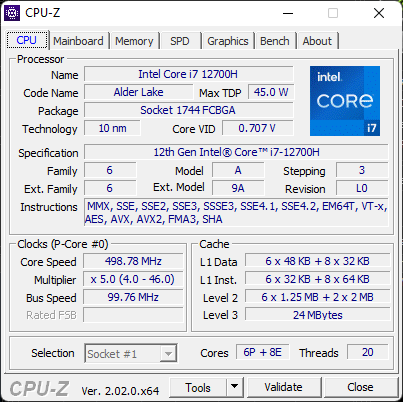
Prestaties - Intel 12e generatie Core H
Testomstandigheden
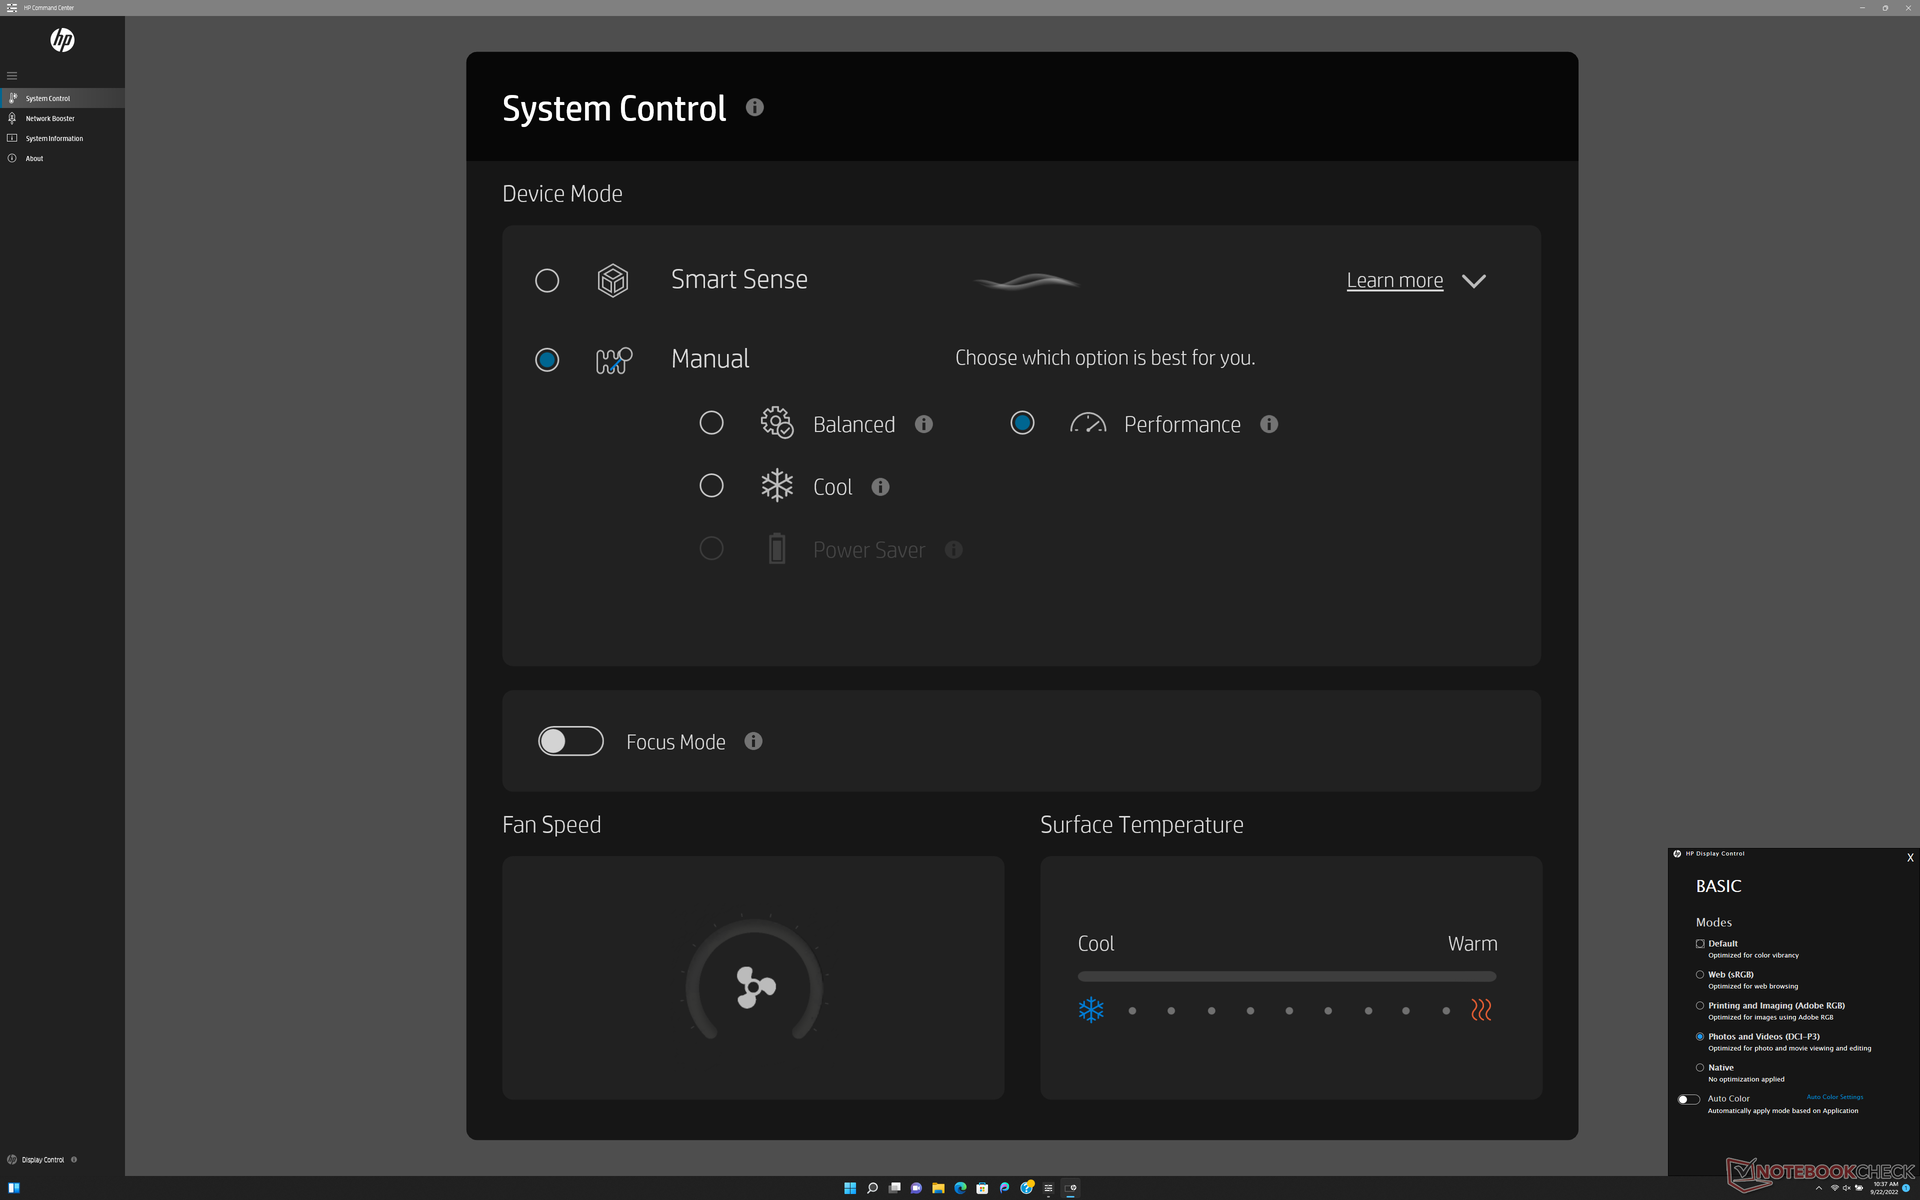
We hebben ons toestel via zowel Windows als de HP Command Center software in de Performance modus gezet voordat we onderstaande benchmarks uitvoerden. HP Command Center is de hub voor het regelen van energieprofielen en schermkleuren, zoals blijkt uit onderstaande schermafbeelding.
Processor
Multi-thread prestaties zijn ongeveer 15 procent langzamer dan de gemiddelde laptop in onze database uitgerust met dezelfde Core i7-12700H CPU. De Lenovo Legion Slim 7 16, bijvoorbeeld, is in staat om dezelfde processor sneller te draaien, zelfs na rekening te houden met eventuele throttling. Toch zijn de prestaties nog steeds aanzienlijk beter dan de 10e genCore i7-10750H in de 2020 Envy 15 met ongeveer 60 procent
Opwaarderen naar de Core i9-12900H SKU zal naar verwachting de multi-thread prestaties met maar liefst 30 tot 40 procent verbeteren ten opzichte van onze Core i7-12700H SKU.
Cinebench R15 Multi Loop
Cinebench R23: Multi Core | Single Core
Cinebench R15: CPU Multi 64Bit | CPU Single 64Bit
Blender: v2.79 BMW27 CPU
7-Zip 18.03: 7z b 4 | 7z b 4 -mmt1
Geekbench 5.5: Multi-Core | Single-Core
HWBOT x265 Benchmark v2.2: 4k Preset
LibreOffice : 20 Documents To PDF
R Benchmark 2.5: Overall mean
Cinebench R23: Multi Core | Single Core
Cinebench R15: CPU Multi 64Bit | CPU Single 64Bit
Blender: v2.79 BMW27 CPU
7-Zip 18.03: 7z b 4 | 7z b 4 -mmt1
Geekbench 5.5: Multi-Core | Single-Core
HWBOT x265 Benchmark v2.2: 4k Preset
LibreOffice : 20 Documents To PDF
R Benchmark 2.5: Overall mean
* ... kleiner is beter
AIDA64: FP32 Ray-Trace | FPU Julia | CPU SHA3 | CPU Queen | FPU SinJulia | FPU Mandel | CPU AES | CPU ZLib | FP64 Ray-Trace | CPU PhotoWorxx
| Performance rating | |
| Lenovo ThinkBook 16 G4+ IAP | |
| HP Envy 16 h0112nr | |
| MSI Creator Z16P B12UHST | |
| Gemiddeld Intel Core i7-12700H | |
| Dell Inspiron 16 Plus 7610-MHJ8F | |
| Huawei MateBook 16s i7 | |
| AIDA64 / FP32 Ray-Trace | |
| Lenovo ThinkBook 16 G4+ IAP | |
| HP Envy 16 h0112nr | |
| Gemiddeld Intel Core i7-12700H (2585 - 17957, n=64) | |
| Dell Inspiron 16 Plus 7610-MHJ8F | |
| MSI Creator Z16P B12UHST | |
| Huawei MateBook 16s i7 | |
| AIDA64 / FPU Julia | |
| Lenovo ThinkBook 16 G4+ IAP | |
| HP Envy 16 h0112nr | |
| Dell Inspiron 16 Plus 7610-MHJ8F | |
| Gemiddeld Intel Core i7-12700H (12439 - 90760, n=64) | |
| MSI Creator Z16P B12UHST | |
| Huawei MateBook 16s i7 | |
| AIDA64 / CPU SHA3 | |
| Dell Inspiron 16 Plus 7610-MHJ8F | |
| Lenovo ThinkBook 16 G4+ IAP | |
| Gemiddeld Intel Core i7-12700H (833 - 4242, n=64) | |
| MSI Creator Z16P B12UHST | |
| HP Envy 16 h0112nr | |
| Huawei MateBook 16s i7 | |
| AIDA64 / CPU Queen | |
| MSI Creator Z16P B12UHST | |
| Lenovo ThinkBook 16 G4+ IAP | |
| HP Envy 16 h0112nr | |
| Gemiddeld Intel Core i7-12700H (57923 - 103202, n=63) | |
| Huawei MateBook 16s i7 | |
| Dell Inspiron 16 Plus 7610-MHJ8F | |
| AIDA64 / FPU SinJulia | |
| MSI Creator Z16P B12UHST | |
| Lenovo ThinkBook 16 G4+ IAP | |
| Gemiddeld Intel Core i7-12700H (3249 - 9939, n=64) | |
| Dell Inspiron 16 Plus 7610-MHJ8F | |
| HP Envy 16 h0112nr | |
| Huawei MateBook 16s i7 | |
| AIDA64 / FPU Mandel | |
| Lenovo ThinkBook 16 G4+ IAP | |
| Dell Inspiron 16 Plus 7610-MHJ8F | |
| HP Envy 16 h0112nr | |
| Gemiddeld Intel Core i7-12700H (7135 - 44760, n=64) | |
| MSI Creator Z16P B12UHST | |
| Huawei MateBook 16s i7 | |
| AIDA64 / CPU AES | |
| Dell Inspiron 16 Plus 7610-MHJ8F | |
| HP Envy 16 h0112nr | |
| MSI Creator Z16P B12UHST | |
| Gemiddeld Intel Core i7-12700H (31839 - 144360, n=64) | |
| Lenovo ThinkBook 16 G4+ IAP | |
| Huawei MateBook 16s i7 | |
| AIDA64 / CPU ZLib | |
| MSI Creator Z16P B12UHST | |
| Lenovo ThinkBook 16 G4+ IAP | |
| Gemiddeld Intel Core i7-12700H (305 - 1171, n=64) | |
| HP Envy 16 h0112nr | |
| Dell Inspiron 16 Plus 7610-MHJ8F | |
| Huawei MateBook 16s i7 | |
| AIDA64 / FP64 Ray-Trace | |
| Lenovo ThinkBook 16 G4+ IAP | |
| HP Envy 16 h0112nr | |
| Gemiddeld Intel Core i7-12700H (1437 - 9692, n=64) | |
| Dell Inspiron 16 Plus 7610-MHJ8F | |
| MSI Creator Z16P B12UHST | |
| Huawei MateBook 16s i7 | |
| AIDA64 / CPU PhotoWorxx | |
| Huawei MateBook 16s i7 | |
| MSI Creator Z16P B12UHST | |
| Lenovo ThinkBook 16 G4+ IAP | |
| HP Envy 16 h0112nr | |
| Gemiddeld Intel Core i7-12700H (12863 - 52207, n=64) | |
| Dell Inspiron 16 Plus 7610-MHJ8F | |
Systeemprestaties
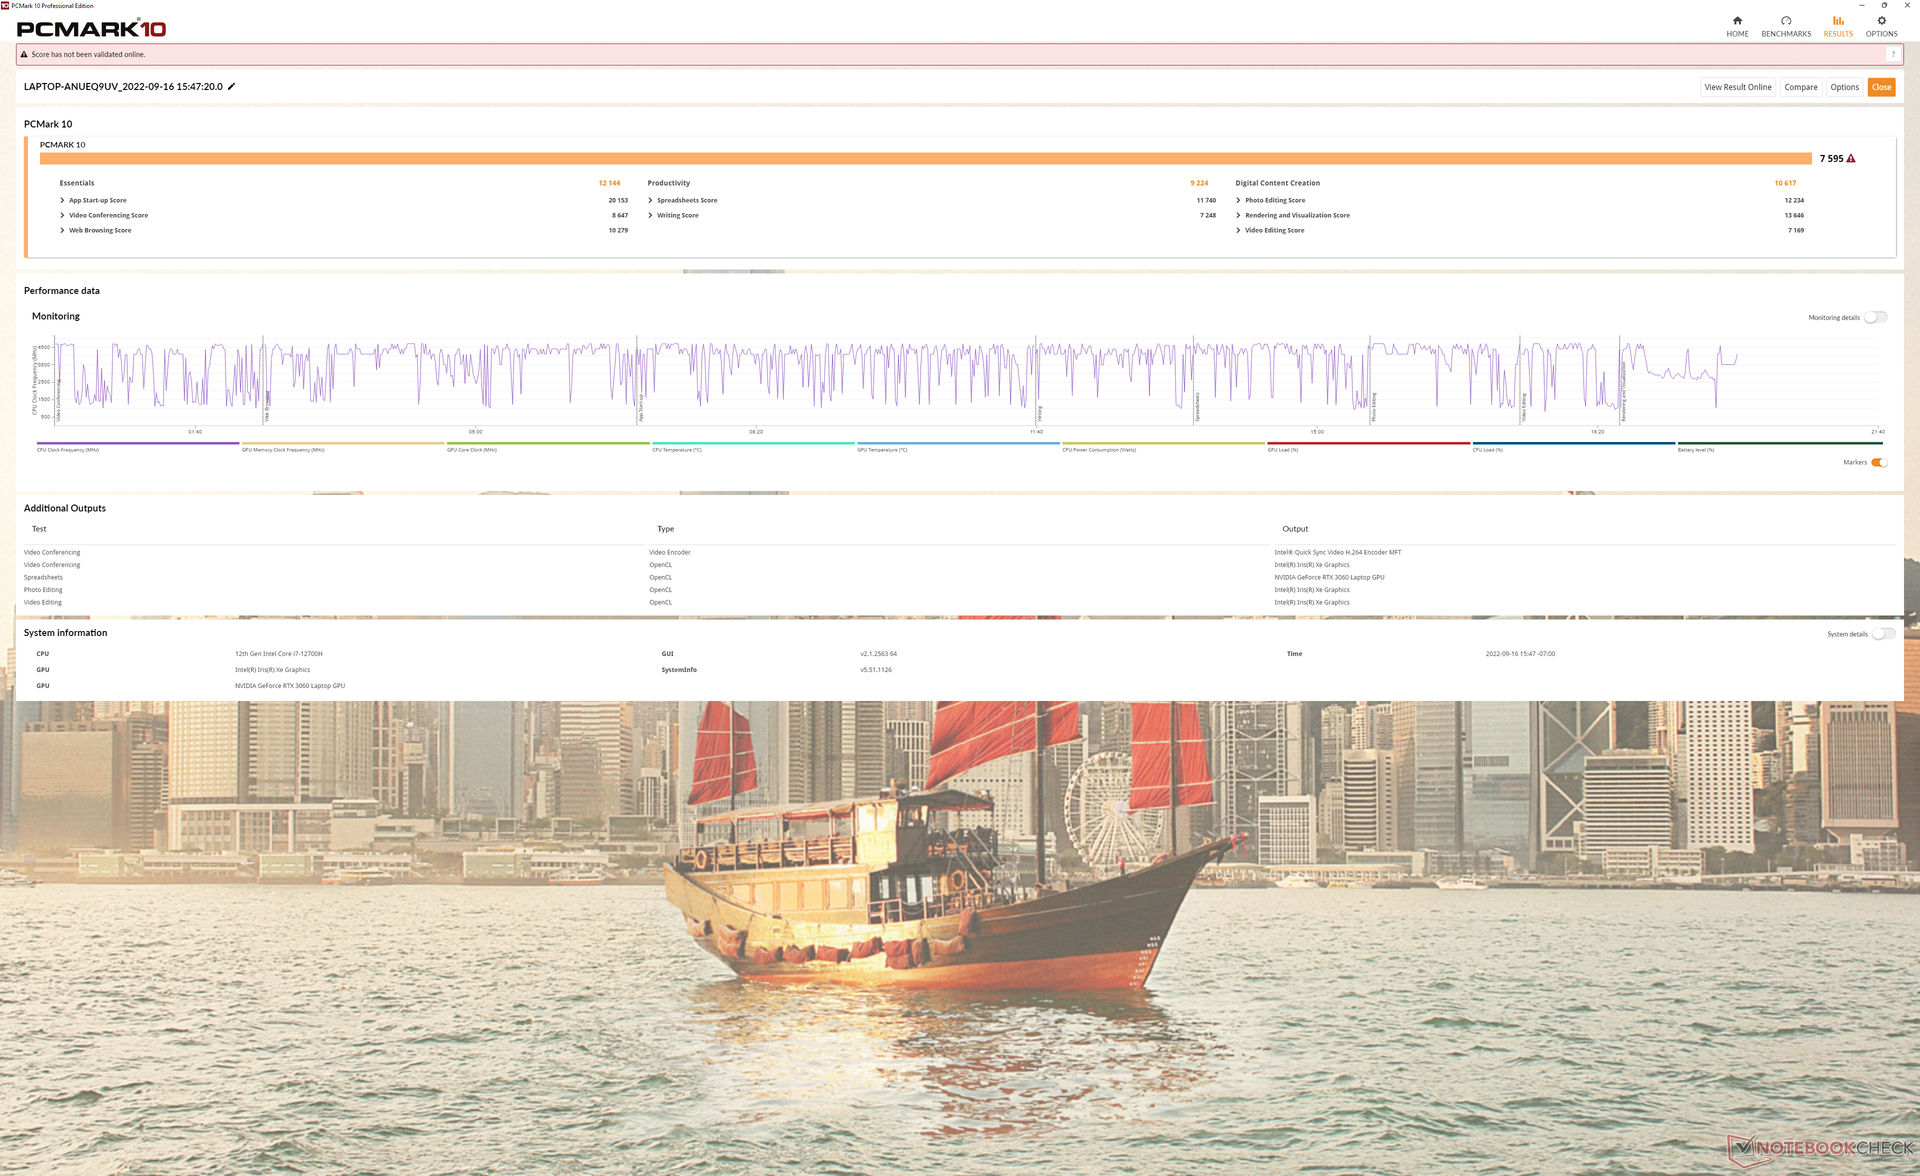
PCMark resultaten zijn consequent hoger dan de 2020 Envy 15 met grote marges. We vermoeden dat de overstap van Intel Optane een grote rol heeft gespeeld in de stijging van de scores.
CrossMark: Overall | Productivity | Creativity | Responsiveness
| PCMark 10 / Score | |
| MSI Creator Z16P B12UHST | |
| HP Envy 16 h0112nr | |
| Gemiddeld Intel Core i7-12700H, NVIDIA GeForce RTX 3060 Laptop GPU (5986 - 8156, n=12) | |
| Huawei MateBook 16s i7 | |
| HP Envy 15-ep0098nr | |
| Dell Inspiron 16 Plus 7610-MHJ8F | |
| PCMark 10 / Essentials | |
| HP Envy 16 h0112nr | |
| Huawei MateBook 16s i7 | |
| MSI Creator Z16P B12UHST | |
| Gemiddeld Intel Core i7-12700H, NVIDIA GeForce RTX 3060 Laptop GPU (9289 - 12144, n=12) | |
| Dell Inspiron 16 Plus 7610-MHJ8F | |
| HP Envy 15-ep0098nr | |
| PCMark 10 / Productivity | |
| MSI Creator Z16P B12UHST | |
| HP Envy 16 h0112nr | |
| Gemiddeld Intel Core i7-12700H, NVIDIA GeForce RTX 3060 Laptop GPU (6161 - 10362, n=12) | |
| Huawei MateBook 16s i7 | |
| HP Envy 15-ep0098nr | |
| Dell Inspiron 16 Plus 7610-MHJ8F | |
| PCMark 10 / Digital Content Creation | |
| MSI Creator Z16P B12UHST | |
| Gemiddeld Intel Core i7-12700H, NVIDIA GeForce RTX 3060 Laptop GPU (8950 - 12554, n=12) | |
| HP Envy 16 h0112nr | |
| Huawei MateBook 16s i7 | |
| HP Envy 15-ep0098nr | |
| Dell Inspiron 16 Plus 7610-MHJ8F | |
| CrossMark / Overall | |
| Huawei MateBook 16s i7 | |
| HP Envy 16 h0112nr | |
| Gemiddeld Intel Core i7-12700H, NVIDIA GeForce RTX 3060 Laptop GPU (1649 - 2017, n=11) | |
| Lenovo ThinkBook 16 G4+ IAP | |
| Apple MacBook Pro 16 2021 M1 Pro | |
| CrossMark / Productivity | |
| Huawei MateBook 16s i7 | |
| HP Envy 16 h0112nr | |
| Gemiddeld Intel Core i7-12700H, NVIDIA GeForce RTX 3060 Laptop GPU (1536 - 1958, n=11) | |
| Lenovo ThinkBook 16 G4+ IAP | |
| Apple MacBook Pro 16 2021 M1 Pro | |
| CrossMark / Creativity | |
| Apple MacBook Pro 16 2021 M1 Pro | |
| HP Envy 16 h0112nr | |
| Huawei MateBook 16s i7 | |
| Lenovo ThinkBook 16 G4+ IAP | |
| Gemiddeld Intel Core i7-12700H, NVIDIA GeForce RTX 3060 Laptop GPU (1816 - 2084, n=11) | |
| CrossMark / Responsiveness | |
| Huawei MateBook 16s i7 | |
| Gemiddeld Intel Core i7-12700H, NVIDIA GeForce RTX 3060 Laptop GPU (1210 - 2207, n=11) | |
| HP Envy 16 h0112nr | |
| Lenovo ThinkBook 16 G4+ IAP | |
| Apple MacBook Pro 16 2021 M1 Pro | |
| PCMark 10 Score | 7595 punten | |
Help | ||
| AIDA64 / Memory Copy | |
| Huawei MateBook 16s i7 | |
| Lenovo ThinkBook 16 G4+ IAP | |
| MSI Creator Z16P B12UHST | |
| HP Envy 16 h0112nr | |
| Gemiddeld Intel Core i7-12700H (25615 - 80511, n=64) | |
| Dell Inspiron 16 Plus 7610-MHJ8F | |
| AIDA64 / Memory Read | |
| Lenovo ThinkBook 16 G4+ IAP | |
| Huawei MateBook 16s i7 | |
| MSI Creator Z16P B12UHST | |
| HP Envy 16 h0112nr | |
| Gemiddeld Intel Core i7-12700H (25586 - 79442, n=64) | |
| Dell Inspiron 16 Plus 7610-MHJ8F | |
| AIDA64 / Memory Write | |
| MSI Creator Z16P B12UHST | |
| Huawei MateBook 16s i7 | |
| HP Envy 16 h0112nr | |
| Lenovo ThinkBook 16 G4+ IAP | |
| Gemiddeld Intel Core i7-12700H (23679 - 88660, n=64) | |
| Dell Inspiron 16 Plus 7610-MHJ8F | |
| AIDA64 / Memory Latency | |
| Lenovo ThinkBook 16 G4+ IAP | |
| Huawei MateBook 16s i7 | |
| Dell Inspiron 16 Plus 7610-MHJ8F | |
| MSI Creator Z16P B12UHST | |
| HP Envy 16 h0112nr | |
| Gemiddeld Intel Core i7-12700H (76.2 - 133.9, n=62) | |
* ... kleiner is beter
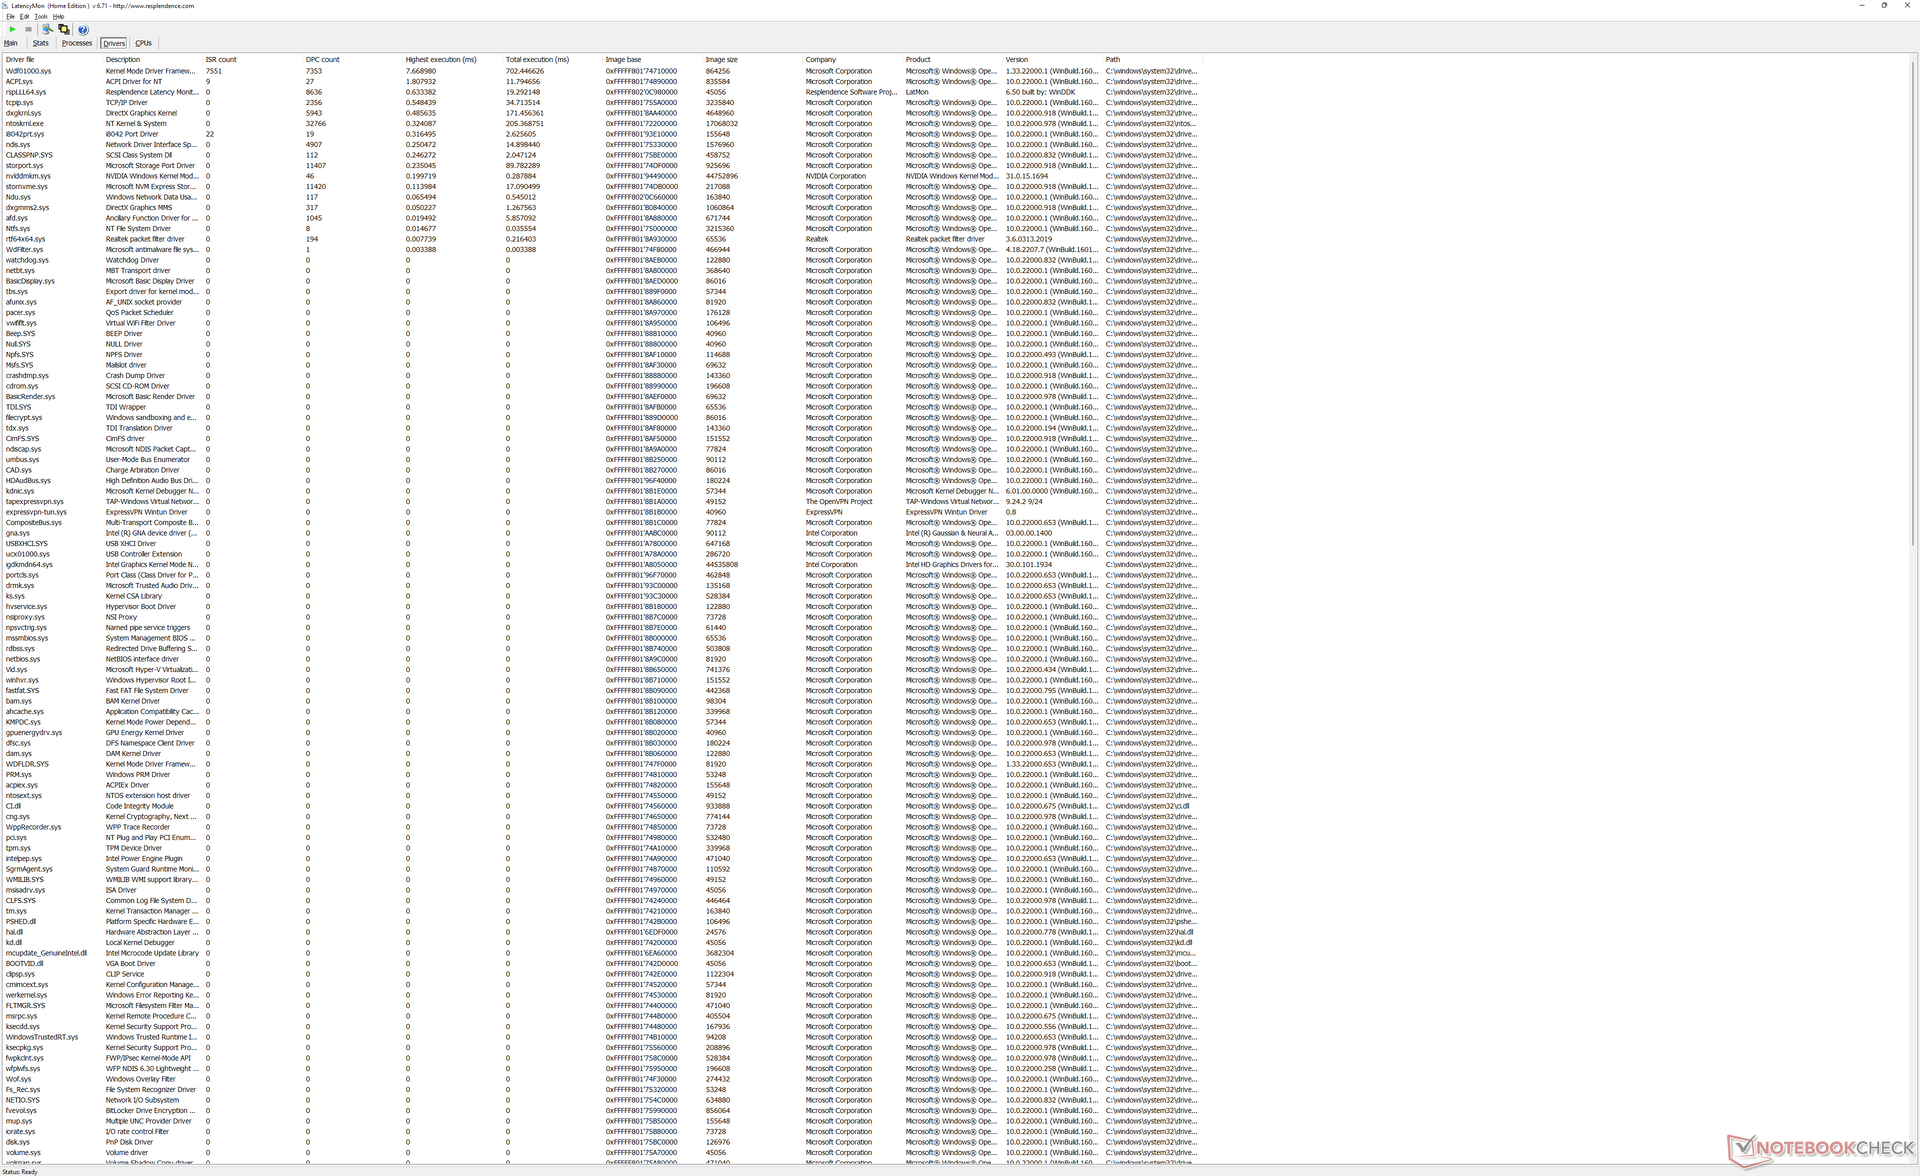
DPC latentie
LatencyMon onthult DPC-problemen bij het openen van meerdere browsertabbladen van onze homepage. het afspelen van 4K-video's bij 60 FPS is ook niet perfect, met 3 dropped frames tijdens onze testvideo van een minuut.
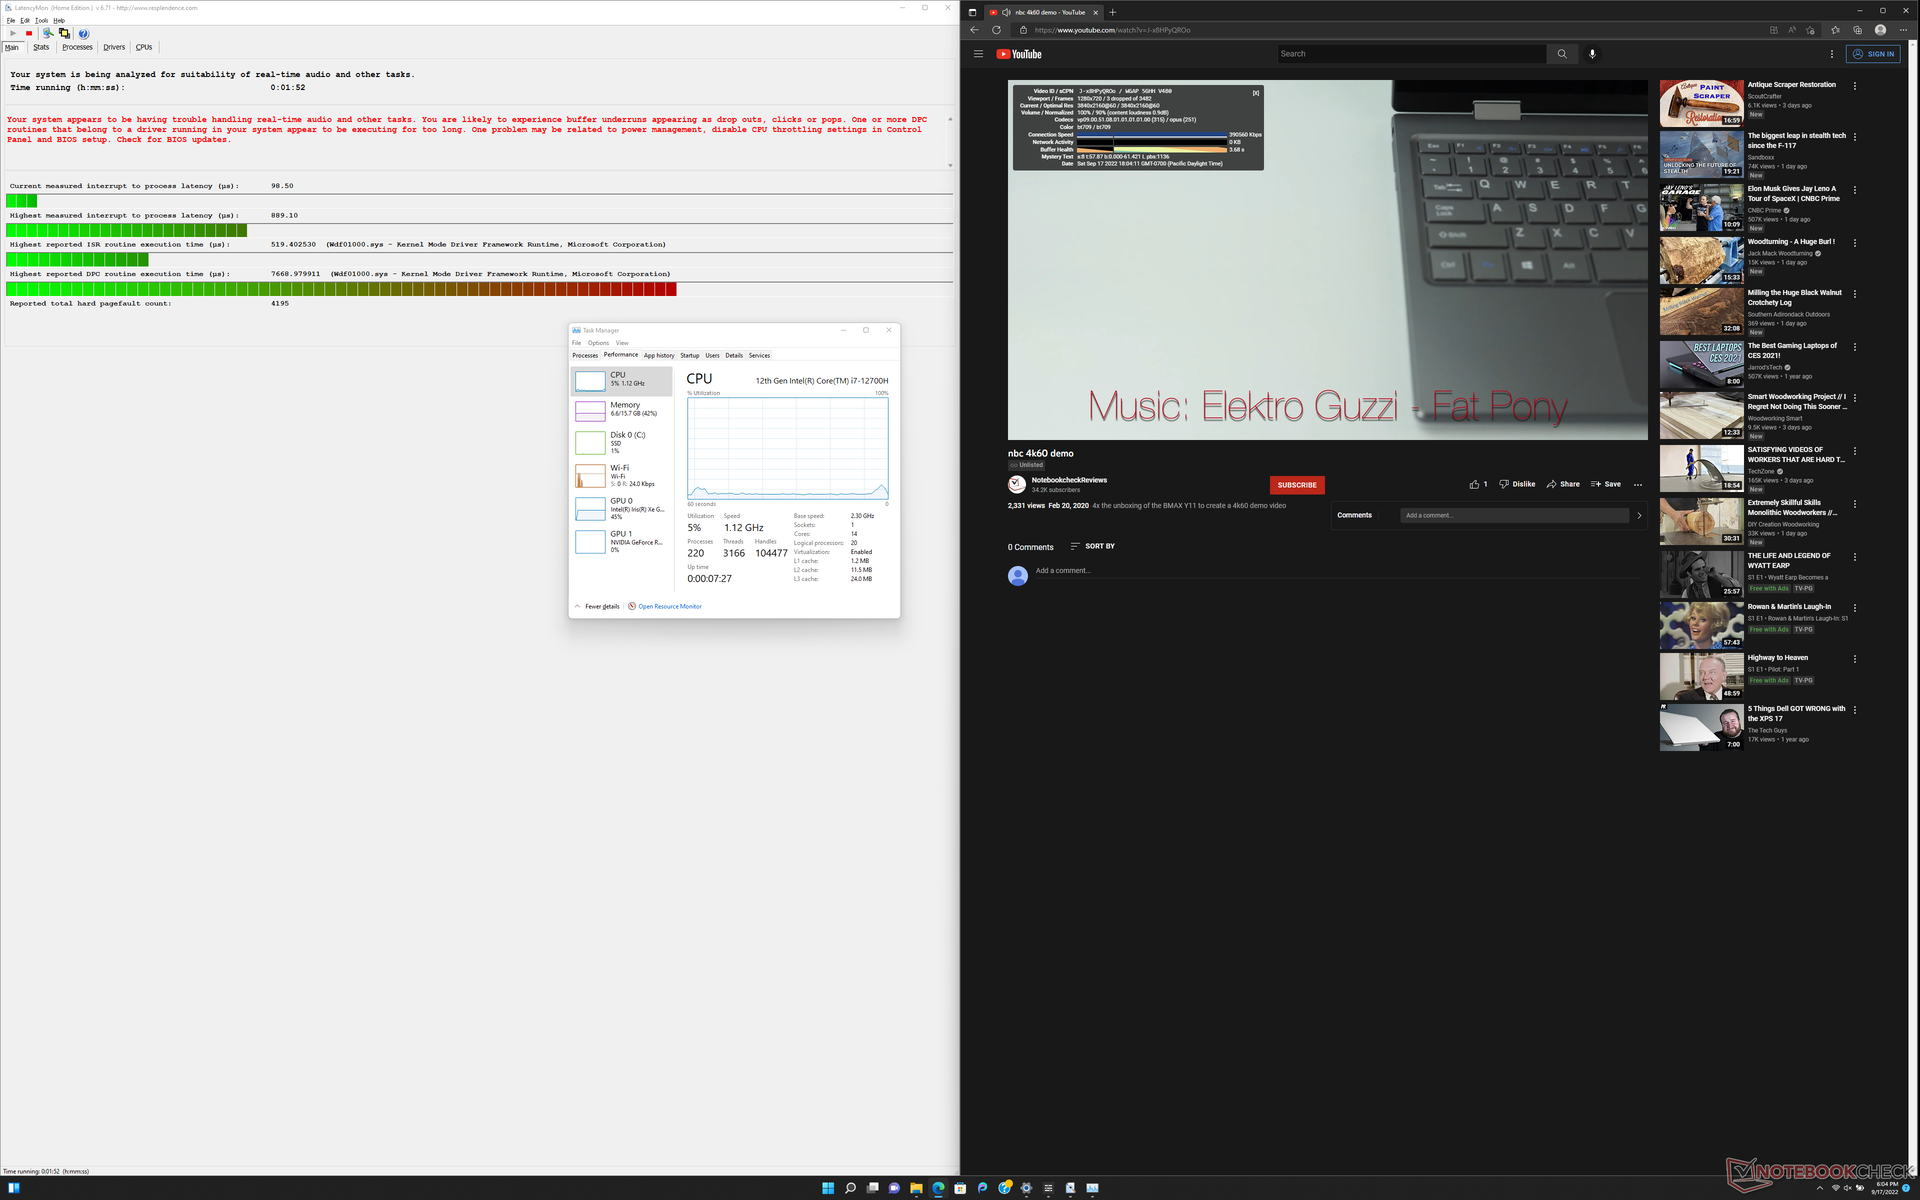
| DPC Latencies / LatencyMon - interrupt to process latency (max), Web, Youtube, Prime95 | |
| Lenovo ThinkBook 16 G4+ IAP | |
| HP Envy 16 h0112nr | |
| MSI Creator Z16P B12UHST | |
* ... kleiner is beter
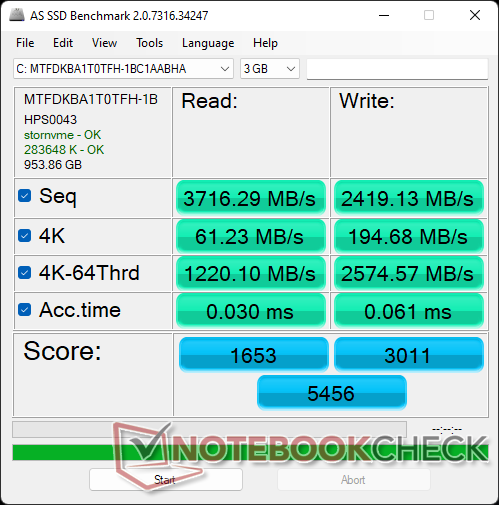
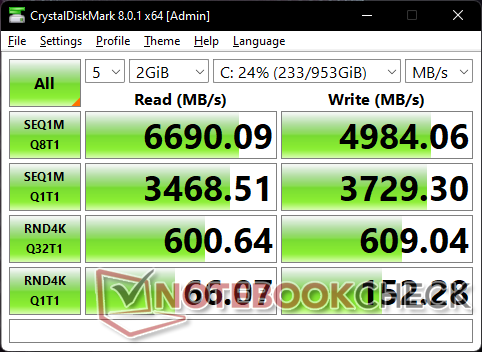
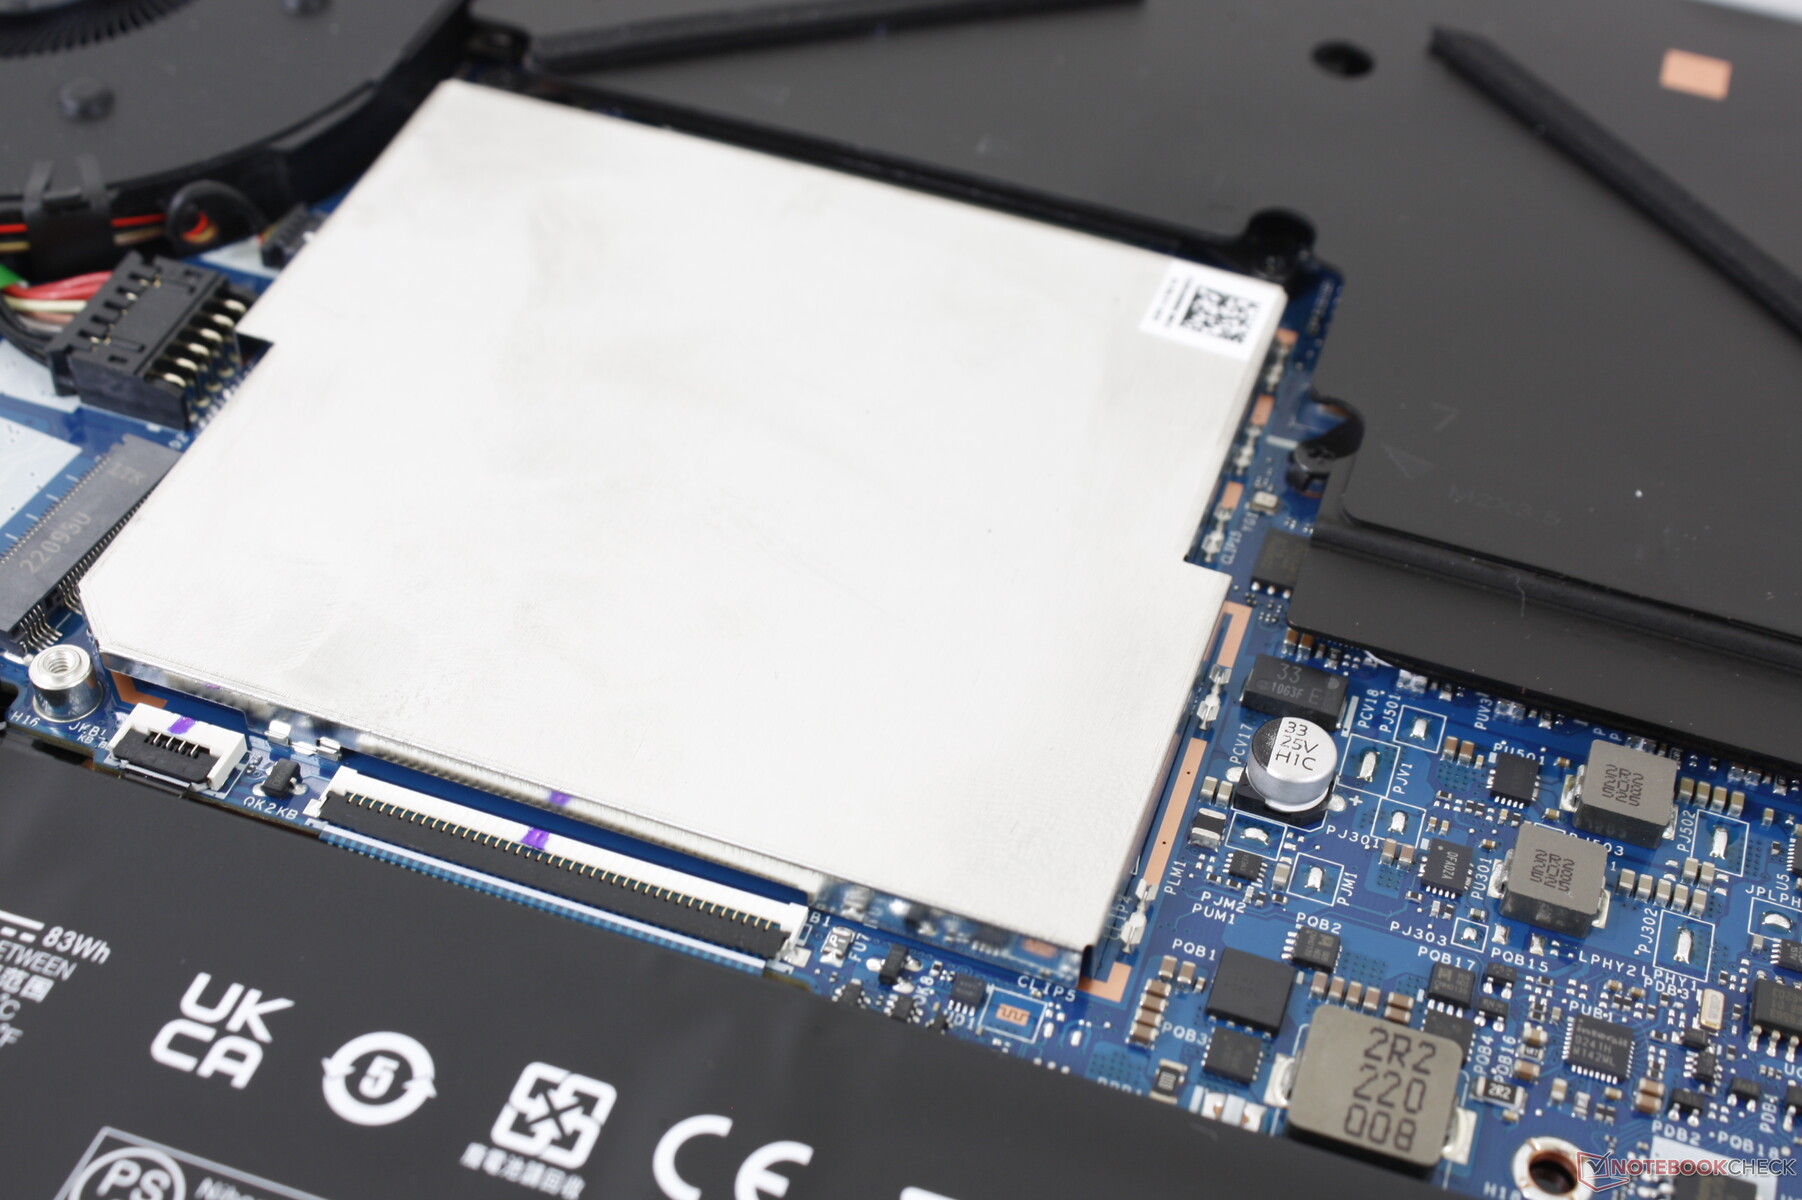
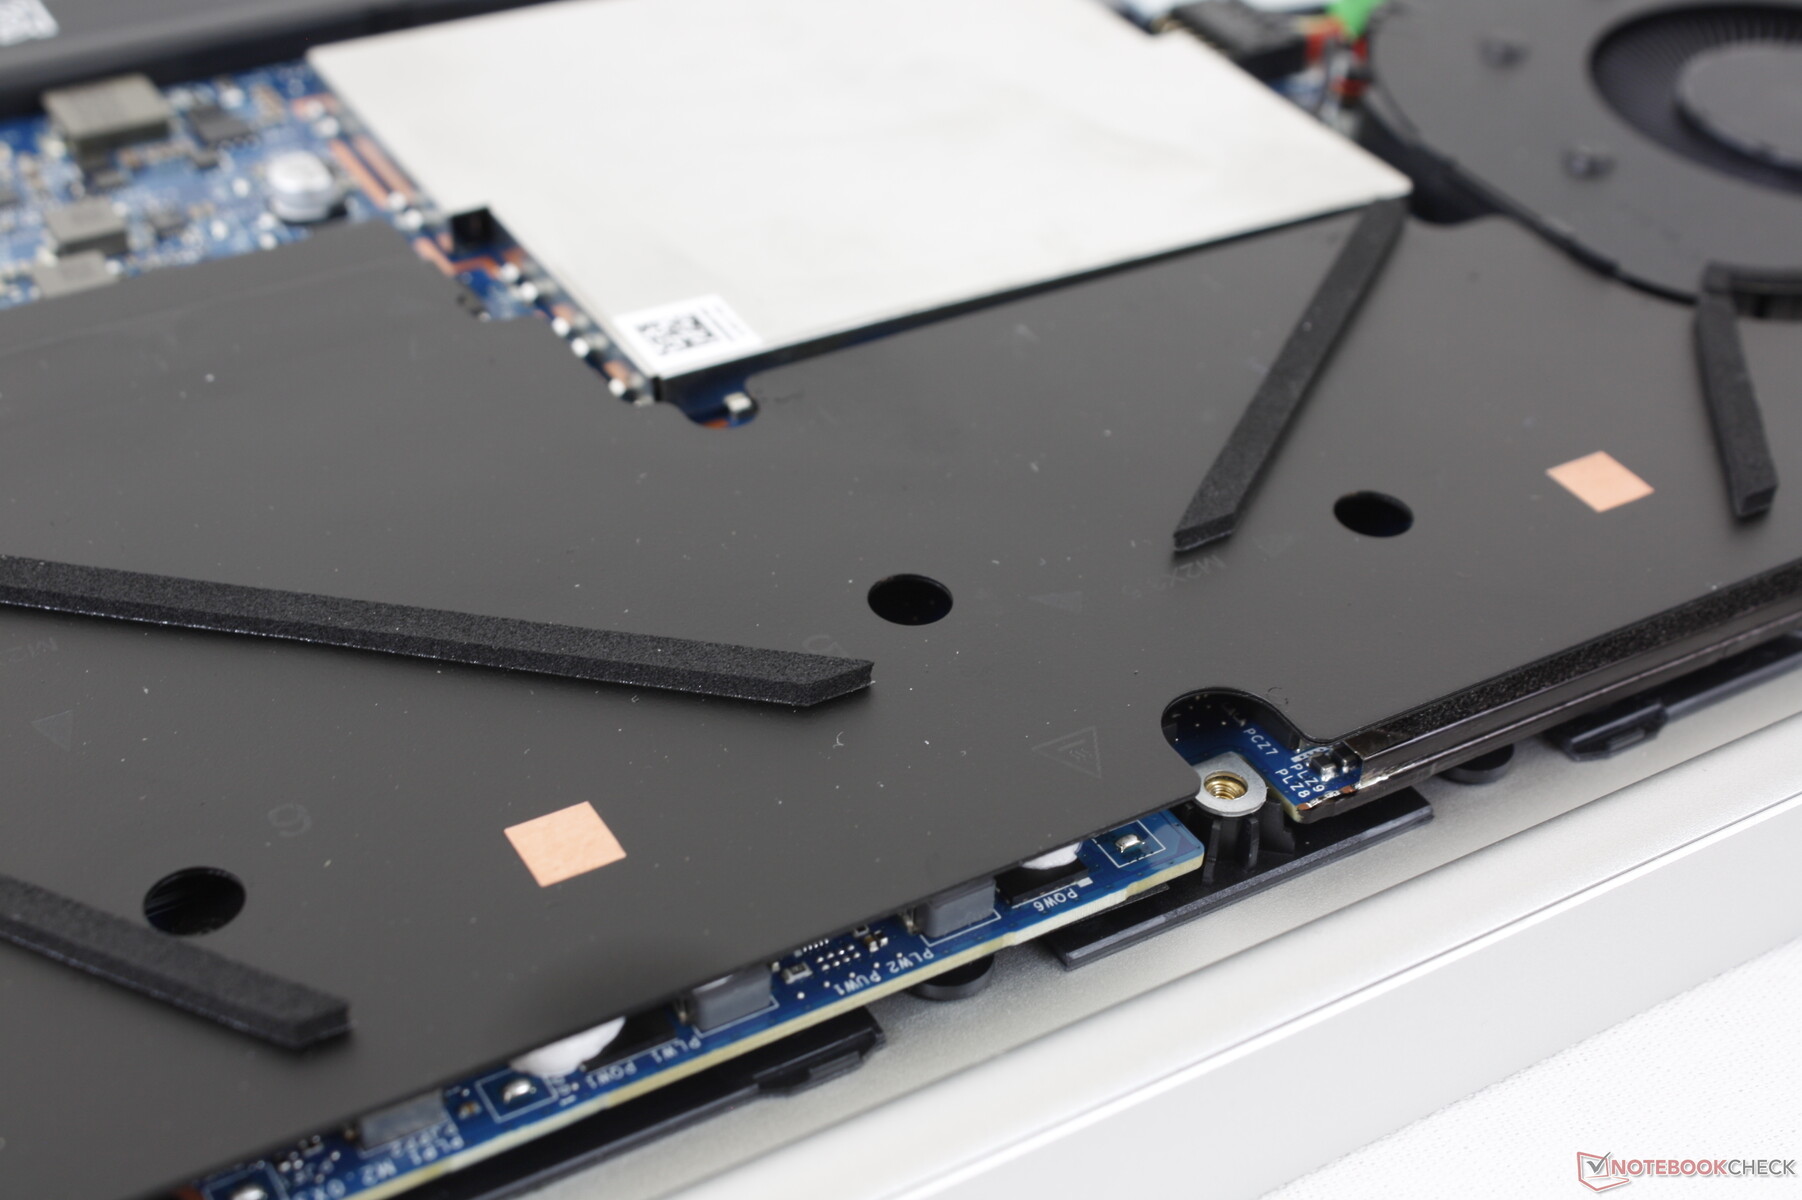
Opslagapparaten - RAID 0-ondersteuning
Onze testunit wordt geleverd met dezelfdeMicron 3400 PCIe4 x4 NVMe SSD zoals gevonden op vele andere high-end systemen waaronder de MSI Stealth GS77 of HP Spectre x360 13.5. De schijf vertoont geen throttling problemen op onze testunit, maar de schrijfsnelheden zijn lang niet zo snel als op de concurrerende Samsung PM9A1 serie.
HP levert slechts één SSD cover ondanks het feit dat er twee SSD slots zijn. Als u van plan bent een tweede schijf te installeren, dan is de kans groot dat deze bij hogere temperaturen draait.

| Drive Performance rating - Percent | |
| MSI Creator Z16P B12UHST | |
| HP Envy 16 h0112nr | |
| Huawei MateBook 16s i7 | |
| Lenovo ThinkBook 16 G4+ IAP | |
| Dell Inspiron 16 Plus 7610-MHJ8F -1! | |
* ... kleiner is beter
Disk Throttling: DiskSpd Read Loop, Queue Depth 8
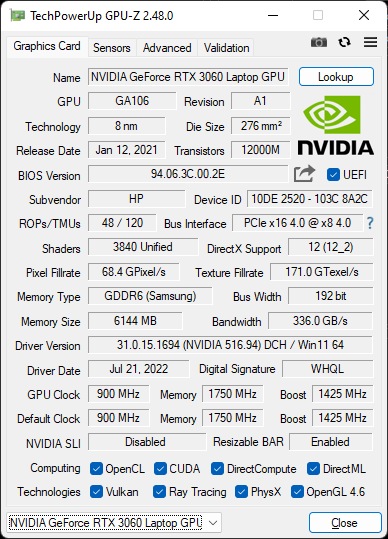
GPU-prestaties - 95 W TGP GeForce RTX 3060
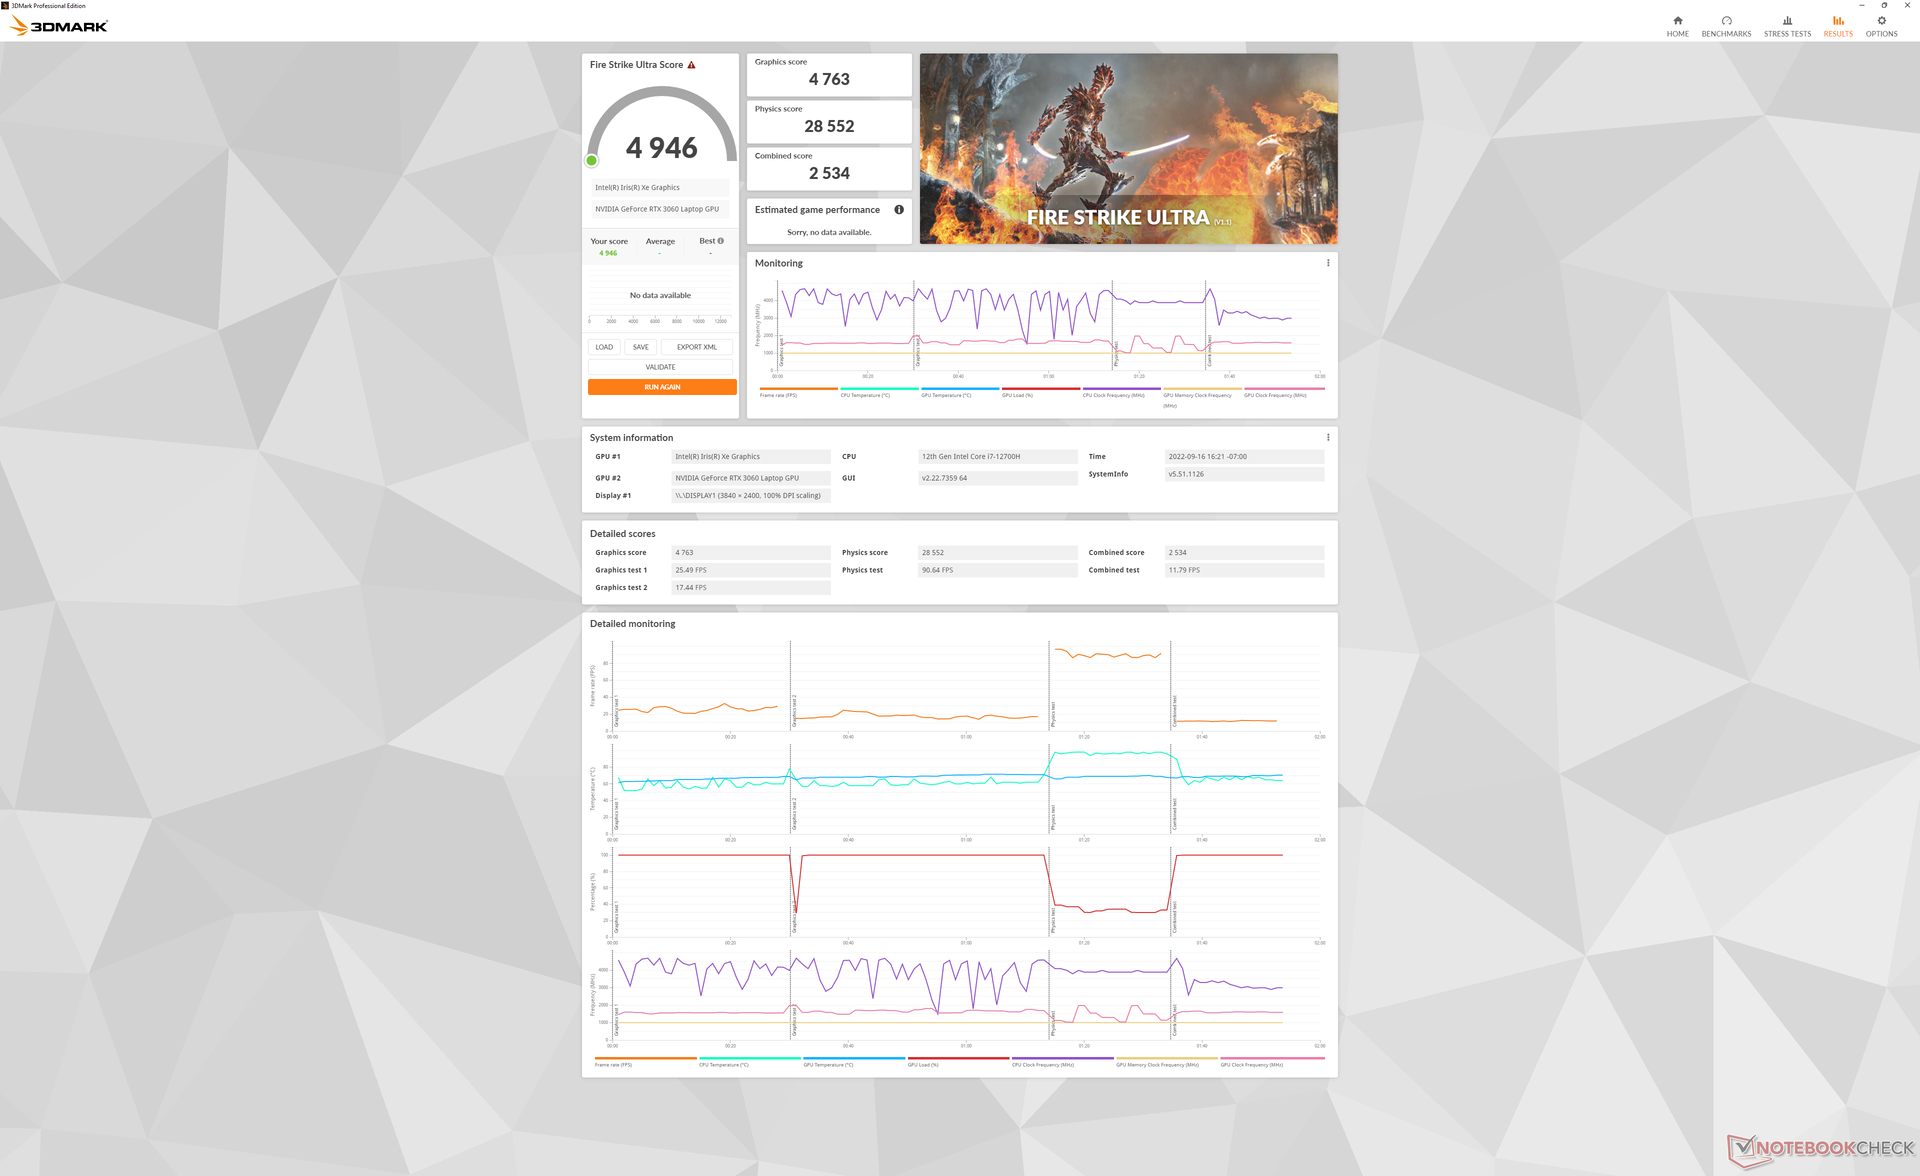
De grafische prestaties zijn ongeveer 5 procent langzamer dan de gemiddelde laptop in onze database uitgerust met dezelfde dezelfde GeForce RTX 3060. Het tekort is klein genoeg dat gebruikers het waarschijnlijk niet zullen merken.
Opwaarderen van de mindere Arc A370M naar de GeForce RTX 3060 levert gebruikers meer dan 2x zoveel grafische prestaties op.
Draaien in de Balanced mode in plaats van de Performance mode vermindert de grafische prestaties met 6 procent voor veel stillere ventilatoren, zoals beschreven in onze System Noise sectie.
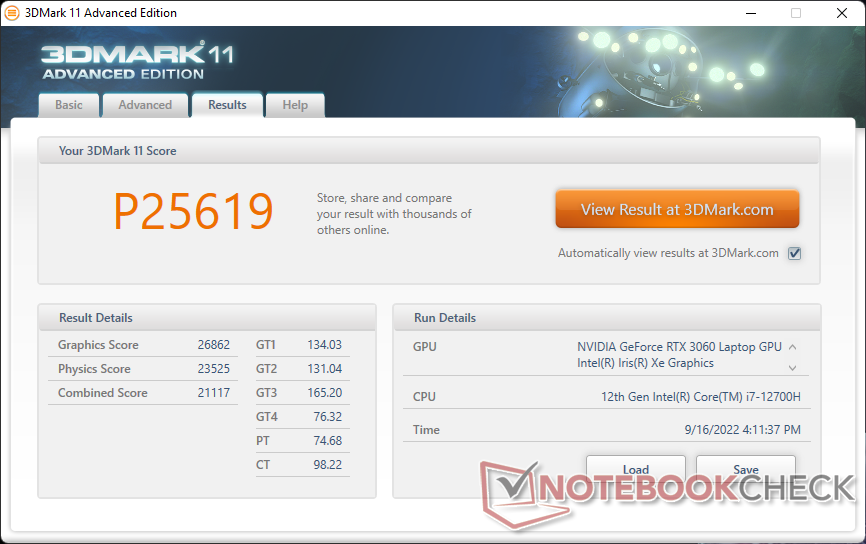
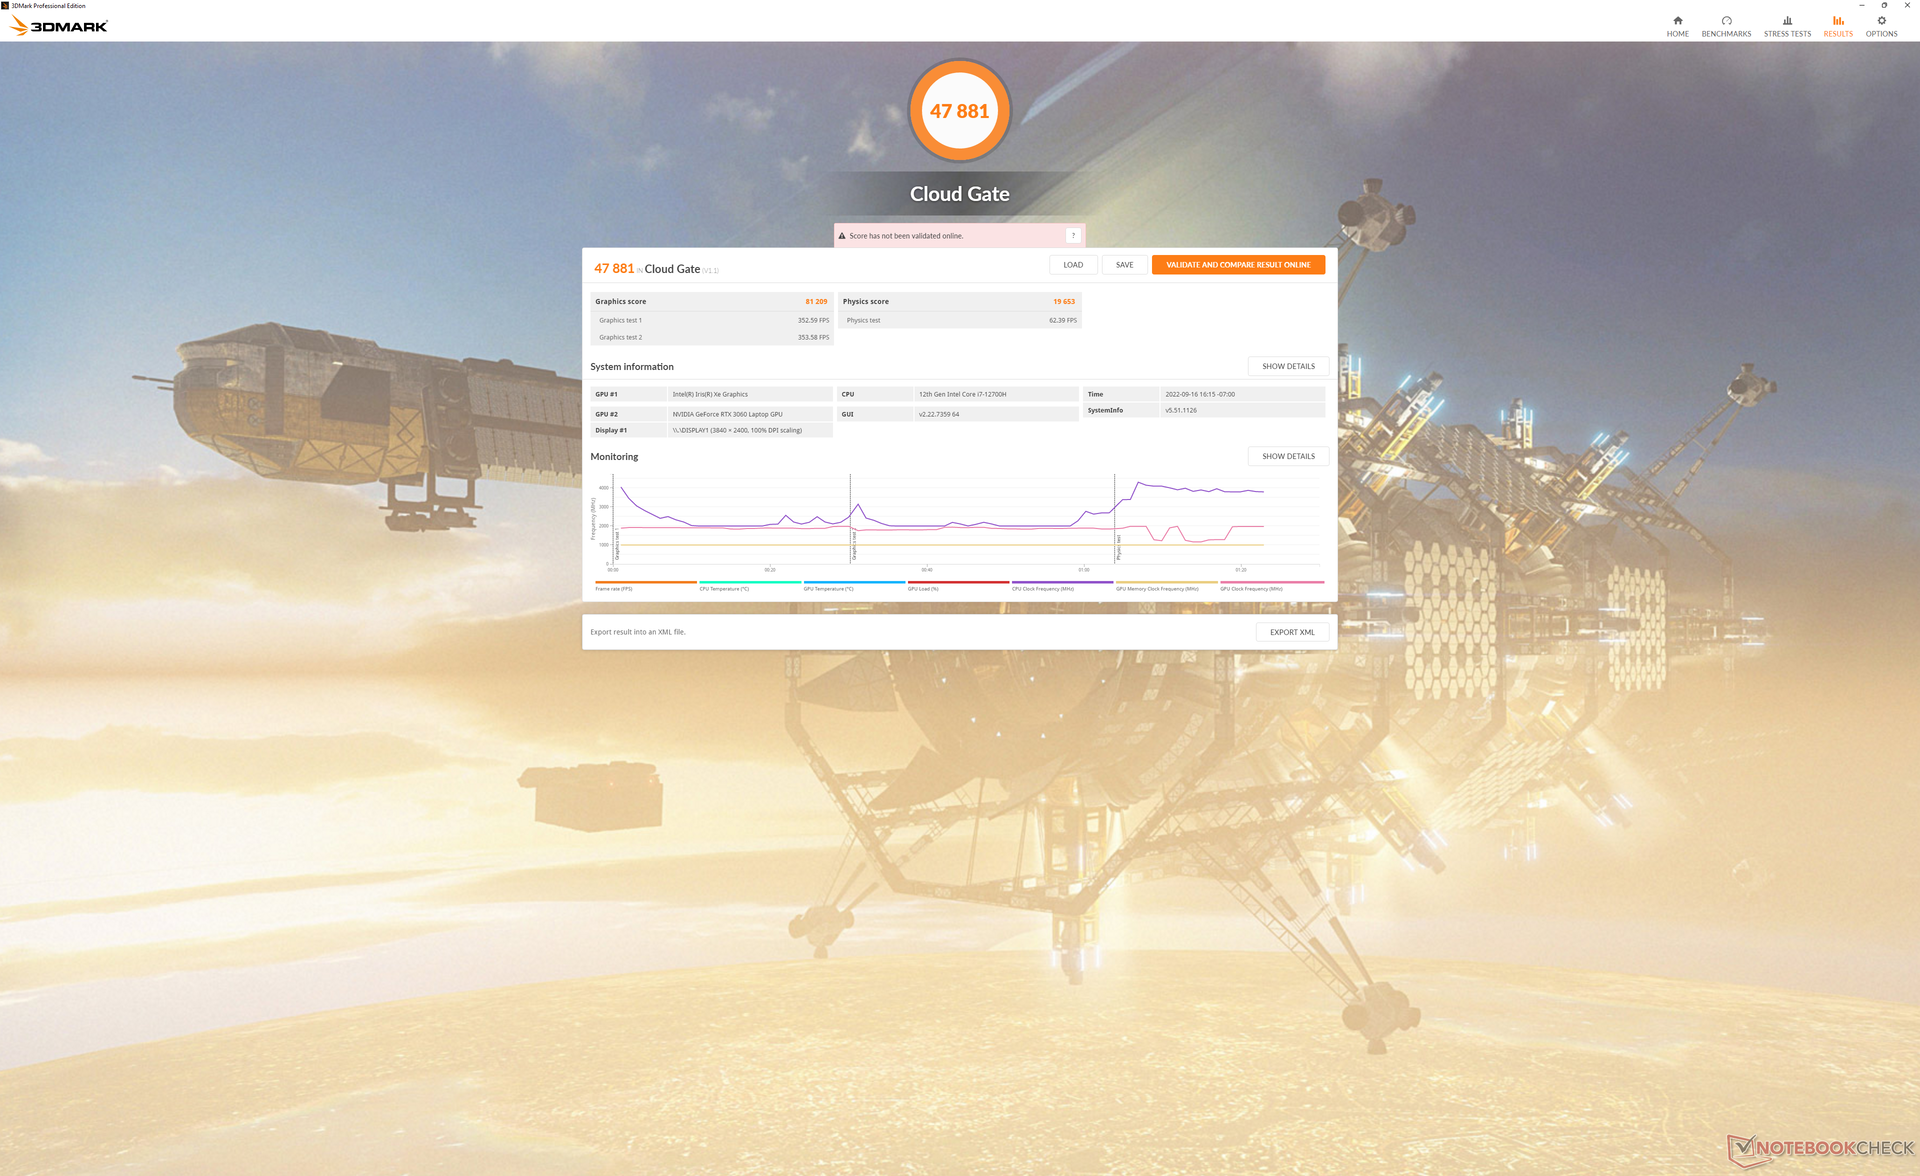

| 3DMark 11 Performance | 25619 punten | |
| 3DMark Cloud Gate Standard Score | 47881 punten | |
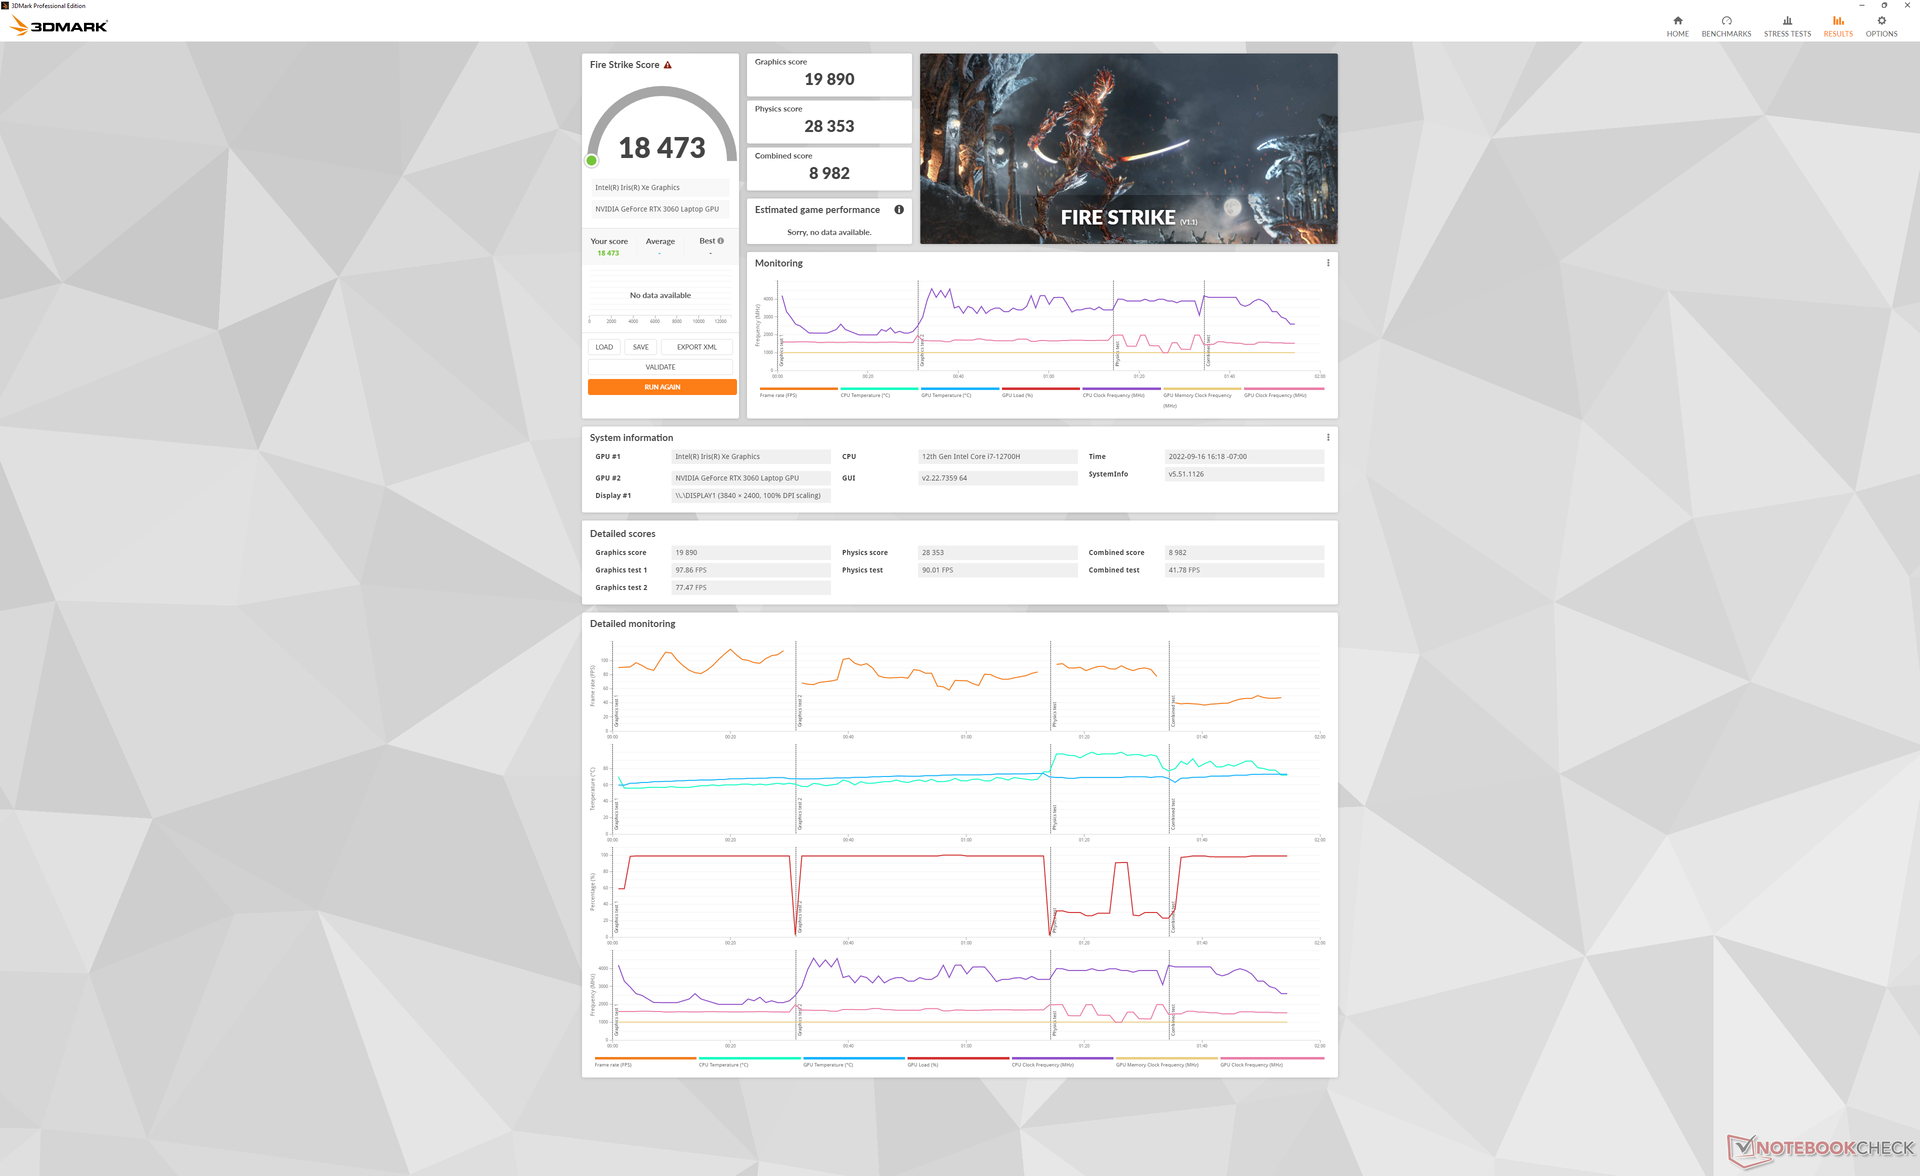
| 3DMark Fire Strike Score | 17118 punten | |
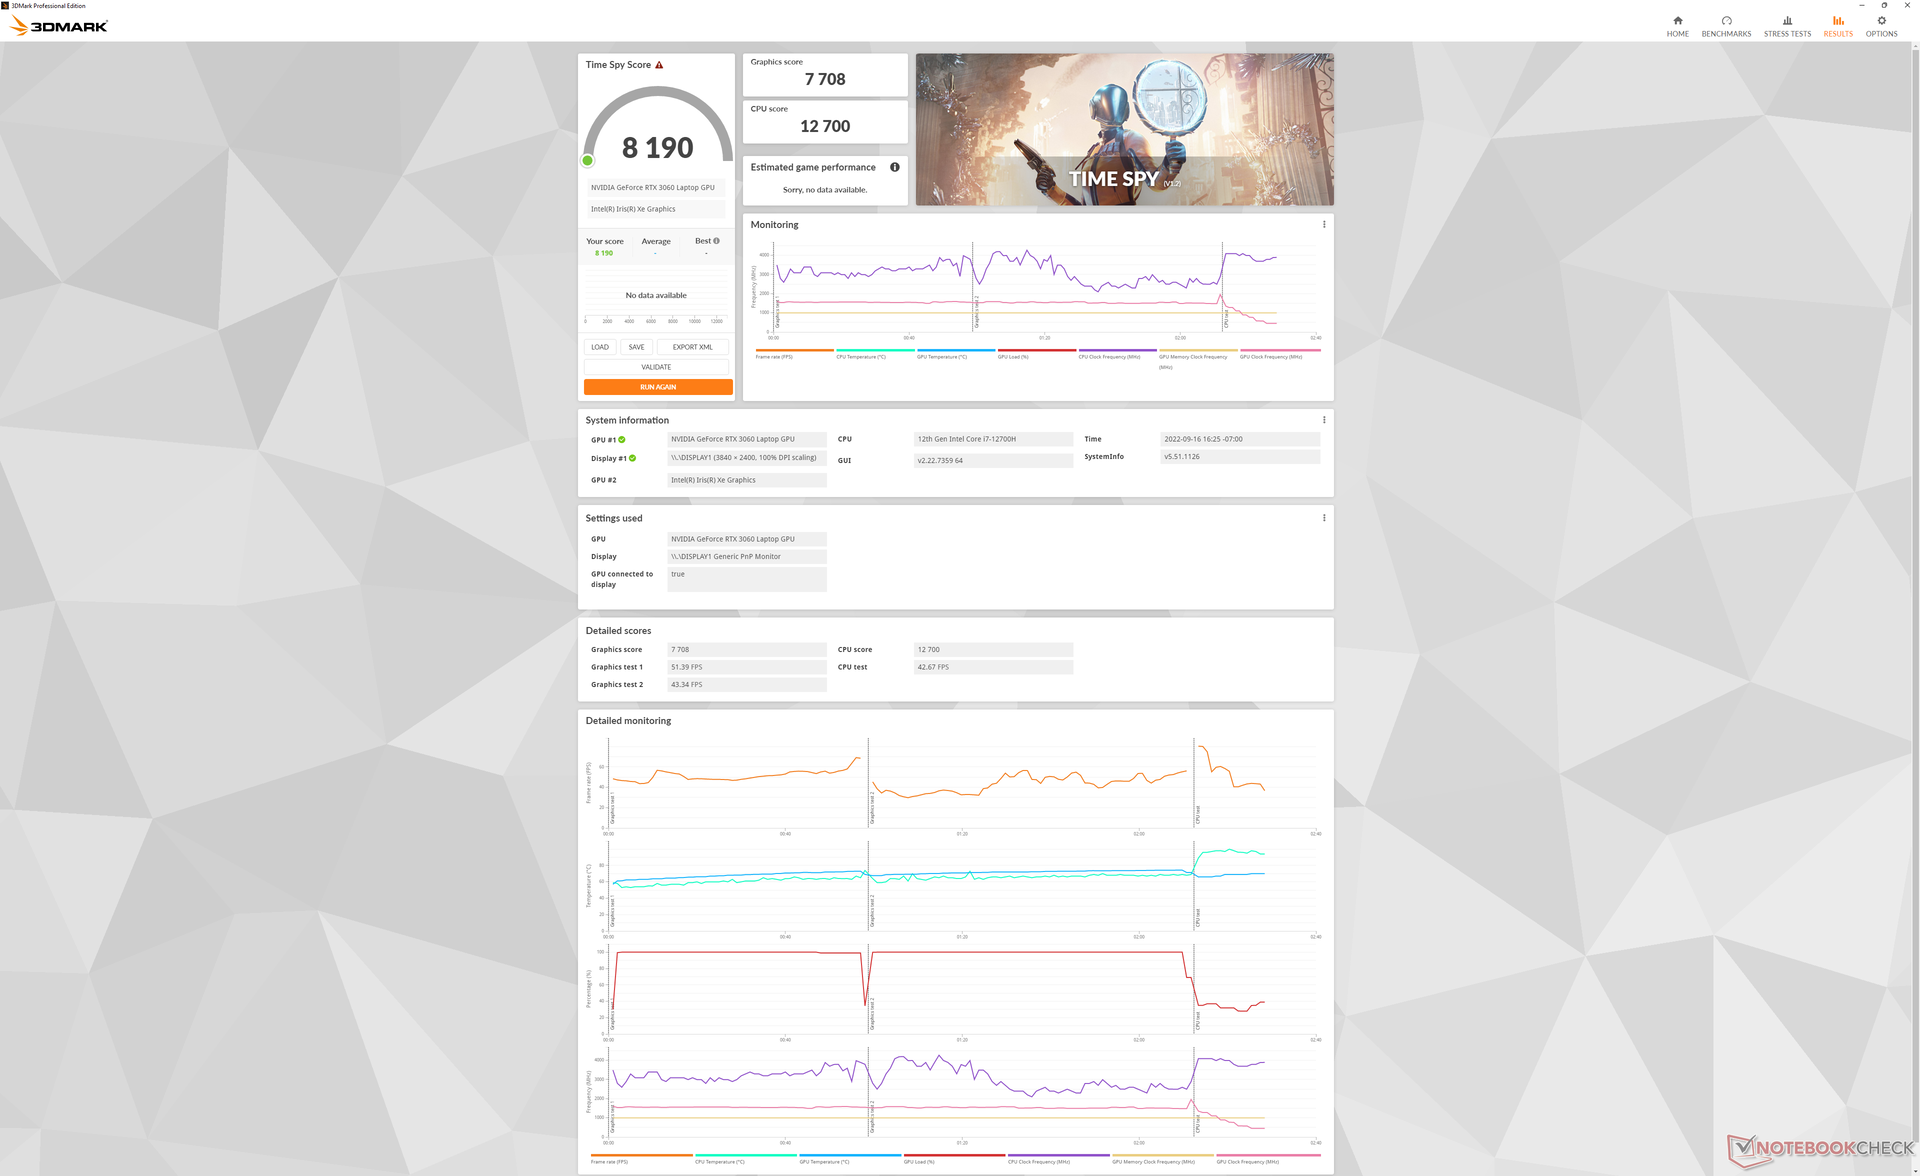
| 3DMark Time Spy Score | 8190 punten | |
Help | ||
Witcher 3 FPS Chart
| lage | gem. | hoge | ultra | QHD | 4K | |
|---|---|---|---|---|---|---|
| GTA V (2015) | 185.6 | 181.2 | 174.1 | 103.3 | 76.7 | |
| The Witcher 3 (2015) | 402.3 | 264 | 161.2 | 82.8 | 55.1 | |
| Dota 2 Reborn (2015) | 180.6 | 164.8 | 149.1 | 139 | 46.9 | |
| Final Fantasy XV Benchmark (2018) | 177.2 | 111.7 | 83.9 | 62 | 34.6 | |
| X-Plane 11.11 (2018) | 140.3 | 127 | 103 | 60.5 | ||
| Strange Brigade (2018) | 418 | 202 | 162 | 140.4 | 103.5 | |
| Cyberpunk 2077 1.6 (2022) | 115.7 | 94.4 | 72.3 | 59.5 | 17.9 |
Emissies
Systeemgeluid - even luid als vele gaming laptops
Het ventilatorgeluid heeft de neiging te pulseren als het is ingesteld op het gebalanceerde vermogensprofiel of hoger. Verwacht dat de ventilatoren tussen de 30 en 34 dB(A) liggen tegen een stille achtergrond van 22,8 dB(A) tijdens het surfen op het web of het afspelen van video. Andere 16-inch laptops zoals deHuawei MateBook 16s of de MacBook Pro 16 zijn elk in staat om langer stil te blijven dan de Envy 16.
De ventilatoren kunnen maar liefst 41 dB(A) luid zijn bij het draaien van 3DMark 06, vergeleken met slechts 26 dB(A) en 34 dB(A) bij respectievelijk de eerder genoemde Apple en Huawei
Het geluid van de ventilator wordt nog luider met iets meer dan 51 dB(A) bij het draaien van Witcher 3 op Performance mode. Dit zou aanzienlijk dalen tot 41,6 dB(A) als het in plaats daarvan in de Gebalanceerde modus zou draaien, maar de grafische prestaties zouden ongeveer 5 tot 10 procent langzamer zijn, zoals hierboven vermeld. Al met al is dit een behoorlijk luide laptop als je de prestaties wilt benutten.
Geluidsniveau
| Onbelast |
| 22.9 / 22.9 / 30.5 dB (A) |
| Belasting |
| 41.4 / 51.4 dB (A) |
 | ||
30 dB stil 40 dB(A) hoorbaar 50 dB(A) luid |
||
min: | ||
| HP Envy 16 h0112nr GeForce RTX 3060 Laptop GPU, i7-12700H, Micron 3400 1TB MTFDKBA1T0TFH | Lenovo ThinkBook 16 G4+ IAP GeForce RTX 2050 Mobile, i7-12700H, Micron 2450 1TB MTFDKCD1T0TFK | MSI Creator Z16P B12UHST GeForce RTX 3080 Ti Laptop GPU, i9-12900H, Samsung PM9A1 MZVL22T0HBLB | Dell Inspiron 16 Plus 7610-MHJ8F UHD Graphics Xe 32EUs (Tiger Lake-H), i7-11800H, OM3PDP3-AD NVMe KDI 512GB | Apple MacBook Pro 16 2021 M1 Pro M1 Pro 16-Core GPU, M1 Pro, Apple SSD AP1024R | Huawei MateBook 16s i7 Iris Xe G7 96EUs, i7-12700H, Silicon Motion PCIe-8 SSD | |
|---|---|---|---|---|---|---|
| Noise | 1% | -5% | -1% | 10% | 9% | |
| uit / omgeving * (dB) | 22.8 | 24.2 -6% | 26 -14% | 26.3 -15% | 24.7 -8% | 24 -5% |
| Idle Minimum * (dB) | 22.9 | 24.2 -6% | 27 -18% | 26.3 -15% | 24.7 -8% | 24 -5% |
| Idle Average * (dB) | 22.9 | 24.2 -6% | 29 -27% | 26.3 -15% | 24.7 -8% | 25.2 -10% |
| Idle Maximum * (dB) | 30.5 | 24.2 21% | 31 -2% | 24.7 19% | 27.2 11% | |
| Load Average * (dB) | 41.4 | 47 -14% | 43 -4% | 33 20% | 26.1 37% | 34.8 16% |
| Witcher 3 ultra * (dB) | 51.1 | 47 8% | 43 16% | 44 14% | 34.8 32% | |
| Load Maximum * (dB) | 51.4 | 47 9% | 46 11% | 49.2 4% | 37.4 27% | 39 24% |
* ... kleiner is beter
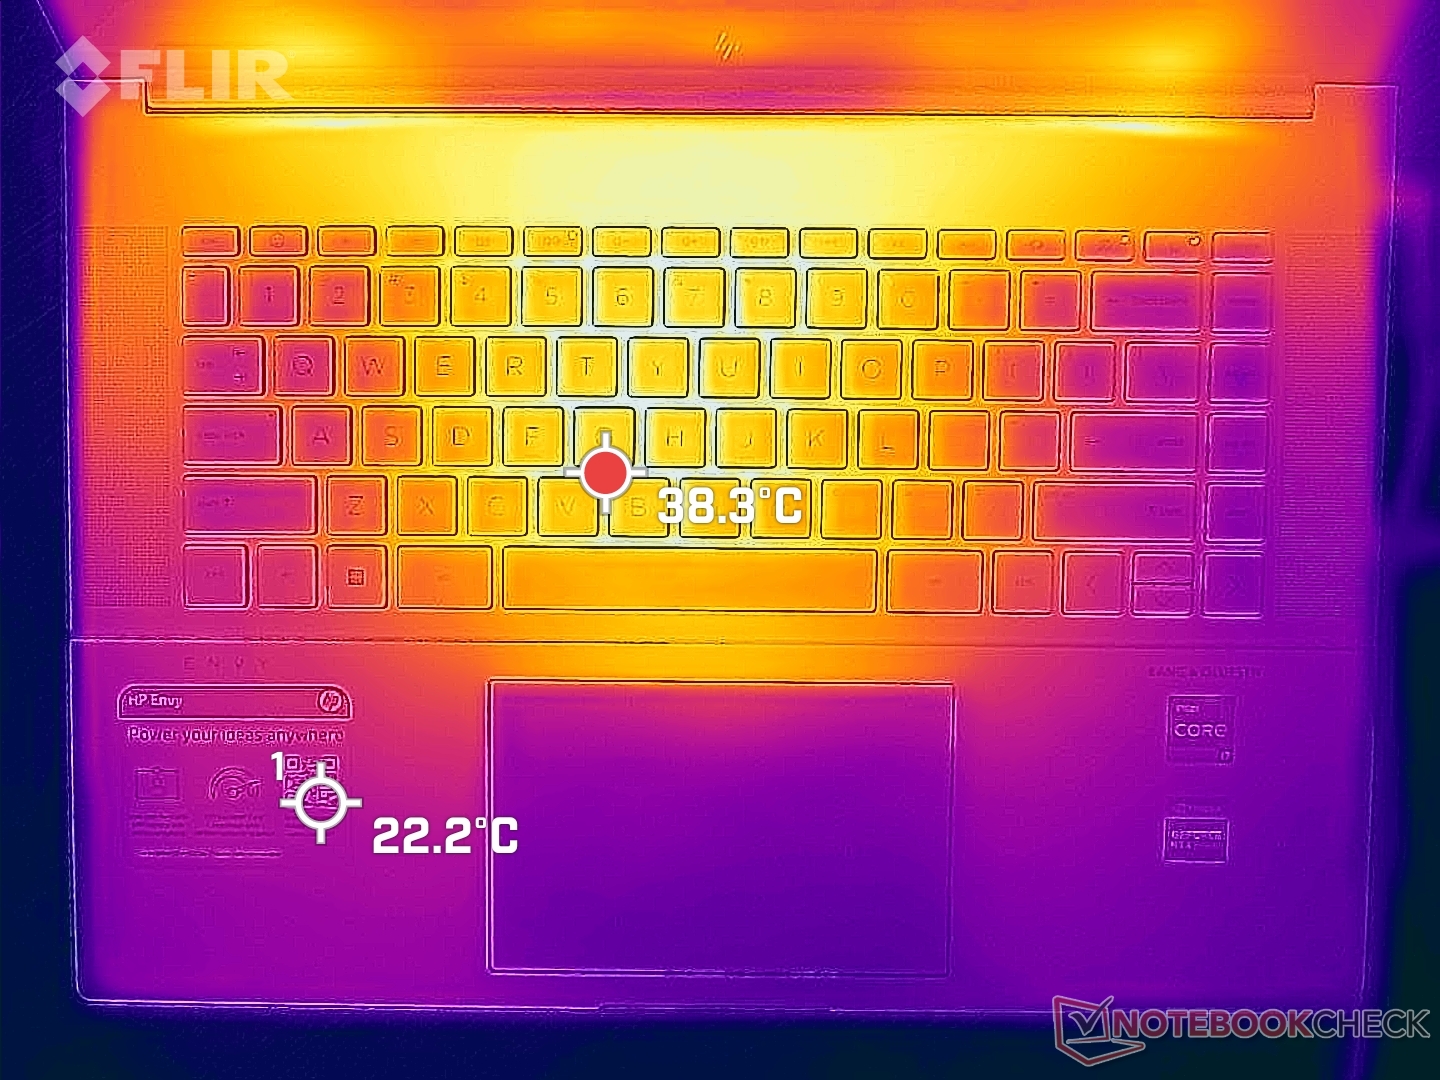
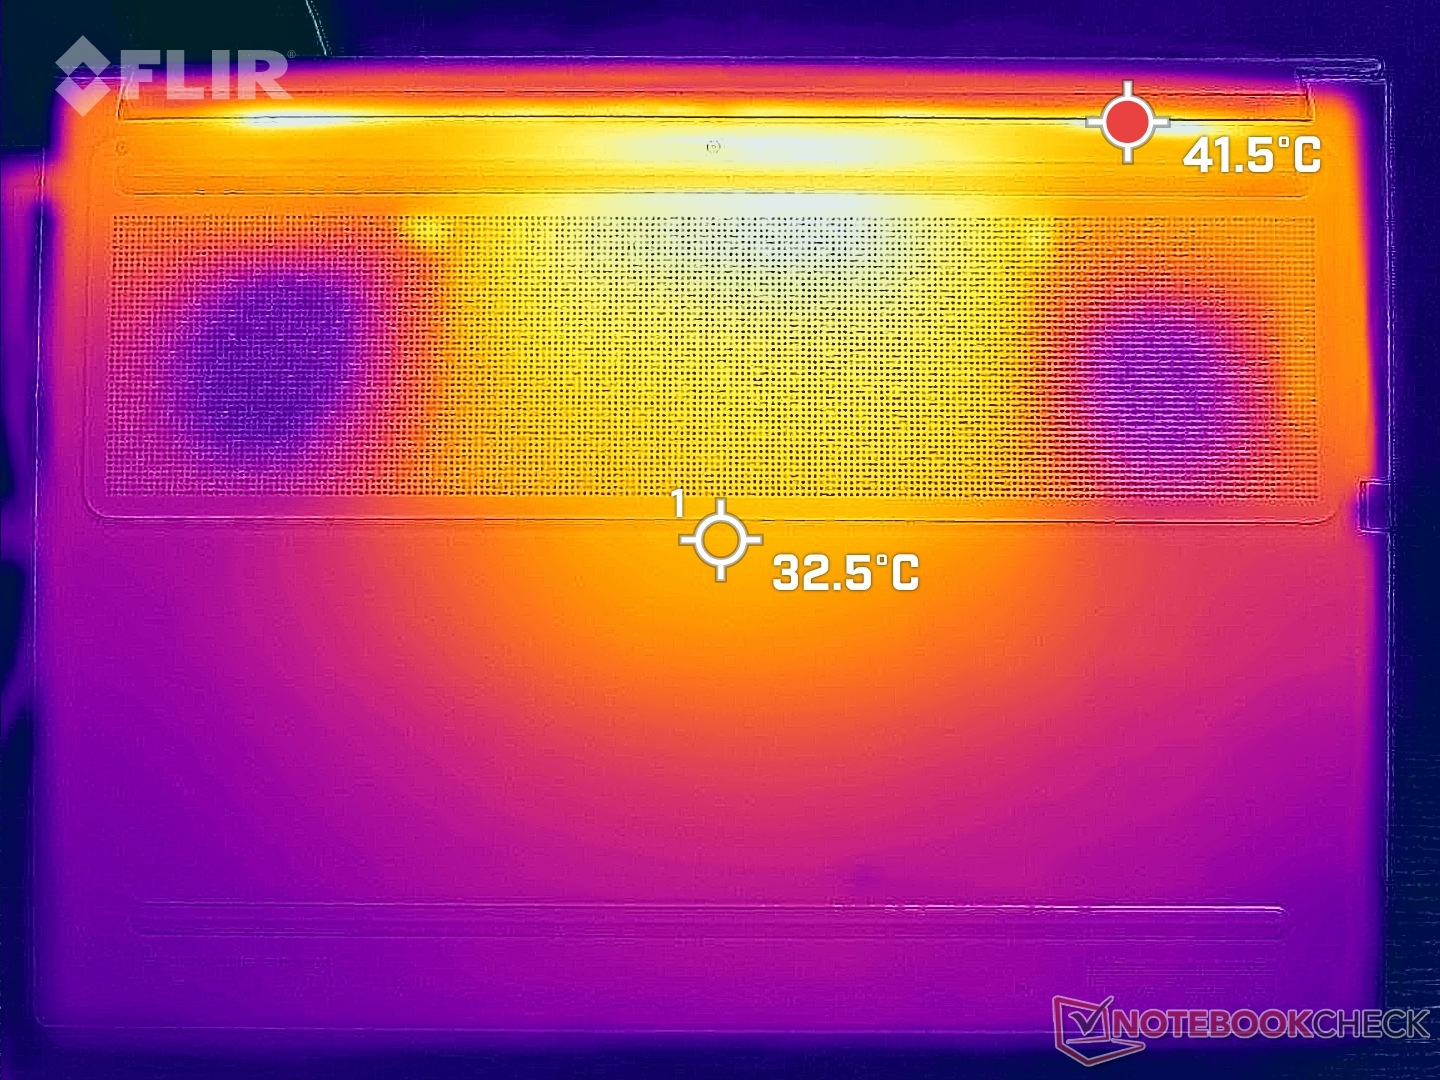
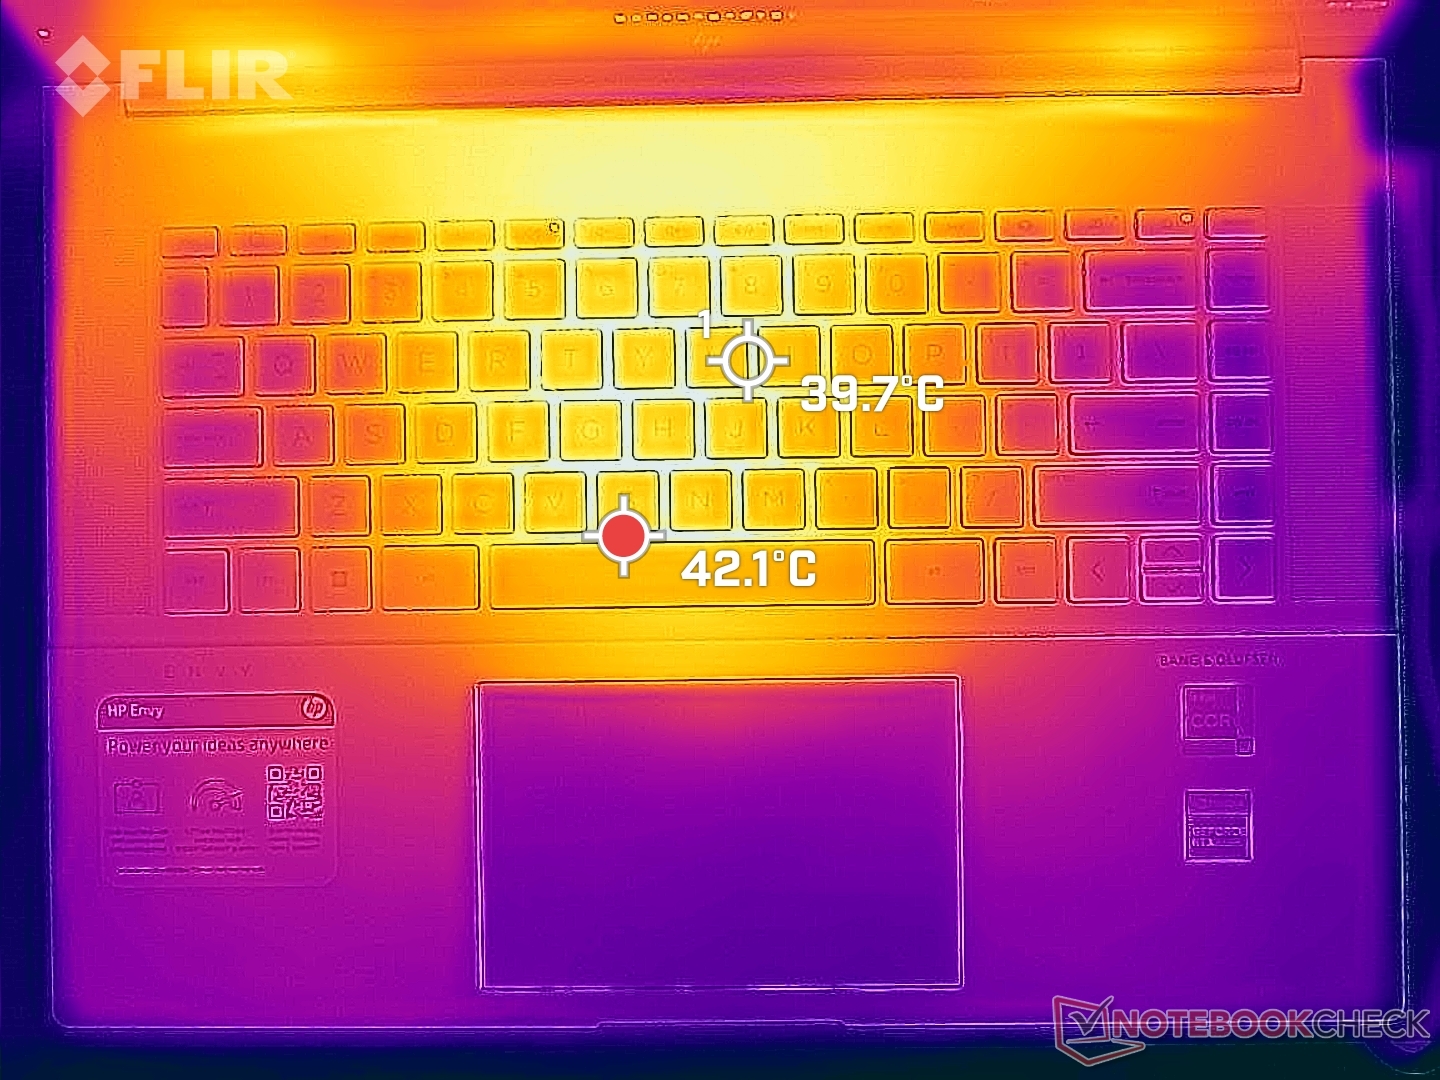
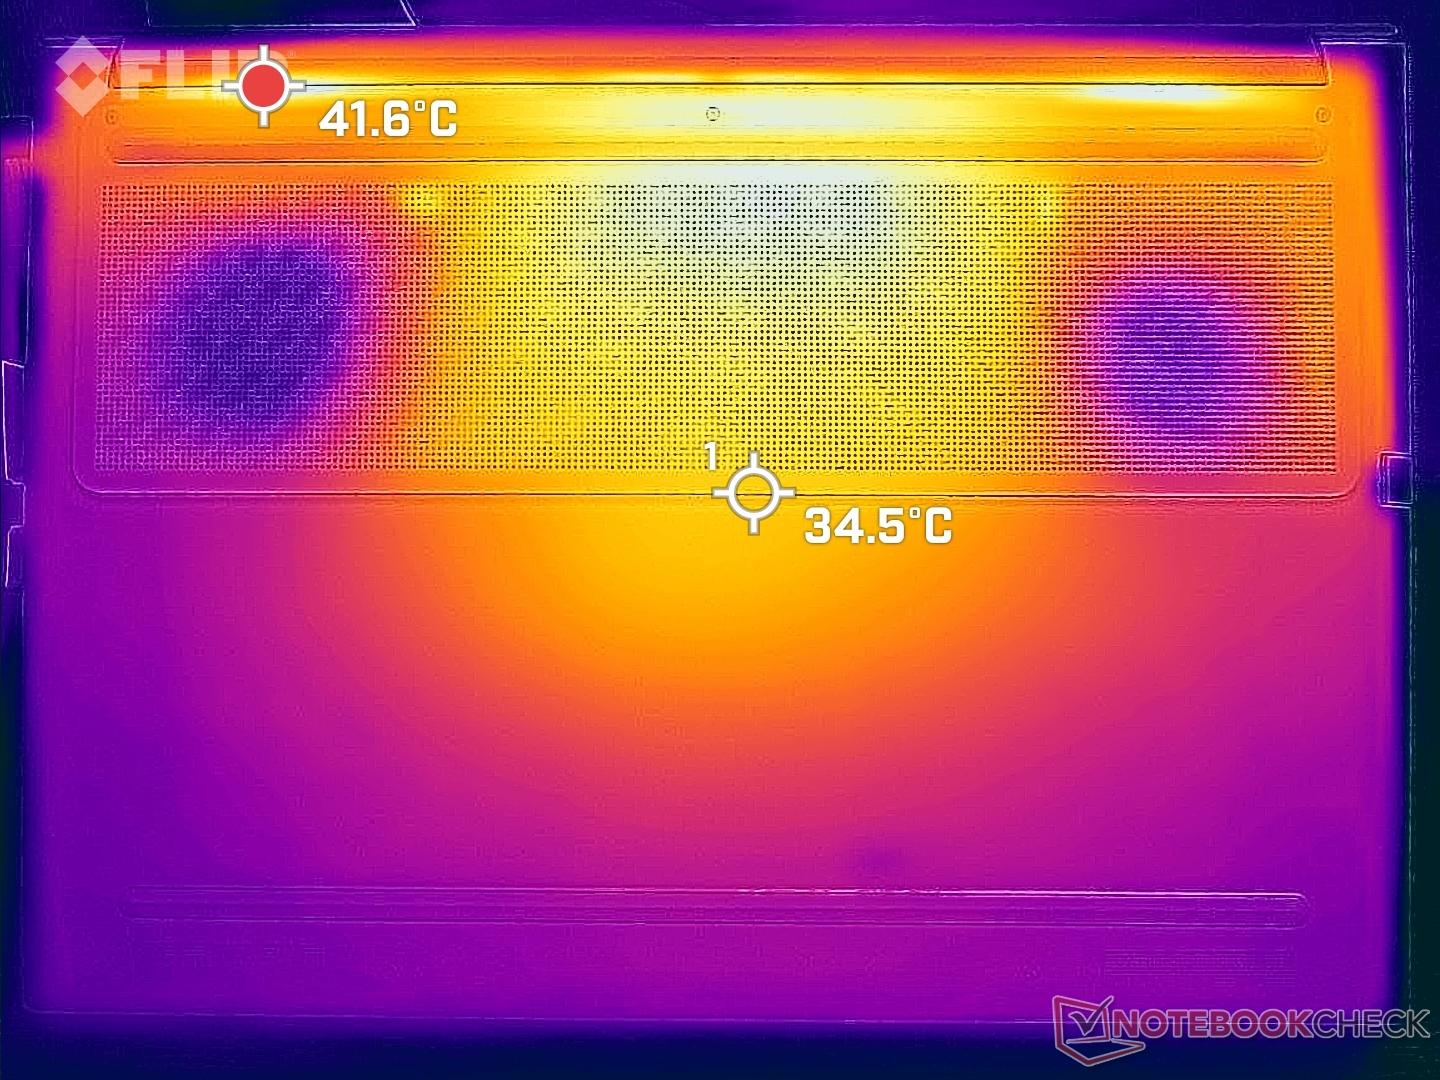
Temperatuur
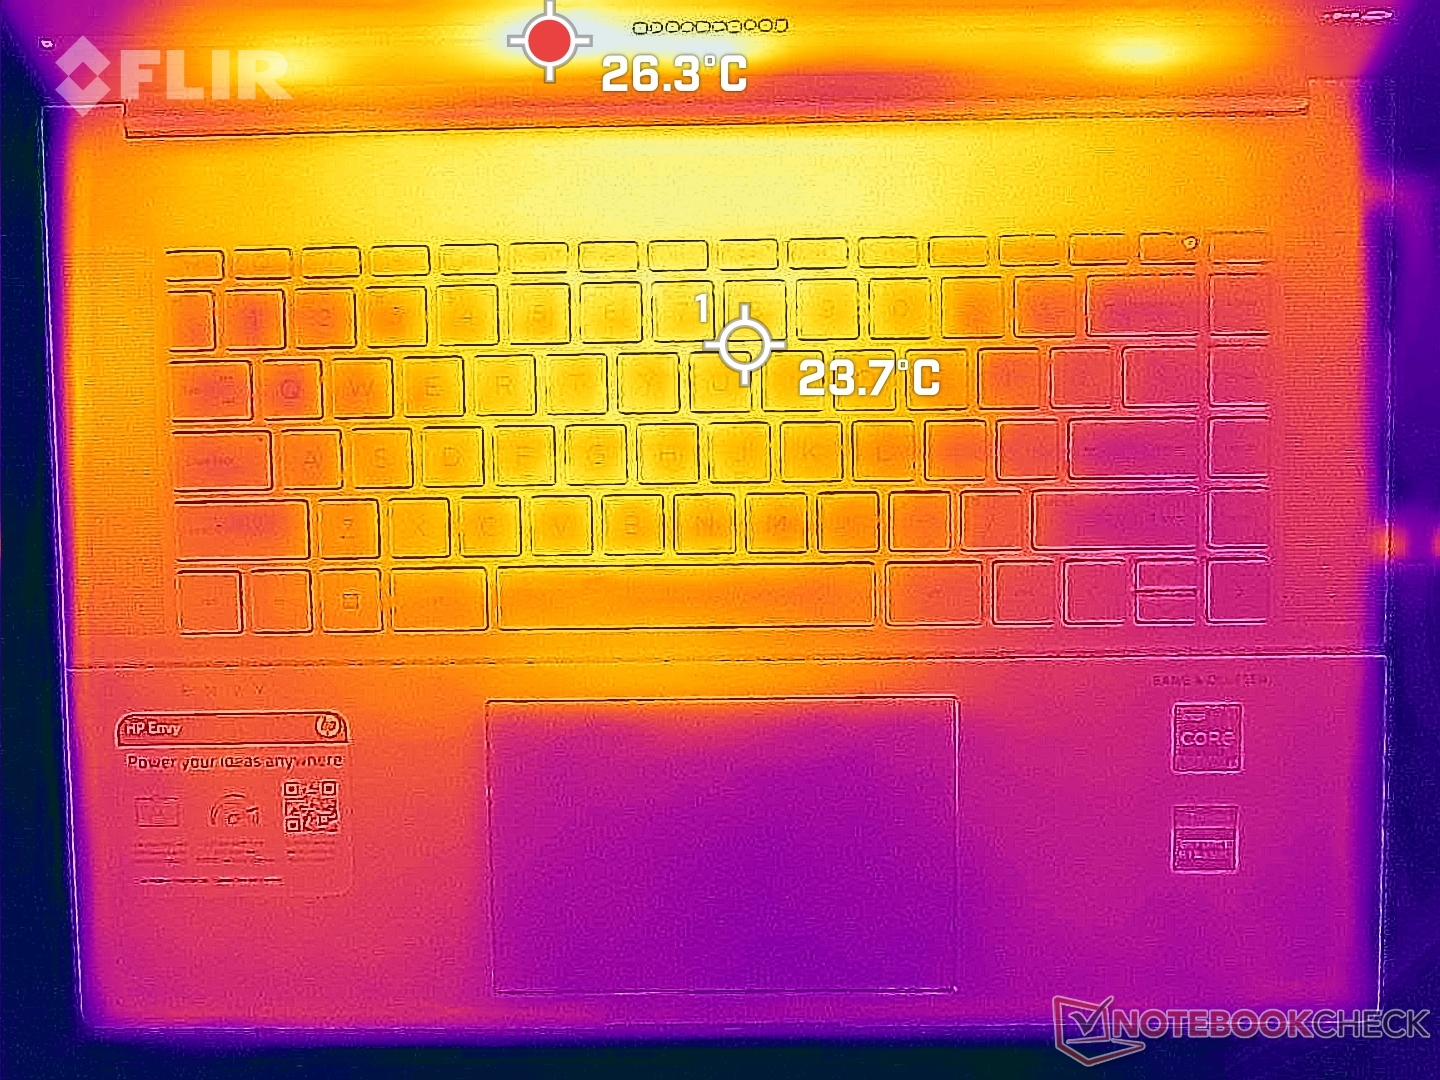
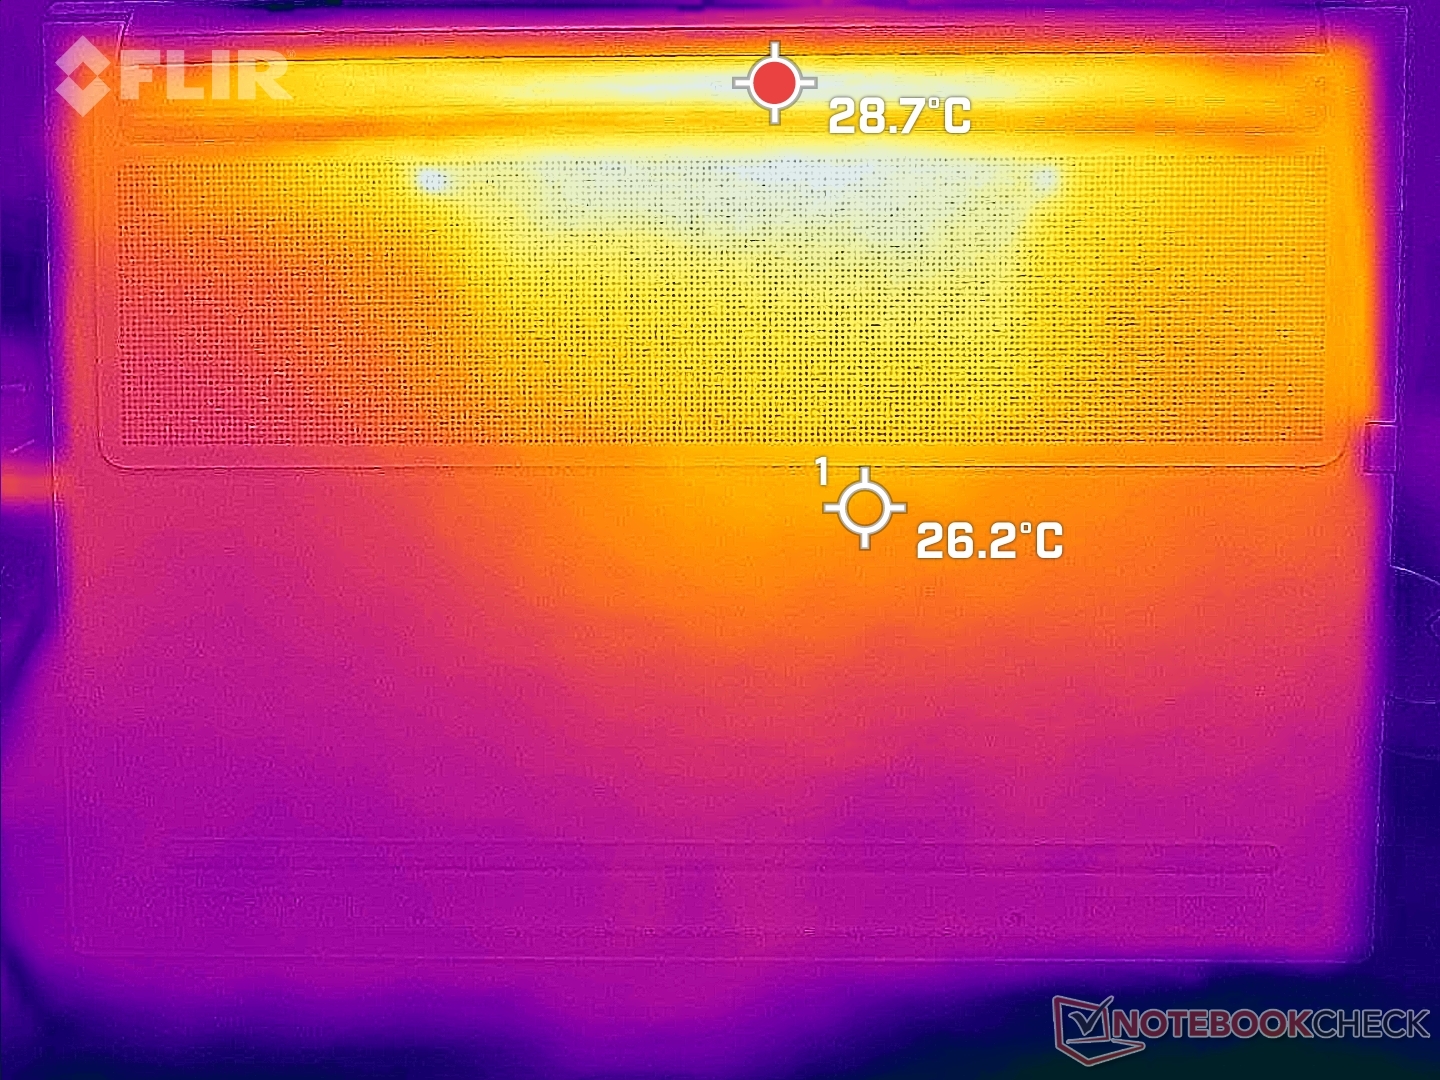
De oppervlaktetemperaturen zijn vrij warm, zelfs wanneer de computer stationair draait zonder toepassingen. Hete plekken onder deze omstandigheden kunnen oplopen tot 33 C aan zowel de boven- als onderkant, vergeleken met slechts 26 C op de ThinkBook 16 G4. Bij hoge belasting kunnen deze zelfde gebieden meer dan 45 C bereiken. De palmsteunen blijven relatief koel, maar de onderkant kan oncomfortabel zijn op de huid.
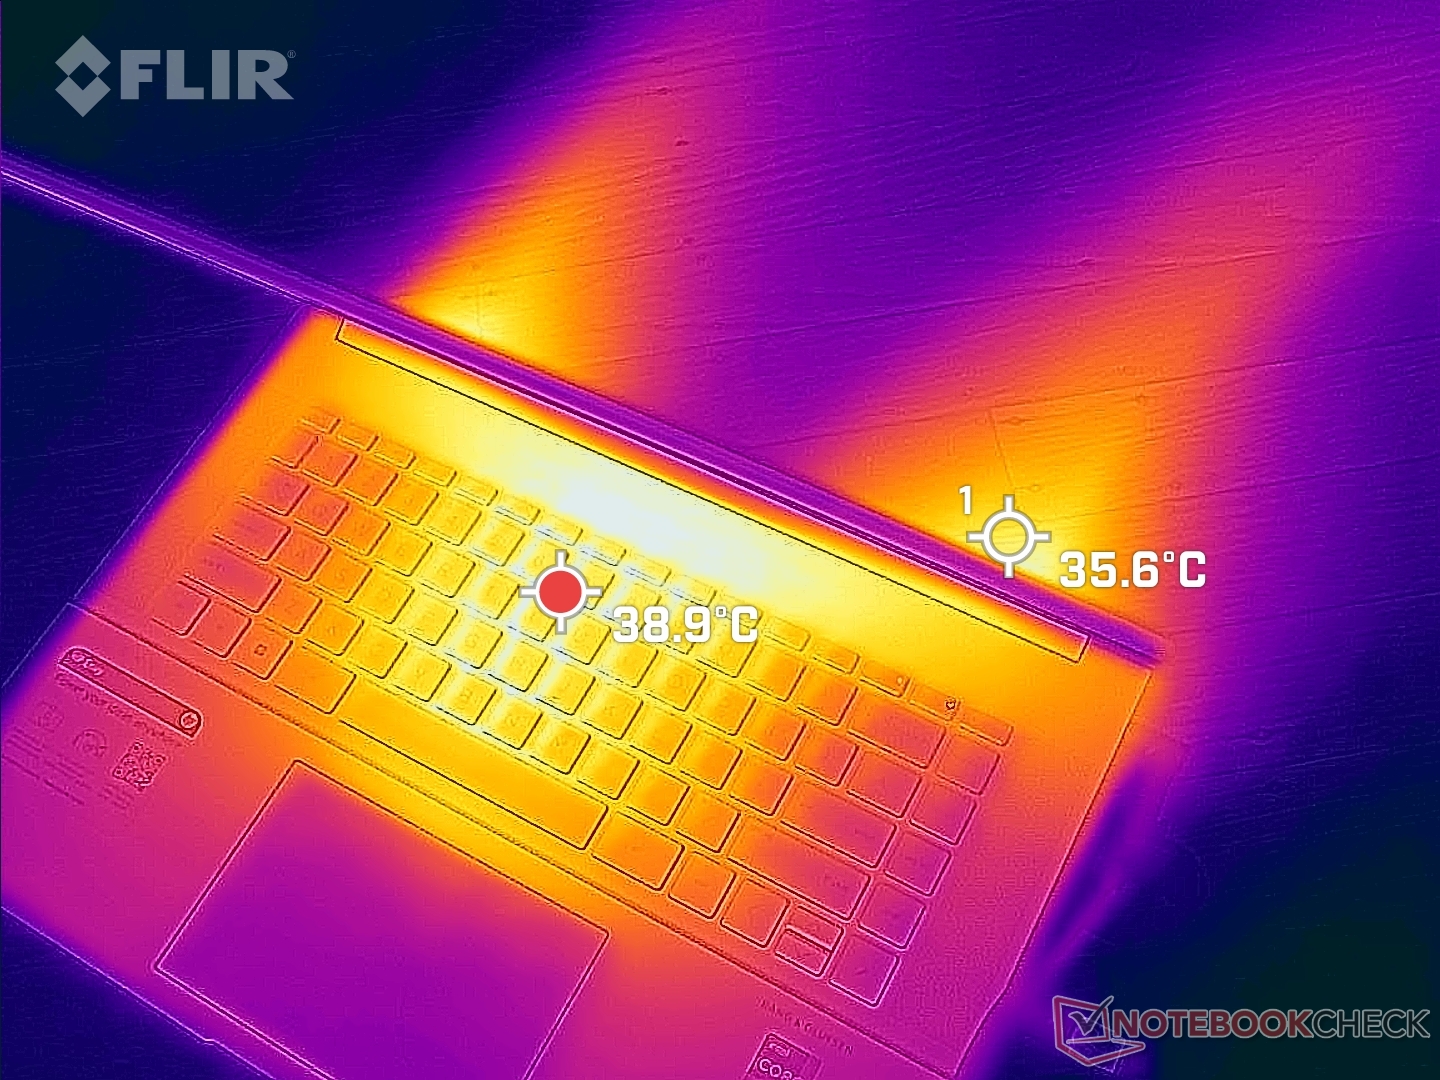
(-) De maximumtemperatuur aan de bovenzijde bedraagt 45.2 °C / 113 F, vergeleken met het gemiddelde van 36.8 °C / 98 F, variërend van 21 tot 71 °C voor de klasse Multimedia.
(±) De bodem warmt op tot een maximum van 44 °C / 111 F, vergeleken met een gemiddelde van 39.1 °C / 102 F
(+) Bij onbelast gebruik bedraagt de gemiddelde temperatuur voor de bovenzijde 31 °C / 88 F, vergeleken met het apparaatgemiddelde van 31.3 °C / 88 F.
(±) Bij het spelen van The Witcher 3 is de gemiddelde temperatuur voor de bovenzijde 33.6 °C / 92 F, vergeleken met het apparaatgemiddelde van 31.3 °C / 88 F.
(+) De palmsteunen en het touchpad zijn met een maximum van ###max## °C / 85.6 F koeler dan de huidtemperatuur en voelen daarom koel aan.
(±) De gemiddelde temperatuur van de handpalmsteun van soortgelijke toestellen bedroeg 28.7 °C / 83.7 F (-1.1 °C / -1.9 F).
| HP Envy 16 h0112nr Intel Core i7-12700H, NVIDIA GeForce RTX 3060 Laptop GPU | Lenovo ThinkBook 16 G4+ IAP Intel Core i7-12700H, NVIDIA GeForce RTX 2050 Mobile | MSI Creator Z16P B12UHST Intel Core i9-12900H, NVIDIA GeForce RTX 3080 Ti Laptop GPU | Dell Inspiron 16 Plus 7610-MHJ8F Intel Core i7-11800H, Intel UHD Graphics Xe 32EUs (Tiger Lake-H) | Apple MacBook Pro 16 2021 M1 Pro Apple M1 Pro, Apple M1 Pro 16-Core GPU | Huawei MateBook 16s i7 Intel Core i7-12700H, Intel Iris Xe Graphics G7 96EUs | |
|---|---|---|---|---|---|---|
| Heat | 8% | -20% | 4% | 19% | 5% | |
| Maximum Upper Side * (°C) | 45.2 | 42.9 5% | 67 -48% | 43.4 4% | 41 9% | 40.9 10% |
| Maximum Bottom * (°C) | 44 | 50.6 -15% | 69 -57% | 45.1 -3% | 39 11% | 48.3 -10% |
| Idle Upper Side * (°C) | 33.6 | 26 23% | 29 14% | 30.6 9% | 24 29% | 29.2 13% |
| Idle Bottom * (°C) | 32.6 | 26.5 19% | 29 11% | 31.1 5% | 24 26% | 30.4 7% |
* ... kleiner is beter
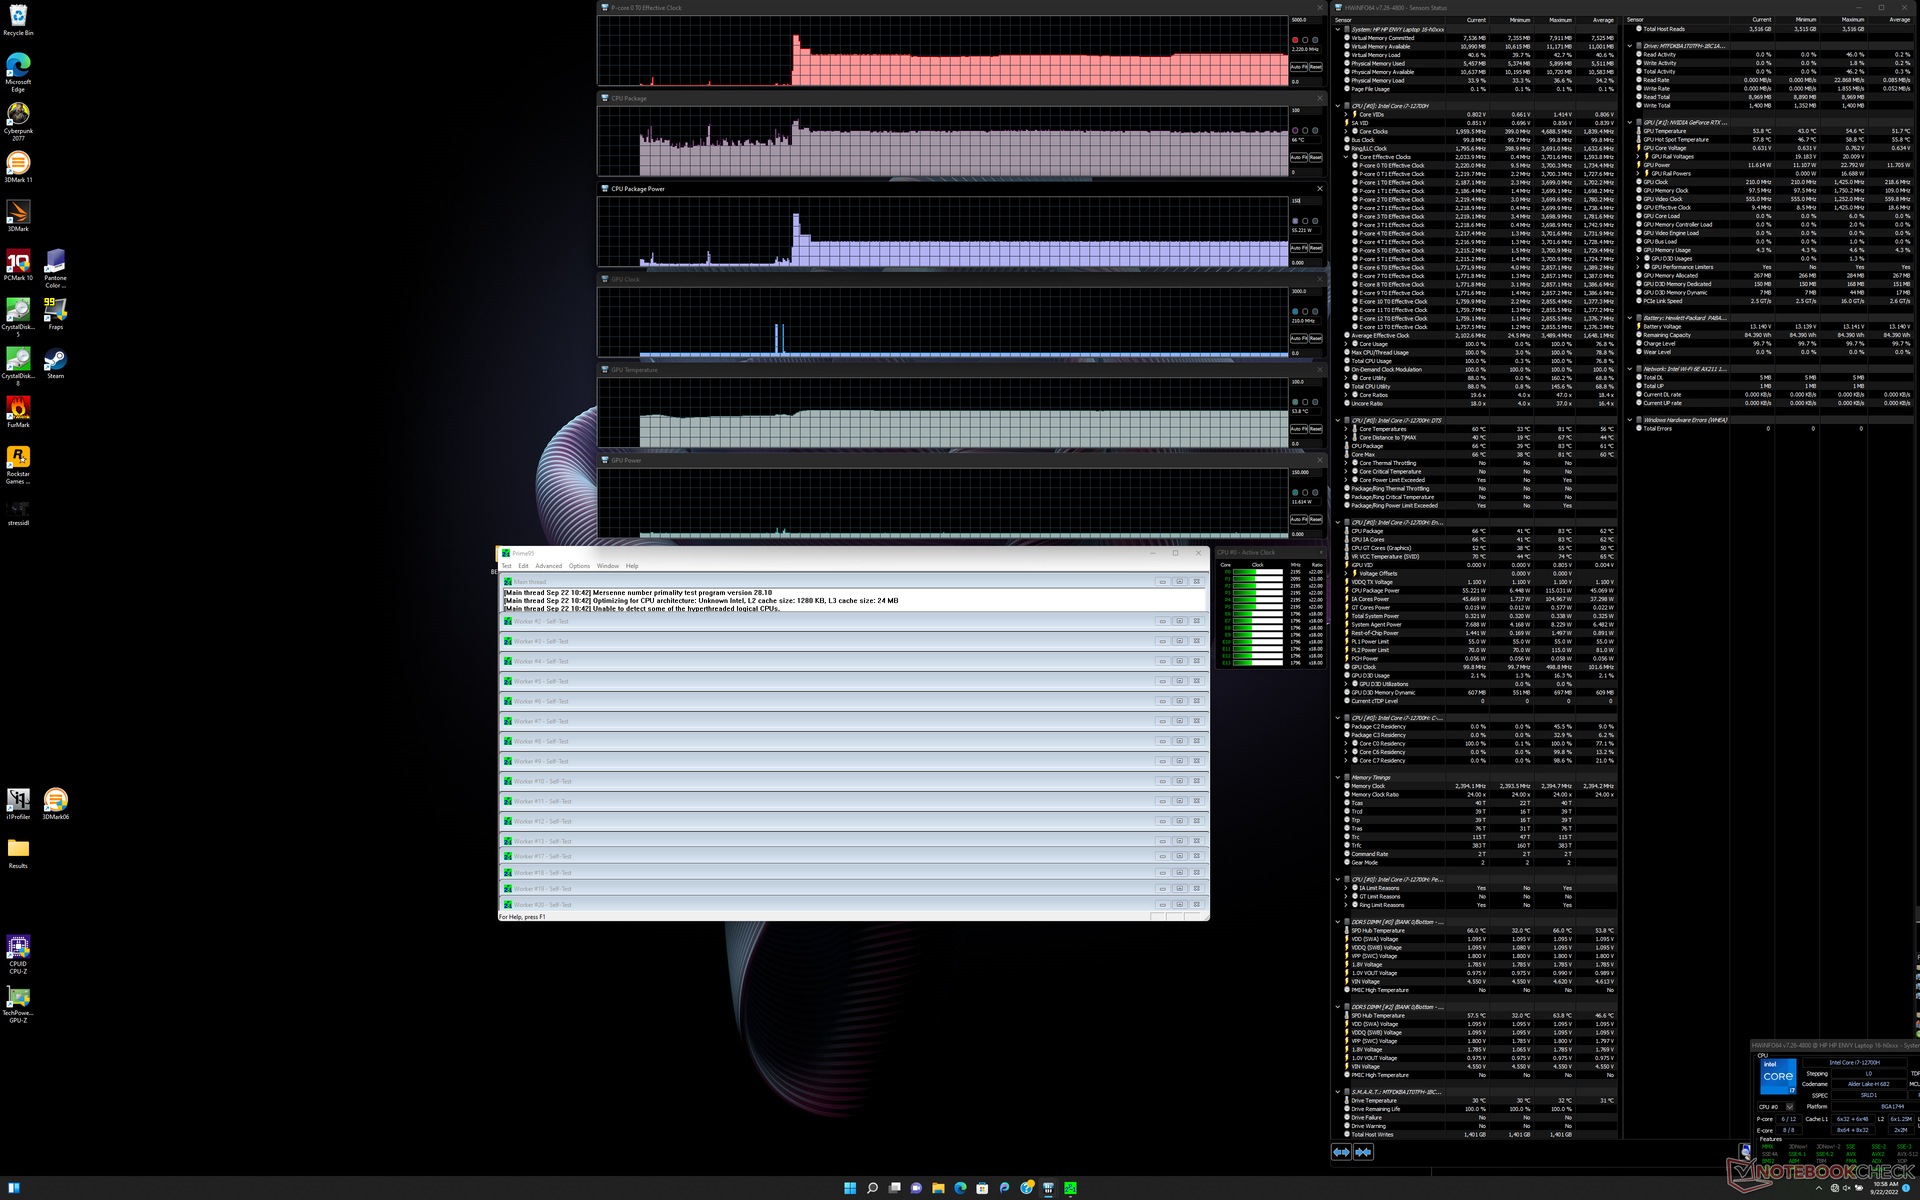
Stresstest - Beperkte Turbo Boost
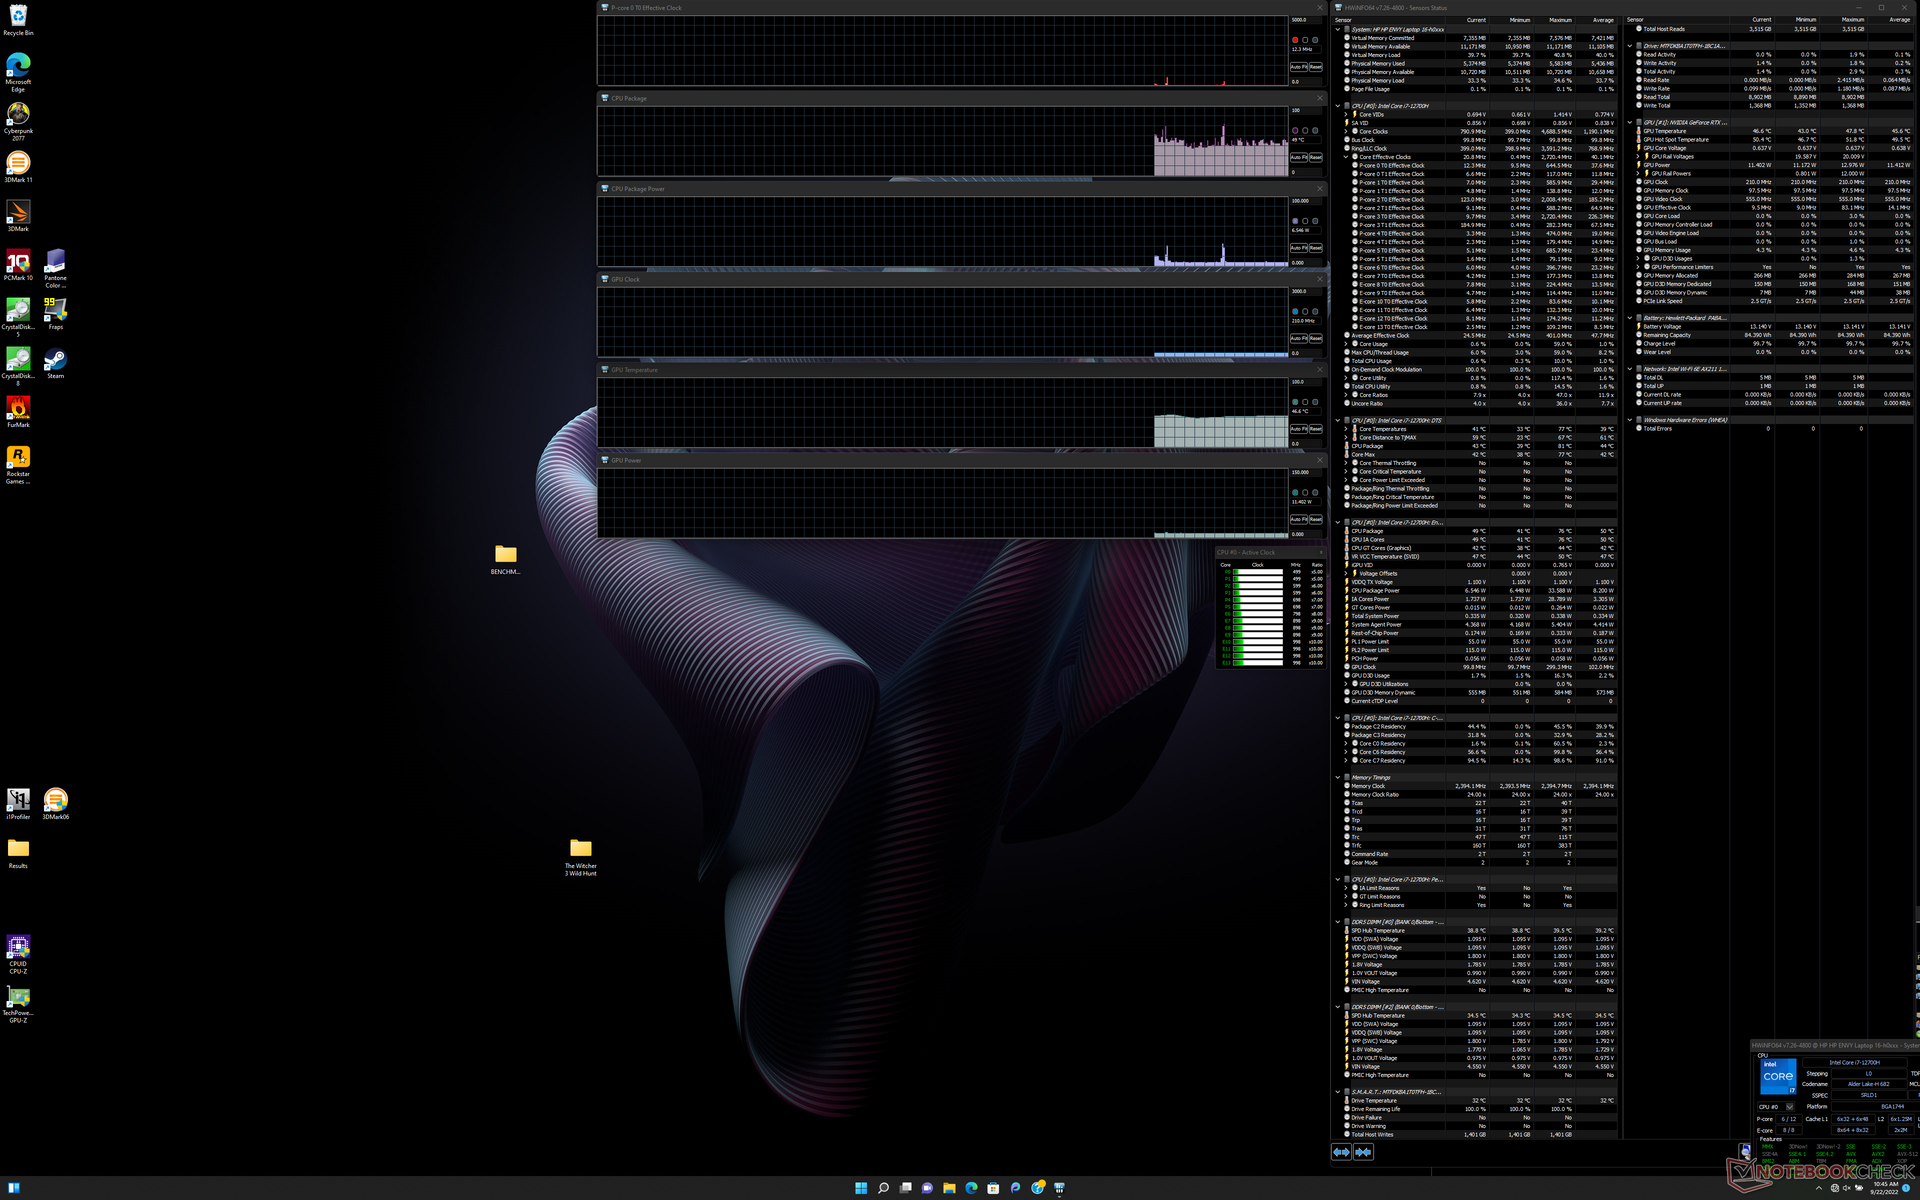
Het uitvoeren van Prime95 veroorzaakt een piek in CPU-kloksnelheid, temperatuur en stroomverbruik op het bord tot respectievelijk 3,7 GHz, 80 C en 115 W, gedurende ongeveer 15 seconden. Daarna daalt de CPU en stabiliseert zich op respectievelijk 2,1 tot 2,2 GHz, 66 C en 55 W. Ter vergelijking, dezelfde test uitvoeren op de MSI GS77 met dezelfde Core i7-12700H CPU zou resulteren in zowel hogere stabiele kloksnelheden als kerntemperaturen van respectievelijk 2,7 - 3,0 GHz en 96 C. HP neemt misschien de veiligere weg met zijn Envy 16 door met lagere Turbo Boost kloksnelheden te werken om de temperaturen lager te houden.
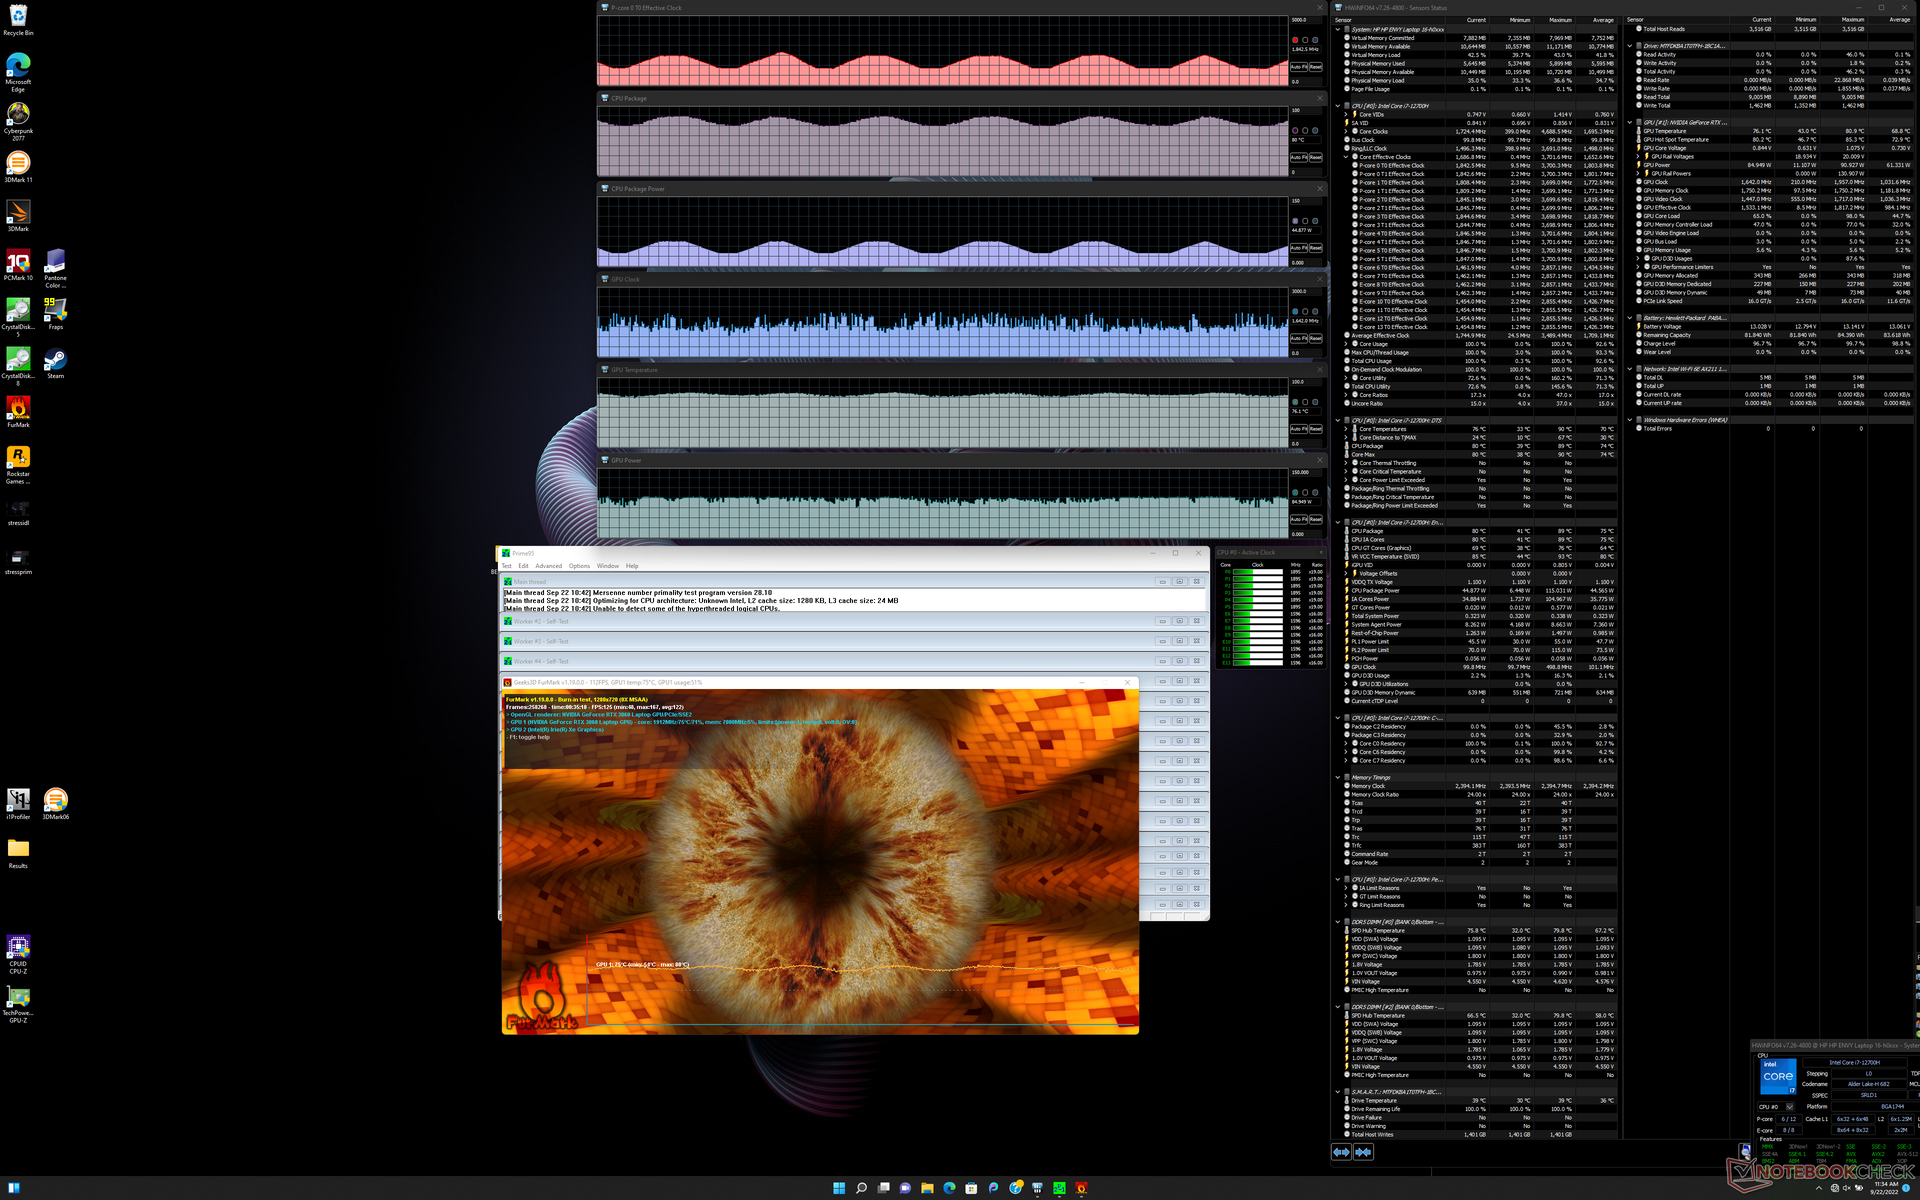
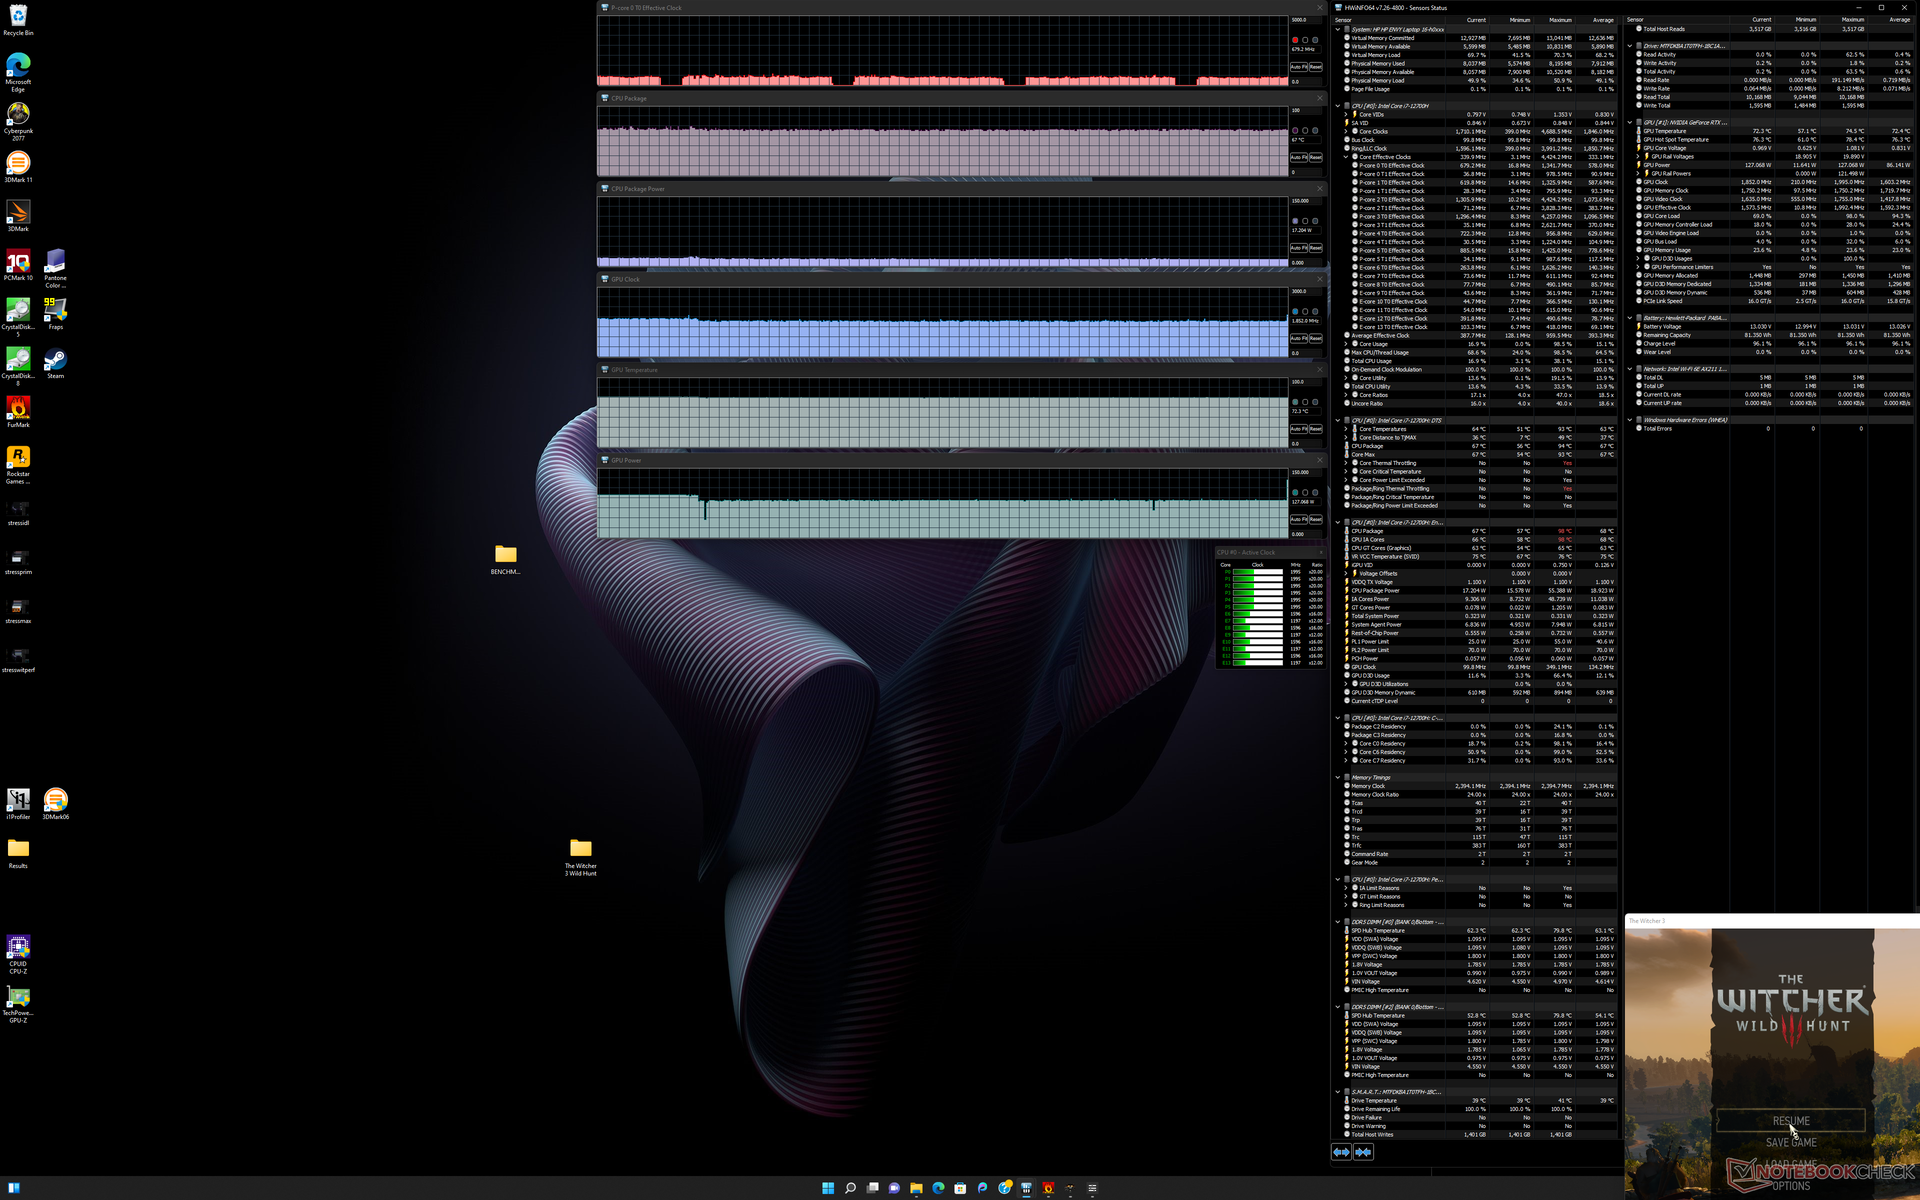
GPU kloksnelheden, temperatuur en stroomverbruik van de kaart stabiliseren zich op 1717 MHz, 74 C en 94 W, respectievelijk, wanneer de Witcher 3 in de modus Prestaties. Dit daalt tot 1542 MHz, 72 C en 80 W als het spel in de Gebalanceerde modus wordt uitgevoerd. Gebruikers zullen het maximale ventilatorgeluid van het systeem moeten verdragen als ze de GPU optimaal willen benutten.
Werken op batterijen beperkt de prestaties. Een Fire Strike test op batterijen levert Physics en Graphics scores op van respectievelijk 17295 en 10572 punten, vergeleken met 28353 en 19890 punten op netstroom.
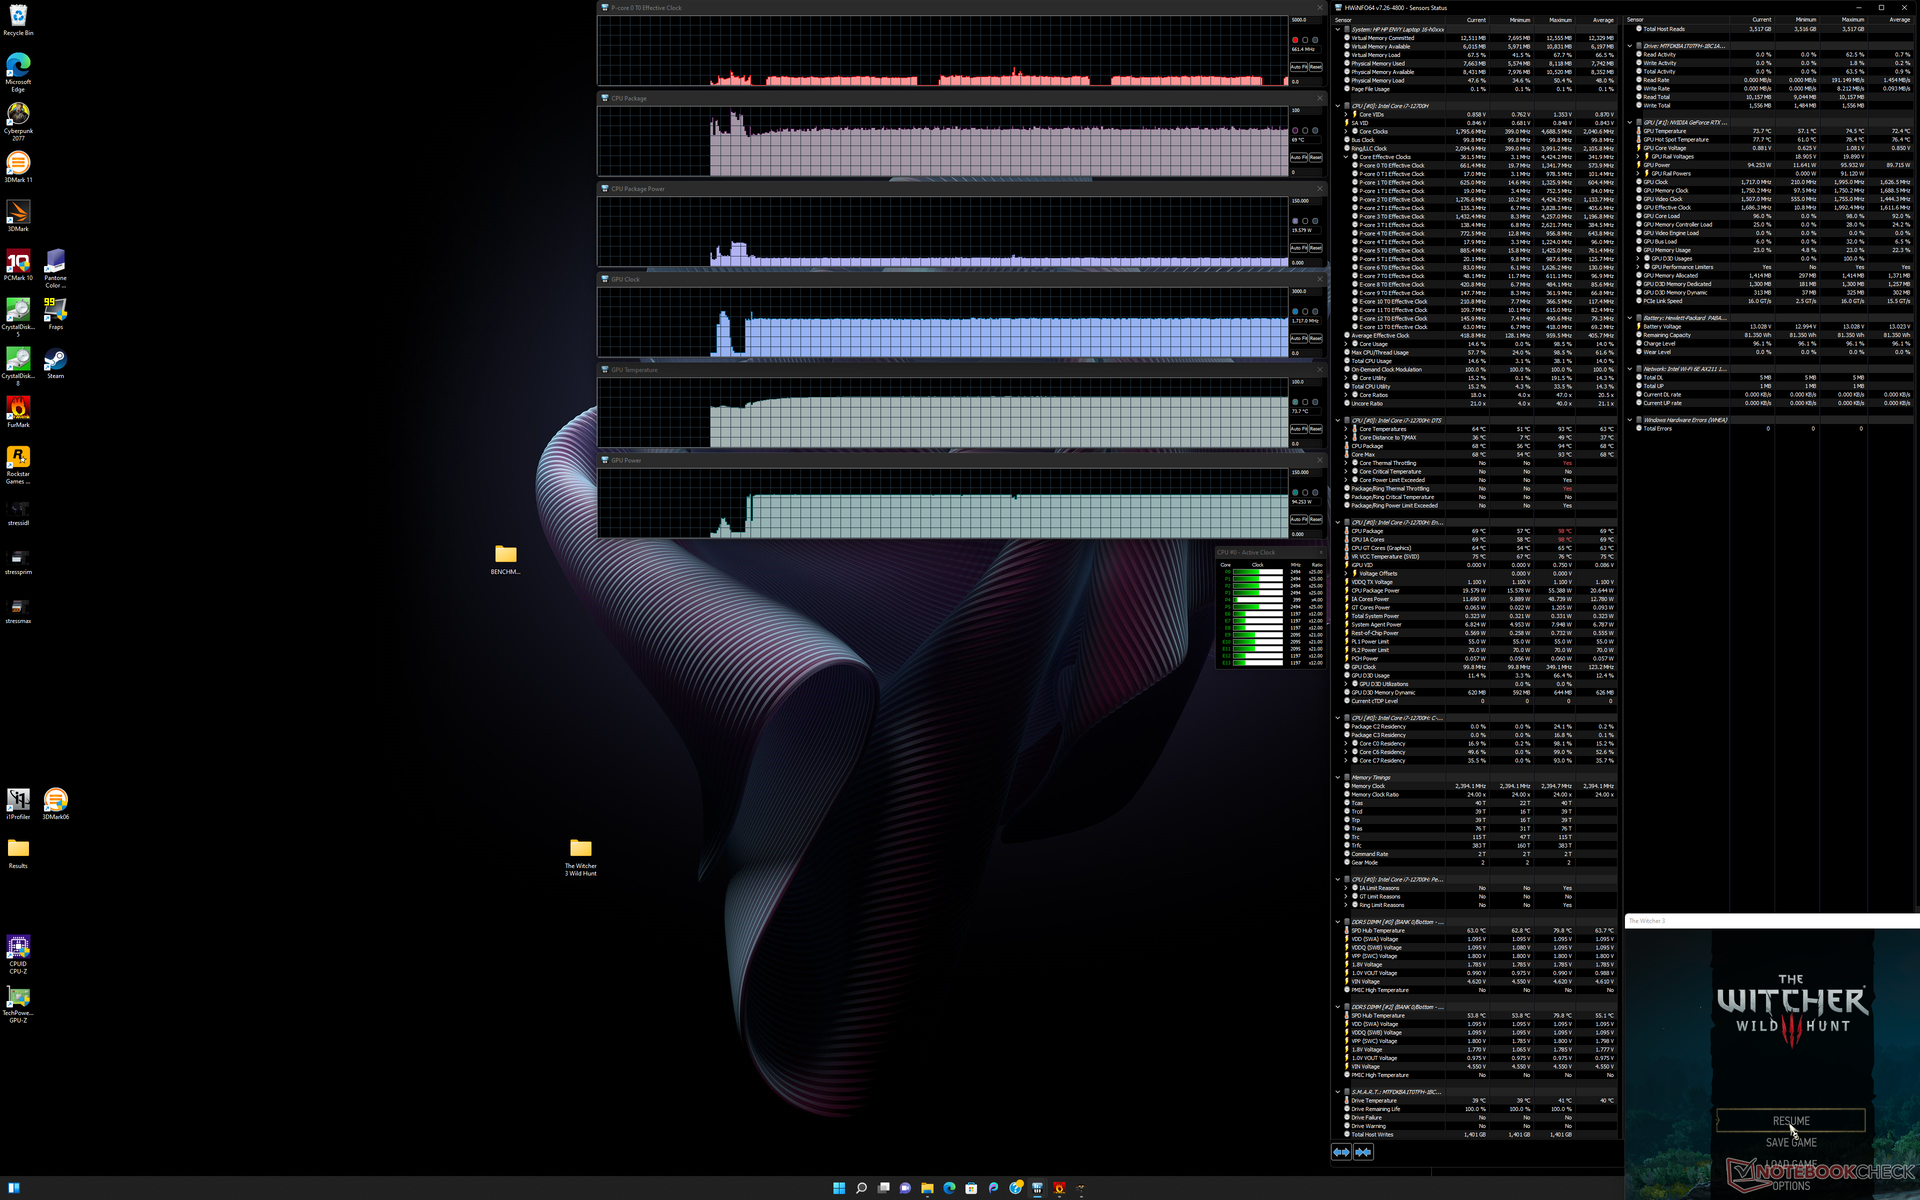
| CPU-klok (GHz) | GPU-klok (MHz) | Gemiddelde CPU-temperatuur (°C) | Gemiddelde GPU-temperatuur (°C) | |
| Systeem Idle | -- | -- | 49 | 47 |
| Prime95 Stress | 2.1 - 2.2 | -- | 66 | 54 |
| Prime95 + FurMark Stress | 1.2 - 2.2 | ~1642 | 74 - 87 | 76 |
| Witcher 3 Stress (evenwichtige modus) | 0,67 | 1542 | 67 | 72 |
| Witcher 3 Stress (prestatiemodus) | 0,67 | 1717 | 69 | 74 |
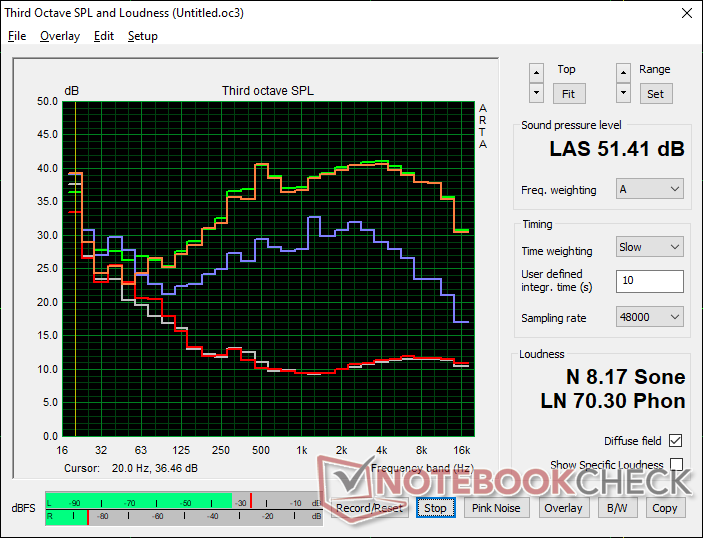
Luidsprekers
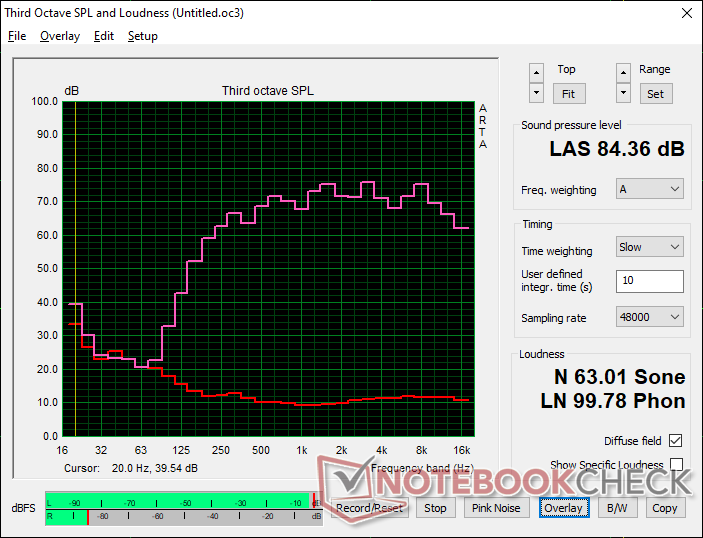
HP Envy 16 h0112nr audioanalyse
(+) | luidsprekers kunnen relatief luid spelen (84.4 dB)
Bas 100 - 315 Hz
(-) | bijna geen lage tonen - gemiddeld 15.9% lager dan de mediaan
(±) | lineariteit van de lage tonen is gemiddeld (12.8% delta ten opzichte van de vorige frequentie)
Midden 400 - 2000 Hz
(+) | evenwichtige middens - slechts 3.1% verwijderd van de mediaan
(+) | de middentonen zijn lineair (5.5% delta ten opzichte van de vorige frequentie)
Hoog 2 - 16 kHz
(+) | evenwichtige hoogtepunten - slechts 3.4% verwijderd van de mediaan
(+) | de hoge tonen zijn lineair (6.3% delta naar de vorige frequentie)
Algemeen 100 - 16.000 Hz
(+) | het totale geluid is lineair (12.1% verschil met de mediaan)
Vergeleken met dezelfde klasse
» 22% van alle geteste apparaten in deze klasse waren beter, 3% vergelijkbaar, 76% slechter
» De beste had een delta van 5%, het gemiddelde was 17%, de slechtste was 45%
Vergeleken met alle geteste toestellen
» 10% van alle geteste apparaten waren beter, 2% gelijk, 88% slechter
» De beste had een delta van 4%, het gemiddelde was 23%, de slechtste was 134%
Apple MacBook Pro 16 2021 M1 Pro audioanalyse
(+) | luidsprekers kunnen relatief luid spelen (84.7 dB)
Bas 100 - 315 Hz
(+) | goede baars - slechts 3.8% verwijderd van de mediaan
(+) | de lage tonen zijn lineair (5.2% delta naar de vorige frequentie)
Midden 400 - 2000 Hz
(+) | evenwichtige middens - slechts 1.3% verwijderd van de mediaan
(+) | de middentonen zijn lineair (2.1% delta ten opzichte van de vorige frequentie)
Hoog 2 - 16 kHz
(+) | evenwichtige hoogtepunten - slechts 1.9% verwijderd van de mediaan
(+) | de hoge tonen zijn lineair (2.7% delta naar de vorige frequentie)
Algemeen 100 - 16.000 Hz
(+) | het totale geluid is lineair (4.6% verschil met de mediaan)
Vergeleken met dezelfde klasse
» 0% van alle geteste apparaten in deze klasse waren beter, 0% vergelijkbaar, 100% slechter
» De beste had een delta van 5%, het gemiddelde was 17%, de slechtste was 45%
Vergeleken met alle geteste toestellen
» 0% van alle geteste apparaten waren beter, 0% gelijk, 100% slechter
» De beste had een delta van 4%, het gemiddelde was 23%, de slechtste was 134%
Energiebeheer
Stroomverbruik
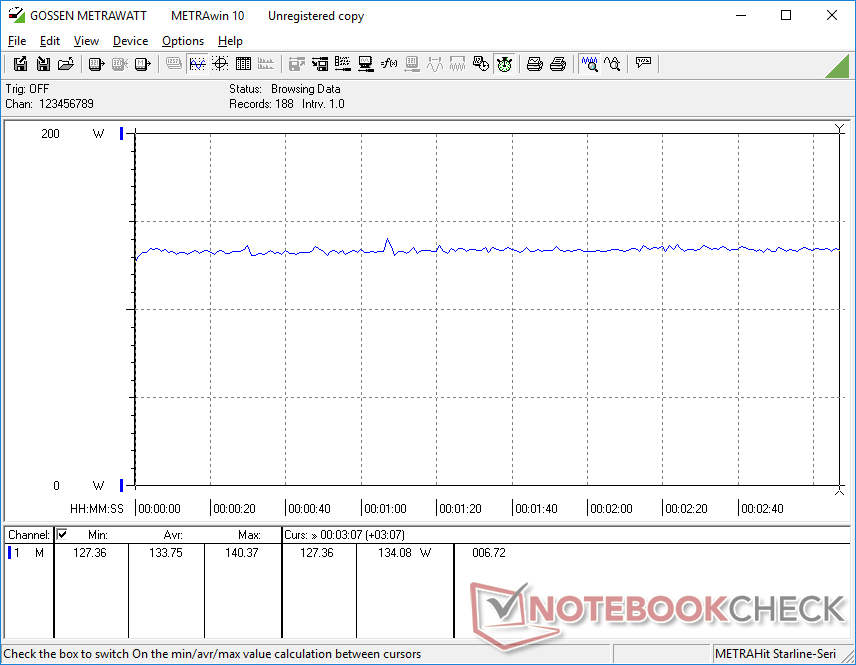
Stationair draaien op de desktop trekt tussen 10 W en 28 W, afhankelijk van het helderheidsniveau, het energieprofiel en de Optimus-instelling, vergeleken met slechts 9 W tot 18 W op de 2020 Envy 15 vanwege het zwaardere OLED-paneel en de 12e generatie CPU. Houd er rekening mee dat bepaalde kleuren meer stroom vragen dan andere op een OLED-paneel, zoals hier gedetailleerd.
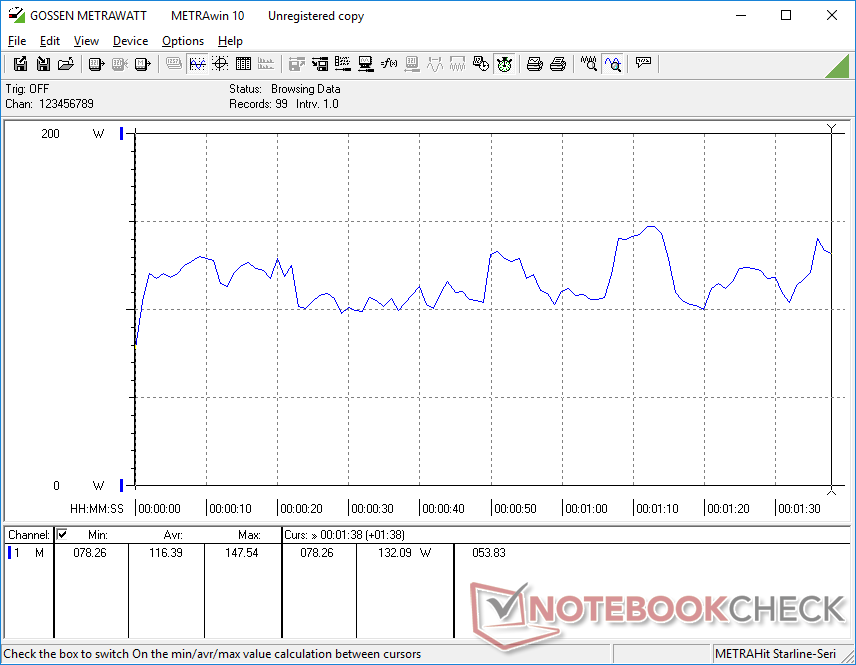
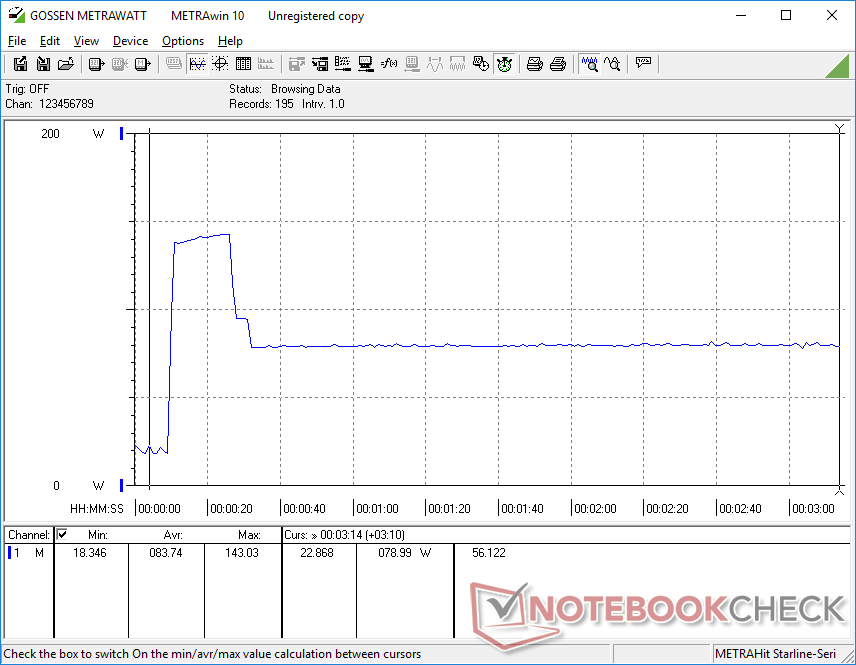
Het stroomverbruik bij gaming is hoog met ongeveer 134 W om vergelijkbaar te zijn met deMSI Creator Z16P met de snellere Core i9-12900H CPU en RTX 3080 Ti GPU of Lenovo Legion Slim 7 16 met dezelfde Core i7 CPU en GPU. In vergelijking met de 2020 Envy 15 is het verbruik echter slechts ongeveer 7 procent hoger bij het gamen, ondanks de 20 tot 30 procent snellere grafische prestaties voor hogere prestaties-per-watt.
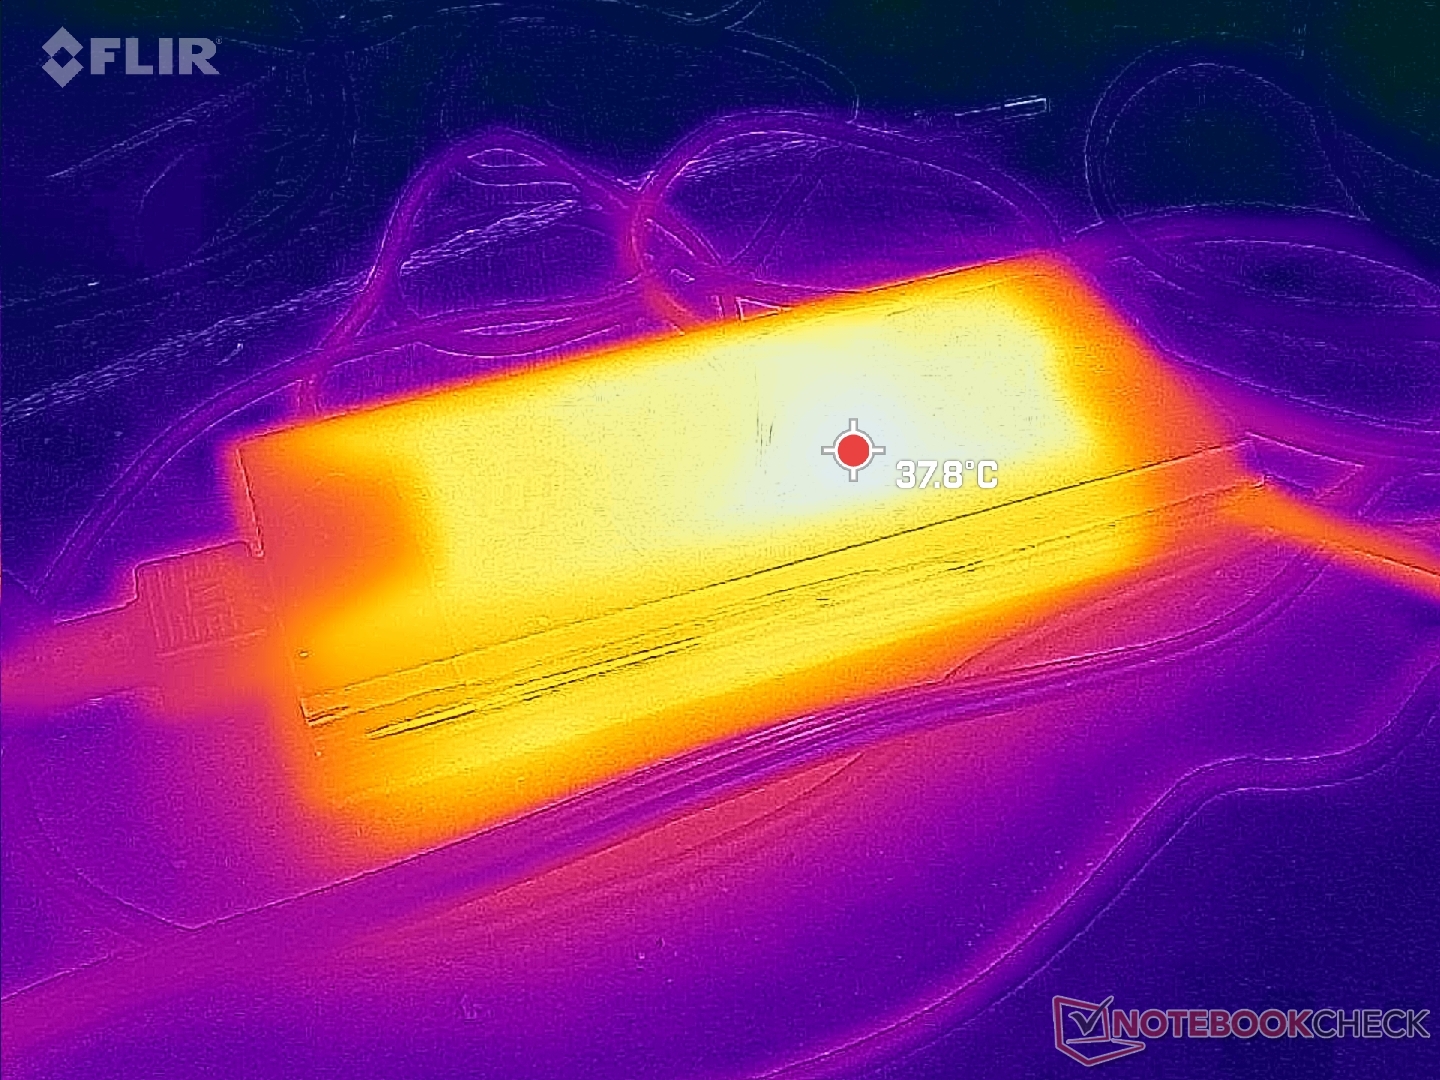
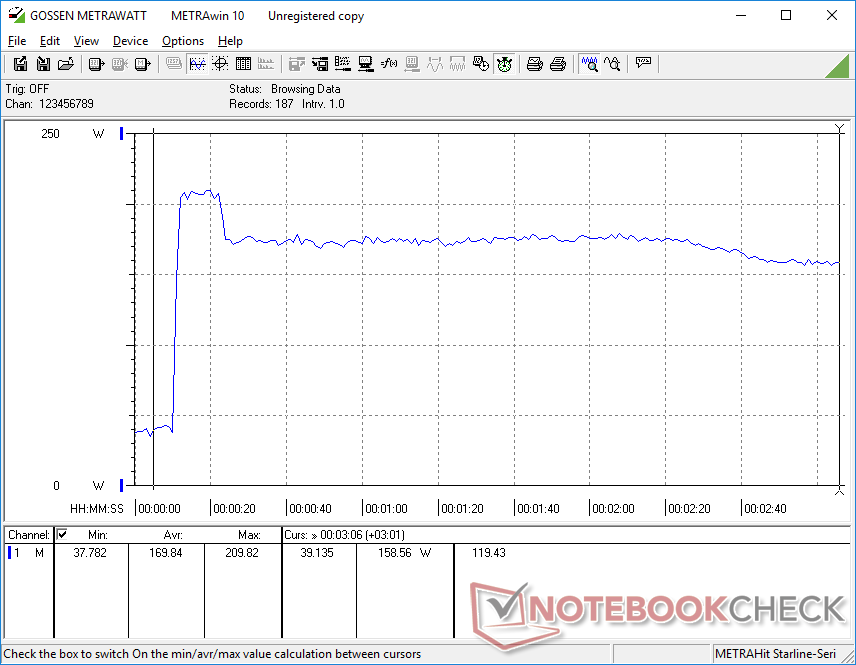
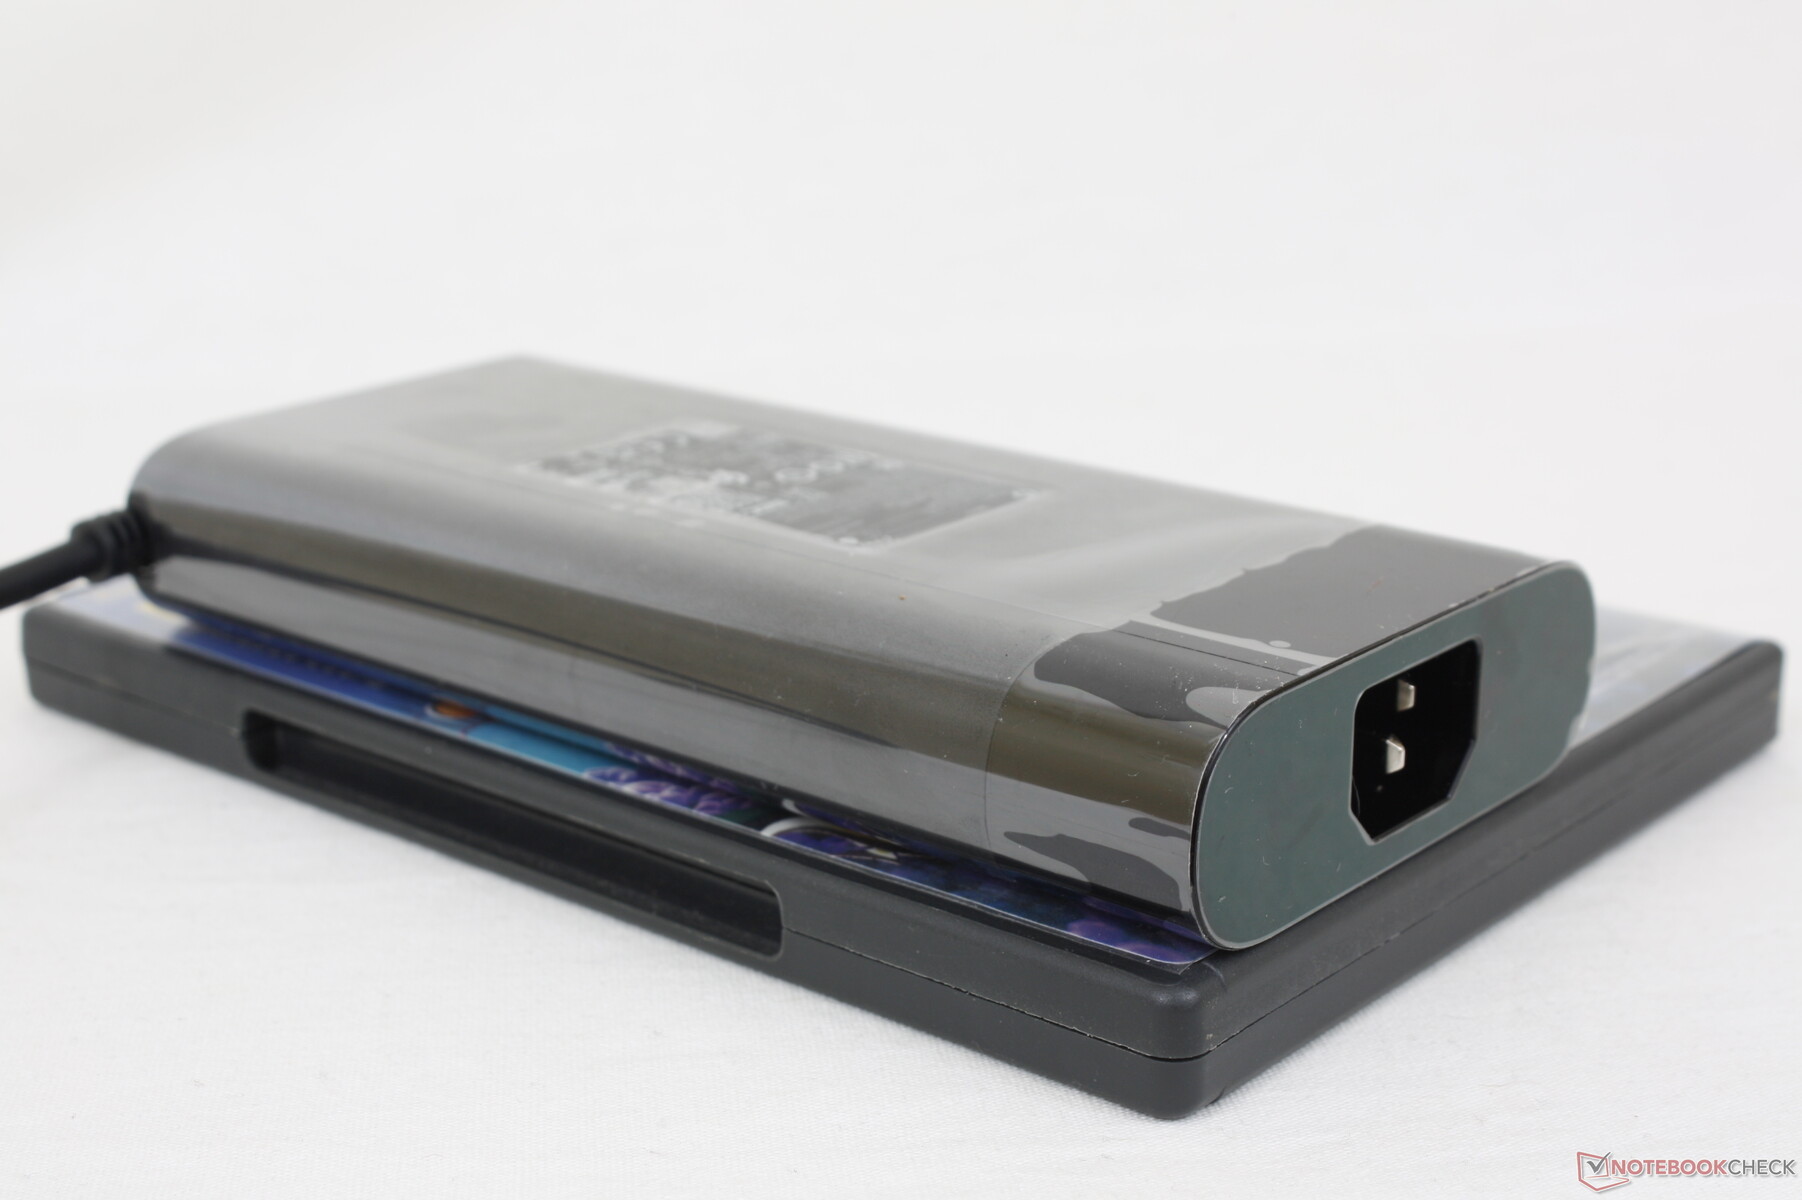
We meten een tijdelijk maximaal verbruik van 209,8 W uit de middelgrote (~16,5 x 7,8 x 2,5 cm) 200 W AC-adapter wanneer de CPU en GPU elk op 100 procent gebruik zitten. Het verbruik stabiliseert zich rond 160 W bij extreme belasting.
| Uit / Standby | |
| Inactief | |
| Belasting |
|
Key:
min: | |
| HP Envy 16 h0112nr i7-12700H, GeForce RTX 3060 Laptop GPU, Micron 3400 1TB MTFDKBA1T0TFH, OLED, 3840x2400, 16" | Lenovo ThinkBook 16 G4+ IAP i7-12700H, GeForce RTX 2050 Mobile, Micron 2450 1TB MTFDKCD1T0TFK, IPS, 2560x1600, 16" | MSI Creator Z16P B12UHST i9-12900H, GeForce RTX 3080 Ti Laptop GPU, Samsung PM9A1 MZVL22T0HBLB, IPS True Pixel (~100% DCI-P3), 2560x1600, 16" | Dell Inspiron 16 Plus 7610-MHJ8F i7-11800H, UHD Graphics Xe 32EUs (Tiger Lake-H), OM3PDP3-AD NVMe KDI 512GB, IPS, 3072x1920, 16" | Apple MacBook Pro 16 2021 M1 Pro M1 Pro, M1 Pro 16-Core GPU, Apple SSD AP1024R, Mini-LED, 3456x2234, 16.2" | Huawei MateBook 16s i7 i7-12700H, Iris Xe G7 96EUs, Silicon Motion PCIe-8 SSD, IPS, 2520x1680, 16" | |
|---|---|---|---|---|---|---|
| Power Consumption | 36% | -11% | 50% | 33% | 35% | |
| Idle Minimum * (Watt) | 10 | 5 50% | 11 -10% | 5.4 46% | 5 50% | 6.8 32% |
| Idle Average * (Watt) | 10.9 | 11.2 -3% | 17 -56% | 9.8 10% | 15.1 -39% | 13.2 -21% |
| Idle Maximum * (Watt) | 27.8 | 11.6 58% | 26 6% | 14 50% | 15.5 44% | 13.8 50% |
| Load Average * (Watt) | 116.4 | 89.3 23% | 124 -7% | 44 62% | 54 54% | 75.2 35% |
| Witcher 3 ultra * (Watt) | 133.7 | 83 38% | 133.5 -0% | 44 67% | 56.1 58% | |
| Load Maximum * (Watt) | 209.8 | 102 51% | 212 -1% | 76.8 63% | 90 57% | 90.6 57% |
* ... kleiner is beter
Power Consumption Witcher 3 / Stresstest
Power Consumption external Monitor
Levensduur van de batterij
De WLAN runtime is met ongeveer 8 uur vergelijkbaar met de MateBook 16s i7 of ThinkBook 16 G4+ IAP. De batterijcapaciteit blijft identiek aan de 2020 Envy 15, ondanks de overstap naar een groter schermformaat.
Opladen van leeg naar vol met de meegeleverde vatadapter duurt ongeveer 1,5 uur. Het systeem kan niet worden opgeladen via USB-C, ondanks wat de officiële specificaties kunnen beweren. Wanneer een 100 W USB-C lader wordt aangesloten, zou het systeem simpelweg een waarschuwing geven om in plaats daarvan een lader met een hogere capaciteit te gebruiken. We hebben HP om opheldering gevraagd en zullen deze sectie dienovereenkomstig bijwerken.
| HP Envy 16 h0112nr i7-12700H, GeForce RTX 3060 Laptop GPU, 83 Wh | Lenovo ThinkBook 16 G4+ IAP i7-12700H, GeForce RTX 2050 Mobile, 71 Wh | MSI Creator Z16P B12UHST i9-12900H, GeForce RTX 3080 Ti Laptop GPU, 90 Wh | Dell Inspiron 16 Plus 7610-MHJ8F i7-11800H, UHD Graphics Xe 32EUs (Tiger Lake-H), 86 Wh | Apple MacBook Pro 16 2021 M1 Pro M1 Pro, M1 Pro 16-Core GPU, 99.6 Wh | Huawei MateBook 16s i7 i7-12700H, Iris Xe G7 96EUs, 84 Wh | |
|---|---|---|---|---|---|---|
| Batterijduur | -1% | -36% | 67% | 114% | 11% | |
| Reader / Idle (h) | 17.8 | 22.5 26% | ||||
| WiFi v1.3 (h) | 7.9 | 8.2 4% | 5.2 -34% | 9.5 20% | 16.9 114% | 8.1 3% |
| Load (h) | 1.6 | 1.5 -6% | 1 -37% | 4.1 156% | 1.9 19% | |
| H.264 (h) | 12.6 | 5.8 | 17.5 | 9.3 | ||
| WiFi (h) | 9.5 |
Pro
Contra
Verdict - Als een budget MacBook Pro 16
De Envy 16 is natuurlijk sneller dan de oudere Envy 15, maar sommige van de nadelen die we bij de Envy 15 noemden, zijn nog niet aangepakt. De luide ventilatoren, het ontbreken van een Kensington-slot, het sponzige clickpad en de relatief zwakke scharnieren zijn een stap omlaag ten opzichte van alternatieven als de MacBook Pro 16 of Dell Inspiron 16 Plus. Het systeem is ook een van de grotere en zwaardere 16-inch laptops op de markt, wat reizigers en studenten kan afschrikken.
De HP Envy 16 is bijna 1000 dollar goedkoper dan de basis-MacBook Pro 16, terwijl hij concurrerende prestaties en kleuren biedt. Het is echter wel een luid en zwaar systeem.
Gebruikers die zich niet laten afschrikken door het gewicht zullen merken dat de Envy 16 een veelzijdig systeem is met prestaties, schermgrootte en kleuren die geschikt zijn voor gaming en bewerkingsdoeleinden. We waarderen vooral hoe eenvoudig het is om meer opslag of RAM toe te voegen indien nodig. Als uw taken echter niet veel paardenkracht vereisen, dan zijn veel lichtere 16-inch opties te overwegen, zoals de LG Gram 16 of Huawei MateBook 16s.
Prijs en beschikbaarheid
De Envy 16 is nu verkrijgbaar bij de grote retailers, waaronder Newegg, Best Buy, Costco, Micro Center, en HP.com in verschillende configuraties. Onze specifieke configuratie is te vinden op Micro Center voor $1700 USD, terwijl Intel Arc A370M SKU's elders te vinden zijn.
HP Envy 16 h0112nr
- 24-09-2022 v7 (old)
Allen Ngo
Price comparison

