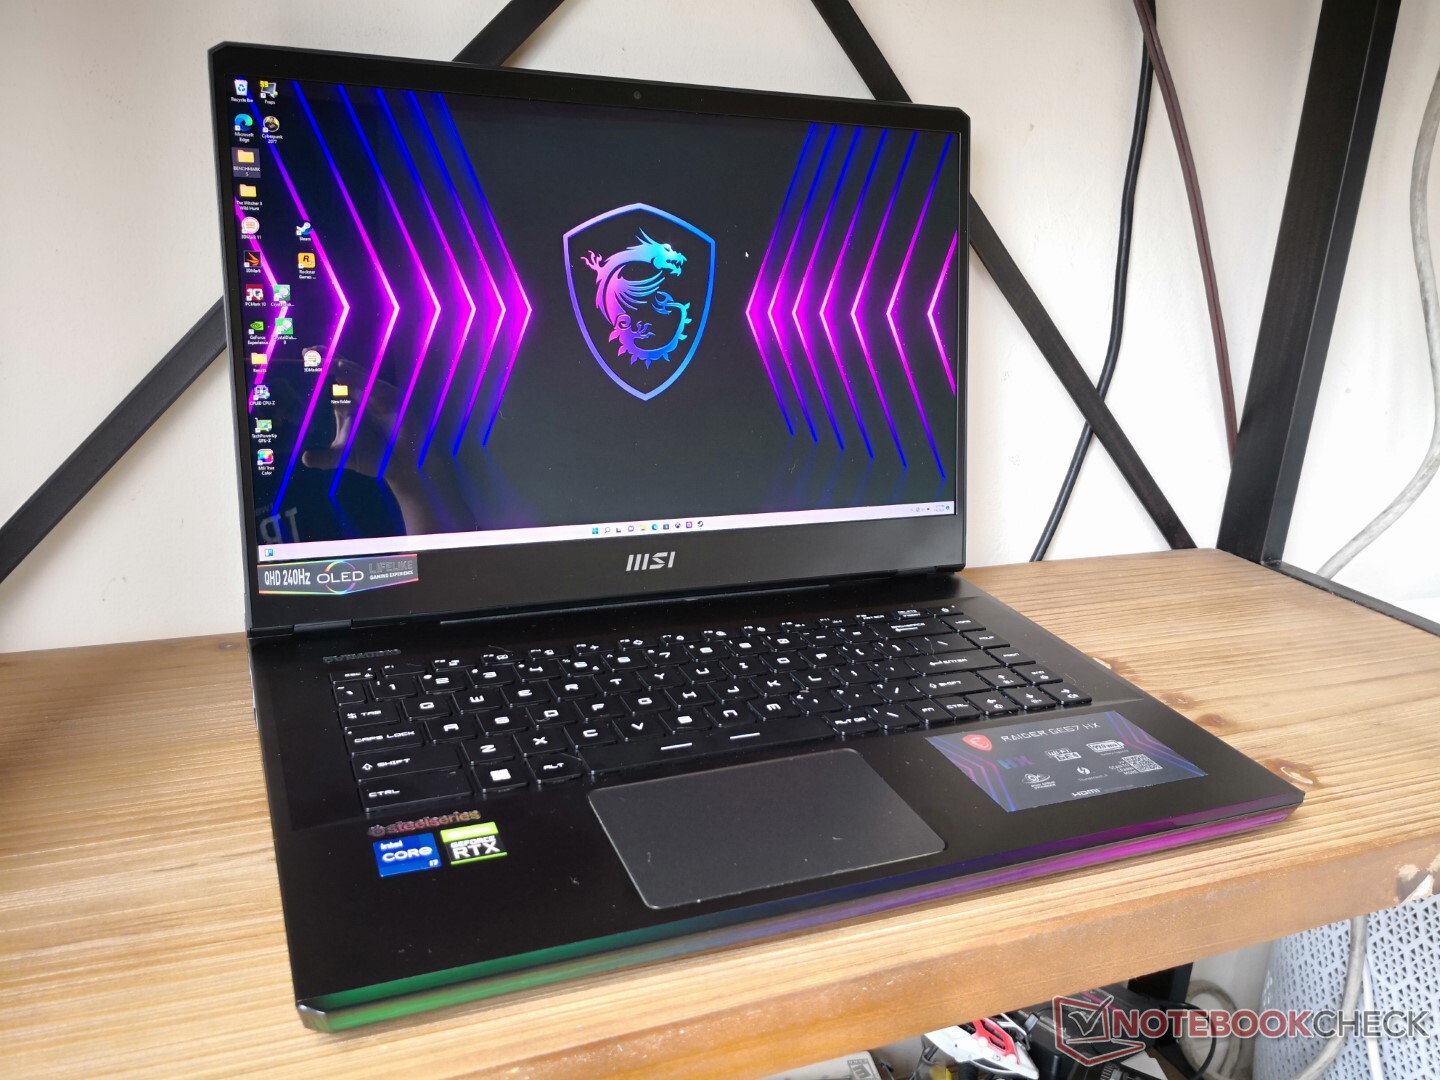
De Intel Core i7-12800HX is waanzinnig: MSI Raider GE67 HX 12UGS laptop review
De MSI GE67 is een high-end gaming serie die boven de minder dure Katana GF of Vector GP serie staat, maar onder de enthousiaste Titan GT serie. Onze GE67 test unit is een directe opvolger van de 2020 GE66. In plaats van te worden geleverd met Intel 10e generatie Comet Lake-H CPU's en Nvidia GeForce Super GPU's, wordt de GE67 geleverd met 12e generatie Alder Lake-H CPU's en mobiele GeForce Ti GPU's
We raden aan onze bestaande twee reviews over de GE66, aangezien de GE67 grotendeels gebruik maakt van hetzelfde chassisontwerp en functies. Er zijn niettemin enkele relatief kleine visuele verschillen die we in onze review hieronder in detail zullen bespreken
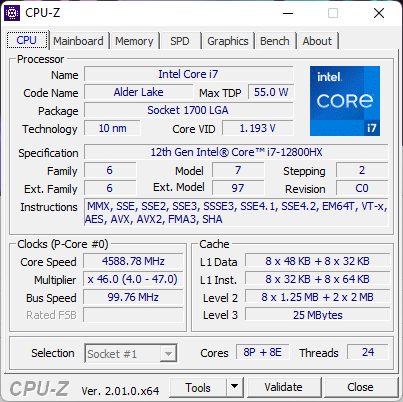
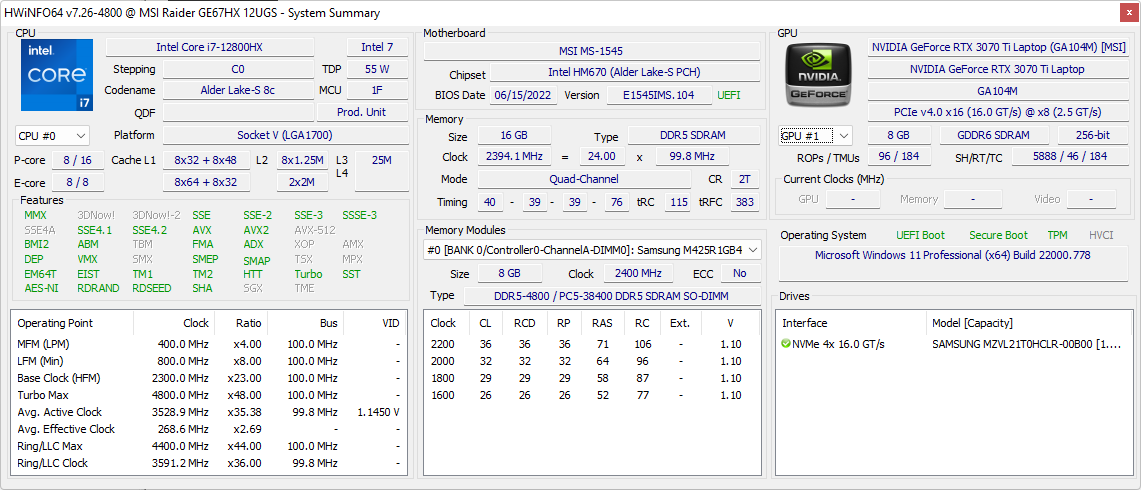
Onze testeenheid is uitgerust met de 16-core Core i7-12800HX CPU, GeForce RTX 3070 Ti GPU, en 240 Hz QHD OLED paneel dat volledige DCI-P3 dekking belooft voor ongeveer $2500 USD retail. Directe concurrenten in deze ruimte zijn andere high-end 15,6-inch gaming laptops zoals de Asus ROG Strix Scar 15, Razer Blade 15ofAlienware m15 R6.
Meer MSI beoordelingen:
Potentiële concurrenten in vergelijking
Evaluatie | Datum | Model | Gewicht | Hoogte | Formaat | Resolutie | Beste prijs |
|---|---|---|---|---|---|---|---|
| 87.7 % v7 (old) | 07-2022 | MSI GE67 HX 12UGS i7-12800HX, GeForce RTX 3070 Ti Laptop GPU | 2.5 kg | 23.4 mm | 15.60" | 1920x1080 | |
| 87.4 % v7 (old) | 06-2022 | MSI Raider GE66 12UHS i9-12900HK, GeForce RTX 3080 Ti Laptop GPU | 2.4 kg | 23.4 mm | 15.60" | 3840x2160 | |
| 86.9 % v7 (old) | 03-2022 | MSI Vector GP66 12UGS i9-12900H, GeForce RTX 3070 Ti Laptop GPU | 2.3 kg | 23.4 mm | 15.60" | 1920x1080 | |
| 86.3 % v7 (old) | 06-2022 | Asus ROG Strix Scar 15 G533ZW-LN106WS i9-12900H, GeForce RTX 3070 Ti Laptop GPU | 2.3 kg | 27.2 mm | 15.60" | 2560x1440 | |
| 86.1 % v7 (old) | 11-2021 | Alienware m15 R6, i7-11800H RTX 3080 i7-11800H, GeForce RTX 3080 Laptop GPU | 2.5 kg | 22.85 mm | 15.60" | 1920x1080 | |
| 89.1 % v7 (old) | 03-2022 | Razer Blade 15 2022 i7-12800H, GeForce RTX 3080 Ti Laptop GPU | 2.1 kg | 16.99 mm | 15.60" | 2560x1440 |
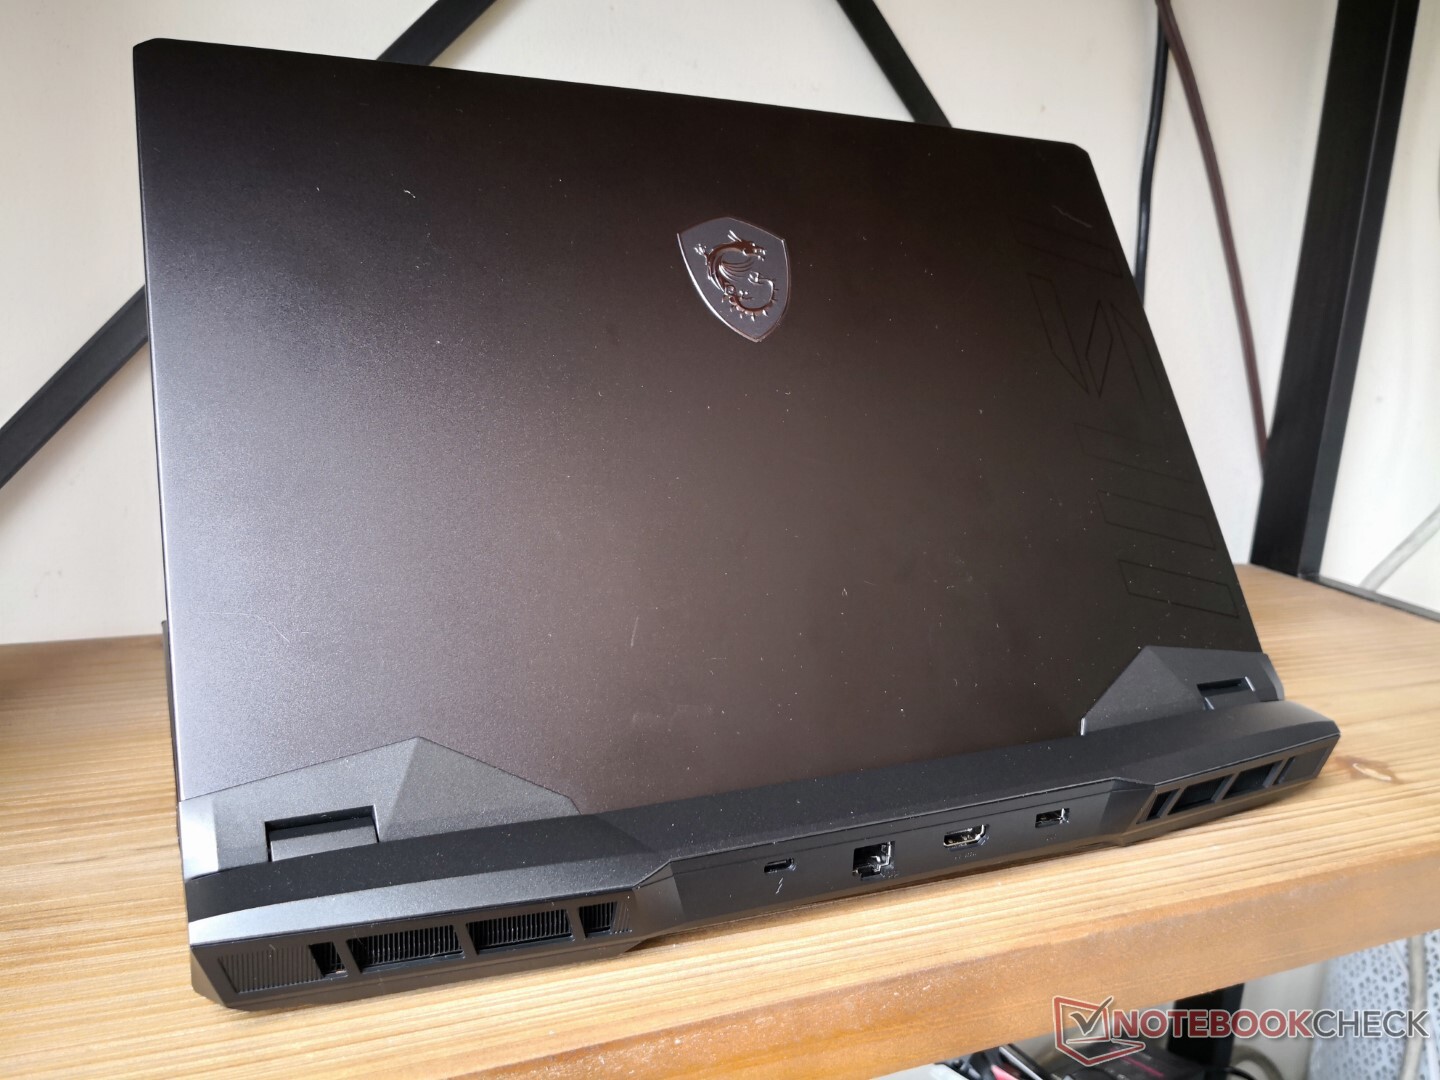
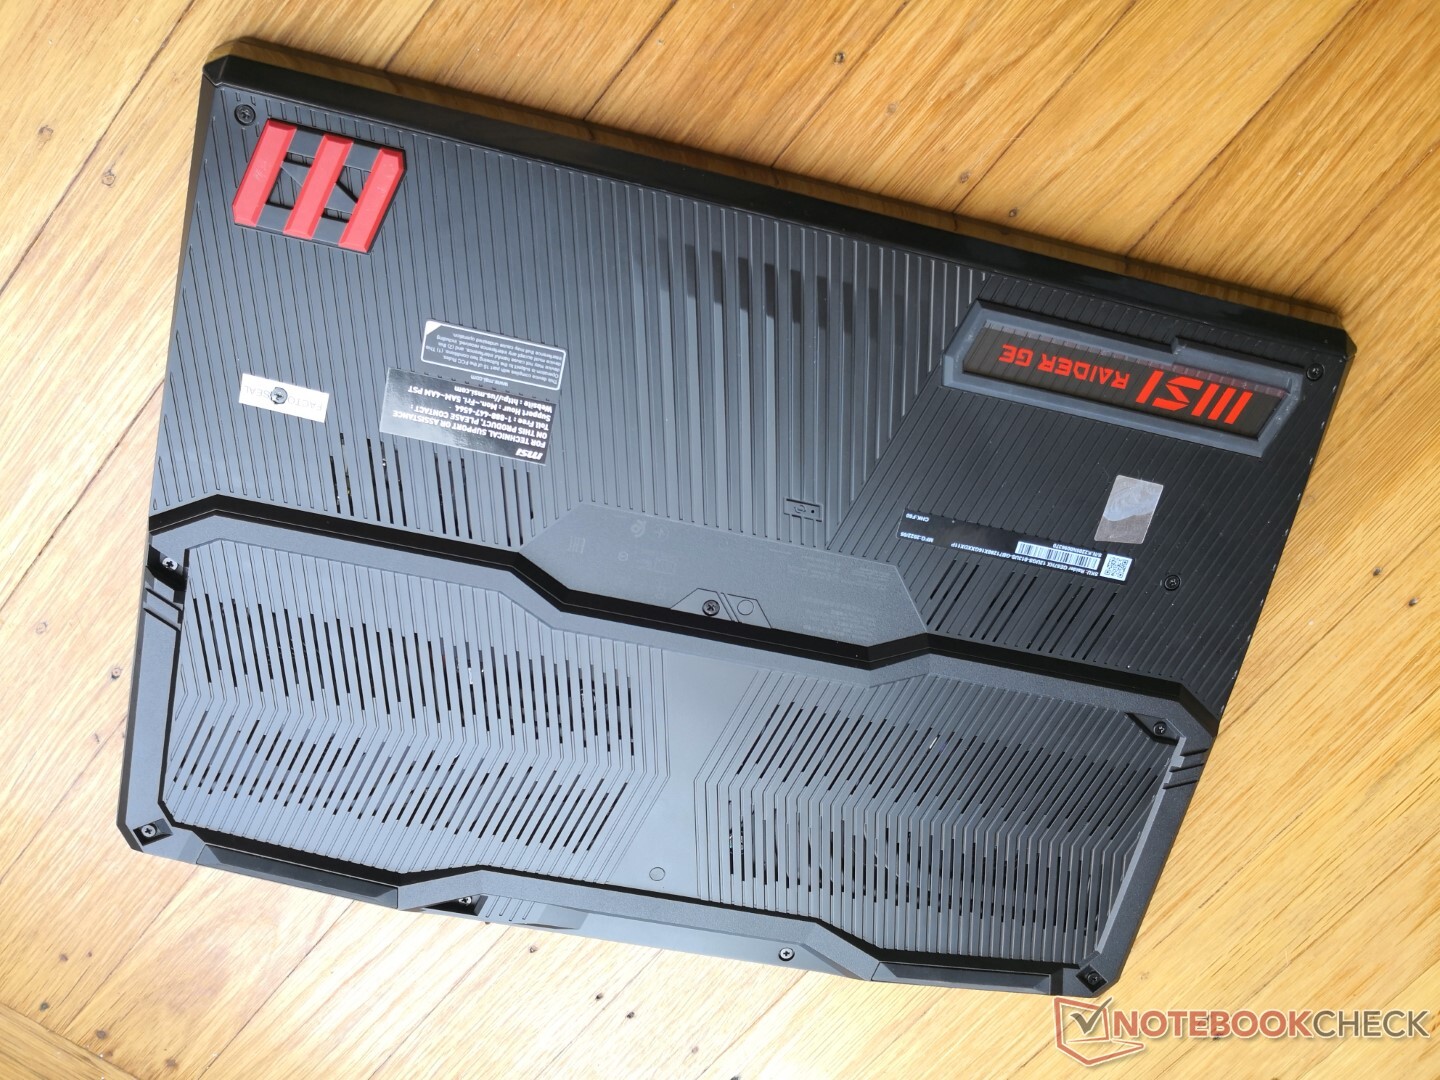
Zaak - hetzelfde van boven, anders van onder
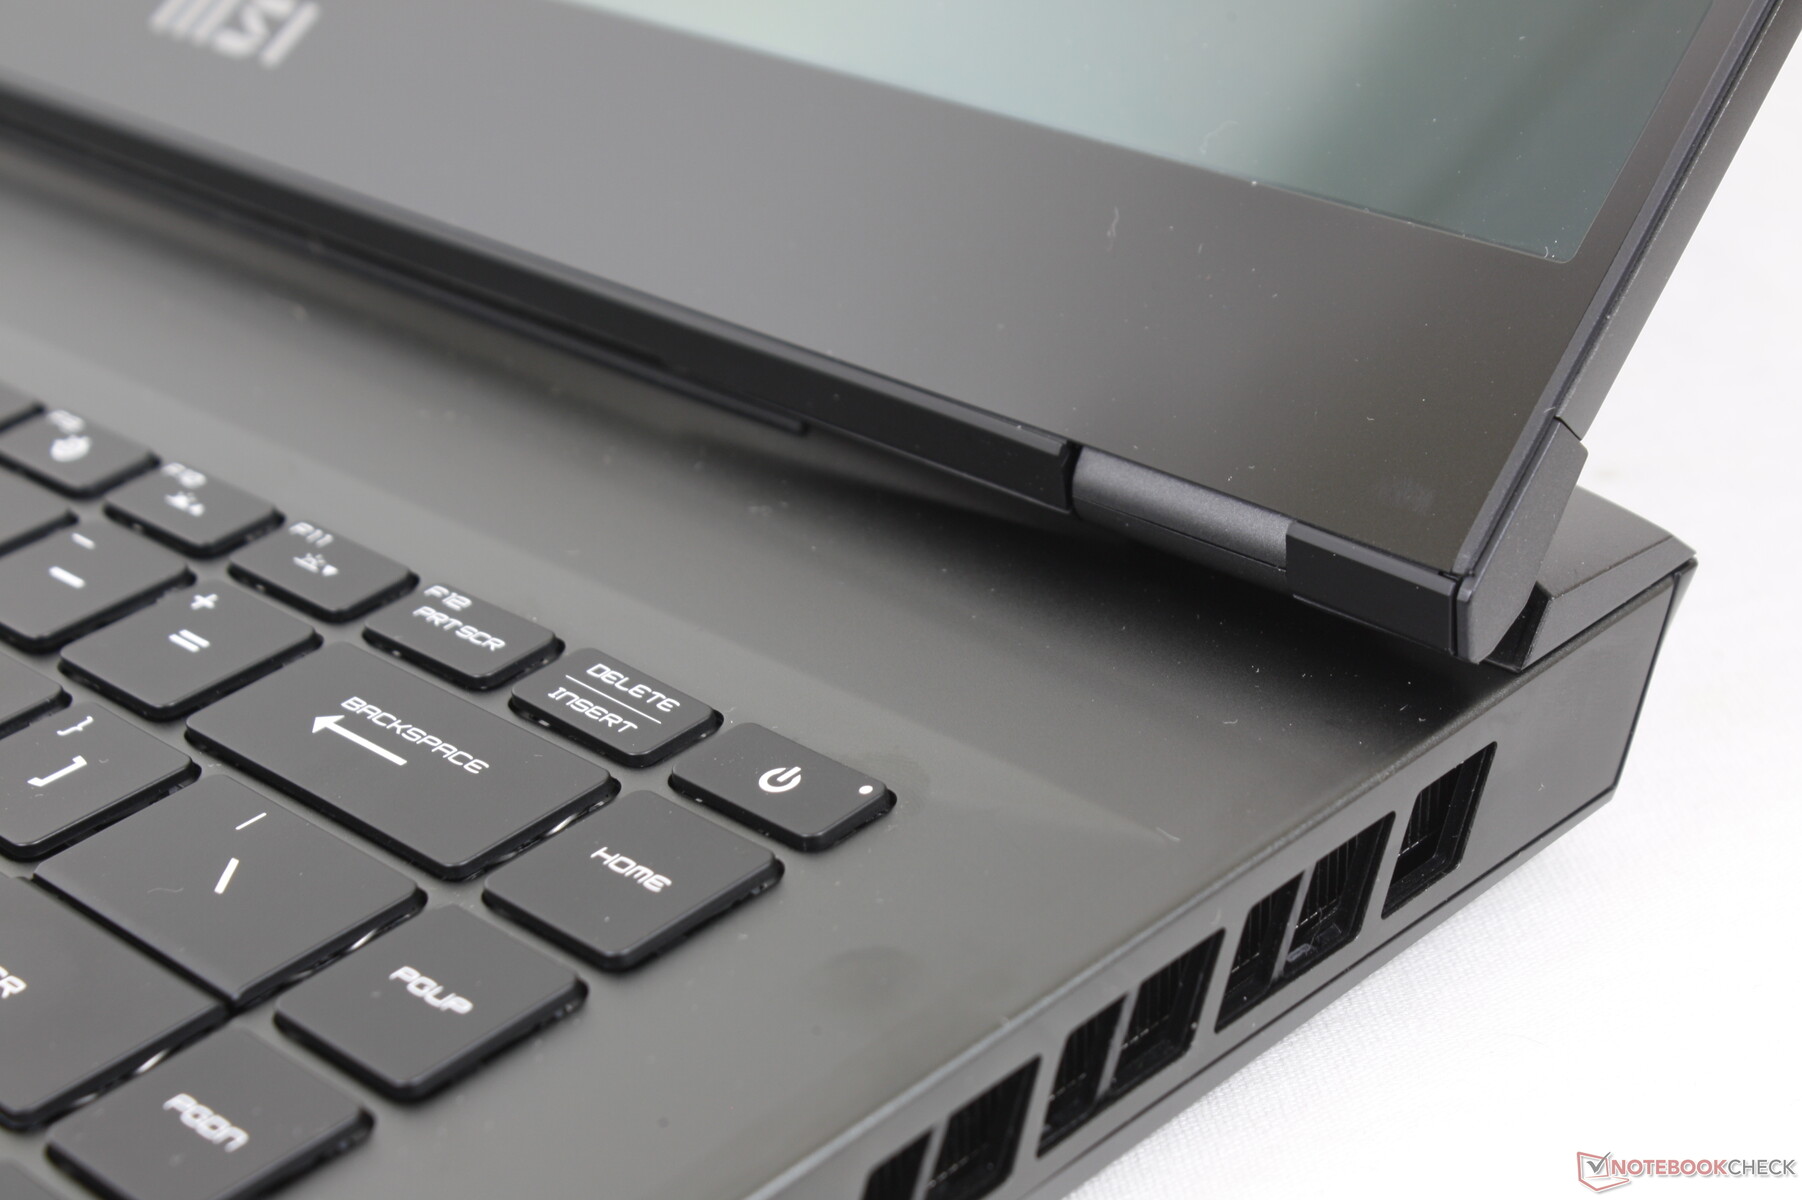
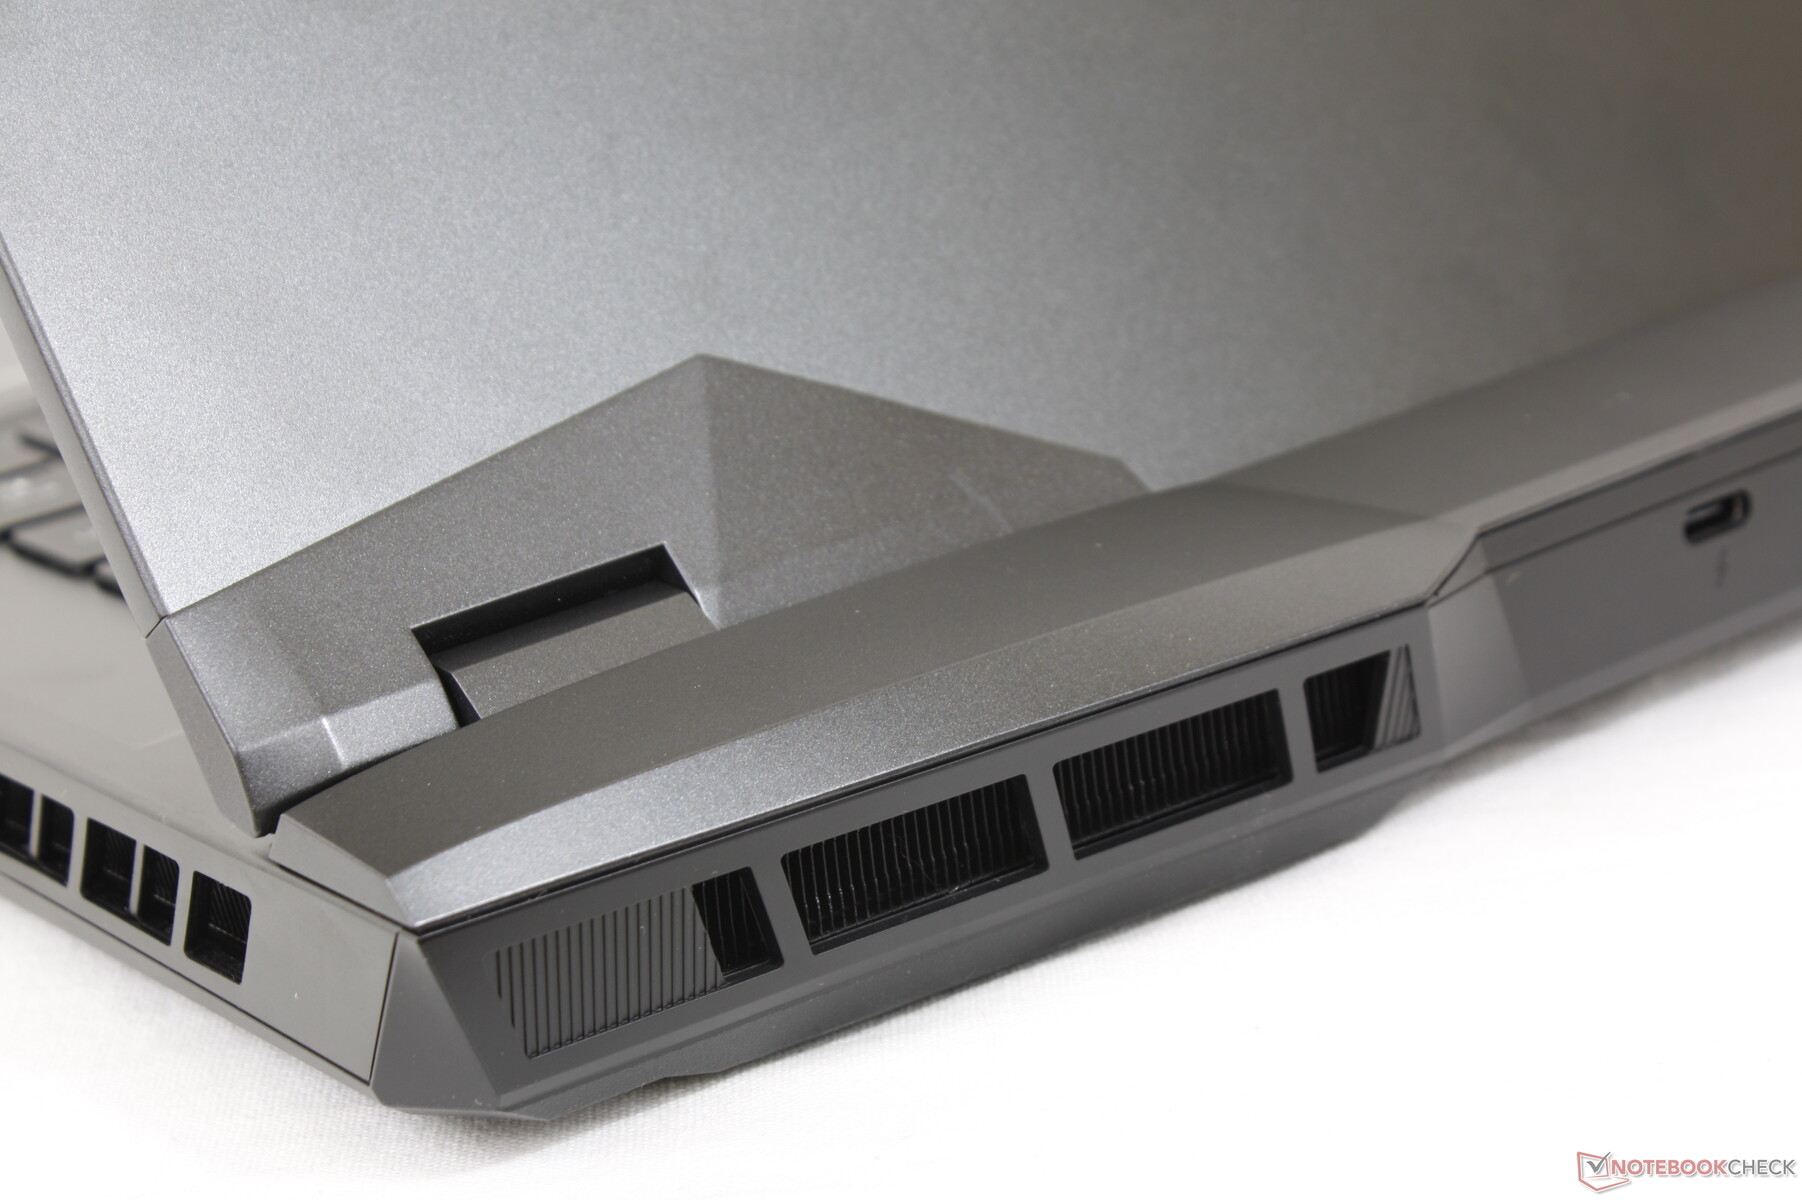
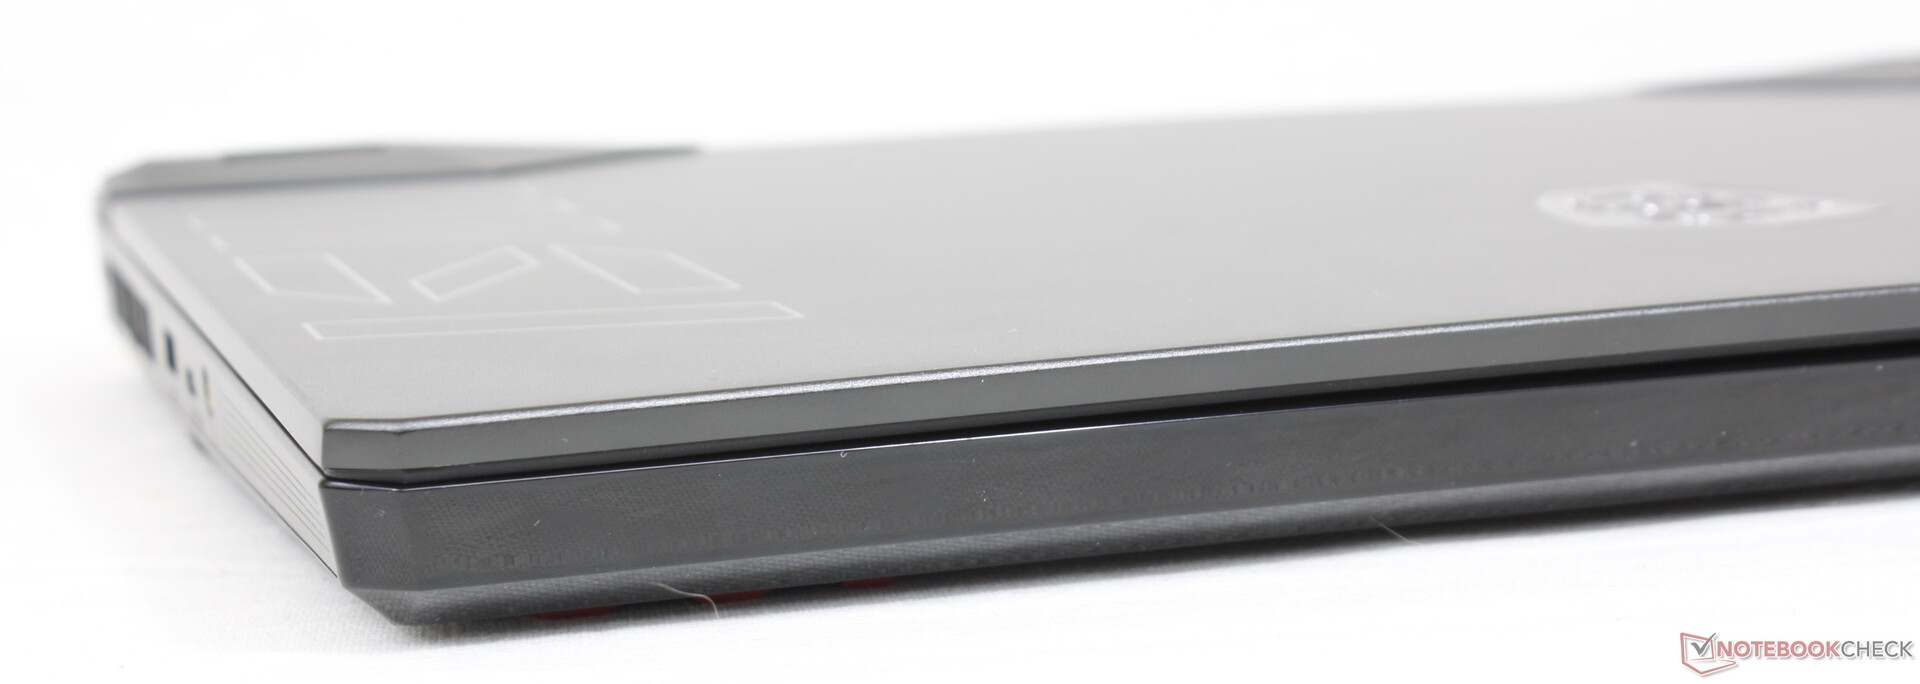
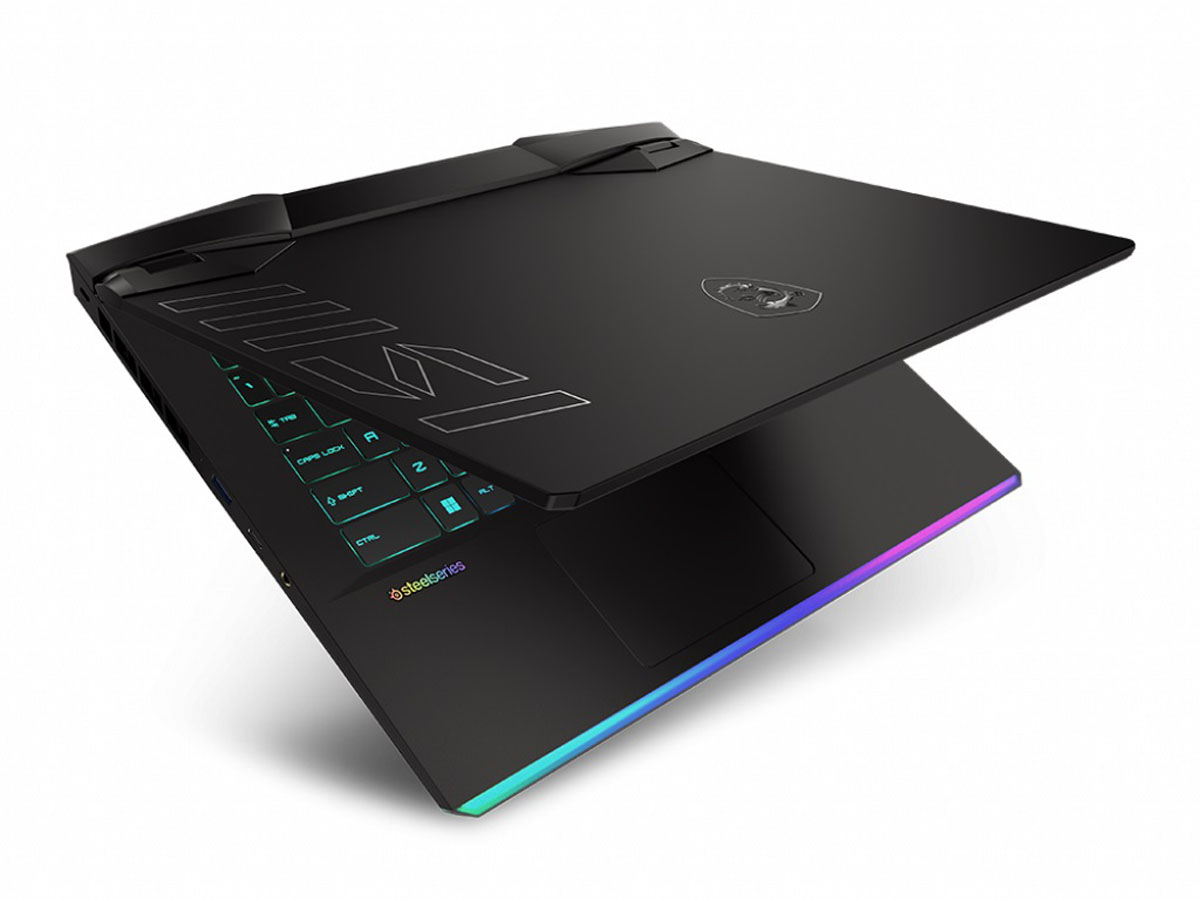
Hoewel de chassisafmetingen exact gelijk zijn aan die van de GE66, zijn er een aantal visuele verschillen. Ten eerste heeft de GE67 een groot MSI logo langs de linker rand van de buitenste deksel, wat helpt om gemakkelijker onderscheid te maken tussen de GE66 en GE67. Ten tweede heeft MSI de onderzijde van de GE67 volledig opnieuw ontworpen, waarschijnlijk om de algehele koelmogelijkheden van het model te verbeteren. Voor het overige maken zowel de GE66 als de GE67 gebruik van vergelijkbare metalen materialen voor het deksel en toetsenbord dek en plastic voor de bodemplaat. De kenmerkende LED balk langs de voorste rand blijft onaangetast.
Het nieuwe model is iets zwaarder dan zijn voorganger met ongeveer 100 g waarschijnlijk als gevolg van de kleine veranderingen.
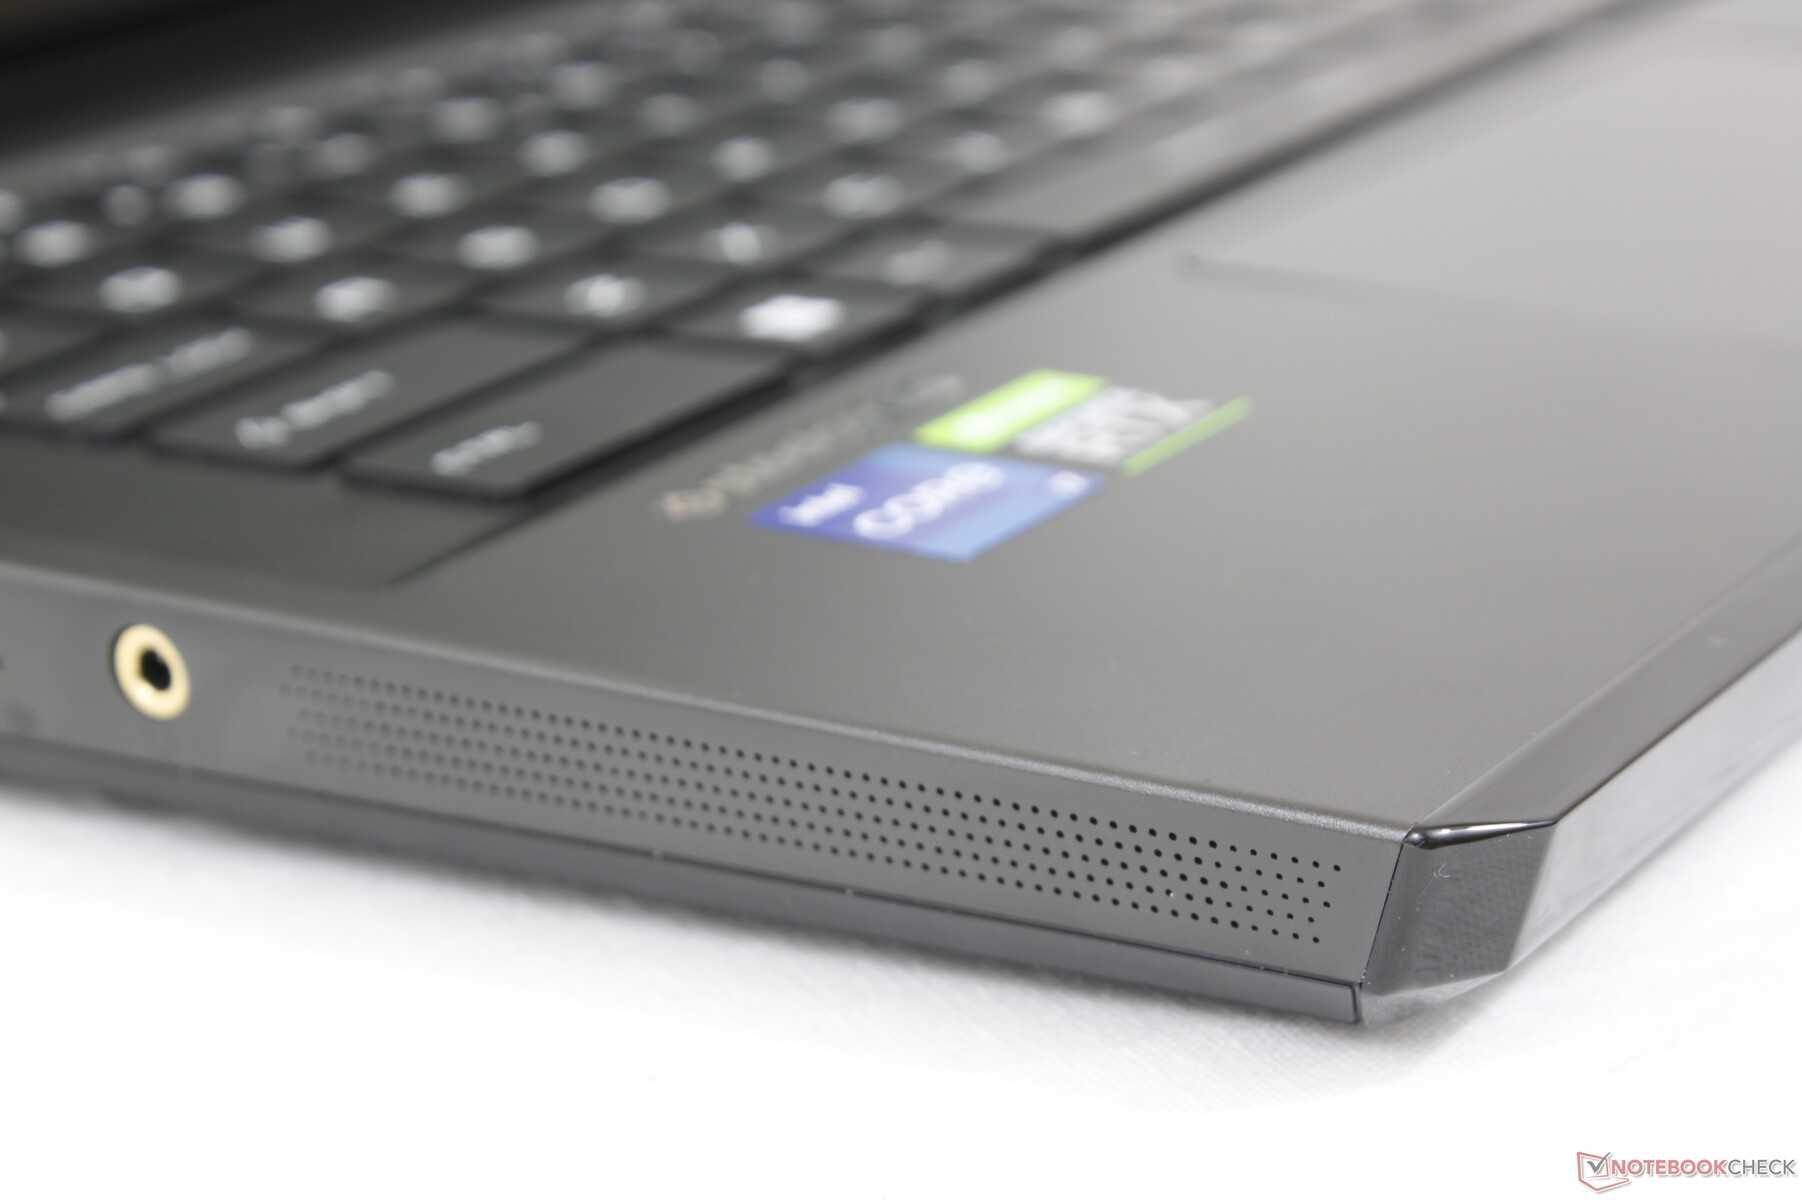
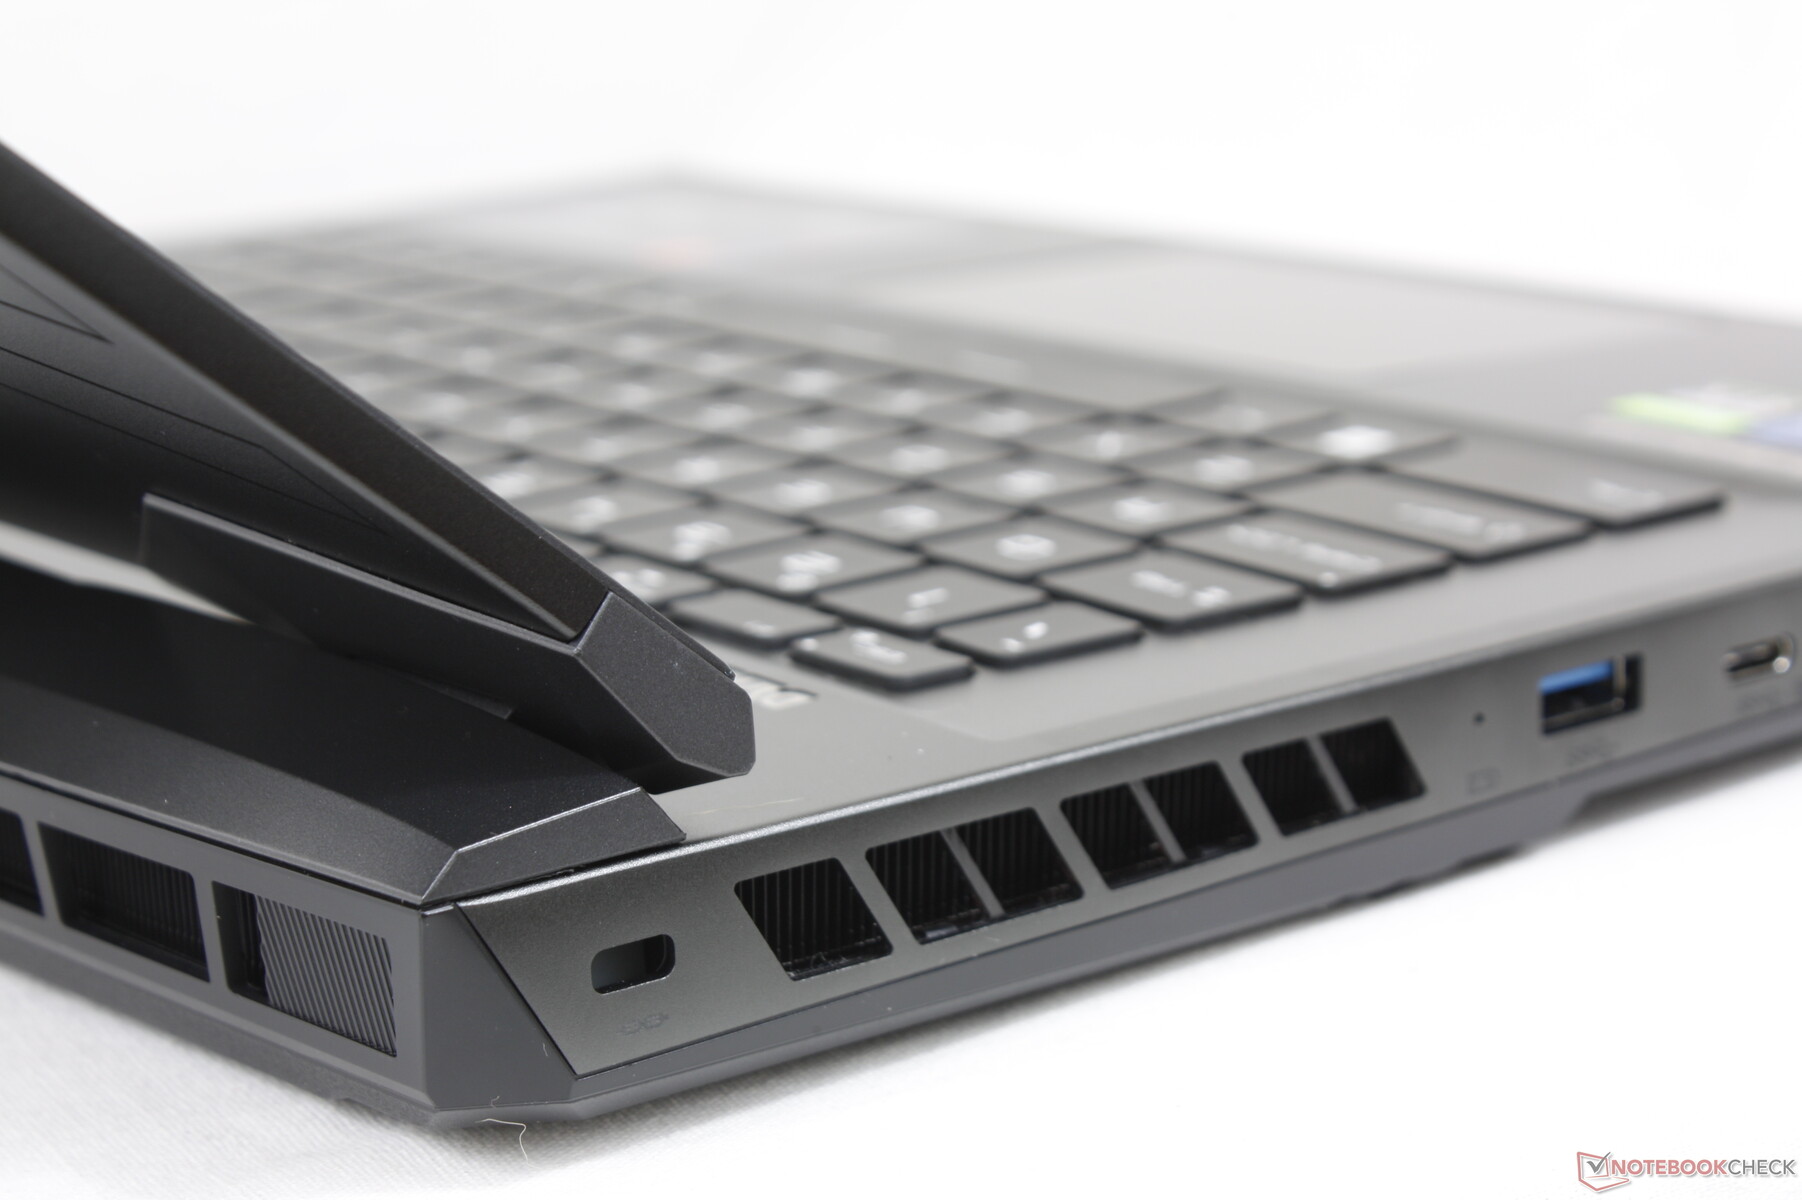
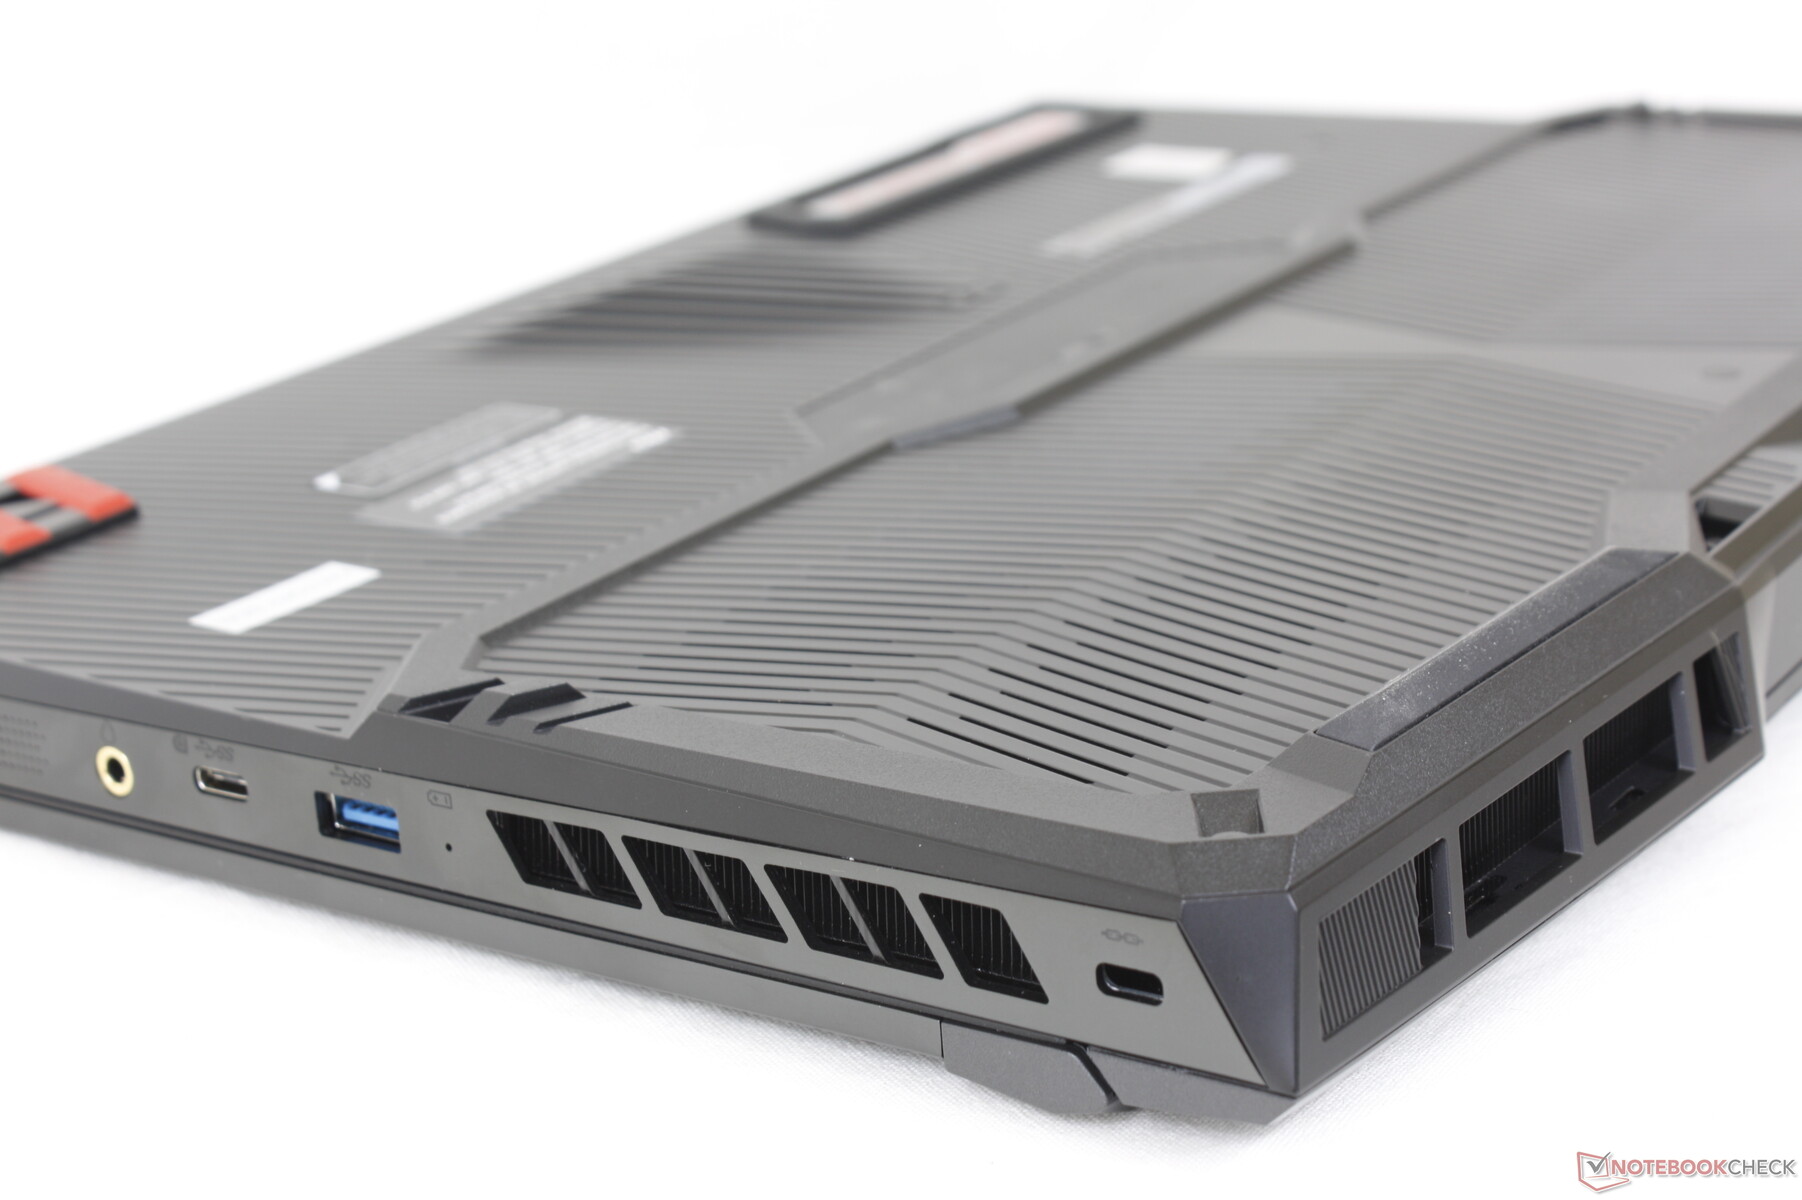
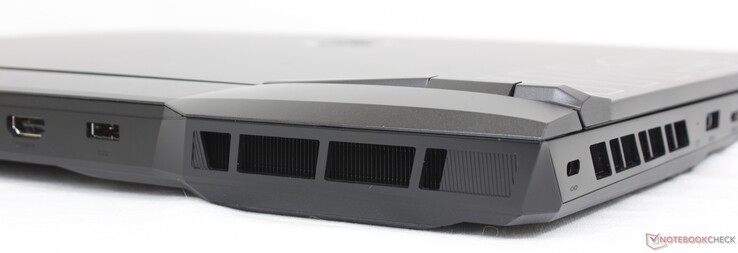
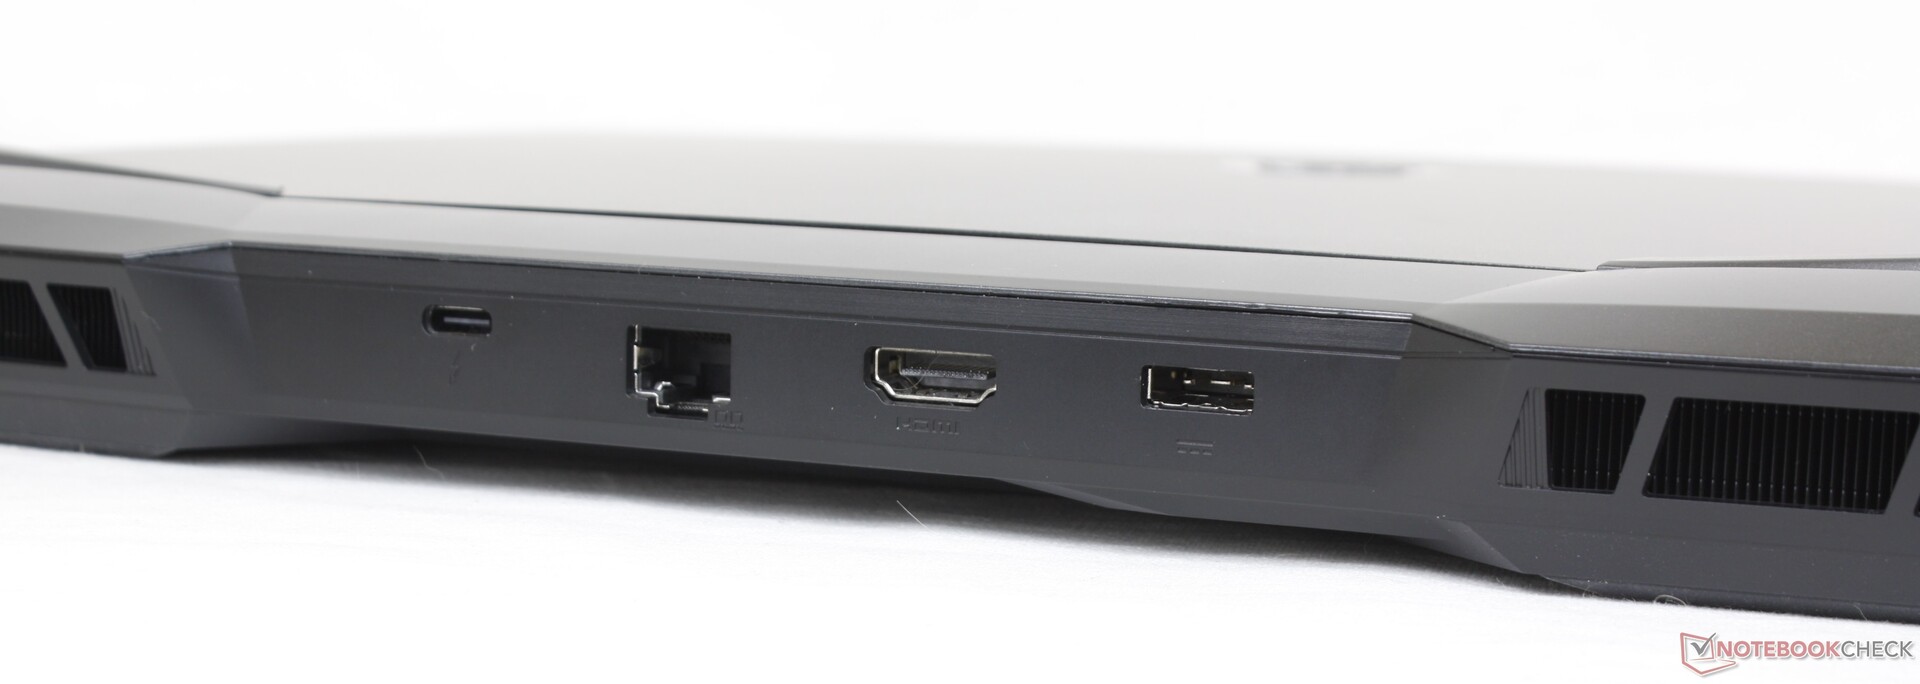
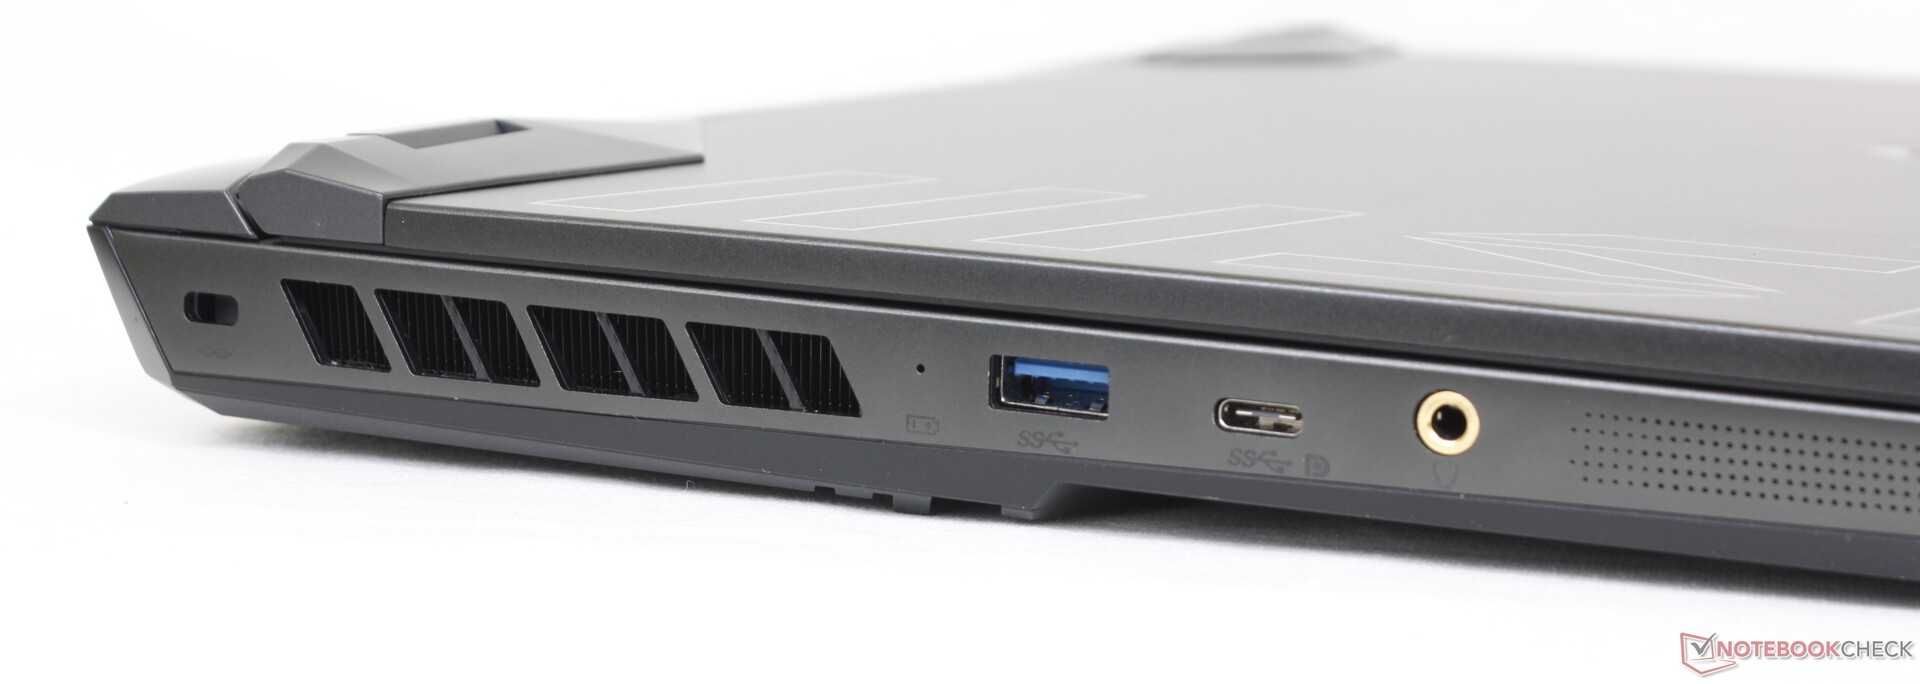
Connectiviteit - Geen Mini-DisplayPort meer
De GE67 heeft de speciale mini-DisplayPort die aanwezig was op de GE66 laten vallen. DisplayPort wordt nog wel ondersteund via de twee USB-C poorten.
Net als bij andere gaming laptops gebaseerd op het Alder-Lake-H platform zoals de Asus TUF Gaming F15 FX507ZM, zal Thunderbolt 4 connectiviteit worden uitgeschakeld als je op discrete grafische modus draait.
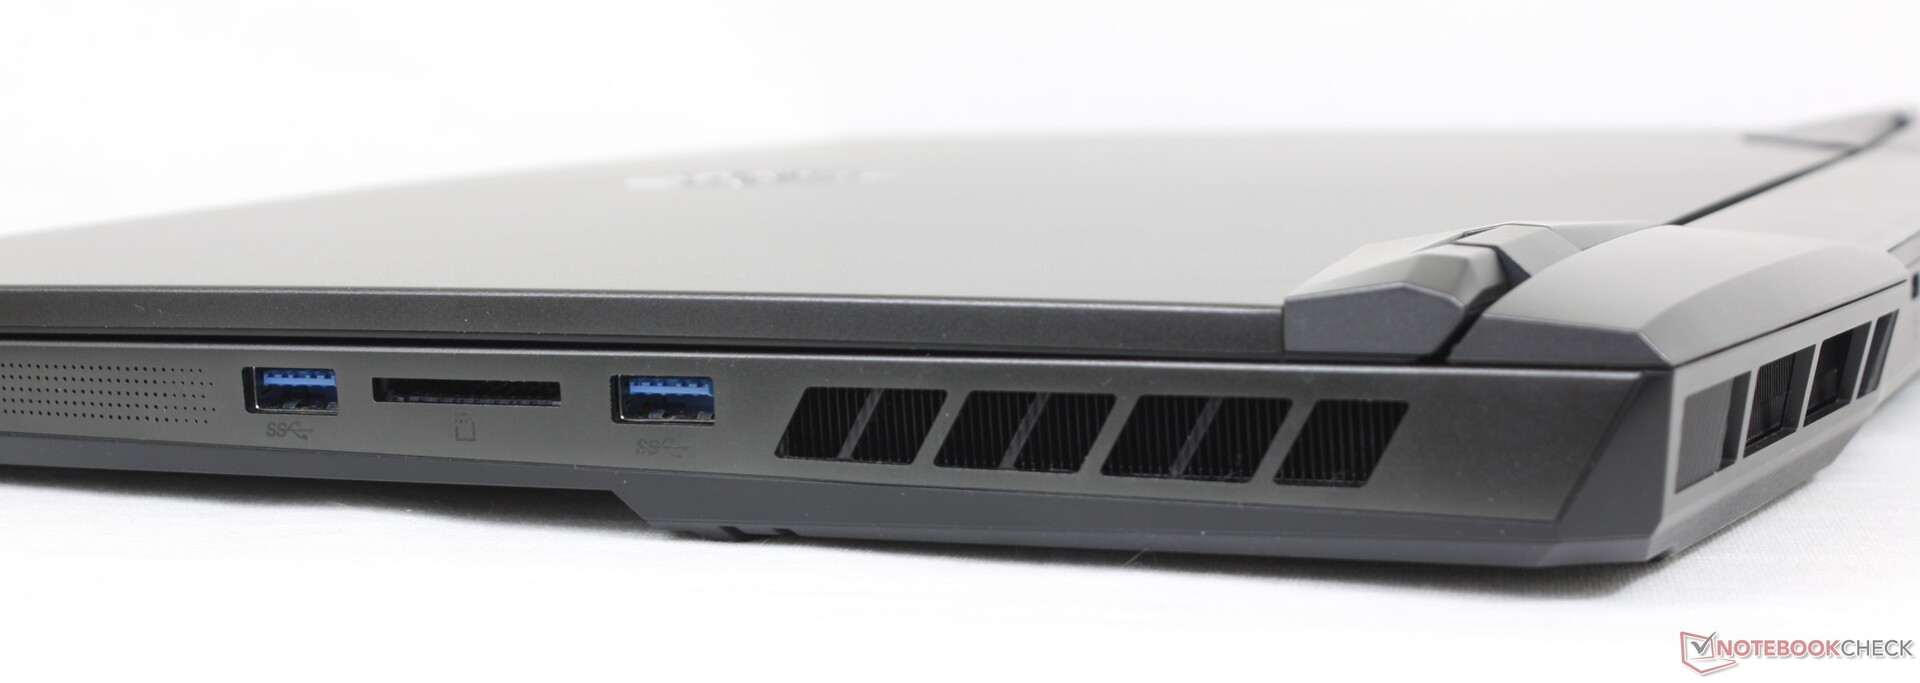
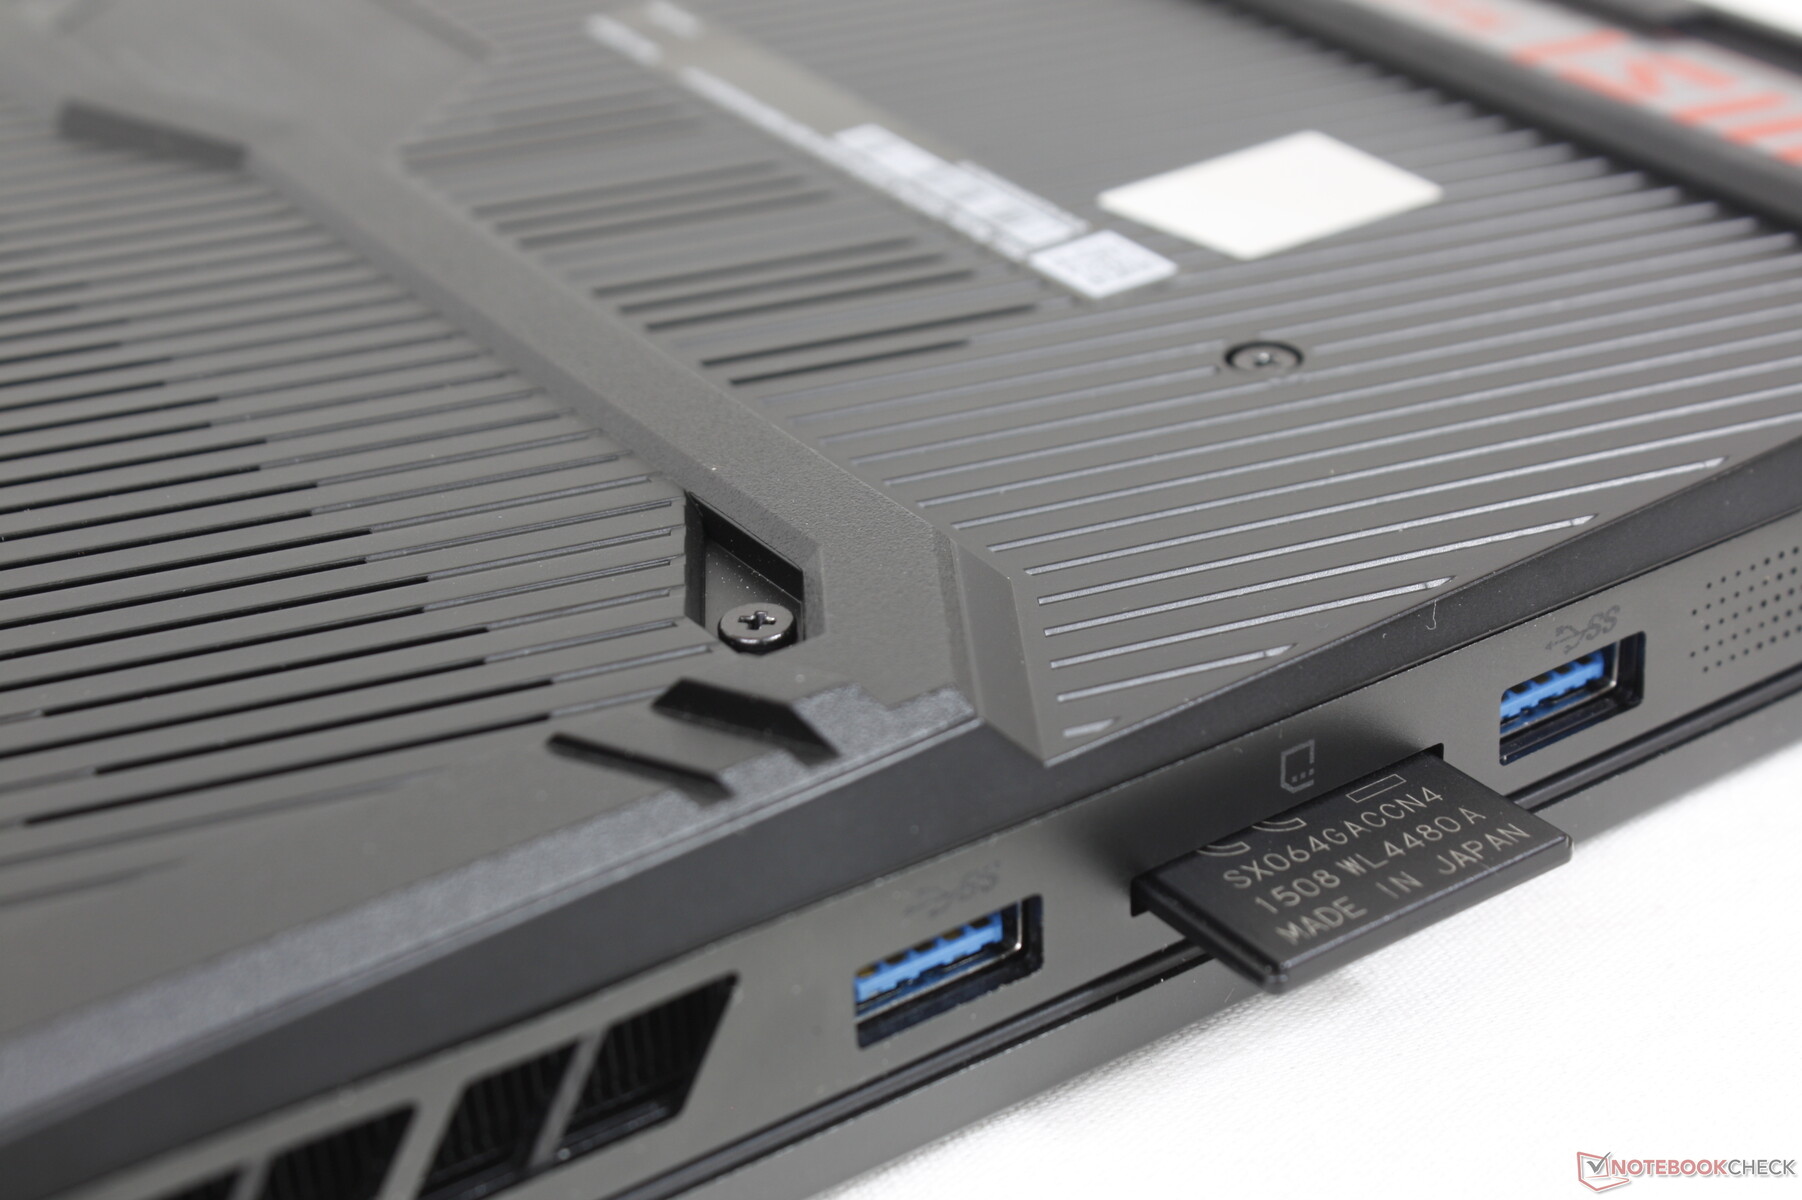
SD-kaartlezer
Overdrachtssnelheden van de geïntegreerde SD-kaartlezer zijn traag in verhouding tot de vraagprijs van de configuratie. Gebruikers zullen 2x snellere SD lezer prestaties zien bij concurrerende modellen zoals de Razer Blade 15 of Asus ROG Zephyrus Duo 16.
| SD Card Reader | |
| average JPG Copy Test (av. of 3 runs) | |
| Razer Blade 15 2022 (Toshiba Exceria Pro SDXC 64 GB UHS-II) | |
| MSI GE67 HX 12UGS (Toshiba Exceria Pro SDXC 64 GB UHS-II) | |
| MSI Raider GE66 12UHS (AV PRO microSD 128 GB V60) | |
| maximum AS SSD Seq Read Test (1GB) | |
| Razer Blade 15 2022 (Toshiba Exceria Pro SDXC 64 GB UHS-II) | |
| MSI GE67 HX 12UGS (Toshiba Exceria Pro SDXC 64 GB UHS-II) | |
Communicatie
| Networking | |
| iperf3 transmit AX12 | |
| Razer Blade 15 2022 | |
| MSI Vector GP66 12UGS | |
| Alienware m15 R6, i7-11800H RTX 3080 | |
| iperf3 receive AX12 | |
| Razer Blade 15 2022 | |
| MSI Vector GP66 12UGS | |
| Alienware m15 R6, i7-11800H RTX 3080 | |
| iperf3 receive AXE11000 6GHz | |
| Asus ROG Strix Scar 15 G533ZW-LN106WS | |
| MSI GE67 HX 12UGS | |
| iperf3 transmit AXE11000 6GHz | |
| Asus ROG Strix Scar 15 G533ZW-LN106WS | |
| MSI GE67 HX 12UGS | |
Webcam
Er zijn geen veranderingen aan de 2 MP webcam, wat ook betekent dat er nog steeds geen fysieke privacy shutter of zelfs Windows Hello ondersteuning is. Gebruikers kunnen in plaats daarvan de webcam elektronisch uitschakelen via de F4-toets.
Merk op dat het lampje van de webcamactiviteit altijd knippert wanneer de webcam actief is. Dit is vooral vervelend tijdens videogesprekken en we kunnen geen optie vinden om het knipperende licht uit te schakelen.


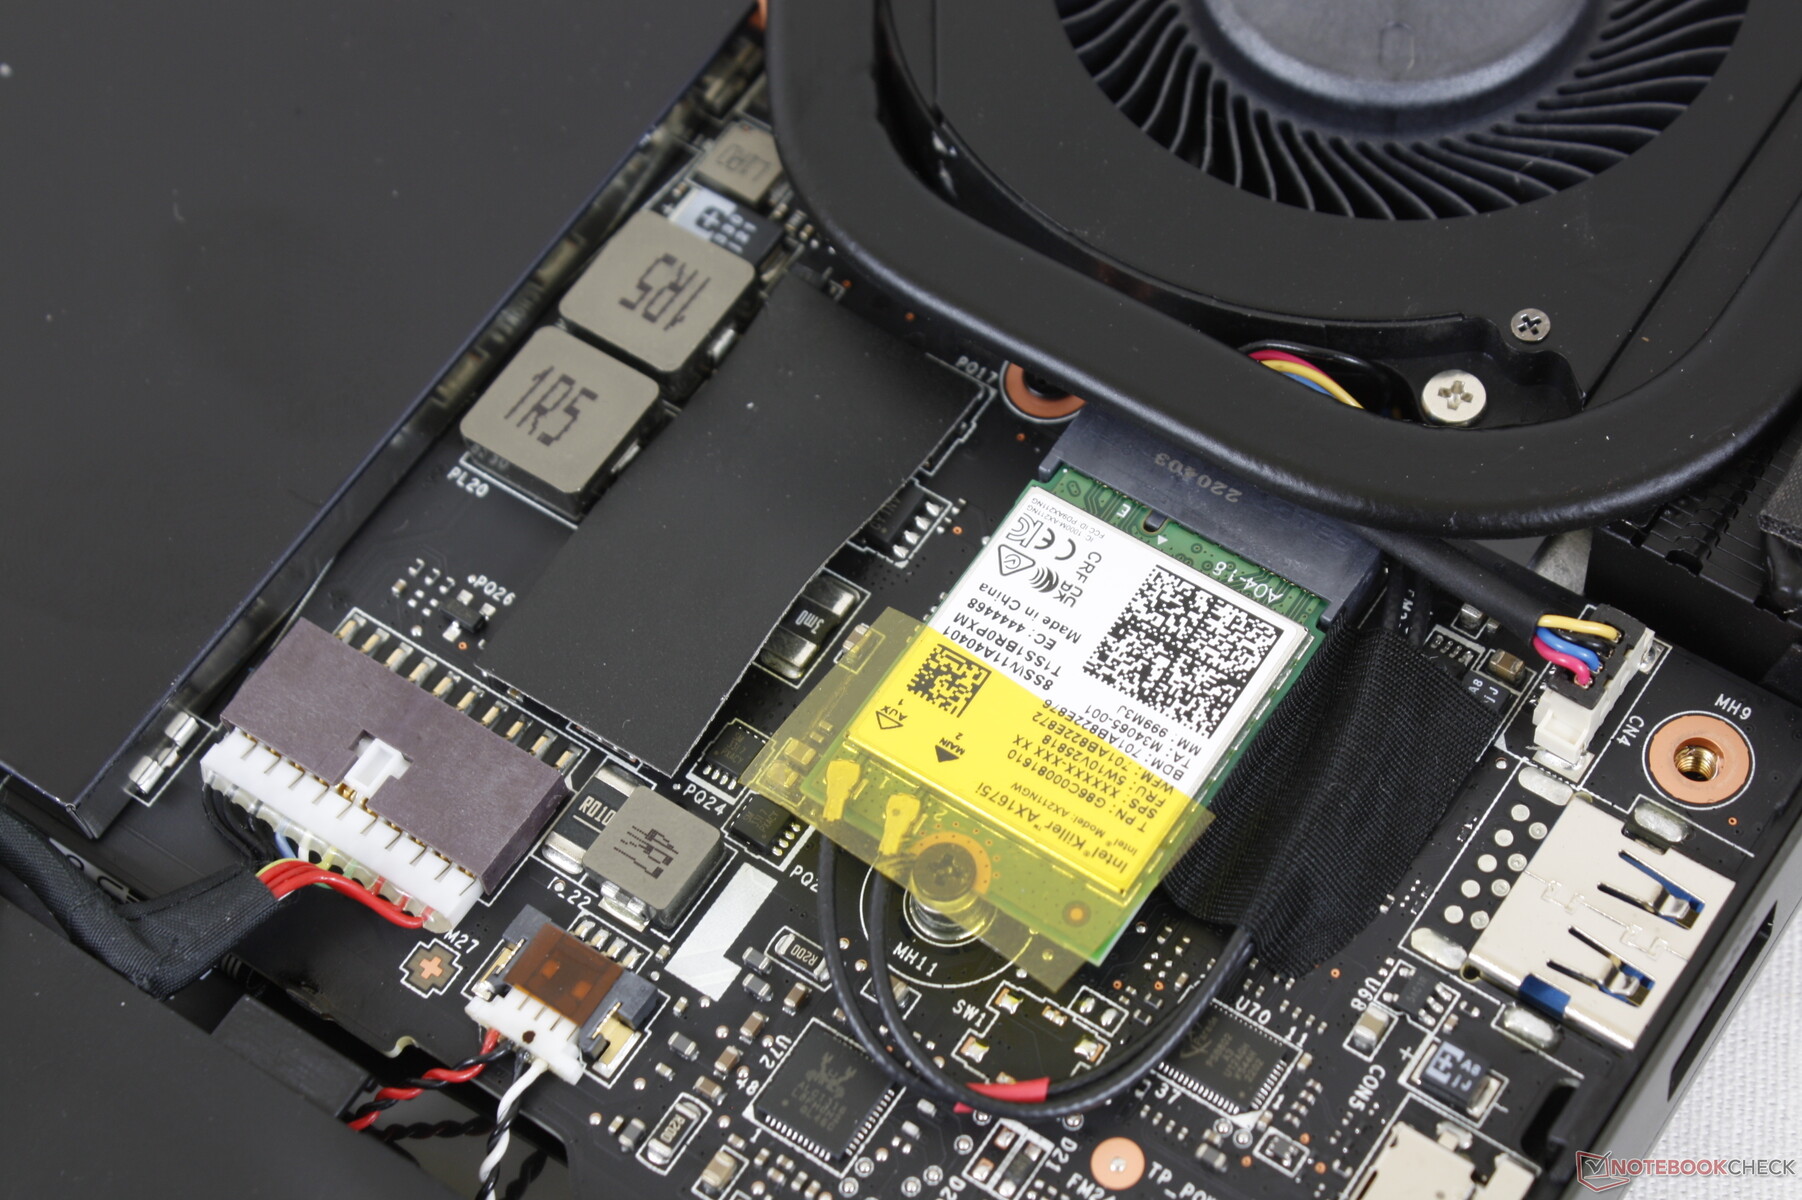
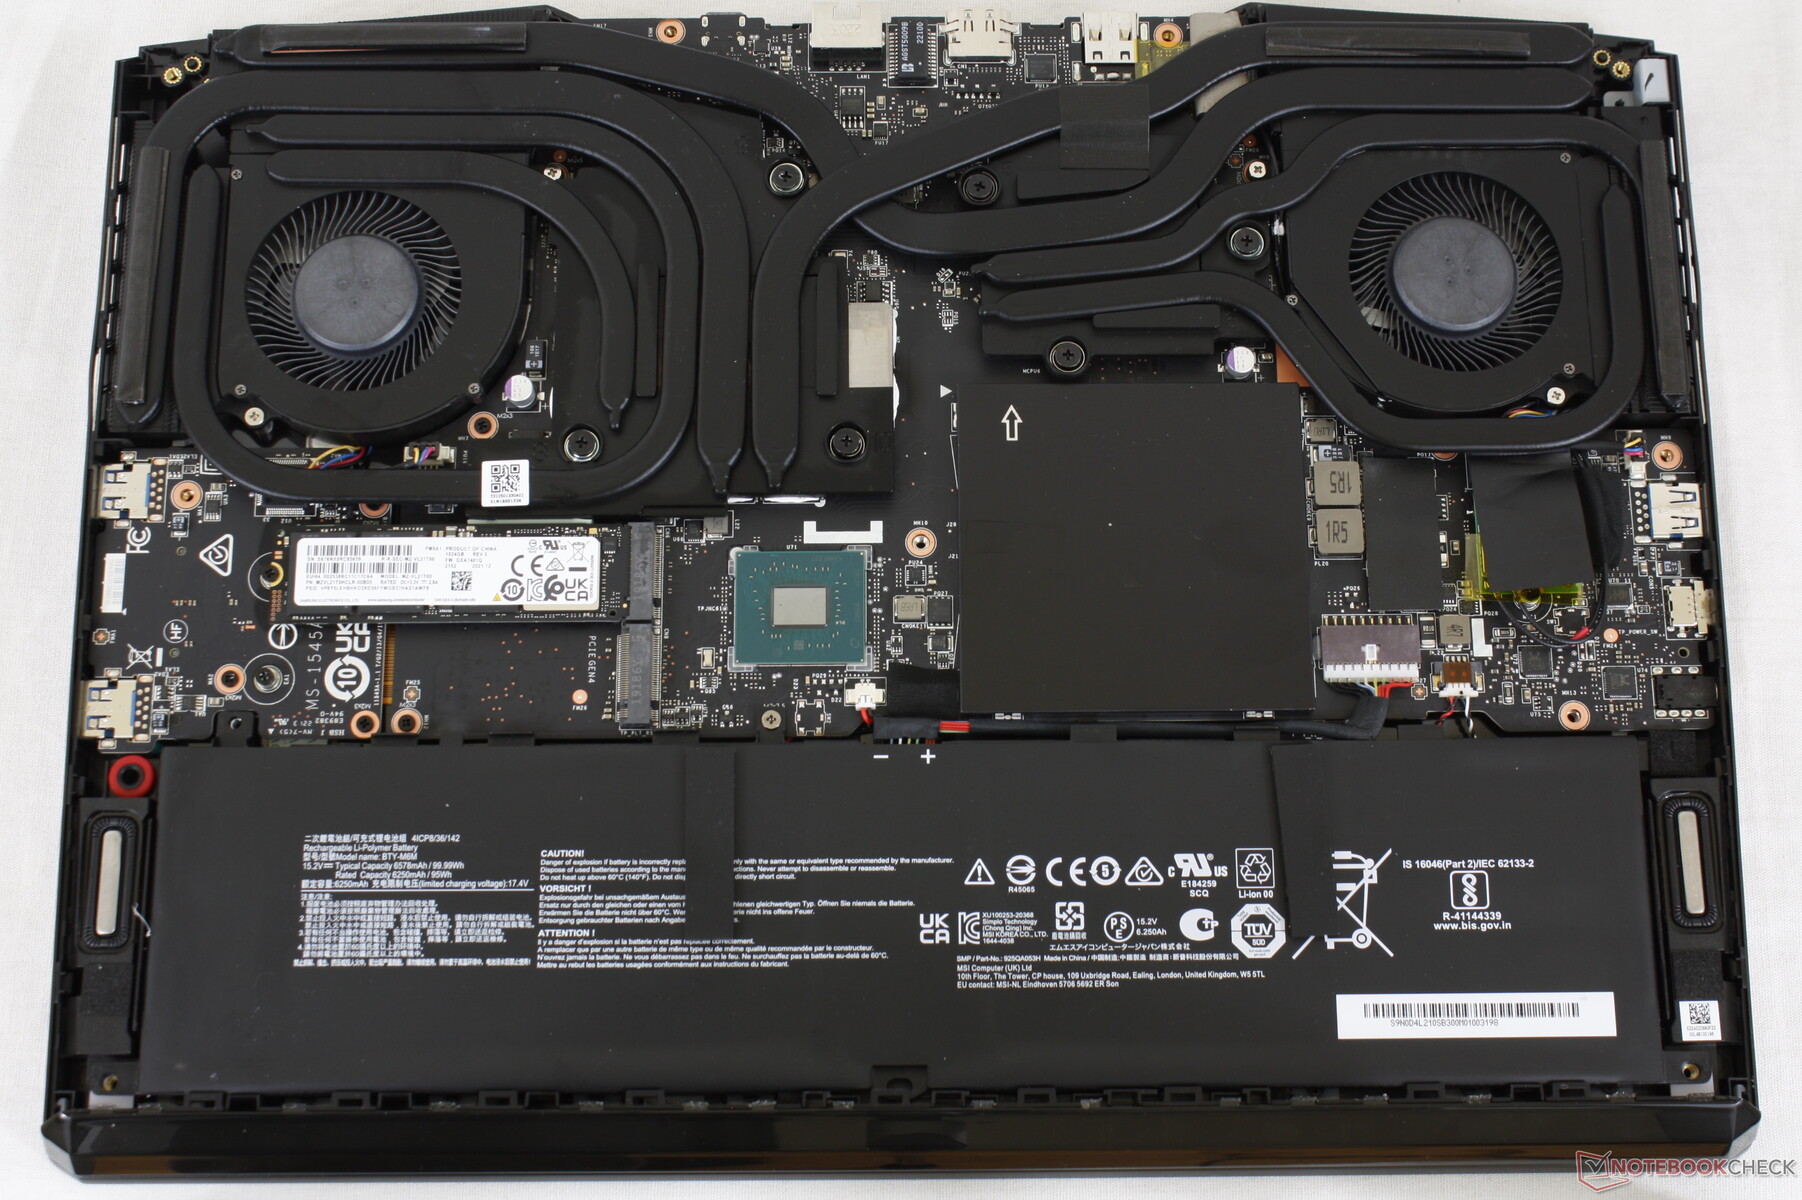
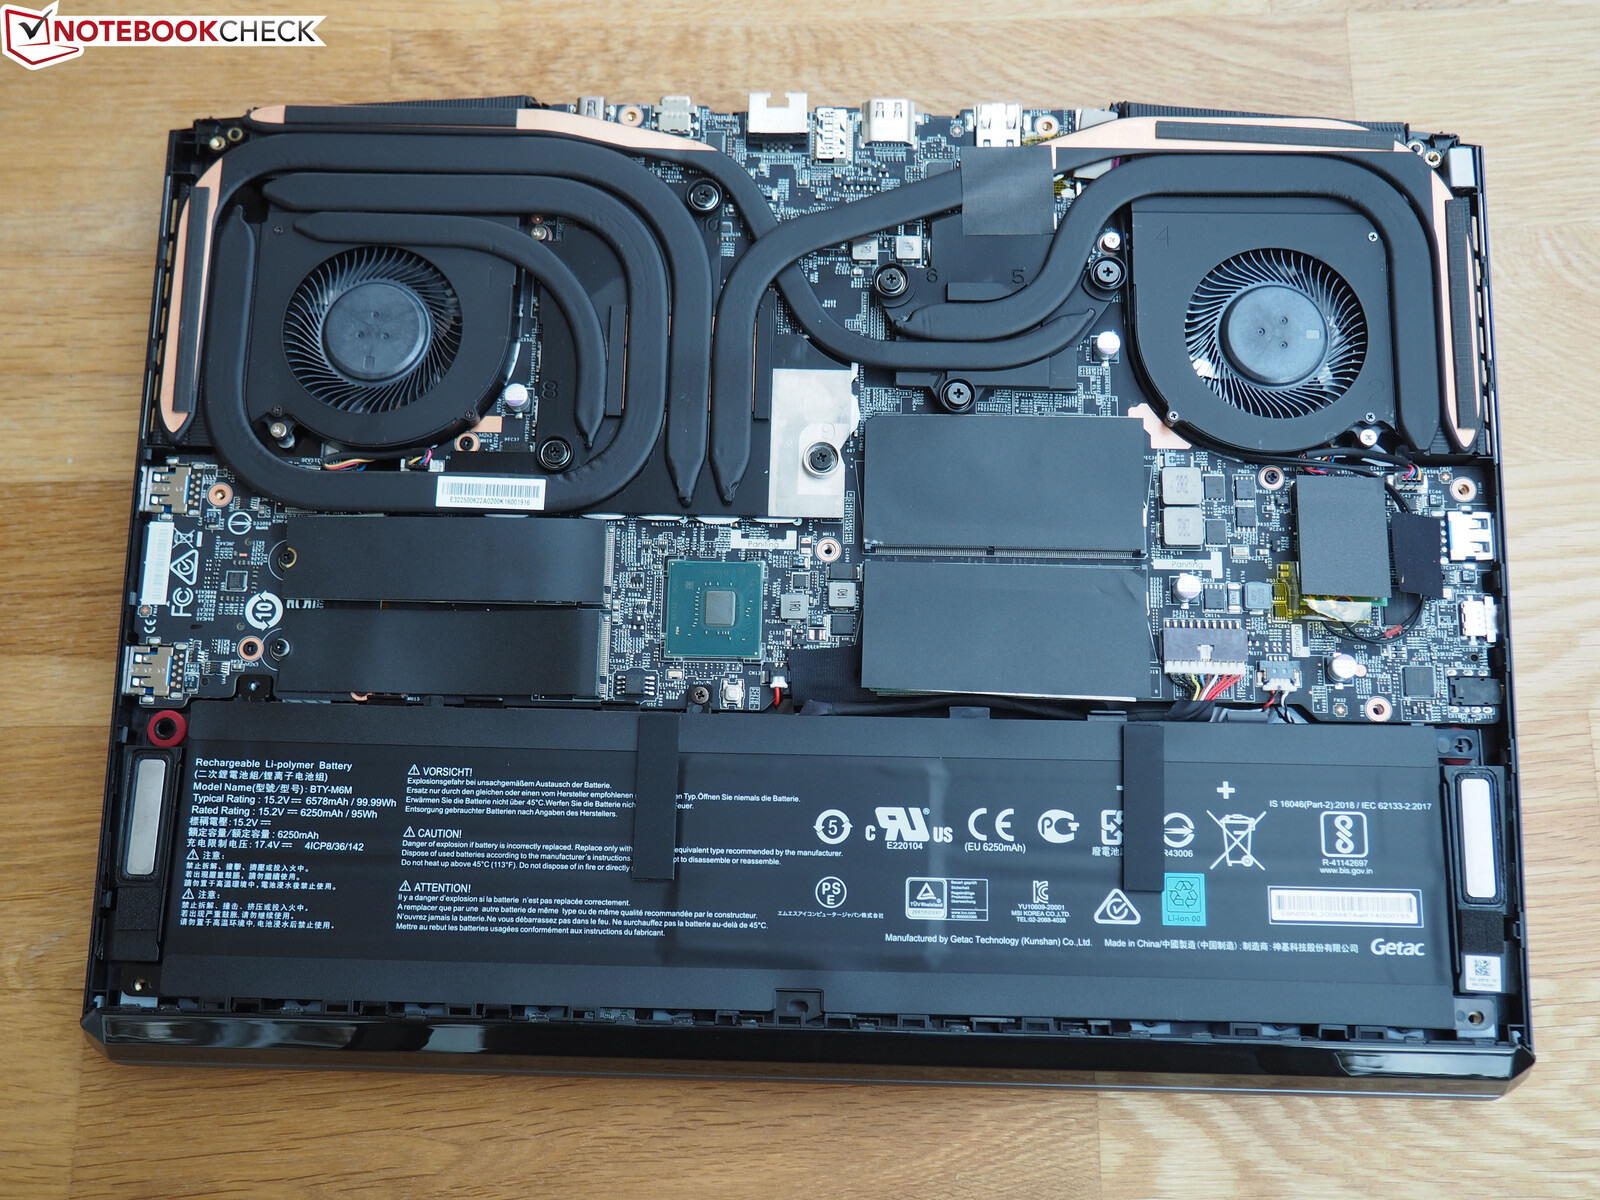
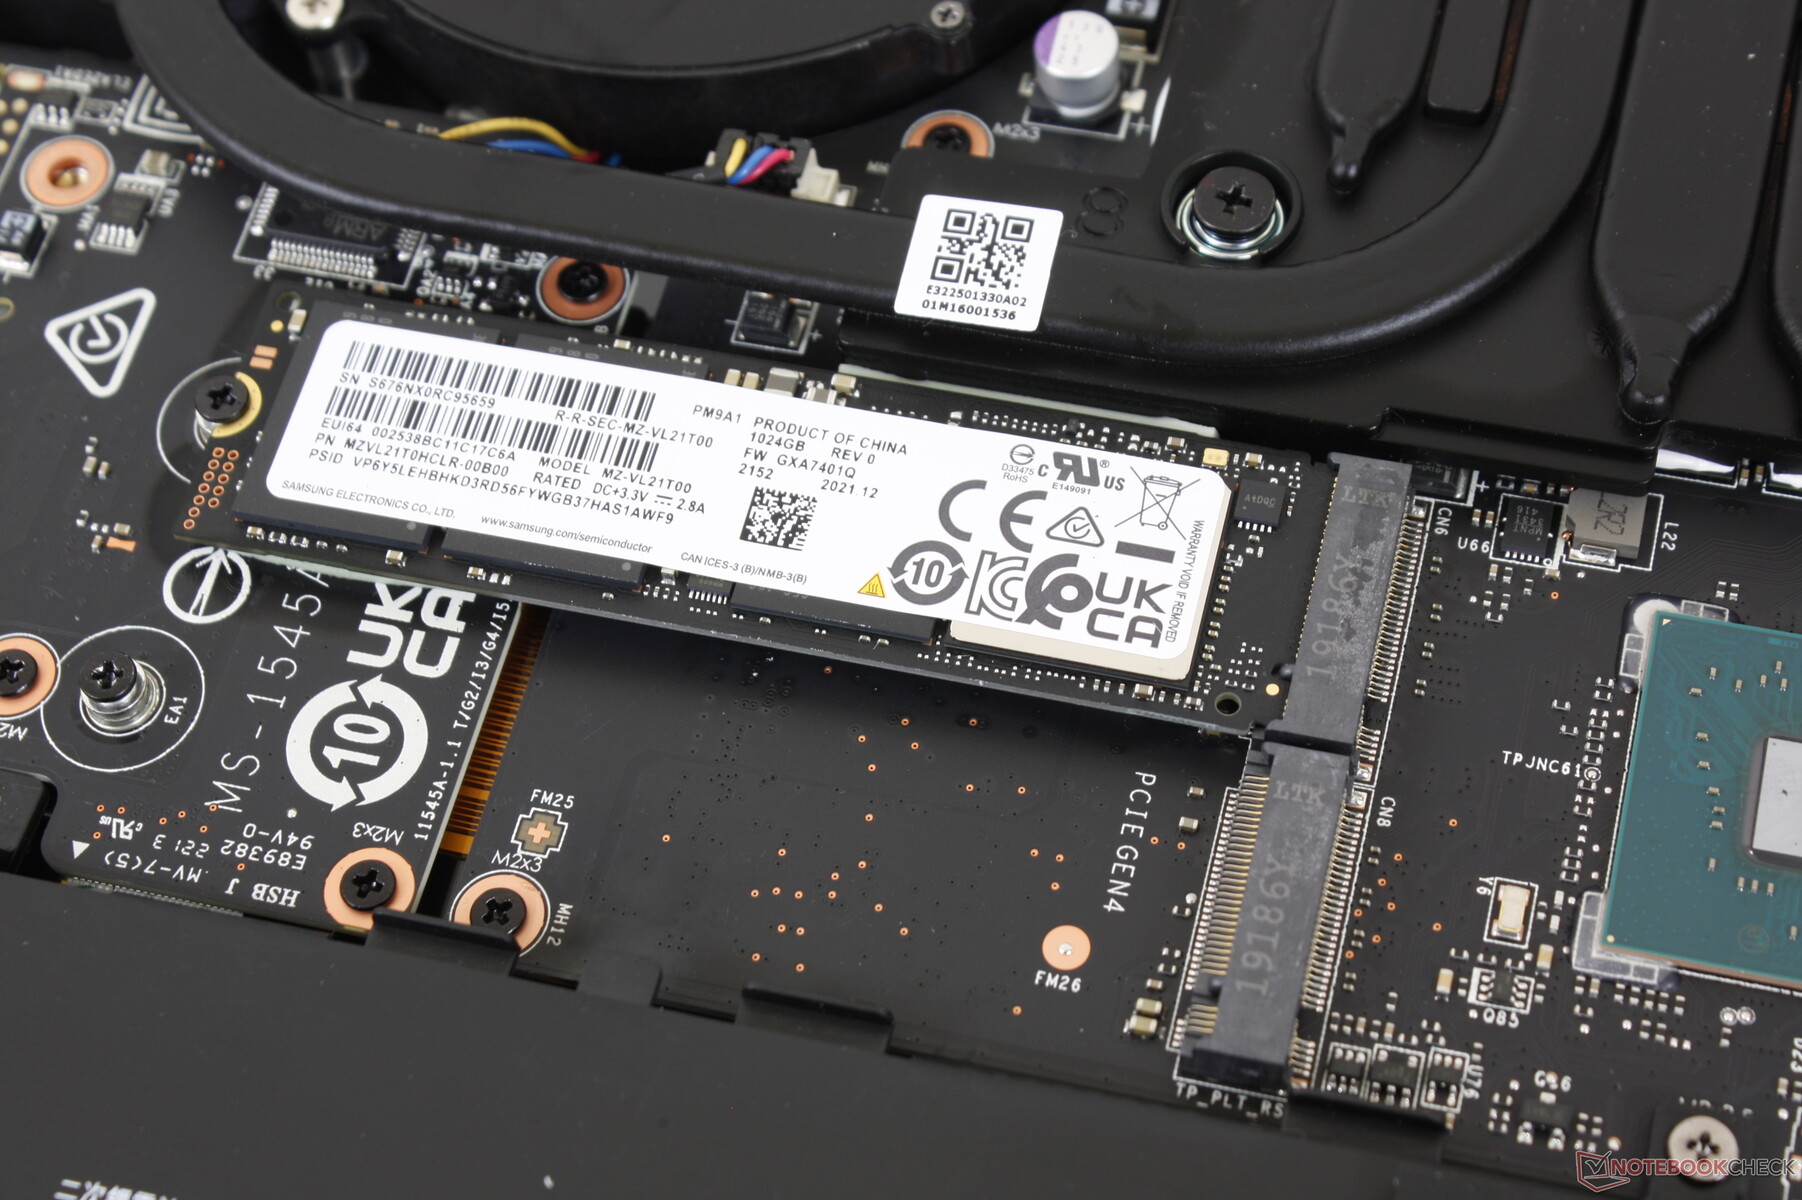
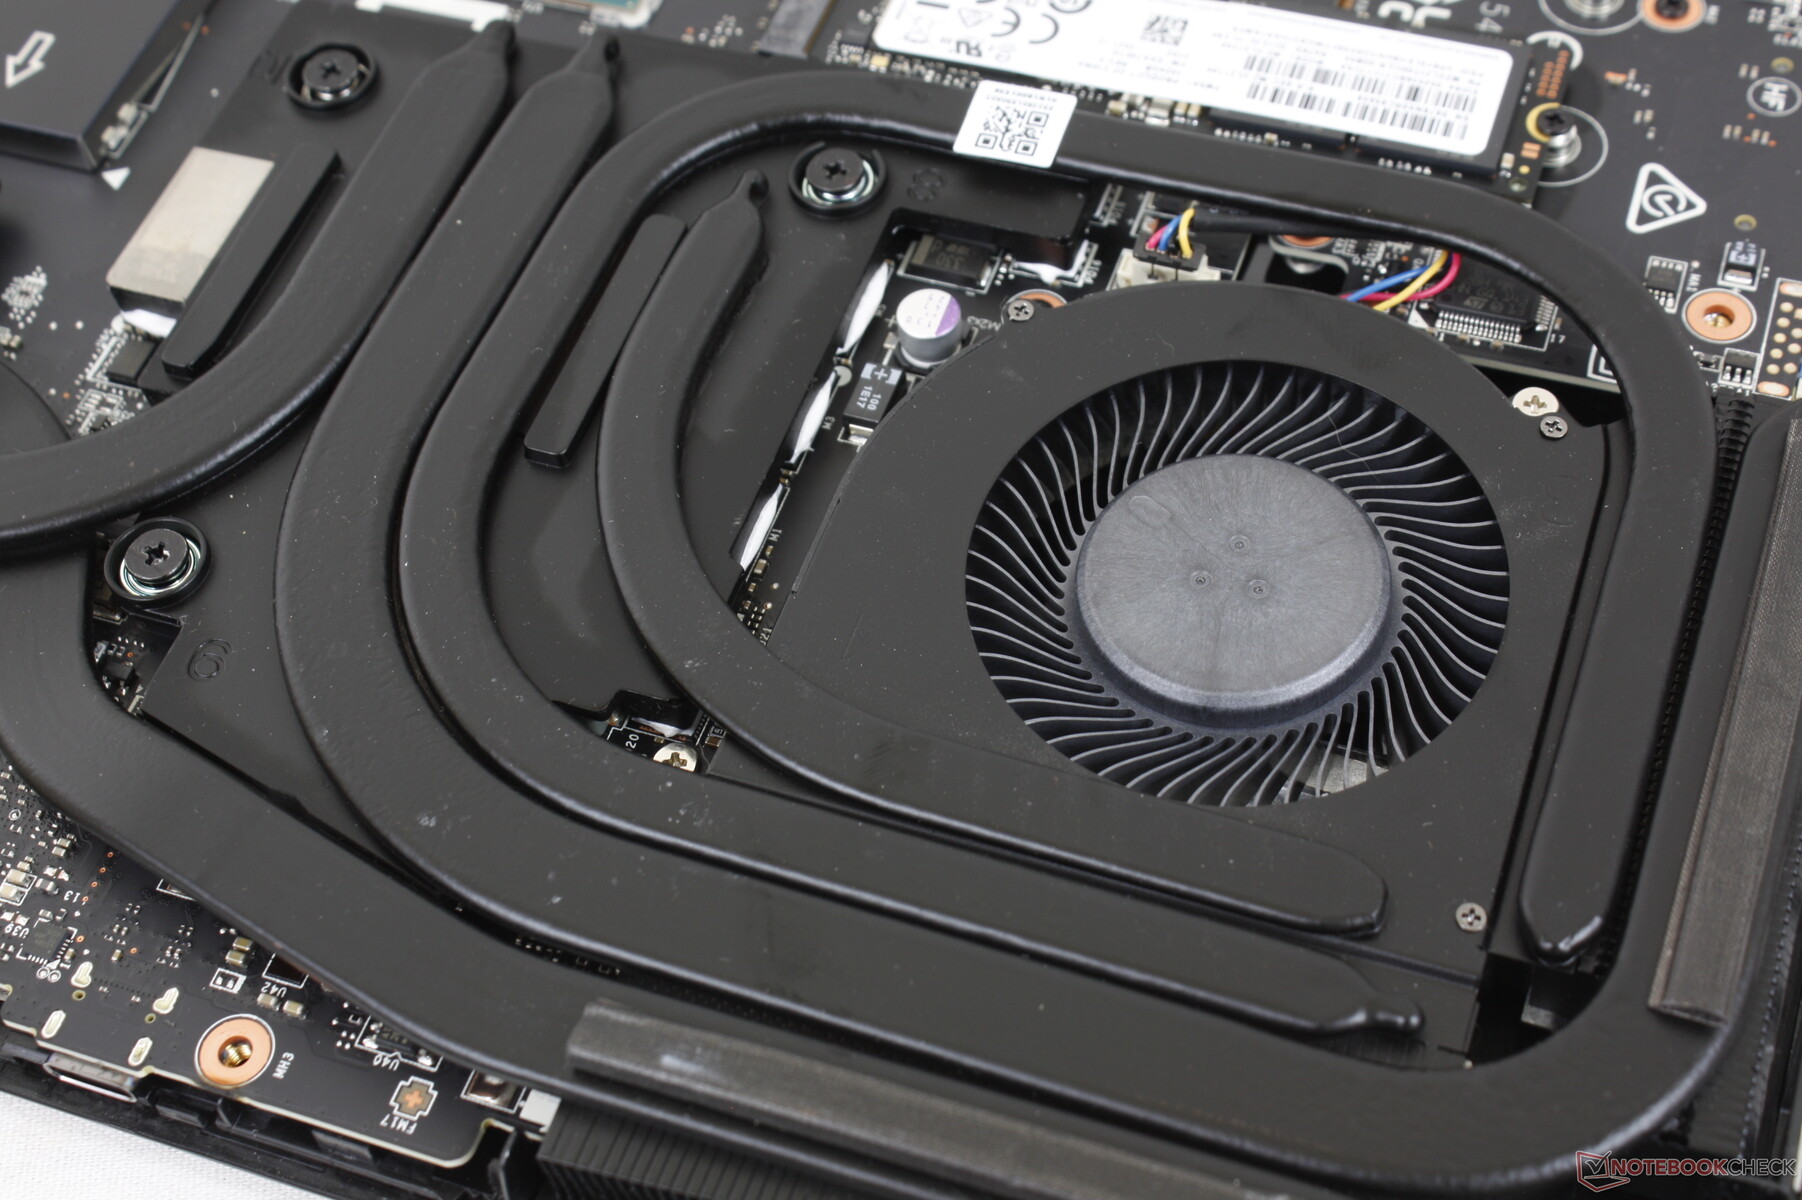
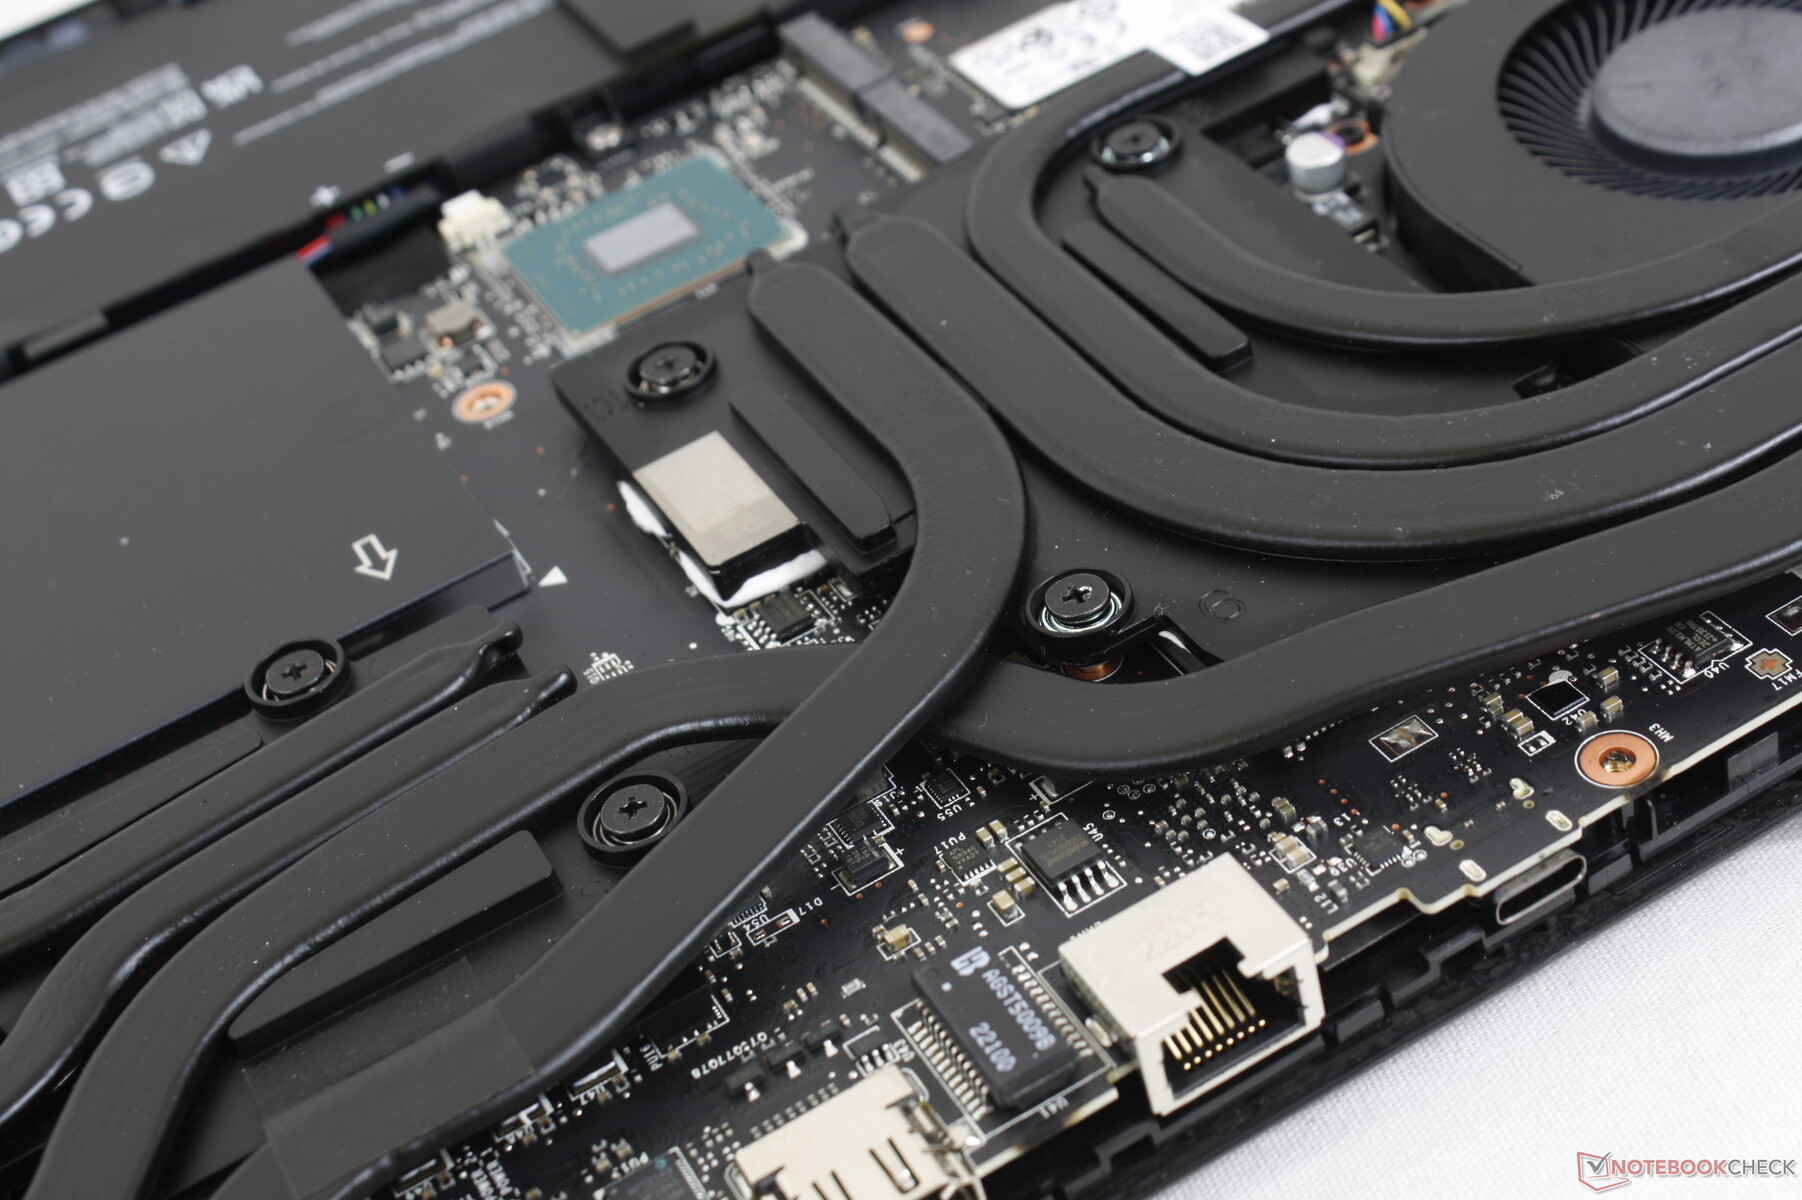
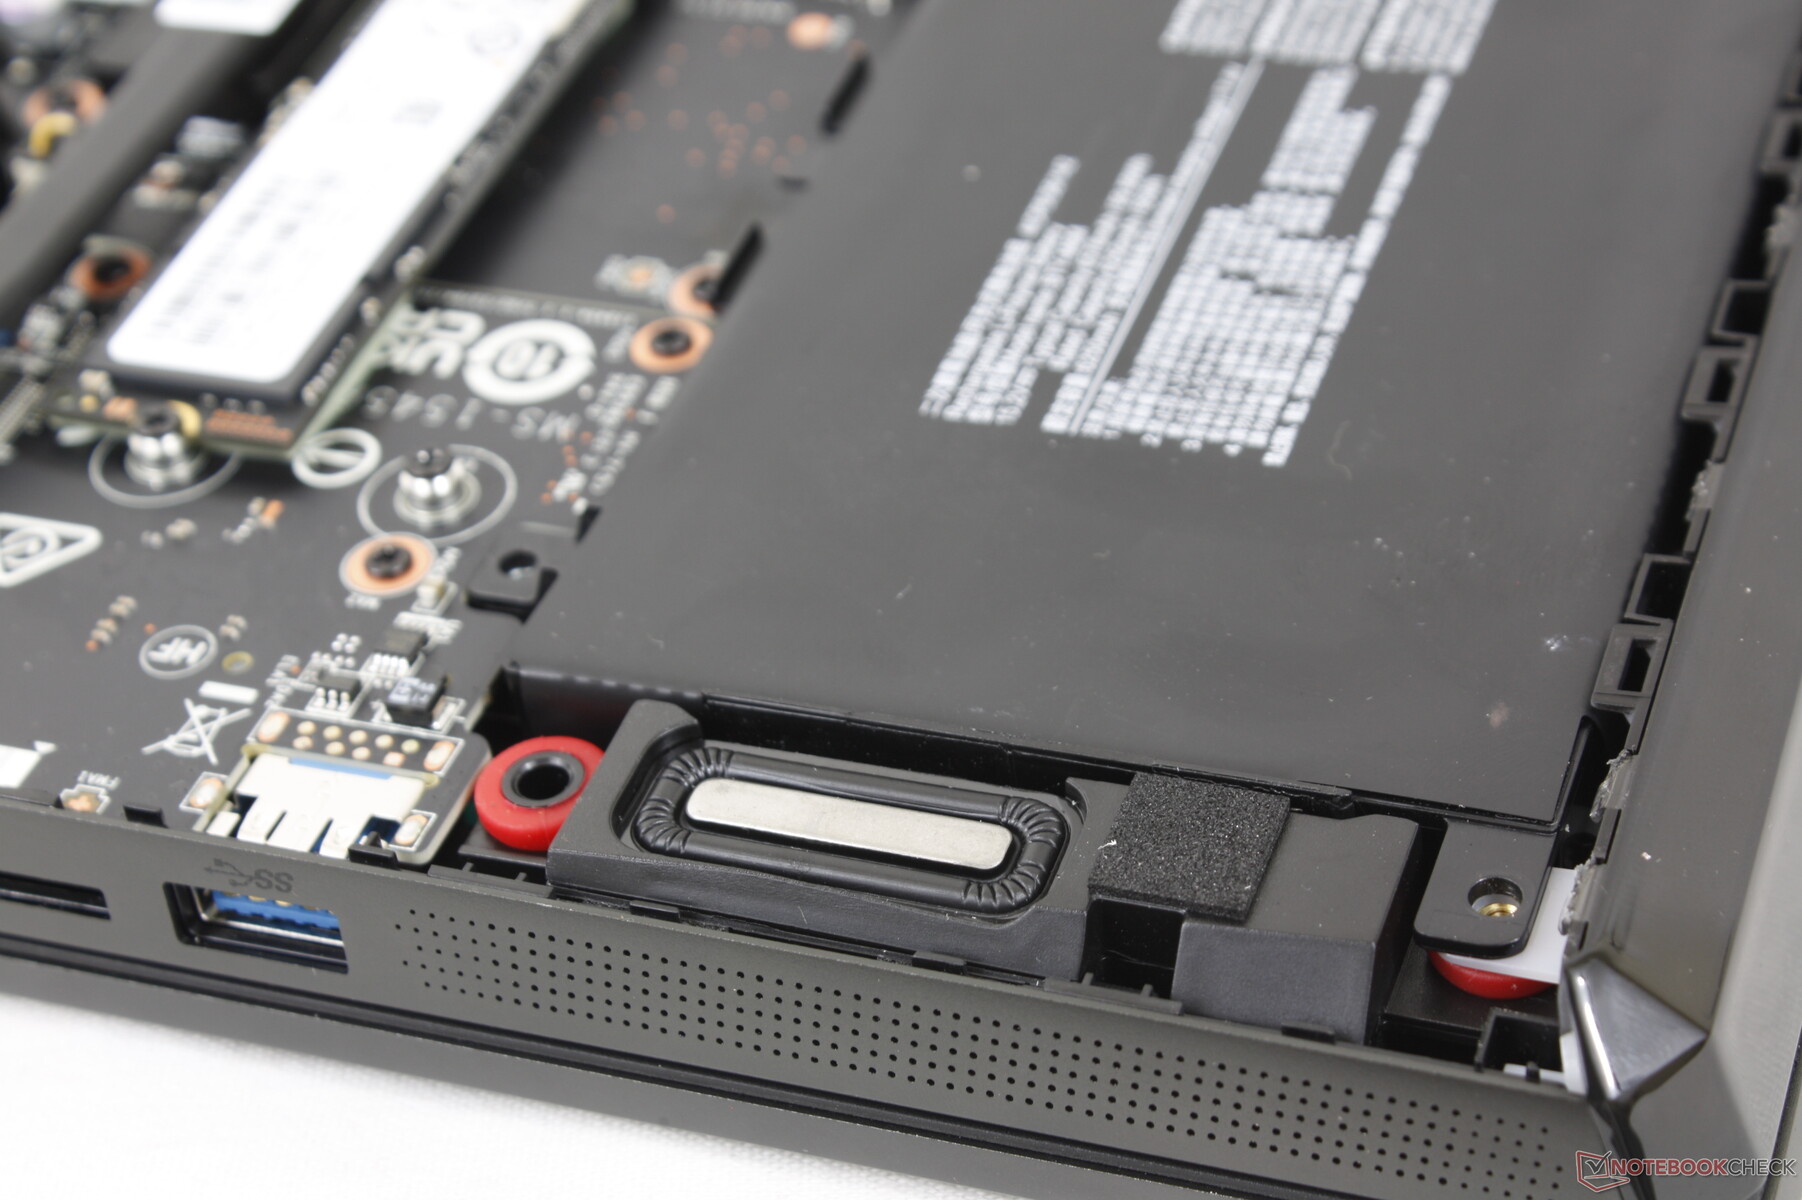
Onderhoud
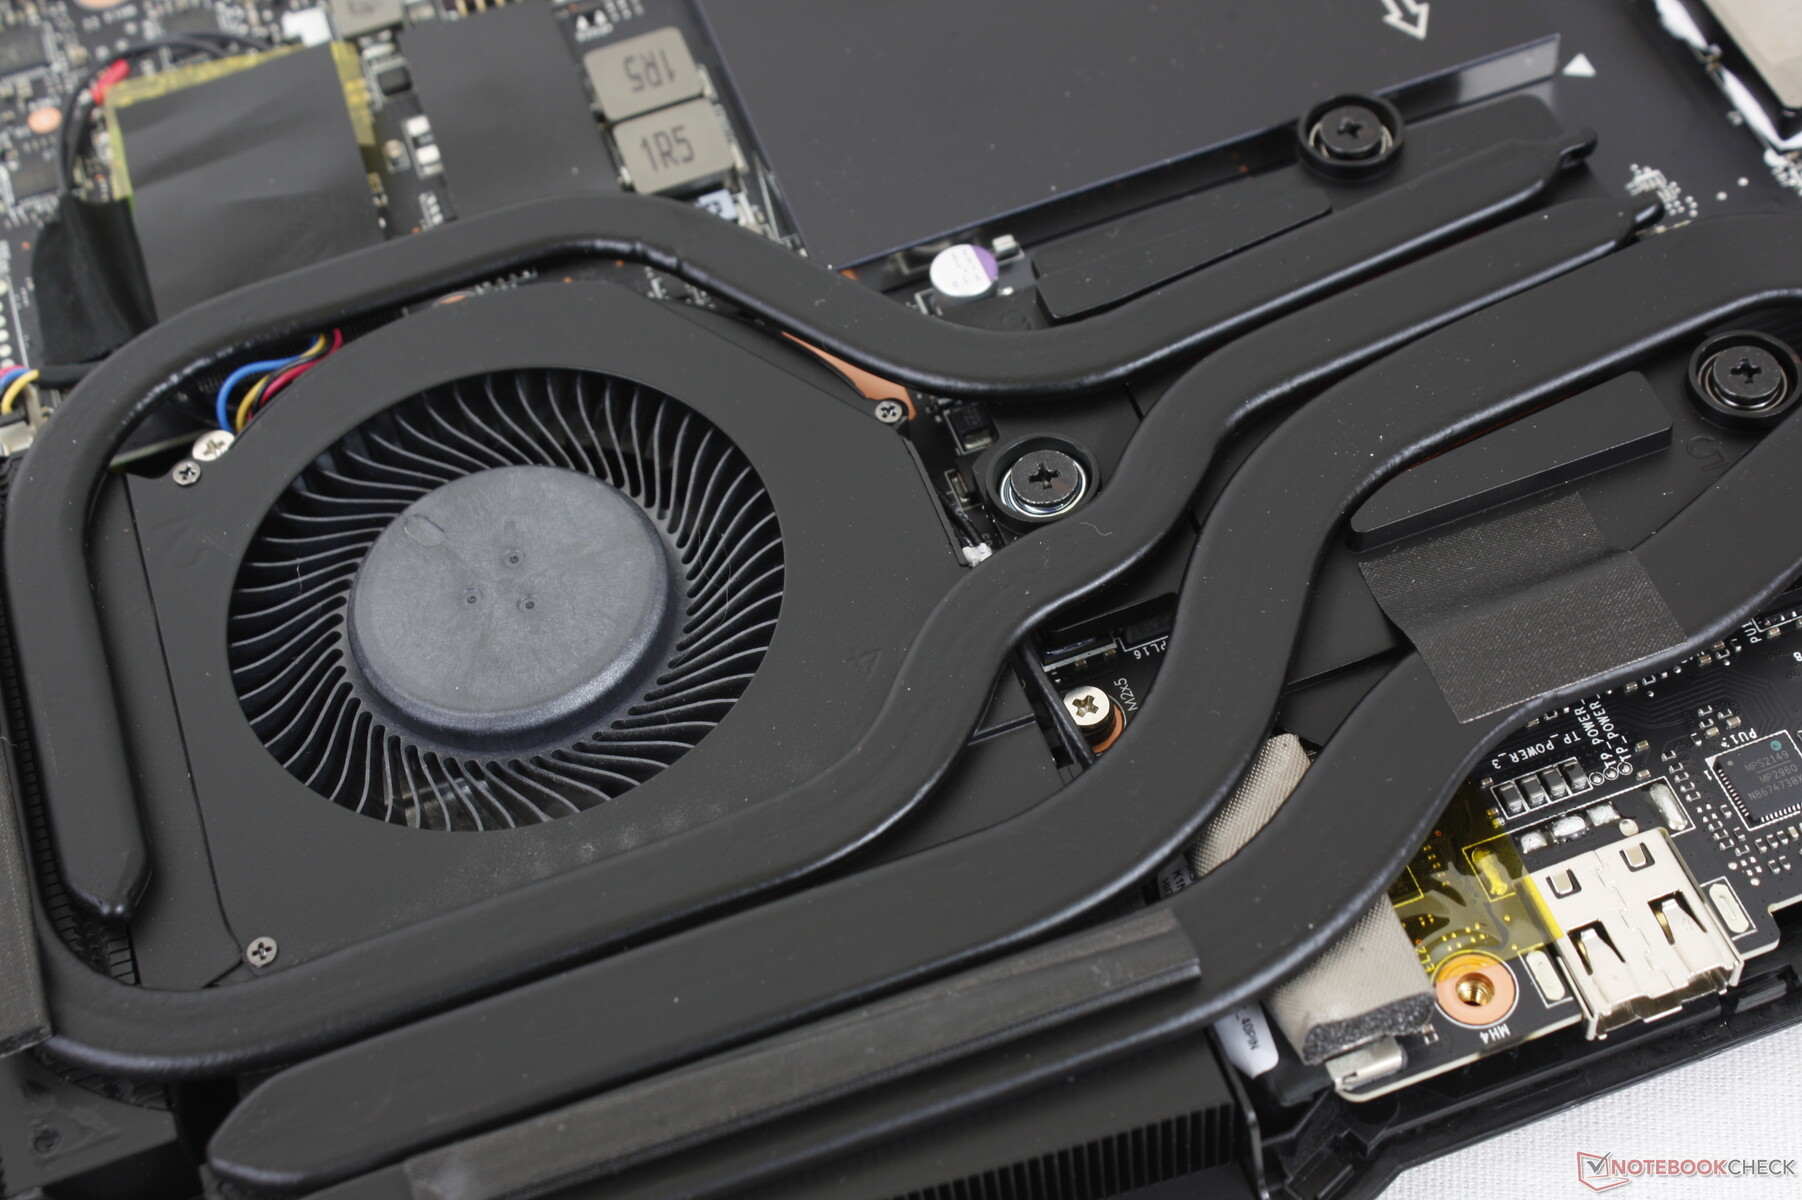
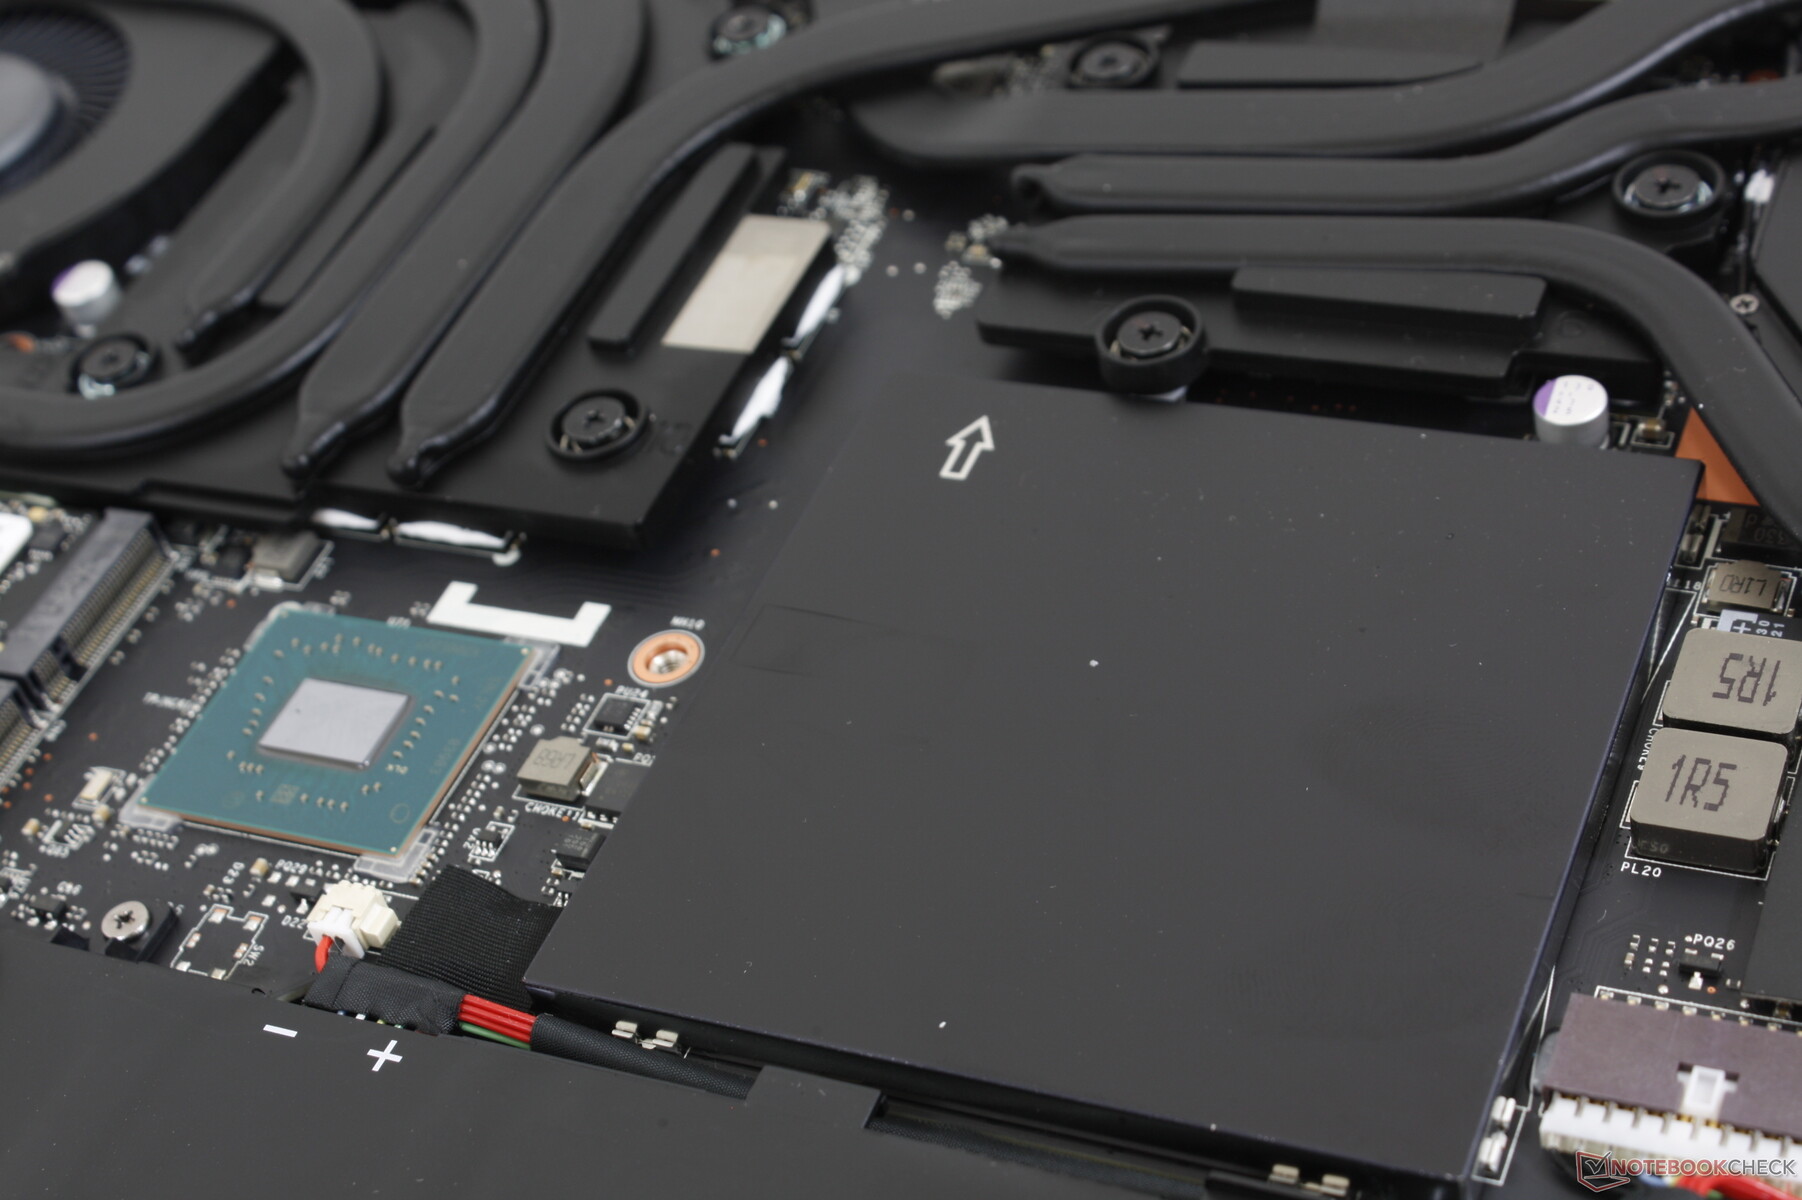
Voor het verwijderen van het bodempaneel is een Philips schroevendraaier en een platte kant nodig. In vergelijking met de GE66 heeft de GE67 een extra heat pipe boven de CPU om de koeling te verbeteren, zoals hieronder te zien is.
Accessoires en garantie
De detailhandeldoos bevat een groot fluwelen doekje naast de netadapter en papierwerk. Bij aankoop in de VS geldt de standaard fabrieksgarantie van één jaar.
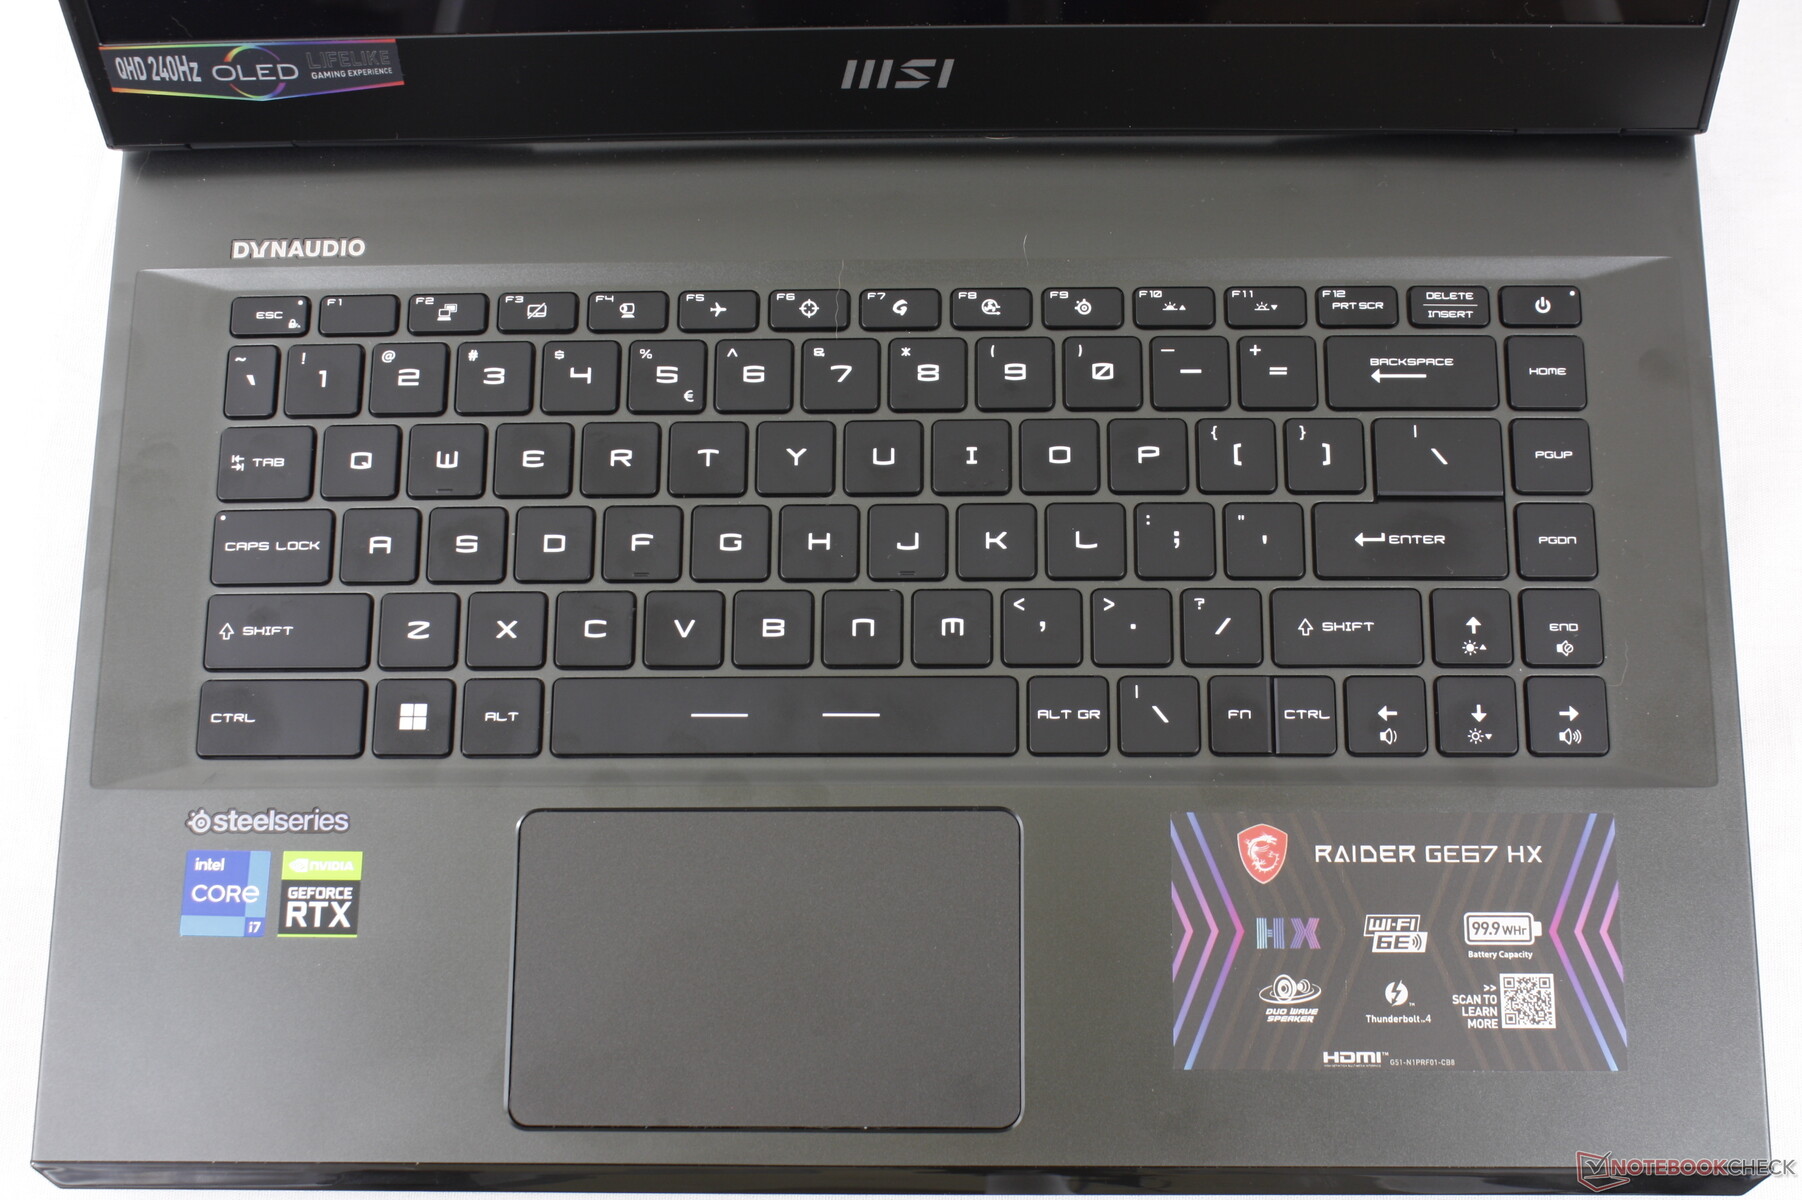
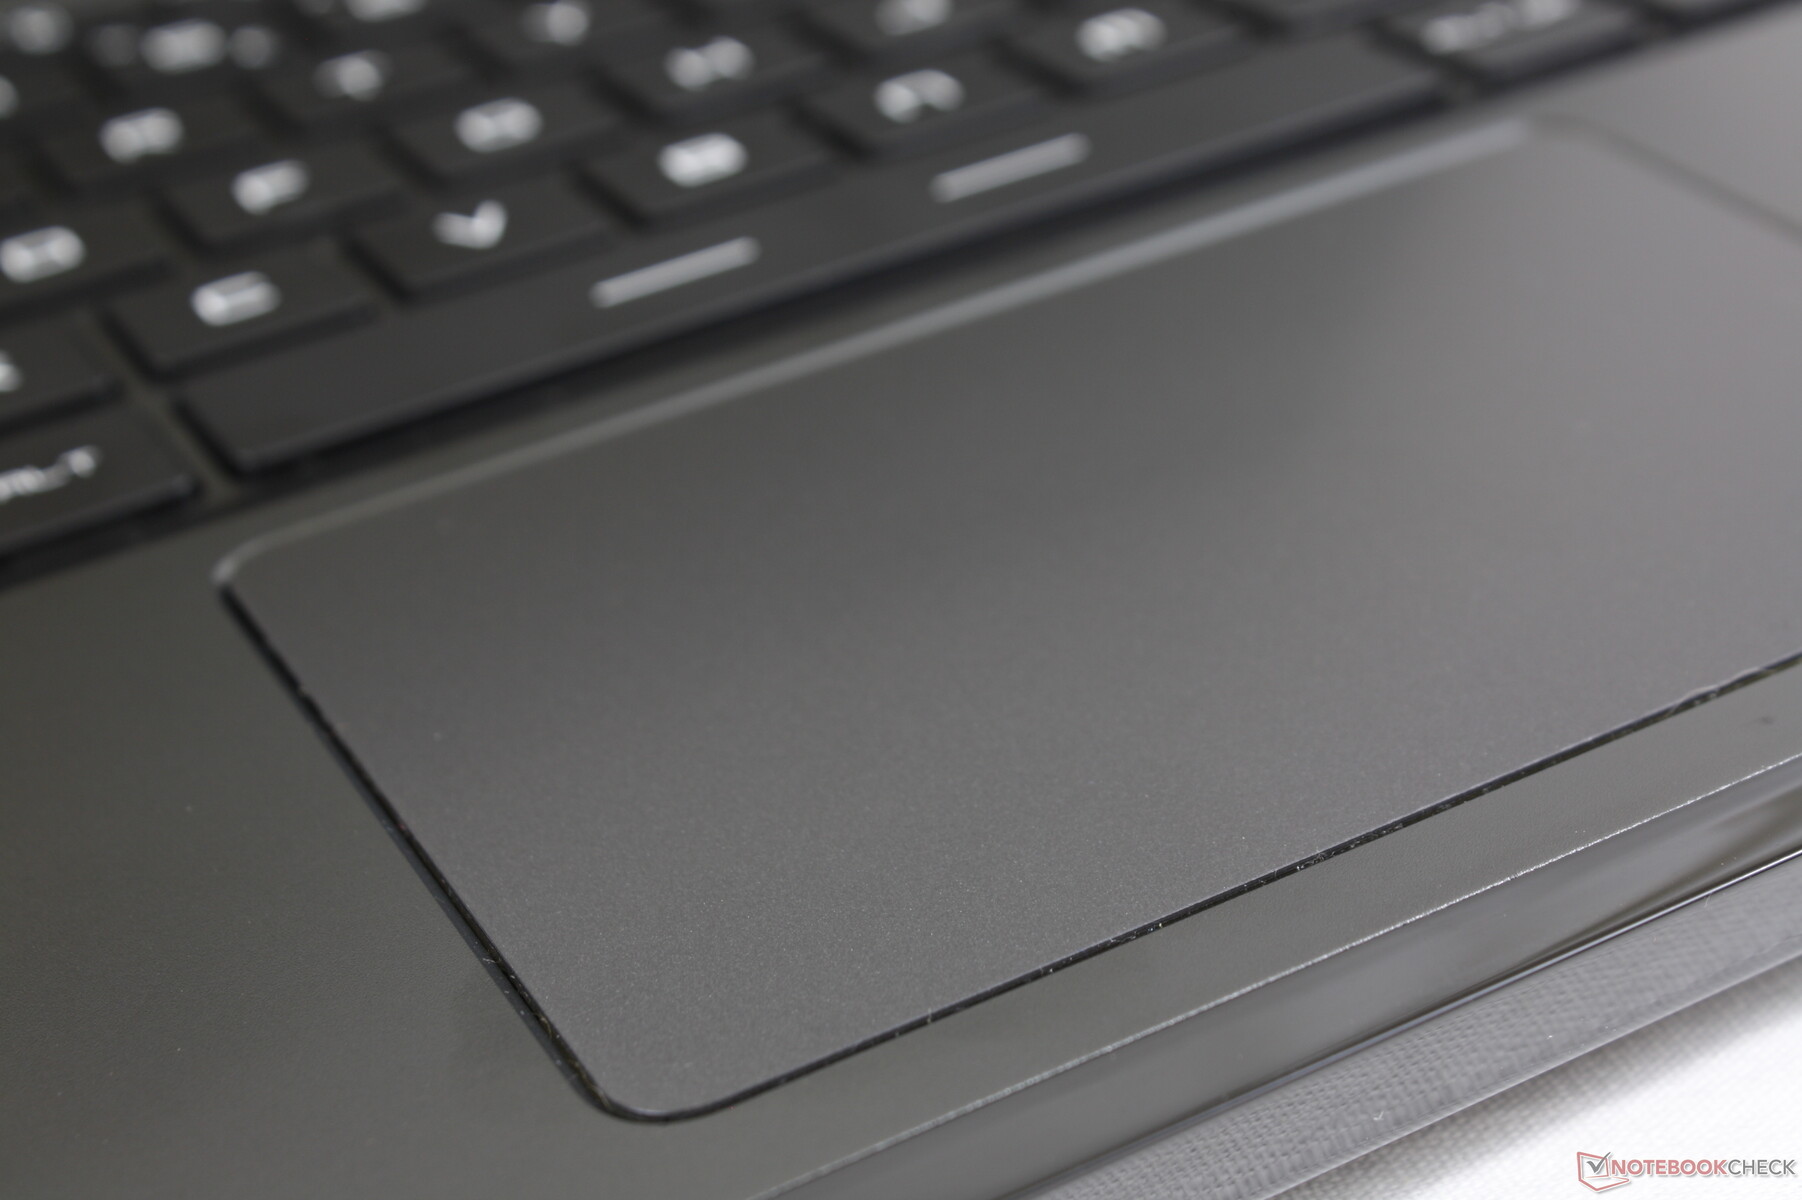
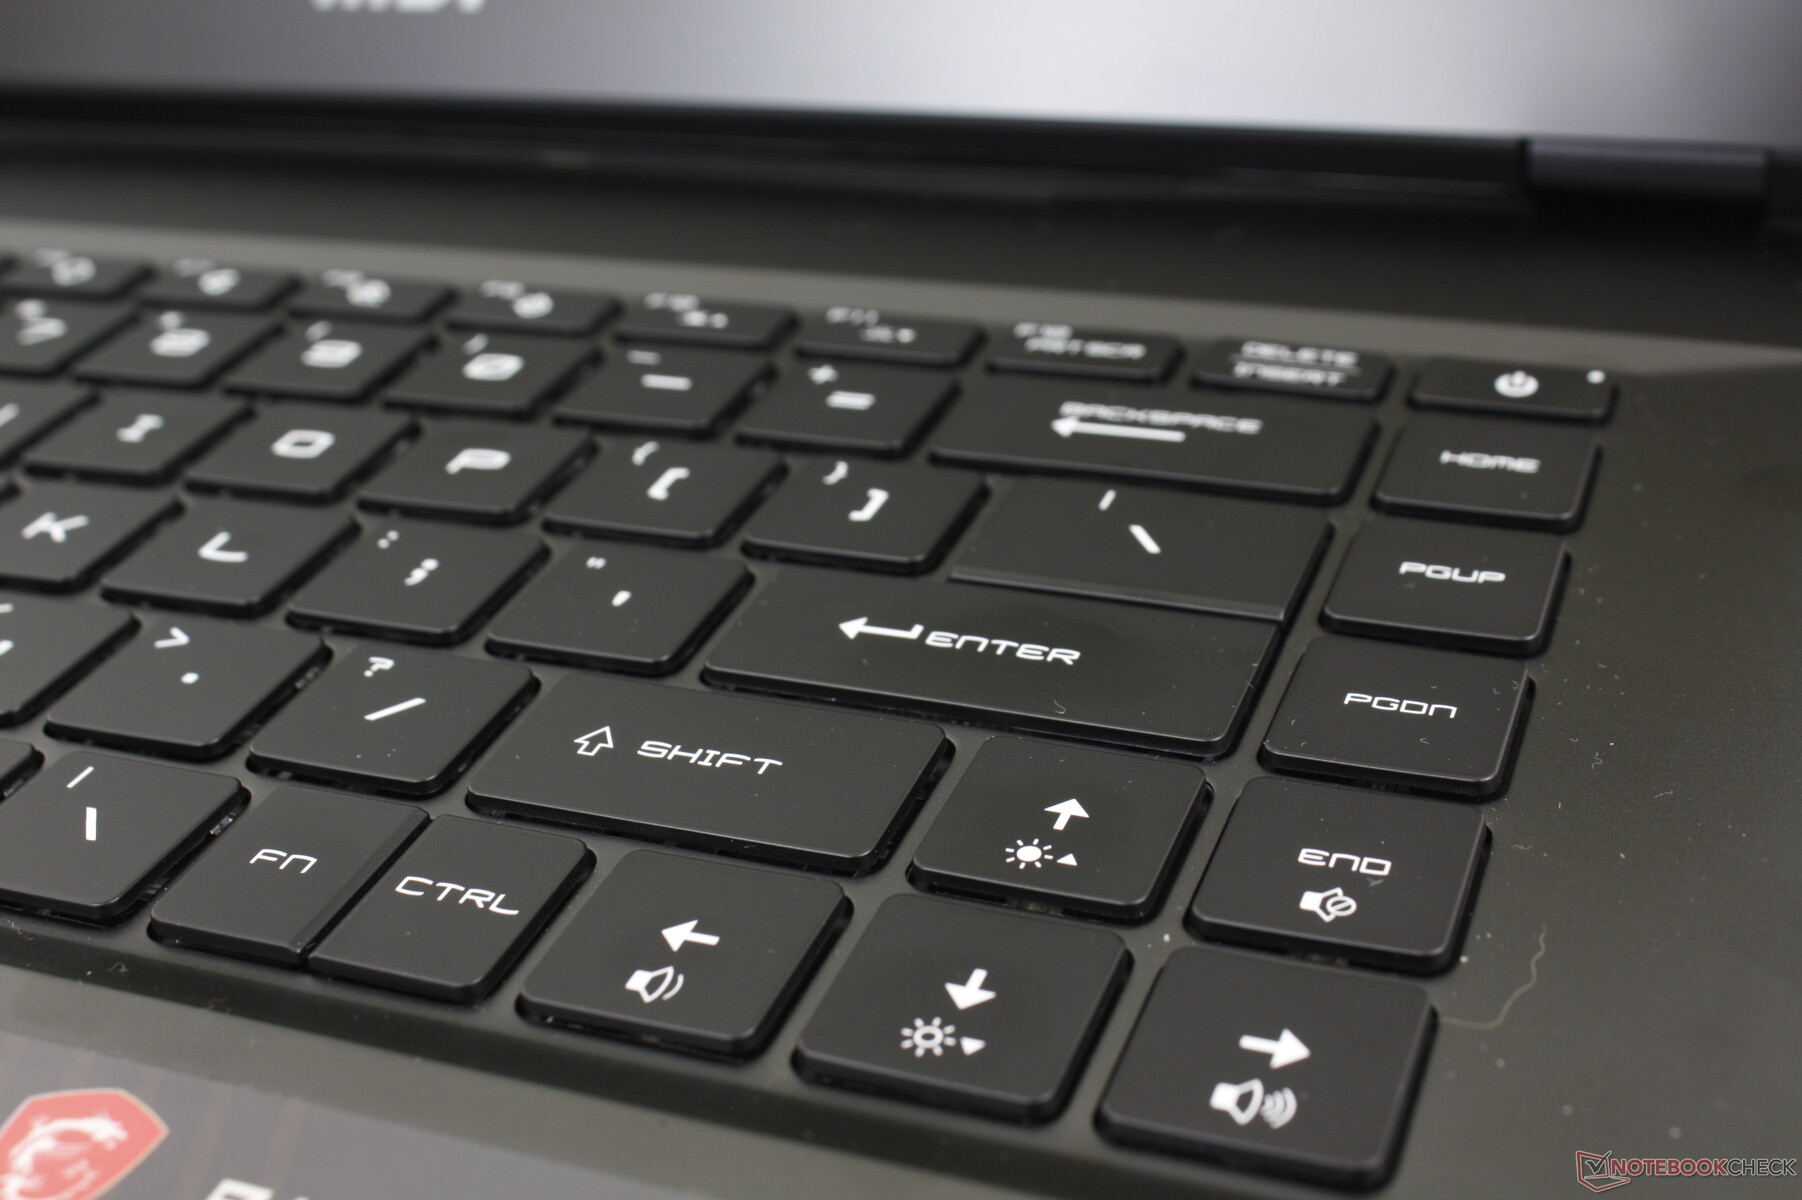
Invoerapparaten - geen grote veranderingen ten opzichte van GE66
Toetsenbord en touchpad

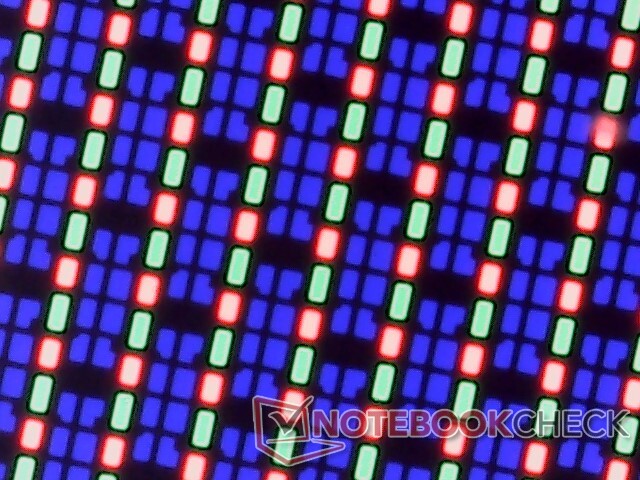
Beeldscherm - bijna ideaal voor gaming
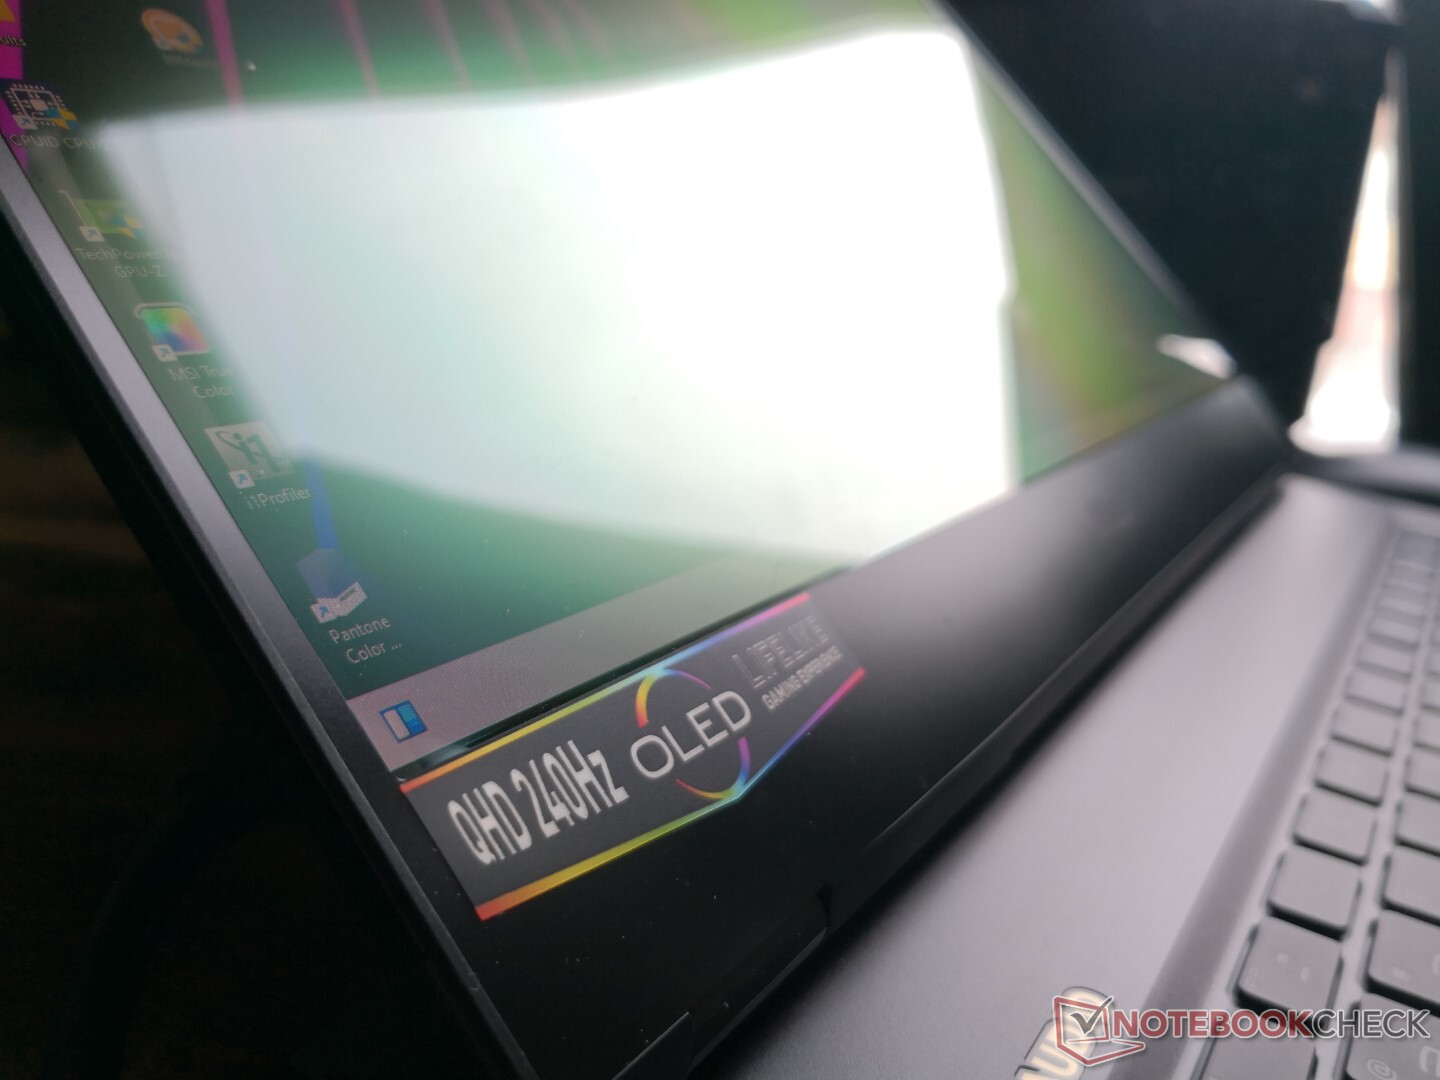
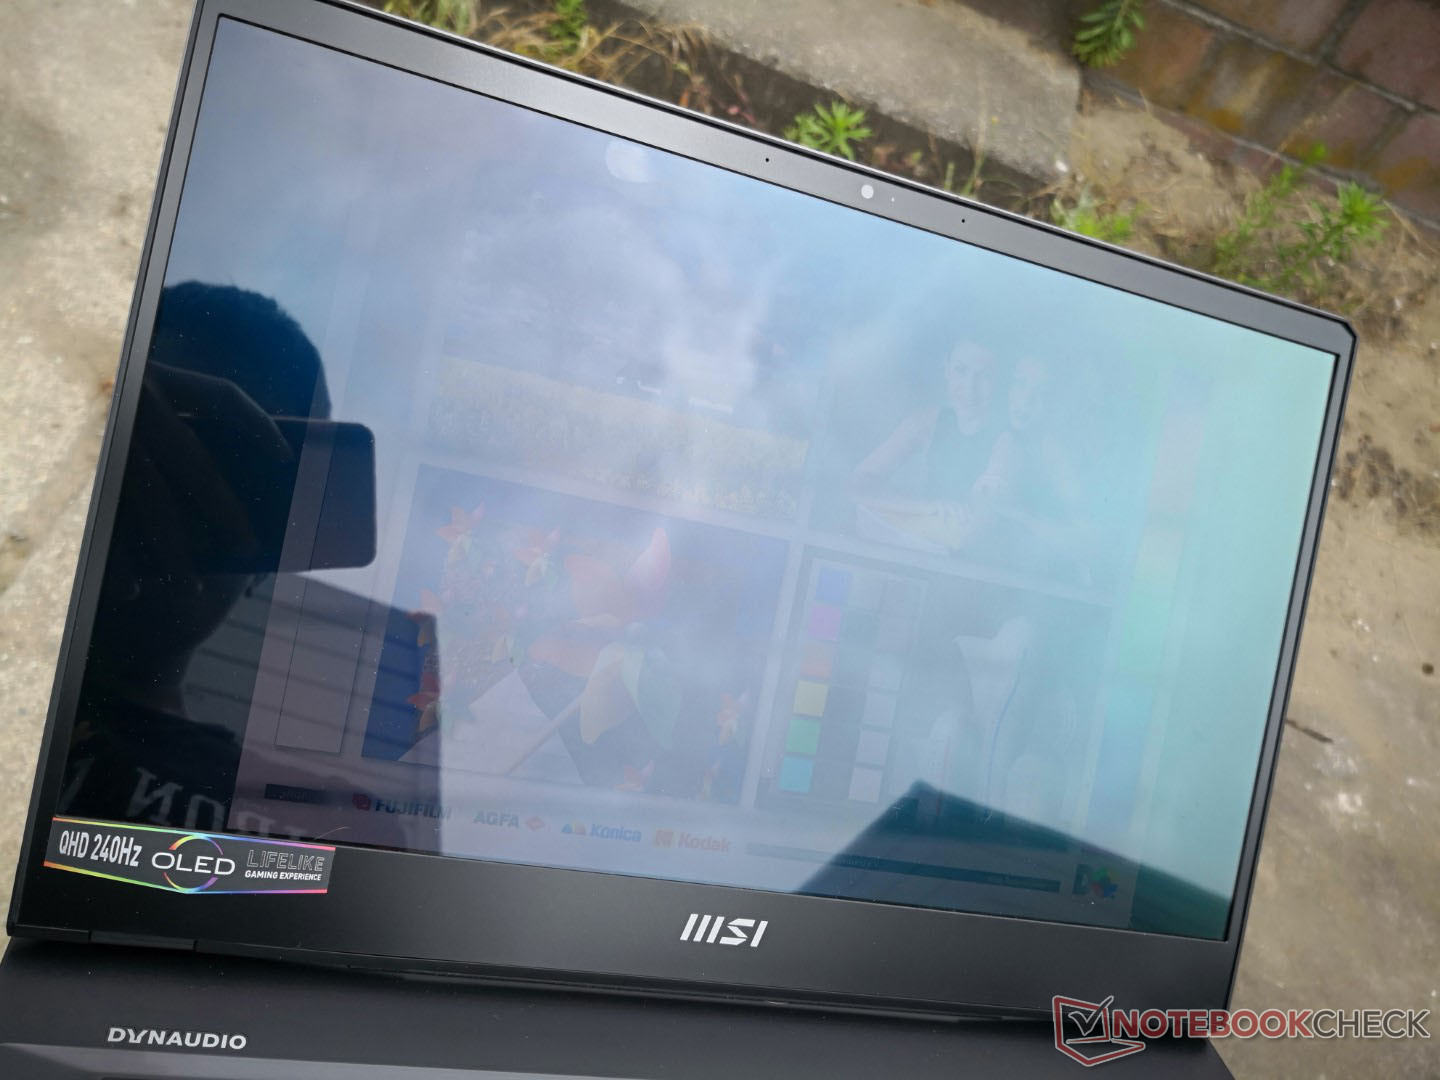
De MSI GE67 en Razer Blade 15 zijn twee van de eerste laptops die QHD OLED 240 Hz beeldschermopties bieden. Hoewel dit op papier uitstekend klinkt, zijn er enkele asterisken om in gedachten te houden
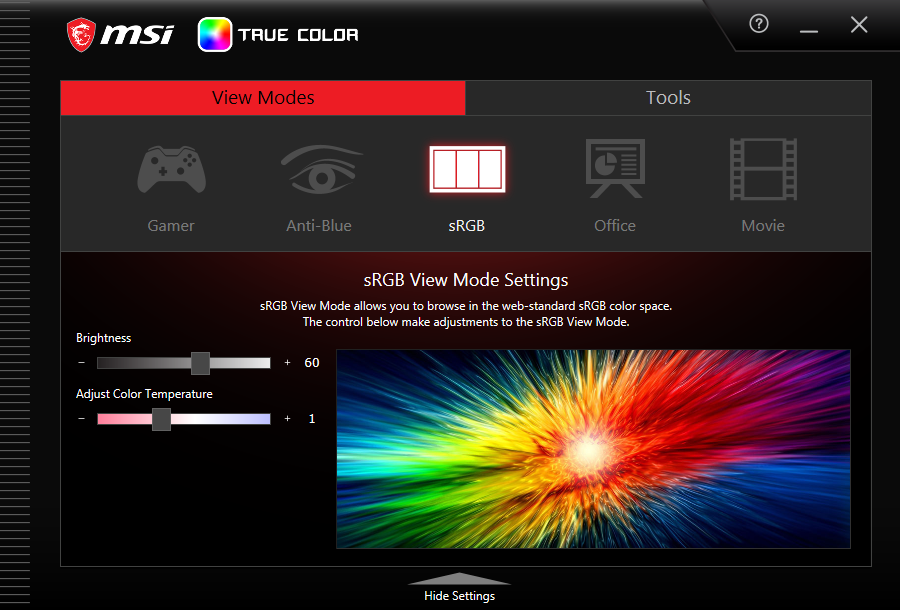
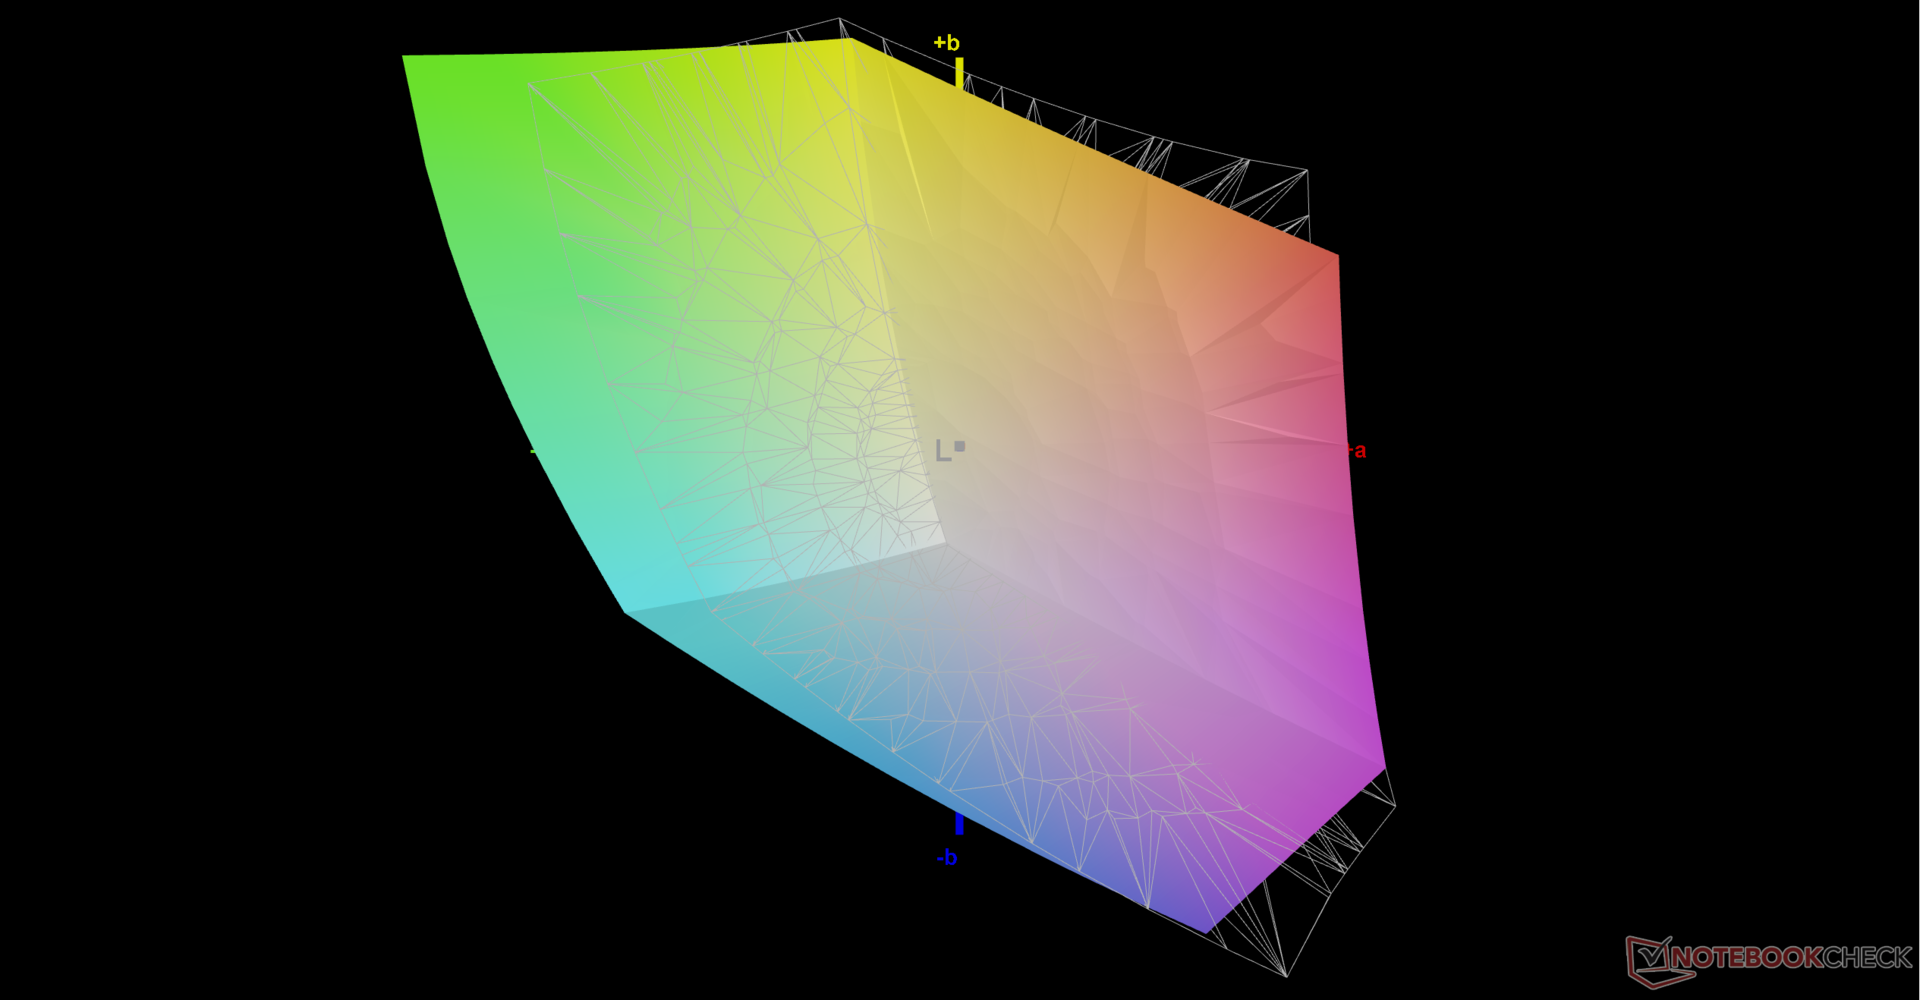
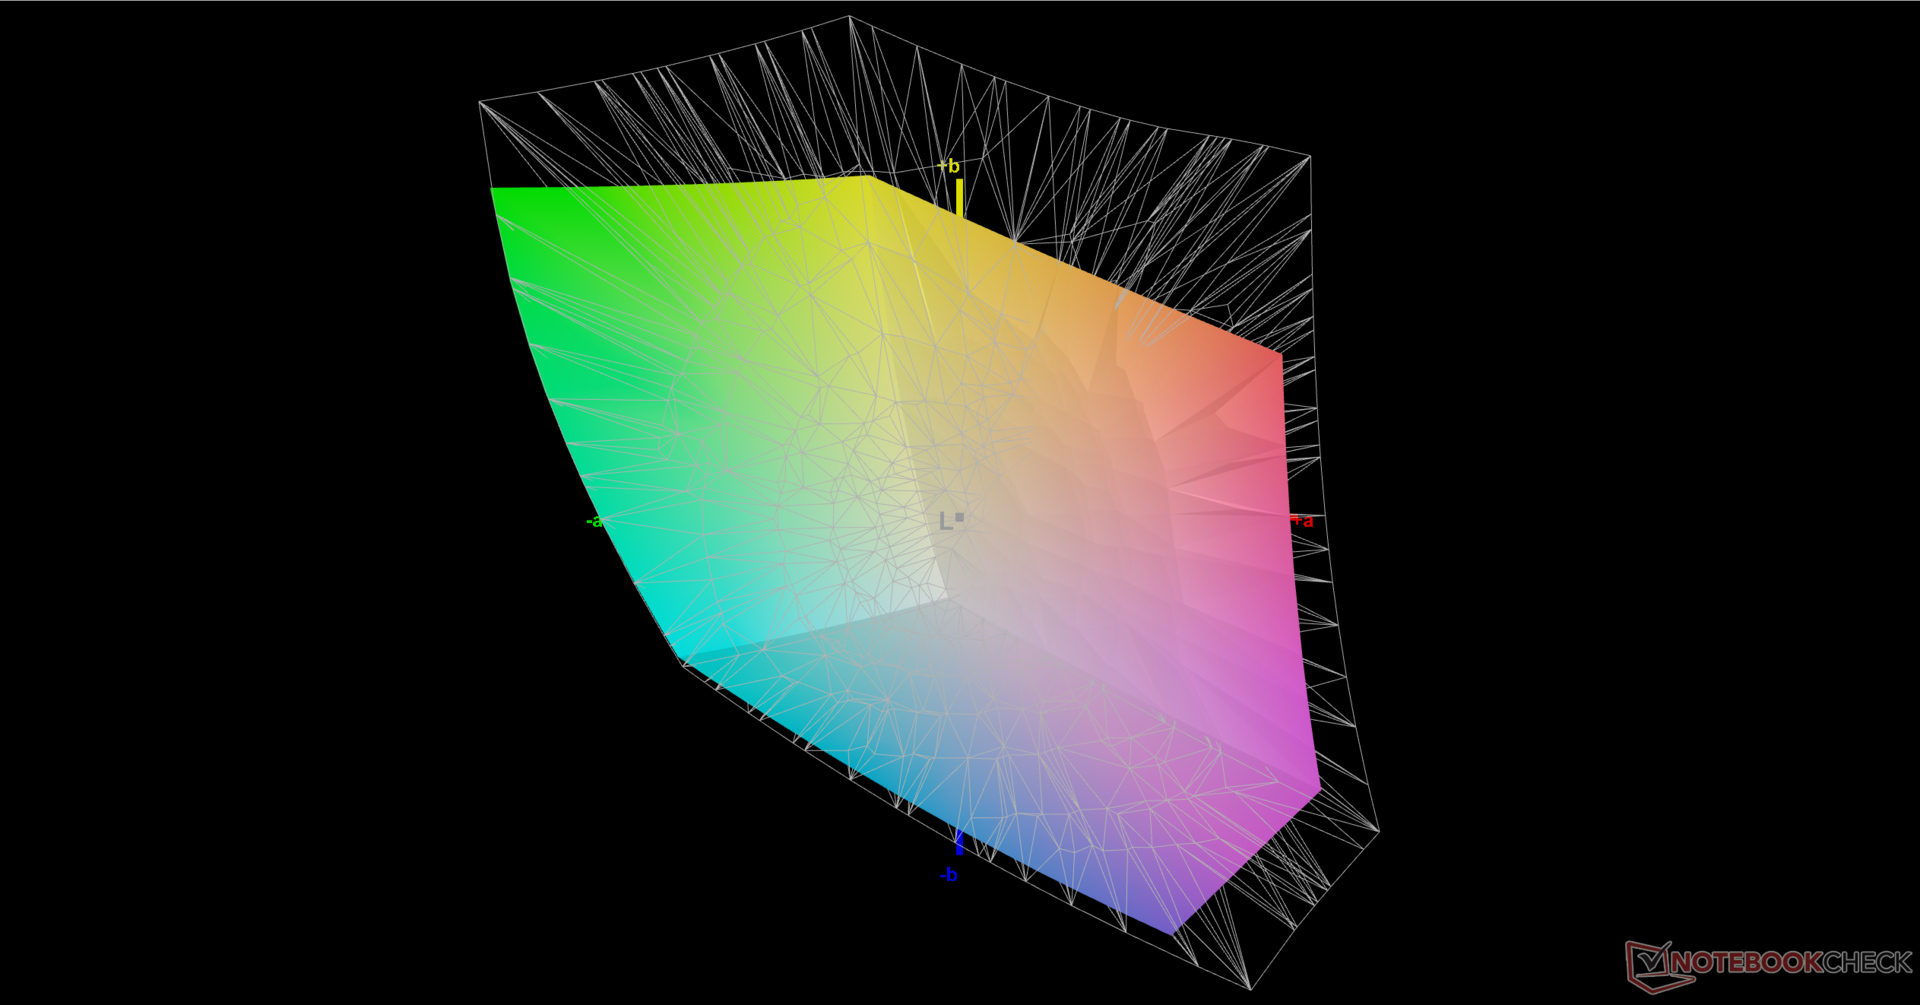
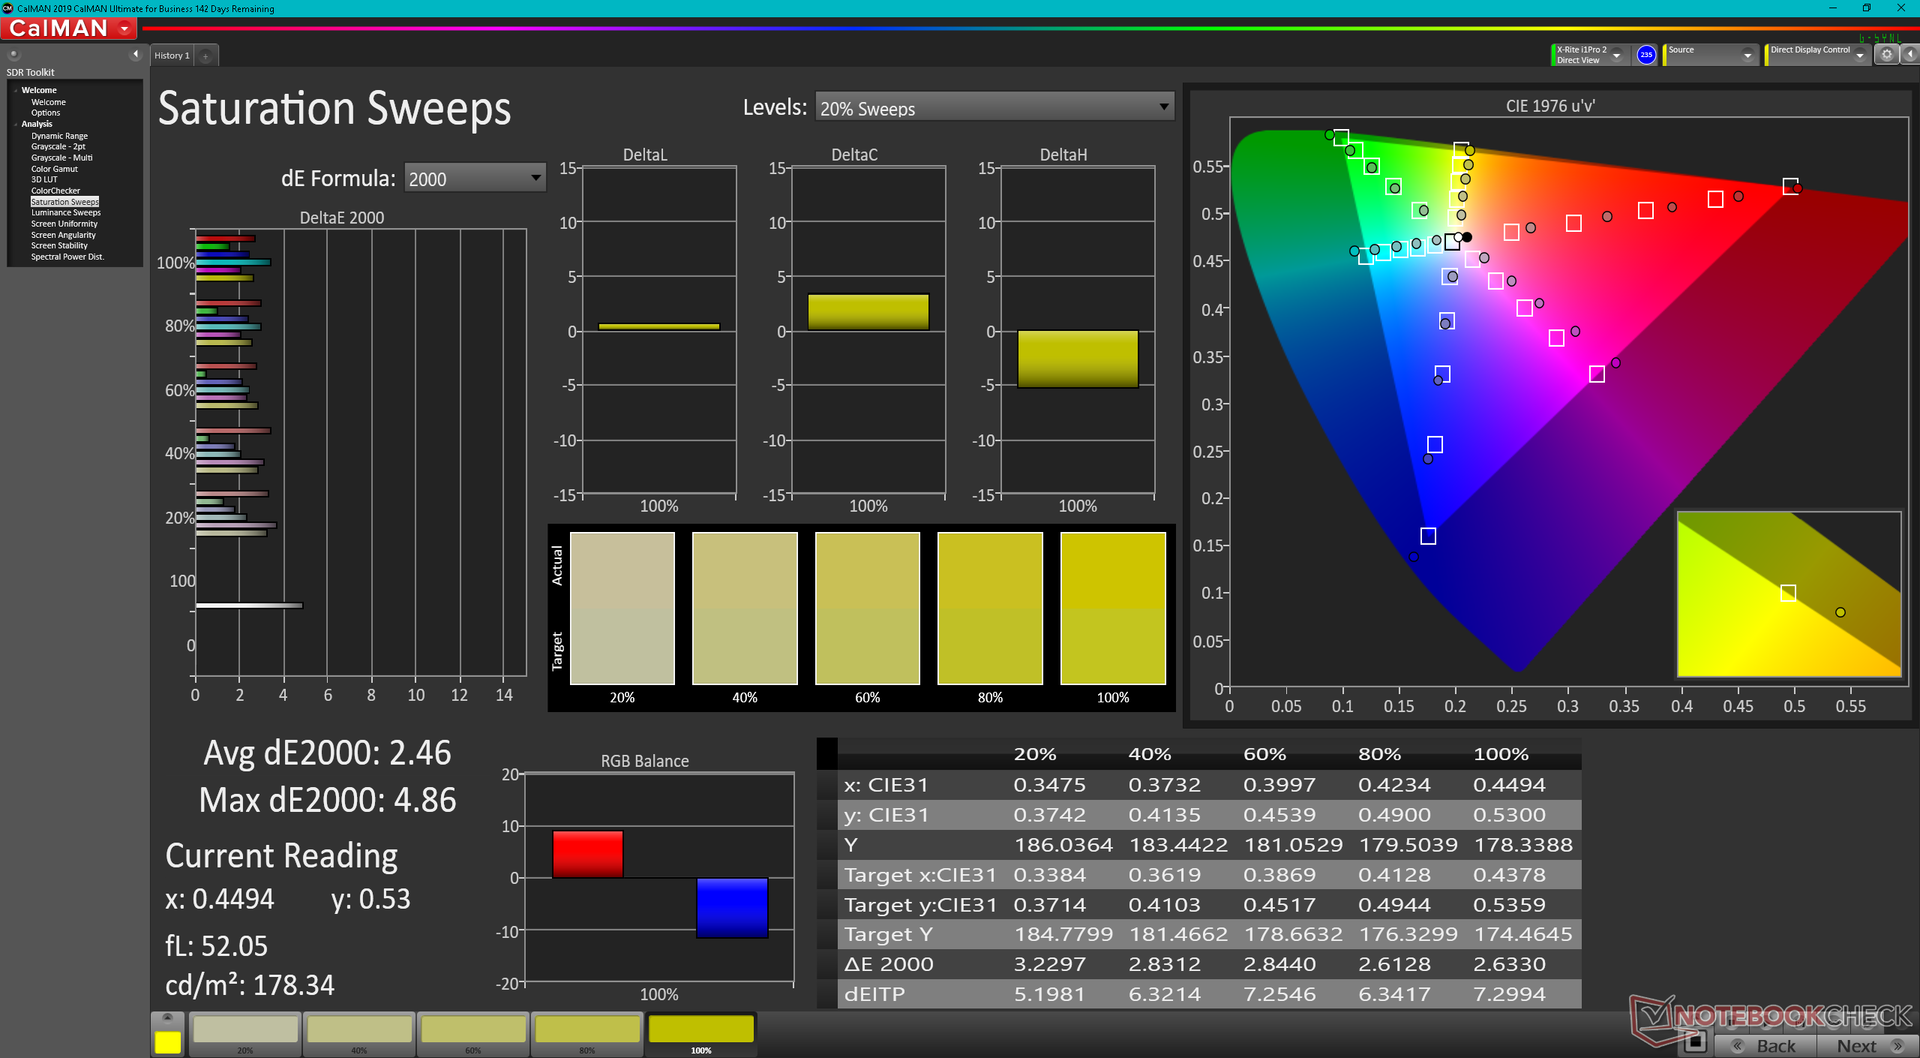
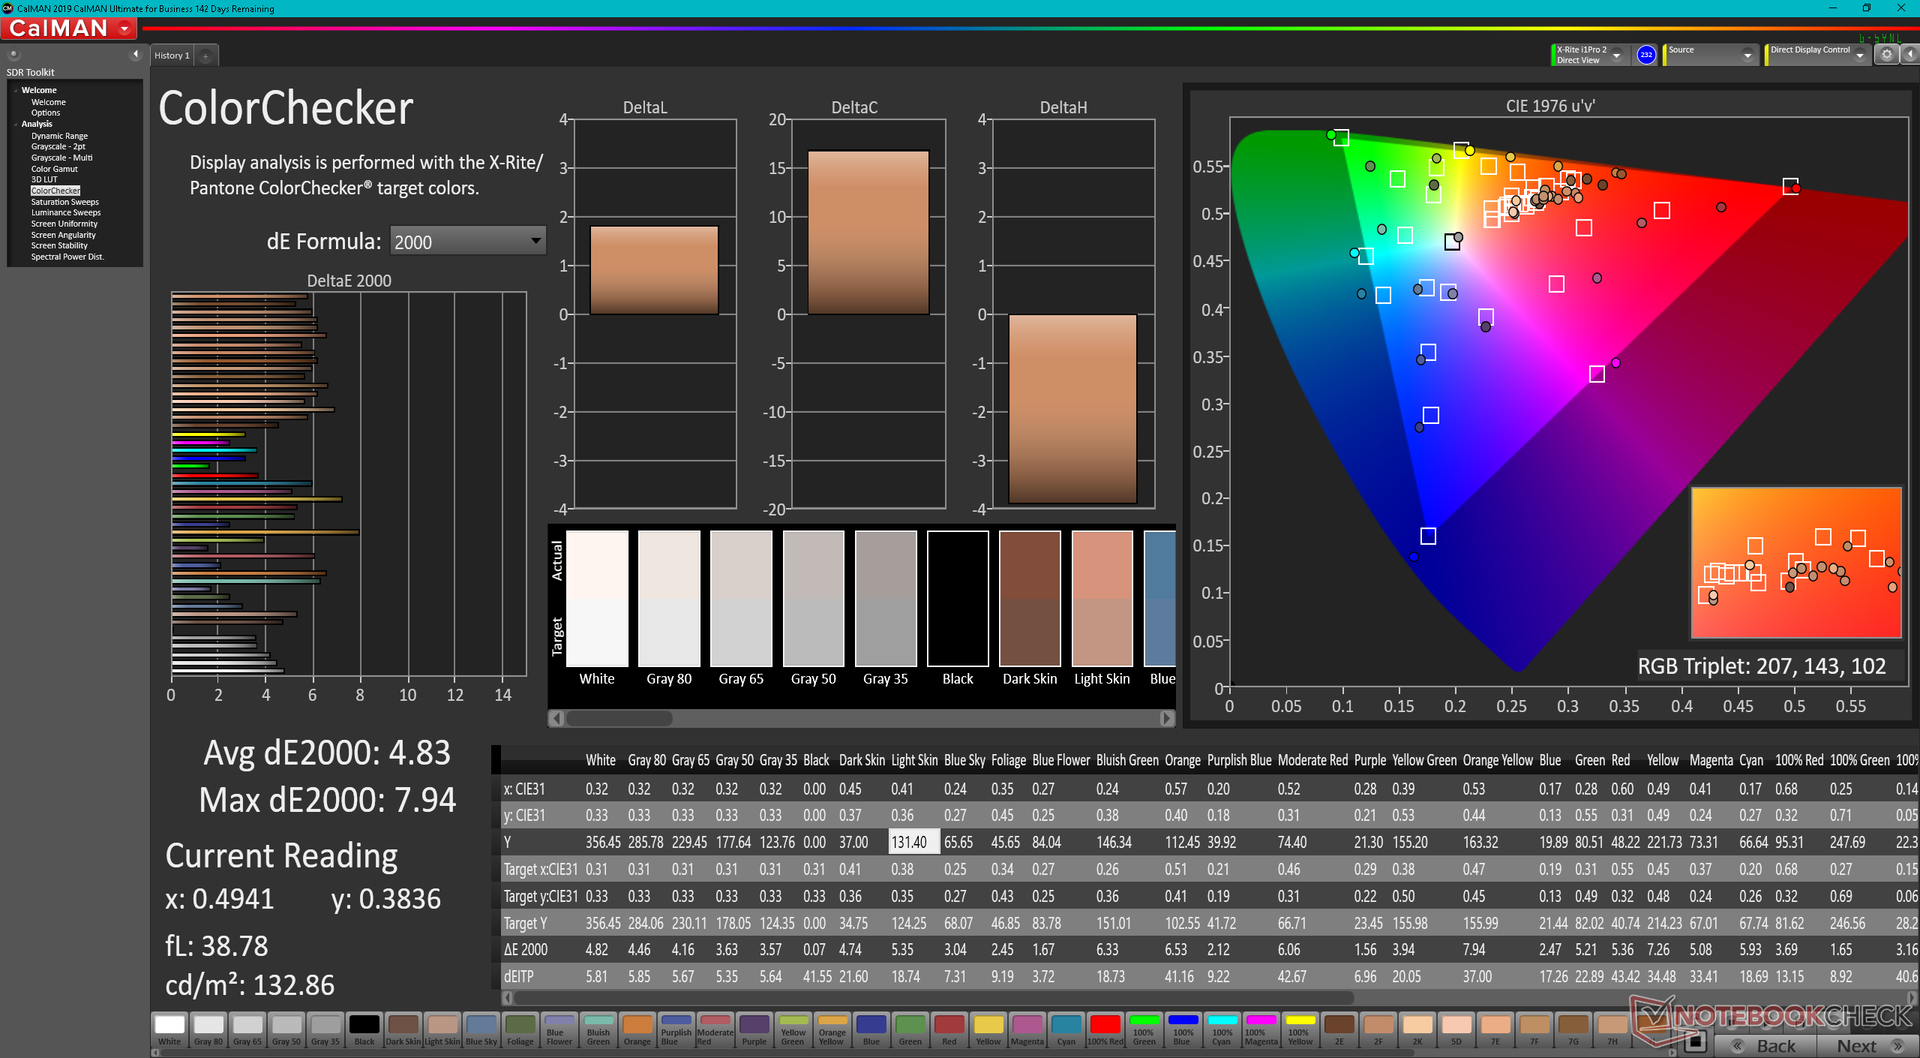
Ten eerste is het GE67 scherm niet gekalibreerd in de fabriek, ook al adverteert het OLED paneel met volledige DCI-P3 dekking. In feite zijn we alleen in staat om een dekking van slechts 72 procent te registreren en de MSI True Color software zelf heeft geen DCI-P3 optie om uit te kiezen. Toen MSI om commentaar werd gevraagd, antwoordde het dat DCI-P3 mode "meer voor video editors en op onze Creator laptop series" is en dat de GE67 in plaats daarvan de Display P3 mode implementeert
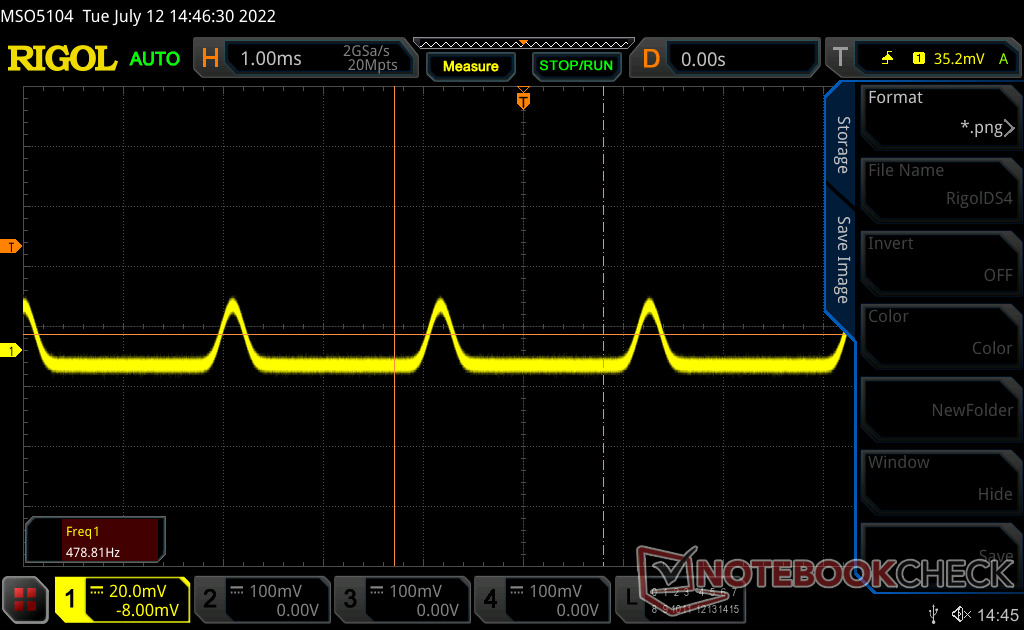
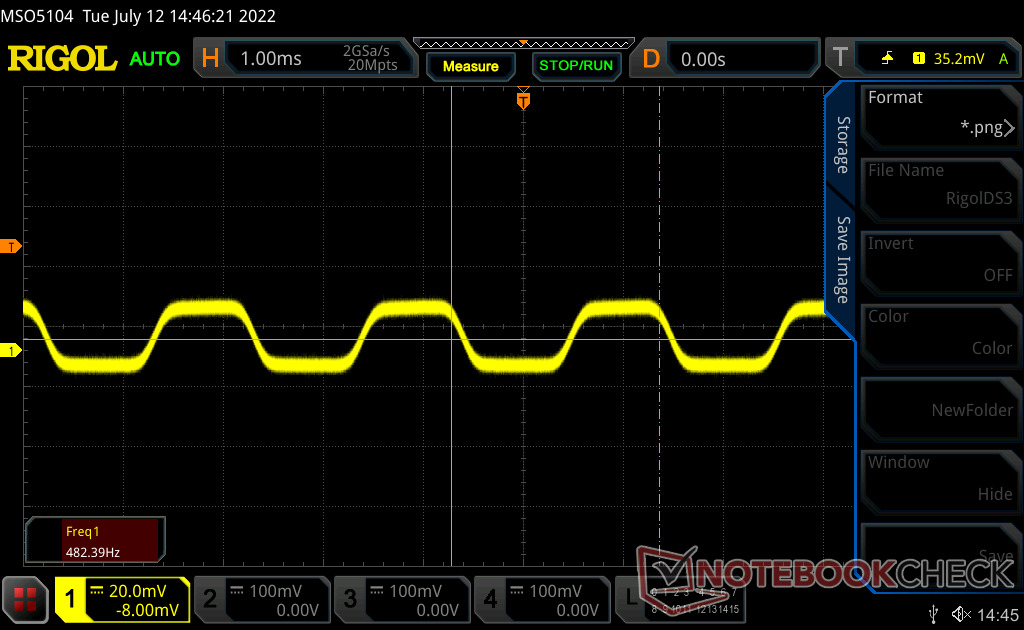
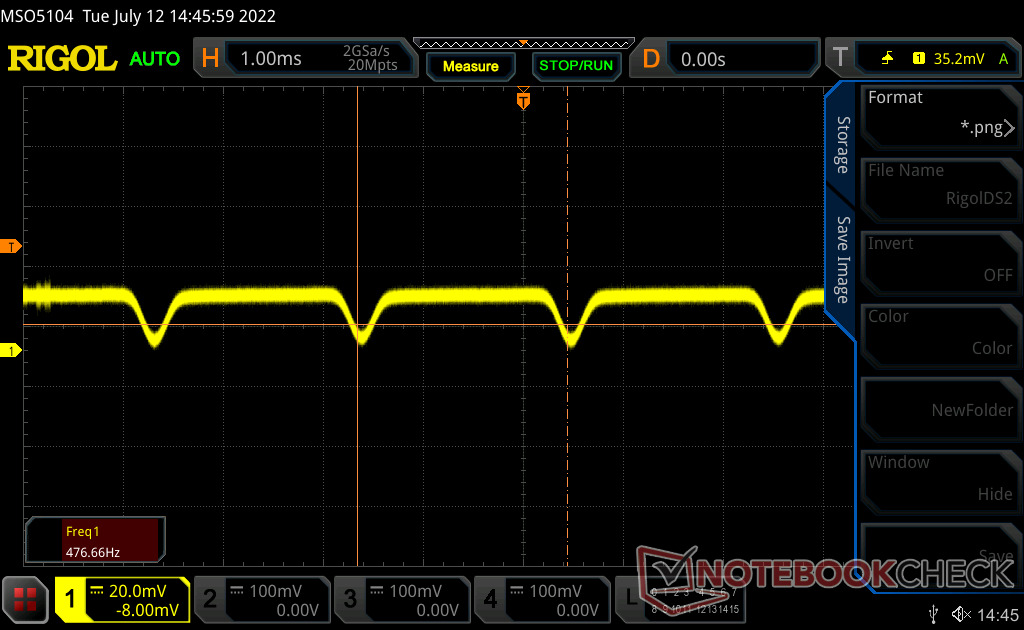
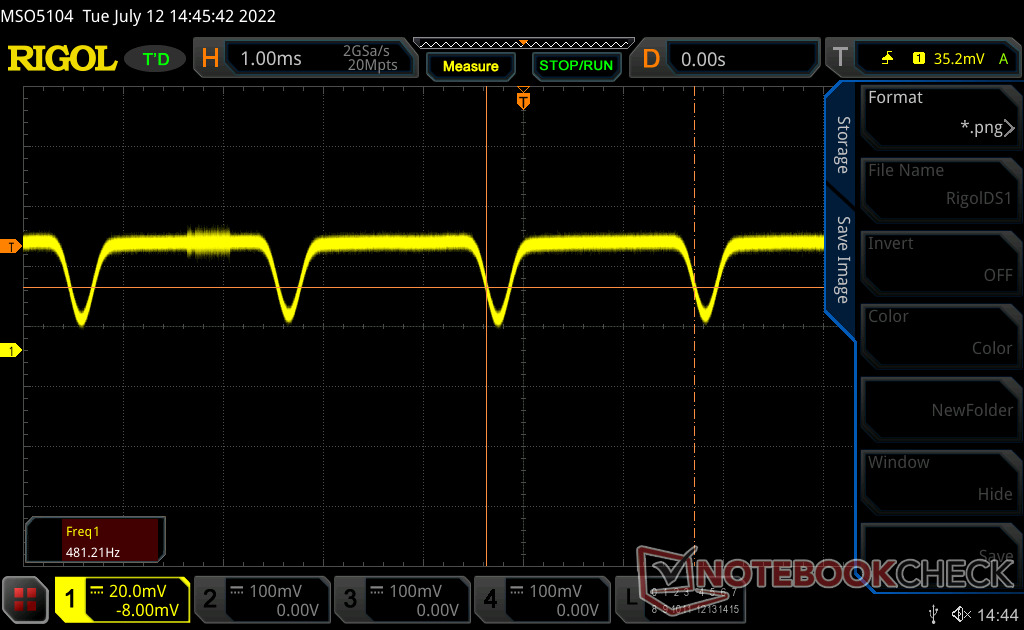
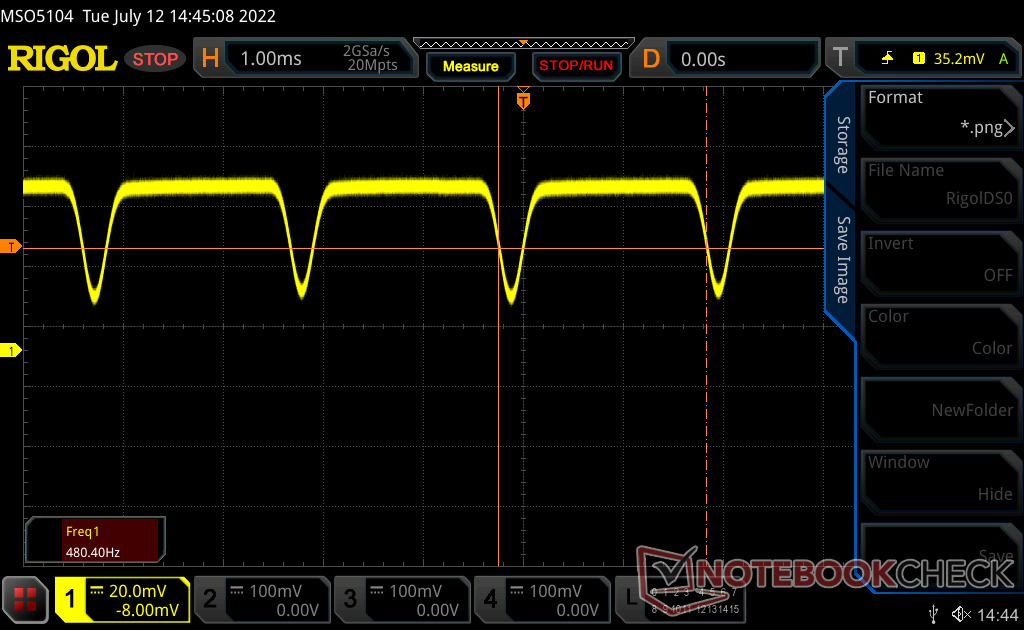
Ten tweede vertoont het paneel flikkeringen bij 480 Hz op alle helderheidsniveaus, inclusief de 100 procent instelling. We hebben soortgelijke resultaten waargenomen op veel recente Asus Vivobook en Zenbook OLED laptops. Als je ogen gevoelig zijn voor onscreen flikkering, dan is het wellicht het beste om de helderheid te verlagen of het gebruik van de GE67 voor langere periodes te vermijden
En tot slot ondersteunt het interne beeldscherm geen G-Sync of adaptieve synchronisatie
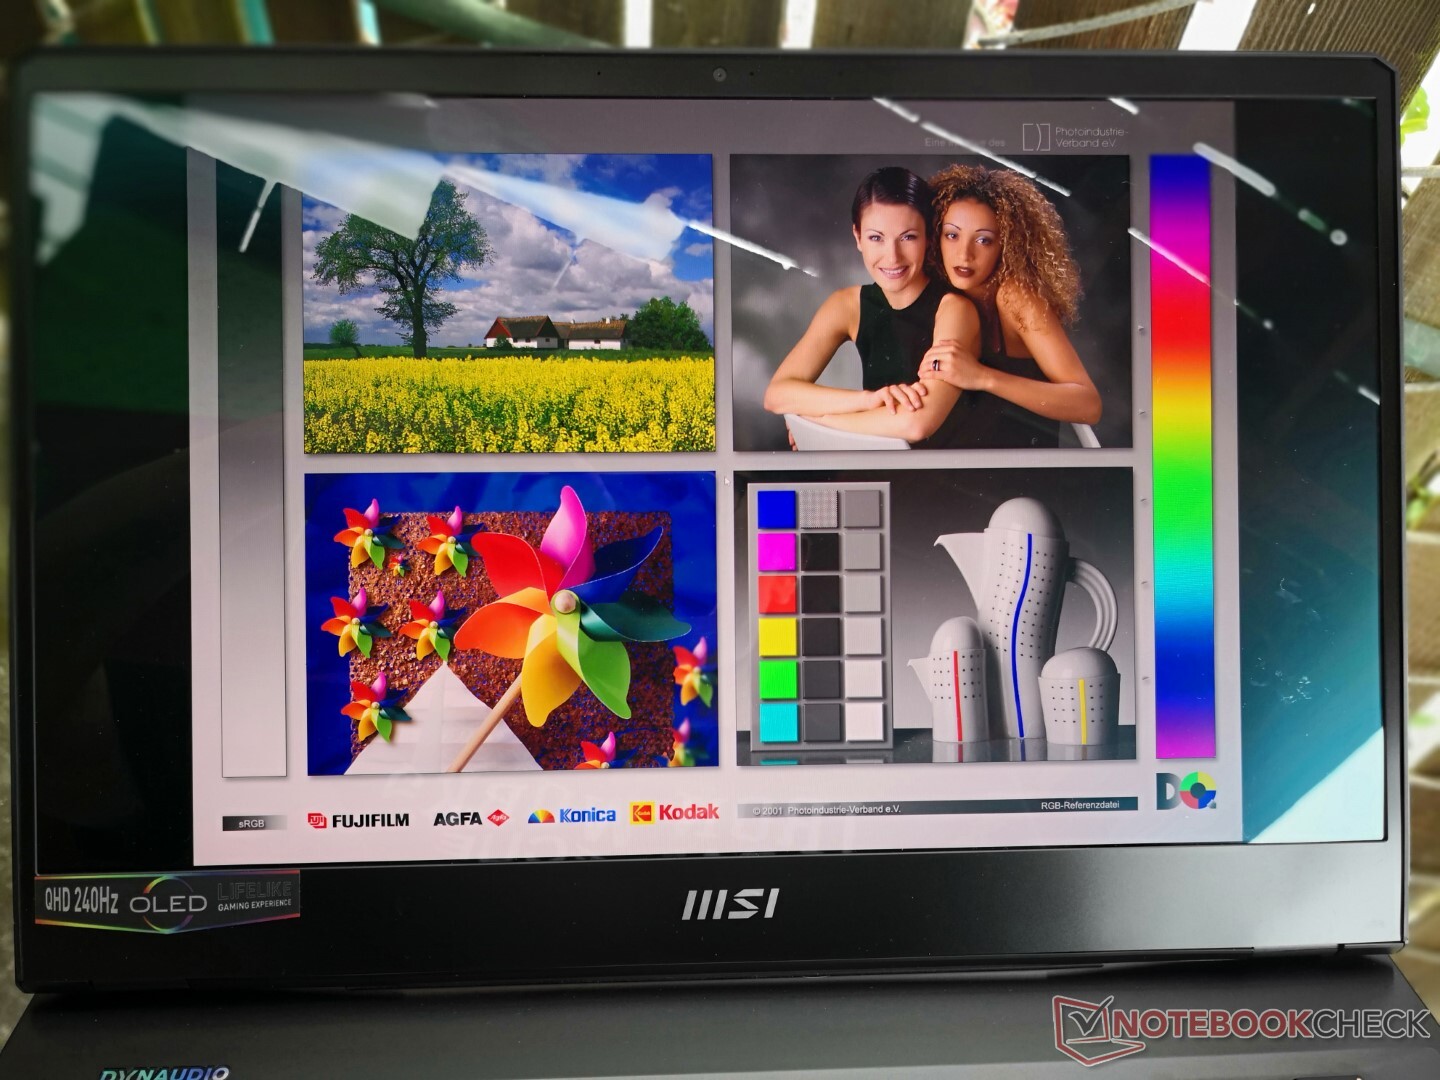
Afgezien van de bovenstaande nadelen, biedt het QHD OLED 240 Hz paneel zeker een van de soepelste OLED ervaringen die we hebben gezien tijdens het gamen. Oudere OLED panelen waren beperkt tot 60 Hz, wat, hoewel perfect prima voor bewerkingsdoeleinden, onaantrekkelijk zou zijn voor enthousiaste gamers. MSI heeft het scherm gemaakt voor gaming doeleinden en minder voor editing of professionals hier.
| |||||||||||||||||||||||||
Helderheidsverdeling: 99 %
Helderheid in Batterij-modus: 356.1 cd/m²
Contrast: ∞:1 (Zwart: 0 cd/m²)
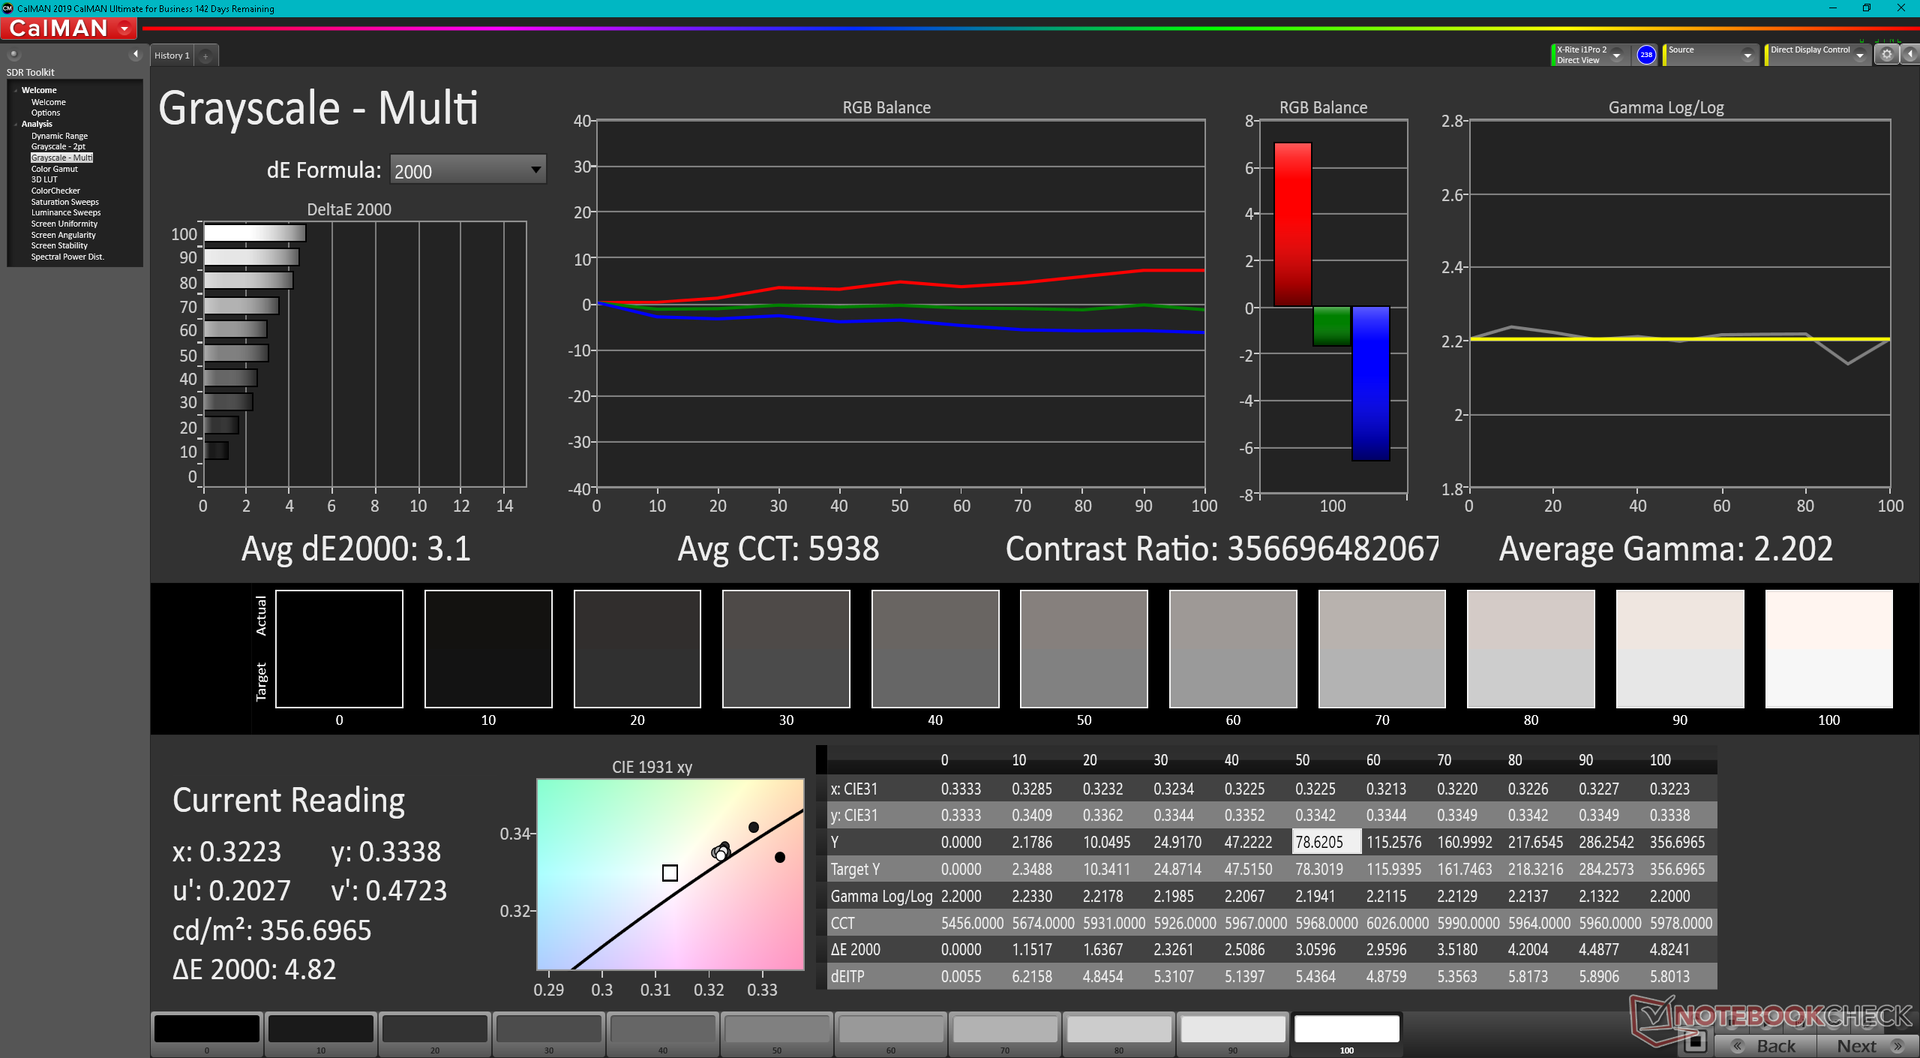
ΔE ColorChecker Calman: 4.83 | ∀{0.5-29.43 Ø4.71}
ΔE Greyscale Calman: 3.1 | ∀{0.09-98 Ø4.96}
75.2% AdobeRGB 1998 (Argyll 3D)
89.7% sRGB (Argyll 3D)
71.7% Display P3 (Argyll 3D)
Gamma: 2.2
CCT: 5938 K
| MSI GE67 HX 12UGS Samsung ATNA562P02-0, OLED, 1920x1080, 15.6" | MSI Raider GE66 12UHS AUO51EB, IPS, 3840x2160, 15.6" | MSI Vector GP66 12UGS BOE NE156FHM-NZ3, IPS, 1920x1080, 15.6" | Asus ROG Strix Scar 15 G533ZW-LN106WS BOE CQ NE156QHM-NZ2, IPS-level, 2560x1440, 15.6" | Alienware m15 R6, i7-11800H RTX 3080 AU Optronics AUO9092 (B156HAN), IPS, 1920x1080, 15.6" | Razer Blade 15 2022 Sharp LQ156T1JW03, IPS, 2560x1440, 15.6" | |
|---|---|---|---|---|---|---|
| Display | 16% | 2% | 19% | 5% | 21% | |
| Display P3 Coverage (%) | 71.7 | 80.4 12% | 70.1 -2% | 96.2 34% | 74.1 3% | 99.1 38% |
| sRGB Coverage (%) | 89.7 | 98.4 10% | 99.5 11% | 99.9 11% | 99.5 11% | 99.9 11% |
| AdobeRGB 1998 Coverage (%) | 75.2 | 94.7 26% | 72.1 -4% | 84.5 12% | 75.7 1% | 86.8 15% |
| Response Times | -5260% | -2260% | -2134% | -1160% | -4230% | |
| Response Time Grey 50% / Grey 80% * (ms) | 0.25 ? | 18.8 ? -7420% | 5.8 ? -2220% | 7.86 ? -3044% 4.21 ? -1584% | 2.8 -1020% | 14.4 ? -5660% |
| Response Time Black / White * (ms) | 0.4 ? | 12.8 ? -3100% | 9.6 ? -2300% | 7.5 ? -1775% | 5.6 -1300% | 11.6 ? -2800% |
| PWM Frequency (Hz) | 480.4 ? | |||||
| Screen | -1% | 6% | 9% | 6% | 15% | |
| Brightness middle (cd/m²) | 356.1 | 351 -1% | 353.1 -1% | 346 -3% | 359 1% | 286 -20% |
| Brightness (cd/m²) | 358 | 347 -3% | 325 -9% | 329 -8% | 344 -4% | 271 -24% |
| Brightness Distribution (%) | 99 | 90 -9% | 85 -14% | 91 -8% | 85 -14% | 89 -10% |
| Black Level * (cd/m²) | 0.35 | 0.38 | 0.59 | 0.35 | 0.25 | |
| Colorchecker dE 2000 * | 4.83 | 2.54 47% | 2.24 54% | 3.06 37% | 3.3 32% | 2.74 43% |
| Colorchecker dE 2000 max. * | 7.94 | 8.36 -5% | 5 37% | 5.81 27% | 4.84 39% | 5.21 34% |
| Greyscale dE 2000 * | 3.1 | 4.1 -32% | 4 -29% | 3.66 -18% | 1.1 65% | |
| Gamma | 2.2 100% | 2.089 105% | 2.24 98% | 2.12 104% | 2.43 91% | 2.2 100% |
| CCT | 5938 109% | 7036 92% | 6864 95% | 7021 93% | 5896 110% | 6408 101% |
| Contrast (:1) | 1003 | 929 | 586 | 1026 | 1144 | |
| Colorchecker dE 2000 calibrated * | 0.67 | 1.02 | 2.57 | 3.28 | 2.52 | |
| Totaal Gemiddelde (Programma / Instellingen) | -1748% /
-952% | -751% /
-407% | -702% /
-573% | -383% /
-206% | -1398% /
-755% |
* ... kleiner is beter
Responstijd Scherm
| ↔ Responstijd Zwart naar Wit | ||
|---|---|---|
| 0.4 ms ... stijging ↗ en daling ↘ gecombineerd | ↗ 0.2 ms stijging | 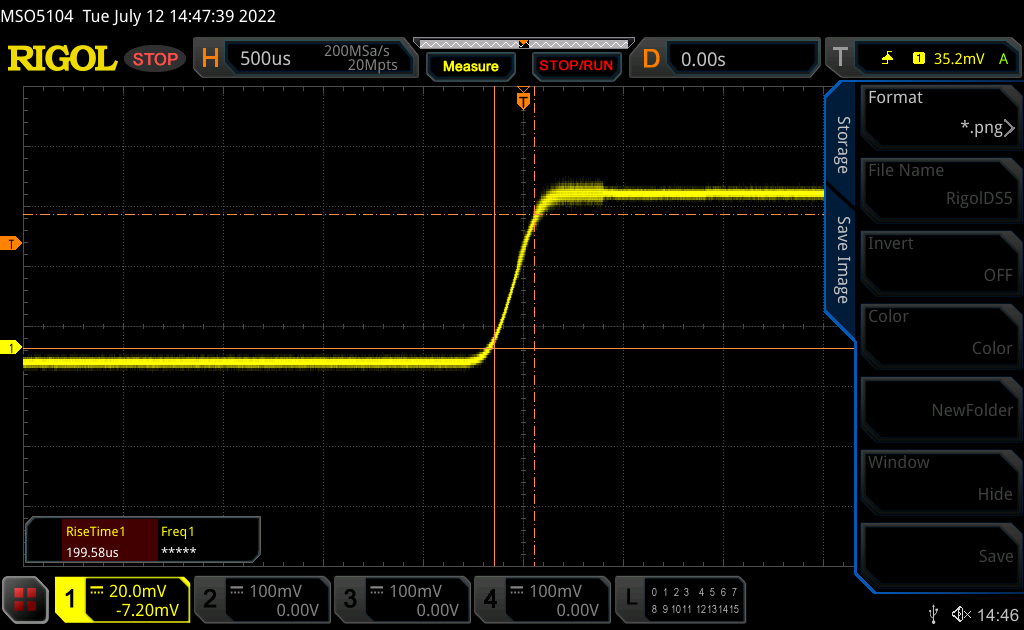 |
| ↘ 0.2 ms daling | ||
| Het scherm vertoonde erg snelle responstijden in onze tests en zou zeer geschikt moeten zijn voor snelle games. Ter vergelijking: alle testtoestellen variëren van 0.1 (minimum) tot 240 (maximum) ms. » 0 % van alle toestellen zijn beter. Dit betekent dat de gemeten responstijd beter is dan het gemiddelde (19.8 ms) van alle geteste toestellen. | ||
| ↔ Responstijd 50% Grijs naar 80% Grijs | ||
| 0.25 ms ... stijging ↗ en daling ↘ gecombineerd | ↗ 0.13 ms stijging | 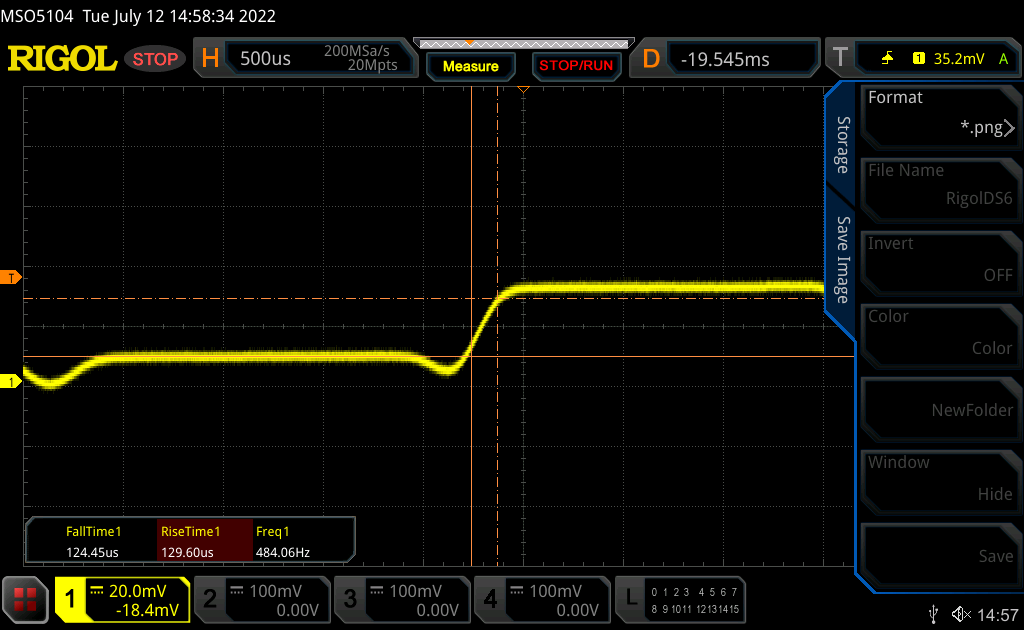 |
| ↘ 0.12 ms daling | ||
| Het scherm vertoonde erg snelle responstijden in onze tests en zou zeer geschikt moeten zijn voor snelle games. Ter vergelijking: alle testtoestellen variëren van 0.165 (minimum) tot 636 (maximum) ms. » 0 % van alle toestellen zijn beter. Dit betekent dat de gemeten responstijd beter is dan het gemiddelde (31 ms) van alle geteste toestellen. | ||
Screen Flickering / PWM (Pulse-Width Modulation)
| Screen flickering / PWM waargenomen | 480.4 Hz | ≤ 100 % helderheid instelling |  |
De achtergrondverlichting van het scherm flikkert op 480.4 Hz (in het slechtste geval, bijvoorbeeld bij gebruik van PWM) aan een helderheid van 100 % en lager. Boven deze helderheid zou er geen flickering / PWM mogen optreden. De frequentie van 480.4 Hz is relatief hoog en de meeste mensen die gevoelig zijn aan flickering zouden dit dus niet mogen waarnemen of geïrriteerde ogen krijgen. Er zijn echter rapporten die beweren dat sommige mensen toch flickering met 500 Hz en hoger kunnen waarnemen: opgelet dus. Ter vergelijking: 52 % van alle geteste toestellen maakten geen gebruik van PWM om de schermhelderheid te verlagen. Als het wel werd gebruikt, werd een gemiddelde van 7757 (minimum: 5 - maximum: 343500) Hz waargenomen. | |||

Prestaties - 16 kernen en 24 draden
Testomstandigheden
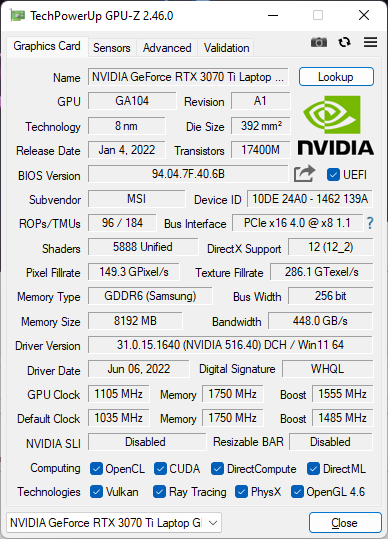
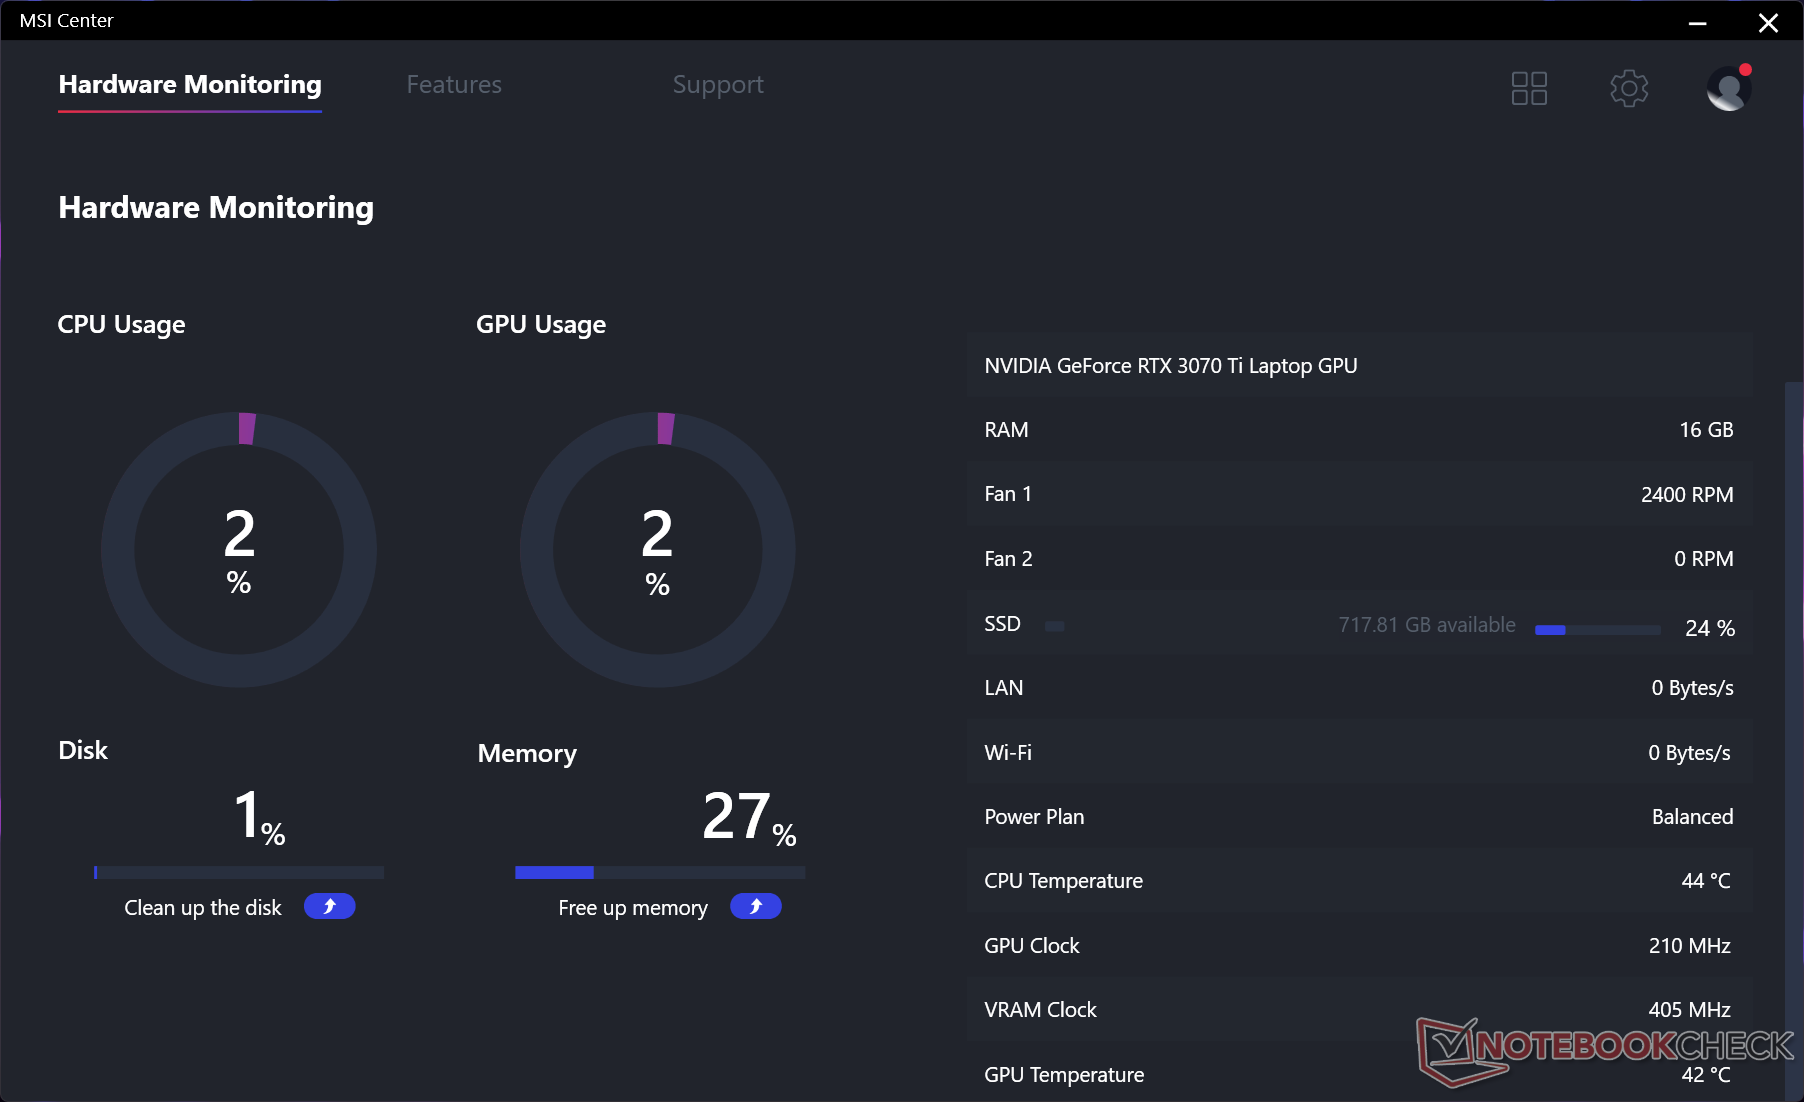
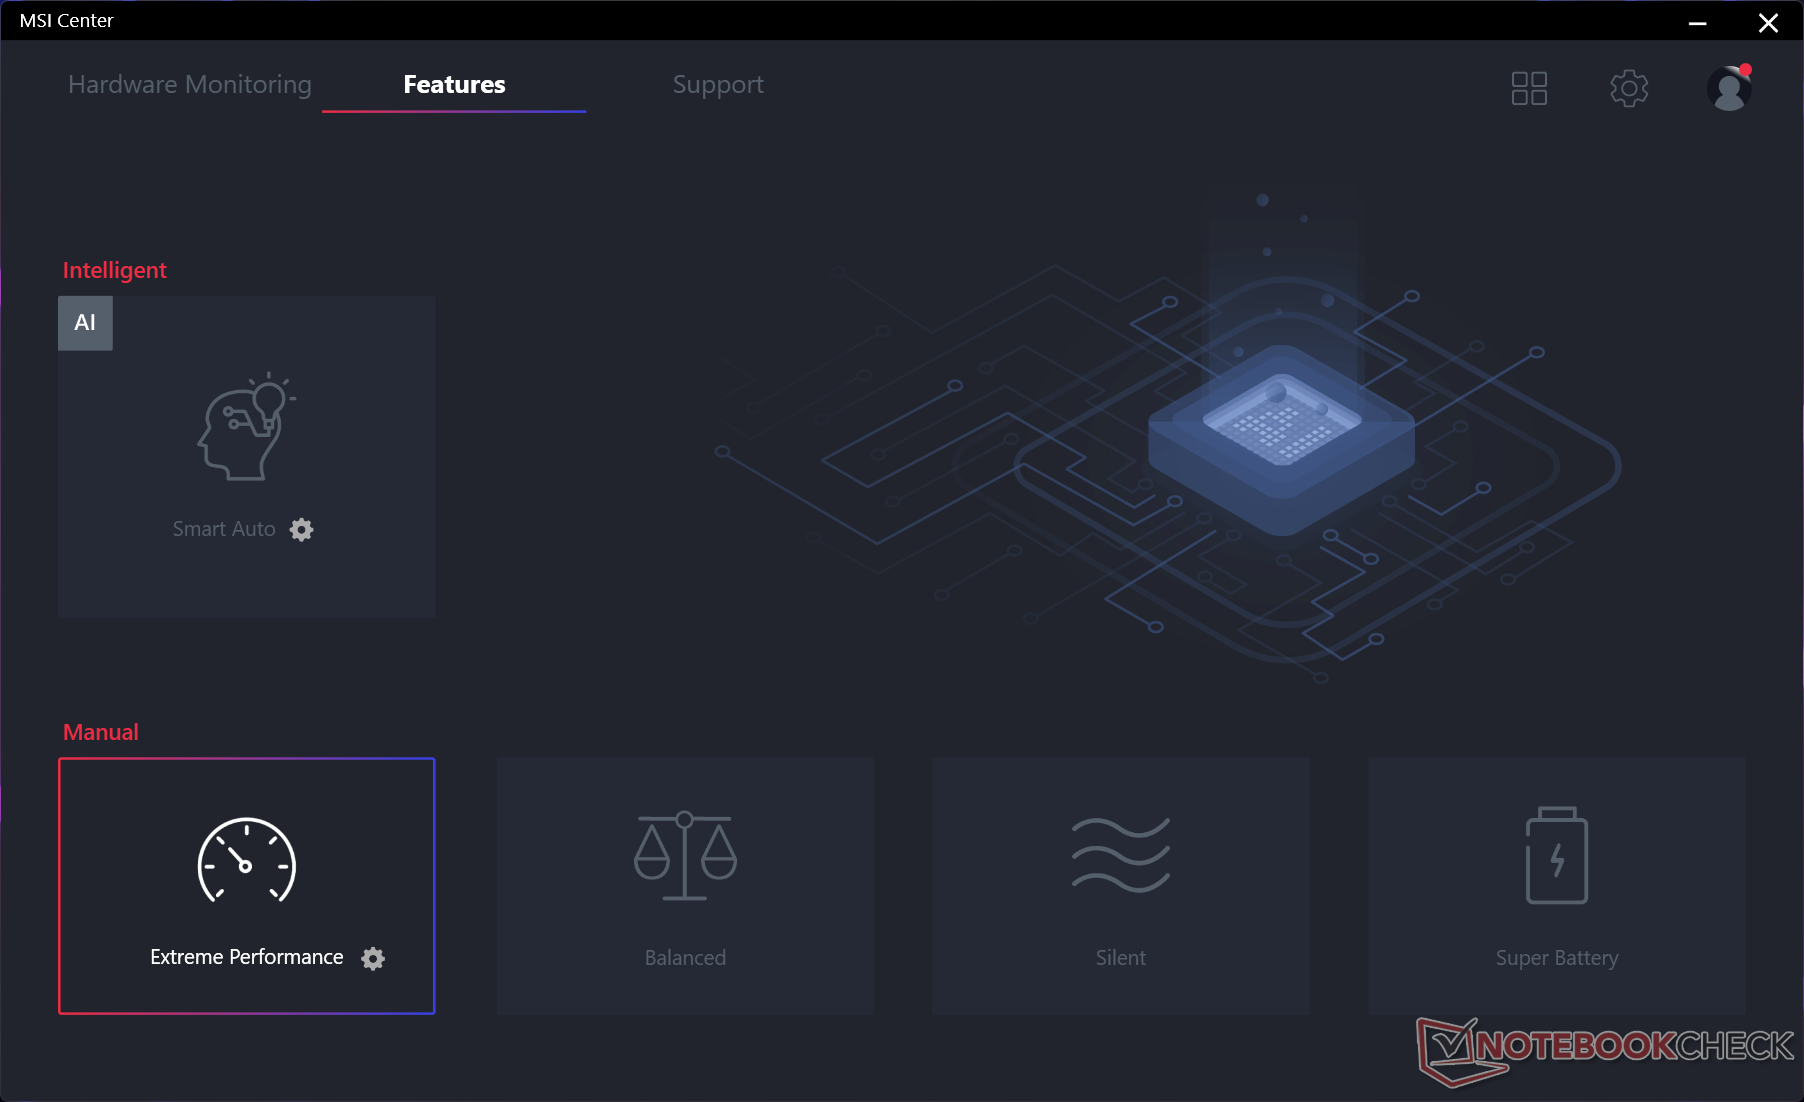
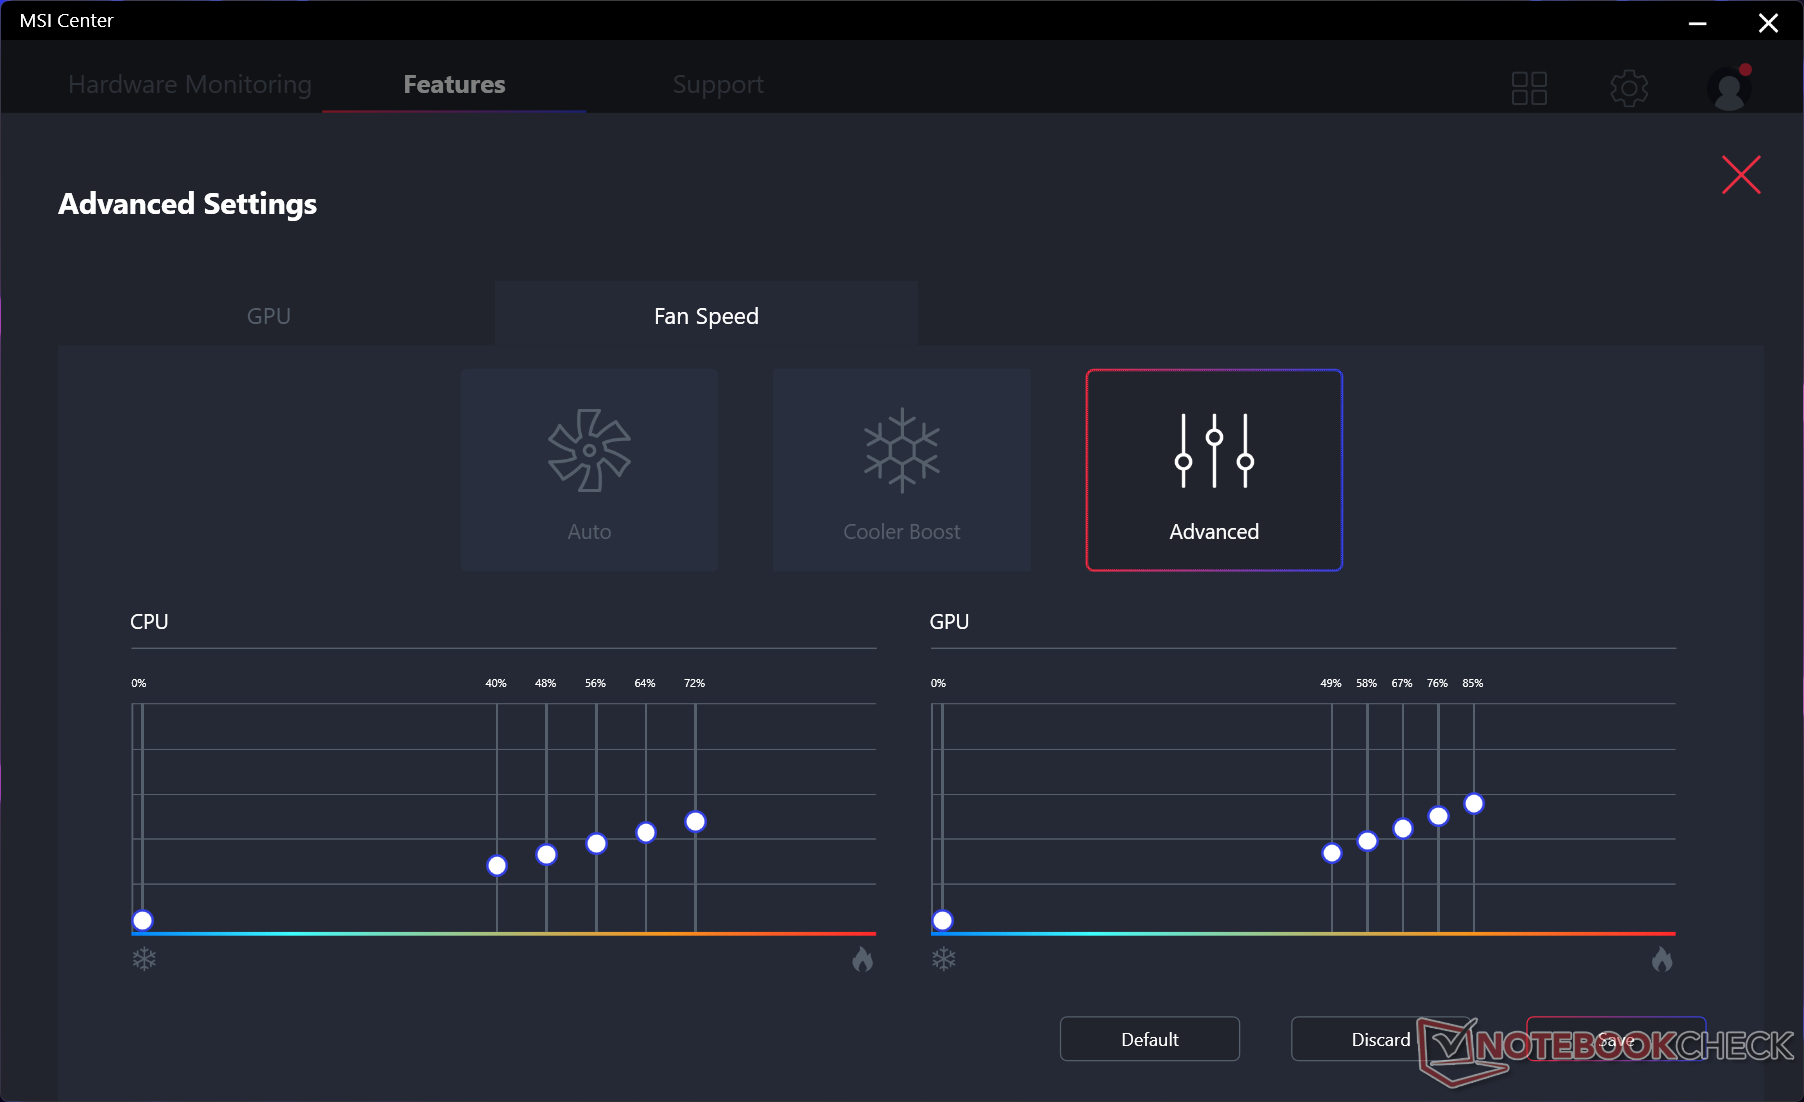
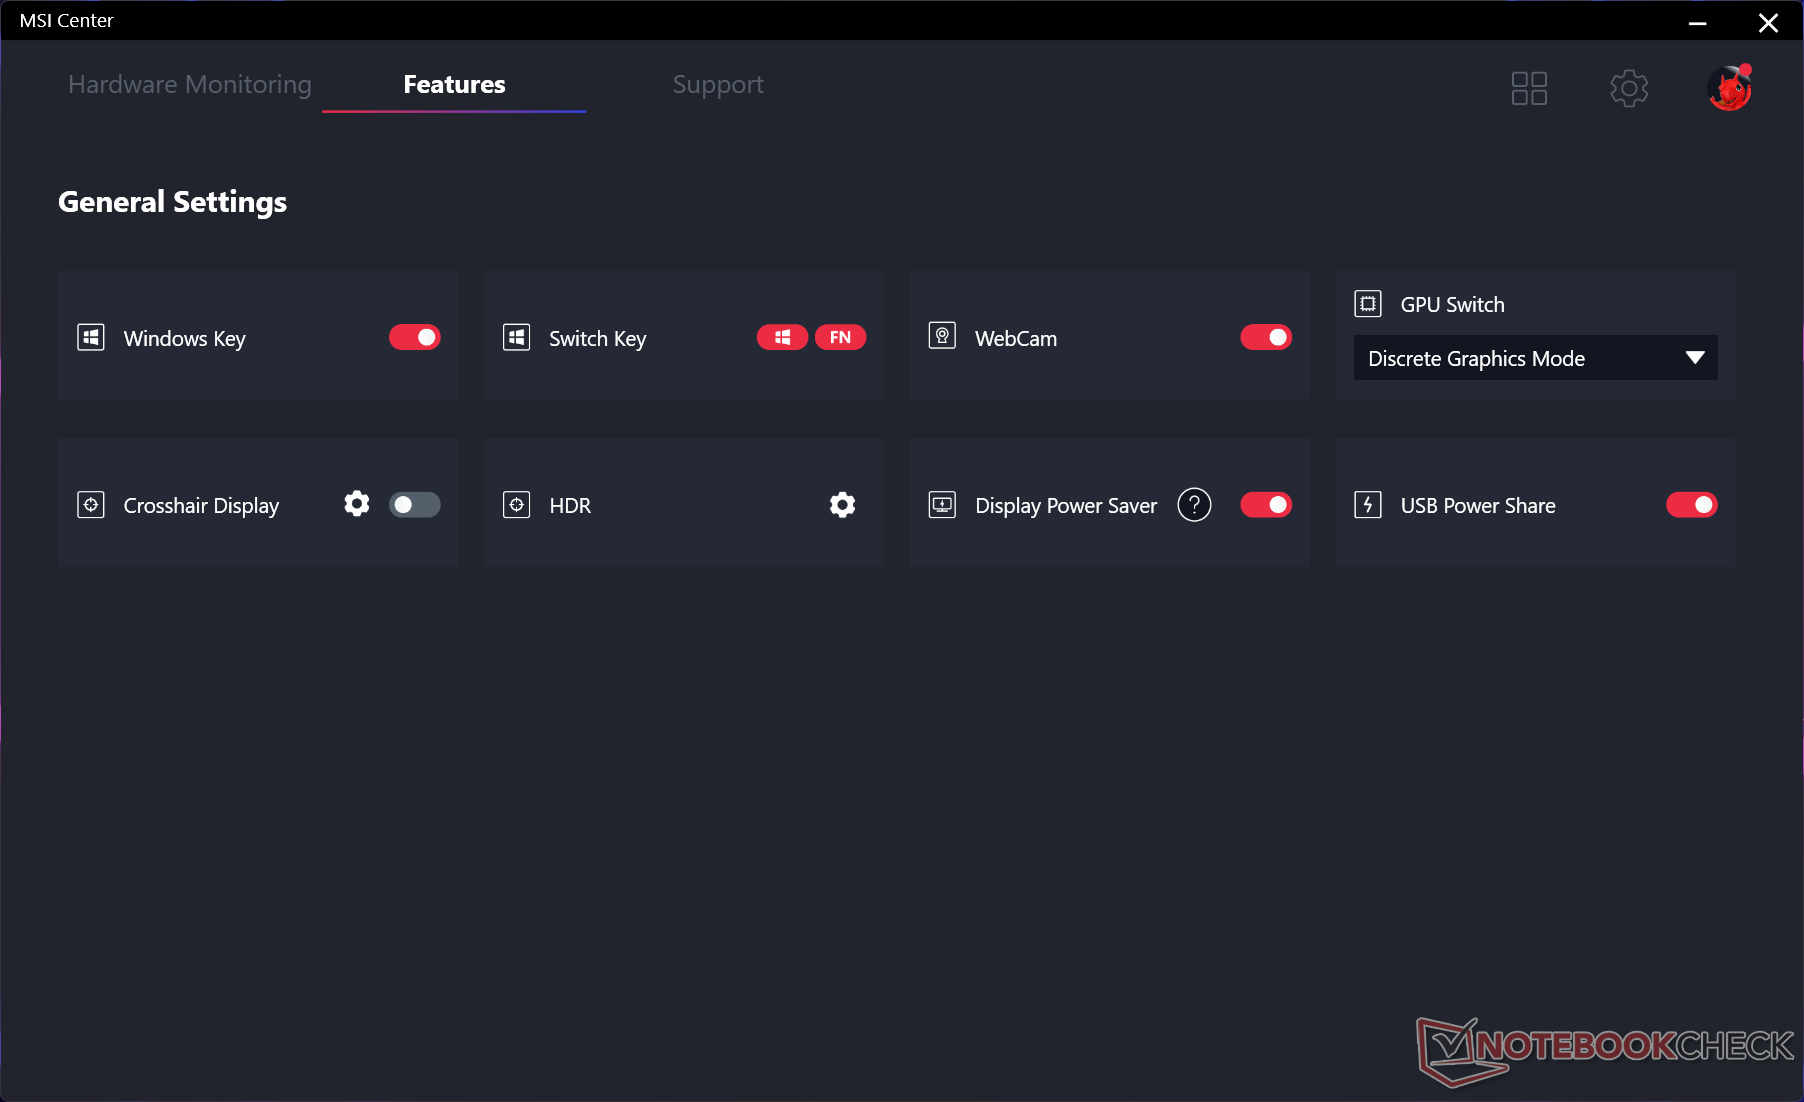
We hebben ons apparaat ingesteld op de Prestatie modus via Windows, Extreme Prestatie modus vis MSI Center, en de discrete GPU actief in plaats van de MSHybrid modus voordat we onderstaande benchmarks uitvoerden. We raden gebruikers aan bekend te raken met de voorgeïnstalleerde MSI Center software, omdat hier de belangrijkste prestatie- en hulpfuncties worden omgeschakeld.
Processor
DeCore i7-12800HX is gemakkelijk een hoogtepunt van de GE67 HX. De ruwe multi-thread prestaties zijn ongeveer 25 procent sneller dan deCore i9-12900HK in de GE66 van Q1 2022 en deze delta is nog groter in vergelijking met de 10e generatie Core i9-10980HK in de oorspronkelijke GE66 van 2020. Hij presteert met gemak beter dan elke mobiele processor in AMD's Zen 3 line-up. De Ryzen 9 5900HXis bijvoorbeeld 40 tot 45 procent langzamer bij multi-threaded belastingen
De duurzaamheid van de prestaties is ook erg goed, zonder grote dips in kloksnelheden in de loop van de tijd, zelfs niet wanneer de processor lange tijd wordt belast
Single-thread prestaties blijven vergelijkbaar met de Core i9-12900HK ondanks hun verschillen in core count (16 vs. 14) en thread count (24 vs. 20).
Cinebench R15 Multi Loop
Cinebench R23: Multi Core | Single Core
Cinebench R15: CPU Multi 64Bit | CPU Single 64Bit
Blender: v2.79 BMW27 CPU
7-Zip 18.03: 7z b 4 | 7z b 4 -mmt1
Geekbench 5.5: Multi-Core | Single-Core
HWBOT x265 Benchmark v2.2: 4k Preset
LibreOffice : 20 Documents To PDF
R Benchmark 2.5: Overall mean
| Cinebench R20 / CPU (Multi Core) | |
| Intel Core i9-12900K | |
| MSI GE67 HX 12UGS | |
| Gemiddeld Intel Core i7-12800HX (n=1) | |
| Eurocom Raptor X15 | |
| MSI GE76 Raider | |
| Schenker XMG Neo 15 (i7-12700H, RTX 3080 Ti) | |
| MSI Raider GE66 12UHS | |
| Asus ROG Strix Scar 15 G533zm | |
| Schenker XMG Apex 15 NH57E PS | |
| MSI Delta 15 A5EFK | |
| Eurocom Sky X4C i9-9900KS | |
| Dell G5 15 SE 5505 P89F | |
| Asus Zephyrus S15 GX502L | |
| MSI GE66 Raider 10SFS | |
| Cinebench R20 / CPU (Single Core) | |
| Intel Core i9-12900K | |
| Eurocom Raptor X15 | |
| MSI GE76 Raider | |
| Asus ROG Strix Scar 15 G533zm | |
| MSI Raider GE66 12UHS | |
| Schenker XMG Neo 15 (i7-12700H, RTX 3080 Ti) | |
| MSI GE67 HX 12UGS | |
| Gemiddeld Intel Core i7-12800HX (n=1) | |
| MSI Delta 15 A5EFK | |
| Schenker XMG Apex 15 NH57E PS | |
| Eurocom Sky X4C i9-9900KS | |
| Dell G5 15 SE 5505 P89F | |
| MSI GE66 Raider 10SFS | |
| Asus Zephyrus S15 GX502L | |
| Cinebench R23 / Multi Core | |
| Intel Core i9-12900K | |
| MSI GE67 HX 12UGS | |
| Gemiddeld Intel Core i7-12800HX (n=1) | |
| MSI GE76 Raider | |
| Schenker XMG Neo 15 (i7-12700H, RTX 3080 Ti) | |
| Eurocom Raptor X15 | |
| Asus ROG Strix Scar 15 G533zm | |
| MSI Raider GE66 12UHS | |
| Schenker XMG Apex 15 NH57E PS | |
| MSI Delta 15 A5EFK | |
| Cinebench R23 / Single Core | |
| Intel Core i9-12900K | |
| MSI GE76 Raider | |
| MSI Raider GE66 12UHS | |
| MSI GE67 HX 12UGS | |
| Gemiddeld Intel Core i7-12800HX (n=1) | |
| Schenker XMG Neo 15 (i7-12700H, RTX 3080 Ti) | |
| Eurocom Raptor X15 | |
| Asus ROG Strix Scar 15 G533zm | |
| MSI Delta 15 A5EFK | |
| Schenker XMG Apex 15 NH57E PS | |
| Cinebench R15 / CPU Multi 64Bit | |
| Intel Core i9-12900K | |
| MSI GE67 HX 12UGS | |
| Gemiddeld Intel Core i7-12800HX (n=1) | |
| Asus ROG Strix Scar 15 G533zm | |
| MSI GE76 Raider | |
| Schenker XMG Neo 15 (i7-12700H, RTX 3080 Ti) | |
| MSI Raider GE66 12UHS | |
| MSI Delta 15 A5EFK | |
| Schenker XMG Apex 15 NH57E PS | |
| Dell G5 15 SE 5505 P89F | |
| Eurocom Sky X4C i9-9900KS | |
| MSI GE66 Raider 10SFS | |
| Asus Zephyrus S15 GX502L | |
| Cinebench R15 / CPU Single 64Bit | |
| Intel Core i9-12900K | |
| Asus ROG Strix Scar 15 G533zm | |
| MSI GE76 Raider | |
| MSI Raider GE66 12UHS | |
| Schenker XMG Neo 15 (i7-12700H, RTX 3080 Ti) | |
| MSI GE67 HX 12UGS | |
| Gemiddeld Intel Core i7-12800HX (n=1) | |
| MSI Delta 15 A5EFK | |
| Schenker XMG Apex 15 NH57E PS | |
| Eurocom Sky X4C i9-9900KS | |
| MSI GE66 Raider 10SFS | |
| Asus Zephyrus S15 GX502L | |
| Dell G5 15 SE 5505 P89F | |
| Blender / v2.79 BMW27 CPU | |
| MSI GE66 Raider 10SFS | |
| Dell G5 15 SE 5505 P89F | |
| Asus Zephyrus S15 GX502L | |
| Eurocom Sky X4C i9-9900KS | |
| Schenker XMG Apex 15 NH57E PS | |
| MSI Delta 15 A5EFK | |
| MSI Raider GE66 12UHS | |
| Eurocom Raptor X15 | |
| MSI GE76 Raider | |
| Schenker XMG Neo 15 (i7-12700H, RTX 3080 Ti) | |
| Asus ROG Strix Scar 15 G533zm | |
| MSI GE67 HX 12UGS | |
| Gemiddeld Intel Core i7-12800HX (n=1) | |
| Intel Core i9-12900K | |
| 7-Zip 18.03 / 7z b 4 | |
| Intel Core i9-12900K | |
| MSI GE67 HX 12UGS | |
| Gemiddeld Intel Core i7-12800HX (n=1) | |
| Asus ROG Strix Scar 15 G533zm | |
| MSI GE76 Raider | |
| Schenker XMG Neo 15 (i7-12700H, RTX 3080 Ti) | |
| MSI Raider GE66 12UHS | |
| Eurocom Raptor X15 | |
| MSI Delta 15 A5EFK | |
| Schenker XMG Apex 15 NH57E PS | |
| Eurocom Sky X4C i9-9900KS | |
| Dell G5 15 SE 5505 P89F | |
| Asus Zephyrus S15 GX502L | |
| MSI GE66 Raider 10SFS | |
| 7-Zip 18.03 / 7z b 4 -mmt1 | |
| Intel Core i9-12900K | |
| Eurocom Raptor X15 | |
| MSI GE76 Raider | |
| Asus ROG Strix Scar 15 G533zm | |
| MSI Raider GE66 12UHS | |
| Schenker XMG Neo 15 (i7-12700H, RTX 3080 Ti) | |
| MSI Delta 15 A5EFK | |
| Eurocom Sky X4C i9-9900KS | |
| MSI GE67 HX 12UGS | |
| Gemiddeld Intel Core i7-12800HX (n=1) | |
| Schenker XMG Apex 15 NH57E PS | |
| MSI GE66 Raider 10SFS | |
| Asus Zephyrus S15 GX502L | |
| Dell G5 15 SE 5505 P89F | |
| Geekbench 5.5 / Multi-Core | |
| Intel Core i9-12900K | |
| MSI GE67 HX 12UGS | |
| Gemiddeld Intel Core i7-12800HX (n=1) | |
| MSI Raider GE66 12UHS | |
| MSI GE76 Raider | |
| Asus ROG Strix Scar 15 G533zm | |
| Schenker XMG Neo 15 (i7-12700H, RTX 3080 Ti) | |
| Eurocom Raptor X15 | |
| Eurocom Sky X4C i9-9900KS | |
| MSI Delta 15 A5EFK | |
| Schenker XMG Apex 15 NH57E PS | |
| MSI GE66 Raider 10SFS | |
| Dell G5 15 SE 5505 P89F | |
| Asus Zephyrus S15 GX502L | |
| Geekbench 5.5 / Single-Core | |
| Intel Core i9-12900K | |
| Eurocom Raptor X15 | |
| MSI GE76 Raider | |
| MSI Raider GE66 12UHS | |
| Asus ROG Strix Scar 15 G533zm | |
| MSI GE67 HX 12UGS | |
| Gemiddeld Intel Core i7-12800HX (n=1) | |
| Schenker XMG Neo 15 (i7-12700H, RTX 3080 Ti) | |
| MSI Delta 15 A5EFK | |
| Schenker XMG Apex 15 NH57E PS | |
| Eurocom Sky X4C i9-9900KS | |
| MSI GE66 Raider 10SFS | |
| Asus Zephyrus S15 GX502L | |
| Dell G5 15 SE 5505 P89F | |
| HWBOT x265 Benchmark v2.2 / 4k Preset | |
| Intel Core i9-12900K | |
| MSI GE67 HX 12UGS | |
| Gemiddeld Intel Core i7-12800HX (n=1) | |
| Asus ROG Strix Scar 15 G533zm | |
| Schenker XMG Neo 15 (i7-12700H, RTX 3080 Ti) | |
| MSI GE76 Raider | |
| MSI Raider GE66 12UHS | |
| MSI Delta 15 A5EFK | |
| Schenker XMG Apex 15 NH57E PS | |
| Eurocom Sky X4C i9-9900KS | |
| Eurocom Raptor X15 | |
| Asus Zephyrus S15 GX502L | |
| MSI GE66 Raider 10SFS | |
| Dell G5 15 SE 5505 P89F | |
Cinebench R23: Multi Core | Single Core
Cinebench R15: CPU Multi 64Bit | CPU Single 64Bit
Blender: v2.79 BMW27 CPU
7-Zip 18.03: 7z b 4 | 7z b 4 -mmt1
Geekbench 5.5: Multi-Core | Single-Core
HWBOT x265 Benchmark v2.2: 4k Preset
LibreOffice : 20 Documents To PDF
R Benchmark 2.5: Overall mean
* ... kleiner is beter
AIDA64: FP32 Ray-Trace | FPU Julia | CPU SHA3 | CPU Queen | FPU SinJulia | FPU Mandel | CPU AES | CPU ZLib | FP64 Ray-Trace | CPU PhotoWorxx
| Performance rating | |
| Alienware m15 R6, i7-11800H RTX 3080 | |
| MSI GE67 HX 12UGS | |
| Gemiddeld Intel Core i7-12800HX | |
| Asus ROG Strix Scar 15 G533ZW-LN106WS | |
| MSI Raider GE66 12UHS | |
| MSI Vector GP66 12UGS | |
| Razer Blade 15 2022 | |
| AIDA64 / FP32 Ray-Trace | |
| Alienware m15 R6, i7-11800H RTX 3080 | |
| MSI GE67 HX 12UGS | |
| Gemiddeld Intel Core i7-12800HX (n=1) | |
| Asus ROG Strix Scar 15 G533ZW-LN106WS | |
| MSI Raider GE66 12UHS | |
| MSI Vector GP66 12UGS | |
| Razer Blade 15 2022 | |
| AIDA64 / FPU Julia | |
| Alienware m15 R6, i7-11800H RTX 3080 | |
| MSI GE67 HX 12UGS | |
| Gemiddeld Intel Core i7-12800HX (n=1) | |
| Asus ROG Strix Scar 15 G533ZW-LN106WS | |
| MSI Raider GE66 12UHS | |
| MSI Vector GP66 12UGS | |
| Razer Blade 15 2022 | |
| AIDA64 / CPU SHA3 | |
| Alienware m15 R6, i7-11800H RTX 3080 | |
| MSI GE67 HX 12UGS | |
| Gemiddeld Intel Core i7-12800HX (n=1) | |
| Asus ROG Strix Scar 15 G533ZW-LN106WS | |
| MSI Vector GP66 12UGS | |
| MSI Raider GE66 12UHS | |
| Razer Blade 15 2022 | |
| AIDA64 / CPU Queen | |
| MSI Vector GP66 12UGS | |
| MSI Raider GE66 12UHS | |
| Asus ROG Strix Scar 15 G533ZW-LN106WS | |
| Razer Blade 15 2022 | |
| Alienware m15 R6, i7-11800H RTX 3080 | |
| MSI GE67 HX 12UGS | |
| Gemiddeld Intel Core i7-12800HX (n=1) | |
| AIDA64 / FPU SinJulia | |
| MSI GE67 HX 12UGS | |
| Gemiddeld Intel Core i7-12800HX (n=1) | |
| Asus ROG Strix Scar 15 G533ZW-LN106WS | |
| Alienware m15 R6, i7-11800H RTX 3080 | |
| MSI Vector GP66 12UGS | |
| MSI Raider GE66 12UHS | |
| Razer Blade 15 2022 | |
| AIDA64 / FPU Mandel | |
| Alienware m15 R6, i7-11800H RTX 3080 | |
| MSI GE67 HX 12UGS | |
| Gemiddeld Intel Core i7-12800HX (n=1) | |
| Asus ROG Strix Scar 15 G533ZW-LN106WS | |
| MSI Raider GE66 12UHS | |
| MSI Vector GP66 12UGS | |
| Razer Blade 15 2022 | |
| AIDA64 / CPU AES | |
| Alienware m15 R6, i7-11800H RTX 3080 | |
| MSI GE67 HX 12UGS | |
| Gemiddeld Intel Core i7-12800HX (n=1) | |
| Asus ROG Strix Scar 15 G533ZW-LN106WS | |
| MSI Vector GP66 12UGS | |
| MSI Raider GE66 12UHS | |
| Razer Blade 15 2022 | |
| AIDA64 / CPU ZLib | |
| MSI GE67 HX 12UGS | |
| Gemiddeld Intel Core i7-12800HX (n=1) | |
| Asus ROG Strix Scar 15 G533ZW-LN106WS | |
| MSI Vector GP66 12UGS | |
| MSI Raider GE66 12UHS | |
| Razer Blade 15 2022 | |
| Alienware m15 R6, i7-11800H RTX 3080 | |
| AIDA64 / FP64 Ray-Trace | |
| Alienware m15 R6, i7-11800H RTX 3080 | |
| MSI GE67 HX 12UGS | |
| Gemiddeld Intel Core i7-12800HX (n=1) | |
| Asus ROG Strix Scar 15 G533ZW-LN106WS | |
| MSI Raider GE66 12UHS | |
| MSI Vector GP66 12UGS | |
| Razer Blade 15 2022 | |
| AIDA64 / CPU PhotoWorxx | |
| Razer Blade 15 2022 | |
| MSI Raider GE66 12UHS | |
| Asus ROG Strix Scar 15 G533ZW-LN106WS | |
| MSI GE67 HX 12UGS | |
| Gemiddeld Intel Core i7-12800HX (n=1) | |
| MSI Vector GP66 12UGS | |
| Alienware m15 R6, i7-11800H RTX 3080 | |
Systeemprestaties
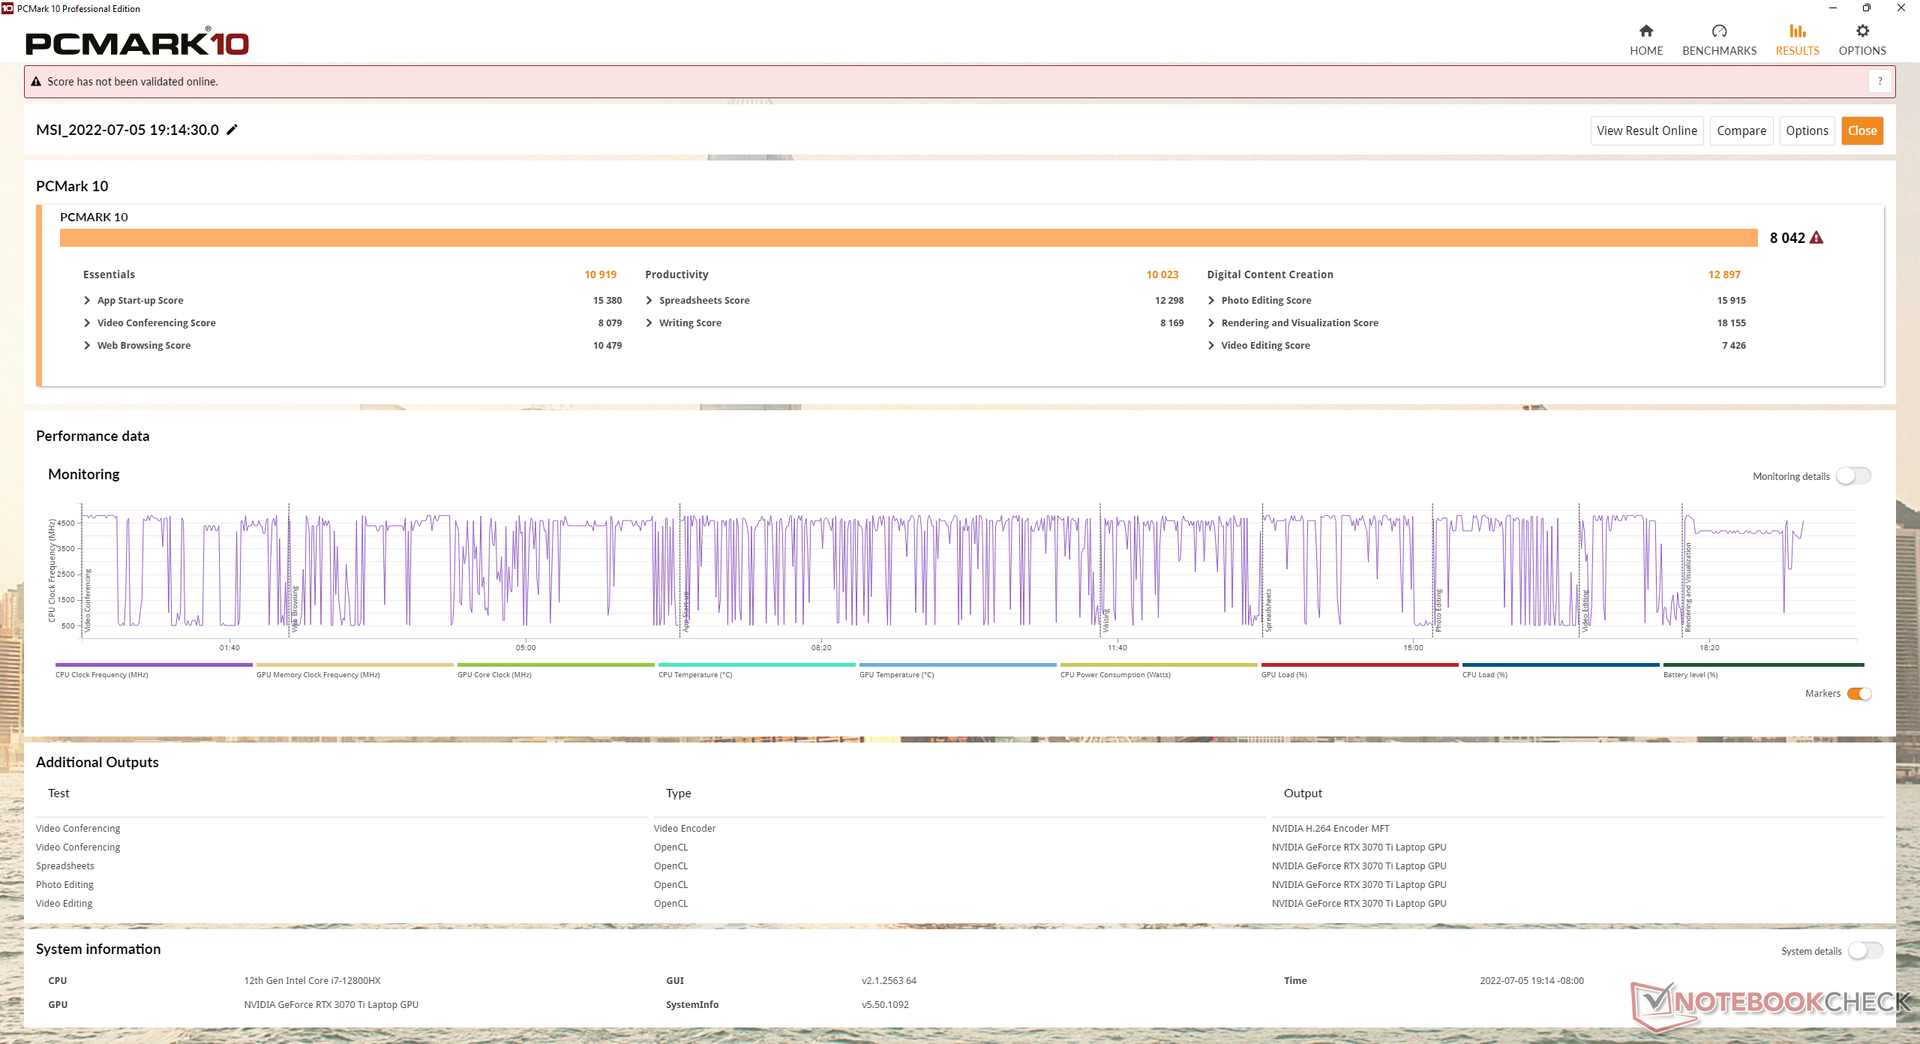
PCMark 10 resultaten behoren tot de hoogste in onze database met scores die vergelijkbaar zijn met wat we waarnamen op de oudere GE66 die draaide op de langzamere Core i9-12900HK maar snellere GeForce RTX 3080 Ti.
Interessant is dat de Digital Content Creation subscore daalt van 12897 punten naar slechts 9568 punten in MSHybrid modus.
CrossMark: Overall | Productivity | Creativity | Responsiveness
| PCMark 10 / Score | |
| MSI Raider GE66 12UHS | |
| MSI GE67 HX 12UGS | |
| Gemiddeld Intel Core i7-12800HX, NVIDIA GeForce RTX 3070 Ti Laptop GPU (n=1) | |
| MSI Vector GP66 12UGS | |
| Asus ROG Strix Scar 15 G533ZW-LN106WS | |
| Razer Blade 15 2022 | |
| Alienware m15 R6, i7-11800H RTX 3080 | |
| PCMark 10 / Essentials | |
| MSI Raider GE66 12UHS | |
| MSI Vector GP66 12UGS | |
| MSI GE67 HX 12UGS | |
| Gemiddeld Intel Core i7-12800HX, NVIDIA GeForce RTX 3070 Ti Laptop GPU (n=1) | |
| Razer Blade 15 2022 | |
| Asus ROG Strix Scar 15 G533ZW-LN106WS | |
| Alienware m15 R6, i7-11800H RTX 3080 | |
| PCMark 10 / Productivity | |
| Asus ROG Strix Scar 15 G533ZW-LN106WS | |
| MSI Raider GE66 12UHS | |
| MSI Vector GP66 12UGS | |
| MSI GE67 HX 12UGS | |
| Gemiddeld Intel Core i7-12800HX, NVIDIA GeForce RTX 3070 Ti Laptop GPU (n=1) | |
| Razer Blade 15 2022 | |
| Alienware m15 R6, i7-11800H RTX 3080 | |
| PCMark 10 / Digital Content Creation | |
| MSI GE67 HX 12UGS | |
| Gemiddeld Intel Core i7-12800HX, NVIDIA GeForce RTX 3070 Ti Laptop GPU (n=1) | |
| MSI Raider GE66 12UHS | |
| MSI Vector GP66 12UGS | |
| Razer Blade 15 2022 | |
| Asus ROG Strix Scar 15 G533ZW-LN106WS | |
| Alienware m15 R6, i7-11800H RTX 3080 | |
| CrossMark / Overall | |
| Asus ROG Strix Scar 15 G533ZW-LN106WS | |
| MSI GE67 HX 12UGS | |
| Gemiddeld Intel Core i7-12800HX, NVIDIA GeForce RTX 3070 Ti Laptop GPU (n=1) | |
| CrossMark / Productivity | |
| Asus ROG Strix Scar 15 G533ZW-LN106WS | |
| MSI GE67 HX 12UGS | |
| Gemiddeld Intel Core i7-12800HX, NVIDIA GeForce RTX 3070 Ti Laptop GPU (n=1) | |
| CrossMark / Creativity | |
| Asus ROG Strix Scar 15 G533ZW-LN106WS | |
| MSI GE67 HX 12UGS | |
| Gemiddeld Intel Core i7-12800HX, NVIDIA GeForce RTX 3070 Ti Laptop GPU (n=1) | |
| CrossMark / Responsiveness | |
| Asus ROG Strix Scar 15 G533ZW-LN106WS | |
| MSI GE67 HX 12UGS | |
| Gemiddeld Intel Core i7-12800HX, NVIDIA GeForce RTX 3070 Ti Laptop GPU (n=1) | |
| PCMark 10 Score | 8042 punten | |
Help | ||
| AIDA64 / Memory Copy | |
| MSI Raider GE66 12UHS | |
| Razer Blade 15 2022 | |
| Asus ROG Strix Scar 15 G533ZW-LN106WS | |
| MSI GE67 HX 12UGS | |
| Gemiddeld Intel Core i7-12800HX (n=1) | |
| MSI Vector GP66 12UGS | |
| Alienware m15 R6, i7-11800H RTX 3080 | |
| AIDA64 / Memory Read | |
| MSI Raider GE66 12UHS | |
| Razer Blade 15 2022 | |
| Asus ROG Strix Scar 15 G533ZW-LN106WS | |
| MSI GE67 HX 12UGS | |
| Gemiddeld Intel Core i7-12800HX (n=1) | |
| Alienware m15 R6, i7-11800H RTX 3080 | |
| MSI Vector GP66 12UGS | |
| AIDA64 / Memory Write | |
| Razer Blade 15 2022 | |
| MSI Raider GE66 12UHS | |
| Asus ROG Strix Scar 15 G533ZW-LN106WS | |
| MSI GE67 HX 12UGS | |
| Gemiddeld Intel Core i7-12800HX (n=1) | |
| MSI Vector GP66 12UGS | |
| Alienware m15 R6, i7-11800H RTX 3080 | |
| AIDA64 / Memory Latency | |
| Asus ROG Strix Scar 15 G533ZW-LN106WS | |
| Alienware m15 R6, i7-11800H RTX 3080 | |
| MSI GE67 HX 12UGS | |
| Gemiddeld Intel Core i7-12800HX (n=1) | |
| MSI Raider GE66 12UHS | |
| MSI Vector GP66 12UGS | |
| Razer Blade 15 2022 | |
* ... kleiner is beter
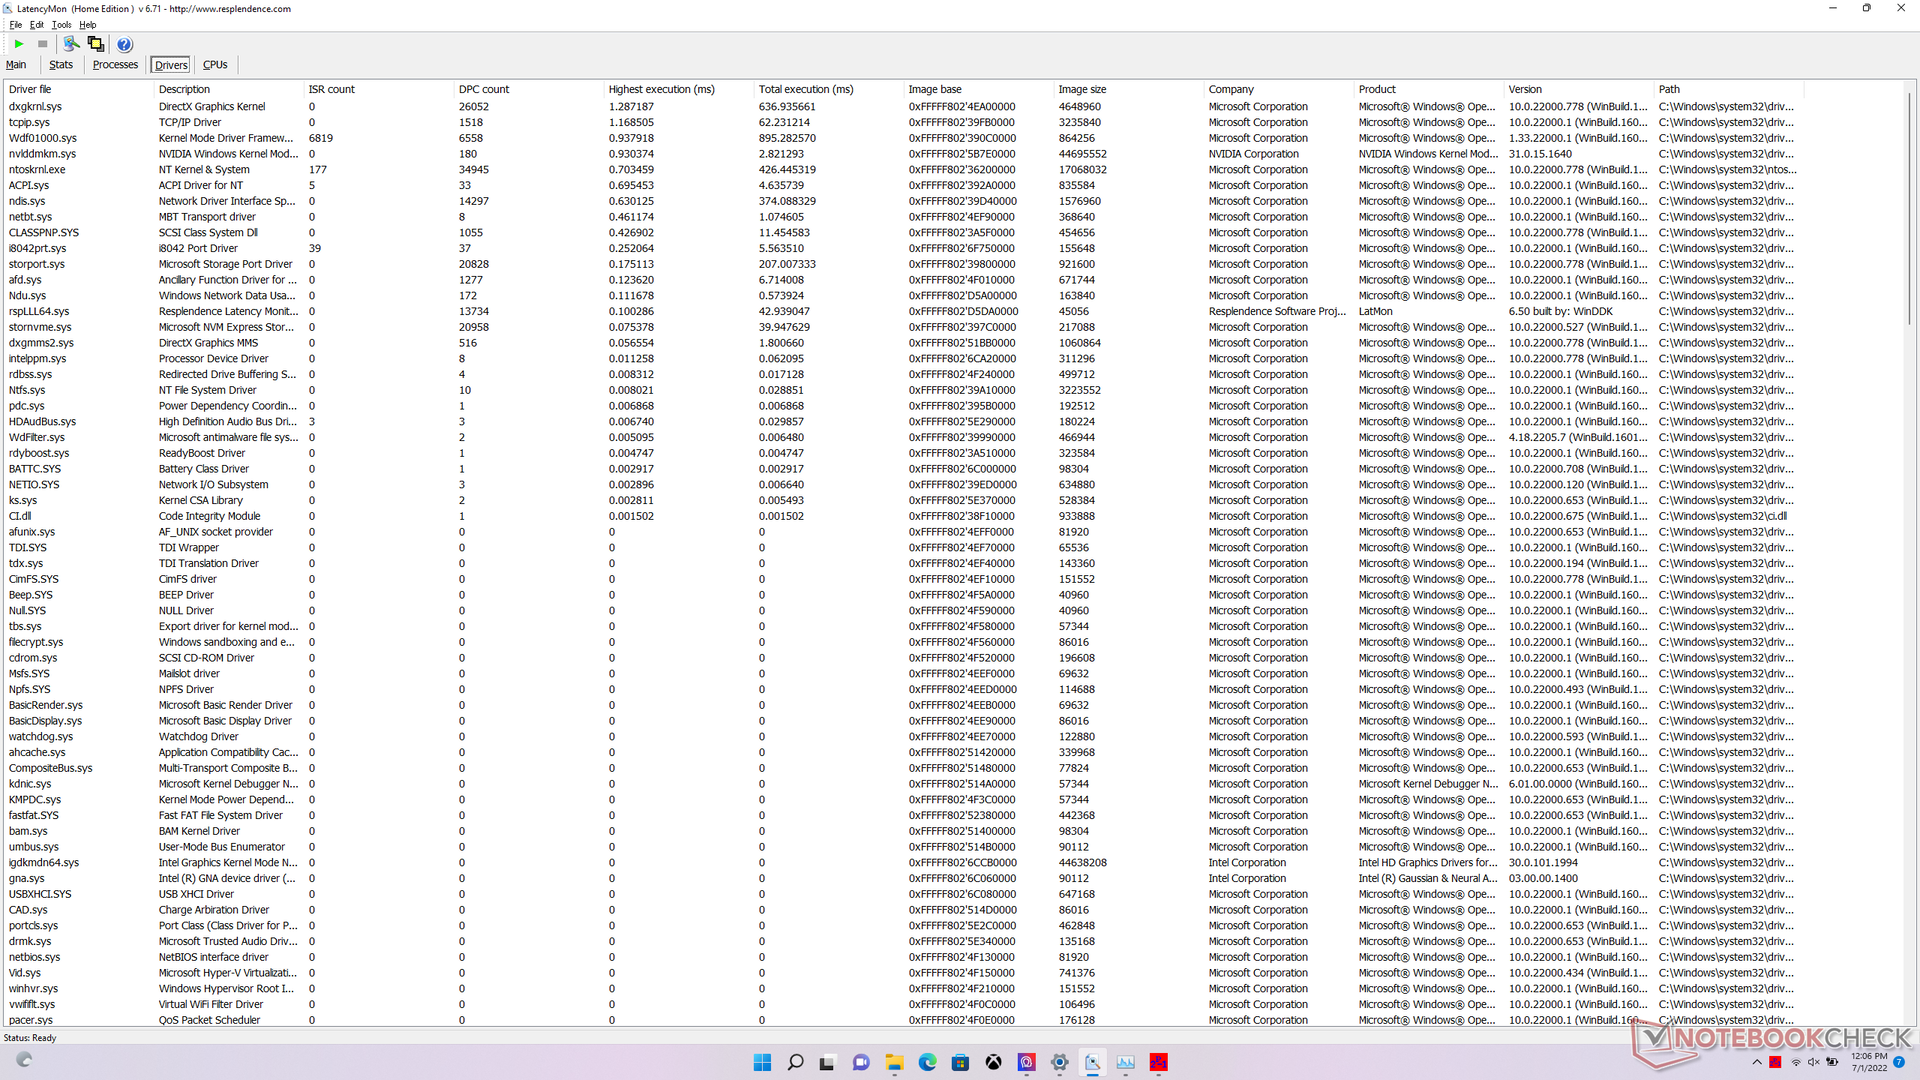
DPC latentie
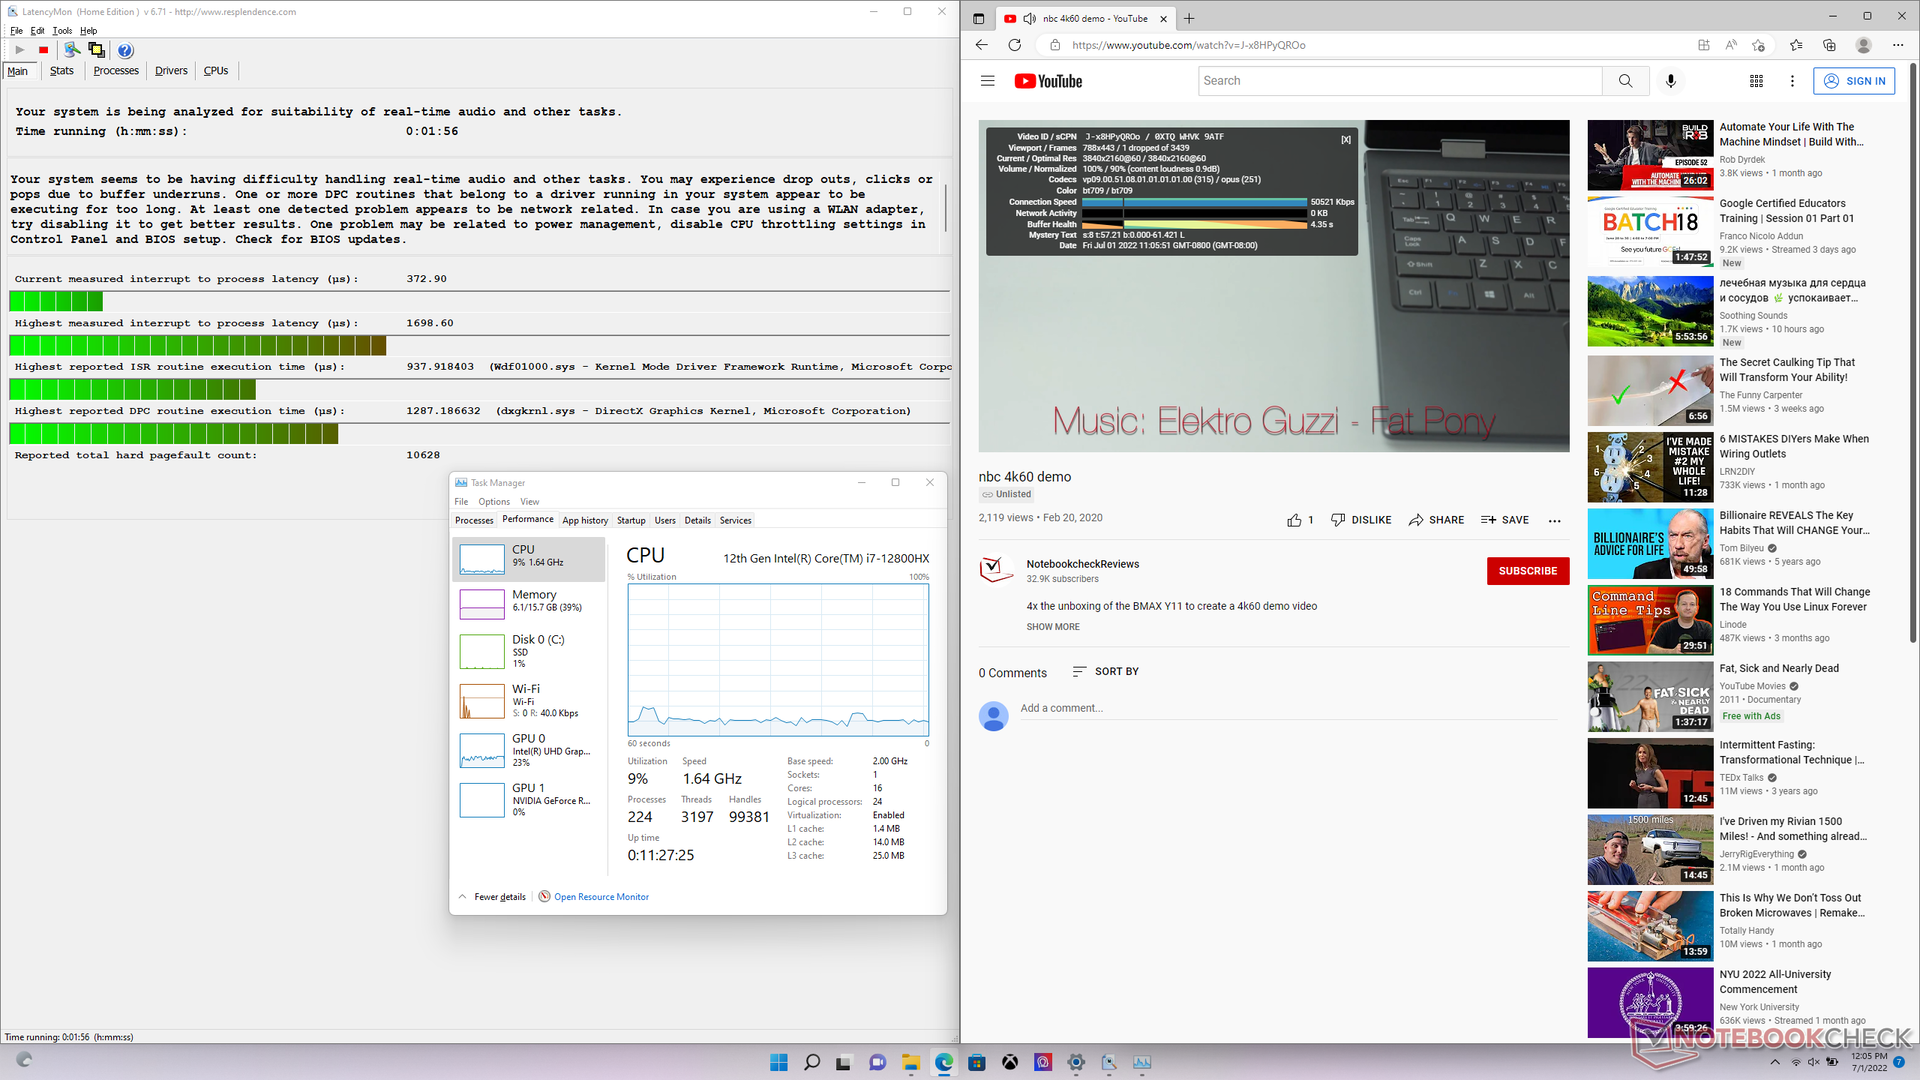
LatencyMon onthult kleine DPC-problemen bij het openen van meerdere browsertabbladen op onze startpagina. het afspelen van 4K-video's met 60 FPS verloopt verder vloeiend, met slechts één uitgevallen frame tijdens onze videotest van 60 seconden.
| DPC Latencies / LatencyMon - interrupt to process latency (max), Web, Youtube, Prime95 | |
| MSI Raider GE66 12UHS | |
| MSI Vector GP66 12UGS | |
| MSI GE67 HX 12UGS | |
| Razer Blade 15 2022 | |
| Alienware m15 R6, i7-11800H RTX 3080 | |
| Asus ROG Strix Scar 15 G533ZW-LN106WS | |
* ... kleiner is beter
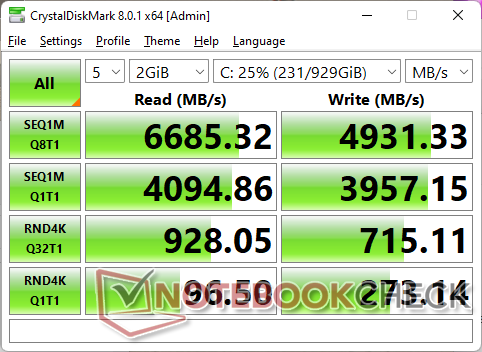
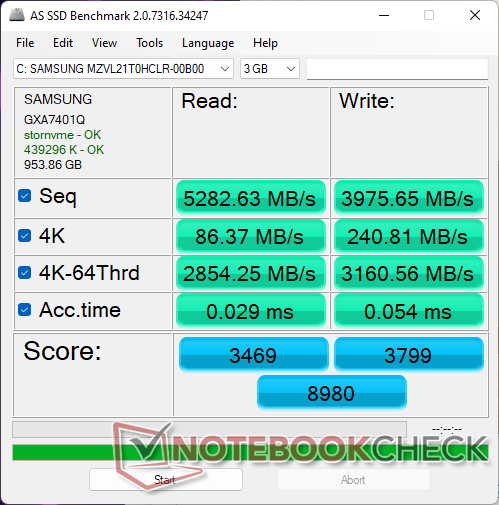
Opslagapparatuur - PCIe4 x4 standaard
Onze unit wordt geleverd met een 1 TBSamsung PM9A1 PCIe4 x4 NVMe SSD voor sequentiële lees- en schrijfsnelheden tot respectievelijk 7000 MB/s en 5100 MB/s. Helaas had onze schijf problemen om de maximale leessnelheid voor langere perioden vast te houden, zoals blijkt uit onze DiskSpd loop test hieronder. De leessnelheden daalden uiteindelijk tot wel 1500 MB/s, waarschijnlijk als gevolg van temperatuurbeperkingen en het ontbreken van een goede warmteverspreider over de SSD.

* ... kleiner is beter
Disk Throttling: DiskSpd Read Loop, Queue Depth 8
GPU-prestaties - 150 W met 25 W Dynamic Boost
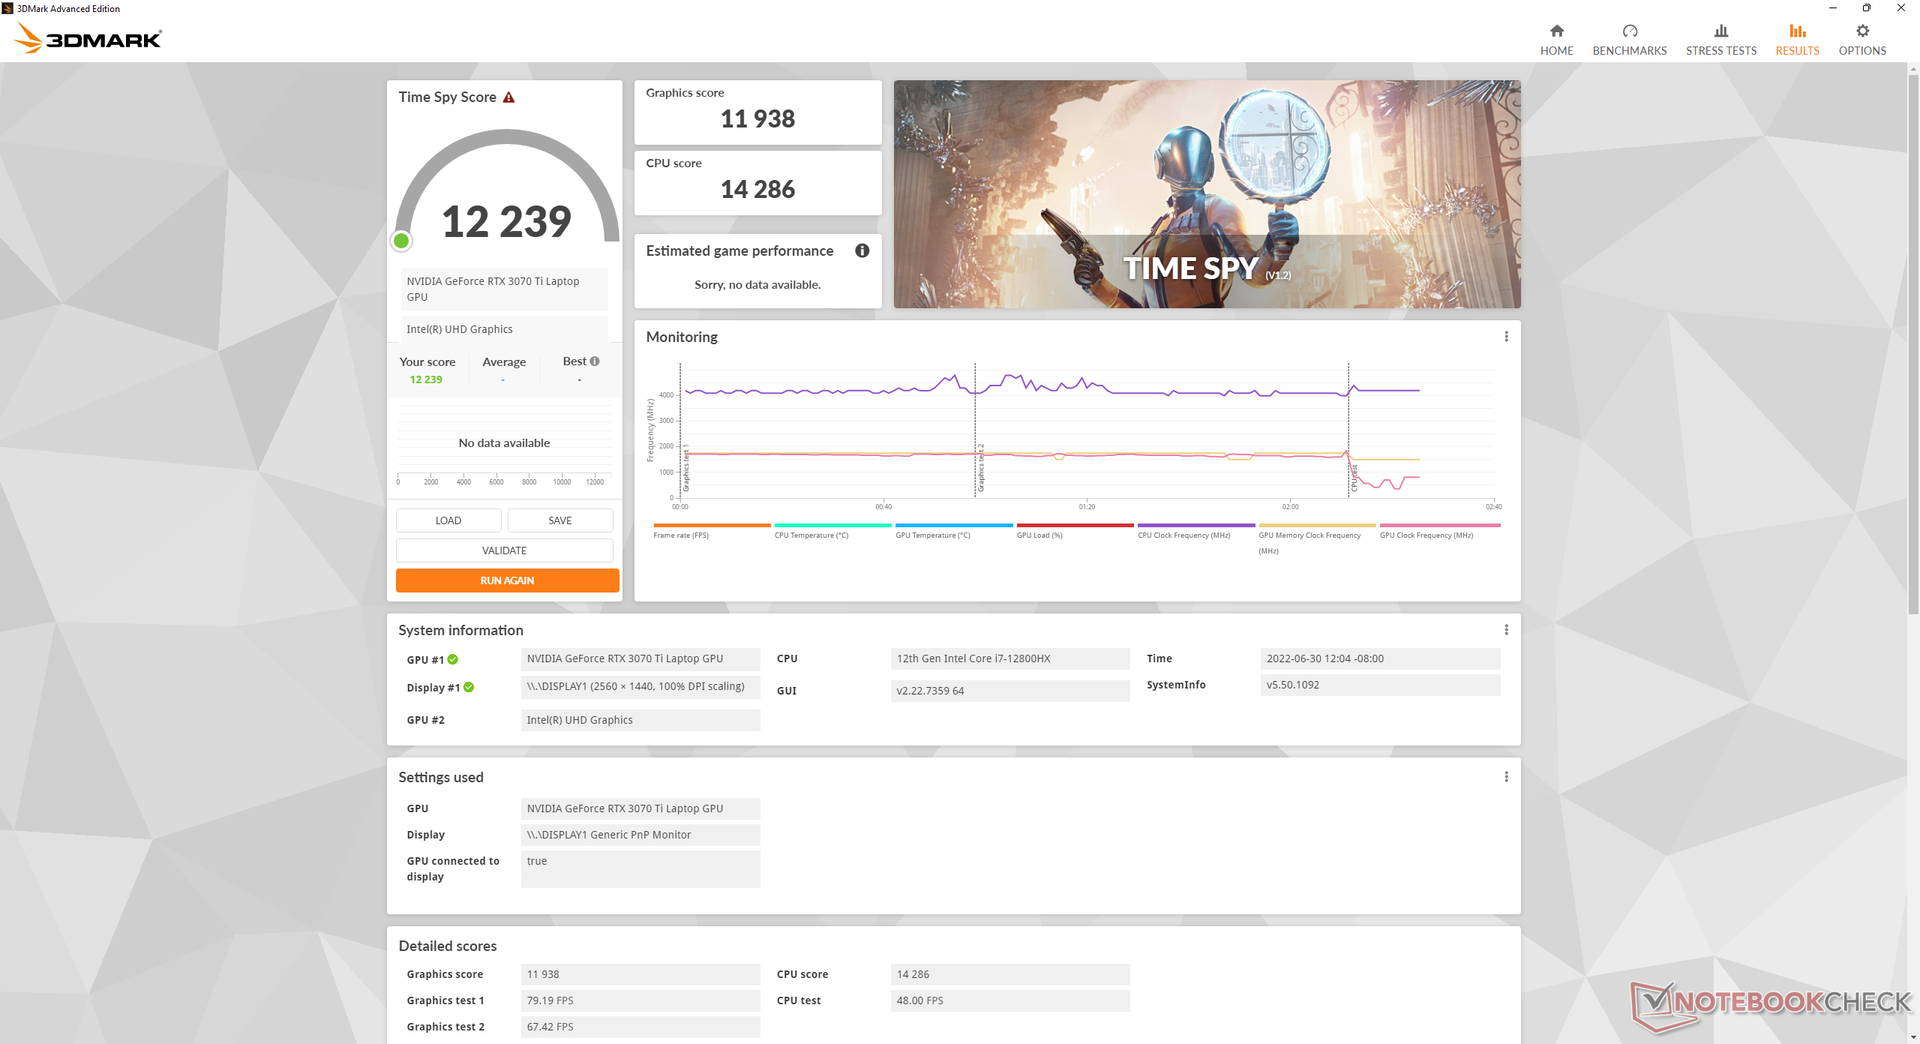
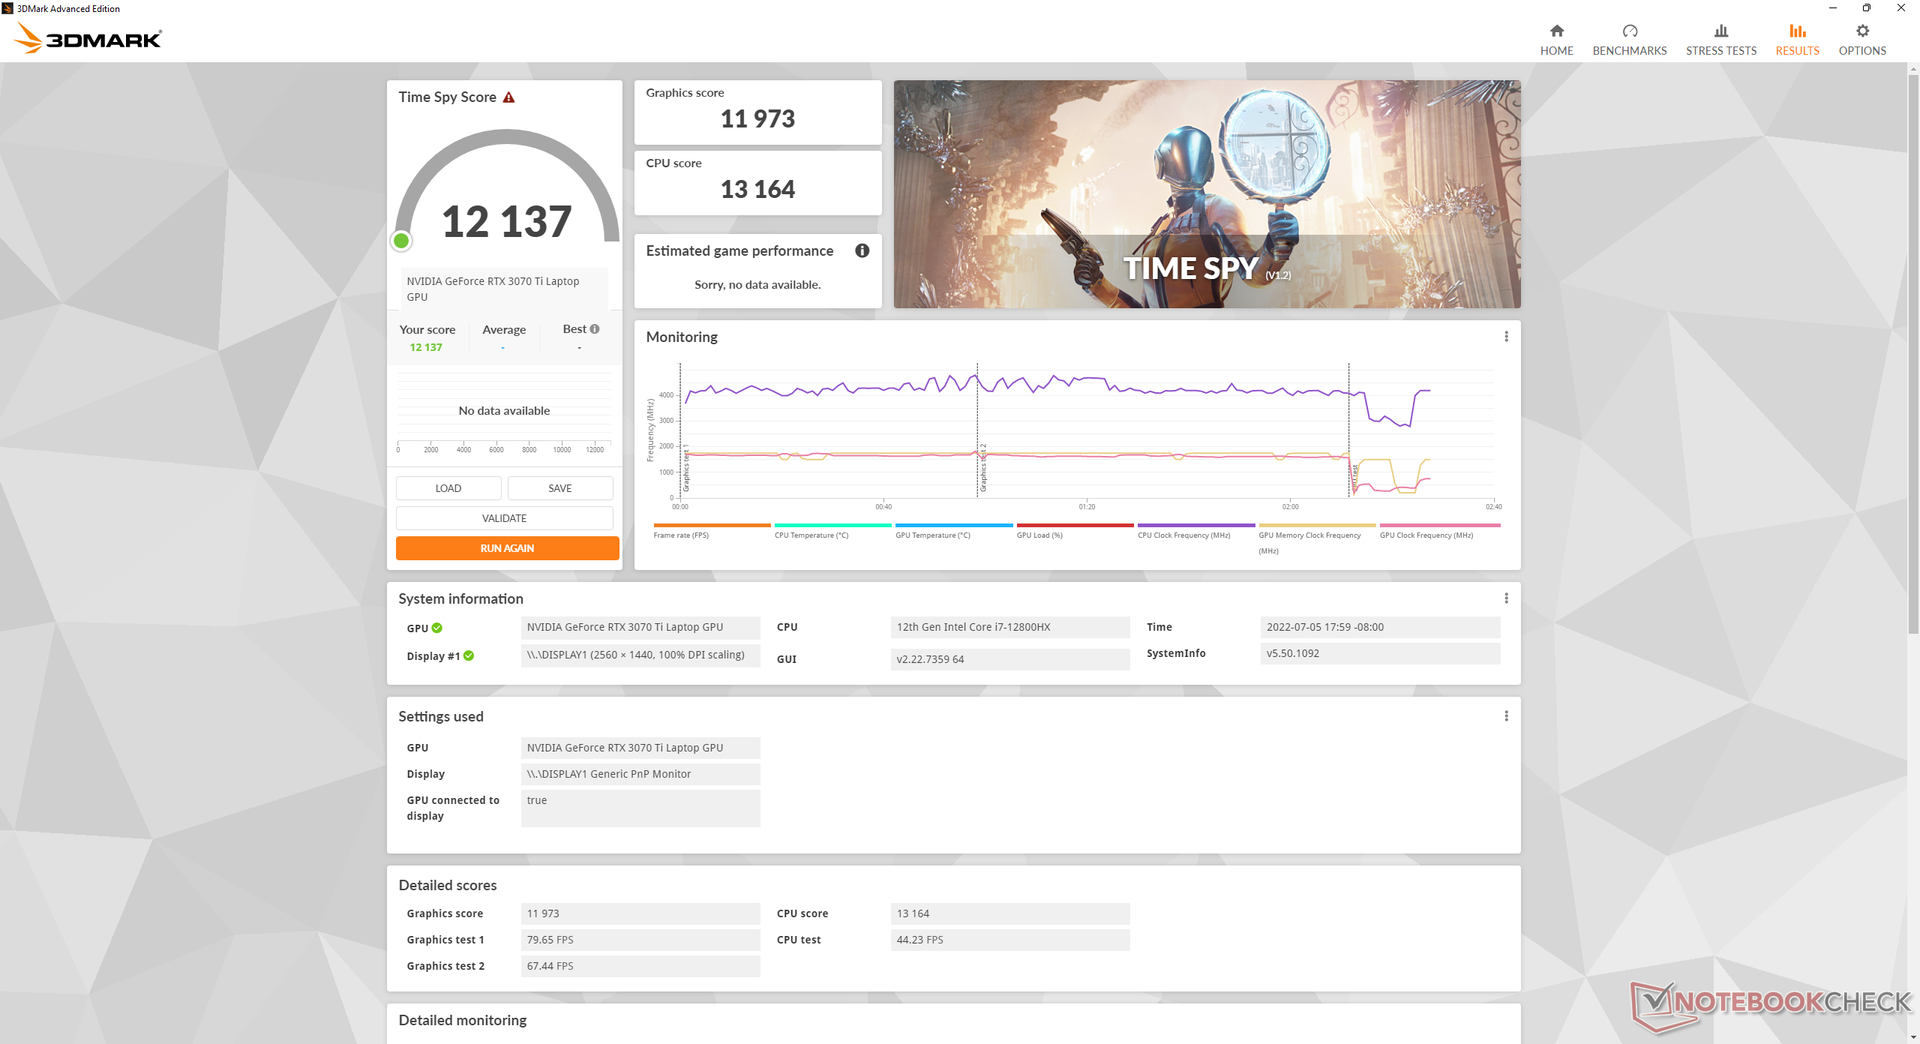
de 3DMark-resultaten zijn ongeveer 12 procent hoger dan de gemiddelde laptop in onze database die is uitgerust met dezelfde mobiele GeForce RTX 3070 Ti GPU. De hoger dan verwachte cijfers kunnen worden toegeschreven aan het hoge 150 W TGP-doel en snelle DDR5 RAM, terwijl de meerderheid van gaminglaptops nog steeds draait op GPU's van 130 W of lager en/of langzamer DDR4 RAM. De verschillen zijn genoeg om onze mobiele GTX 3070 Ti vergelijkbaar te laten presteren met de mobiele RTX 3080 Ti die draait op de oudere Q1 2022 GE66.
Voor gamingdoeleinden zou de Nvidia GPU bijna identiek presteren tussen MSHybrid en discrete modi.
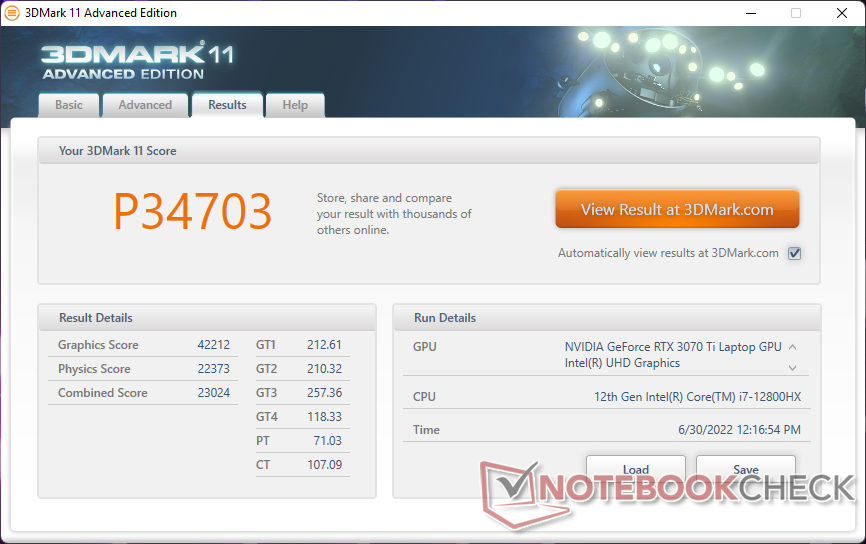
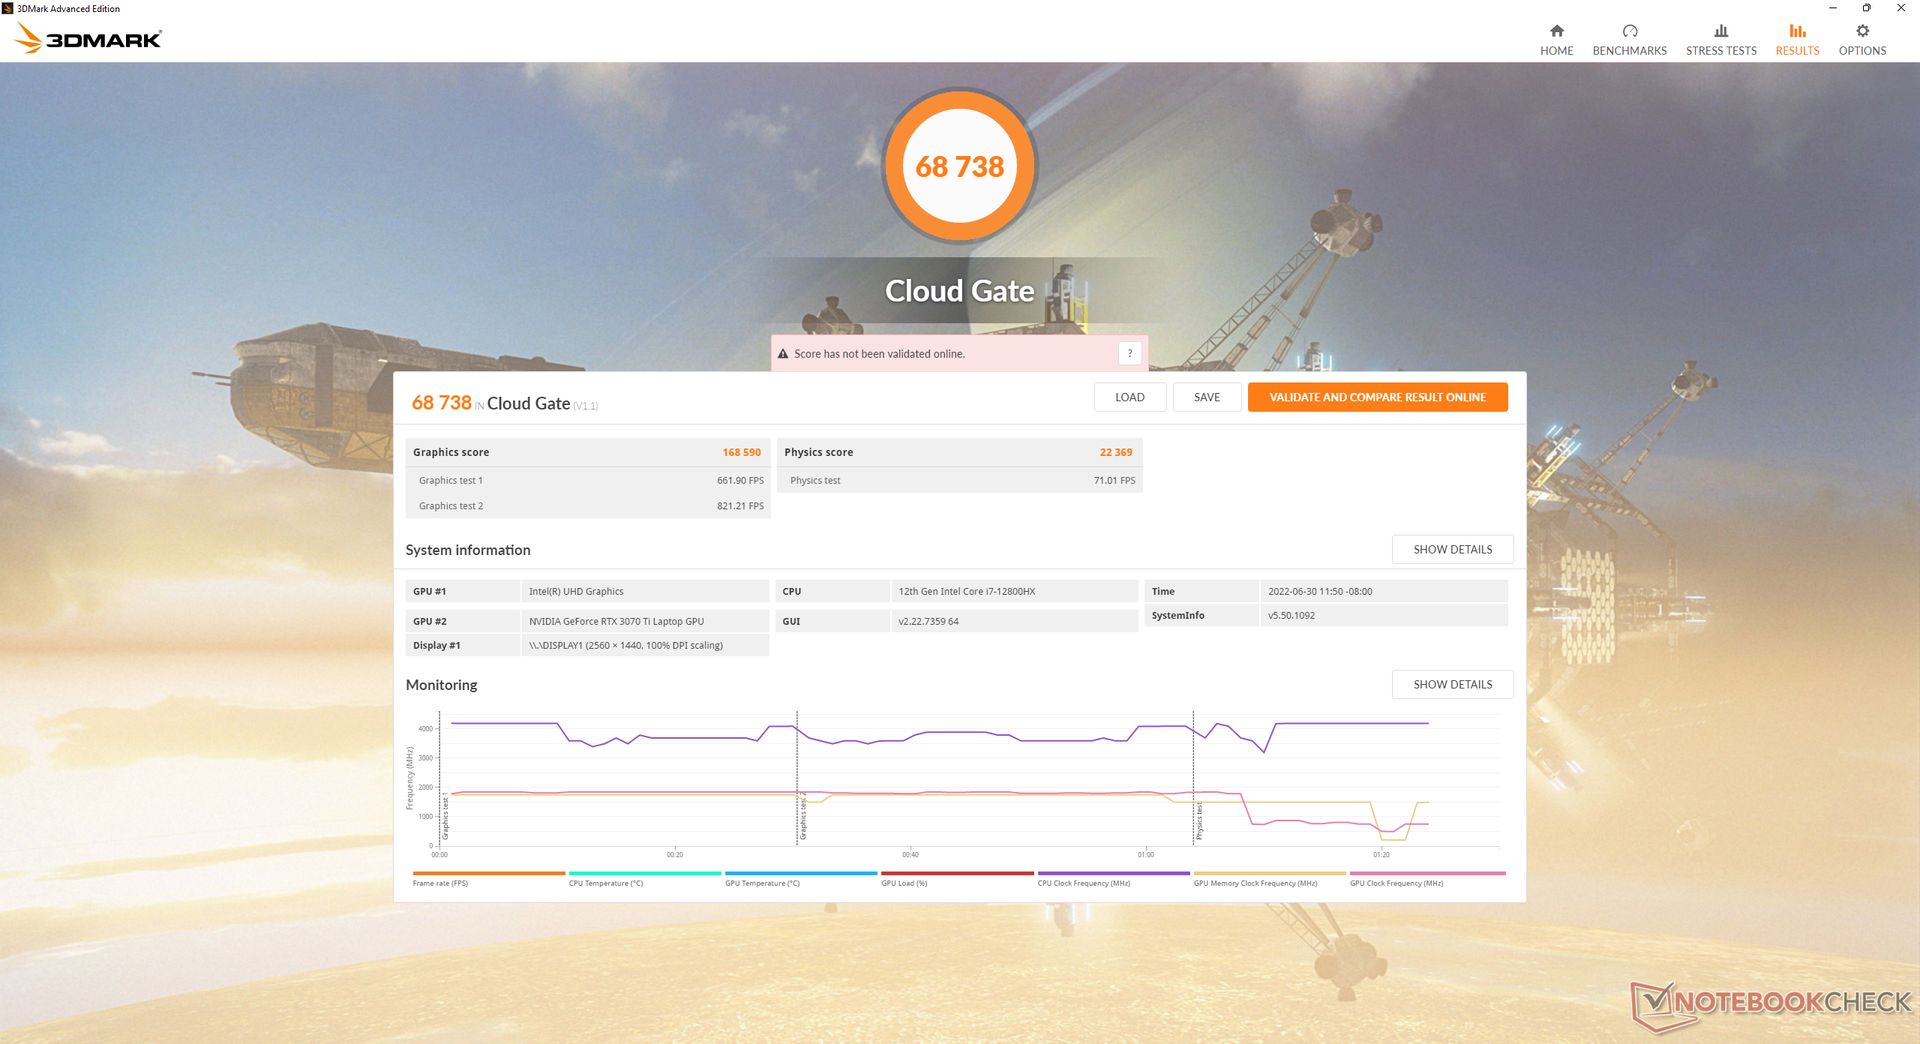
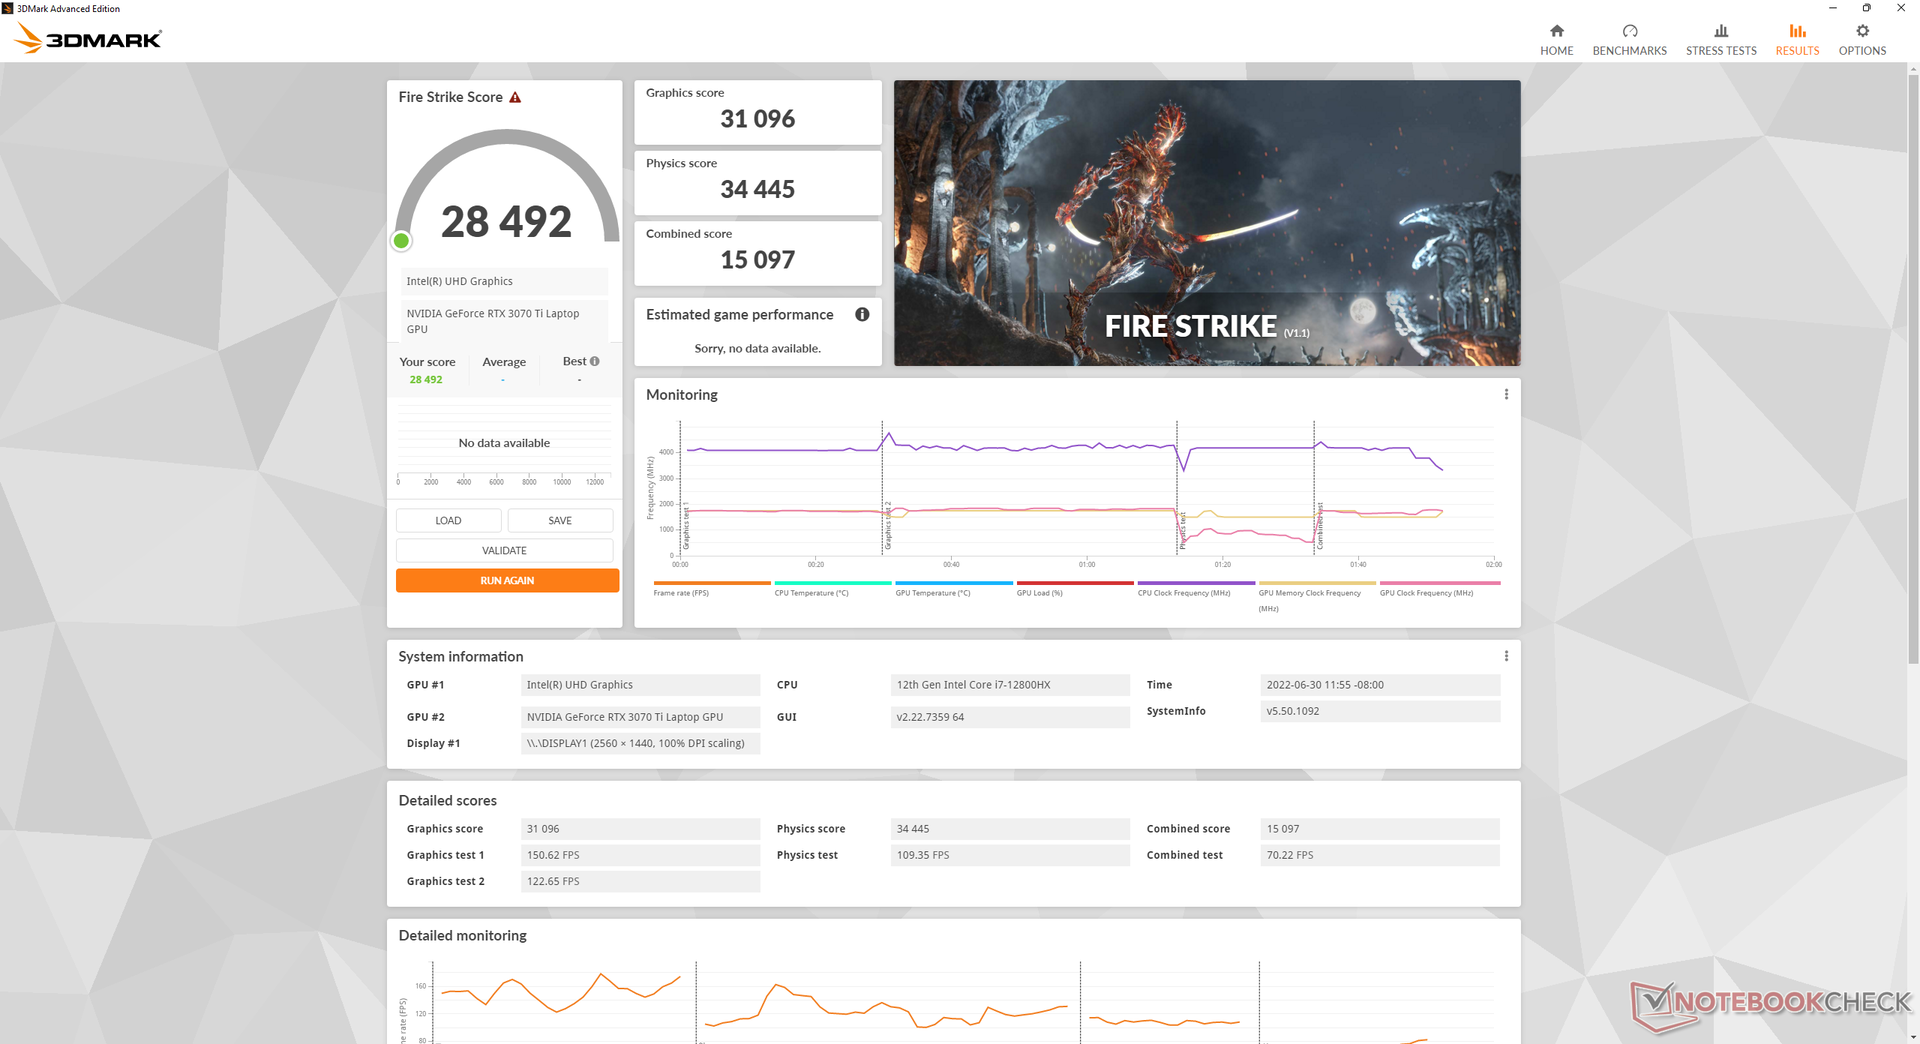
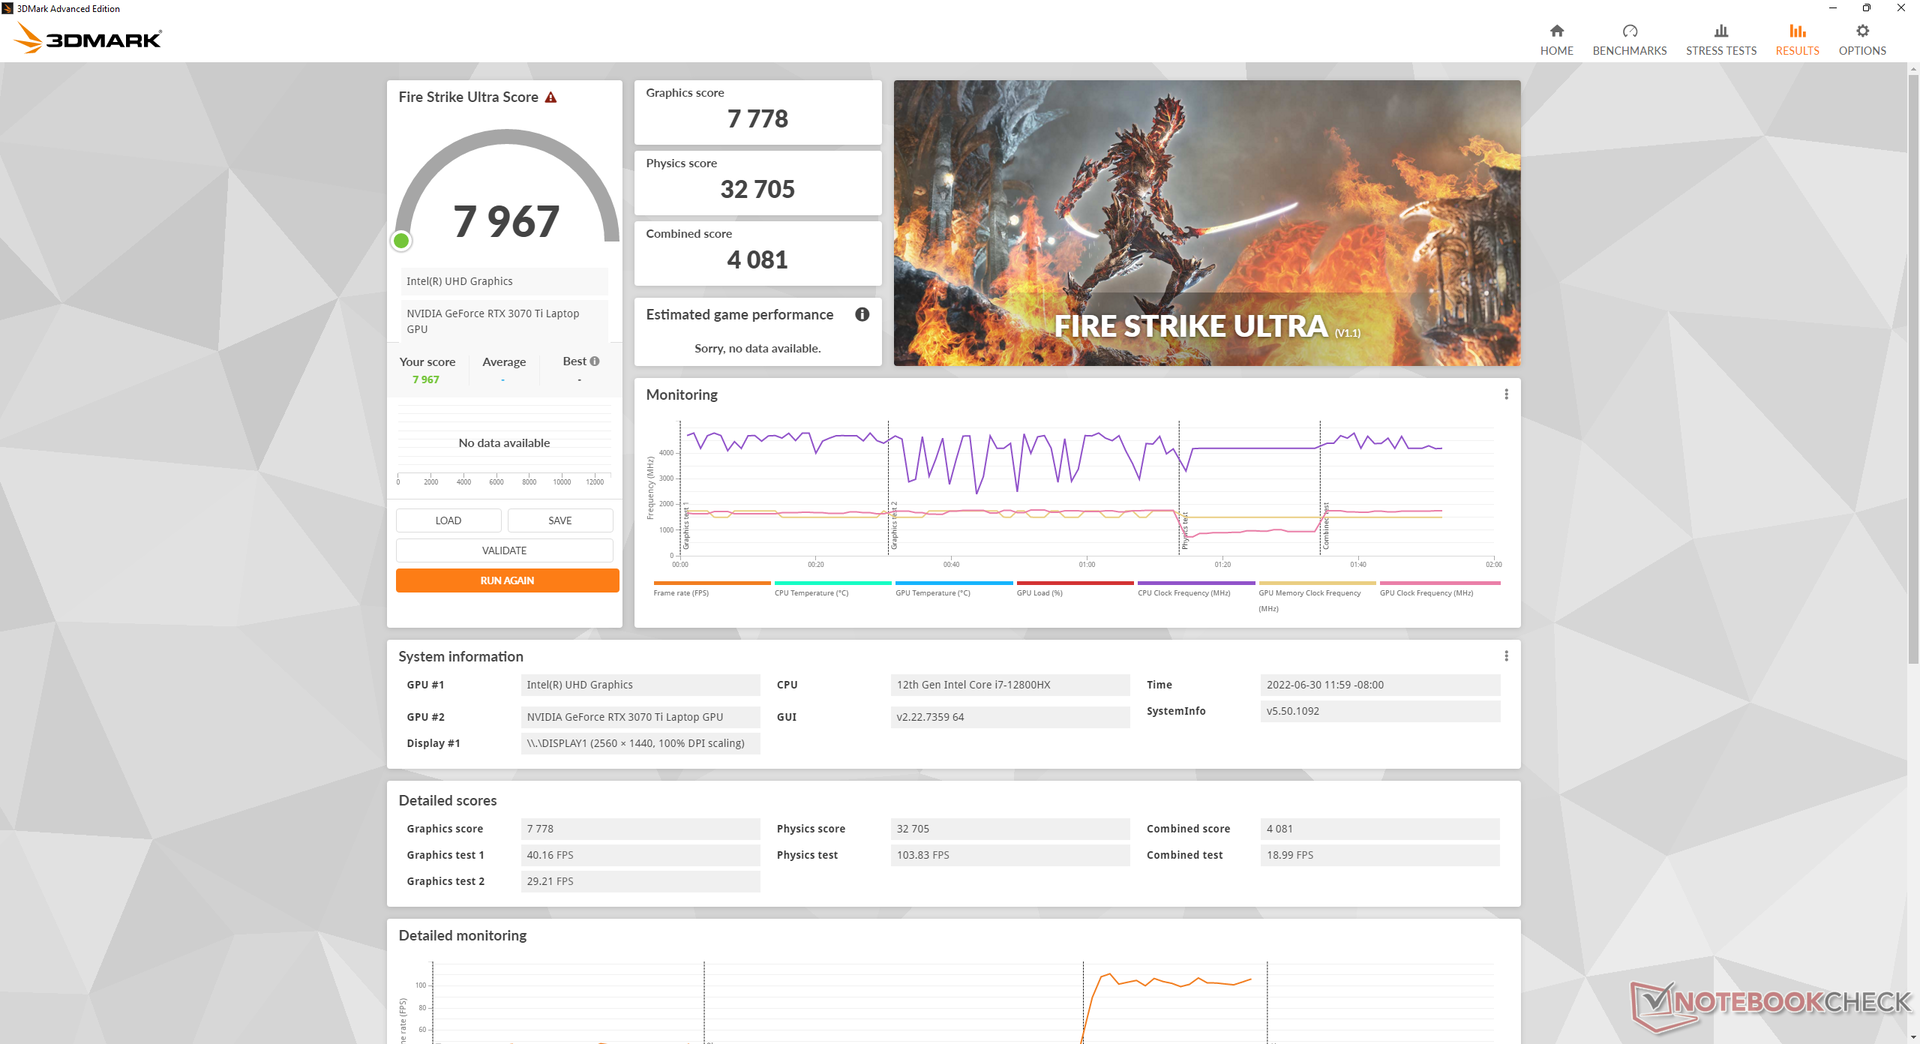
| 3DMark 11 Performance | 34703 punten | |
| 3DMark Cloud Gate Standard Score | 68738 punten | |
| 3DMark Fire Strike Score | 28492 punten | |
| 3DMark Time Spy Score | 12239 punten | |
Help | ||
Witcher 3 FPS Chart
| lage | gem. | hoge | ultra | QHD | 4K | |
|---|---|---|---|---|---|---|
| GTA V (2015) | 186.8 | 184.7 | 178.1 | 122 | 108.7 | |
| The Witcher 3 (2015) | 426.4 | 329 | 223.3 | 112.7 | ||
| Dota 2 Reborn (2015) | 181.2 | 165.6 | 155.3 | 147.7 | 148.9 | |
| Final Fantasy XV Benchmark (2018) | 201 | 162.6 | 122.4 | 93 | ||
| X-Plane 11.11 (2018) | 145.5 | 133.4 | 105.9 | |||
| Strange Brigade (2018) | 453 | 288 | 235 | 207 | 154.1 | |
| Cyberpunk 2077 1.6 (2022) | 141.2 | 133.2 | 106 | 88.1 | 56.4 |
Emissies
Systeemgeluid
Ventilator geluid is afhankelijk van de vijf vooringestelde stroom profielen zoals genoemd in de Test Condities hierboven. Wanneer het apparaat stationair draait op een desktop zonder draaiende applicaties, blijft het stil met 22.9 dB(A), zelfs wanneer het is ingesteld op het Extreme Performance profiel. Kleine vereisten zoals web browsing of video streaming zullen echter een ventilatorgeluid veroorzaken in het hoorbare 30 tot 34 dB(A) bereik, ongeacht de profielinstelling. Het uitvoeren van de eerste benchmark scene van 3DMark 06 op Balanced mode zou een ventilatorgeluid van 44 dB(A) veroorzaken om vergelijkbaar te zijn met wat we registreerden op de GE66 of Razer Blade 15.
Als Witcher 3 wordt uitgevoerd in de Balanced-modus en Extreme Performance-modus, resulteert dit in een ventilatorgeluid van respectievelijk 49,8 dB(A) en 55,7 dB(A). Wij beschouwen alles in het bereik van 50 dB(A) als zeer luid, tot het punt waarop een koptelefoon wordt aanbevolen tijdens het gamen. Desalniettemin is dit bereik helaas gebruikelijk op veel enthousiaste gaming laptops, waaronder de Vector GP66, Asus ROG Strix Scar 15, of Alienware m15 R6. Als Cooler Boost (d.w.z. maximale ventilatorgeluidsmodus) actief is, zal het ventilatorgeluid nog hoger zijn met 57,4 dB(A). Gebruikers zullen moeten gamen op Extreme Performance mode op de GE67 om TGP te maximaliseren, zoals onze Stress Test sectie hieronder zal laten zien. De GE66 was niet zo luid onder vergelijkbare omstandigheden.
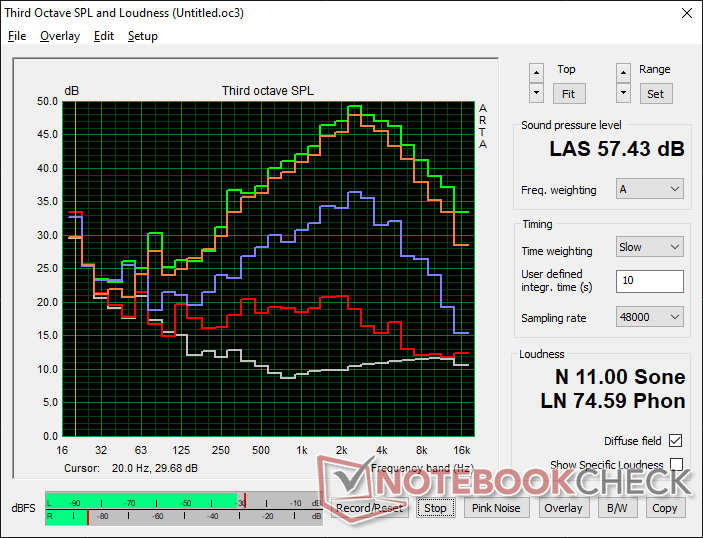
Geluidsniveau
| Onbelast |
| 22.9 / 22.9 / 22.9 dB (A) |
| Belasting |
| 44.4 / 57.4 dB (A) |
 | ||
30 dB stil 40 dB(A) hoorbaar 50 dB(A) luid |
||
min: | ||
| MSI GE67 HX 12UGS GeForce RTX 3070 Ti Laptop GPU, i7-12800HX, Samsung PM9A1 MZVL21T0HCLR | MSI Raider GE66 12UHS GeForce RTX 3080 Ti Laptop GPU, i9-12900HK, Samsung PM9A1 MZVL22T0HBLB | MSI Vector GP66 12UGS GeForce RTX 3070 Ti Laptop GPU, i9-12900H | Asus ROG Strix Scar 15 G533ZW-LN106WS GeForce RTX 3070 Ti Laptop GPU, i9-12900H, Samsung PM9A1 MZVL22T0HBLB | Alienware m15 R6, i7-11800H RTX 3080 GeForce RTX 3080 Laptop GPU, i7-11800H, Samsung PM9A1 MZVL21T0HCLR | Razer Blade 15 2022 GeForce RTX 3080 Ti Laptop GPU, i7-12800H, SSSTC CA6-8D1024 | |
|---|---|---|---|---|---|---|
| Noise | -14% | -2% | -36% | -2% | -5% | |
| uit / omgeving * (dB) | 22.7 | 26 -15% | 22.9 -1% | 26.86 -18% | 23 -1% | 25.4 -12% |
| Idle Minimum * (dB) | 22.9 | 27 -18% | 23.4 -2% | 39.07 -71% | 23 -0% | 26.2 -14% |
| Idle Average * (dB) | 22.9 | 30 -31% | 23.4 -2% | 39.07 -71% | 23 -0% | 26.2 -14% |
| Idle Maximum * (dB) | 22.9 | 39 -70% | 27.4 -20% | 39.07 -71% | 30 -31% | 28.4 -24% |
| Load Average * (dB) | 44.4 | 45 -1% | 36 19% | 53.34 -20% | 41.26 7% | 44.7 -1% |
| Witcher 3 ultra * (dB) | 55.7 | 45 19% | 58.2 -4% | 56.6 -2% | 53.4 4% | 44.7 20% |
| Load Maximum * (dB) | 57.4 | 47 18% | 58 -1% | 56.6 1% | 53.37 7% | 51.9 10% |
* ... kleiner is beter
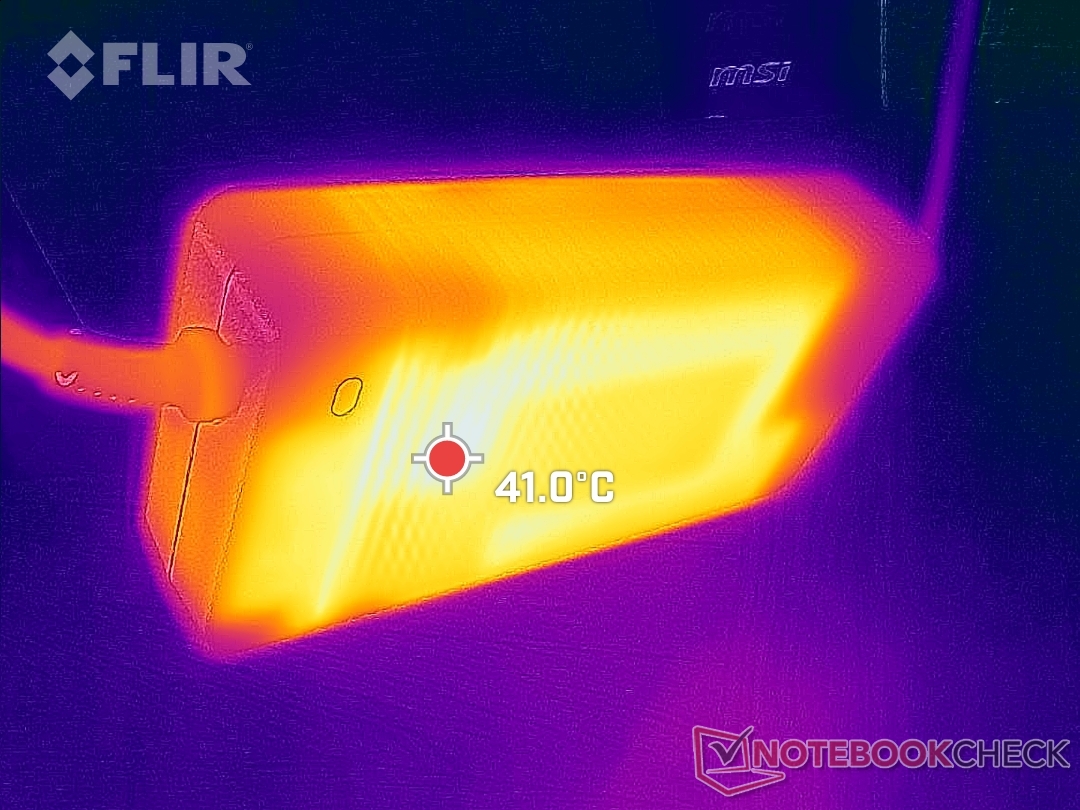
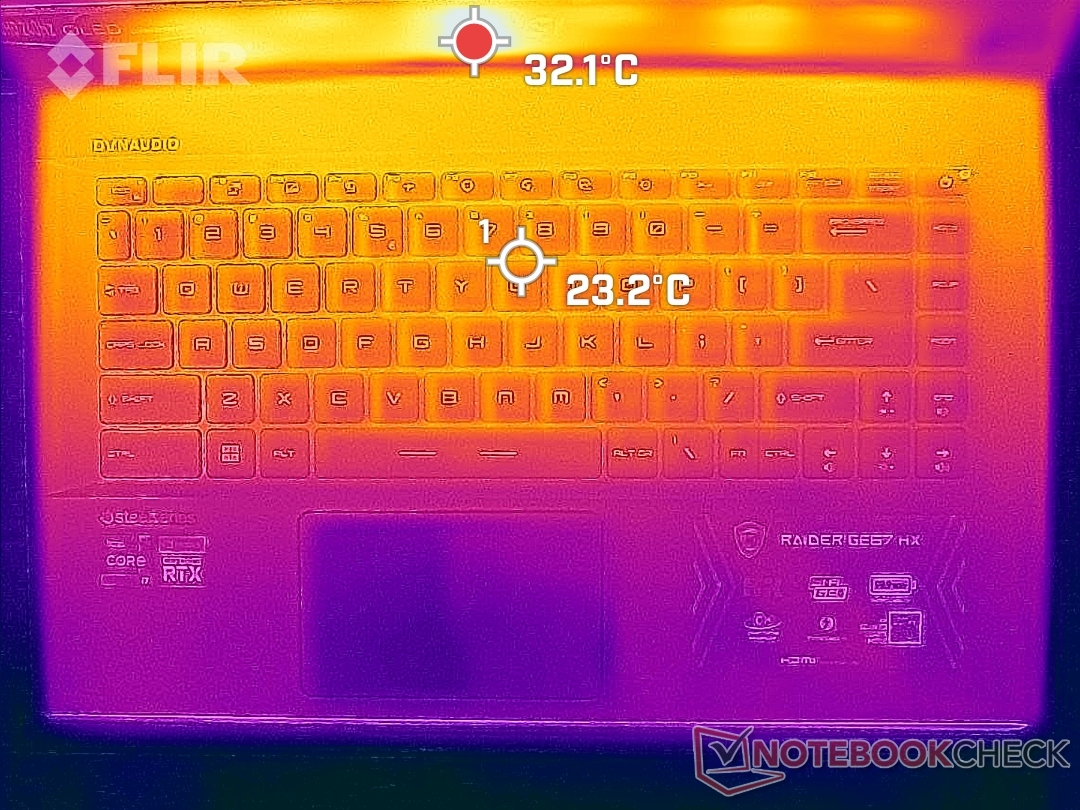
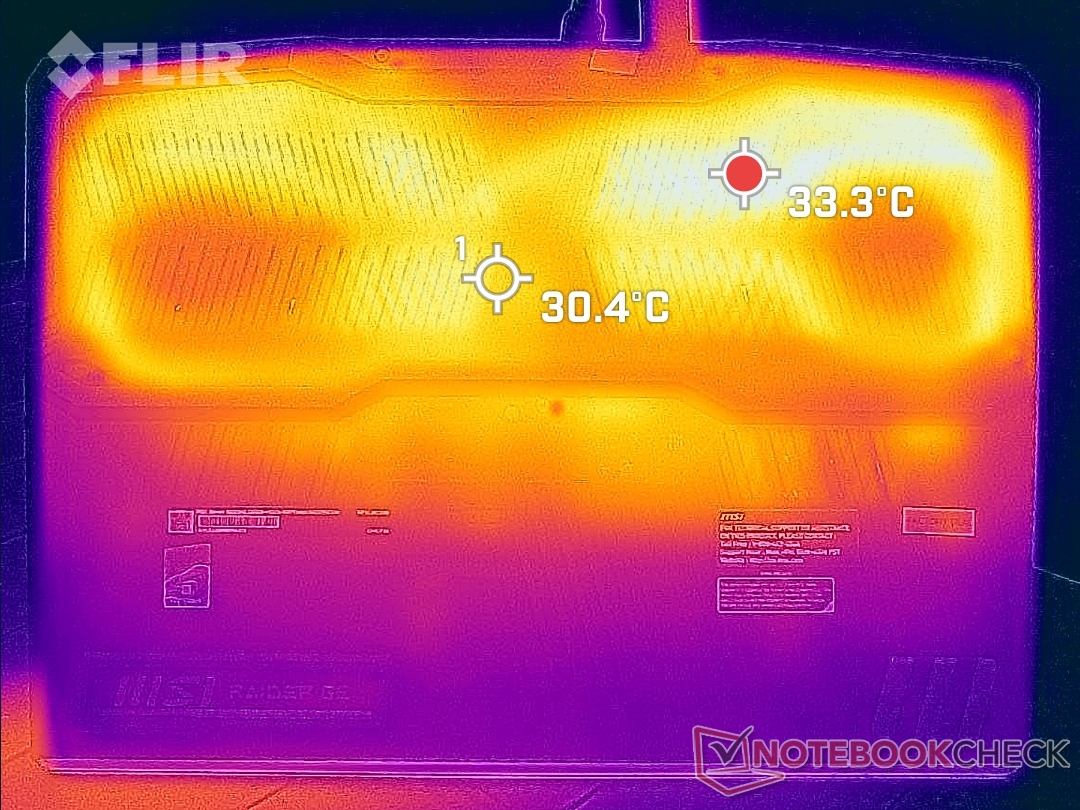
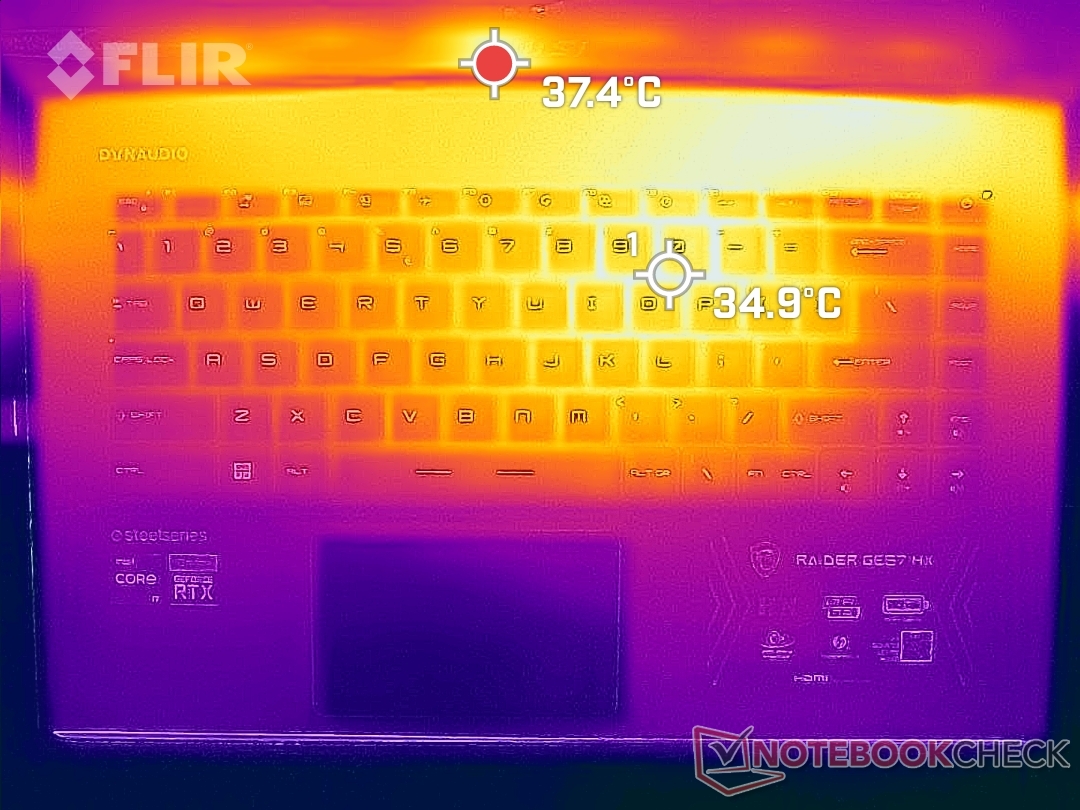
Temperatuur
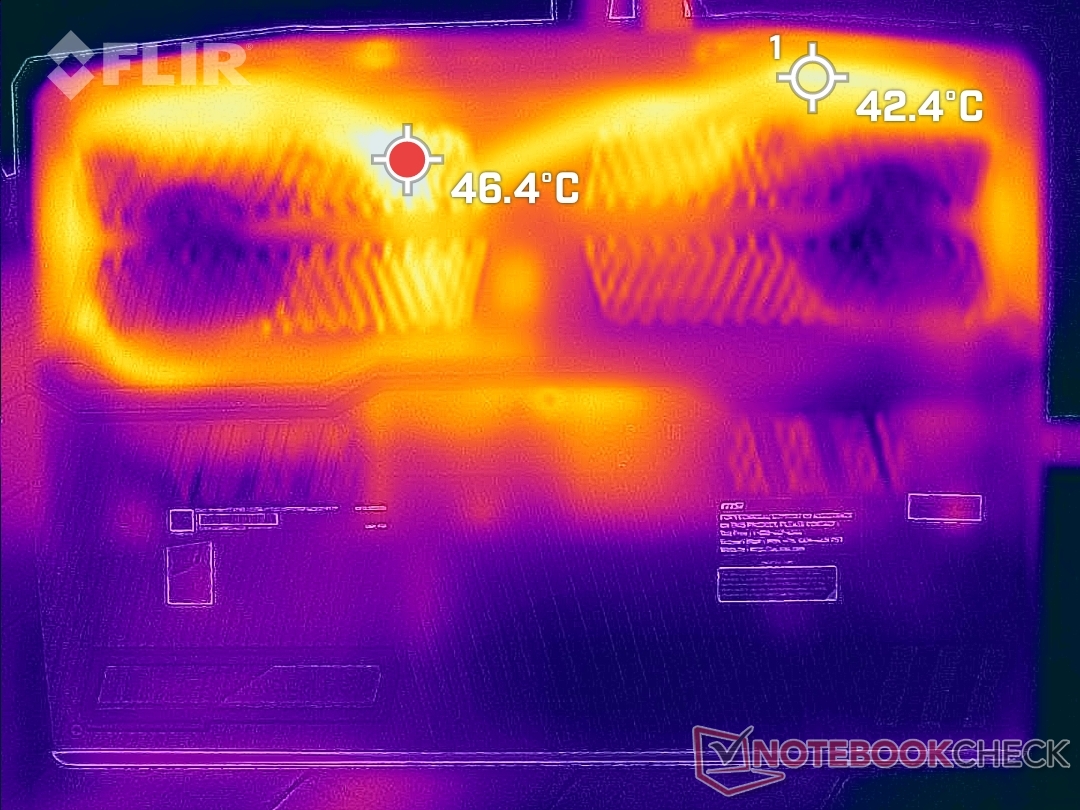
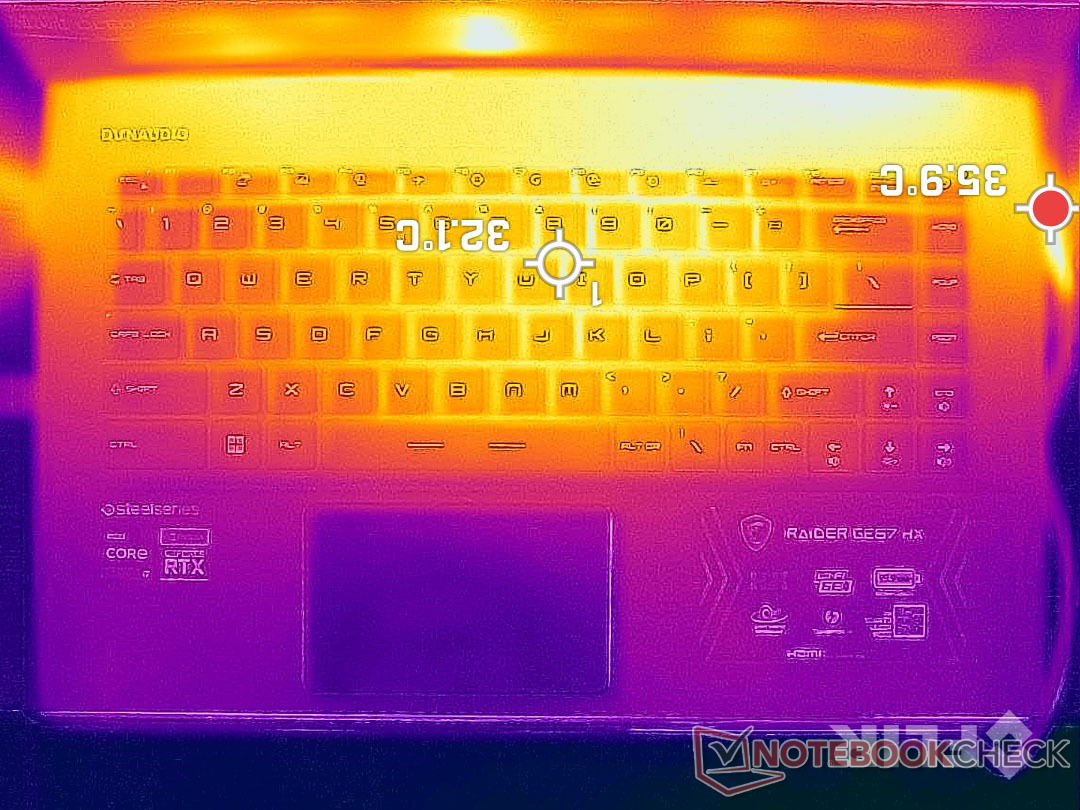
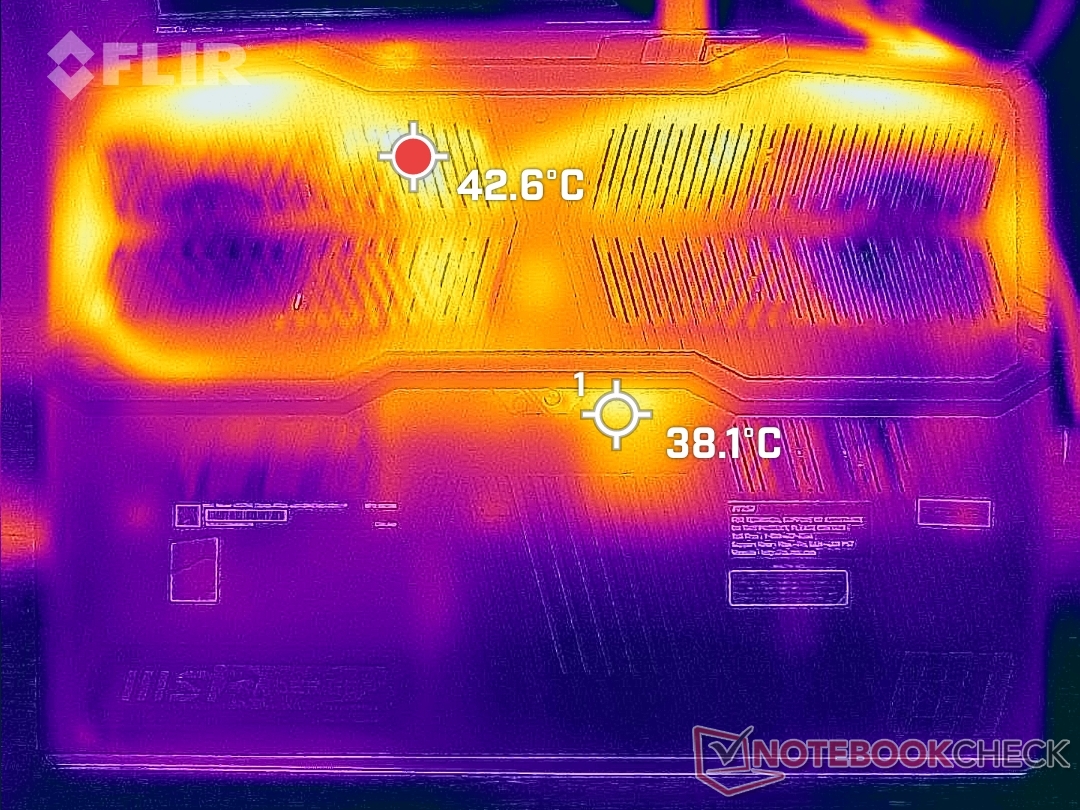
De oppervlaktetemperaturen zijn koeler dan wat we waarnamen bij de oudere GE66. Tijdens het gamen kunnen hete plekken op het toetsenborddek en het bodempaneel respectievelijk 35 C en 46 C bereiken. Deze zones bevinden zich aan de achterzijde van het chassis, zoals blijkt uit de temperatuurkaarten hieronder.
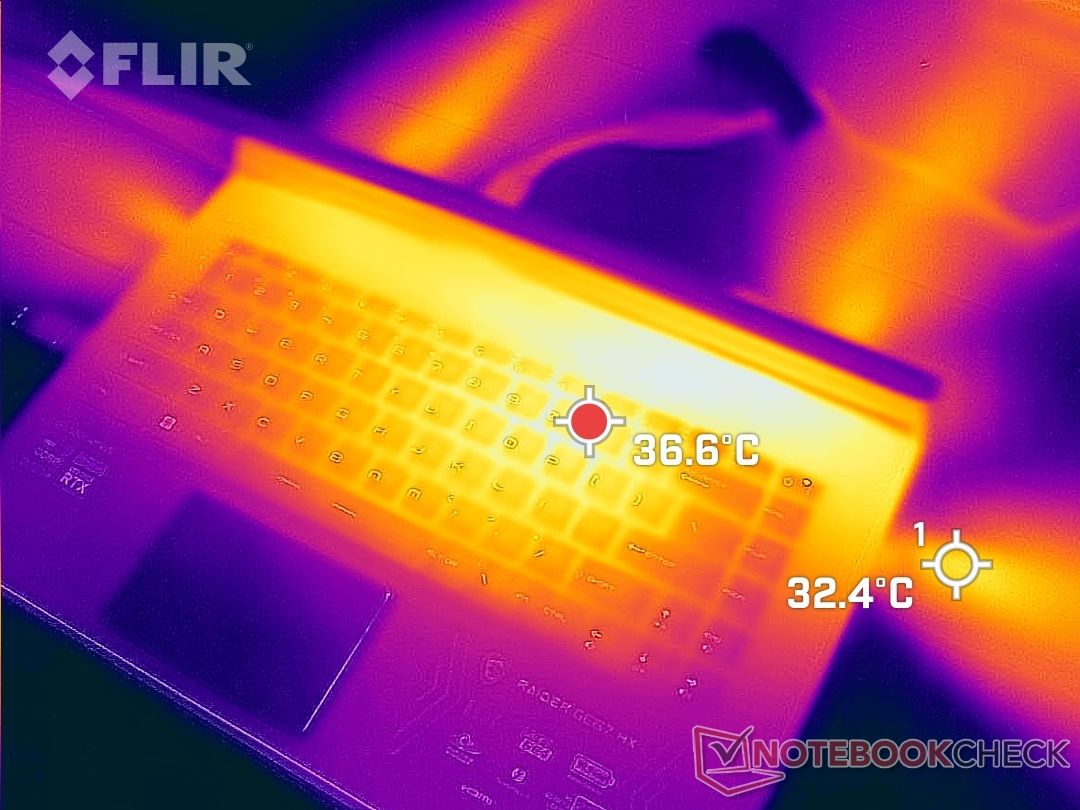
(+) De maximumtemperatuur aan de bovenzijde bedraagt 34.4 °C / 94 F, vergeleken met het gemiddelde van 40.4 °C / 105 F, variërend van 21.2 tot 68.8 °C voor de klasse Gaming.
(±) De bodem warmt op tot een maximum van 42 °C / 108 F, vergeleken met een gemiddelde van 43.2 °C / 110 F
(+) Bij onbelast gebruik bedraagt de gemiddelde temperatuur voor de bovenzijde 21.4 °C / 71 F, vergeleken met het apparaatgemiddelde van 33.9 °C / 93 F.
(+) Bij het spelen van The Witcher 3 is de gemiddelde temperatuur voor de bovenzijde 27.9 °C / 82 F, vergeleken met het apparaatgemiddelde van 33.9 °C / 93 F.
(+) De palmsteunen en het touchpad zijn met een maximum van ###max## °C / 68.7 F koeler dan de huidtemperatuur en voelen daarom koel aan.
(+) De gemiddelde temperatuur van de handpalmsteun van soortgelijke toestellen bedroeg 28.8 °C / 83.8 F (+8.4 °C / 15.1 F).
| MSI GE67 HX 12UGS Intel Core i7-12800HX, NVIDIA GeForce RTX 3070 Ti Laptop GPU | MSI Raider GE66 12UHS Intel Core i9-12900HK, NVIDIA GeForce RTX 3080 Ti Laptop GPU | MSI Vector GP66 12UGS Intel Core i9-12900H, NVIDIA GeForce RTX 3070 Ti Laptop GPU | Asus ROG Strix Scar 15 G533ZW-LN106WS Intel Core i9-12900H, NVIDIA GeForce RTX 3070 Ti Laptop GPU | Alienware m15 R6, i7-11800H RTX 3080 Intel Core i7-11800H, NVIDIA GeForce RTX 3080 Laptop GPU | Razer Blade 15 2022 Intel Core i7-12800H, NVIDIA GeForce RTX 3080 Ti Laptop GPU | |
|---|---|---|---|---|---|---|
| Heat | -36% | -19% | -29% | -45% | -32% | |
| Maximum Upper Side * (°C) | 34.4 | 54 -57% | 40.2 -17% | 42.6 -24% | 61 -77% | 50 -45% |
| Maximum Bottom * (°C) | 42 | 65 -55% | 43.8 -4% | 50.2 -20% | 58 -38% | 47 -12% |
| Idle Upper Side * (°C) | 24 | 30 -25% | 34.8 -45% | 36.2 -51% | 38 -58% | 37.4 -56% |
| Idle Bottom * (°C) | 33.2 | 35 -5% | 37 -11% | 40.2 -21% | 36 -8% | 38.4 -16% |
* ... kleiner is beter
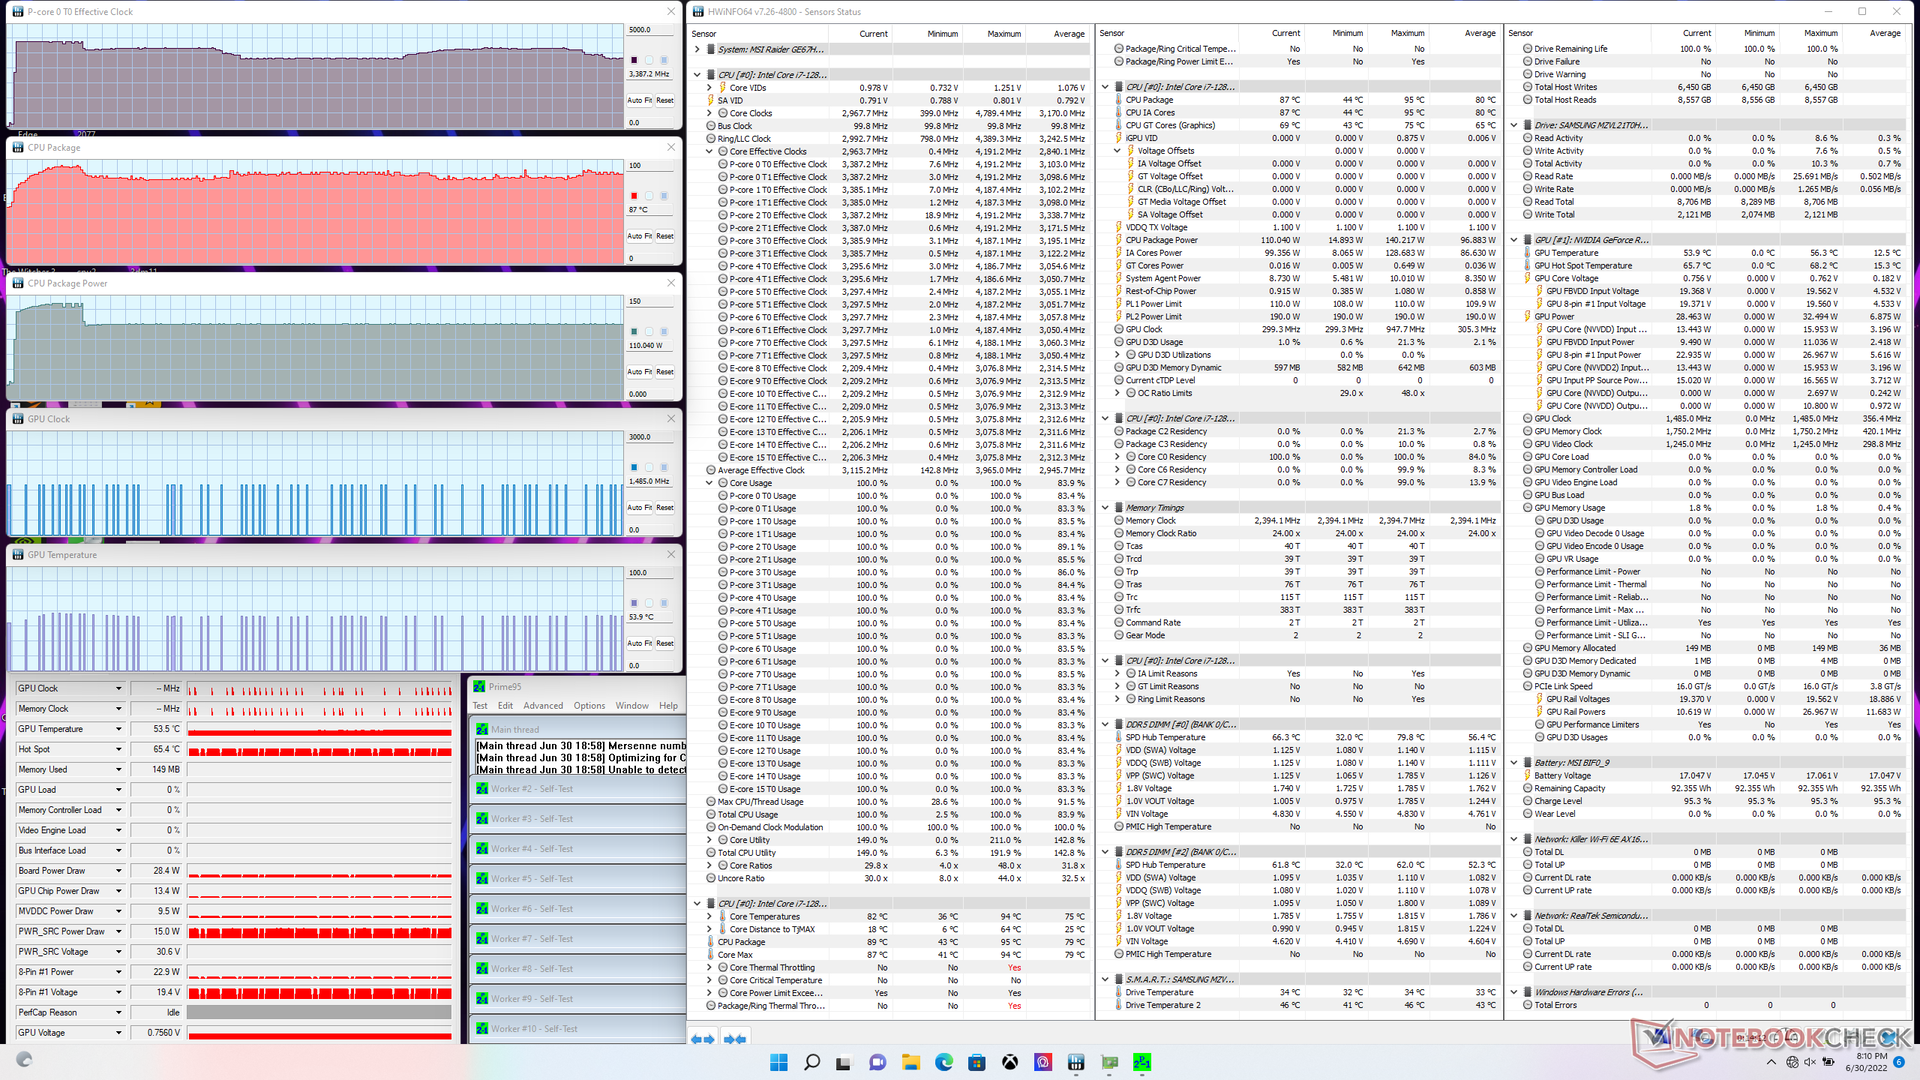
Stresstest
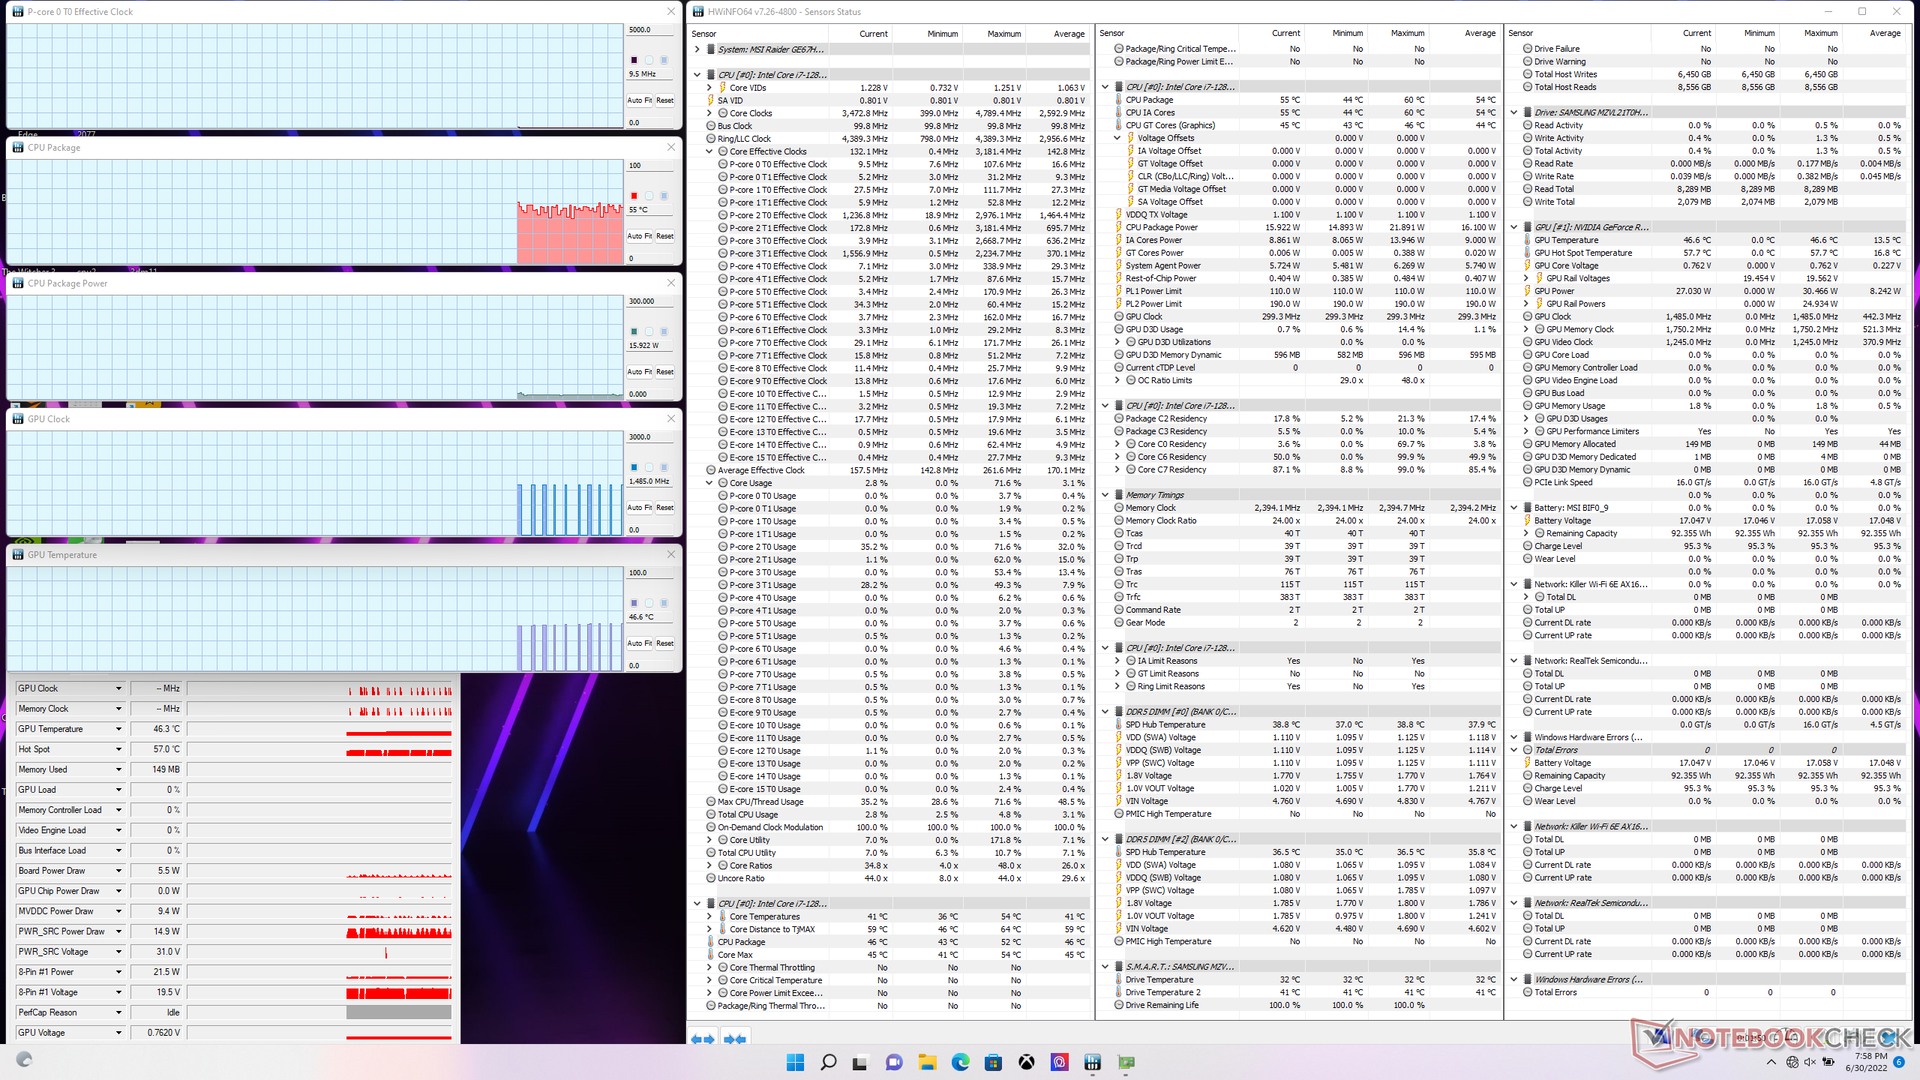
Onder belasting van Prime95, zou de CPU een boost geven tot 4,2 GHz tot ongeveer 90 seconden later, wanneer de kerntemperatuur 96 C zou bereiken. Daarna zou de kloksnelheid dalen tot 3,4 tot 3,7 GHz om een koelere kerntemperatuur te behouden van ongeveer 87 C. Het stroomverbruik van het CPU-pakket zou oplopen tot 140 W tijdens de eerste 90 seconden van de test, voordat het stabiliseerde op 110 W. Ter vergelijking, de Core i7-12900HK in de oudere GE66 zou stabiliseren op slechts 45 W wanneer onder vergelijkbare omstandigheden.
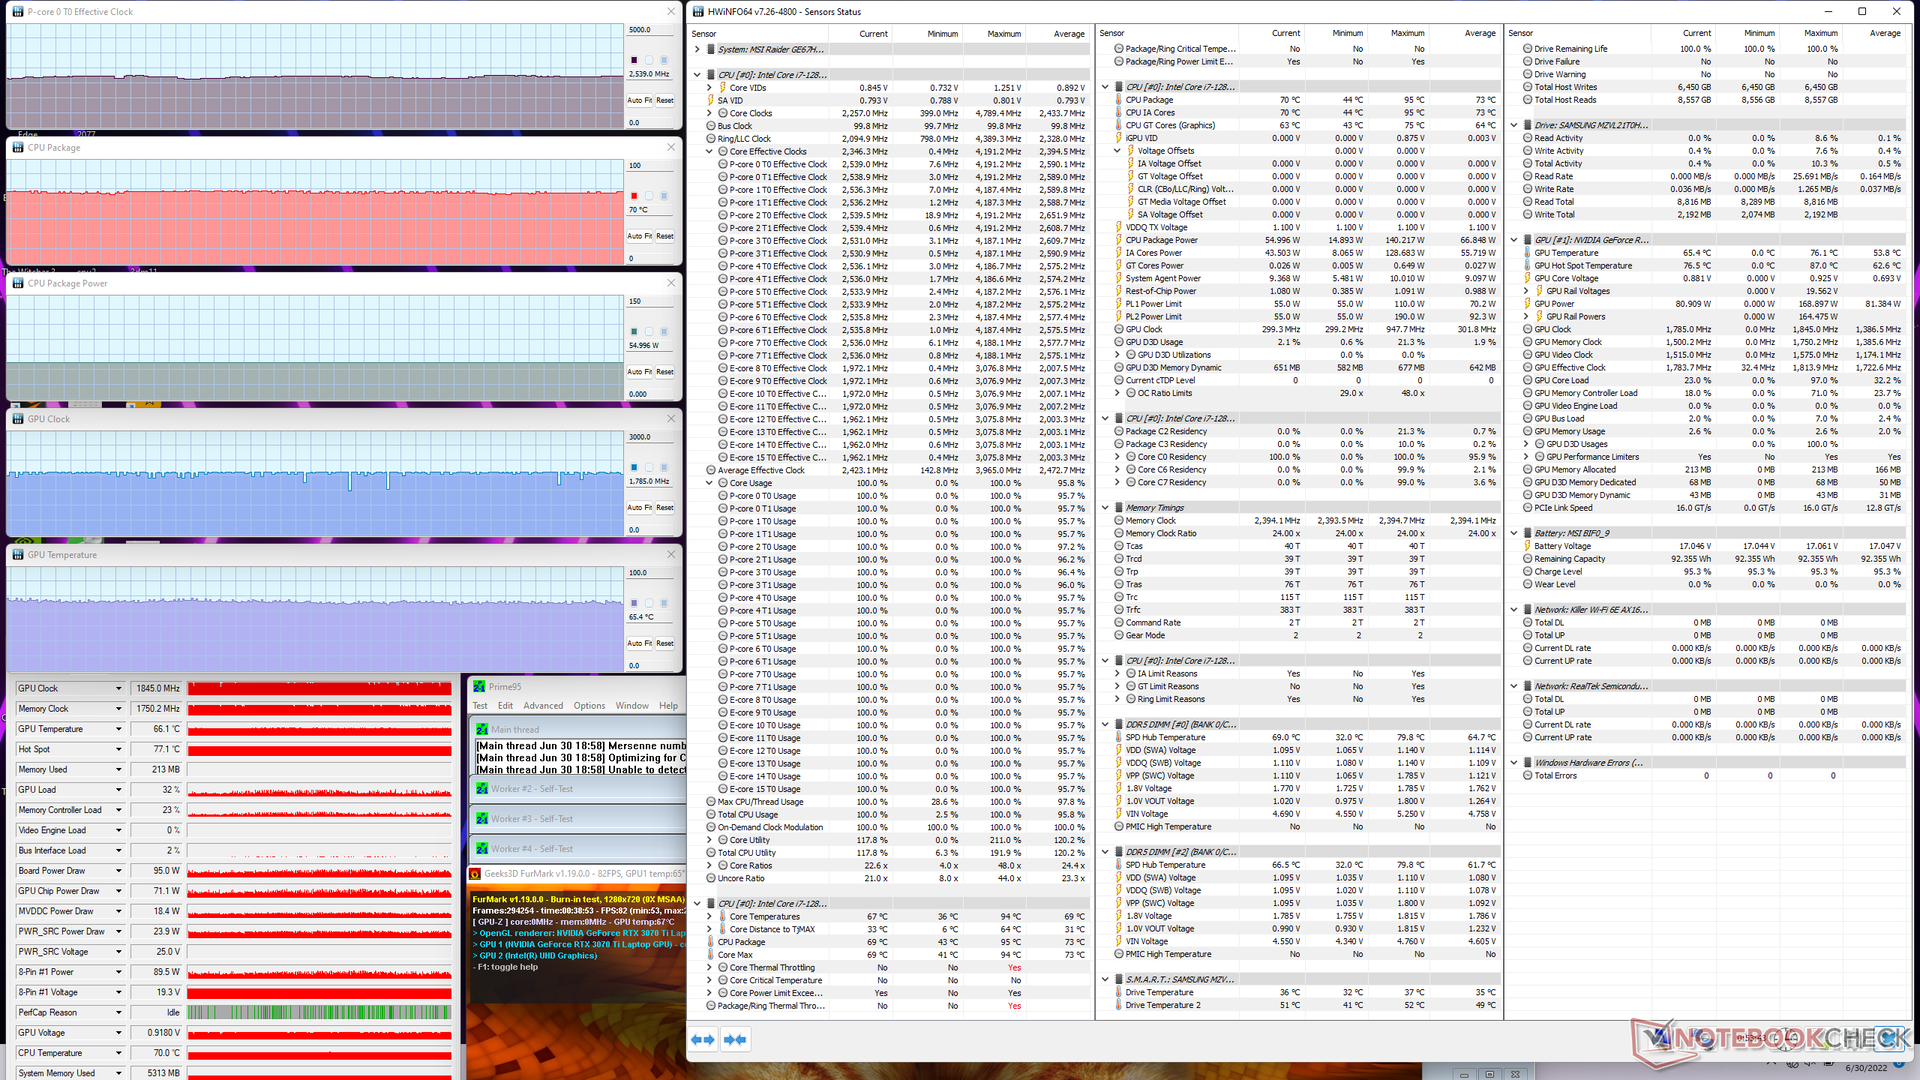
Het stroomverbruik van de GPU-printplaat is maximaal 148 W in de Extreme Performance modus, vergeleken met ~135 W in het Balanced power profiel. U zult de Extreme Prestaties modus willen inschakelen om het GPU potentieel te maximaliseren als gevolg hiervan. De gemiddelde CPU en GPU temperaturen zijn redelijk met respectievelijk 69 C en 77 C, vergeleken met 71 C en 70 C op de Vector GP66 die wordt geleverd met dezelfde GeForce RTX 3070 Ti GPU maar een langzamere 11e generatie CPU.
Het is vermeldenswaard dat we slechts in staat waren om een GPU board stroomverbruik van slechts 148 W te bereiken, ondanks de MSI advertentie van 150 W + 25 W Dynamic Boost, zelfs bij het draaien op Extreme Performance mode, althans volgens GPU-Z.
Het werken op batterijen heeft invloed op de prestaties. Een Fire Strike test op batterijvoeding zou een Physics en Graphics score opleveren van respectievelijk 22492 en 11614 punten, vergeleken met 34445 en 31096 punten op netstroom.

| CPU Klok (GHz) | GPU Klok (MHz) | Gemiddelde CPU Temperatuur (°C) | Gemiddelde GPU Temperatuur (°C) | |
| Systeem in rusttoestand | -- | -- | 55 | 47 |
| Prime95 Stress | 3.4 - 3.7 | -- | 87 | 54 |
| Prime95 + FurMark Stress | 2.6 | 1845 | 70 | 65 |
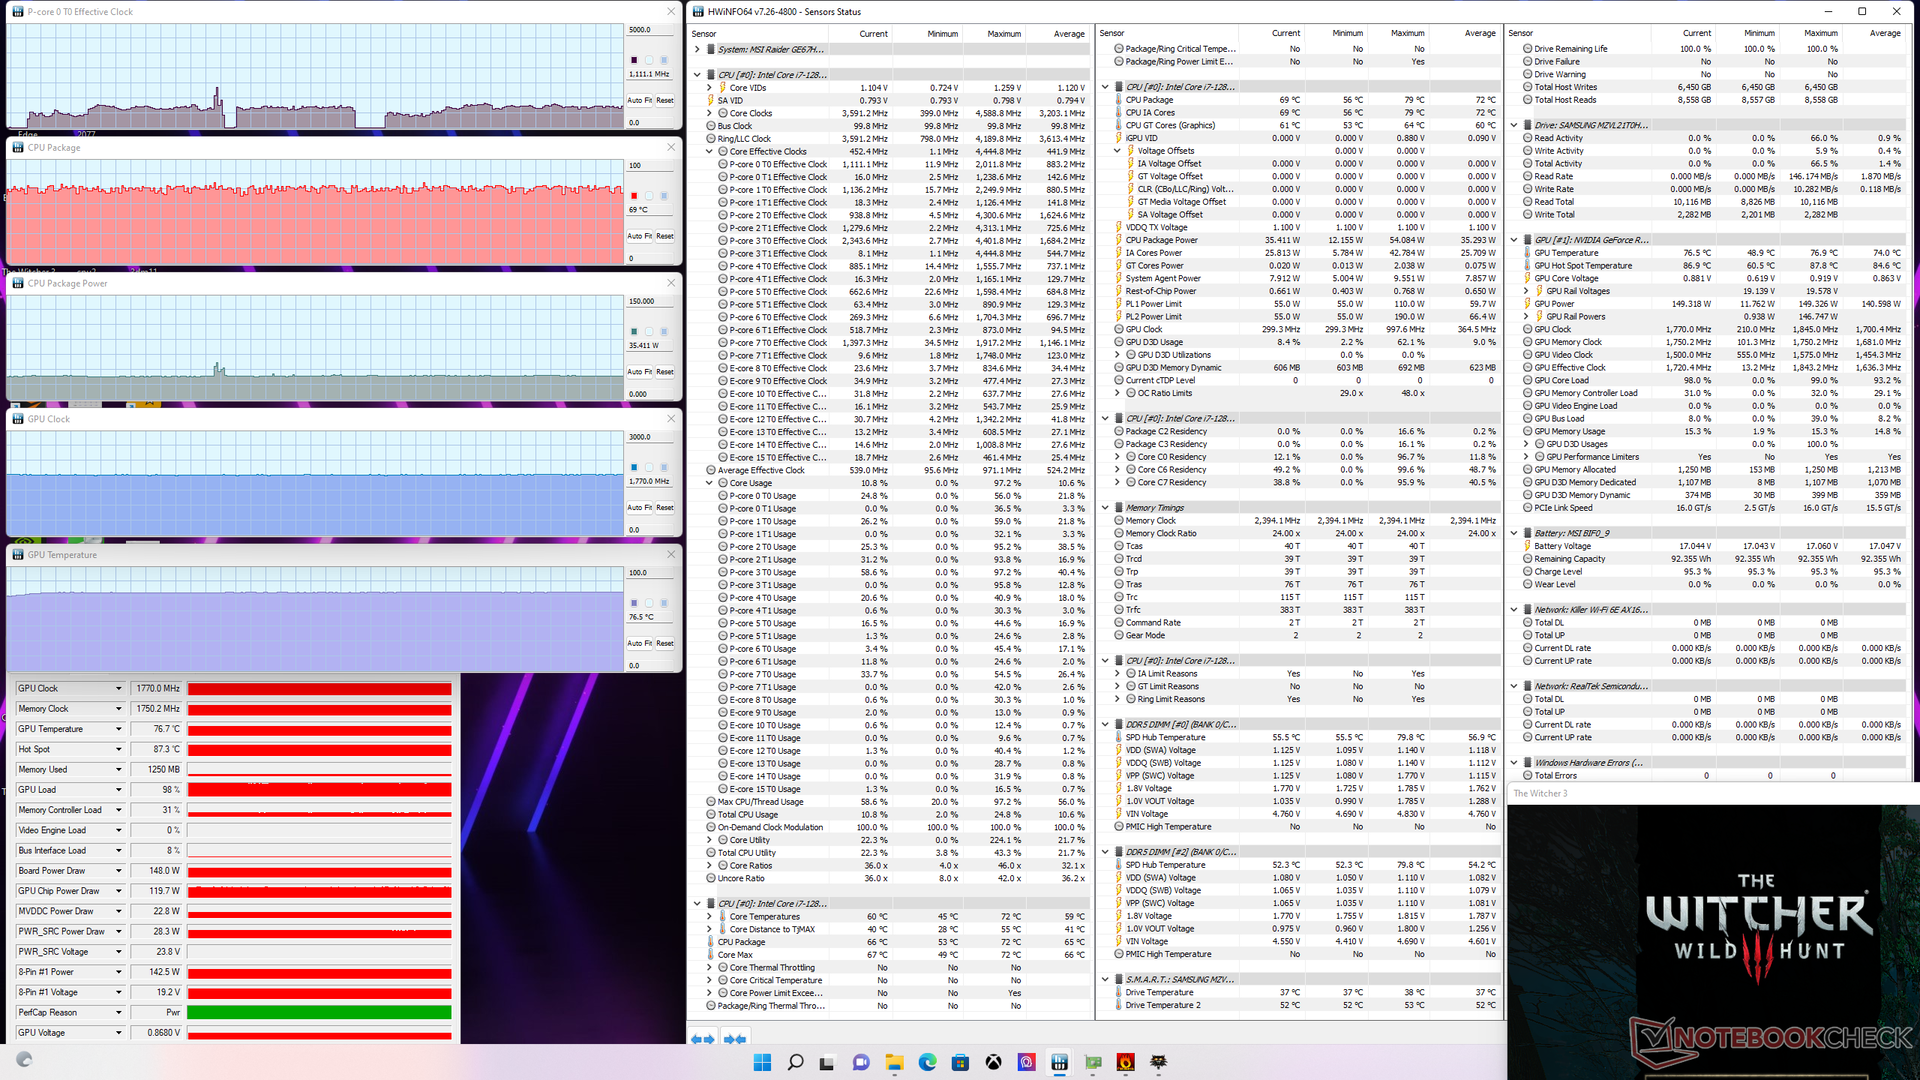
| Witcher 3 Stress(gebalanceerde modus) | 0.9 | 1800 | 74 | 75 |
| Witcher 3 Stress(modus extreme prestaties) | 1.1 | 1770 | 69 | 77 |
Sprekers
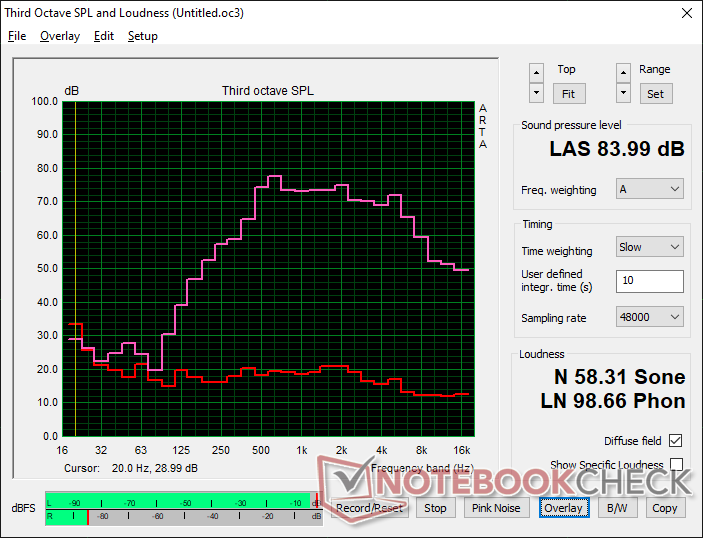
MSI GE67 HX 12UGS audioanalyse
(+) | luidsprekers kunnen relatief luid spelen (84 dB)
Bas 100 - 315 Hz
(-) | bijna geen lage tonen - gemiddeld 17.9% lager dan de mediaan
(±) | lineariteit van de lage tonen is gemiddeld (13.7% delta ten opzichte van de vorige frequentie)
Midden 400 - 2000 Hz
(±) | hogere middens - gemiddeld 7.9% hoger dan de mediaan
(+) | de middentonen zijn lineair (6.6% delta ten opzichte van de vorige frequentie)
Hoog 2 - 16 kHz
(±) | higher highs - on average 5.5% higher than median
(±) | lineariteit van de hoogtepunten is gemiddeld (8.6% delta ten opzichte van de vorige frequentie)
Algemeen 100 - 16.000 Hz
(±) | lineariteit van het totale geluid is gemiddeld (22.1% verschil met de mediaan)
Vergeleken met dezelfde klasse
» 79% van alle geteste apparaten in deze klasse waren beter, 6% vergelijkbaar, 15% slechter
» De beste had een delta van 6%, het gemiddelde was 18%, de slechtste was 132%
Vergeleken met alle geteste toestellen
» 64% van alle geteste apparaten waren beter, 6% gelijk, 30% slechter
» De beste had een delta van 4%, het gemiddelde was 23%, de slechtste was 134%
Apple MacBook Pro 16 2021 M1 Pro audioanalyse
(+) | luidsprekers kunnen relatief luid spelen (84.7 dB)
Bas 100 - 315 Hz
(+) | goede baars - slechts 3.8% verwijderd van de mediaan
(+) | de lage tonen zijn lineair (5.2% delta naar de vorige frequentie)
Midden 400 - 2000 Hz
(+) | evenwichtige middens - slechts 1.3% verwijderd van de mediaan
(+) | de middentonen zijn lineair (2.1% delta ten opzichte van de vorige frequentie)
Hoog 2 - 16 kHz
(+) | evenwichtige hoogtepunten - slechts 1.9% verwijderd van de mediaan
(+) | de hoge tonen zijn lineair (2.7% delta naar de vorige frequentie)
Algemeen 100 - 16.000 Hz
(+) | het totale geluid is lineair (4.6% verschil met de mediaan)
Vergeleken met dezelfde klasse
» 0% van alle geteste apparaten in deze klasse waren beter, 0% vergelijkbaar, 100% slechter
» De beste had een delta van 5%, het gemiddelde was 17%, de slechtste was 45%
Vergeleken met alle geteste toestellen
» 0% van alle geteste apparaten waren beter, 0% gelijk, 100% slechter
» De beste had een delta van 4%, het gemiddelde was 23%, de slechtste was 134%
Energiebeheer - Hoog Verbruik en Zware Vermogens Baksteen
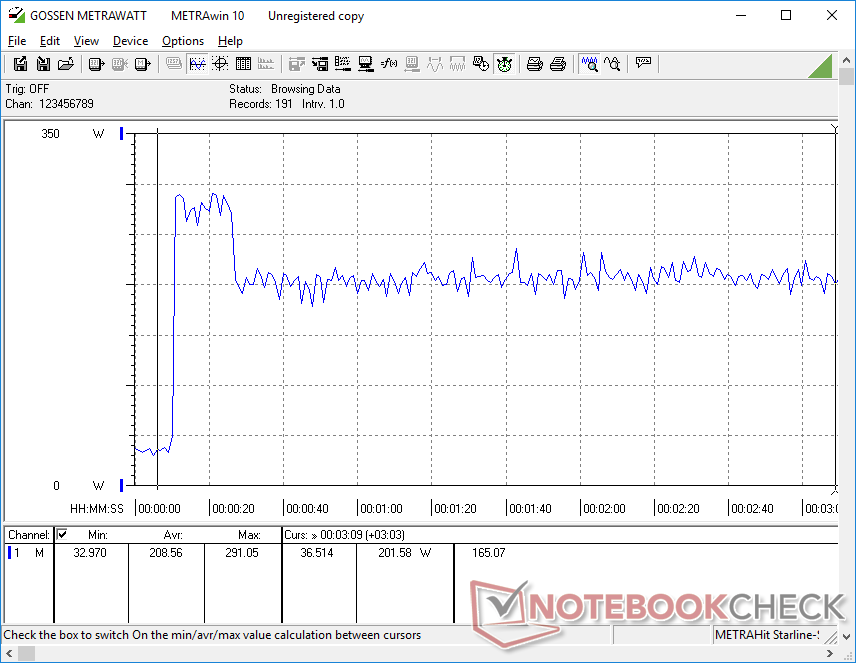
Stroomverbruik
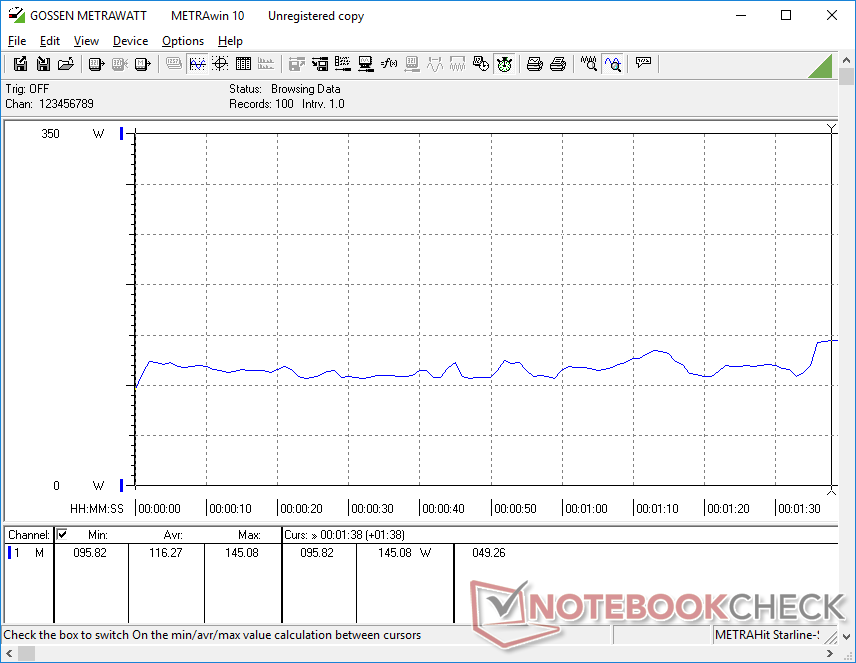
Het verbruik is merkbaar hoger dan wat we registreerden op de oudere Core i9-12900HK GE66, vooral wanneer zware CPU toepassingen worden uitgevoerd. Prime95, bijvoorbeeld, zou ongeveer 165 W verbruiken op onze GE67 vergeleken met slechts 90 W op de GE66, wat neerkomt op een toename van 83 procent. Het is een hoge prijs die betaald moet worden voor de 35 tot 40 procent toename in ruwe multi-thread prestaties tussen de Core i9-12900HK en Core i7-12800HX
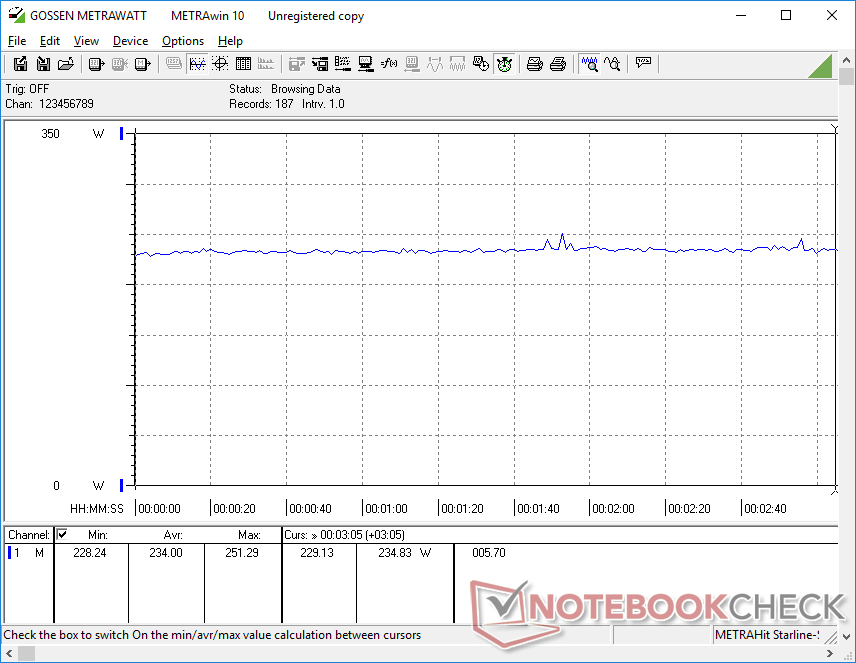
Met Witcher 3 zou ongeveer 237 W verbruiken, wat opnieuw hoger is dan de 202 W die we registreerden op de GE66. Zelfs in vergelijking met andere high-performance gaming laptops zoals de Asus ROG Strix Scar 15 of Alienware m15 R6zou de GE67 in beide gevallen meer stroom verbruiken
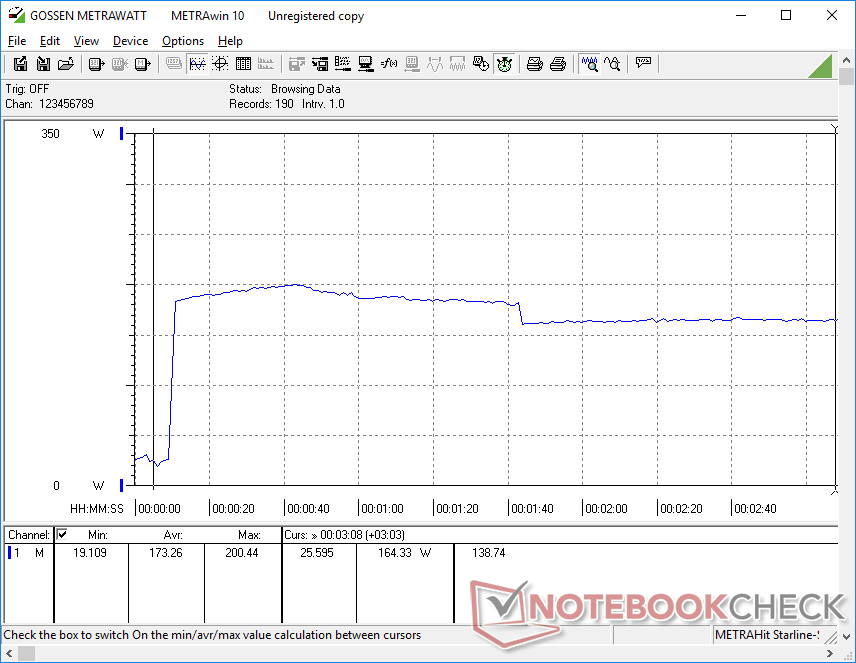
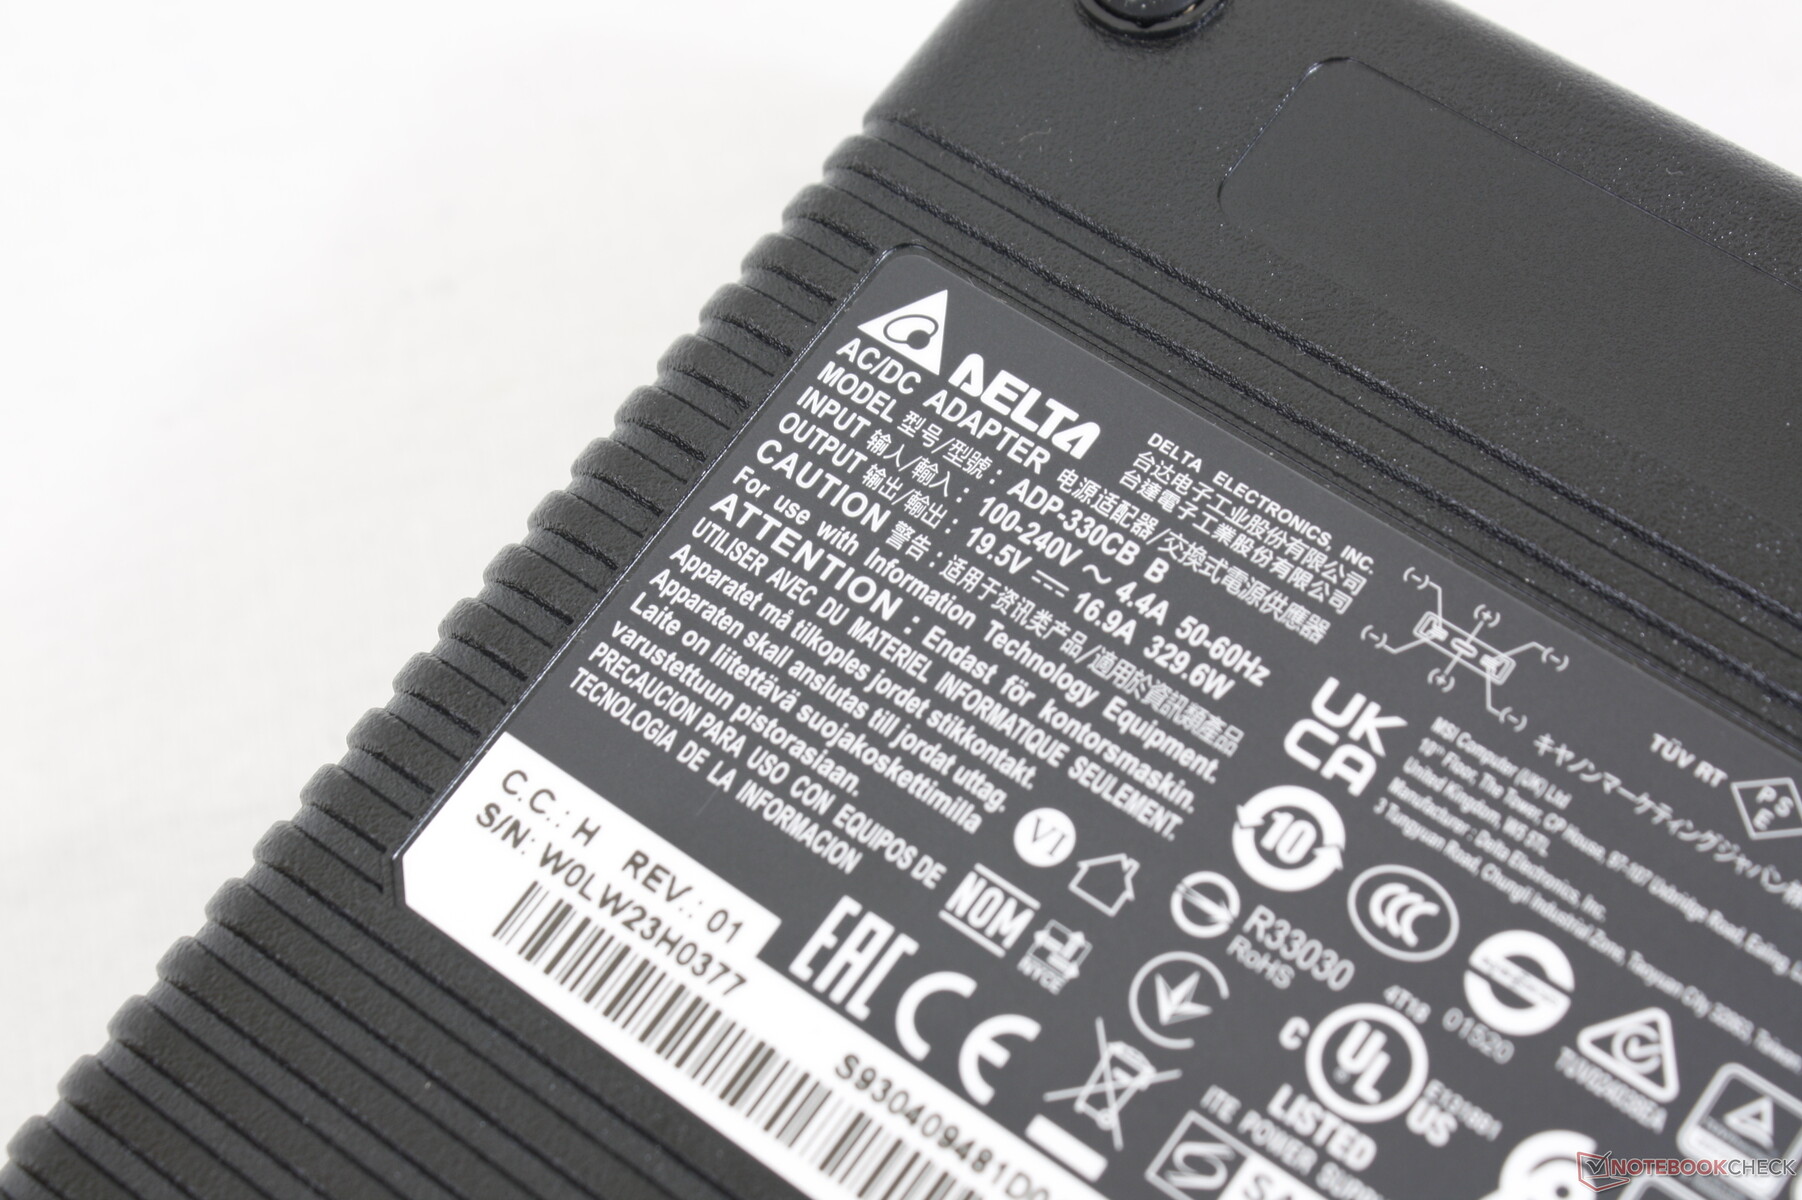
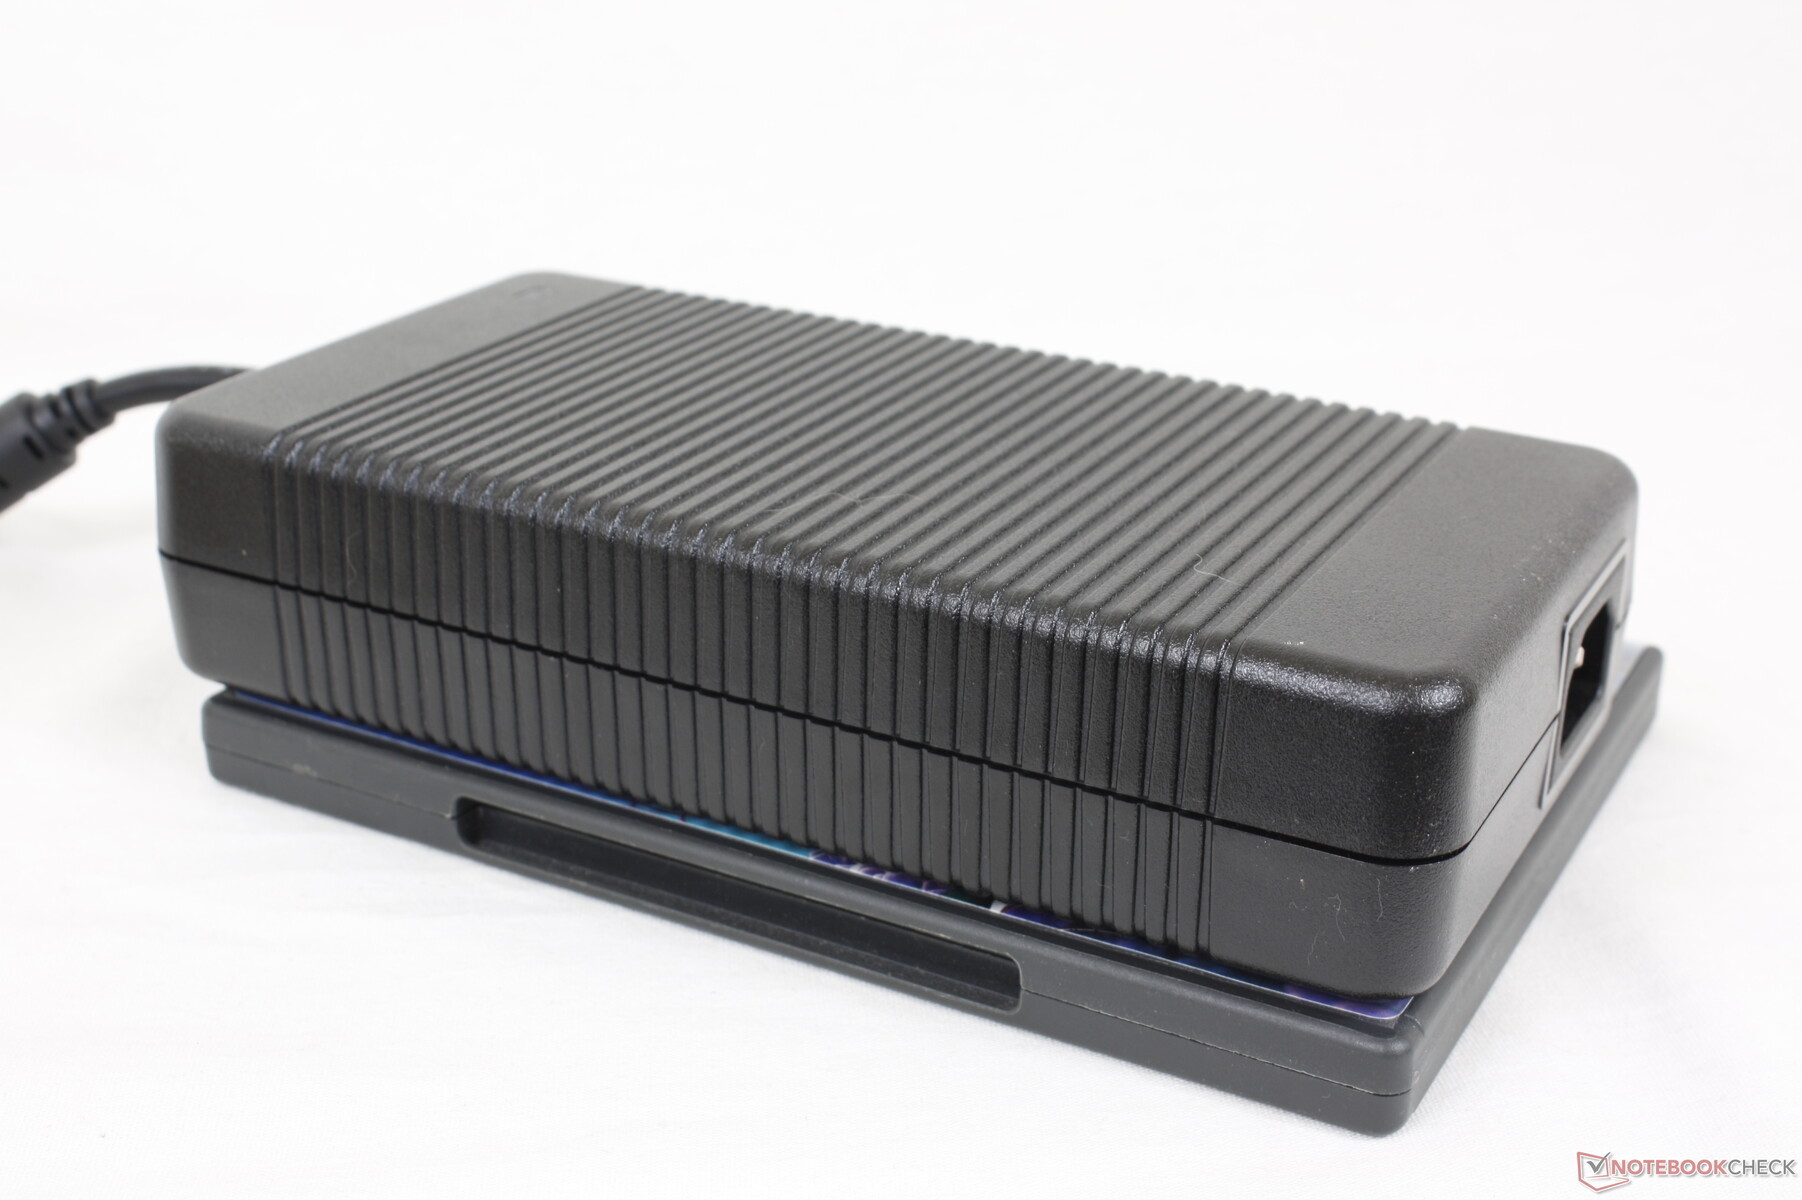
We zijn in staat om een maximale trek van 291 W te registreren uit de enorme (~20 x 9,8 x 4,3 cm) en zware (1,3 kg) 330 W voeding wanneer we tegelijkertijd zowel Prime95 als FurMark draaien. Merk op dat de meeste andere gaming laptops worden geleverd met 280 W of kleinere AC-adapters.
| Uit / Standby | |
| Inactief | |
| Belasting |
|
Key:
min: | |
| MSI GE67 HX 12UGS i7-12800HX, GeForce RTX 3070 Ti Laptop GPU, Samsung PM9A1 MZVL21T0HCLR, OLED, 1920x1080, 15.6" | MSI Raider GE66 12UHS i9-12900HK, GeForce RTX 3080 Ti Laptop GPU, Samsung PM9A1 MZVL22T0HBLB, IPS, 3840x2160, 15.6" | MSI Vector GP66 12UGS i9-12900H, GeForce RTX 3070 Ti Laptop GPU, , IPS, 1920x1080, 15.6" | Asus ROG Strix Scar 15 G533ZW-LN106WS i9-12900H, GeForce RTX 3070 Ti Laptop GPU, Samsung PM9A1 MZVL22T0HBLB, IPS-level, 2560x1440, 15.6" | Alienware m15 R6, i7-11800H RTX 3080 i7-11800H, GeForce RTX 3080 Laptop GPU, Samsung PM9A1 MZVL21T0HCLR, IPS, 1920x1080, 15.6" | Razer Blade 15 2022 i7-12800H, GeForce RTX 3080 Ti Laptop GPU, SSSTC CA6-8D1024, IPS, 2560x1440, 15.6" | |
|---|---|---|---|---|---|---|
| Power Consumption | 5% | -15% | 21% | 12% | -35% | |
| Idle Minimum * (Watt) | 16.1 | 16 1% | 17.5 -9% | 7.56 53% | 14 13% | 33.2 -106% |
| Idle Average * (Watt) | 17.1 | 19 -11% | 20.1 -18% | 13.5 21% | 18 -5% | 36.4 -113% |
| Idle Maximum * (Watt) | 26.6 | 26 2% | 47.3 -78% | 16.87 37% | 29 -9% | 37.6 -41% |
| Load Average * (Watt) | 116.3 | 110 5% | 107.3 8% | 128.9 -11% | 93 20% | 116.7 -0% |
| Witcher 3 ultra * (Watt) | 237 | 202 15% | 225 5% | 196.2 17% | 190 20% | 172 27% |
| Load Maximum * (Watt) | 291.1 | 242 17% | 277.7 5% | 274.86 6% | 203 30% | 228.6 21% |
* ... kleiner is beter
Power Consumption Witcher 3 / Stresstest
Power Consumption external Monitor
Batterijlevensduur - eigenlijk niet slecht
De batterijcapaciteit is met 99,9 Wh het grootst toegestane, omdat een hogere capaciteit in strijd zou zijn met de veiligheidsvoorschriften voor lithiumbatterijen van de FAA. Gebruikers kunnen WLAN runtimes verwachten van ongeveer 5,5 uur wanneer ingesteld op het Balanced power profiel, wat vergelijkbaar is met wat we registreerden op de GE66 ondanks hun verschillen in prestaties.
Het opladen van leeg naar vol gaat langzaam met 2 tot 2,5 uur. Het systeem kan niet worden opgeladen via USB-C in tegenstelling tot de Razer Blade serie of de meeste Asus ROG modellen.
| MSI GE67 HX 12UGS i7-12800HX, GeForce RTX 3070 Ti Laptop GPU, 99.9 Wh | MSI Raider GE66 12UHS i9-12900HK, GeForce RTX 3080 Ti Laptop GPU, 99 Wh | MSI Vector GP66 12UGS i9-12900H, GeForce RTX 3070 Ti Laptop GPU, 65 Wh | Asus ROG Strix Scar 15 G533ZW-LN106WS i9-12900H, GeForce RTX 3070 Ti Laptop GPU, 90 Wh | Alienware m15 R6, i7-11800H RTX 3080 i7-11800H, GeForce RTX 3080 Laptop GPU, 84 Wh | Razer Blade 15 2022 i7-12800H, GeForce RTX 3080 Ti Laptop GPU, 80 Wh | |
|---|---|---|---|---|---|---|
| Batterijduur | -9% | -19% | -4% | -18% | -12% | |
| Reader / Idle (h) | 8.4 | 7.9 -6% | ||||
| WiFi v1.3 (h) | 5.6 | 5.7 2% | 5.7 2% | 8.4 50% | 5 -11% | 4.9 -12% |
| Load (h) | 2.1 | 1.7 -19% | 1 -52% | 0.9 -57% | 1.6 -24% | |
| H.264 (h) | 7.1 | 8.5 | 5.6 | |||
| Witcher 3 ultra (h) | 1.2 |
Pro
Contra
Verdict - Hogere prestaties, hogere stroomrekeningen
De prestatievoordelen van de Core i7-12800HX zijn onmiskenbaar. In vergelijking met de Ryzen 7 5800H of zelfs de Core i9-12900Hbiedt de Intel HX CPU tot 80 procent snellere multi-thread prestaties dan de eerstgenoemde en 30 tot 60 procent snellere prestaties dan de laatstgenoemde. De winst is aanzienlijk genoeg om een voorsprong te nemen op de desktop-klasse Core i7-12700K in veel gevallen voor te blijven. Enthousiastelingen en gamers die weten dat ze voordeel kunnen halen uit de processor, bijvoorbeeld voor hogere framerates bij het gamen, zullen veel te waarderen vinden aan wat de GE67 kan bieden.
Al die extra prestaties zijn echter niet gratis. Terwijl de GE66 wordt geleverd met een slankere 280 W AC adapter, wordt de GE67 geleverd met een volumineuzere 330 W AC adapter, alleen maar om plaats te bieden aan de energieverslindende Intel 12e generatie HX CPU. Het stroomverbruik is onbetwistbaar hoger als gevolg hiervan. Sommige gebruikers zullen deze nadelen de moeite waard vinden wanneer ze de immense CPU winst in overweging nemen, maar het is nog steeds iets om in gedachten te houden vanuit een prestatie-per-watt perspectief.
De GE67 is een van de snelste 15,6-inch gaming laptops dankzij de Core i7-12800HX CPU en 150 W GeForce RTX GPU. Het is ook een van de meest energieverslindende, want het vereist een grote 330 W power brick om te draaien.
Wat betreft het QHD OLED 240 Hz scherm, het is gemakkelijk het beste OLED paneel dat momenteel beschikbaar is voor gaming doeleinden en het paart zeer goed met de HX CPU en 150 W GeForce RTX 3070 Ti GPU. De implementatie op de GE67 is echter niet voor professionele bewerkingsdoeleinden, en het flikkeren kan een minderheid van gebruikers beïnvloeden.
Prijs en beschikbaarheid
De MSI GE67 is op het moment van schrijven nog niet overal verkrijgbaar bij Amazon of Best Buy. Echter, verkooppunten zoals XoticPC en EXcaliberPC hebben SKU's op voorraad vanaf $2500 USD.
MSI GE67 HX 12UGS
- 30-08-2022 v7 (old)
Allen Ngo
Price comparison

