Nauwelijks beter dan het jaar ervoor: 2023 Dell XPS 13 Plus 9320 Core i7-1360P test

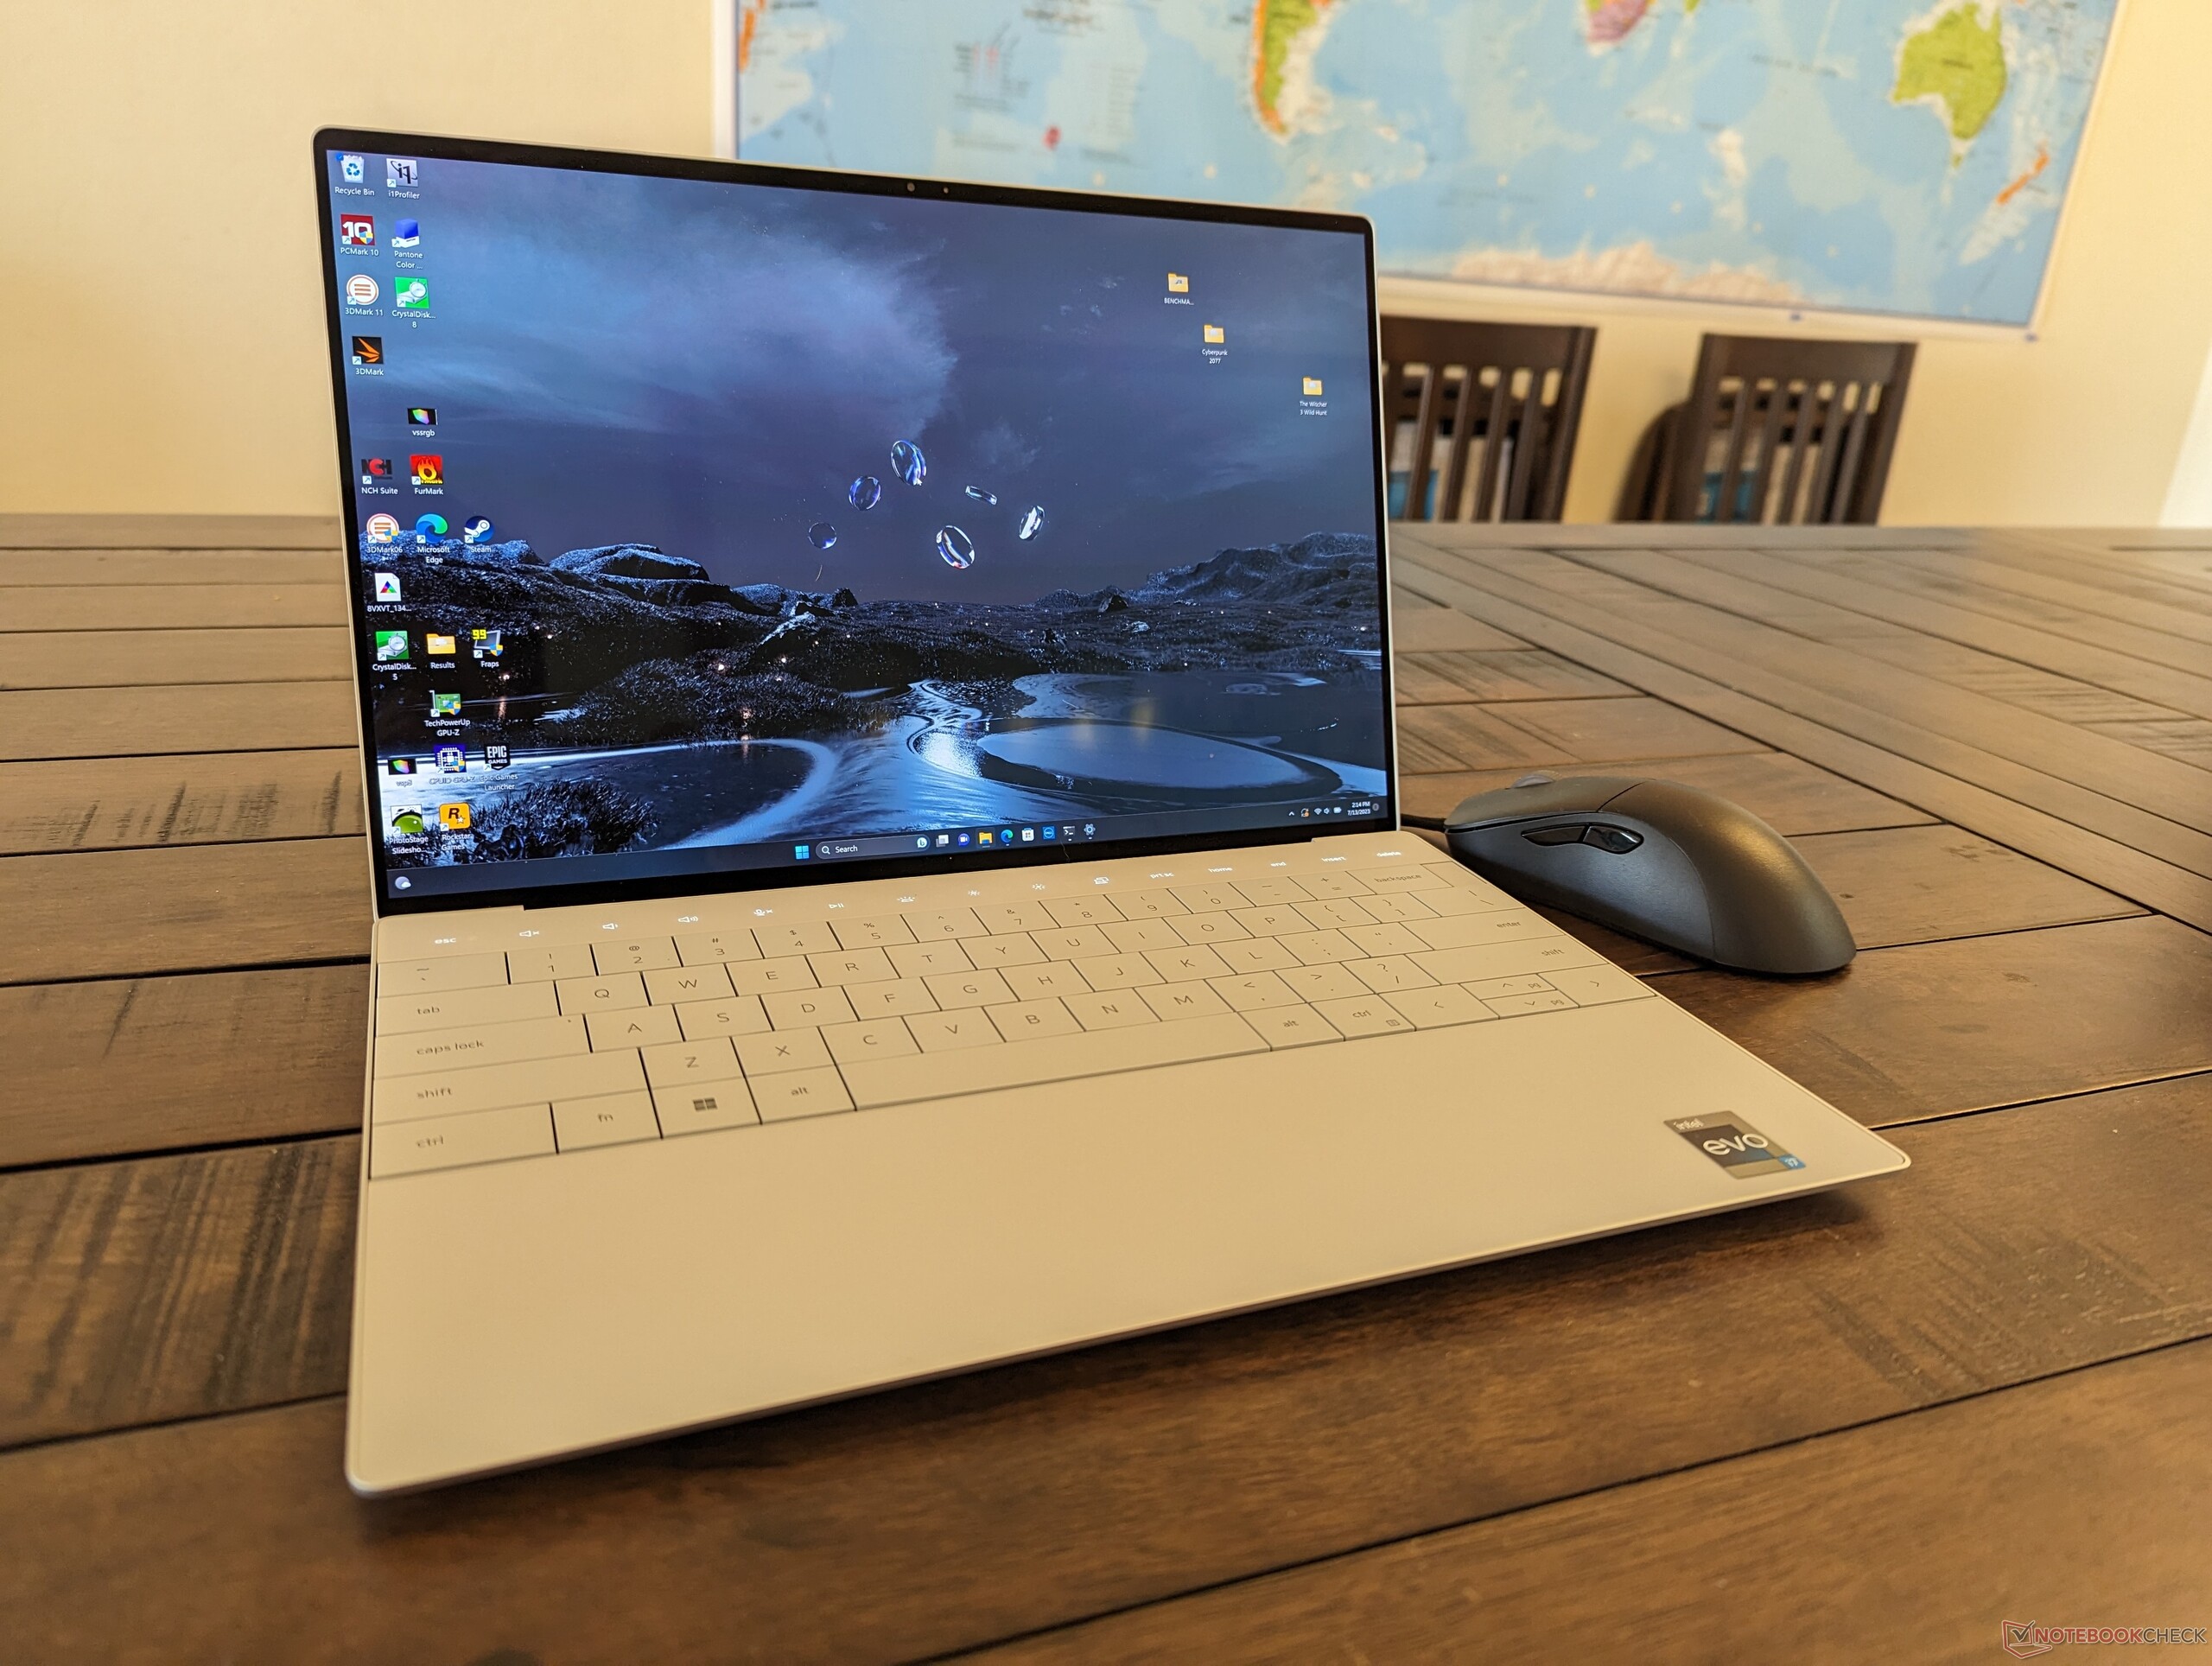
De 2023 XPS 13 Plus 9320 is de opvolger van het originele 2022 model. Het maakt gebruik van hetzelfde chassisontwerp, maar met nieuwere 13e gen Raptor Lake CPU-opties ter vervanging van de oudere 12e gen Alder Lake opties. Er zijn verder geen uiterlijke wijzigingen en daarom raden we aan om te kijken naar onze review van het 2022 model om meer te weten te komen over de fysieke kenmerken van de XPS 13 Plus.
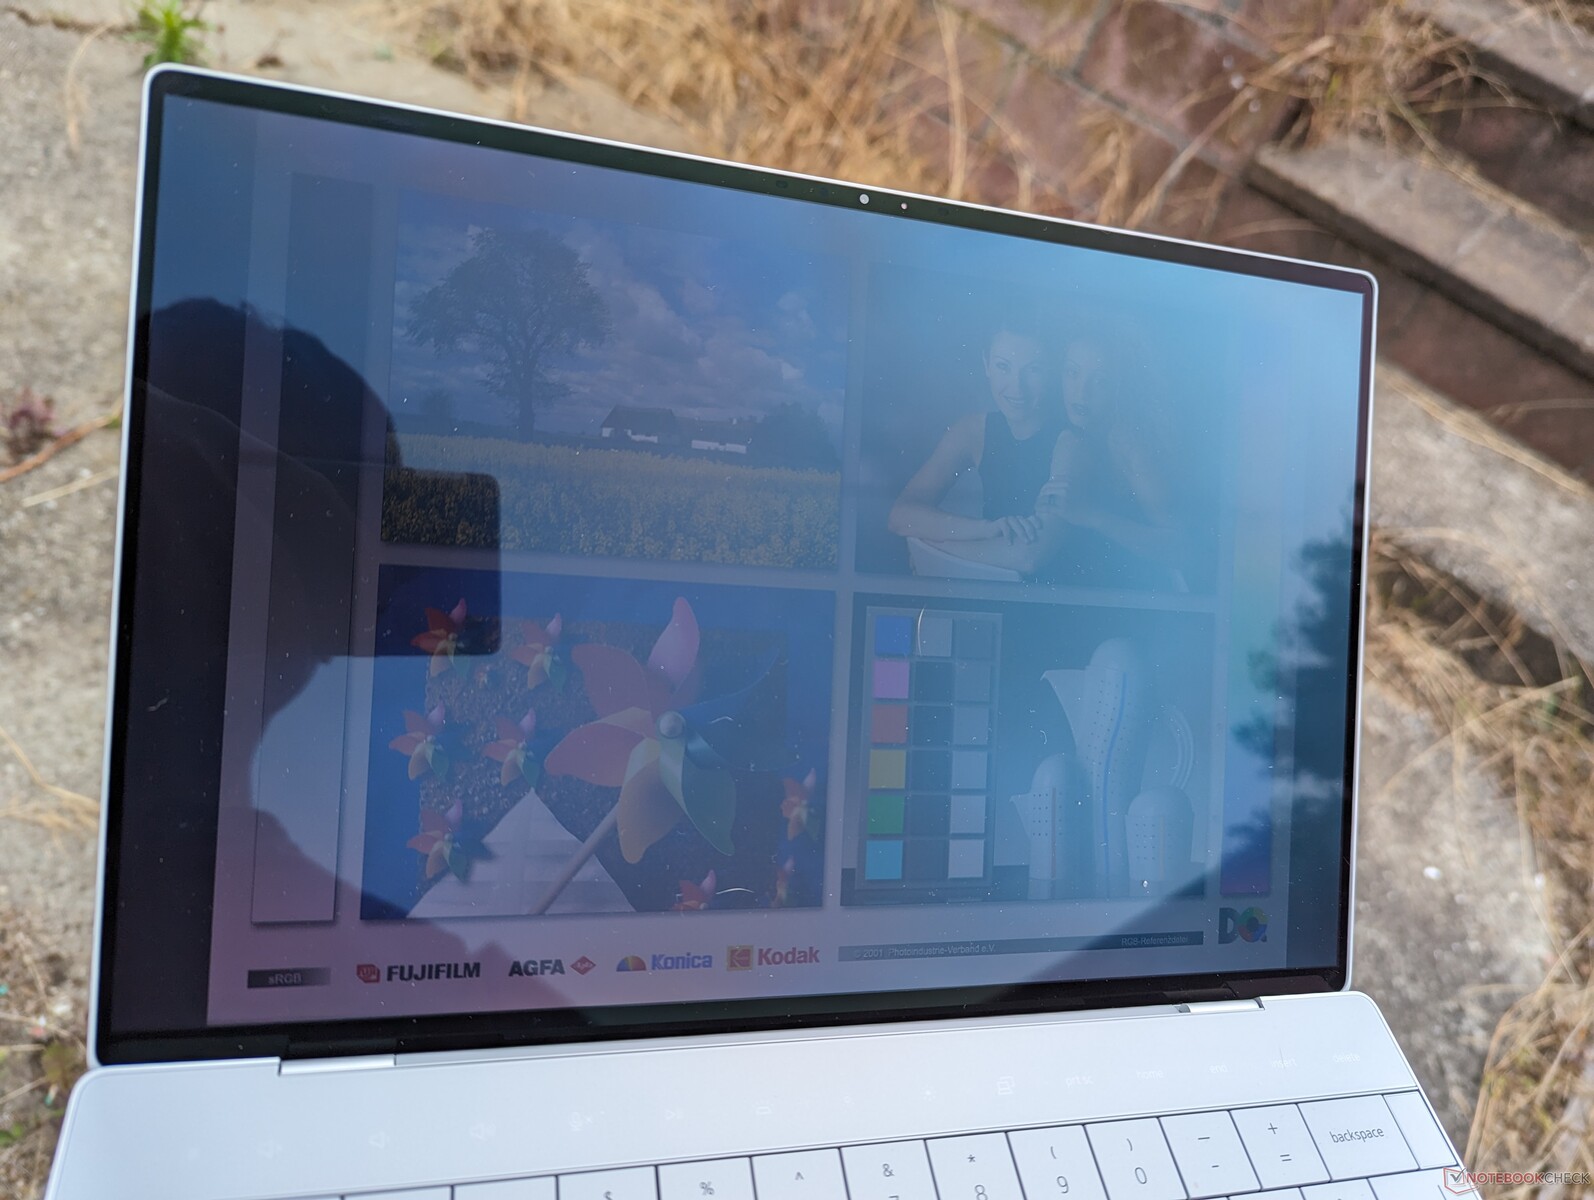
Onze configuratie is een midrange SKU met het 13,4-inch 3,5K (3456 x 2160) OLED aanraakscherm en 16 GB snel LPDDR5 6000 MHz RAM voor ongeveer $1300 USD. Andere SKU's kunnen in plaats daarvan 1200p of 2400p panelen hebben, maar ze worden momenteel allemaal geleverd met dezelfde Core i7-1360P processor.
Alternatieven voor de XPS 13 Plus zijn andere vlaggenschip 13-inch subnotebooks zoals deKader laptop 13.5,HP Spectre x360 13.5of de Lenovo ThinkPad X13 G3.
Meer Dell beoordelingen:
Potentiële concurrenten in vergelijking
Evaluatie | Datum | Model | Gewicht | Hoogte | Formaat | Resolutie | Beste prijs |
|---|---|---|---|---|---|---|---|
| 87.4 % v7 (old) | 07-2023 | Dell XPS 13 Plus 9320 Core i7-1360P i7-1360P, Iris Xe G7 96EUs | 1.3 kg | 15.3 mm | 13.40" | 3456x2160 | |
| 87.3 % v7 (old) | 09-2022 | Dell XPS 13 Plus 9320 i7-1280P OLED i7-1280P, Iris Xe G7 96EUs | 1.3 kg | 15.28 mm | 13.40" | 3456x2160 | |
| 85.9 % v7 (old) | 11-2019 | Dell XPS 13 7390 Core i7-10710U i7-10710U, UHD Graphics 620 | 1.2 kg | 11.6 mm | 13.30" | 3840x2160 | |
| 86.2 % v7 (old) | 05-2023 | Framework Laptop 13.5 13th Gen Intel i7-1370P, Iris Xe G7 96EUs | 1.3 kg | 15.85 mm | 13.50" | 2256x1504 | |
| 89.1 % v7 (old) | 06-2023 | Lenovo ThinkPad X13 Yoga G3 21AW003UGE i7-1265U, Iris Xe G7 96EUs | 1.2 kg | 15.9 mm | 13.30" | 2560x1600 | |
| 90.3 % v7 (old) | 08-2022 | HP Spectre x360 13.5 14t-ef000 i7-1255U, Iris Xe G7 96EUs | 1.4 kg | 17 mm | 13.50" | 3000x2000 |
Zaak
Communicatie
| Networking | |
| iperf3 transmit AX12 | |
| Dell XPS 13 7390 Core i7-10710U | |
| iperf3 receive AX12 | |
| Dell XPS 13 7390 Core i7-10710U | |
| iperf3 transmit AXE11000 | |
| Dell XPS 13 Plus 9320 Core i7-1360P | |
| Framework Laptop 13.5 13th Gen Intel | |
| Lenovo ThinkPad X13 Yoga G3 21AW003UGE | |
| iperf3 receive AXE11000 | |
| Lenovo ThinkPad X13 Yoga G3 21AW003UGE | |
| Dell XPS 13 Plus 9320 Core i7-1360P | |
| Framework Laptop 13.5 13th Gen Intel | |
| iperf3 transmit AXE11000 6GHz | |
| HP Spectre x360 13.5 14t-ef000 | |
| Framework Laptop 13.5 13th Gen Intel | |
| Dell XPS 13 Plus 9320 Core i7-1360P | |
| iperf3 receive AXE11000 6GHz | |
| Framework Laptop 13.5 13th Gen Intel | |
| Dell XPS 13 Plus 9320 Core i7-1360P | |
| HP Spectre x360 13.5 14t-ef000 | |
Webcam
Er zijn geen wijzigingen aan de 1 MP webcam, terwijl sommige concurrerende modellen zoals de HP Spectre al zijn overgestapt op 5 MP sensoren van hogere kwaliteit.


Onderhoud
Weergave
Er zijn vier schermopties beschikbaar:
- 1920 x 1200, 60 Hz, IPS, non-touch, mat, 500 nits
- 1920 x 1200, 60 Hz, IPS, aanraakgevoelig, mat, 500 nits
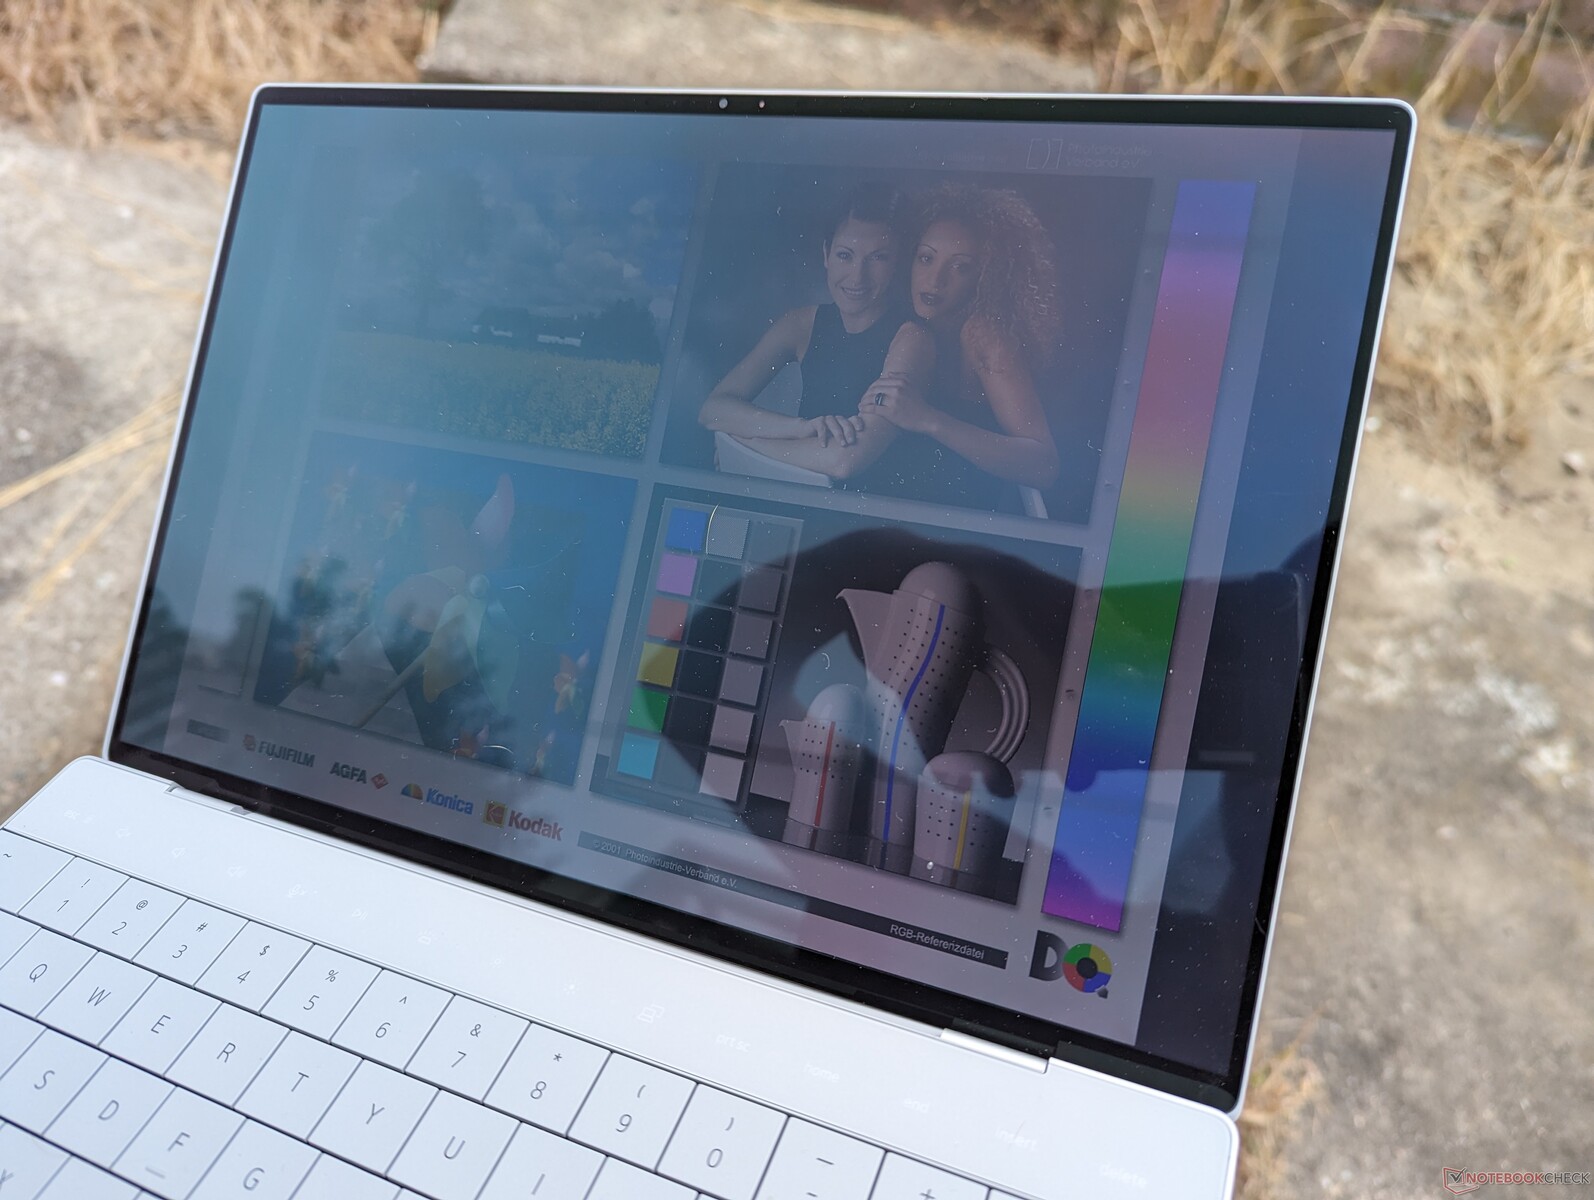
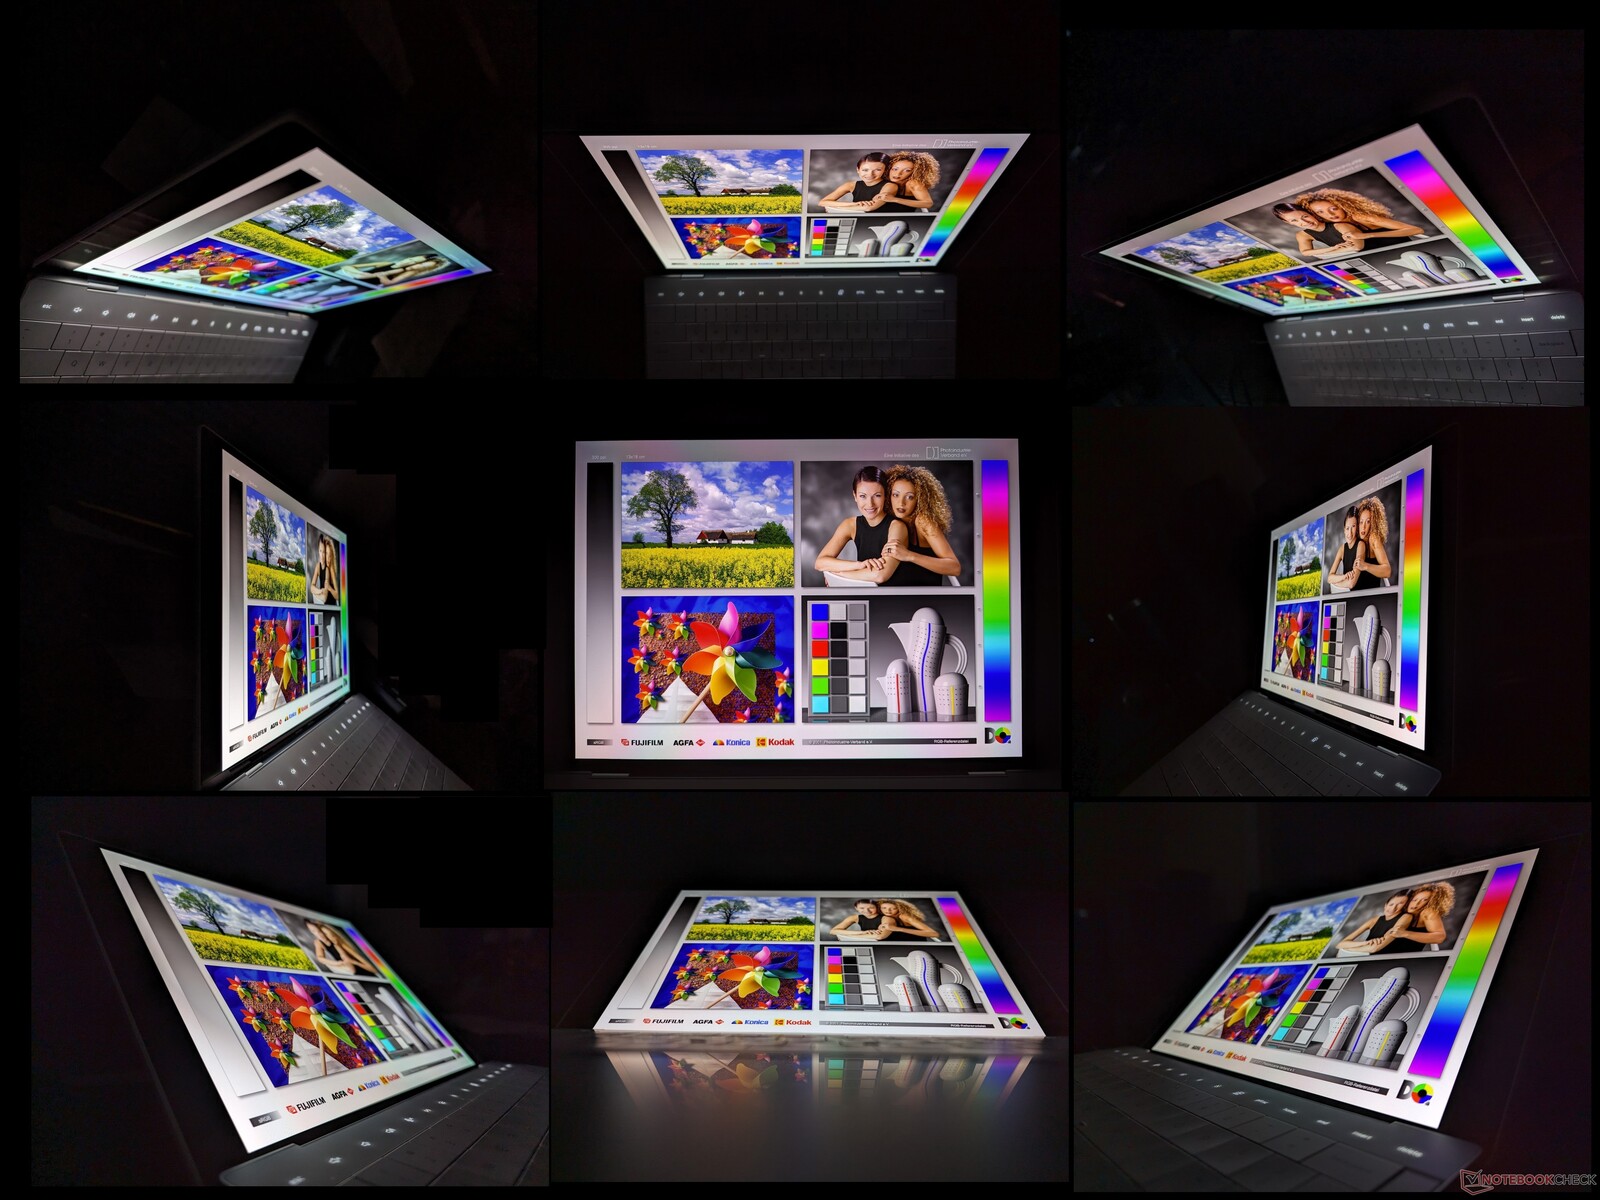
- 3456 x 2160, 60 Hz, OLED, aanraakgevoelig, glanzend, 400 nits
- 3840 x 2400, 60 Hz, IPS, aanraken, glanzend, 500 nits
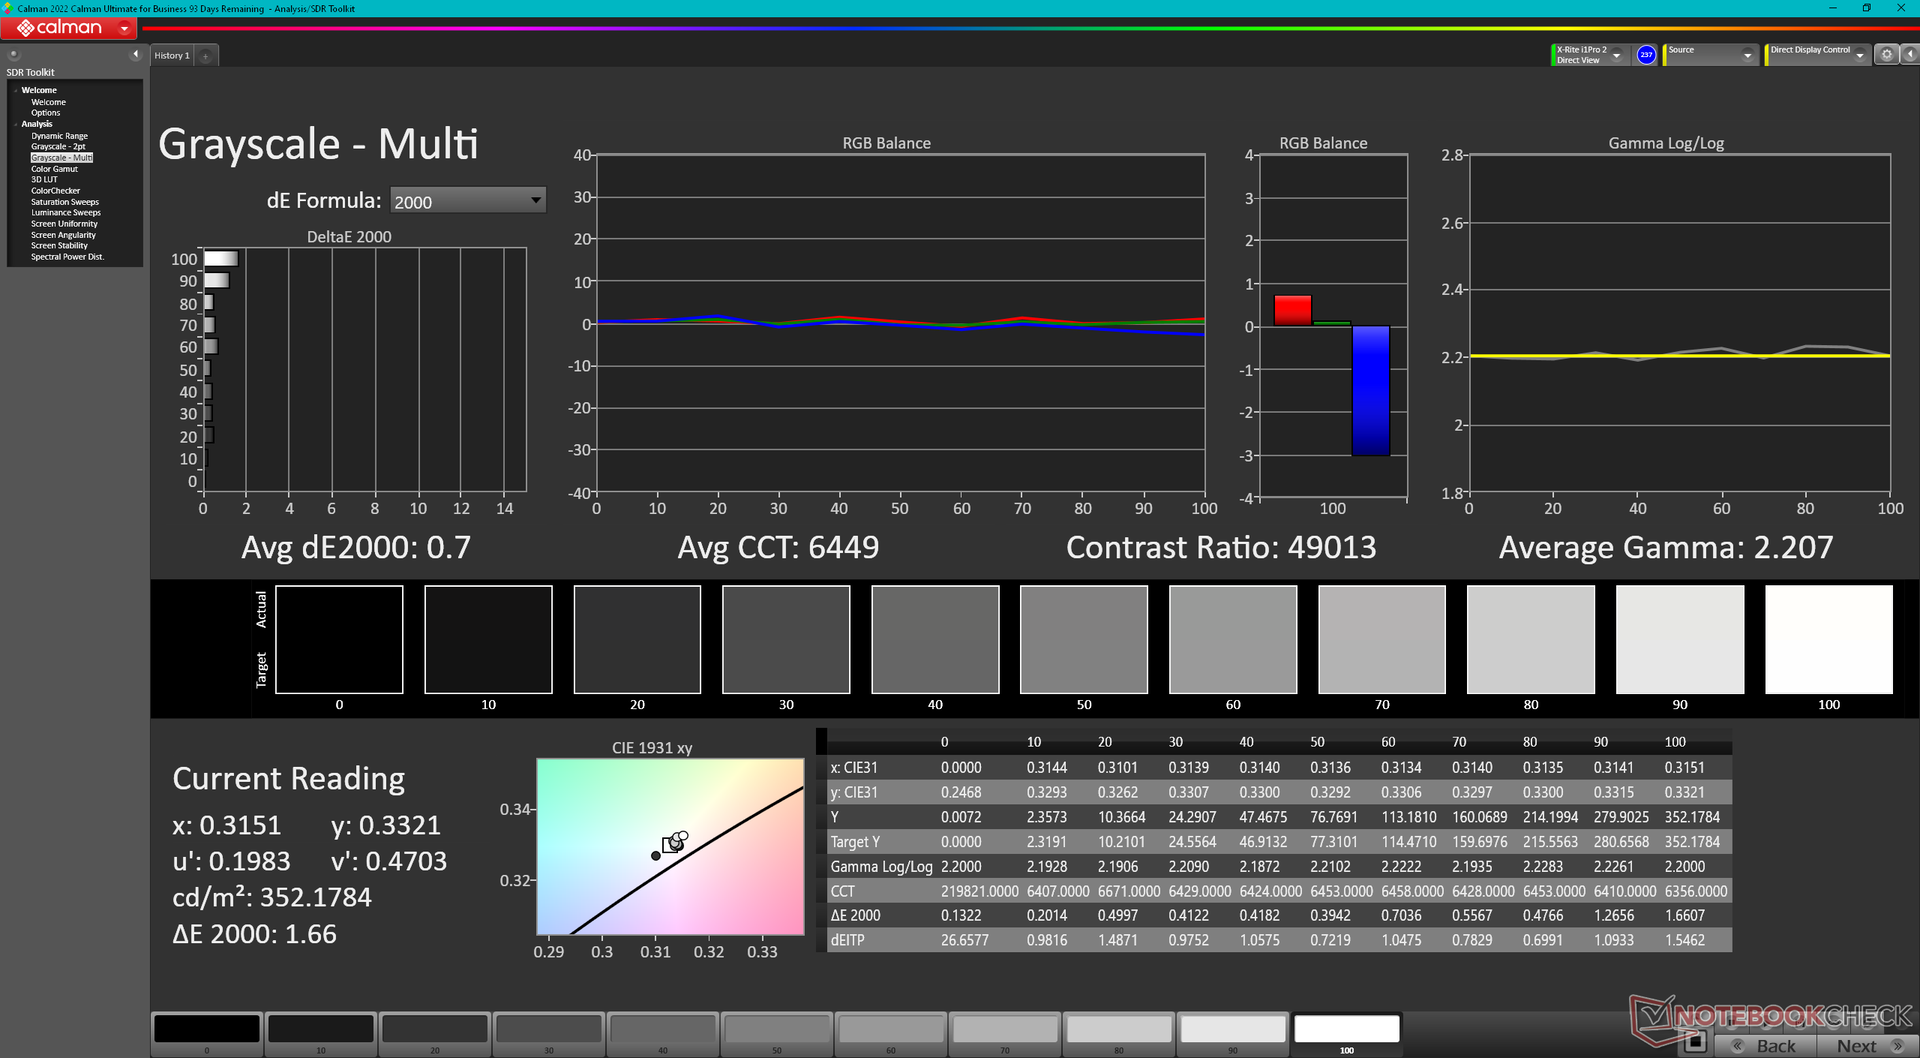
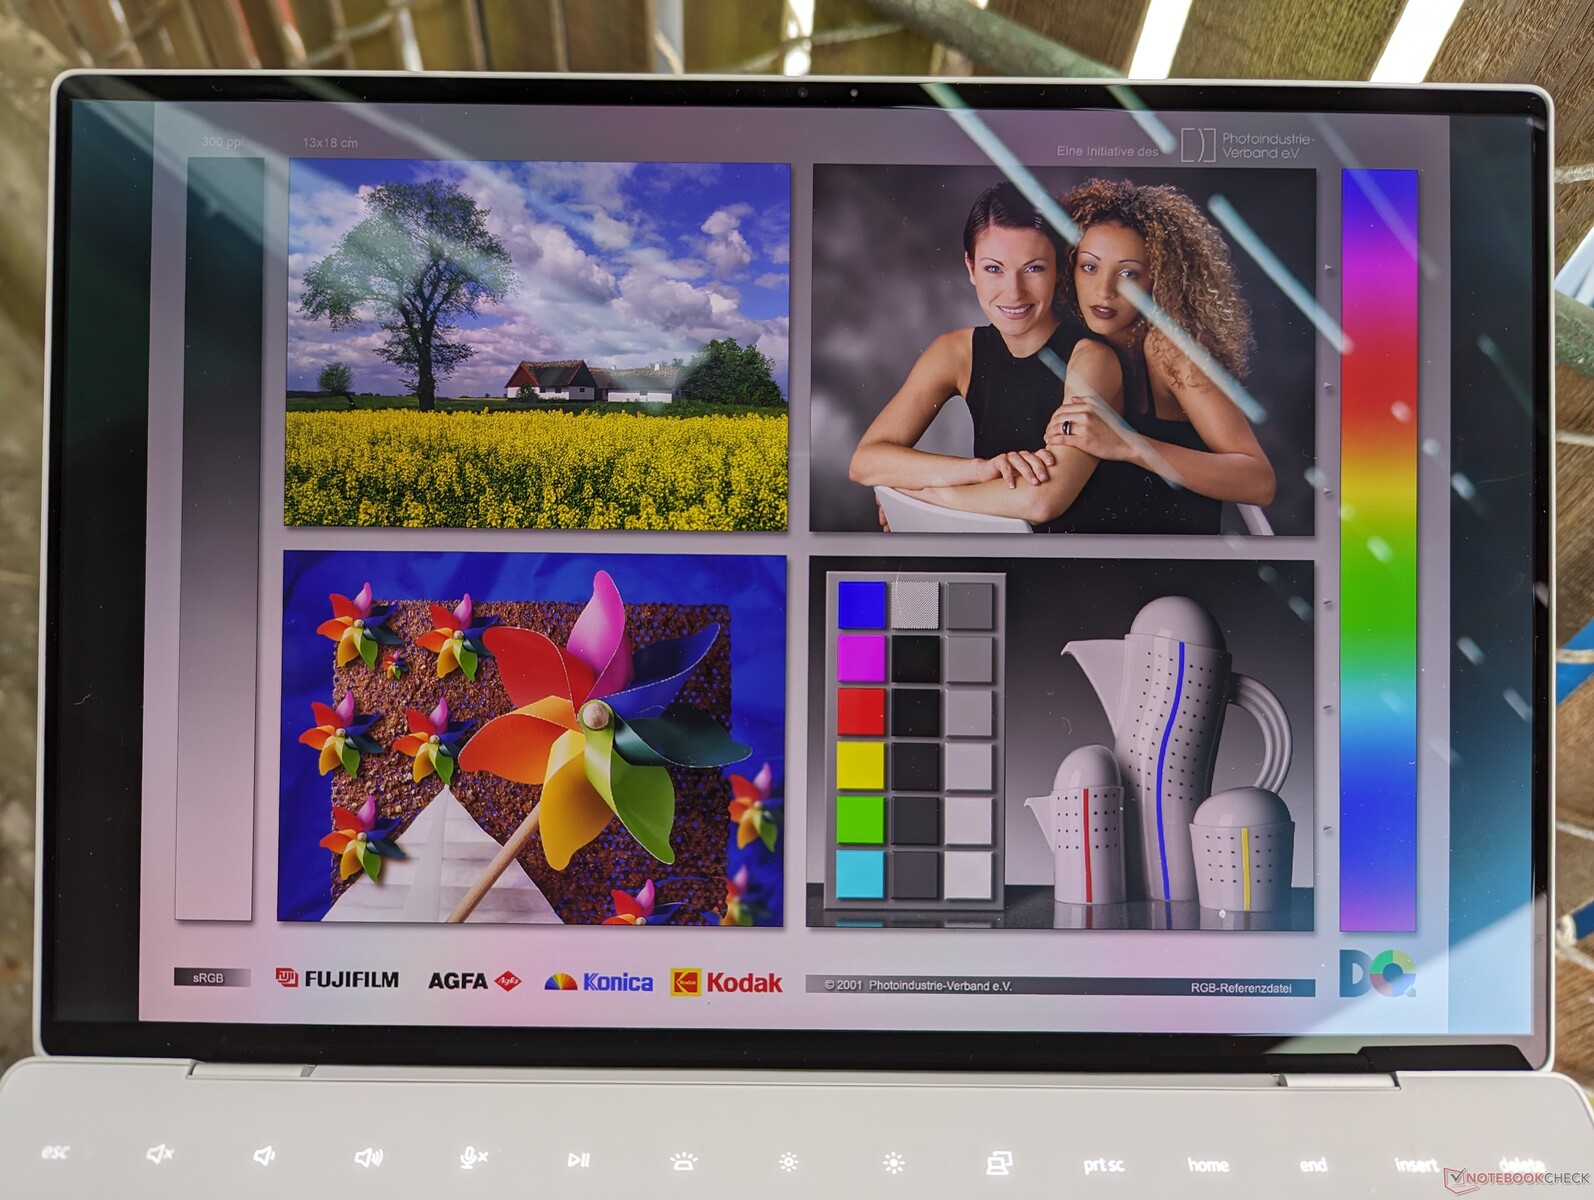
Onze OLED-configuratie maakt gebruik van hetzelfde Samsung 134XK04 paneel als op de oLED SKU van vorig jaar en dus blijft de kijkervaring identiek. Eigenaren krijgen minimaal 99 procent sRGB-dekking ongeacht de gekozen optie op basis van onze ervaringen met alle drie resolutie opties.

| |||||||||||||||||||||||||
Helderheidsverdeling: 96 %
Helderheid in Batterij-modus: 361.7 cd/m²
Contrast: ∞:1 (Zwart: 0 cd/m²)
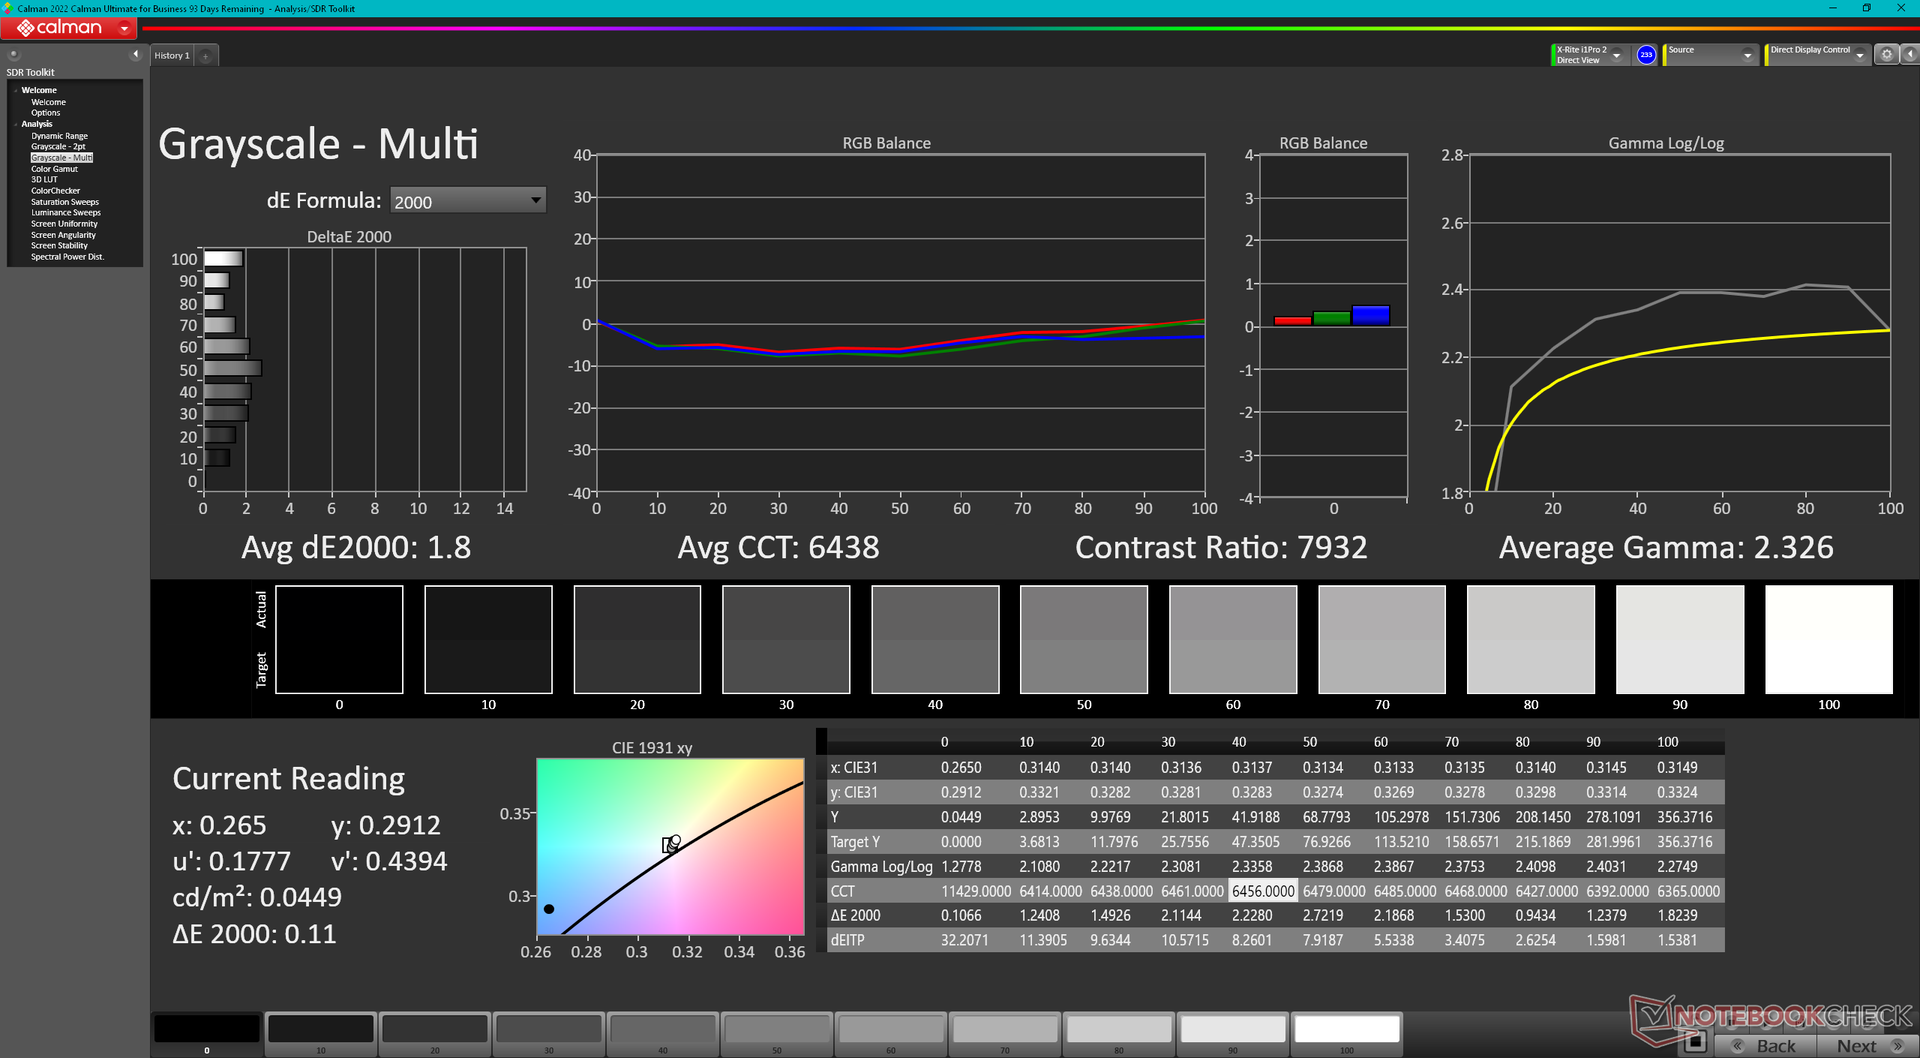
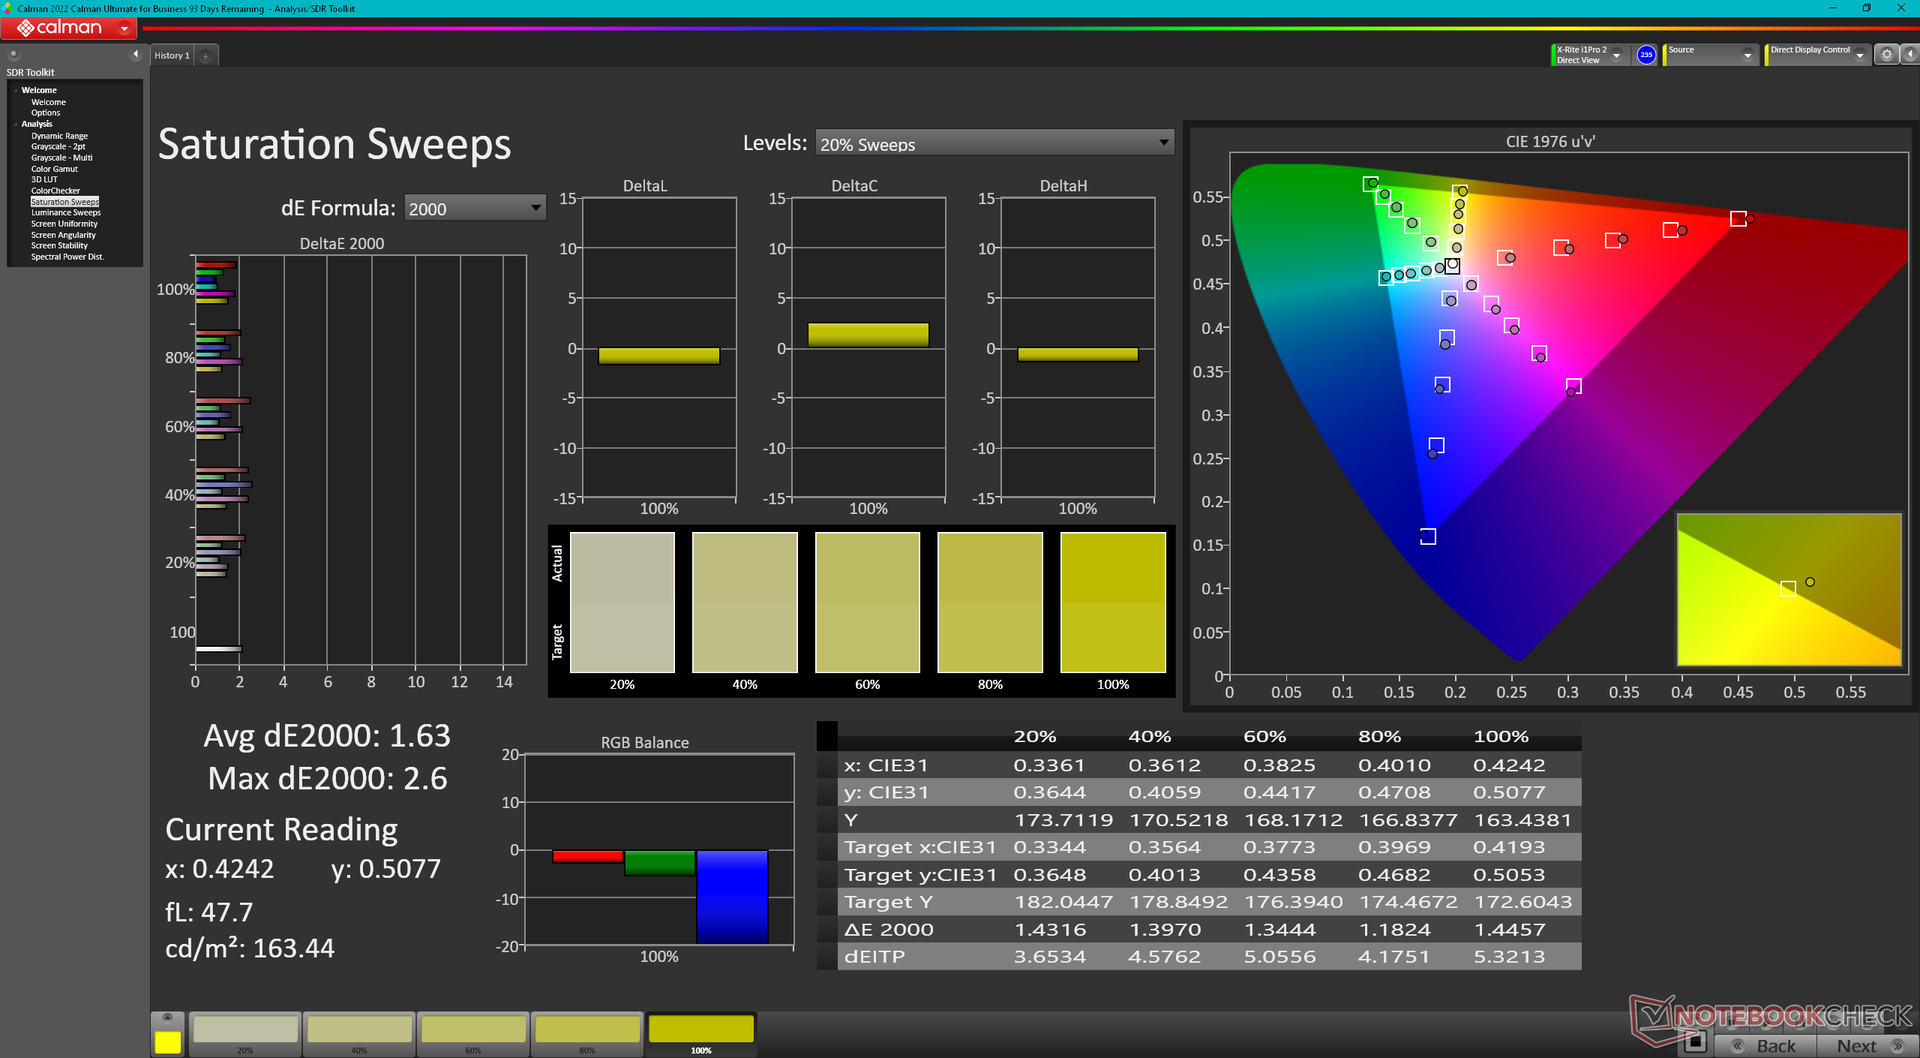
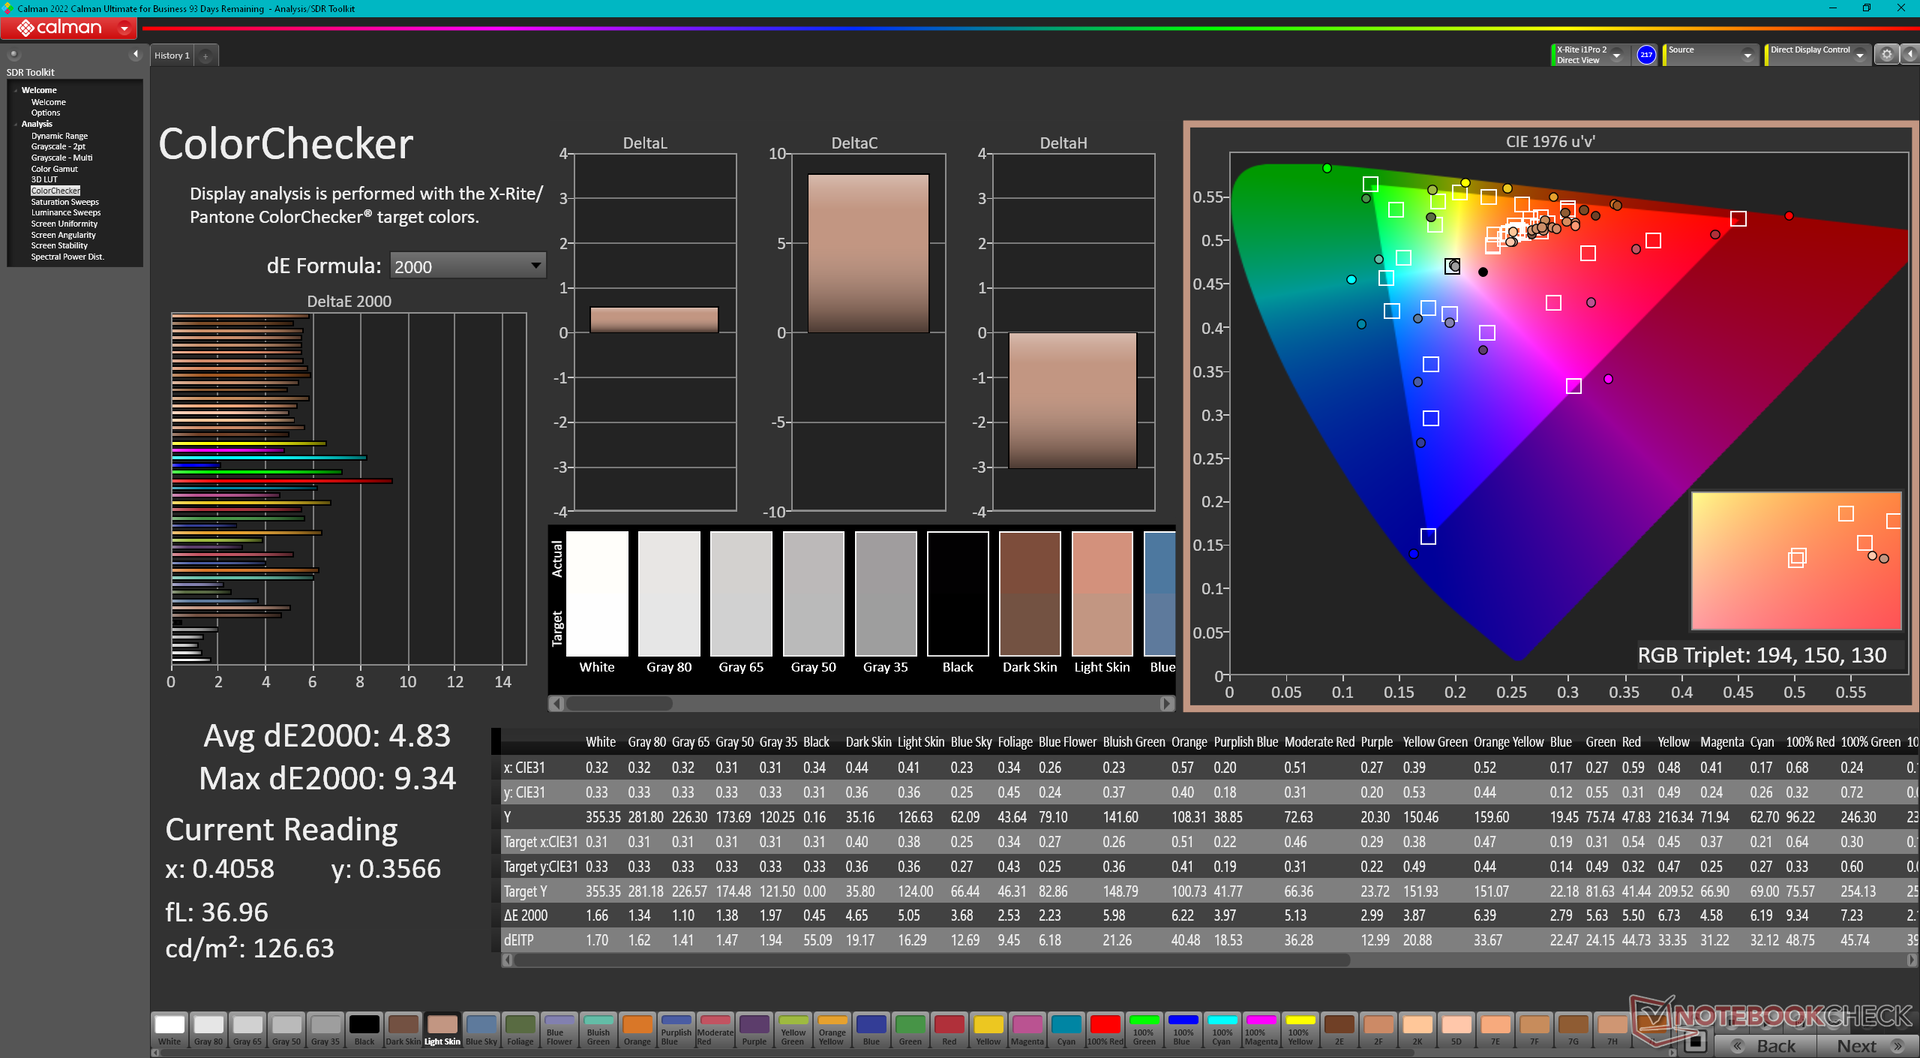
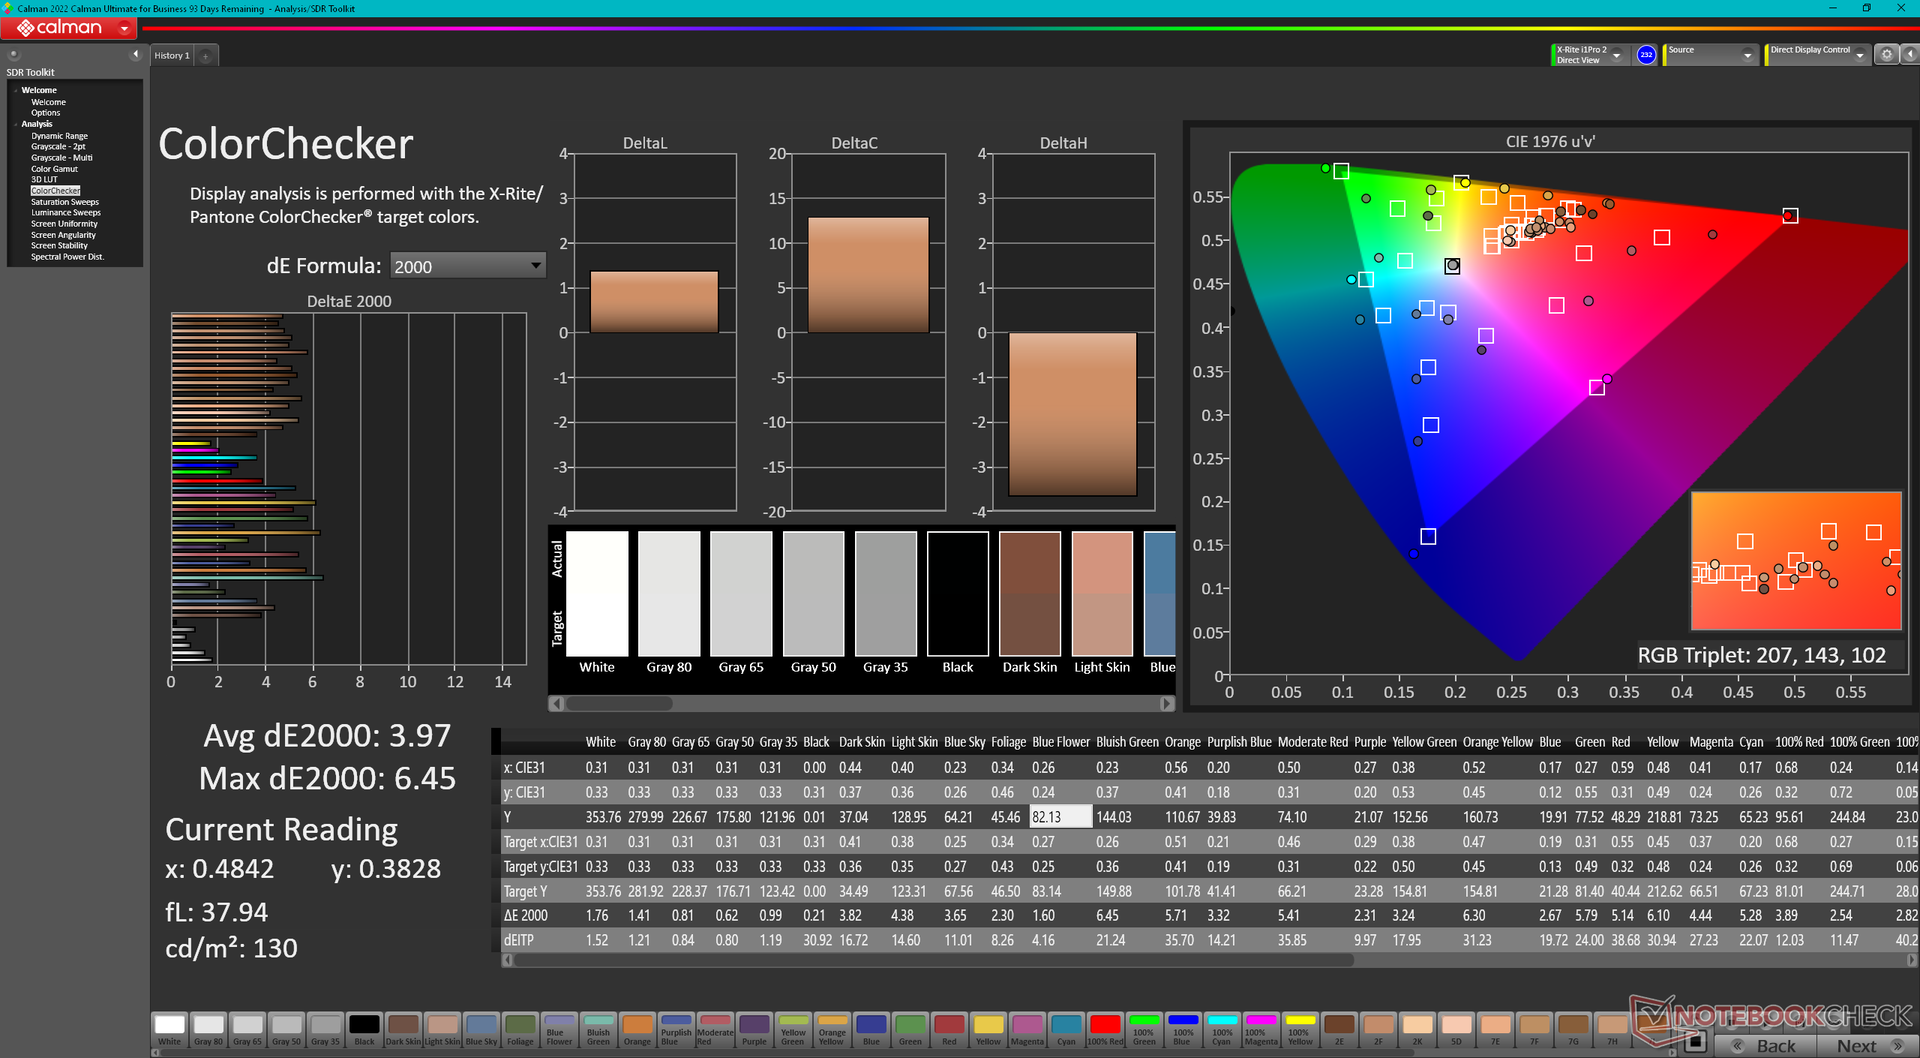
ΔE ColorChecker Calman: 4.83 | ∀{0.5-29.43 Ø4.71}
calibrated: 3.97
ΔE Greyscale Calman: 1.8 | ∀{0.09-98 Ø4.96}
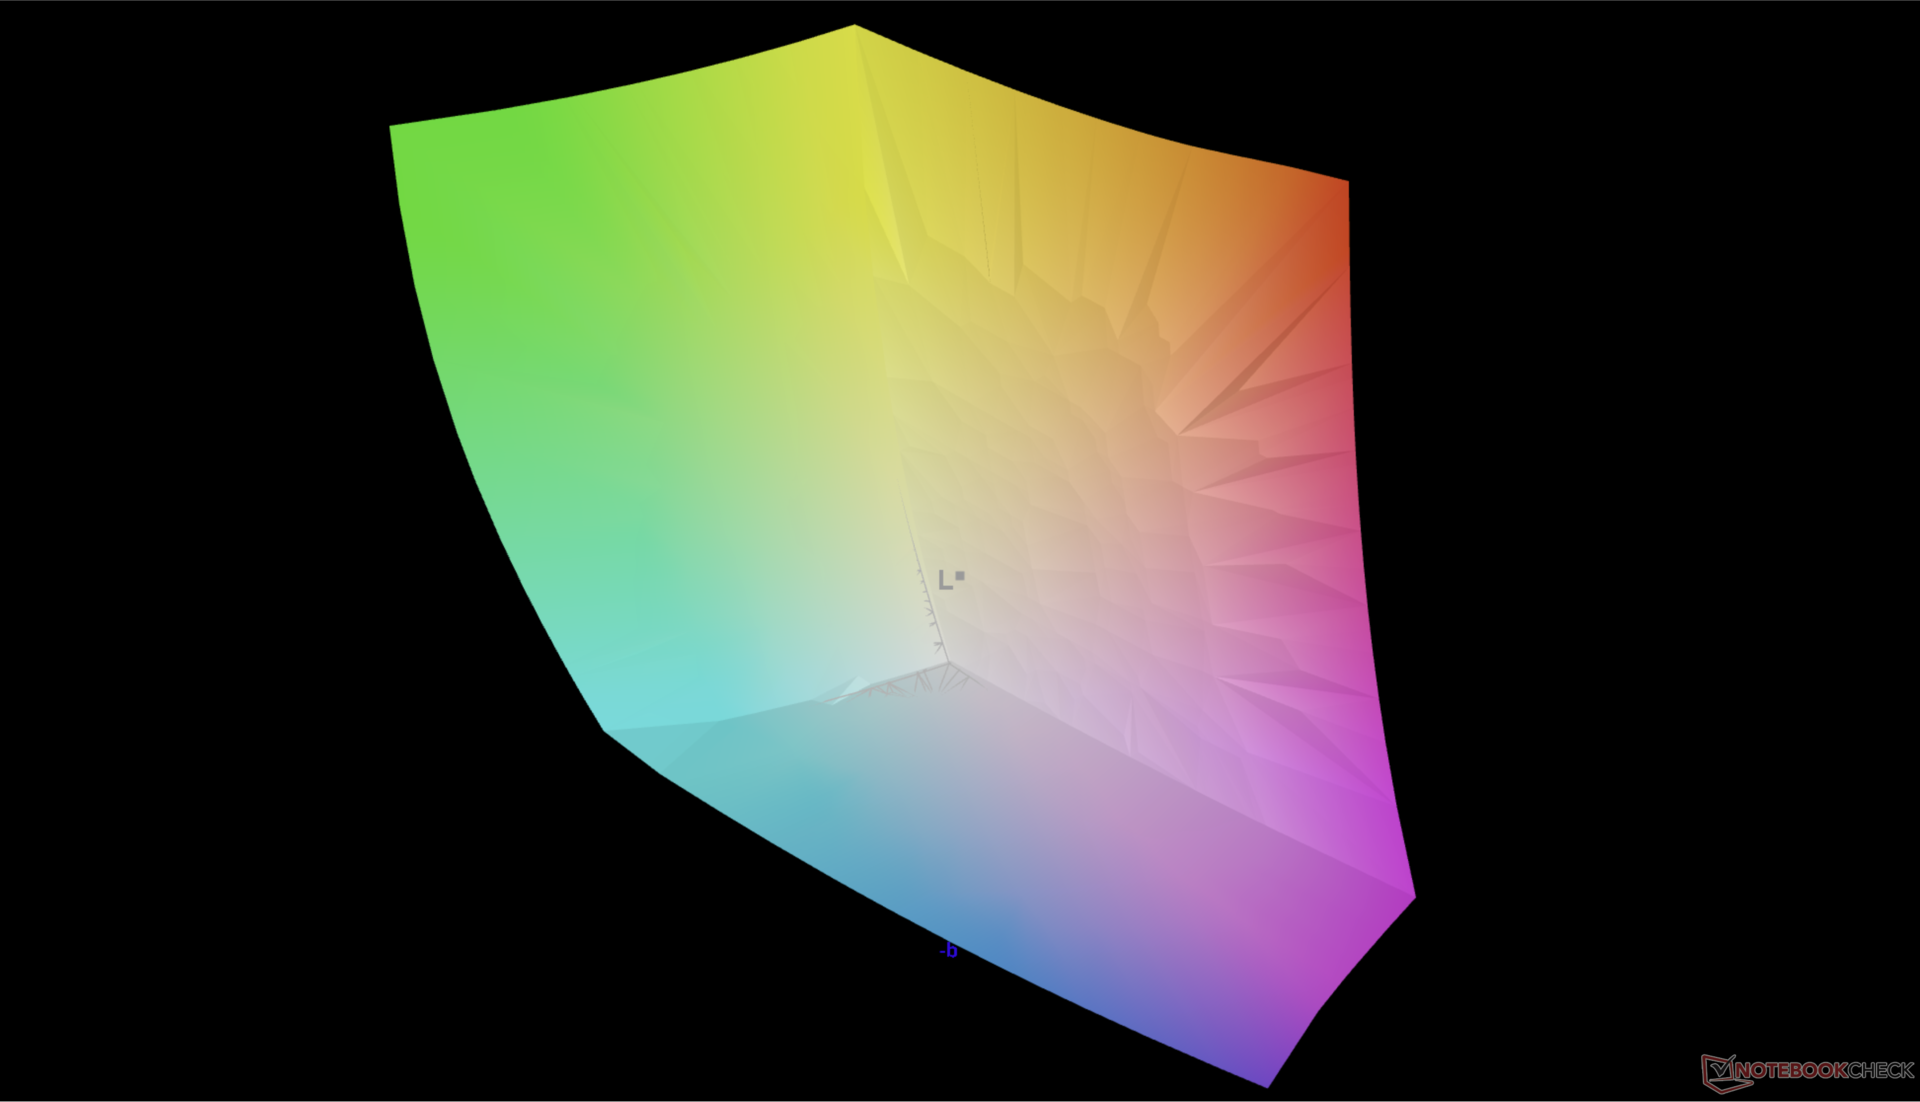
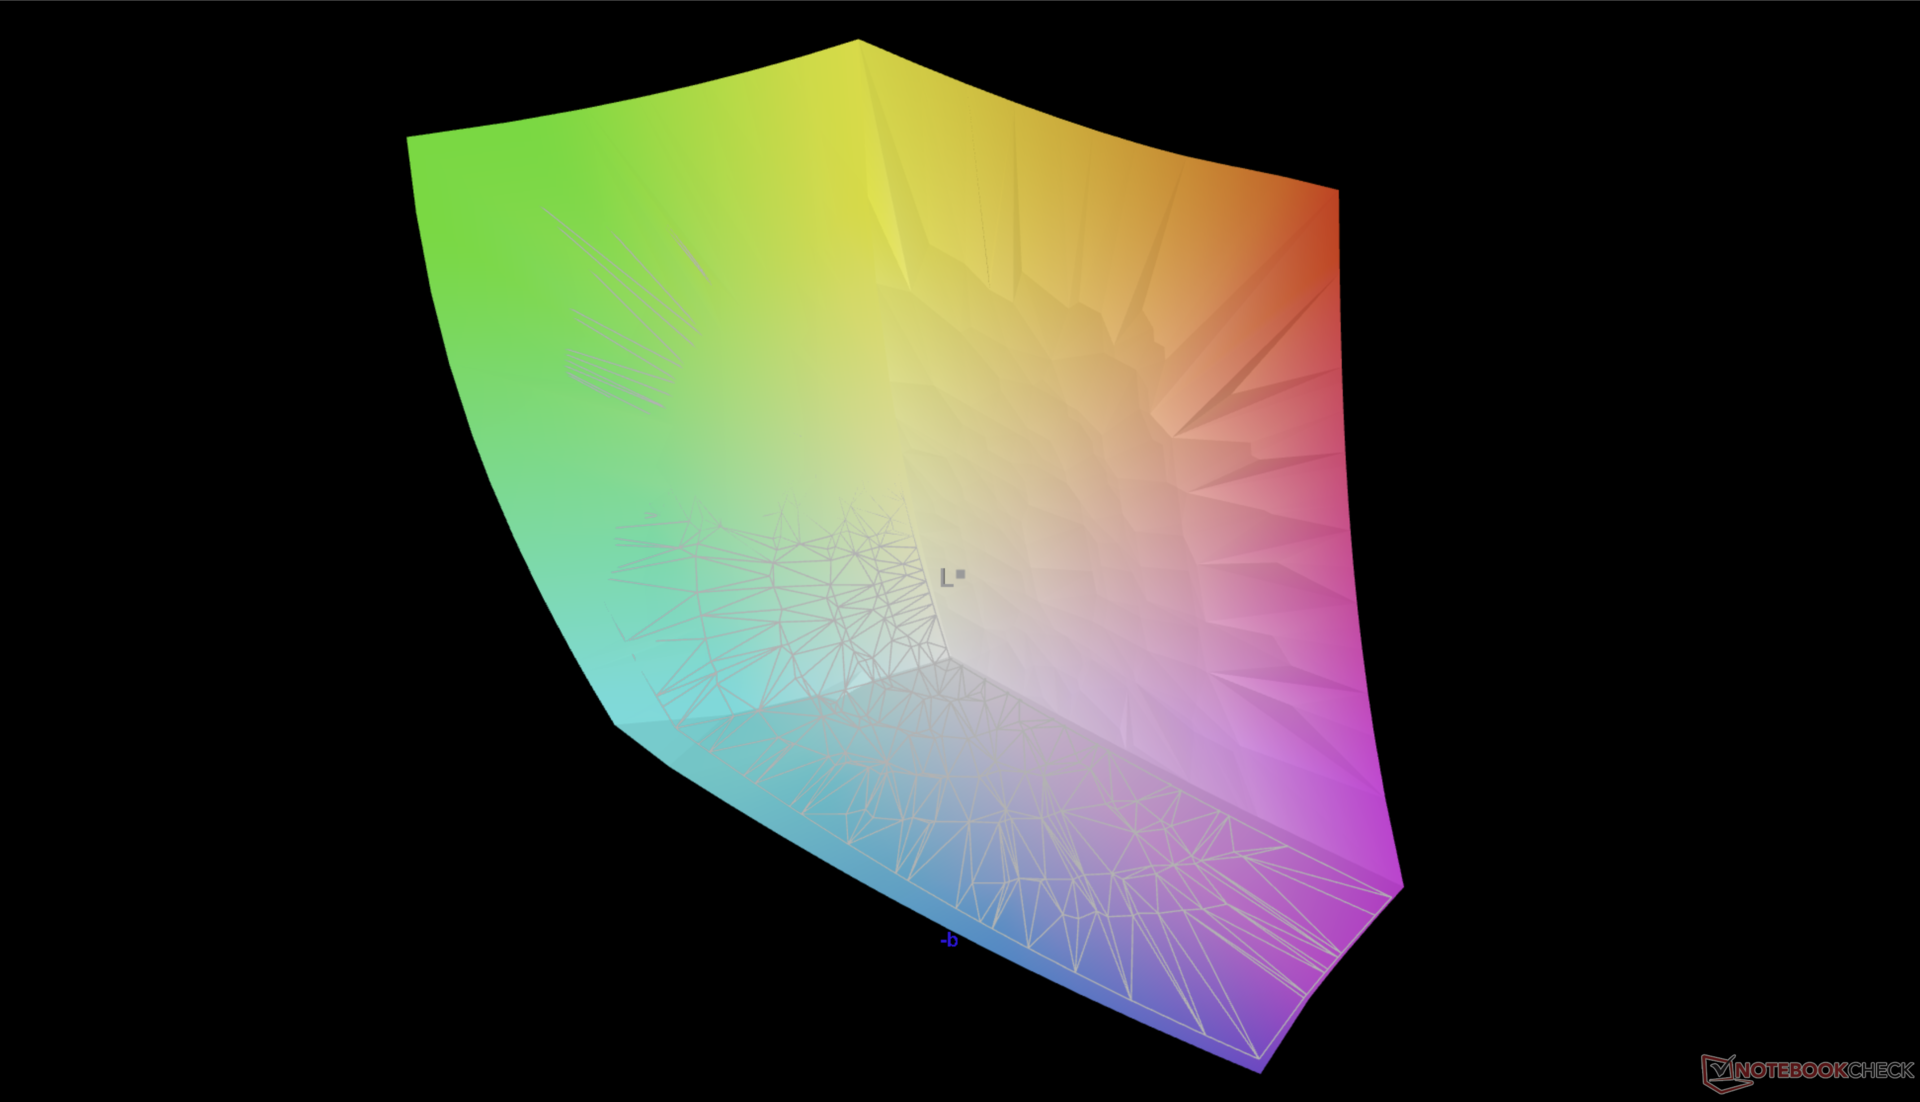
96.8% AdobeRGB 1998 (Argyll 3D)
100% sRGB (Argyll 3D)
99.7% Display P3 (Argyll 3D)
Gamma: 2.33
CCT: 6438 K
| Dell XPS 13 Plus 9320 Core i7-1360P Samsung 134XK04, OLED, 3456x2160, 13.4" | Dell XPS 13 Plus 9320 i7-1280P OLED Samsung 134XK04, OLED, 3456x2160, 13.4" | Dell XPS 13 7390 Core i7-10710U AU Optronics B133ZAN, Dell P/N: 90NTH, IPS, 3840x2160, 13.3" | Framework Laptop 13.5 13th Gen Intel BOE CQ NE135FBM-N41, IPS, 2256x1504, 13.5" | Lenovo ThinkPad X13 Yoga G3 21AW003UGE LP133WQ1-SPF2, IPS LED, 2560x1600, 13.3" | HP Spectre x360 13.5 14t-ef000 SDC4160, OLED, 3000x2000, 13.5" | |
|---|---|---|---|---|---|---|
| Display | 1% | -25% | -20% | -20% | -2% | |
| Display P3 Coverage (%) | 99.7 | 99.5 0% | 63.4 -36% | 68.9 -31% | 68 -32% | 99.9 0% |
| sRGB Coverage (%) | 100 | 100 0% | 93.7 -6% | 97.5 -2% | 98.6 -1% | 100 0% |
| AdobeRGB 1998 Coverage (%) | 96.8 | 98.4 2% | 64.3 -34% | 71.1 -27% | 69.5 -28% | 90.8 -6% |
| Response Times | -10% | -1891% | -1965% | -1617% | 5% | |
| Response Time Grey 50% / Grey 80% * (ms) | 2.18 ? | 2.6 ? -19% | 51.6 ? -2267% | 54.9 ? -2418% | 45.9 ? -2006% | 1.9 ? 13% |
| Response Time Black / White * (ms) | 2.08 ? | 2.1 ? -1% | 33.6 ? -1515% | 33.5 ? -1511% | 27.6 ? -1227% | 2.16 ? -4% |
| PWM Frequency (Hz) | 238.6 ? | 59.5 | 60.2 ? | |||
| Screen | 14% | -39% | 2% | 23% | 9% | |
| Brightness middle (cd/m²) | 361.7 | 371.8 3% | 408.2 13% | 503 39% | 438 21% | 351.7 -3% |
| Brightness (cd/m²) | 367 | 374 2% | 399 9% | 472 29% | 399 9% | 351 -4% |
| Brightness Distribution (%) | 96 | 98 2% | 89 -7% | 87 -9% | 84 -12% | 87 -9% |
| Black Level * (cd/m²) | 0.39 | 0.36 | 0.29 | |||
| Colorchecker dE 2000 * | 4.83 | 2.37 51% | 4.6 5% | 3.38 30% | 1.8 63% | 1.78 63% |
| Colorchecker dE 2000 max. * | 9.34 | 6.1 35% | 11.84 -27% | 7.08 24% | 4 57% | 6.14 34% |
| Colorchecker dE 2000 calibrated * | 3.97 | 2.03 49% | 1.21 70% | 0.8 80% | ||
| Greyscale dE 2000 * | 1.8 | 2 -11% | 7.5 -317% | 4.8 -167% | 2.8 -56% | 2.3 -28% |
| Gamma | 2.33 94% | 2.29 96% | 2.12 104% | 2.13 103% | 2.24 98% | 2.11 104% |
| CCT | 6438 101% | 6261 104% | 7966 82% | 6235 104% | 6785 96% | 6683 97% |
| Contrast (:1) | 1047 | 1397 | 1510 | |||
| Color Space (Percent of AdobeRGB 1998) (%) | 59.5 | |||||
| Color Space (Percent of sRGB) (%) | 93.5 | |||||
| Totaal Gemiddelde (Programma / Instellingen) | 2% /
6% | -652% /
-344% | -661% /
-331% | -538% /
-261% | 4% /
5% |
* ... kleiner is beter
Responstijd Scherm
| ↔ Responstijd Zwart naar Wit | ||
|---|---|---|
| 2.08 ms ... stijging ↗ en daling ↘ gecombineerd | ↗ 0.98 ms stijging | 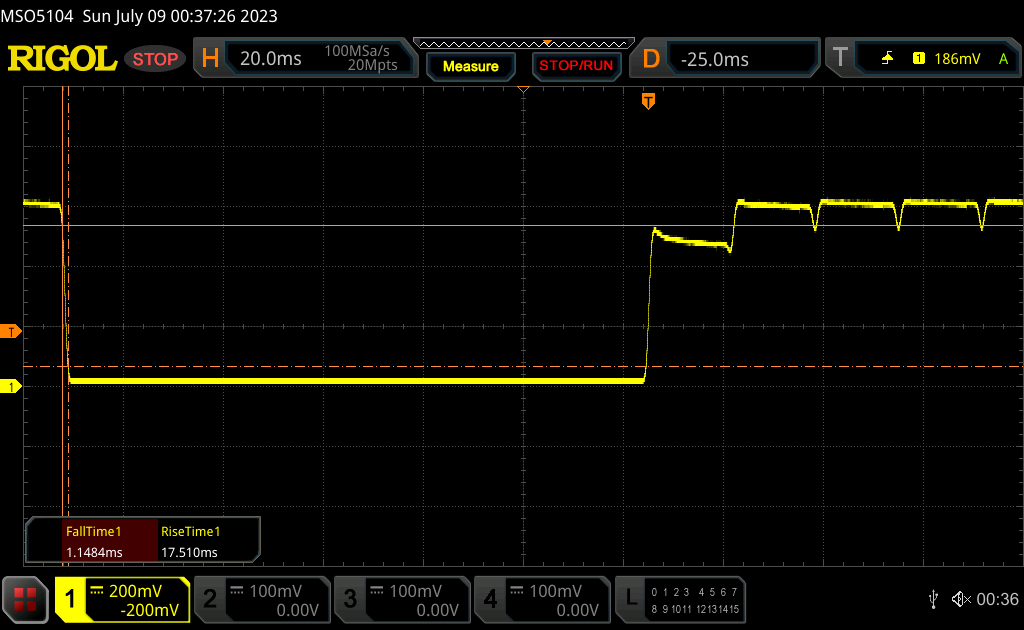 |
| ↘ 1.1 ms daling | ||
| Het scherm vertoonde erg snelle responstijden in onze tests en zou zeer geschikt moeten zijn voor snelle games. Ter vergelijking: alle testtoestellen variëren van 0.1 (minimum) tot 240 (maximum) ms. » 12 % van alle toestellen zijn beter. Dit betekent dat de gemeten responstijd beter is dan het gemiddelde (19.8 ms) van alle geteste toestellen. | ||
| ↔ Responstijd 50% Grijs naar 80% Grijs | ||
| 2.18 ms ... stijging ↗ en daling ↘ gecombineerd | ↗ 1.2 ms stijging | 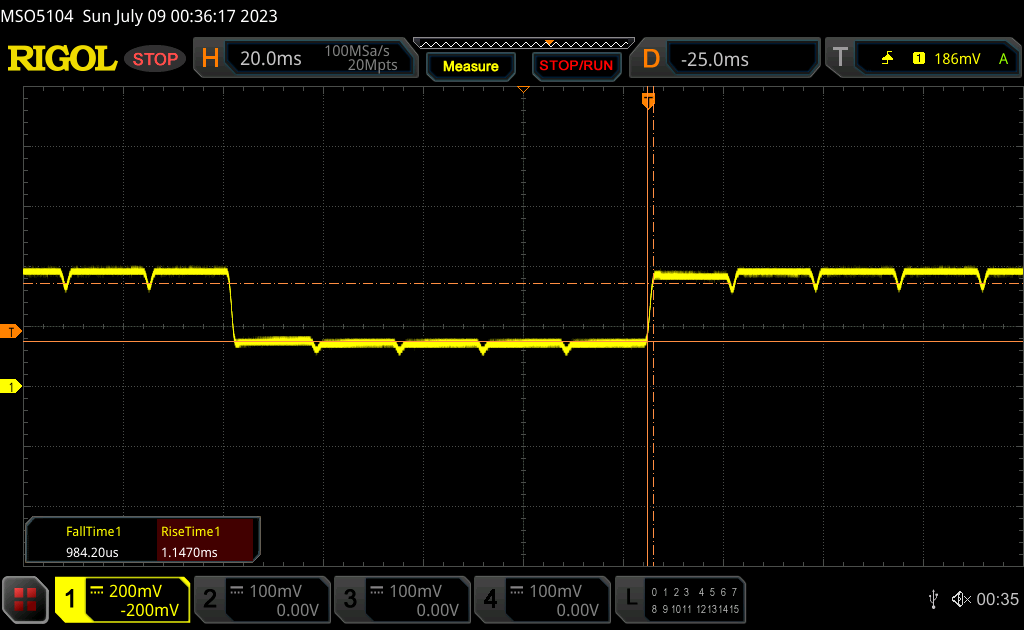 |
| ↘ 0.98 ms daling | ||
| Het scherm vertoonde erg snelle responstijden in onze tests en zou zeer geschikt moeten zijn voor snelle games. Ter vergelijking: alle testtoestellen variëren van 0.165 (minimum) tot 636 (maximum) ms. » 11 % van alle toestellen zijn beter. Dit betekent dat de gemeten responstijd beter is dan het gemiddelde (31 ms) van alle geteste toestellen. | ||
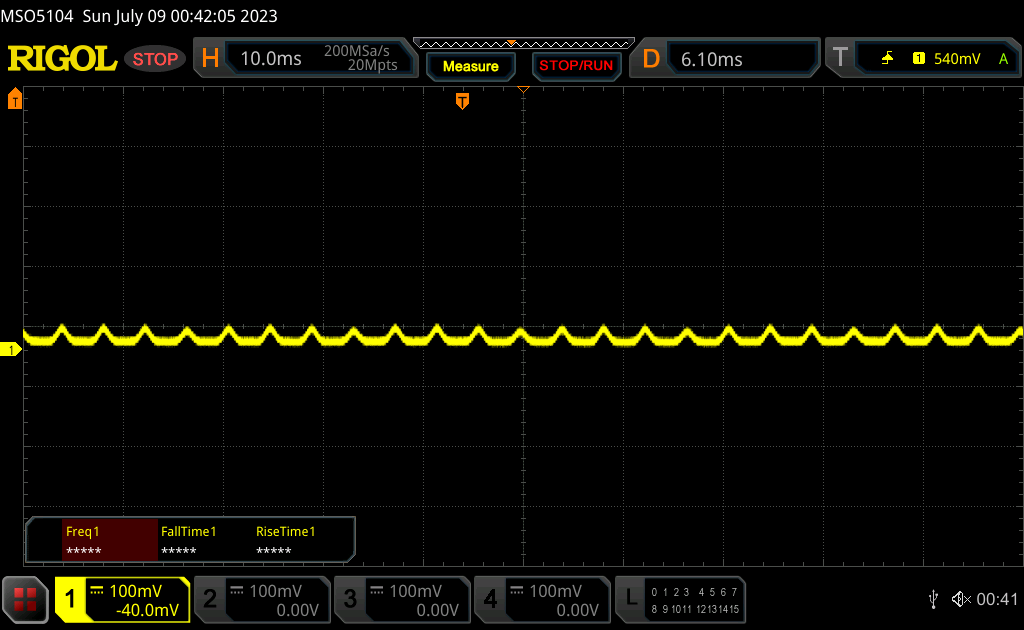
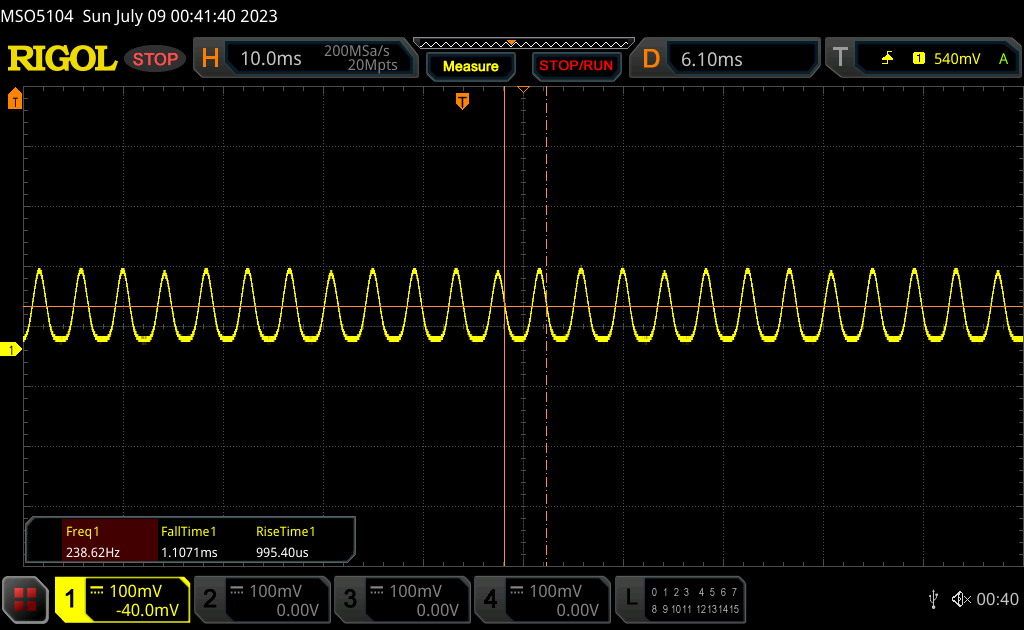
Screen Flickering / PWM (Pulse-Width Modulation)
| Screen flickering / PWM waargenomen | 238.6 Hz | ≤ 100 % helderheid instelling | 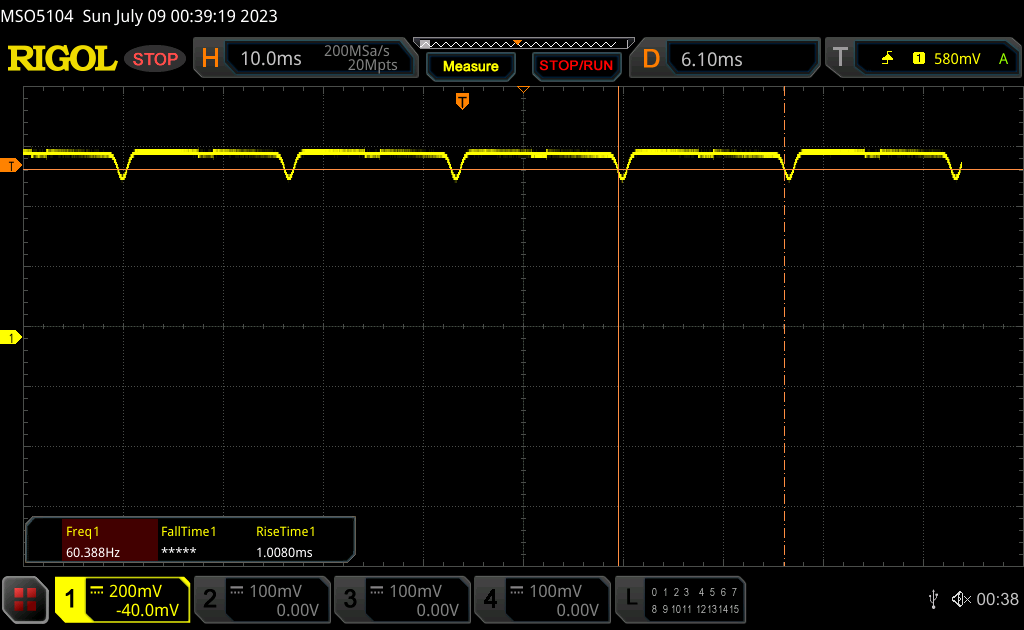 |
De achtergrondverlichting van het scherm flikkert op 238.6 Hz (in het slechtste geval, bijvoorbeeld bij gebruik van PWM) aan een helderheid van 100 % en lager. Boven deze helderheid zou er geen flickering / PWM mogen optreden. De frequentie van 238.6 Hz is redelijk laag en de meeste mensen die gevoelig zijn aan flickering kunnen dit dus waarnemen of geïrriteerde ogen krijgen (gebruikmakend van de vermelde helderheid en lager). Ter vergelijking: 52 % van alle geteste toestellen maakten geen gebruik van PWM om de schermhelderheid te verlagen. Als het wel werd gebruikt, werd een gemiddelde van 7754 (minimum: 5 - maximum: 343500) Hz waargenomen. | |||
Pulsbreedtemodulatie of flikkeren is nog steeds aanwezig op de meeste helderheidsniveaus. We kunnen een frequentie van 238,6 Hz waarnemen van 0 procent tot 52 procent helderheid en 60 Hz van 53 procent helderheid tot maximaal. De alternatieve IPS-opties zullen naar verwachting geen flikkering of PWM vertonen.

Prestaties
Testomstandigheden
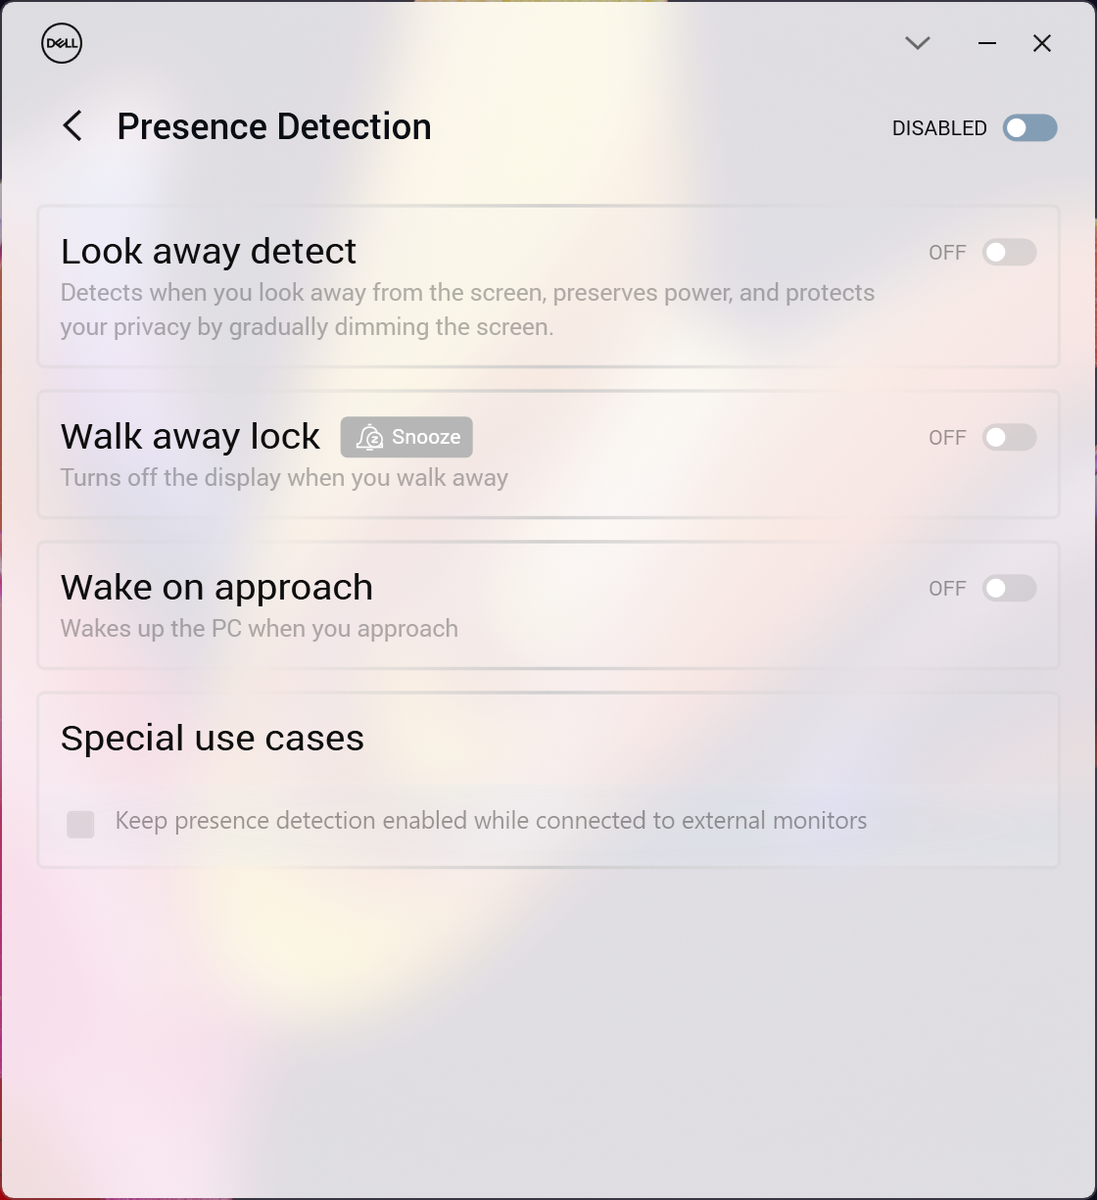
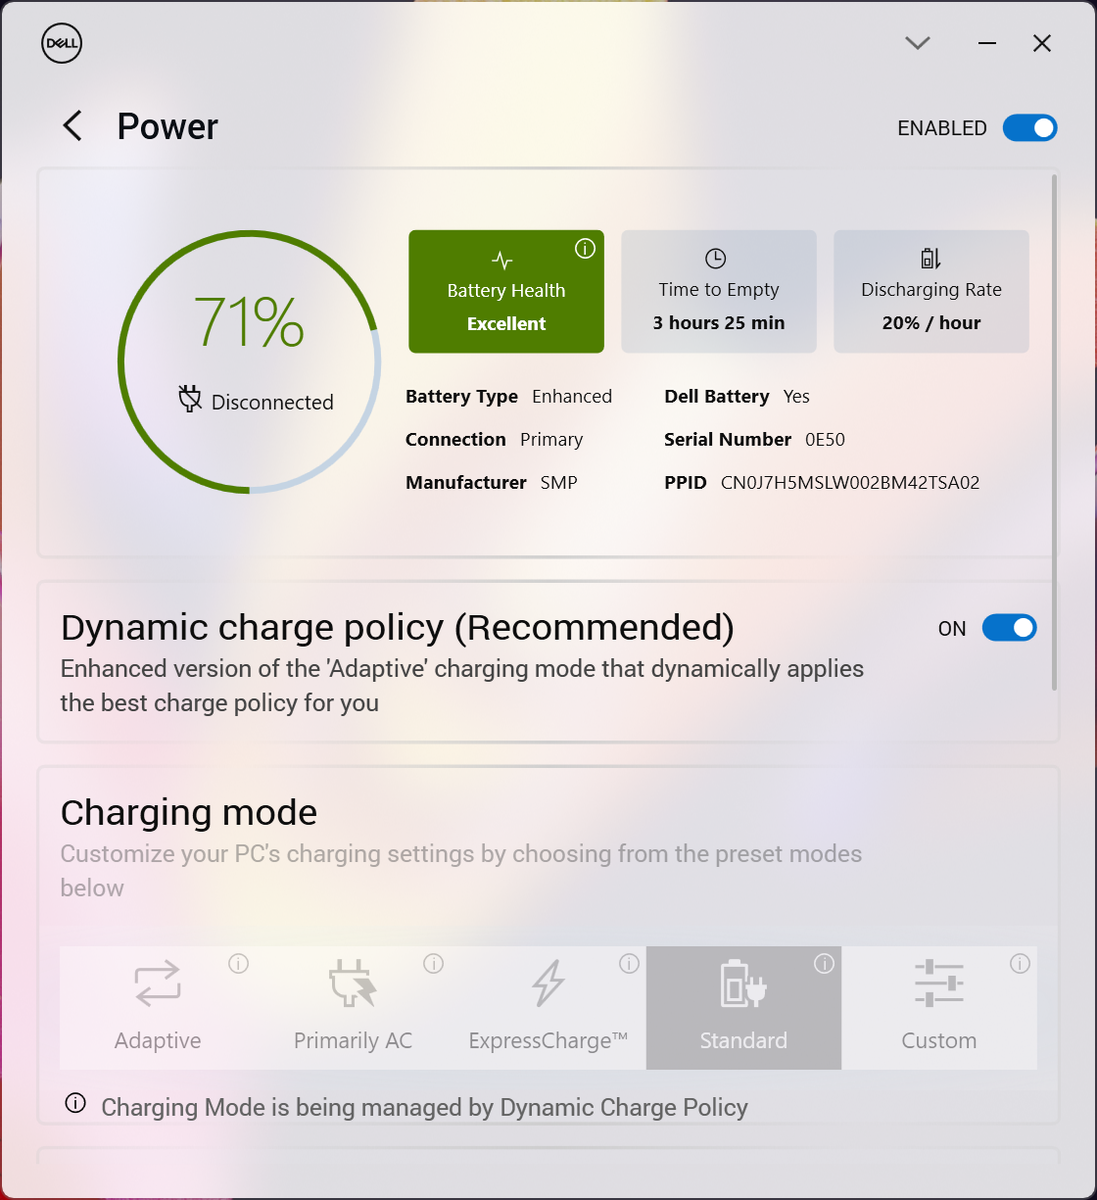
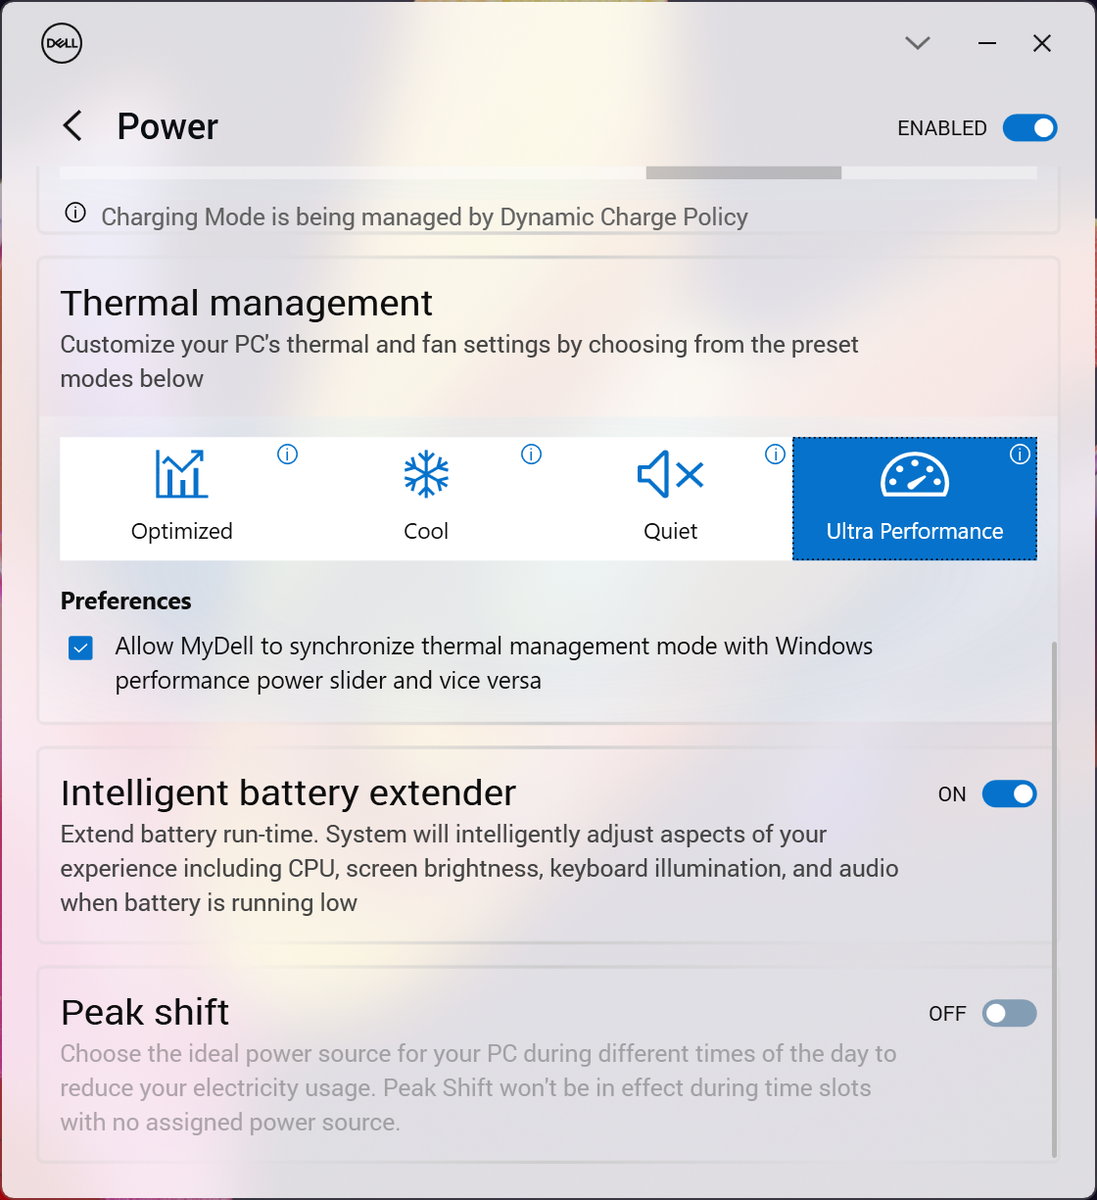
We hebben ons apparaat ingesteld op de Ultra Performance-modus via de vernieuwde MyDell-software voordat we de onderstaande benchmarks uitvoerden. MyDell is het XPS-equivalent van de Optimizer-software die met veel Latitude modellen wordt meegeleverd en bevat dus vergelijkbare functies zoals prestatieprofielen, oplaadgewoonten en aanwezigheidsdetectie. De Dell energieprofielen kunnen eenvoudig worden gesynchroniseerd met de standaard Windows profielen, in tegenstelling tot de meeste andere laptops.
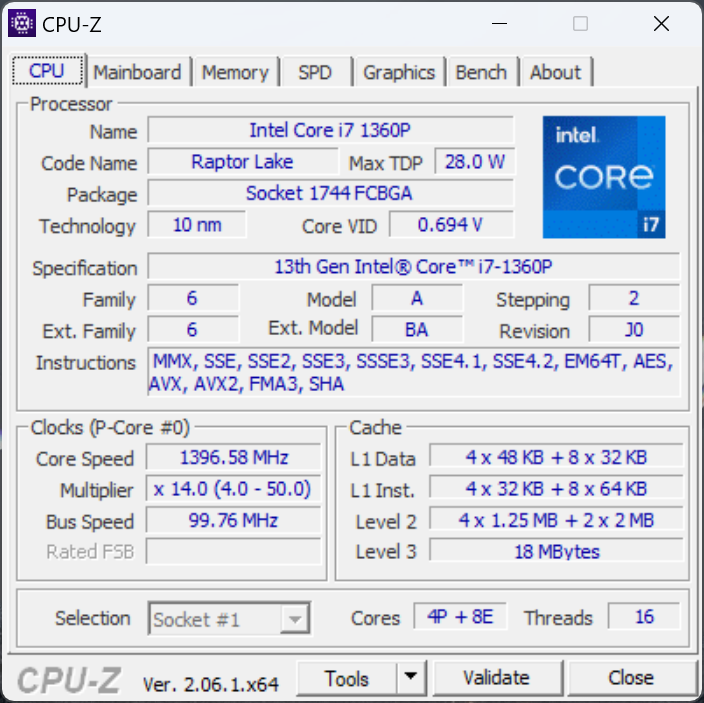
Processor
Multi-thread prestaties van onze 13e generatie Core i7-1360P zijn bijna identiek aan die van de 12e generatie Core i7-1280P in de 2022 XPS 13 Plus. Zelfs hun Turbo Boost-gedrag is hetzelfde, zoals blijkt uit de CineBench R15 xT loop-testresultaten hieronder. DeLenovo Yoga 9 14IRP G8die wordt geleverd met dezelfde Core i7-1360P, is in staat om iets hogere Turbo Boost kloksnelheden langer vol te houden onder dezelfde test.
Terwijl de multi-thread prestaties jaar-op-jaar niet echt zijn veranderd, zijn de single-thread prestaties met ruwweg 10 tot 15 procent toegenomen ten opzichte van de Core i7-1280P. Er wordt echter niet verwacht dat dit veel invloed zal hebben op de dagelijkse werkbelasting, aangezien de meeste moderne toepassingen multi-threaded zijn.
Cinebench R15 Multi Loop
Cinebench R20: CPU (Multi Core) | CPU (Single Core)
Cinebench R23: Multi Core | Single Core
Cinebench R15: CPU Multi 64Bit | CPU Single 64Bit
Blender: v2.79 BMW27 CPU
7-Zip 18.03: 7z b 4 | 7z b 4 -mmt1
Geekbench 5.5: Multi-Core | Single-Core
HWBOT x265 Benchmark v2.2: 4k Preset
LibreOffice : 20 Documents To PDF
R Benchmark 2.5: Overall mean
* ... kleiner is beter
AIDA64: FP32 Ray-Trace | FPU Julia | CPU SHA3 | CPU Queen | FPU SinJulia | FPU Mandel | CPU AES | CPU ZLib | FP64 Ray-Trace | CPU PhotoWorxx
| Performance rating | |
| Framework Laptop 13.5 13th Gen Intel | |
| Dell XPS 13 Plus 9320 i7-1280P OLED | |
| Dell XPS 13 Plus 9320 Core i7-1360P | |
| HP Spectre x360 13.5 14t-ef000 | |
| Lenovo ThinkPad X13 Yoga G3 21AW003UGE | |
| AIDA64 / FP32 Ray-Trace | |
| Framework Laptop 13.5 13th Gen Intel | |
| Dell XPS 13 Plus 9320 i7-1280P OLED | |
| Dell XPS 13 Plus 9320 Core i7-1360P | |
| Lenovo ThinkPad X13 Yoga G3 21AW003UGE | |
| HP Spectre x360 13.5 14t-ef000 | |
| AIDA64 / FPU Julia | |
| Framework Laptop 13.5 13th Gen Intel | |
| Dell XPS 13 Plus 9320 i7-1280P OLED | |
| Dell XPS 13 Plus 9320 Core i7-1360P | |
| Lenovo ThinkPad X13 Yoga G3 21AW003UGE | |
| HP Spectre x360 13.5 14t-ef000 | |
| AIDA64 / CPU SHA3 | |
| Framework Laptop 13.5 13th Gen Intel | |
| Dell XPS 13 Plus 9320 i7-1280P OLED | |
| Dell XPS 13 Plus 9320 Core i7-1360P | |
| Lenovo ThinkPad X13 Yoga G3 21AW003UGE | |
| HP Spectre x360 13.5 14t-ef000 | |
| AIDA64 / CPU Queen | |
| Framework Laptop 13.5 13th Gen Intel | |
| Dell XPS 13 Plus 9320 i7-1280P OLED | |
| Dell XPS 13 Plus 9320 Core i7-1360P | |
| Lenovo ThinkPad X13 Yoga G3 21AW003UGE | |
| HP Spectre x360 13.5 14t-ef000 | |
| AIDA64 / FPU SinJulia | |
| Framework Laptop 13.5 13th Gen Intel | |
| Dell XPS 13 Plus 9320 i7-1280P OLED | |
| Dell XPS 13 Plus 9320 Core i7-1360P | |
| Lenovo ThinkPad X13 Yoga G3 21AW003UGE | |
| HP Spectre x360 13.5 14t-ef000 | |
| AIDA64 / FPU Mandel | |
| Framework Laptop 13.5 13th Gen Intel | |
| Dell XPS 13 Plus 9320 i7-1280P OLED | |
| Dell XPS 13 Plus 9320 Core i7-1360P | |
| Lenovo ThinkPad X13 Yoga G3 21AW003UGE | |
| HP Spectre x360 13.5 14t-ef000 | |
| AIDA64 / CPU AES | |
| Framework Laptop 13.5 13th Gen Intel | |
| HP Spectre x360 13.5 14t-ef000 | |
| Dell XPS 13 Plus 9320 i7-1280P OLED | |
| Dell XPS 13 Plus 9320 Core i7-1360P | |
| Lenovo ThinkPad X13 Yoga G3 21AW003UGE | |
| AIDA64 / CPU ZLib | |
| Framework Laptop 13.5 13th Gen Intel | |
| Dell XPS 13 Plus 9320 Core i7-1360P | |
| Dell XPS 13 Plus 9320 i7-1280P OLED | |
| Lenovo ThinkPad X13 Yoga G3 21AW003UGE | |
| HP Spectre x360 13.5 14t-ef000 | |
| AIDA64 / FP64 Ray-Trace | |
| Framework Laptop 13.5 13th Gen Intel | |
| Dell XPS 13 Plus 9320 i7-1280P OLED | |
| Dell XPS 13 Plus 9320 Core i7-1360P | |
| HP Spectre x360 13.5 14t-ef000 | |
| Lenovo ThinkPad X13 Yoga G3 21AW003UGE | |
| AIDA64 / CPU PhotoWorxx | |
| Dell XPS 13 Plus 9320 Core i7-1360P | |
| Dell XPS 13 Plus 9320 i7-1280P OLED | |
| HP Spectre x360 13.5 14t-ef000 | |
| Lenovo ThinkPad X13 Yoga G3 21AW003UGE | |
| Framework Laptop 13.5 13th Gen Intel | |
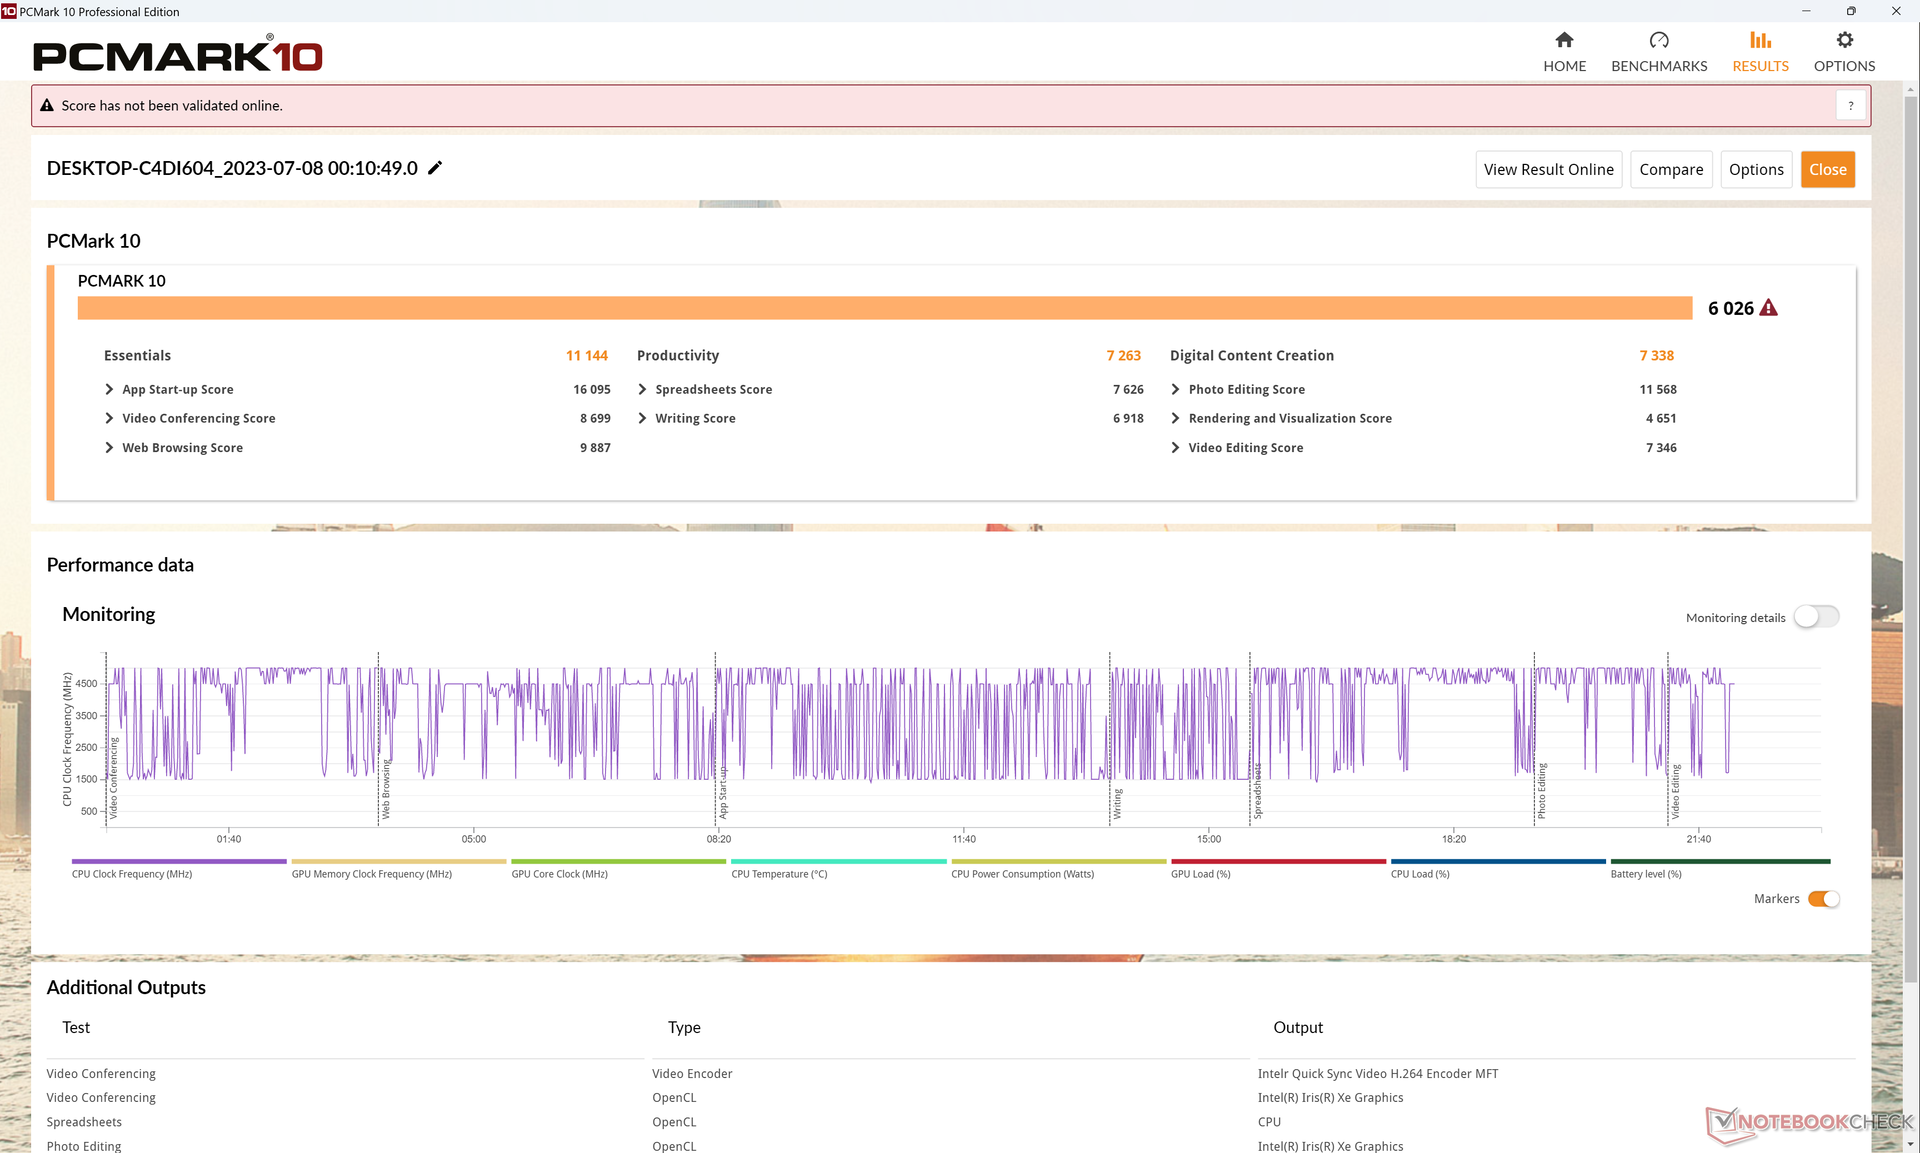
Systeemprestaties
De PCMark-resultaten zijn net iets maar consequent beter dan de XPS 13 Plus van vorig jaar met enkele cijfers, waarschijnlijk dankzij het snellere RAM en iets snellere single-thread prestaties.
CrossMark: Overall | Productivity | Creativity | Responsiveness
| PCMark 10 / Productivity | |
| Framework Laptop 13.5 13th Gen Intel | |
| Gemiddeld Intel Core i7-1360P (6572 - 9371, n=16) | |
| HP Spectre x360 13.5 14t-ef000 | |
| Dell XPS 13 Plus 9320 Core i7-1360P | |
| Dell XPS 13 Plus 9320 i7-1280P OLED | |
| Lenovo ThinkPad X13 Yoga G3 21AW003UGE | |
| Dell XPS 13 7390 Core i7-10710U | |
| PCMark 10 / Digital Content Creation | |
| Framework Laptop 13.5 13th Gen Intel | |
| Dell XPS 13 Plus 9320 Core i7-1360P | |
| Gemiddeld Intel Core i7-1360P (5723 - 9597, n=16) | |
| Dell XPS 13 Plus 9320 i7-1280P OLED | |
| HP Spectre x360 13.5 14t-ef000 | |
| Lenovo ThinkPad X13 Yoga G3 21AW003UGE | |
| Dell XPS 13 7390 Core i7-10710U | |
| CrossMark / Overall | |
| Dell XPS 13 Plus 9320 Core i7-1360P | |
| Dell XPS 13 Plus 9320 i7-1280P OLED | |
| Framework Laptop 13.5 13th Gen Intel | |
| Gemiddeld Intel Core i7-1360P (1527 - 1891, n=15) | |
| HP Spectre x360 13.5 14t-ef000 | |
| Lenovo ThinkPad X13 Yoga G3 21AW003UGE | |
| CrossMark / Productivity | |
| Framework Laptop 13.5 13th Gen Intel | |
| Dell XPS 13 Plus 9320 Core i7-1360P | |
| Dell XPS 13 Plus 9320 i7-1280P OLED | |
| Gemiddeld Intel Core i7-1360P (1503 - 1842, n=15) | |
| HP Spectre x360 13.5 14t-ef000 | |
| Lenovo ThinkPad X13 Yoga G3 21AW003UGE | |
| CrossMark / Creativity | |
| Dell XPS 13 Plus 9320 Core i7-1360P | |
| Dell XPS 13 Plus 9320 i7-1280P OLED | |
| Framework Laptop 13.5 13th Gen Intel | |
| Gemiddeld Intel Core i7-1360P (1558 - 2003, n=15) | |
| HP Spectre x360 13.5 14t-ef000 | |
| Lenovo ThinkPad X13 Yoga G3 21AW003UGE | |
| CrossMark / Responsiveness | |
| Gemiddeld Intel Core i7-1360P (1311 - 1899, n=15) | |
| Dell XPS 13 Plus 9320 i7-1280P OLED | |
| Dell XPS 13 Plus 9320 Core i7-1360P | |
| Framework Laptop 13.5 13th Gen Intel | |
| HP Spectre x360 13.5 14t-ef000 | |
| Lenovo ThinkPad X13 Yoga G3 21AW003UGE | |
| PCMark 10 Score | 6026 punten | |
Help | ||
| AIDA64 / Memory Copy | |
| Dell XPS 13 Plus 9320 Core i7-1360P | |
| Dell XPS 13 Plus 9320 i7-1280P OLED | |
| Gemiddeld Intel Core i7-1360P (44299 - 72748, n=16) | |
| HP Spectre x360 13.5 14t-ef000 | |
| Lenovo ThinkPad X13 Yoga G3 21AW003UGE | |
| Framework Laptop 13.5 13th Gen Intel | |
| AIDA64 / Memory Read | |
| Dell XPS 13 Plus 9320 i7-1280P OLED | |
| Dell XPS 13 Plus 9320 Core i7-1360P | |
| HP Spectre x360 13.5 14t-ef000 | |
| Gemiddeld Intel Core i7-1360P (44751 - 68945, n=16) | |
| Lenovo ThinkPad X13 Yoga G3 21AW003UGE | |
| Framework Laptop 13.5 13th Gen Intel | |
| AIDA64 / Memory Write | |
| Dell XPS 13 Plus 9320 Core i7-1360P | |
| Gemiddeld Intel Core i7-1360P (45887 - 93331, n=16) | |
| HP Spectre x360 13.5 14t-ef000 | |
| Dell XPS 13 Plus 9320 i7-1280P OLED | |
| Framework Laptop 13.5 13th Gen Intel | |
| Lenovo ThinkPad X13 Yoga G3 21AW003UGE | |
| AIDA64 / Memory Latency | |
| Dell XPS 13 Plus 9320 i7-1280P OLED | |
| Lenovo ThinkPad X13 Yoga G3 21AW003UGE | |
| Dell XPS 13 Plus 9320 Core i7-1360P | |
| Gemiddeld Intel Core i7-1360P (85 - 110.5, n=16) | |
| HP Spectre x360 13.5 14t-ef000 | |
| Framework Laptop 13.5 13th Gen Intel | |
* ... kleiner is beter
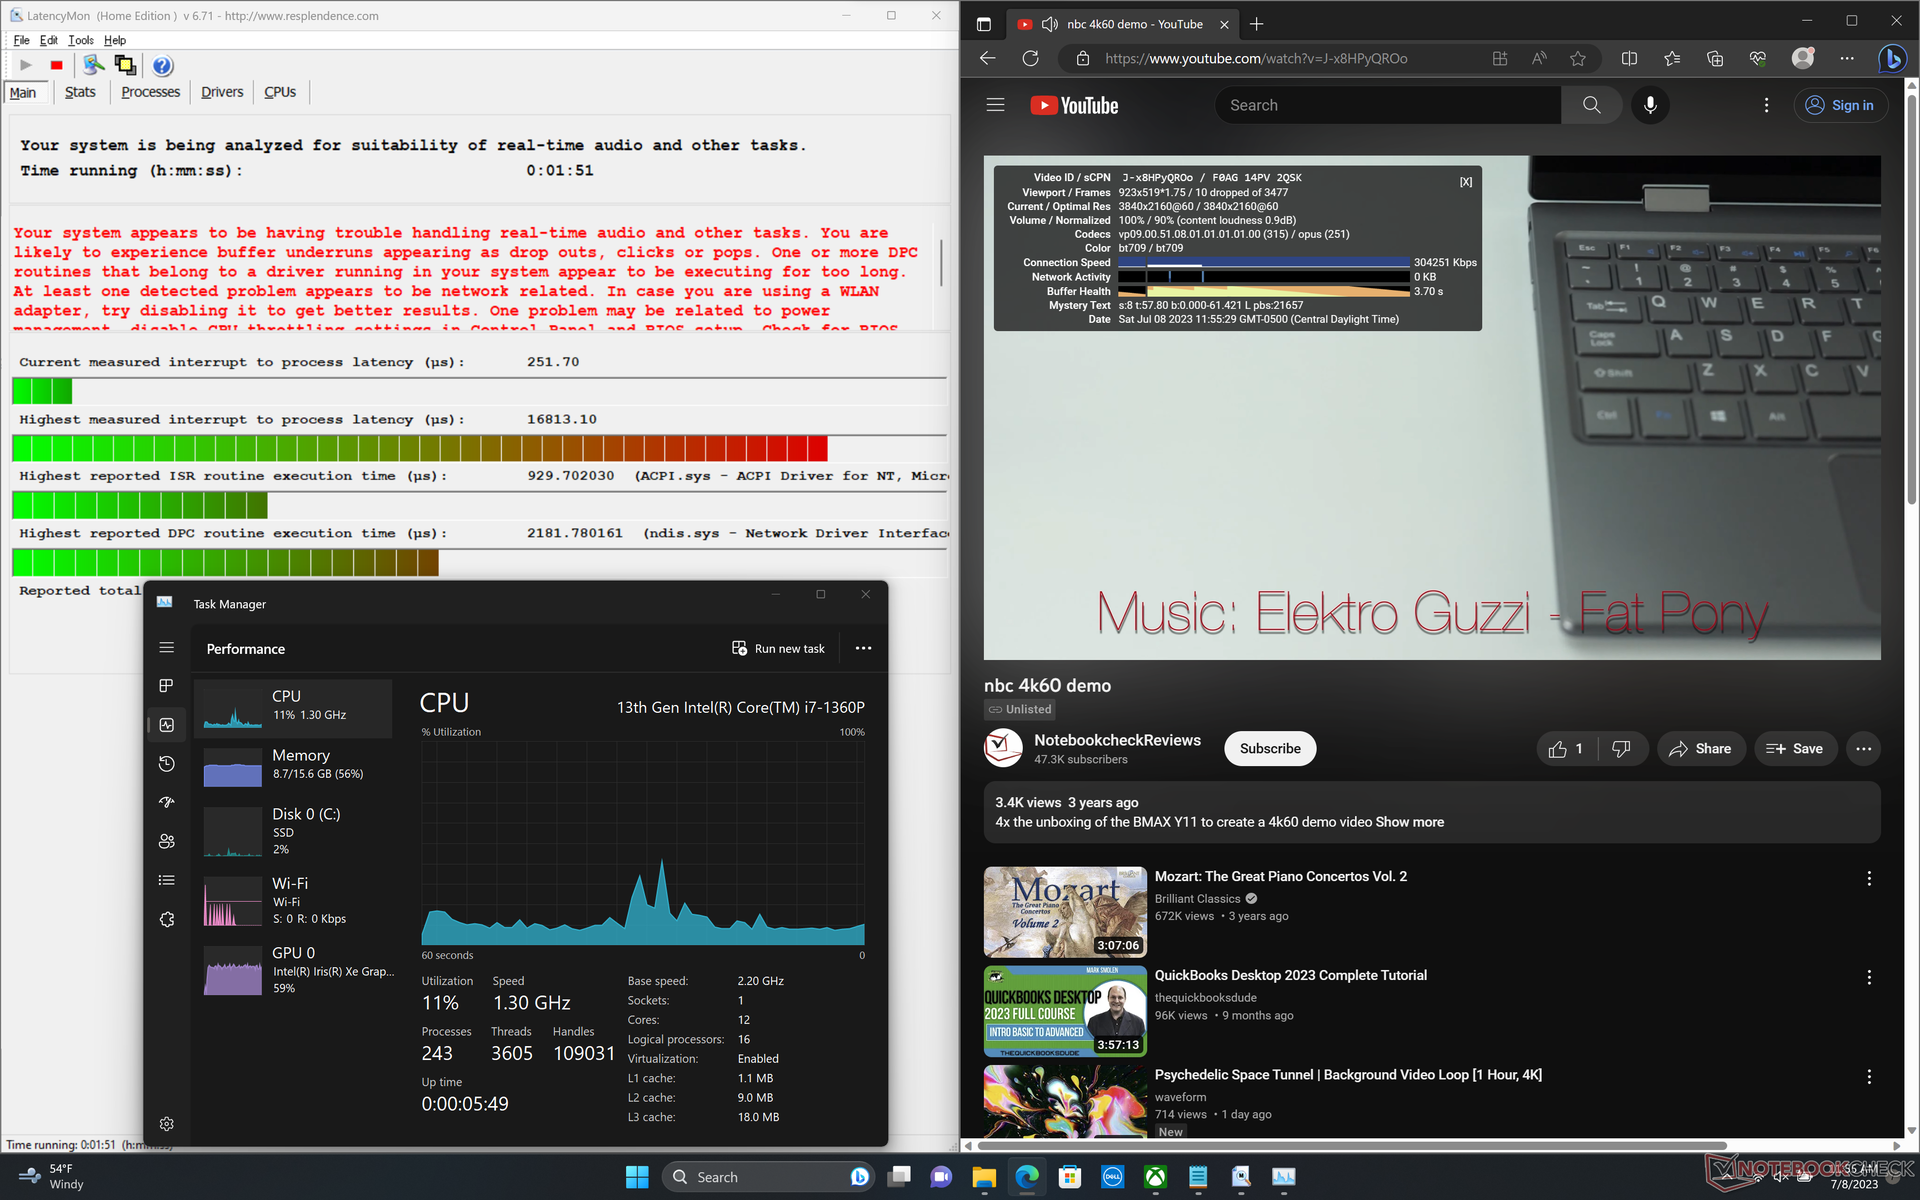
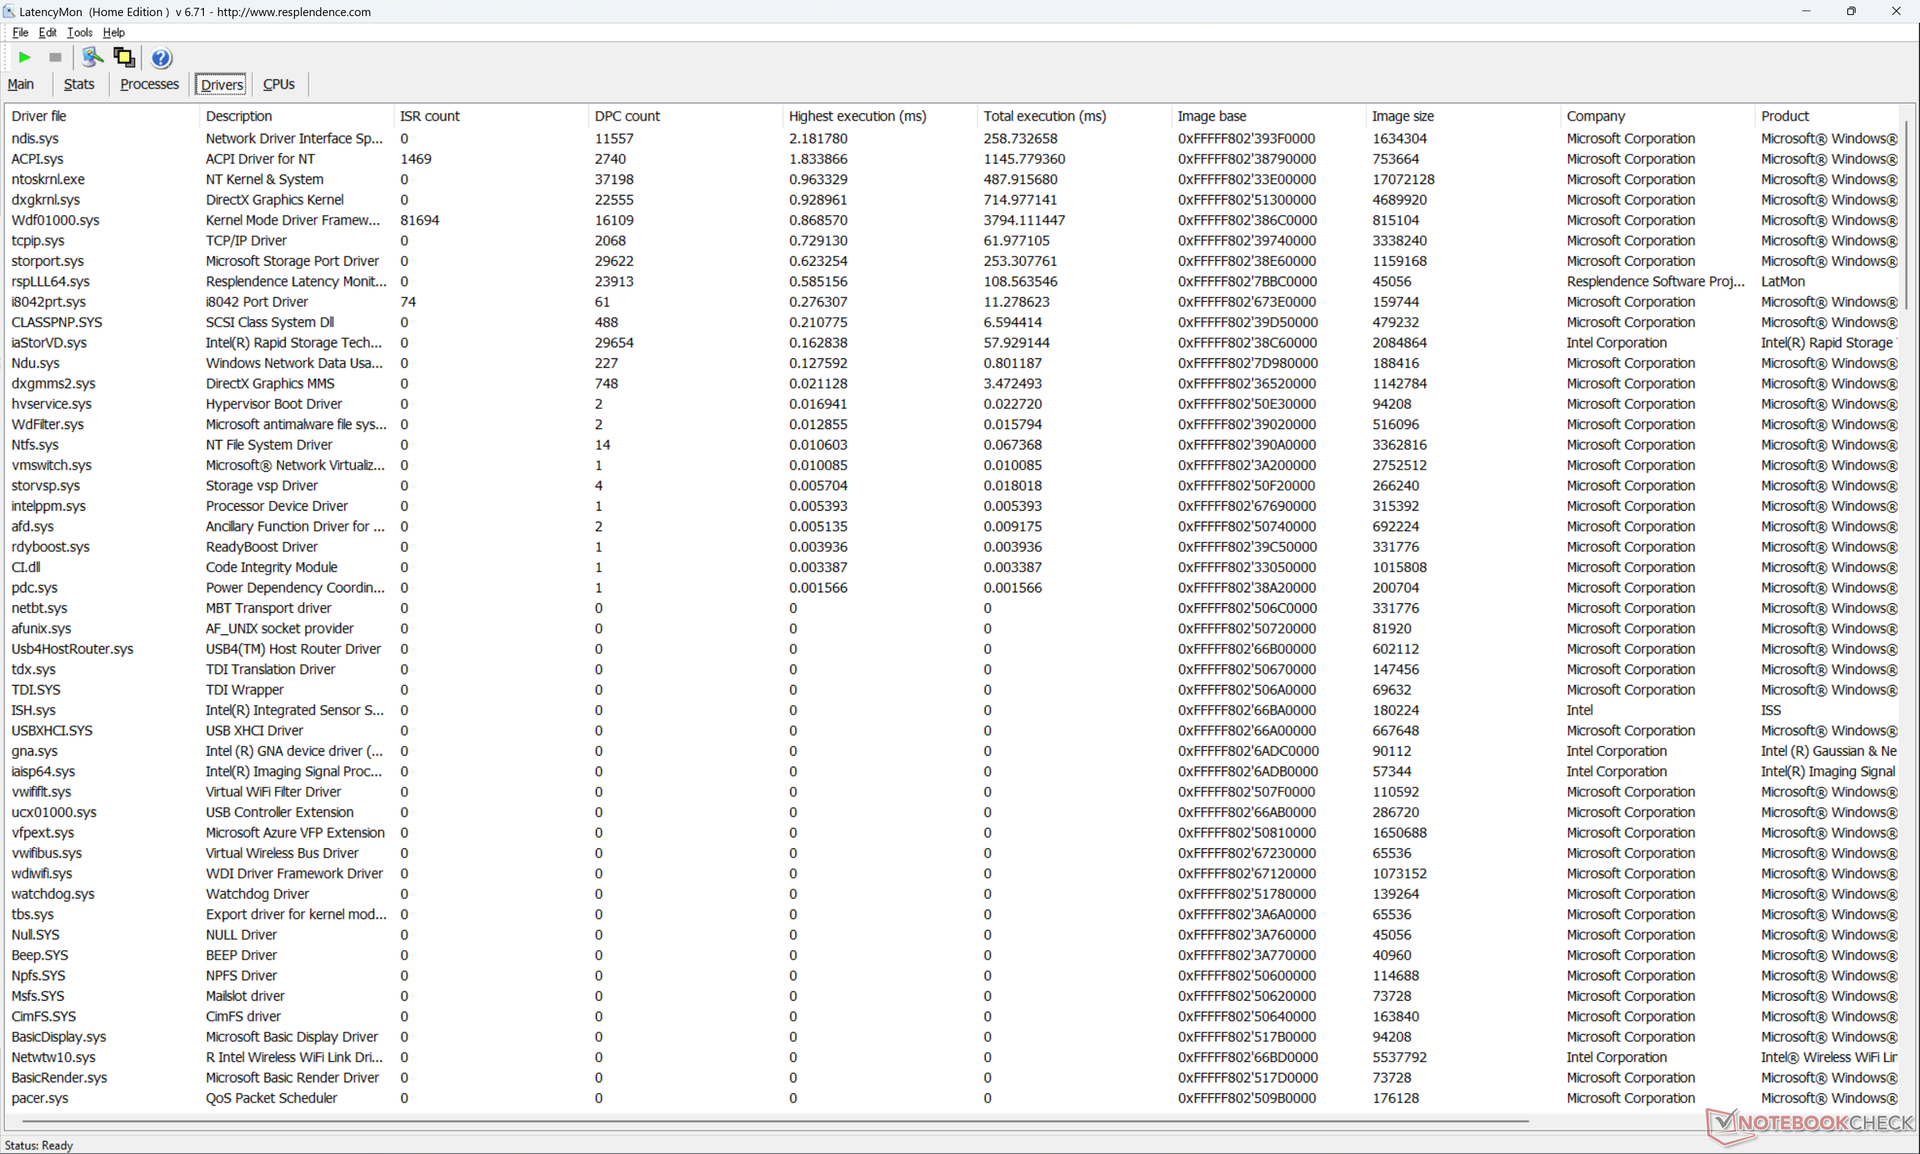
DPC latentie
Ons apparaat vertoonde vertragingsproblemen bij het openen van meerdere browsertabbladen of startpagina's, zelfs na meerdere pogingen opnieuw. het afspelen van 4K video's met 60 FPS was ook niet perfect met 10 dropped frames tijdens onze testvideo van een minuut. Dit kan mogelijk een bug zijn in het nieuwe 2023 model, aangezien geen van onze drie 2022 testeenheden deze problemen vertoonde.
| DPC Latencies / LatencyMon - interrupt to process latency (max), Web, Youtube, Prime95 | |
| Dell XPS 13 Plus 9320 Core i7-1360P | |
| Lenovo ThinkPad X13 Yoga G3 21AW003UGE | |
| Dell XPS 13 Plus 9320 i5-1240p | |
| Dell XPS 13 Plus 9320 4K | |
| HP Spectre x360 13.5 14t-ef000 | |
| Dell XPS 13 Plus 9320 i7-1280P OLED | |
| Framework Laptop 13.5 13th Gen Intel | |
* ... kleiner is beter
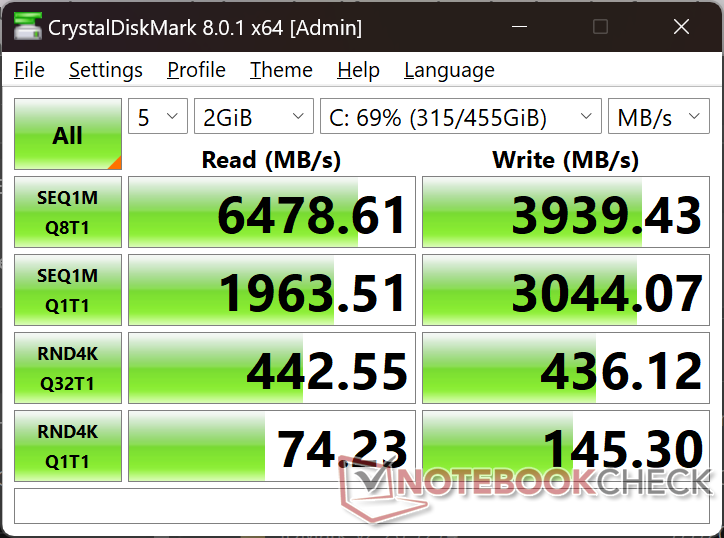
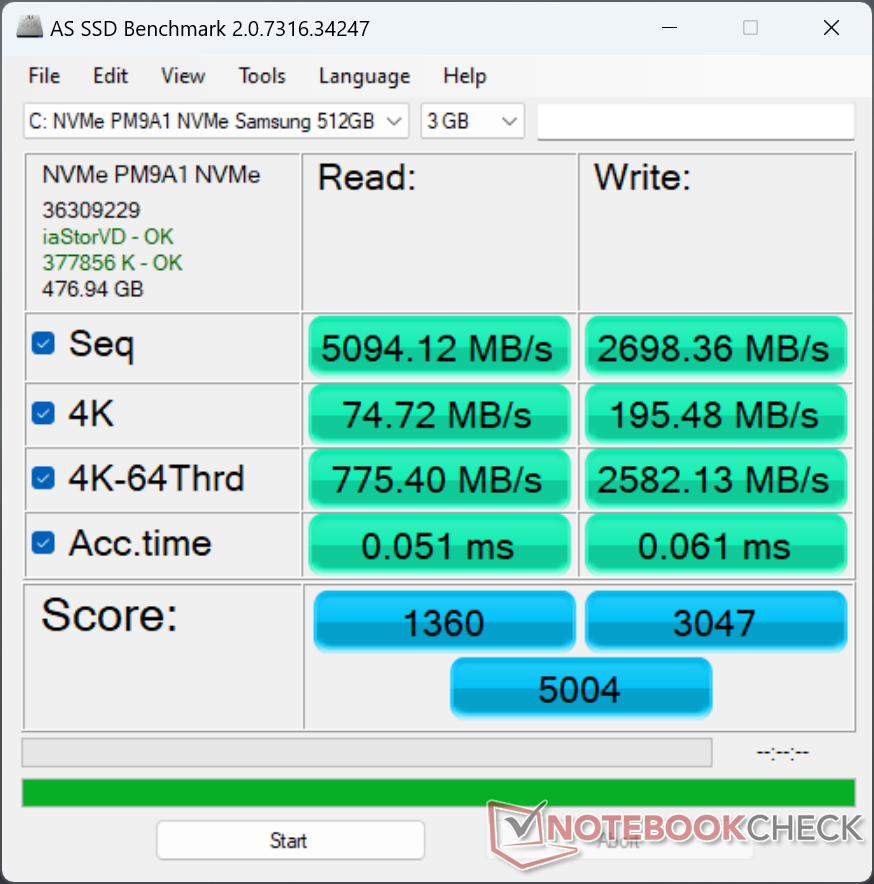
Opslagapparaten
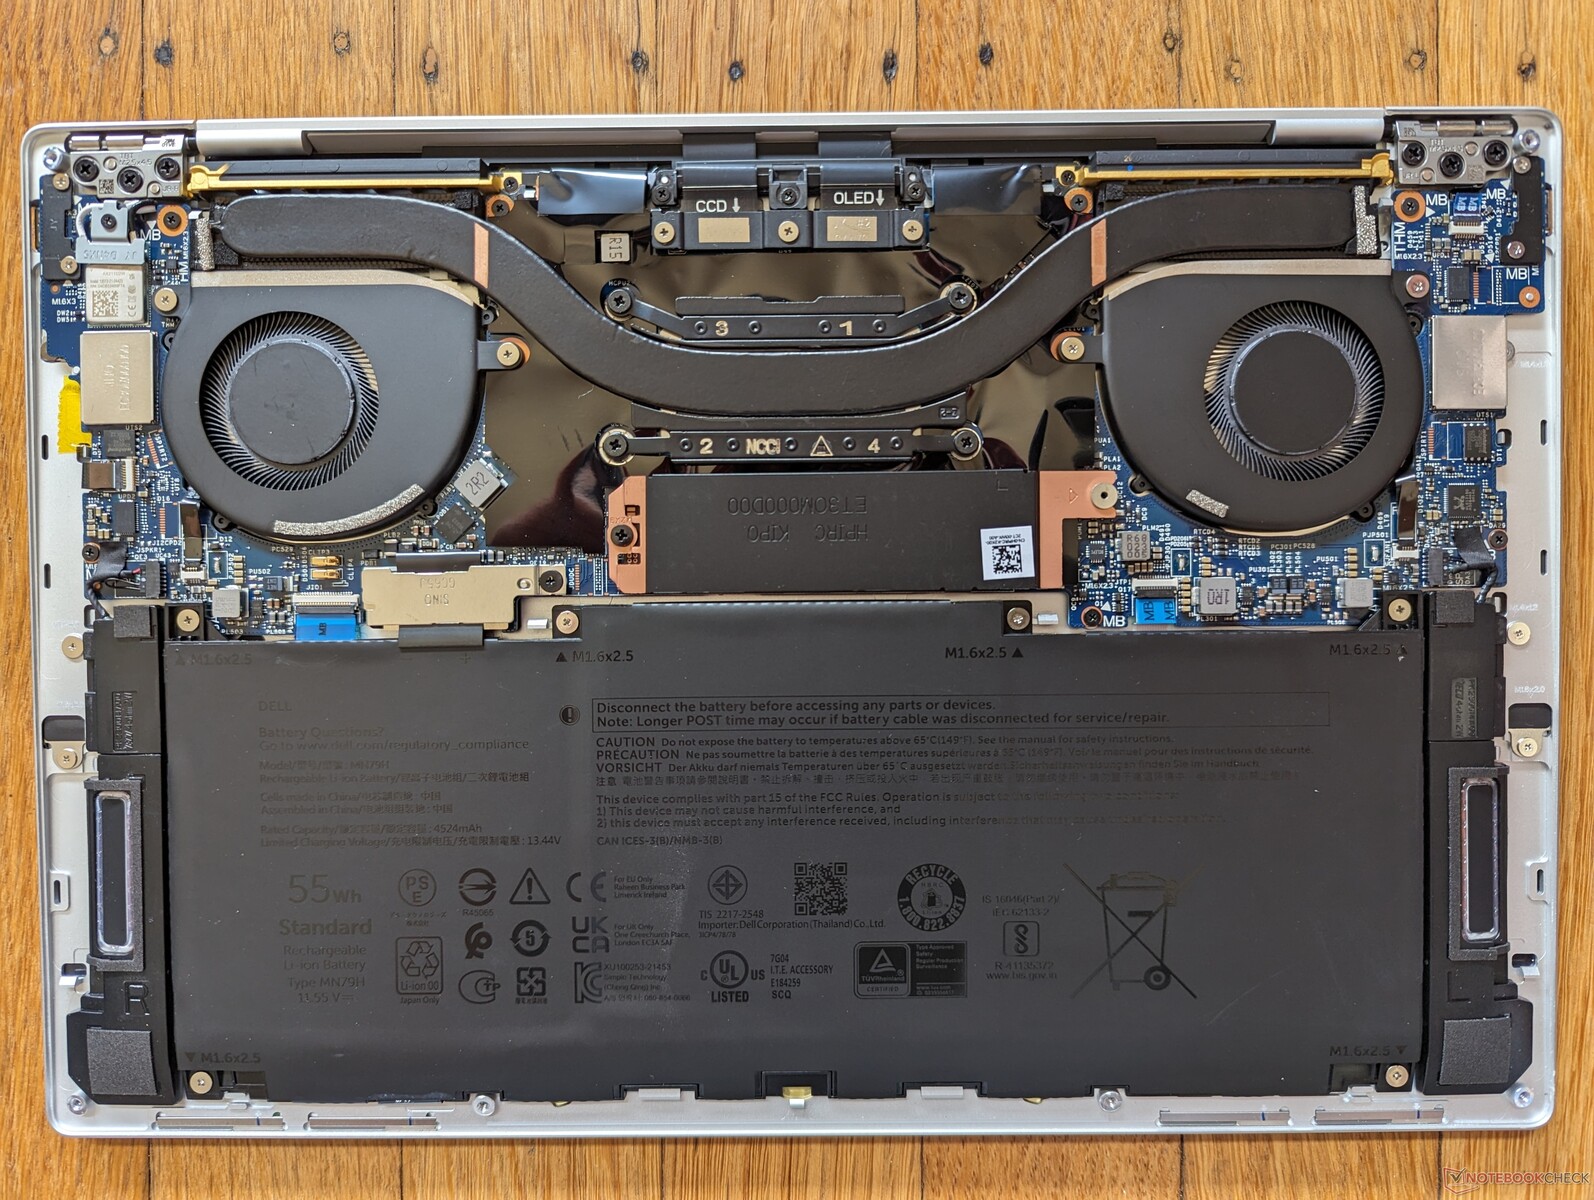
De SSD's in de XPS 13 Plus-serie kunnen afkomstig zijn van Samsung, Micron of Western Digital. Voor dit specifieke apparaat is onze SSD de Samsung PM9A1 PCIe4 x4 met een sequentiële lees- en schrijfsnelheid van respectievelijk bijna 7000 MB/s en 4000 MB/s. Helaas verslappen de prestaties van onze schijf tot wel 2000 MB/s wanneer deze wordt belast, zoals blijkt uit onze DiskSpd loop testresultaten hieronder. Herhaalde tests zouden geen verbeteringen opleveren. Daarentegen vertoonde dezelfde schijf in onze 2022 XPS 13 Plus helemaal geen throttling. We zijn niet zeker van de specifieke oorzaken, aangezien er geen wijzigingen zijn aangebracht aan de SSD-hitteverspreider, voor zover we kunnen nagaan.

* ... kleiner is beter
Disk Throttling: DiskSpd Read Loop, Queue Depth 8
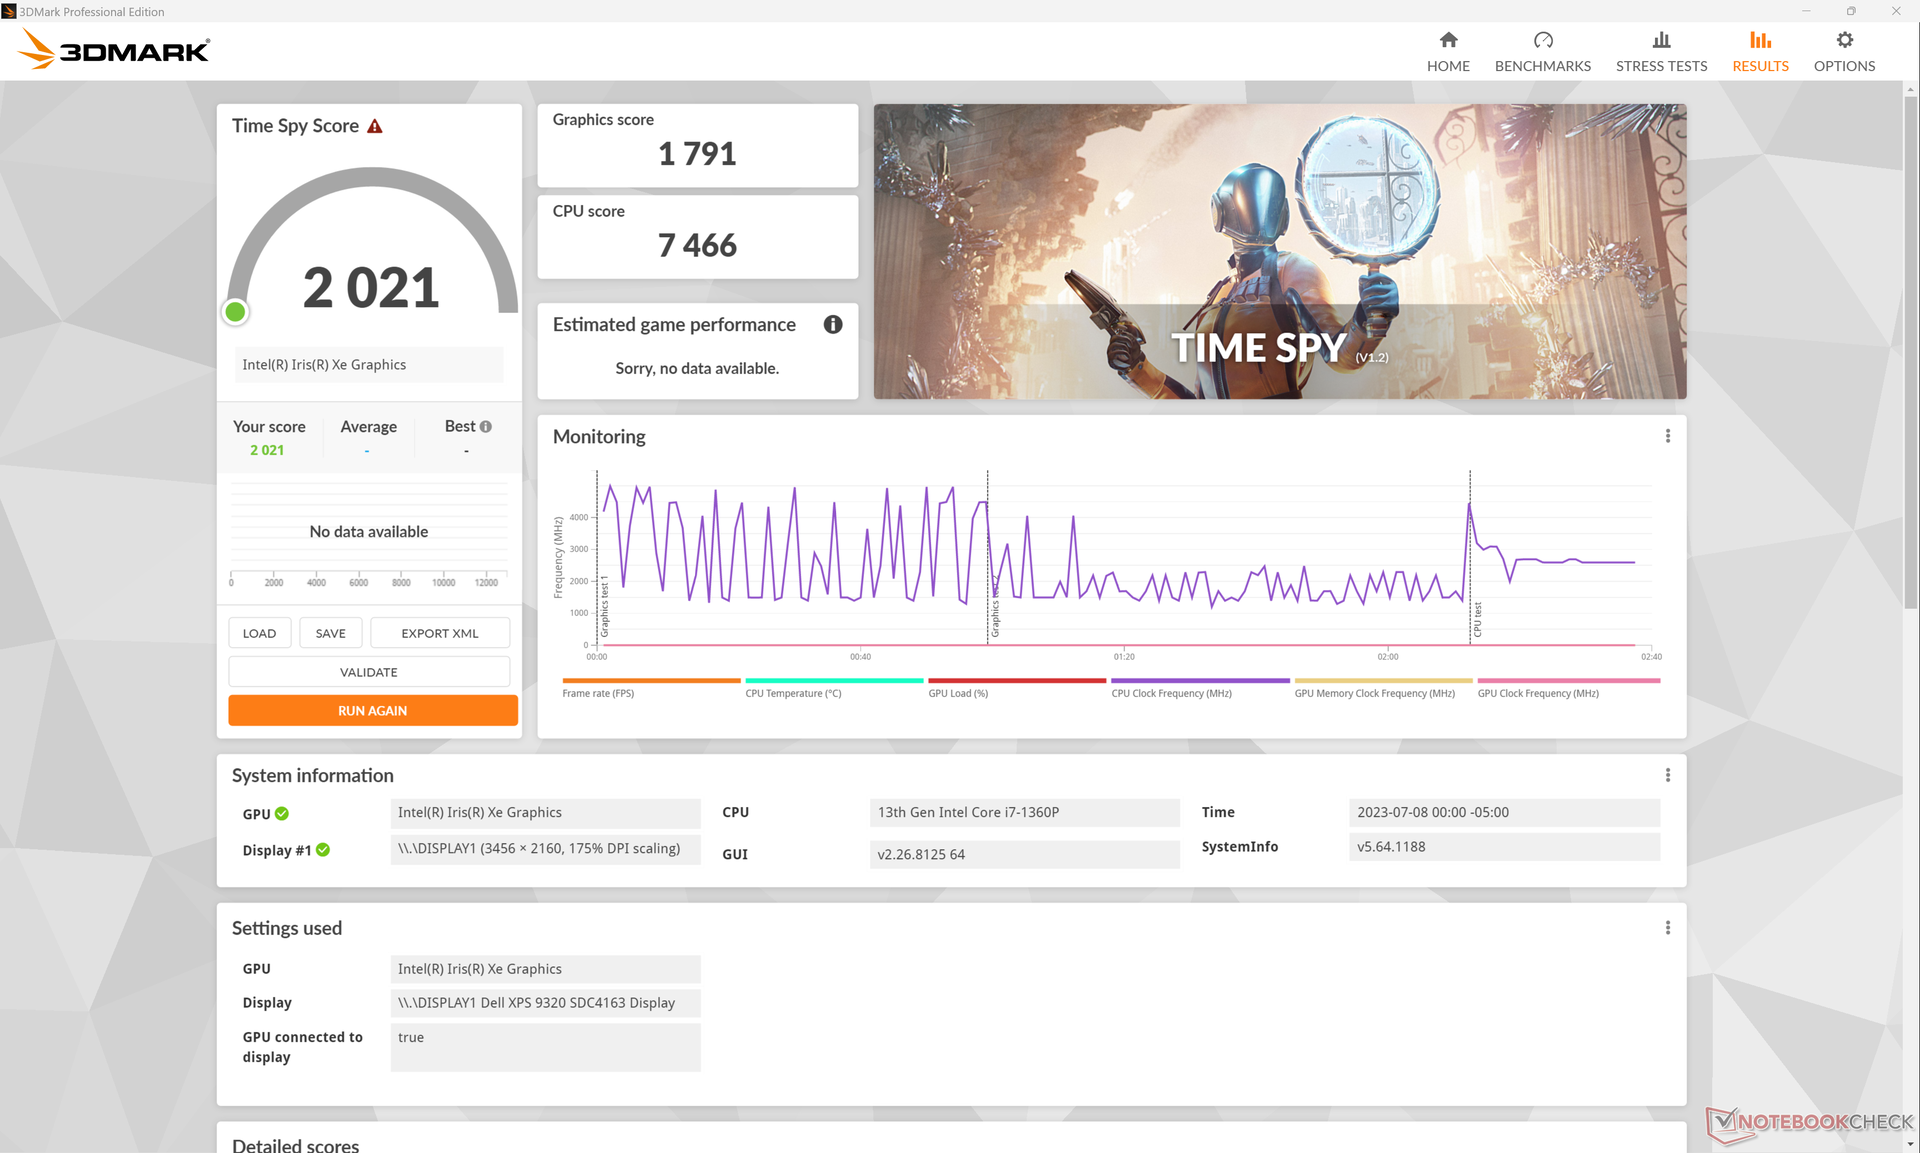
GPU-prestaties
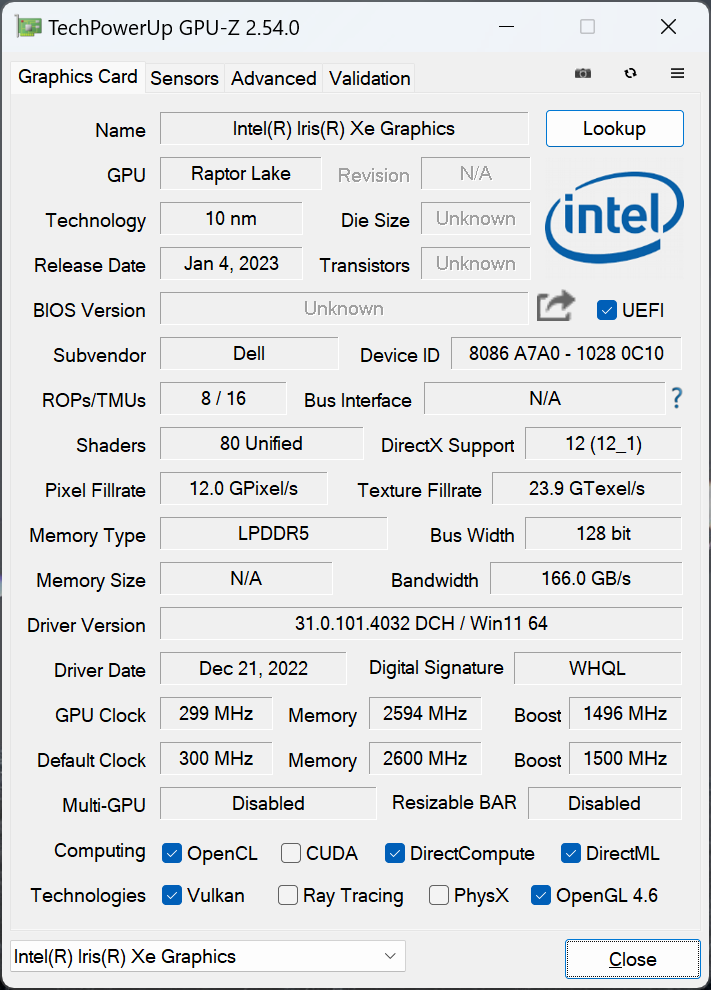
De Iris Xe 96 EUs blijft de snelste geïntegreerde grafische oplossing van Intel, ondanks dat deze al een paar jaar oud is. De versie van dit jaar is een paar procentpunten sneller dan die van vorig jaar door de kleine verbetering in de kloksnelheid van het geheugen, maar hij verbleekt nog steeds in vergelijking met de concurrerende Radeon 680M of 780M.
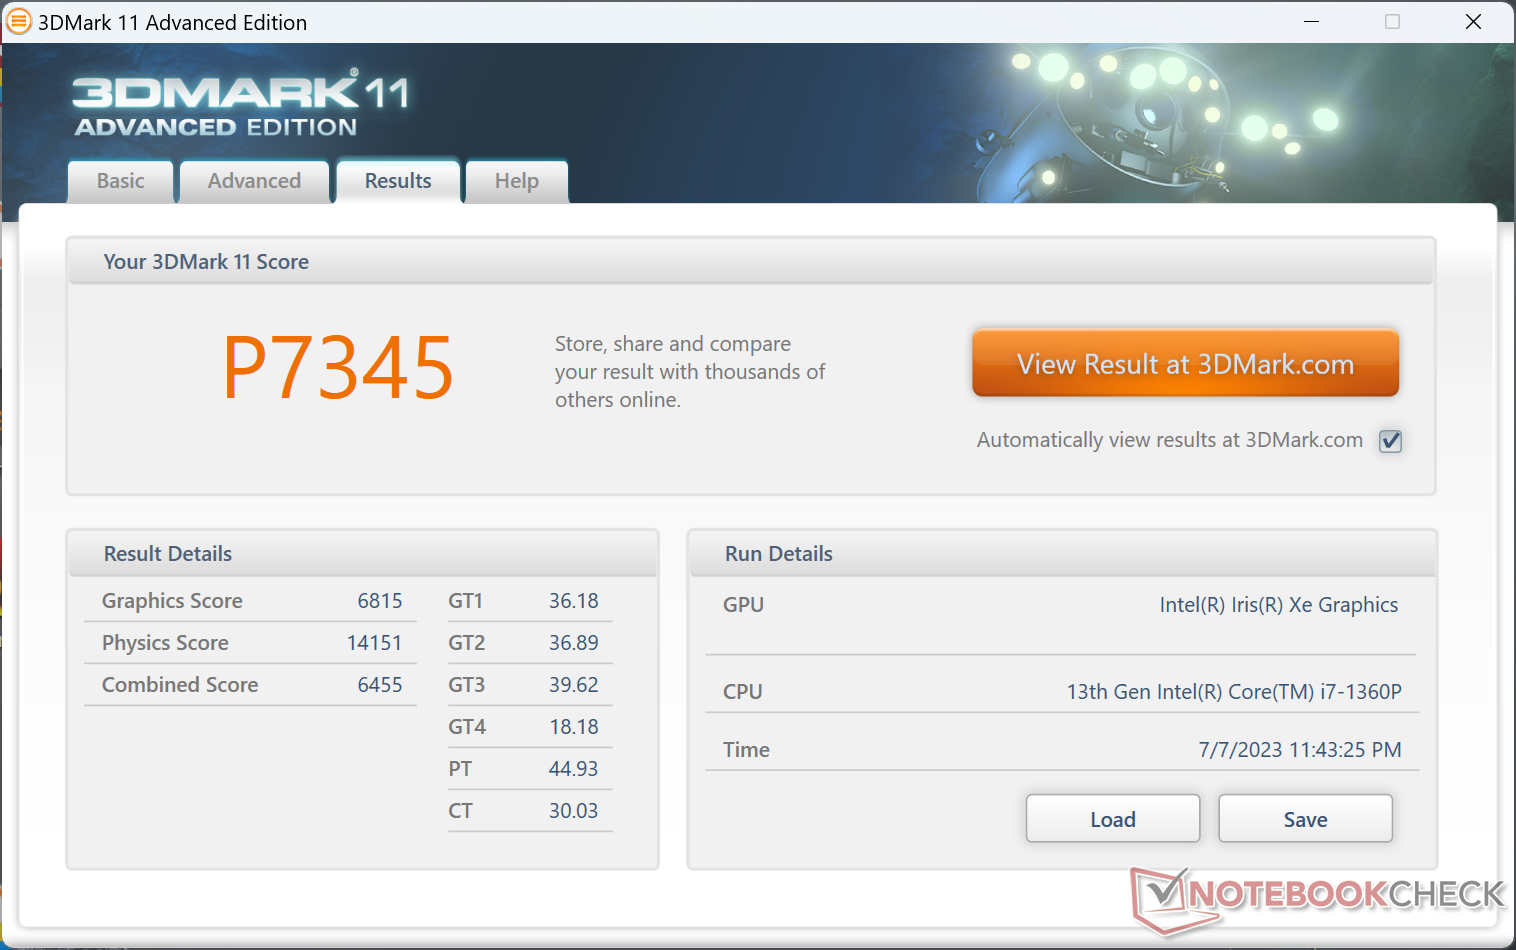
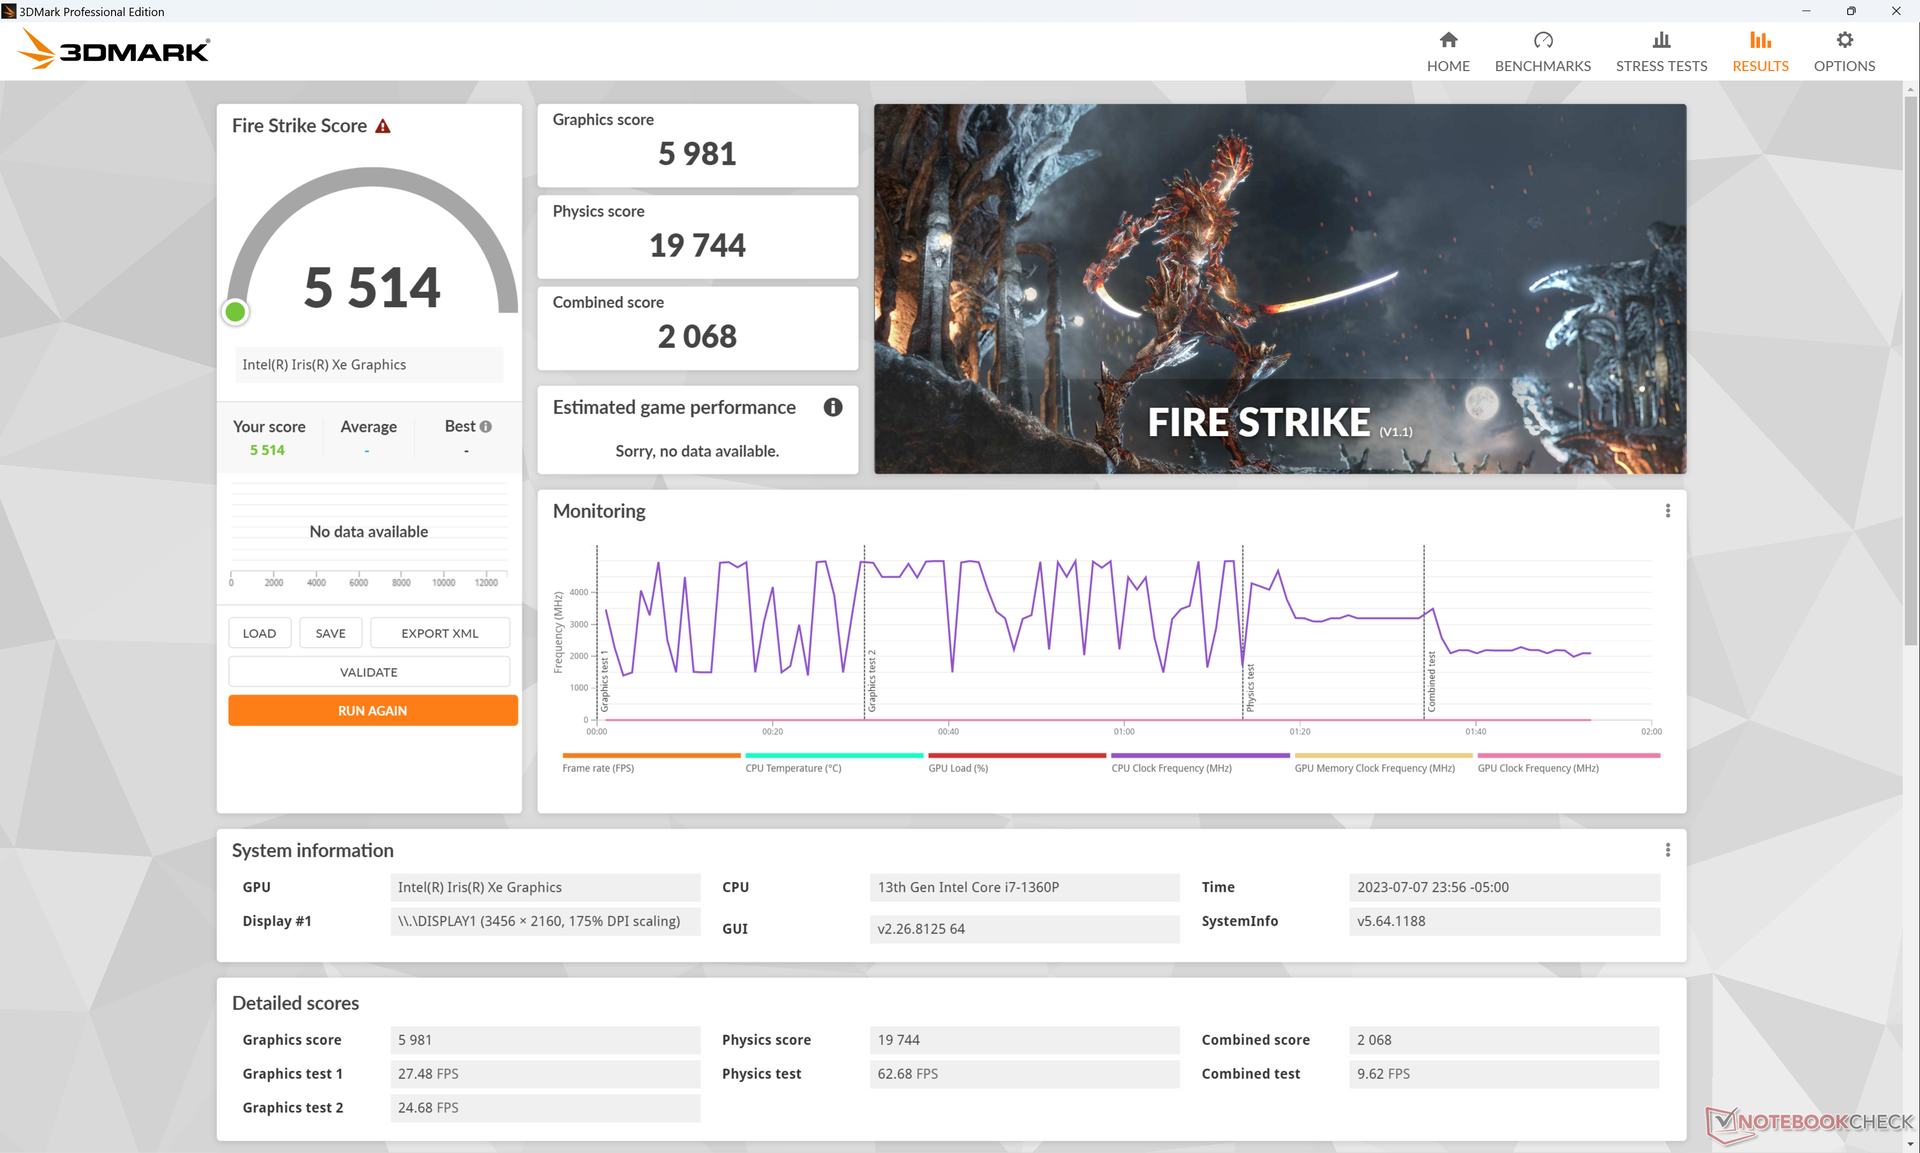
| 3DMark 11 Performance | 7345 punten | |
| 3DMark Fire Strike Score | 5514 punten | |
| 3DMark Time Spy Score | 2021 punten | |
Help | ||
* ... kleiner is beter
| Tiny Tina's Wonderlands | |
| 1920x1080 Low Preset (DX12) | |
| Framework Laptop 13.5 13th Gen Intel | |
| Gemiddeld Intel Iris Xe Graphics G7 96EUs (22.3 - 53, n=32) | |
| Dell XPS 13 Plus 9320 Core i7-1360P | |
| 1920x1080 Medium Preset (DX12) | |
| Framework Laptop 13.5 13th Gen Intel | |
| Dell XPS 13 Plus 9320 Core i7-1360P | |
| Gemiddeld Intel Iris Xe Graphics G7 96EUs (17 - 40.1, n=30) | |
| 1920x1080 High Preset (DX12) | |
| Framework Laptop 13.5 13th Gen Intel | |
| Dell XPS 13 Plus 9320 Core i7-1360P | |
| Gemiddeld Intel Iris Xe Graphics G7 96EUs (10.6 - 24.1, n=29) | |
| 1920x1080 Badass Preset (DX12) | |
| Framework Laptop 13.5 13th Gen Intel | |
| Dell XPS 13 Plus 9320 Core i7-1360P | |
| Gemiddeld Intel Iris Xe Graphics G7 96EUs (8.4 - 18.4, n=26) | |
| 1280x720 Lowest Preset (DX12) | |
| Dell XPS 13 Plus 9320 Core i7-1360P | |
| Gemiddeld Intel Iris Xe Graphics G7 96EUs (25.9 - 67.3, n=32) | |
Witcher 3 FPS Chart
| lage | gem. | hoge | ultra | QHD | |
|---|---|---|---|---|---|
| GTA V (2015) | 130.6 | 105.3 | 26.6 | 11.6 | 7.35 |
| The Witcher 3 (2015) | 86.7 | 56.1 | 33.9 | 15.4 | |
| Dota 2 Reborn (2015) | 125.6 | 97.7 | 68.7 | 61.6 | |
| Final Fantasy XV Benchmark (2018) | 44.5 | 25.2 | 17.5 | ||
| X-Plane 11.11 (2018) | 42.7 | 36.2 | 33.2 | ||
| Strange Brigade (2018) | 93.9 | 43.8 | 35.4 | 27.5 | |
| Cyberpunk 2077 1.6 (2022) | 20.8 | 17.3 | 13.6 | 11 | |
| Tiny Tina's Wonderlands (2022) | 29.6 | 23.7 | 15.2 | 12.2 | |
| F1 22 (2022) | 47.5 | 42.8 | 31.9 | 24.1 |
Uitstoot
Systeemgeluid
Hoewel er geen veranderingen zijn aan de koeloplossing of ventilatorgeluidsniveaus, kunnen we een licht spoelgejank waarnemen van onze testunit wanneer we een oor in de buurt van de toetsen op het toetsenbord leggen. De ventilatoren zijn anders stationair of net hoorbaar onder de meeste lichte belastingen zoals surfen op het web of tekstverwerken.
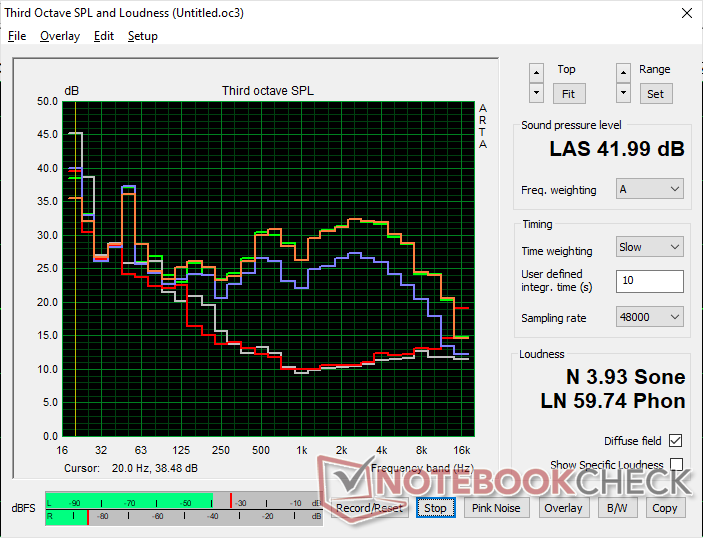
Geluidsniveau
| Onbelast |
| 24 / 24 / 24.4 dB (A) |
| Belasting |
| 37 / 42 dB (A) |
 | ||
30 dB stil 40 dB(A) hoorbaar 50 dB(A) luid |
||
min: | ||
| Dell XPS 13 Plus 9320 Core i7-1360P Iris Xe G7 96EUs, i7-1360P, Samsung PM9A1 MZVL2512HCJQ | Dell XPS 13 Plus 9320 i7-1280P OLED Iris Xe G7 96EUs, i7-1280P, WDC PC SN810 512GB | Dell XPS 13 7390 Core i7-10710U UHD Graphics 620, i7-10710U, SK Hynix PC601 NVMe 512 GB | Framework Laptop 13.5 13th Gen Intel Iris Xe G7 96EUs, i7-1370P, WD PC SN740 SDDPNQD-1T00 | Lenovo ThinkPad X13 Yoga G3 21AW003UGE Iris Xe G7 96EUs, i7-1265U, Samsung PM9A1 MZVL2512HCJQ | HP Spectre x360 13.5 14t-ef000 Iris Xe G7 96EUs, i7-1255U, Micron 3400 1TB MTFDKBA1T0TFH | |
|---|---|---|---|---|---|---|
| Noise | 3% | -12% | -6% | -2% | 7% | |
| uit / omgeving * (dB) | 23.7 | 23.4 1% | 28 -18% | 23.2 2% | 23.22 2% | 23.5 1% |
| Idle Minimum * (dB) | 24 | 23.4 2% | 28 -17% | 23.2 3% | 23.2 3% | 23.5 2% |
| Idle Average * (dB) | 24 | 23.4 2% | 28 -17% | 23.2 3% | 23.2 3% | 23.5 2% |
| Idle Maximum * (dB) | 24.4 | 23.4 4% | 28 -15% | 23.2 5% | 28.6 -17% | 23.5 4% |
| Load Average * (dB) | 37 | 35 5% | 33.7 9% | 45.3 -22% | 39.8 -8% | 27 27% |
| Witcher 3 ultra * (dB) | 42.1 | 41.6 1% | 47.9 -14% | 41.8 1% | 36.2 14% | |
| Load Maximum * (dB) | 42 | 39.9 5% | 46.5 -11% | 49.2 -17% | 40.6 3% | 42.4 -1% |
* ... kleiner is beter
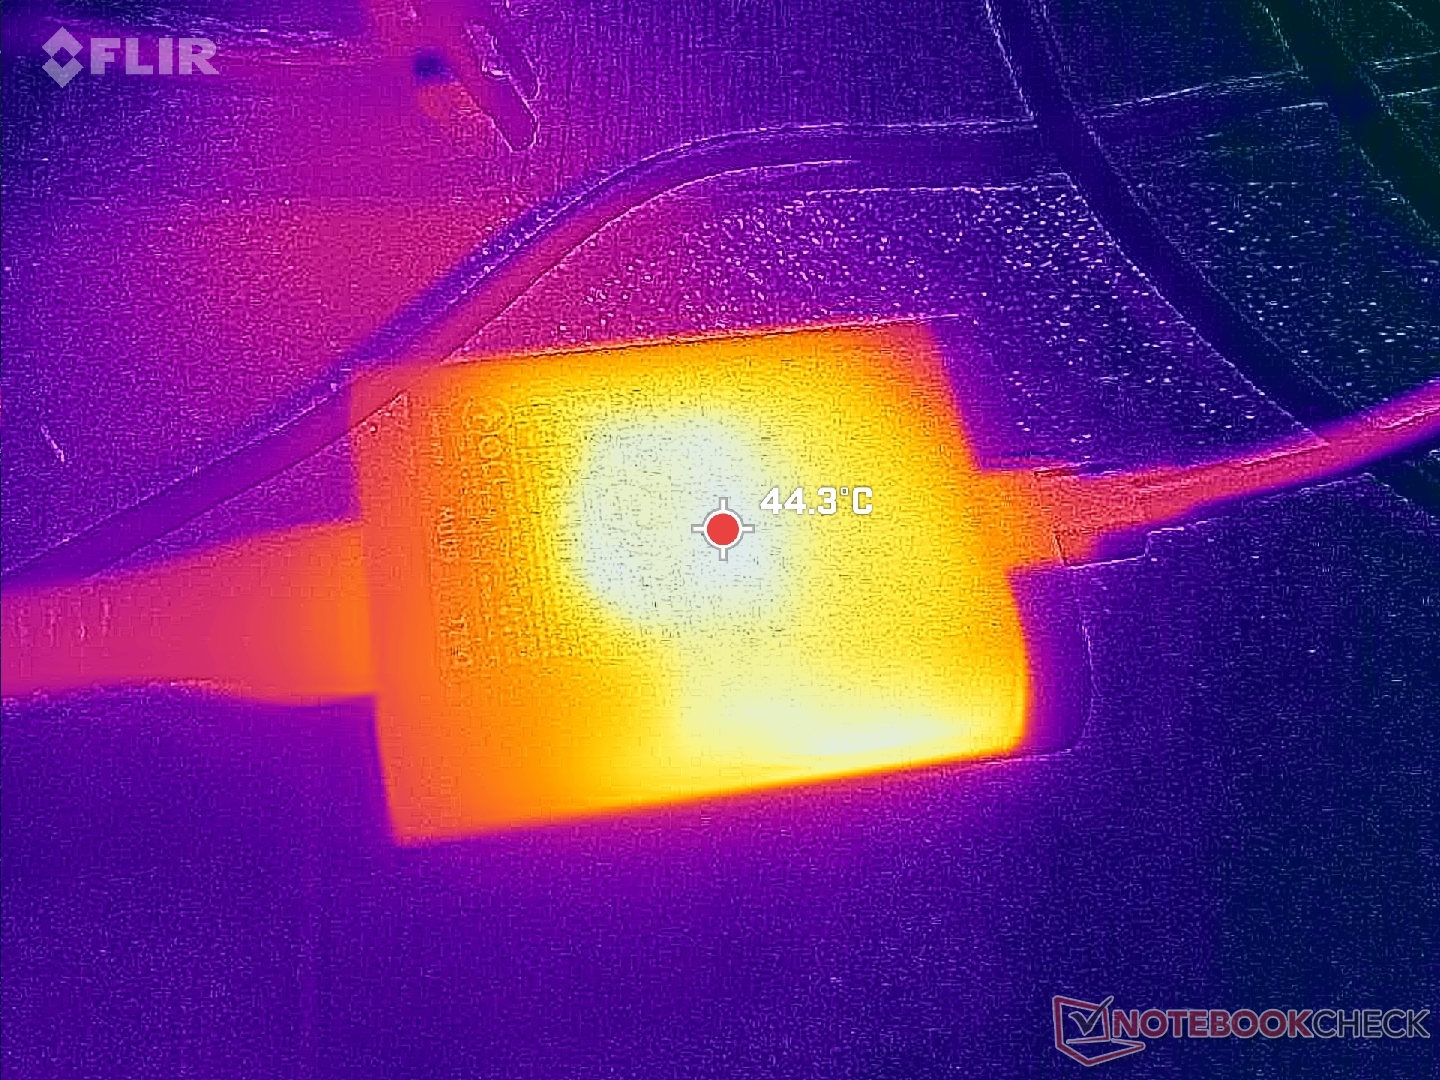
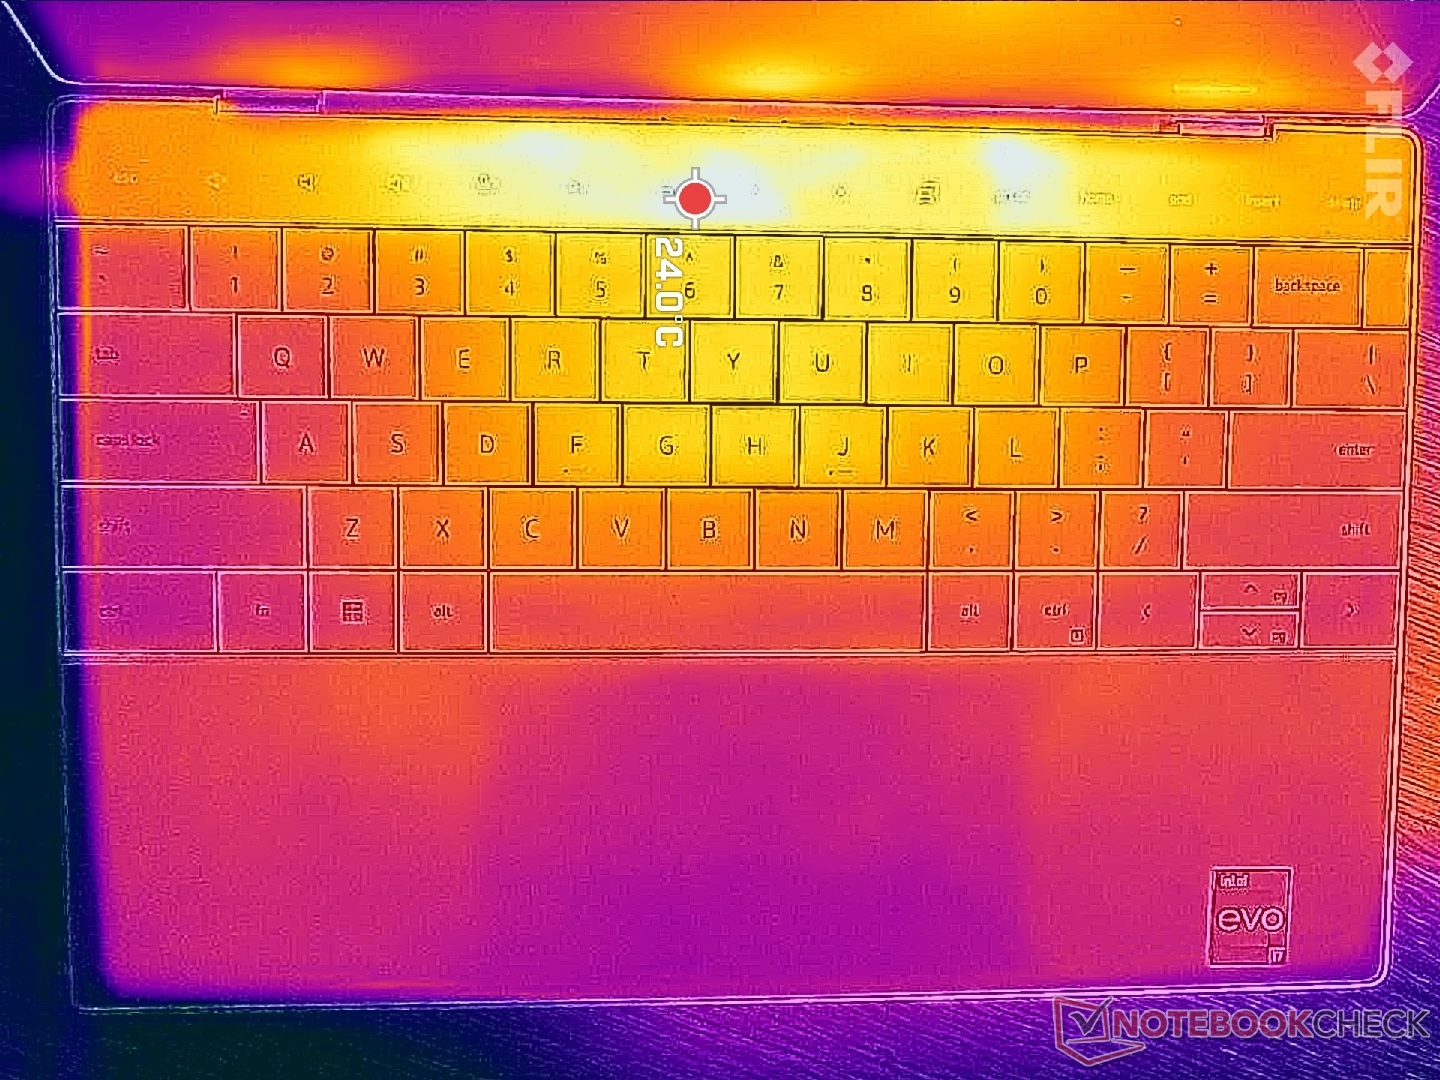
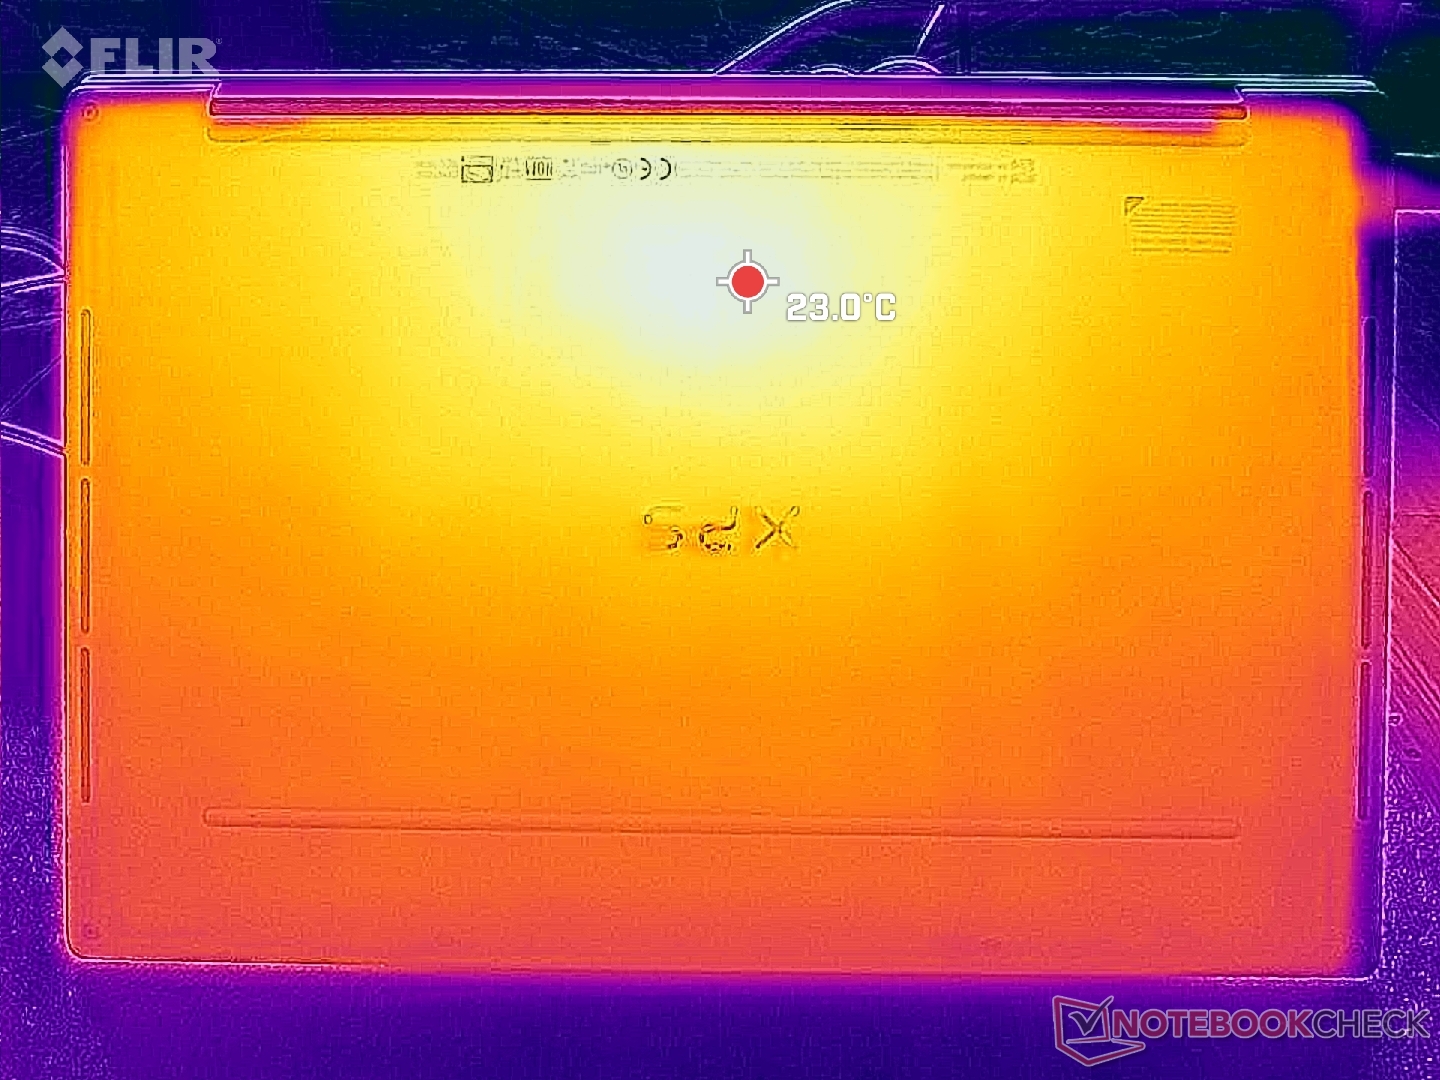
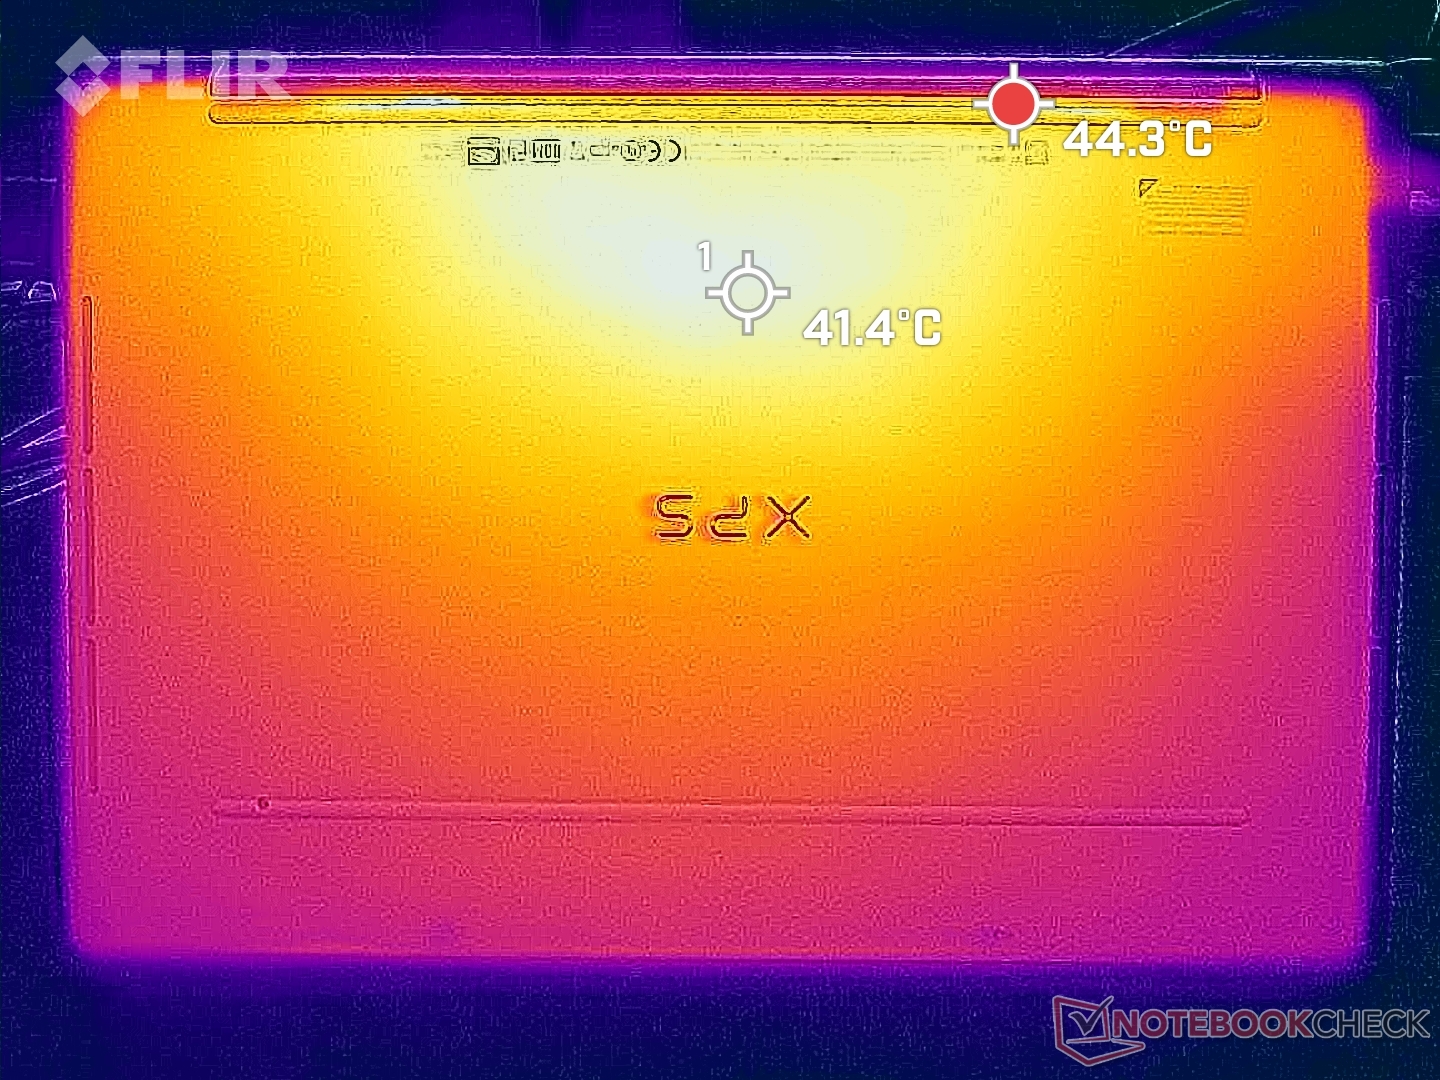
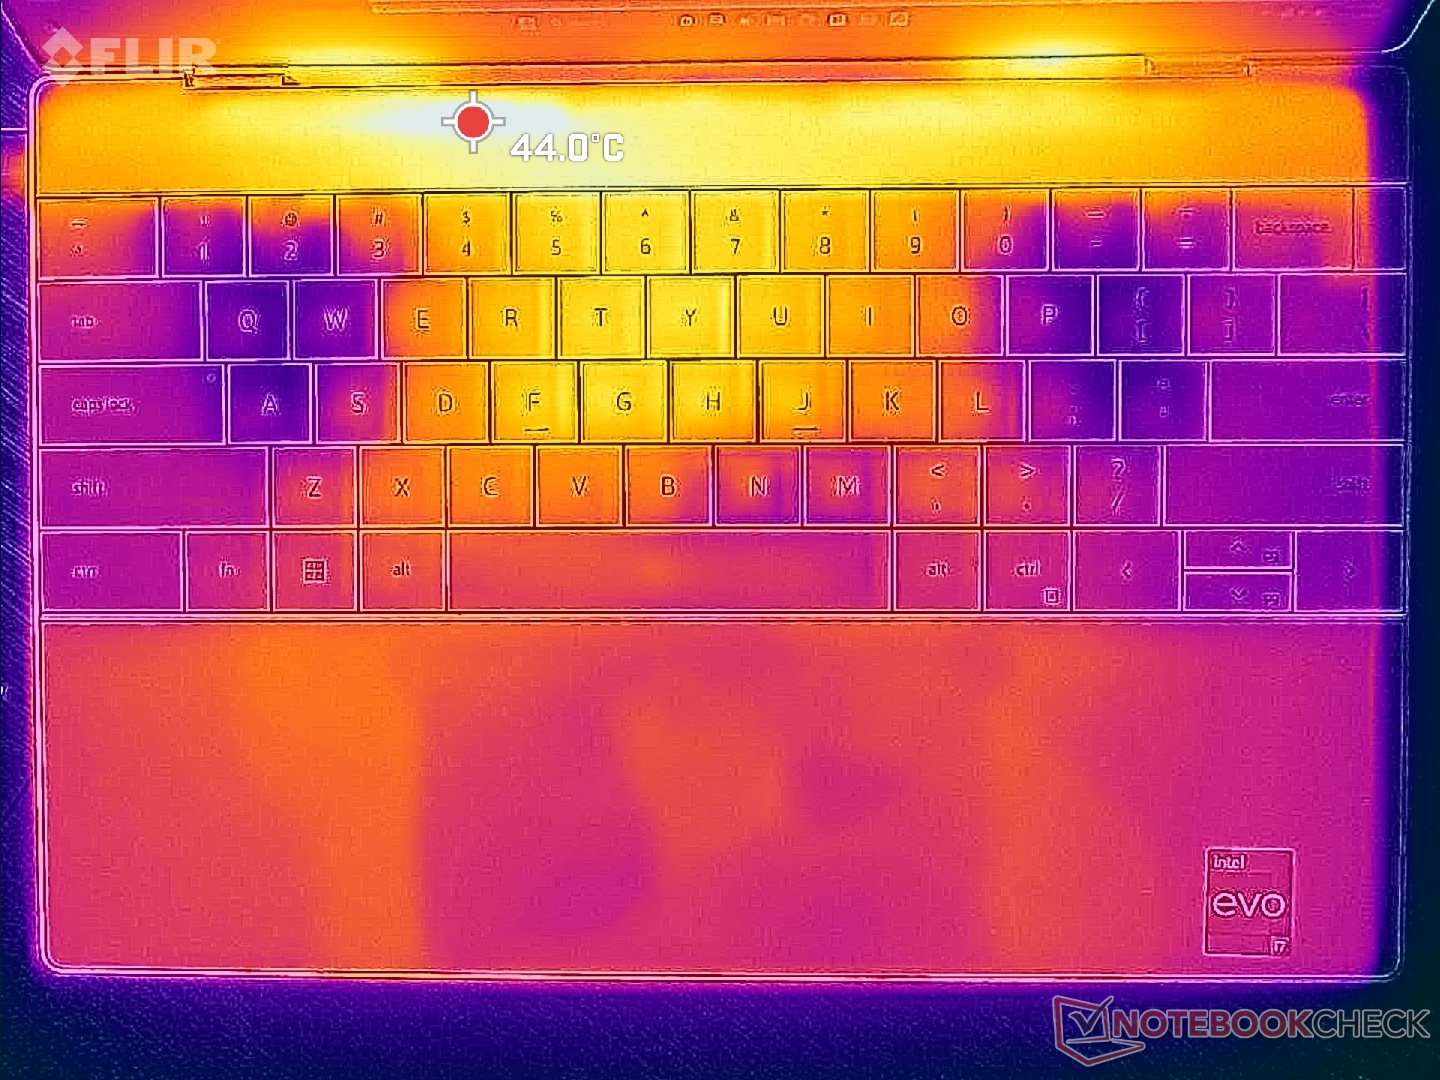
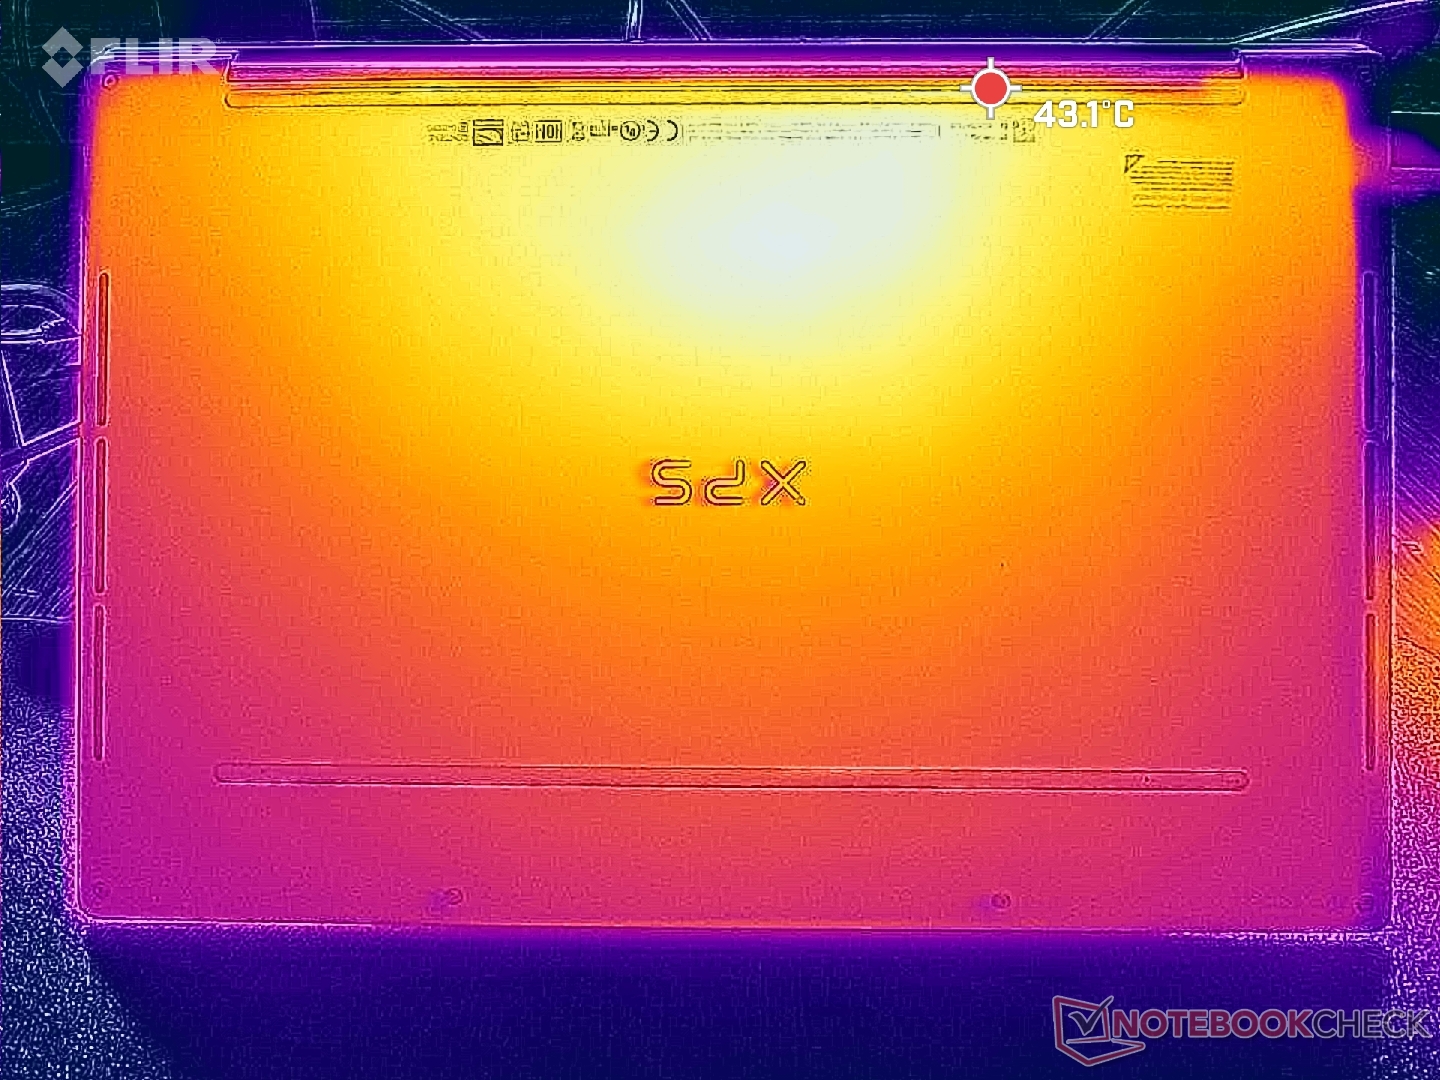
Temperatuur
De oppervlaktetemperaturen kunnen erg hoog oplopen door het dunne profiel, de Core-P CPU en het ontbreken van ventilatieroosters aan de onderkant. Hete plekken kunnen oplopen tot 45 C in vergelijking met slechts 35 C op de langzamere HP Dragonfly Folio 13.5 G3.
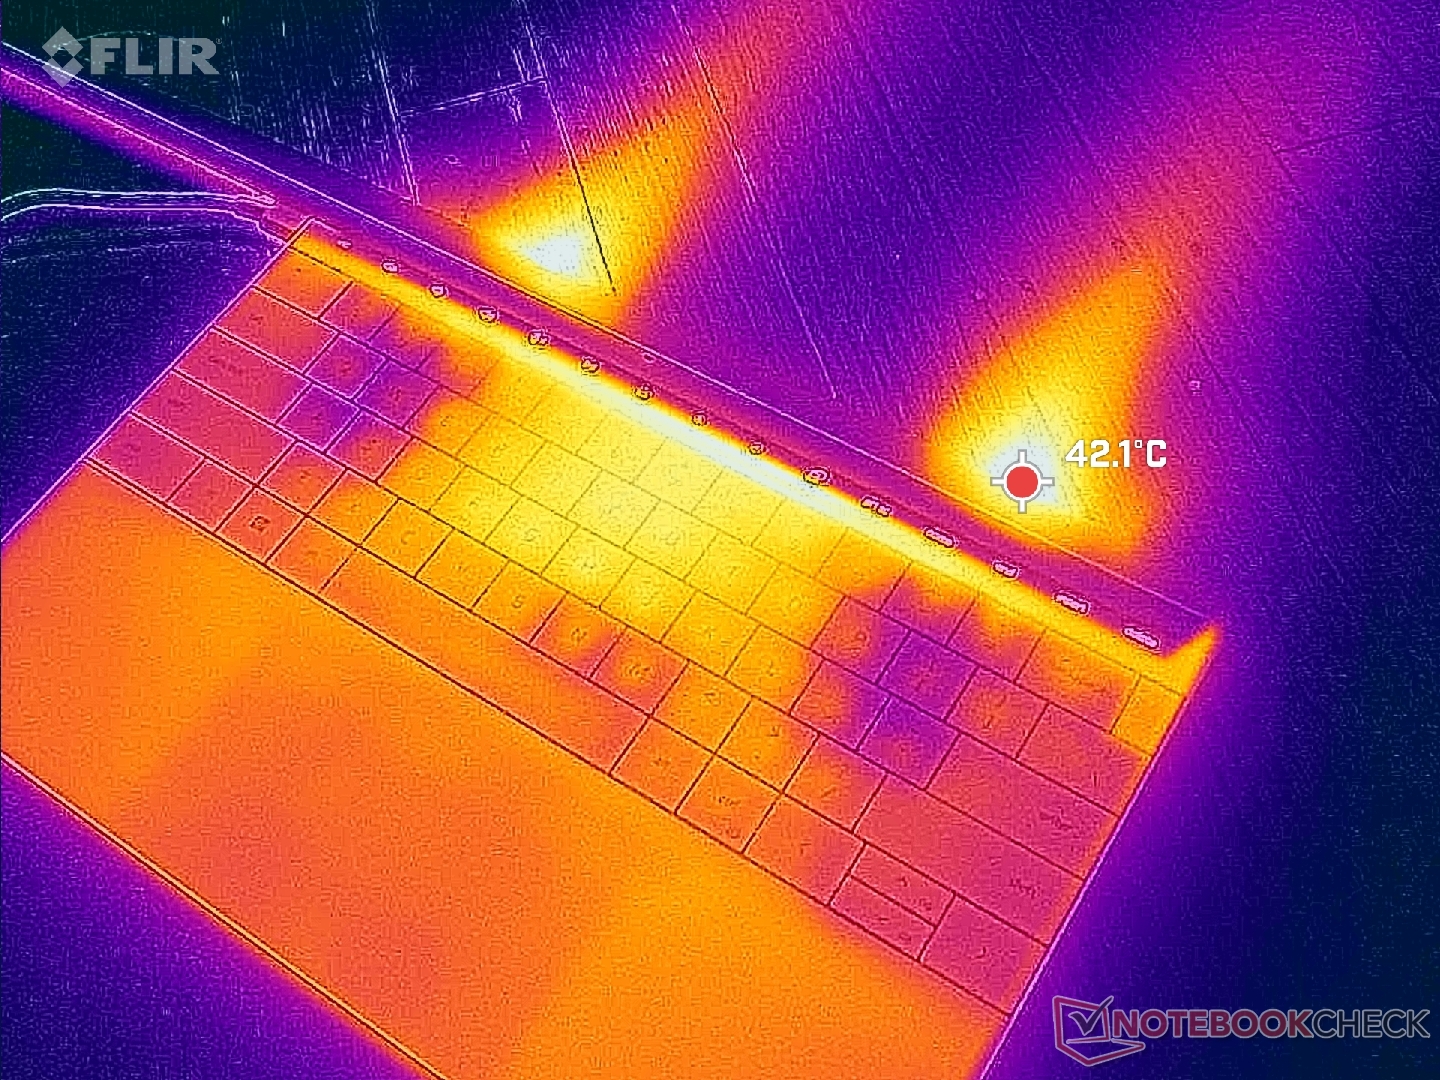
(±) De maximumtemperatuur aan de bovenzijde bedraagt 43.8 °C / 111 F, vergeleken met het gemiddelde van 35.9 °C / 97 F, variërend van 21.4 tot 59 °C voor de klasse Subnotebook.
(±) De bodem warmt op tot een maximum van 44.4 °C / 112 F, vergeleken met een gemiddelde van 39.2 °C / 103 F
(+) Bij onbelast gebruik bedraagt de gemiddelde temperatuur voor de bovenzijde 22.4 °C / 72 F, vergeleken met het apparaatgemiddelde van 30.8 °C / 87 F.
(±) Bij het spelen van The Witcher 3 is de gemiddelde temperatuur voor de bovenzijde 32.9 °C / 91 F, vergeleken met het apparaatgemiddelde van 30.8 °C / 87 F.
(+) De handpalmsteunen en het touchpad bereiken maximaal de huidtemperatuur (32.6 °C / 90.7 F) en zijn dus niet heet.
(-) De gemiddelde temperatuur van de handpalmsteun van soortgelijke toestellen bedroeg 28.2 °C / 82.8 F (-4.4 °C / -7.9 F).

| Dell XPS 13 Plus 9320 Core i7-1360P Intel Core i7-1360P, Intel Iris Xe Graphics G7 96EUs | Dell XPS 13 Plus 9320 i5-1240p Intel Core i5-1240P, Intel Iris Xe Graphics G7 80EUs | Dell XPS 13 7390 Core i7-10710U Intel Core i7-10710U, Intel UHD Graphics 620 | Framework Laptop 13.5 13th Gen Intel Intel Core i7-1370P, Intel Iris Xe Graphics G7 96EUs | Lenovo ThinkPad X13 Yoga G3 21AW003UGE Intel Core i7-1265U, Intel Iris Xe Graphics G7 96EUs | HP Spectre x360 13.5 14t-ef000 Intel Core i7-1255U, Intel Iris Xe Graphics G7 96EUs | |
|---|---|---|---|---|---|---|
| Heat | -41% | -13% | 1% | -25% | 14% | |
| Maximum Upper Side * (°C) | 43.8 | 47.6 -9% | 44.6 -2% | 38.2 13% | 52.2 -19% | 36.4 17% |
| Maximum Bottom * (°C) | 44.4 | 57 -28% | 49.2 -11% | 41.4 7% | 50.2 -13% | 37 17% |
| Idle Upper Side * (°C) | 24 | 38.8 -62% | 28.2 -18% | 25.8 -8% | 32 -33% | 20.8 13% |
| Idle Bottom * (°C) | 25.2 | 41 -63% | 30.2 -20% | 27.6 -10% | 33.6 -33% | 22.6 10% |
* ... kleiner is beter
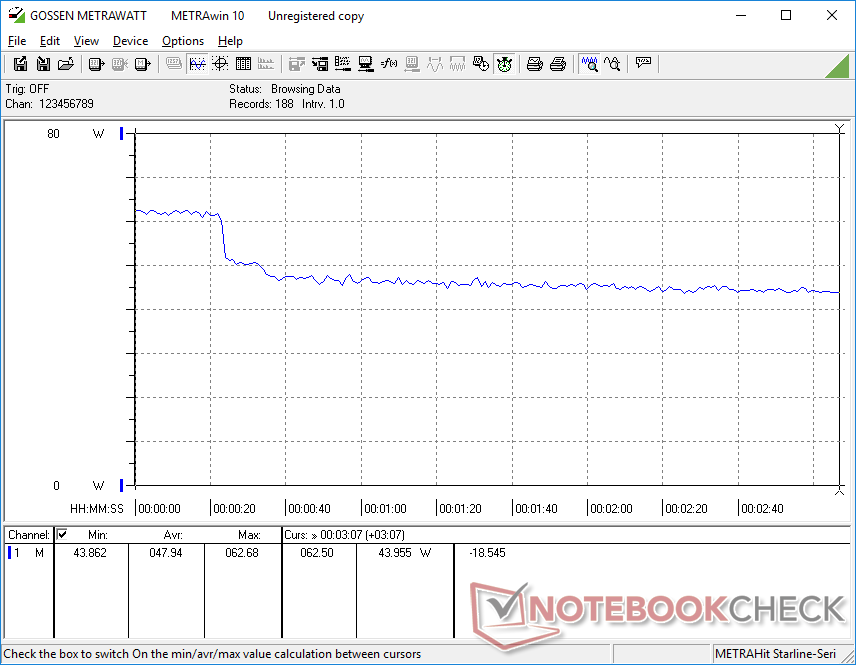
Stresstest
Bij belasting onder Prime95 zijn de PL2- en PL1-limieten van de Core i7-1360P met respectievelijk 64 W en 34 W precies hetzelfde als wat we zagen op de Core i7-1280P-aangedreven XPS 13 Plus van vorig jaar. De kloksnelheden stegen de eerste seconde tot 3,6 GHz, daalden daarna en stabiliseerden zich uiteindelijk op 2,3 GHz en 90 C. De zeer warme CPU-temperatuur is deels verantwoordelijk voor de hoge oppervlaktetemperaturen die hierboven zijn genoemd.
Het werken op batterijen heeft geen invloed op de prestaties. Een 3DMark 11 test op batterijen zou in wezen dezelfde scores opleveren als op netstroom.
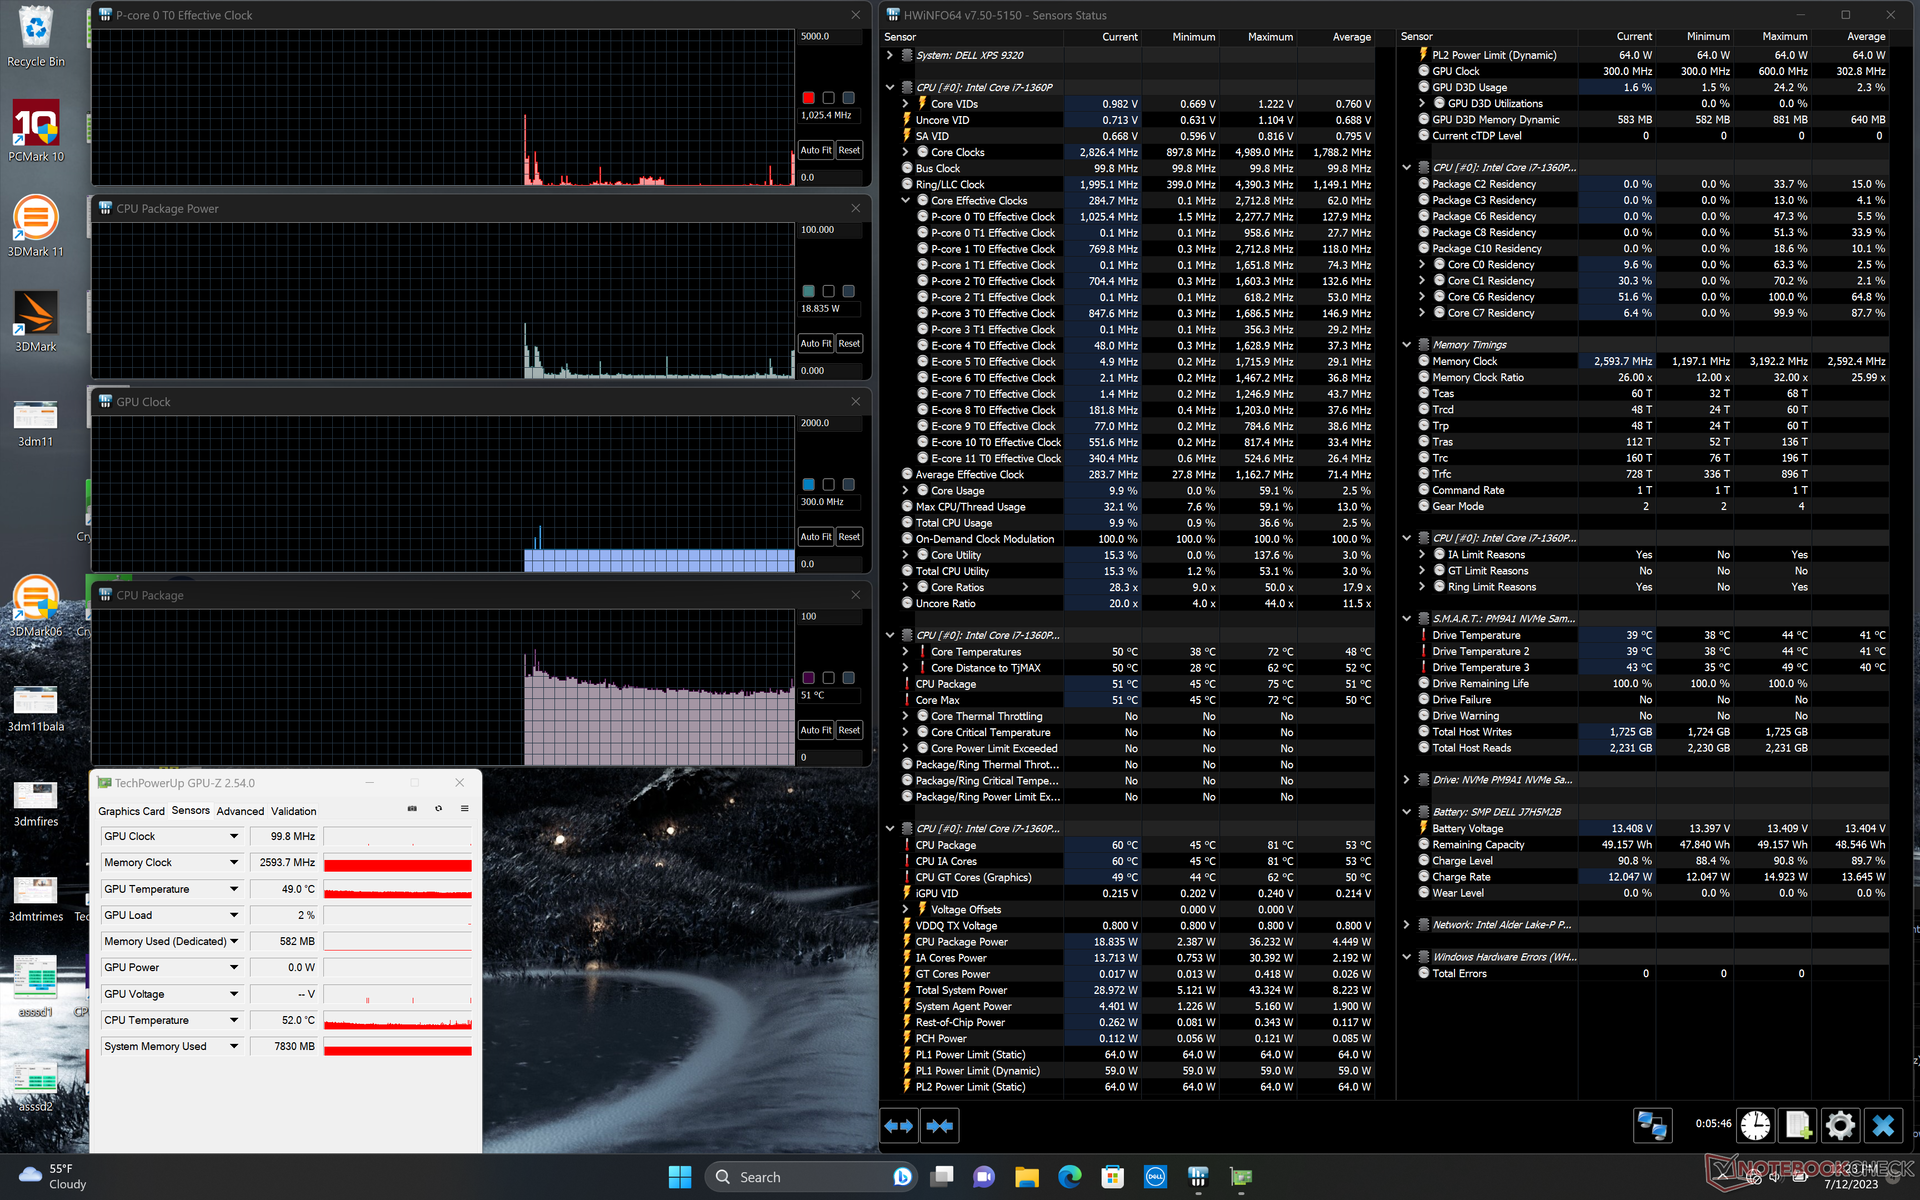
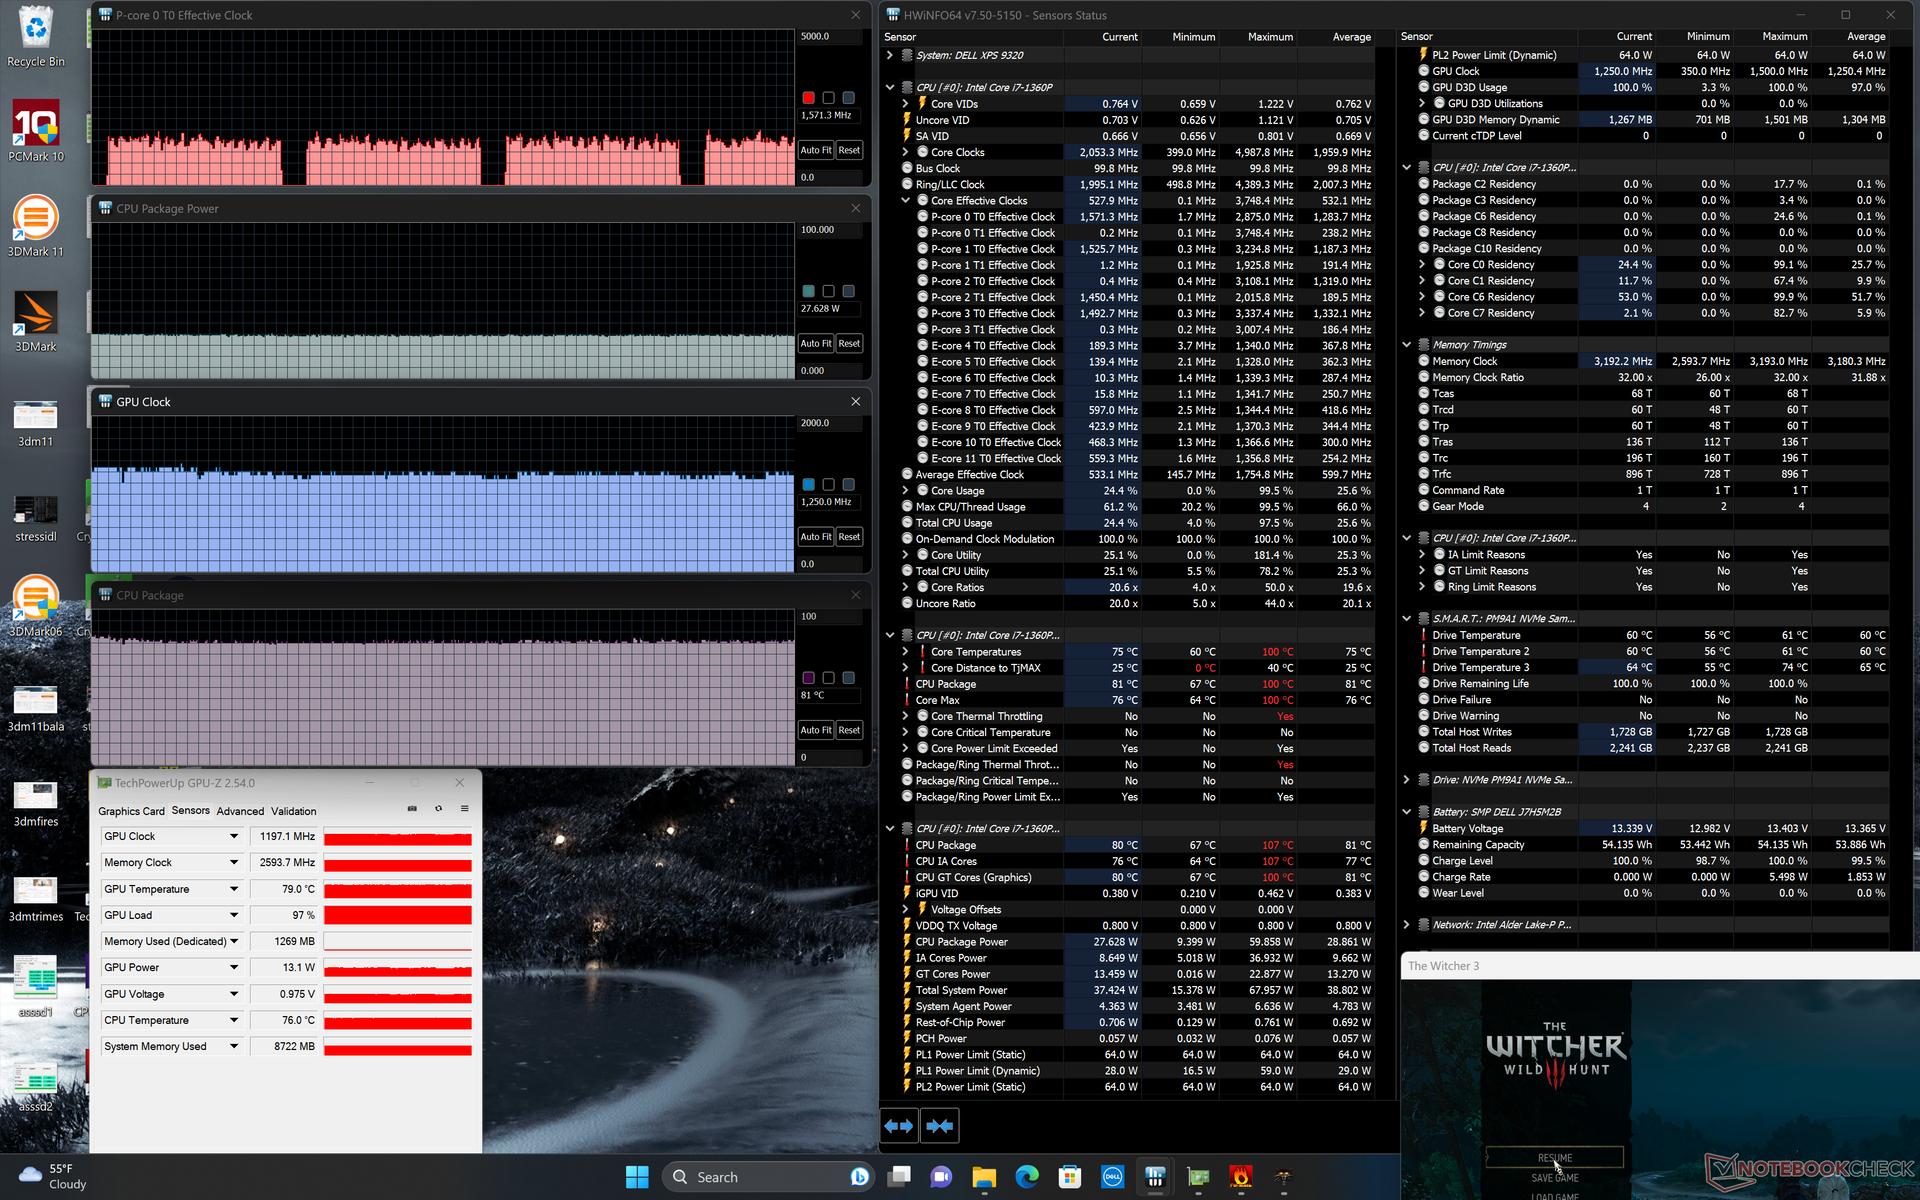
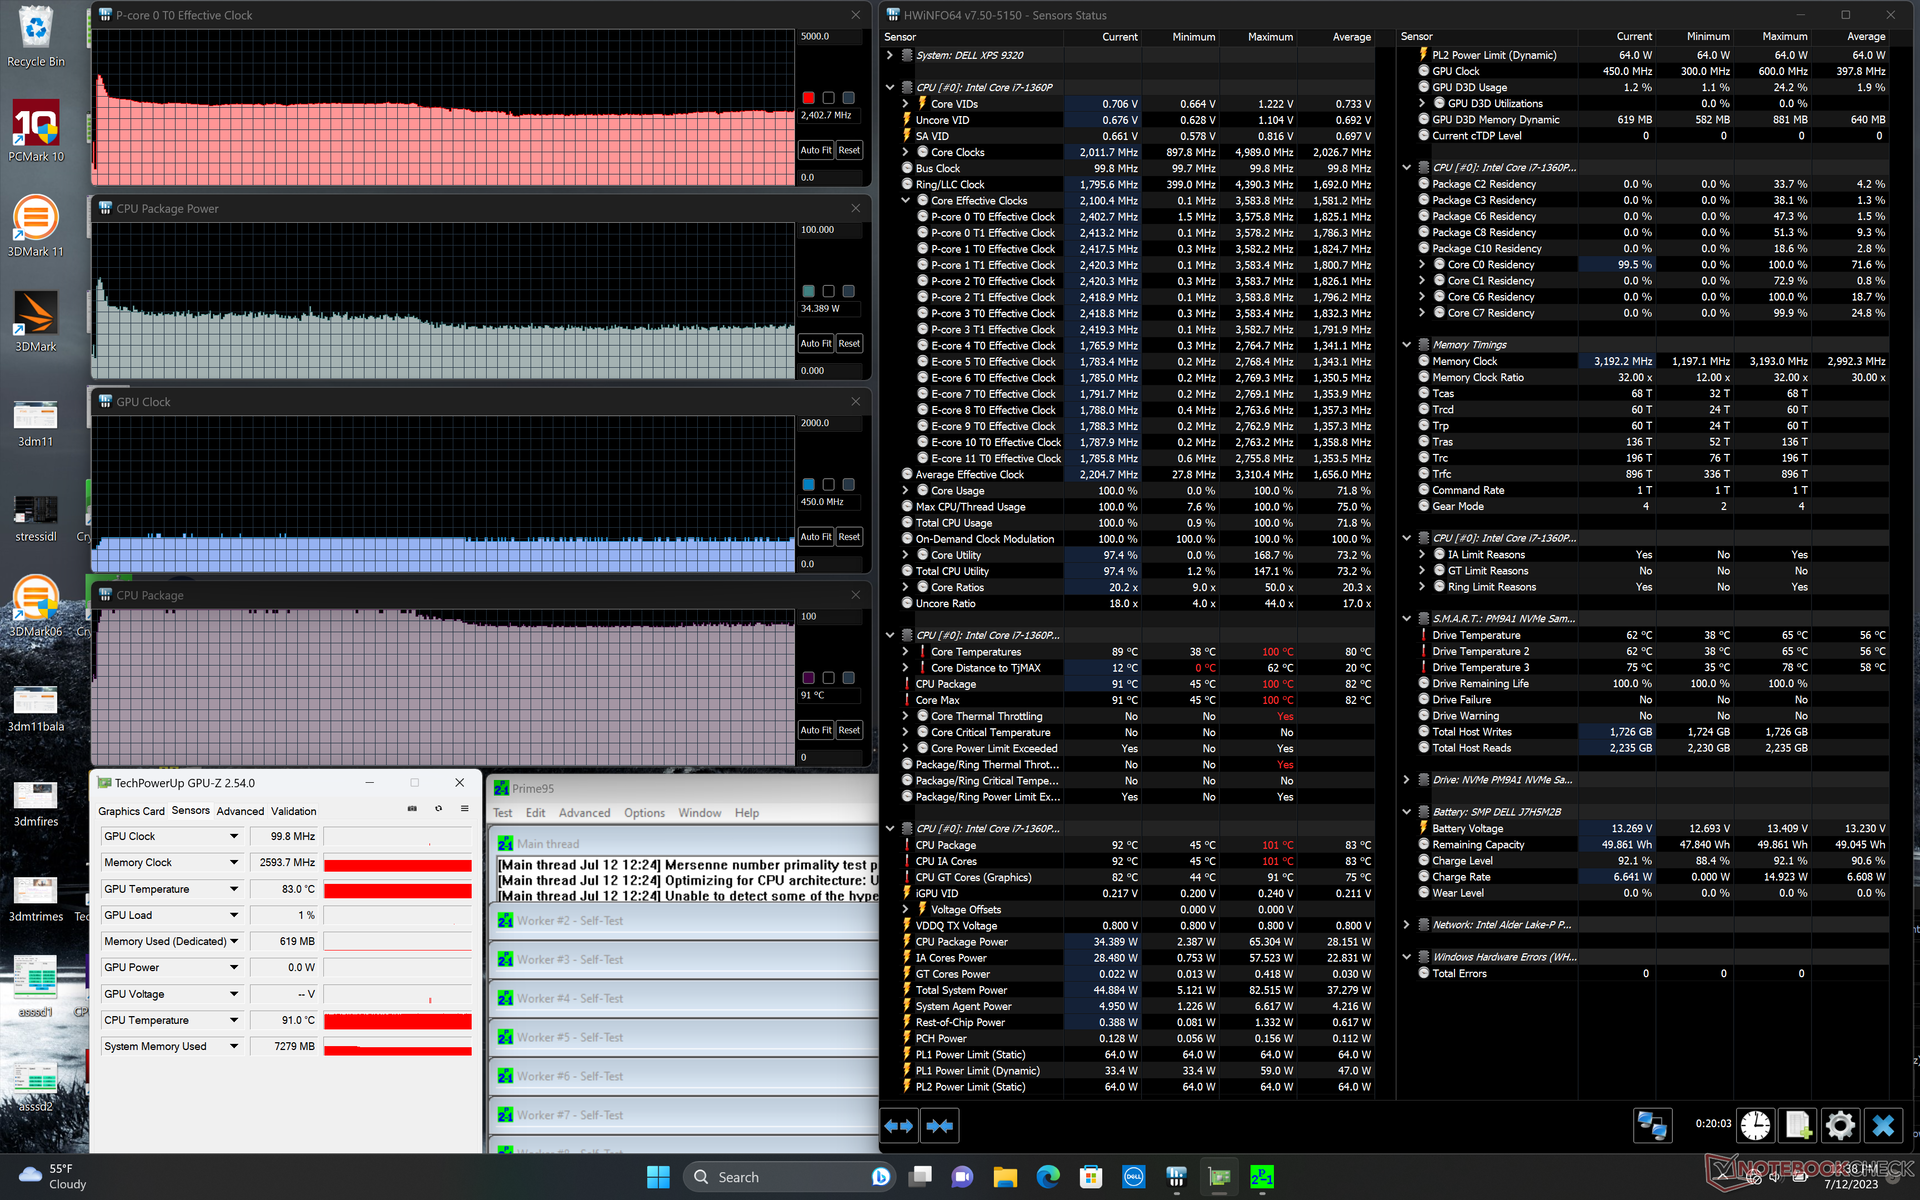
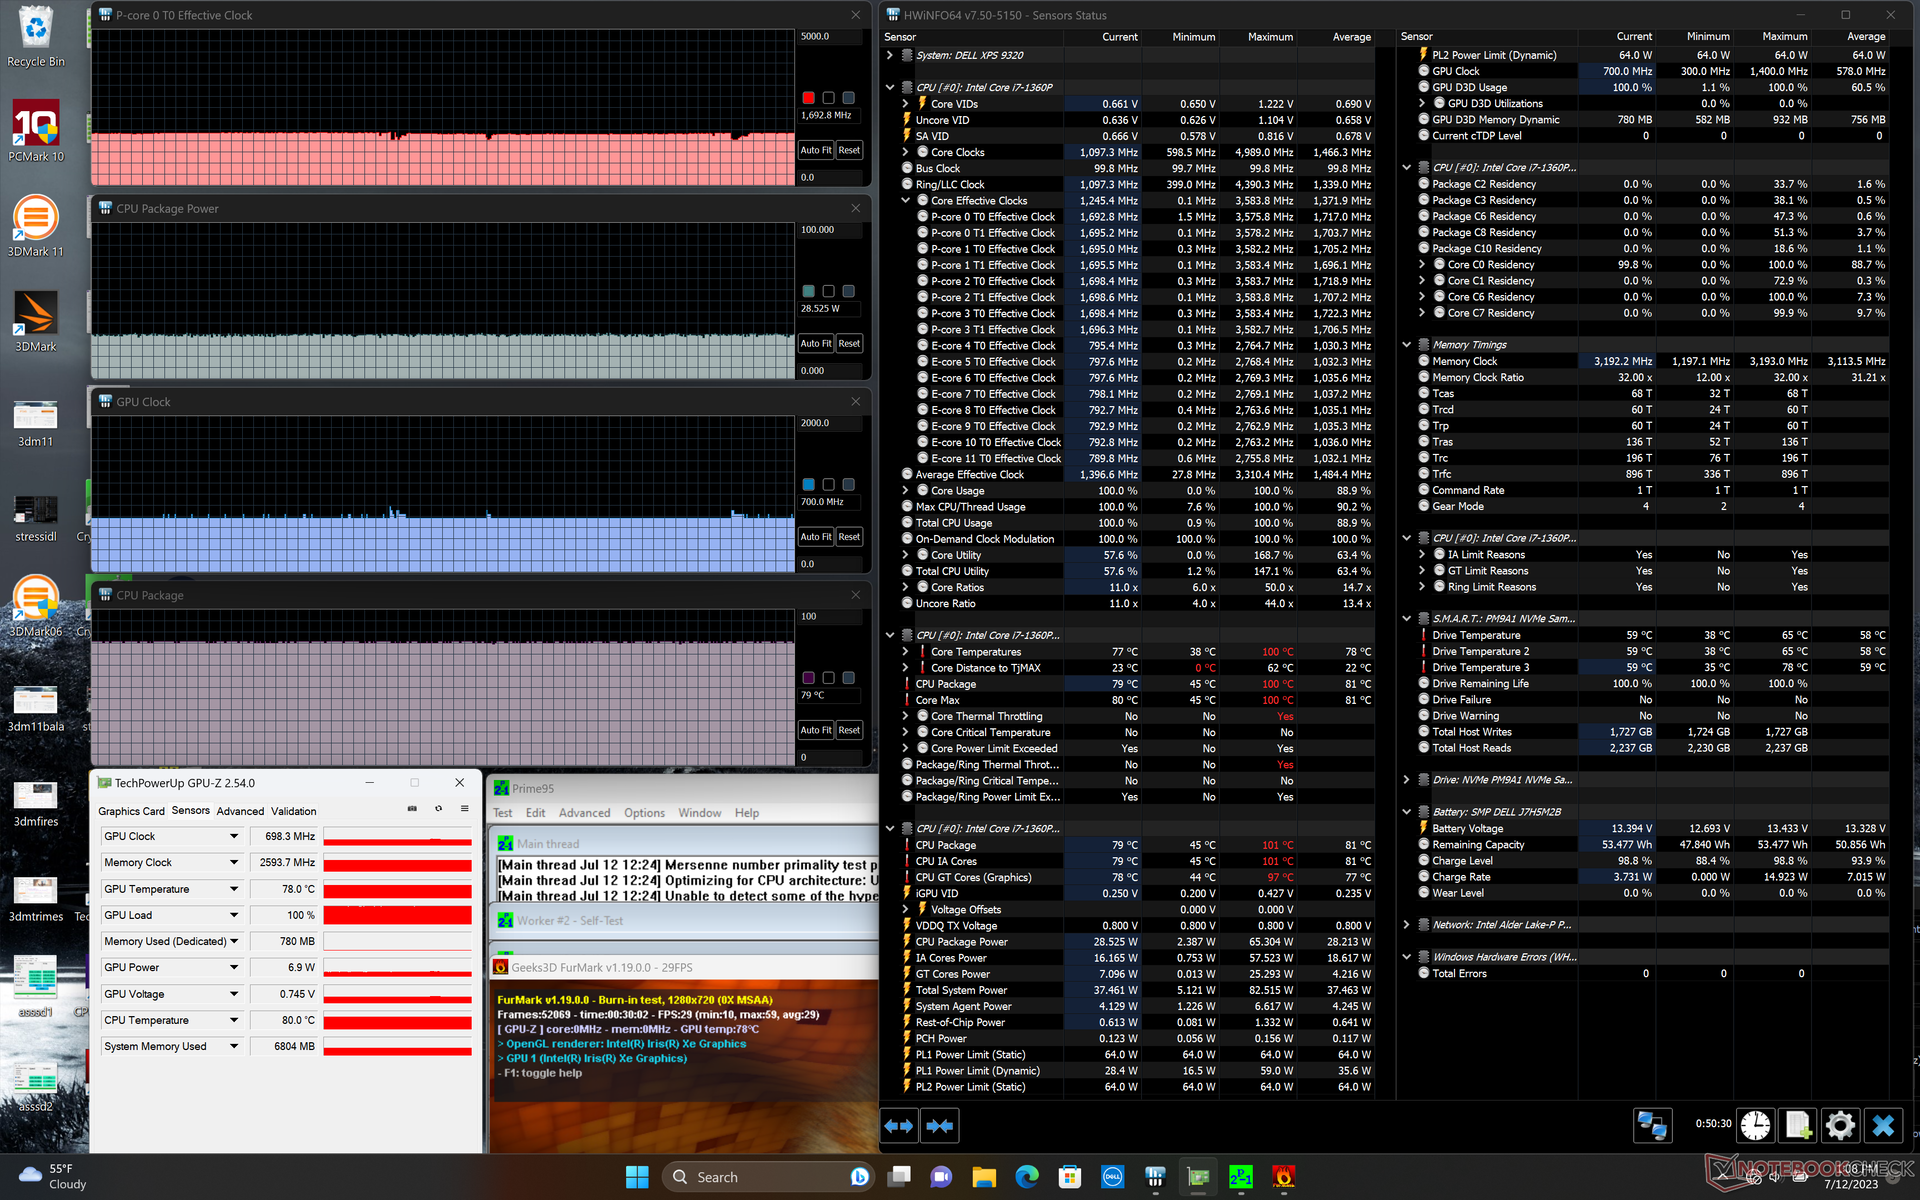
| CPU-klok (GHz) | GPU-klok (MHz) | Gemiddelde CPU-temperatuur (°C) | |
| Inactief systeem | -- | -- | 51 |
| Prime95-stress | 2.4 | -- | 91 |
| Prime95 + FurMark-stress | 1,7 | 700 | 79 |
| Witcher 3 Stress | ~1.6 | 1250 | 81 |
Luidsprekers
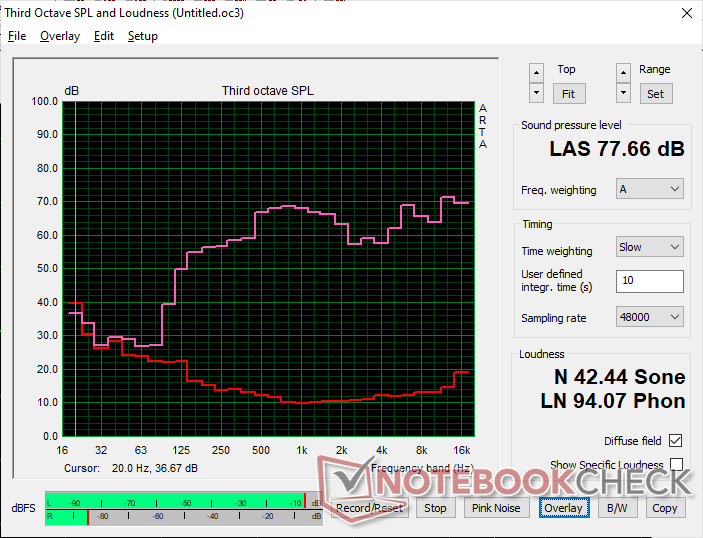
Dell XPS 13 Plus 9320 Core i7-1360P audioanalyse
(±) | luidspreker luidheid is gemiddeld maar goed (77.7 dB)
Bas 100 - 315 Hz
(±) | verminderde zeebaars - gemiddeld 10.8% lager dan de mediaan
(±) | lineariteit van de lage tonen is gemiddeld (10.2% delta ten opzichte van de vorige frequentie)
Midden 400 - 2000 Hz
(+) | evenwichtige middens - slechts 3.6% verwijderd van de mediaan
(+) | de middentonen zijn lineair (3.8% delta ten opzichte van de vorige frequentie)
Hoog 2 - 16 kHz
(+) | evenwichtige hoogtepunten - slechts 3.6% verwijderd van de mediaan
(±) | lineariteit van de hoogtepunten is gemiddeld (7.4% delta ten opzichte van de vorige frequentie)
Algemeen 100 - 16.000 Hz
(+) | het totale geluid is lineair (13.2% verschil met de mediaan)
Vergeleken met dezelfde klasse
» 22% van alle geteste apparaten in deze klasse waren beter, 5% vergelijkbaar, 74% slechter
» De beste had een delta van 5%, het gemiddelde was 18%, de slechtste was 53%
Vergeleken met alle geteste toestellen
» 13% van alle geteste apparaten waren beter, 3% gelijk, 84% slechter
» De beste had een delta van 4%, het gemiddelde was 23%, de slechtste was 134%
Apple MacBook Pro 16 2021 M1 Pro audioanalyse
(+) | luidsprekers kunnen relatief luid spelen (84.7 dB)
Bas 100 - 315 Hz
(+) | goede baars - slechts 3.8% verwijderd van de mediaan
(+) | de lage tonen zijn lineair (5.2% delta naar de vorige frequentie)
Midden 400 - 2000 Hz
(+) | evenwichtige middens - slechts 1.3% verwijderd van de mediaan
(+) | de middentonen zijn lineair (2.1% delta ten opzichte van de vorige frequentie)
Hoog 2 - 16 kHz
(+) | evenwichtige hoogtepunten - slechts 1.9% verwijderd van de mediaan
(+) | de hoge tonen zijn lineair (2.7% delta naar de vorige frequentie)
Algemeen 100 - 16.000 Hz
(+) | het totale geluid is lineair (4.6% verschil met de mediaan)
Vergeleken met dezelfde klasse
» 0% van alle geteste apparaten in deze klasse waren beter, 0% vergelijkbaar, 100% slechter
» De beste had een delta van 5%, het gemiddelde was 17%, de slechtste was 45%
Vergeleken met alle geteste toestellen
» 0% van alle geteste apparaten waren beter, 0% gelijk, 100% slechter
» De beste had een delta van 4%, het gemiddelde was 23%, de slechtste was 134%
Energiebeheer
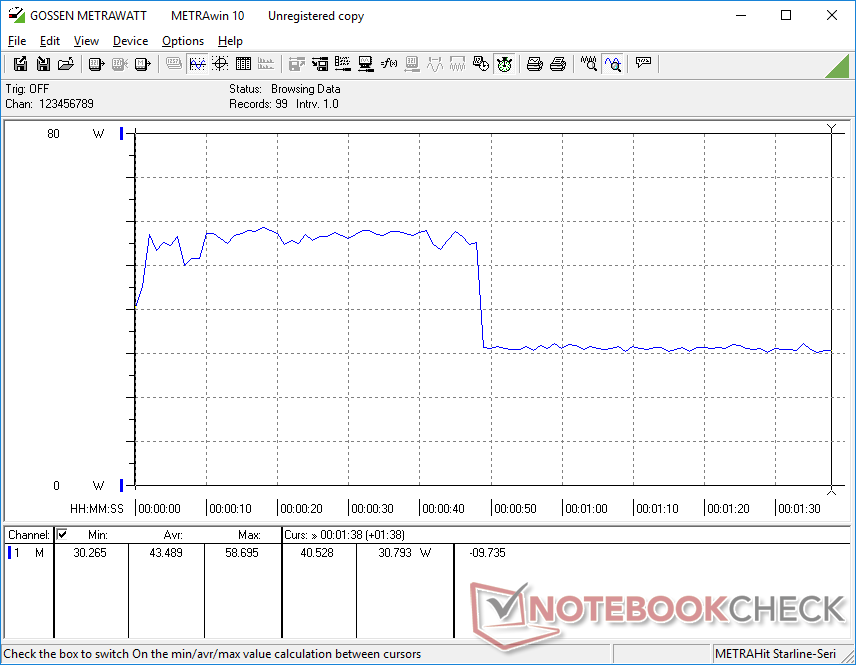
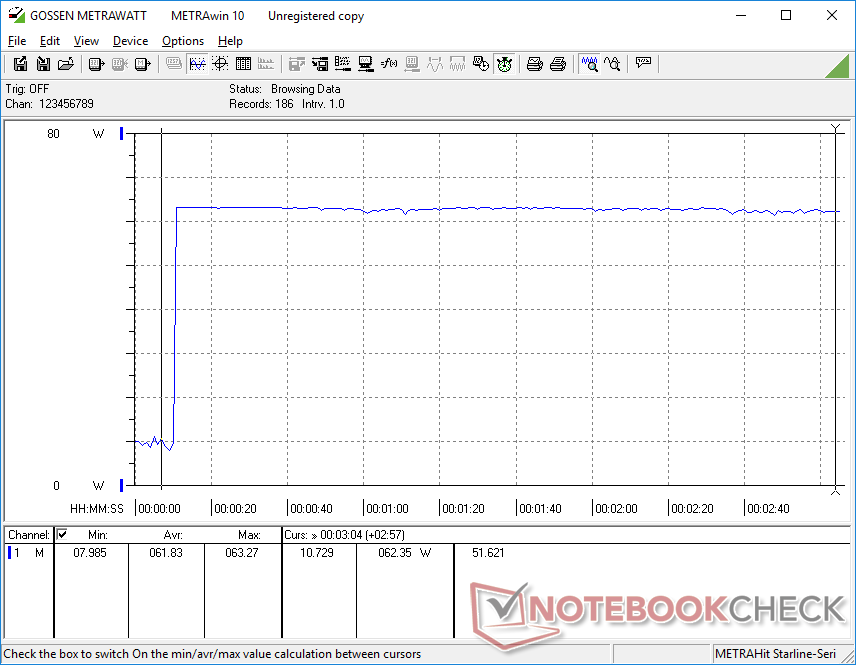
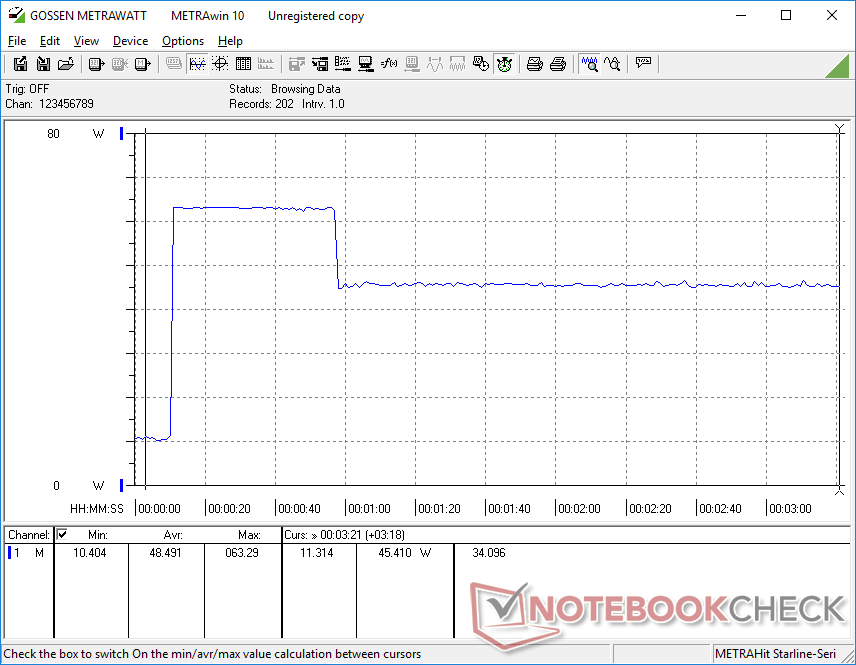
Stroomverbruik
Stationair draaien op een desktop kan tussen de 6 W en 14 W verbruiken, wat een groter bereik is dan bij de meeste andere subnotebooks vanwege het veeleisendere OLED-scherm. Zoals beschreven in ons artikel hiervragen bepaalde kleuren meer stroom op een OLED-paneel, terwijl het stroomverbruik onafhankelijk is van de kleur op IPS.
Over het algemeen is het stroomverbruik vergelijkbaar met het model van vorig jaar, ondanks de nieuwere generatie CPU. Het draaien van Prime95 zou bijvoorbeeld ongeveer 63 W van elk systeem vragen, wat betekent dat de prestatie-per-watt voordelen van de 13e generatie Core i7-1360P niet beter zijn dan die van de 12e generatie Core i7-1280P.
| Uit / Standby | |
| Inactief | |
| Belasting |
|
Key:
min: | |
| Dell XPS 13 Plus 9320 Core i7-1360P i7-1360P, Iris Xe G7 96EUs, Samsung PM9A1 MZVL2512HCJQ, OLED, 3456x2160, 13.4" | Dell XPS 13 Plus 9320 i7-1280P OLED i7-1280P, Iris Xe G7 96EUs, WDC PC SN810 512GB, OLED, 3456x2160, 13.4" | Dell XPS 13 7390 Core i7-10710U i7-10710U, UHD Graphics 620, SK Hynix PC601 NVMe 512 GB, IPS, 3840x2160, 13.3" | Framework Laptop 13.5 13th Gen Intel i7-1370P, Iris Xe G7 96EUs, WD PC SN740 SDDPNQD-1T00, IPS, 2256x1504, 13.5" | Lenovo ThinkPad X13 Yoga G3 21AW003UGE i7-1265U, Iris Xe G7 96EUs, Samsung PM9A1 MZVL2512HCJQ, IPS LED, 2560x1600, 13.3" | HP Spectre x360 13.5 14t-ef000 i7-1255U, Iris Xe G7 96EUs, Micron 3400 1TB MTFDKBA1T0TFH, OLED, 3000x2000, 13.5" | |
|---|---|---|---|---|---|---|
| Power Consumption | -5% | 16% | 10% | 7% | 16% | |
| Idle Minimum * (Watt) | 6.9 | 6.5 6% | 4.7 32% | 2.9 58% | 4.6 33% | 4 42% |
| Idle Average * (Watt) | 7.4 | 7.8 -5% | 8.3 -12% | 6.3 15% | 7.9 -7% | 4.9 34% |
| Idle Maximum * (Watt) | 13.6 | 13 4% | 9 34% | 9.9 27% | 8.9 35% | 12.5 8% |
| Load Average * (Watt) | 43.5 | 56.6 -30% | 42 3% | 56.2 -29% | 56.1 -29% | 48.1 -11% |
| Witcher 3 ultra * (Watt) | 48 | 49.2 -3% | 56.6 -18% | 40.4 16% | 35.8 25% | |
| Load Maximum * (Watt) | 63.3 | 63 -0% | 49 23% | 60.8 4% | 66.1 -4% | 65.2 -3% |
* ... kleiner is beter
Power Consumption Witcher 3 / Stresstest
Power Consumption external Monitor
Levensduur batterij
De runtimes zijn bijna identiek aan die van de Core i7-1260P-configuratie van vorig jaar met ongeveer 7,5 uur surfen in de echte wereld.
Opladen van leeg naar vol duurt met de meegeleverde adapter iets meer dan 2 uur.
| Dell XPS 13 Plus 9320 Core i7-1360P i7-1360P, Iris Xe G7 96EUs, 55 Wh | Dell XPS 13 Plus 9320 i7-1280P OLED i7-1280P, Iris Xe G7 96EUs, 55 Wh | Dell XPS 13 7390 Core i7-10710U i7-10710U, UHD Graphics 620, 52 Wh | Framework Laptop 13.5 13th Gen Intel i7-1370P, Iris Xe G7 96EUs, 61 Wh | Lenovo ThinkPad X13 Yoga G3 21AW003UGE i7-1265U, Iris Xe G7 96EUs, 52.8 Wh | HP Spectre x360 13.5 14t-ef000 i7-1255U, Iris Xe G7 96EUs, 66 Wh | |
|---|---|---|---|---|---|---|
| Batterijduur | -21% | 15% | 21% | 11% | 10% | |
| WiFi v1.3 (h) | 7.3 | 5.8 -21% | 8.4 15% | 8.8 21% | 8.1 11% | 8 10% |
| Load (h) | 1.9 | 2.2 | ||||
| Reader / Idle (h) | 20.4 |
Pro
Contra
Verdict - Sla de 2023-versie over en koop gewoon de 2022-versie
De XPS 13 Plus ontwerp werd vorig jaar geïntroduceerd en de update van dit jaar is dus naar verwachting klein. Het zou onrealistisch zijn om op dit moment uit te gaan van dramatische updates aan het chassis of de interne onderdelen, maar de 2023 refresh is helaas vergeetbaar gezien het feit dat het nauwelijks voordelen biedt op het gebied van processorprestaties of prestaties-per-watt ten opzichte van het voorgaande jaar. Bovendien lijken andere aspecten inconsistent, zoals frame skips tijdens het afspelen van video's en de throttling SSD. Alle belangrijke voor- en nadelen van de originele XPS 13 Plus 9320 zijn nog steeds van toepassing op de 2023 versie.
De 13e Core i7-1360P voelt aan als een rebranding van de 12e gen Core i7-1280P. Geïnteresseerde kopers kunnen daarom beter de originele XPS 13 Plus 9320 uit 2022 overwegen in plaats van de nieuwere versie uit 2023.
Als je in de markt bent voor de XPS 13 Plus 9320, dan raden we het originele 2022 model aan, omdat het minder duur is met in wezen dezelfde prestaties als de 2023 iteratie. In plaats daarvan kunnen kopers de bespaarde dollars investeren in meer tastbare functies zoals meer RAM, meer opslagruimte of een beeldscherm met een hogere resolutie.
Prijs en beschikbaarheid
Dell levert de XPS 13 Plus 9320 nu vanaf $1150 USD voor de basisconfiguratie met FHD tot $1750 USD voor de configuratie met 4K UHD.
Dell XPS 13 Plus 9320 Core i7-1360P
- 16-07-2023 v7 (old)
Allen Ngo
Transparantie
De selectie van te beoordelen apparaten wordt gemaakt door onze redactie. Het testexemplaar werd ten behoeve van deze beoordeling door de fabrikant of detailhandelaar in bruikleen aan de auteur verstrekt. De kredietverstrekker had geen invloed op deze recensie, noch ontving de fabrikant vóór publicatie een exemplaar van deze recensie. Er bestond geen verplichting om deze recensie te publiceren. Als onafhankelijk mediabedrijf is Notebookcheck niet onderworpen aan het gezag van fabrikanten, detailhandelaren of uitgevers.
[transparency_disclaimer]Dit is hoe Notebookcheck test
Elk jaar beoordeelt Notebookcheck onafhankelijk honderden laptops en smartphones met behulp van gestandaardiseerde procedures om ervoor te zorgen dat alle resultaten vergelijkbaar zijn. We hebben onze testmethoden al zo'n 20 jaar voortdurend ontwikkeld en daarbij de industriestandaard bepaald. In onze testlaboratoria wordt gebruik gemaakt van hoogwaardige meetapparatuur door ervaren technici en redacteuren. Deze tests omvatten een validatieproces in meerdere fasen. Ons complexe beoordelingssysteem is gebaseerd op honderden goed onderbouwde metingen en benchmarks, waardoor de objectiviteit behouden blijft. Meer informatie over onze testmethoden kunt u hier vinden.
Price comparison

