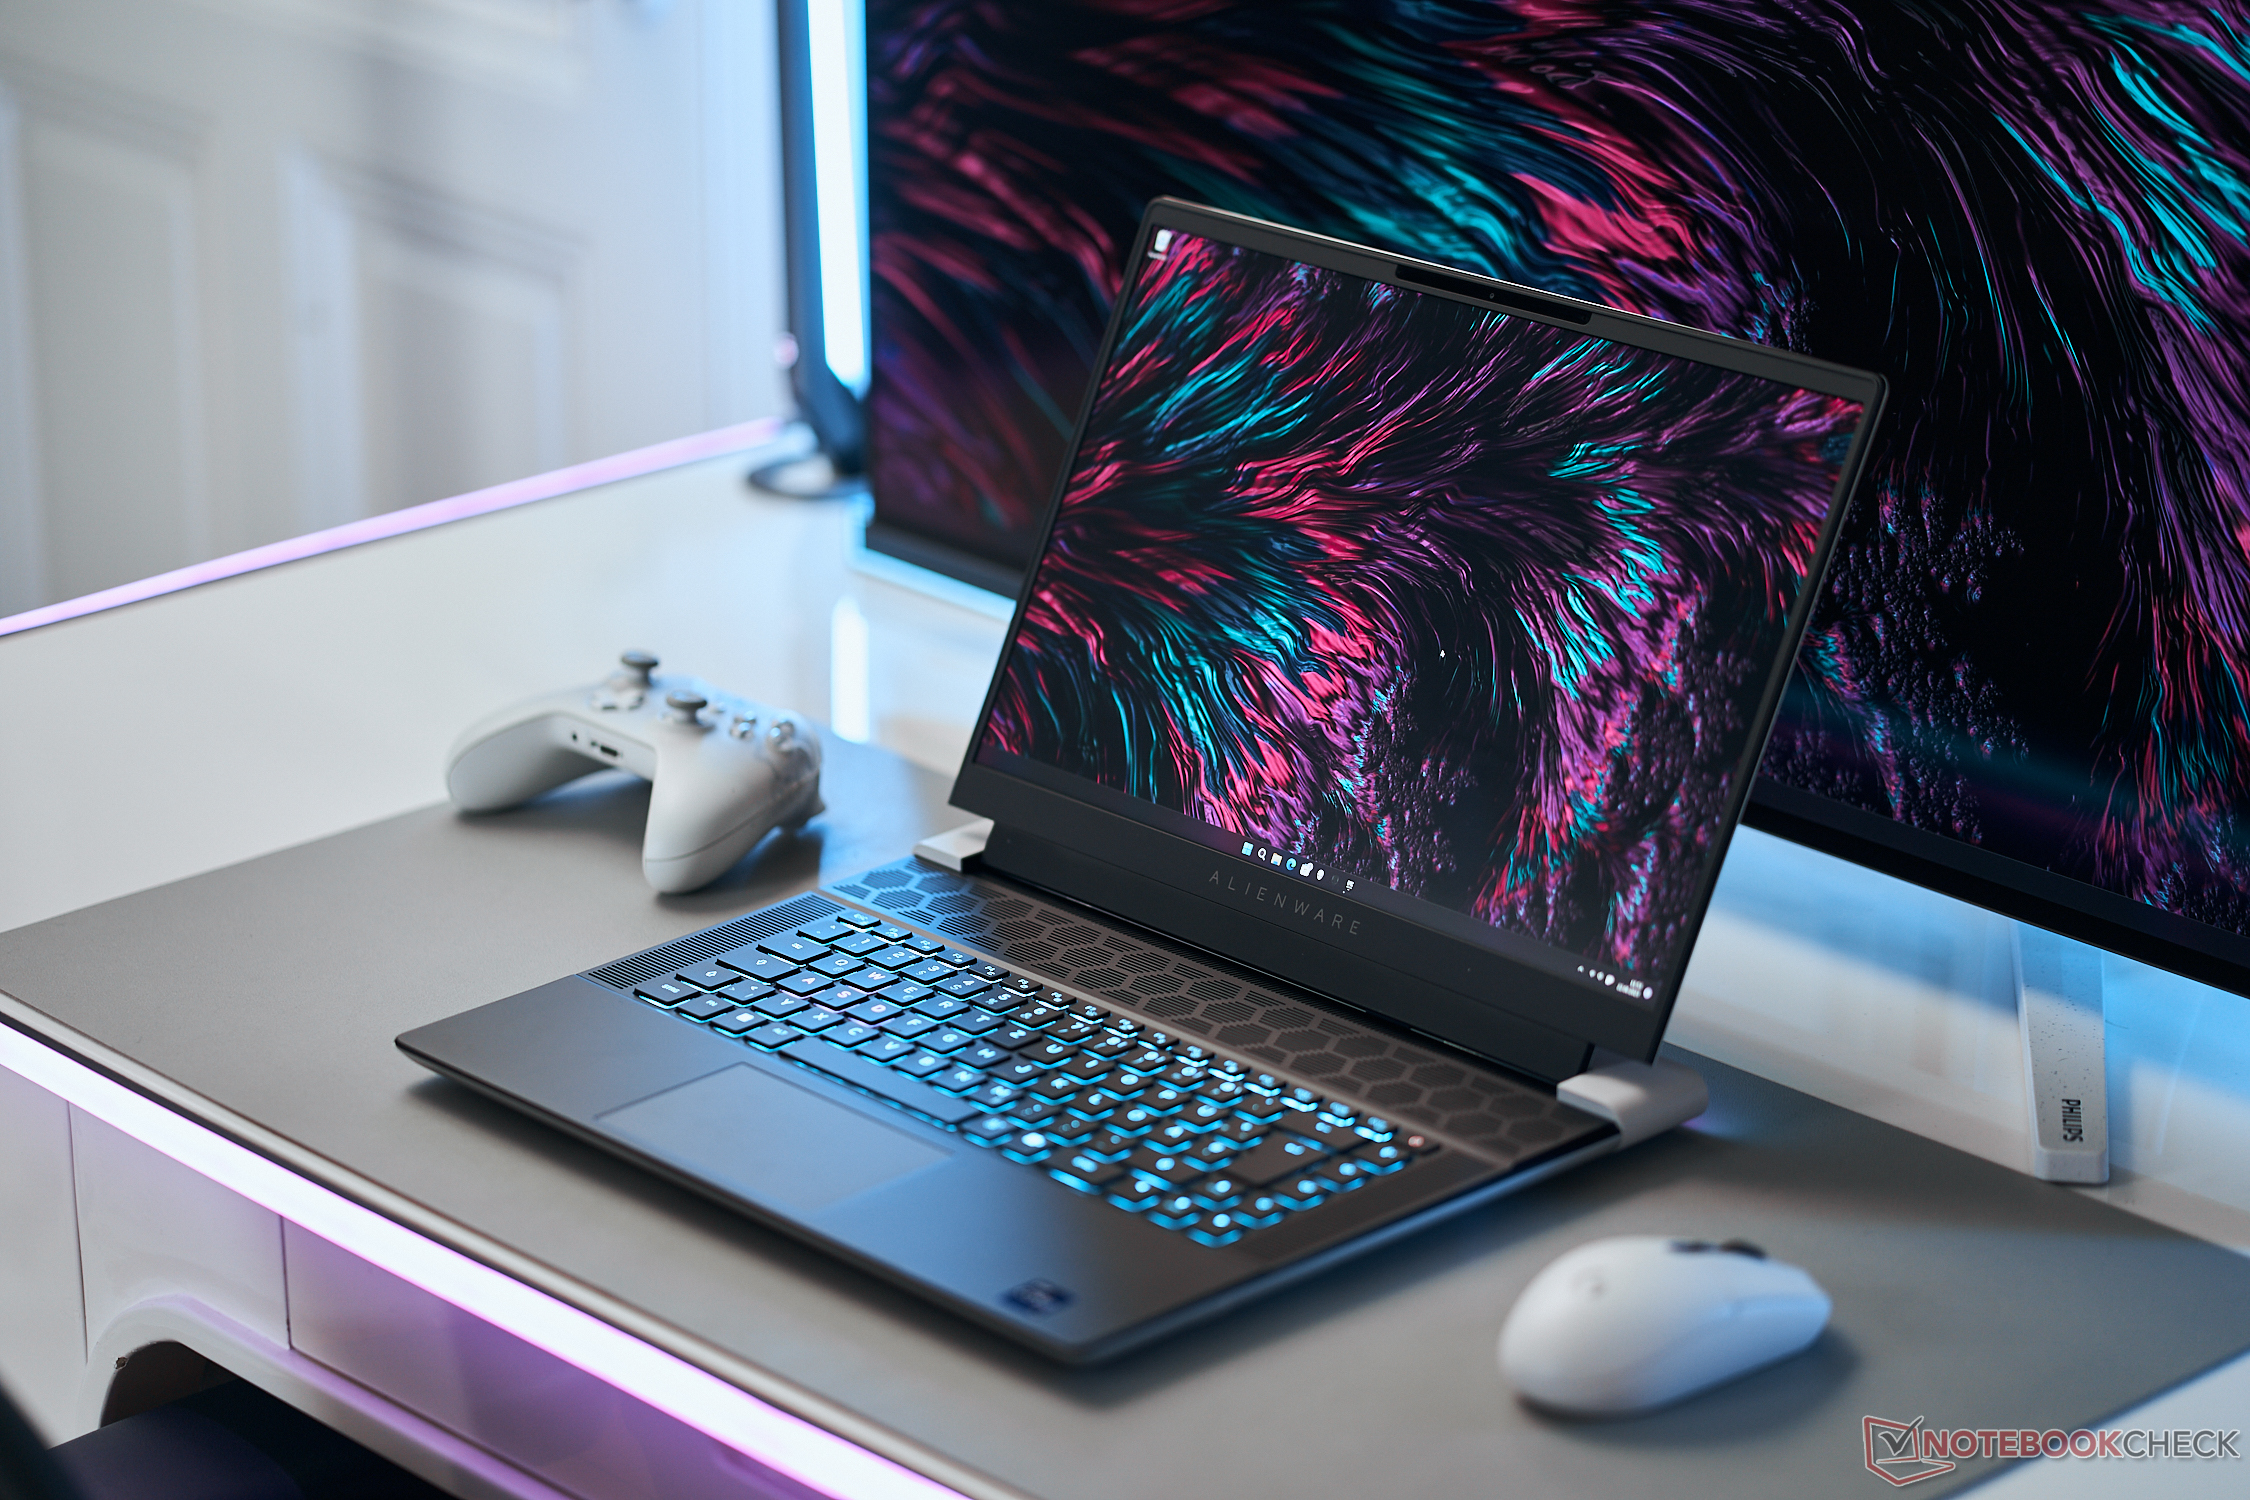
Intel Core i9-13900HK prestatiedebuut: Alienware x16 R1 laptop review

Onthuld op CES 2023de Alienware x16 R1 is het tweede 16-inch model in de familie na de dikkere en krachtigere Alienware m16 die we nog moeten reviewen. De twee modellen zijn een aanvulling op de bestaande 14-inch, 15-inch, 17-inch en 18-inch Alienware-opties die al op de markt zijn.
Onze testunit is een configuratie in het hogere segment met de 13e gen Raptor Lake Core i9-13900HK CPU, GeForce RTX 4080 GPU en 16,0-inch 2560 x 1600 240 Hz IPS scherm voor ongeveer 3350 USD. Goedkopere of duurdere configuraties zijn beschikbaar, variërend van de Core i7-13620H, 1200p beeldscherm en RTX 4050 GPU tot de RTX 4090 voor $2200 tot meer dan $4000.
Alternatieven voor de Alienware x16 R1 zijn andere 16-inch gaming laptops zoals de Lenovo Legion Pro 7, Asus ROG Zephyrus M16, Razer Blade 16, of de HP Omen 16. Deze specifieke groottecategorie is de afgelopen jaren steeds populairder geworden.
Meer Dell beoordelingen:
Potentiële concurrenten in vergelijking
Evaluatie | Datum | Model | Gewicht | Hoogte | Formaat | Resolutie | Beste prijs |
|---|---|---|---|---|---|---|---|
| 88.4 % v7 (old) | 06-2023 | Alienware x16 R1 i9-13900HK, GeForce RTX 4080 Laptop GPU | 2.6 kg | 18.57 mm | 16.00" | 2560x1600 | |
| 88.8 % v7 (old) | 06-2023 | Lenovo Legion Pro 7 RTX4090 i9-13900HX, GeForce RTX 4090 Laptop GPU | 2.7 kg | 26 mm | 16.00" | 2560x1600 | |
| 89.4 % v7 (old) | 03-2023 | Asus ROG Zephyrus M16 GU604VY-NM042X i9-13900H, GeForce RTX 4090 Laptop GPU | 2.3 kg | 22.9 mm | 16.00" | 2560x1600 | |
| 91.2 % v7 (old) | 02-2023 | Razer Blade 16 Early 2023 i9-13950HX, GeForce RTX 4080 Laptop GPU | 2.4 kg | 21.99 mm | 16.00" | 2560x1600 | |
| 86.1 % v7 (old) | 10-2022 | Dell G16 7620 i7-12700H, GeForce RTX 3060 Laptop GPU | 2.6 kg | 26.9 mm | 16.00" | 2560x1600 | |
| 86.1 % v7 (old) | 01-2023 | Alienware m17 R5 (R9 6900HX, RX 6850M XT) R9 6900HX, Radeon RX 6850M XT | 3.4 kg | 26.7 mm | 17.00" | 3840x2160 |
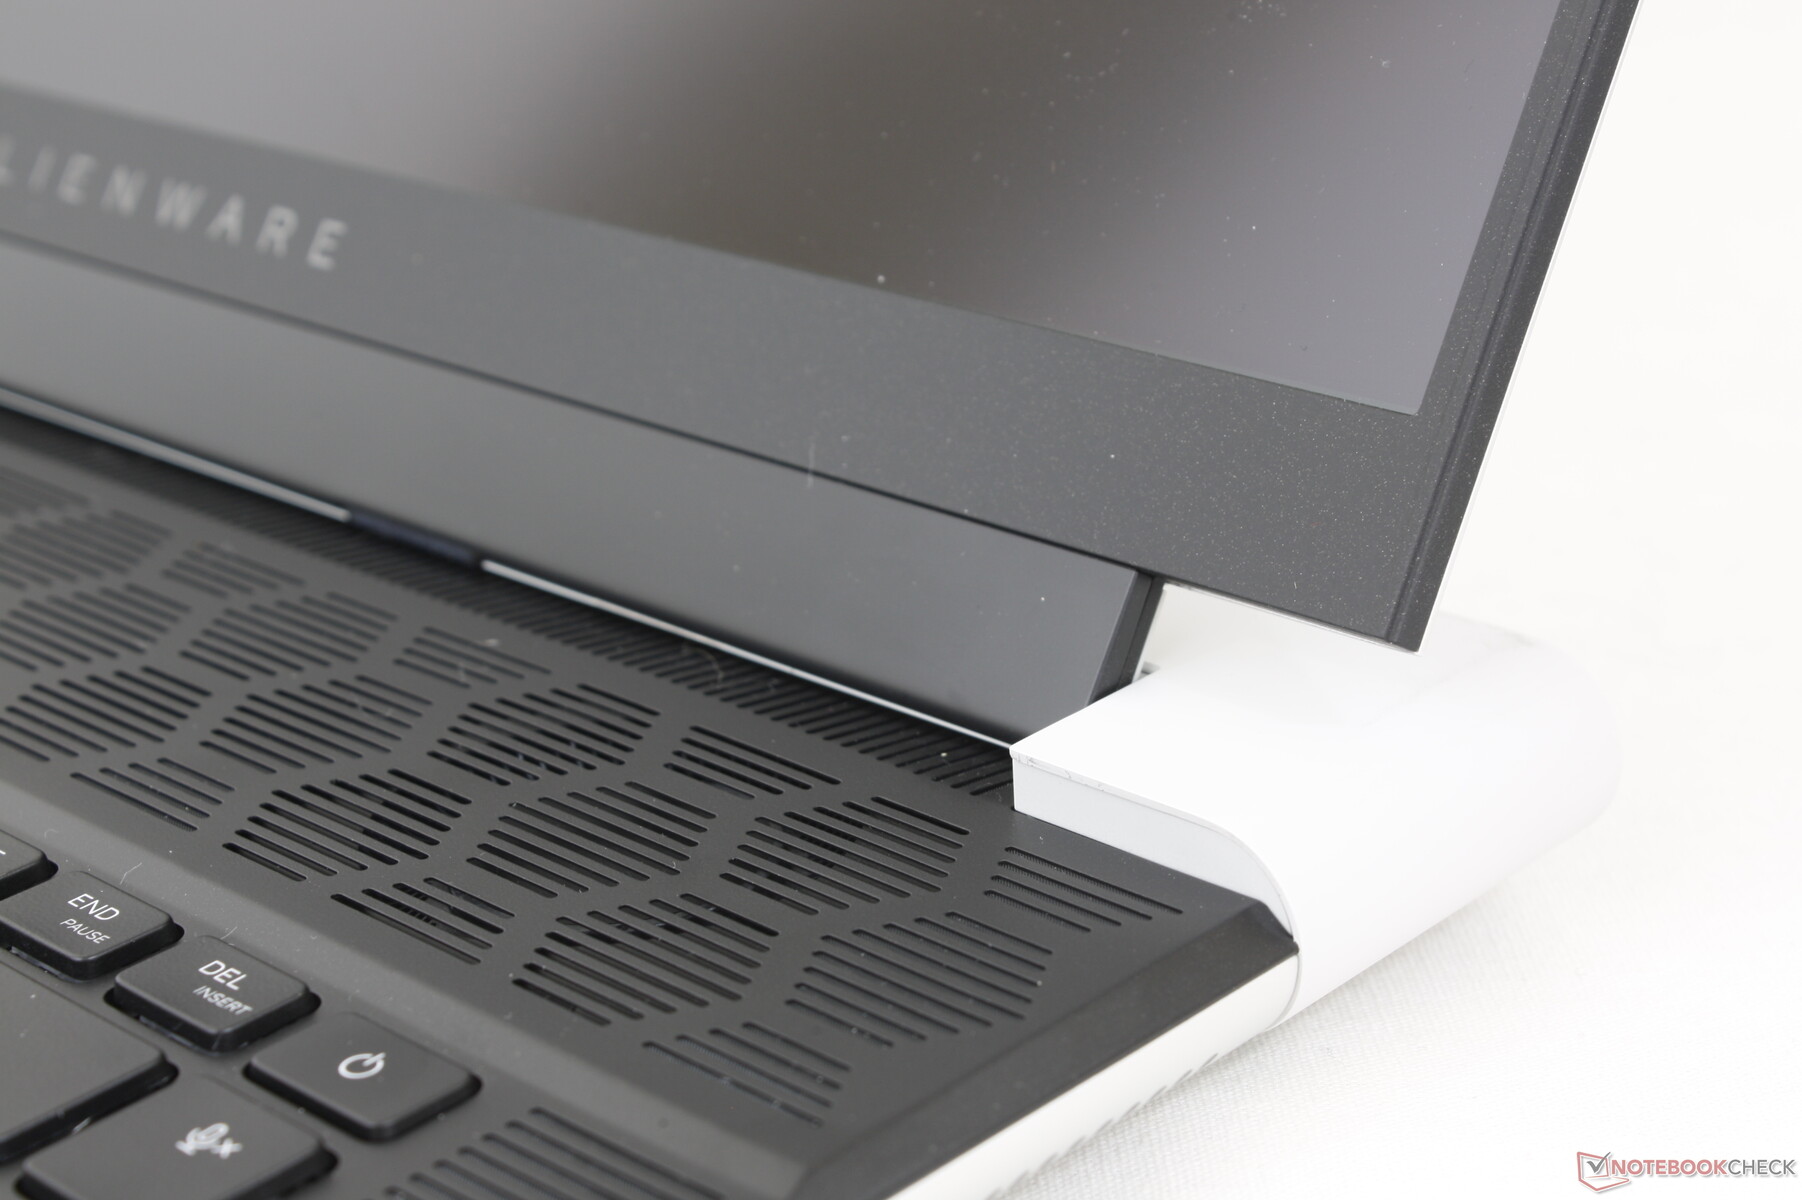
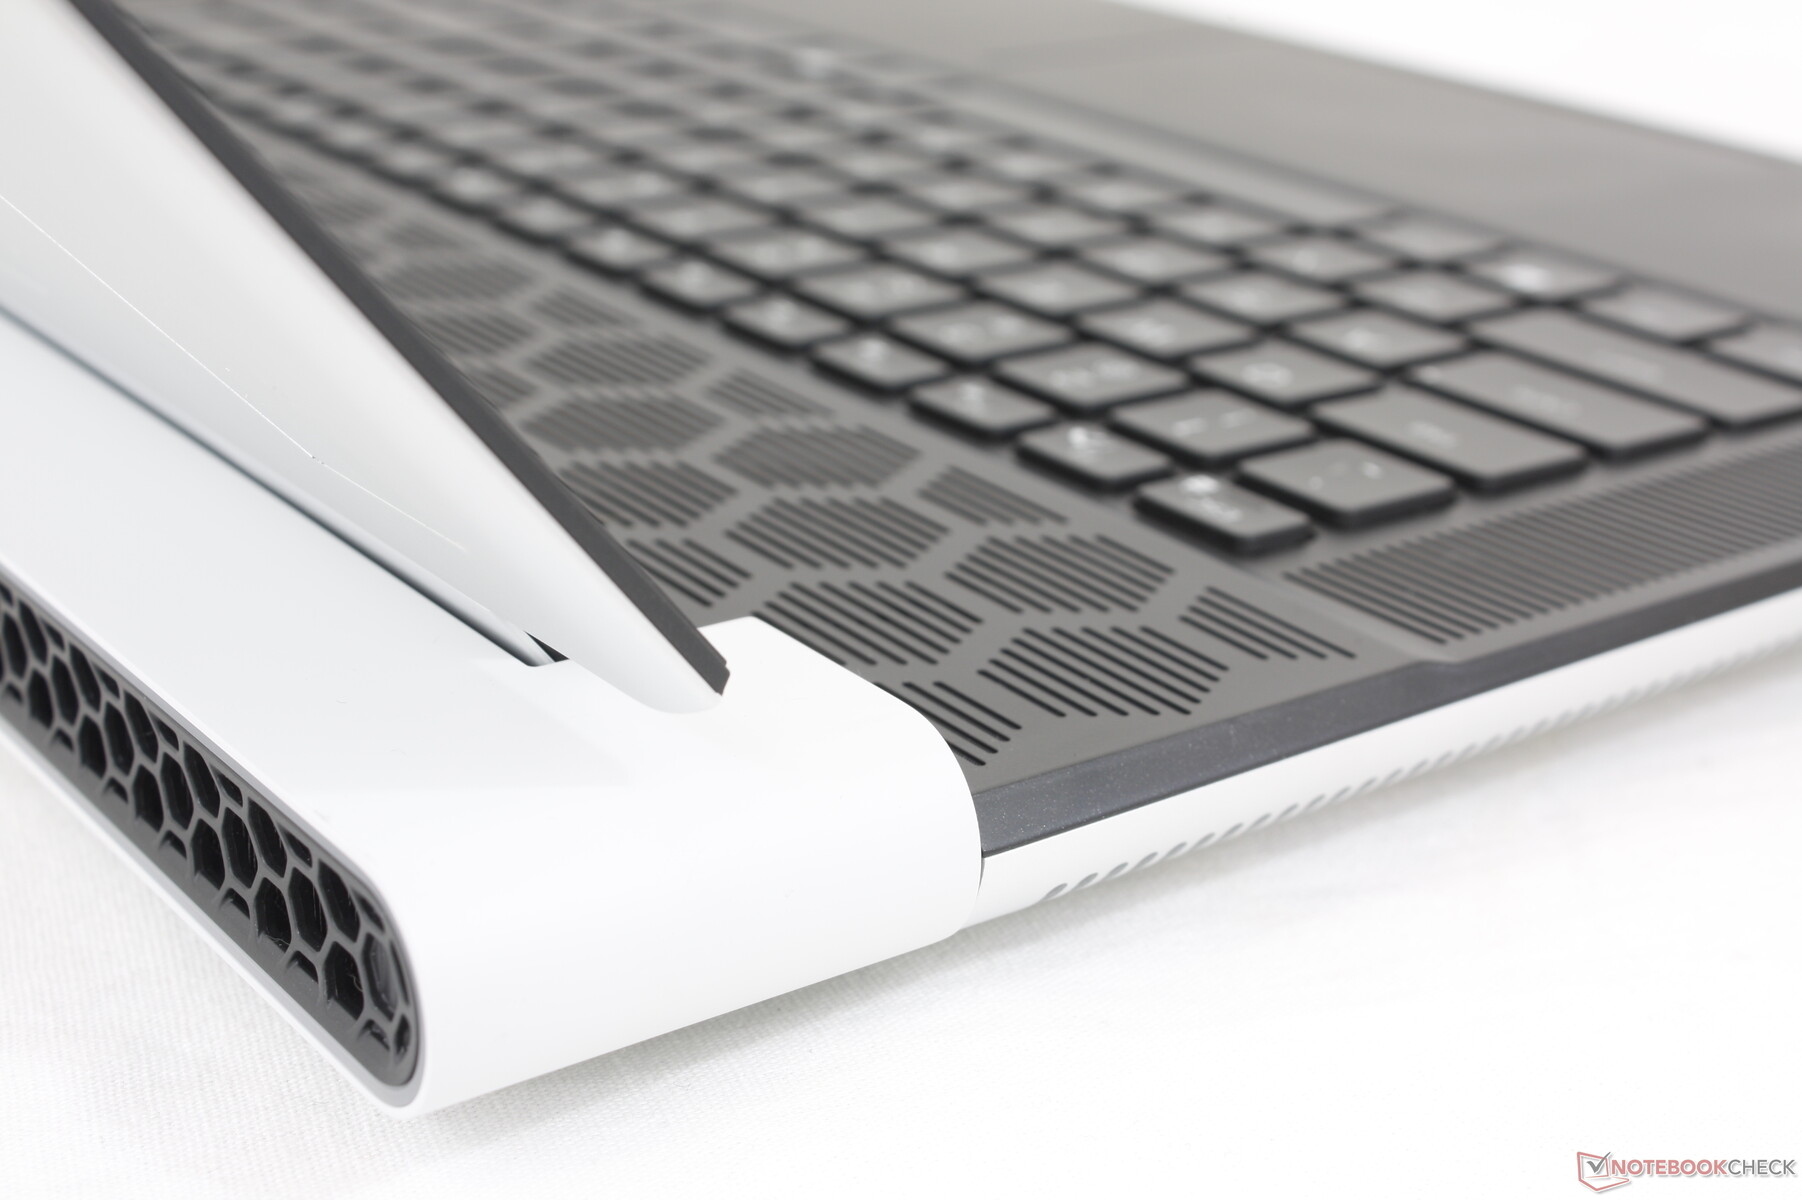
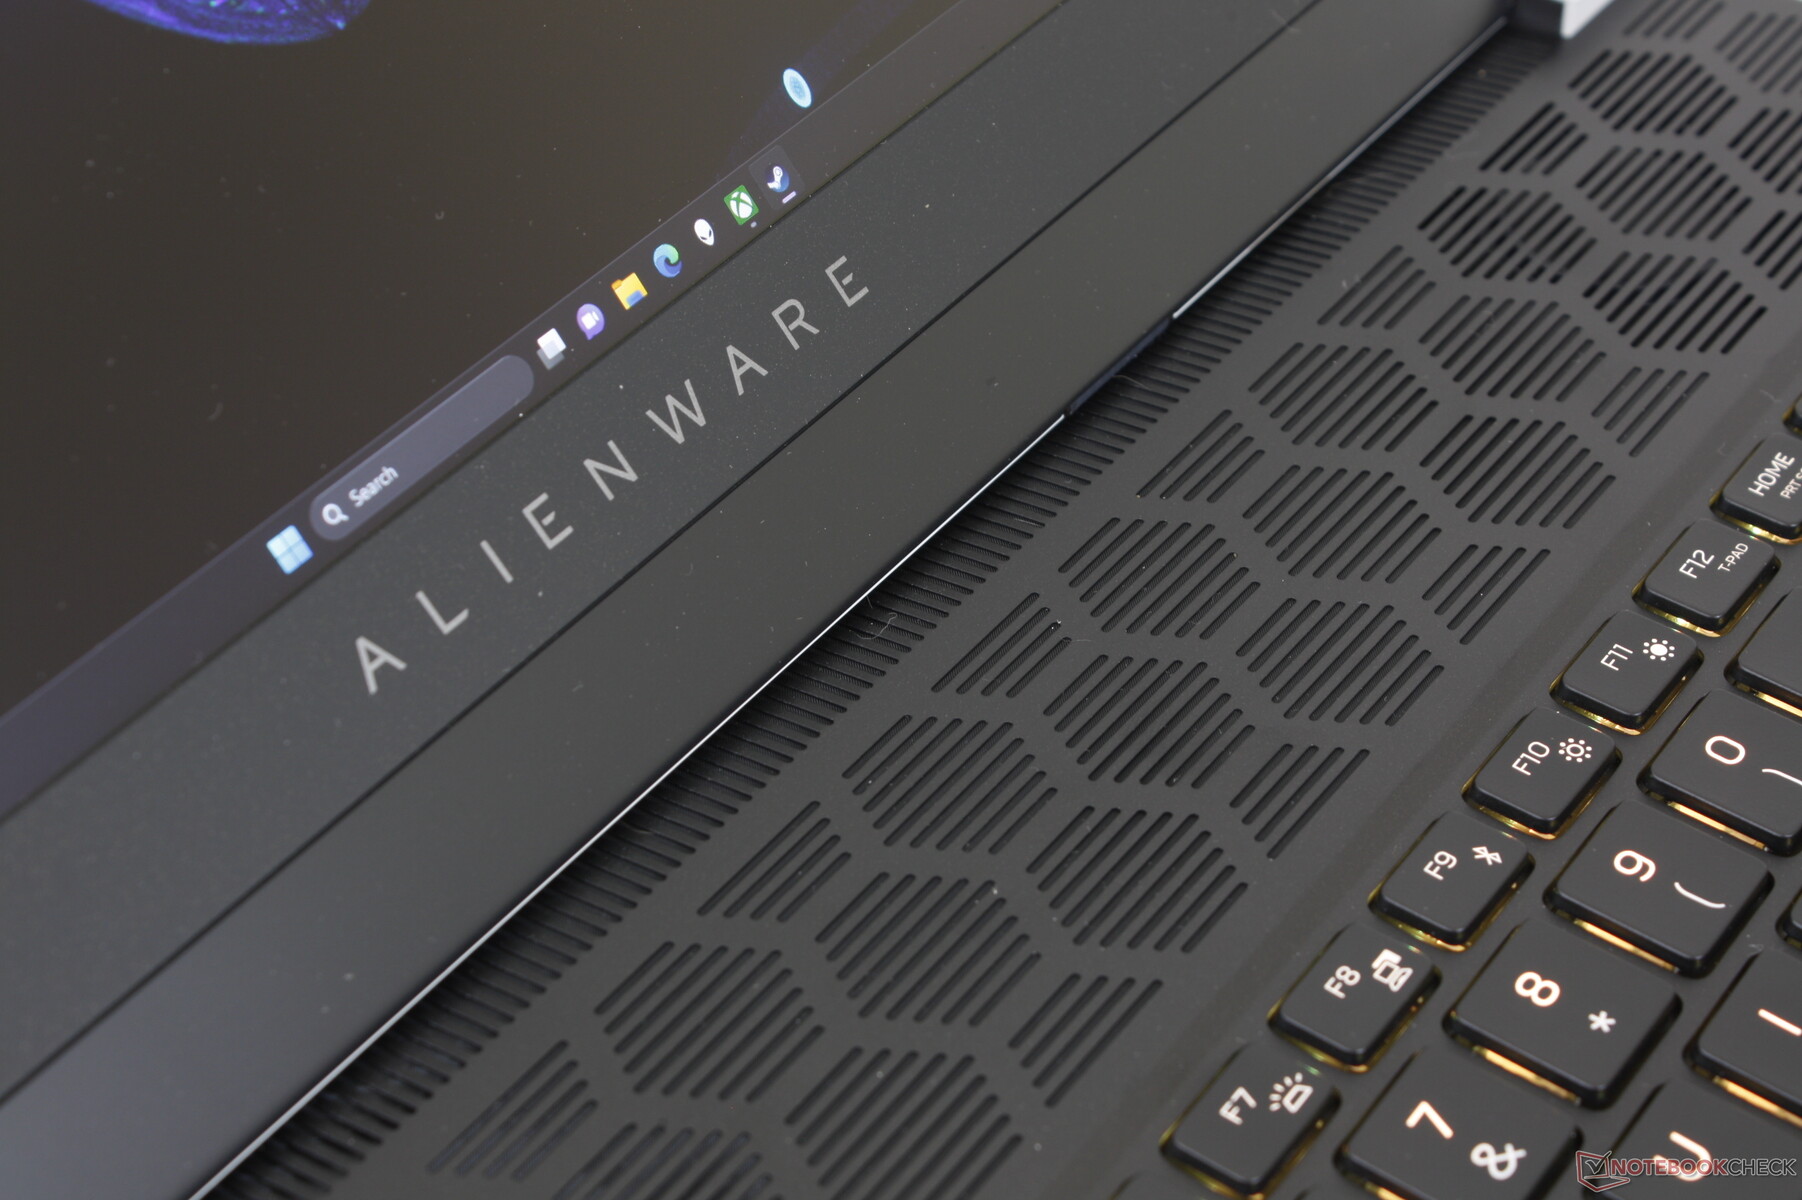
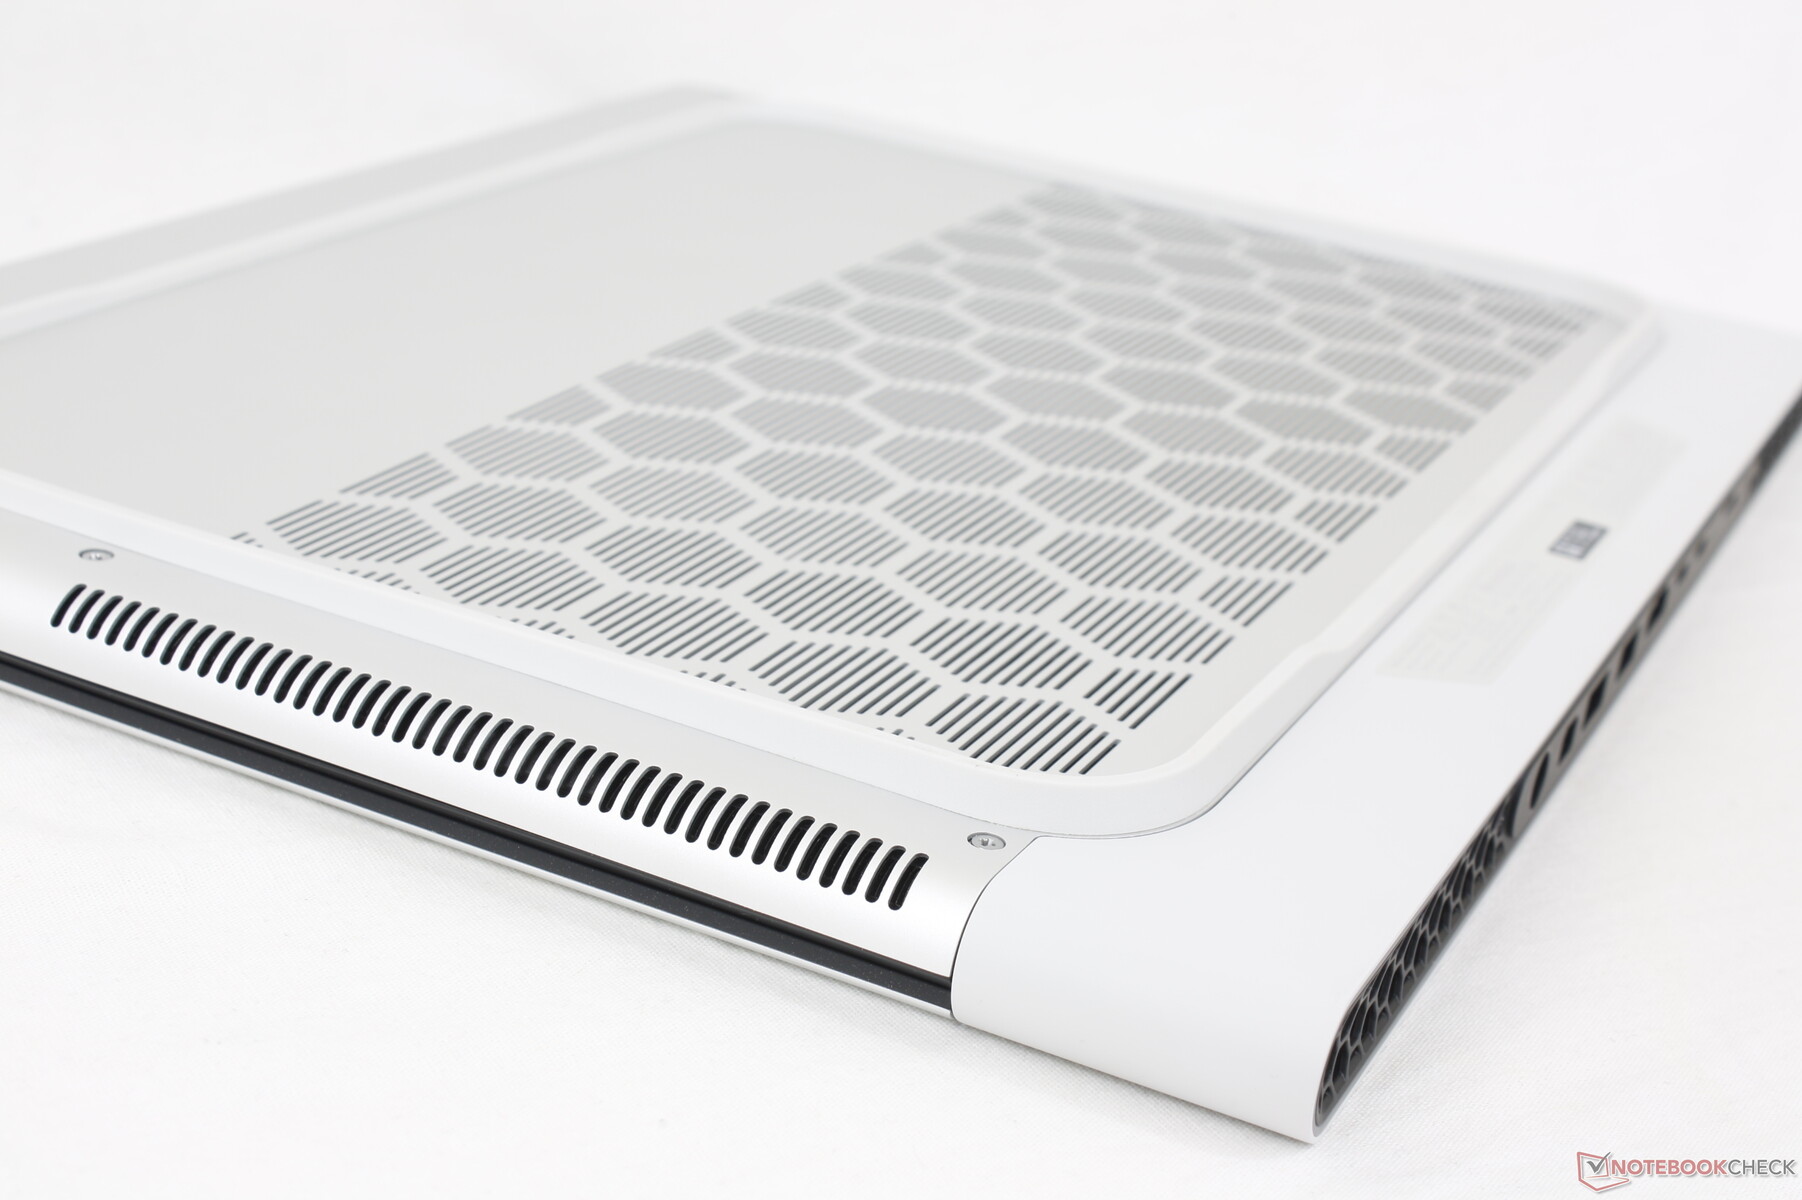
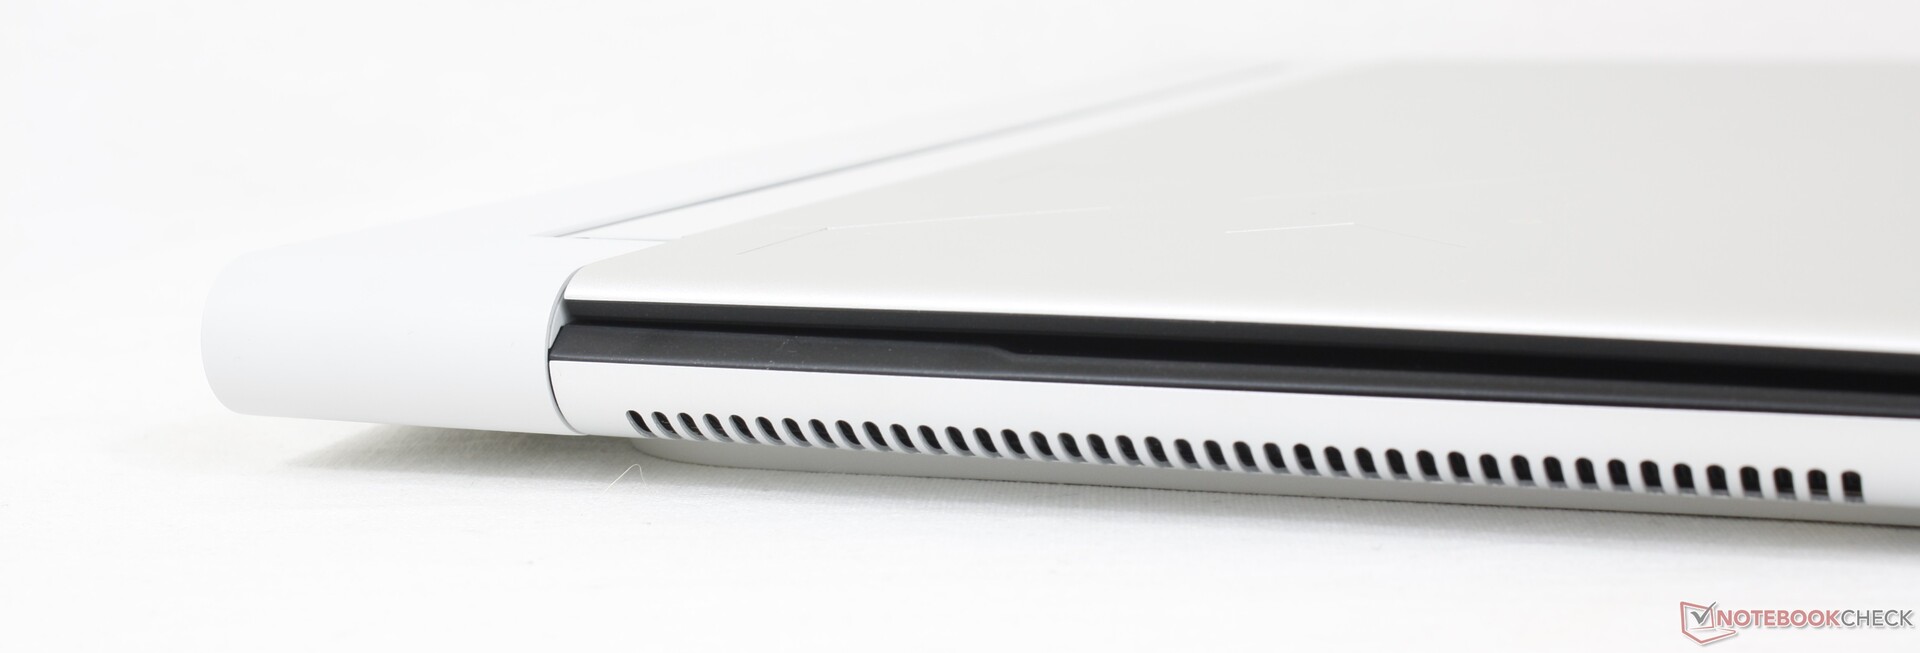
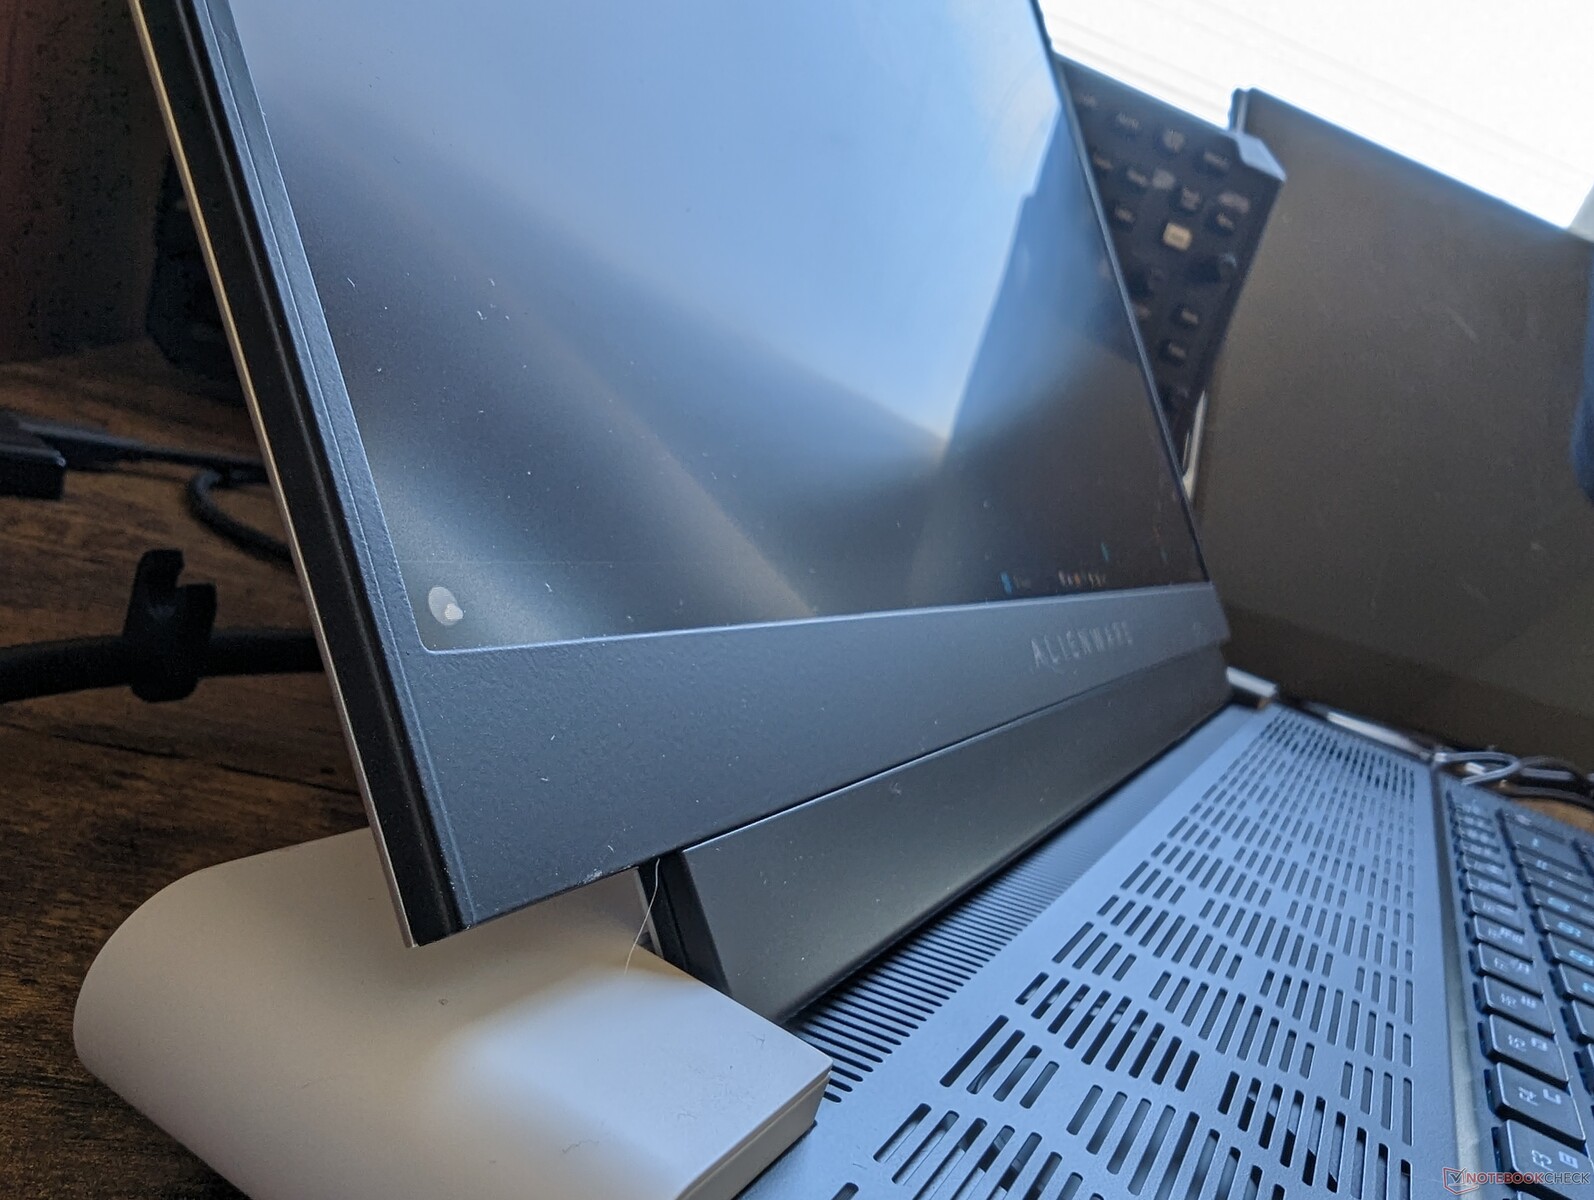
Behuizing - Onderscheidend Alienware
Het chassis heeft veel gemeen met de Alienware x15 R2 en X17 R2 omdat ze allemaal de Legend 3 designtaal delen. De tweekleurige zwarte en witte, geanodiseerde aluminium en magnesium legering en de RGB ring langs de achterkant helpen om de Alienware serie visueel te onderscheiden van de oceaan van andere gaming laptops. Of het aantrekkelijker of begeerlijker is dan concurrerende modellen hangt af van de voorkeur van de gebruiker.
De stijfheid van het chassis is uitstekend, vooral rond de basis waar draaien en kromtrekken minimaal zijn. Het deksel en de scharnieren zijn echter niet zo stijf als we zouden willen in vergelijking met de stijvere schermen op de Asus Strix Scar serie of de Blade 16.
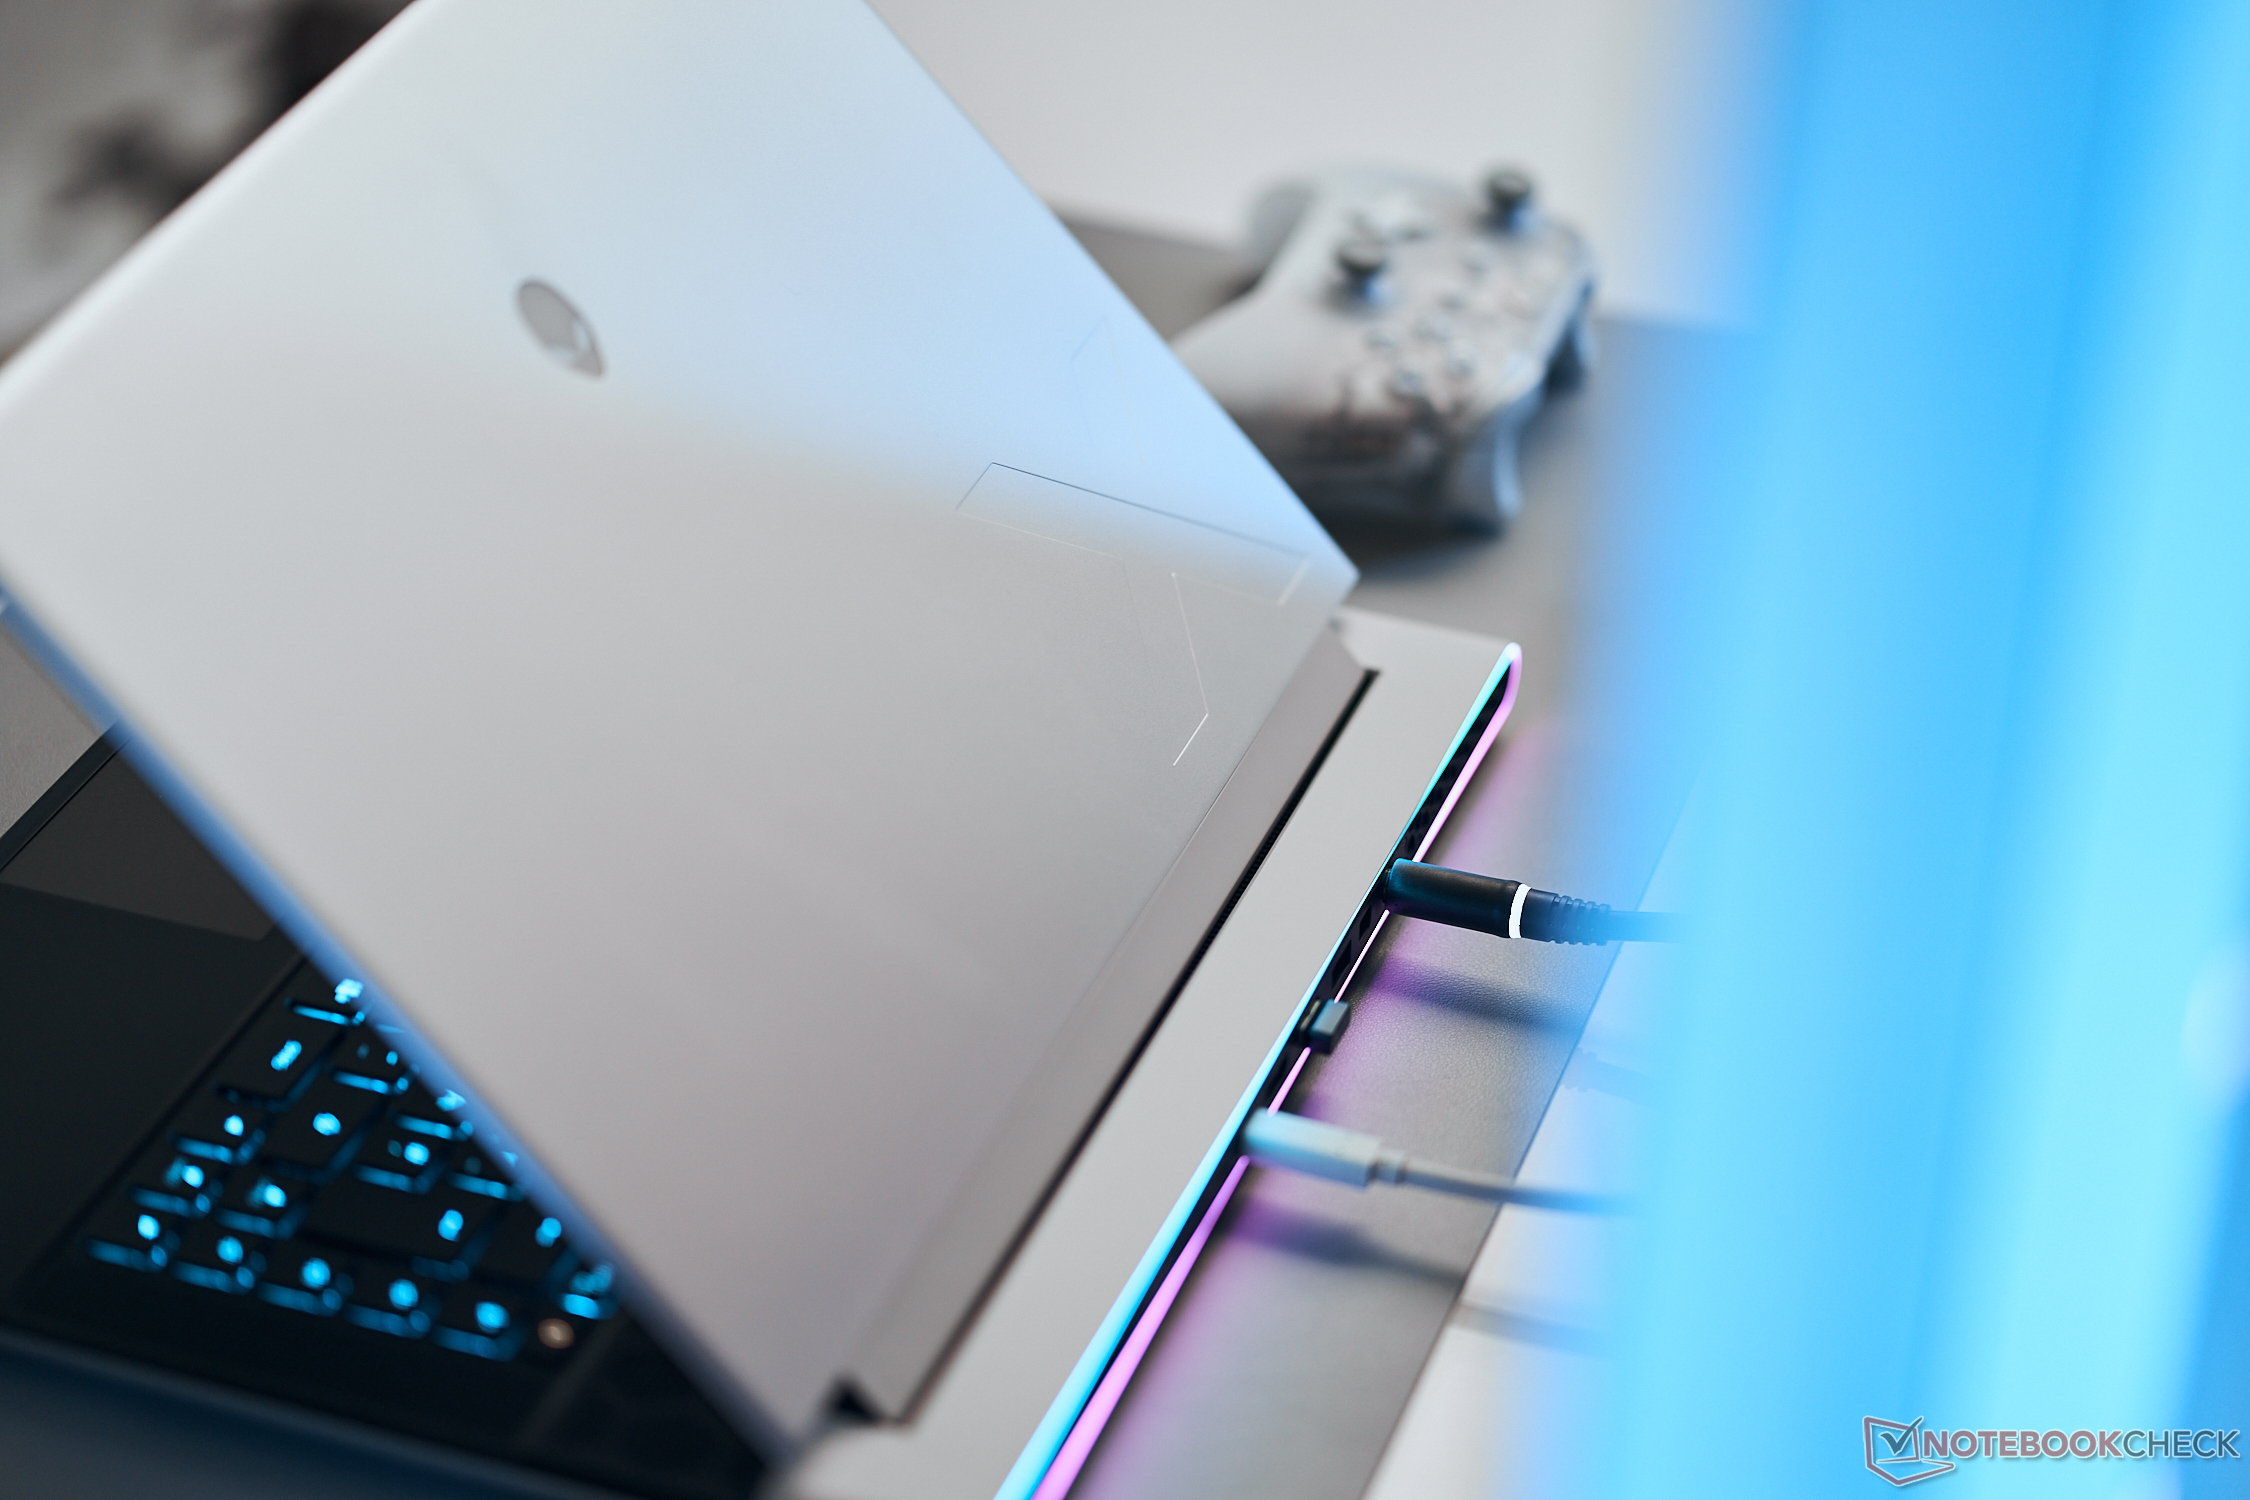
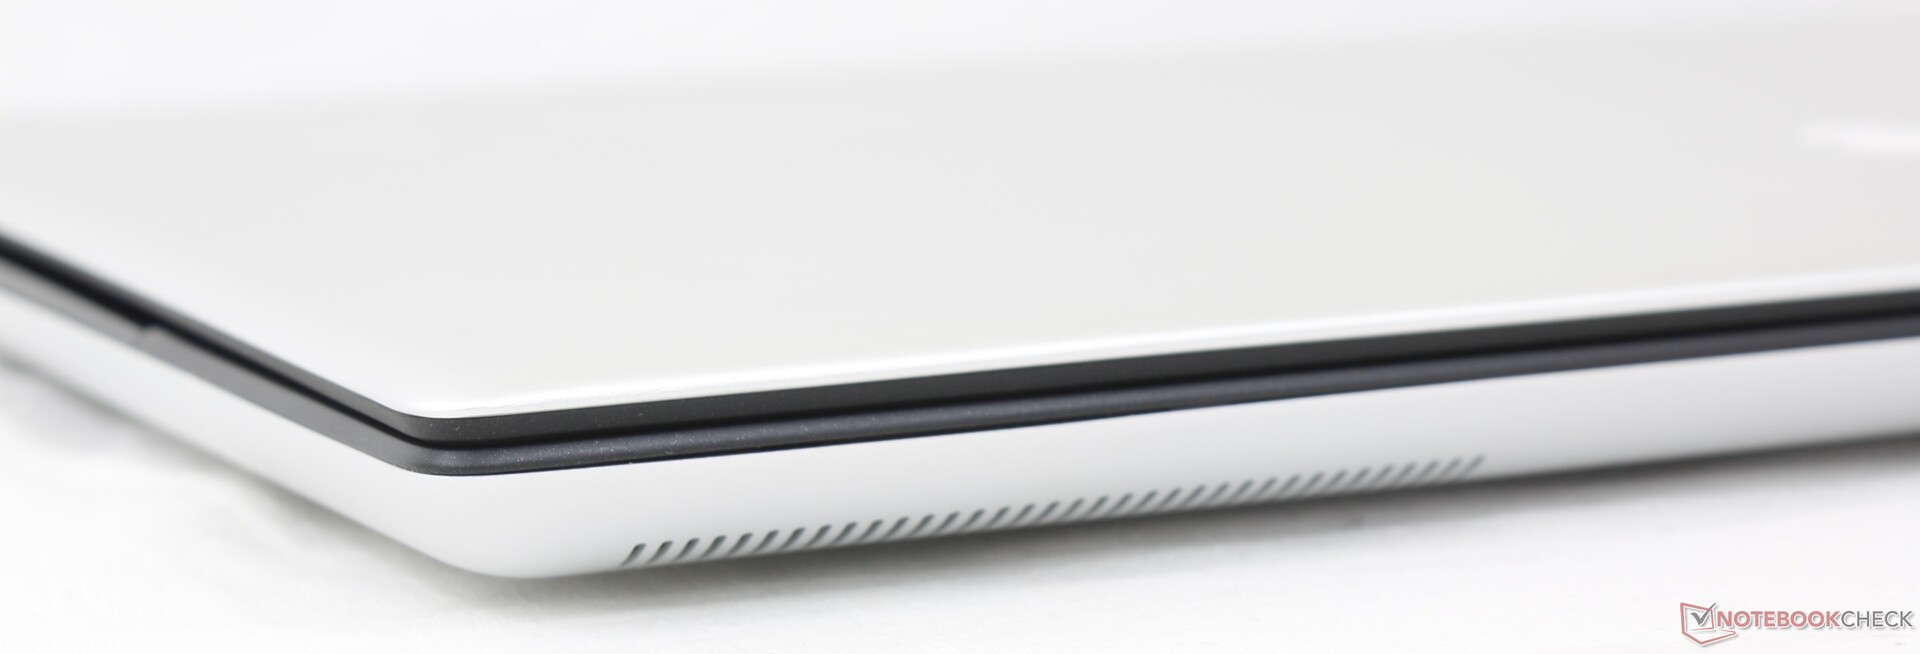
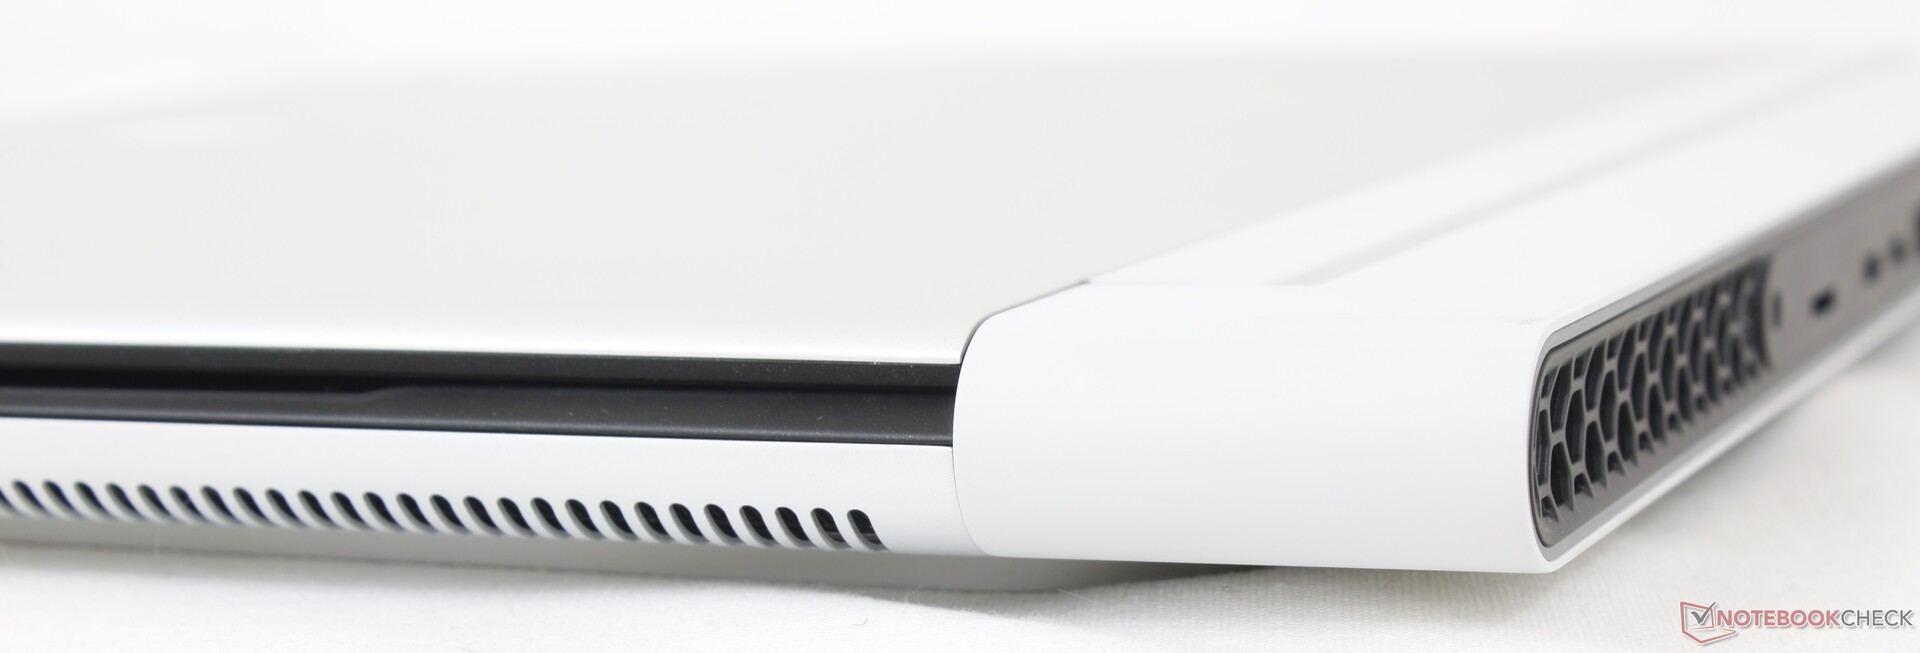
Met minder dan 19 mm is de Alienware x16 een van de dunste 16-inch gaming laptops op de markt, dunner dan zelfs de Razer Blade 16. Helaas is het systeem breder en langer voor een veel grotere voetafdruk. Helaas is het systeem breder en langer voor een veel grotere voetafdruk, waardoor het totale volume niet kleiner is dan dat van veel concurrenten. De Alienware is bijvoorbeeld bijna 4 mm dunner dan de Blade 16, maar is meer dan 40 mm langer en daardoor ongeveer 200 gram zwaarder.
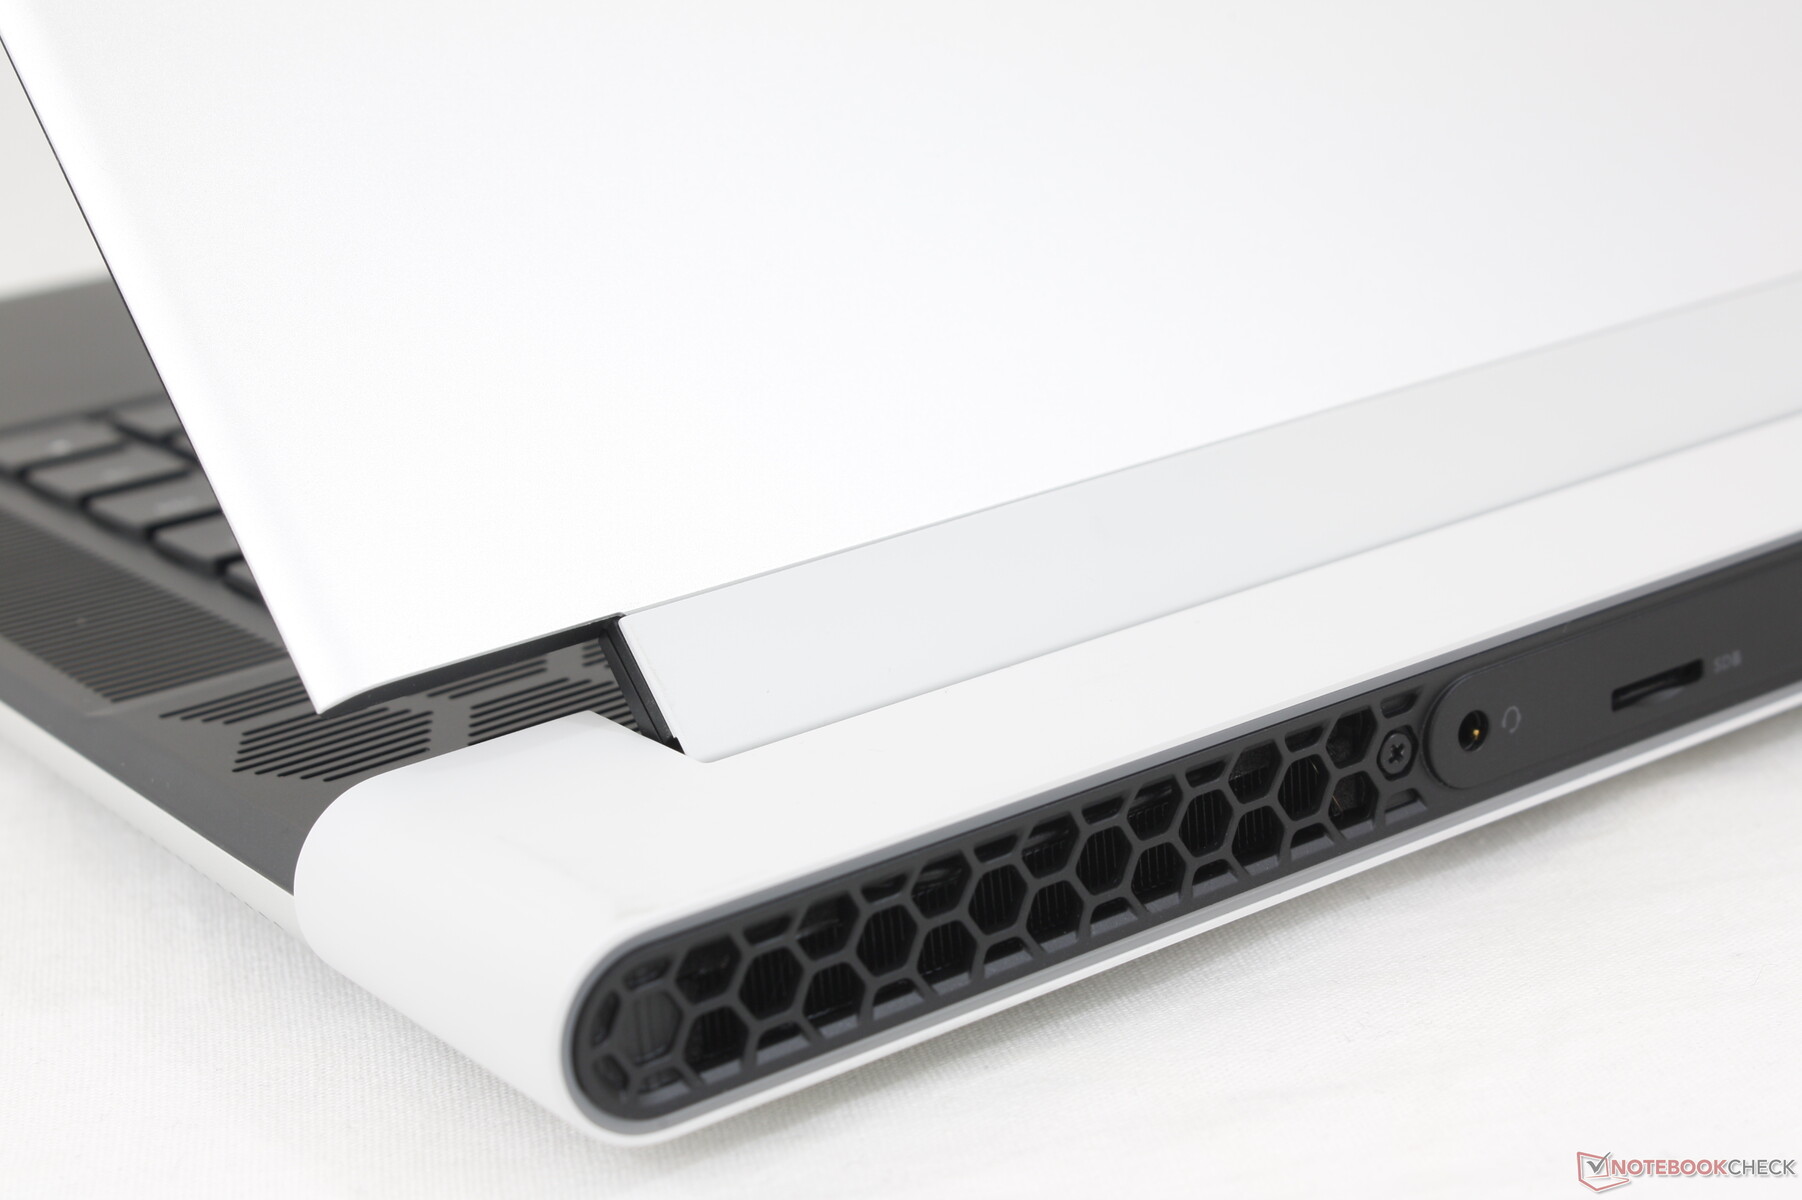
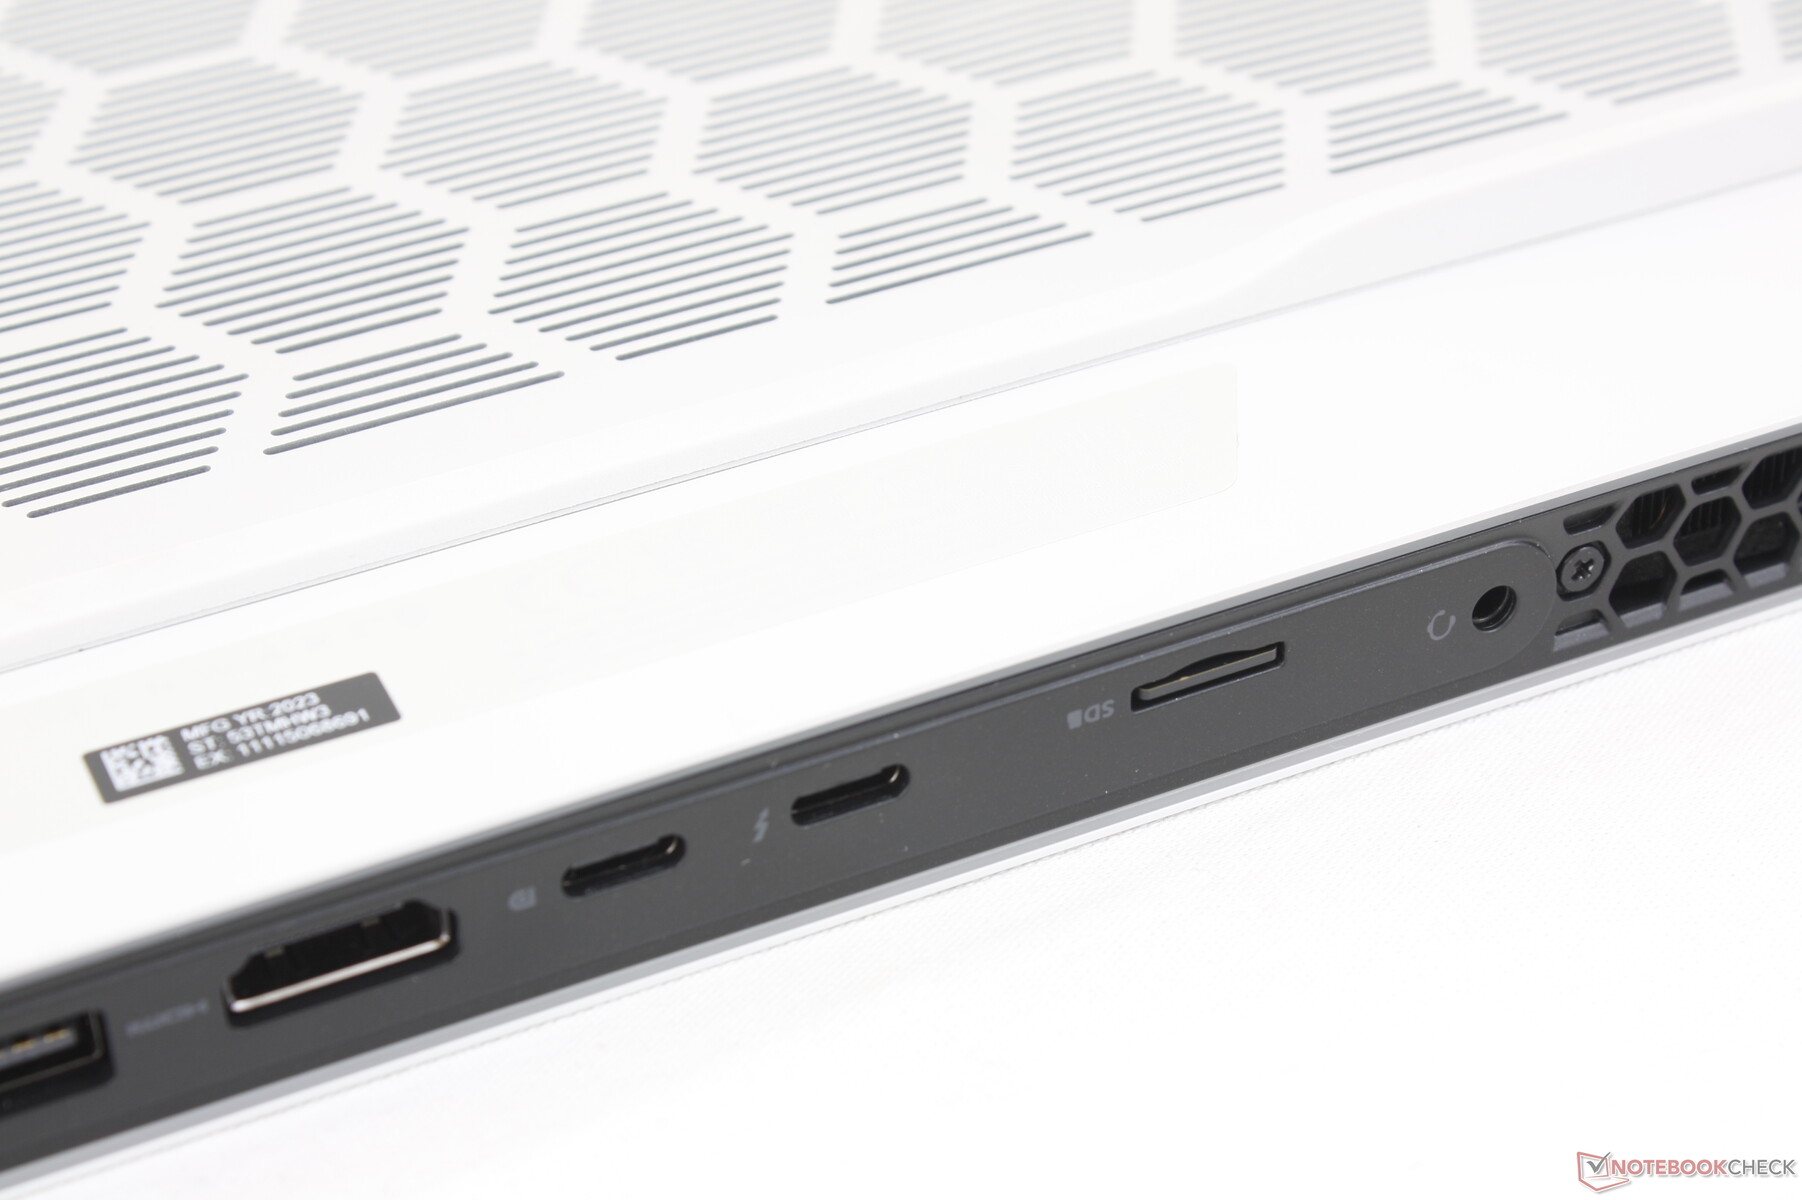
Connectiviteit - Niets aan de zijkanten
Alle poorten bevinden zich aan de achterkant, wat zowel een zegen als een probleem kan zijn. Aan de ene kant betekent het ontbreken van poorten aan de zijkant dat er geen lelijke of storende kabels zijn. Aan de andere kant is de plaatsing van de poorten niet ideaal, vooral voor de veelgebruikte USB-poorten.
Houd er rekening mee dat Thunderbolt 4 slechts op één van de twee USB-C poorten wordt ondersteund.
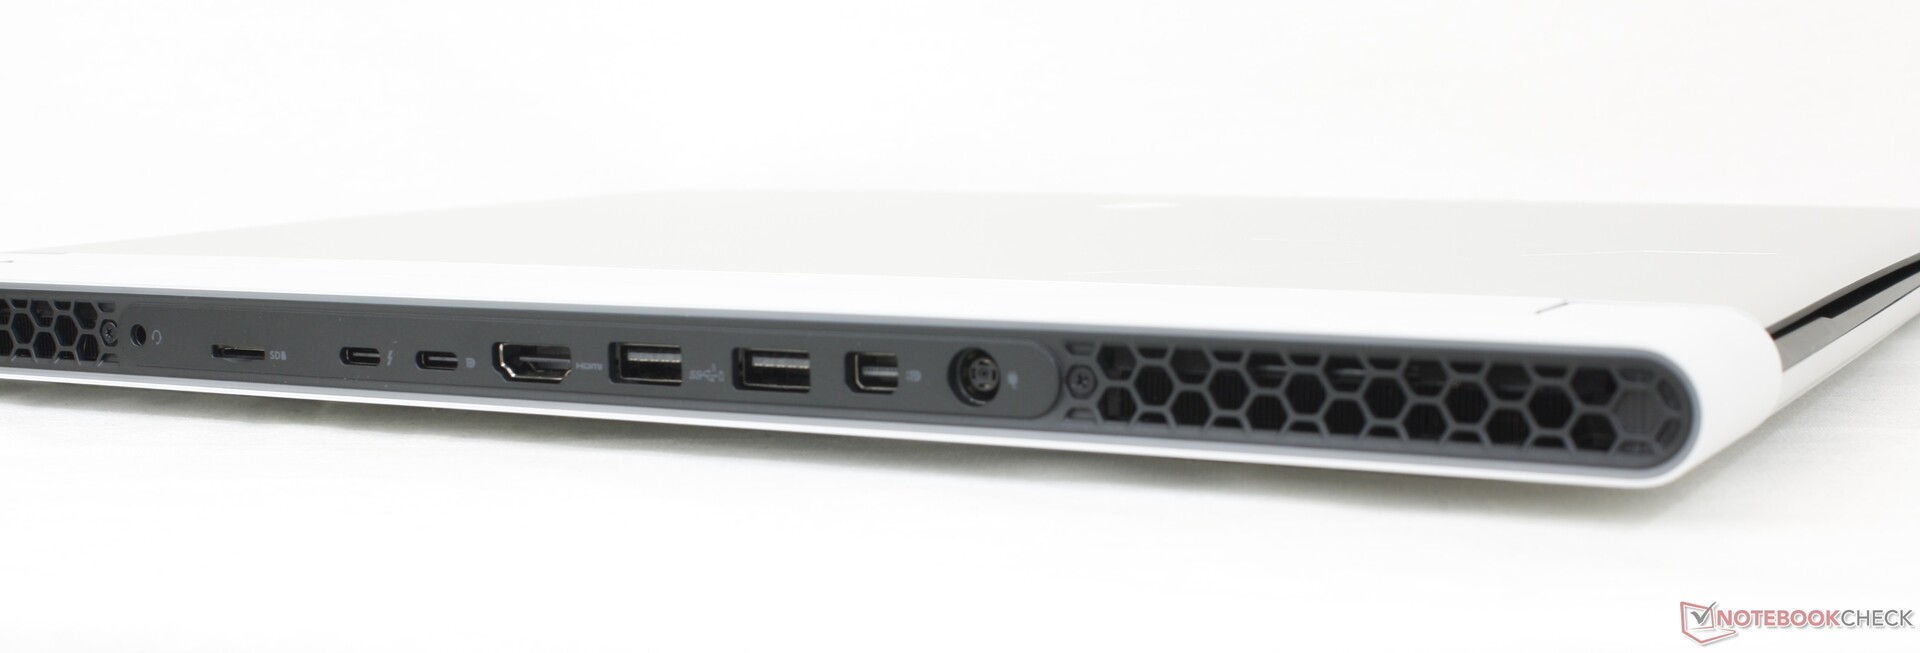
SD-kaartlezer
De AS SSD rapporteert een sequentiële leessnelheid van 256,1 MB/s, terwijl een echte test waarbij 1 GB aan foto's werd overgezet veel langzamer zou zijn met slechts 57 MB/s met onze UHS-II MicroSD-testkaart, zelfs na meerdere pogingen.
In tegenstelling tot de meeste andere laptops bevindt de MicroSD-lezer zich aan de achterkant van het chassis in plaats van aan de zijkanten.
| SD Card Reader | |
| average JPG Copy Test (av. of 3 runs) | |
| Asus ROG Zephyrus M16 GU604VY-NM042X | |
| Razer Blade 16 Early 2023 (AV PRO microSD 128 GB V60) | |
| Alienware x16 R1 (AV PRO microSD 128 GB V60) | |
| maximum AS SSD Seq Read Test (1GB) | |
| Alienware x16 R1 (AV PRO microSD 128 GB V60) | |
| Razer Blade 16 Early 2023 (AV PRO microSD 128 GB V60) | |
| Asus ROG Zephyrus M16 GU604VY-NM042X | |
Communicatie
| Networking | |
| iperf3 transmit AXE11000 | |
| Lenovo Legion Pro 7 16IRX8H | |
| Razer Blade 16 Early 2023 | |
| Alienware x16 R1 | |
| Alienware m17 R5 (R9 6900HX, RX 6850M XT) | |
| Dell G16 7620 | |
| iperf3 receive AXE11000 | |
| Lenovo Legion Pro 7 16IRX8H | |
| Razer Blade 16 Early 2023 | |
| Alienware x16 R1 | |
| Dell G16 7620 | |
| Alienware m17 R5 (R9 6900HX, RX 6850M XT) | |
| iperf3 transmit AXE11000 6GHz | |
| Asus ROG Zephyrus M16 GU604VY-NM042X | |
| Razer Blade 16 Early 2023 | |
| Alienware x16 R1 | |
| iperf3 receive AXE11000 6GHz | |
| Asus ROG Zephyrus M16 GU604VY-NM042X | |
| Razer Blade 16 Early 2023 | |
| Alienware x16 R1 | |
Webcam
Een 2MP webcam wordt standaard meegeleverd naast IR voor Hello ondersteuning. Er is echter geen privacy shutter.


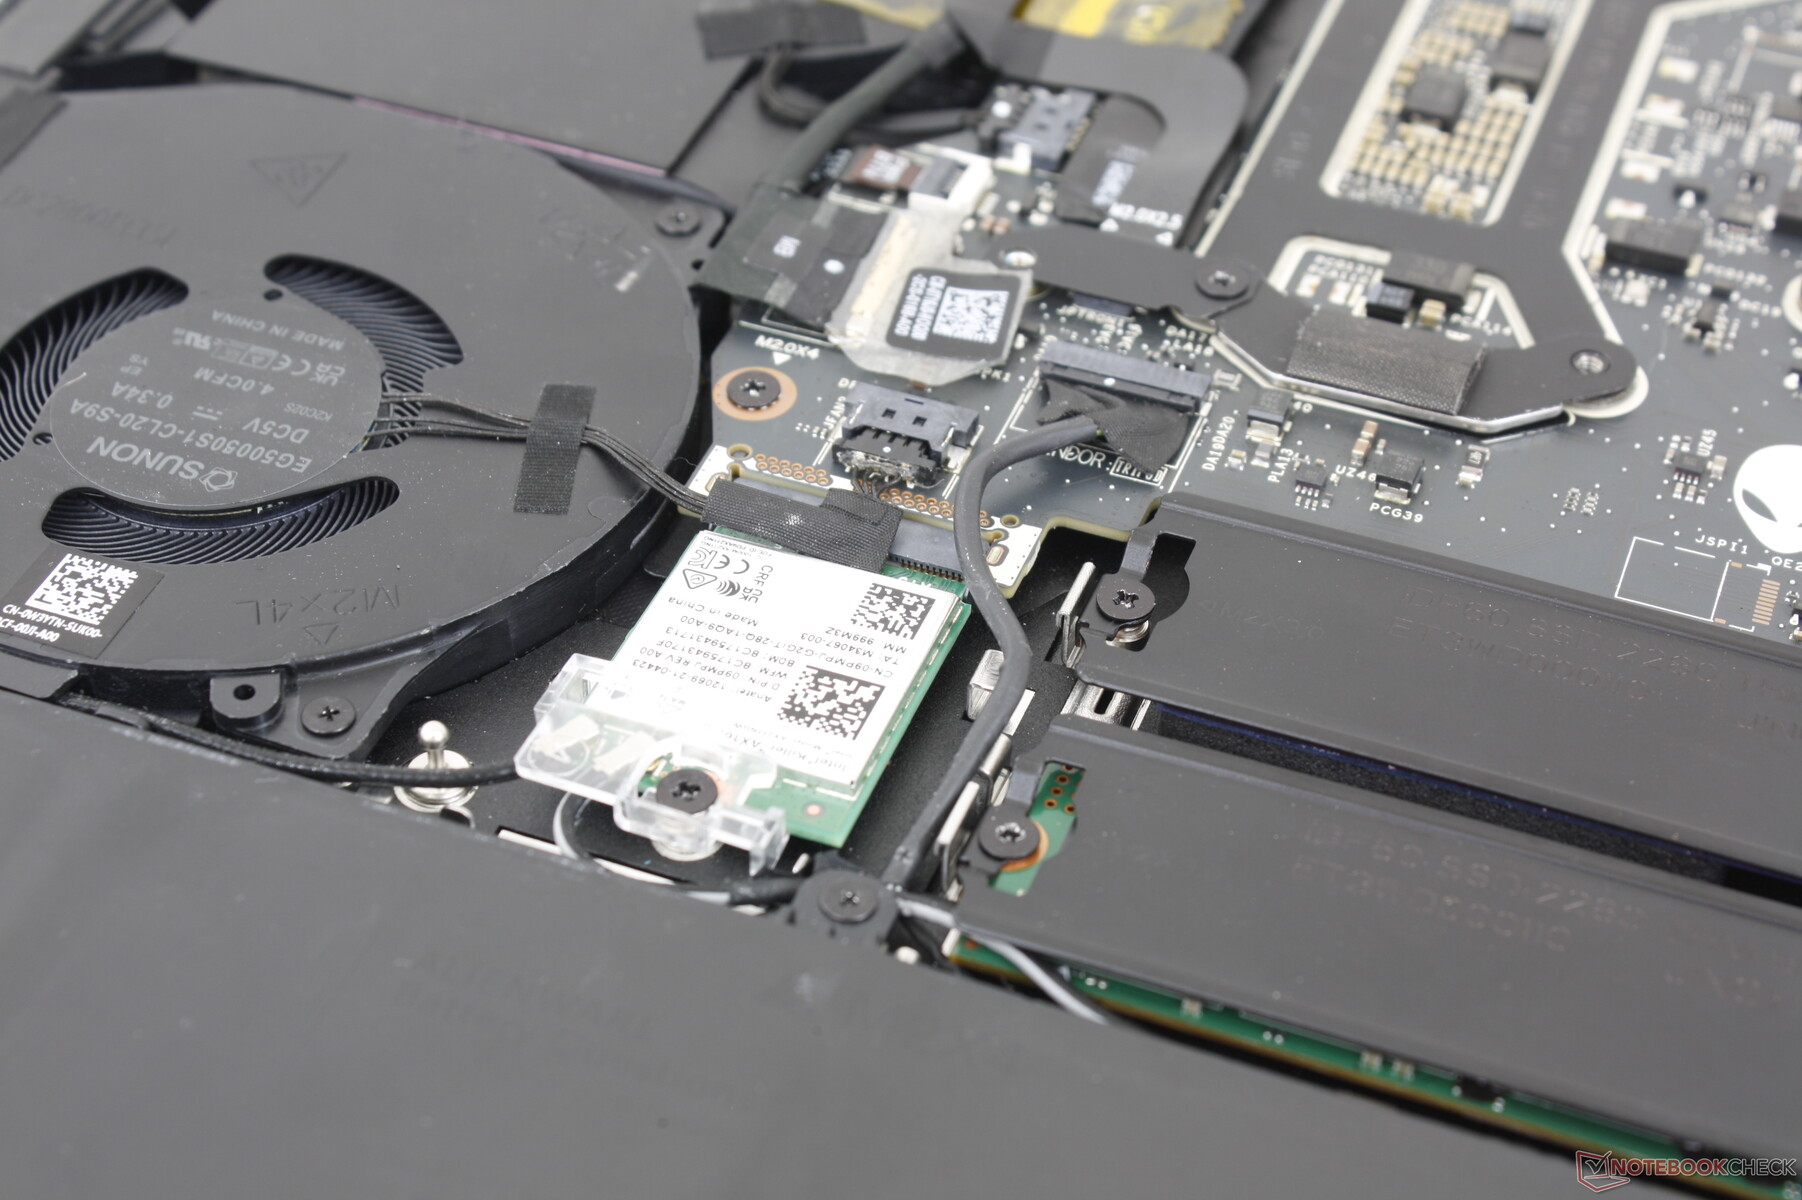
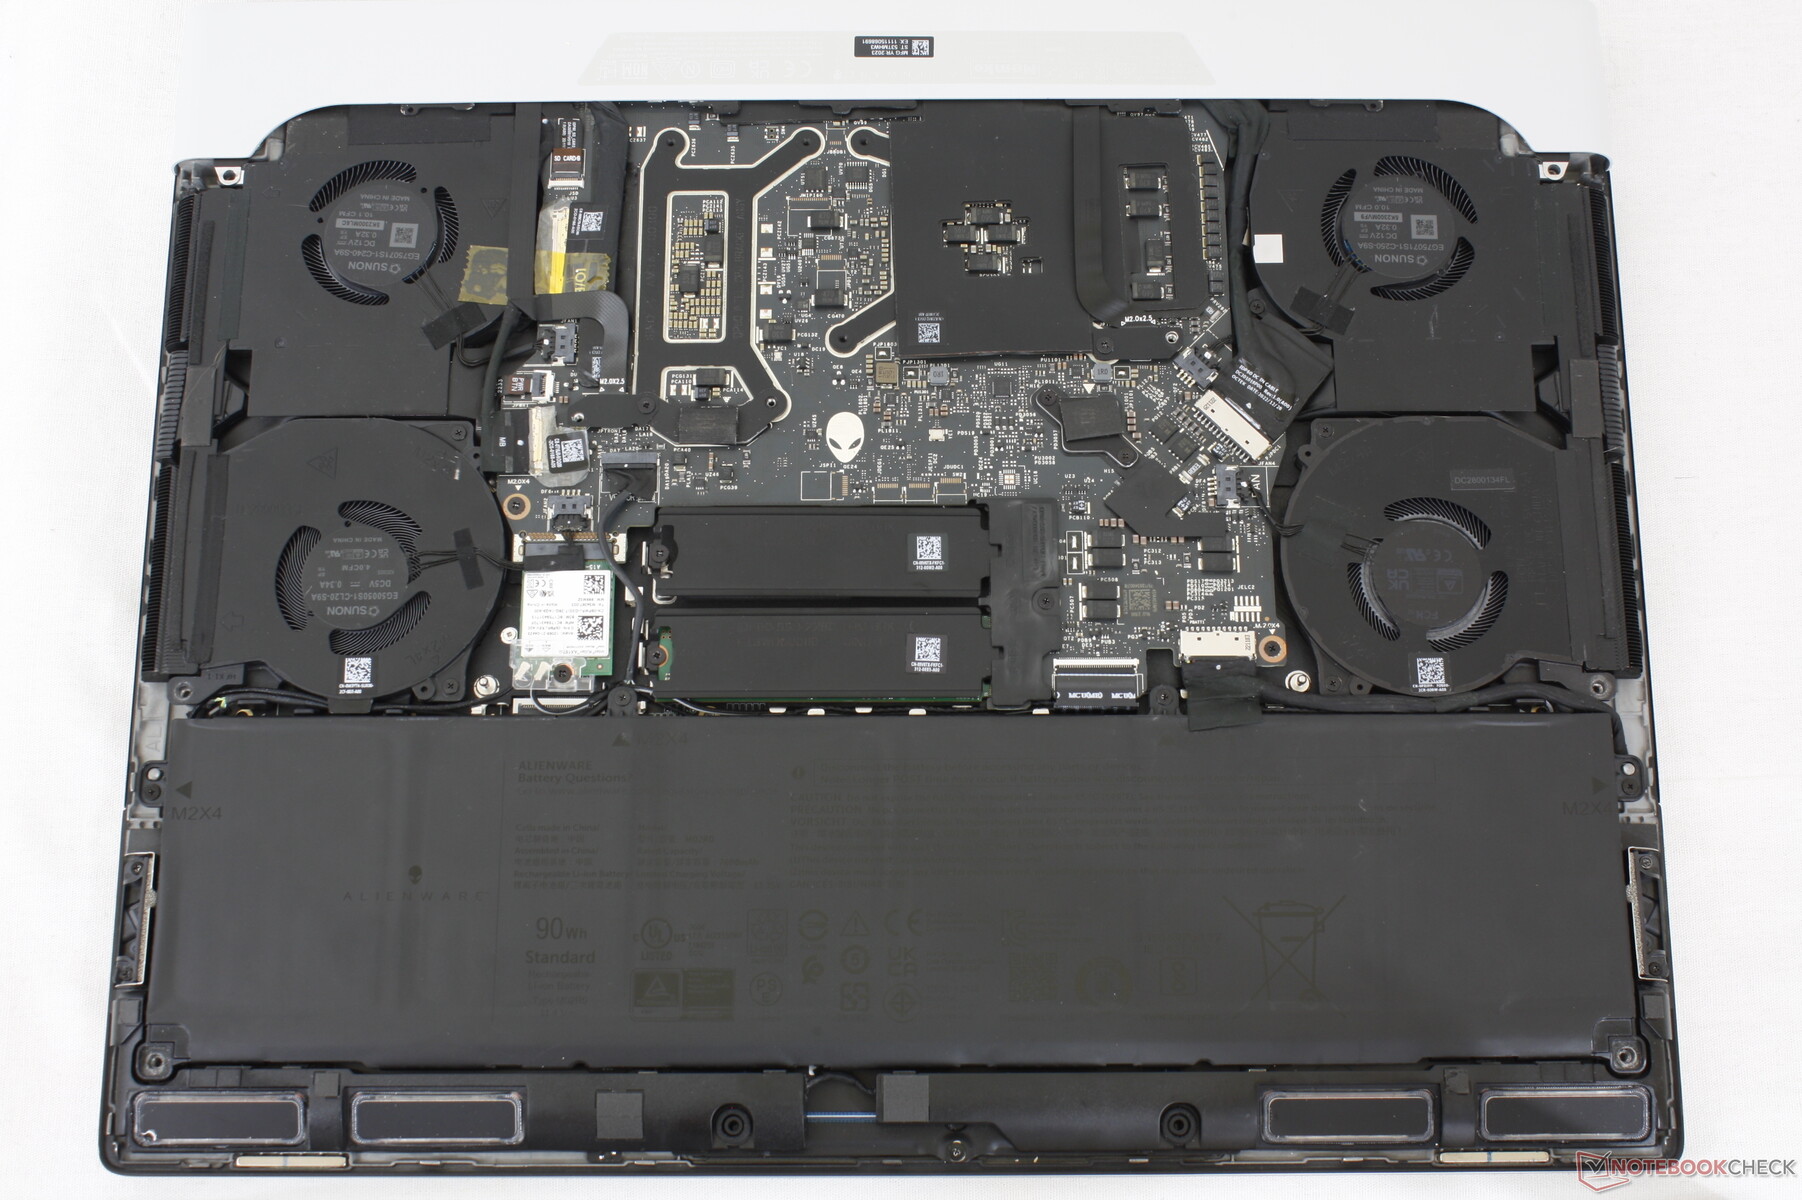
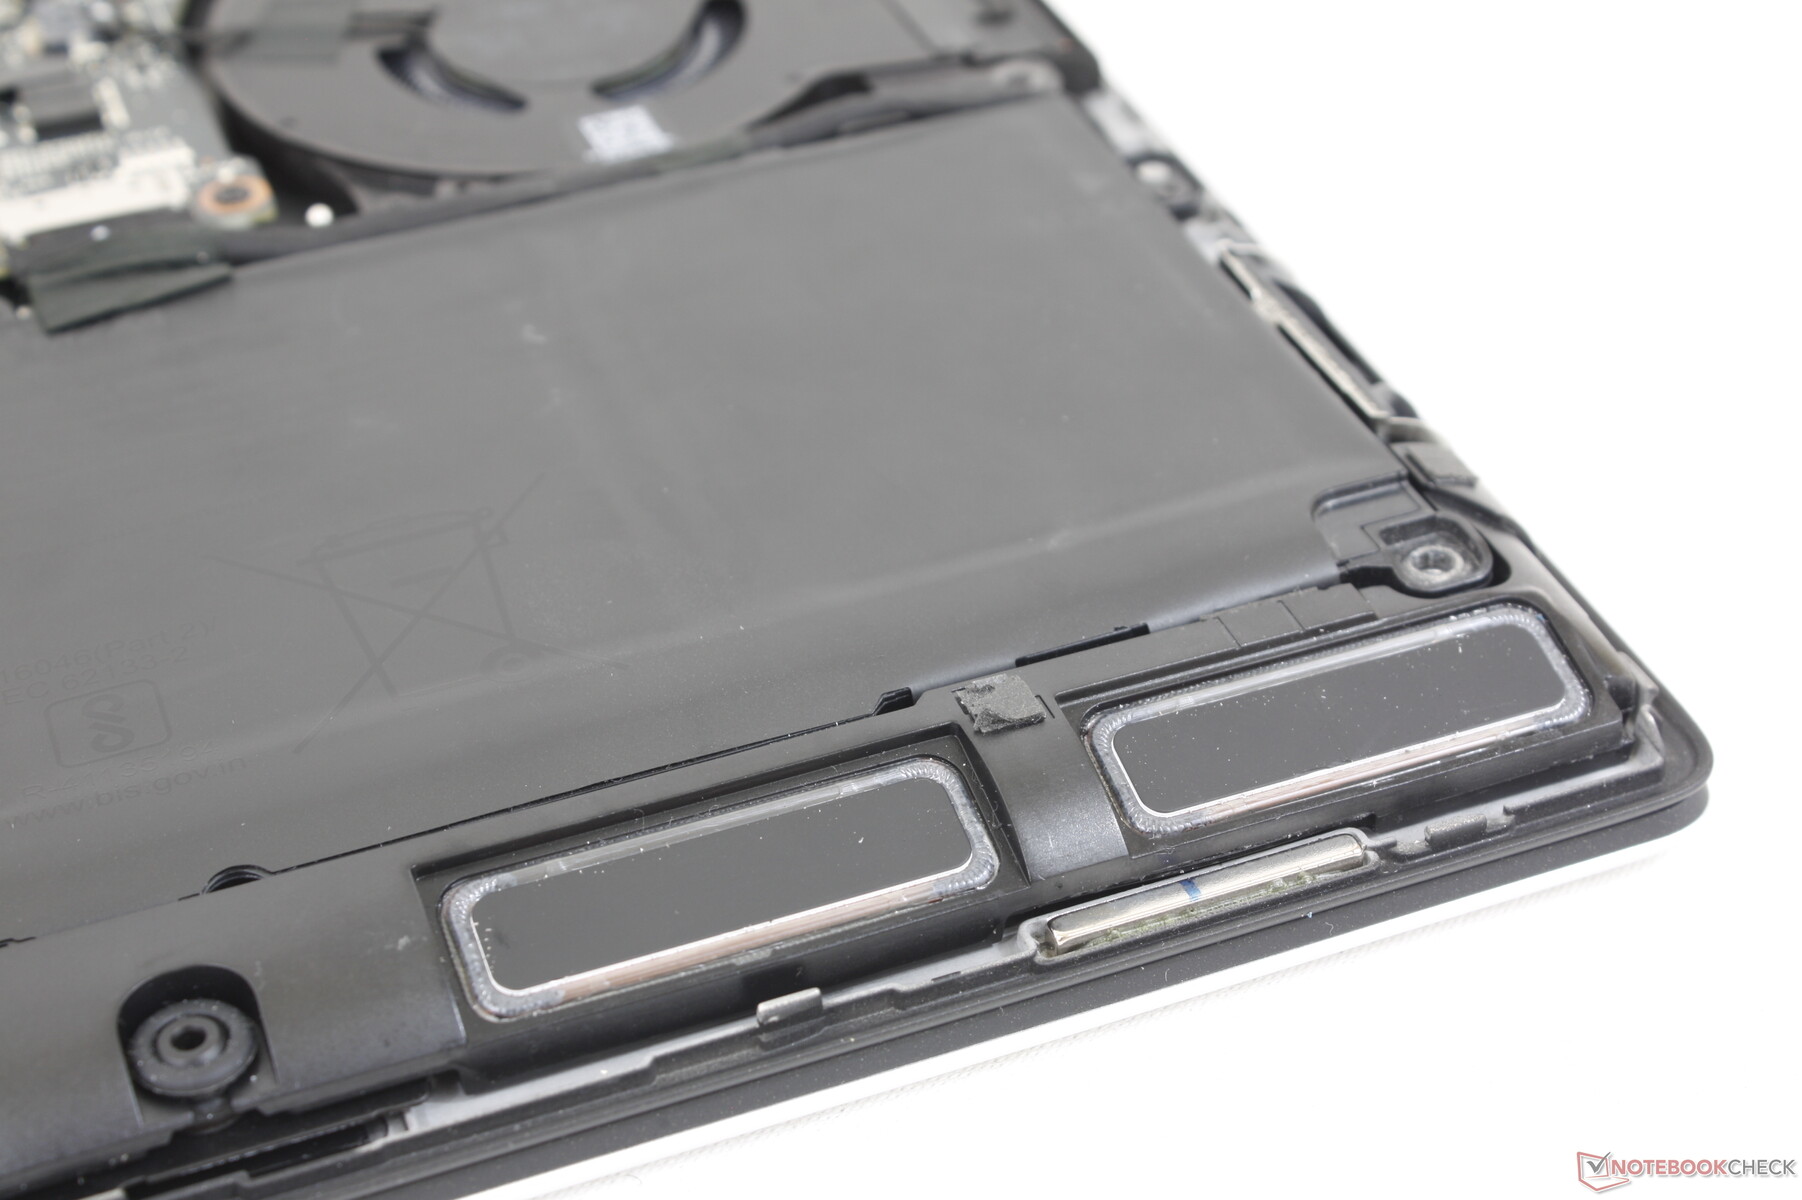
Onderhoud
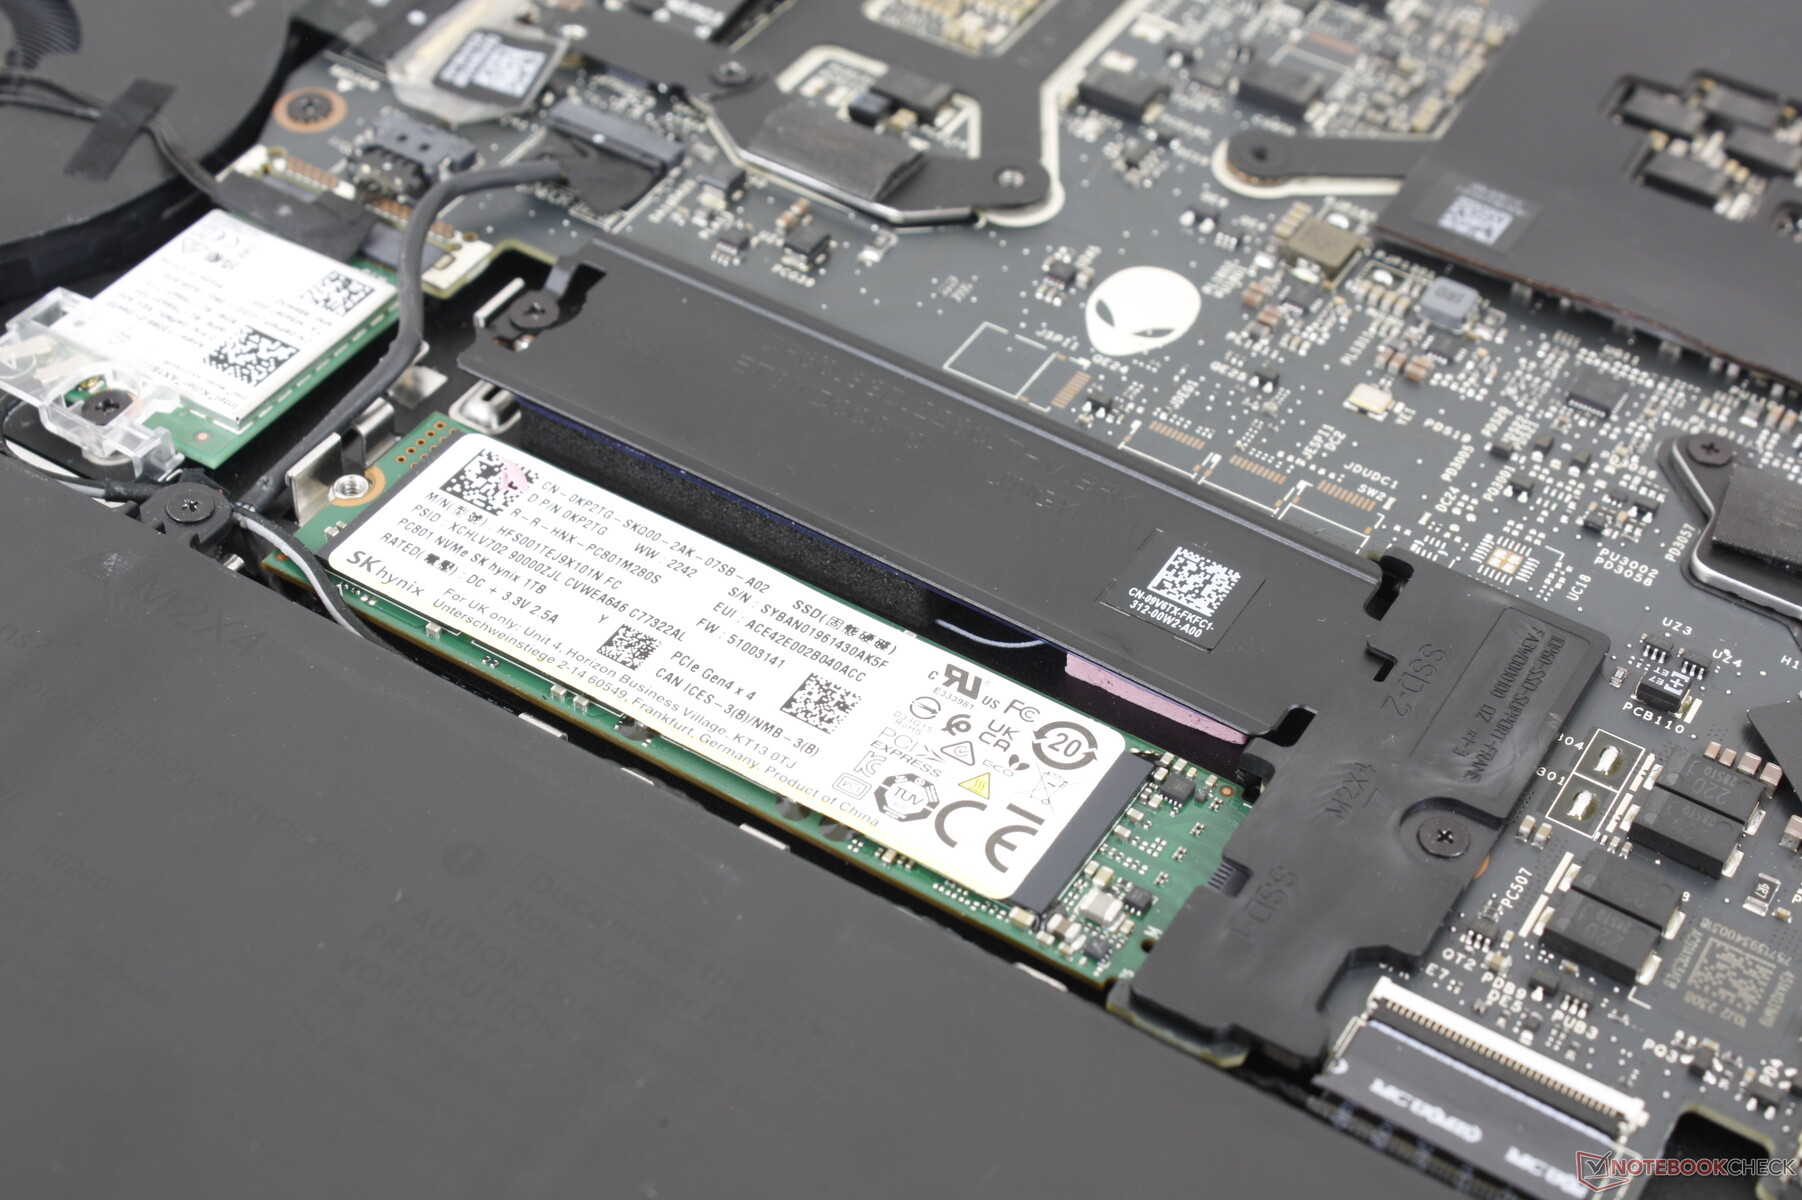
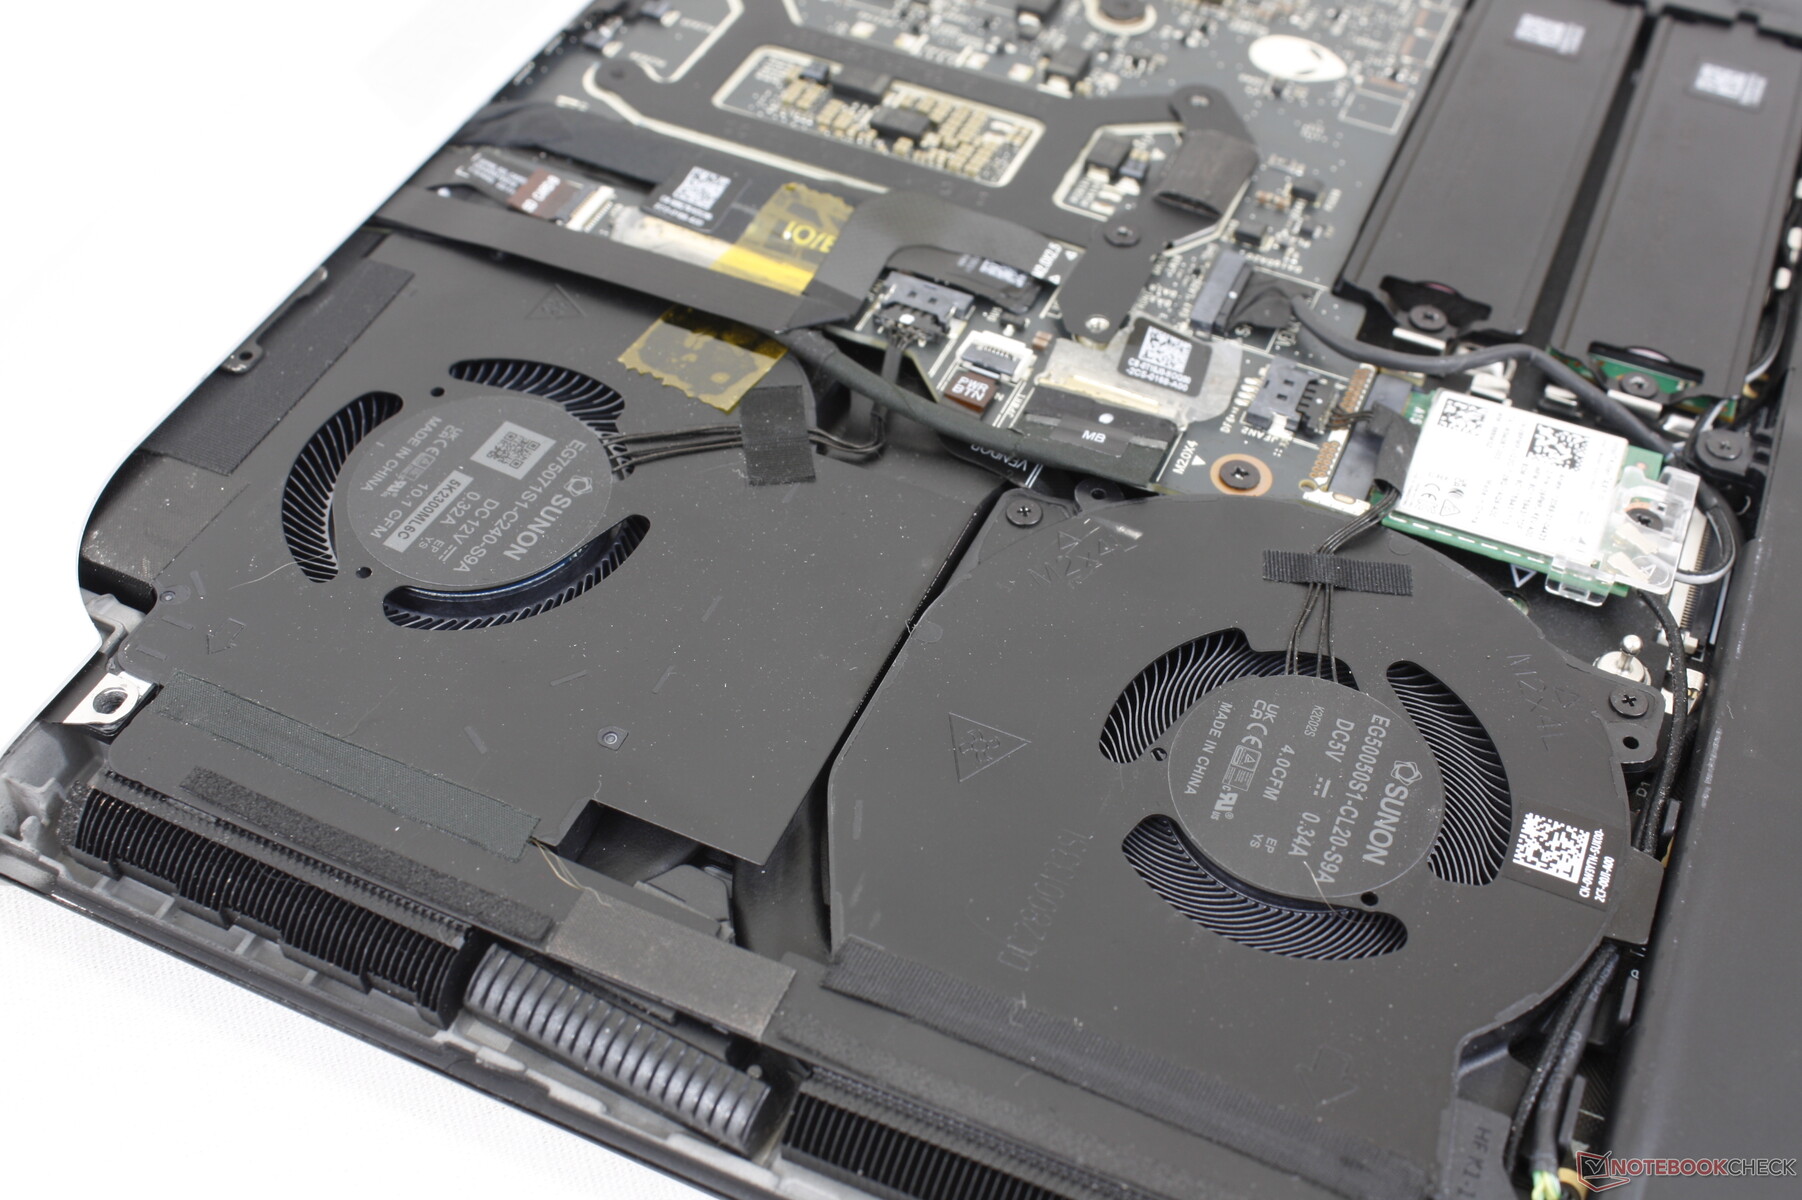
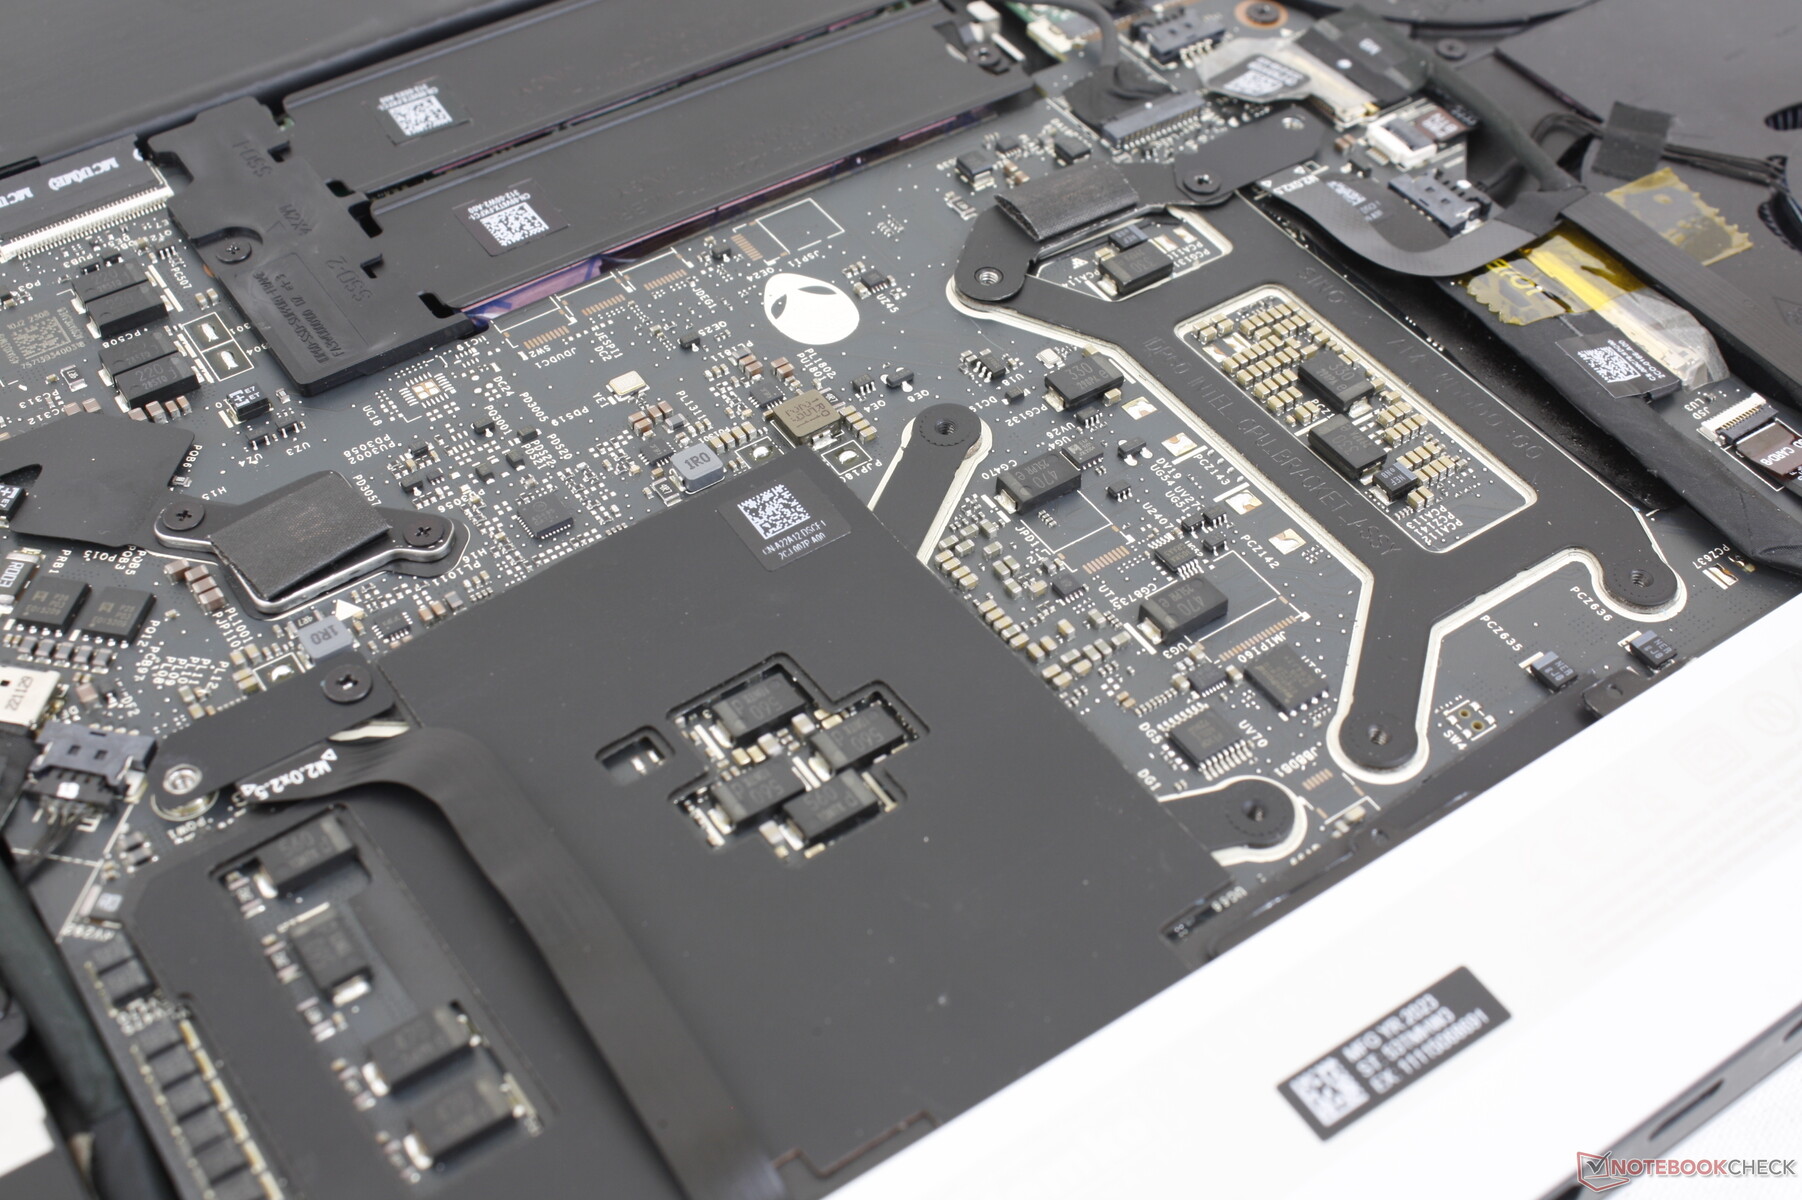
Het bodempaneel wordt vastgezet met slechts zes kruiskopschroeven en is dus eenvoudig te verwijderen. Eigenaars hebben direct toegang tot twee M.2 2280 SSD-sleuven, de batterij en de verwijderbare WLAN-module.
Accessoires en garantie
Er zitten geen extra's in de doos behalve de AC-adapter en papierwerk. Bij aankoop in de VS geldt de gebruikelijke beperkte fabrieksgarantie van een jaar.
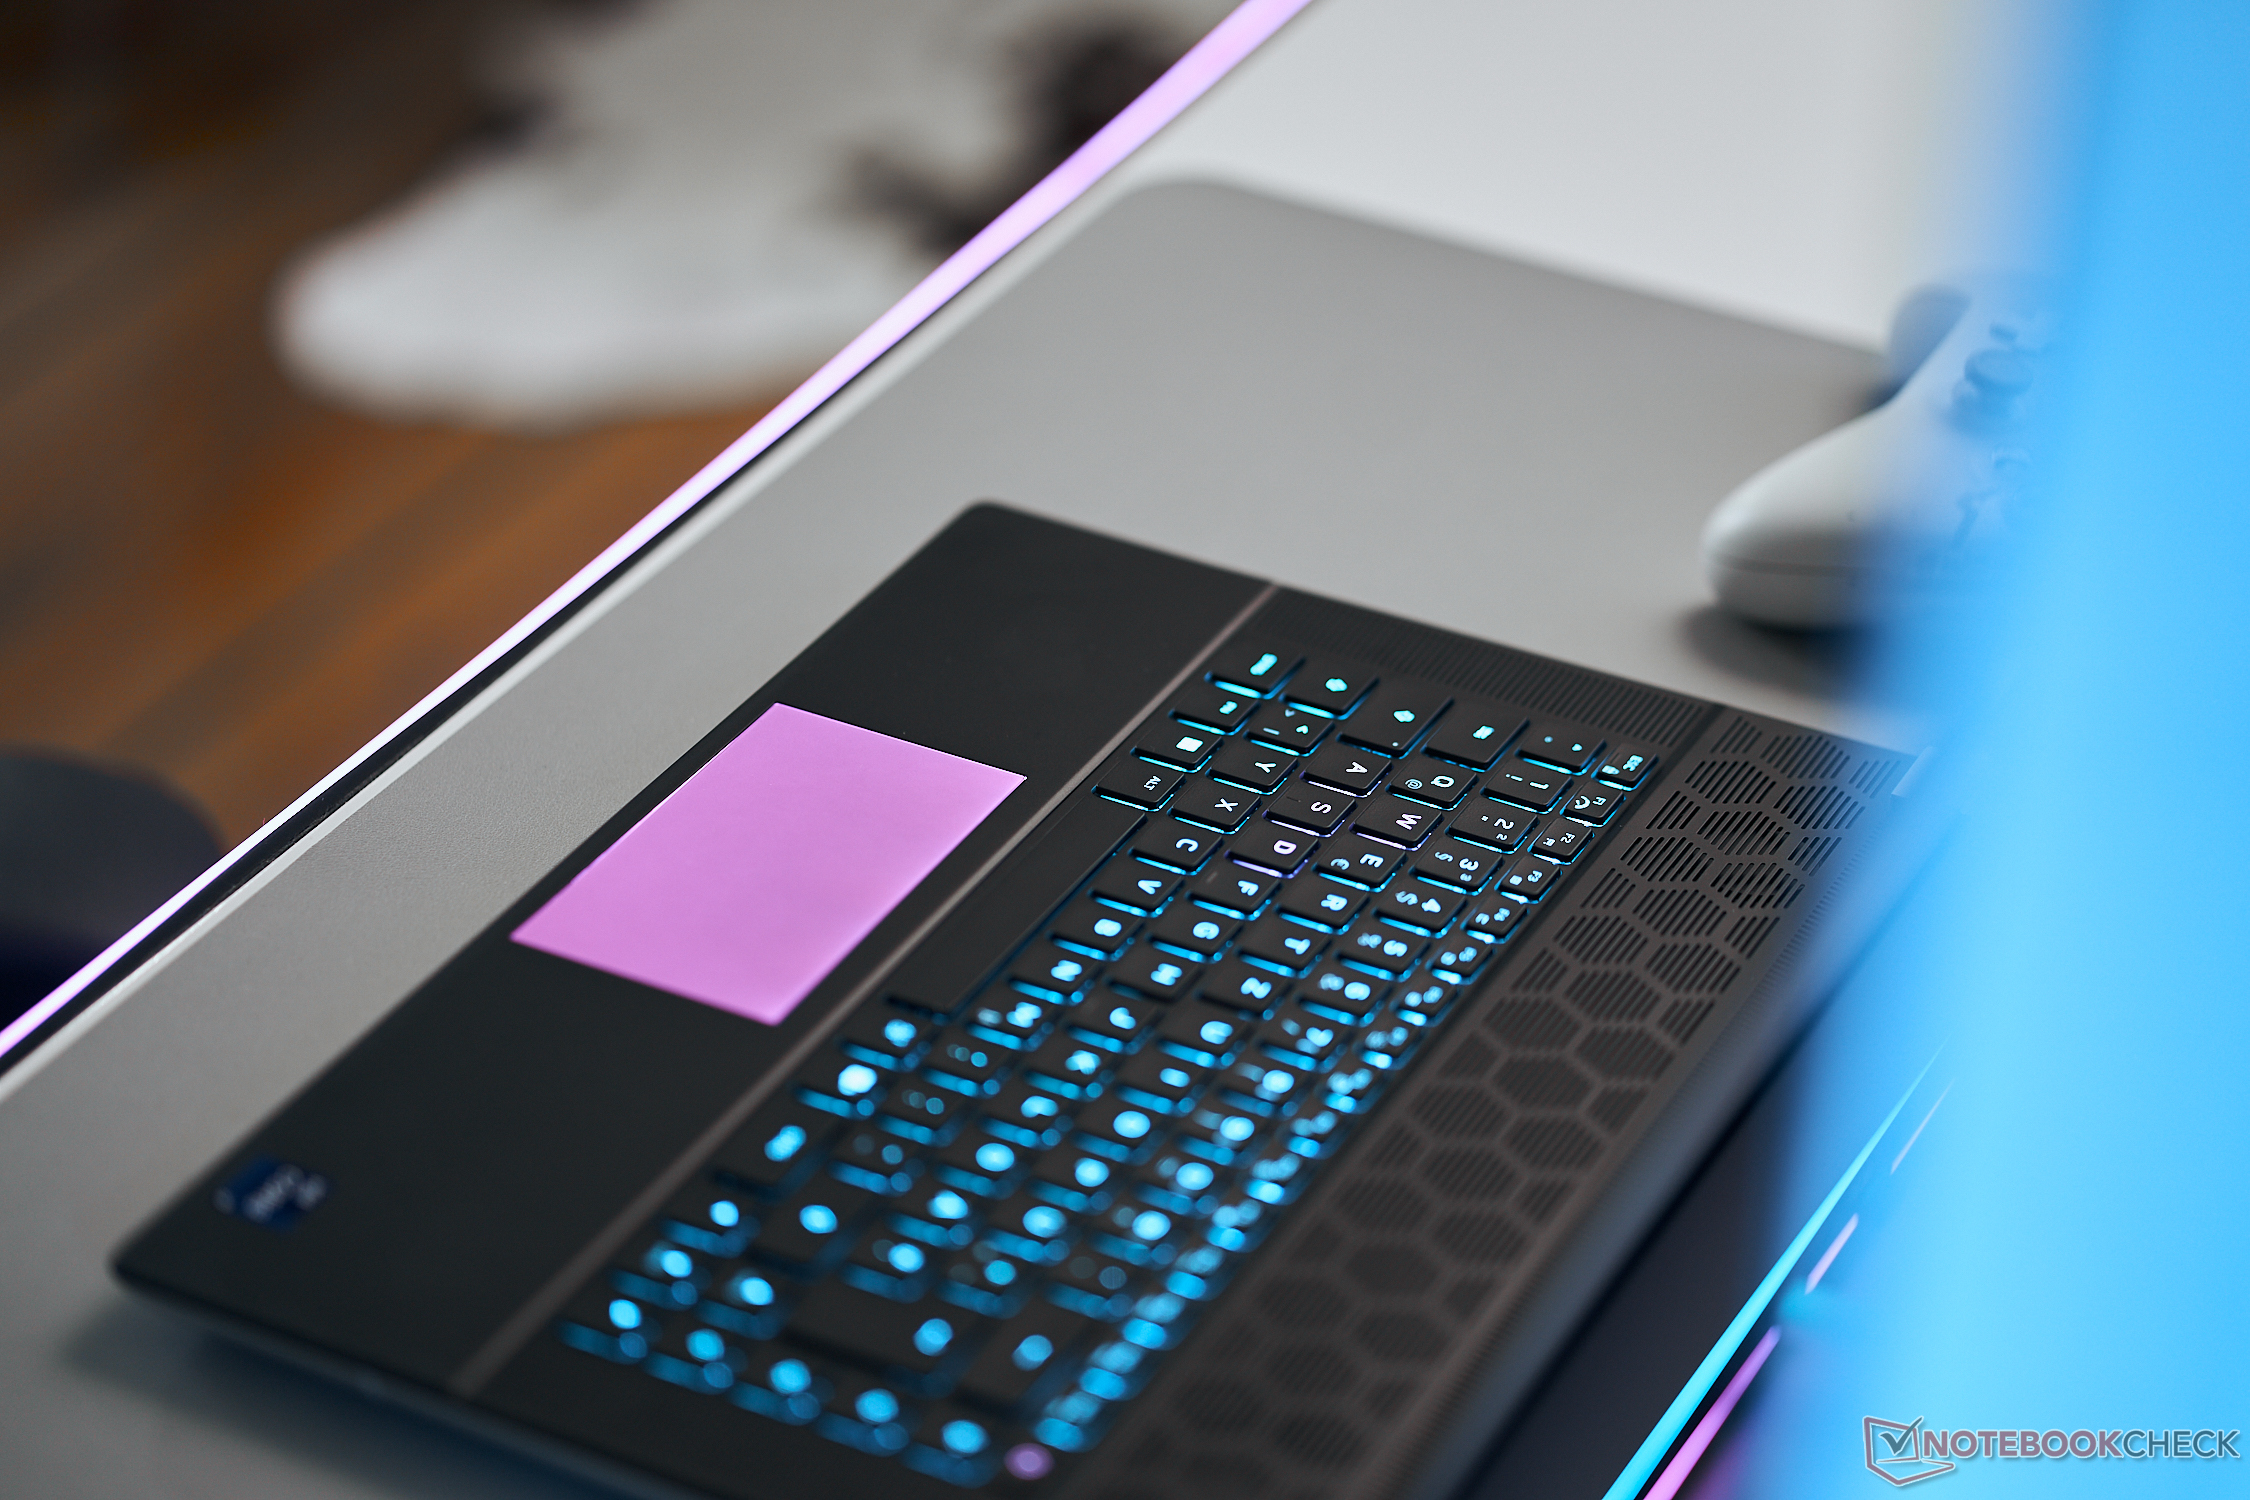
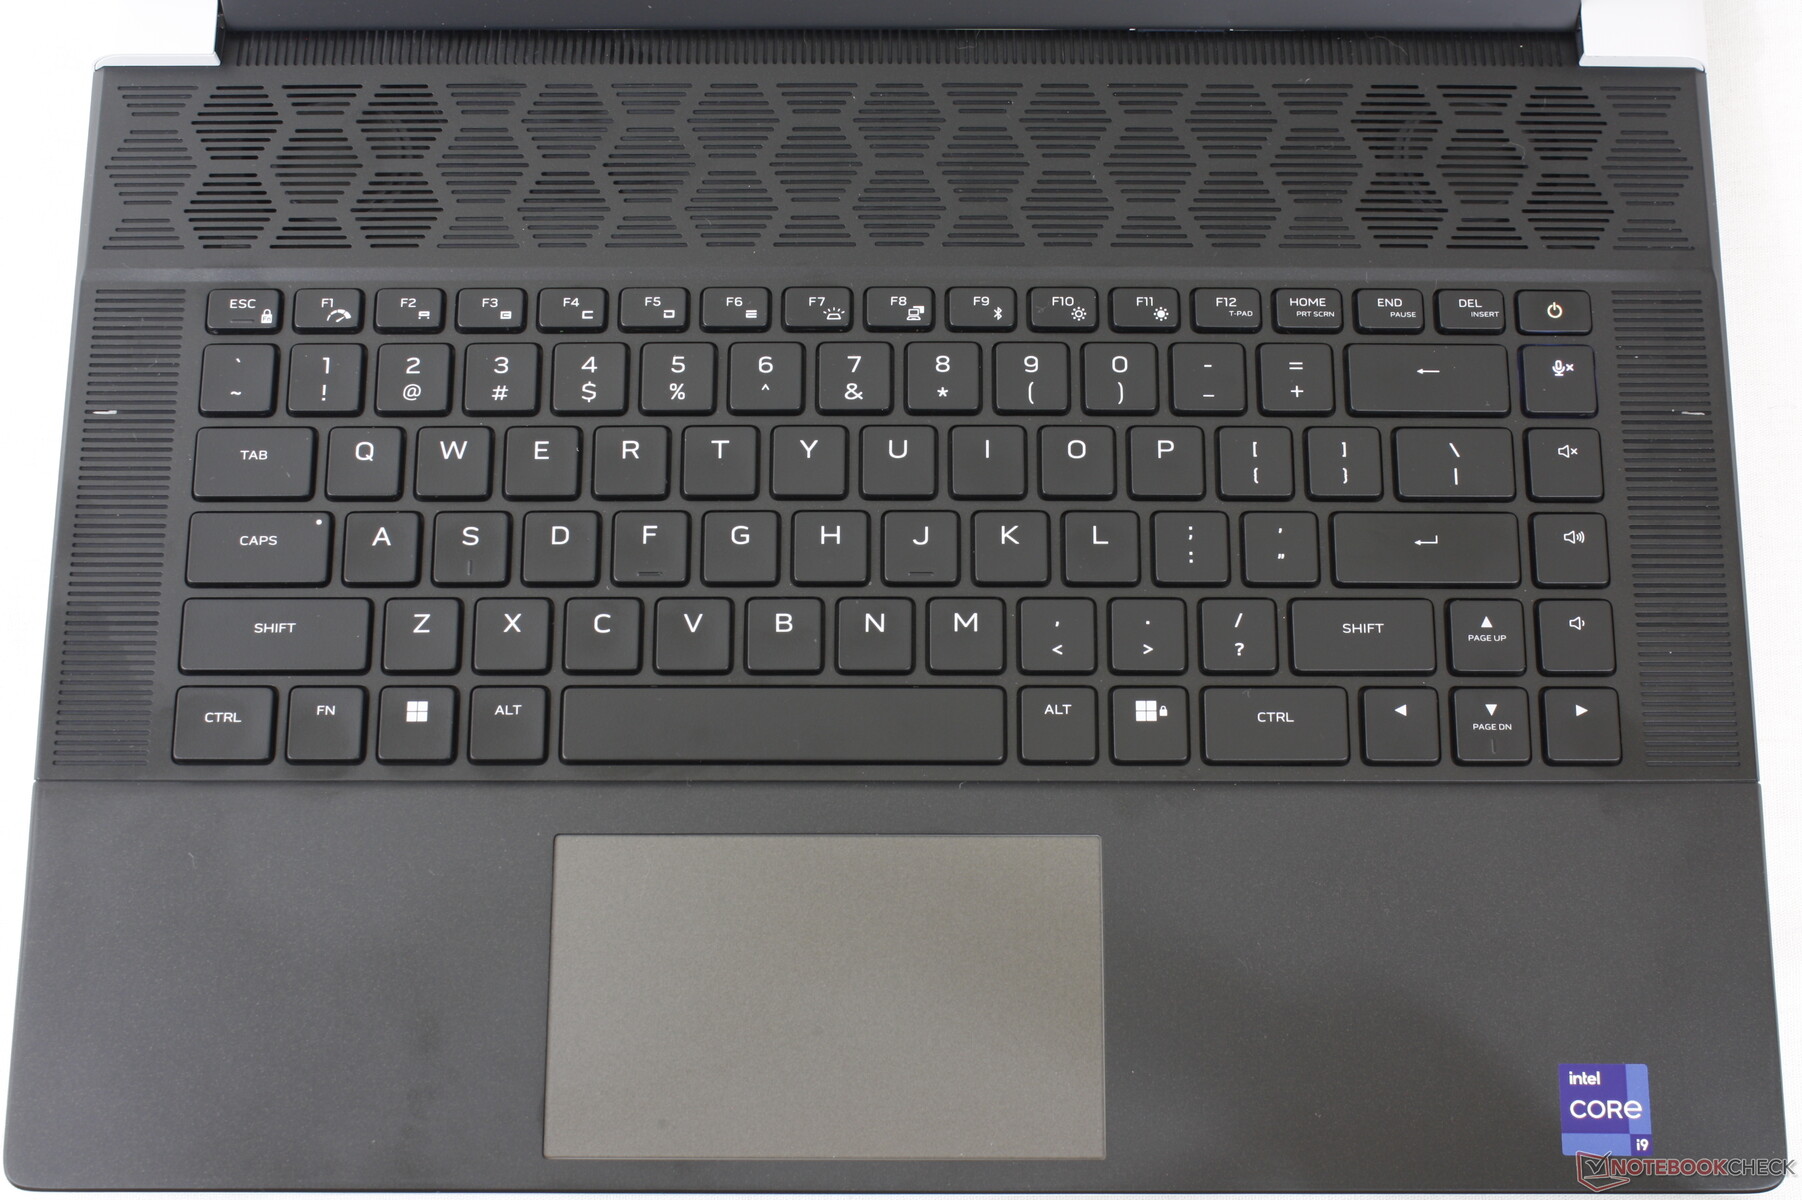
Invoerapparaten - Mechanische toetsen zijn luid en trots
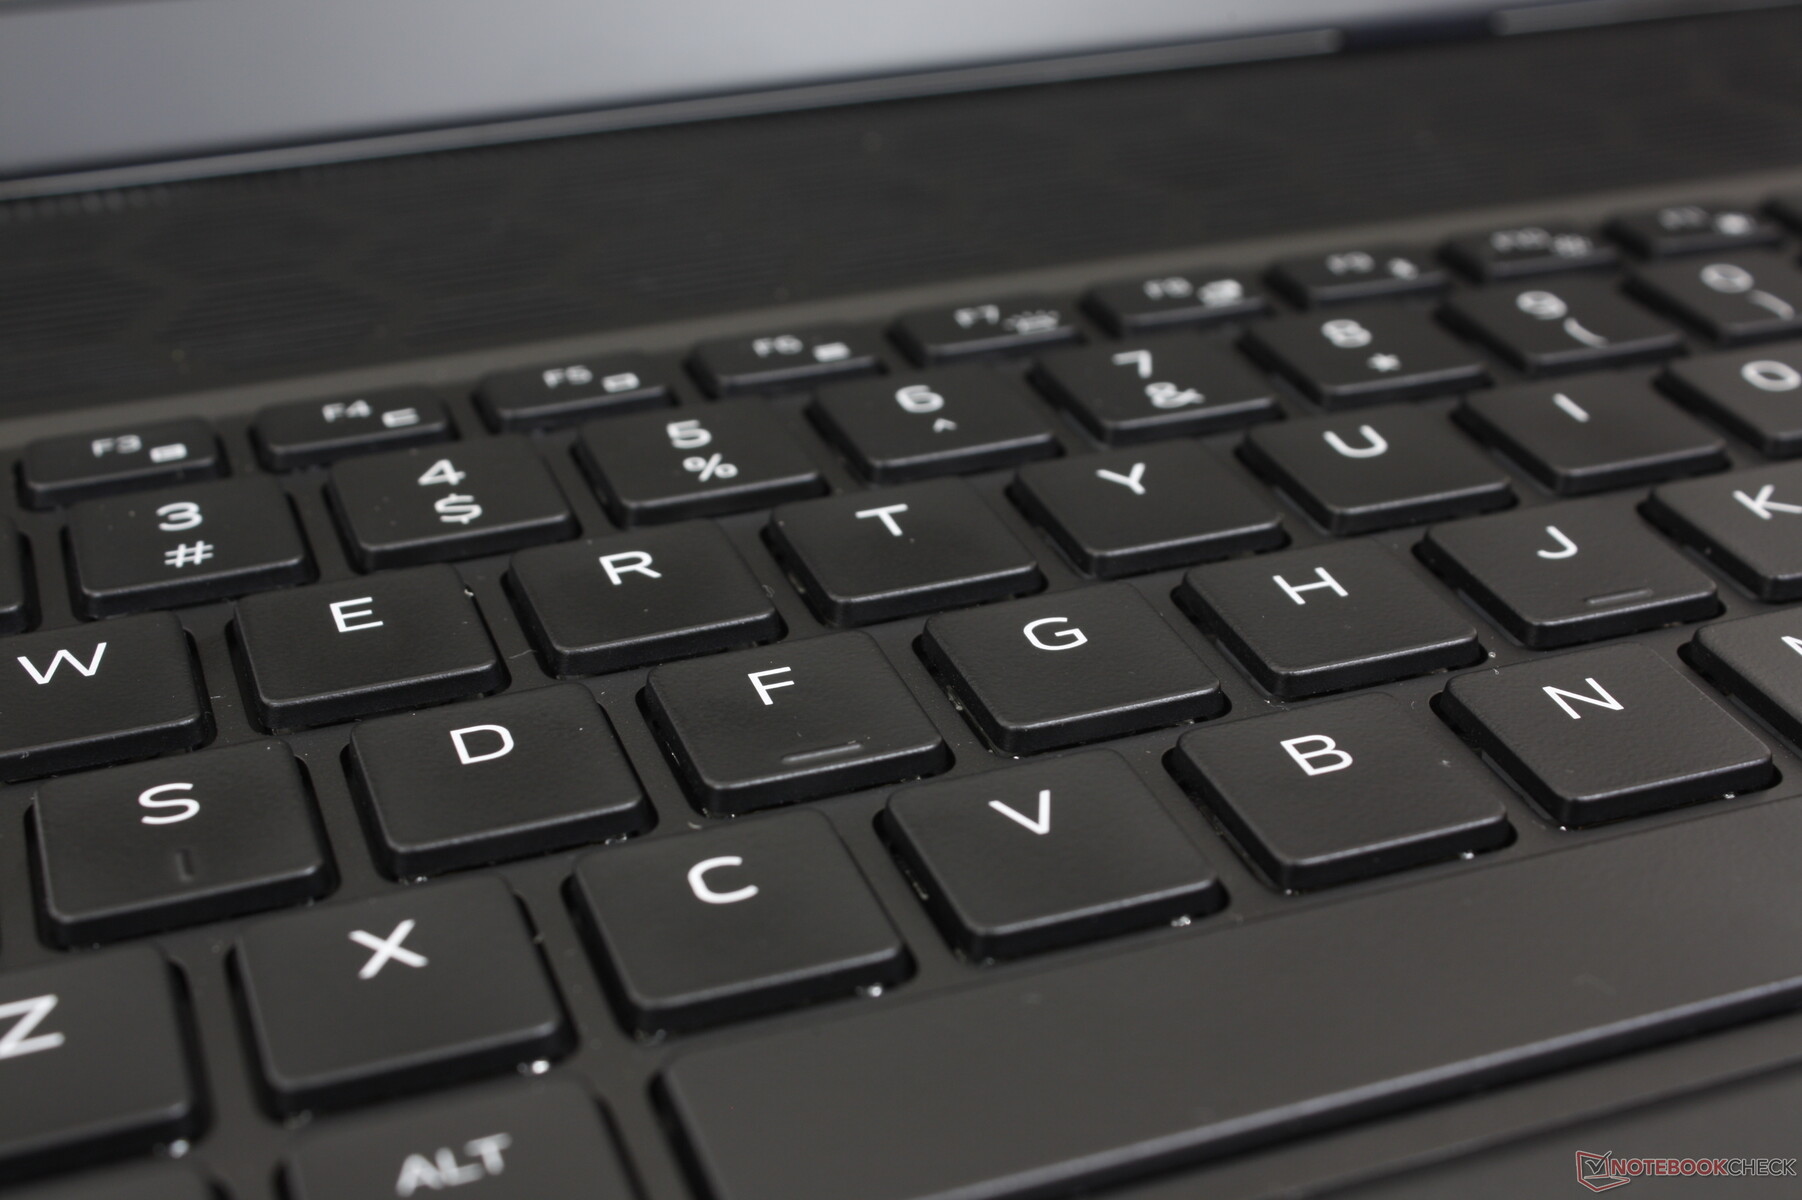
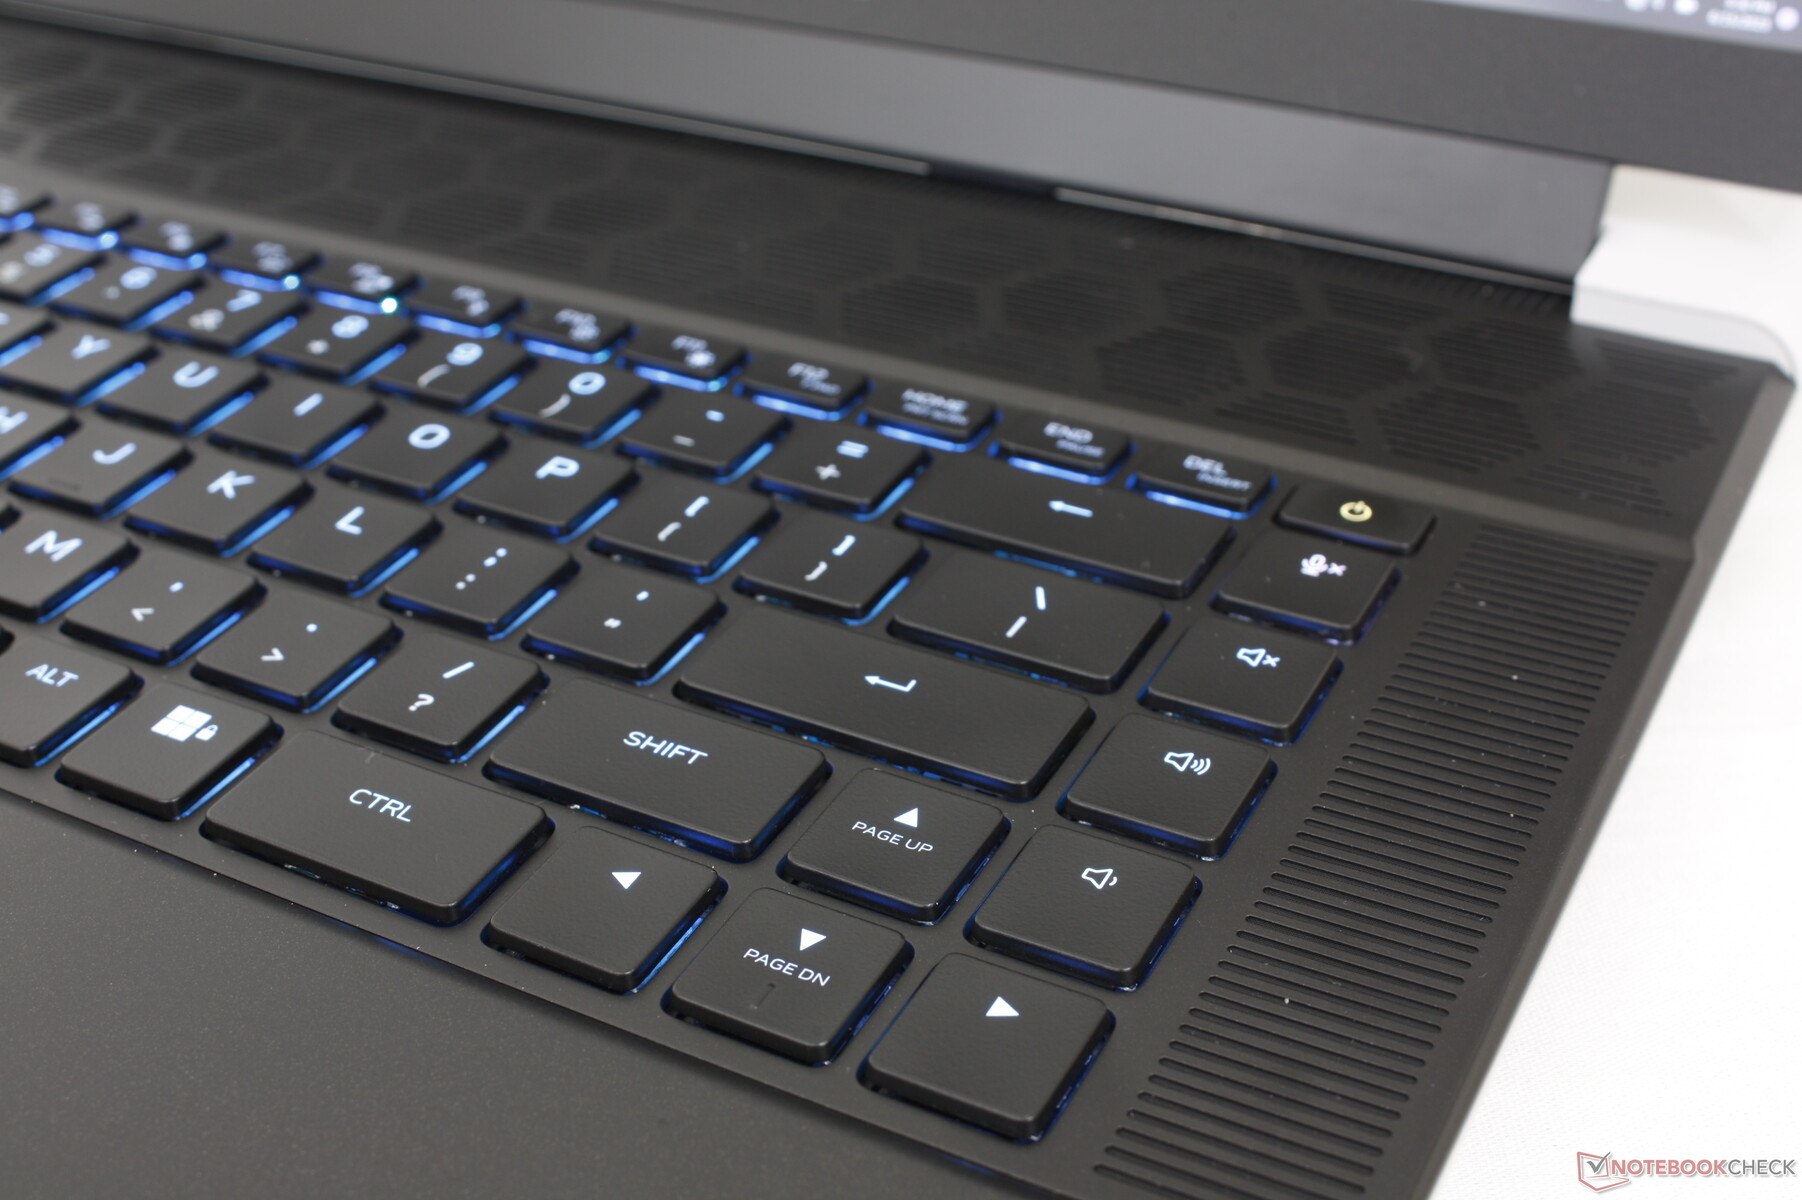
Toetsenbord
Dell biedt twee toetsenbordopties: standaard membraantoetsen en CherryMX ultra low-profile toetsen met RGB-verlichting per toets. Onze testunit is uitgerust met de laatste optie en de type-ervaring is dag en nacht vergeleken met de membraan-toetsen op de meeste andere gaming laptops. De veerweg van de toetsen van 1,8 mm is dieper dan de gebruikelijke 1,5 mm en de feedback is veel steviger en klikkeriger voor een bevredigender gevoel. Het is moeilijk om terug te gaan naar typen op iets als de Razer Blade 16 na gewend te zijn aan de CherryMX toetsen van de Alienware x16.
Het grootste nadeel is natuurlijk het aanzienlijk luidere gekletter van de mechanische toetsen. Daarom kun je de standaard niet-mechanische optie overwegen als je van plan bent de laptop te gebruiken in geluidsgevoelige omgevingen zoals klaslokalen of krappe slaapzalen.
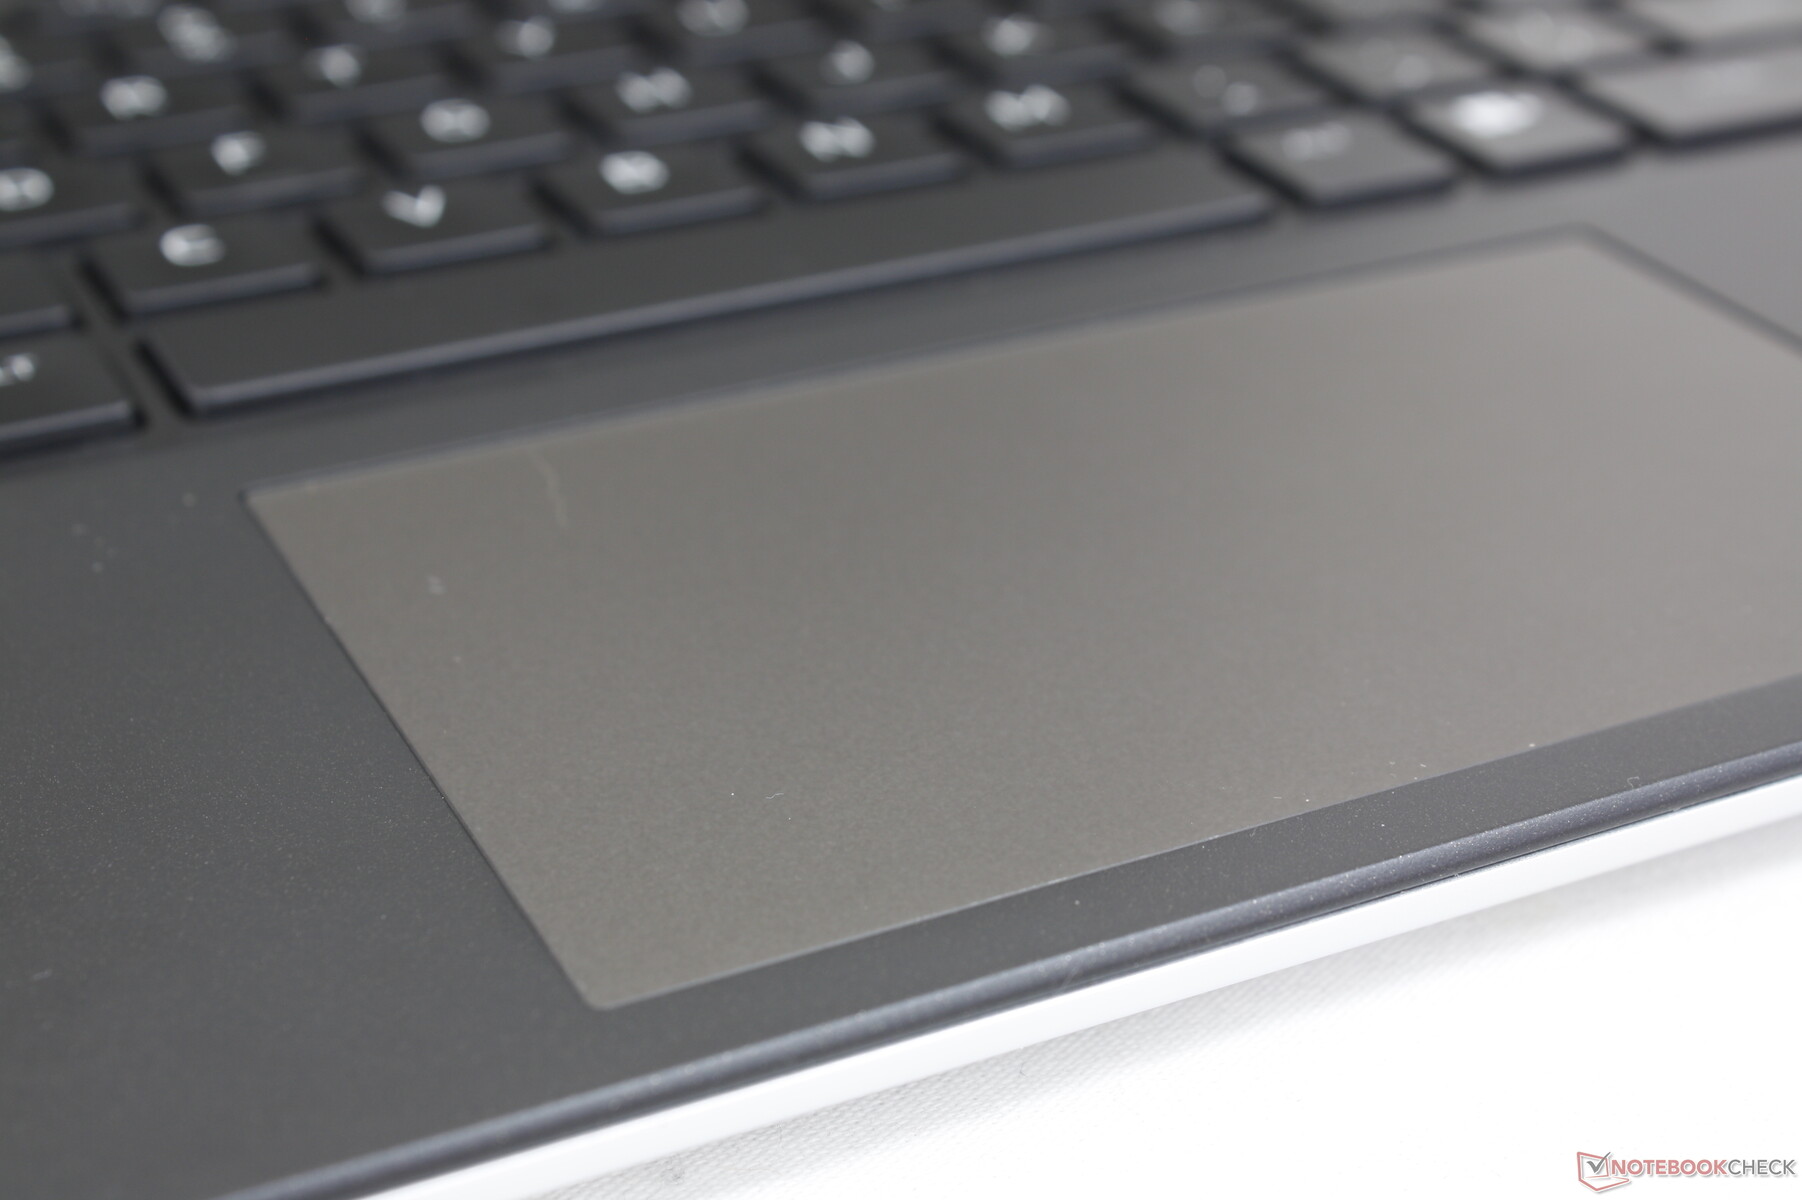
Touchpad
Het clickpad is met slechts 11,2 x 6,5 cm een van de kleinste voor een 16-inch gaminglaptop, vergeleken met 17 x 9,7 cm en 12 x 7,5 cm op de Blade 16 en Pro 5 16 Legion Pro 5 16respectievelijk. Het kleinere formaat is te danken aan de grote koeloplossing en ventilatieroosters die meer ruimte innemen langs de achterkant van het systeem. Het glijden gaat soepel met slechts een lichte hapering bij lagere snelheden voor nauwkeuriger klikken.
De feedback bij het klikken is licht en erg oppervlakkig voor een onbevredigend gevoel. Op basis van dit en het kleine oppervlak is het duidelijk dat Dell verwacht dat de meeste gebruikers een USB-muis klaar hebben liggen.
Weergave - Geen slechte optie
Er zijn drie weergaveopties beschikbaar en onze metingen geven alleen de vetgedrukte optie weer:
- 2560 x 1600, 165 Hz, 3 ms, 100% sRGB, G-Sync
- 1920 x 1200, 480 Hz, 3 ms, 100% DCI-P3, G-Sync
- 2560 x 1600, 240 Hz, 3 ms, 100% DCI-P3, G-Sync
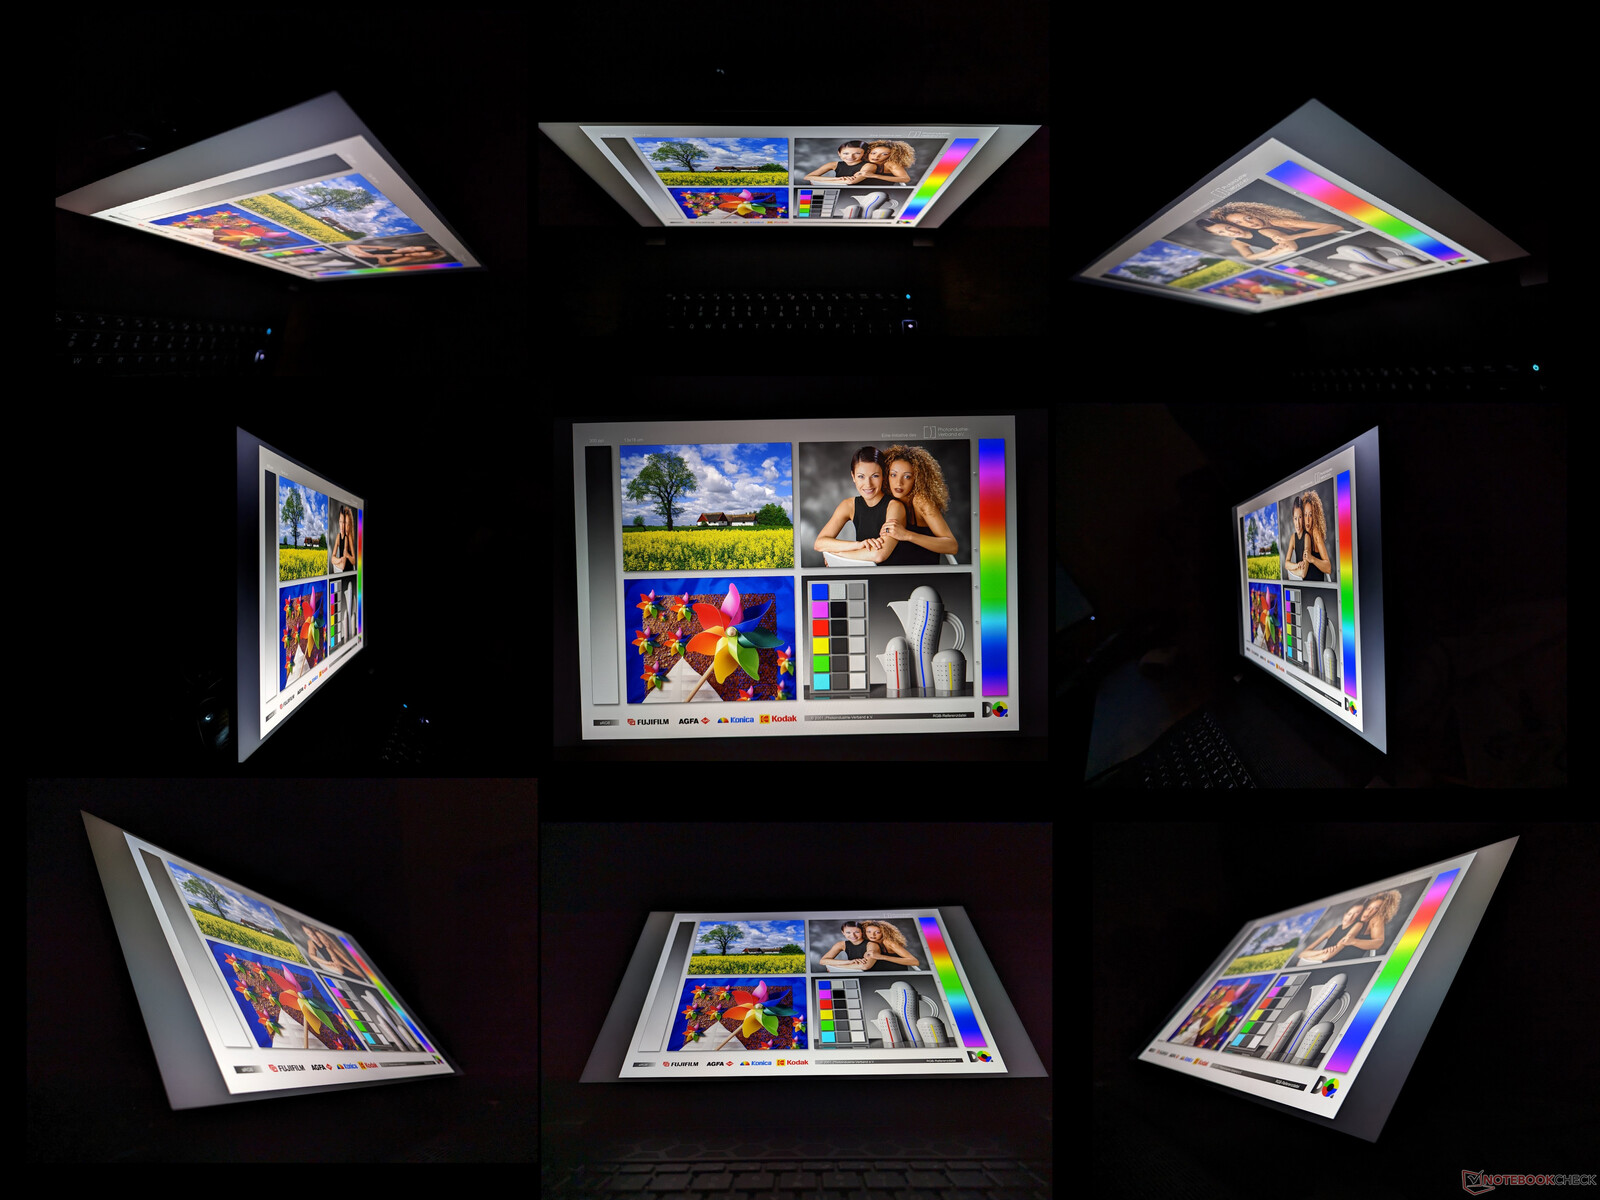
Er is zeker geen slecht of "verkeerd" paneel omdat alle panelen geschikt zijn voor gamingdoeleinden met hun snelle verversingsfrequenties en snelle responstijden. Dat gezegd hebbende, ons geconfigureerde 1600p240 paneel is de sweet spot voor de meeste gebruikers omdat de 1200p480 optie resolutie opoffert en de 1600p165 optie ondiepere kleuren heeft. De kijkervaring is vergelijkbaar met die van de Blade 16 en beter dan die van de Dell G16 en Lenovo Legion Pro 7 16 wat betreft kleurbereik.
| |||||||||||||||||||||||||
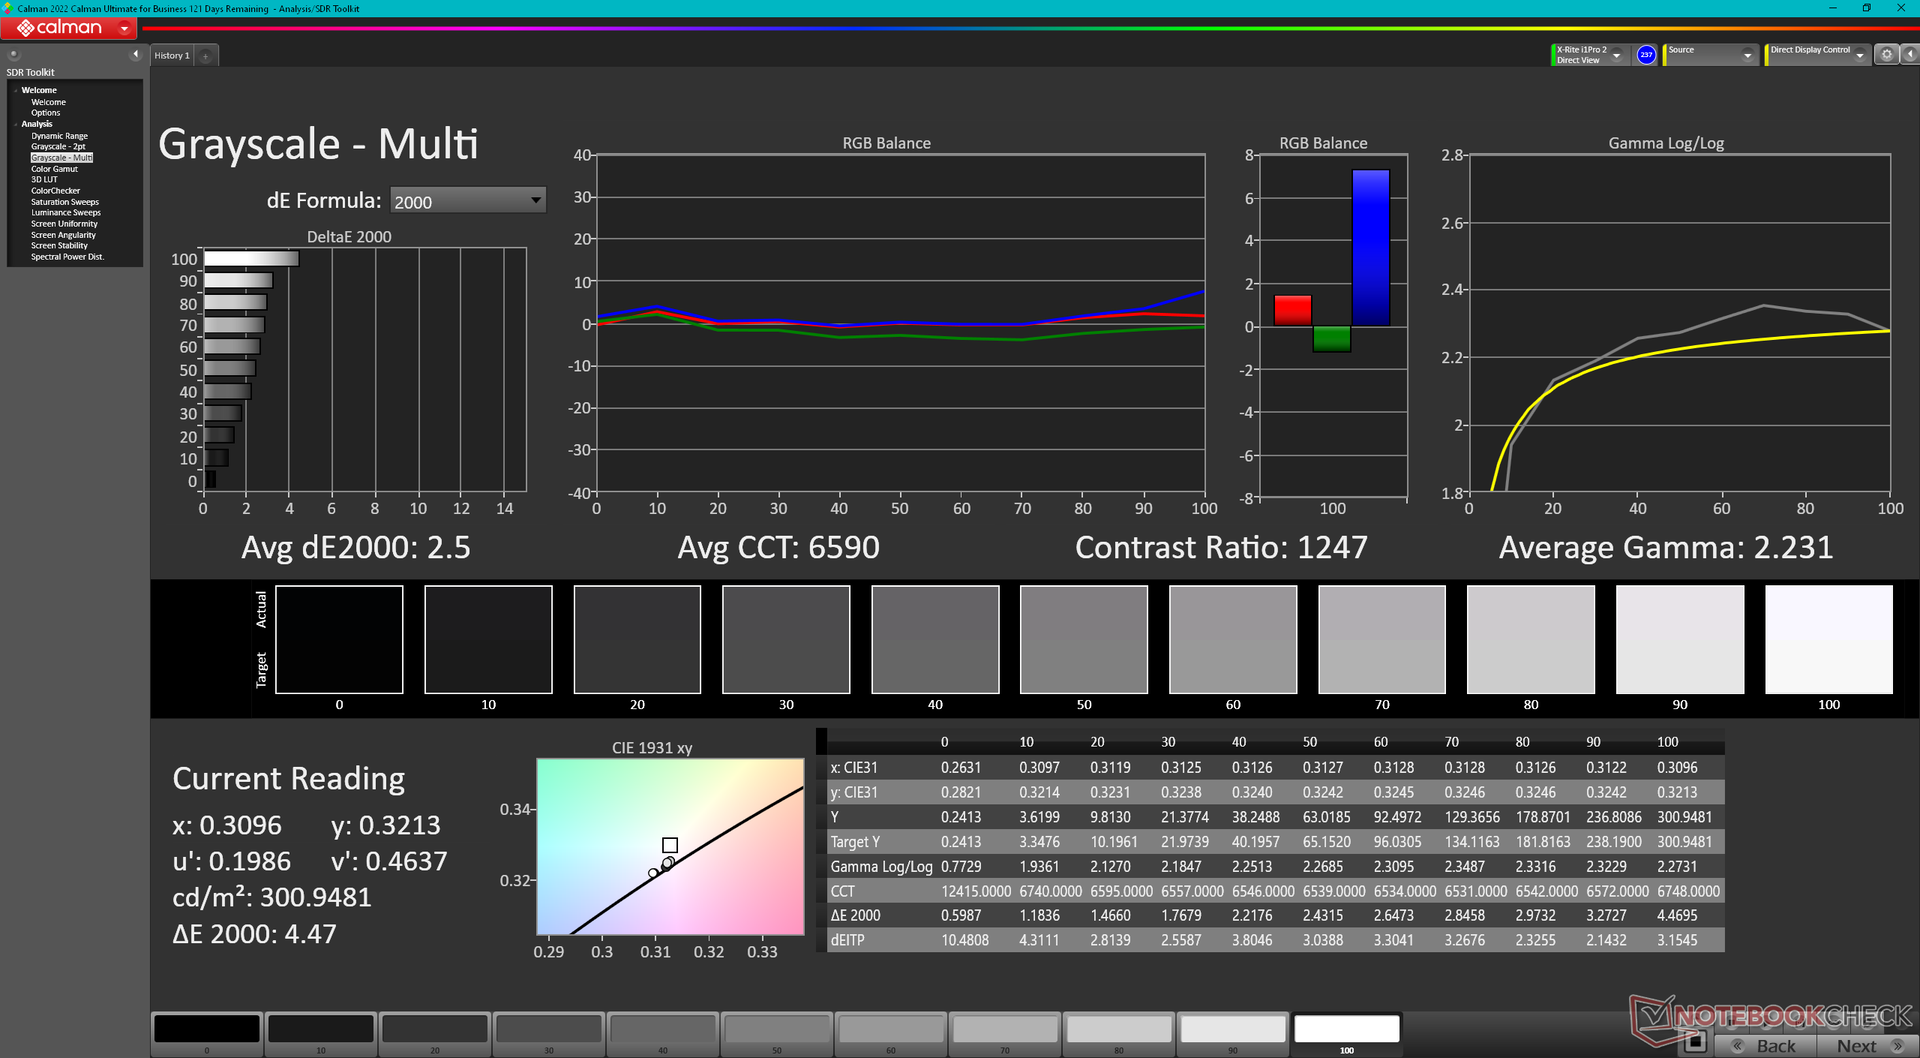
Helderheidsverdeling: 89 %
Helderheid in Batterij-modus: 302.2 cd/m²
Contrast: 1162:1 (Zwart: 0.26 cd/m²)
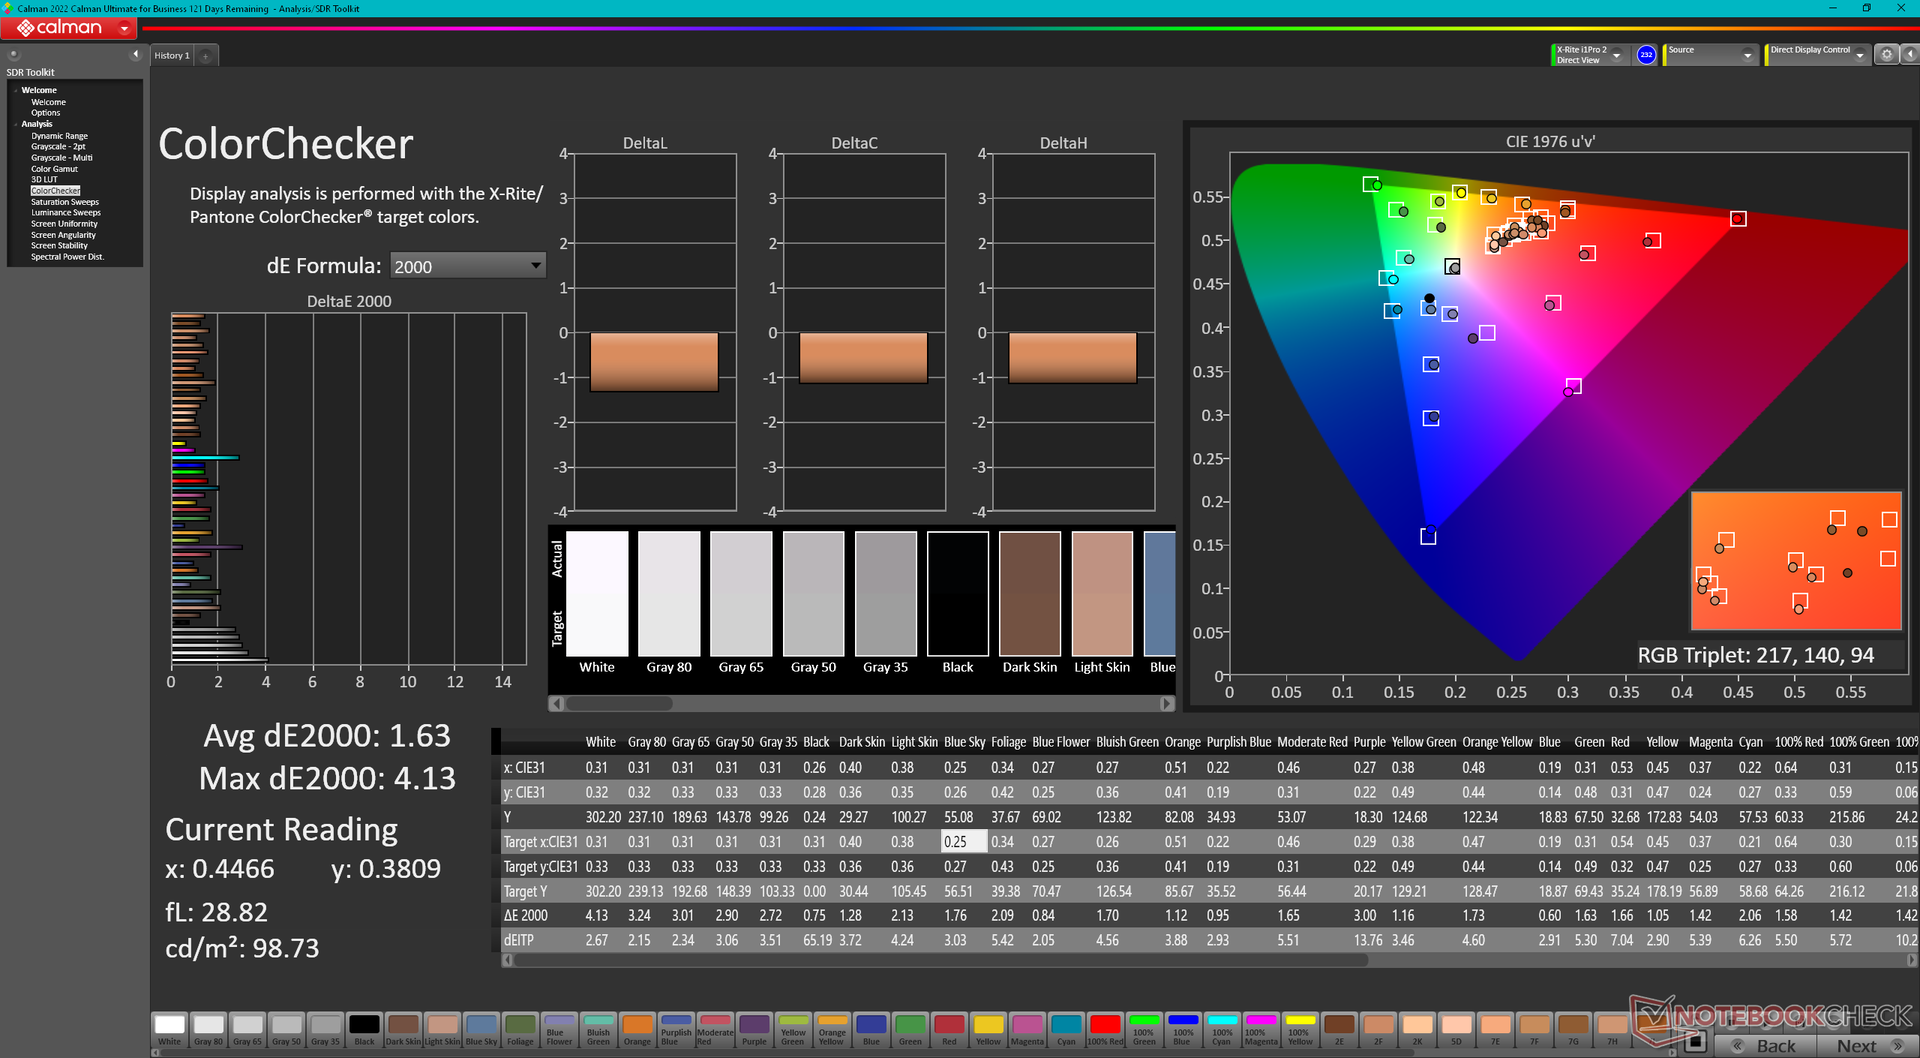
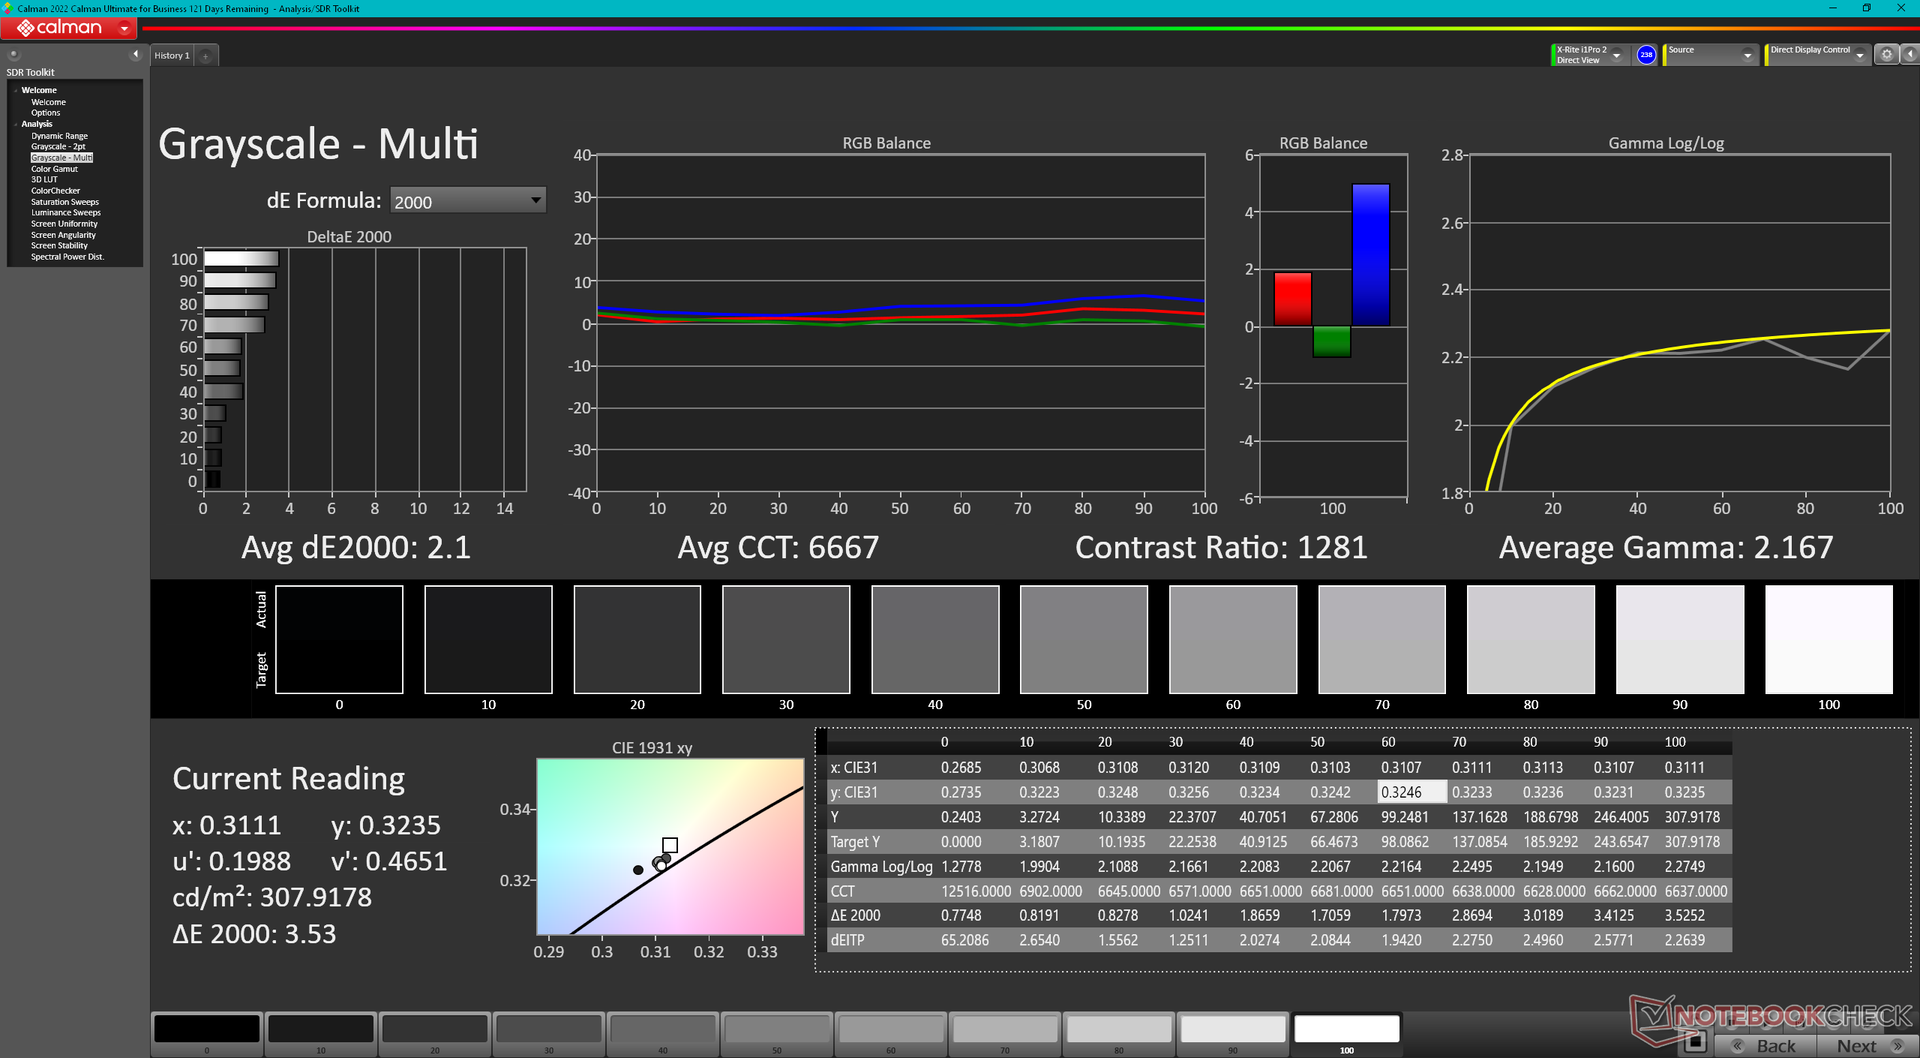
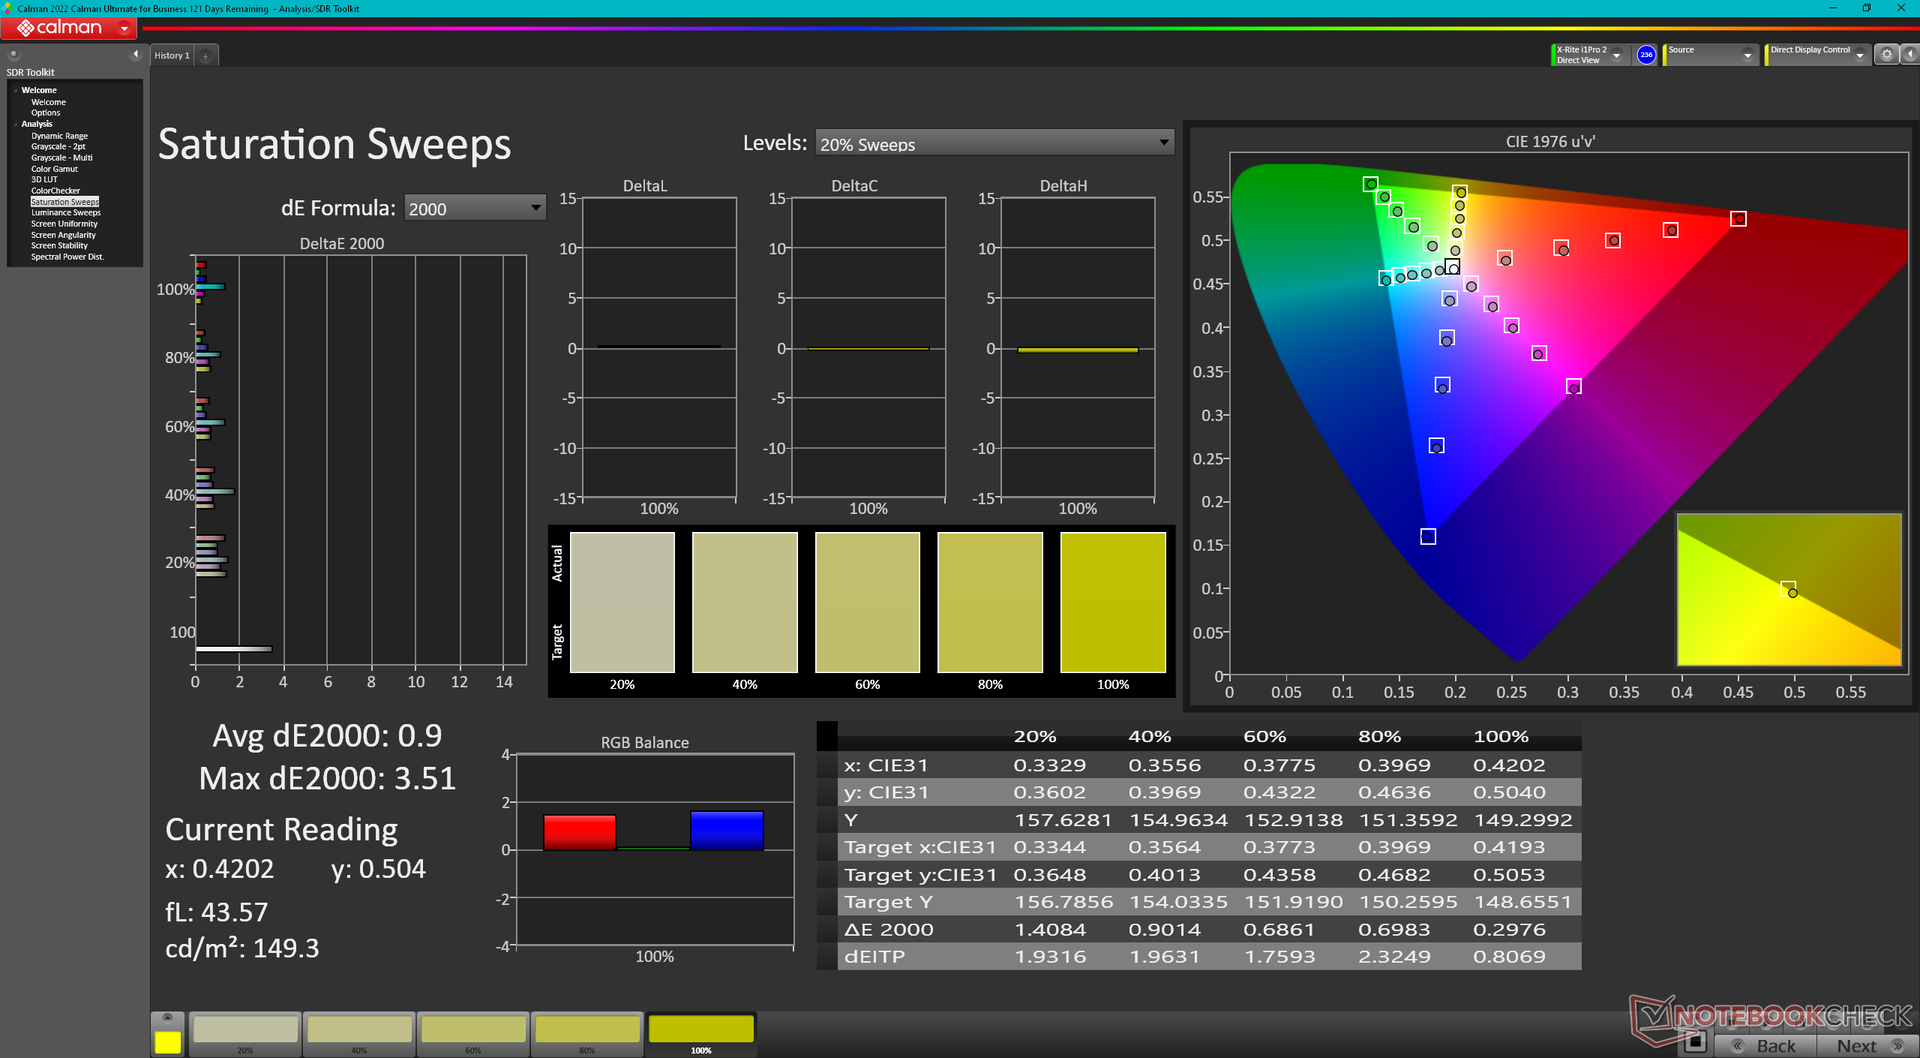
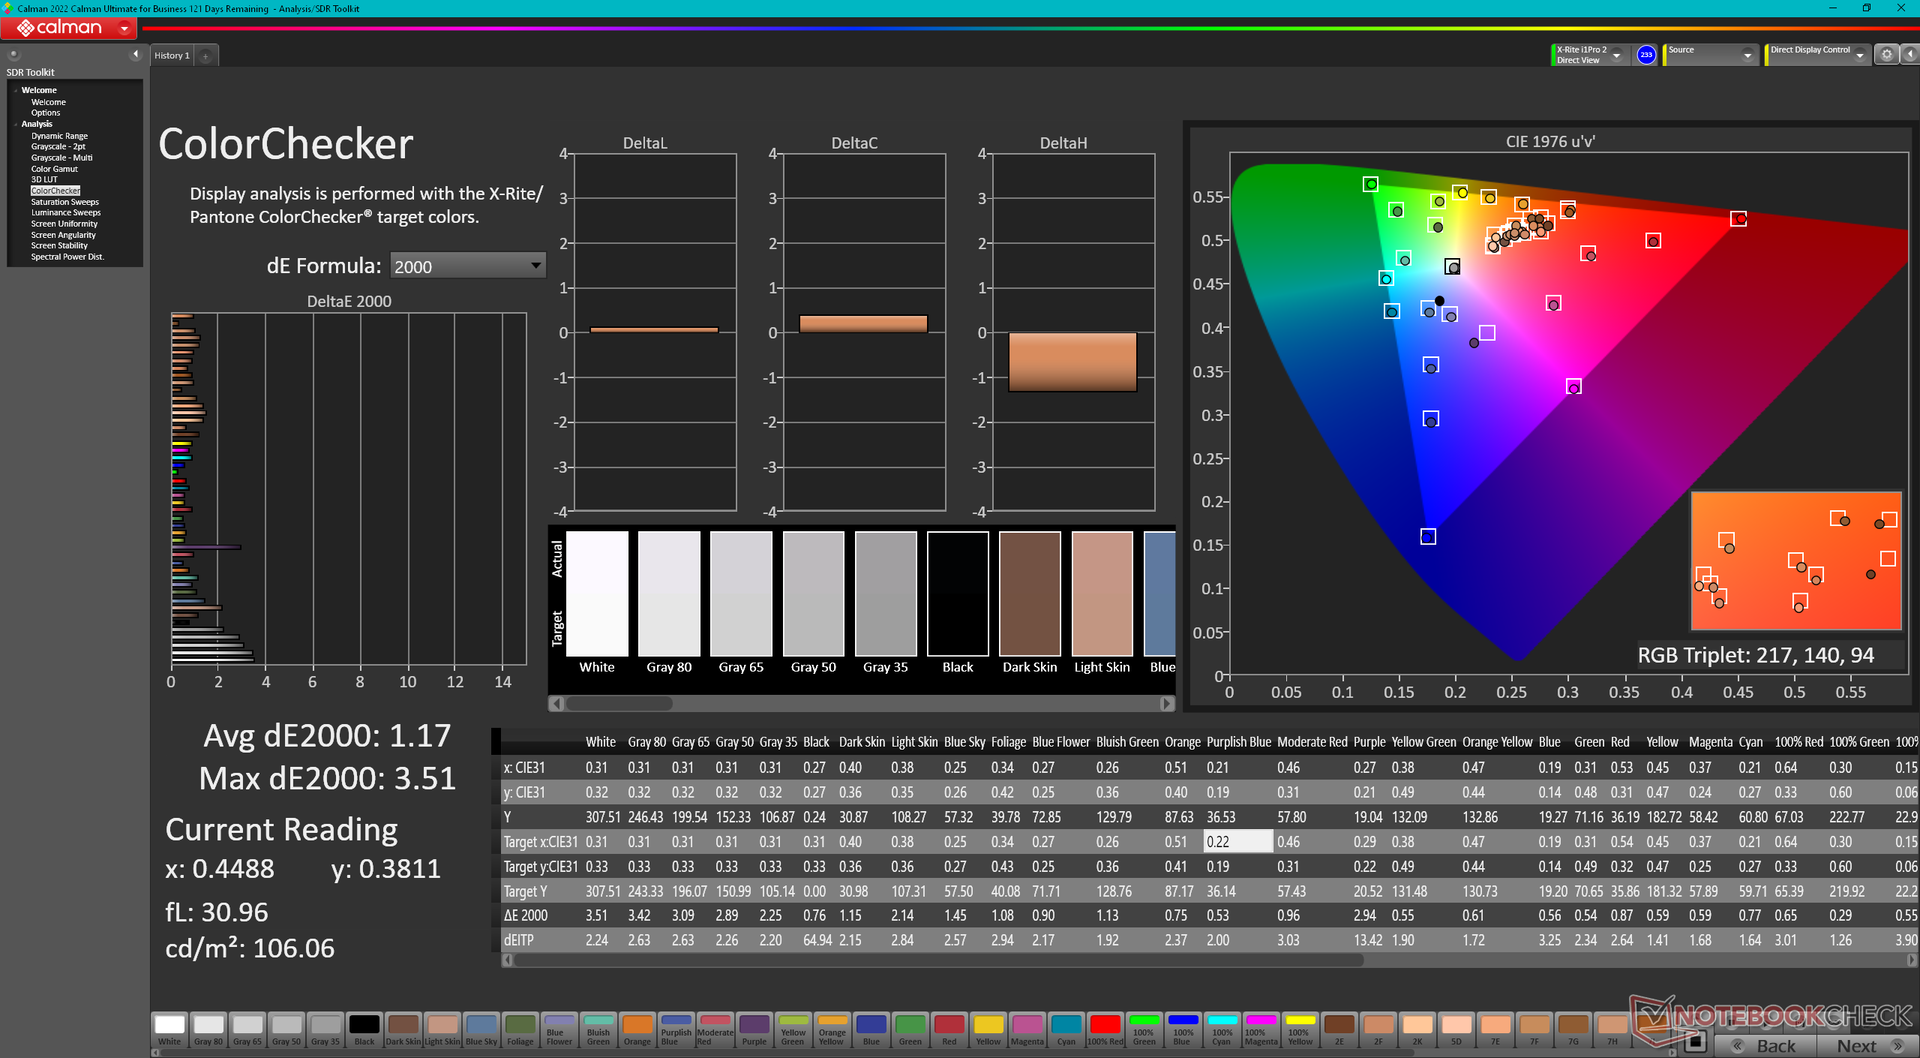
ΔE ColorChecker Calman: 1.63 | ∀{0.5-29.43 Ø4.71}
calibrated: 1.17
ΔE Greyscale Calman: 2.5 | ∀{0.09-98 Ø4.96}
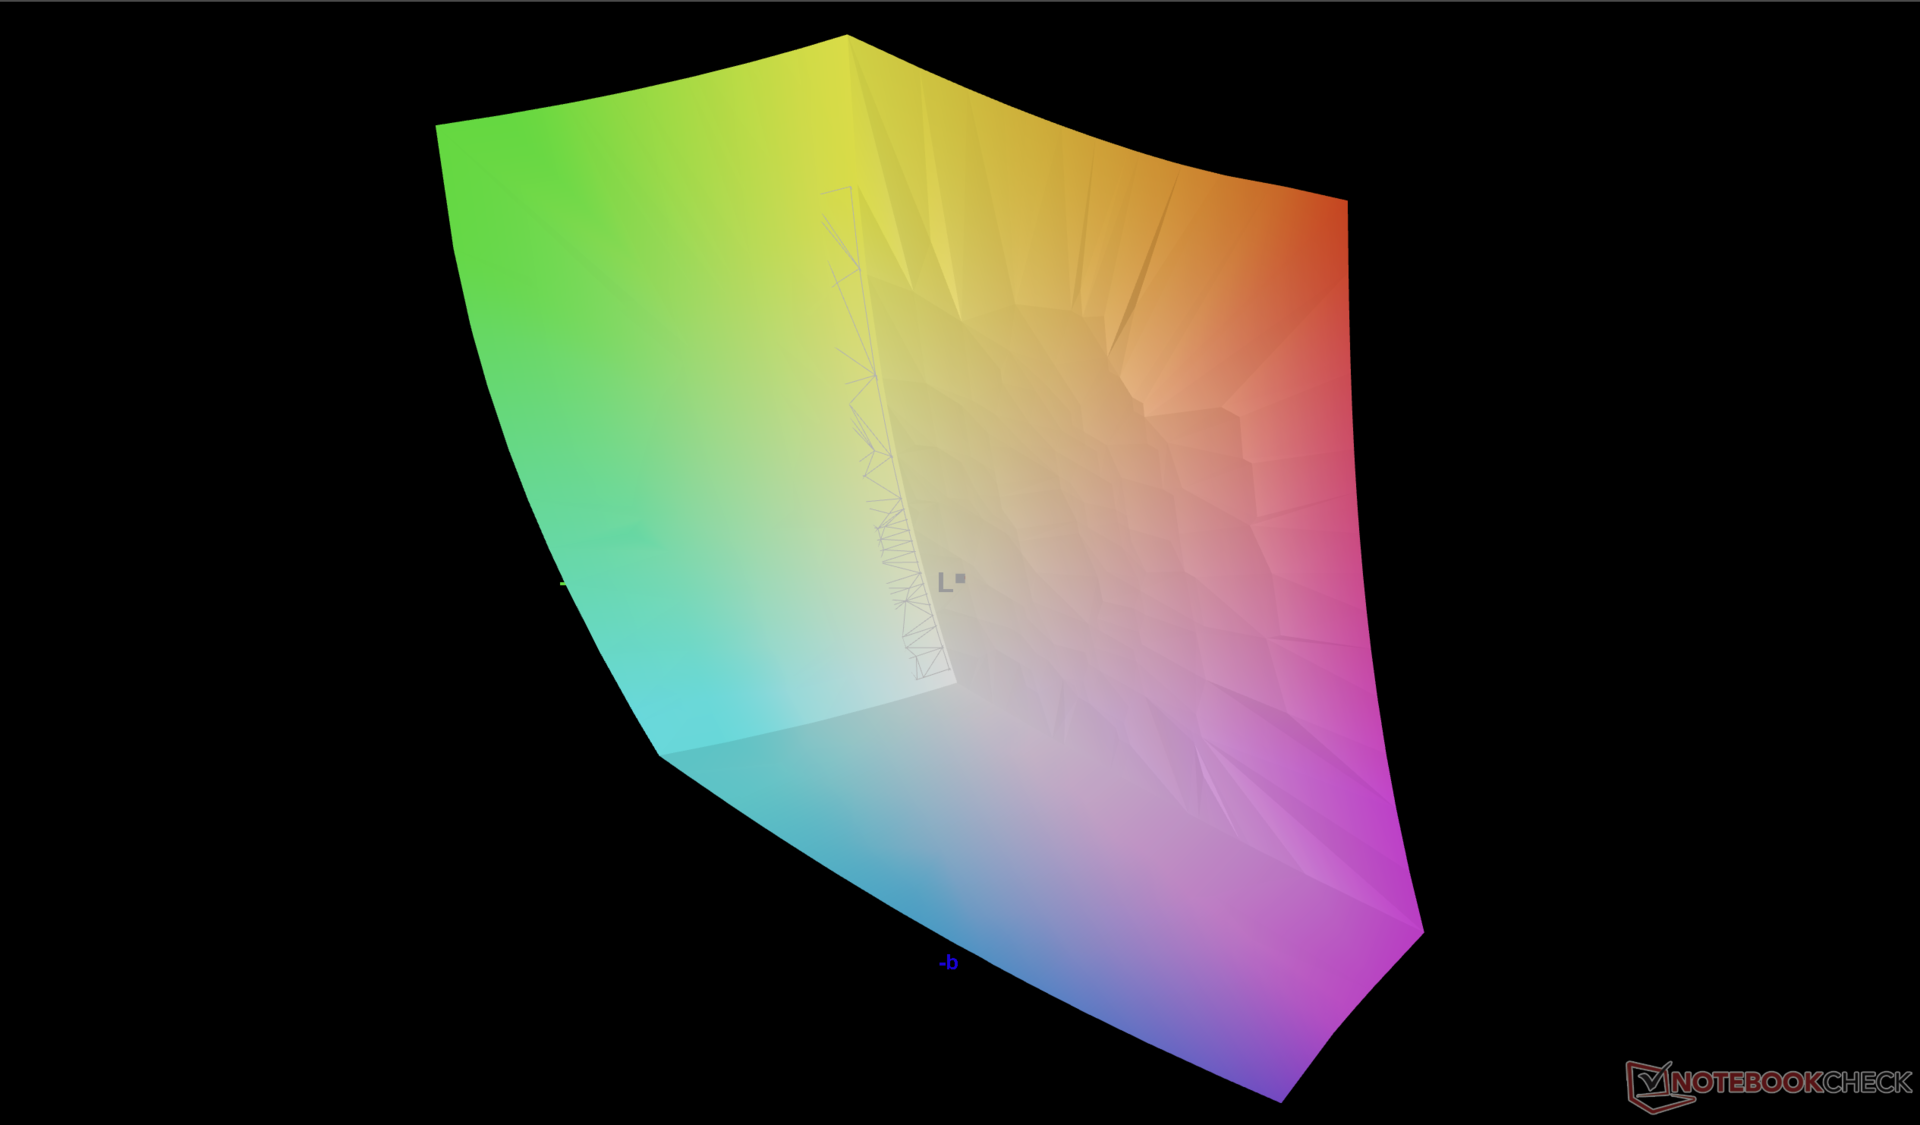
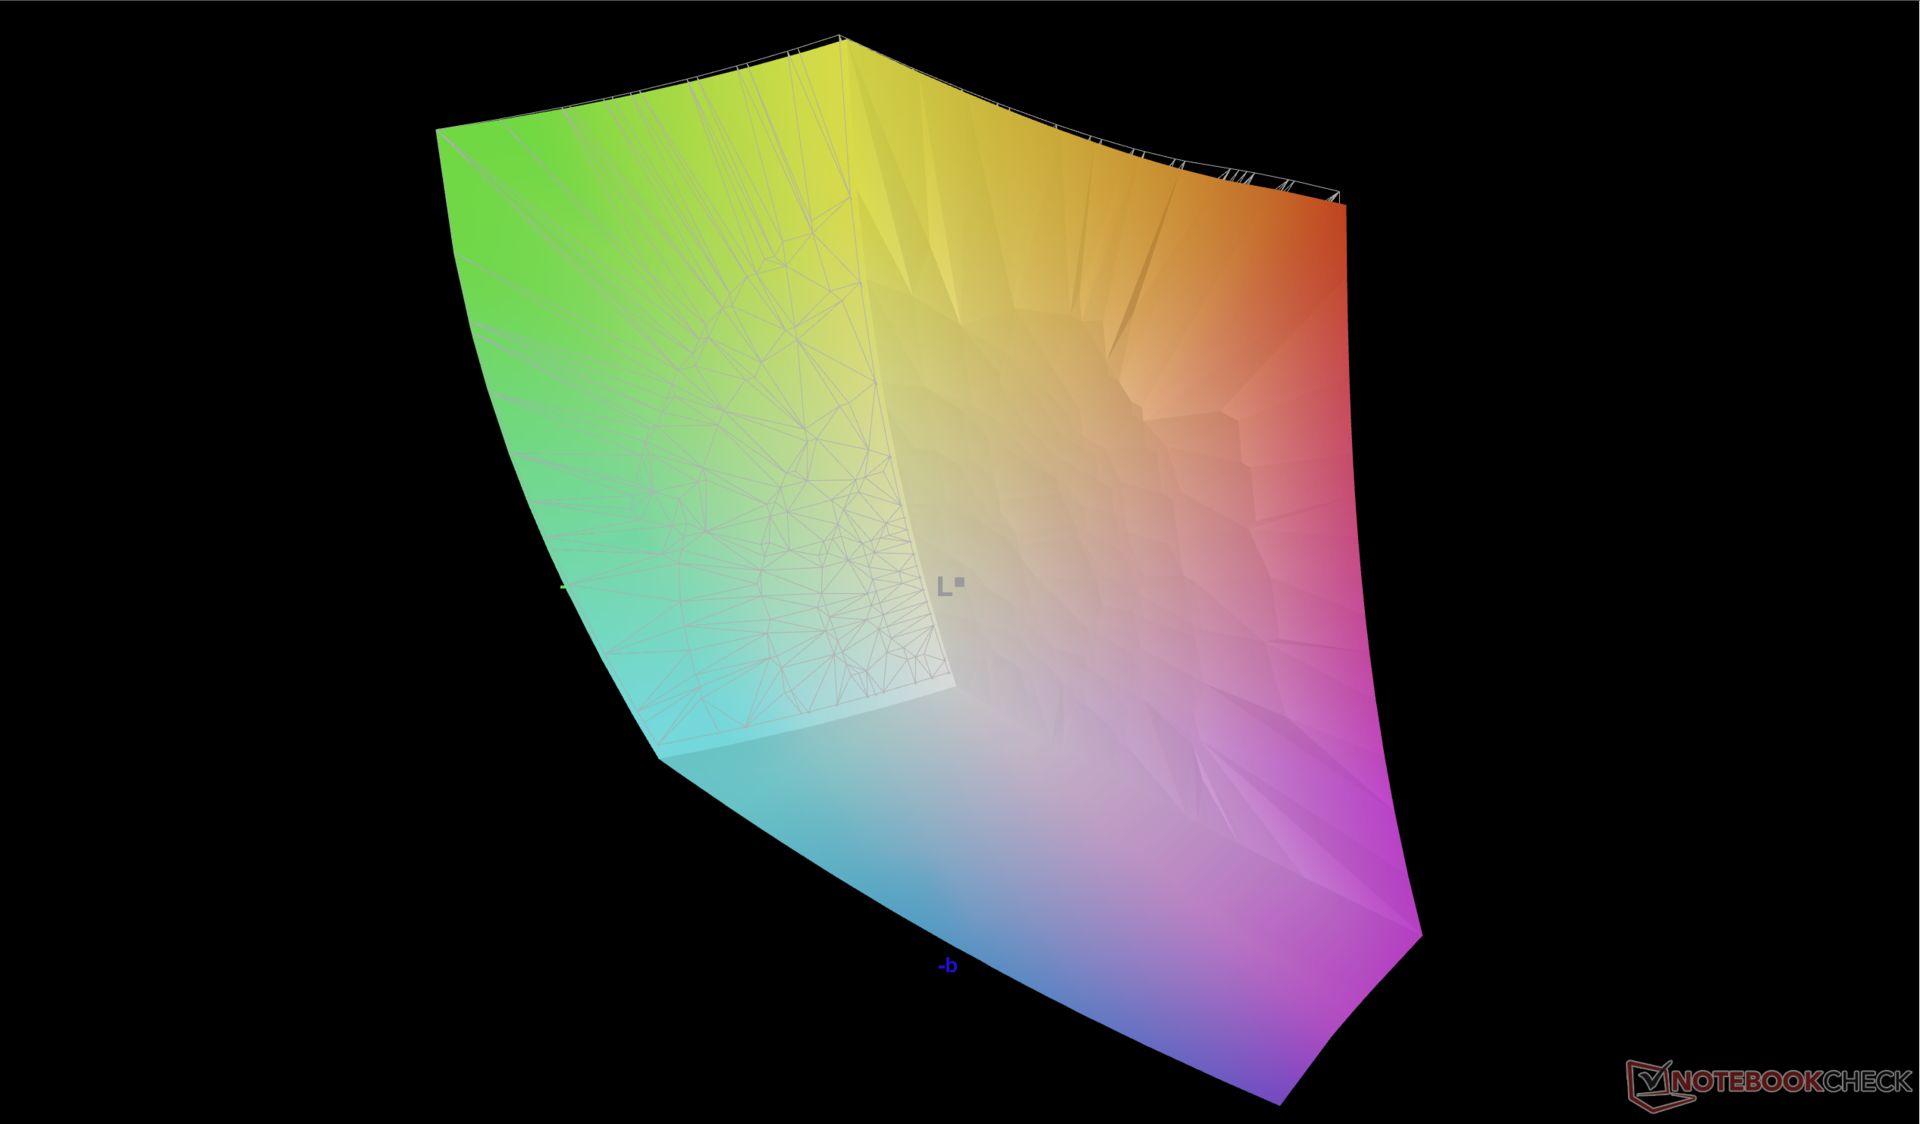
88.6% AdobeRGB 1998 (Argyll 3D)
100% sRGB (Argyll 3D)
99.2% Display P3 (Argyll 3D)
Gamma: 2.23
CCT: 6590 K
| Alienware x16 R1 BOE NE16NZ4, IPS, 2560x1600, 16" | Asus ROG Zephyrus M16 GU604VY-NM042X BOE0B74 (NE160QDM-NM4, IPS, 2560x1600, 16" | Razer Blade 16 Early 2023 CSOT T3 MNG007DA4-1, IPS, 2560x1600, 16" | Dell G16 7620 BOE NE16QDM, IPS, 2560x1600, 16" | Alienware m17 R5 (R9 6900HX, RX 6850M XT) AU Optronics AUODBA3, IPS, 3840x2160, 17" | Lenovo Legion Pro 7 16IRX8H MNG007DA2-3 (CSO1628), IPS, 2560x1600, 16" | |
|---|---|---|---|---|---|---|
| Display | 1% | 0% | -18% | -1% | -17% | |
| Display P3 Coverage (%) | 99.2 | 99.33 0% | 98.5 -1% | 68.3 -31% | 97.2 -2% | 69.1 -30% |
| sRGB Coverage (%) | 100 | 99.9 0% | 100 0% | 98 -2% | 99.6 0% | 99.7 0% |
| AdobeRGB 1998 Coverage (%) | 88.6 | 90.01 2% | 89.7 1% | 70.5 -20% | 88.4 0% | 71.2 -20% |
| Response Times | -542% | -23% | -35% | -118% | -49% | |
| Response Time Grey 50% / Grey 80% * (ms) | 5.1 ? | 50.8 ? -896% | 6.6 ? -29% | 8.6 ? -69% | 16.4 ? -222% | 12.3 ? -141% |
| Response Time Black / White * (ms) | 10.3 ? | 29.6 ? -187% | 12 ? -17% | 10.4 ? -1% | 11.6 ? -13% | 5.9 ? 43% |
| PWM Frequency (Hz) | 12000 | |||||
| Screen | 247% | -8% | -4% | -80% | 31% | |
| Brightness middle (cd/m²) | 302.2 | 634 110% | 456.8 51% | 369.4 22% | 484 60% | 511 69% |
| Brightness (cd/m²) | 285 | 627 120% | 437 53% | 348 22% | 449 58% | 469 65% |
| Brightness Distribution (%) | 89 | 92 3% | 83 -7% | 83 -7% | 87 -2% | 86 -3% |
| Black Level * (cd/m²) | 0.26 | 0.03 88% | 0.35 -35% | 0.32 -23% | 0.55 -112% | 0.4 -54% |
| Contrast (:1) | 1162 | 21133 1719% | 1305 12% | 1154 -1% | 880 -24% | 1278 10% |
| Colorchecker dE 2000 * | 1.63 | 0.89 45% | 3.7 -127% | 1.78 -9% | 4.8 -194% | 0.95 42% |
| Colorchecker dE 2000 max. * | 4.13 | 1.79 57% | 6.42 -55% | 4.41 -7% | 7.48 -81% | 2.07 50% |
| Colorchecker dE 2000 calibrated * | 1.17 | 0.91 22% | 0.66 44% | 1.22 -4% | 4.74 -305% | 0.91 22% |
| Greyscale dE 2000 * | 2.5 | 1.13 55% | 2.6 -4% | 3.2 -28% | 5.5 -120% | 0.6 76% |
| Gamma | 2.23 99% | 2.47 89% | 2.3 96% | 2.2 100% | 2.42 91% | 2.176 101% |
| CCT | 6590 99% | 6497 100% | 6108 106% | 6750 96% | 6148 106% | 6545 99% |
| Totaal Gemiddelde (Programma / Instellingen) | -98% /
81% | -10% /
-8% | -19% /
-11% | -66% /
-68% | -12% /
9% |
* ... kleiner is beter
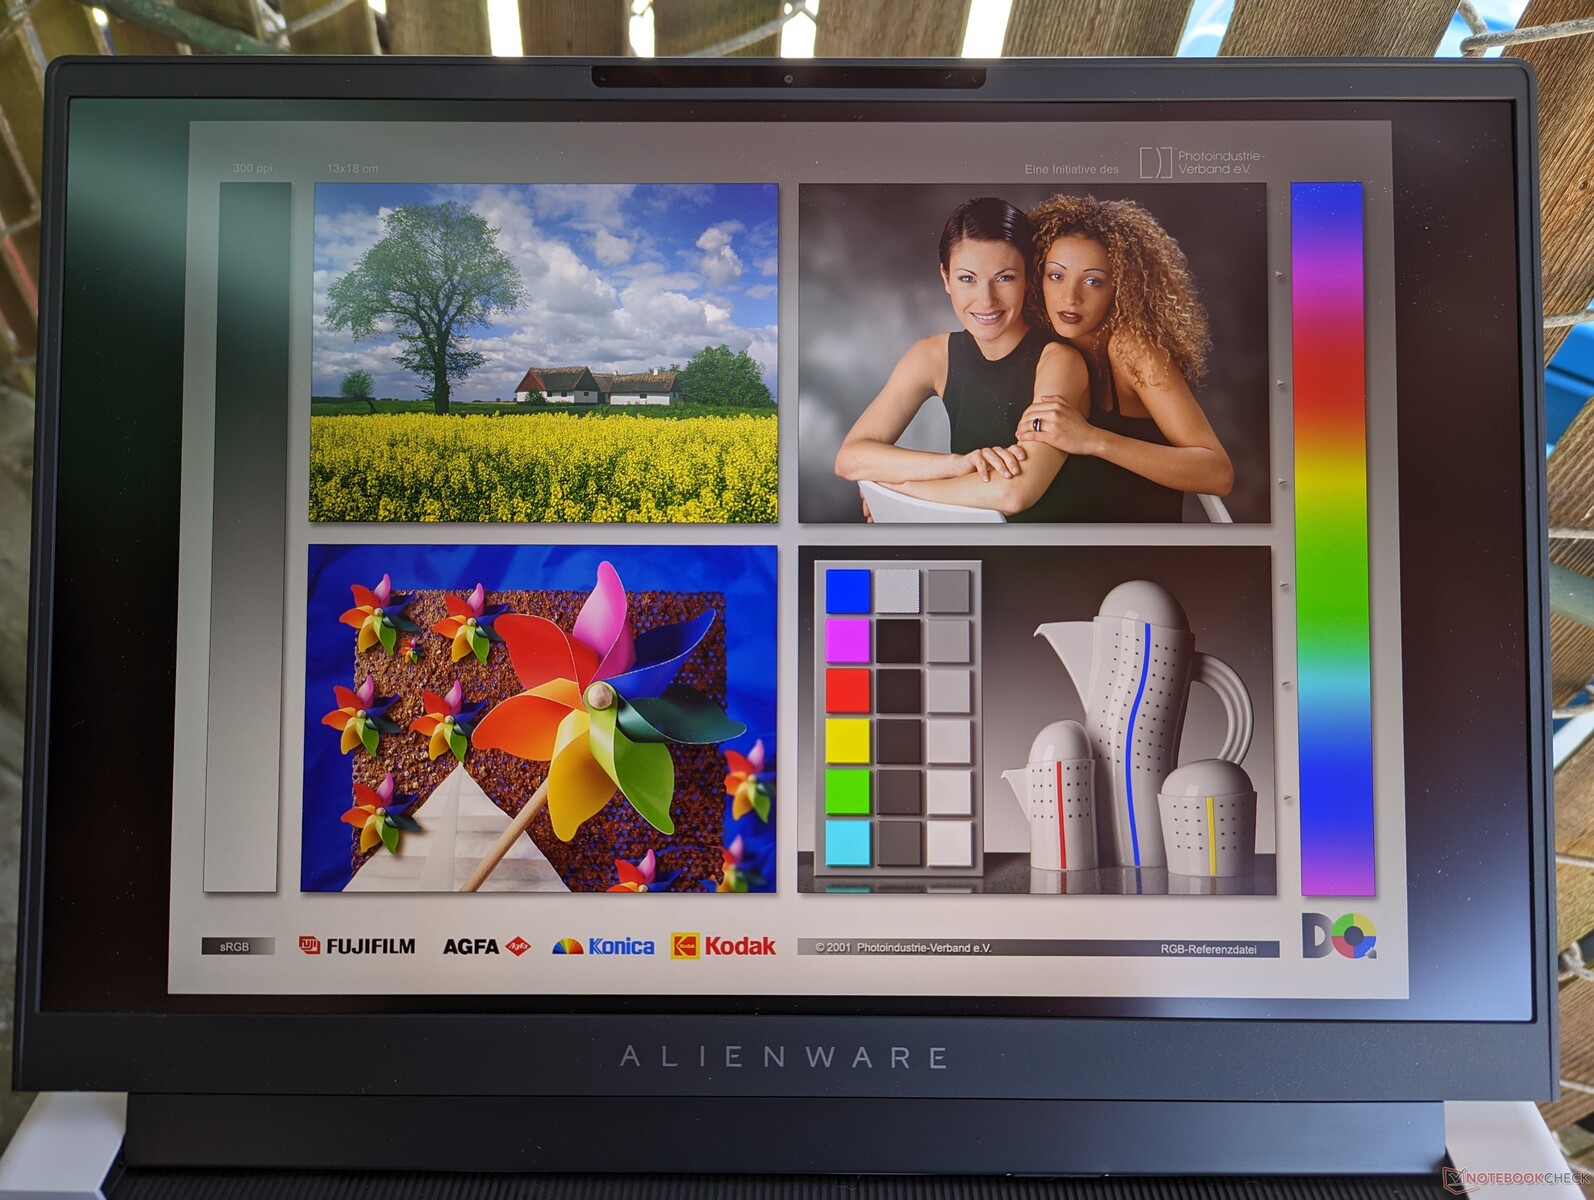
Het scherm is goed gekalibreerd uit de doos met gemiddelde grijswaarden en kleur deltaE waarden van slechts 2,5 en 1,63, respectievelijk. Pogingen om het scherm nog verder te kalibreren met onze X-Rite colorimeter zouden slechts zeer kleine verbeteringen opleveren en dus is een kalibratie door de eindgebruiker niet nodig.

Responstijd Scherm
| ↔ Responstijd Zwart naar Wit | ||
|---|---|---|
| 10.3 ms ... stijging ↗ en daling ↘ gecombineerd | ↗ 5.4 ms stijging | 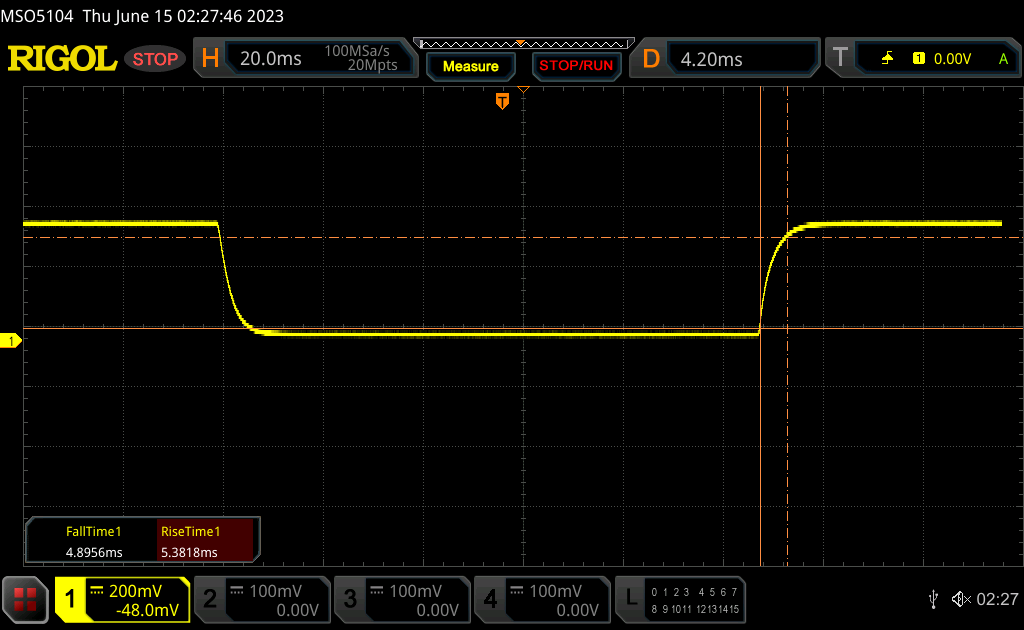 |
| ↘ 4.9 ms daling | ||
| Het scherm vertoonde prima responstijden in onze tests maar is misschien wat te traag voor competitieve games. Ter vergelijking: alle testtoestellen variëren van 0.1 (minimum) tot 240 (maximum) ms. » 28 % van alle toestellen zijn beter. Dit betekent dat de gemeten responstijd beter is dan het gemiddelde (19.8 ms) van alle geteste toestellen. | ||
| ↔ Responstijd 50% Grijs naar 80% Grijs | ||
| 5.1 ms ... stijging ↗ en daling ↘ gecombineerd | ↗ 2.4 ms stijging | 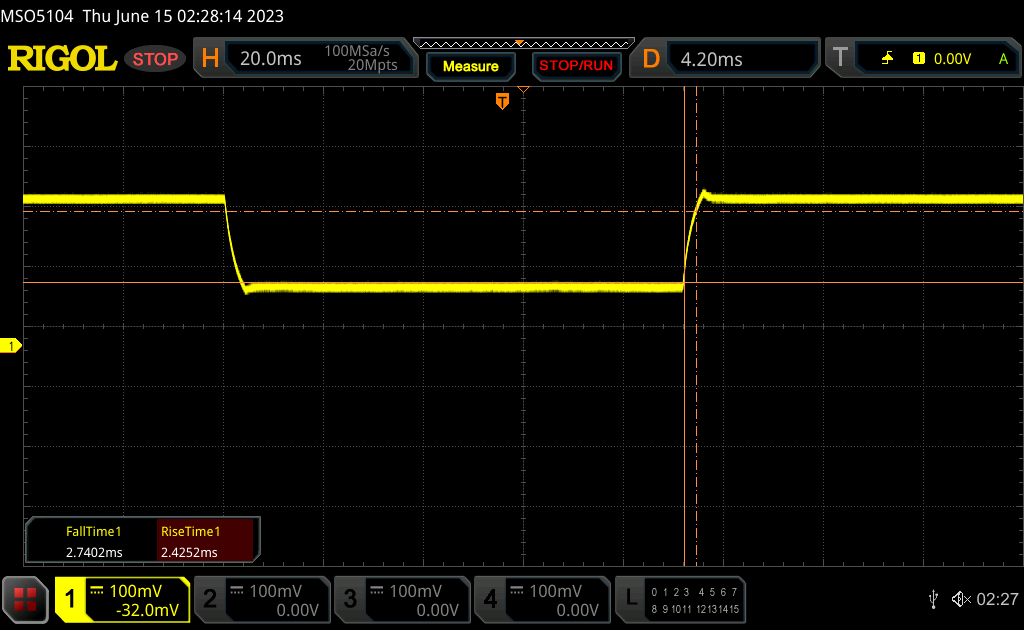 |
| ↘ 2.7 ms daling | ||
| Het scherm vertoonde erg snelle responstijden in onze tests en zou zeer geschikt moeten zijn voor snelle games. Ter vergelijking: alle testtoestellen variëren van 0.165 (minimum) tot 636 (maximum) ms. » 17 % van alle toestellen zijn beter. Dit betekent dat de gemeten responstijd beter is dan het gemiddelde (31 ms) van alle geteste toestellen. | ||
Screen Flickering / PWM (Pulse-Width Modulation)
| Screen flickering / PWM niet waargenomen |  | ||
Ter vergelijking: 52 % van alle geteste toestellen maakten geen gebruik van PWM om de schermhelderheid te verlagen. Als het wel werd gebruikt, werd een gemiddelde van 7757 (minimum: 5 - maximum: 343500) Hz waargenomen. | |||
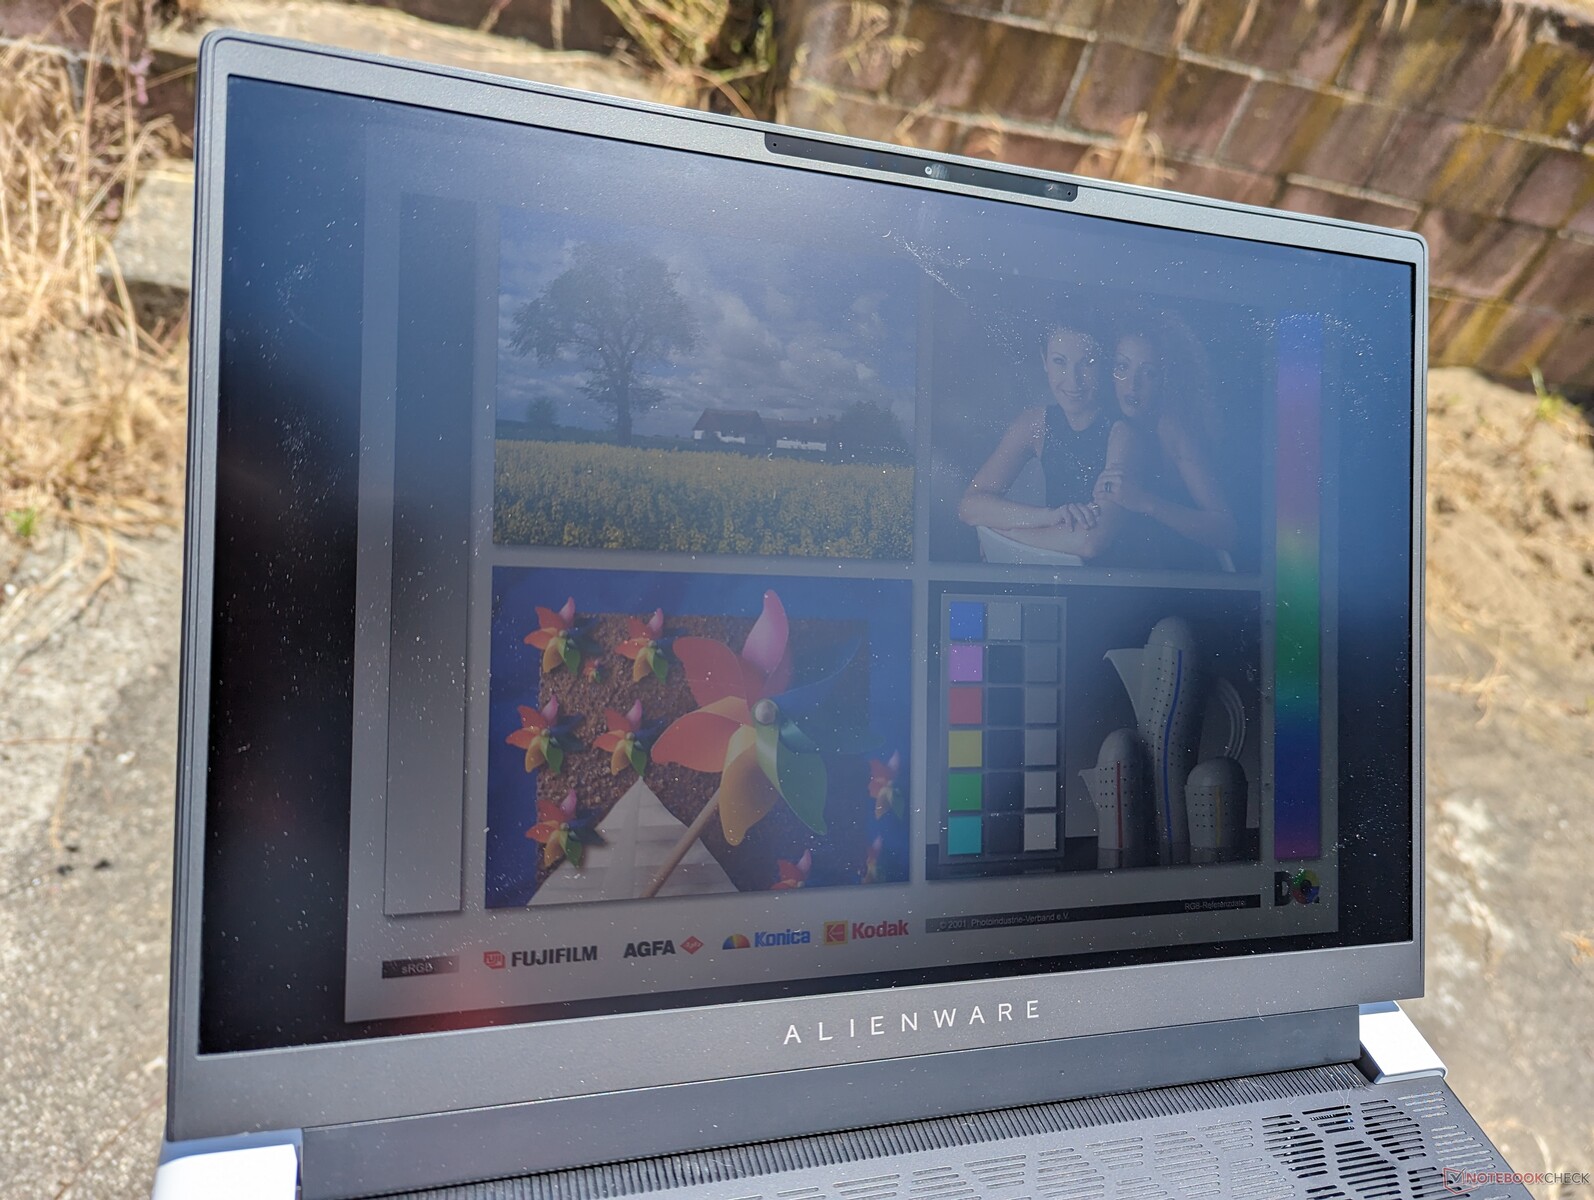
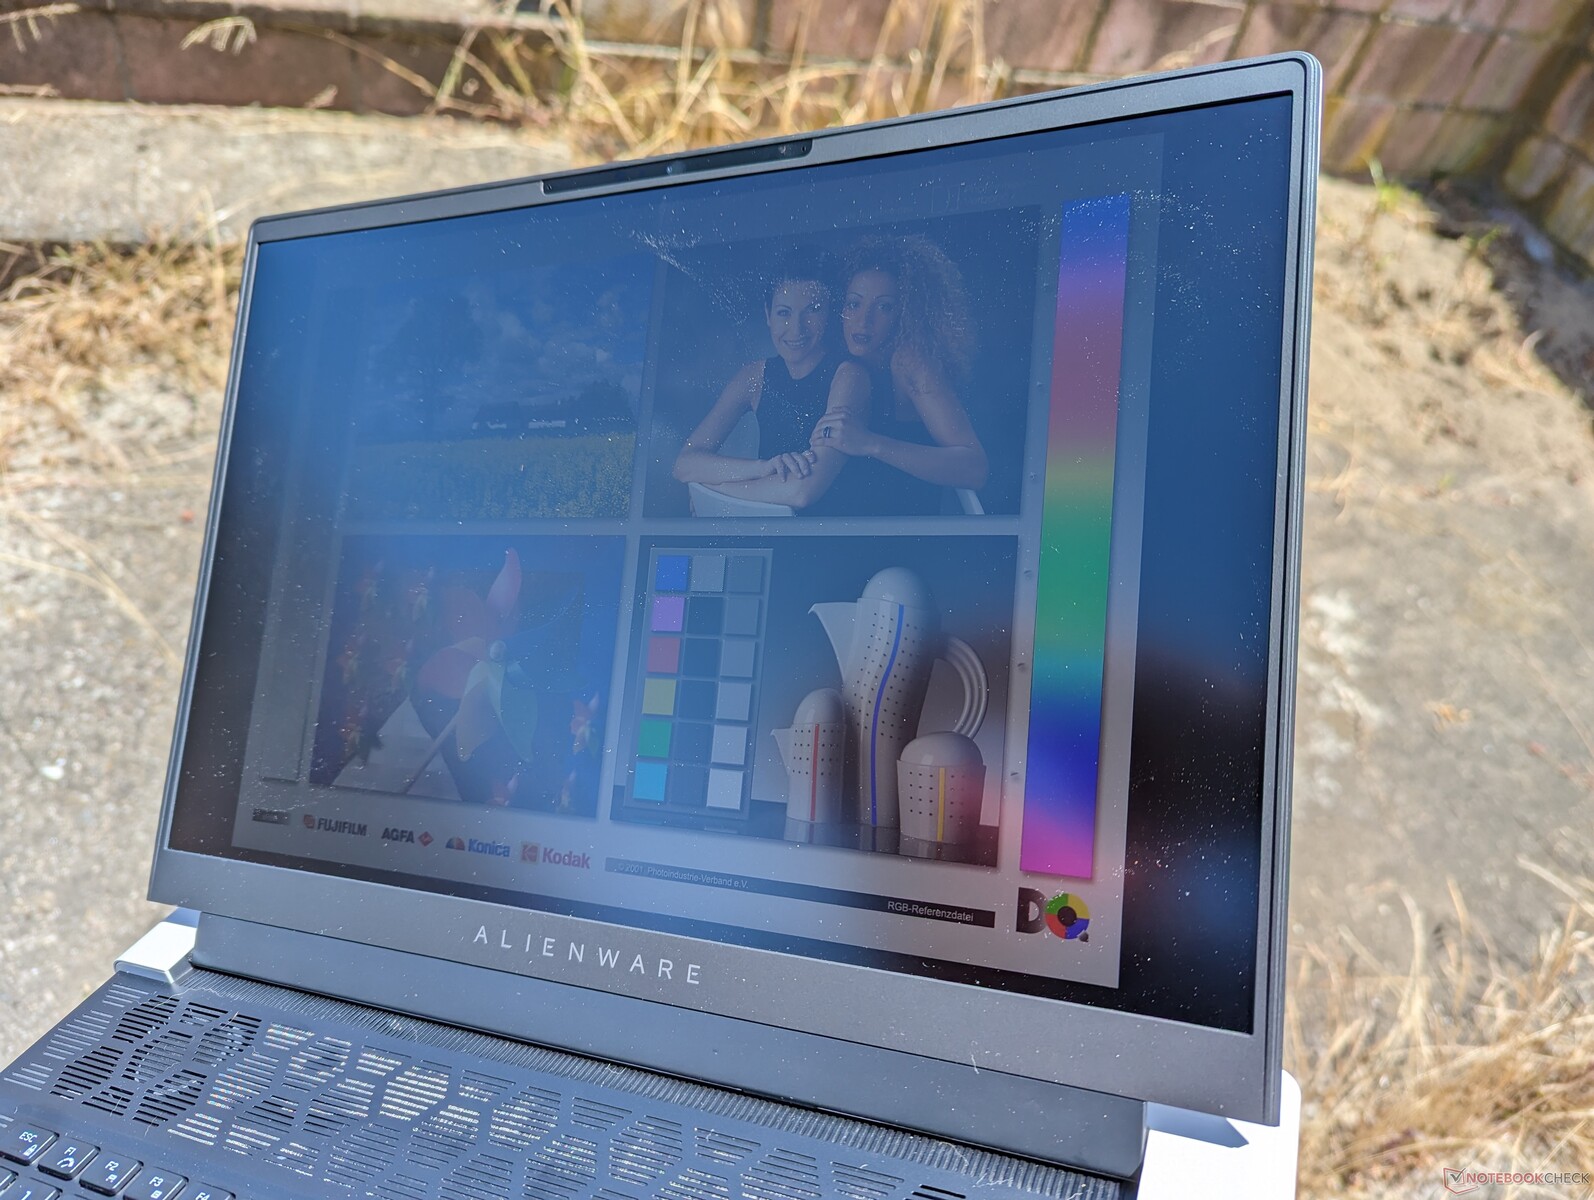
Het zicht naar buiten is niet zo geweldig als op andere 16-inch gaminglaptops zoals deZephyrus M16blade 16 of Legion Pro 7 16, omdat het scherm van de Alienware merkbaar donkerder is. Combineer dit met de relatief grote voetafdruk en de Alienware x16 R1 is zeker geen outdoor-vriendelijke laptop, ondanks het dunne ontwerp van het chassis.
Prestaties - Meh CPU, indrukwekkende GPU
Testomstandigheden
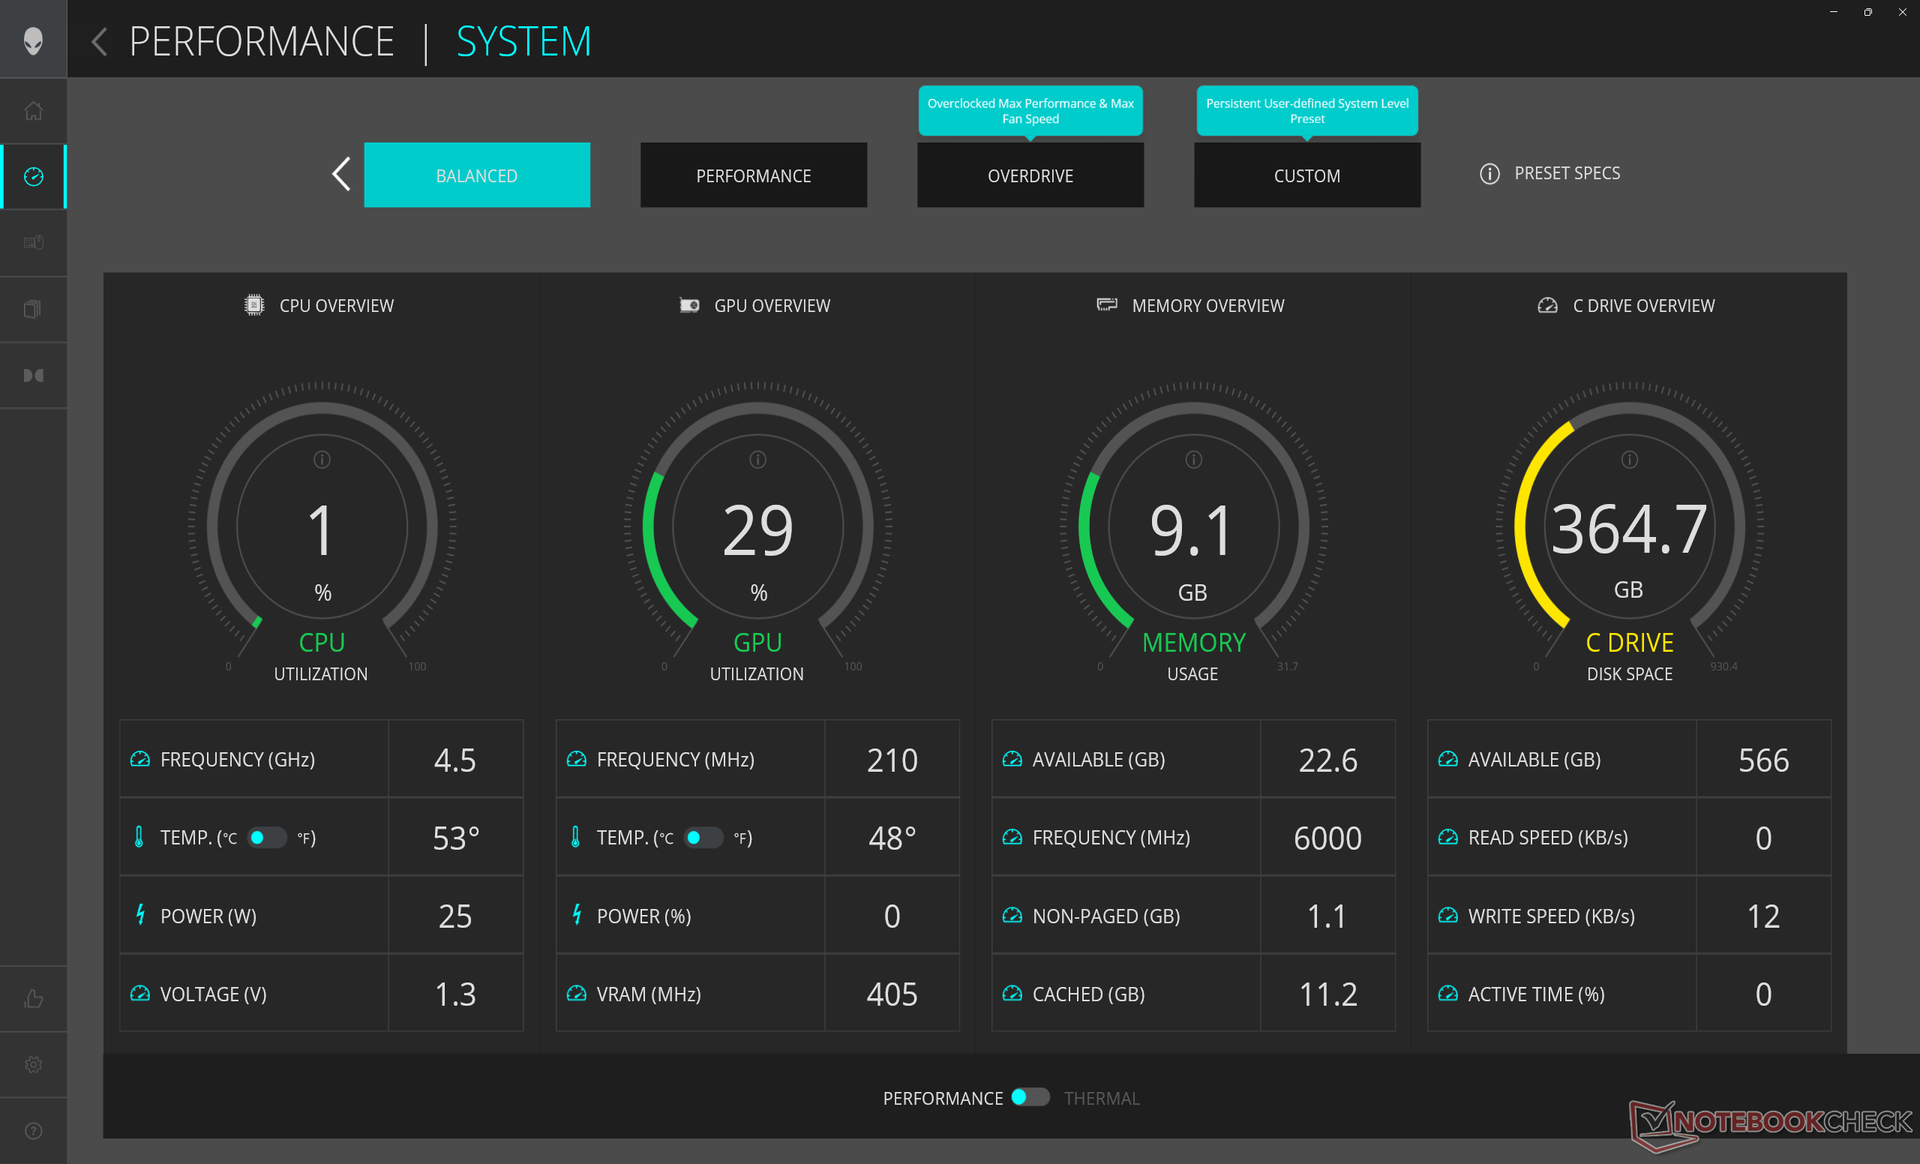
We hebben onze unit ingesteld op Overdrive-modus via Alienware Command Center (ACC) en High Performance-modus via Windows voordat we de onderstaande benchmarks uitvoerden. We hebben er ook voor gezorgd dat de grafische weergave alleen in de dGPU-modus staat in plaats van Optimus via het Nvidia Configuratiescherm. Vervelend genoeg worden de ACC energieprofielen niet gesynchroniseerd met Windows en is het dus mogelijk om tegenstrijdige profielen actief te hebben (d.w.z. de ene ingesteld op Energiebesparing en de andere op Prestaties).
ACC moet niet worden verward met My Alienware. Het eerste is een controlecentrum voor systeemgegevens, RGB-instellingen, energieprofielen en gaming-instellingen, terwijl het tweede een centraal punt is voor Dell-ondersteuning, mobiele connectiviteit en optionele accessoires.
Advanced Optimus of MUX wordt ondersteund op alle SKU's. Houd er rekening mee dat G-Sync actief is voor de interne monitor als deze alleen is ingesteld op de dGPU-modus.
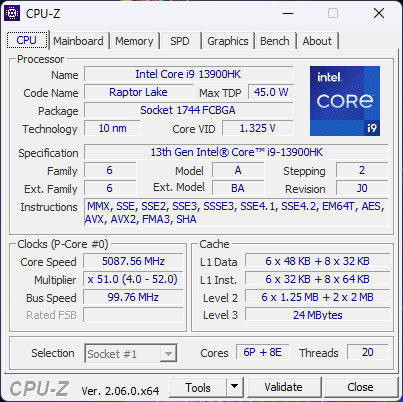
Processor
Het is belangrijk om op te merken dat het model het maximum haalt uit de Core i9-13900HK en niet de Core i9-13900HX de laatste kan 50 tot 60 procent snellere multi-thread prestaties bieden. De algehele prestaties van onze Core i7-13900HK zijn daarom vrijwel identiek aan de goedkopere Core i9-13900H en vergelijkbaar met de concurrerende Ryzen 7 7745HX. Voor snellere prestaties kunnen gamers de dikkere Alienware m16 of Lenovo Legion Pro 7 overwegen, omdat deze geconfigureerd kunnen worden met de Core i7-13900HX.
Downgraden naar de minder dure i7-13620H of i7-13700H configuraties zal naar verwachting de processorprestaties met ongeveer 15 tot 20 procent beïnvloeden, gebaseerd op onze tijd met deMSI Katana 17 en de Dell XPS 17 9730.
Cinebench R15 Multi Loop
Cinebench R20: CPU (Multi Core) | CPU (Single Core)
Cinebench R23: Multi Core | Single Core
Cinebench R15: CPU Multi 64Bit | CPU Single 64Bit
Blender: v2.79 BMW27 CPU
7-Zip 18.03: 7z b 4 | 7z b 4 -mmt1
Geekbench 5.5: Multi-Core | Single-Core
HWBOT x265 Benchmark v2.2: 4k Preset
LibreOffice : 20 Documents To PDF
R Benchmark 2.5: Overall mean
* ... kleiner is beter
AIDA64: FP32 Ray-Trace | FPU Julia | CPU SHA3 | CPU Queen | FPU SinJulia | FPU Mandel | CPU AES | CPU ZLib | FP64 Ray-Trace | CPU PhotoWorxx
| Performance rating | |
| Lenovo Legion Pro 7 RTX4090 | |
| Razer Blade 16 Early 2023 | |
| Asus ROG Zephyrus M16 GU604VY-NM042X | |
| Alienware x16 R1 | |
| Alienware m17 R5 (R9 6900HX, RX 6850M XT) | |
| Dell G16 7620 | |
| Gemiddeld Intel Core i9-13900HK | |
| AIDA64 / FP32 Ray-Trace | |
| Lenovo Legion Pro 7 RTX4090 | |
| Razer Blade 16 Early 2023 | |
| Razer Blade 16 Early 2023 | |
| Razer Blade 16 Early 2023 | |
| Asus ROG Zephyrus M16 GU604VY-NM042X | |
| Alienware x16 R1 | |
| Alienware m17 R5 (R9 6900HX, RX 6850M XT) | |
| Gemiddeld Intel Core i9-13900HK (12351 - 18326, n=4) | |
| Dell G16 7620 | |
| AIDA64 / CPU Queen | |
| Lenovo Legion Pro 7 RTX4090 | |
| Razer Blade 16 Early 2023 | |
| Razer Blade 16 Early 2023 | |
| Asus ROG Zephyrus M16 GU604VY-NM042X | |
| Alienware x16 R1 | |
| Alienware m17 R5 (R9 6900HX, RX 6850M XT) | |
| Dell G16 7620 | |
| Gemiddeld Intel Core i9-13900HK (75615 - 118166, n=4) | |
| AIDA64 / FP64 Ray-Trace | |
| Lenovo Legion Pro 7 RTX4090 | |
| Razer Blade 16 Early 2023 | |
| Razer Blade 16 Early 2023 | |
| Razer Blade 16 Early 2023 | |
| Asus ROG Zephyrus M16 GU604VY-NM042X | |
| Alienware x16 R1 | |
| Alienware m17 R5 (R9 6900HX, RX 6850M XT) | |
| Gemiddeld Intel Core i9-13900HK (6839 - 10018, n=4) | |
| Dell G16 7620 | |
| AIDA64 / CPU PhotoWorxx | |
| Razer Blade 16 Early 2023 | |
| Razer Blade 16 Early 2023 | |
| Razer Blade 16 Early 2023 | |
| Lenovo Legion Pro 7 RTX4090 | |
| Alienware x16 R1 | |
| Asus ROG Zephyrus M16 GU604VY-NM042X | |
| Dell G16 7620 | |
| Gemiddeld Intel Core i9-13900HK (15421 - 49539, n=4) | |
| Alienware m17 R5 (R9 6900HX, RX 6850M XT) | |
Systeemprestaties
CrossMark: Overall | Productivity | Creativity | Responsiveness
| PCMark 10 / Score | |
| Alienware x16 R1 | |
| Gemiddeld Intel Core i9-13900HK, NVIDIA GeForce RTX 4080 Laptop GPU (n=1) | |
| Asus ROG Zephyrus M16 GU604VY-NM042X | |
| Lenovo Legion Pro 7 RTX4090 | |
| Razer Blade 16 Early 2023 | |
| Alienware m17 R5 (R9 6900HX, RX 6850M XT) | |
| Dell G16 7620 | |
| PCMark 10 / Essentials | |
| Asus ROG Zephyrus M16 GU604VY-NM042X | |
| Alienware x16 R1 | |
| Gemiddeld Intel Core i9-13900HK, NVIDIA GeForce RTX 4080 Laptop GPU (n=1) | |
| Lenovo Legion Pro 7 RTX4090 | |
| Razer Blade 16 Early 2023 | |
| Dell G16 7620 | |
| Alienware m17 R5 (R9 6900HX, RX 6850M XT) | |
| PCMark 10 / Productivity | |
| Asus ROG Zephyrus M16 GU604VY-NM042X | |
| Alienware x16 R1 | |
| Gemiddeld Intel Core i9-13900HK, NVIDIA GeForce RTX 4080 Laptop GPU (n=1) | |
| Alienware m17 R5 (R9 6900HX, RX 6850M XT) | |
| Lenovo Legion Pro 7 RTX4090 | |
| Dell G16 7620 | |
| Razer Blade 16 Early 2023 | |
| PCMark 10 / Digital Content Creation | |
| Lenovo Legion Pro 7 RTX4090 | |
| Razer Blade 16 Early 2023 | |
| Alienware x16 R1 | |
| Gemiddeld Intel Core i9-13900HK, NVIDIA GeForce RTX 4080 Laptop GPU (n=1) | |
| Asus ROG Zephyrus M16 GU604VY-NM042X | |
| Alienware m17 R5 (R9 6900HX, RX 6850M XT) | |
| Dell G16 7620 | |
| CrossMark / Overall | |
| Asus ROG Zephyrus M16 GU604VY-NM042X | |
| Alienware x16 R1 | |
| Gemiddeld Intel Core i9-13900HK, NVIDIA GeForce RTX 4080 Laptop GPU (n=1) | |
| Dell G16 7620 | |
| Alienware m17 R5 (R9 6900HX, RX 6850M XT) | |
| Razer Blade 16 Early 2023 | |
| CrossMark / Productivity | |
| Asus ROG Zephyrus M16 GU604VY-NM042X | |
| Alienware x16 R1 | |
| Gemiddeld Intel Core i9-13900HK, NVIDIA GeForce RTX 4080 Laptop GPU (n=1) | |
| Dell G16 7620 | |
| Alienware m17 R5 (R9 6900HX, RX 6850M XT) | |
| Razer Blade 16 Early 2023 | |
| CrossMark / Creativity | |
| Asus ROG Zephyrus M16 GU604VY-NM042X | |
| Alienware x16 R1 | |
| Gemiddeld Intel Core i9-13900HK, NVIDIA GeForce RTX 4080 Laptop GPU (n=1) | |
| Dell G16 7620 | |
| Razer Blade 16 Early 2023 | |
| Alienware m17 R5 (R9 6900HX, RX 6850M XT) | |
| CrossMark / Responsiveness | |
| Alienware x16 R1 | |
| Gemiddeld Intel Core i9-13900HK, NVIDIA GeForce RTX 4080 Laptop GPU (n=1) | |
| Asus ROG Zephyrus M16 GU604VY-NM042X | |
| Dell G16 7620 | |
| Razer Blade 16 Early 2023 | |
| Alienware m17 R5 (R9 6900HX, RX 6850M XT) | |
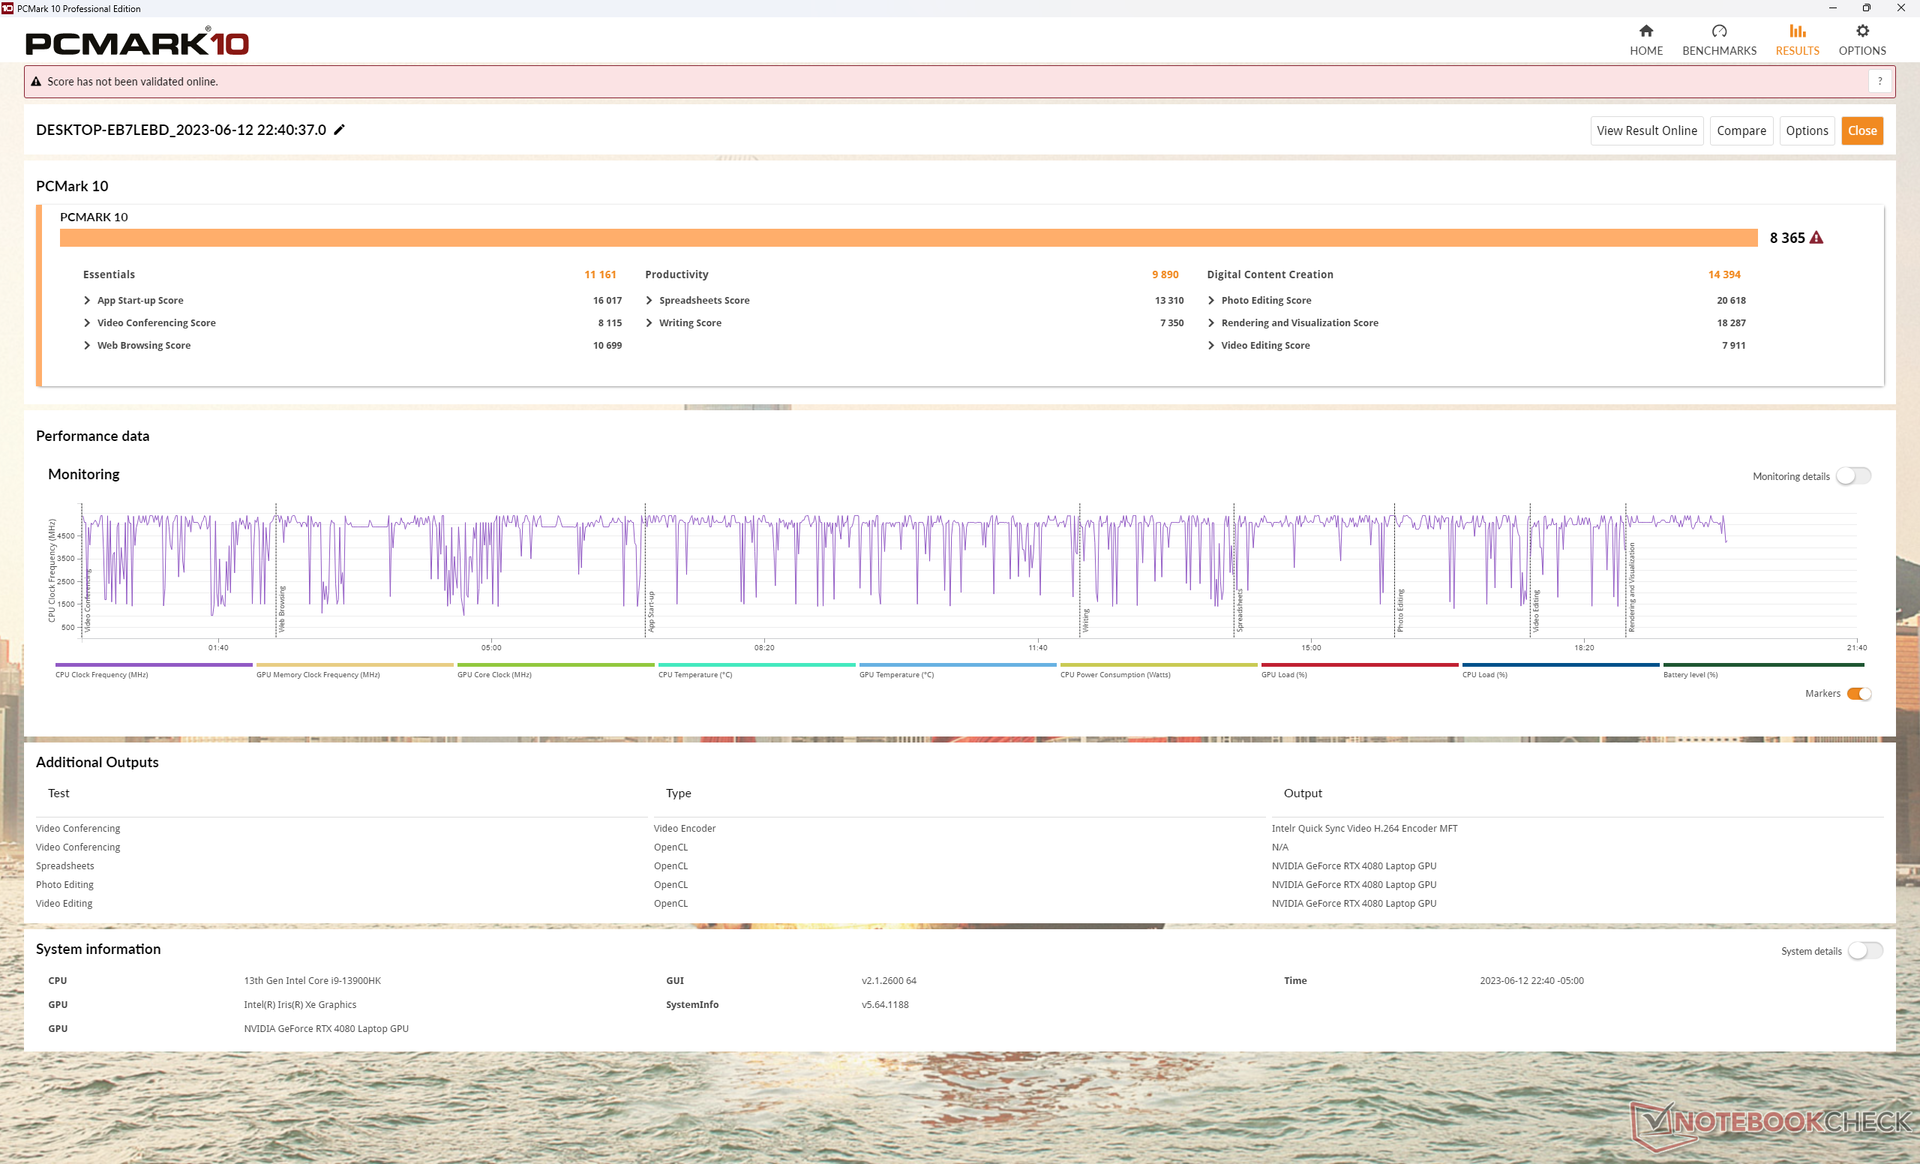
| PCMark 10 Score | 8365 punten | |
Help | ||
| AIDA64 / Memory Latency | |
| Alienware x16 R1 | |
| Dell G16 7620 | |
| Razer Blade 16 Early 2023 | |
| Razer Blade 16 Early 2023 | |
| Razer Blade 16 Early 2023 | |
| Gemiddeld Intel Core i9-13900HK (83 - 115.3, n=4) | |
| Alienware m17 R5 (R9 6900HX, RX 6850M XT) | |
| Asus ROG Zephyrus M16 GU604VY-NM042X | |
| Lenovo Legion Pro 7 RTX4090 | |
* ... kleiner is beter
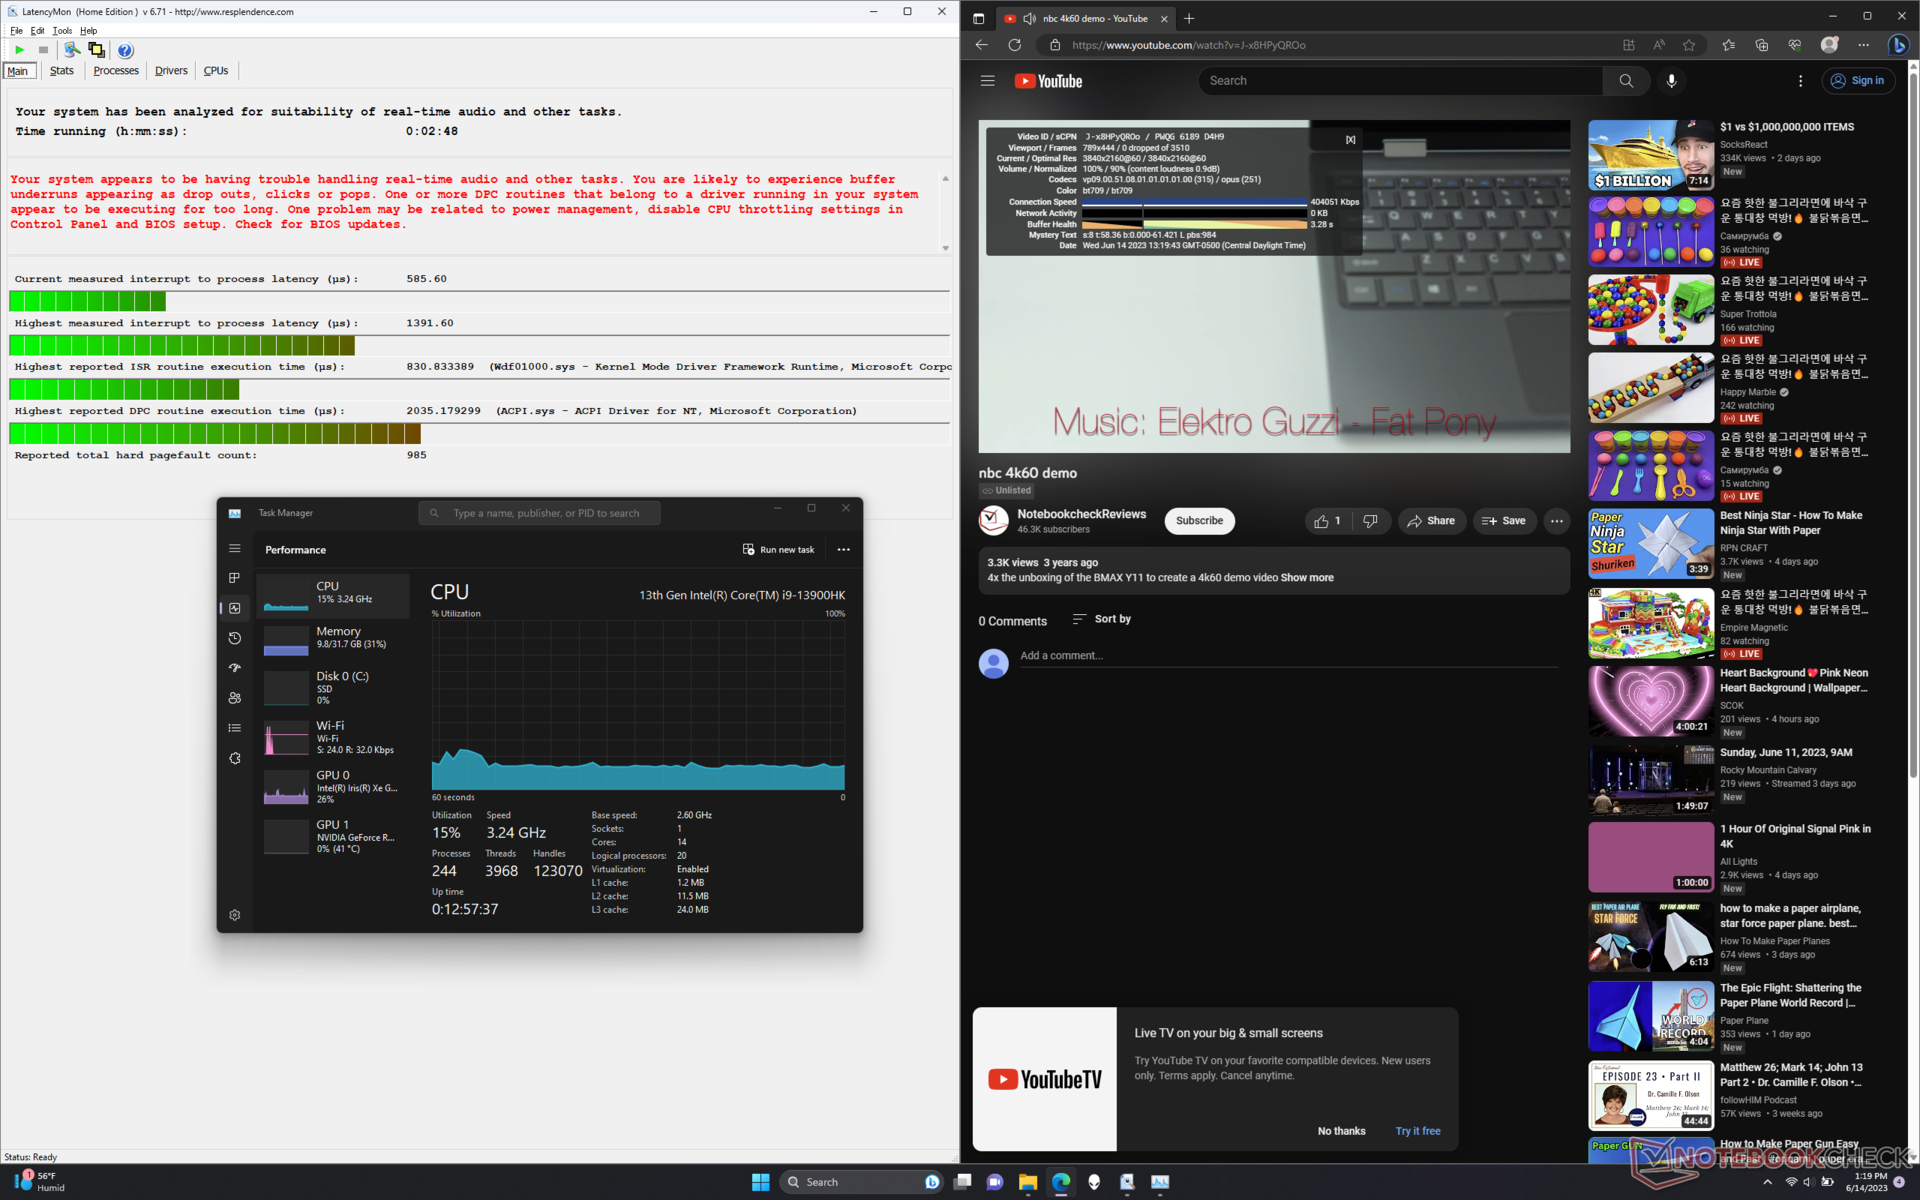
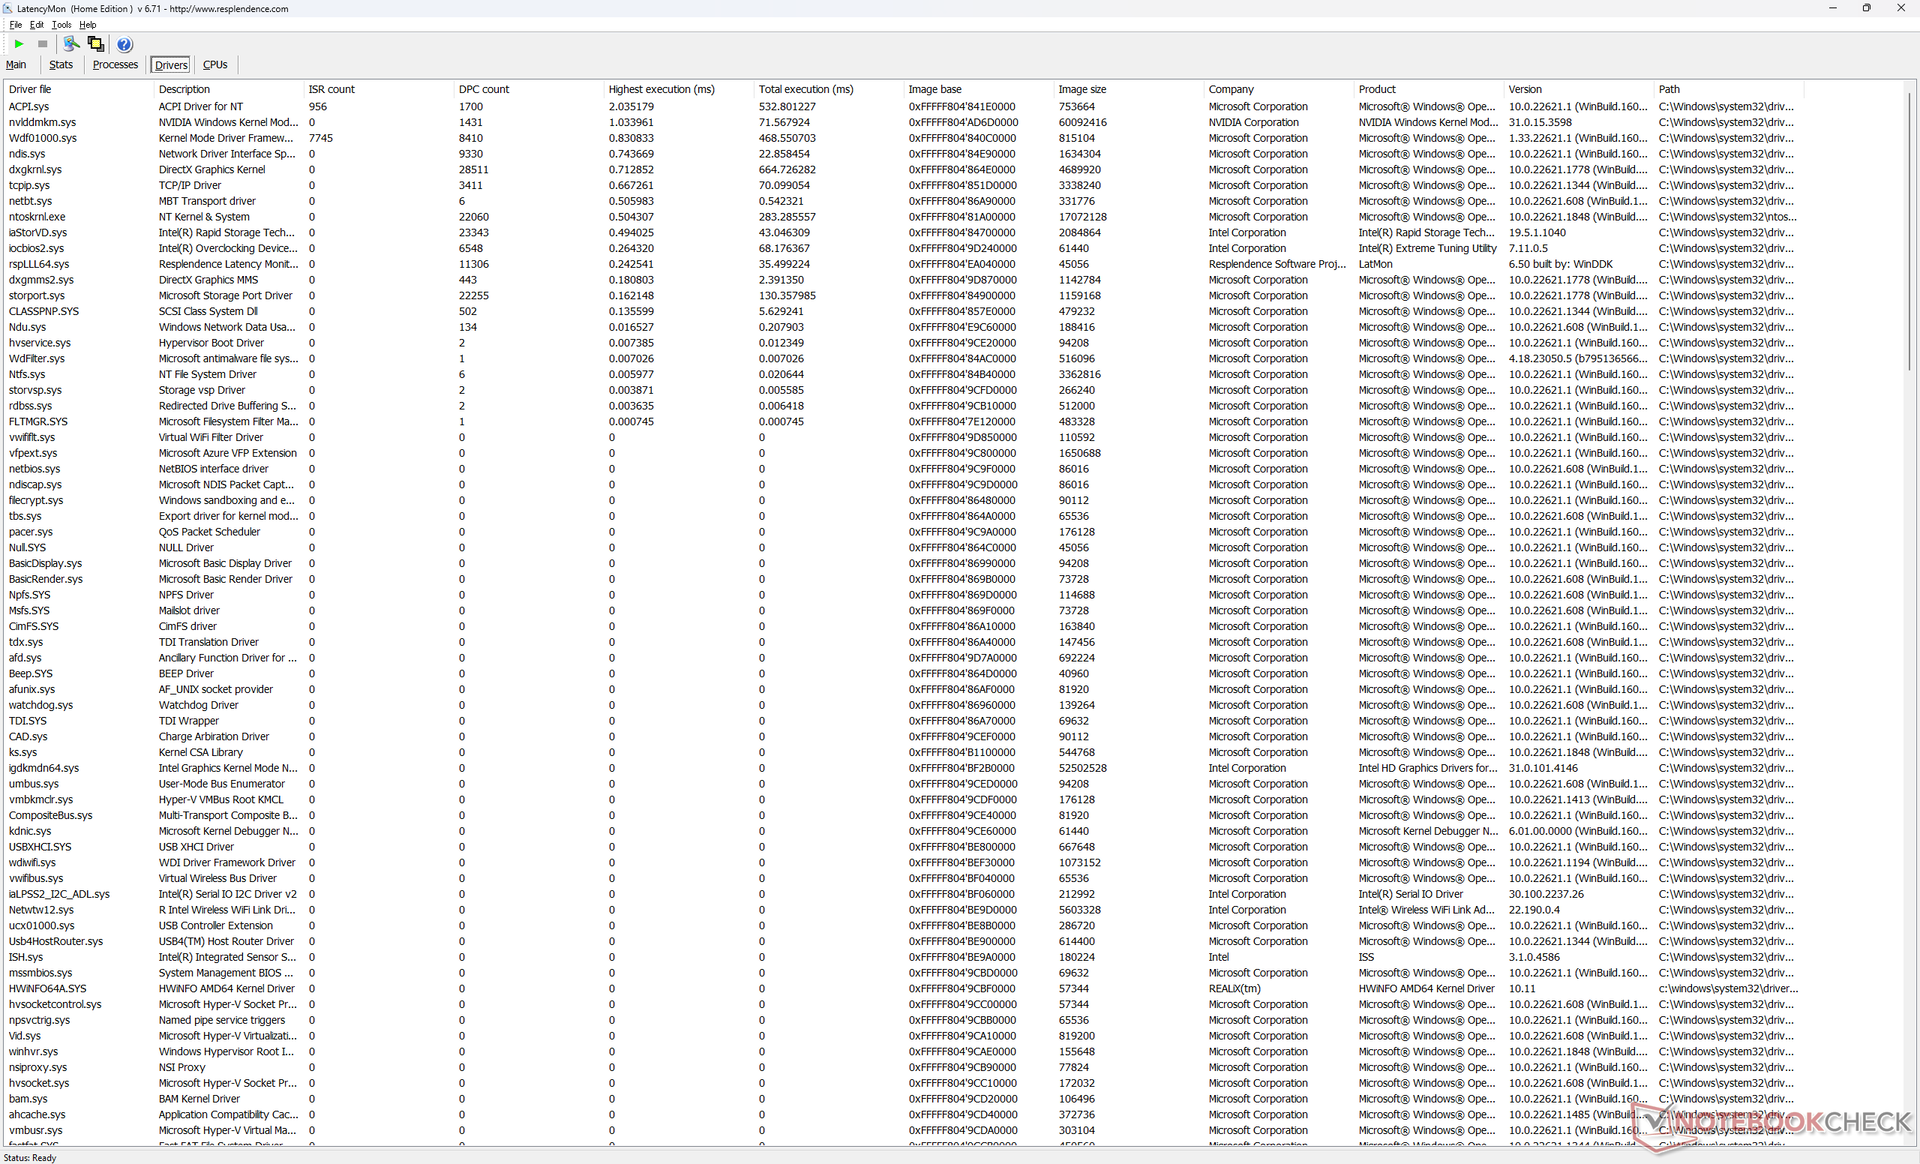
DPC latentie
LatencyMon onthult DPC-problemen bij het openen van meerdere browsertabbladen van onze startpagina. het afspelen van 4K-video's met 60 FPS is verder perfect zonder dropped frames.
| DPC Latencies / LatencyMon - interrupt to process latency (max), Web, Youtube, Prime95 | |
| Lenovo Legion Pro 7 RTX4090 | |
| Asus ROG Zephyrus M16 GU604VY-NM042X | |
| Razer Blade 16 Early 2023 | |
| Alienware x16 R1 | |
| Alienware m17 R5 (R9 6900HX, RX 6850M XT) | |
| Dell G16 7620 | |
* ... kleiner is beter
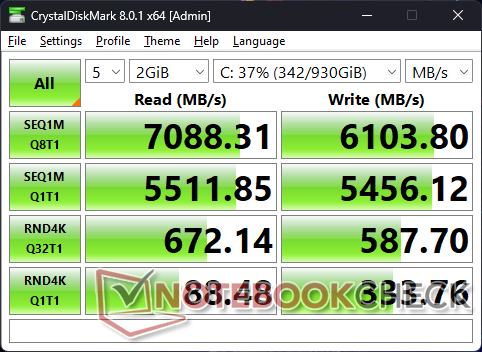
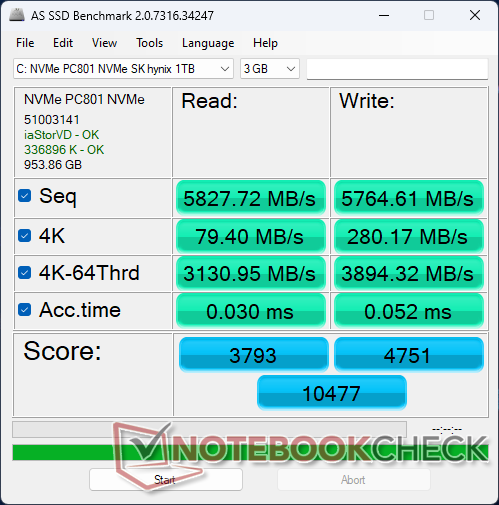
Opslagapparaten
De PCIe4 x4 SK Hynix PC801 schijf in onze unit kan leessnelheden tot 7100 MB/s bereiken en is daarmee vergelijkbaar met de populaire Samsung PM9A1. Helaas heeft de schijf problemen om zijn maximale overdrachtsnelheid gedurende langere perioden te behouden, waarschijnlijk door onvoldoende koeling. Bij het uitvoeren van DiskSpd in een lus, bijvoorbeeld, daalden de leessnelheden tot wel 3400 MB/s na slechts een paar minuten in de stresstest, zoals de grafiek hieronder laat zien. De resultaten verbeterden niet na herhaalde tests.

| Drive Performance rating - Percent | |
| Alienware x16 R1 | |
| Lenovo Legion Pro 7 RTX4090 | |
| Dell G16 7620 | |
| Asus ROG Zephyrus M16 GU604VY-NM042X | |
| Razer Blade 16 Early 2023 | |
| Alienware m17 R5 (R9 6900HX, RX 6850M XT) | |
* ... kleiner is beter
Disk Throttling: DiskSpd Read Loop, Queue Depth 8
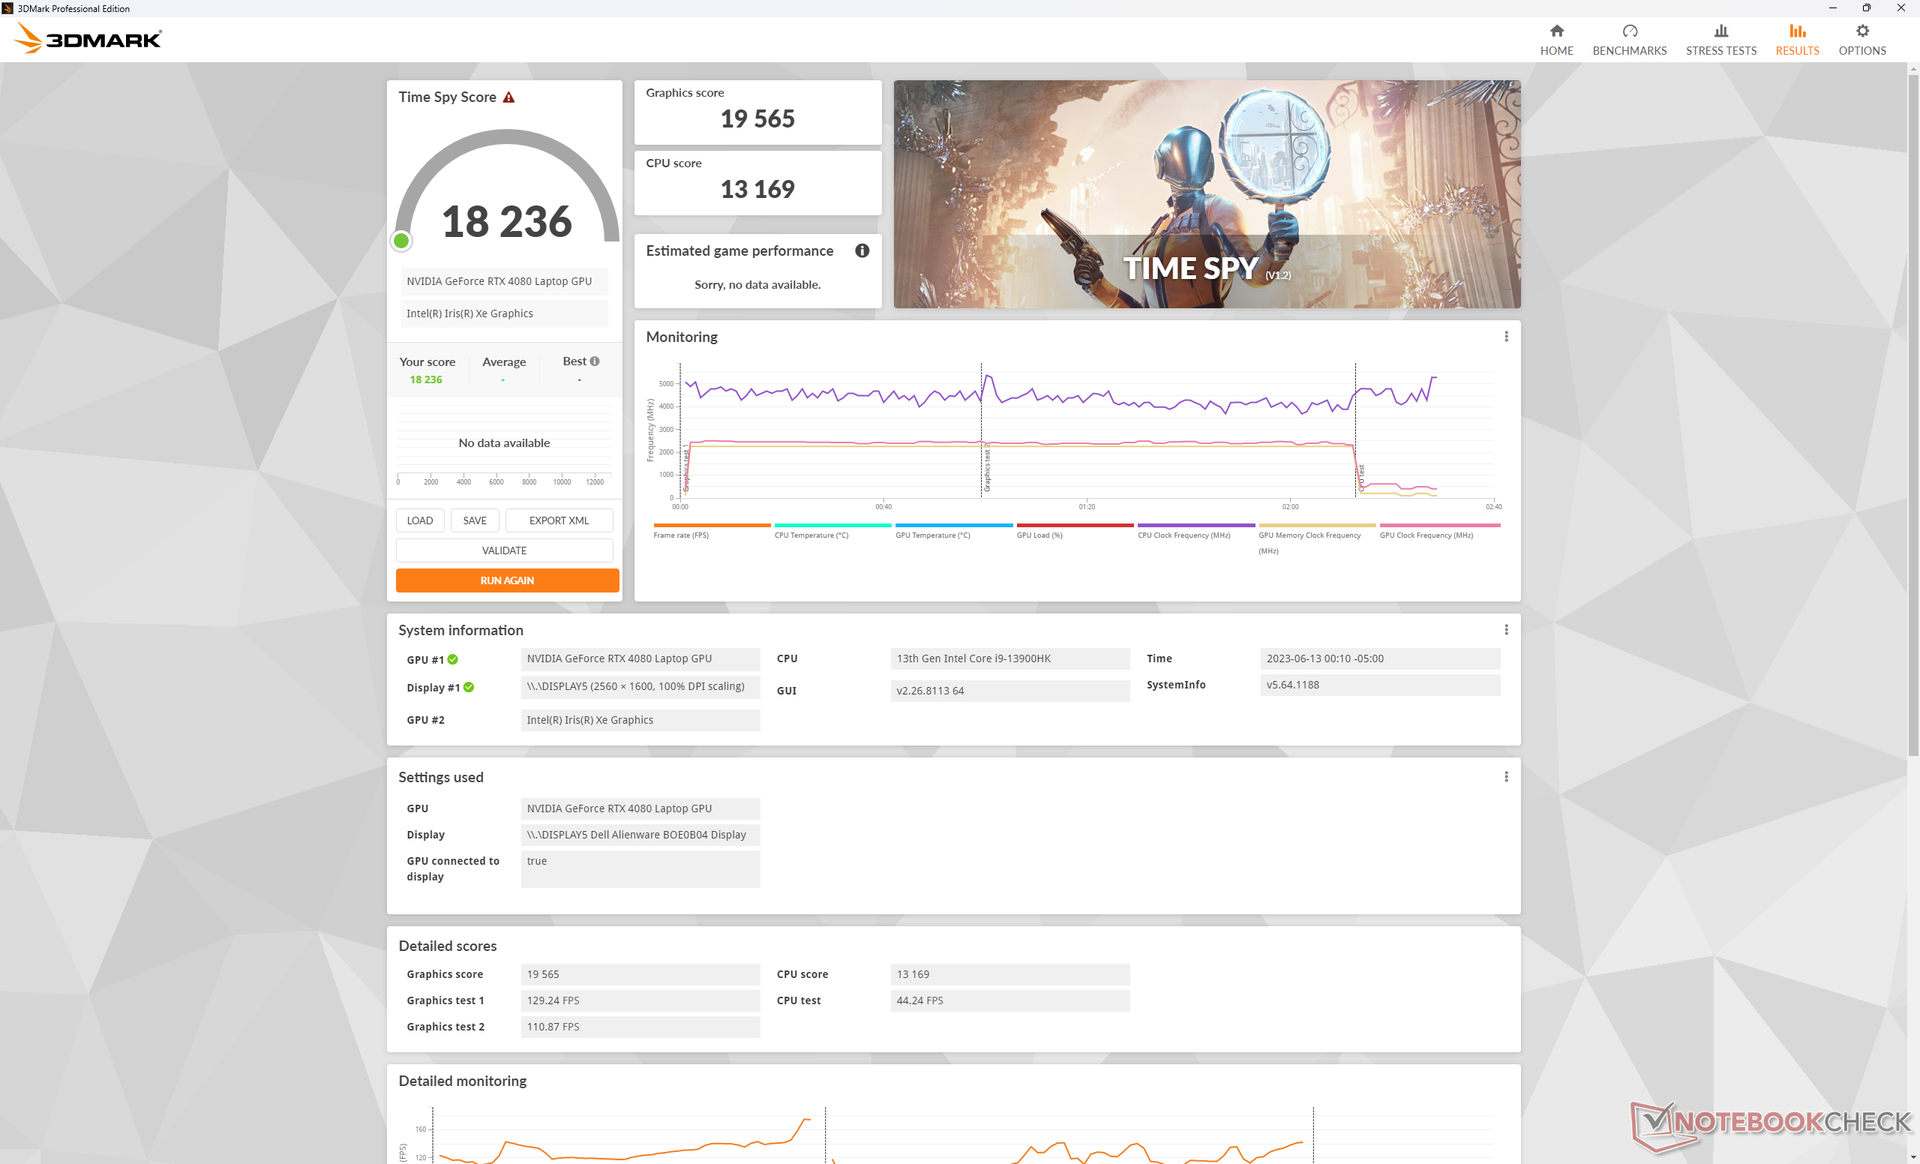
GPU-prestaties - 175 W GeForce RTX 4080
De GeForce RTX 4080 in onze Alienware x16 is ongeveer 5 tot 10 procent sneller dan de gemiddelde laptop in onze database die is uitgerust met dezelfde RTX 4080 GPU. Het voordeel lijkt misschien niet veel, maar het is genoeg om het systeem tot een van de snelste RTX 4080 gaming laptops te maken die je kunt kopen. 3DMark resultaten liggen slechts binnen 10 procent van de RTX 4090 in deasus Zephyrus Duo 16bijvoorbeeld.
Interessant is dat 3DMark-scores met slechts een paar procentpunten daalden wanneer ze werden uitgevoerd in de stillere modi Performance en Balanced in plaats van in de hoogste modus Overdrive, zoals blijkt uit de onderstaande tabel. Dit is belangrijk om in gedachten te houden voor de Stress Test en Systeemgeluid secties hieronder.
Downgraden naar de RTX 4070 optie zal naar verwachting de prestaties met 30 tot 35 procent beïnvloeden, terwijl upgraden naar de RTX 4090 de prestaties met ongeveer 10 procent zal verbeteren.
| Instelling energieprofiel | Fire Strike Fysieke score | Fire Strike GPU Score | Fire Strike Gecombineerde score |
| Overdrive | 29857 | 43478 | 13071 |
| Prestaties | 27890 (-7%) | 43605 (-0%) | 12961 (-1%) |
| Uitgebalanceerd | 28704 (-4%) | 41909 (-4%) | 12476 (-5%) |
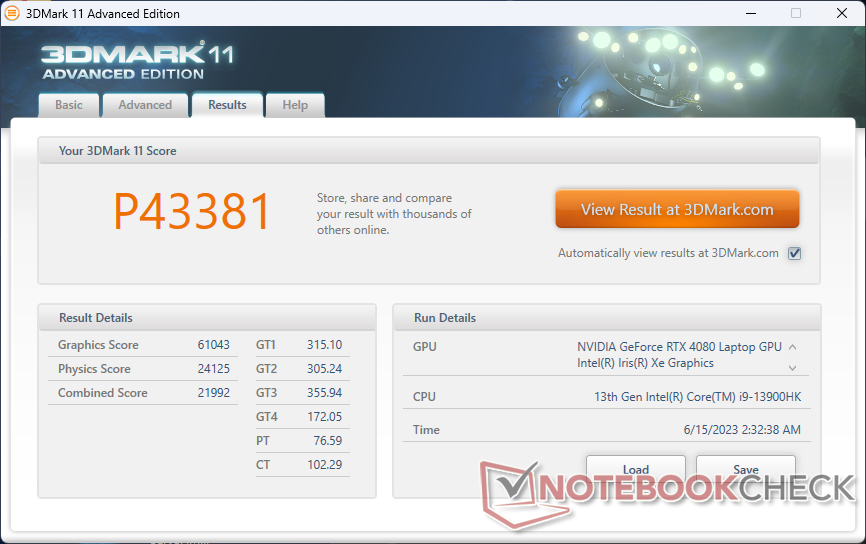
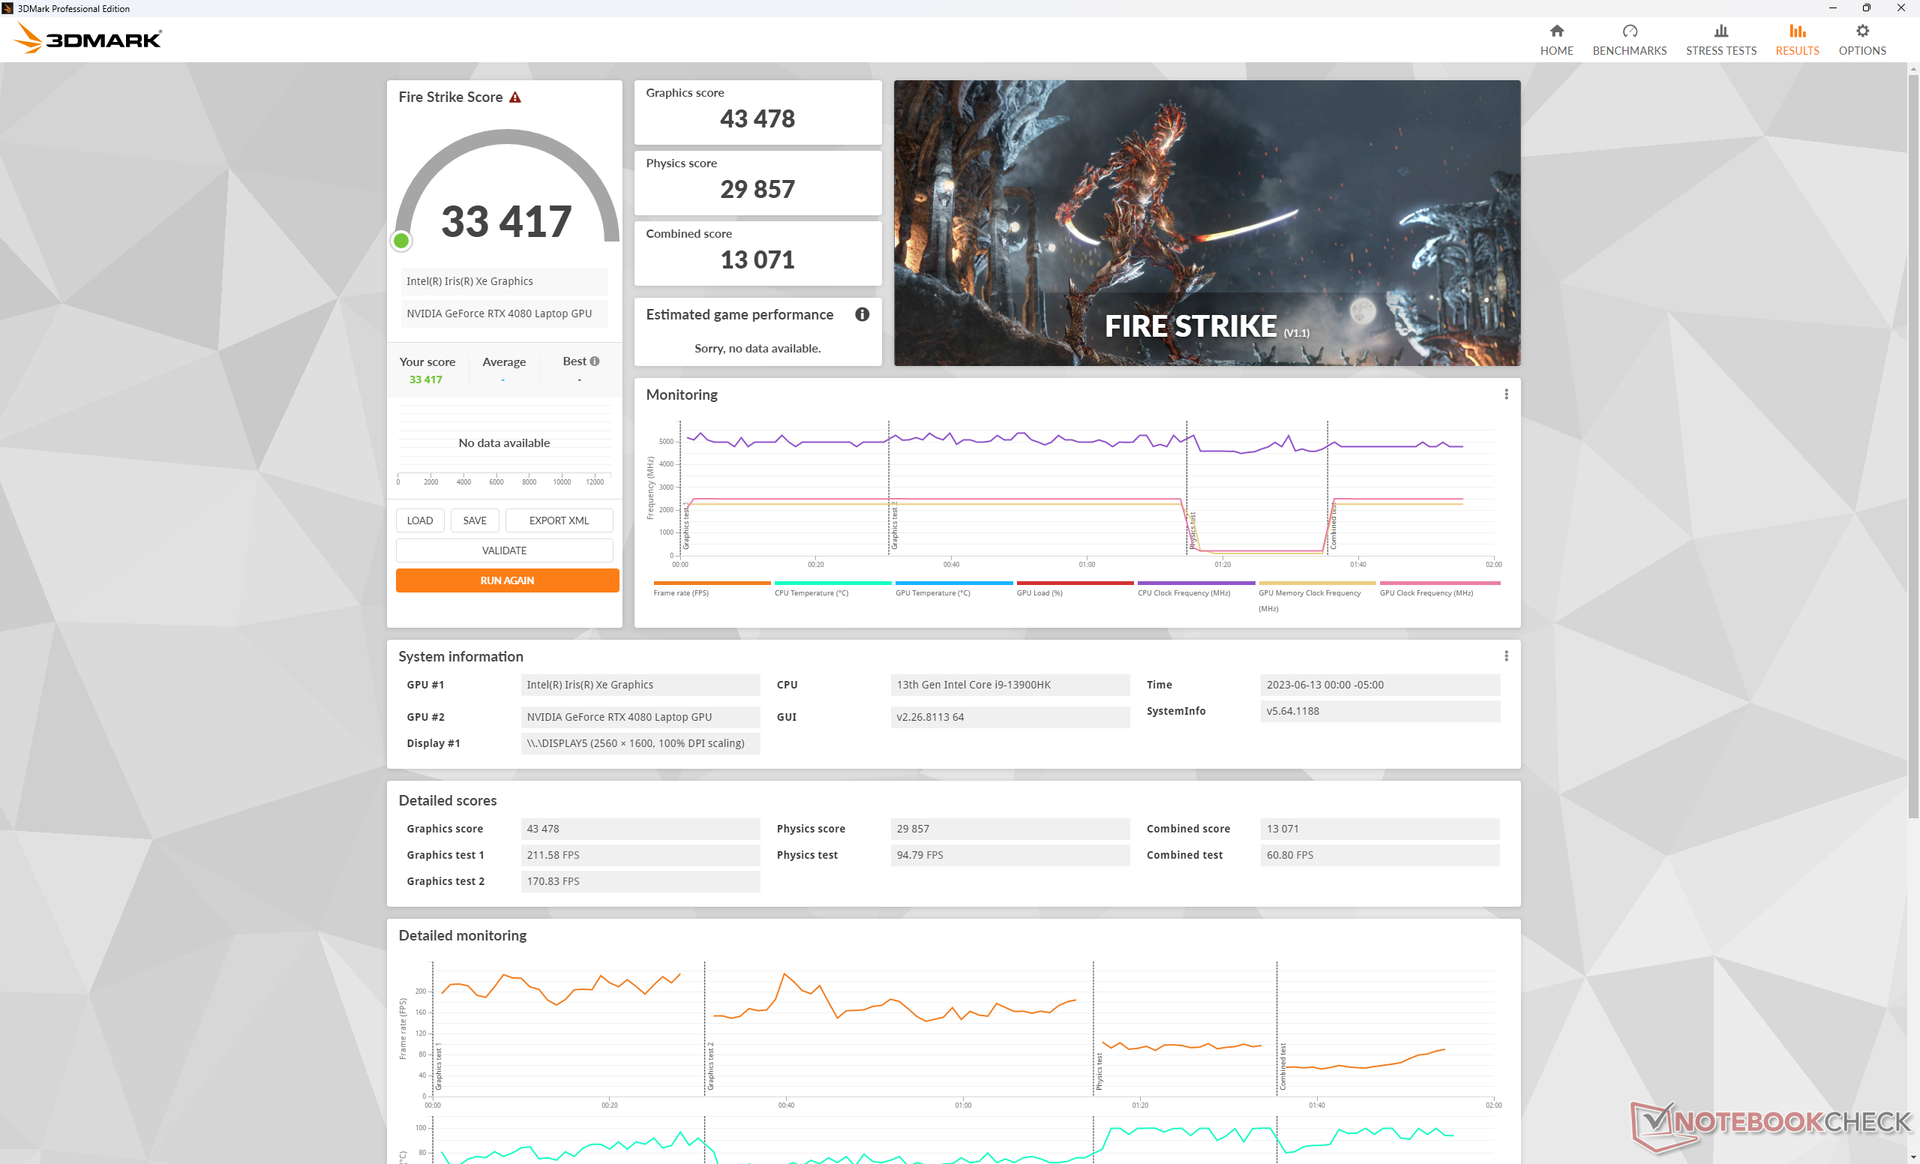
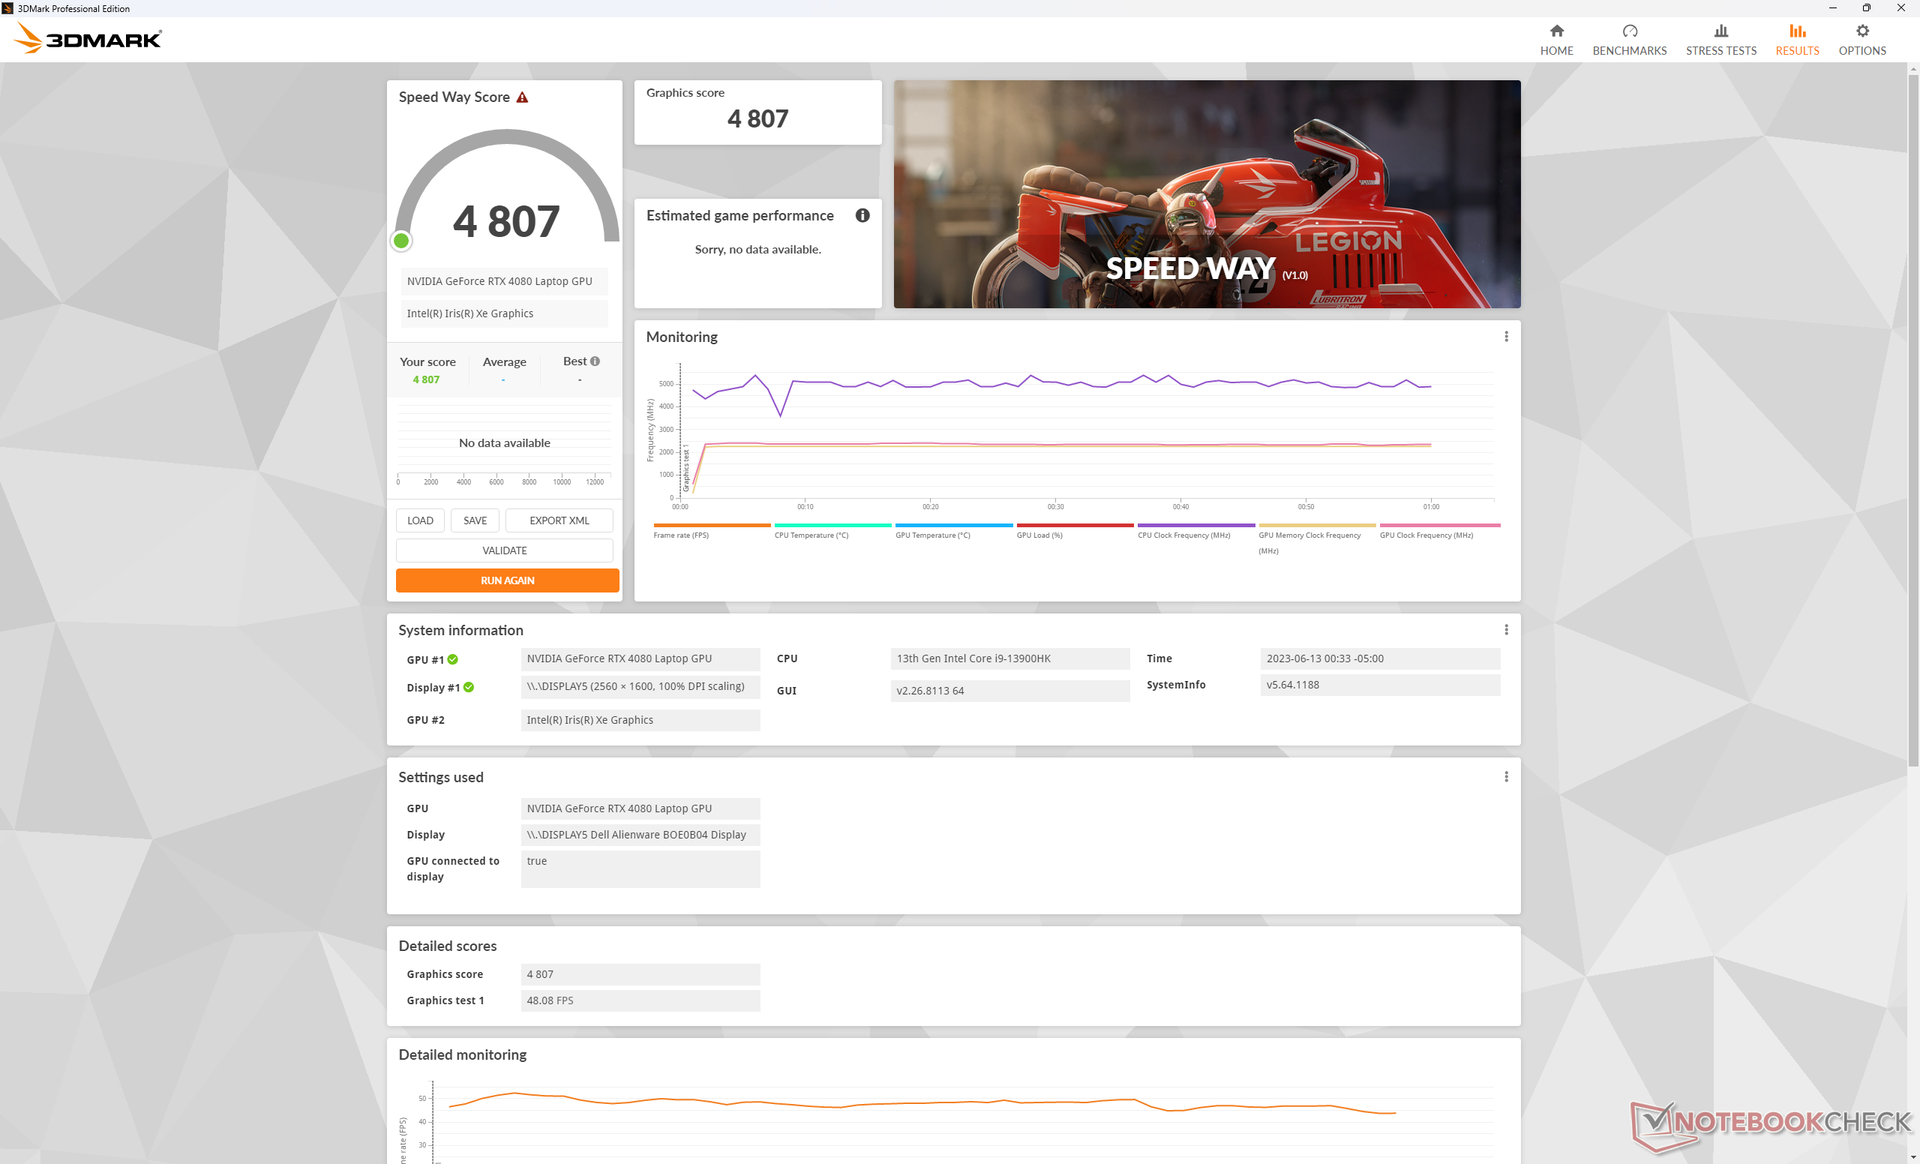
| 3DMark 11 Performance | 43381 punten | |
| 3DMark Fire Strike Score | 33417 punten | |
| 3DMark Time Spy Score | 18236 punten | |
Help | ||
* ... kleiner is beter
Spelprestaties
Alle games zijn speelbaar op de native QHD+ resolutie met stabiele framerates op of boven 60 FPS. Zelfs 4K gaming is mogelijk op een externe monitor met de meeste instellingen op hoog tot maximaal, inclusief Returnal en F122. Voor framerates met drie cijfers wil je echter DLSS 2 of DLSS 3 inschakelen waar beschikbaar om de hoge verversingssnelheid van de monitor beter te benutten.
Witcher 3 FPS Chart
| lage | gem. | hoge | ultra | QHD | 4K | |
|---|---|---|---|---|---|---|
| GTA V (2015) | 185.8 | 180.4 | 176.4 | 120.3 | 115.4 | 142.9 |
| The Witcher 3 (2015) | 425.6 | 352.7 | 306.5 | 160.2 | 115 | |
| Dota 2 Reborn (2015) | 178.8 | 164 | 159.7 | 146.8 | 129.4 | |
| Final Fantasy XV Benchmark (2018) | 211 | 195.5 | 164.2 | 132.4 | 76.2 | |
| X-Plane 11.11 (2018) | 145.3 | 134.5 | 104.2 | 90.5 | ||
| Strange Brigade (2018) | 469 | 373 | 350 | 325 | 237 | 120.5 |
| Shadow of the Tomb Raider (2018) | 165 | 143 | 84 | |||
| Far Cry 6 (2021) | 121 | 112 | 73 | |||
| Cyberpunk 2077 1.6 (2022) | 158 | 150.9 | 141.2 | 133.6 | 84.4 | 38.5 |
| Tiny Tina's Wonderlands (2022) | 256.6 | 217.3 | 183.3 | 156.4 | 111.1 | 58.6 |
| F1 22 (2022) | 265 | 259 | 244 | 110 | 79 | 39 |
| Call of Duty Modern Warfare 2 2022 (2022) | 139 | 110 | 67 | |||
| Returnal (2023) | 116 | 117 | 114 | 109 | 79 | 43 |
Uitstoot
Systeemgeluid - Veel vermogensprofielopties
Ventilator geluid is direct gekoppeld aan de ACC energie profiel instellingen. Als je niet aan het gamen bent, is het aan te raden om ACC in te stellen op Gebalanceerde modus of Stille modus, omdat de ventilatoren veel vaker pulseren als ze in de modus Prestaties of Overdrive staan.
Draaien Witcher 3 in de modus Prestaties en Overdrive resulteert in een ventilatorgeluid van respectievelijk 50 dB(A) en 55 dB(A). Aangezien het framerateverlies minimaal is tussen de modi Prestaties en Overdrive, zoals hierboven vermeld in het gedeelte over GPU-prestaties, kun je een merkbaar stillere game-ervaring hebben in de modus Prestaties. Ventilatorgeluid zou zelfs nog stiller zijn in de Gebalanceerde modus zonder dat dit een significante invloed heeft op framerates. 50+ dB(A) is natuurlijk nog steeds erg luid, maar dat is niettemin een gangbaar bereik op concurrerende modellen zoals de Lenovo Legion Pro 7 of Razer Blade 16.
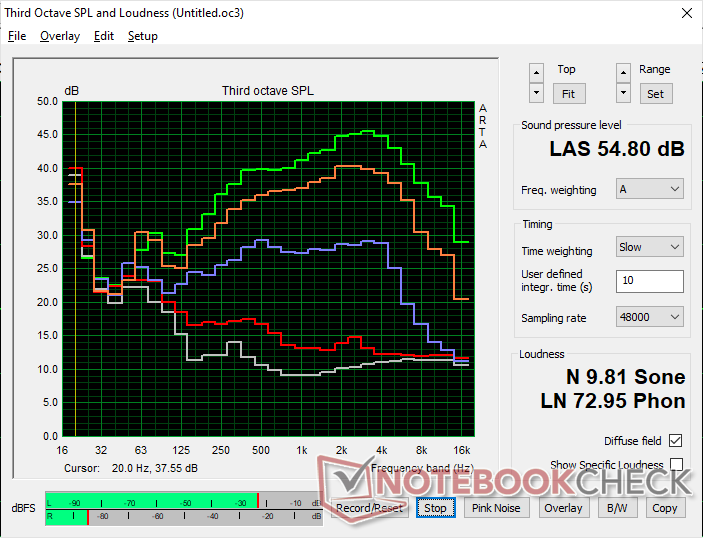
Geluidsniveau
| Onbelast |
| 23.1 / 25.8 / 25.8 dB (A) |
| Belasting |
| 39.3 / 54.8 dB (A) |
 | ||
30 dB stil 40 dB(A) hoorbaar 50 dB(A) luid |
||
min: | ||
| Alienware x16 R1 GeForce RTX 4080 Laptop GPU, i9-13900HK, SK hynix PC801 HFS001TEJ9X101N | Lenovo Legion Pro 7 RTX4090 GeForce RTX 4090 Laptop GPU, i9-13900HX, Samsung PM9A1 MZVL21T0HCLR | Asus ROG Zephyrus M16 GU604VY-NM042X GeForce RTX 4090 Laptop GPU, i9-13900H, Samsung PM9A1 MZVL22T0HBLB | Razer Blade 16 Early 2023 GeForce RTX 4080 Laptop GPU, i9-13950HX, SSSTC CA6-8D1024 | Dell G16 7620 GeForce RTX 3060 Laptop GPU, i7-12700H, WDC PC SN810 512GB | Alienware m17 R5 (R9 6900HX, RX 6850M XT) Radeon RX 6850M XT, R9 6900HX, SSSTC CA6-8D1024 | |
|---|---|---|---|---|---|---|
| Noise | -17% | -10% | 3% | -2% | 2% | |
| uit / omgeving * (dB) | 22.7 | 25 -10% | 24 -6% | 23 -1% | 23.2 -2% | 23 -1% |
| Idle Minimum * (dB) | 23.1 | 28 -21% | 24 -4% | 23 -0% | 28.3 -23% | 23 -0% |
| Idle Average * (dB) | 25.8 | 30 -16% | 29.96 -16% | 23 11% | 28.8 -12% | 28.11 -9% |
| Idle Maximum * (dB) | 25.8 | 38 -47% | 34.27 -33% | 23.6 9% | 28.9 -12% | 28.11 -9% |
| Load Average * (dB) | 39.3 | 48 -22% | 35.89 9% | 39 1% | 32.4 18% | 30.62 22% |
| Witcher 3 ultra * (dB) | 49.9 | 53 -6% | 57.5 -15% | 51.6 -3% | 48.3 3% | 49.75 -0% |
| Load Maximum * (dB) | 54.8 | 55 -0% | 57.54 -5% | 51.3 6% | 48.1 12% | 50.17 8% |
* ... kleiner is beter
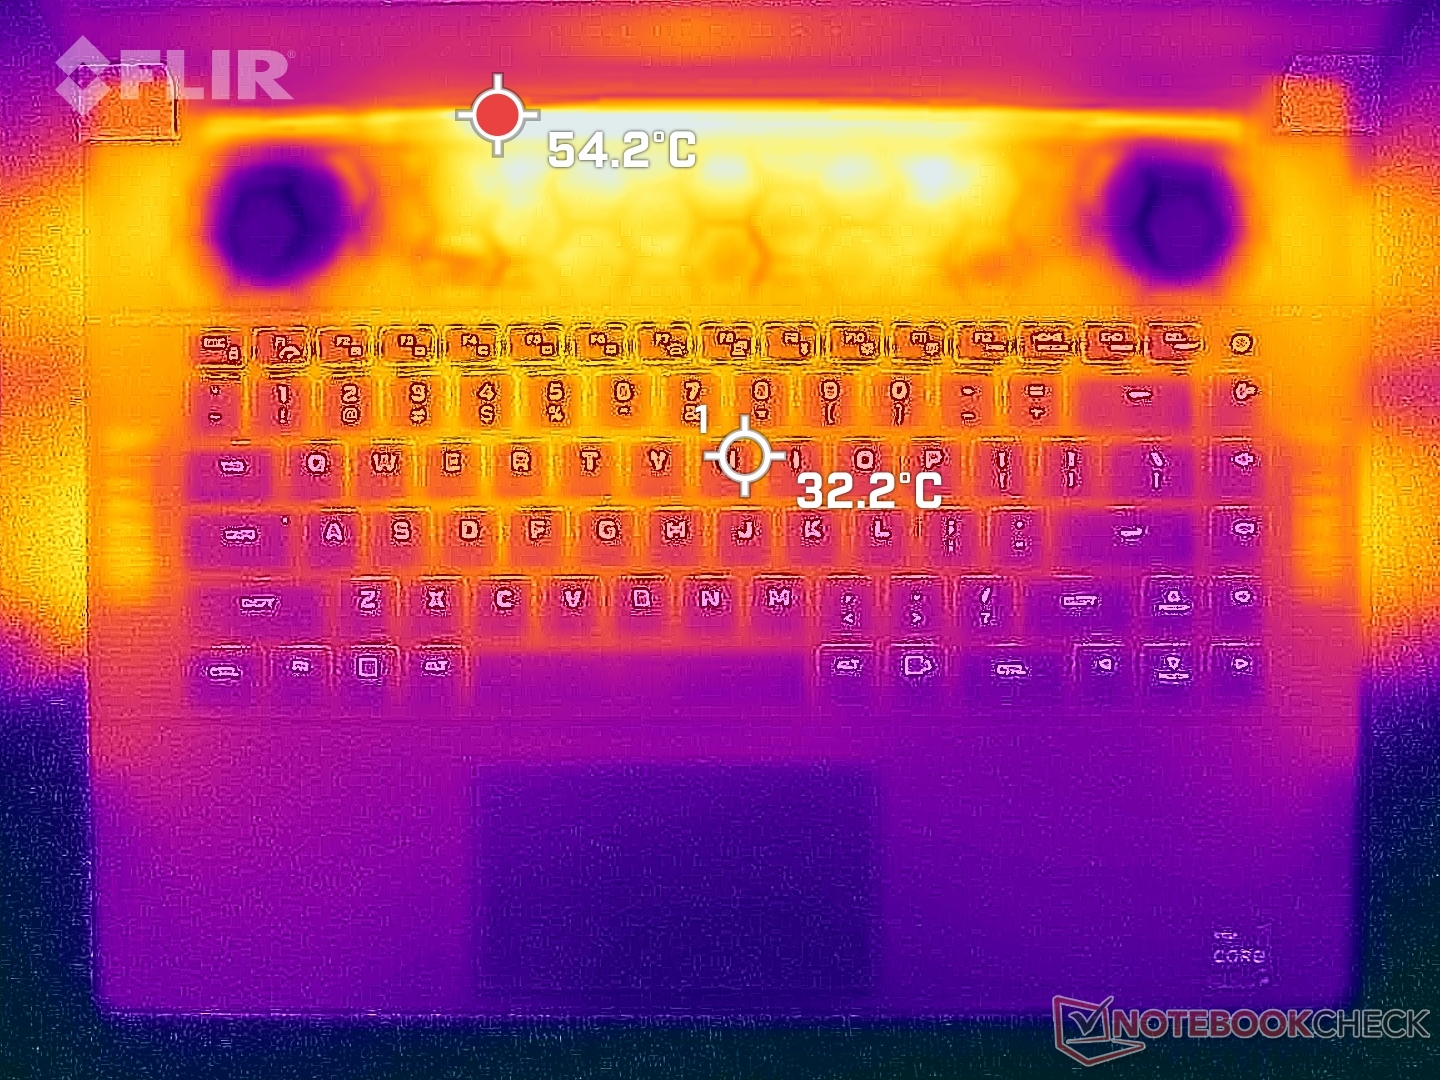
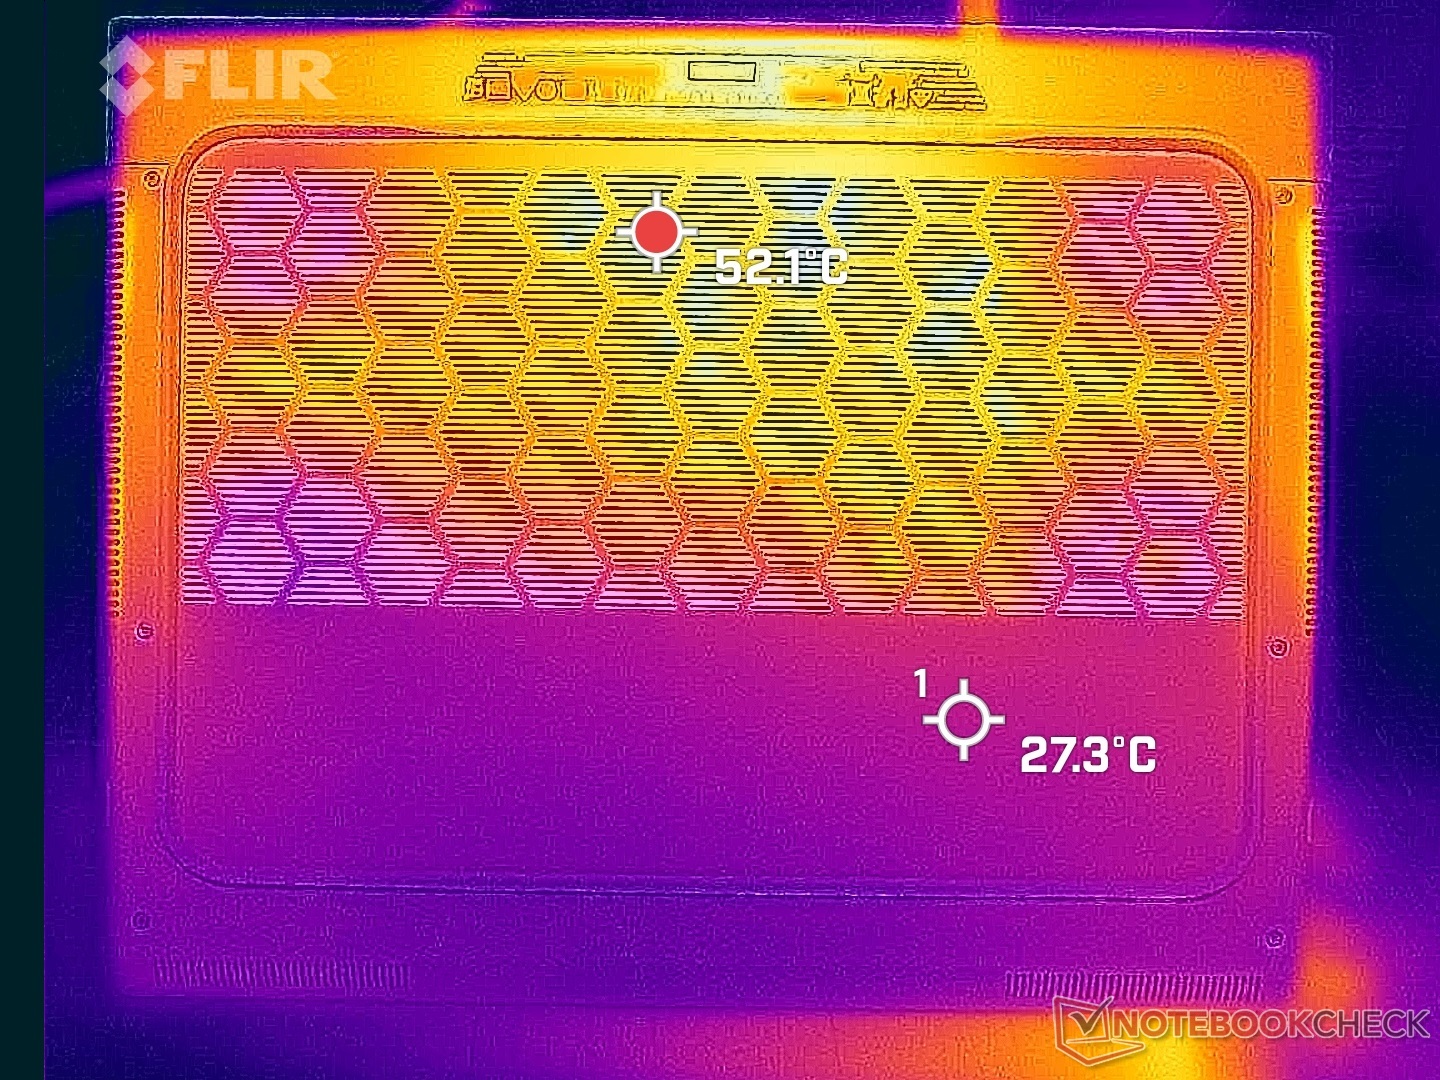
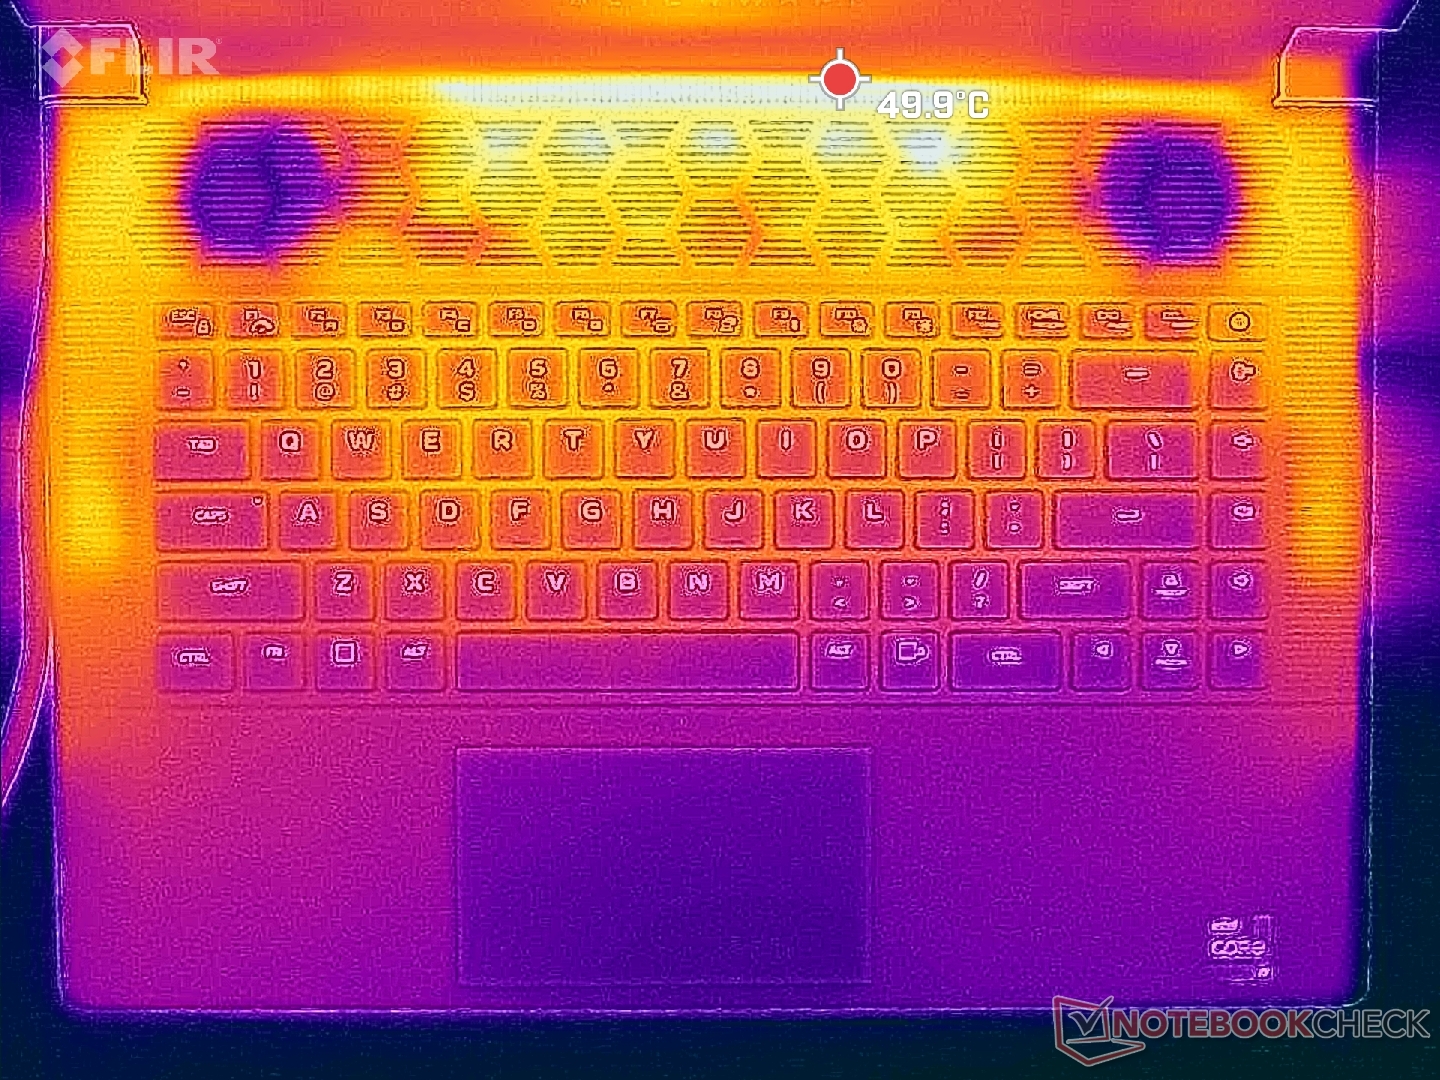
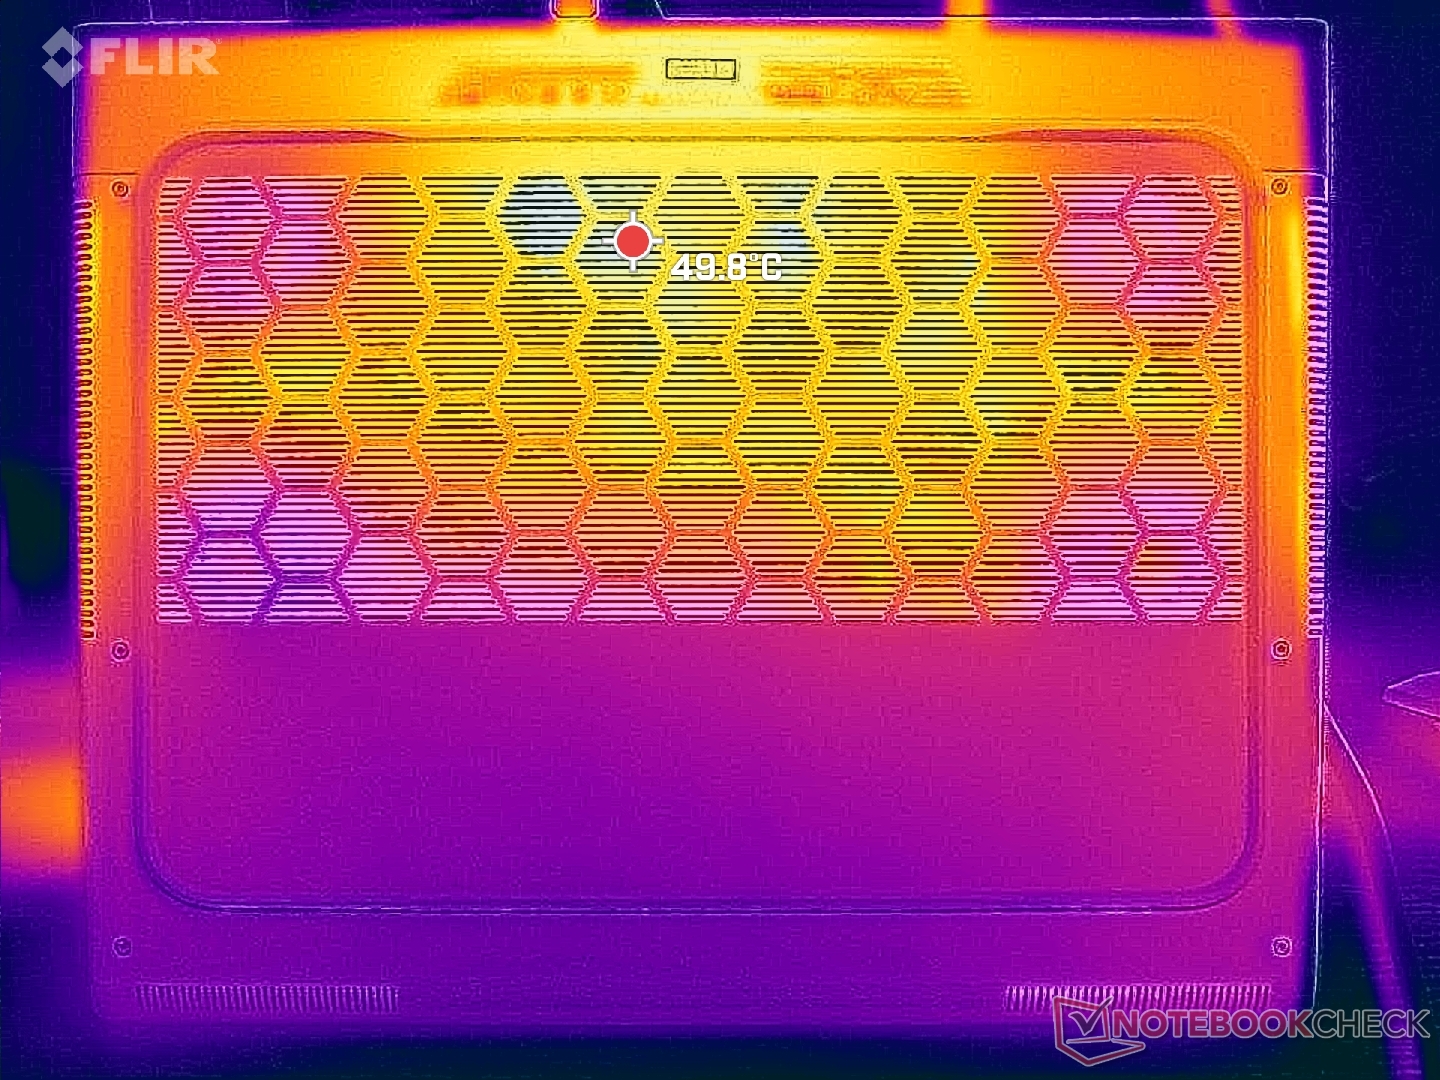
Temperatuur
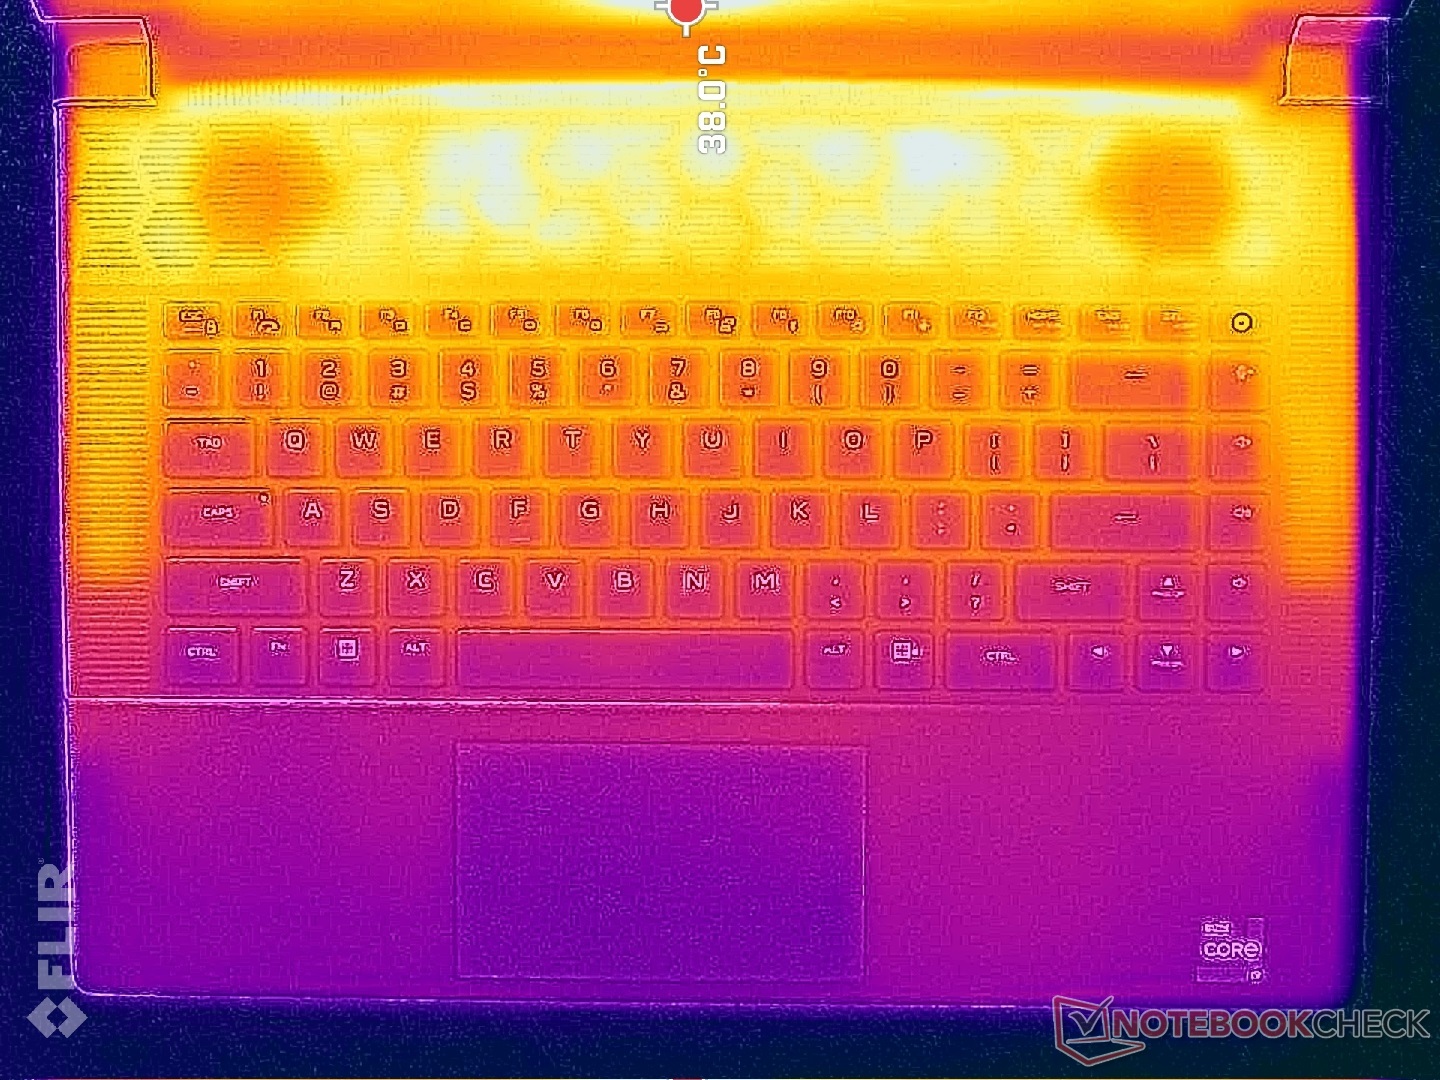
De oppervlaktetemperaturen kunnen erg hoog oplopen door het dunne profiel. Hete plekken kunnen oplopen tot ongeveer 50 C aan de boven- en onderkant, vergeleken met slechts 40 C op de Blade 16. Gelukkig bevinden deze hete plekken zich aan de achterkant en weg van de palmsteunen. Gelukkig bevinden deze warme plekken zich aan de achterkant en uit de buurt van de palmsteunen.
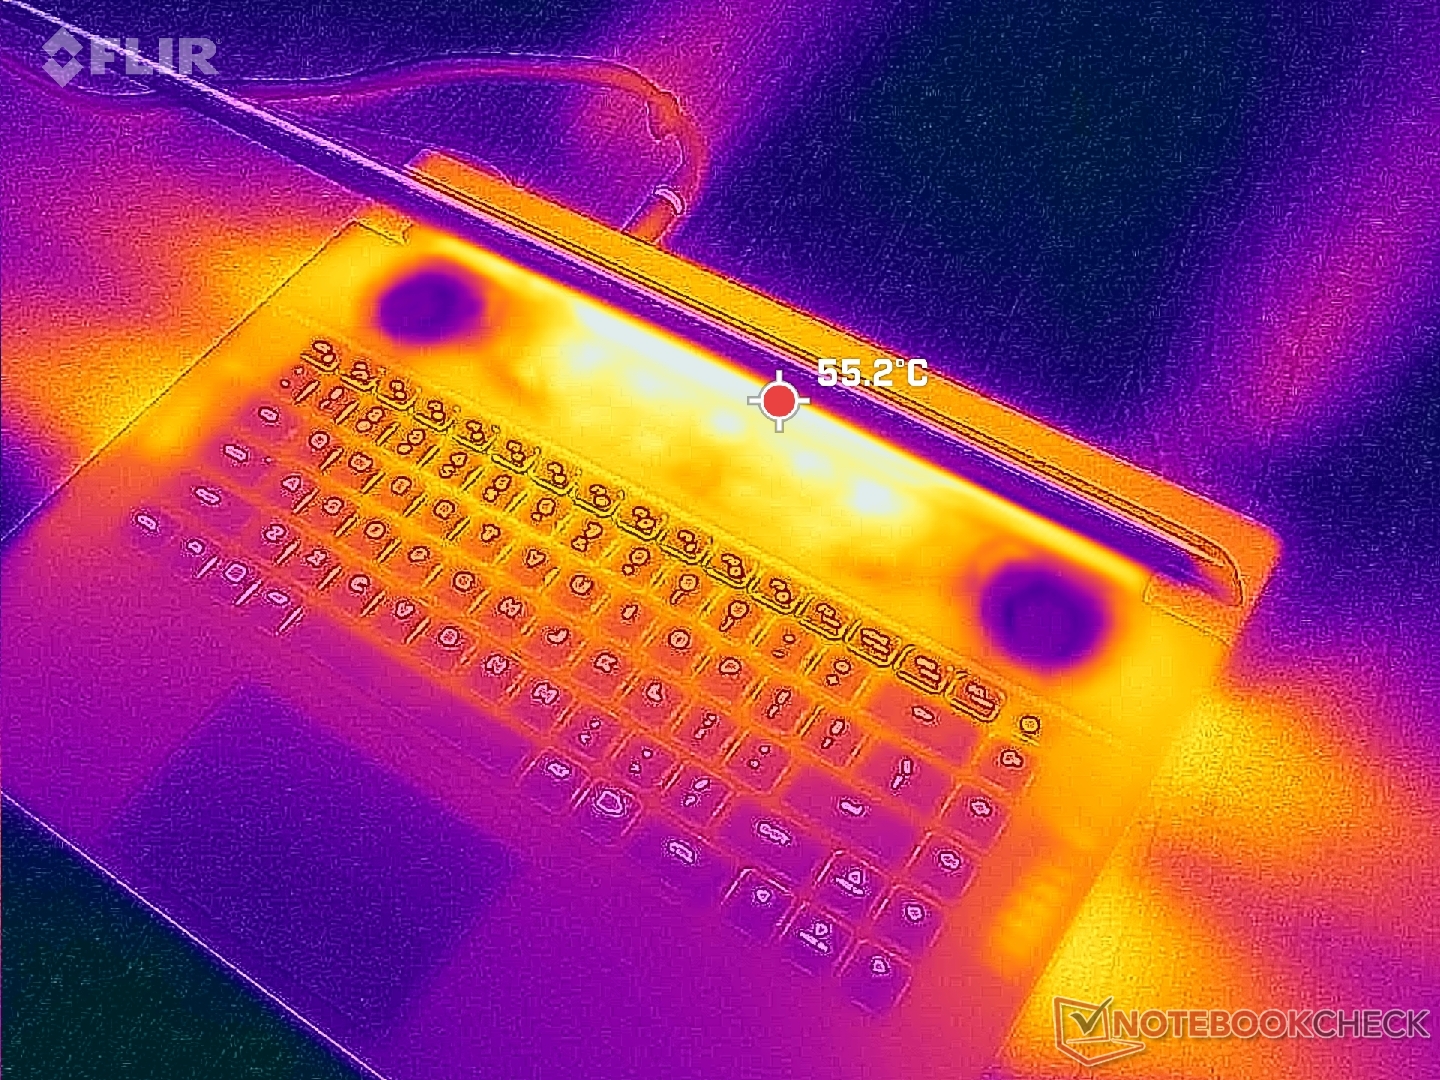
(-) De maximumtemperatuur aan de bovenzijde bedraagt 47.2 °C / 117 F, vergeleken met het gemiddelde van 40.4 °C / 105 F, variërend van 21.2 tot 68.8 °C voor de klasse Gaming.
(-) De bodem warmt op tot een maximum van 47.8 °C / 118 F, vergeleken met een gemiddelde van 43.2 °C / 110 F
(+) Bij onbelast gebruik bedraagt de gemiddelde temperatuur voor de bovenzijde 30.8 °C / 87 F, vergeleken met het apparaatgemiddelde van 33.9 °C / 93 F.
(±) Bij het spelen van The Witcher 3 is de gemiddelde temperatuur voor de bovenzijde 38 °C / 100 F, vergeleken met het apparaatgemiddelde van 33.9 °C / 93 F.
(+) De palmsteunen en het touchpad zijn met een maximum van ###max## °C / 87.1 F koeler dan de huidtemperatuur en voelen daarom koel aan.
(±) De gemiddelde temperatuur van de handpalmsteun van soortgelijke toestellen bedroeg 28.8 °C / 83.8 F (-1.8 °C / -3.3 F).
| Alienware x16 R1 Intel Core i9-13900HK, NVIDIA GeForce RTX 4080 Laptop GPU | Lenovo Legion Pro 7 RTX4090 Intel Core i9-13900HX, NVIDIA GeForce RTX 4090 Laptop GPU | Asus ROG Zephyrus M16 GU604VY-NM042X Intel Core i9-13900H, NVIDIA GeForce RTX 4090 Laptop GPU | Razer Blade 16 Early 2023 Intel Core i9-13950HX, NVIDIA GeForce RTX 4080 Laptop GPU | Dell G16 7620 Intel Core i7-12700H, NVIDIA GeForce RTX 3060 Laptop GPU | Alienware m17 R5 (R9 6900HX, RX 6850M XT) AMD Ryzen 9 6900HX, AMD Radeon RX 6850M XT | |
|---|---|---|---|---|---|---|
| Heat | -4% | 6% | 15% | 14% | 2% | |
| Maximum Upper Side * (°C) | 47.2 | 53 -12% | 50 -6% | 40 15% | 47.6 -1% | 53 -12% |
| Maximum Bottom * (°C) | 47.8 | 59 -23% | 58 -21% | 37.6 21% | 54 -13% | 56 -17% |
| Idle Upper Side * (°C) | 36.8 | 34 8% | 26 29% | 32.4 12% | 23 37% | 30 18% |
| Idle Bottom * (°C) | 35.8 | 32 11% | 28 22% | 31.4 12% | 24.6 31% | 29 19% |
* ... kleiner is beter
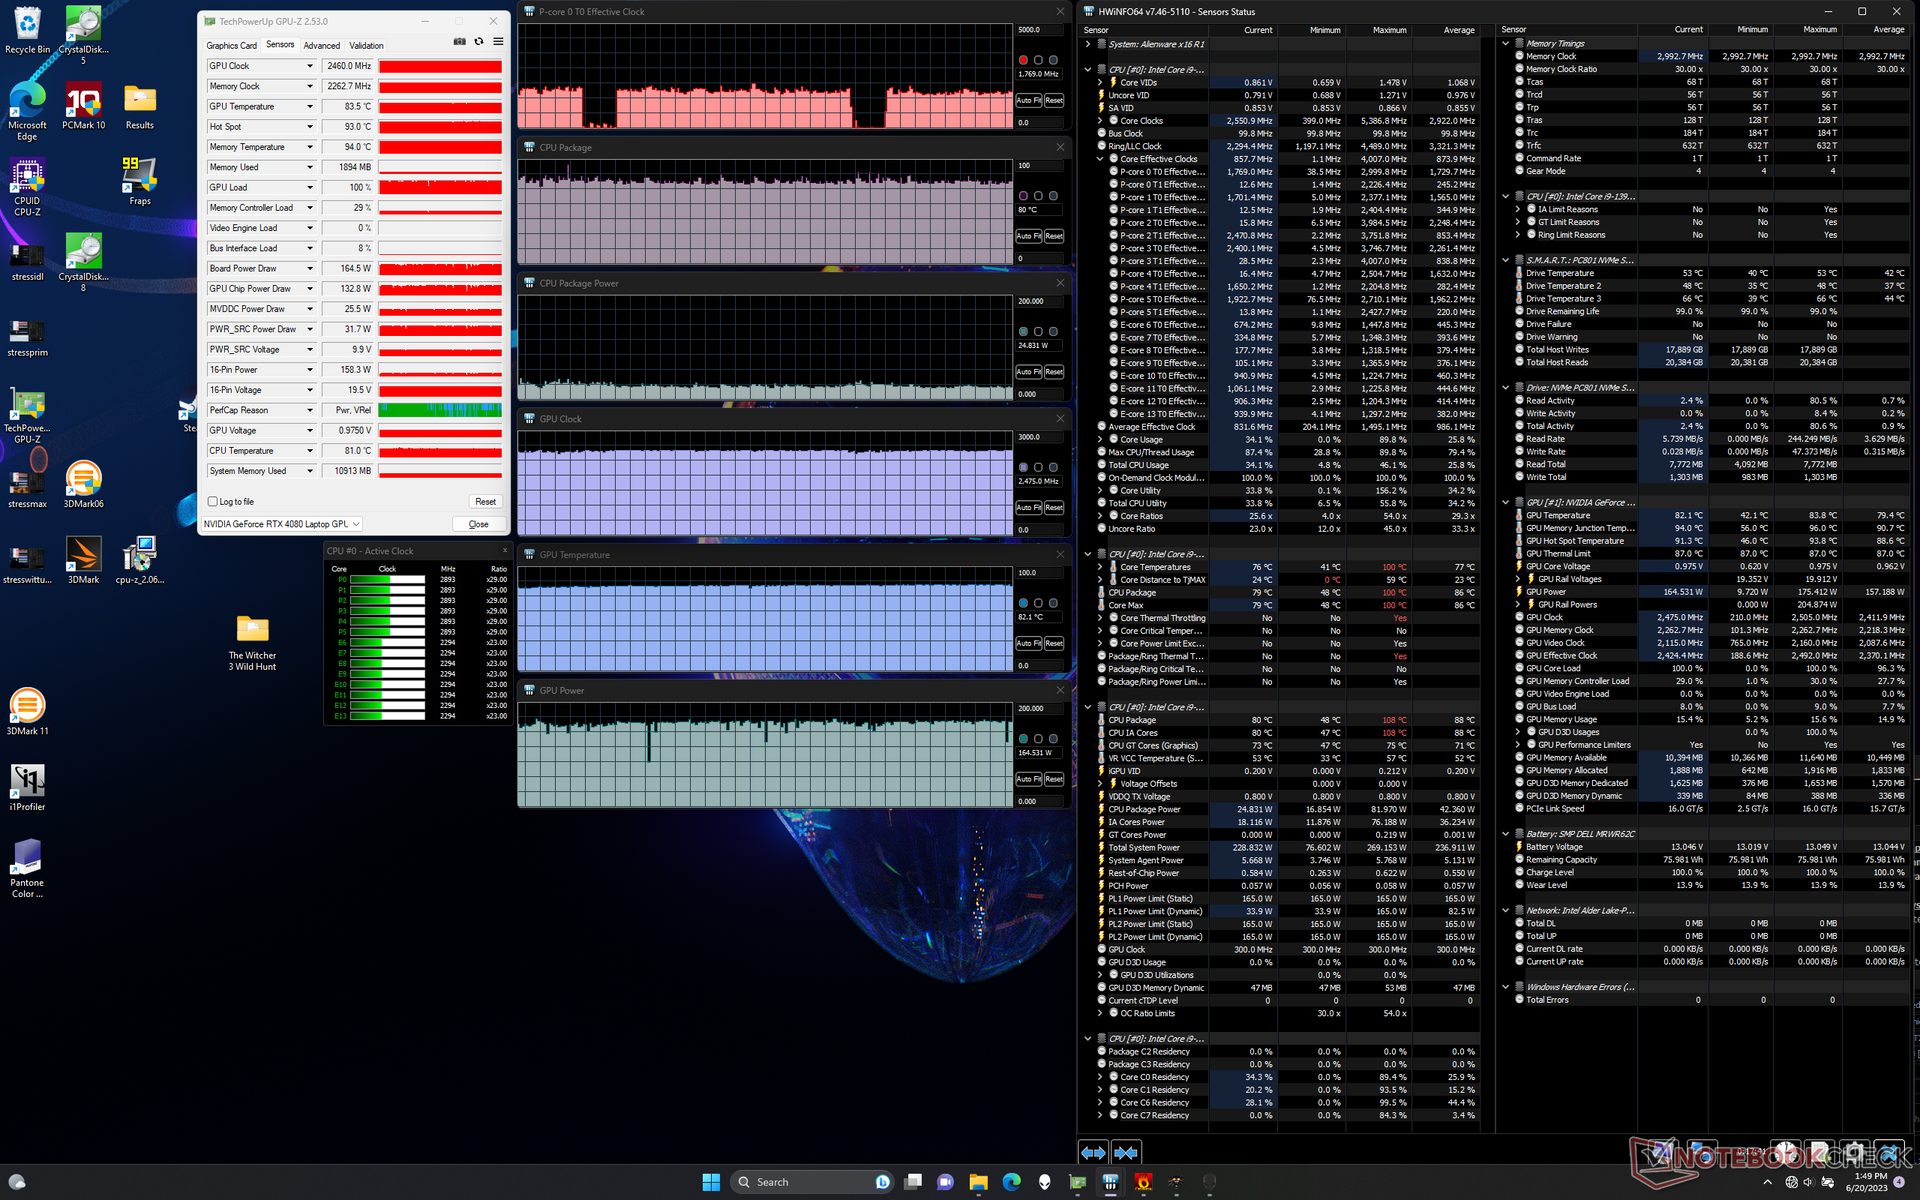
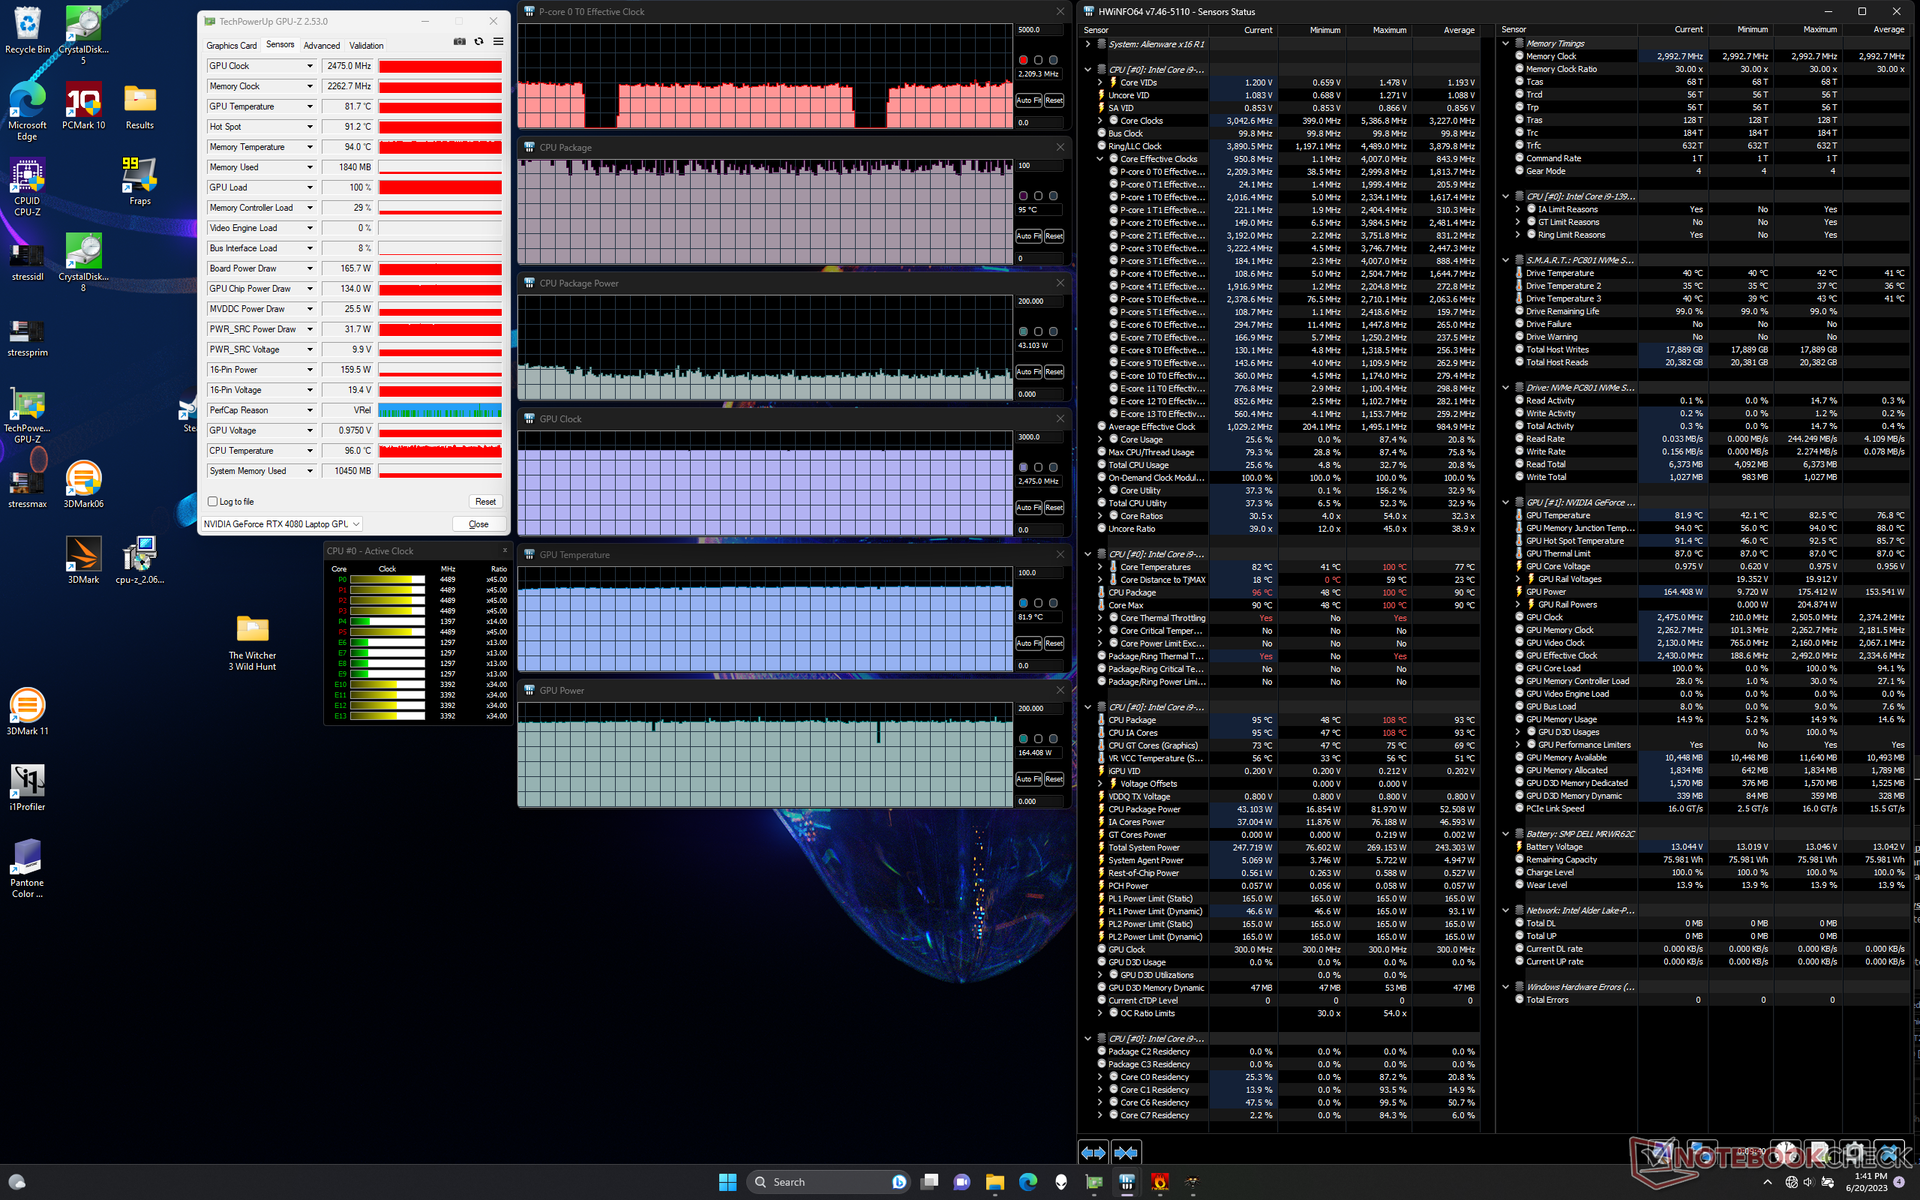
Stresstest
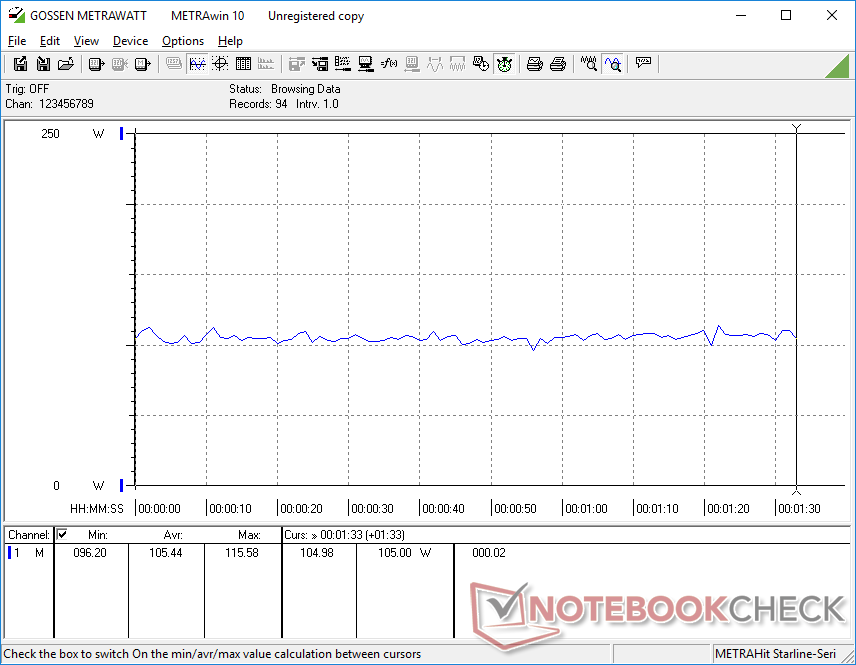
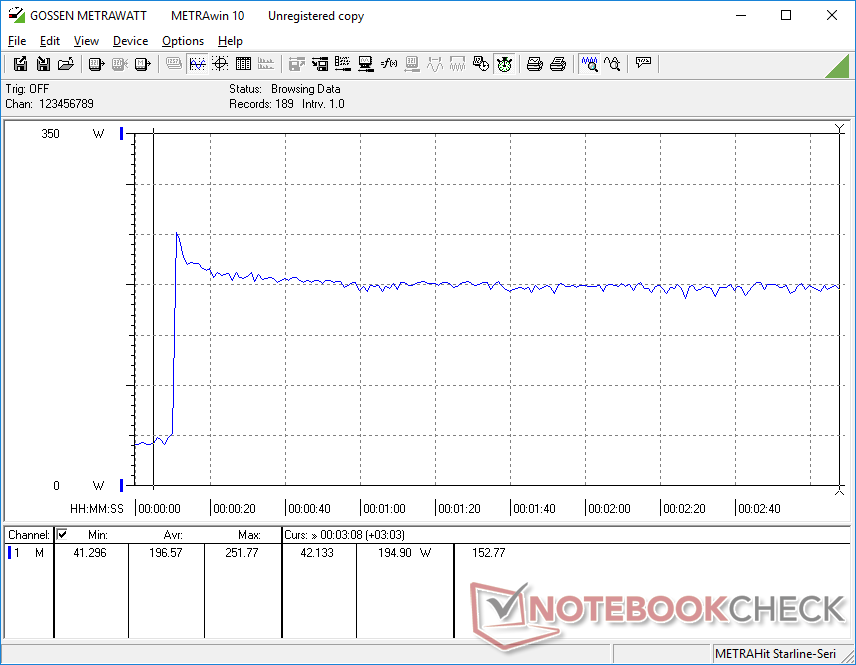
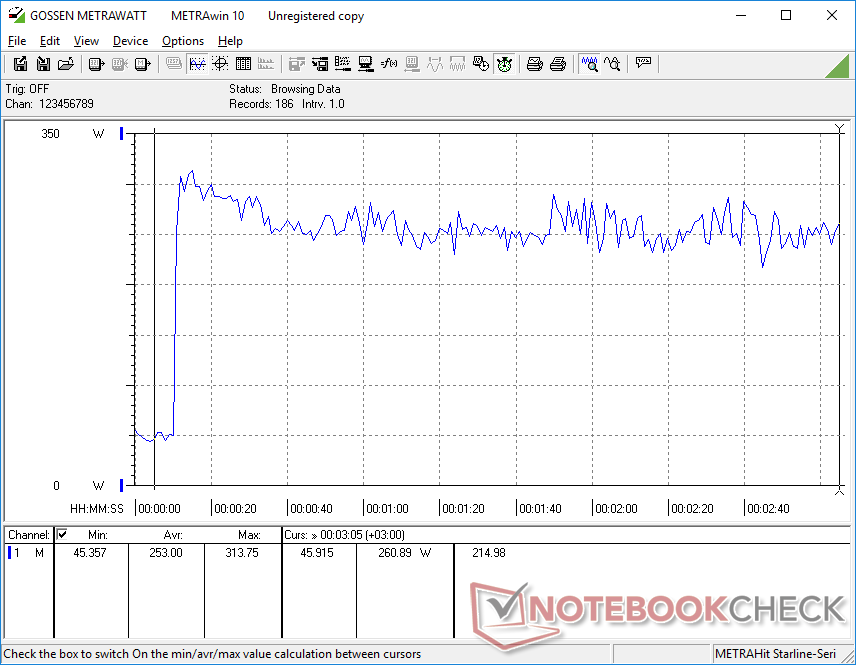
De kloksnelheid van de CPU, de stroomopname op het moederbord en de kerntemperatuur piekten respectievelijk naar 4,5 GHz, 178 W en 99 C bij het starten van Prime95 stress. De CPU stabiliseerde uiteindelijk op 3,8 GHz, 123 W en 99 C na slechts een paar minuten. Met zulke hoge kerntemperaturen is het duidelijk dat de processor de grenzen van de koeling opzoekt om de hoogst mogelijke Turbo Boost kloksnelheden aan te kunnen. Het herhalen van deze test op de Blade 16 zou bijvoorbeeld resulteren in een koelere stabiele kerntemperatuur van 82 C.
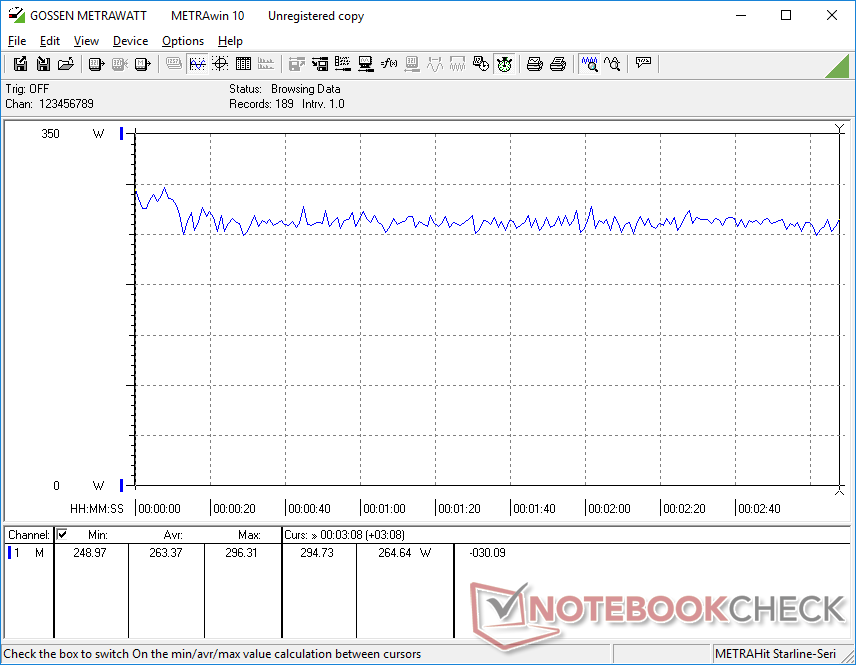
Bij het uitvoeren van Witcher 3 op Overdrive-modus om typische gamingbelastingen weer te geven, zou de GPU stabiliseren op ongeveer 166 W tegen een doel van 175 W. Interessant genoeg zou de stroomafname op het bord nauwelijks dalen tot slechts 161 W in Balanced-modus, zoals te zien is op de screenshots hieronder, om een zeer marginaal prestatieverlies weer te geven in verhouding tot het aanzienlijk stillere ventilatorgeluid in vergelijking met de Overdrive-modus. Eigenaars kunnen daarom overwegen om te gamen in de Gebalanceerde modus in plaats van de luidere modi Prestaties of Overdrive.
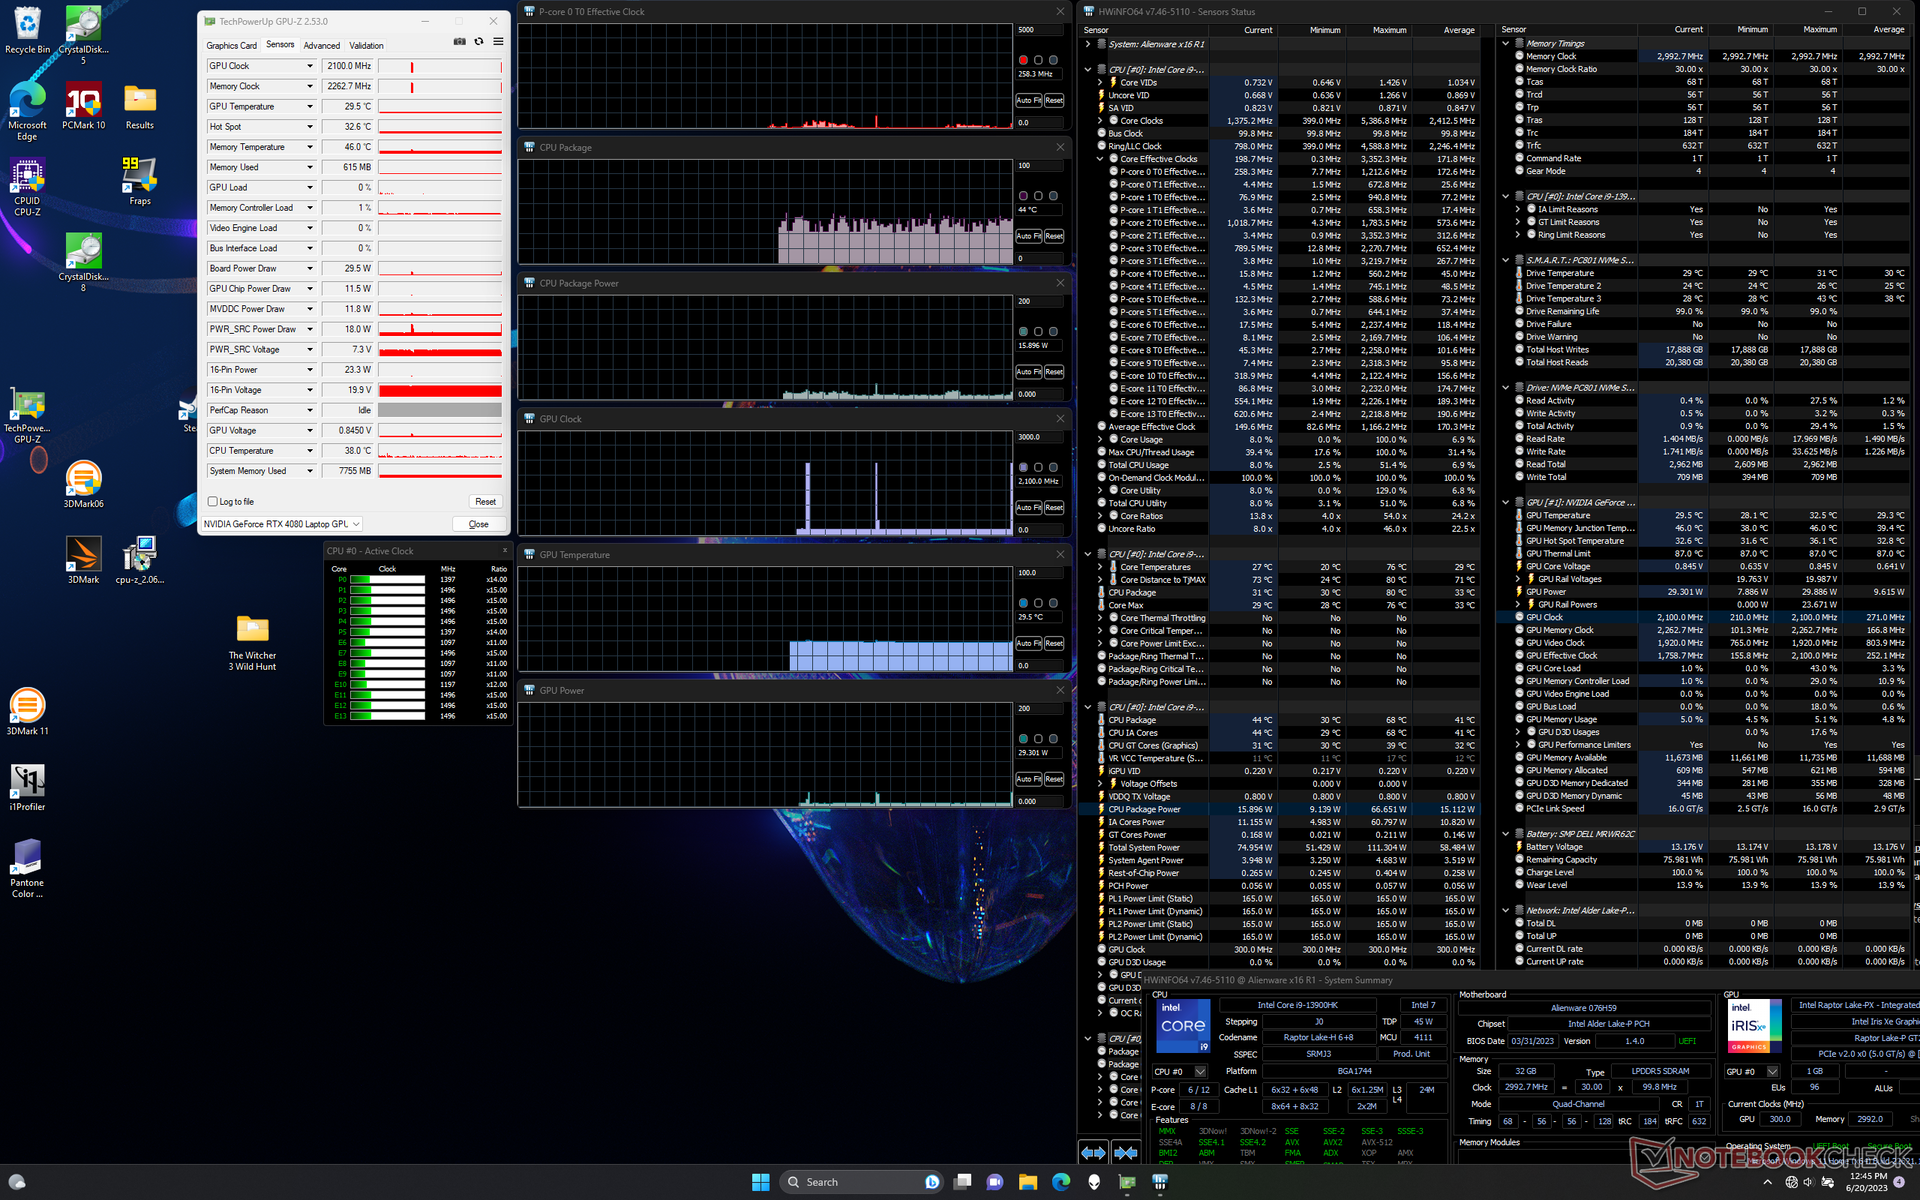

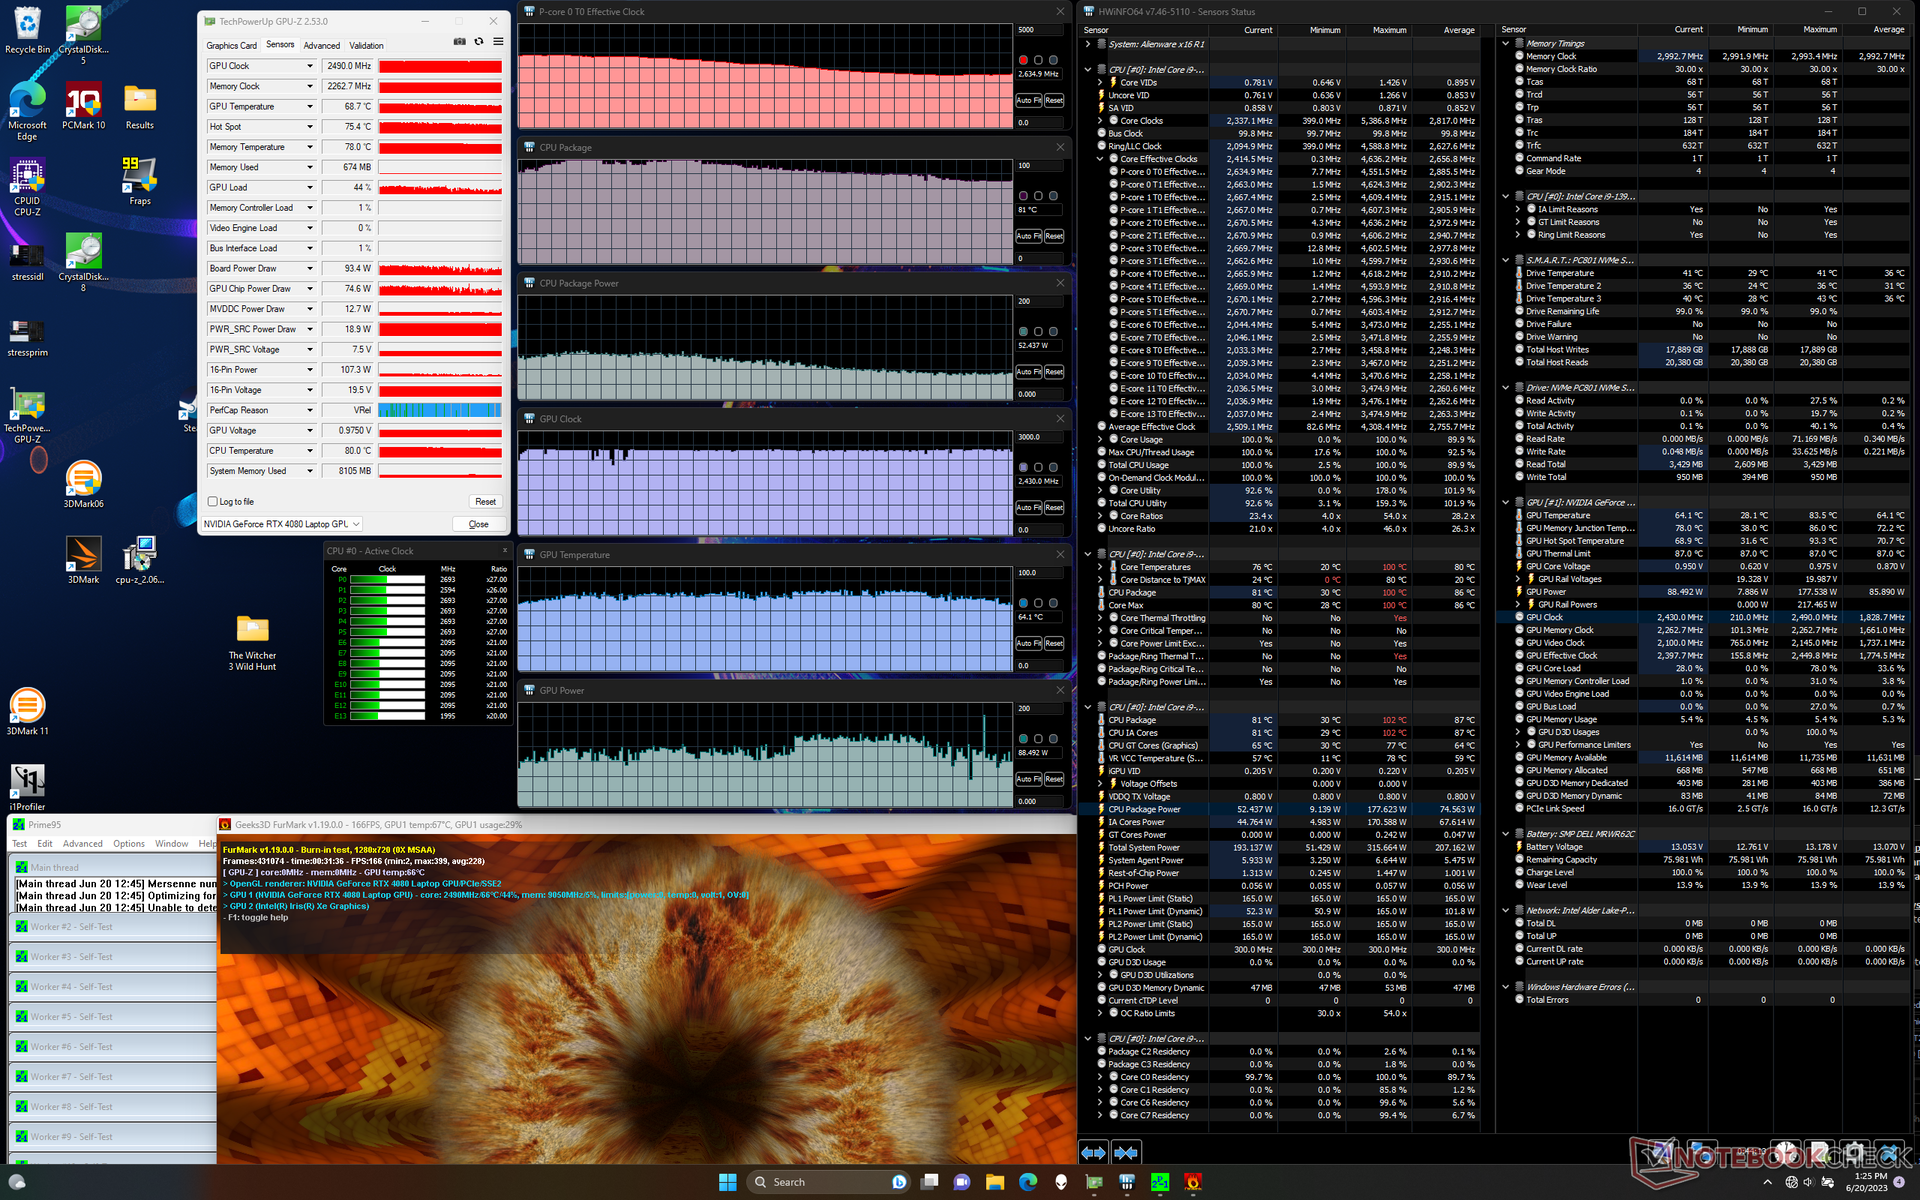

| CPU-klok (GHz) | GPU-klok (MHz) | Gemiddelde CPU-temperatuur (°C) | Gemiddelde GPU-temperatuur (°C) | |
| Systeem inactief | -- | -- | 44 | 30 |
| Prime95-stress | 3.8 | -- | 99 | 51 |
| Prime95 + FurMark Stress | 2.5 - 3.6 | 2475 | 82 - 100 | 72 - 77 |
| Witcher 3 Belasting (evenwichtige modus) | ~1.8 | 2460 | 81 | 85 |
| Witcher 3 Belasting(modus Prestaties) | ~1,8 | 2460 | 80 | 82 |
| Witcher 3 Belasting (Overdrive modus) | ~2.2 | 2475 | 95 | 82 |
Luidsprekers
Alienware x16 R1 audioanalyse
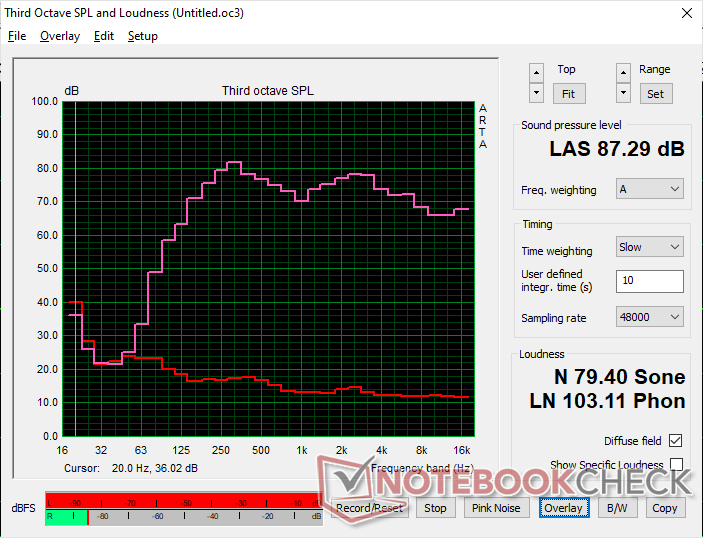
(+) | luidsprekers kunnen relatief luid spelen (87.3 dB)
Bas 100 - 315 Hz
(±) | verminderde zeebaars - gemiddeld 7.3% lager dan de mediaan
(±) | lineariteit van de lage tonen is gemiddeld (9.1% delta ten opzichte van de vorige frequentie)
Midden 400 - 2000 Hz
(+) | evenwichtige middens - slechts 2.2% verwijderd van de mediaan
(+) | de middentonen zijn lineair (3.8% delta ten opzichte van de vorige frequentie)
Hoog 2 - 16 kHz
(+) | evenwichtige hoogtepunten - slechts 3.6% verwijderd van de mediaan
(+) | de hoge tonen zijn lineair (3.3% delta naar de vorige frequentie)
Algemeen 100 - 16.000 Hz
(+) | het totale geluid is lineair (7.9% verschil met de mediaan)
Vergeleken met dezelfde klasse
» 1% van alle geteste apparaten in deze klasse waren beter, 1% vergelijkbaar, 98% slechter
» De beste had een delta van 6%, het gemiddelde was 18%, de slechtste was 132%
Vergeleken met alle geteste toestellen
» 2% van alle geteste apparaten waren beter, 1% gelijk, 98% slechter
» De beste had een delta van 4%, het gemiddelde was 23%, de slechtste was 134%
Apple MacBook Pro 16 2021 M1 Pro audioanalyse
(+) | luidsprekers kunnen relatief luid spelen (84.7 dB)
Bas 100 - 315 Hz
(+) | goede baars - slechts 3.8% verwijderd van de mediaan
(+) | de lage tonen zijn lineair (5.2% delta naar de vorige frequentie)
Midden 400 - 2000 Hz
(+) | evenwichtige middens - slechts 1.3% verwijderd van de mediaan
(+) | de middentonen zijn lineair (2.1% delta ten opzichte van de vorige frequentie)
Hoog 2 - 16 kHz
(+) | evenwichtige hoogtepunten - slechts 1.9% verwijderd van de mediaan
(+) | de hoge tonen zijn lineair (2.7% delta naar de vorige frequentie)
Algemeen 100 - 16.000 Hz
(+) | het totale geluid is lineair (4.6% verschil met de mediaan)
Vergeleken met dezelfde klasse
» 0% van alle geteste apparaten in deze klasse waren beter, 0% vergelijkbaar, 100% slechter
» De beste had een delta van 5%, het gemiddelde was 17%, de slechtste was 45%
Vergeleken met alle geteste toestellen
» 0% van alle geteste apparaten waren beter, 0% gelijk, 100% slechter
» De beste had een delta van 4%, het gemiddelde was 23%, de slechtste was 134%
Energiebeheer
Stroomverbruik - hoog, zoals verwacht
Het stroomverbruik ligt tussen de 25 W en 50 W bij stationair draaien op de desktop, afhankelijk van het stroomprofiel, de GPU en de helderheidsinstellingen. Dit is zelfs aan de hoge kant voor deze categorie, aangezien andere 16-inch modellen zoals de Razer Blade 16 of Alienware m17 slechts 15 W kunnen bereiken bij vergelijkbare minimale voedingsinstellingen.
Gaming vereist ongeveer 263 W, wat tussen de Asus ROG Strix G16 en MSI GE78 HX elk met dezelfde RTX 4080 GPU. Misschien nog opmerkelijker is dat de RTX 4090-aangedreven Asus ROG Zephyrus M16 20 procent minder stroom, terwijl hij ongeveer dezelfde grafische prestaties levert als onze Alienware met RTX 4080.
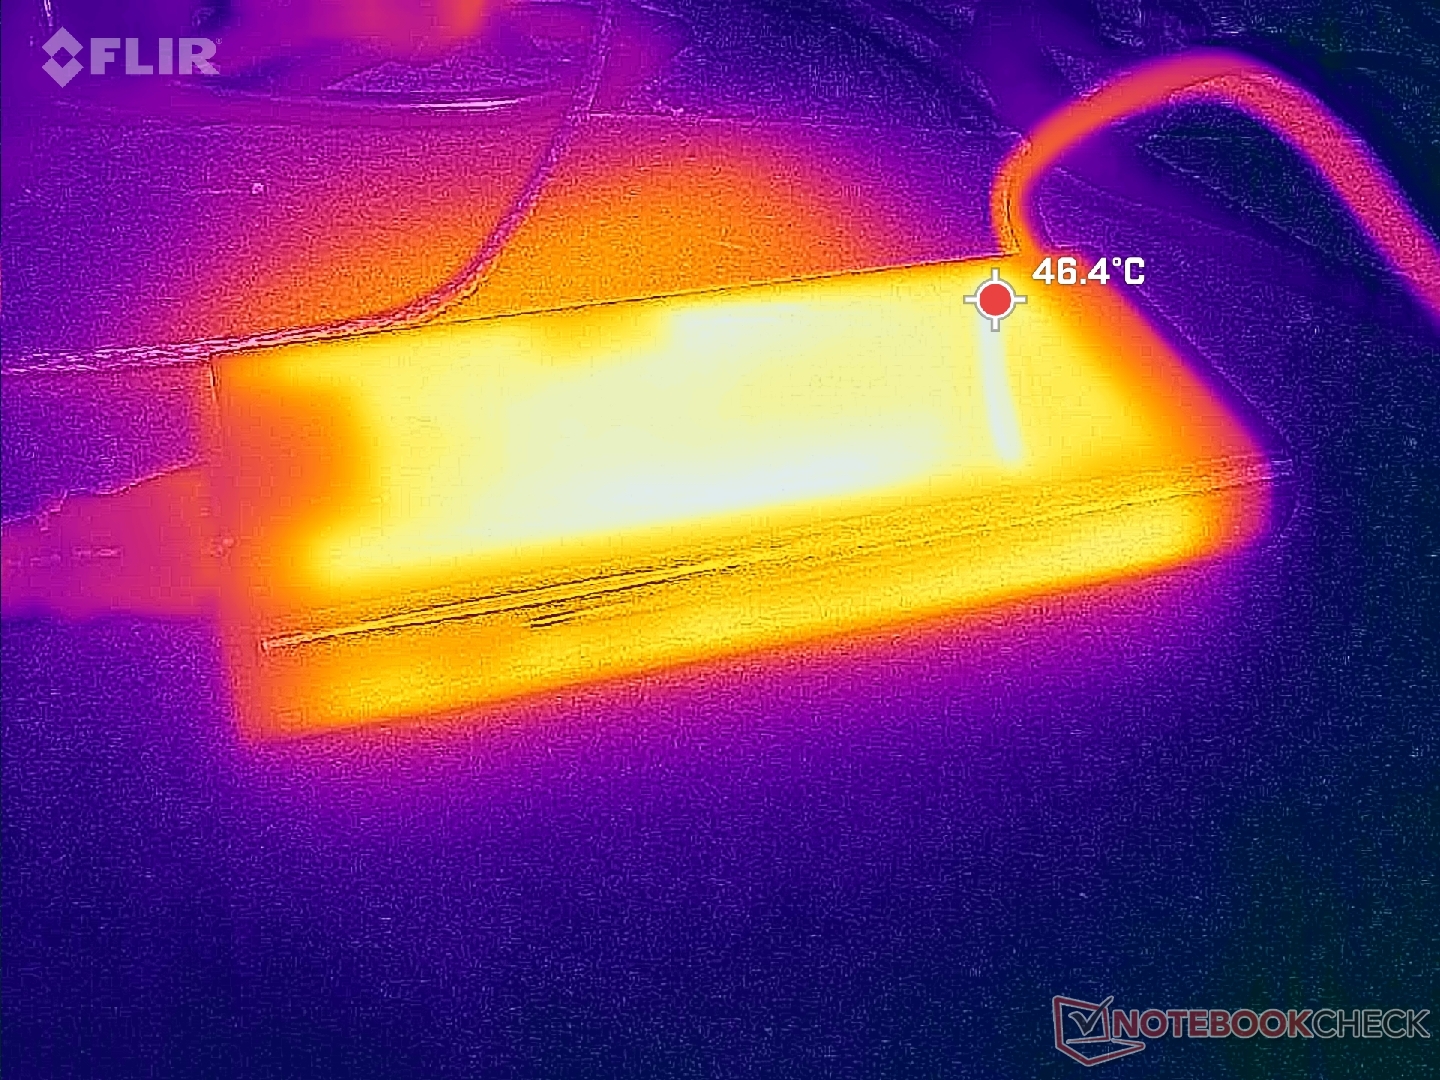
We kunnen een maximaal tijdelijk verbruik meten van 313 W uit de middelgrote (~18,3 x 8,6 x 2,6 cm) 330 W AC-adapter wanneer zowel de CPU als de GPU op 100 procent gebruik staan. De oplaadsnelheid vertraagt wanneer dergelijke veeleisende belastingen worden uitgevoerd.
| Uit / Standby | |
| Inactief | |
| Belasting |
|
Key:
min: | |
| Alienware x16 R1 i9-13900HK, GeForce RTX 4080 Laptop GPU, SK hynix PC801 HFS001TEJ9X101N, IPS, 2560x1600, 16" | Lenovo Legion Pro 7 RTX4090 i9-13900HX, GeForce RTX 4090 Laptop GPU, Samsung PM9A1 MZVL21T0HCLR, IPS, 2560x1600, 16" | Asus ROG Zephyrus M16 GU604VY-NM042X i9-13900H, GeForce RTX 4090 Laptop GPU, Samsung PM9A1 MZVL22T0HBLB, IPS, 2560x1600, 16" | Razer Blade 16 Early 2023 i9-13950HX, GeForce RTX 4080 Laptop GPU, SSSTC CA6-8D1024, IPS, 2560x1600, 16" | Dell G16 7620 i7-12700H, GeForce RTX 3060 Laptop GPU, WDC PC SN810 512GB, IPS, 2560x1600, 16" | Alienware m17 R5 (R9 6900HX, RX 6850M XT) R9 6900HX, Radeon RX 6850M XT, SSSTC CA6-8D1024, IPS, 3840x2160, 17" | |
|---|---|---|---|---|---|---|
| Power Consumption | 5% | 21% | 12% | 30% | 33% | |
| Idle Minimum * (Watt) | 25.2 | 20 21% | 20 21% | 15.2 40% | 14.4 43% | 13 48% |
| Idle Average * (Watt) | 29.9 | 25 16% | 24 20% | 22.8 24% | 17.8 40% | 16.5 45% |
| Idle Maximum * (Watt) | 49.8 | 35 30% | 25 50% | 49.8 -0% | 31.5 37% | 17 66% |
| Load Average * (Watt) | 105.4 | 136 -29% | 107 -2% | 121.2 -15% | 101.2 4% | 93 12% |
| Witcher 3 ultra * (Watt) | 263 | 282 -7% | 208 21% | 242 8% | 176.9 33% | 239 9% |
| Load Maximum * (Watt) | 313.8 | 320 -2% | 267 15% | 273.7 13% | 242.9 23% | 251 20% |
* ... kleiner is beter
Power Consumption Witcher 3 / Stresstest
Power Consumption external Monitor
Levensduur batterij
We konden slechts 2,5 uur gebruikstijd registreren tijdens onze WLAN browsertest, zelfs met ACC ingesteld op batterijmodus en het systeem in iGPU Optimus-modus. Herhaalde tests zouden vergelijkbare cijfers opleveren. We verwachten geen lange runtimes van gaming laptops, maar dit is nog steeds veel korter in vergelijking met concurrerende platforms. Dell claimt een browsing runtime van meer dan 7 uur, die we alleen kunnen behalen wanneer het systeem stationair draait op het bureaublad bij de laagste helderheidsinstelling. De resultaten zijn ongebruikelijk omdat onzeAlienware x17 twee keer zo lang meeging als onze Alienware x16 bij dezelfde WLAN-test.
Opladen van leeg naar vol duurt ongeveer twee uur met de meegeleverde AC-adapter. Het systeem kan ook worden opgeladen via USB-C adapters, inclusief de 130 W adapters die worden meegeleverd met XPS-modellen.
| Alienware x16 R1 i9-13900HK, GeForce RTX 4080 Laptop GPU, 90 Wh | Asus ROG Zephyrus M16 GU604VY-NM042X i9-13900H, GeForce RTX 4090 Laptop GPU, 90 Wh | Razer Blade 16 Early 2023 i9-13950HX, GeForce RTX 4080 Laptop GPU, 95.2 Wh | Dell G16 7620 i7-12700H, GeForce RTX 3060 Laptop GPU, 84 Wh | Alienware m17 R5 (R9 6900HX, RX 6850M XT) R9 6900HX, Radeon RX 6850M XT, 97 Wh | Lenovo Legion Pro 7 16IRX8H i9-13900HX, GeForce RTX 4080 Laptop GPU, 99.9 Wh | |
|---|---|---|---|---|---|---|
| Batterijduur | 193% | 89% | 32% | 125% | 97% | |
| Reader / Idle (h) | 7.3 | 8.9 22% | 7.1 -3% | 6.4 -12% | ||
| WiFi v1.3 (h) | 2.5 | 4.3 72% | 6.1 144% | 5 100% | 4.8 92% | 5.1 104% |
| Load (h) | 0.7 | 2.9 314% | 1.4 100% | 0.7 0% | 1.8 157% | 2.1 200% |
| H.264 (h) | 4.8 | 4.9 |
Pro
Contra
Verdict - slaagt in het nastreven van zowel slankheid als graphics
Het is algemeen bekend dat laptopprestaties omgekeerd evenredig zijn met dunheid. De Alienware x16 daagt dit uit door een van de dunste in zijn formaatcategorie te zijn en nog steeds beter te presteren dan grote concurrenten zoals de Razer Blade 16, Asus ROG Strix G16of HP Omen 17 op het gebied van grafische prestaties. Het is indrukwekkend dat het model in staat is om een 175 W GeForce RTX GPU erin te proppen, gezien het ultradunne profiel.
Als je op zoek bent naar maximale GPU-prestaties met een minimale dikte, dan zou de Alienware x16 bovenaan je lijst moeten staan.
Er zijn echter een aantal nadelen waarvan sommige uniek zijn voor de Alienware x16. Ten eerste, alleen omdat het superdun is betekent niet dat het super klein of lichtgewicht is, want het systeem is erg groot in termen van lengte en breedte om de dunnere Z-hoogte goed te maken. Ten tweede kan het ontbreken van poorten aan de zijkanten het aansluiten van monitoren of accessoires elke keer een beetje lastig maken. En tot slot is de Core i9-13900HK slechts marginale verbeteringen ten opzichte van de vorige generatieCore i9-12900H aangezien hij lang niet zo krachtig is als deCore i9-13900HX die beschikbaar is op de dikkere Alienware m16 en niet op de Alienware x16. Concessies op het gebied van voetafdruk, positionering van poorten en CPU-prestaties waren waarschijnlijk nodig om de GPU-kracht te maximaliseren.
Prijs en beschikbaarheid
Dell levert de Alienware x16 nu aan consumenten vanaf $2200 voor de basisconfiguratie tot $3350 USD voor de door ons beoordeelde configuratie.
Alienware x16 R1
- 22-06-2023 v7 (old)
Allen Ngo
Transparantie
De selectie van te beoordelen apparaten wordt gemaakt door onze redactie. Het testexemplaar werd ten behoeve van deze beoordeling door de fabrikant of detailhandelaar in bruikleen aan de auteur verstrekt. De kredietverstrekker had geen invloed op deze recensie, noch ontving de fabrikant vóór publicatie een exemplaar van deze recensie. Er bestond geen verplichting om deze recensie te publiceren. Als onafhankelijk mediabedrijf is Notebookcheck niet onderworpen aan het gezag van fabrikanten, detailhandelaren of uitgevers.
[transparency_disclaimer]Dit is hoe Notebookcheck test
Elk jaar beoordeelt Notebookcheck onafhankelijk honderden laptops en smartphones met behulp van gestandaardiseerde procedures om ervoor te zorgen dat alle resultaten vergelijkbaar zijn. We hebben onze testmethoden al zo'n 20 jaar voortdurend ontwikkeld en daarbij de industriestandaard bepaald. In onze testlaboratoria wordt gebruik gemaakt van hoogwaardige meetapparatuur door ervaren technici en redacteuren. Deze tests omvatten een validatieproces in meerdere fasen. Ons complexe beoordelingssysteem is gebaseerd op honderden goed onderbouwde metingen en benchmarks, waardoor de objectiviteit behouden blijft. Meer informatie over onze testmethoden kunt u hier vinden.
Price comparison

