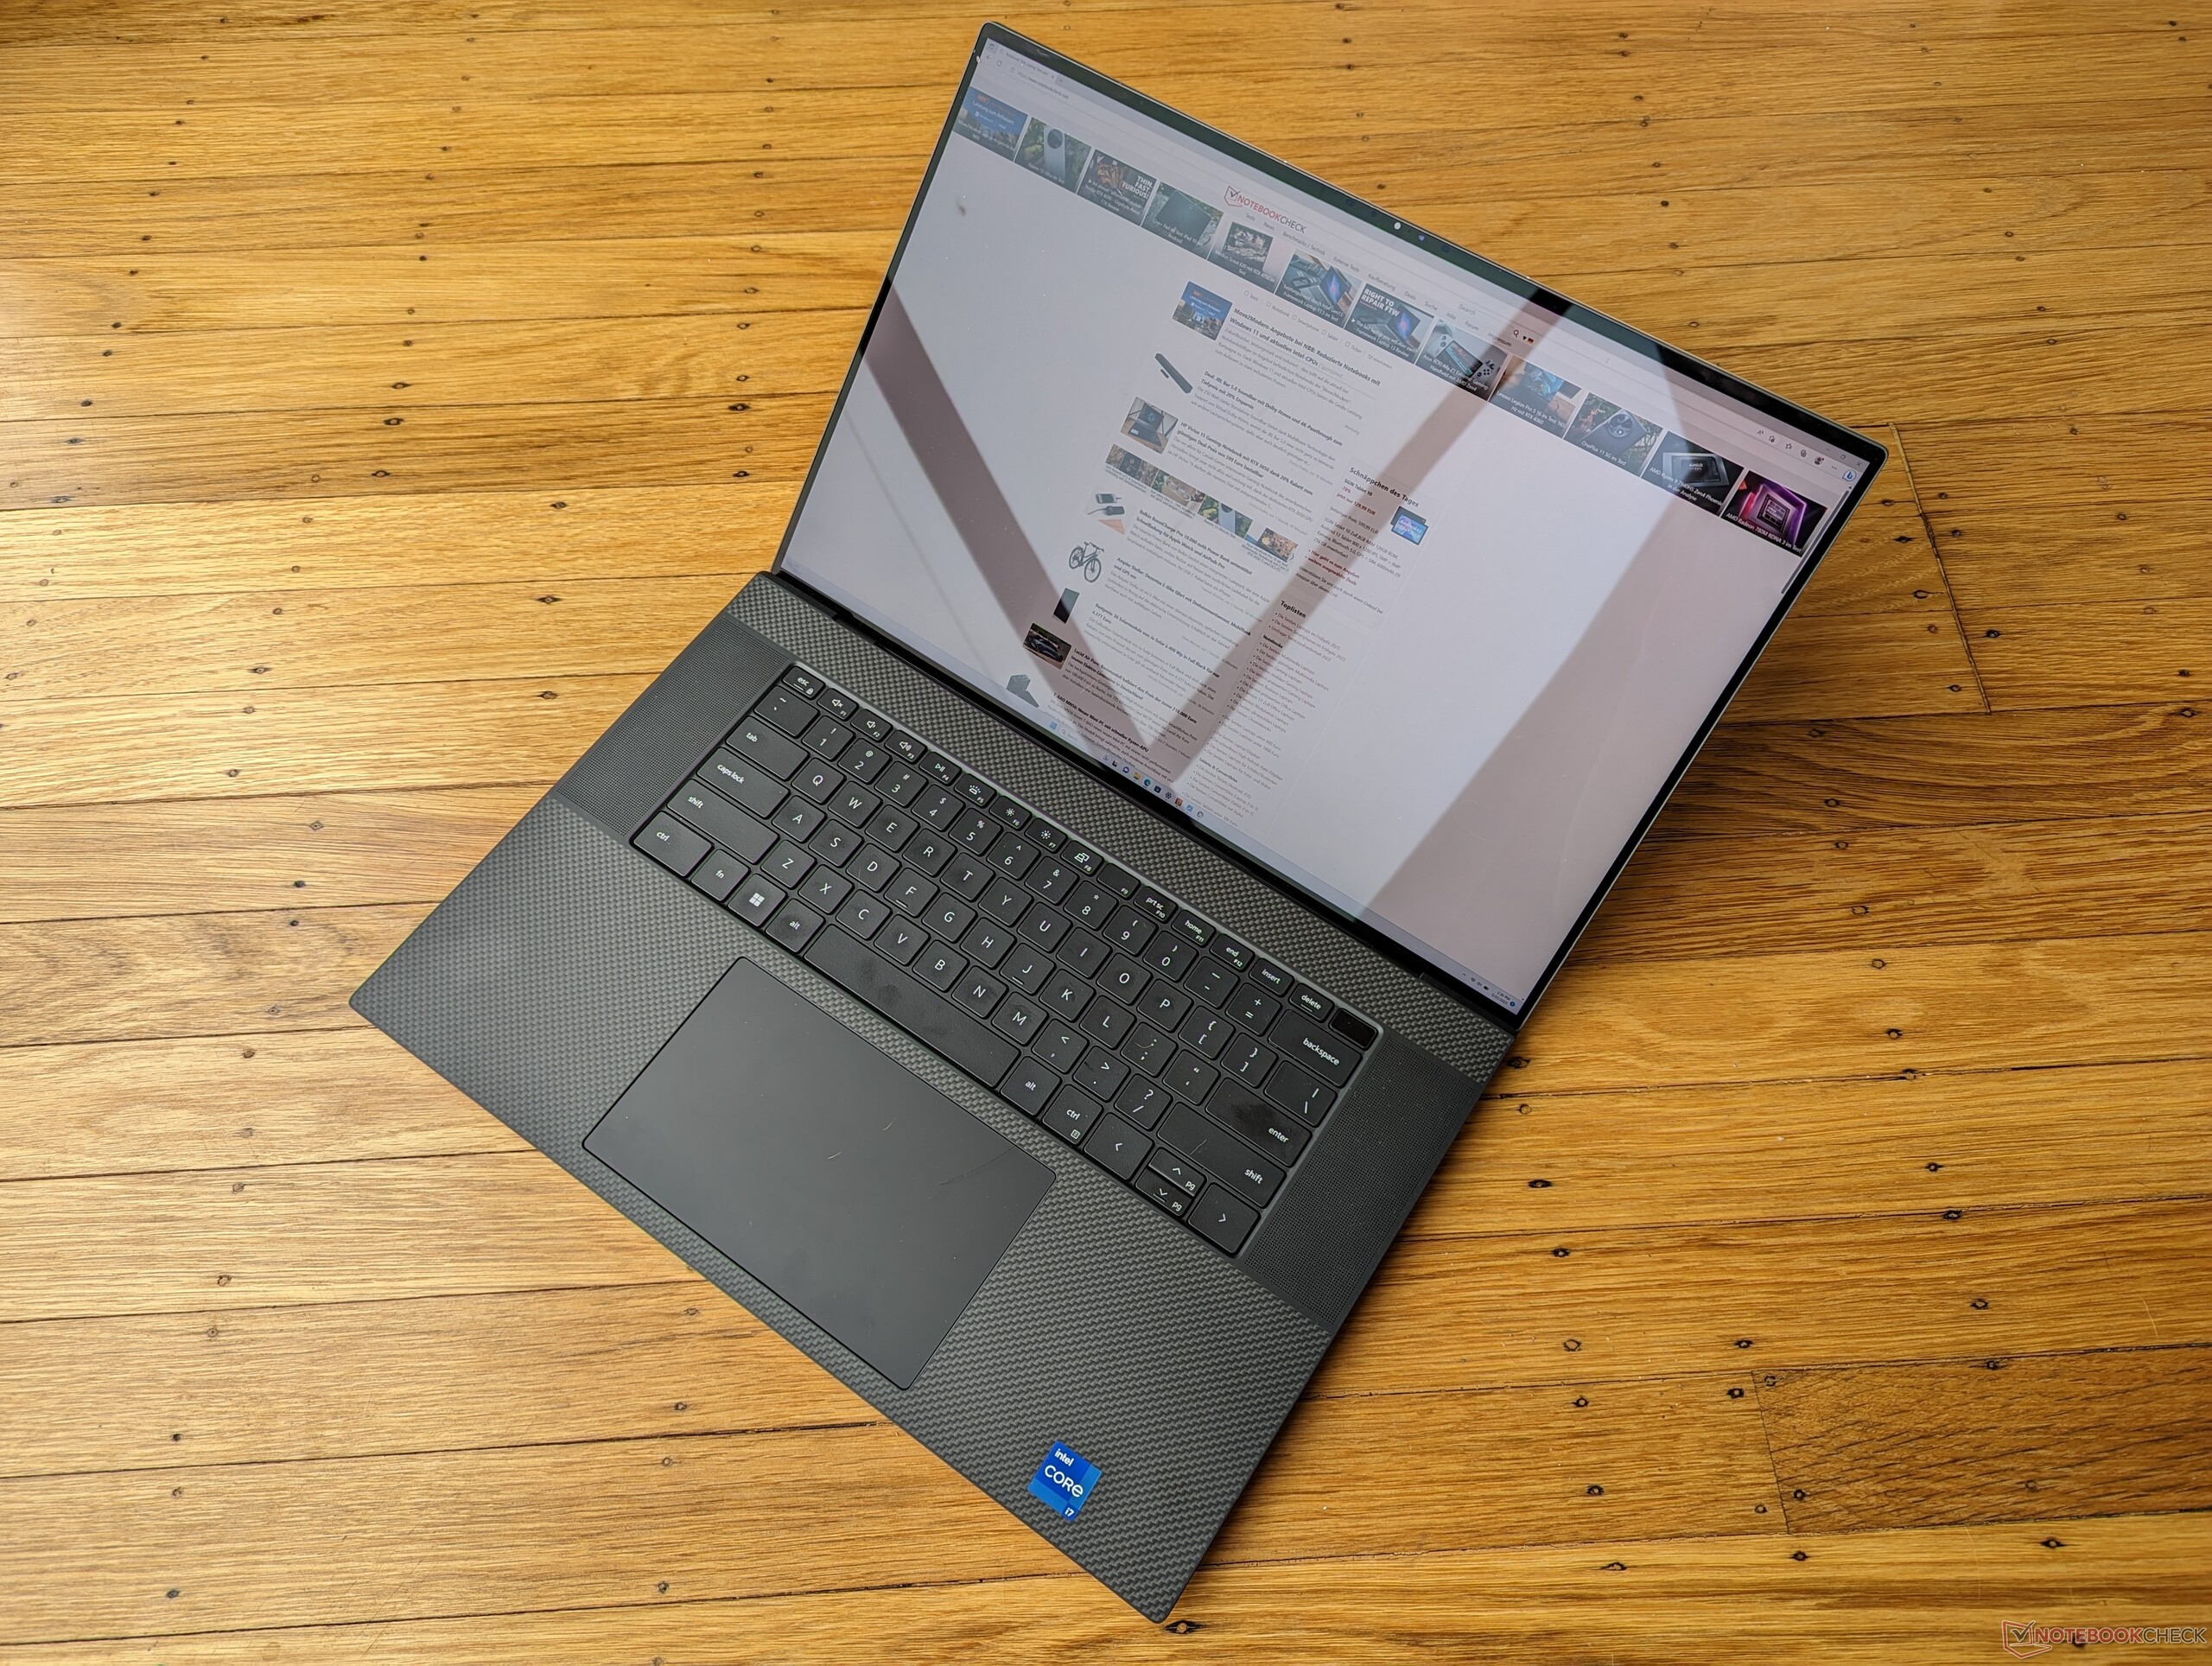
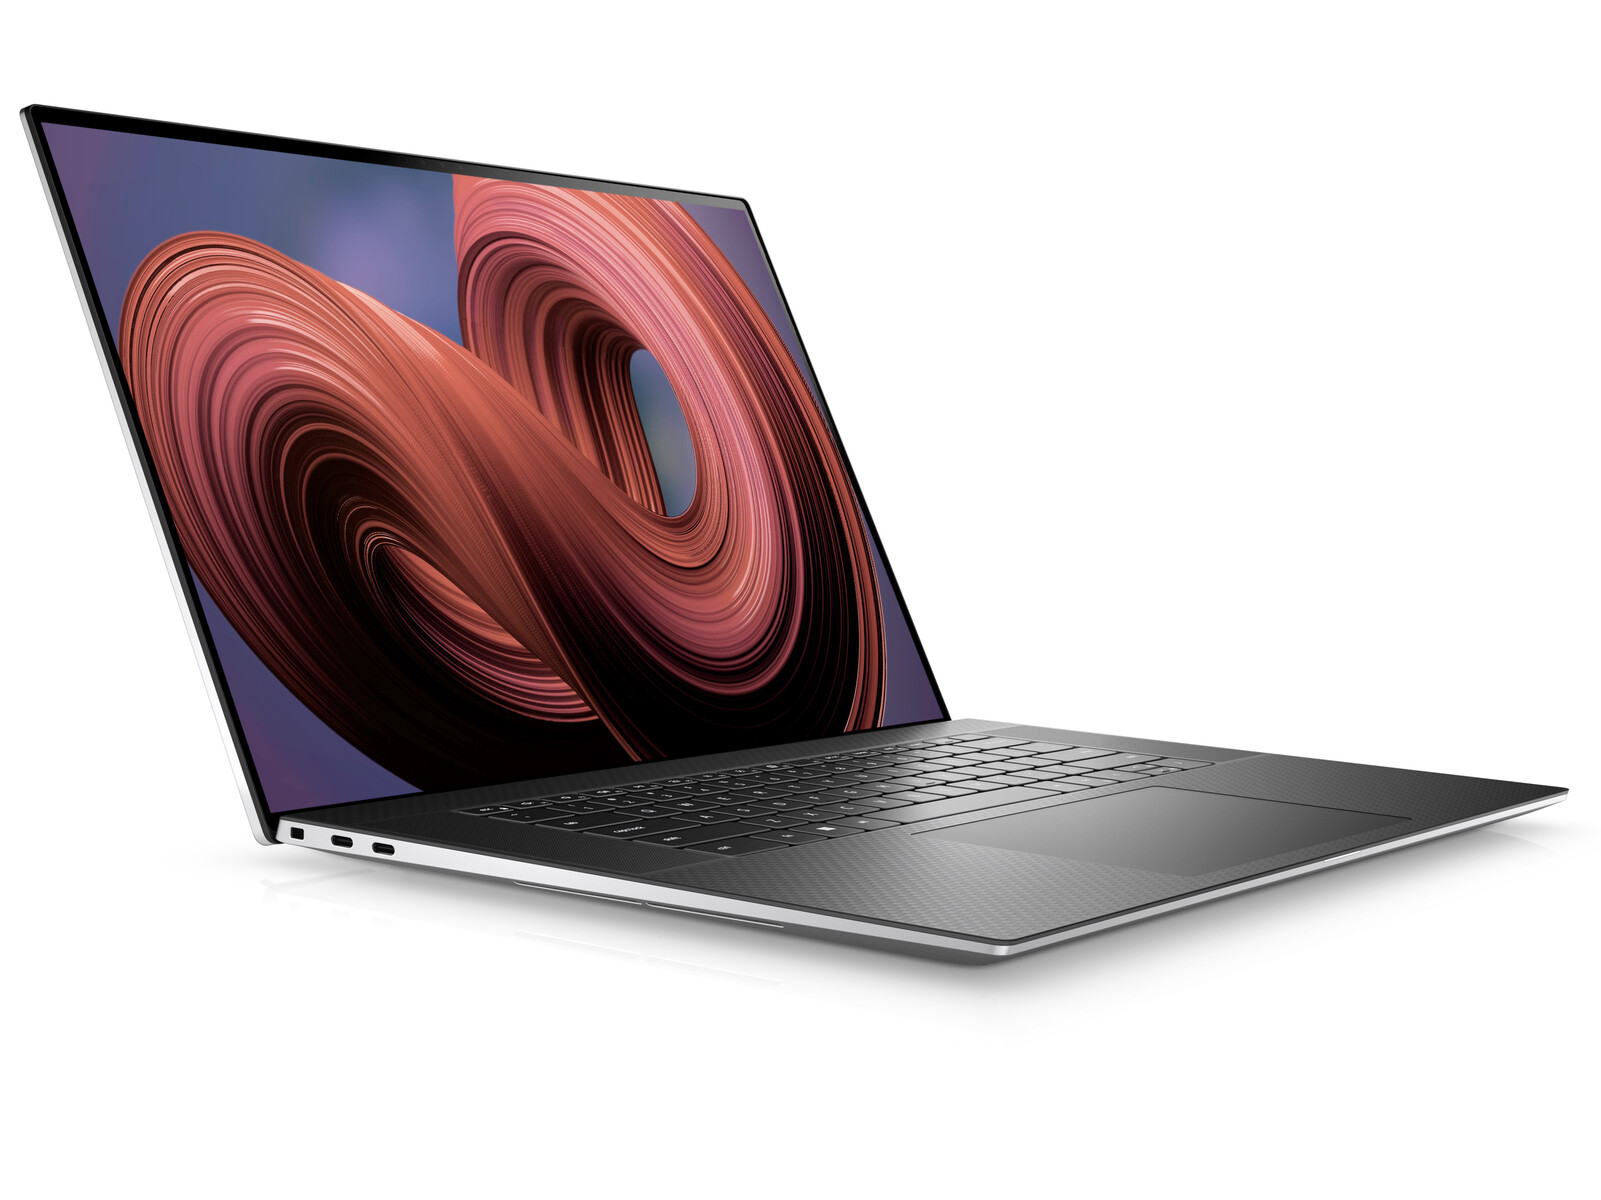
Dell XPS 17 9730 laptop review: GeForce RTX 4070 multimedia monster

De 2023 XPS 17 9730 is de vierde iteratie van de oorspronkelijke 2020 XPS 17 9700 ontwerp. Het is een interne update met 13e gen Intel Raptor Lake-H CPU's en Nvidia Ada Lovelace GPU's om respectievelijk de 12e gen Alder Lake-H en Ampere-opties van vorig jaar te vervangen. Er zijn verder geen grote oppervlakkige veranderingen en dus raden we aan om onze review over de originele XPS 17 9700 om meer te weten te komen over de fysieke kenmerken van de laptop. Eventuele toekomstige redesigns zullen waarschijnlijk inspiratie putten uit de recente XPS 13 Plus serie.
Onze specifieke configuratie in review is een high-end SKU met de Core i7-13700H, GeForce RTX 4070, en UHD+ 2400p glossy touchscreen voor ongeveer $3500 USD retail. Andere SKU's zijn beschikbaar met de RTX 4050, RTX 4060, RTX 4080, Core i9-13900H, of 1200p mat scherm in plaats daarvan. Interessant is dat alle configuraties moeten komen met discrete graphics, terwijl eerdere XPS 17-modellen goedkopere geïntegreerde UHD- of Iris Xe-opties hadden.
Concurrenten in deze ruimte zijn andere vlaggenschip 17-inch multimedia laptops zoals de LG Gram 17, HP Envy 17,MSI Creator Z17of de 16-inchApple MacBook Pro 16.
Meer Dell beoordelingen:
Potentiële concurrenten in vergelijking
Evaluatie | Datum | Model | Gewicht | Hoogte | Formaat | Resolutie | Beste prijs |
|---|---|---|---|---|---|---|---|
| 90 % v7 (old) | 05-2023 | Dell XPS 17 9730 RTX 4070 i7-13700H, GeForce RTX 4070 Laptop GPU | 2.5 kg | 19.5 mm | 17.00" | 3840x2400 | |
| 88.8 % v7 (old) | 06-2022 | Dell XPS 17 9720 RTX 3060 i7-12700H, GeForce RTX 3060 Laptop GPU | 2.5 kg | 19.5 mm | 17.00" | 3840x2400 | |
| 86.4 % v7 (old) | 05-2023 | LG Gram 17 (2023) i7-1360P, Iris Xe G7 96EUs | 1.4 kg | 17.8 mm | 17.00" | 2560x1600 | |
| 86.3 % v7 (old) | 04-2023 | HP Envy 17-cr0079ng i7-1255U, GeForce RTX 2050 Mobile | 2.6 kg | 19.6 mm | 17.30" | 3840x2160 | |
| 83.8 % v7 (old) | 09-2022 | MSI Creator Z17 A12UGST-054 i9-12900H, GeForce RTX 3070 Ti Laptop GPU | 2.5 kg | 19 mm | 17.00" | 2560x1600 | |
| 93.7 % v7 (old) | 03-2023 | Apple MacBook Pro 16 2023 M2 Max M2 Max, M2 Max 38-Core GPU | 2.2 kg | 16.8 mm | 16.20" | 3456x2234 |
Geval - Zelfde ontwerp Drie jaar achtereen
SD-kaartlezer
| SD Card Reader | |
| average JPG Copy Test (av. of 3 runs) | |
| Dell XPS 17 9720 RTX 3060 (Toshiba Exceria Pro SDXC 64 GB UHS-II) | |
| Dell XPS 17 9730 RTX 4070 (Toshiba Exceria Pro SDXC 64 GB UHS-II) | |
| Apple MacBook Pro 16 2023 M2 Max (Angelbird AV Pro V60) | |
| MSI Creator Z17 A12UGST-054 (AV Pro SD microSD 128 GB V60) | |
| HP Envy 17-cr0079ng (AV Pro SD microSD 128 GB V60) | |
| LG Gram 17 (2023) (AV Pro SD microSD 128 GB V60) | |
| maximum AS SSD Seq Read Test (1GB) | |
| Apple MacBook Pro 16 2023 M2 Max (Angelbird AV Pro V60) | |
| Dell XPS 17 9730 RTX 4070 (Toshiba Exceria Pro SDXC 64 GB UHS-II) | |
| Dell XPS 17 9720 RTX 3060 (Toshiba Exceria Pro SDXC 64 GB UHS-II) | |
| LG Gram 17 (2023) (AV Pro SD microSD 128 GB V60) | |
| MSI Creator Z17 A12UGST-054 (AV Pro SD microSD 128 GB V60) | |
| HP Envy 17-cr0079ng (AV Pro SD microSD 128 GB V60) | |
Communicatie - Geen Wi-Fi 6E
De XPS 15 en XPS 17 blijven de enige laptops in de recente geschiedenis die worden geleverd met Wi-Fi 6E WLAN-modules en toch GEEN Wi-Fi 6E-connectiviteit ondersteunen. U kunt dus geen verbinding maken met 6 GHz Wi-Fi netwerken. Dit zou voor de meeste gebruikers geen groot probleem moeten zijn, maar het is toch teleurstellend voor een laptop die meer dan $3500 kost.
| Networking | |
| iperf3 transmit AXE11000 | |
| LG Gram 17 (2023) | |
| Dell XPS 17 9720 RTX 3060 | |
| HP Envy 17-cr0079ng | |
| Dell XPS 17 9730 RTX 4070 | |
| iperf3 receive AXE11000 | |
| LG Gram 17 (2023) | |
| HP Envy 17-cr0079ng | |
| Dell XPS 17 9720 RTX 3060 | |
| Dell XPS 17 9730 RTX 4070 | |
| iperf3 transmit AXE11000 6GHz | |
| Apple MacBook Pro 16 2023 M2 Max | |
| LG Gram 17 (2023) | |
| HP Envy 17-cr0079ng | |
| MSI Creator Z17 A12UGST-054 | |
| iperf3 receive AXE11000 6GHz | |
| Apple MacBook Pro 16 2023 M2 Max | |
| MSI Creator Z17 A12UGST-054 | |
| HP Envy 17-cr0079ng | |
| LG Gram 17 (2023) | |
Webcam - Alleen 720p
De XPS 15 en XPS 17 zijn waarschijnlijk de enige vlaggenschip laptops die nog steeds worden geleverd met lage resolutie 1 MP of 720p webcams en geen privacy shutter. Concurrerende fabrikanten zoals Lenovo, HP, Asus en anderen zijn al overgestapt op 2 MP of zelfs 8 MP oplossingen. Dell zegt dat de super smalle schermrand van het XPS ontwerp de kwaliteit van de webcam sensor beperkt.


Onderhoud

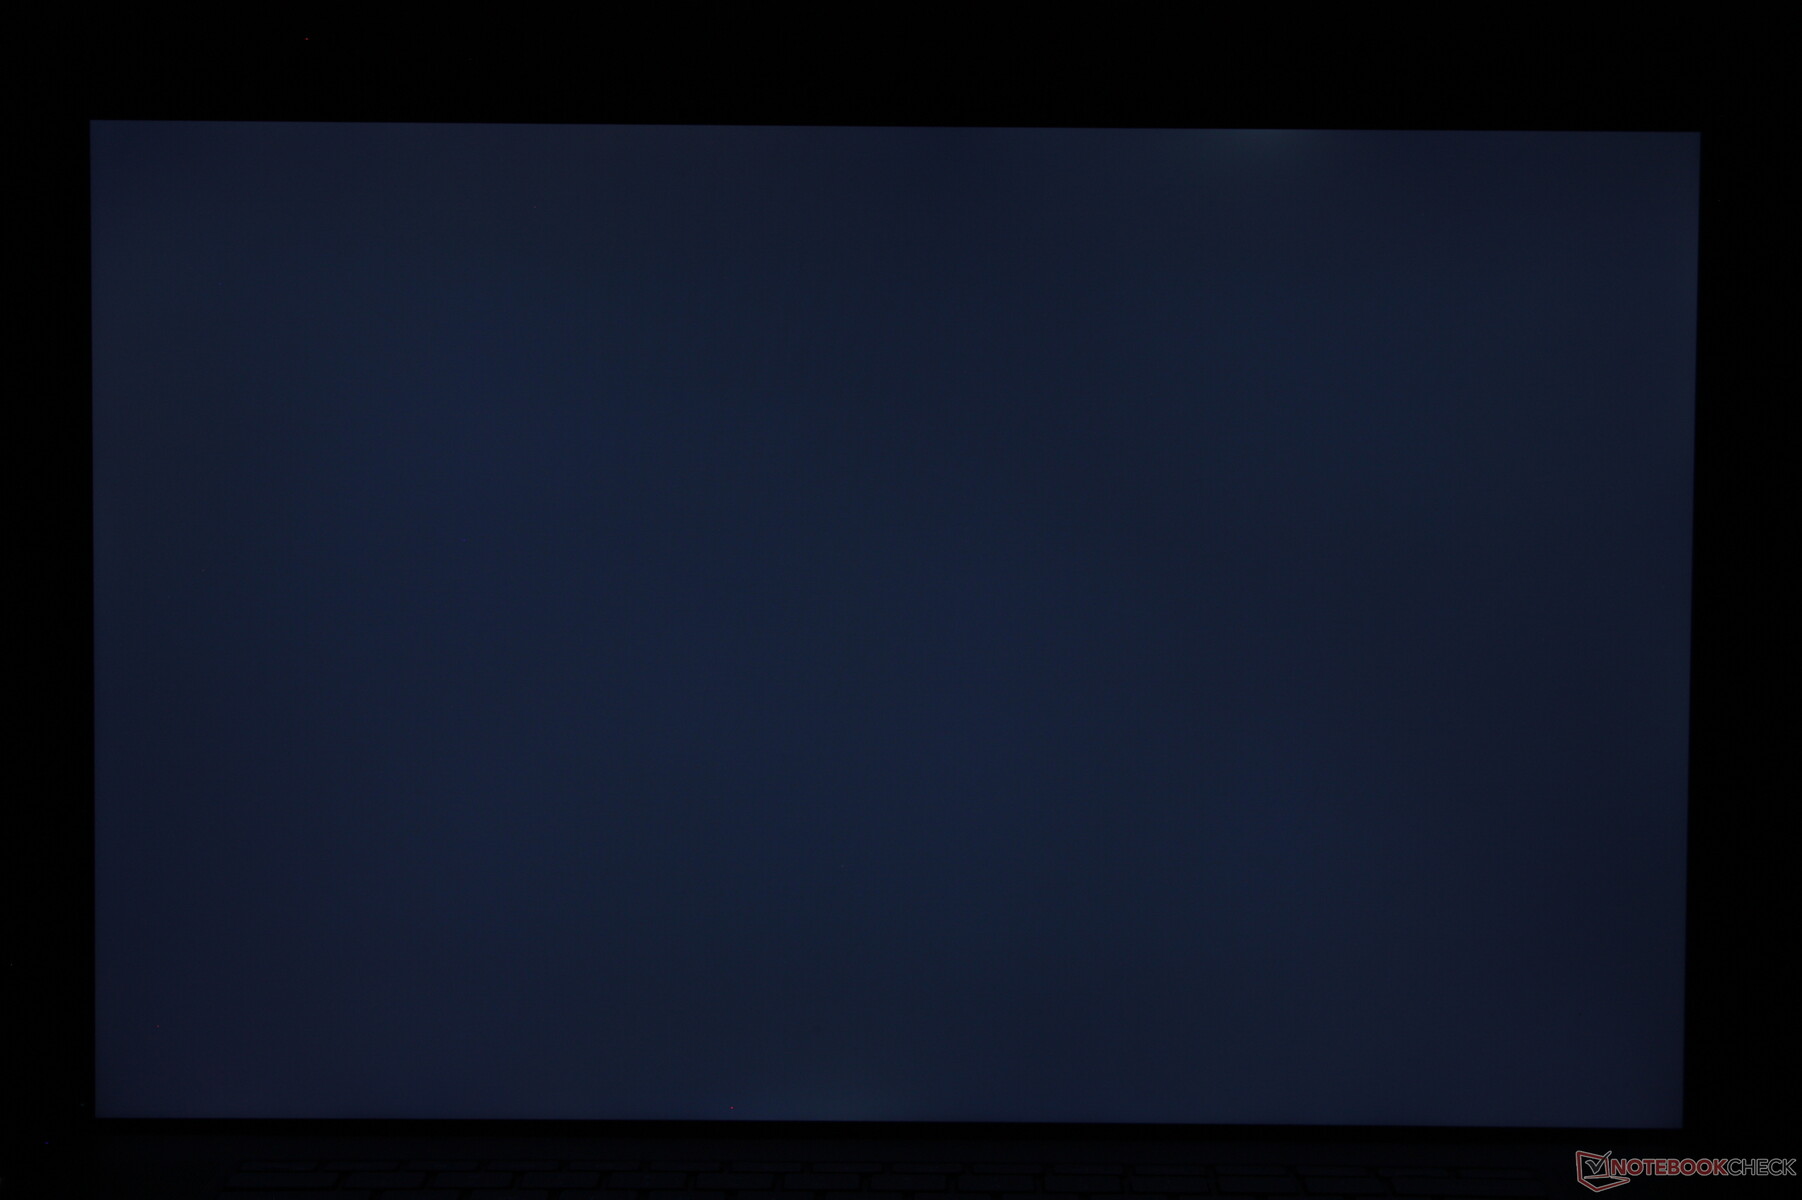
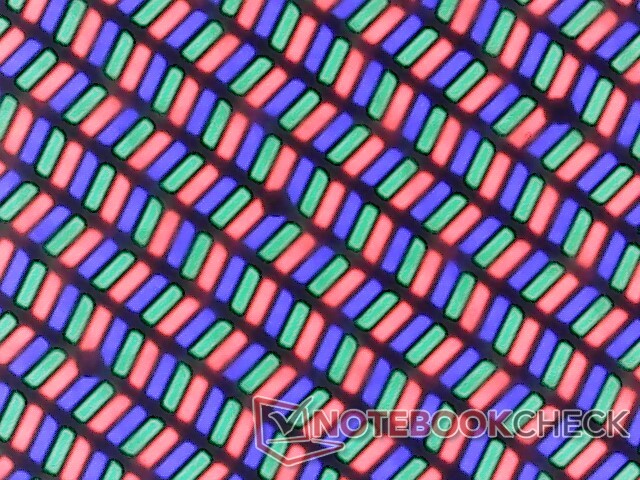
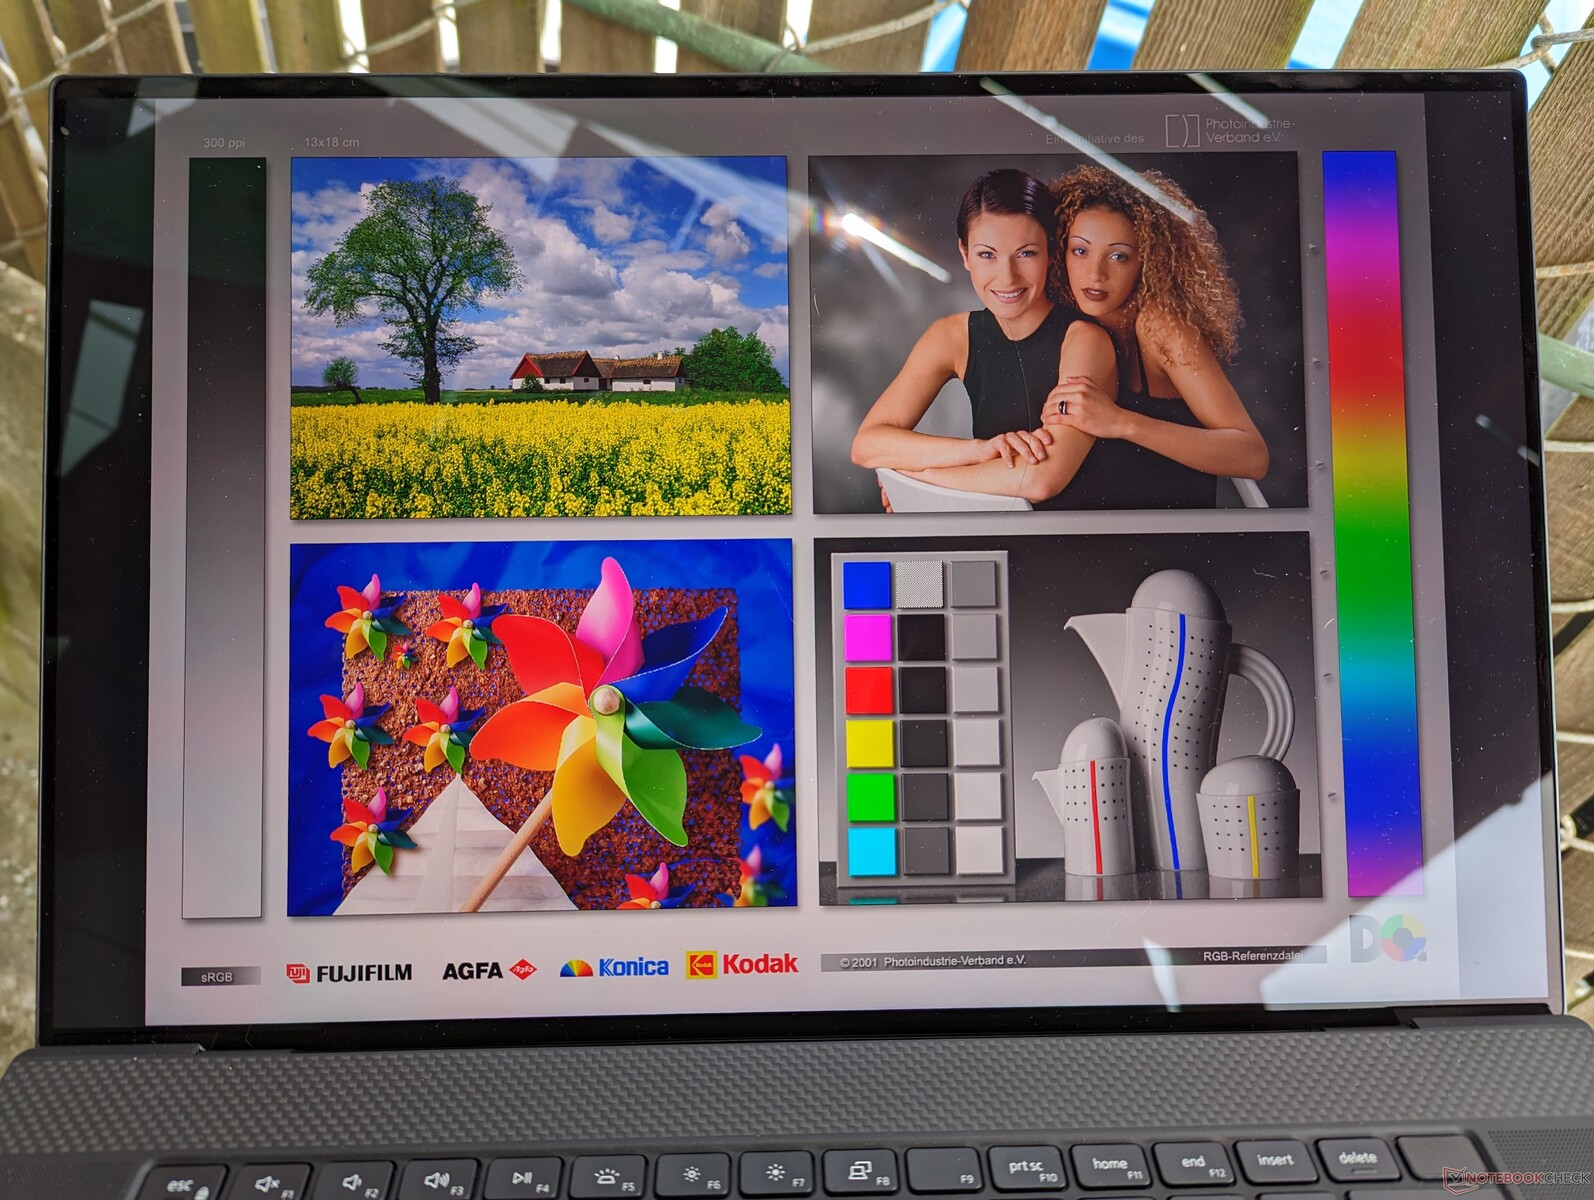
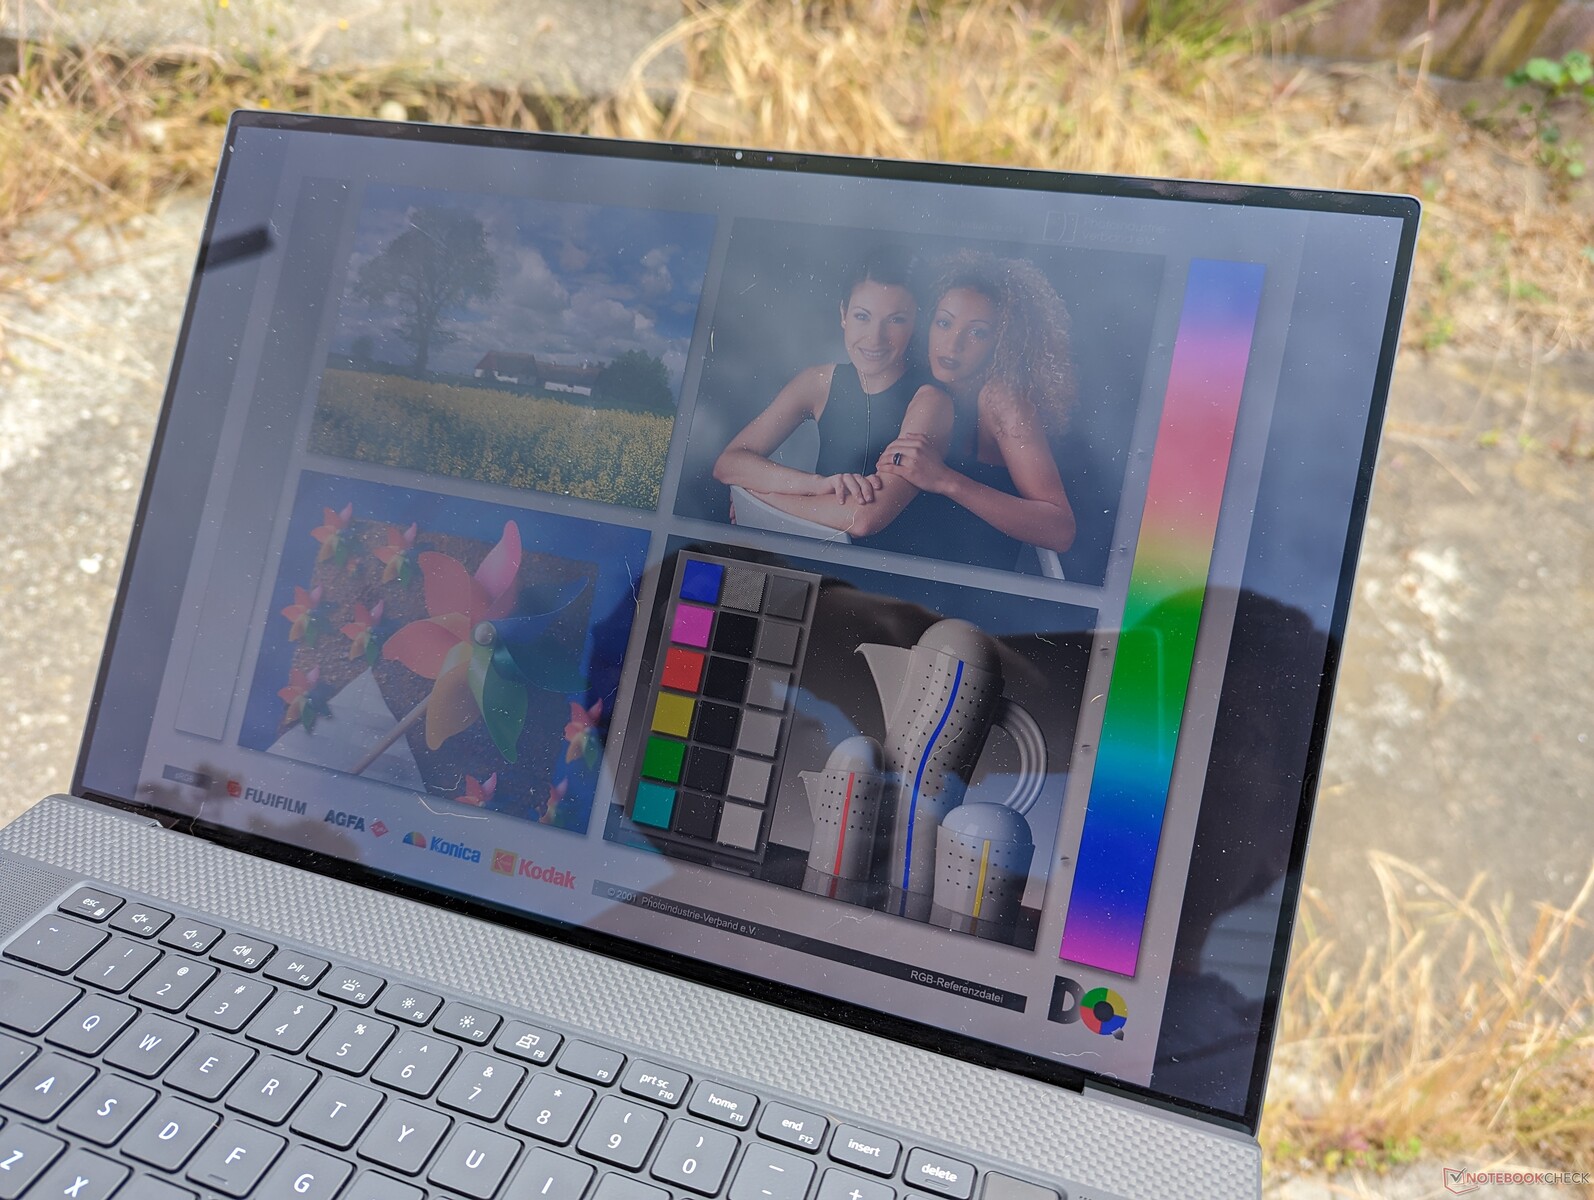
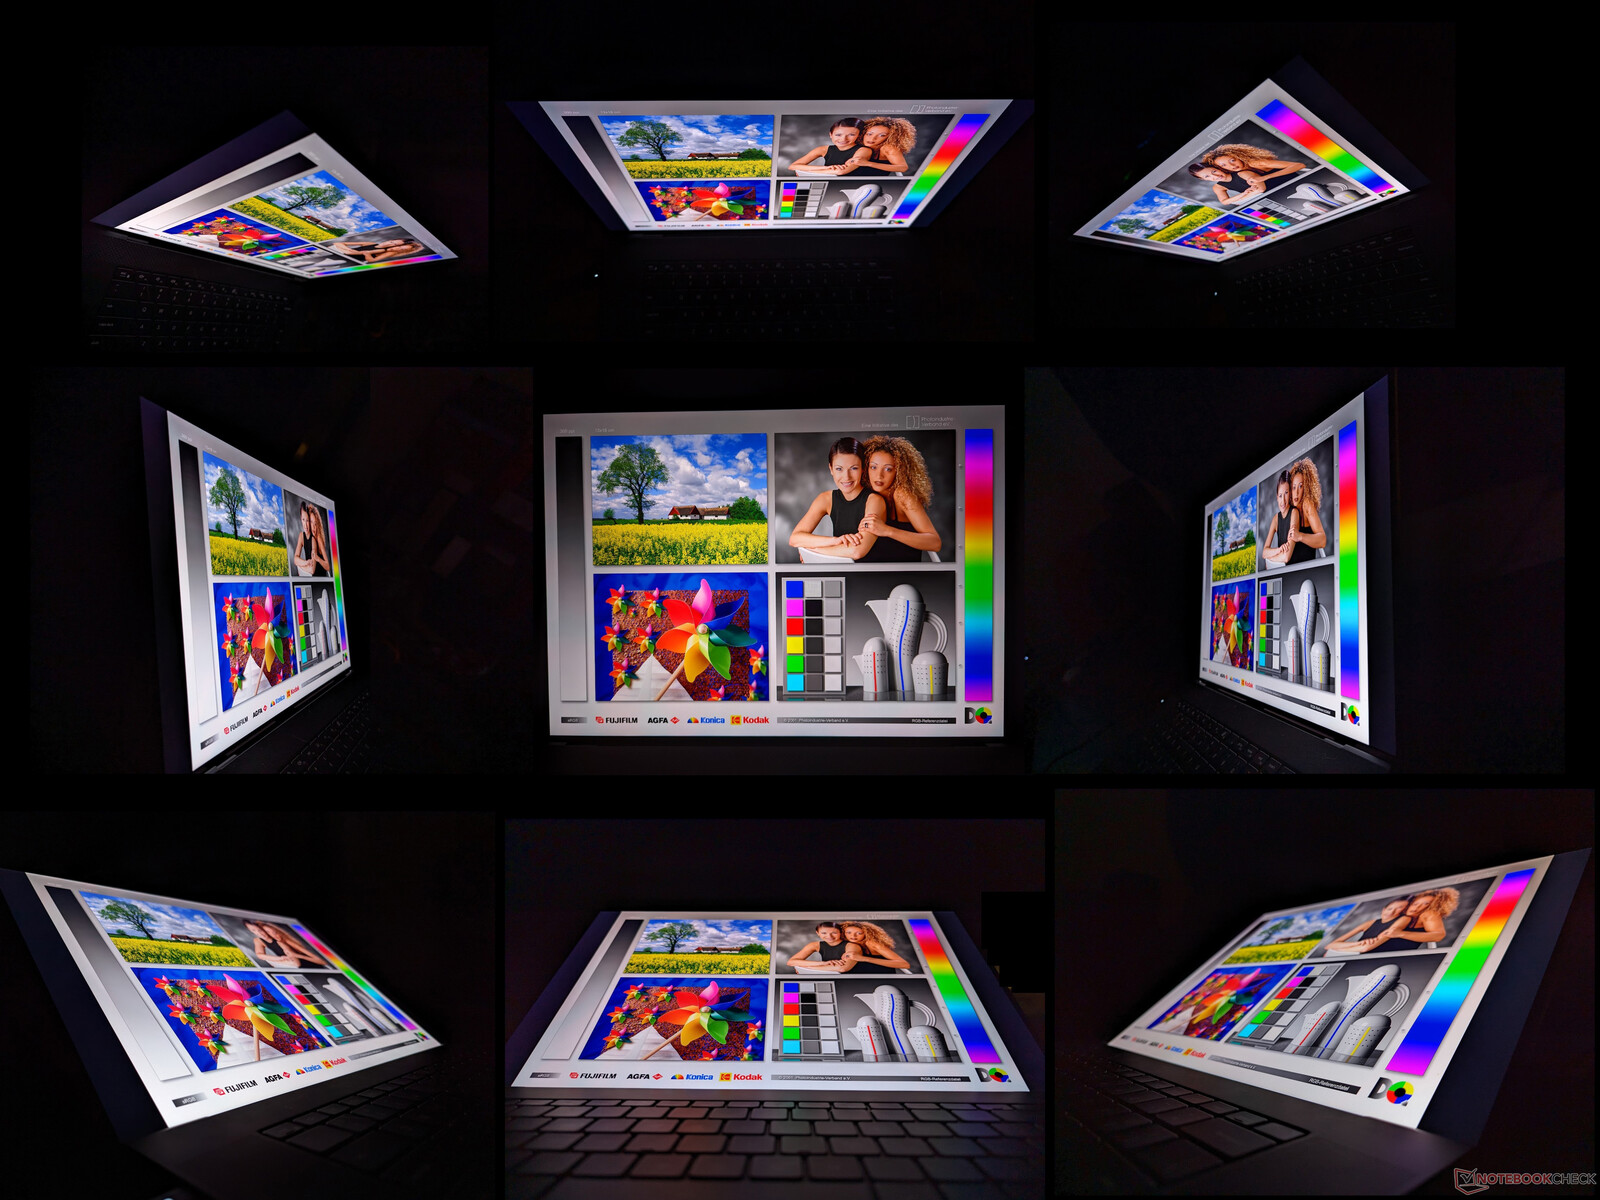
Beeldscherm - nog steeds goed, maar geen 120 Hz optie
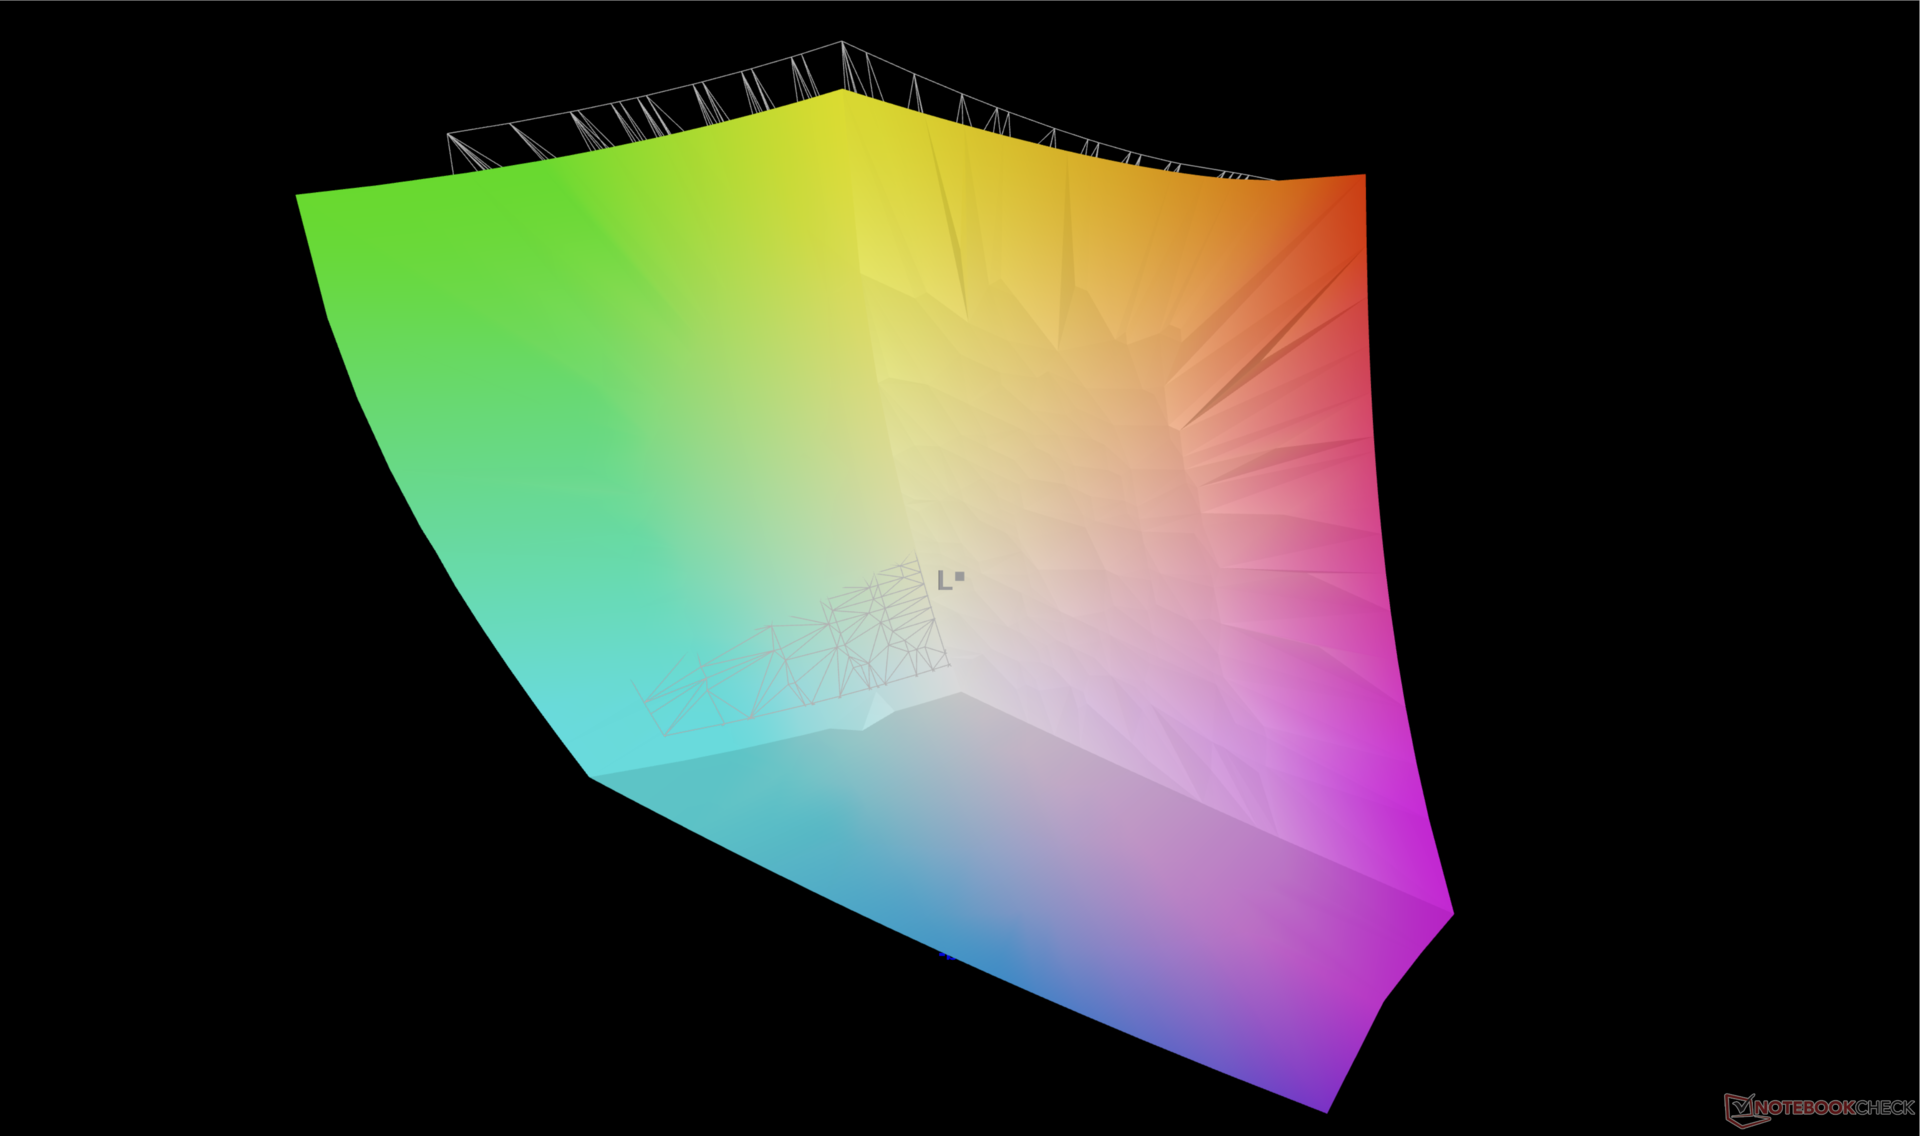
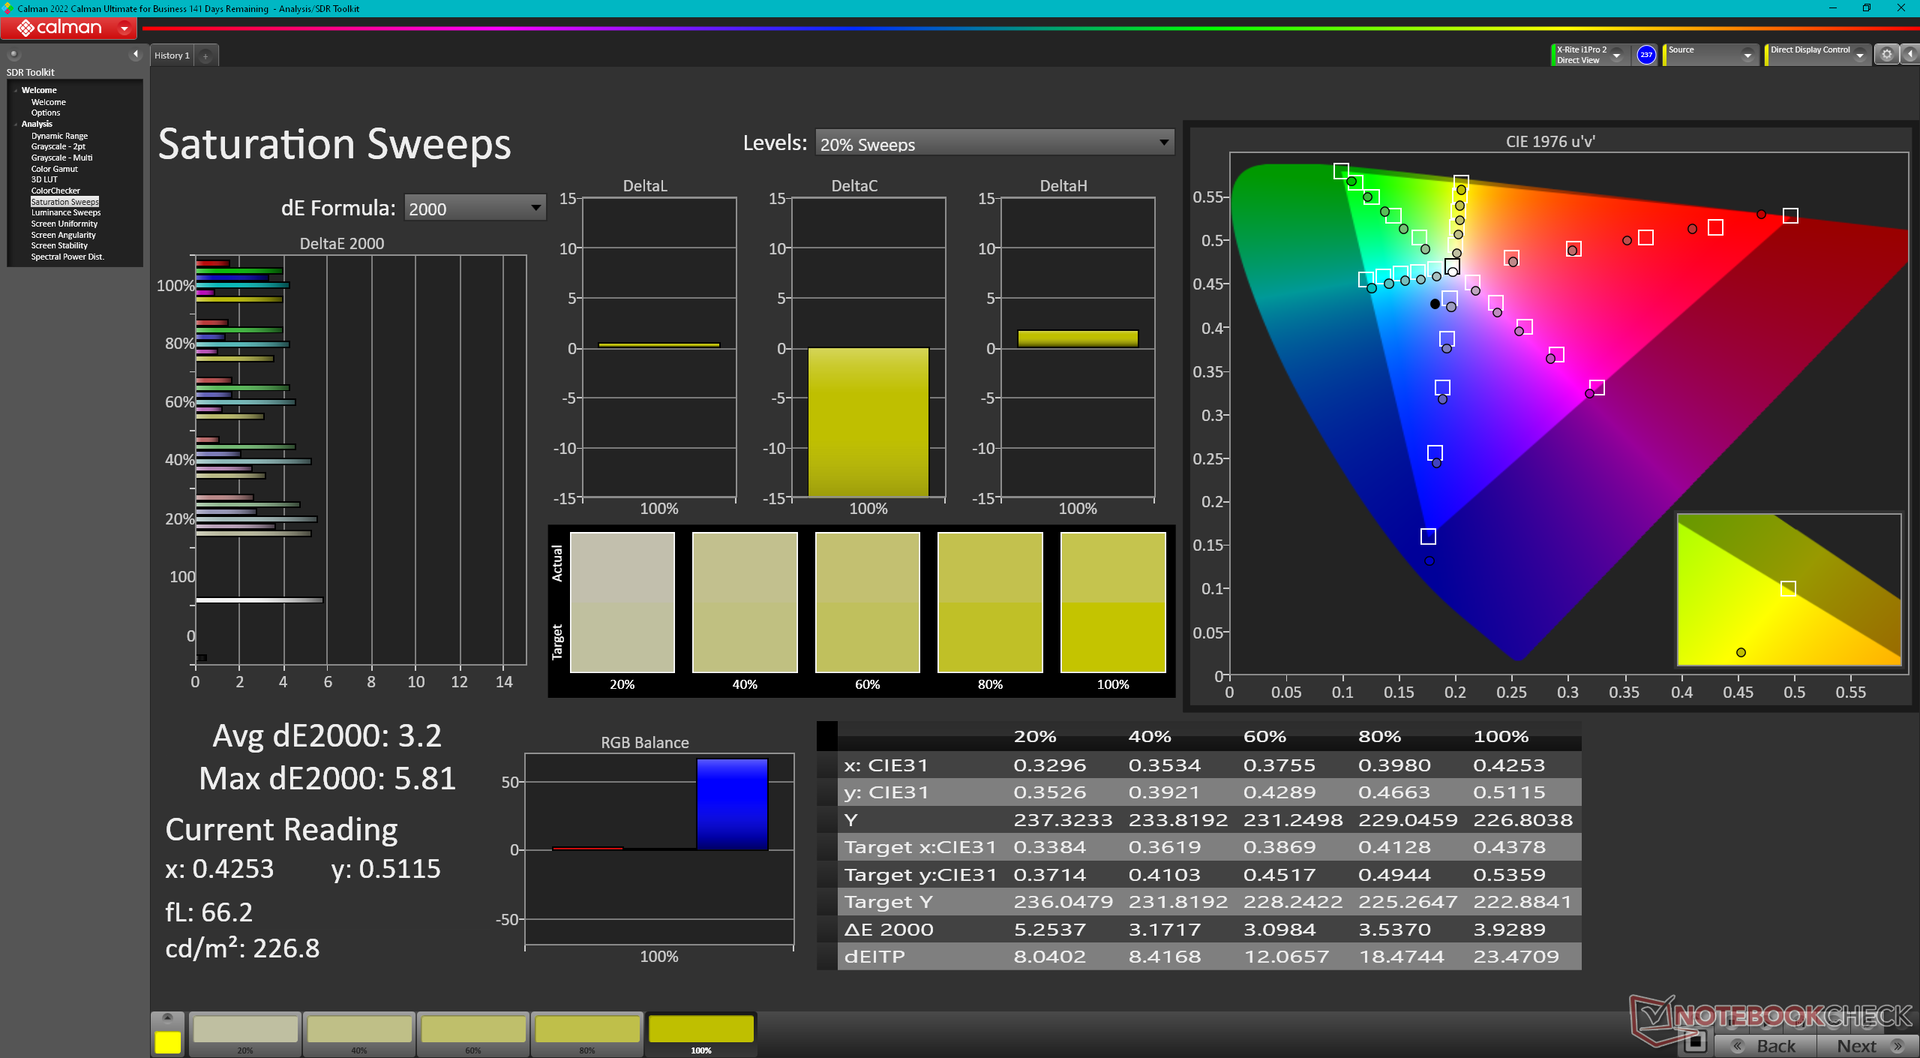
Dell gebruikt al sinds het oorspronkelijke model uit 2020 exact hetzelfde 17,0 inch Sharp LQ170R1 IPS touchscreen paneel voor zijn XPS 17 serie. De visuele ervaring is dus sindsdien identiek gebleven en we raden aan onze bestaande reviews over de 9720, 9710, of 9700 modellen om meer te weten te komen over het scherm. Hoewel de brede DCI-P3 kleuren, goede maximale helderheid, scherpe UHD+ resolutie, en goede 1500:1 contrast ratio nog steeds geweldig zijn, begint de 60 Hz verversingsfrequentie zijn leeftijd te tonen nu 90 Hz of snellere panelen gemeengoed worden op andere multimedia laptops zoals de Asus ZenBook 14 of Lenovo Slim 7i.
| |||||||||||||||||||||||||
Helderheidsverdeling: 85 %
Helderheid in Batterij-modus: 457.4 cd/m²
Contrast: 1475:1 (Zwart: 0.31 cd/m²)
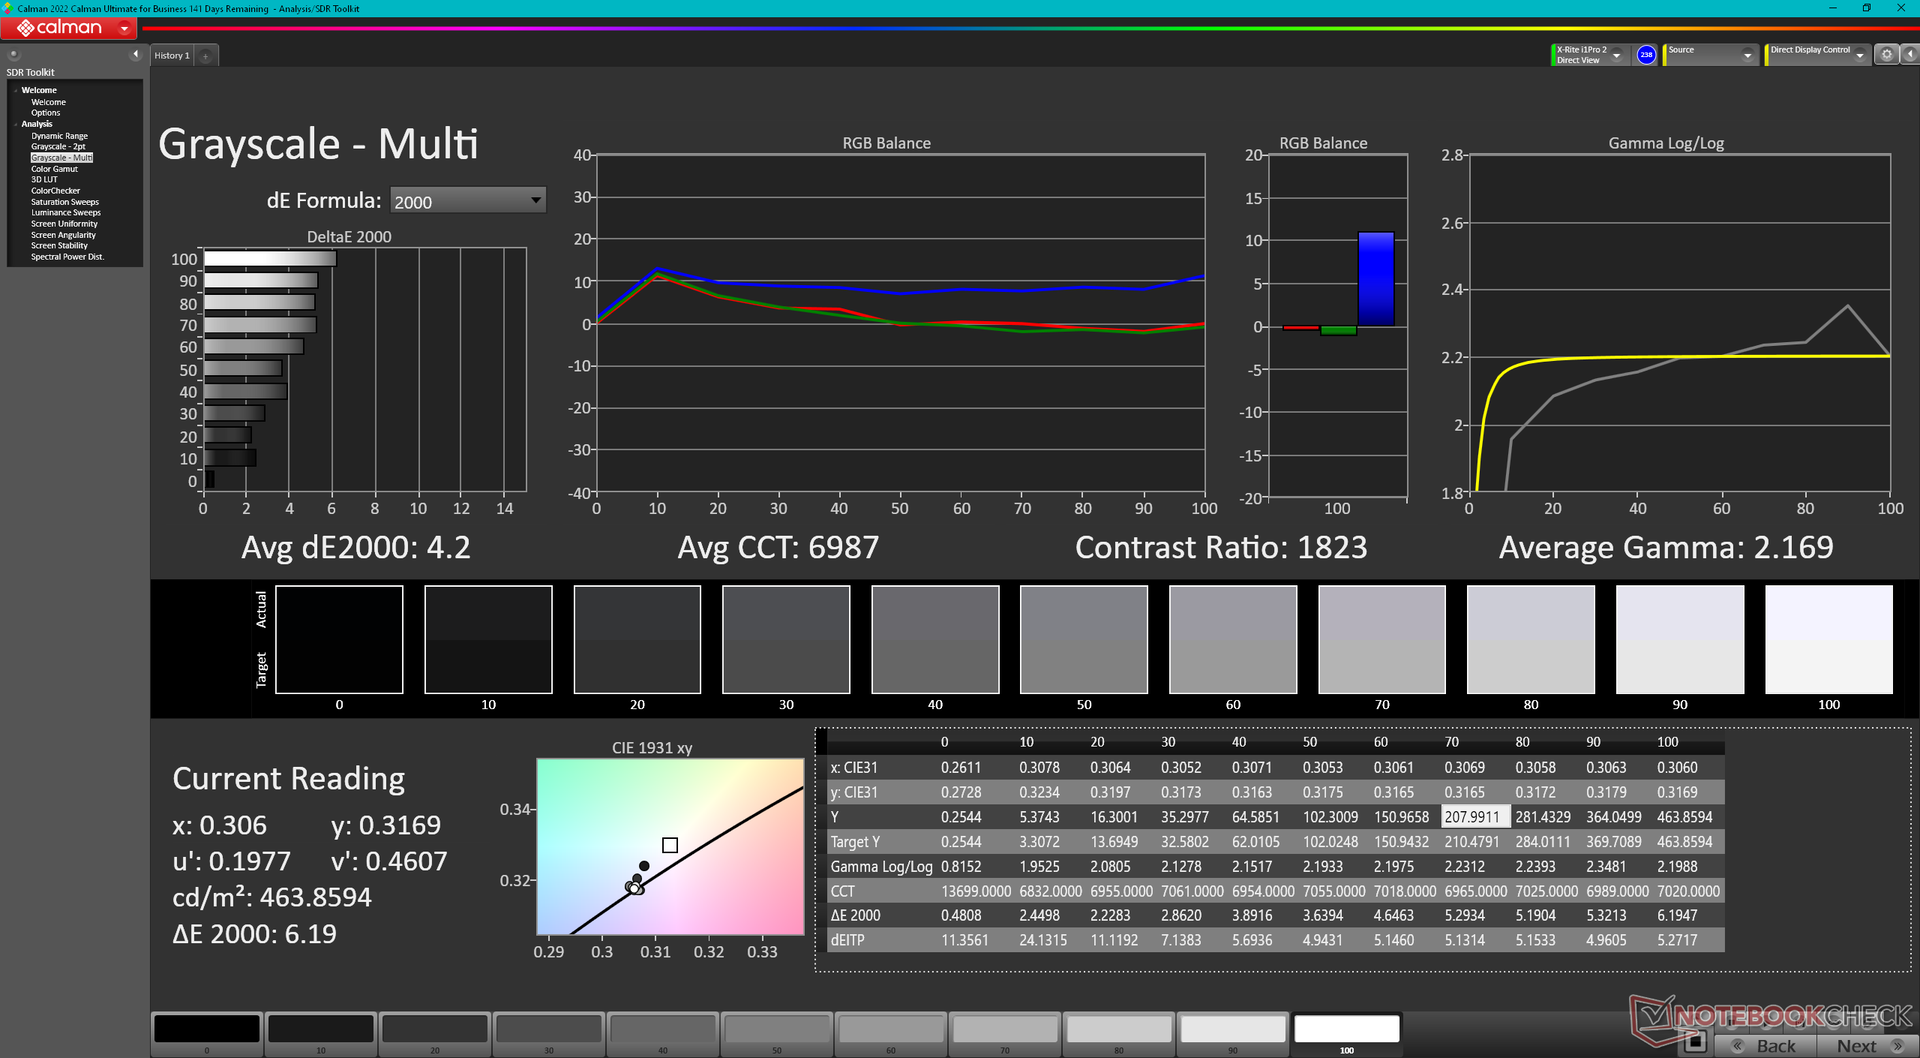
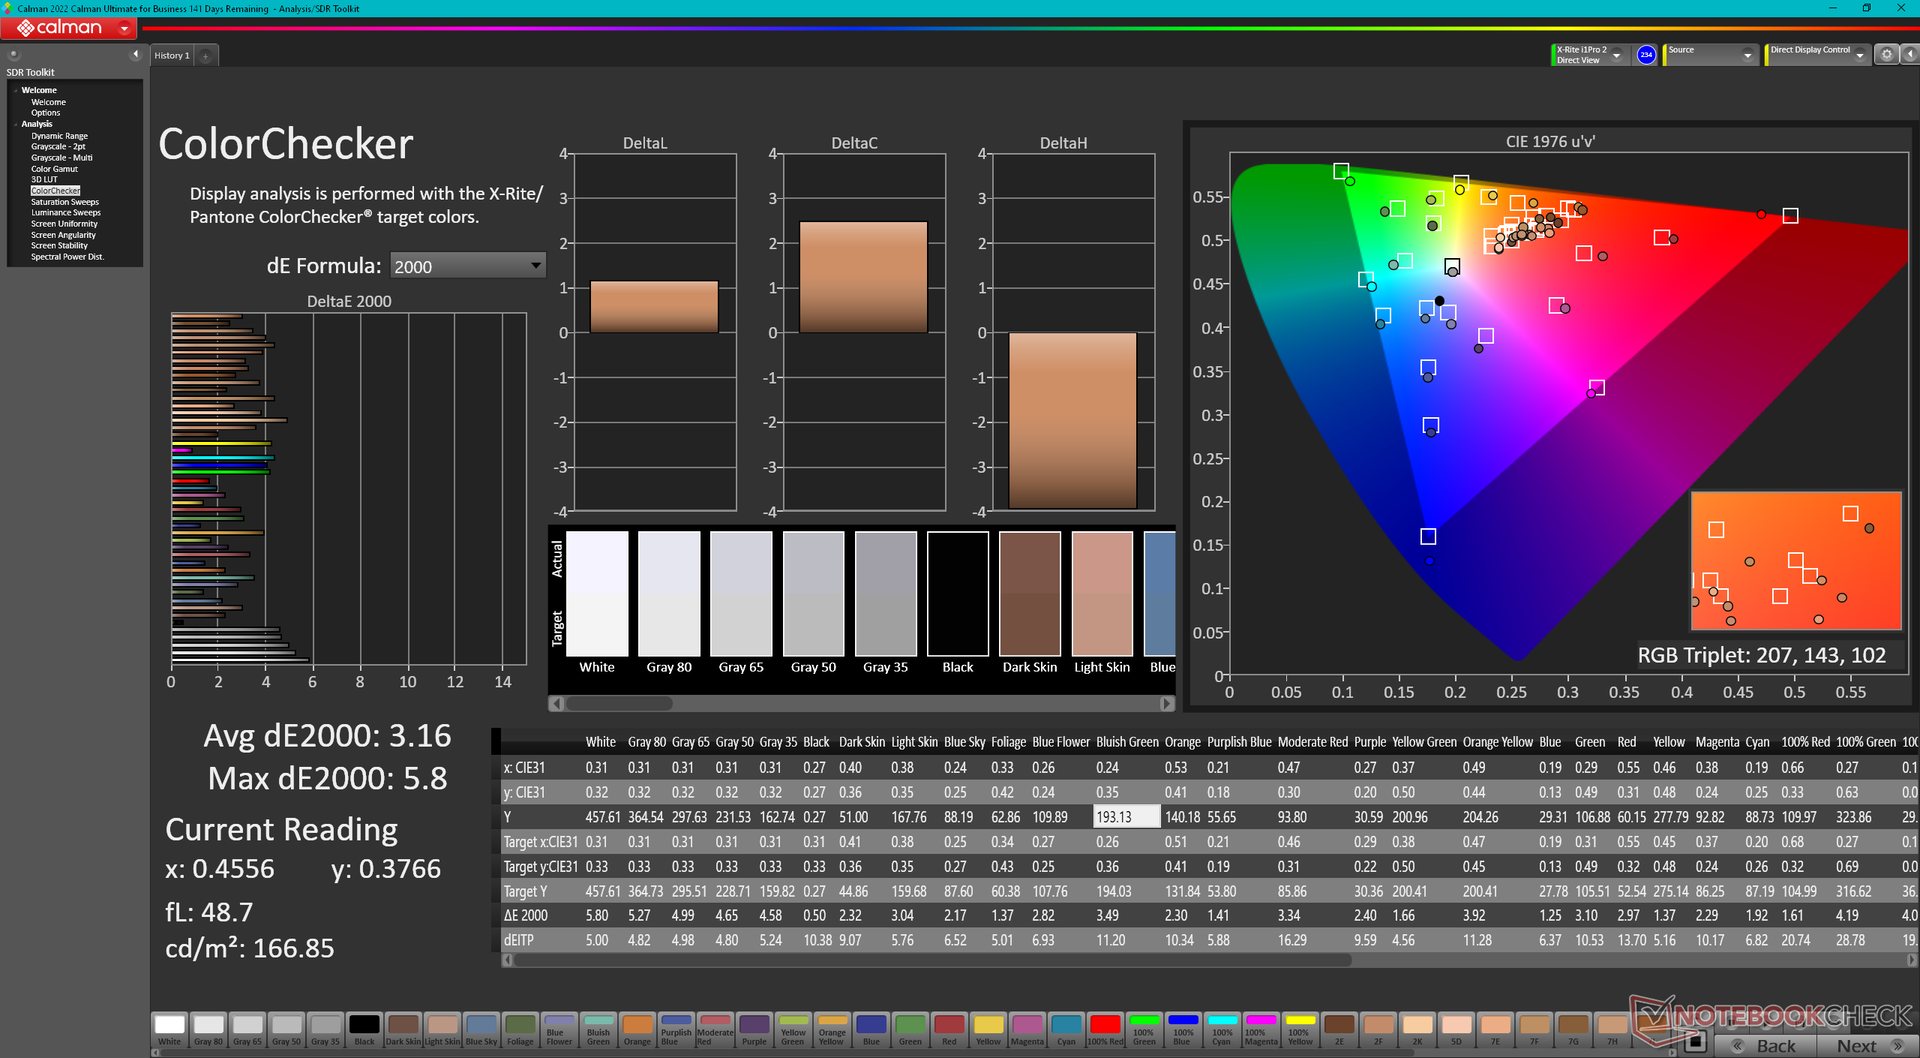
ΔE ColorChecker Calman: 3.16 | ∀{0.5-29.43 Ø4.71}
ΔE Greyscale Calman: 4.2 | ∀{0.09-98 Ø4.96}
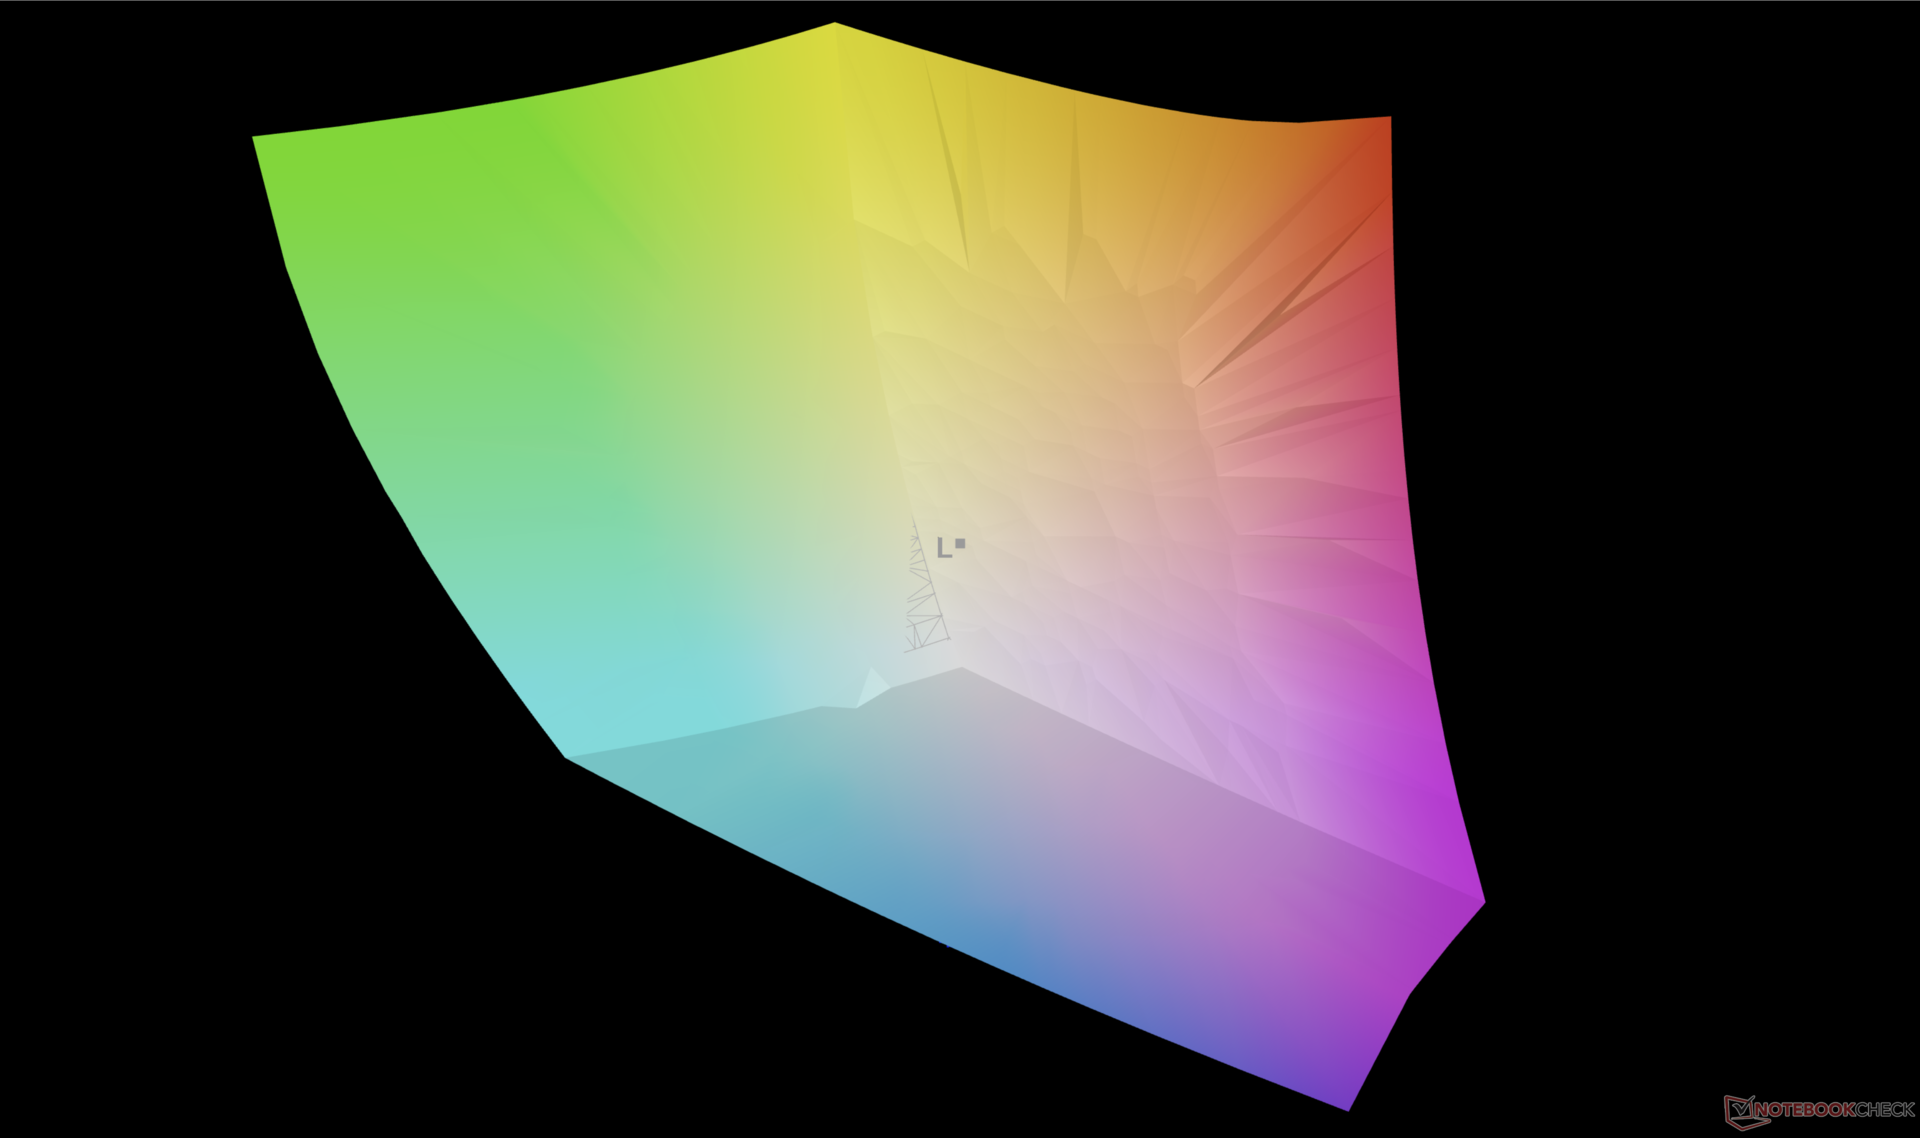
100% AdobeRGB 1998 (Argyll 3D)
100% sRGB (Argyll 3D)
95.2% Display P3 (Argyll 3D)
Gamma: 2.17
CCT: 6987 K
| Dell XPS 17 9730 RTX 4070 10-point capacitive, Sharp LQ170R1, 3840x2400, 17" | Dell XPS 17 9720 RTX 3060 Sharp LQ170R1, IPS, 3840x2400, 17" | LG Gram 17 (2023) LG Display LP170WQ1-SPF2, IPS, 2560x1600, 17" | HP Envy 17-cr0079ng BOE0A66, IPS, 3840x2160, 17.3" | MSI Creator Z17 A12UGST-054 AUO3C9B (B170QAN01.0), IPS, 2560x1600, 17" | Apple MacBook Pro 16 2023 M2 Max Mini-LED, 3456x2234, 16.2" | |
|---|---|---|---|---|---|---|
| Display | -6% | -4% | -3% | -3% | -2% | |
| Display P3 Coverage (%) | 95.2 | 92.9 -2% | 97 2% | 98.31 3% | 98.9 4% | 99 4% |
| sRGB Coverage (%) | 100 | 100 0% | 99.8 0% | 100 0% | 99.9 0% | 100 0% |
| AdobeRGB 1998 Coverage (%) | 100 | 85.3 -15% | 84.9 -15% | 87.03 -13% | 86.4 -14% | 88.5 -11% |
| Response Times | -16% | 80% | 88% | 79% | -70% | |
| Response Time Grey 50% / Grey 80% * (ms) | 42.9 ? | 51.2 ? -19% | 2 ? 95% | 1 98% | 11 ? 74% | 80.5 ? -88% |
| Response Time Black / White * (ms) | 31.3 ? | 35.2 ? -12% | 11 ? 65% | 7 ? 78% | 5 ? 84% | 47.2 ? -51% |
| PWM Frequency (Hz) | 14880 ? | |||||
| Screen | -30% | -6% | 9% | -13% | 4294% | |
| Brightness middle (cd/m²) | 457.4 | 512.7 12% | 405 -11% | 390 -15% | 444 -3% | 504 10% |
| Brightness (cd/m²) | 430 | 463 8% | 363 -16% | 385 -10% | 415 -3% | 487 13% |
| Brightness Distribution (%) | 85 | 85 0% | 82 -4% | 86 1% | 88 4% | 94 11% |
| Black Level * (cd/m²) | 0.31 | 0.32 -3% | 0.225 27% | 0.395 -27% | 0.7 -126% | 0.001 100% |
| Contrast (:1) | 1475 | 1602 9% | 1800 22% | 987 -33% | 634 -57% | 504000 34069% |
| Colorchecker dE 2000 * | 3.16 | 5.98 -89% | 3.35 -6% | 1.66 47% | 2.48 22% | 1.5 53% |
| Colorchecker dE 2000 max. * | 5.8 | 12.09 -108% | 7.96 -37% | 2.9 50% | 3.52 39% | 3.3 43% |
| Greyscale dE 2000 * | 4.2 | 7.2 -71% | 5.28 -26% | 1.83 56% | 3.33 21% | 2.1 50% |
| Gamma | 2.17 101% | 2.54 87% | 2.43 91% | 2.25 98% | 2.33 94% | 2.25 98% |
| CCT | 6987 93% | 6914 94% | 7424 88% | 6727 97% | 6230 104% | 6882 94% |
| Colorchecker dE 2000 calibrated * | 1.34 | 1.16 | 2.91 | |||
| Totaal Gemiddelde (Programma / Instellingen) | -17% /
-22% | 23% /
7% | 31% /
18% | 21% /
3% | 1407% /
2631% |
* ... kleiner is beter
Responstijd Scherm
| ↔ Responstijd Zwart naar Wit | ||
|---|---|---|
| 31.3 ms ... stijging ↗ en daling ↘ gecombineerd | ↗ 16.9 ms stijging | 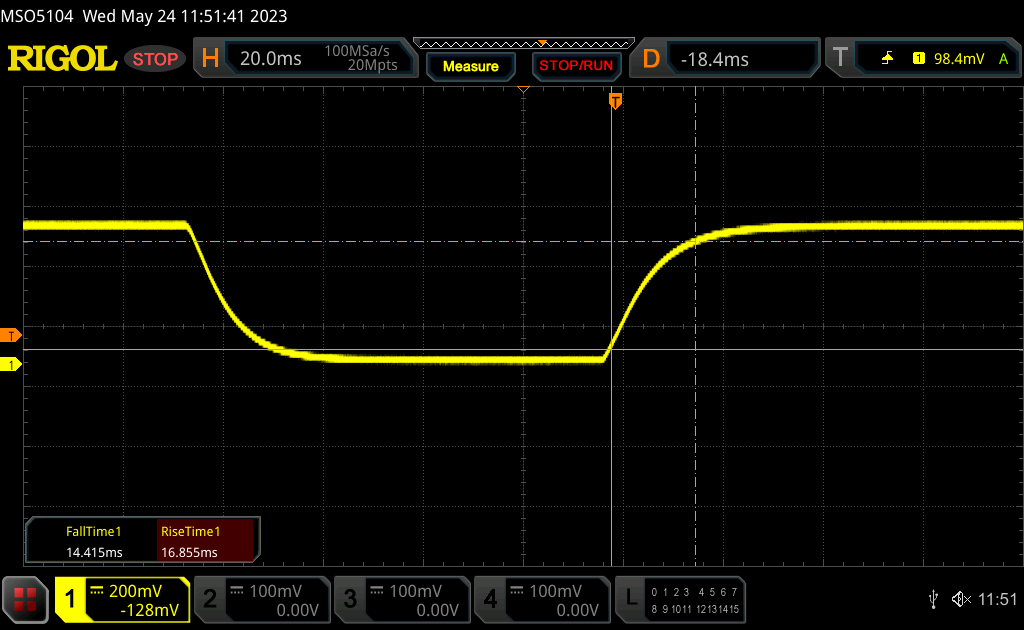 |
| ↘ 14.4 ms daling | ||
| Het scherm vertoonde trage responstijden in onze tests en is misschien te traag voor games. Ter vergelijking: alle testtoestellen variëren van 0.1 (minimum) tot 240 (maximum) ms. » 85 % van alle toestellen zijn beter. Dit betekent dat de gemeten responstijd slechter is dan het gemiddelde (19.8 ms) van alle geteste toestellen. | ||
| ↔ Responstijd 50% Grijs naar 80% Grijs | ||
| 42.9 ms ... stijging ↗ en daling ↘ gecombineerd | ↗ 19.9 ms stijging | 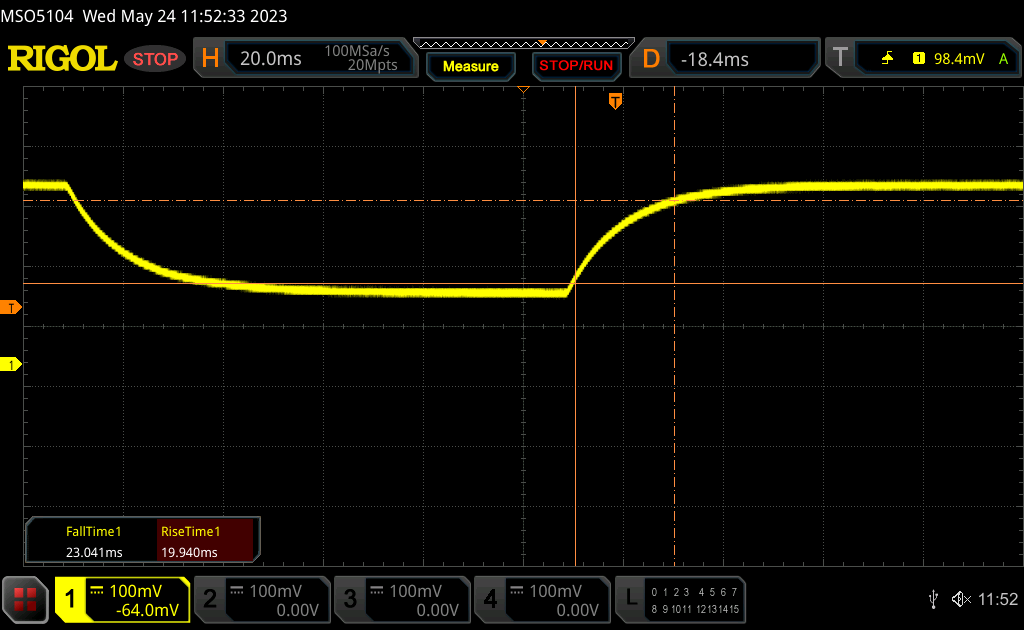 |
| ↘ 23 ms daling | ||
| Het scherm vertoonde trage responstijden in onze tests en is misschien te traag voor games. Ter vergelijking: alle testtoestellen variëren van 0.165 (minimum) tot 636 (maximum) ms. » 71 % van alle toestellen zijn beter. Dit betekent dat de gemeten responstijd slechter is dan het gemiddelde (31 ms) van alle geteste toestellen. | ||
Screen Flickering / PWM (Pulse-Width Modulation)
| Screen flickering / PWM niet waargenomen | 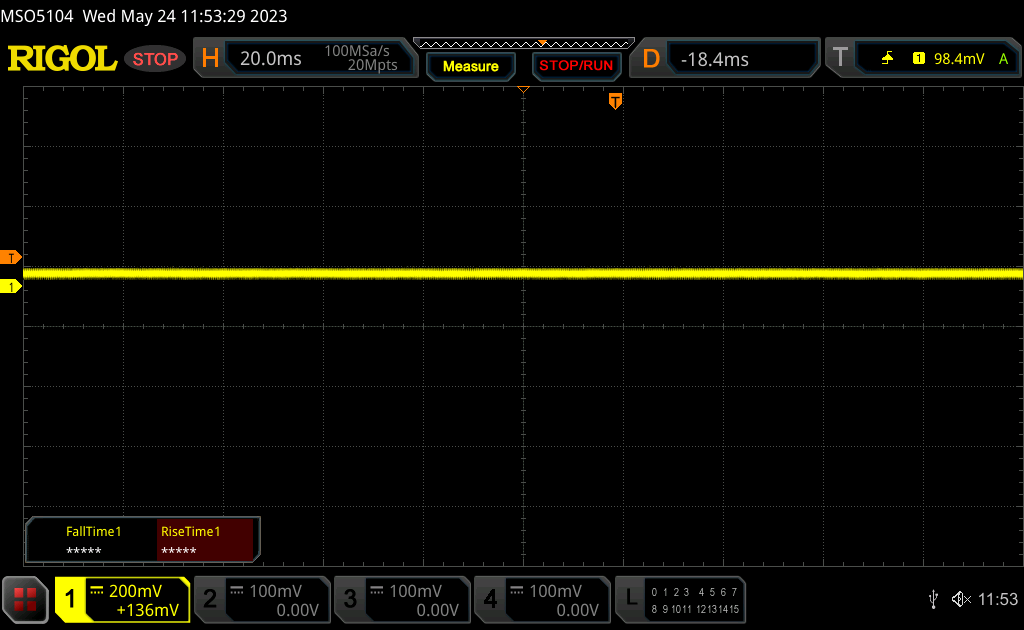 | ||
Ter vergelijking: 52 % van alle geteste toestellen maakten geen gebruik van PWM om de schermhelderheid te verlagen. Als het wel werd gebruikt, werd een gemiddelde van 7754 (minimum: 5 - maximum: 343500) Hz waargenomen. | |||
Prestaties - 13e generatie Intel + Nvidia Ada Lovelace
Testomstandigheden
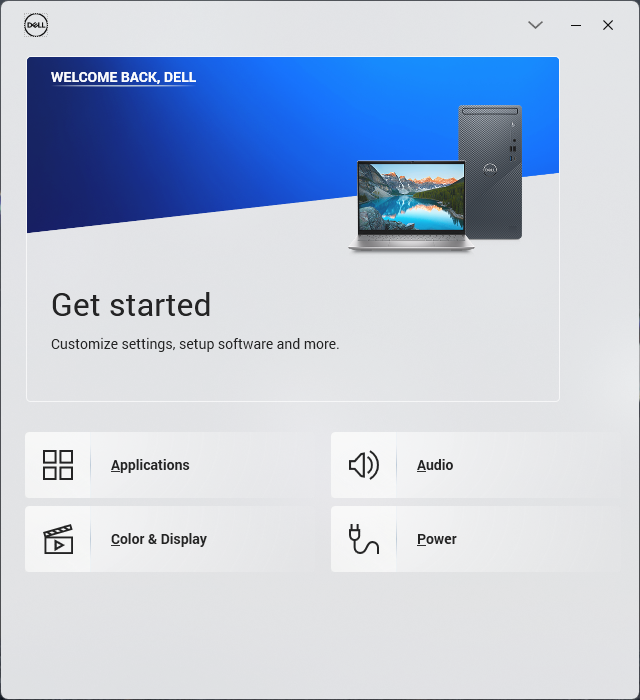
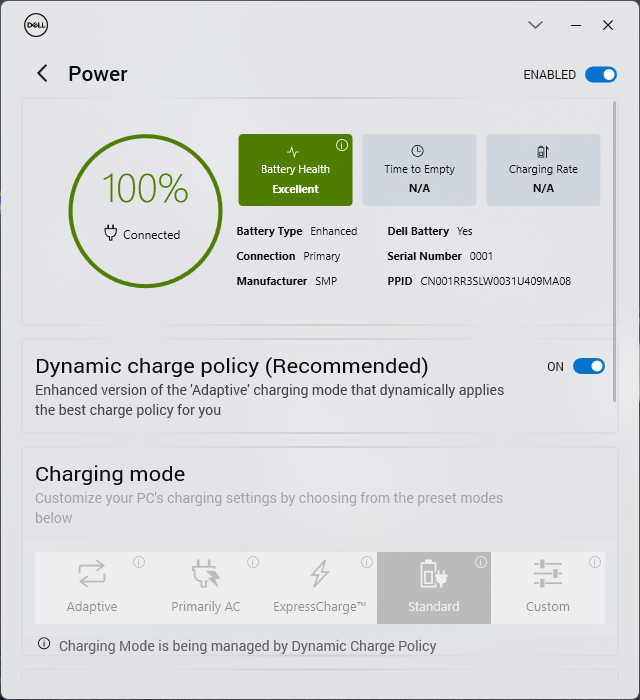
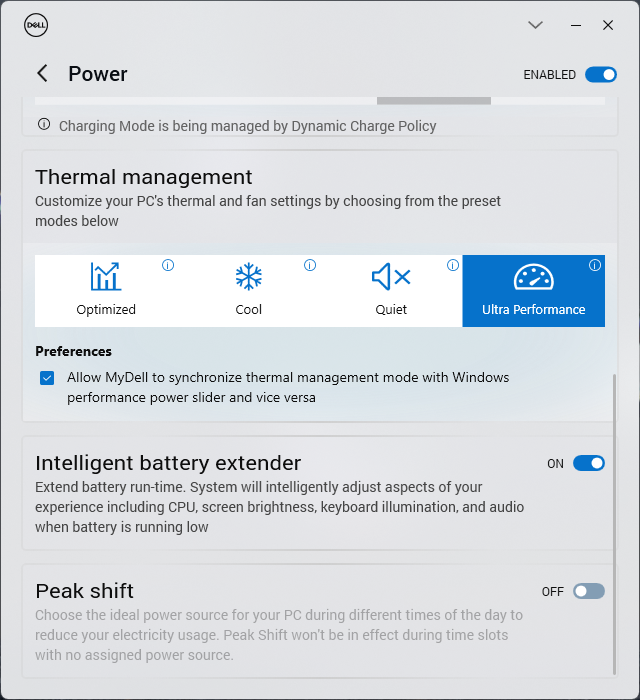
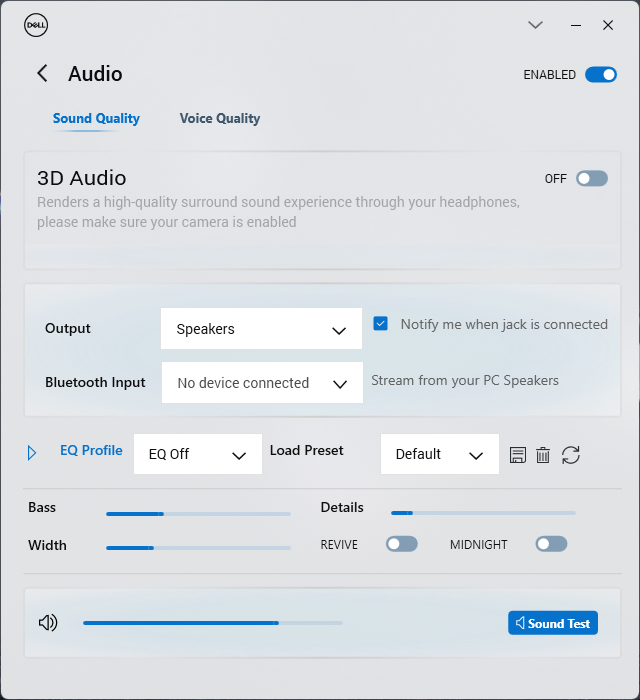
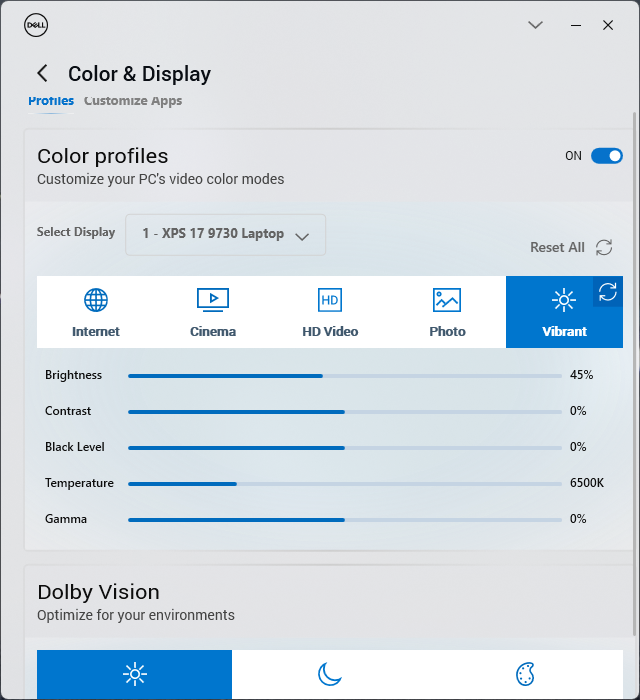
We hebben ons toestel via de MyDell software in de Performance modus gezet voordat we onderstaande benchmarks uitvoerden. De Dell energie profiel instellingen zijn handig gesynchroniseerd met de Windows energie profiel instellingen in tegenstelling tot de meeste andere laptops.
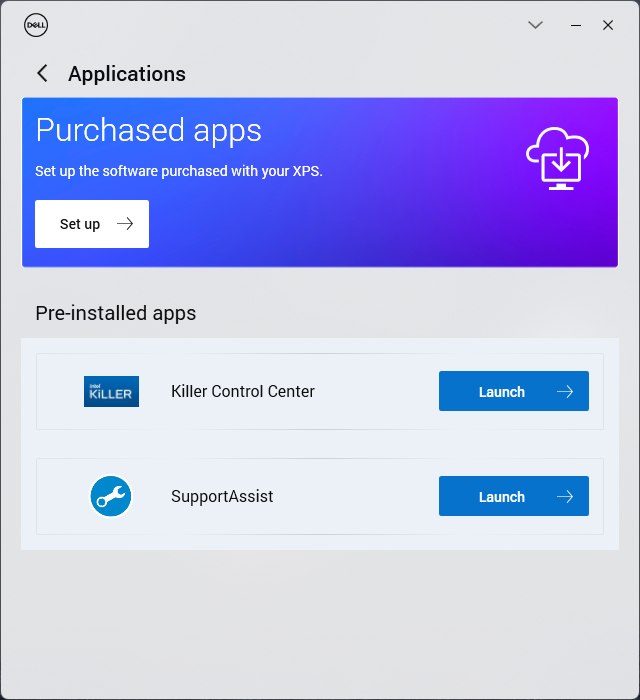
Het wordt aanbevolen dat gebruikers vertrouwd raken met MyDell, omdat het de centrale hub is voor het aanpassen van audio, kleuren, stroom en andere vooraf geïnstalleerde Dell apps zoals SupportAssist. Dell heeft de MyDell UI opnieuw ontworpen om meer te lijken op de Dell Optimizer software die met veel zakelijke laptops van dezelfde fabrikant wordt meegeleverd. Vervelend genoeg is het app venster erg klein en kan het niet gemaximaliseerd worden.
Optimus wordt standaard geleverd voor automatisch schakelen tussen de iGPU en dGPU. Er is geen ondersteuning voor Advanced Optimus of MUX.
Processor
De Core i7-13700H in de XPS 17 presteert zeer goed met benchmarkresultaten die iets hoger zijn dan de meeste andere laptops in onze database die met dezelfde processor zijn uitgerust, waaronder de recente XPS 15 9530. Vooral Turbo Boost is indrukwekkend met een prestatievoordeel van 25 procent ten opzichte van de Core i7-12700H in de XPS 17 9720 model.
Er is echter een opvallend addertje onder het gras om in gedachten te houden. CPU Turbo Boost is niet onbeperkt, zoals blijkt uit onze onderstaande grafiek bij het draaien van CineBench R15 xT in een lus. De prestaties dalen met ongeveer 25 procent na 9 of 10 runs, wat steiler is dan bij de meeste andere laptops met CPU's uit de H-serie. Rekening houdend met deze throttling, zou de Core i7-13700H eigenlijk bijna identiek presteren als de Core i7-12700H. Dus, de Core i7-13700H is op zijn best wanneer hoge prestaties nodig zijn in korte uitbarstingen, zoals bij het starten van programma's, het bewerken van afbeeldingen, of het coderen van korte video's. Anders biedt hij slechts kleine prestatievoordelen ten opzichte van de Core i7-12700H van vorig jaar.
Opwaarderen naar de Core i9-13900H optie zal naar verwachting de multi-thread prestaties met ongeveer 10 tot 20 procent verbeteren, gebaseerd op onze ervaring met deMSI Stealth 17 Studio. Single-thread prestaties zouden echter ongeveer hetzelfde blijven, zo niet iets langzamer met de Core i9.
Cinebench R15 Multi Loop
Cinebench R23: Multi Core | Single Core
Cinebench R20: CPU (Multi Core) | CPU (Single Core)
Cinebench R15: CPU Multi 64Bit | CPU Single 64Bit
Blender: v2.79 BMW27 CPU
7-Zip 18.03: 7z b 4 | 7z b 4 -mmt1
Geekbench 5.5: Multi-Core | Single-Core
HWBOT x265 Benchmark v2.2: 4k Preset
LibreOffice : 20 Documents To PDF
R Benchmark 2.5: Overall mean
* ... kleiner is beter
AIDA64: FP32 Ray-Trace | FPU Julia | CPU SHA3 | CPU Queen | FPU SinJulia | FPU Mandel | CPU AES | CPU ZLib | FP64 Ray-Trace | CPU PhotoWorxx
| Performance rating | |
| Dell XPS 17 9730 RTX 4070 | |
| Gemiddeld Intel Core i7-13700H | |
| MSI Creator Z17 A12UGST-054 | |
| Dell XPS 17 9720 RTX 3060 | |
| LG Gram 17 (2023) | |
| HP Envy 17-cr0079ng | |
| AIDA64 / FP32 Ray-Trace | |
| Dell XPS 17 9730 RTX 4070 | |
| Gemiddeld Intel Core i7-13700H (4986 - 18908, n=29) | |
| LG Gram 17 (2023) | |
| MSI Creator Z17 A12UGST-054 | |
| HP Envy 17-cr0079ng | |
| Dell XPS 17 9720 RTX 3060 | |
| AIDA64 / FPU Julia | |
| Dell XPS 17 9730 RTX 4070 | |
| Gemiddeld Intel Core i7-13700H (25360 - 92359, n=29) | |
| HP Envy 17-cr0079ng | |
| LG Gram 17 (2023) | |
| MSI Creator Z17 A12UGST-054 | |
| Dell XPS 17 9720 RTX 3060 | |
| AIDA64 / CPU SHA3 | |
| Dell XPS 17 9730 RTX 4070 | |
| Gemiddeld Intel Core i7-13700H (1339 - 4224, n=29) | |
| MSI Creator Z17 A12UGST-054 | |
| Dell XPS 17 9720 RTX 3060 | |
| HP Envy 17-cr0079ng | |
| LG Gram 17 (2023) | |
| AIDA64 / CPU Queen | |
| MSI Creator Z17 A12UGST-054 | |
| Dell XPS 17 9720 RTX 3060 | |
| Dell XPS 17 9730 RTX 4070 | |
| Gemiddeld Intel Core i7-13700H (59324 - 107159, n=29) | |
| LG Gram 17 (2023) | |
| HP Envy 17-cr0079ng | |
| AIDA64 / FPU SinJulia | |
| Dell XPS 17 9730 RTX 4070 | |
| MSI Creator Z17 A12UGST-054 | |
| Dell XPS 17 9720 RTX 3060 | |
| Gemiddeld Intel Core i7-13700H (4800 - 11050, n=29) | |
| LG Gram 17 (2023) | |
| HP Envy 17-cr0079ng | |
| AIDA64 / FPU Mandel | |
| Dell XPS 17 9730 RTX 4070 | |
| Gemiddeld Intel Core i7-13700H (12321 - 45118, n=29) | |
| MSI Creator Z17 A12UGST-054 | |
| LG Gram 17 (2023) | |
| Dell XPS 17 9720 RTX 3060 | |
| HP Envy 17-cr0079ng | |
| AIDA64 / CPU AES | |
| MSI Creator Z17 A12UGST-054 | |
| Dell XPS 17 9720 RTX 3060 | |
| Gemiddeld Intel Core i7-13700H (28769 - 151254, n=29) | |
| Dell XPS 17 9730 RTX 4070 | |
| LG Gram 17 (2023) | |
| HP Envy 17-cr0079ng | |
| AIDA64 / CPU ZLib | |
| Dell XPS 17 9730 RTX 4070 | |
| MSI Creator Z17 A12UGST-054 | |
| Gemiddeld Intel Core i7-13700H (389 - 1215, n=29) | |
| Dell XPS 17 9720 RTX 3060 | |
| HP Envy 17-cr0079ng | |
| LG Gram 17 (2023) | |
| AIDA64 / FP64 Ray-Trace | |
| Dell XPS 17 9730 RTX 4070 | |
| Gemiddeld Intel Core i7-13700H (2540 - 10135, n=29) | |
| LG Gram 17 (2023) | |
| MSI Creator Z17 A12UGST-054 | |
| Dell XPS 17 9720 RTX 3060 | |
| HP Envy 17-cr0079ng | |
| AIDA64 / CPU PhotoWorxx | |
| LG Gram 17 (2023) | |
| Dell XPS 17 9730 RTX 4070 | |
| Dell XPS 17 9720 RTX 3060 | |
| Gemiddeld Intel Core i7-13700H (12872 - 52727, n=29) | |
| MSI Creator Z17 A12UGST-054 | |
| HP Envy 17-cr0079ng | |
Systeemprestaties
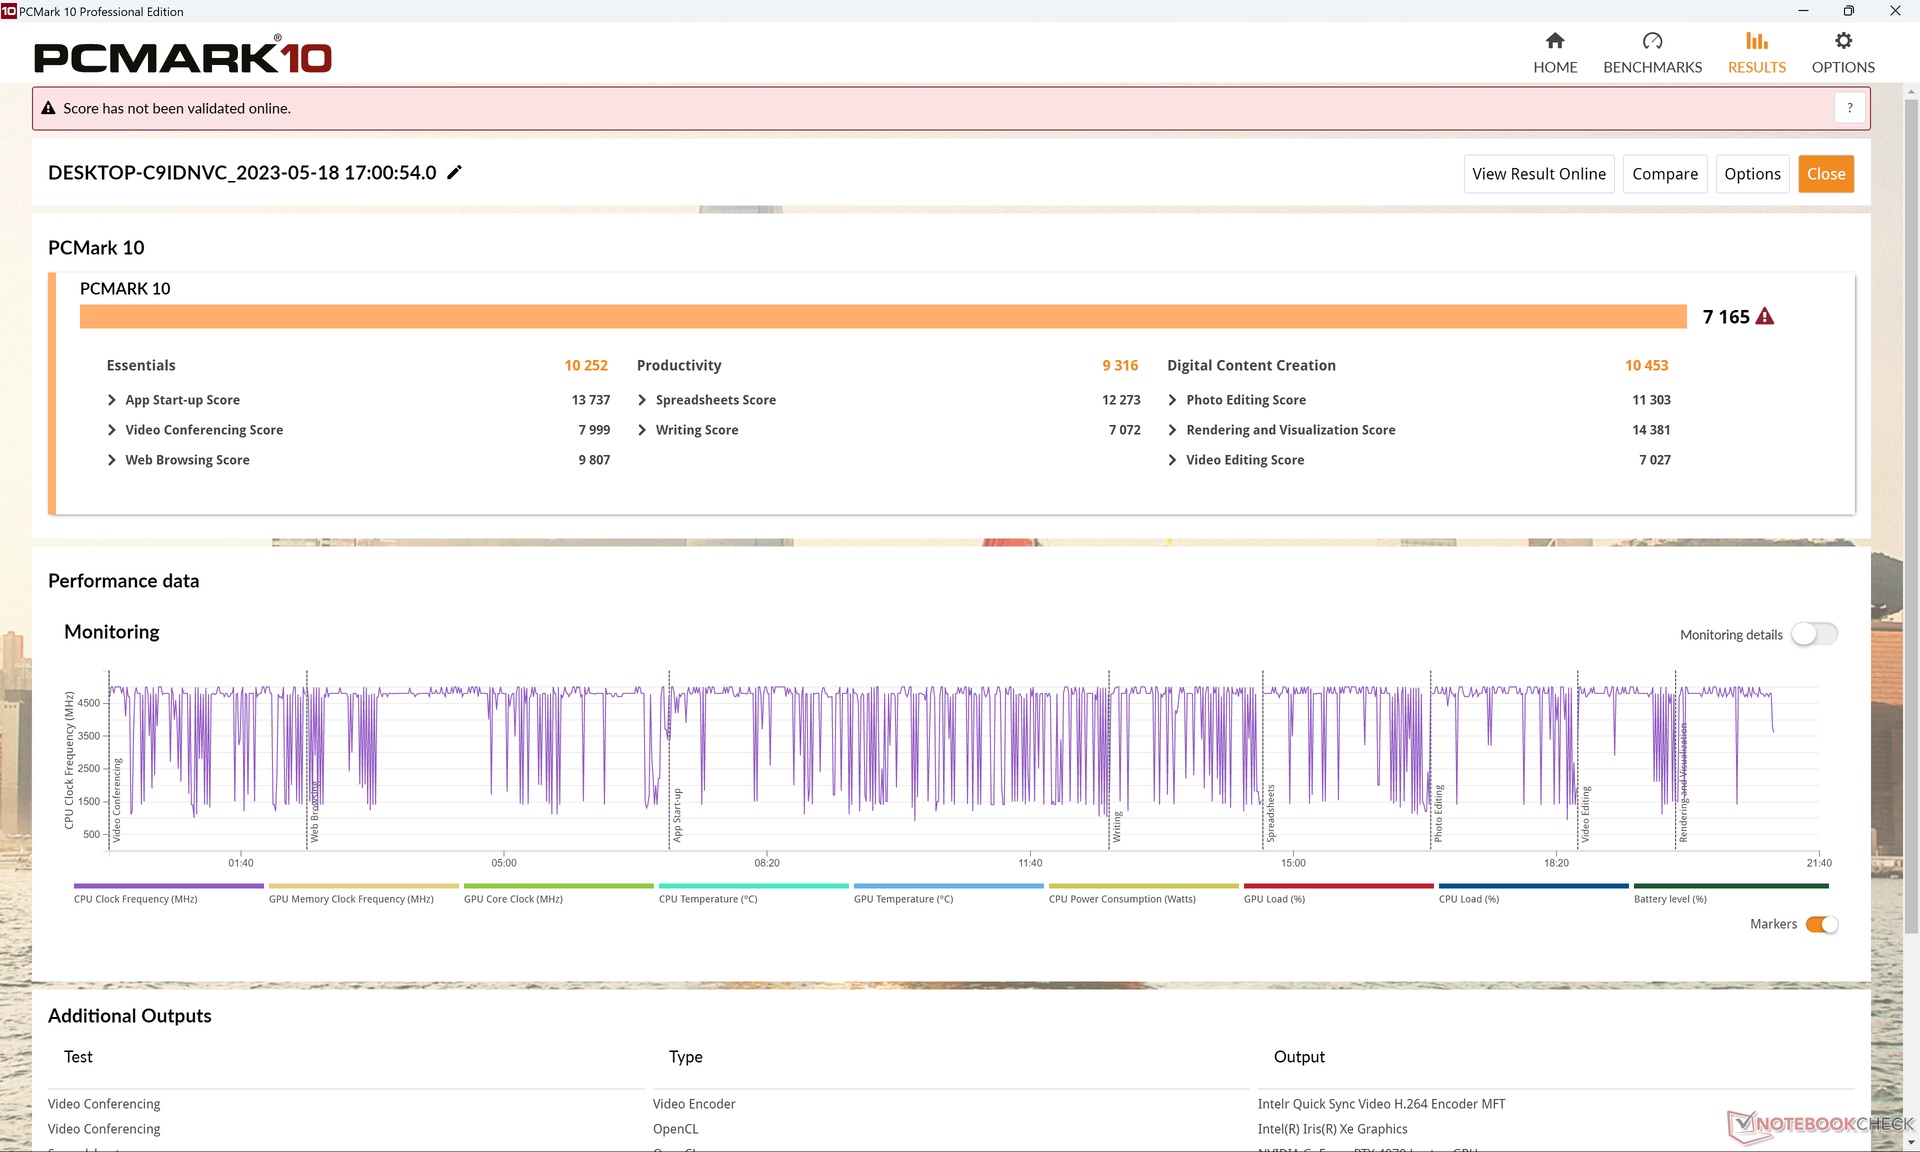
PCMark scores zijn bijna identiek aan de XPS 17 9720 van vorig jaar, ondanks de jaar-op-jaar prestatieverbeteringen. Dit suggereert dat dagelijkse werklasten en lichte kantooractiviteiten niet merkbaar sneller zijn op het nieuwste model. Als uw werklasten voornamelijk bestaan uit surfen op het web, spreadsheets en tekstverwerking, dan is een mindere XPS 17 configuratie met de RTX 4050 wellicht geschikter dan onze RTX 4070 configuratie.
CrossMark: Overall | Productivity | Creativity | Responsiveness
| PCMark 10 / Score | |
| Gemiddeld Intel Core i7-13700H, NVIDIA GeForce RTX 4070 Laptop GPU (7158 - 7956, n=8) | |
| Dell XPS 17 9720 RTX 3060 | |
| Dell XPS 17 9730 RTX 4070 | |
| MSI Creator Z17 A12UGST-054 | |
| HP Envy 17-cr0079ng | |
| LG Gram 17 (2023) | |
| PCMark 10 / Essentials | |
| LG Gram 17 (2023) | |
| Dell XPS 17 9720 RTX 3060 | |
| Gemiddeld Intel Core i7-13700H, NVIDIA GeForce RTX 4070 Laptop GPU (10252 - 11449, n=8) | |
| HP Envy 17-cr0079ng | |
| MSI Creator Z17 A12UGST-054 | |
| Dell XPS 17 9730 RTX 4070 | |
| PCMark 10 / Productivity | |
| Gemiddeld Intel Core i7-13700H, NVIDIA GeForce RTX 4070 Laptop GPU (8501 - 10769, n=8) | |
| MSI Creator Z17 A12UGST-054 | |
| Dell XPS 17 9720 RTX 3060 | |
| Dell XPS 17 9730 RTX 4070 | |
| HP Envy 17-cr0079ng | |
| LG Gram 17 (2023) | |
| PCMark 10 / Digital Content Creation | |
| Gemiddeld Intel Core i7-13700H, NVIDIA GeForce RTX 4070 Laptop GPU (10358 - 12908, n=8) | |
| Dell XPS 17 9730 RTX 4070 | |
| Dell XPS 17 9720 RTX 3060 | |
| MSI Creator Z17 A12UGST-054 | |
| HP Envy 17-cr0079ng | |
| LG Gram 17 (2023) | |
| CrossMark / Overall | |
| MSI Creator Z17 A12UGST-054 | |
| Apple MacBook Pro 16 2023 M2 Max | |
| Gemiddeld Intel Core i7-13700H, NVIDIA GeForce RTX 4070 Laptop GPU (1768 - 2073, n=6) | |
| Dell XPS 17 9720 RTX 3060 | |
| Dell XPS 17 9730 RTX 4070 | |
| LG Gram 17 (2023) | |
| HP Envy 17-cr0079ng | |
| CrossMark / Productivity | |
| MSI Creator Z17 A12UGST-054 | |
| Gemiddeld Intel Core i7-13700H, NVIDIA GeForce RTX 4070 Laptop GPU (1645 - 2006, n=6) | |
| Dell XPS 17 9720 RTX 3060 | |
| Dell XPS 17 9730 RTX 4070 | |
| Apple MacBook Pro 16 2023 M2 Max | |
| LG Gram 17 (2023) | |
| HP Envy 17-cr0079ng | |
| CrossMark / Creativity | |
| Apple MacBook Pro 16 2023 M2 Max | |
| MSI Creator Z17 A12UGST-054 | |
| Dell XPS 17 9720 RTX 3060 | |
| Gemiddeld Intel Core i7-13700H, NVIDIA GeForce RTX 4070 Laptop GPU (1936 - 2137, n=6) | |
| Dell XPS 17 9730 RTX 4070 | |
| LG Gram 17 (2023) | |
| HP Envy 17-cr0079ng | |
| CrossMark / Responsiveness | |
| MSI Creator Z17 A12UGST-054 | |
| Gemiddeld Intel Core i7-13700H, NVIDIA GeForce RTX 4070 Laptop GPU (1451 - 2202, n=6) | |
| Dell XPS 17 9720 RTX 3060 | |
| Dell XPS 17 9730 RTX 4070 | |
| LG Gram 17 (2023) | |
| Apple MacBook Pro 16 2023 M2 Max | |
| HP Envy 17-cr0079ng | |
| PCMark 10 Score | 7165 punten | |
Help | ||
| AIDA64 / Memory Copy | |
| LG Gram 17 (2023) | |
| Dell XPS 17 9730 RTX 4070 | |
| Dell XPS 17 9720 RTX 3060 | |
| MSI Creator Z17 A12UGST-054 | |
| Gemiddeld Intel Core i7-13700H (24334 - 78081, n=29) | |
| HP Envy 17-cr0079ng | |
| AIDA64 / Memory Read | |
| Dell XPS 17 9730 RTX 4070 | |
| Dell XPS 17 9720 RTX 3060 | |
| MSI Creator Z17 A12UGST-054 | |
| Gemiddeld Intel Core i7-13700H (23681 - 79656, n=29) | |
| LG Gram 17 (2023) | |
| HP Envy 17-cr0079ng | |
| AIDA64 / Memory Write | |
| LG Gram 17 (2023) | |
| Dell XPS 17 9730 RTX 4070 | |
| Gemiddeld Intel Core i7-13700H (22986 - 99898, n=29) | |
| MSI Creator Z17 A12UGST-054 | |
| Dell XPS 17 9720 RTX 3060 | |
| HP Envy 17-cr0079ng | |
| AIDA64 / Memory Latency | |
| LG Gram 17 (2023) | |
| MSI Creator Z17 A12UGST-054 | |
| Dell XPS 17 9730 RTX 4070 | |
| Gemiddeld Intel Core i7-13700H (82.4 - 136.8, n=29) | |
| Dell XPS 17 9720 RTX 3060 | |
| HP Envy 17-cr0079ng | |
* ... kleiner is beter
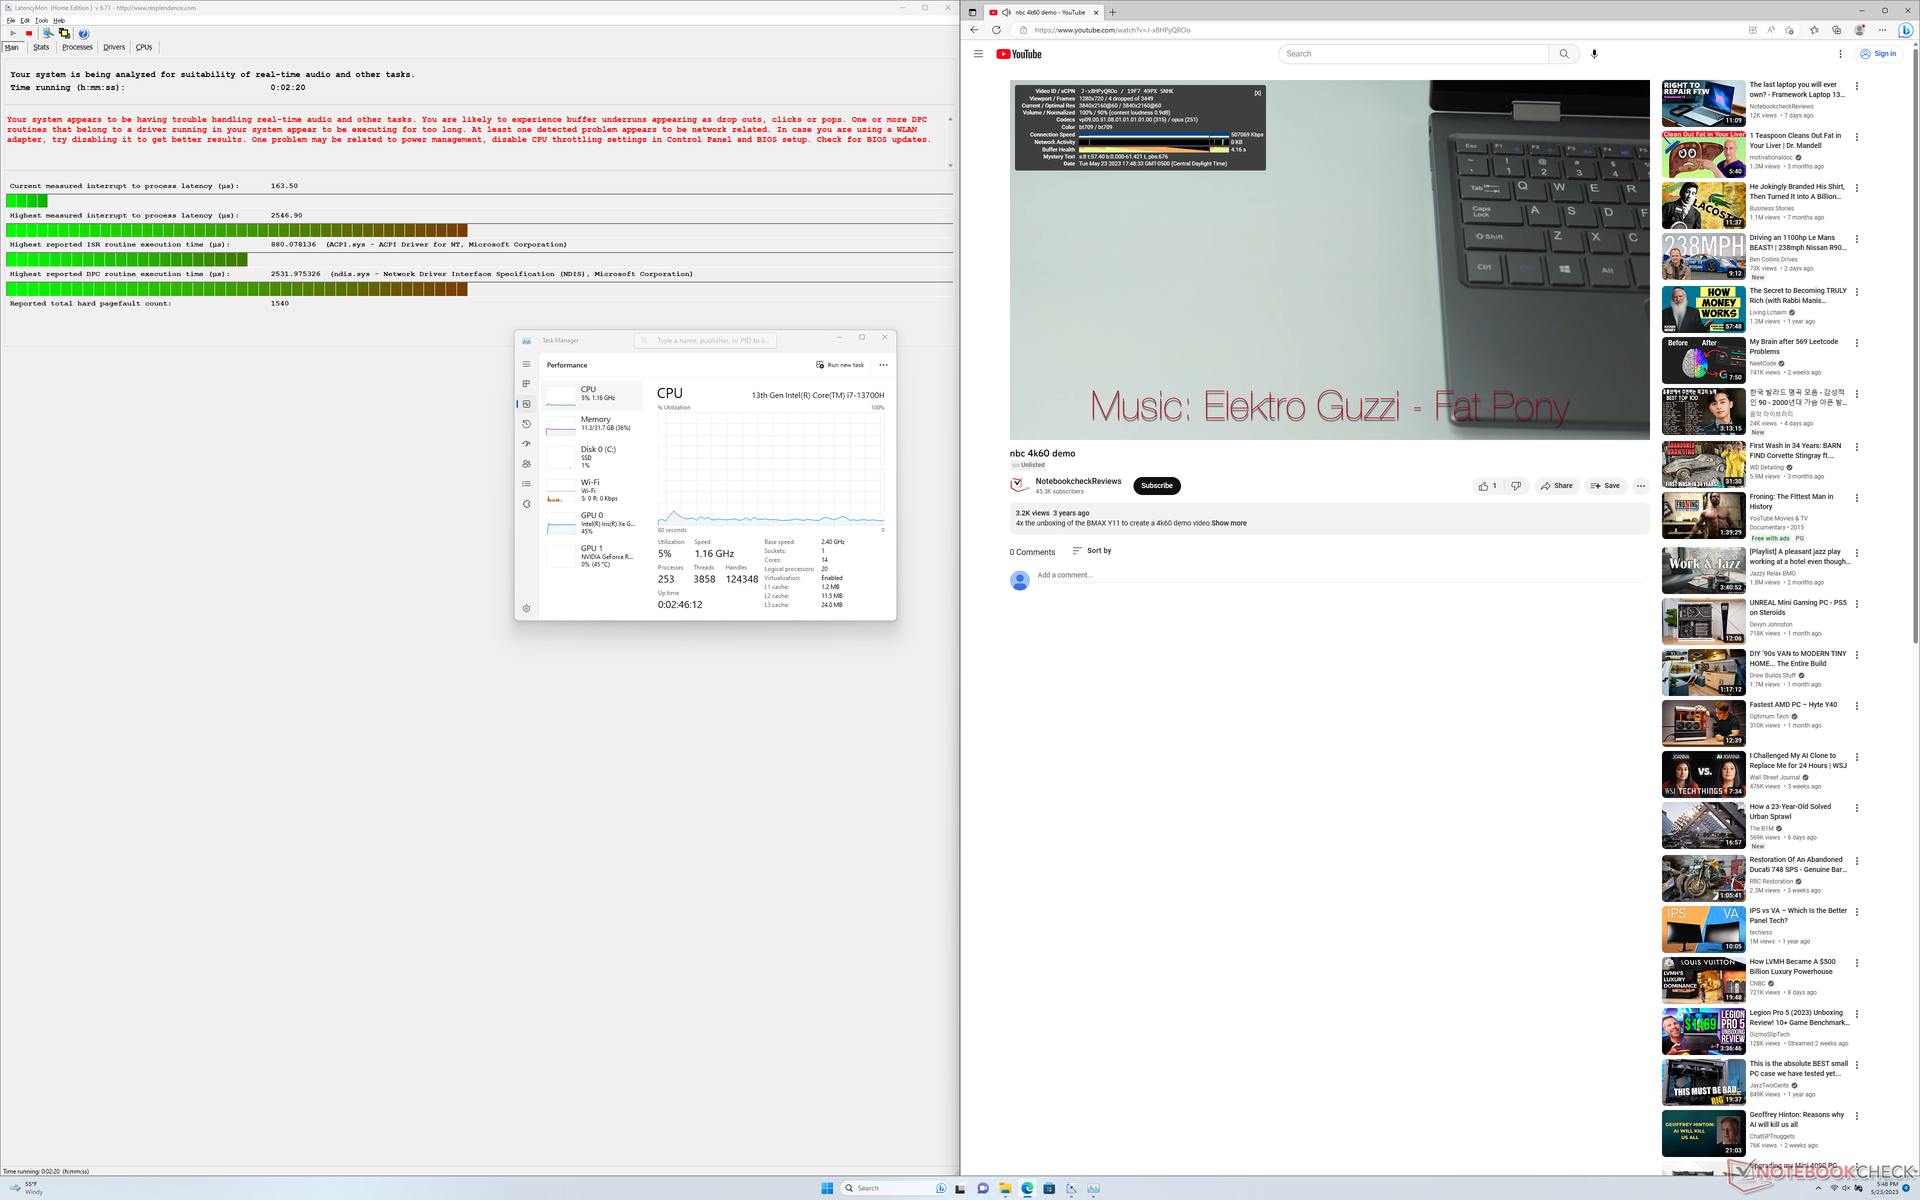
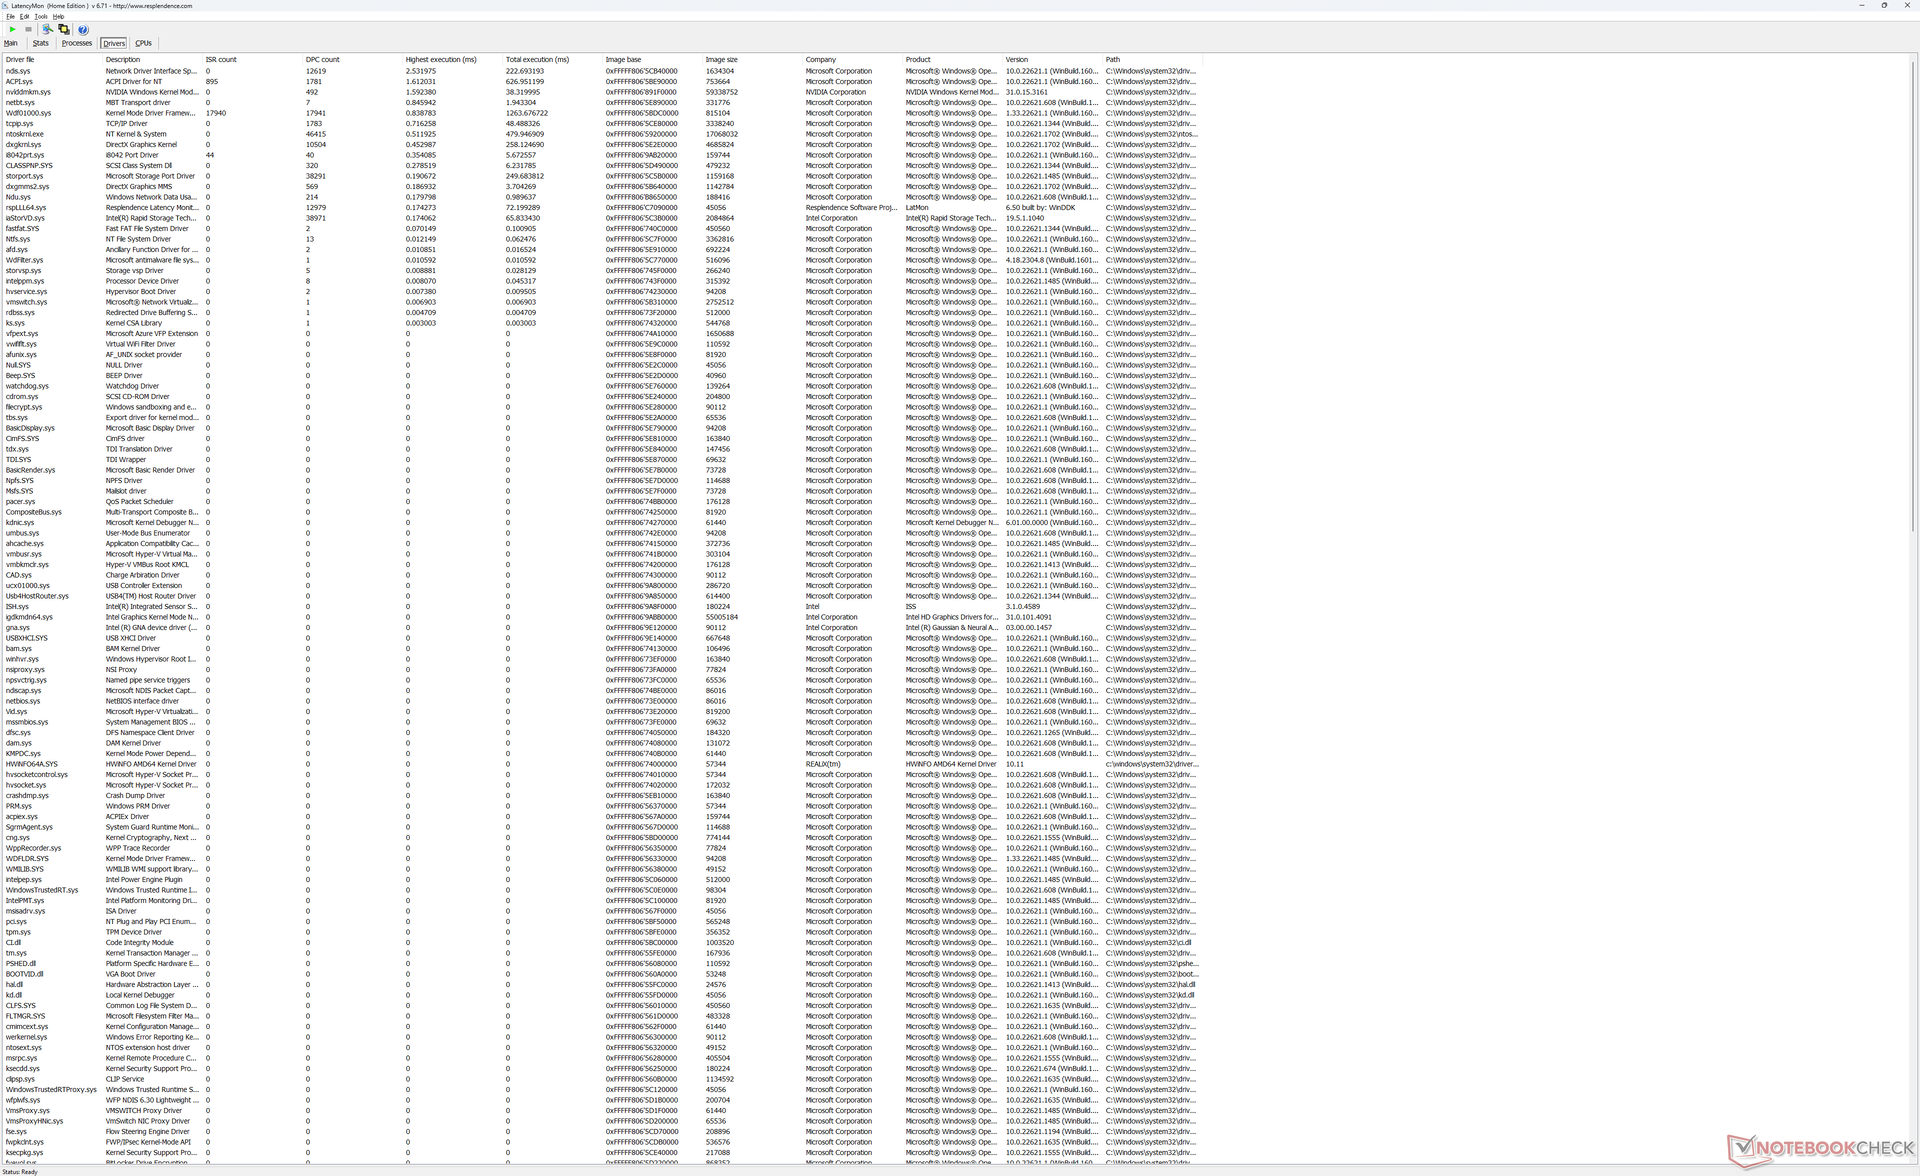
DPC latentie
LatencyMon onthult DPC-problemen bij het openen van meerdere browsertabbladen van onze homepage, zelfs na meerdere pogingen. De resultaten zijn teleurstellend aangezien we geen problemen tegenkwamen op de recente XPS 15 9530 of op de XPS 17 9720 van vorig jaar.
het afspelen van 4K-video's met 60 FPS is perfect, behalve aan het begin waar steeds 4 frames wegvallen. Interessant is dat ditzelfde probleem ook optrad bij de XPS 15 9530.
| DPC Latencies / LatencyMon - interrupt to process latency (max), Web, Youtube, Prime95 | |
| HP Envy 17-cr0079ng | |
| Dell XPS 17 9730 RTX 4070 | |
| LG Gram 17 (2023) | |
| MSI Creator Z17 A12UGST-054 | |
| Dell XPS 15 9530 RTX 4070 | |
| Dell XPS 17 9720 RTX 3060 | |
* ... kleiner is beter
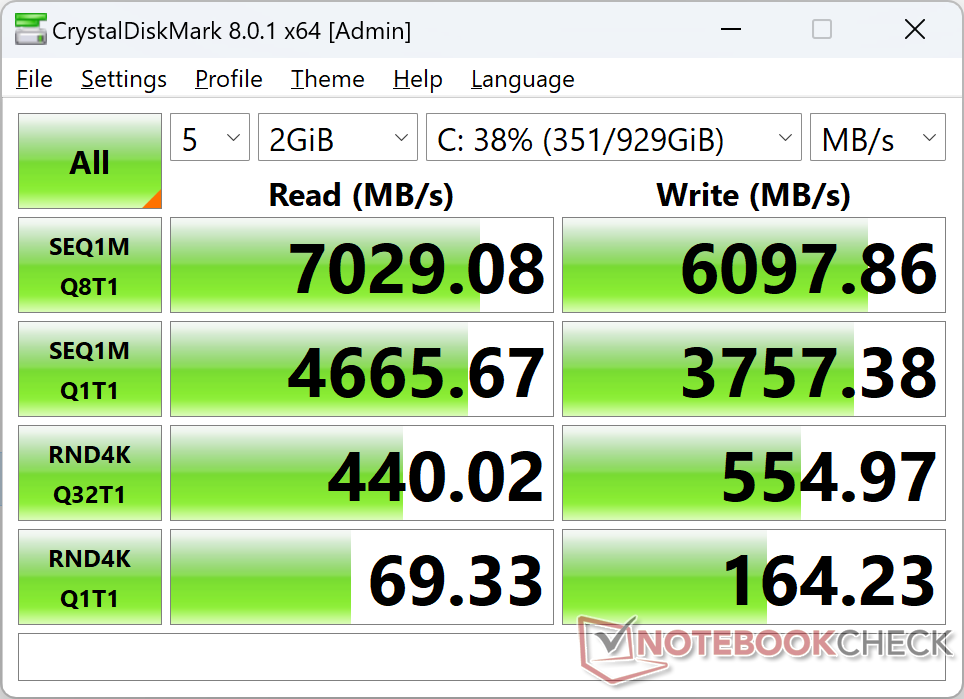
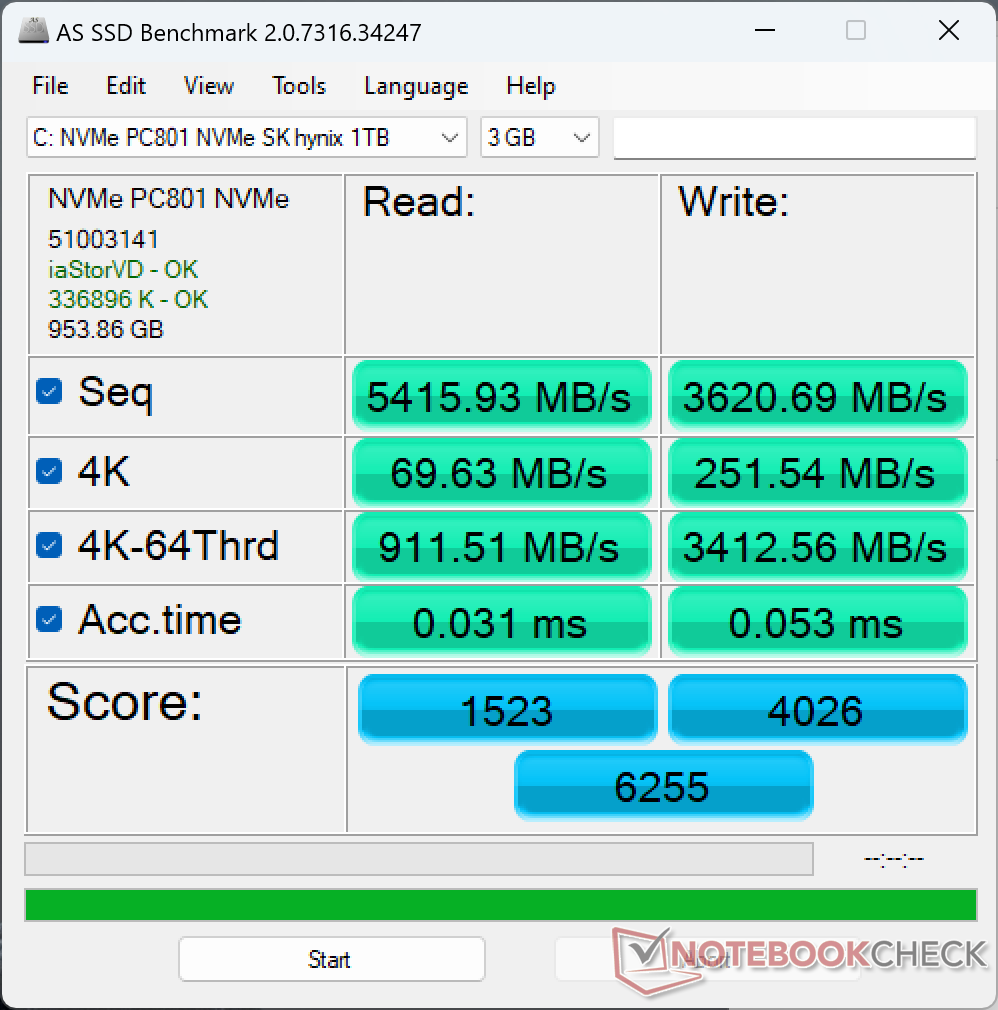
Opslagapparaten
XPS-eenheden kunnen worden geleverd met SSD's van Samsung, Micron, Western Digital of SK Hynix. In ons specifieke geval wordt onze testunit geleverd met de SK Hynix PC801 PCIe4 x4 NVMe SSD. De prestaties zijn uitstekend en vergelijkbaar met die van de Samsung PM9A1, zonder dips in overdrachtssnelheden bij belasting.
Een tweede M.2 SSD kan worden geïnstalleerd indien nodig. Elk van de twee M.2 slots wordt geleverd met een warmte verspreider om te helpen bij het koelen van de drives.

| Drive Performance rating - Percent | |
| LG Gram 17 (2023) | |
| MSI Creator Z17 A12UGST-054 | |
| Dell XPS 17 9730 RTX 4070 | |
| Dell XPS 17 9720 RTX 3060 | |
| HP Envy 17-cr0079ng | |
* ... kleiner is beter
Disk Throttling: DiskSpd Read Loop, Queue Depth 8
GPU prestaties - Veel sneller dan de XPS 15 9530
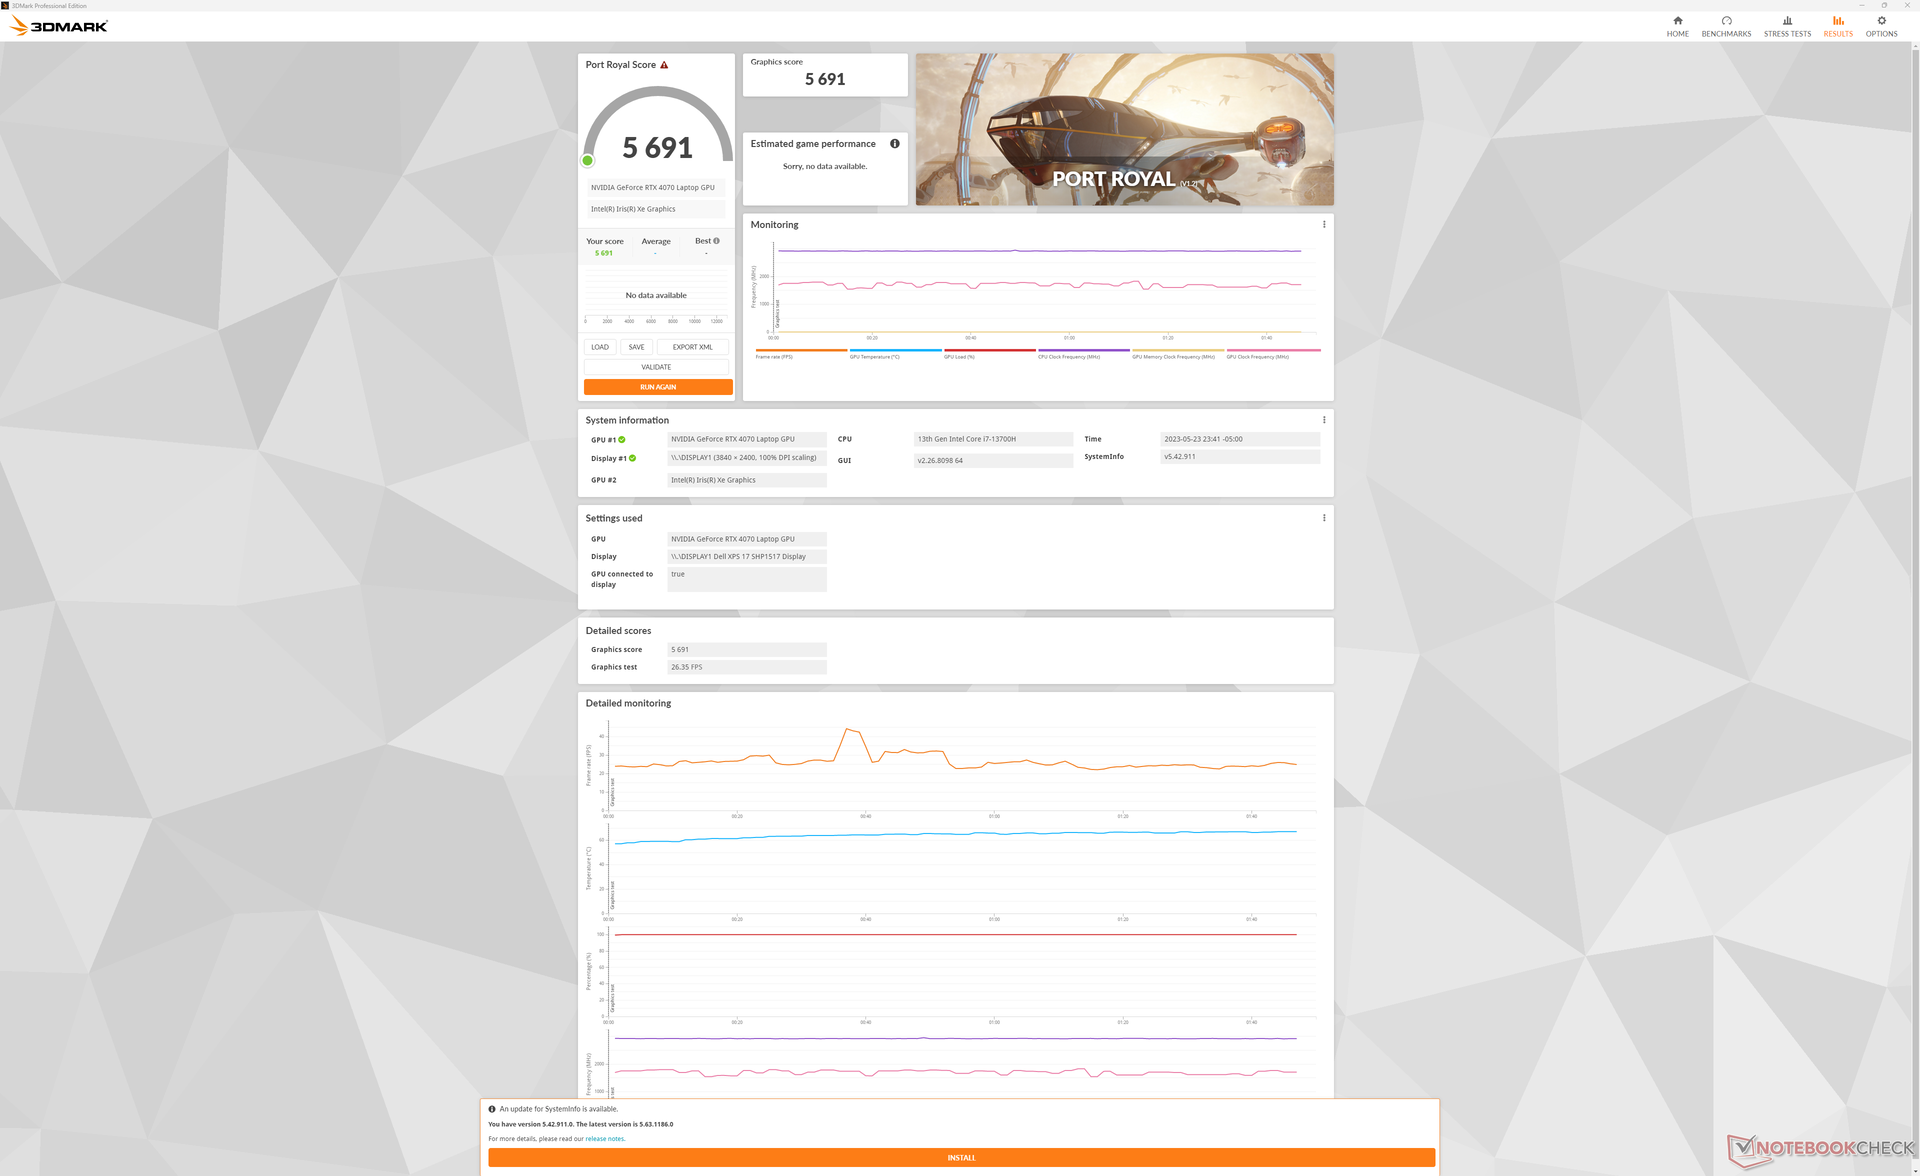
De mobiele GeForce RTX 4070 in de XPS 17 mikt op een TGP van 60 W tot 70 W, terwijl dezelfde GPU in de kleinere XPS 15 mikt op 40 W. Deze schijnbaar kleine verandering maakt een wereld van verschil, want 3DMark-scores voor zowel DirectX als ray tracing benchmarks zijn 50 tot 60 procent sneller op de XPS 17 9730 in vergelijking met de XPS 15. De prestatieboost is zo groot dat de RTX 4070 in de XPS 17 slechts 10 tot 15 procent achterloopt op de gemiddelde gaming-laptop die met dezelfde GPU is uitgerust. Dit is het prestatiebereik dat we hoopten te zien van de XPS 15 9530.
Blender GPU versnelling krijgt ook een boost in vergelijking met dezelfde GPU in de XPS 15. Het is een kleinere toename van 20 procent in prestaties om de XPS 17 in lijn te brengen met de meeste andere RTX 4070 laptops.
Dell biedt een nog hogere RTX 4080 optie voor de XPS 17, maar we verwachten volledig dat deze ondermaats zal presteren in vergelijking met de meeste andere RTX 4080 laptops vanwege de beperkte 130 W USB-C voeding. DeMSI Stealth 17 Studio, bijvoorbeeld, biedt de RTX 4080, zij het met een veel meer capabele 240 W AC-adapter.
De hoogste GPU-optie voor de XPS 17-serie vóór de XPS 17 9730 was de RTX 3060. In vergelijking met die configuratie kan onze RTX 4070 respectievelijk 20 procent en 30 procent snellere contentcreatie en grafische prestaties bieden.
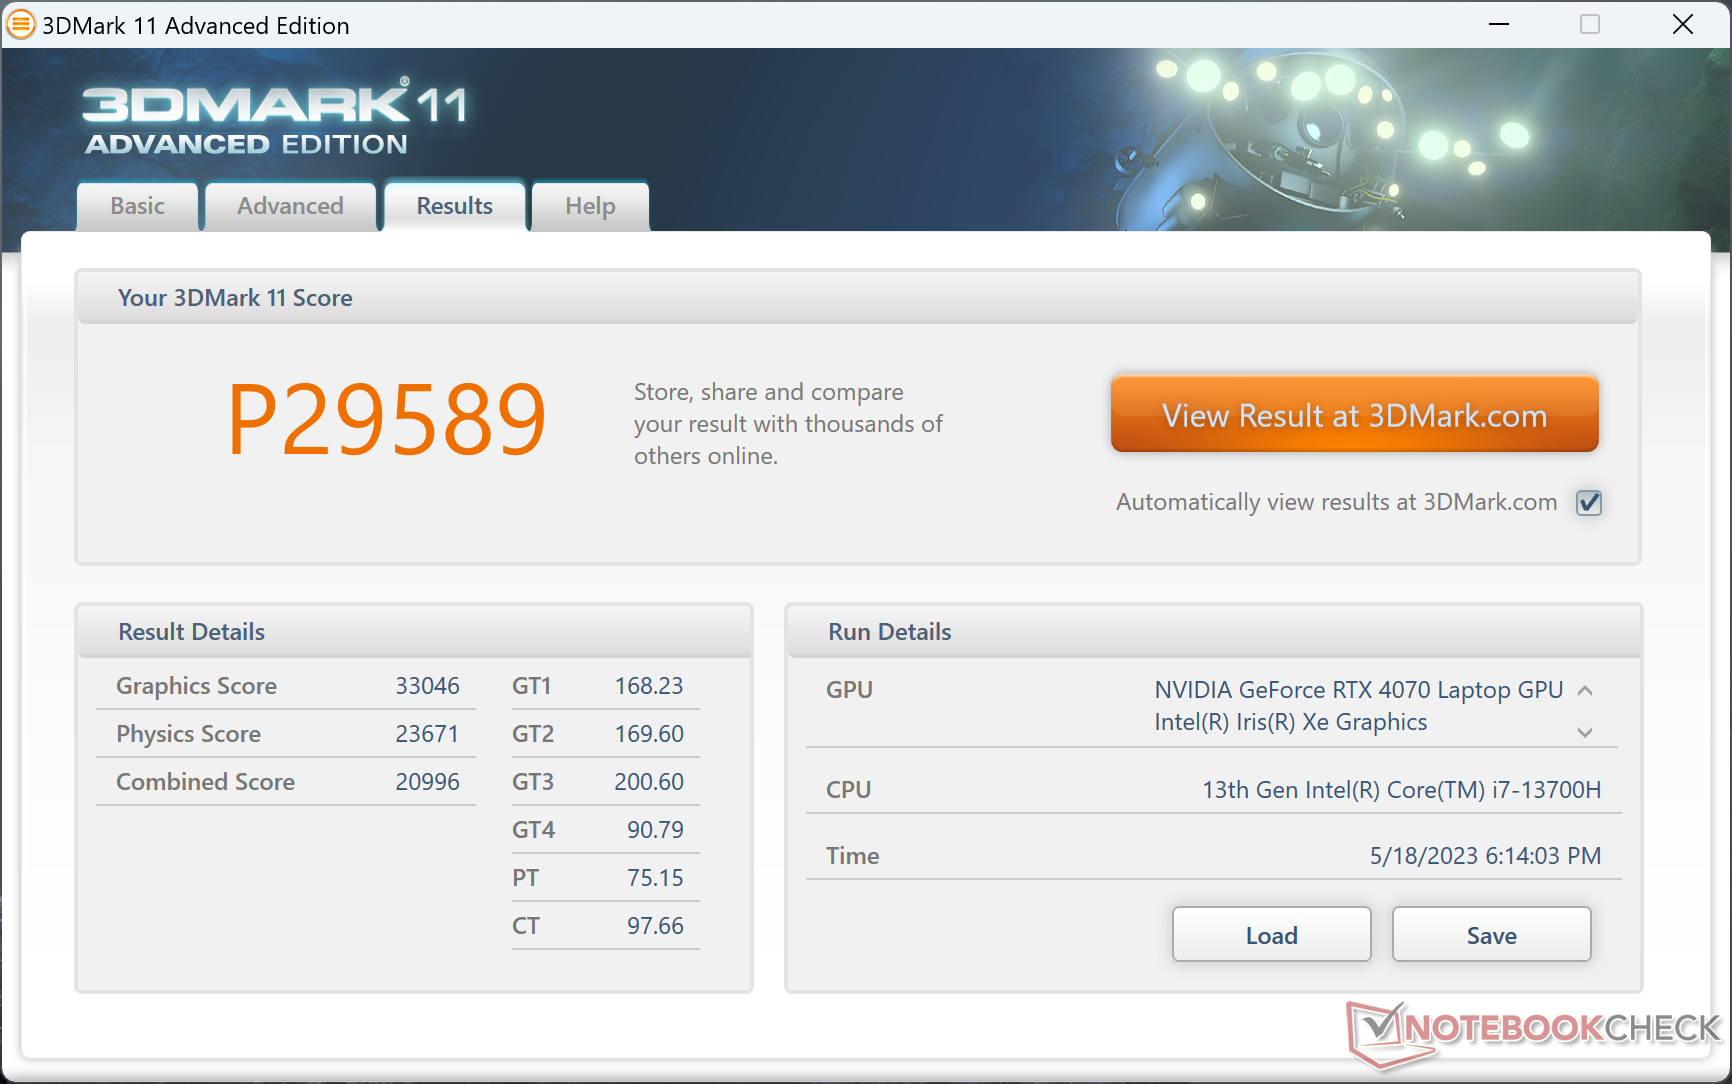
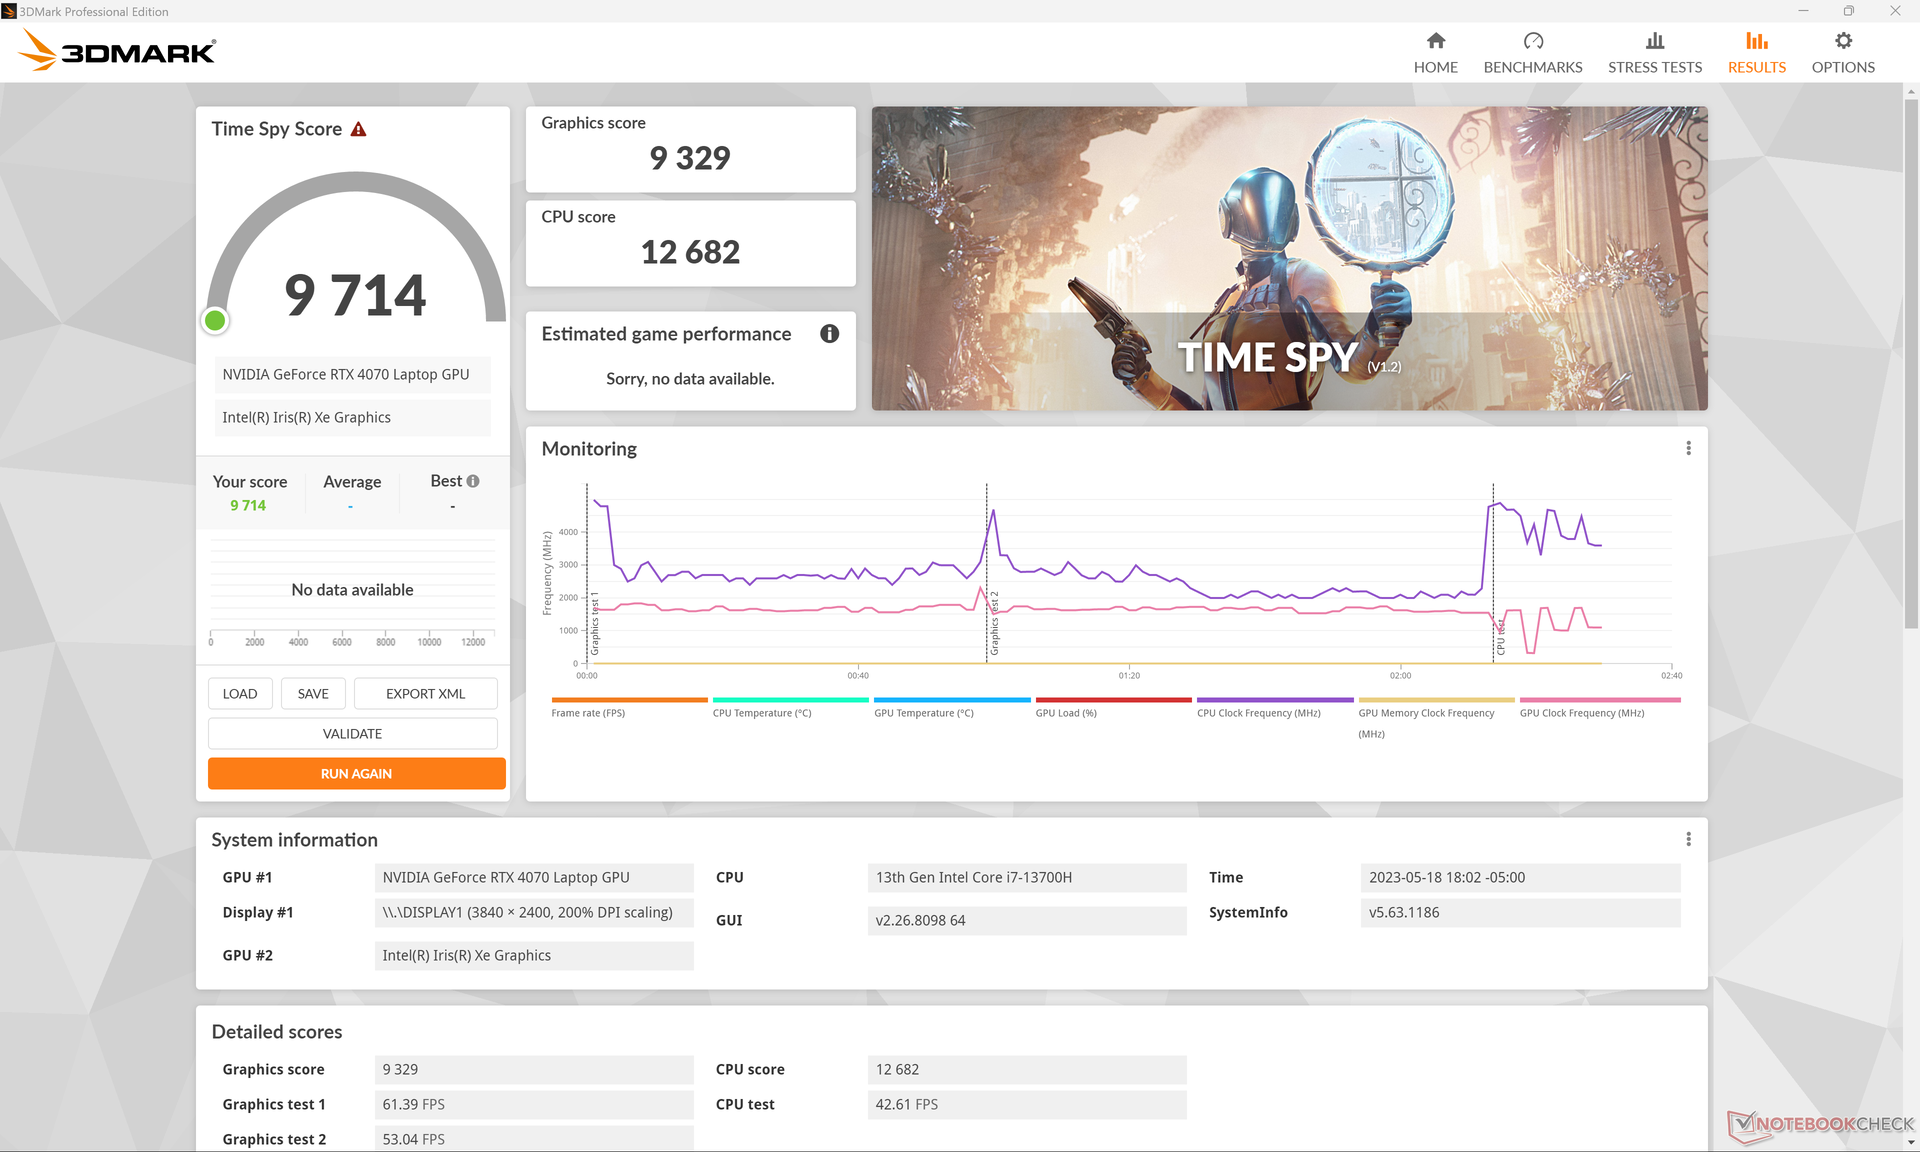

| 3DMark 11 Performance | 29589 punten | |
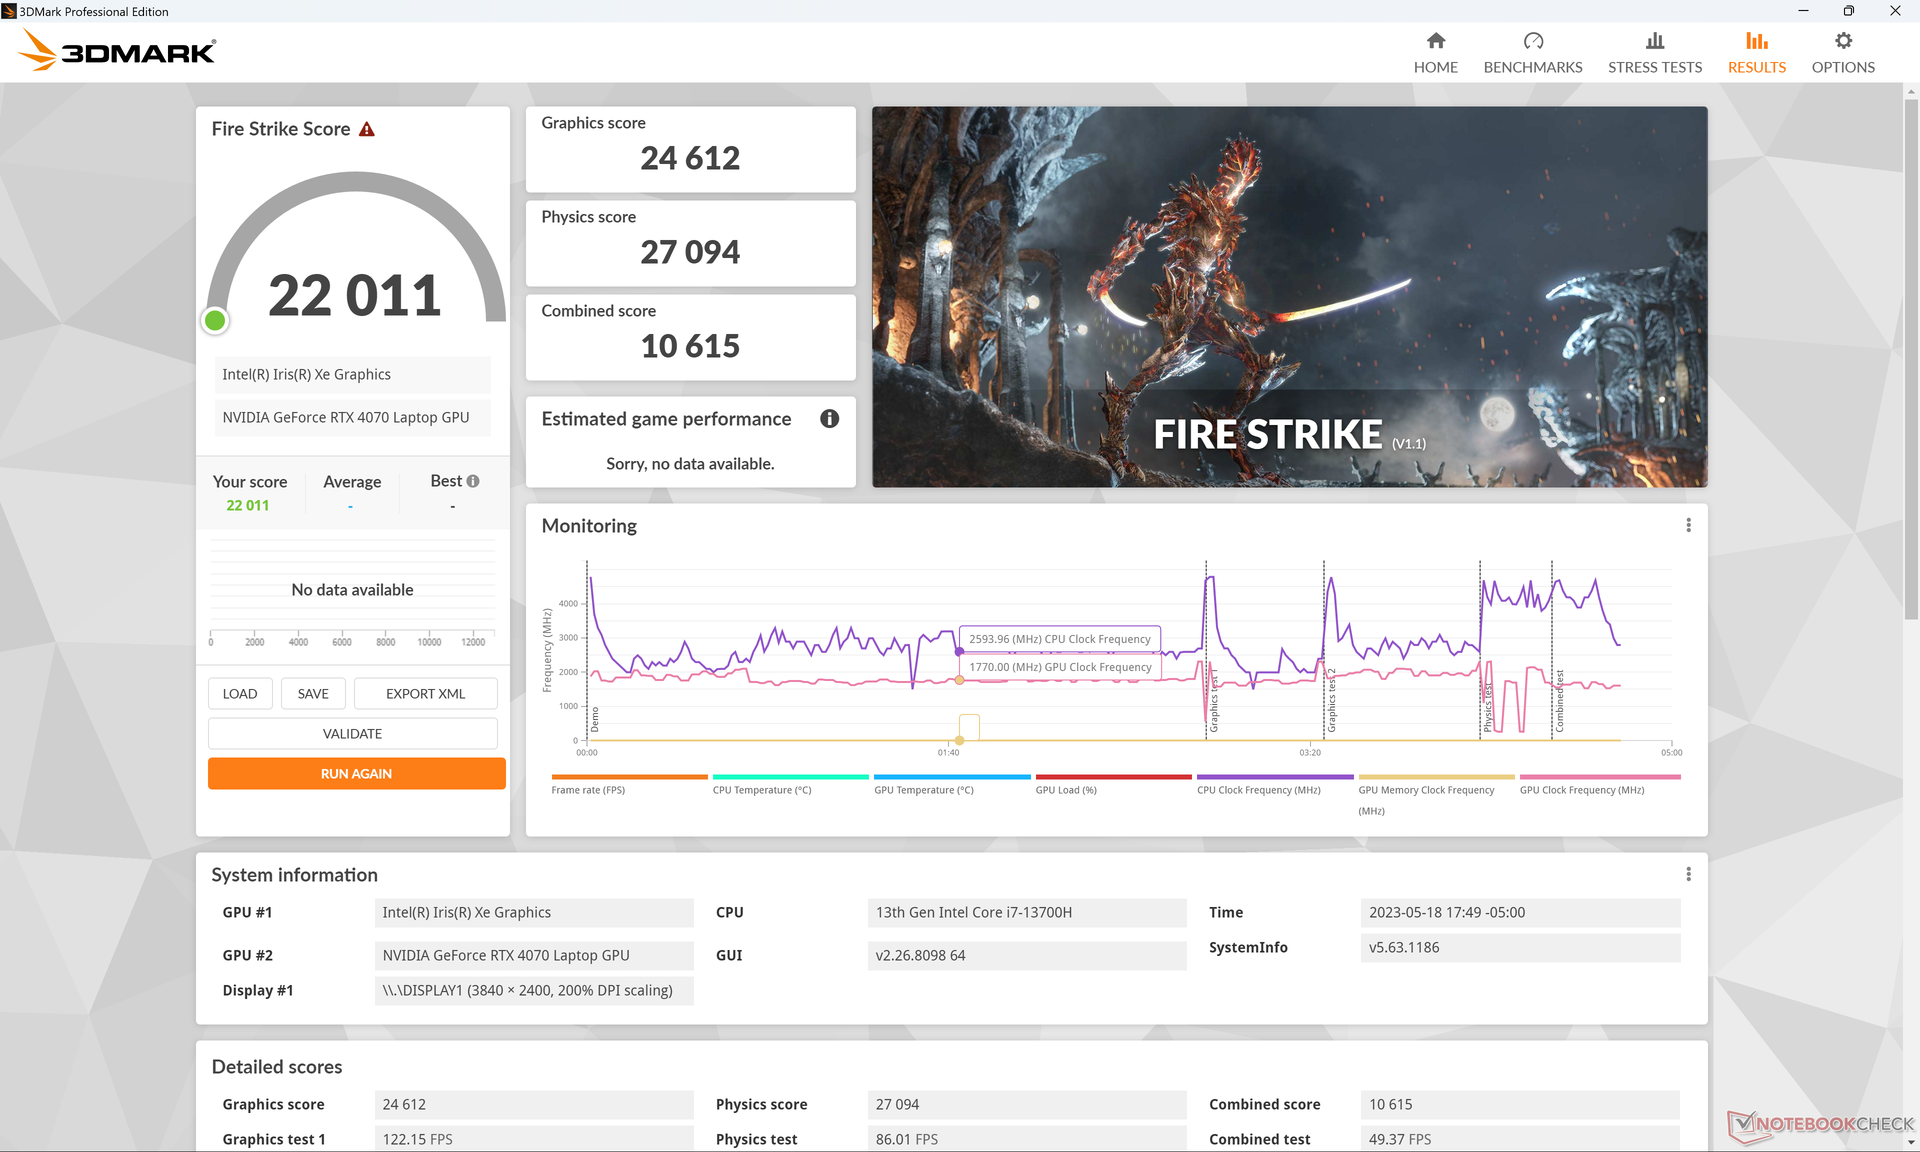
| 3DMark Fire Strike Score | 22011 punten | |
| 3DMark Time Spy Score | 9714 punten | |
Help | ||
* ... kleiner is beter
Spelprestaties
Het systeem werkt goed als secundaire gaming machine. Aangezien de 70 W RTX 4070 lang niet zo underpowered is als de 40 W versie in de XPS 15, is de XPS 17 in staat om de nieuwste games op QHD resolutie en 60 FPS te draaien op middelhoge tot hoge instellingen. 4K UHD is nog steeds grotendeels buiten bereik, maar de GPU zou goed combineren met externe FHD of QHD monitoren voor gaming doeleinden.
Misschien zijn de twee opmerkelijke factoren die de XPS 17 ervan weerhouden een "echte" gaming laptop te zijn, de relatief trage beeldschermreactietijden en het gebrek aan G-Sync ondersteuning voor het interne beeldscherm. Dropped frames, screen tearing en ghosting komen dus vaker voor bij het gamen op de XPS 17. Natuurlijk kan veel van dit worden vermeden door gewoon te gamen op een externe monitor.
| Returnal | |
| 1280x720 Low Preset | |
| Aorus 17X AZF | |
| Gemiddeld NVIDIA GeForce RTX 4070 Laptop GPU (126 - 150, n=5) | |
| 1920x1080 Low Preset | |
| Aorus 17X AZF | |
| Gemiddeld NVIDIA GeForce RTX 4070 Laptop GPU (65 - 119, n=11) | |
| Dell XPS 17 9730 RTX 4070 | |
| 1920x1080 Medium Preset | |
| Aorus 17X AZF | |
| Gemiddeld NVIDIA GeForce RTX 4070 Laptop GPU (69 - 117, n=12) | |
| Dell XPS 17 9730 RTX 4070 | |
| 1920x1080 High Preset | |
| Aorus 17X AZF | |
| Gemiddeld NVIDIA GeForce RTX 4070 Laptop GPU (64 - 106, n=12) | |
| Dell XPS 17 9730 RTX 4070 | |
| 1920x1080 Epic Preset | |
| Aorus 17X AZF | |
| Gemiddeld NVIDIA GeForce RTX 4070 Laptop GPU (54 - 90, n=12) | |
| Dell XPS 17 9730 RTX 4070 | |
| 2560x1440 Epic Preset | |
| Aorus 17X AZF | |
| Gemiddeld NVIDIA GeForce RTX 4070 Laptop GPU (39 - 66, n=12) | |
| Dell XPS 17 9730 RTX 4070 | |
| 3840x2160 Epic Preset | |
| Aorus 17X AZF | |
| Gemiddeld NVIDIA GeForce RTX 4070 Laptop GPU (21 - 39, n=8) | |
| Dell XPS 17 9730 RTX 4070 | |
| Tiny Tina's Wonderlands | |
| 1920x1080 Low Preset (DX12) | |
| Aorus 17X AZF | |
| Gemiddeld NVIDIA GeForce RTX 4070 Laptop GPU (98.1 - 283, n=15) | |
| Dell XPS 17 9730 RTX 4070 | |
| 1920x1080 Medium Preset (DX12) | |
| Aorus 17X AZF | |
| Gemiddeld NVIDIA GeForce RTX 4070 Laptop GPU (92.5 - 231, n=15) | |
| Dell XPS 17 9730 RTX 4070 | |
| 1920x1080 High Preset (DX12) | |
| Aorus 17X AZF | |
| Gemiddeld NVIDIA GeForce RTX 4070 Laptop GPU (74.3 - 151.4, n=15) | |
| Dell XPS 17 9730 RTX 4070 | |
| 1920x1080 Badass Preset (DX12) | |
| Aorus 17X AZF | |
| Gemiddeld NVIDIA GeForce RTX 4070 Laptop GPU (58.6 - 115.9, n=18) | |
| Dell XPS 17 9730 RTX 4070 | |
| 2560x1440 Badass Preset (DX12) | |
| Aorus 17X AZF | |
| Gemiddeld NVIDIA GeForce RTX 4070 Laptop GPU (49.8 - 79.5, n=17) | |
| Dell XPS 17 9730 RTX 4070 | |
| 3840x2160 Badass Preset (DX12) | |
| Aorus 17X AZF | |
| Gemiddeld NVIDIA GeForce RTX 4070 Laptop GPU (28.3 - 39.7, n=13) | |
| Dell XPS 17 9730 RTX 4070 | |
Witcher 3 FPS Chart
| lage | gem. | hoge | ultra | QHD | 4K | |
|---|---|---|---|---|---|---|
| GTA V (2015) | 186.6 | 182.5 | 167.9 | 102.7 | 75.5 | 76.9 |
| The Witcher 3 (2015) | 415.2 | 297.6 | 181.4 | 96.2 | 59 | |
| Dota 2 Reborn (2015) | 193.5 | 174.5 | 165.9 | 156.9 | 108 | |
| Final Fantasy XV Benchmark (2018) | 174.8 | 128.3 | 94.7 | 69.9 | 38.2 | |
| X-Plane 11.11 (2018) | 154.6 | 133.1 | 106.4 | 90 | ||
| Strange Brigade (2018) | 431 | 238 | 192 | 165.4 | 113.6 | 61.7 |
| Cyberpunk 2077 1.6 (2022) | 102.1 | 99.4 | 85.6 | 71 | 43 | 18.7 |
| Tiny Tina's Wonderlands (2022) | 183.5 | 153.3 | 104.9 | 82.4 | 55.7 | 28.3 |
| F1 22 (2022) | 206 | 196.4 | 158.2 | 60.7 | 39.4 | 18.8 |
| Returnal (2023) | 72 | 71 | 67 | 59 | 41 | 21 |
Emissies
Systeemgeluid - alleen luid als het moet
Het ventilatorgeluid is niet drastisch veranderd, ondanks de verbeterde prestaties. De XPS 17 schommelt meestal rond een nauwelijks hoorbare 25,6 dB(A) tegen een stille achtergrond van 22,7 dB(A) bij surfen op het web of streaming video. Bij zeer veeleisende belastingen, zoals games, begint het geluid van de ventilator echter het niveau van sommige gaming laptops tot 50 dB(A) te benaderen. Het XPS-model biedt immers specificaties op gamingniveau.
Geluidsniveau
| Onbelast |
| 22.8 / 22.8 / 22.8 dB (A) |
| Belasting |
| 38.9 / 50.2 dB (A) |
 | ||
30 dB stil 40 dB(A) hoorbaar 50 dB(A) luid |
||
min: | ||
| Dell XPS 17 9730 RTX 4070 GeForce RTX 4070 Laptop GPU, i7-13700H, SK hynix PC801 HFS001TEJ9X101N | Dell XPS 17 9720 RTX 3060 GeForce RTX 3060 Laptop GPU, i7-12700H, Samsung PM9A1 MZVL21T0HCLR | LG Gram 17 (2023) Iris Xe G7 96EUs, i7-1360P, Samsung PM9A1 MZVL21T0HCLR | HP Envy 17-cr0079ng GeForce RTX 2050 Mobile, i7-1255U, Samsung PM991a MZVLQ1T0HBLB | MSI Creator Z17 A12UGST-054 GeForce RTX 3070 Ti Laptop GPU, i9-12900H, Micron 3400 1TB MTFDKBA1T0TFH | Apple MacBook Pro 16 2023 M2 Max M2 Max 38-Core GPU, M2 Max, Apple SSD AP2048Z | |
|---|---|---|---|---|---|---|
| Noise | -4% | -11% | -16% | -28% | 4% | |
| uit / omgeving * (dB) | 22.7 | 23.8 -5% | 25.2 -11% | 26.5 -17% | 26 -15% | 23.9 -5% |
| Idle Minimum * (dB) | 22.8 | 24.1 -6% | 25.2 -11% | 28.5 -25% | 31.8 -39% | 23.9 -5% |
| Idle Average * (dB) | 22.8 | 24.1 -6% | 25.7 -13% | 28.5 -25% | 31.8 -39% | 23.9 -5% |
| Idle Maximum * (dB) | 22.8 | 24.1 -6% | 29.3 -29% | 29.7 -30% | 31.8 -39% | 23.9 -5% |
| Load Average * (dB) | 38.9 | 43.2 -11% | 44.4 -14% | 39.5 -2% | 53.9 -39% | 36.6 6% |
| Witcher 3 ultra * (dB) | 47.4 | 48 -1% | 53.9 -14% | 35.1 26% | ||
| Load Maximum * (dB) | 50.2 | 48 4% | 45.2 10% | 48 4% | 54.9 -9% | 43.2 14% |
* ... kleiner is beter
Temperatuur
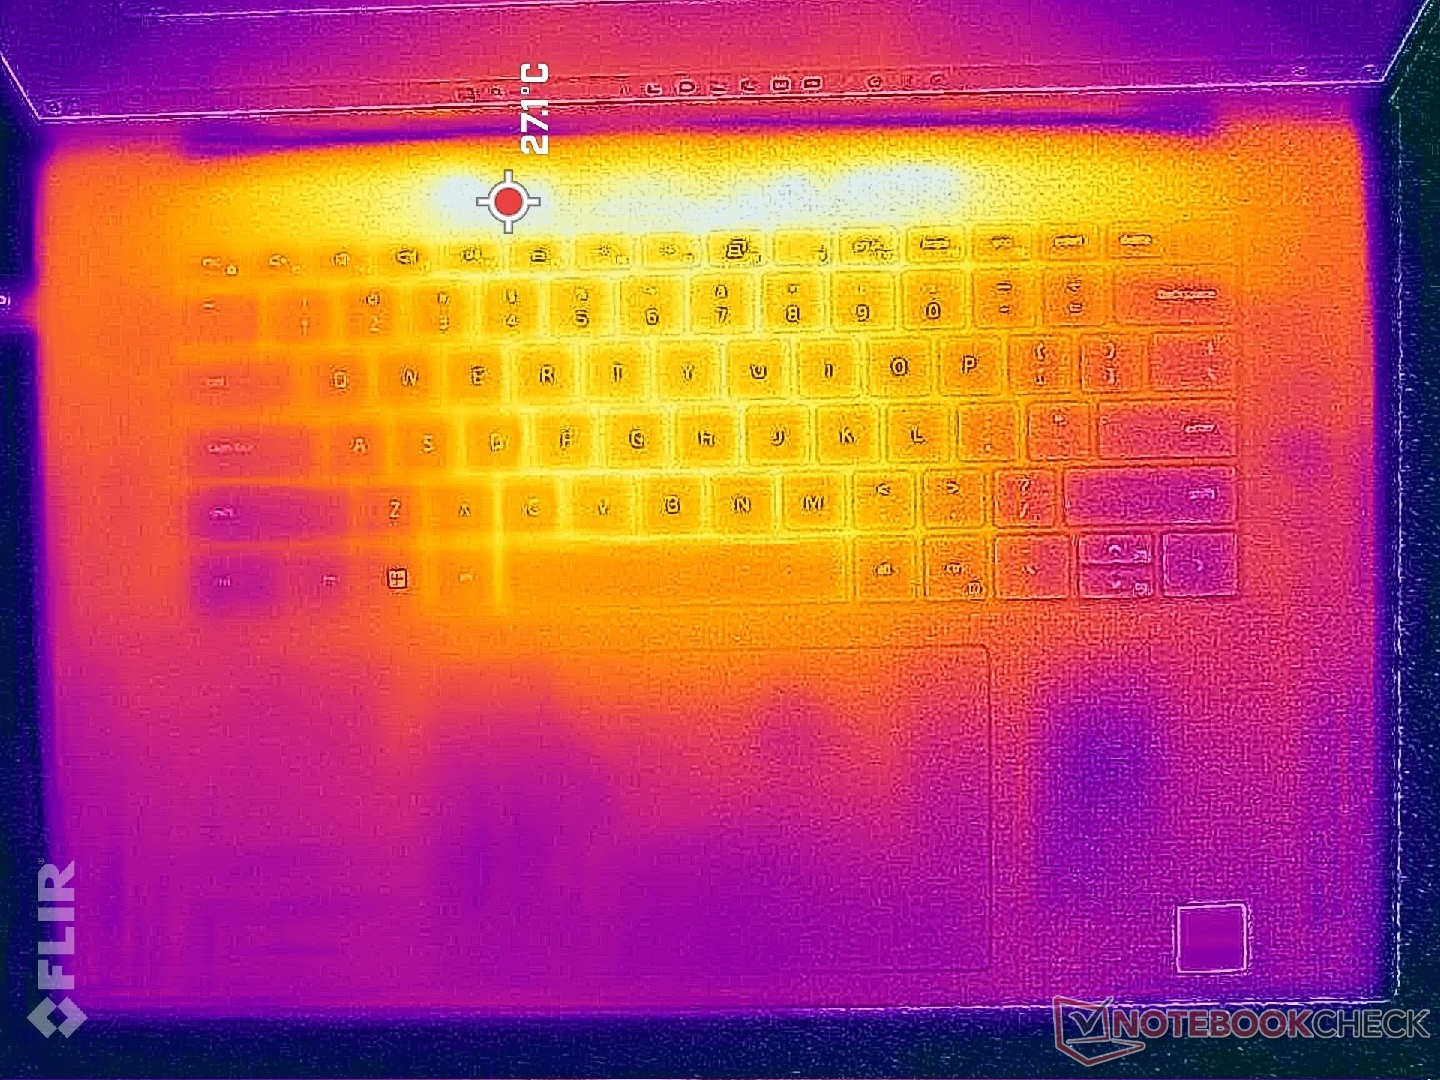
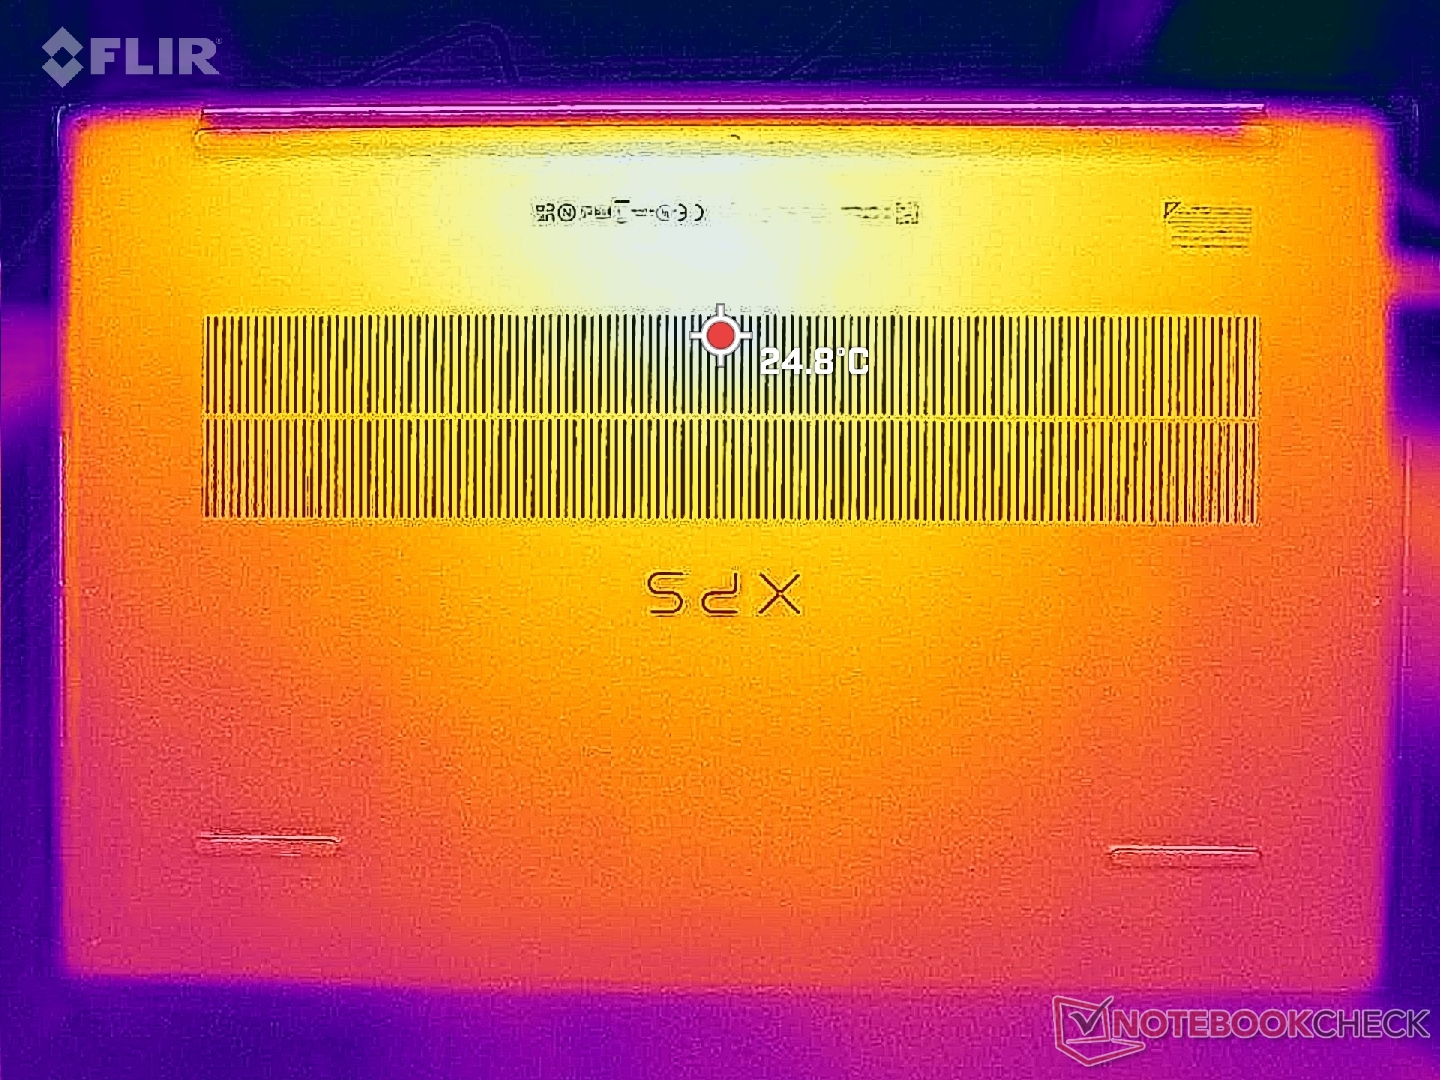
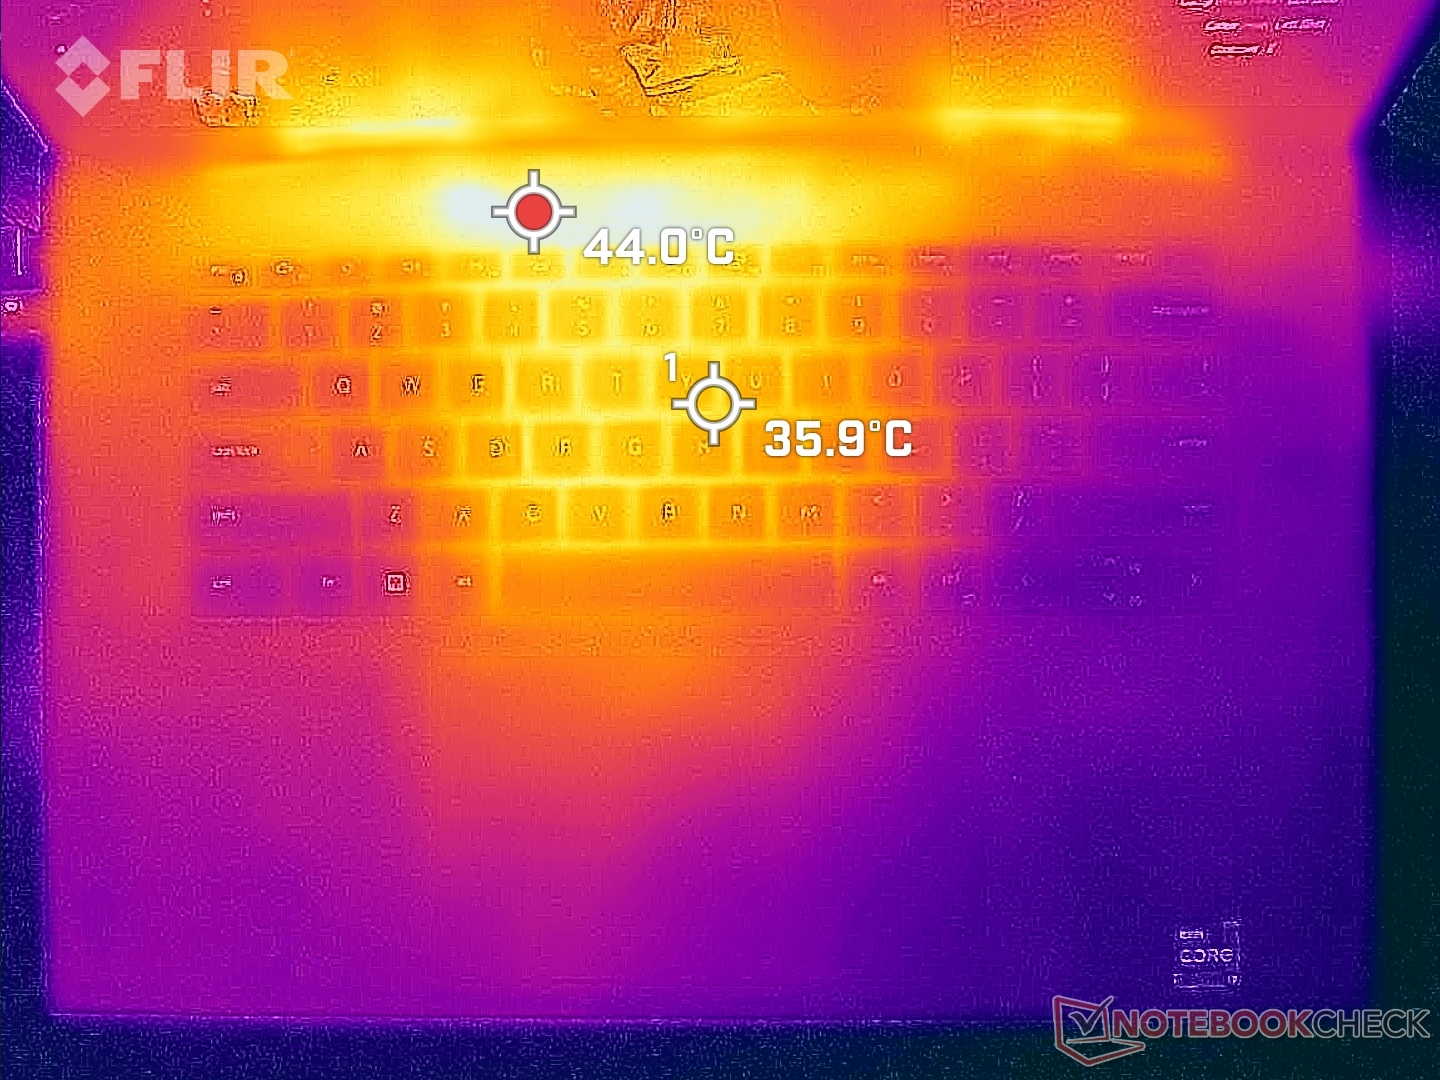
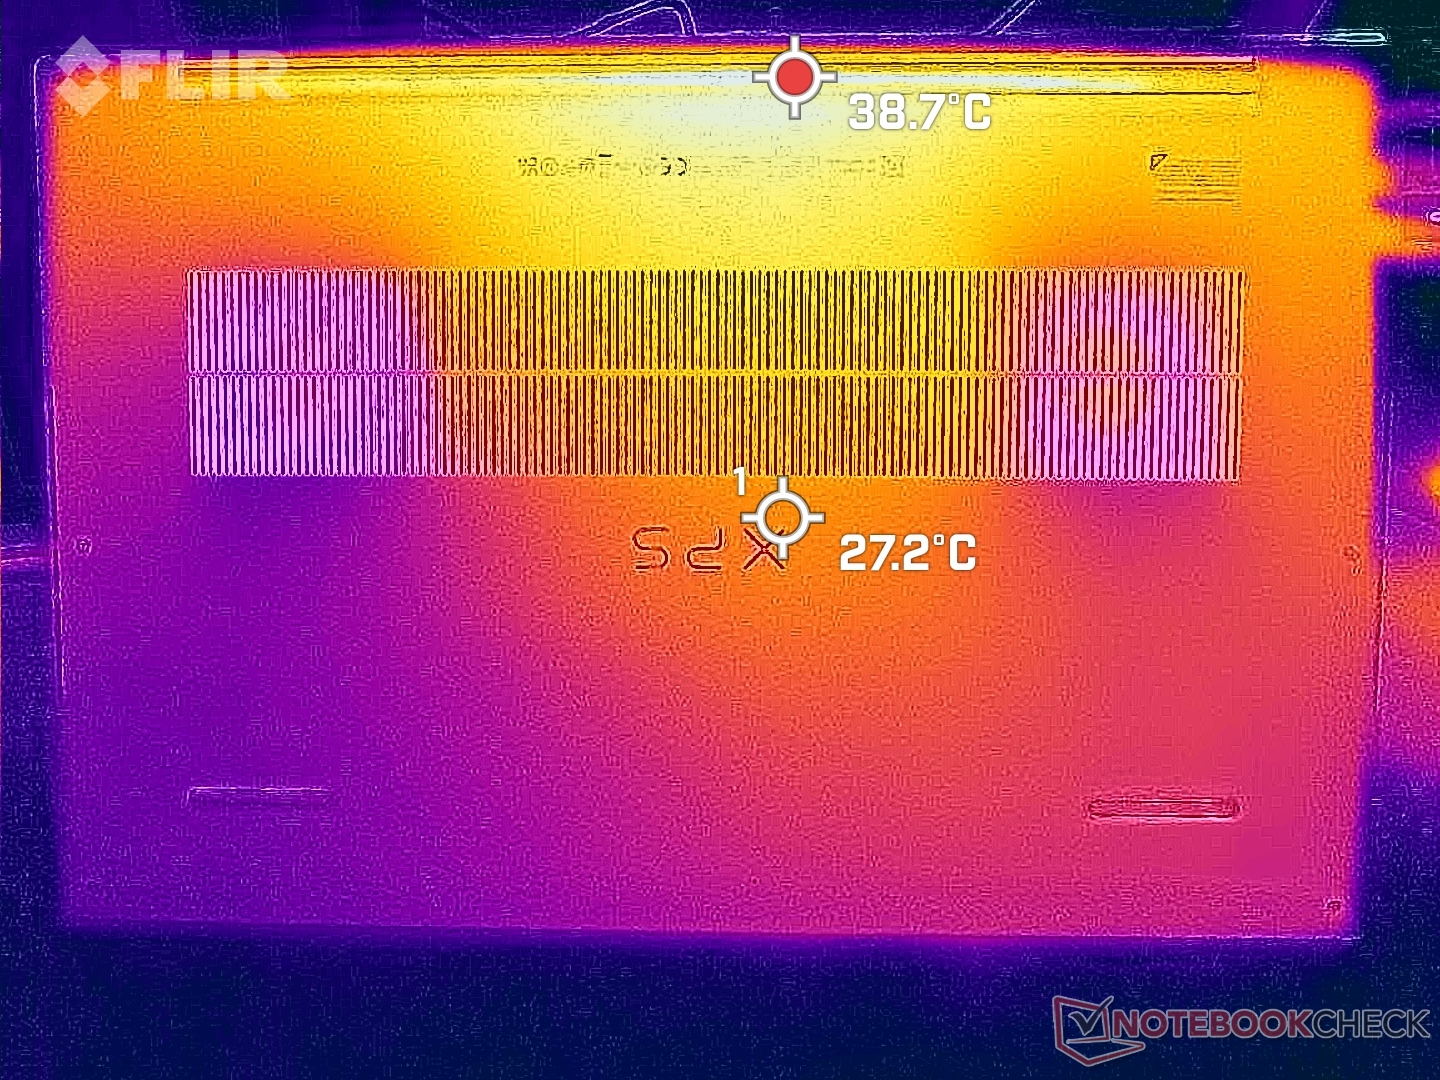
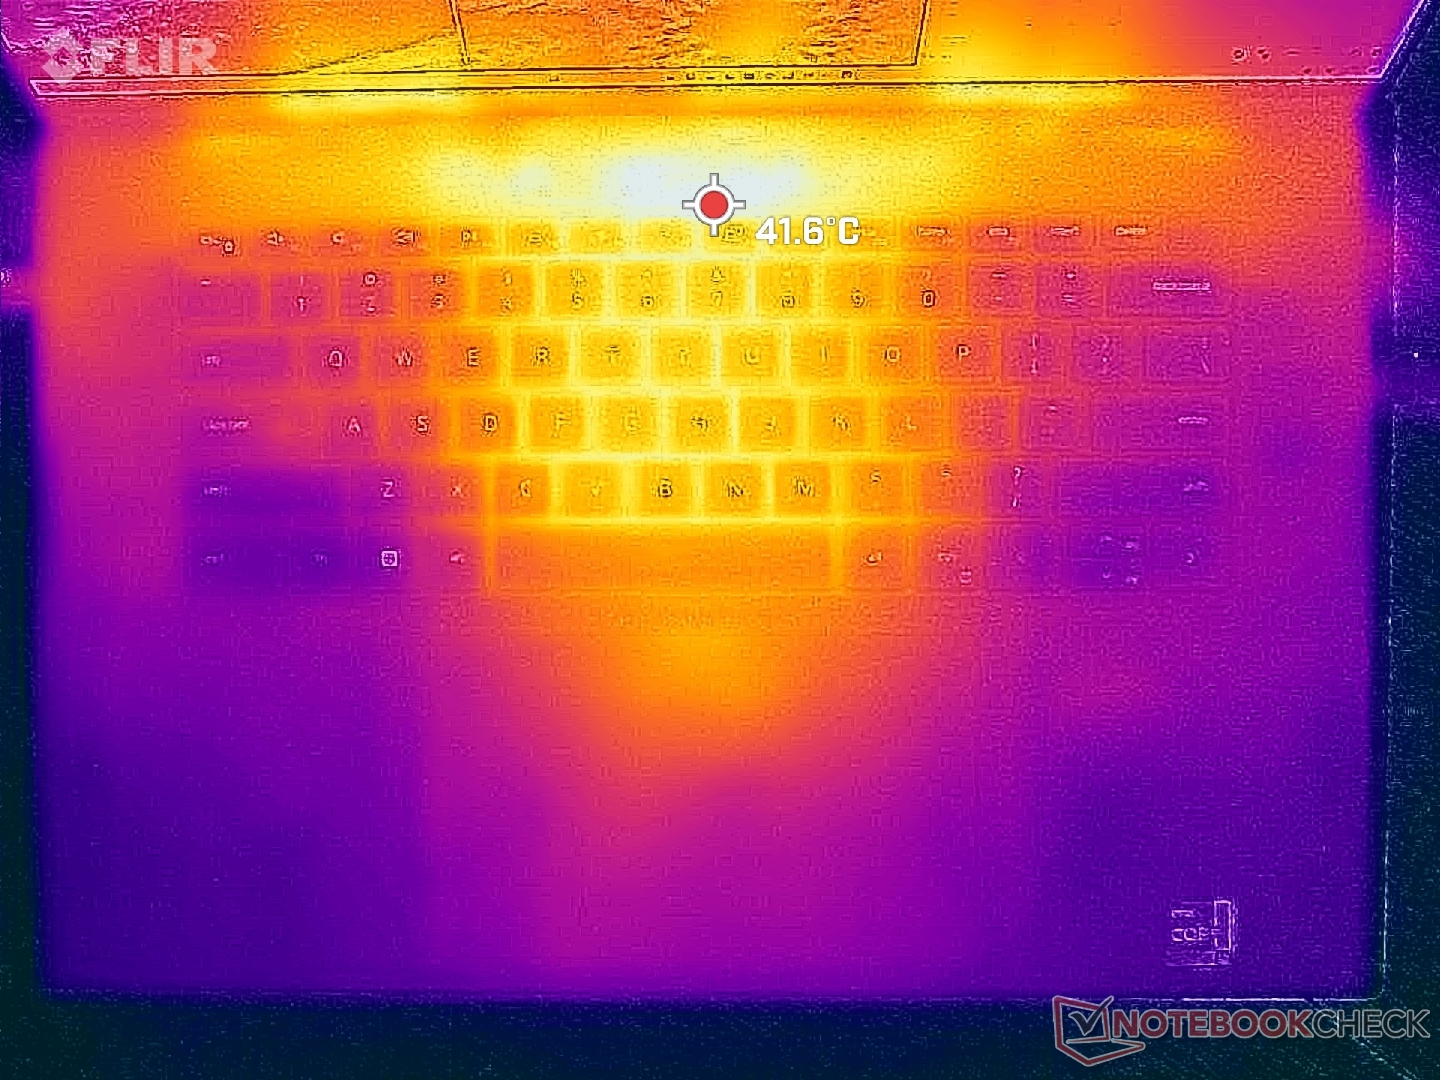
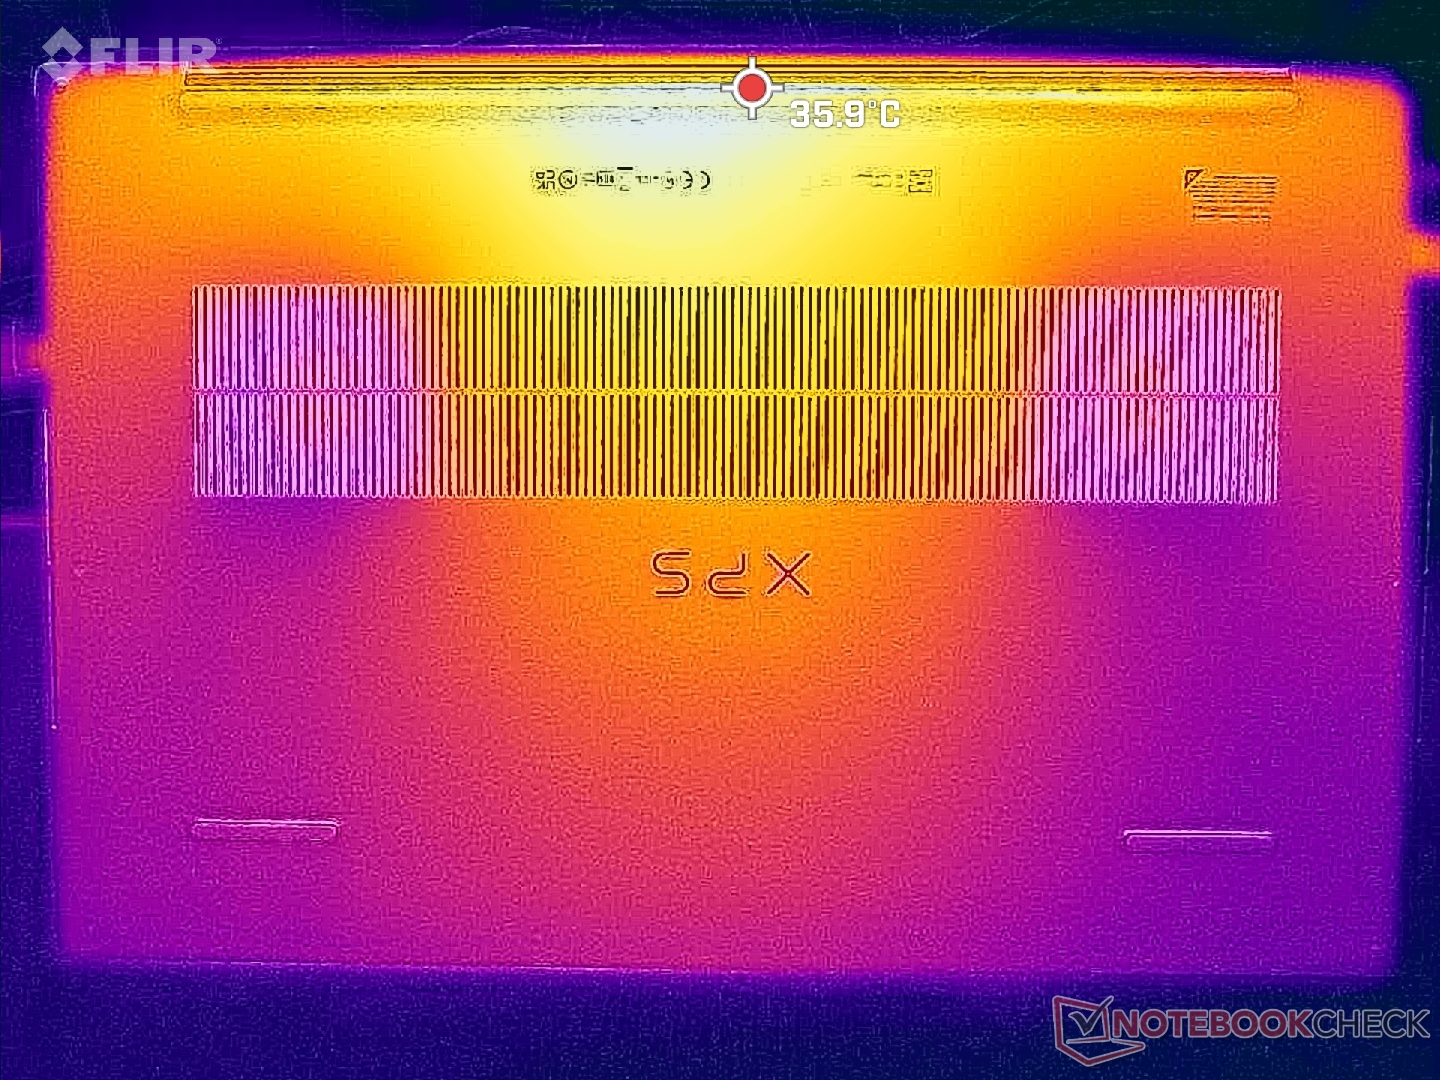
De temperaturen van de Surface zijn koeler dan verwacht in vergelijking met andere laptops met vergelijkbare Core H-serie CPU's en GeForce RTX GPU's. De concurrerendeMSI Creator Z17zou bijvoorbeeld hete plekken hebben van wel 60+ C, terwijl onze Dell slechts 43 C zou hebben bij vergelijkbare zware belastingen. De lagere oppervlaktetemperaturen op de Dell kunnen worden toegeschreven aan de dampkamer-koeler, GORE thermische isolatie, en over het algemeen een lager energieverbruik.
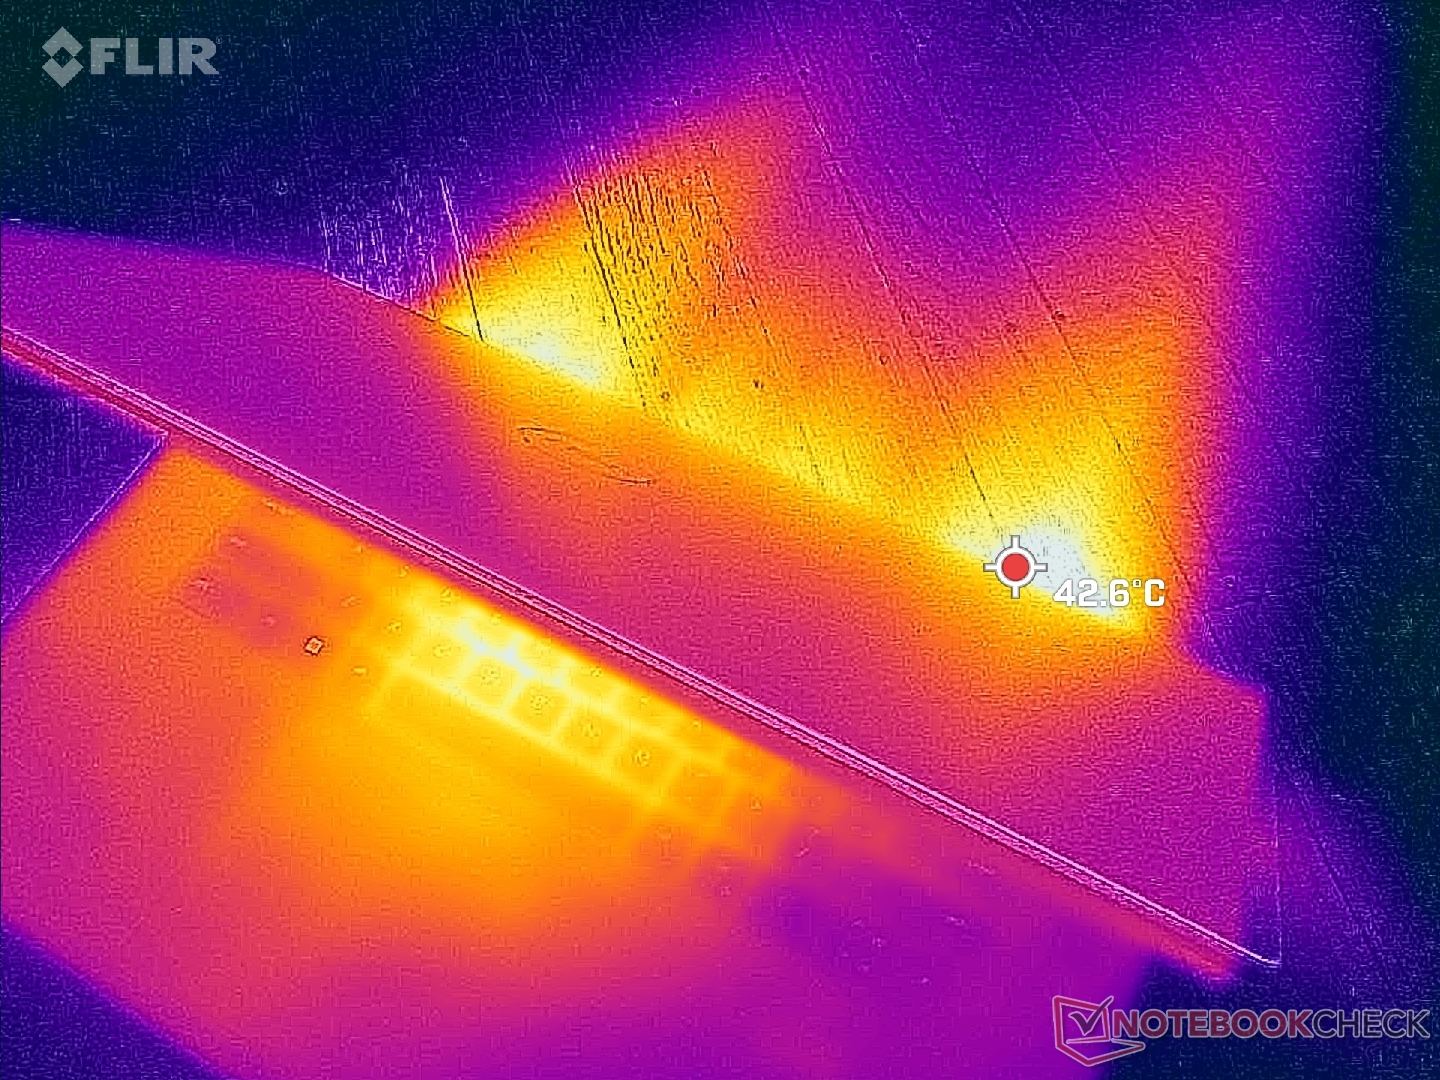
(±) De maximumtemperatuur aan de bovenzijde bedraagt 43.2 °C / 110 F, vergeleken met het gemiddelde van 36.8 °C / 98 F, variërend van 21 tot 71 °C voor de klasse Multimedia.
(+) De bodem warmt op tot een maximum van 31.8 °C / 89 F, vergeleken met een gemiddelde van 39.1 °C / 102 F
(+) Bij onbelast gebruik bedraagt de gemiddelde temperatuur voor de bovenzijde 28.2 °C / 83 F, vergeleken met het apparaatgemiddelde van 31.3 °C / 88 F.
(±) Bij het spelen van The Witcher 3 is de gemiddelde temperatuur voor de bovenzijde 33.7 °C / 93 F, vergeleken met het apparaatgemiddelde van 31.3 °C / 88 F.
(+) De palmsteunen en het touchpad zijn met een maximum van ###max## °C / 87.8 F koeler dan de huidtemperatuur en voelen daarom koel aan.
(-) De gemiddelde temperatuur van de handpalmsteun van soortgelijke toestellen bedroeg 28.7 °C / 83.7 F (-2.3 °C / -4.1 F).
| Dell XPS 17 9730 RTX 4070 Intel Core i7-13700H, NVIDIA GeForce RTX 4070 Laptop GPU | Dell XPS 17 9720 RTX 3060 Intel Core i7-12700H, NVIDIA GeForce RTX 3060 Laptop GPU | LG Gram 17 (2023) Intel Core i7-1360P, Intel Iris Xe Graphics G7 96EUs | HP Envy 17-cr0079ng Intel Core i7-1255U, NVIDIA GeForce RTX 2050 Mobile | MSI Creator Z17 A12UGST-054 Intel Core i9-12900H, NVIDIA GeForce RTX 3070 Ti Laptop GPU | Apple MacBook Pro 16 2023 M2 Max Apple M2 Max, Apple M2 Max 38-Core GPU | |
|---|---|---|---|---|---|---|
| Heat | -19% | -7% | -3% | -37% | 5% | |
| Maximum Upper Side * (°C) | 43.2 | 51.8 -20% | 43.9 -2% | 47.1 -9% | 63.9 -48% | 44.2 -2% |
| Maximum Bottom * (°C) | 31.8 | 44.2 -39% | 45.5 -43% | 43.8 -38% | 68 -114% | 42.9 -35% |
| Idle Upper Side * (°C) | 32.8 | 34.8 -6% | 28.4 13% | 25.2 23% | 28.3 14% | 22.4 32% |
| Idle Bottom * (°C) | 29.8 | 33.2 -11% | 28.2 5% | 25.9 13% | 30.2 -1% | 22.3 25% |
* ... kleiner is beter
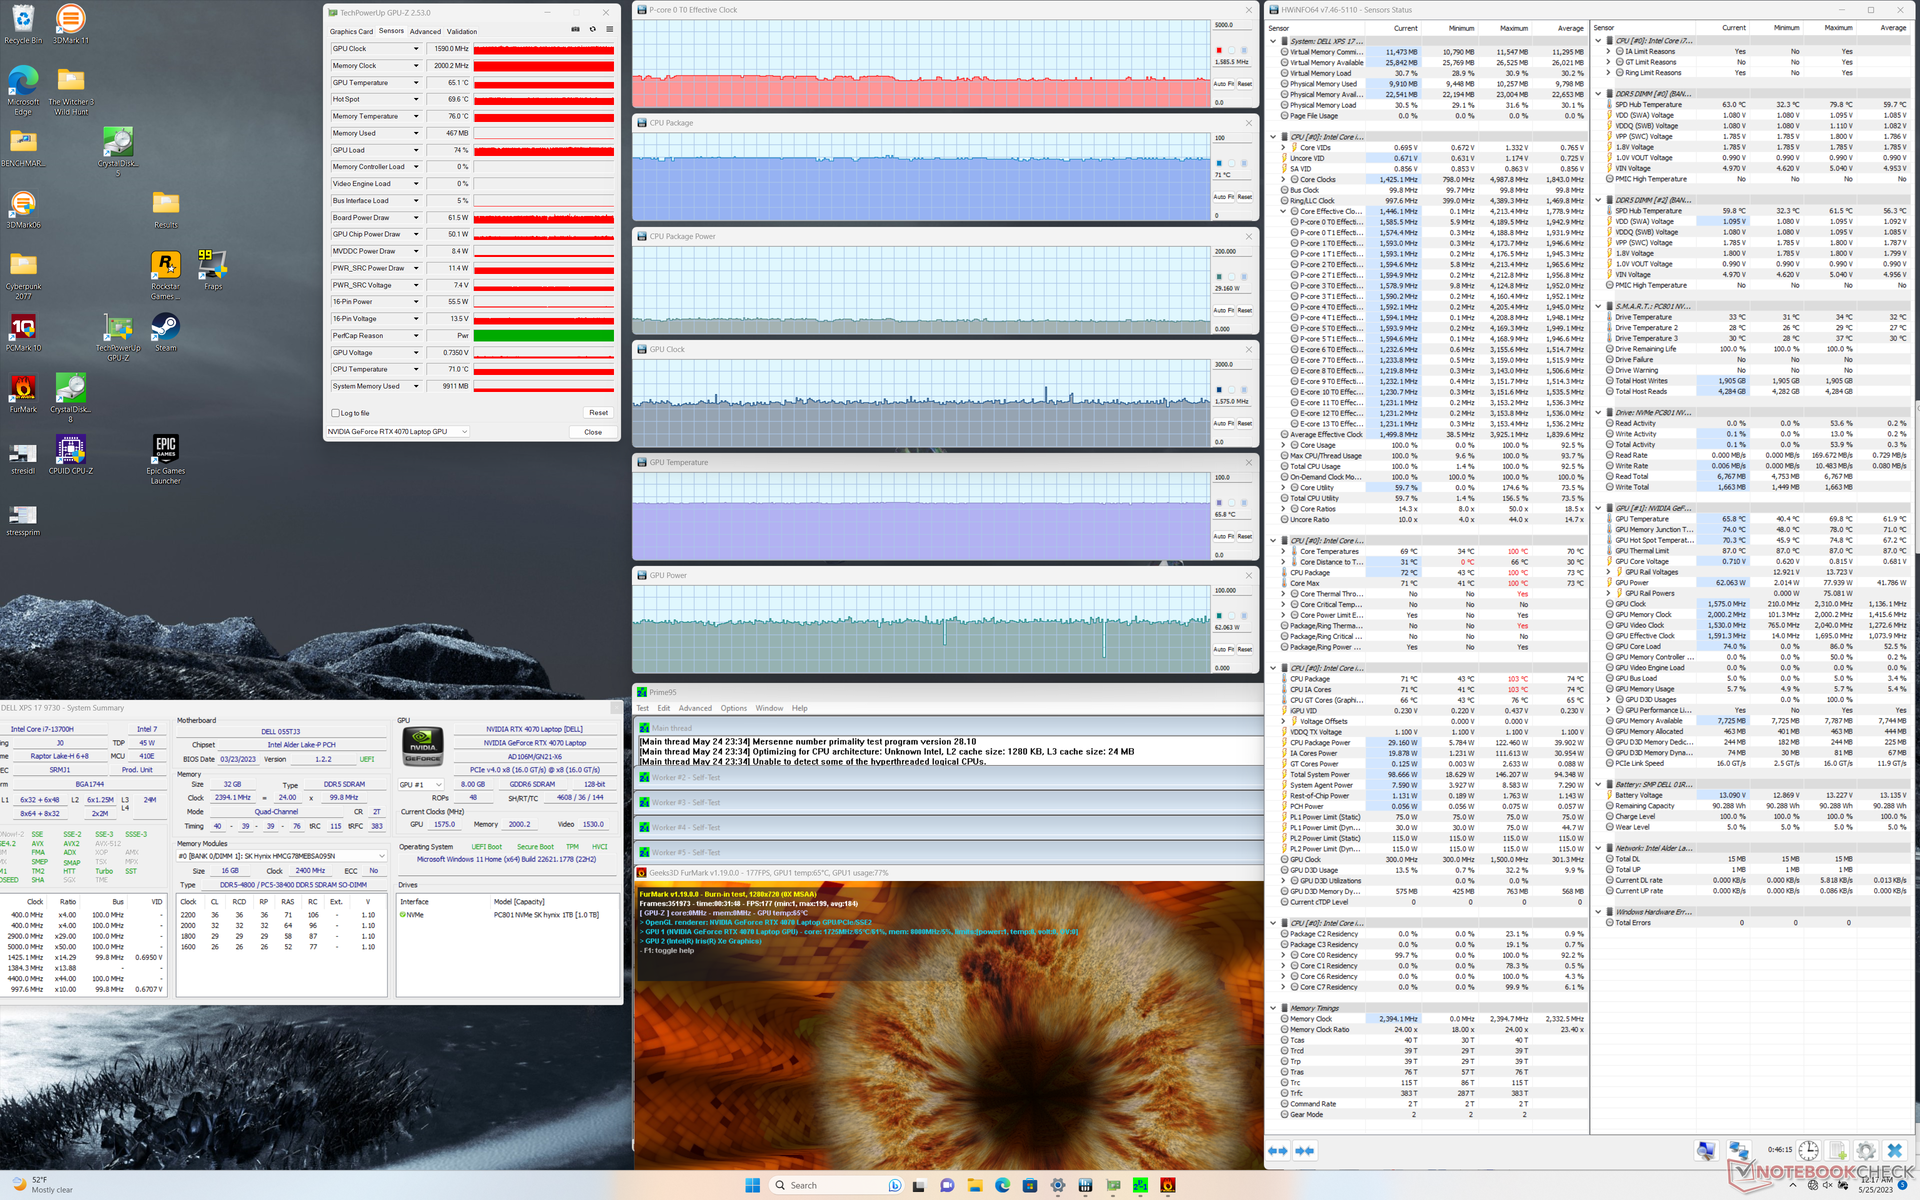
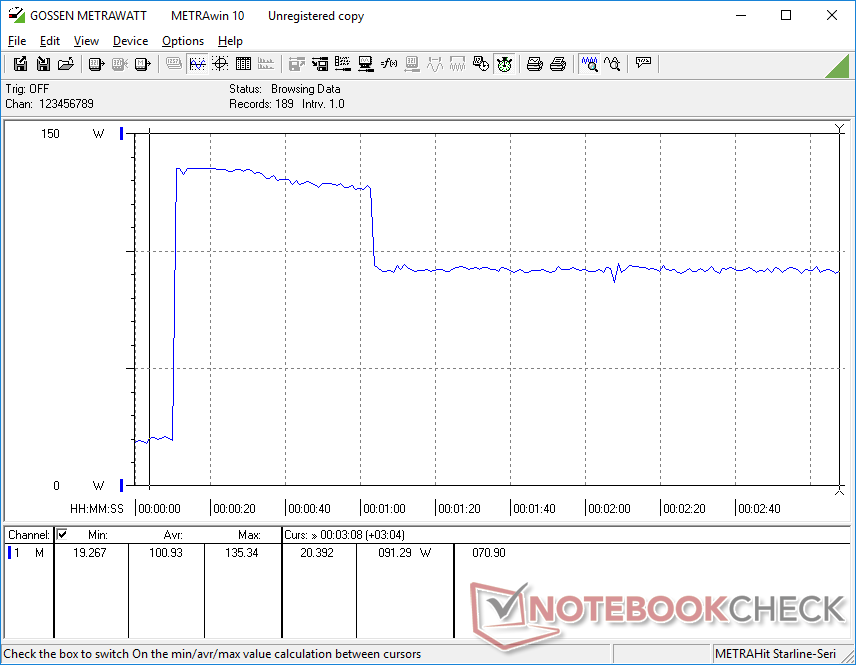
Stresstest
Toen Prime95 werd uitgevoerd om de CPU te belasten, piekten de kloksnelheden en het pakketvermogen tot respectievelijk 4,1 GHz en 122 W, gedurende slechts enkele seconden. Daarna daalde de processor gestaag tot 3,4 GHz en 80 W, en een paar minuten later tot 2,6 GHz en 55 W. Het uiteindelijke stabiele energieverbruik van 55 W komt overeen met wat we zagen op de XPS 19 9720 wat hun vergelijkbare processorprestaties zou verklaren, nadat rekening is gehouden met throttling zoals hierboven vermeld. De kerntemperatuur is met 95 tot 100 C erg hoog tijdens de eerste minuten van de test wanneer Turbo Boost het meest actief is, voordat hij daalt en zich stabiliseert op 74 C.
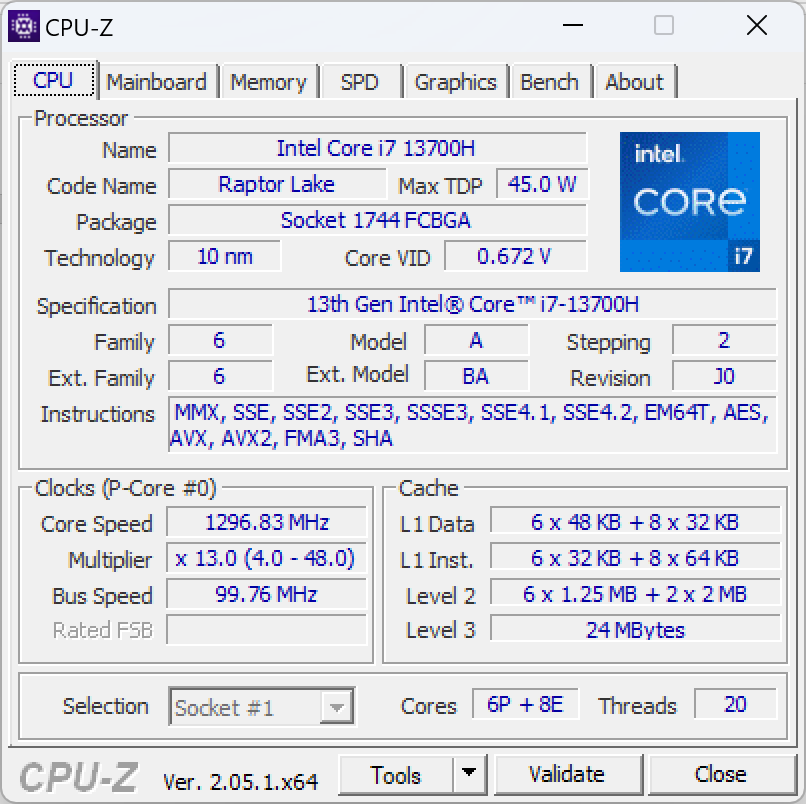
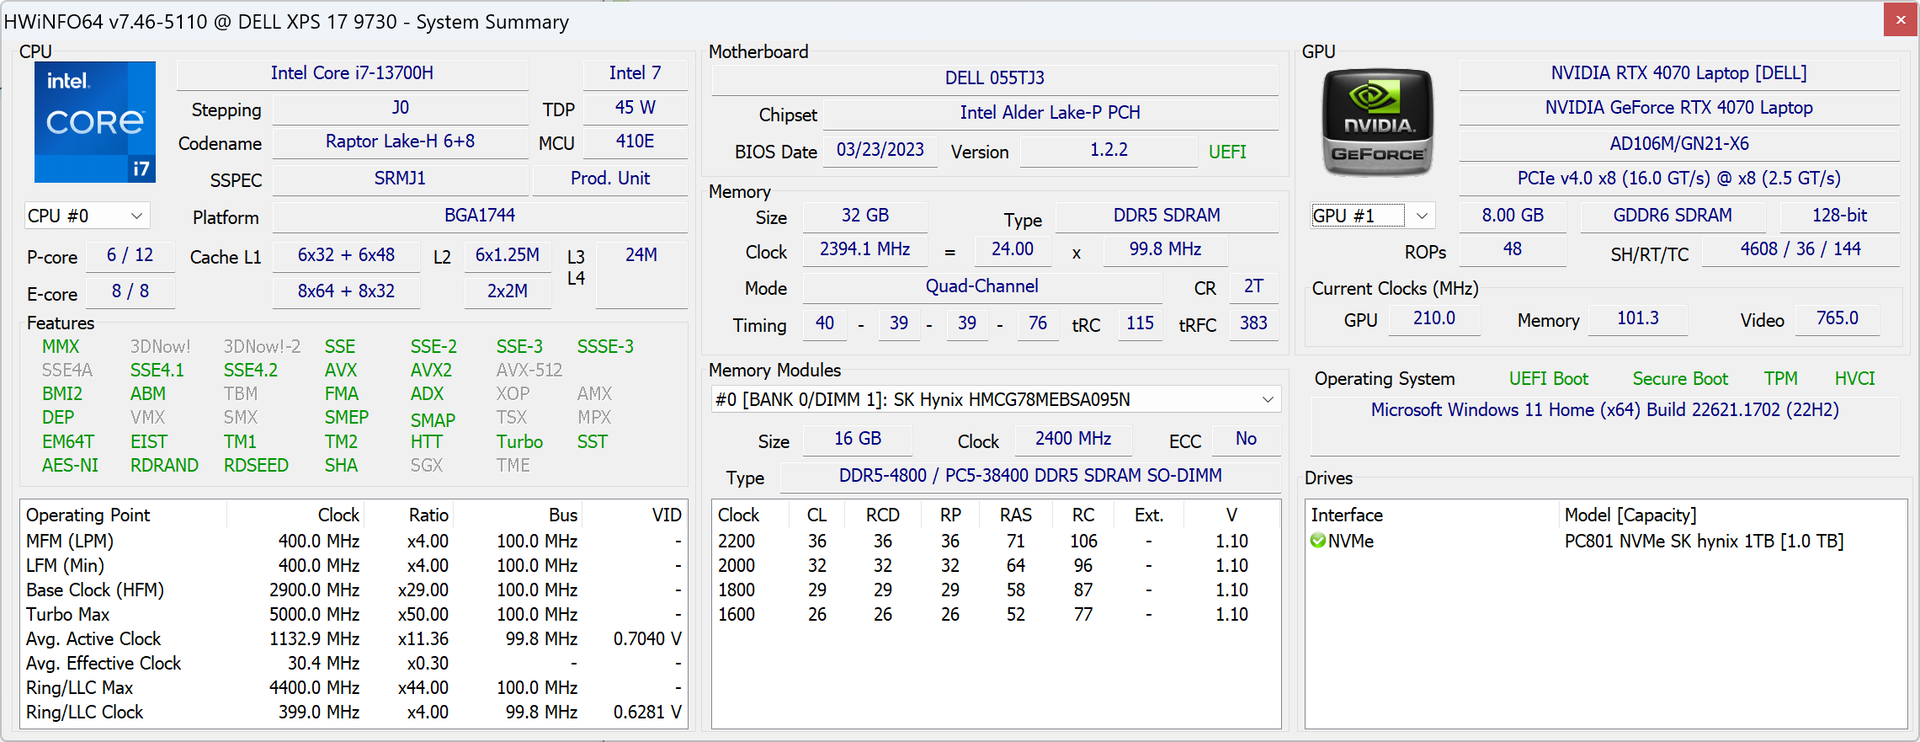
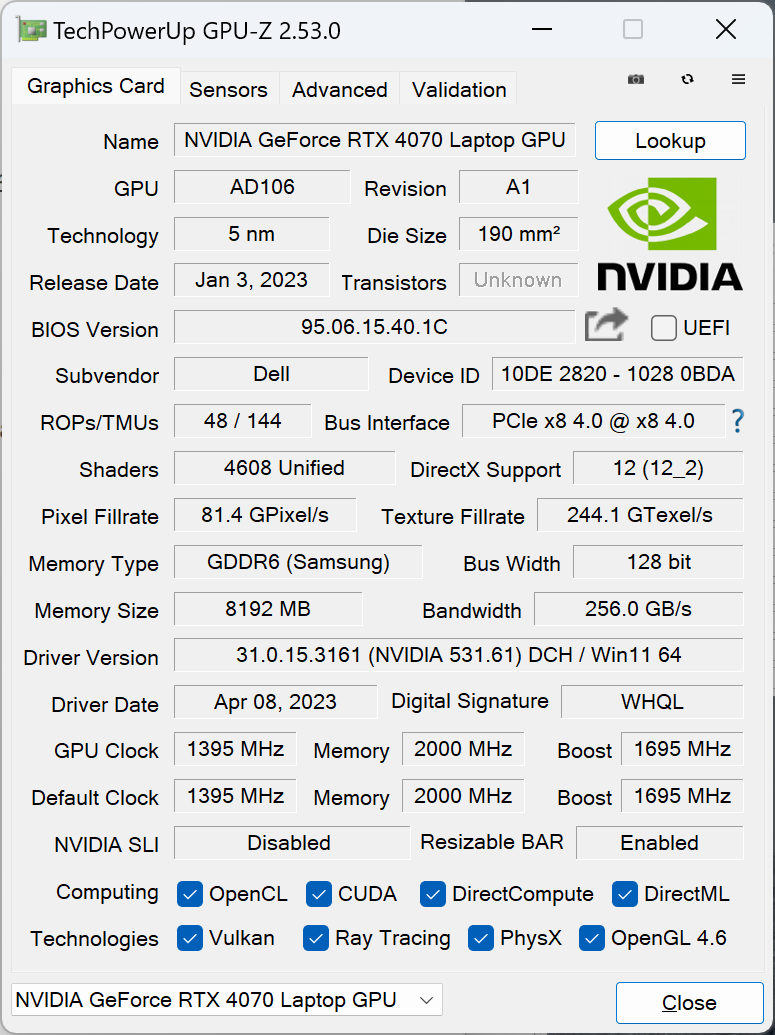
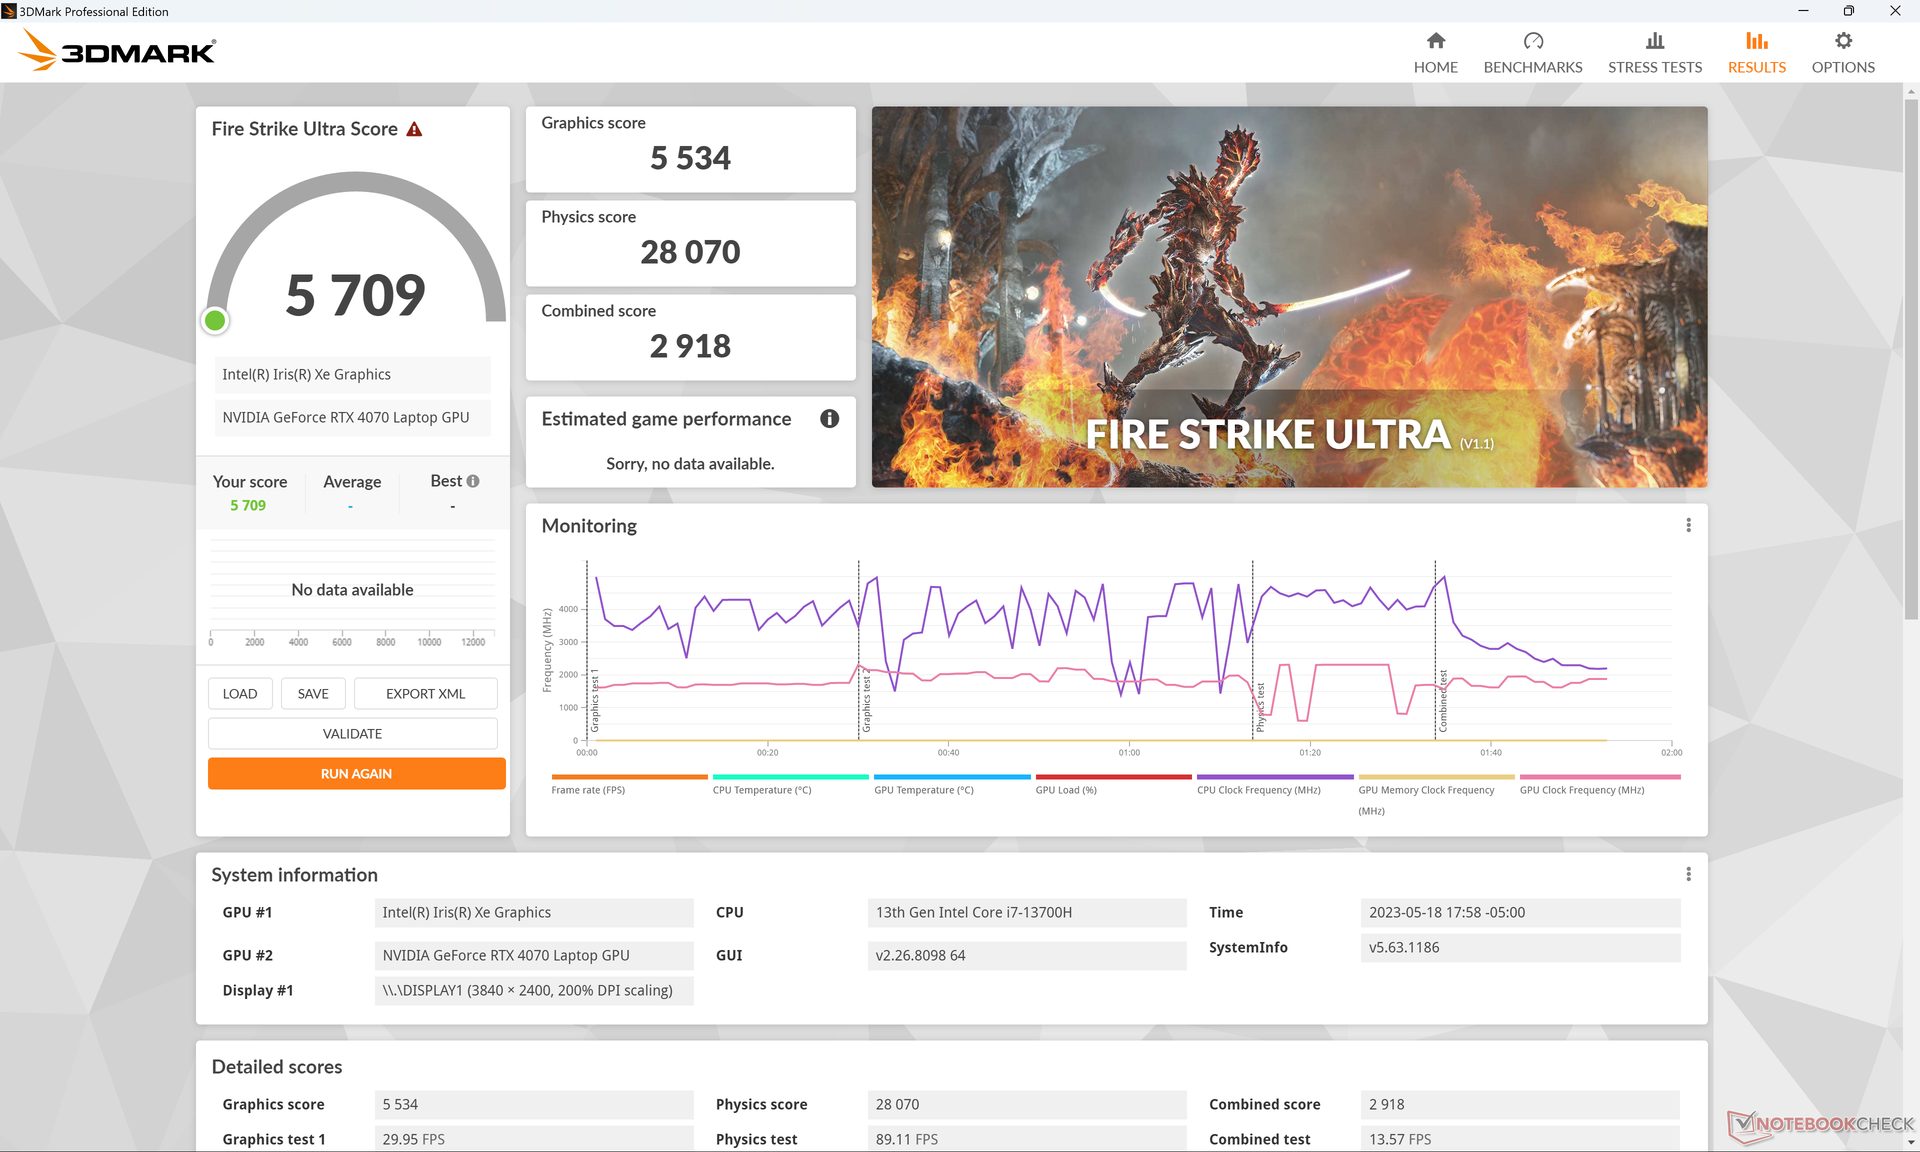
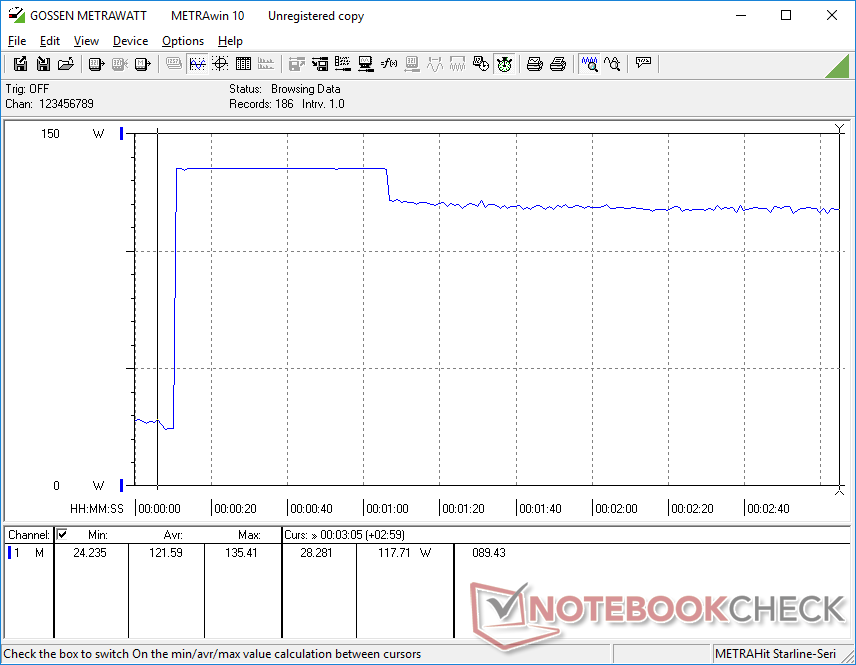
GPU kloksnelheid en temperatuur tijdens het draaien Witcher 3 zouden stabiliseren op respectievelijk 2115 MHz en 67 C, waarvan de laatste overeenkomt met wat we vorig jaar waarnamen op de RTX 3060-aangedreven XPS 17 9720. Interessant is dat GPU-Z een lager stroomverbruik van 52 W rapporteert, terwijl HWiNFO 70 W rapporteert, zoals blijkt uit ons screenshot hieronder. Beide waarden lijken niettemin stabiel te zijn.
Werken op batterijen beperkt de prestaties. Een Fire Strike test op batterijen zou Physics en Graphics scores opleveren van respectievelijk 24847 en 21172 punten, vergeleken met 27094 en 24612 punten op netstroom.
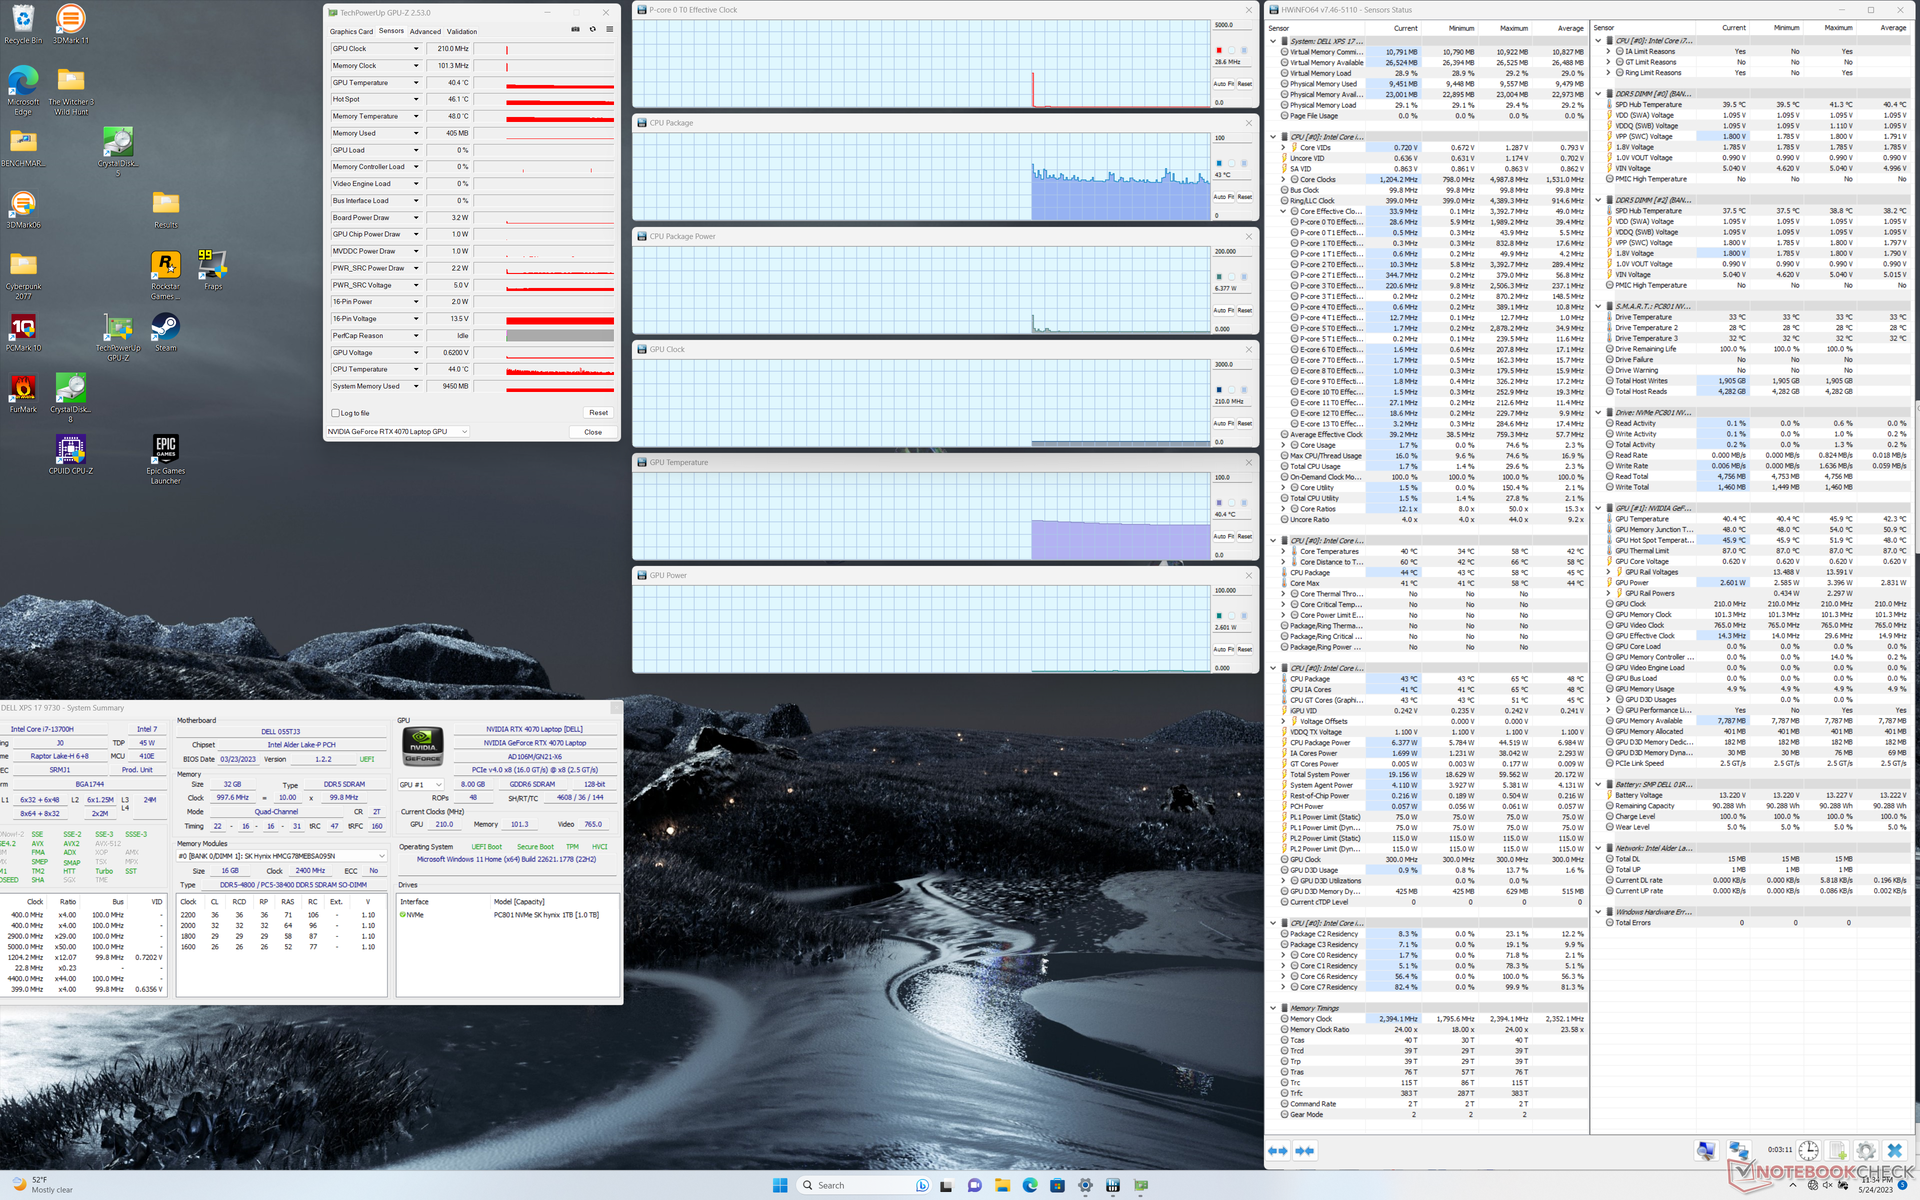
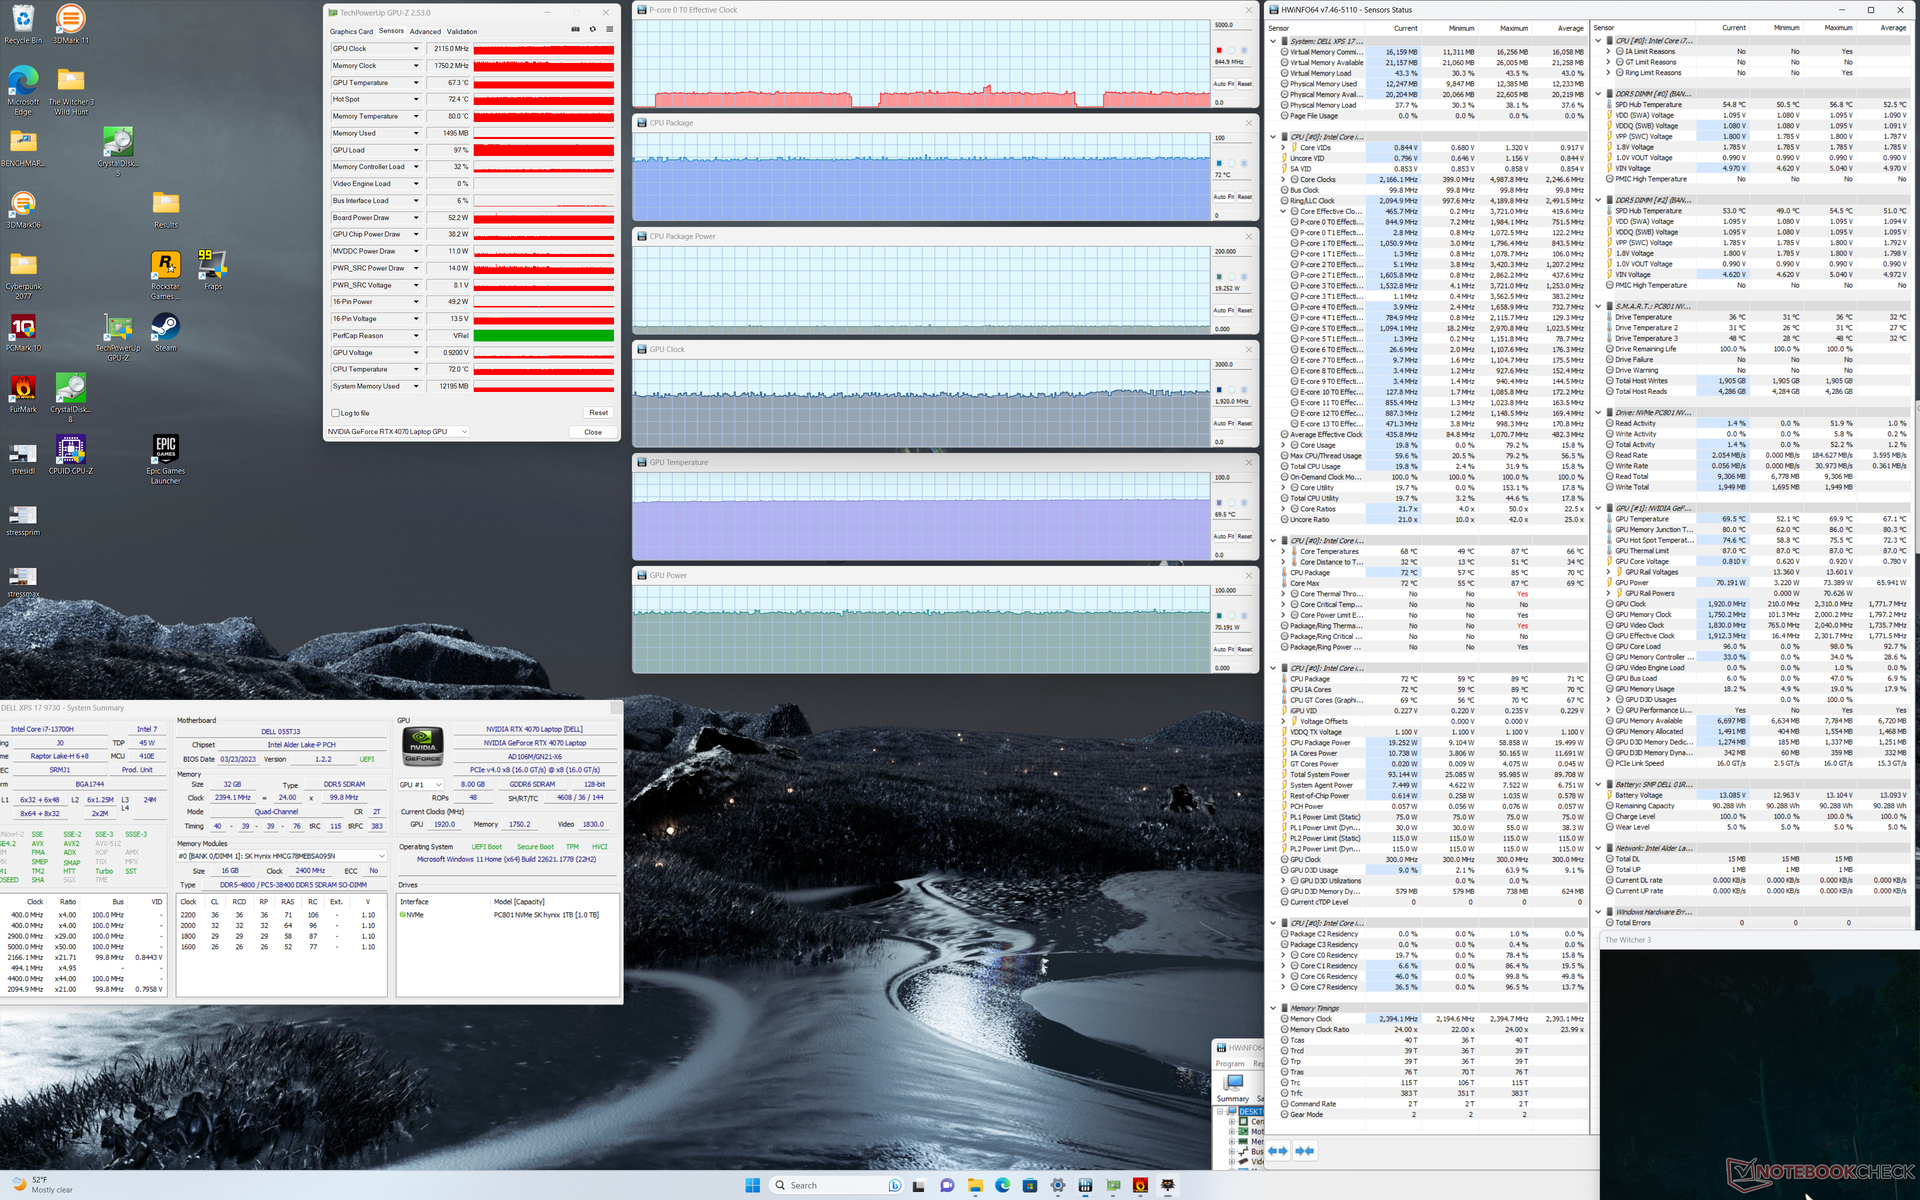
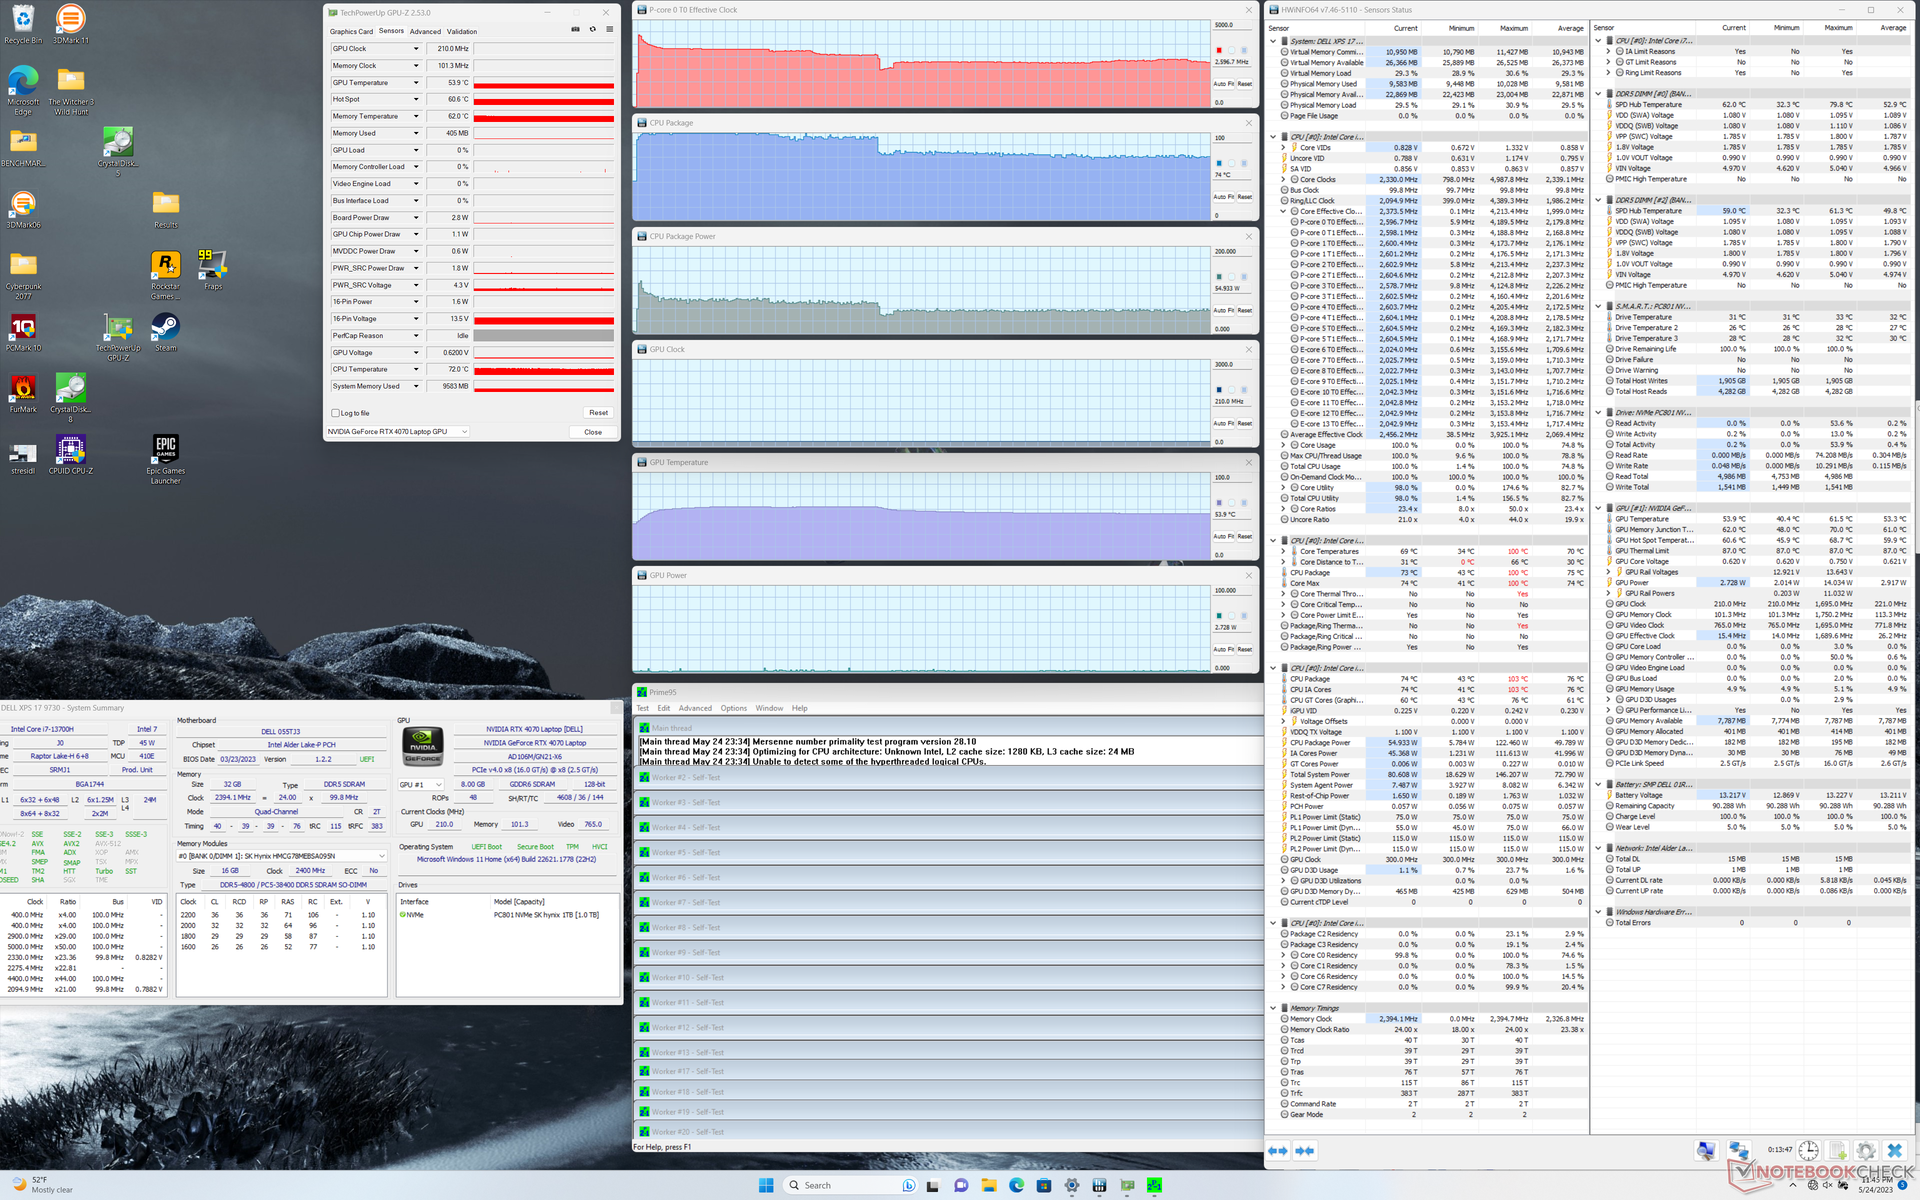
| CPU-klok (GHz) | GPU-klok (MHz) | Gemiddelde CPU-temperatuur (°C) | Gemiddelde GPU-temperatuur (°C) | |
| Systeem Idle | -- | -- | 43 | 40 |
| Prime95 Stress | 2.6 | -- | 74 | 54 |
| Prime95 + FurMark Stress | 1.6 | 1590 | 71 | 65 |
| Witcher 3 Stress | 0,8 | 2115 | 72 | 67 |
Luidsprekers
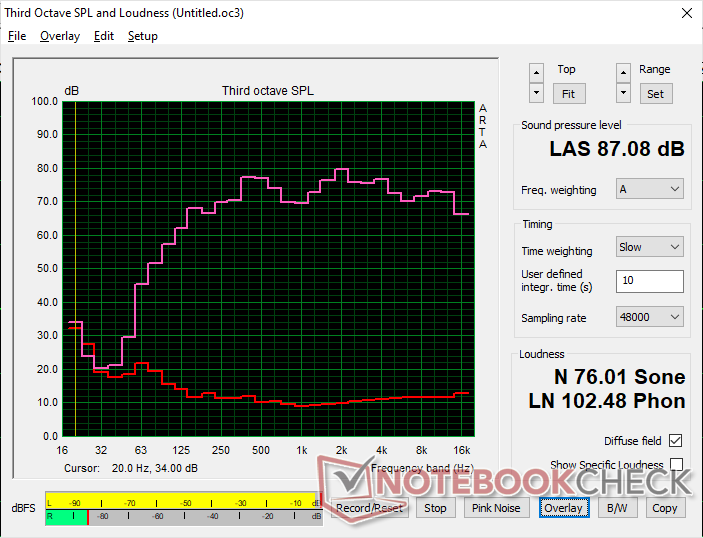
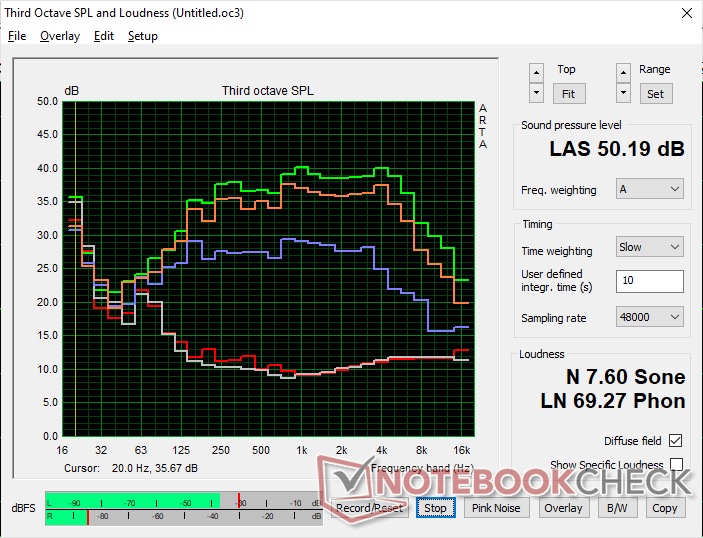
Dell XPS 17 9730 RTX 4070 audioanalyse
(+) | luidsprekers kunnen relatief luid spelen (87.1 dB)
Bas 100 - 315 Hz
(±) | verminderde zeebaars - gemiddeld 7.2% lager dan de mediaan
(+) | de lage tonen zijn lineair (5.9% delta naar de vorige frequentie)
Midden 400 - 2000 Hz
(+) | evenwichtige middens - slechts 3.3% verwijderd van de mediaan
(+) | de middentonen zijn lineair (5.1% delta ten opzichte van de vorige frequentie)
Hoog 2 - 16 kHz
(+) | evenwichtige hoogtepunten - slechts 1.9% verwijderd van de mediaan
(+) | de hoge tonen zijn lineair (3.4% delta naar de vorige frequentie)
Algemeen 100 - 16.000 Hz
(+) | het totale geluid is lineair (7% verschil met de mediaan)
Vergeleken met dezelfde klasse
» 5% van alle geteste apparaten in deze klasse waren beter, 1% vergelijkbaar, 94% slechter
» De beste had een delta van 5%, het gemiddelde was 17%, de slechtste was 45%
Vergeleken met alle geteste toestellen
» 1% van alle geteste apparaten waren beter, 0% gelijk, 99% slechter
» De beste had een delta van 4%, het gemiddelde was 23%, de slechtste was 134%
Apple MacBook Pro 16 2021 M1 Pro audioanalyse
(+) | luidsprekers kunnen relatief luid spelen (84.7 dB)
Bas 100 - 315 Hz
(+) | goede baars - slechts 3.8% verwijderd van de mediaan
(+) | de lage tonen zijn lineair (5.2% delta naar de vorige frequentie)
Midden 400 - 2000 Hz
(+) | evenwichtige middens - slechts 1.3% verwijderd van de mediaan
(+) | de middentonen zijn lineair (2.1% delta ten opzichte van de vorige frequentie)
Hoog 2 - 16 kHz
(+) | evenwichtige hoogtepunten - slechts 1.9% verwijderd van de mediaan
(+) | de hoge tonen zijn lineair (2.7% delta naar de vorige frequentie)
Algemeen 100 - 16.000 Hz
(+) | het totale geluid is lineair (4.6% verschil met de mediaan)
Vergeleken met dezelfde klasse
» 0% van alle geteste apparaten in deze klasse waren beter, 0% vergelijkbaar, 100% slechter
» De beste had een delta van 5%, het gemiddelde was 17%, de slechtste was 45%
Vergeleken met alle geteste toestellen
» 0% van alle geteste apparaten waren beter, 0% gelijk, 100% slechter
» De beste had een delta van 4%, het gemiddelde was 23%, de slechtste was 134%
Energiebeheer - USB-C aan het werk
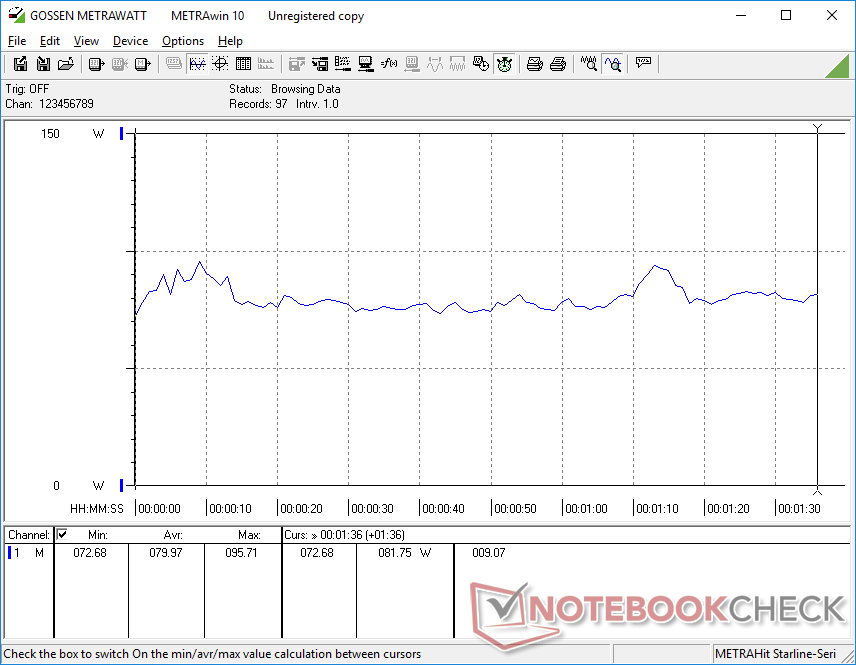
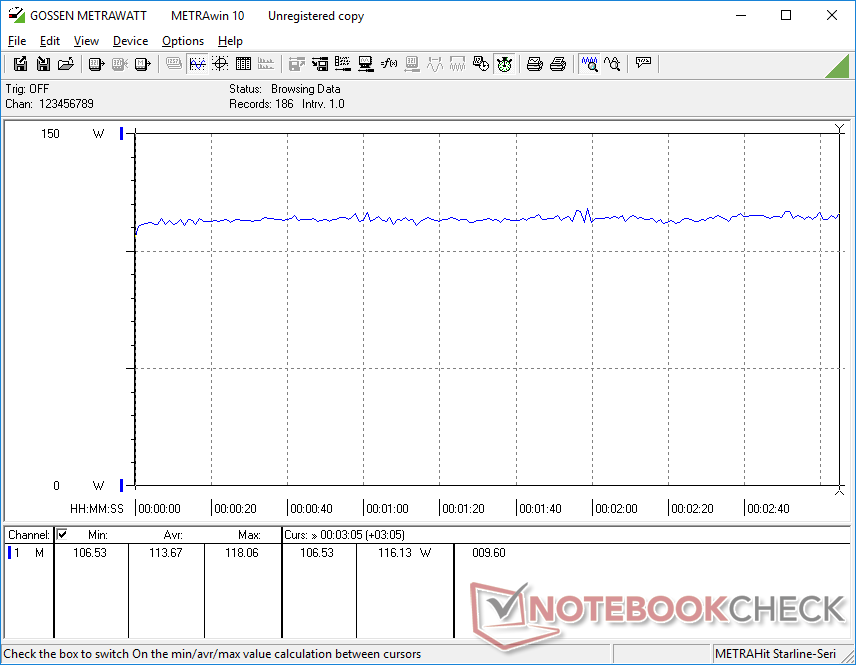
Stroomverbruik - Is 130 W genoeg?
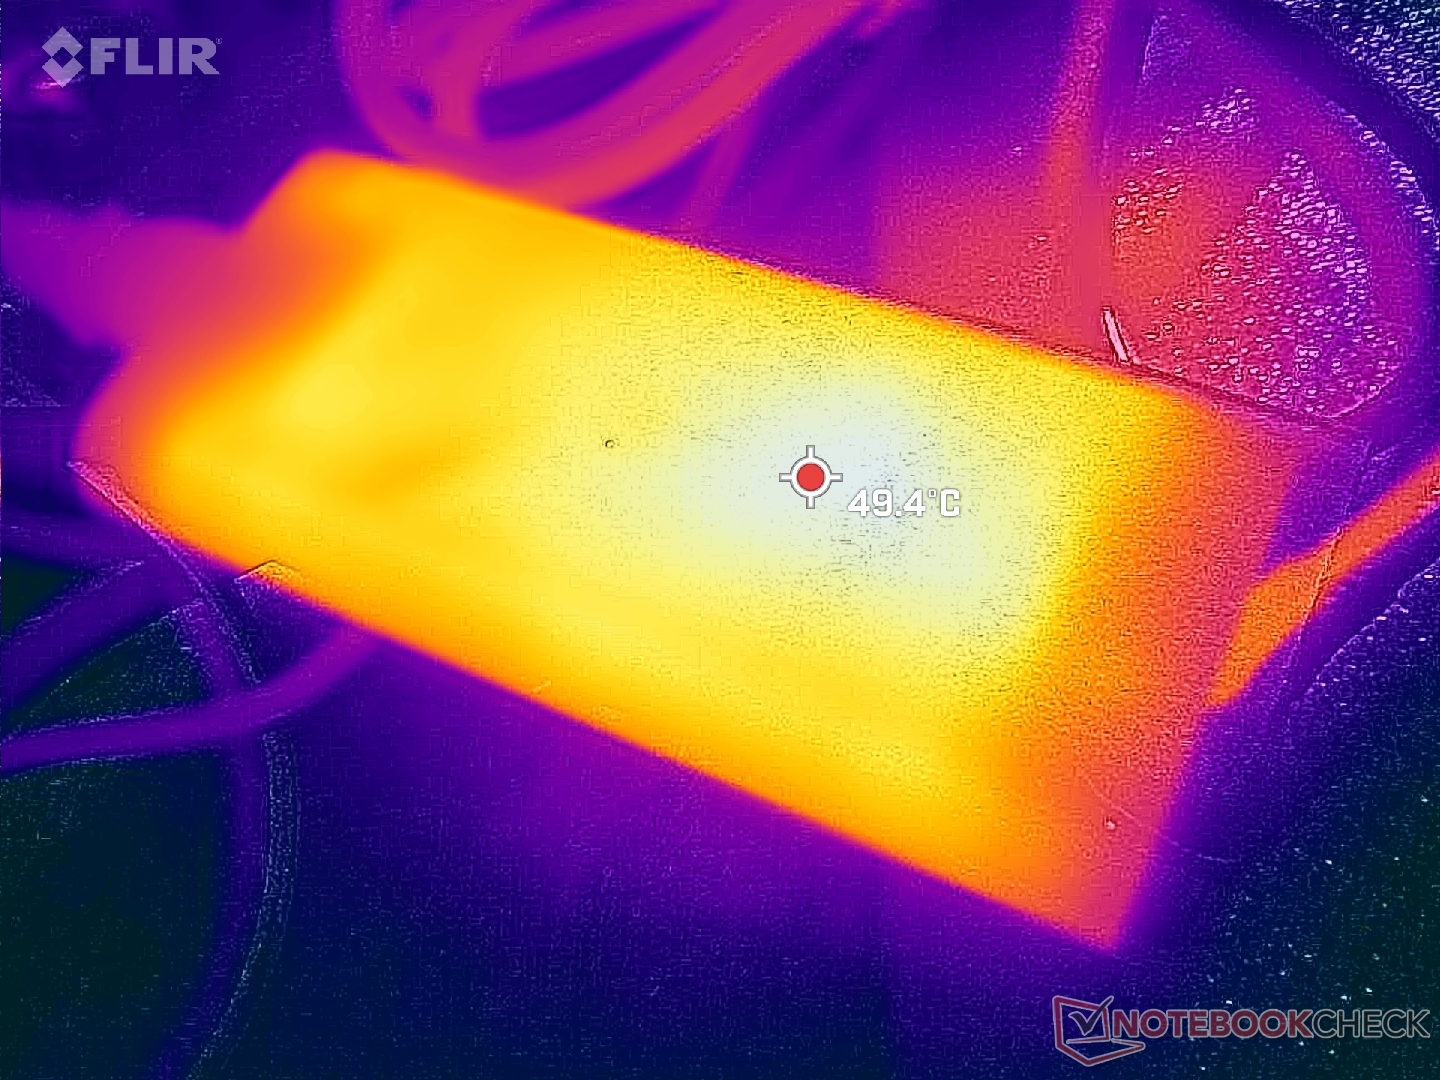
Het stroomverbruik is niet drastisch veranderd ten opzichte van de oudere XPS 17 9720, aangezien alle XPS 17-modellen tot nu toe worden geleverd met dezelfde 130 W USB-C AC-adapter. In vergelijking met andere laptops met H-serie CPU's en GeForce RTX GPU's is de 130 W Dell adapter een van de kleinste in zowel formaat als output. De kleine adapter verruilt hogere prestaties en sneller opladen voor draagbaarheid.
Toch zorgt de hogere prestatie-per-watt van Ada Lovelace versus Ampere ervoor dat de XPS 17 9730 nog steeds beter presteert dan het model van vorig jaar bij hetzelfde vermogen. Het draaien van Witcher 3, bijvoorbeeld, verbruikt ongeveer 114 W op zowel de XPS 17 9720 als 9730, ondanks dat de laatste 30 procent snellere grafische prestaties biedt. CPU stroomverbruik zou ook stabieler zijn met zijn langere Turbo Boost duurzaamheid ten opzichte van de Core i7-12700H zoals hierboven vermeld. Dell heeft zeker de CPU en GPU zo goed mogelijk geoptimaliseerd om binnen het beperkte stroombudget te passen.
| Uit / Standby | |
| Inactief | |
| Belasting |
|
Key:
min: | |
| Dell XPS 17 9730 RTX 4070 i7-13700H, GeForce RTX 4070 Laptop GPU, SK hynix PC801 HFS001TEJ9X101N, Sharp LQ170R1, 3840x2400, 17" | Dell XPS 17 9720 RTX 3060 i7-12700H, GeForce RTX 3060 Laptop GPU, Samsung PM9A1 MZVL21T0HCLR, IPS, 3840x2400, 17" | LG Gram 17 (2023) i7-1360P, Iris Xe G7 96EUs, Samsung PM9A1 MZVL21T0HCLR, IPS, 2560x1600, 17" | HP Envy 17-cr0079ng i7-1255U, GeForce RTX 2050 Mobile, Samsung PM991a MZVLQ1T0HBLB, IPS, 3840x2160, 17.3" | MSI Creator Z17 A12UGST-054 i9-12900H, GeForce RTX 3070 Ti Laptop GPU, Micron 3400 1TB MTFDKBA1T0TFH, IPS, 2560x1600, 17" | Apple MacBook Pro 16 2023 M2 Max M2 Max, M2 Max 38-Core GPU, Apple SSD AP2048Z, Mini-LED, 3456x2234, 16.2" | |
|---|---|---|---|---|---|---|
| Power Consumption | 6% | 59% | 34% | -79% | 16% | |
| Idle Minimum * (Watt) | 15 | 5.9 61% | 2.2 85% | 5.8 61% | 34.6 -131% | 5.2 65% |
| Idle Average * (Watt) | 23.6 | 15.8 33% | 8.9 62% | 14.3 39% | 43 -82% | 16.5 30% |
| Idle Maximum * (Watt) | 24.3 | 26.7 -10% | 11 55% | 18.4 24% | 44.9 -85% | 16.8 31% |
| Load Average * (Watt) | 80 | 117.4 -47% | 53 34% | 70 12% | 145 -81% | 113 -41% |
| Witcher 3 ultra * (Watt) | 113.7 | 114.8 -1% | 42.5 63% | 69.4 39% | 152.4 -34% | 92 19% |
| Load Maximum * (Watt) | 135.4 | 136.6 -1% | 64 53% | 93 31% | 220 -62% | 145 -7% |
* ... kleiner is beter
Power Consumption Witcher 3 / Stresstest
Power Consumption external Monitor
Batterijduur - Lange levensduur, langzaam opladen
De WLAN runtime is ongeveer een uur langer dan op de XPS 17 9720 van vorig jaar, voor een totaal van 10 uur echt browsen. Het is goed om te zien dat de accuduur geen klap heeft gekregen, ondanks de jaarlijkse toename van de algemene prestaties.
Het opladen van lege naar volle capaciteit gaat langzaam: ongeveer 2 tot 2,5 uur, vergeleken met 1,5 uur bij de meeste andere laptops. Houd er rekening mee dat het opladen nog langzamer gaat bij veeleisende belastingen zoals games, vanwege de beperkte 130 W AC-adapter.
Het is vermeldenswaard dat de batterij niet langzaam leegloopt bij aansluiting op het lichtnet en het draaien van games of andere veeleisende belastingen. Dit probleem was specifiek voor de originele XPS 9700 en het werd opgelost vanaf de XPS 17 9710.
| Dell XPS 17 9730 RTX 4070 i7-13700H, GeForce RTX 4070 Laptop GPU, 97 Wh | Dell XPS 17 9720 RTX 3060 i7-12700H, GeForce RTX 3060 Laptop GPU, 97 Wh | LG Gram 17 (2023) i7-1360P, Iris Xe G7 96EUs, 80 Wh | HP Envy 17-cr0079ng i7-1255U, GeForce RTX 2050 Mobile, 55 Wh | MSI Creator Z17 A12UGST-054 i9-12900H, GeForce RTX 3070 Ti Laptop GPU, 90 Wh | Apple MacBook Pro 16 2023 M2 Max M2 Max, M2 Max 38-Core GPU, 99.6 Wh | |
|---|---|---|---|---|---|---|
| Batterijduur | -11% | 63% | -4% | 28% | 24% | |
| Reader / Idle (h) | 19.1 | 25.7 35% | ||||
| WiFi v1.3 (h) | 10 | 8.7 -13% | 12.8 28% | 4.7 -53% | 5.5 -45% | 14.8 48% |
| Load (h) | 1.1 | 1 -9% | 2.5 127% | 1.6 45% | 2.2 100% | 1.1 0% |
| H.264 (h) | 14.5 | 5.5 | 5.5 | 18.7 |
Pro
Contra
Verdict - Uitgebalanceerd en geoptimaliseerd
Er is een gezegde dat zegt dat je niet op een eerste generatie product of ontwerp moet inspringen omdat er potentiële problemen of knikken zijn die moeten worden weggewerkt. De originele XPS 17 9700had bijvoorbeeld problemen met het leeglopen van de batterij, problemen met de framerate stabiliteit en zwakke CPU Turbo Boost prestaties. Na drie volle jaren van constante optimalisaties, heeft de nieuwste XPS 17 9730 al deze tekortkomingen direct aangepakt om een veel gemakkelijkere aanbeveling te zijn. Stroomverbruik is niet langer een probleem, framerates zijn stabiel, en Turbo Boost is langduriger en consistenter.
De XPS 17 9730 balanceert hoge prestaties met een beperkt stroombudget van 130 W veel beter dan op de XPS 15 9530. Wanneer uitgerust met exact dezelfde Core i7 CPU en GeForce RTX 4070 GPU, zou onze XPS 17 zijn kleinere broertje met respectievelijk 10 tot 15 procent en 50 tot 60 procent overtreffen. Vooral de GPU-boost is enorm, simpelweg vanwege het hogere TGP-doel van de XPS 17. Als je twijfelt tussen de XPS 15 en XPS 17 en de grafische prestaties zijn van het grootste belang, dan is de XPS 17 de duidelijke winnaar.
De XPS 17 9730 heeft de prestaties, draagbaarheid, het beeldscherm en het gamingpotentieel om de meeste thuis- en kantoorgebruikers tevreden te stellen. Niettemin worden bepaalde aspecten van het drie jaar oude ontwerp achterhaald.
De nadelen van het model kunnen niet worden genegeerd. Voor een $3000+ laptop zijn de magere 1 MP webcam zonder privacy shutter en geen Wi-Fi 6E ondersteuning beschamend voor deze prijsklasse. Het 60 Hz IPS scherm wordt ook afgezaagd nu OLED en hogere verversingsfrequenties gemeengoed zijn geworden. De 130 W AC-adapter voelt meer als een stenen muur die de XPS 17-serie verhindert om zowel snellere oplaadsnelheden als hogere TGP-doelstellingen te bereiken. Er is ongetwijfeld veel dat verbeterd kan worden, maar de prestaties zijn in ieder geval op een comfortabel niveau gezien het dunne ontwerp.
Prijs en beschikbaarheid
De XPS 17 9730 is nog niet overal verkrijgbaar via wederverkopers. Voor de meest configureerbare opties en onmiddellijke verzending, raden we aan rechtstreeks bij Dell te kopen. De prijzen beginnen bij $2450 USD voor de goedkoopste SKU en lopen op tot $4300 à $5100 indien volledig geconfigureerd.
Dell XPS 17 9730 RTX 4070
- 27-05-2023 v7 (old)
Allen Ngo
Transparantie
De selectie van te beoordelen apparaten wordt gemaakt door onze redactie. Het testexemplaar werd ten behoeve van deze beoordeling door de fabrikant of detailhandelaar in bruikleen aan de auteur verstrekt. De kredietverstrekker had geen invloed op deze recensie, noch ontving de fabrikant vóór publicatie een exemplaar van deze recensie. Er bestond geen verplichting om deze recensie te publiceren. Als onafhankelijk mediabedrijf is Notebookcheck niet onderworpen aan het gezag van fabrikanten, detailhandelaren of uitgevers.
[transparency_disclaimer]Dit is hoe Notebookcheck test
Elk jaar beoordeelt Notebookcheck onafhankelijk honderden laptops en smartphones met behulp van gestandaardiseerde procedures om ervoor te zorgen dat alle resultaten vergelijkbaar zijn. We hebben onze testmethoden al zo'n 20 jaar voortdurend ontwikkeld en daarbij de industriestandaard bepaald. In onze testlaboratoria wordt gebruik gemaakt van hoogwaardige meetapparatuur door ervaren technici en redacteuren. Deze tests omvatten een validatieproces in meerdere fasen. Ons complexe beoordelingssysteem is gebaseerd op honderden goed onderbouwde metingen en benchmarks, waardoor de objectiviteit behouden blijft. Meer informatie over onze testmethoden kunt u hier vinden.
Price comparison

