Dell XPS 17 9720 RTX 3060 laptop review: 50 procent snellere processor dan voorheen
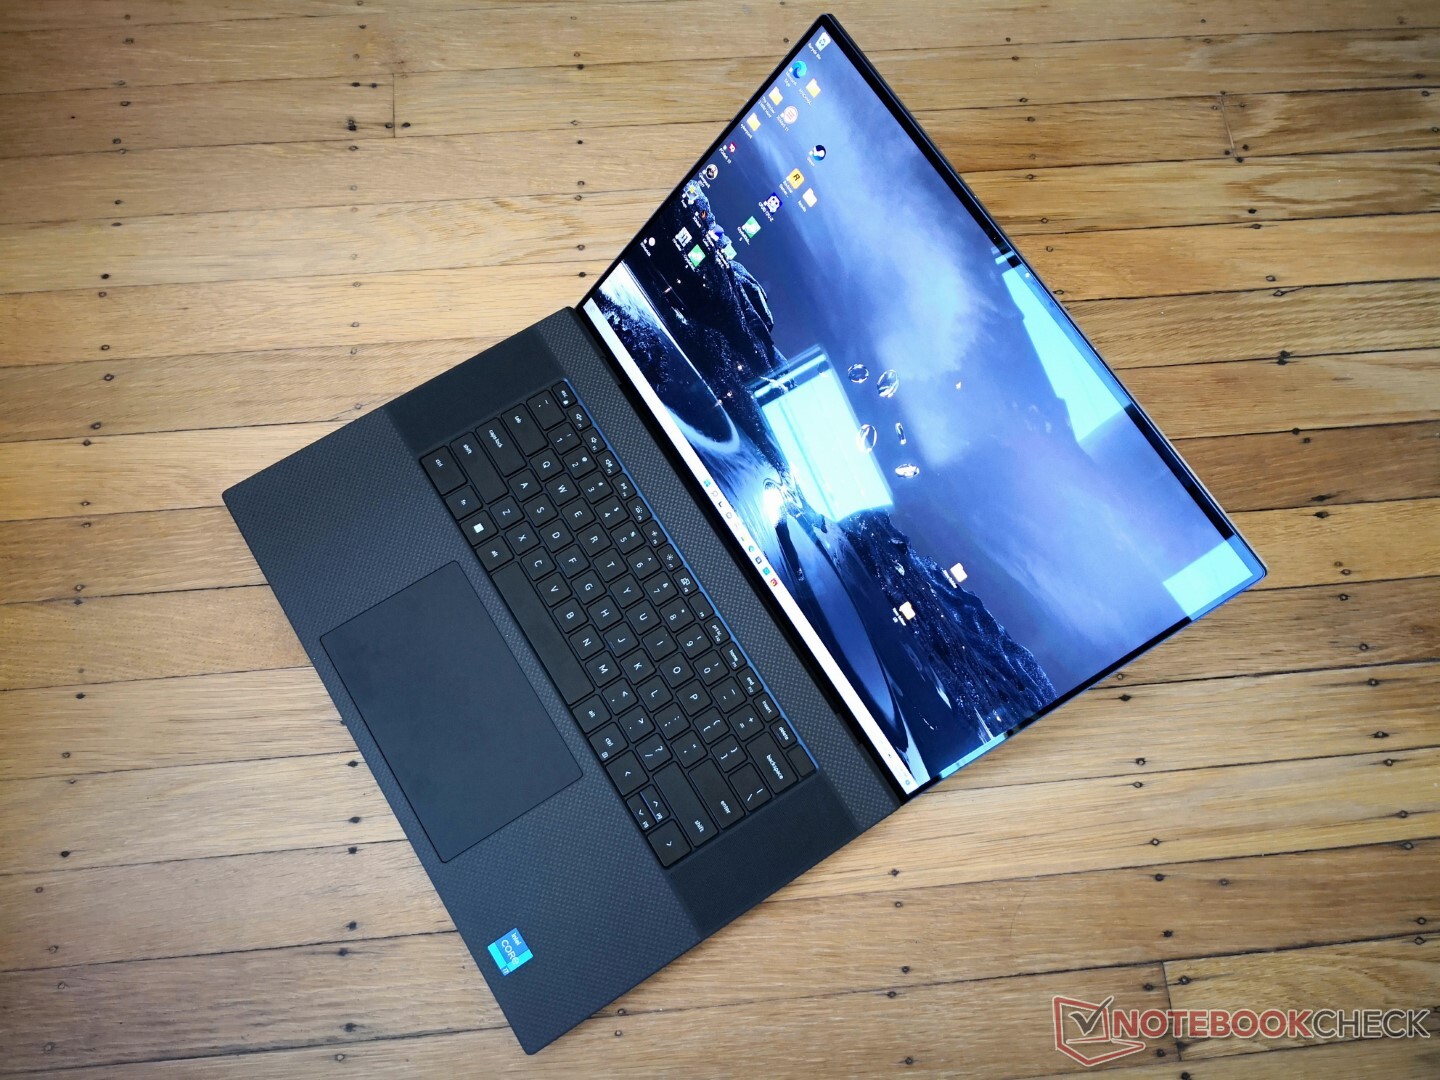
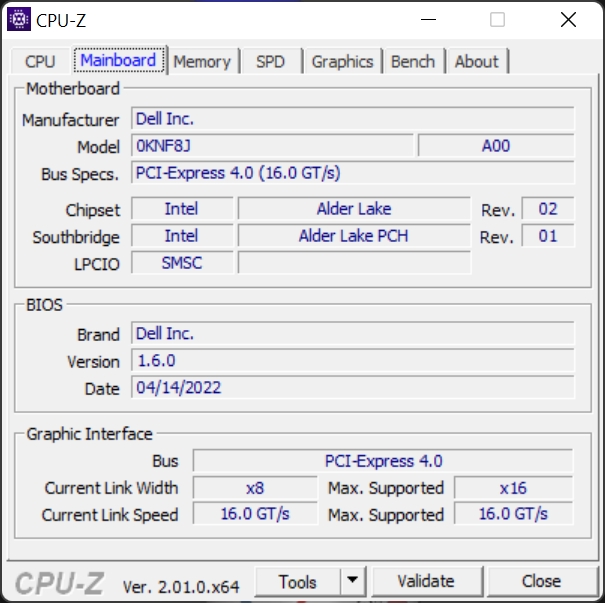
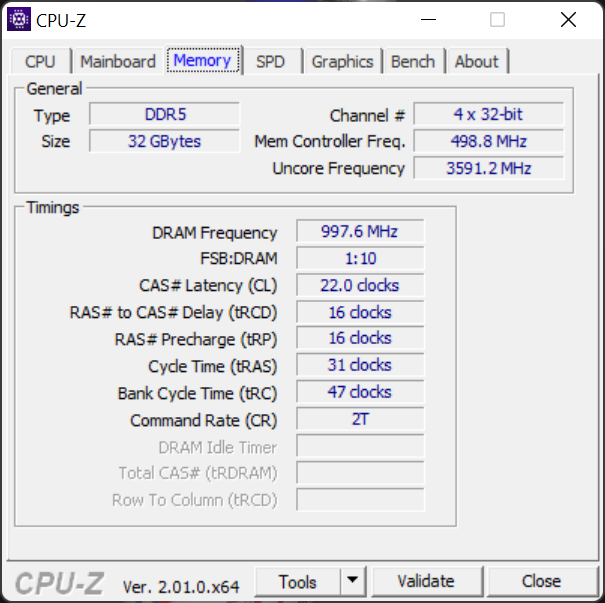
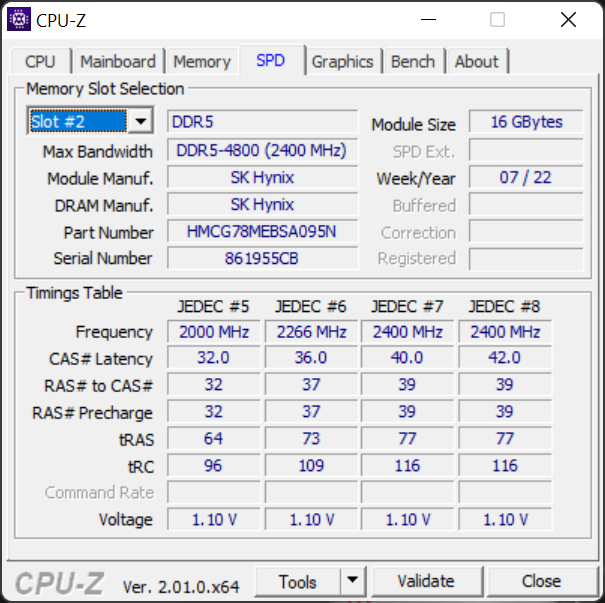
De Dell XPS 17 9720 is de derde iteratie van de 17.0-inch XPS 17-serie die begon met de 2020 XPS 17 9700. Terwijl de XPS 17 9700 en 2021 9710 versies werden geleverd met respectievelijk 10e en 11e generatie Intel CPU's, heeft de 2022 9720 12e generatie CPU's en DDR5 RAM-opties toegevoegd aan de mix. Andere hoofdkenmerken zoals het chassis en GPU opties zijn verder identiek aan de XPS 17 9700 of 9710 en dus raden we aan om onze bestaande reviews over de serie om meer te weten te komen over de fysieke kenmerken van het model
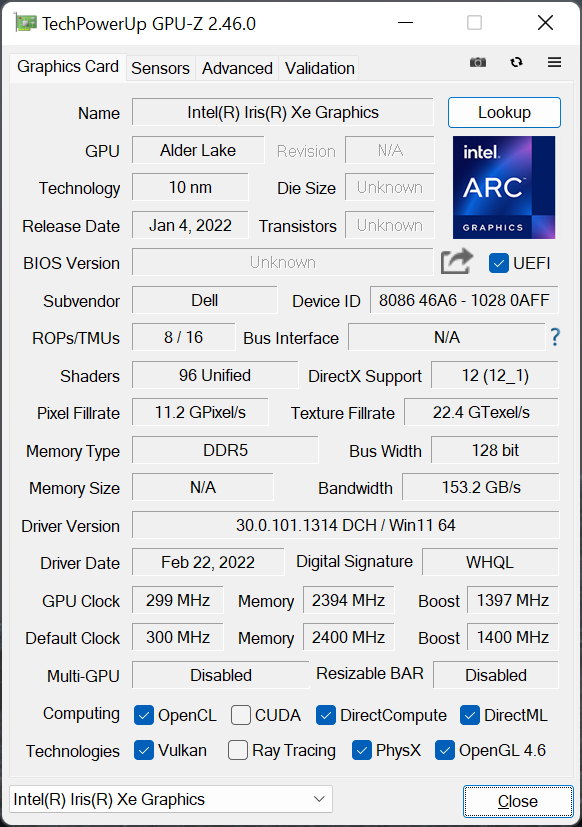
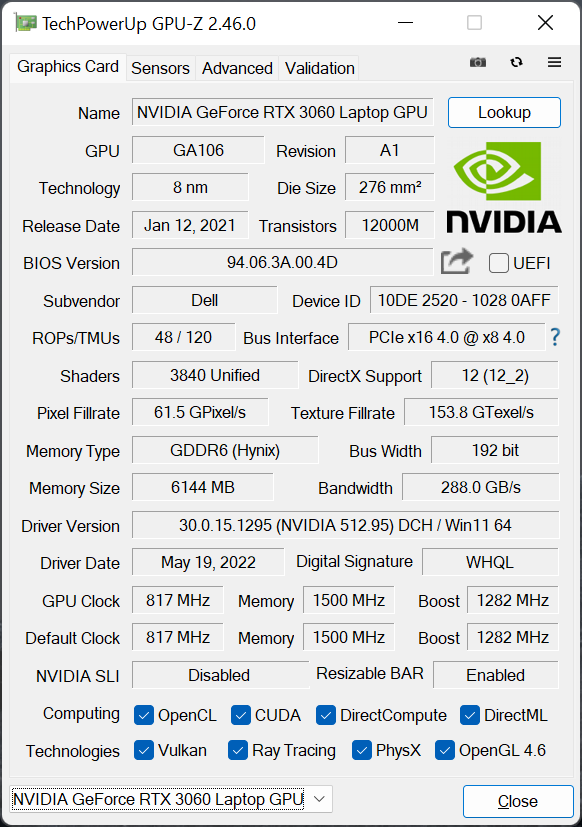
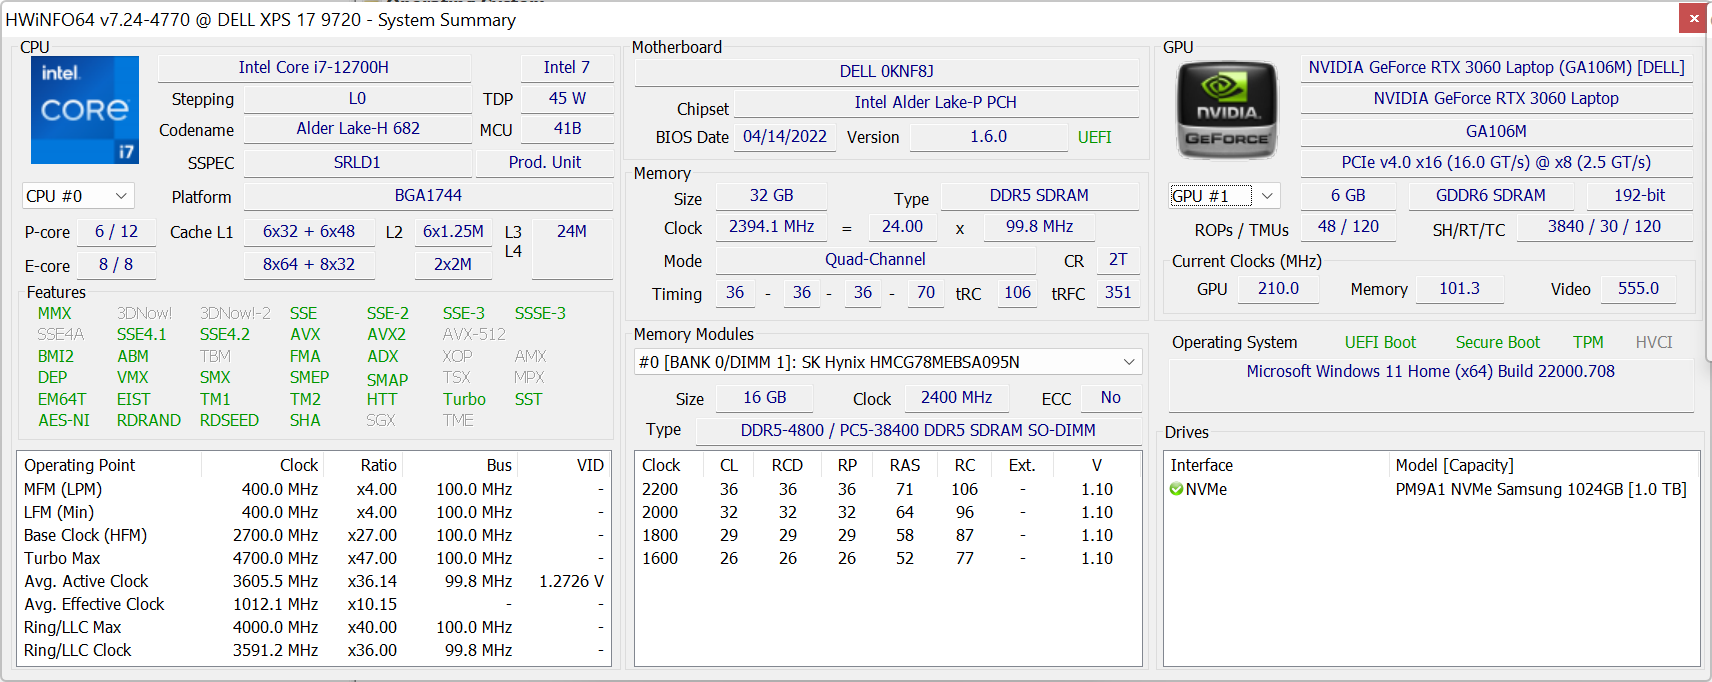
Onze recensietoestel is een upper-midrange configuratie met de Core i7-12700H CPU, UHD+ (3840 x 2400) IPS touchscreen, en GeForce RTX 3060 GPU voor ongeveer $3000 USD. Andere SKU's zijn ook beschikbaar met de i5-12500H, i9-12900HK, GeForce RTX 3050 Ti, 1200p beeldscherm, of alleen geïntegreerde graphics
Concurrenten van de XPS 17 9720 zijn 17,3-inch multimedia of prosumer laptops zoals de Gigabyte Aero 17, Razer Blade 17, HP Envy 17of Lenovo Legion 5 17
Meer Dell reviews
Potentiële concurrenten in vergelijking
Evaluatie | Datum | Model | Gewicht | Hoogte | Formaat | Resolutie | Beste prijs |
|---|---|---|---|---|---|---|---|
| 88.8 % v7 (old) | 06-2022 | Dell XPS 17 9720 RTX 3060 i7-12700H, GeForce RTX 3060 Laptop GPU | 2.5 kg | 19.5 mm | 17.00" | 3840x2400 | |
| 82.4 % v7 (old) | 08-2021 | HP Envy 17-cg i5-1135G7, GeForce MX450 | 2.7 kg | 19.3 mm | 17.30" | 1920x1080 | |
| 87.9 % v7 (old) | 07-2021 | Dell XPS 17 9710 Core i7 RTX 3060 i7-11800H, GeForce RTX 3060 Laptop GPU | 2.5 kg | 19.5 mm | 17.00" | 3840x2400 | |
| 87.9 % v7 (old) | 07-2020 | Dell XPS 17 9700 Core i7 RTX 2060 Max-Q i7-10875H, GeForce RTX 2060 Max-Q | 2.5 kg | 19.5 mm | 17.00" | 3840x2400 | |
| 85.2 % v7 (old) | 02-2022 | Lenovo Legion 5 17ACH6H-82JY0003GE R5 5600H, GeForce RTX 3060 Laptop GPU | 3.1 kg | 24.3 mm | 17.30" | 1920x1080 | |
| 76.5 % v7 (old) | 05-2022 | Asus VivoBook 17 F712JA-AU708W i7-1065G7, Iris Plus Graphics G7 (Ice Lake 64 EU) | 2.2 kg | 21.4 mm | 17.30" | 1920x1080 | |
| 90.1 % v7 (old) | 05-2022 | Razer Blade 17 (i7-12800H, RTX 3070 Ti) i7-12800H, GeForce RTX 3070 Ti Laptop GPU | 2.8 kg | 19.9 mm | 17.30" | 2560x1440 |
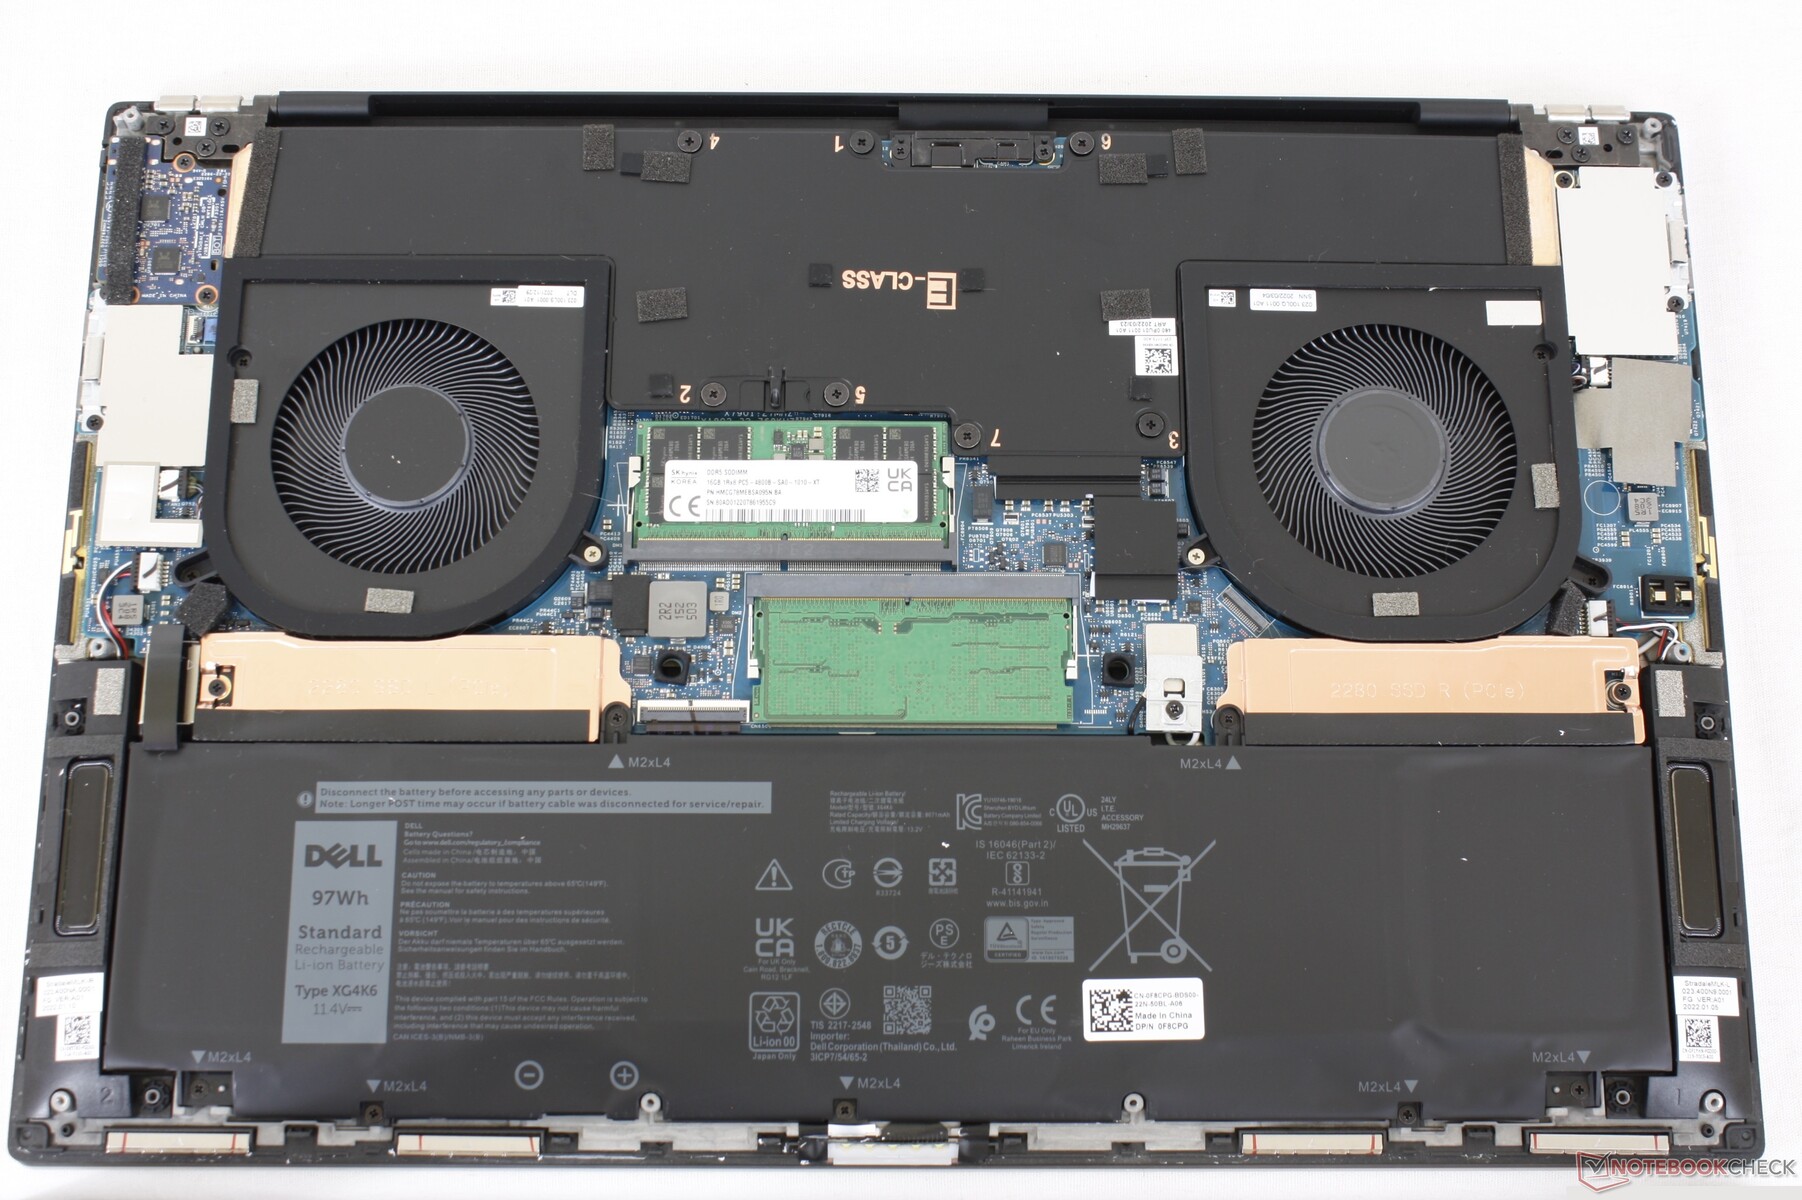
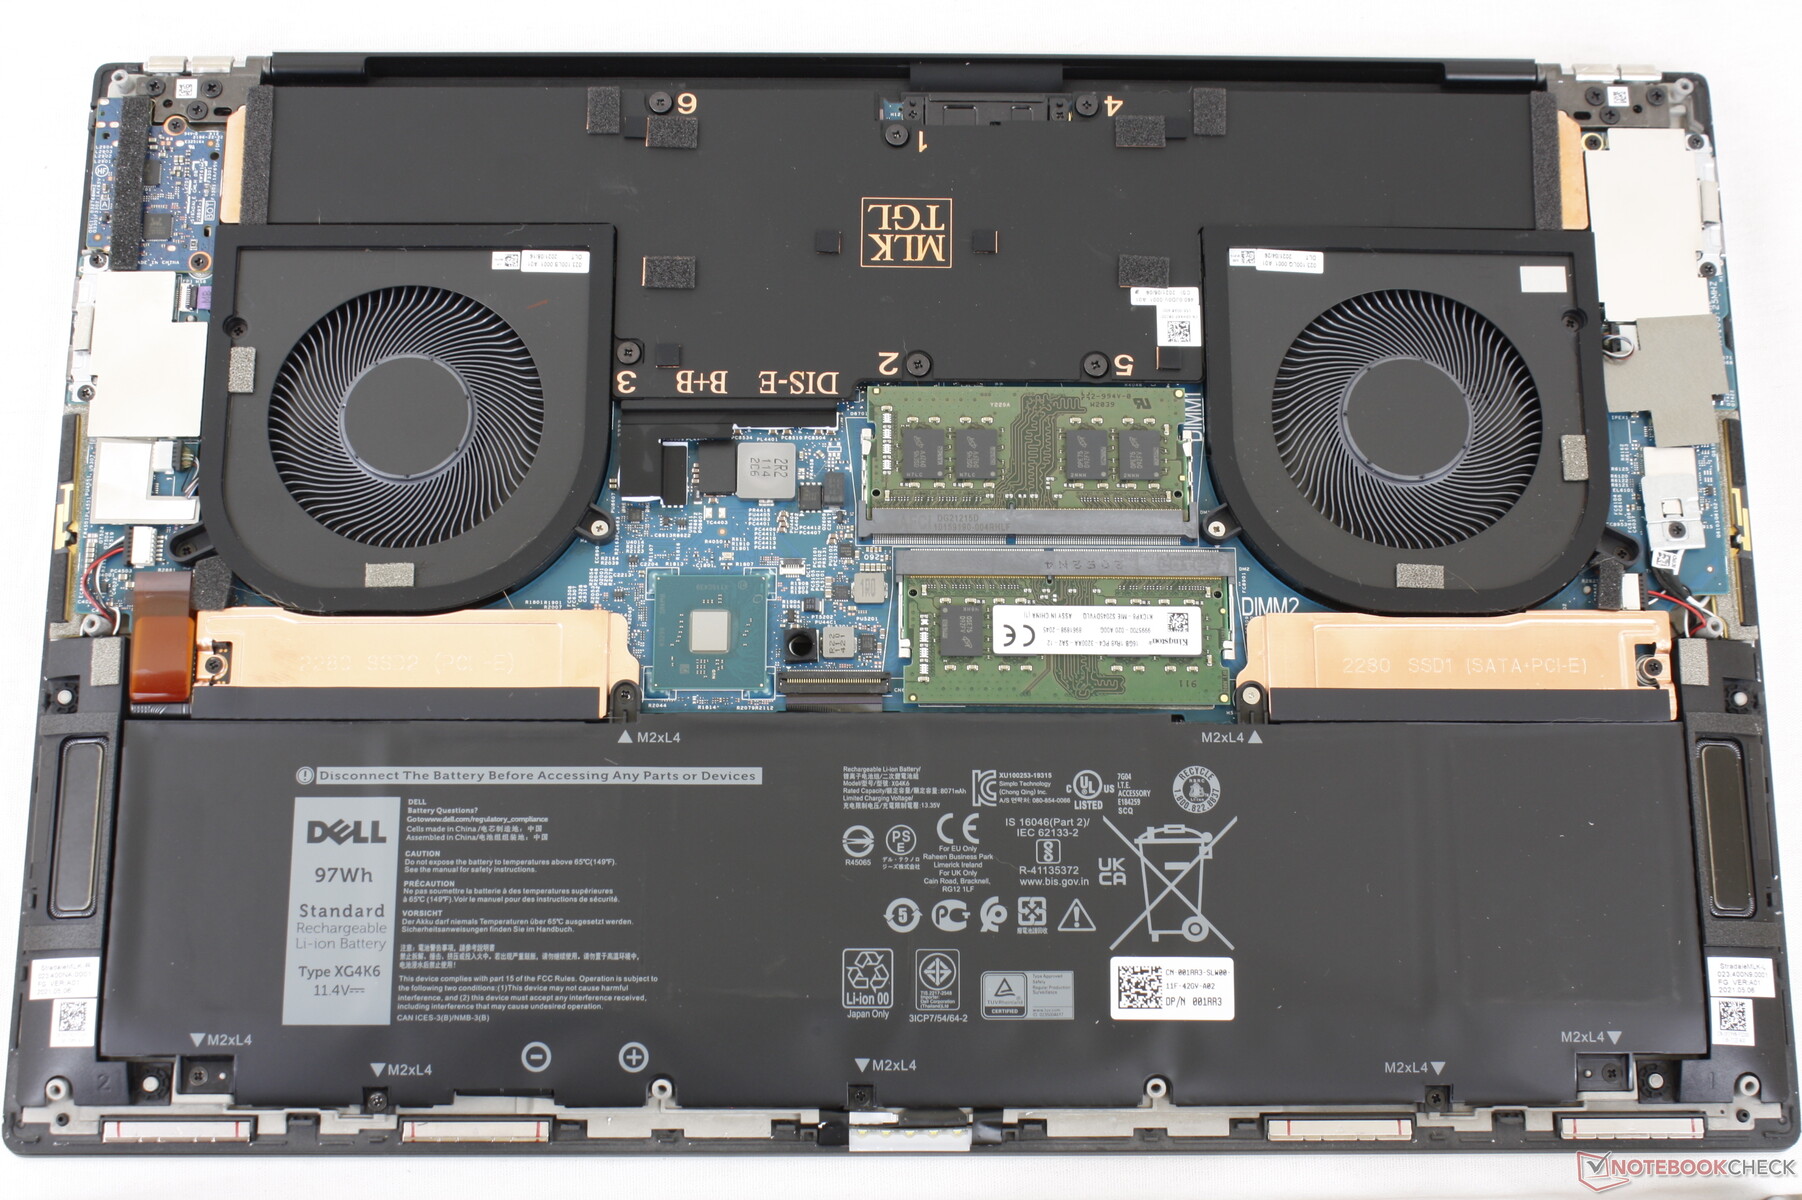
Case - Same But Still Great
Het chassis is niet veranderd ten opzichte van de XPS 17 9700 of 9710. Ondanks dat het een twee jaar oud ontwerp is, zorgt de unieke 16:10 17,0-inch vormfactor ervoor dat het model merkbaar kleiner en dunner is dan andere modellen in dezelfde groottecategorie.
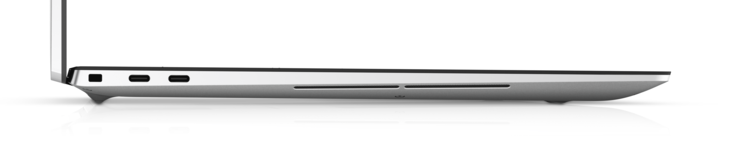
SD-kaartlezer
| SD Card Reader | |
| average JPG Copy Test (av. of 3 runs) | |
| Dell XPS 17 9720 RTX 3060 (Toshiba Exceria Pro SDXC 64 GB UHS-II) | |
| Dell XPS 17 9700 Core i7 RTX 2060 Max-Q (Toshiba Exceria Pro SDXC 64 GB UHS-II) | |
| Dell XPS 17 9710 Core i7 RTX 3060 (AV PRO microSD 128 GB V60) | |
| Razer Blade 17 (i7-12800H, RTX 3070 Ti) | |
| Lenovo Legion 5 17ACH6H-82JY0003GE (AV Pro SD microSD 128 GB V60) | |
| HP Envy 17-cg (AV Pro microSD 128 GB V60) | |
| Asus VivoBook 17 F712JA-AU708W (AV Pro SD microSD 128 GB V60) | |
| maximum AS SSD Seq Read Test (1GB) | |
| Dell XPS 17 9720 RTX 3060 (Toshiba Exceria Pro SDXC 64 GB UHS-II) | |
| Dell XPS 17 9700 Core i7 RTX 2060 Max-Q (Toshiba Exceria Pro SDXC 64 GB UHS-II) | |
| Razer Blade 17 (i7-12800H, RTX 3070 Ti) | |
| Dell XPS 17 9710 Core i7 RTX 3060 (AV PRO microSD 128 GB V60) | |
| Lenovo Legion 5 17ACH6H-82JY0003GE (AV Pro SD microSD 128 GB V60) | |
| HP Envy 17-cg (AV Pro microSD 128 GB V60) | |
| Asus VivoBook 17 F712JA-AU708W (AV Pro SD microSD 128 GB V60) | |
Communicatie - Geen Wi-Fi 6E
Dell heeft het WLAN geüpgraded van de Intel AX1650 op de XPS 17 9710 naar de Intel AX1675 (of AX211) op de XPS 17 9720. De nieuwere chip ondersteunt Wi-Fi 6E, maar deze functie is uitgeschakeld op de XPS 17 9720, net als wat we ontdekten op de XPS 15 9520. Gebruikers kunnen dus alleen verbinding maken met 2,4 GHz of 5 GHz netwerken en niet met 6 GHz netwerken.
| Networking | |
| iperf3 transmit AX12 | |
| HP Envy 17-cg | |
| Dell XPS 17 9710 Core i7 RTX 3060 | |
| Asus VivoBook 17 F712JA-AU708W | |
| Lenovo Legion 5 17ACH6H-82JY0003GE | |
| Dell XPS 17 9700 Core i7 RTX 2060 Max-Q | |
| iperf3 receive AX12 | |
| HP Envy 17-cg | |
| Dell XPS 17 9710 Core i7 RTX 3060 | |
| Dell XPS 17 9700 Core i7 RTX 2060 Max-Q | |
| Asus VivoBook 17 F712JA-AU708W | |
| Lenovo Legion 5 17ACH6H-82JY0003GE | |
| iperf3 receive AXE11000 | |
| Dell XPS 17 9720 RTX 3060 | |
| iperf3 transmit AXE11000 | |
| Dell XPS 17 9720 RTX 3060 | |
Webcam
De camera is nog steeds slechts 720p zonder privacy sluiter. De lage native resolutie gaat slecht samen met het hoge resolutie beeldscherm voor een onvermijdelijk troebel beeld. Dell zegt dat de IR en RGB sensoren nu gescheiden zijn voor betere prestaties, maar de pixeldichtheid is nog steeds erg laag. Ter vergelijking, de Razer Blade 17 wordt geleverd met een hogere resolutie 1080p webcam.
Windows Hello wordt nog steeds ondersteund.


Onderhoud
Accessoires en garantie
De XPS 17 9720 wordt geleverd met dezelfde 130 W-lichtnetadapter en USB-C-naar-HDMI- en USB-A-adapter als op de XPS 15 9520, XPS 17 9710 en XPS 17 9700. Bij aankoop in de VS geldt een beperkte fabrieksgarantie van één jaar.
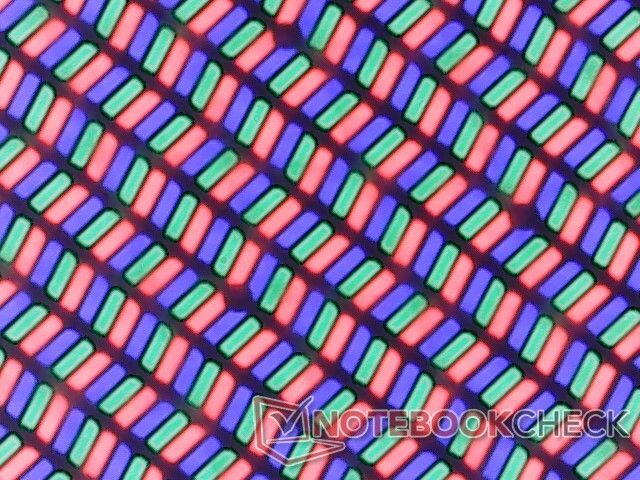
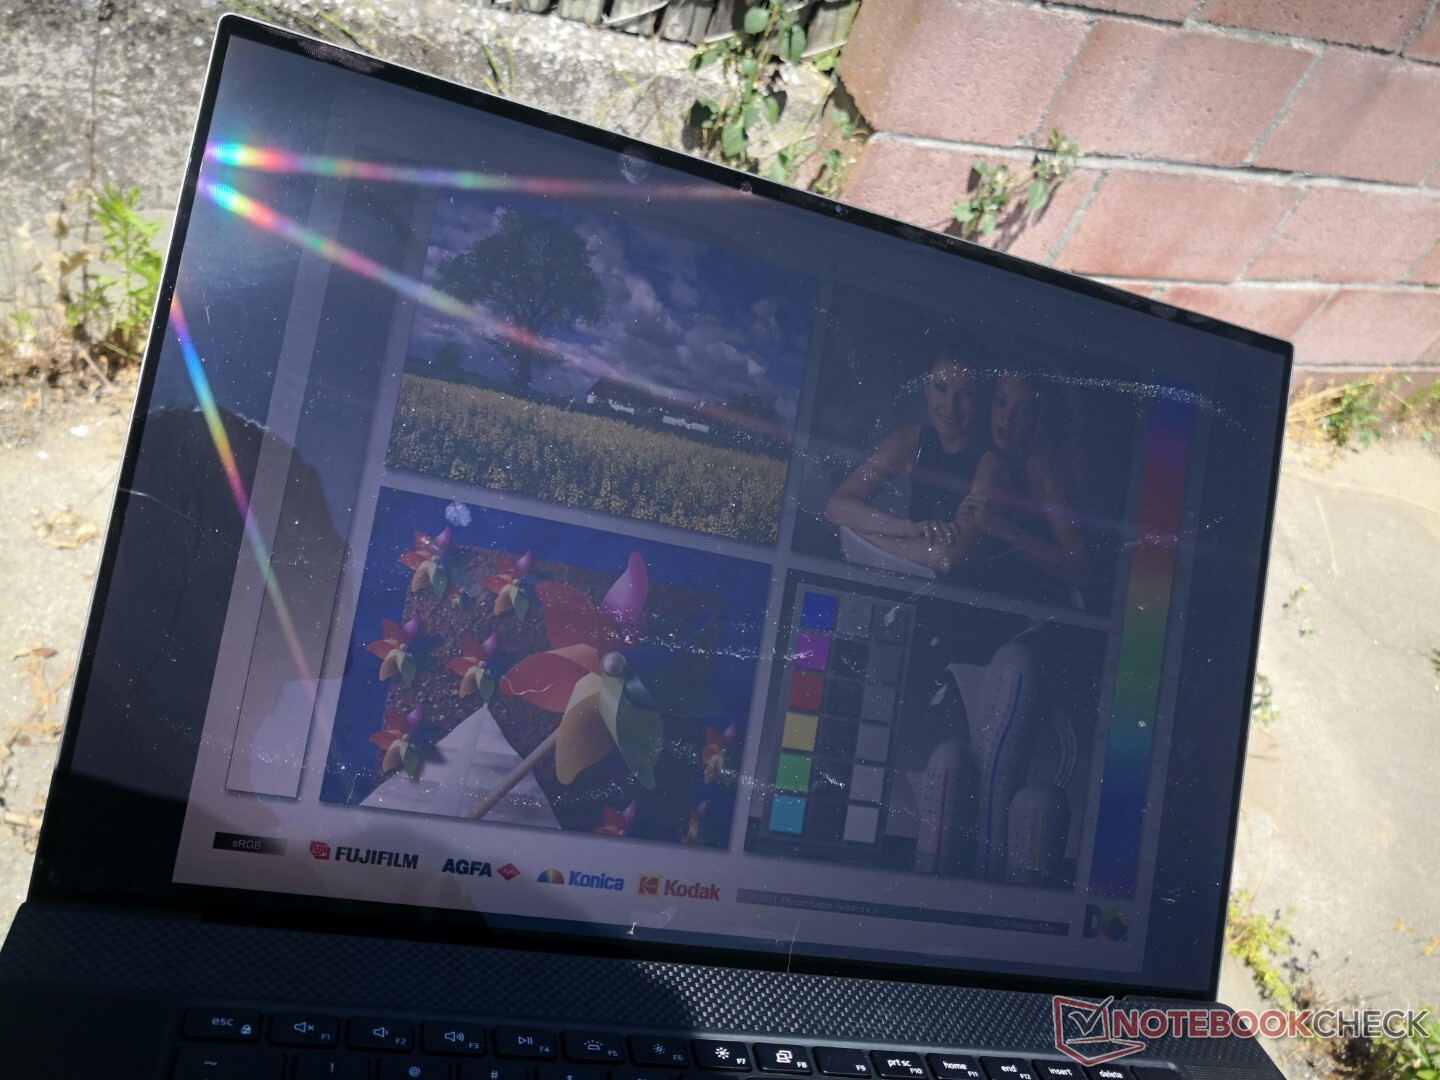
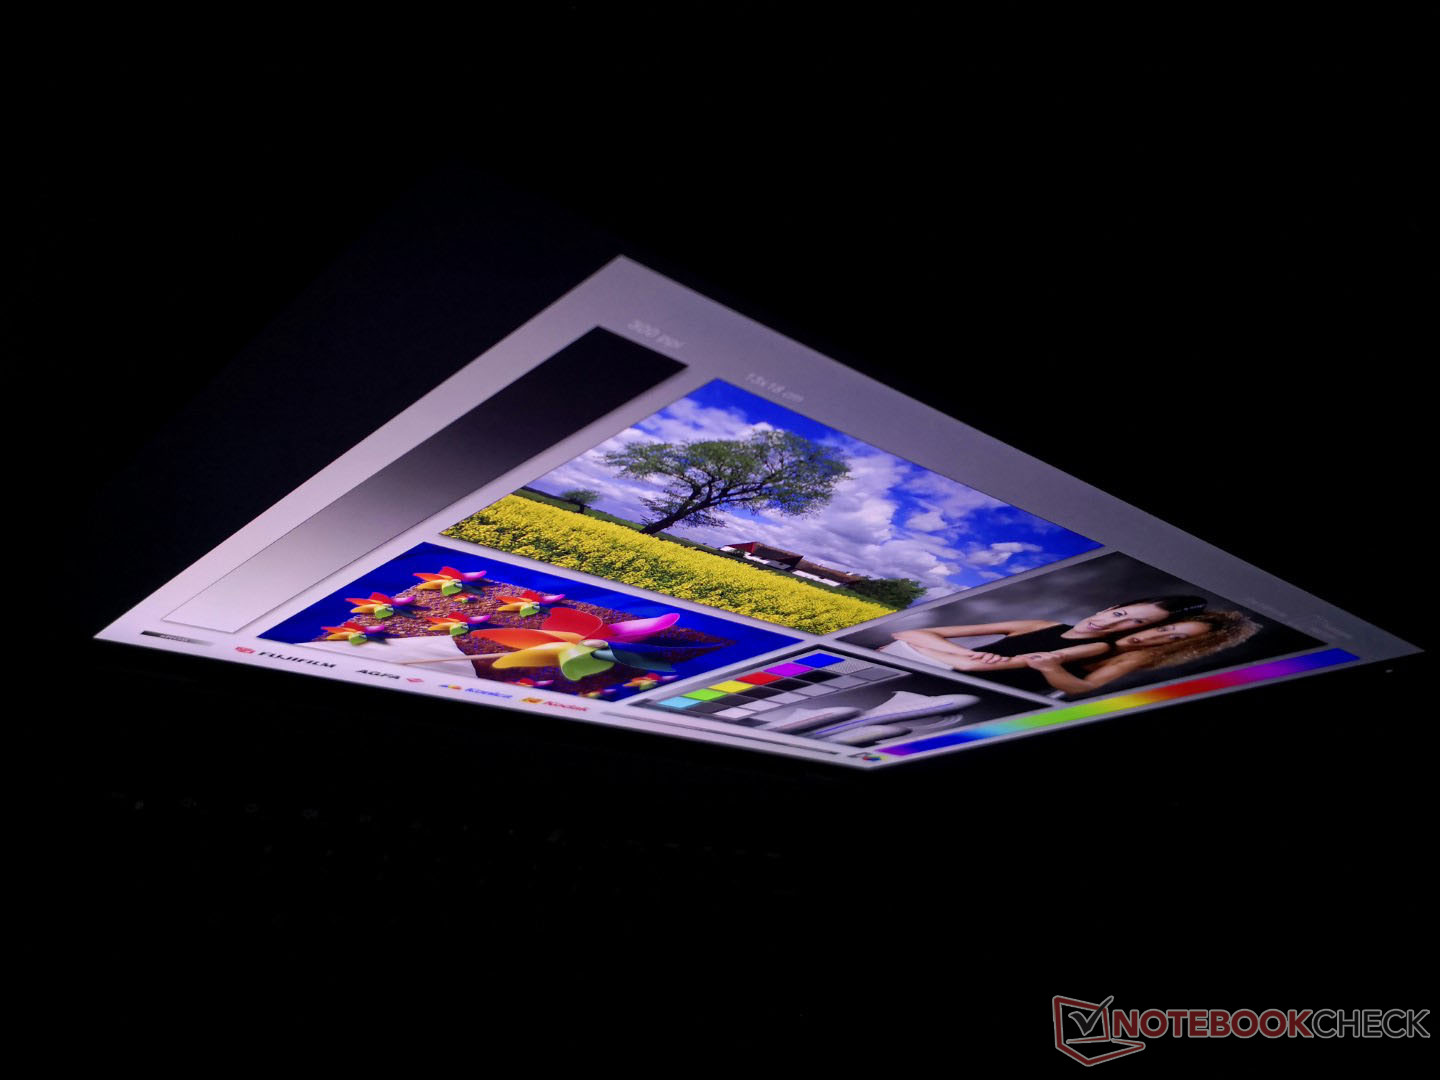
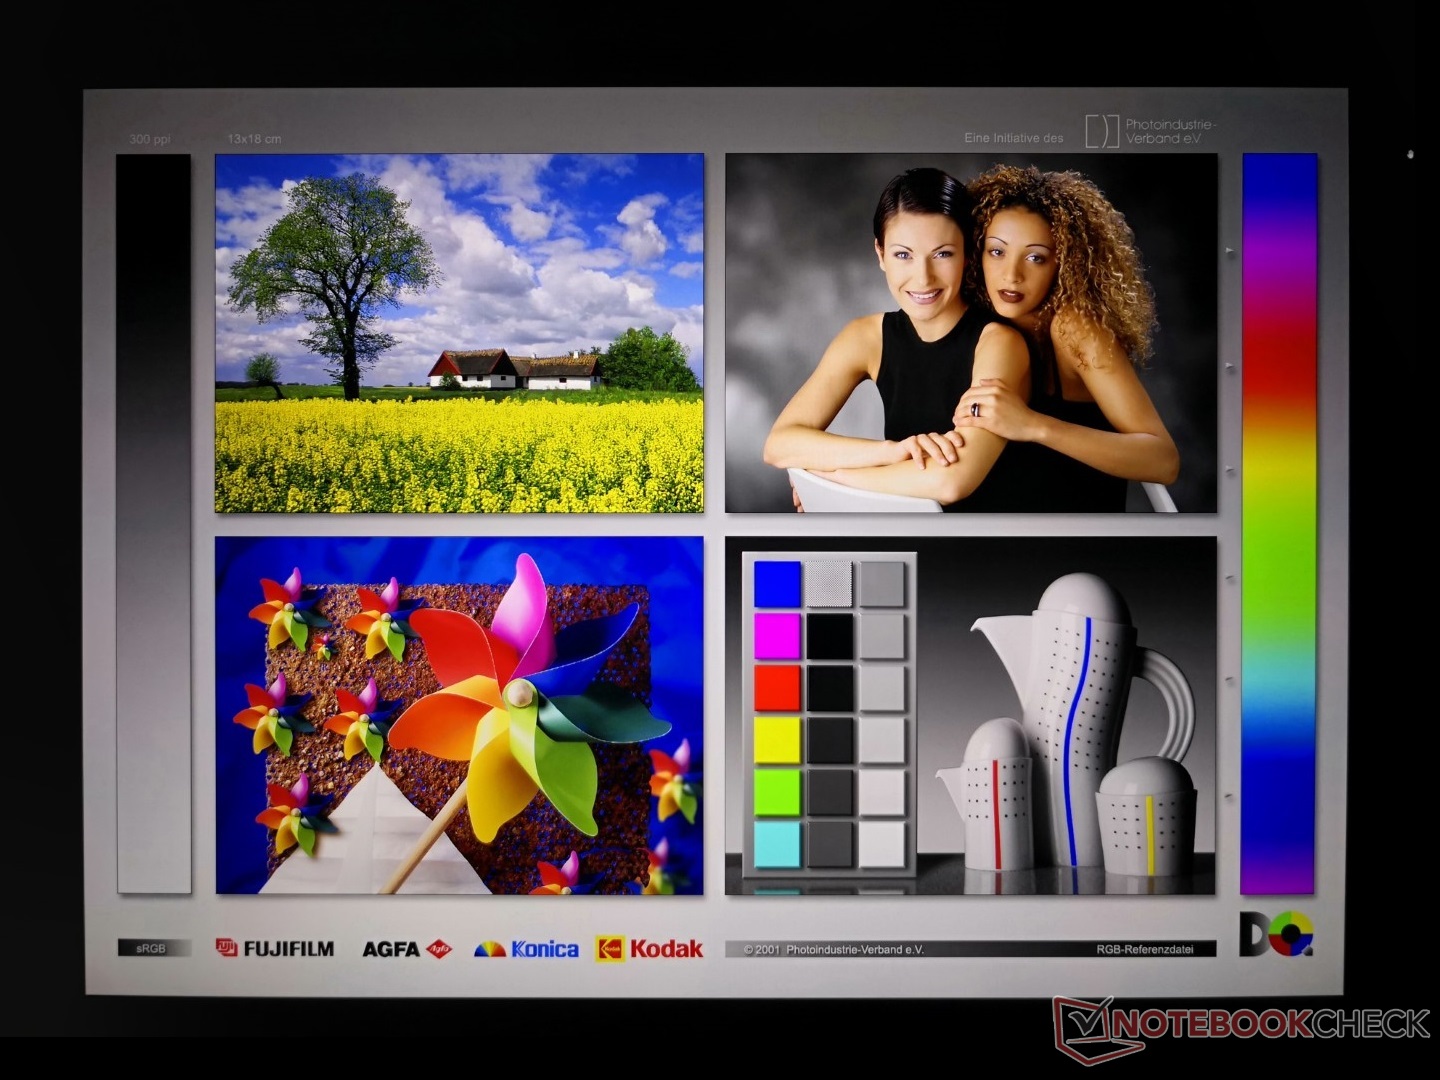
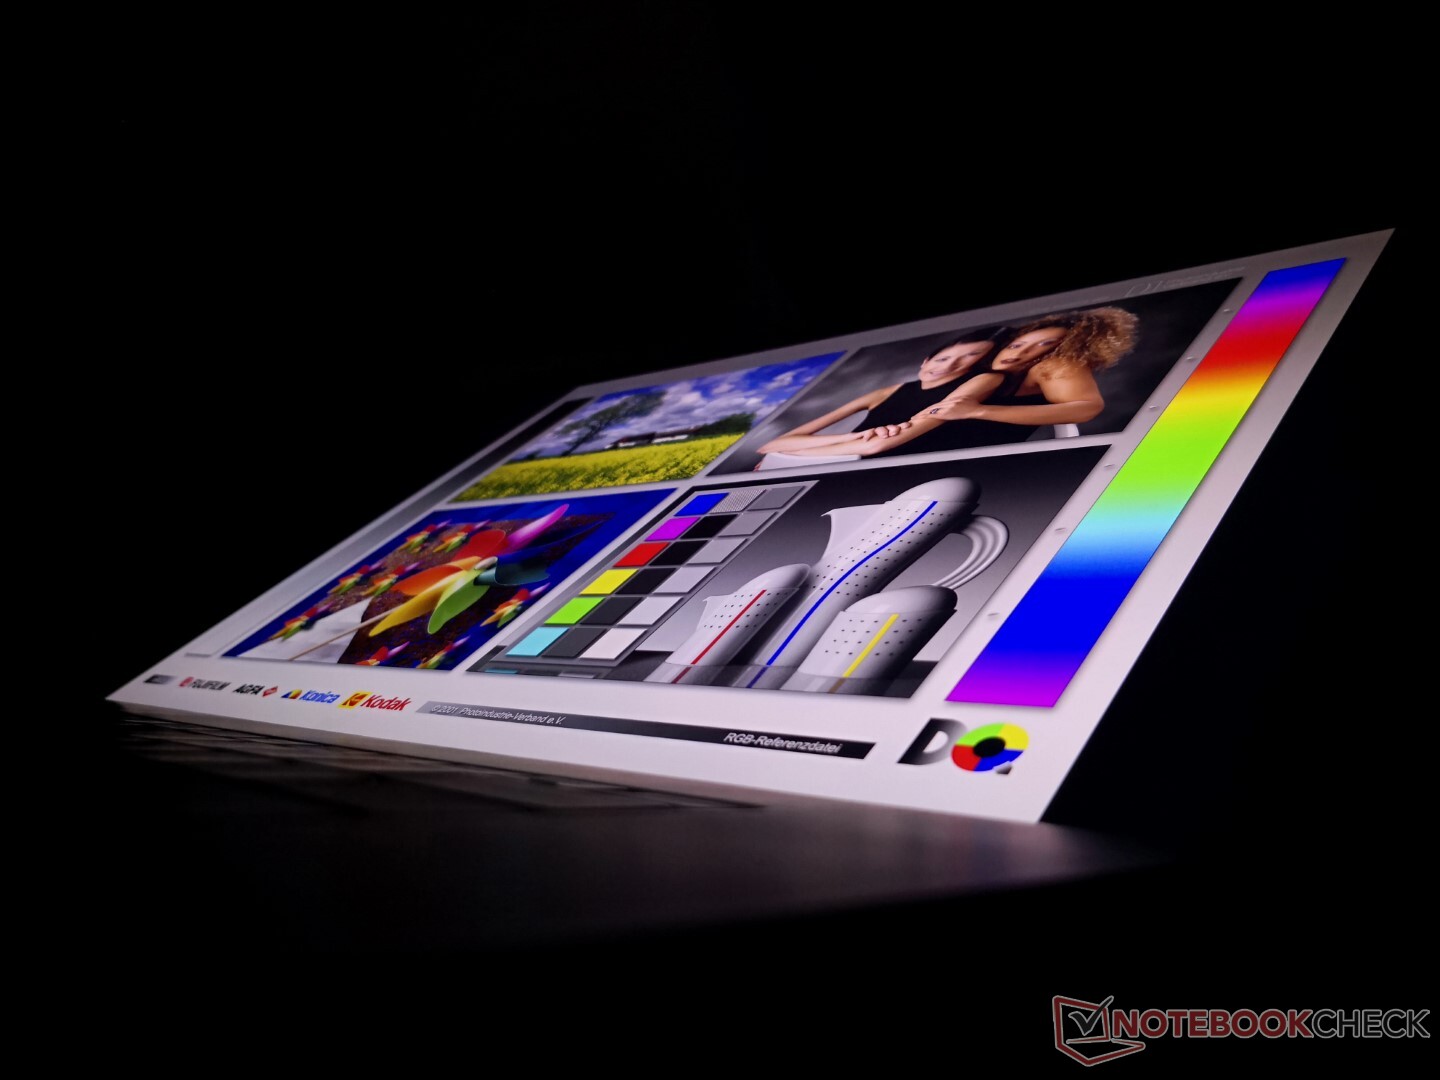
Beeldscherm - 16:10 60 Hz IPS
Er zijn twee weergave-opties om uit te kiezen (1200p en 2400p), vergeleken met drie op de XPS 15 9520. Het paneel op ons apparaat is hetzelfde Sharp LQ170R1 IPS-paneel als dat op de XPS 17 9710 of 9700, wat betekent dat de kijkervaring niet is veranderd sinds het oorspronkelijke 2020-model. Het was toen een uitstekend beeldscherm en dat is het nu nog steeds, vooral in termen van contrastverhouding ten opzichte van andere IPS-panelen, maar we zouden in de toekomst graag 90 Hz verversingsfrequentie of snellere opties zien, vergelijkbaar met wat al beschikbaar is op de nieuwste IdeaPad Slim 7i Pro of de komende Zenbook Pro 14 Duo.
| |||||||||||||||||||||||||
Helderheidsverdeling: 85 %
Helderheid in Batterij-modus: 512.7 cd/m²
Contrast: 1602:1 (Zwart: 0.32 cd/m²)
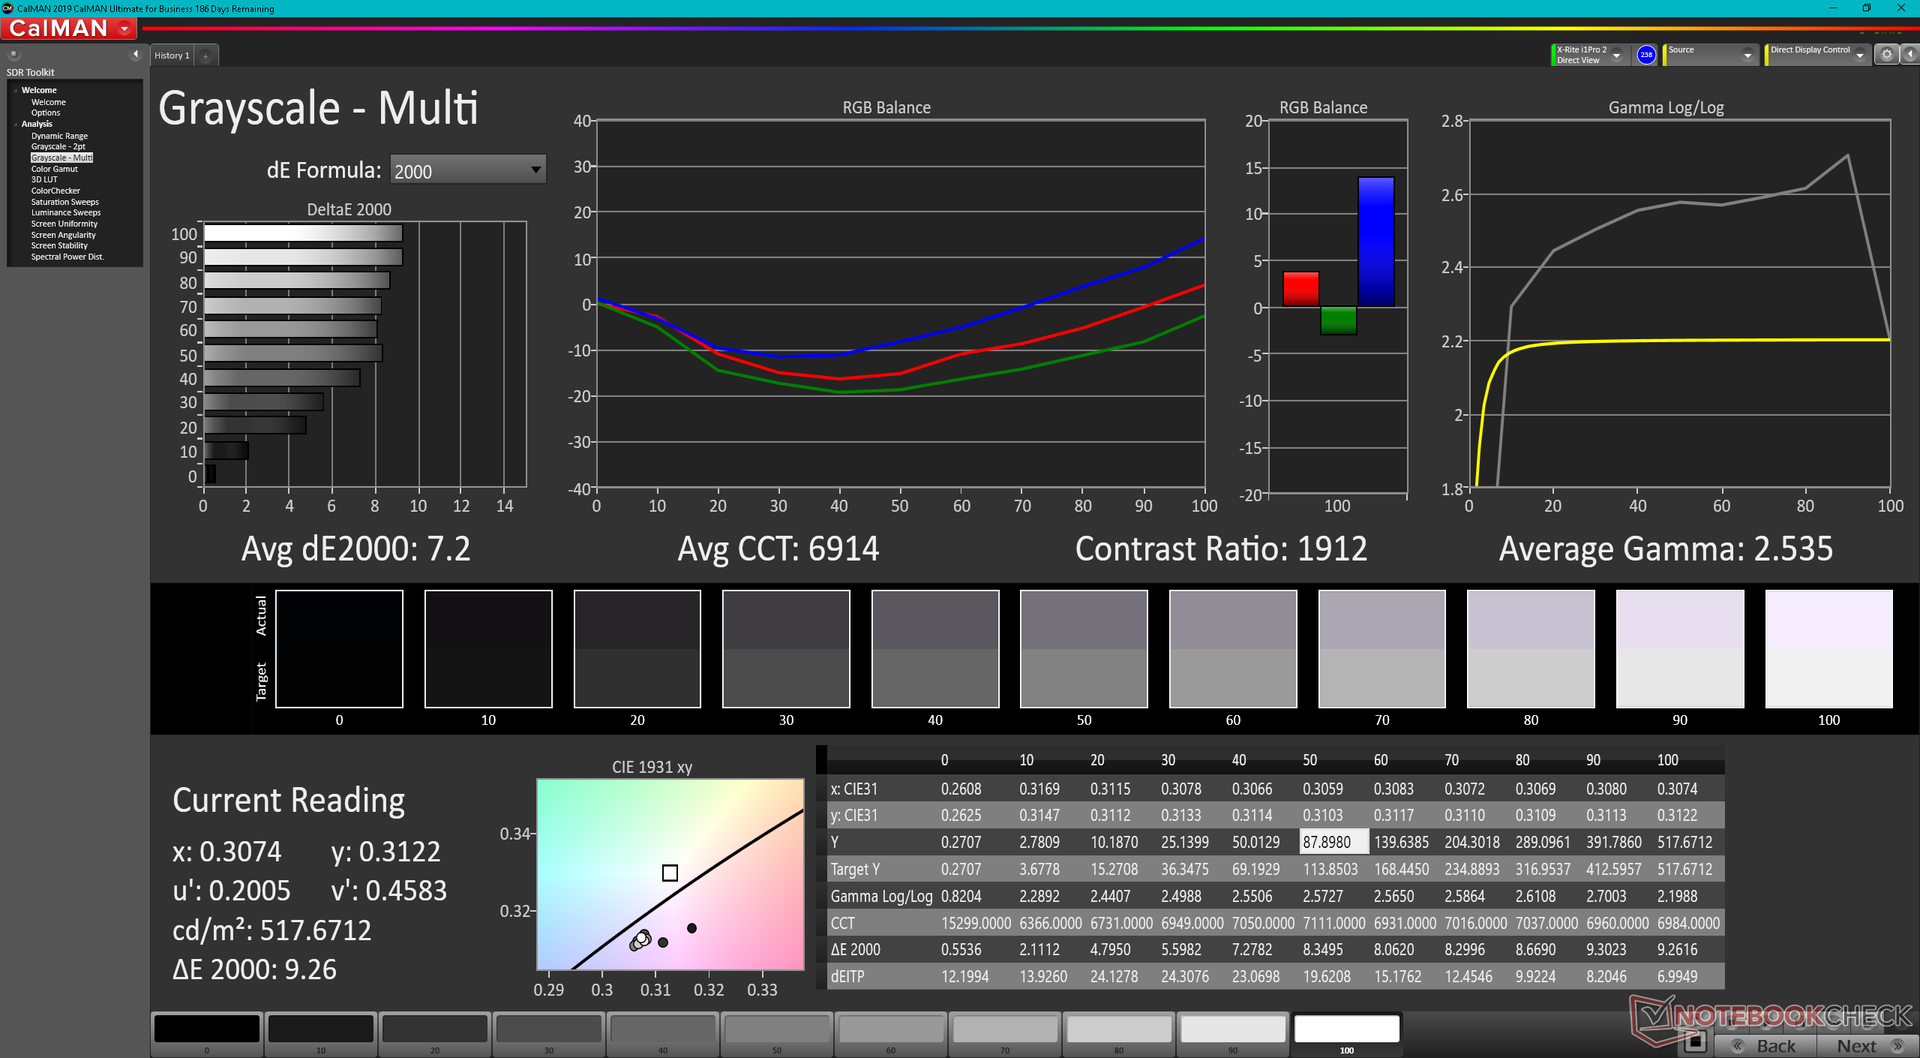
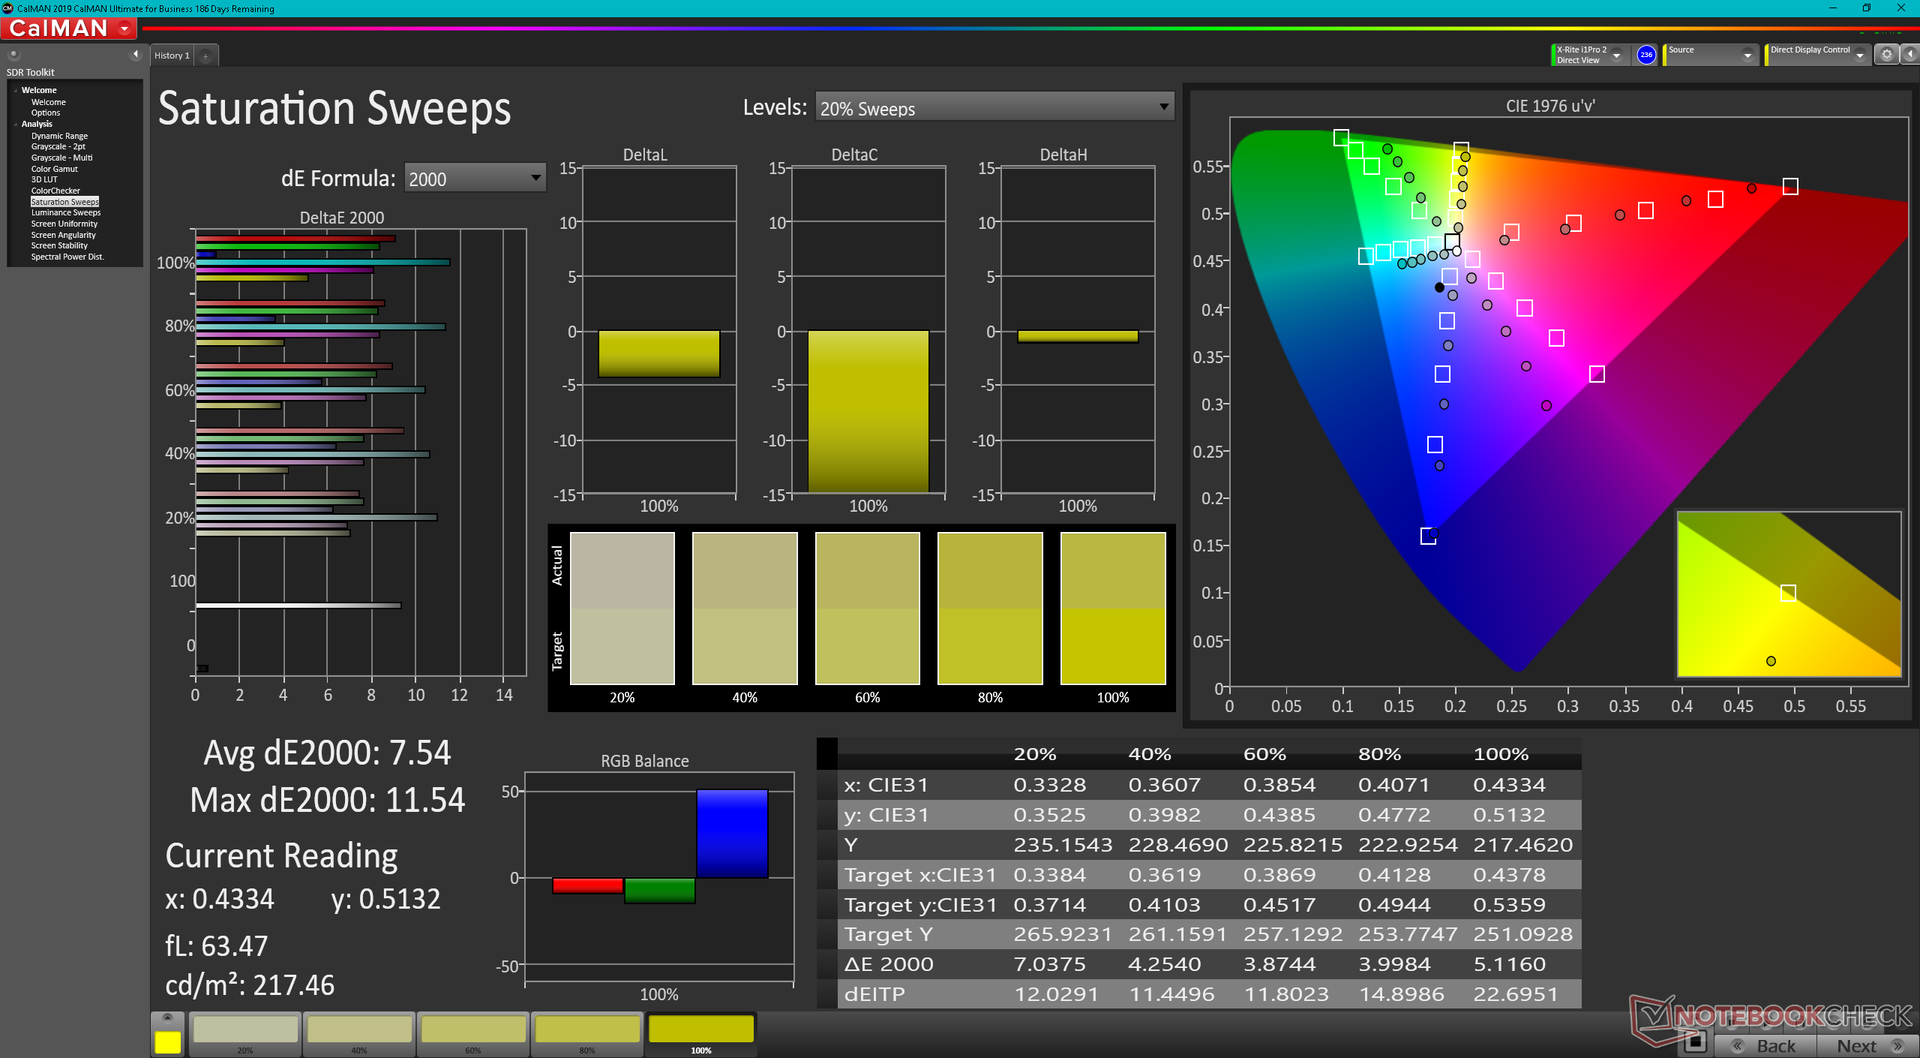
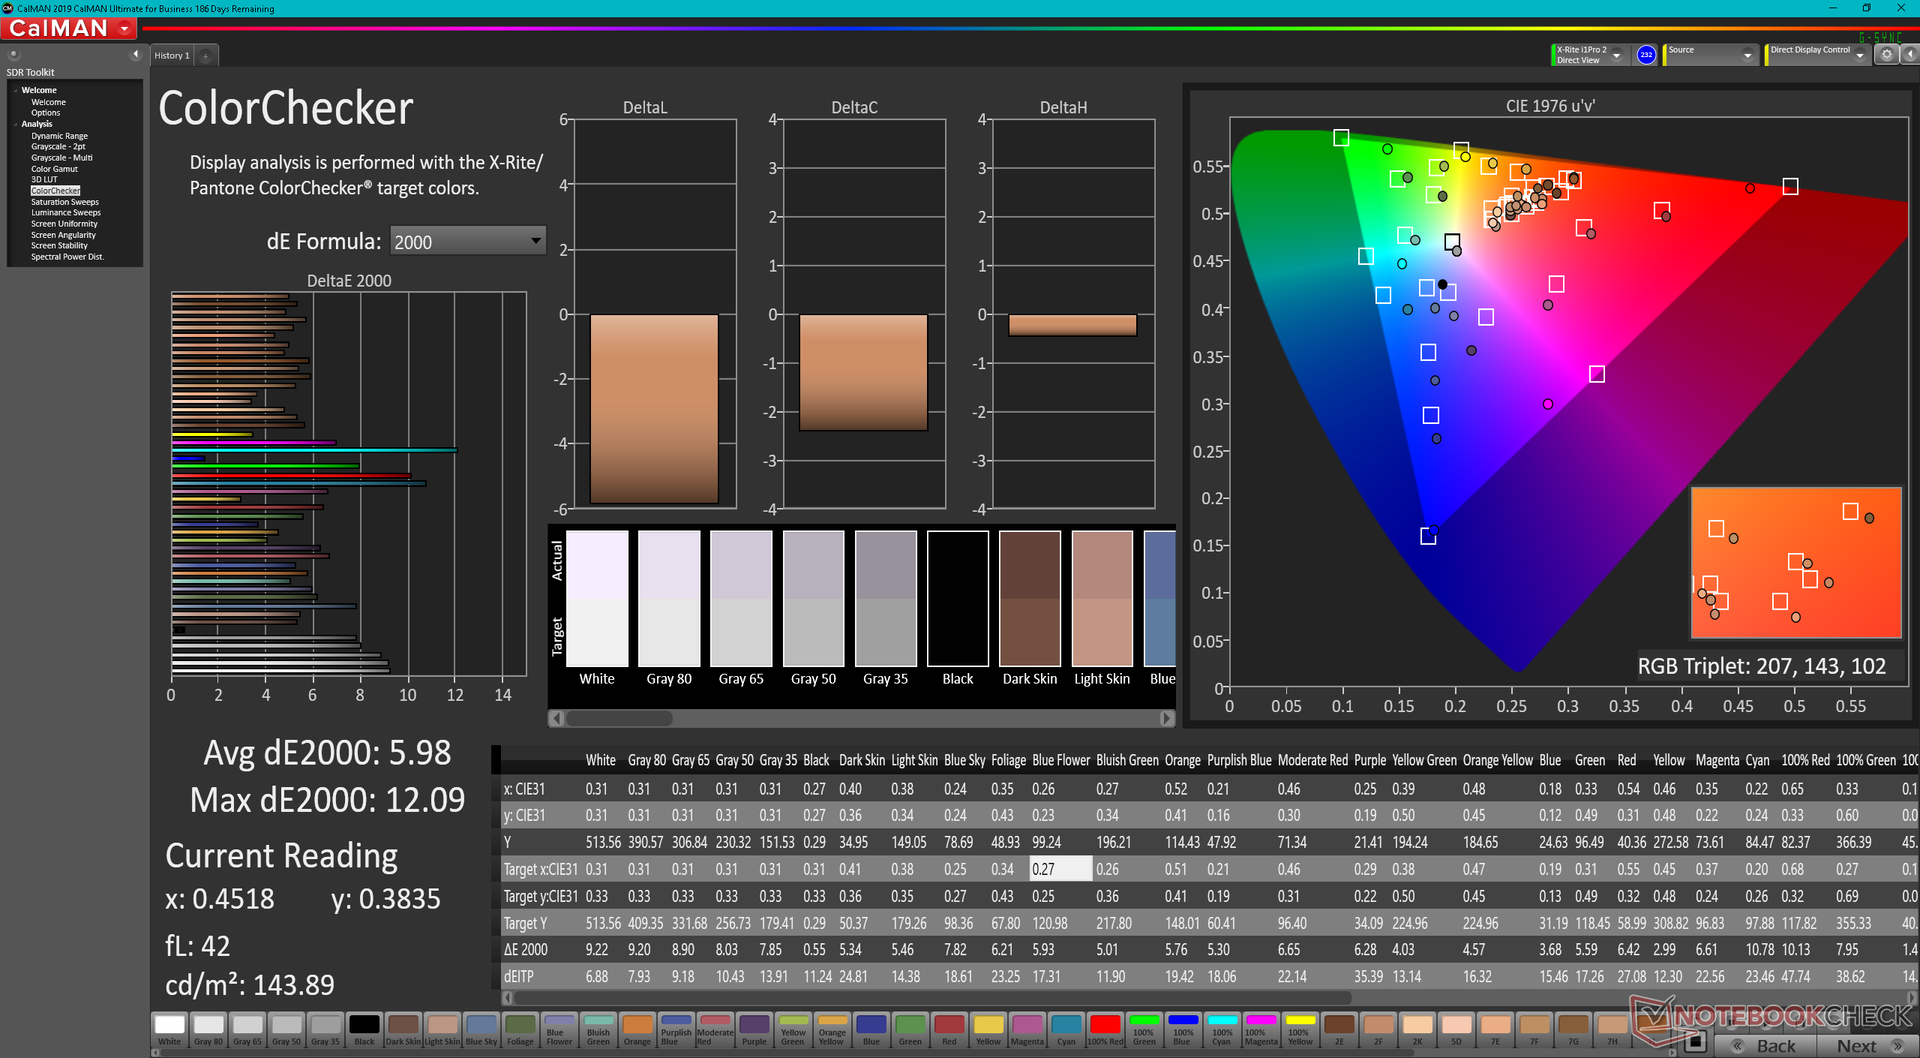
ΔE ColorChecker Calman: 5.98 | ∀{0.5-29.43 Ø4.71}
ΔE Greyscale Calman: 7.2 | ∀{0.09-98 Ø4.96}
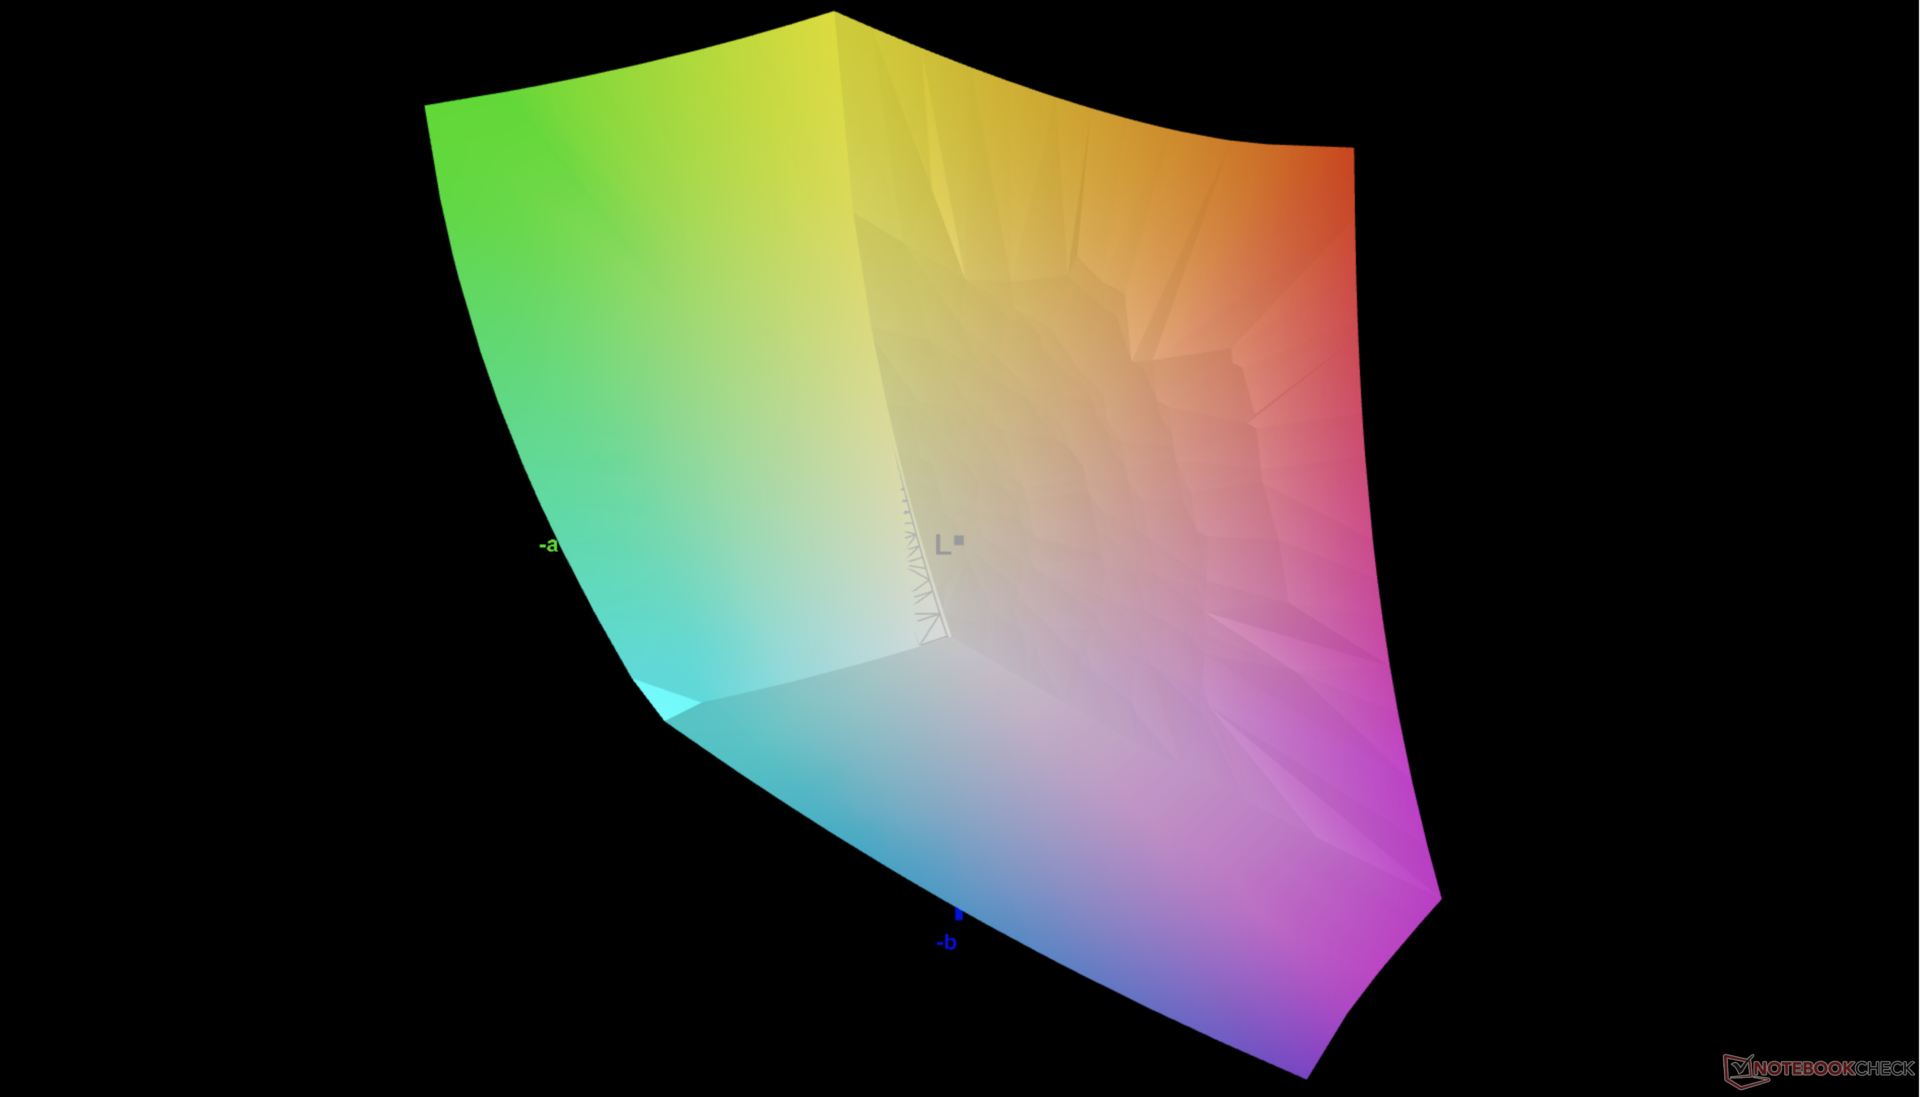
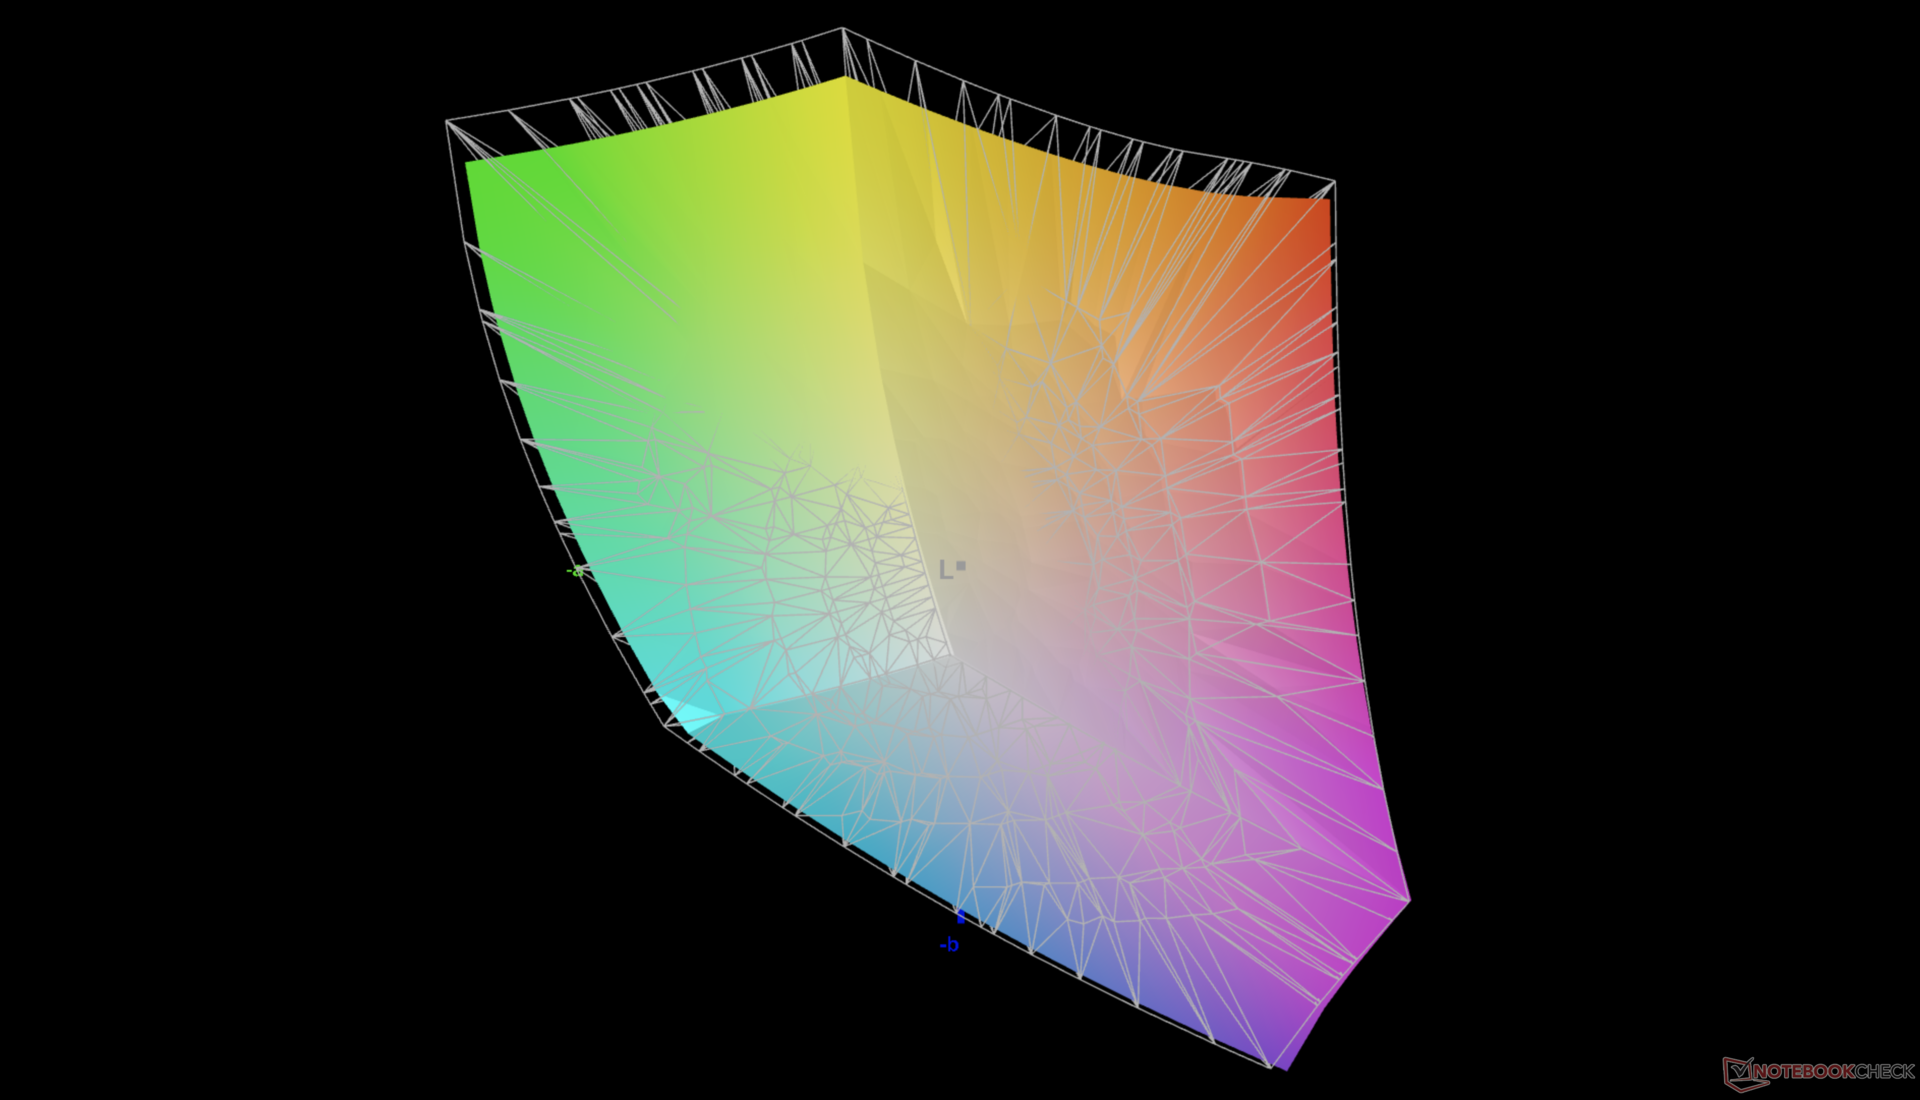
85.3% AdobeRGB 1998 (Argyll 3D)
100% sRGB (Argyll 3D)
92.9% Display P3 (Argyll 3D)
Gamma: 2.54
CCT: 6914 K
| Dell XPS 17 9720 RTX 3060 Sharp LQ170R1, IPS, 3840x2400, 17" | Dell XPS 17 9700 Core i7 RTX 2060 Max-Q Sharp LQ170R1, IPS, 3840x2400, 17" | Dell XPS 17 9700 i5-10300H SHP14D7, IPS, 1920x1200, 17.3" | HP Envy 17-cg AU Optronics AUO439D, IPS, 1920x1080, 17.3" | Lenovo Legion 5 17ACH6H-82JY0003GE LEN173FHD, IPS, 1920x1080, 17.3" | Asus VivoBook 17 F712JA-AU708W BOE NV173FHM-N49, IPS, 1920x1080, 17.3" | Razer Blade 17 (i7-12800H, RTX 3070 Ti) BOE CQ NE173QHM-NZ1 (BOE09F9), IPS, 2560x1440, 17.3" | |
|---|---|---|---|---|---|---|---|
| Display | 5% | -9% | -17% | -18% | -50% | 2% | |
| Display P3 Coverage (%) | 92.9 | 90.5 -3% | 77.4 -17% | 68 -27% | 64.8 -30% | 39.53 -57% | 97.9 5% |
| sRGB Coverage (%) | 100 | 100 0% | 100 0% | 95 -5% | 97.2 -3% | 58.85 -41% | 99.9 0% |
| AdobeRGB 1998 Coverage (%) | 85.3 | 99.8 17% | 76.6 -10% | 69 -19% | 66.7 -22% | 40.84 -52% | 85.5 0% |
| Response Times | 5% | -13% | 19% | 73% | 57% | 69% | |
| Response Time Grey 50% / Grey 80% * (ms) | 51.2 ? | 51.2 ? -0% | 60.4 ? -18% | 40 ? 22% | 15 ? 71% | 22 ? 57% | 15.2 ? 70% |
| Response Time Black / White * (ms) | 35.2 ? | 32 ? 9% | 37.6 ? -7% | 30 ? 15% | 9 ? 74% | 15 ? 57% | 11.2 ? 68% |
| PWM Frequency (Hz) | 2500 ? | ||||||
| Screen | 20% | 33% | 6% | 16% | -16% | -9% | |
| Brightness middle (cd/m²) | 512.7 | 539.4 5% | 636 24% | 347 -32% | 323 -37% | 269 -48% | 341 -33% |
| Brightness (cd/m²) | 463 | 494 7% | 580 25% | 329 -29% | 305 -34% | 263 -43% | 308 -33% |
| Brightness Distribution (%) | 85 | 84 -1% | 86 1% | 89 5% | 89 5% | 88 4% | 82 -4% |
| Black Level * (cd/m²) | 0.32 | 0.32 -0% | 0.34 -6% | 0.27 16% | 0.25 22% | 0.3 6% | 0.45 -41% |
| Contrast (:1) | 1602 | 1686 5% | 1871 17% | 1285 -20% | 1292 -19% | 897 -44% | 758 -53% |
| Colorchecker dE 2000 * | 5.98 | 4.12 31% | 2.4 60% | 3.75 37% | 1.87 69% | 5.8 3% | 4.16 30% |
| Colorchecker dE 2000 max. * | 12.09 | 7.65 37% | 3.5 71% | 7.53 38% | 4.84 60% | 18.46 -53% | 8.14 33% |
| Greyscale dE 2000 * | 7.2 | 1.5 79% | 2 72% | 4.88 32% | 2.57 64% | 3.64 49% | 5.09 29% |
| Gamma | 2.54 87% | 2.15 102% | 2.08 106% | 2.53 87% | 2.42 91% | 2.35 94% | 2.48 89% |
| CCT | 6914 94% | 6438 101% | 6704 97% | 6624 98% | 7012 93% | 6995 93% | 6884 94% |
| Colorchecker dE 2000 calibrated * | 3.91 | 1.5 | 0.92 | 3 | |||
| Color Space (Percent of AdobeRGB 1998) (%) | 90.4 | 67.5 | |||||
| Color Space (Percent of sRGB) (%) | 100 | 100 | |||||
| Totaal Gemiddelde (Programma / Instellingen) | 10% /
14% | 4% /
16% | 3% /
3% | 24% /
17% | -3% /
-12% | 21% /
5% |
* ... kleiner is beter
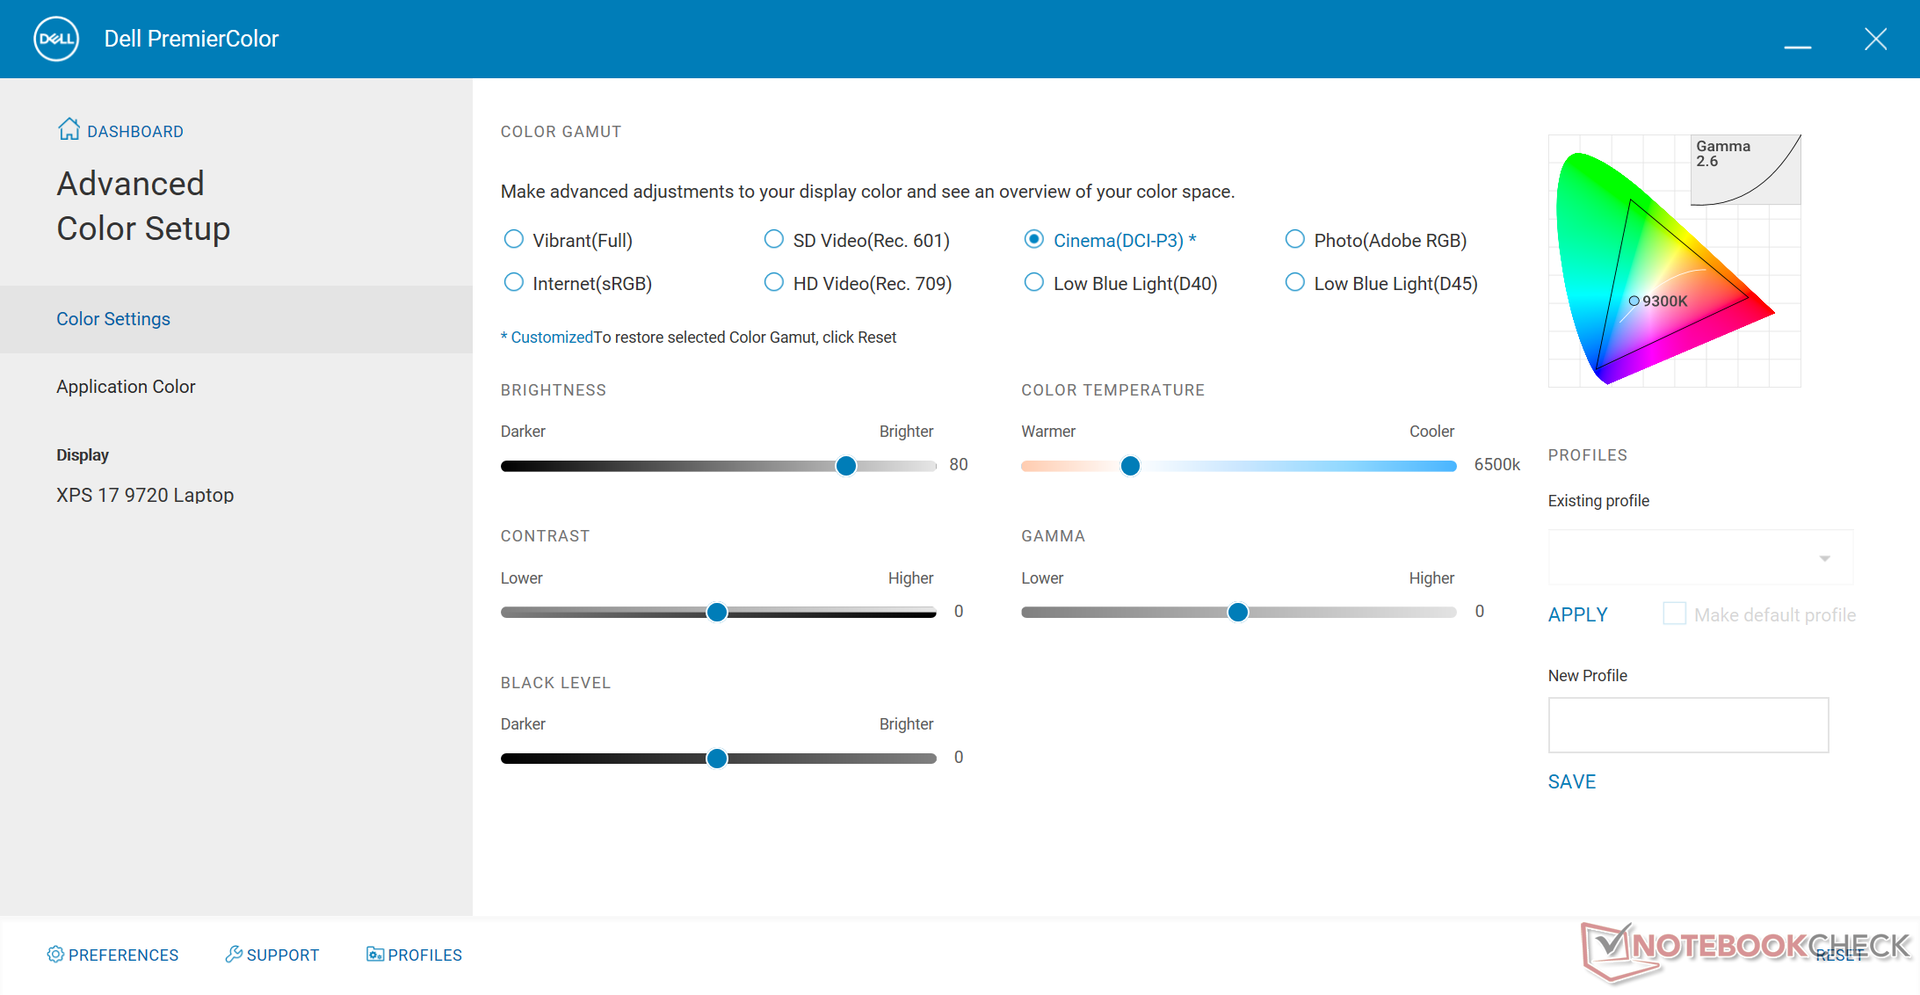
De kleurtemperatuur is warmer dan verwacht wanneer deze via de Dell PremierColor software wordt ingesteld op de DCI-P3 kleurenstandaard. In tegenstelling tot veel professionele laptops zoals de Dell Precision, Gigabyte Aero, of HP ZBook series, is de XPS serie niet X-Rite gekalibreerd in de fabriek. Een kalibratie door de eindgebruiker zou noodzakelijk zijn om het brede kleurengamma van het paneel beter te benutten.
Responstijd Scherm
| ↔ Responstijd Zwart naar Wit | ||
|---|---|---|
| 35.2 ms ... stijging ↗ en daling ↘ gecombineerd | ↗ 18.8 ms stijging | 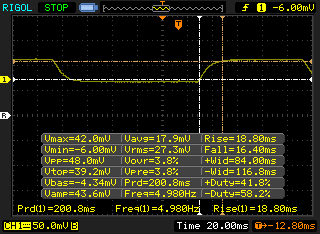 |
| ↘ 16.4 ms daling | ||
| Het scherm vertoonde trage responstijden in onze tests en is misschien te traag voor games. Ter vergelijking: alle testtoestellen variëren van 0.1 (minimum) tot 240 (maximum) ms. » 93 % van alle toestellen zijn beter. Dit betekent dat de gemeten responstijd slechter is dan het gemiddelde (19.8 ms) van alle geteste toestellen. | ||
| ↔ Responstijd 50% Grijs naar 80% Grijs | ||
| 51.2 ms ... stijging ↗ en daling ↘ gecombineerd | ↗ 26 ms stijging | 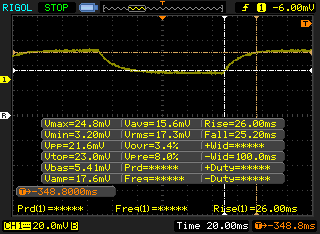 |
| ↘ 25.2 ms daling | ||
| Het scherm vertoonde trage responstijden in onze tests en is misschien te traag voor games. Ter vergelijking: alle testtoestellen variëren van 0.165 (minimum) tot 636 (maximum) ms. » 88 % van alle toestellen zijn beter. Dit betekent dat de gemeten responstijd slechter is dan het gemiddelde (31 ms) van alle geteste toestellen. | ||
Screen Flickering / PWM (Pulse-Width Modulation)
| Screen flickering / PWM niet waargenomen | 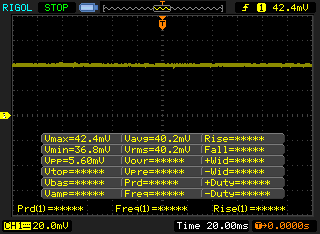 | ||
Ter vergelijking: 52 % van alle geteste toestellen maakten geen gebruik van PWM om de schermhelderheid te verlagen. Als het wel werd gebruikt, werd een gemiddelde van 7754 (minimum: 5 - maximum: 343500) Hz waargenomen. | |||
Performance - Alder Lake-H Ups The Ante
Testomstandigheden
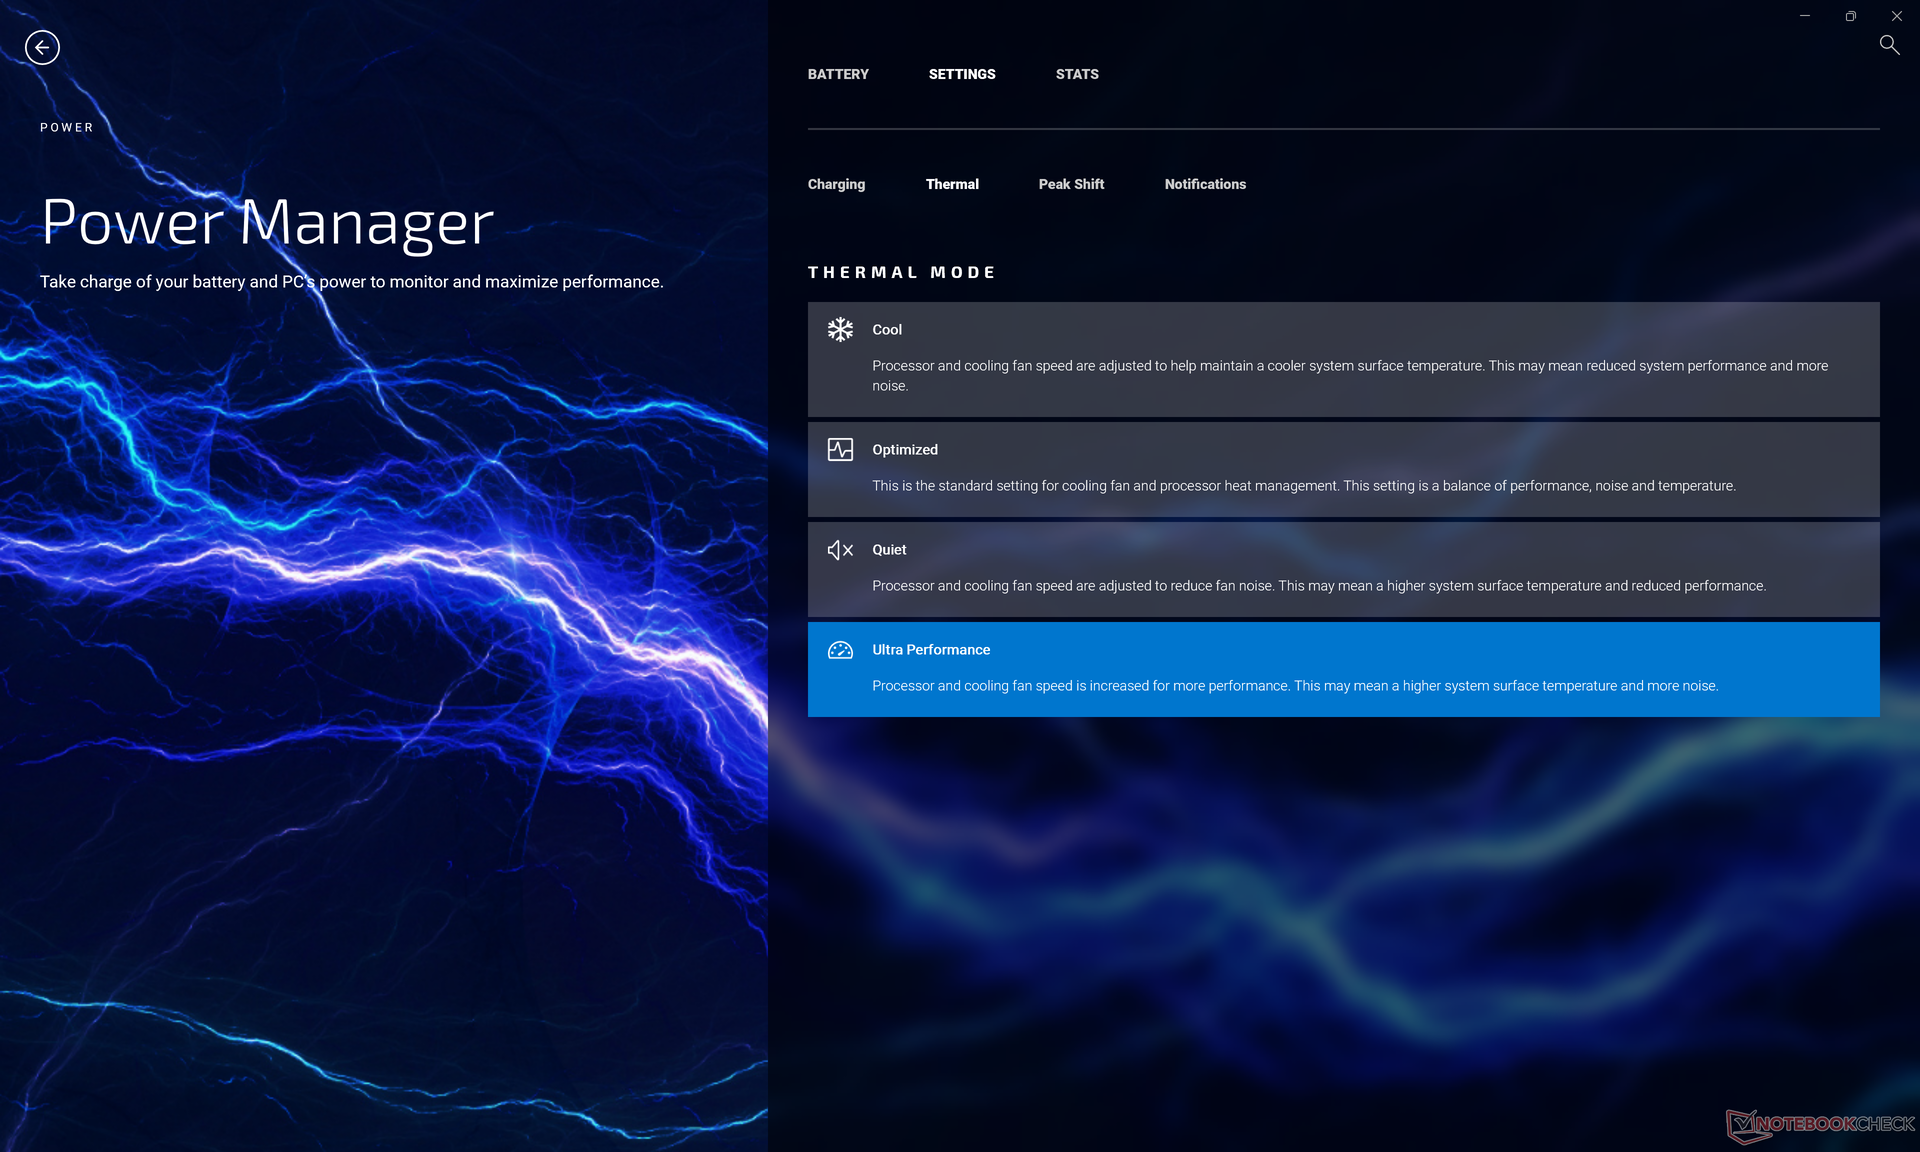
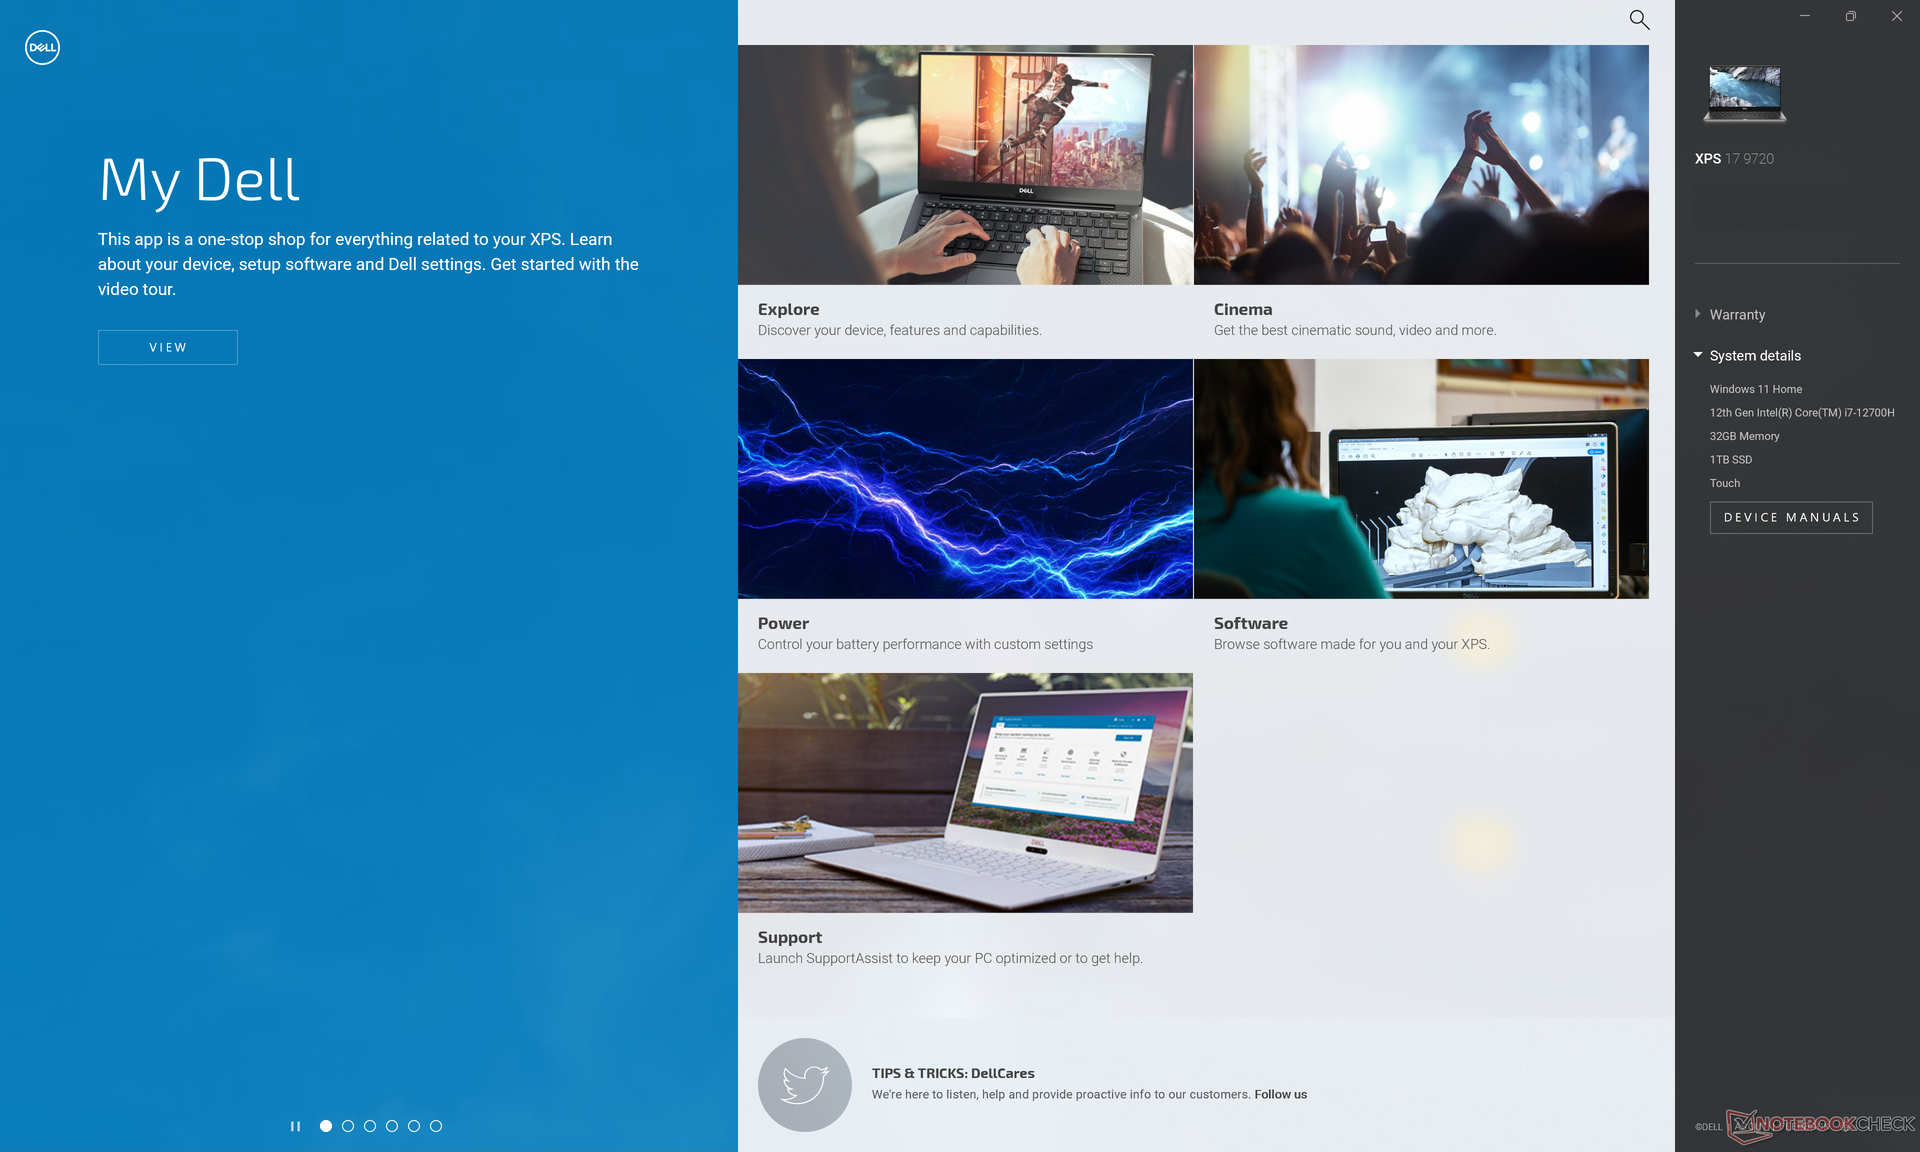
Ons toestel werd via de My Dell-software ingesteld op de Ultra Performance-modus voordat de onderstaande benchmarks werden uitgevoerd voor de hoogst mogelijke scores. Wij raden gebruikers aan vertrouwd te raken met de software van Mijn Dell, Dell Update en PremierColor, aangezien de belangrijkste functies van het systeem via deze apps worden omgeschakeld
Optimus 1.0 wordt standaard geleverd voor automatische grafische schakeling tussen de geïntegreerde GPU en discrete GeForce RTX 3060. Interne adaptieve synchronisatie en MUX worden niet ondersteund, aangezien de XPS 17 geen gaming machine is.
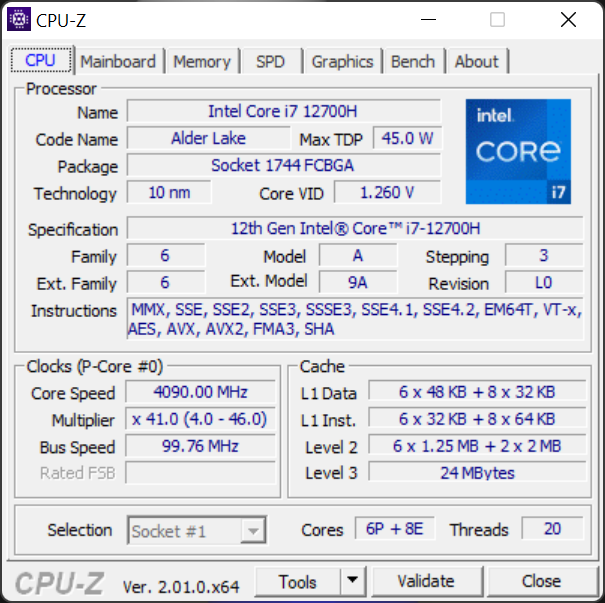
Processor
CineBench xT benchmarks en bepaalde AIDA64 subtests kunnen tot 50 procent sneller zijn dan op de XPS 15 9710 die is uitgerust met de laatste generatie Core i7-11800H een aanzienlijke verbetering van de processorprestaties ten opzichte van vorig jaar. De winst is echter veel kleiner bij andere tests, waaronder Blender en HWBOT x265, maar de gemiddelde winst is nog steeds groter dan wat we hebben waargenomen tussen de XPS 17 9700 en XPS 17 9710.
Vreemd genoeg is de Core i7-12700H achter op de 10e generatie Core i7-10875H bij een aantal AIDA64 benchmarks, zoals hieronder te zien is.
Sommige dikkere laptops met dezelfde Core i7-12800H CPU zijn in staat om de processor op hogere kloksnelheden te laten draaien en tot 20 procent sneller, zoals op de HP Omen 16
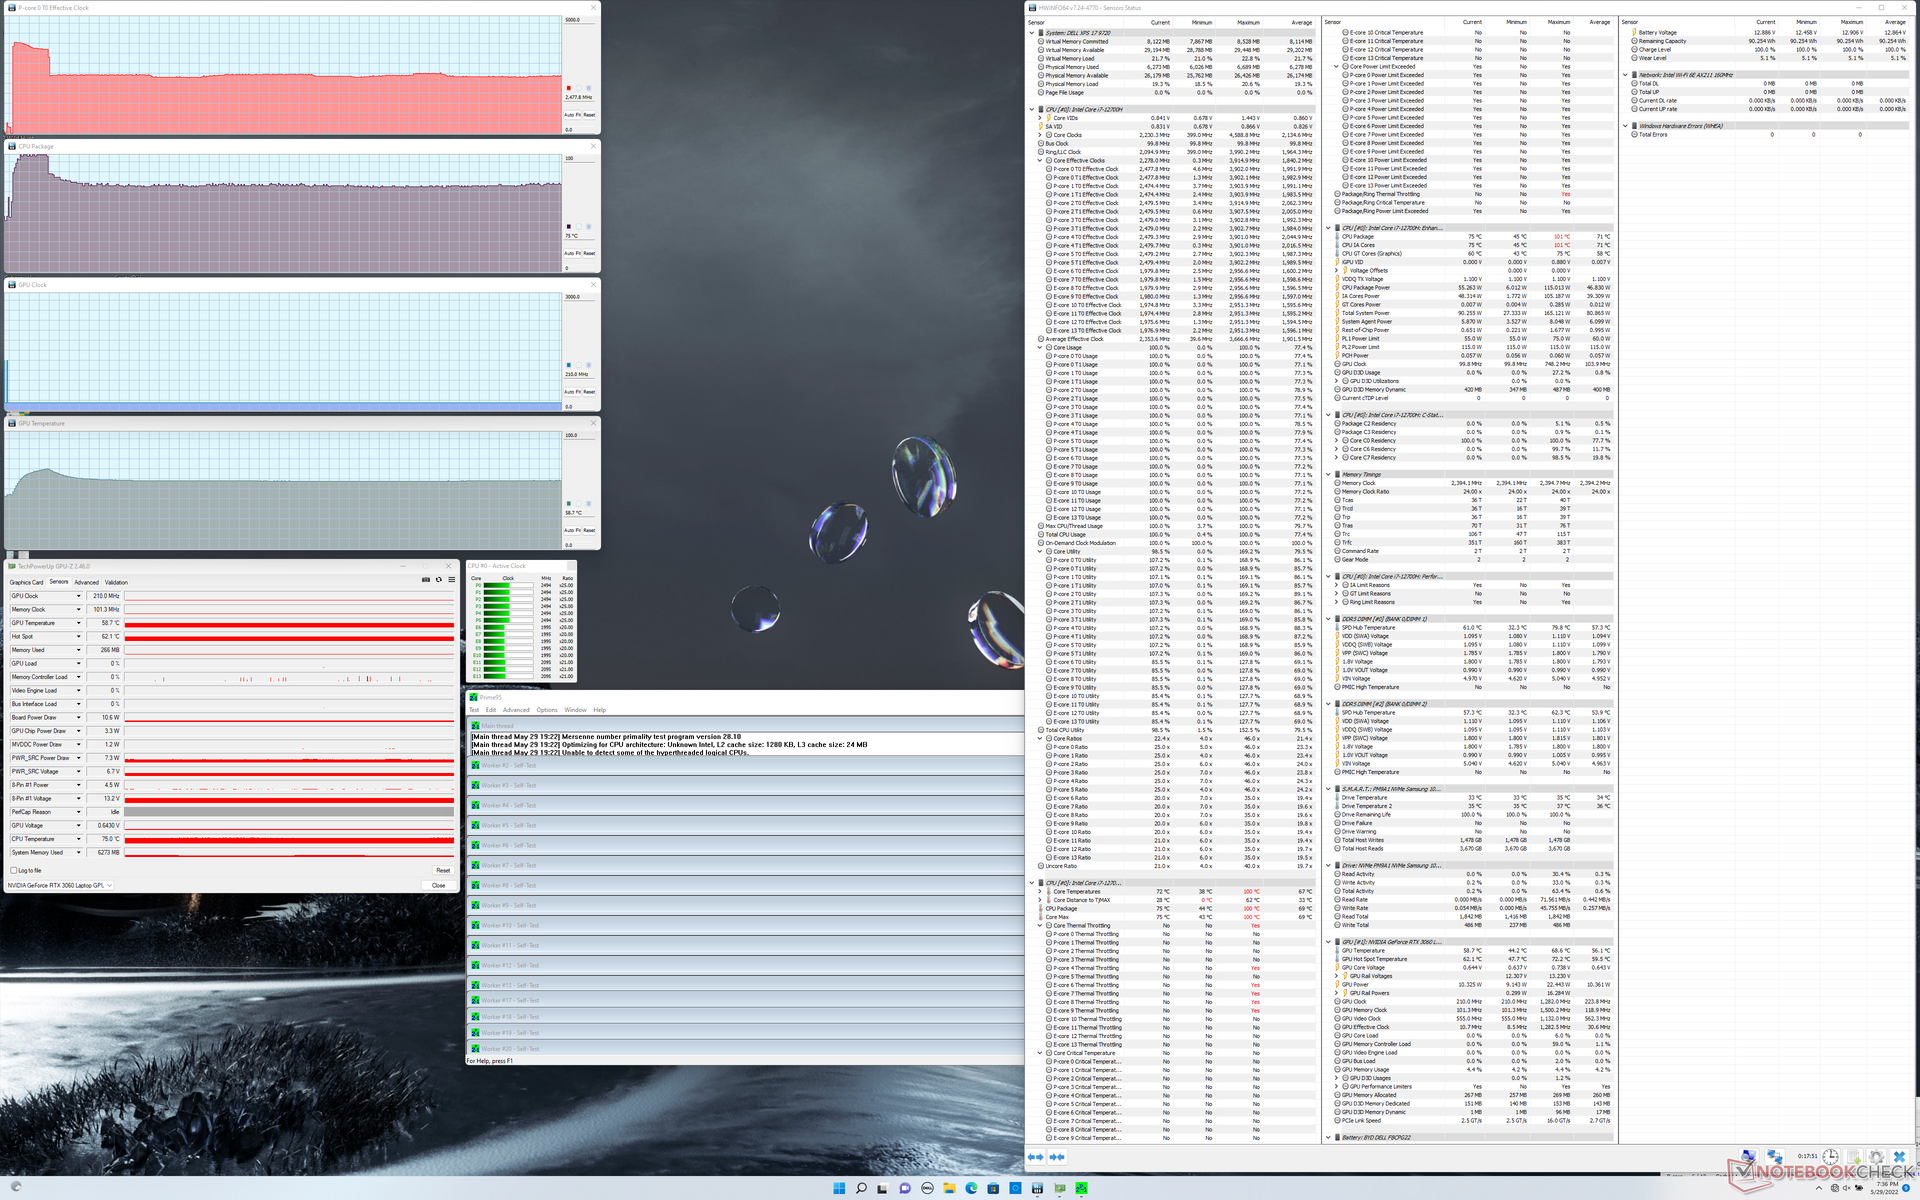
Het draaien van CineBench R15 xT in een loop laat geen grote prestatie throttling problemen zien wanneer het gedurende lange perioden wordt onderworpen aan extreme verwerkingsbelastingen.
Cinebench R15 Multi Loop
Cinebench R23: Multi Core | Single Core
Cinebench R15: CPU Multi 64Bit | CPU Single 64Bit
Blender: v2.79 BMW27 CPU
7-Zip 18.03: 7z b 4 | 7z b 4 -mmt1
Geekbench 5.5: Multi-Core | Single-Core
HWBOT x265 Benchmark v2.2: 4k Preset
LibreOffice : 20 Documents To PDF
R Benchmark 2.5: Overall mean
| Geekbench 5.5 / Multi-Core | |
| Alienware x17 R2 P48E | |
| Razer Blade 17 RTX 3080 Ti | |
| Dell XPS 17 9720 RTX 3060 | |
| Gemiddeld Intel Core i7-12700H (5144 - 13745, n=64) | |
| MSI GS76 Stealth 11UH | |
| Dell XPS 17 9700 Core i7 RTX 2060 Max-Q | |
| Schenker XMG Core 17 (Early 2021) | |
| Acer Nitro 5 AN517-53-54DQ | |
| Dell XPS 17 9700 i5-10300H | |
| Geekbench 5.5 / Single-Core | |
| Alienware x17 R2 P48E | |
| Razer Blade 17 RTX 3080 Ti | |
| Gemiddeld Intel Core i7-12700H (803 - 1851, n=64) | |
| Dell XPS 17 9720 RTX 3060 | |
| MSI GS76 Stealth 11UH | |
| Acer Nitro 5 AN517-53-54DQ | |
| Dell XPS 17 9700 Core i7 RTX 2060 Max-Q | |
| Schenker XMG Core 17 (Early 2021) | |
| Dell XPS 17 9700 i5-10300H | |
Cinebench R23: Multi Core | Single Core
Cinebench R15: CPU Multi 64Bit | CPU Single 64Bit
Blender: v2.79 BMW27 CPU
7-Zip 18.03: 7z b 4 | 7z b 4 -mmt1
Geekbench 5.5: Multi-Core | Single-Core
HWBOT x265 Benchmark v2.2: 4k Preset
LibreOffice : 20 Documents To PDF
R Benchmark 2.5: Overall mean
* ... kleiner is beter
| AIDA64 / FP32 Ray-Trace | |
| Eurocom RX315 NH57AF1 | |
| Lenovo Legion 5 17ACH6H-82JY0003GE | |
| Gemiddeld Intel Core i7-12700H (2585 - 17957, n=64) | |
| Dell XPS 17 9700 Core i7 RTX 2060 Max-Q | |
| Razer Blade 17 (i7-12800H, RTX 3070 Ti) | |
| Dell XPS 17 9720 RTX 3060 | |
| Asus VivoBook 17 F712JA-AU708W | |
| AIDA64 / FPU Julia | |
| Lenovo Legion 5 17ACH6H-82JY0003GE | |
| Eurocom RX315 NH57AF1 | |
| Gemiddeld Intel Core i7-12700H (12439 - 90760, n=64) | |
| Dell XPS 17 9700 Core i7 RTX 2060 Max-Q | |
| Razer Blade 17 (i7-12800H, RTX 3070 Ti) | |
| Dell XPS 17 9720 RTX 3060 | |
| Asus VivoBook 17 F712JA-AU708W | |
| AIDA64 / CPU SHA3 | |
| Eurocom RX315 NH57AF1 | |
| Gemiddeld Intel Core i7-12700H (833 - 4242, n=64) | |
| Razer Blade 17 (i7-12800H, RTX 3070 Ti) | |
| Lenovo Legion 5 17ACH6H-82JY0003GE | |
| Dell XPS 17 9720 RTX 3060 | |
| Dell XPS 17 9700 Core i7 RTX 2060 Max-Q | |
| Asus VivoBook 17 F712JA-AU708W | |
| AIDA64 / CPU Queen | |
| Dell XPS 17 9720 RTX 3060 | |
| Gemiddeld Intel Core i7-12700H (57923 - 103202, n=63) | |
| Razer Blade 17 (i7-12800H, RTX 3070 Ti) | |
| Eurocom RX315 NH57AF1 | |
| Dell XPS 17 9700 Core i7 RTX 2060 Max-Q | |
| Lenovo Legion 5 17ACH6H-82JY0003GE | |
| Asus VivoBook 17 F712JA-AU708W | |
| AIDA64 / FPU SinJulia | |
| Eurocom RX315 NH57AF1 | |
| Razer Blade 17 (i7-12800H, RTX 3070 Ti) | |
| Lenovo Legion 5 17ACH6H-82JY0003GE | |
| Gemiddeld Intel Core i7-12700H (3249 - 9939, n=64) | |
| Dell XPS 17 9720 RTX 3060 | |
| Dell XPS 17 9700 Core i7 RTX 2060 Max-Q | |
| Asus VivoBook 17 F712JA-AU708W | |
| AIDA64 / FPU Mandel | |
| Lenovo Legion 5 17ACH6H-82JY0003GE | |
| Eurocom RX315 NH57AF1 | |
| Gemiddeld Intel Core i7-12700H (7135 - 44760, n=64) | |
| Dell XPS 17 9700 Core i7 RTX 2060 Max-Q | |
| Razer Blade 17 (i7-12800H, RTX 3070 Ti) | |
| Dell XPS 17 9720 RTX 3060 | |
| Asus VivoBook 17 F712JA-AU708W | |
| AIDA64 / FP64 Ray-Trace | |
| Eurocom RX315 NH57AF1 | |
| Lenovo Legion 5 17ACH6H-82JY0003GE | |
| Gemiddeld Intel Core i7-12700H (1437 - 9692, n=64) | |
| Dell XPS 17 9700 Core i7 RTX 2060 Max-Q | |
| Dell XPS 17 9720 RTX 3060 | |
| Razer Blade 17 (i7-12800H, RTX 3070 Ti) | |
| Asus VivoBook 17 F712JA-AU708W | |
| AIDA64 / CPU PhotoWorxx | |
| Dell XPS 17 9720 RTX 3060 | |
| Gemiddeld Intel Core i7-12700H (12863 - 52207, n=64) | |
| Razer Blade 17 (i7-12800H, RTX 3070 Ti) | |
| Dell XPS 17 9700 Core i7 RTX 2060 Max-Q | |
| Eurocom RX315 NH57AF1 | |
| Asus VivoBook 17 F712JA-AU708W | |
| Lenovo Legion 5 17ACH6H-82JY0003GE | |
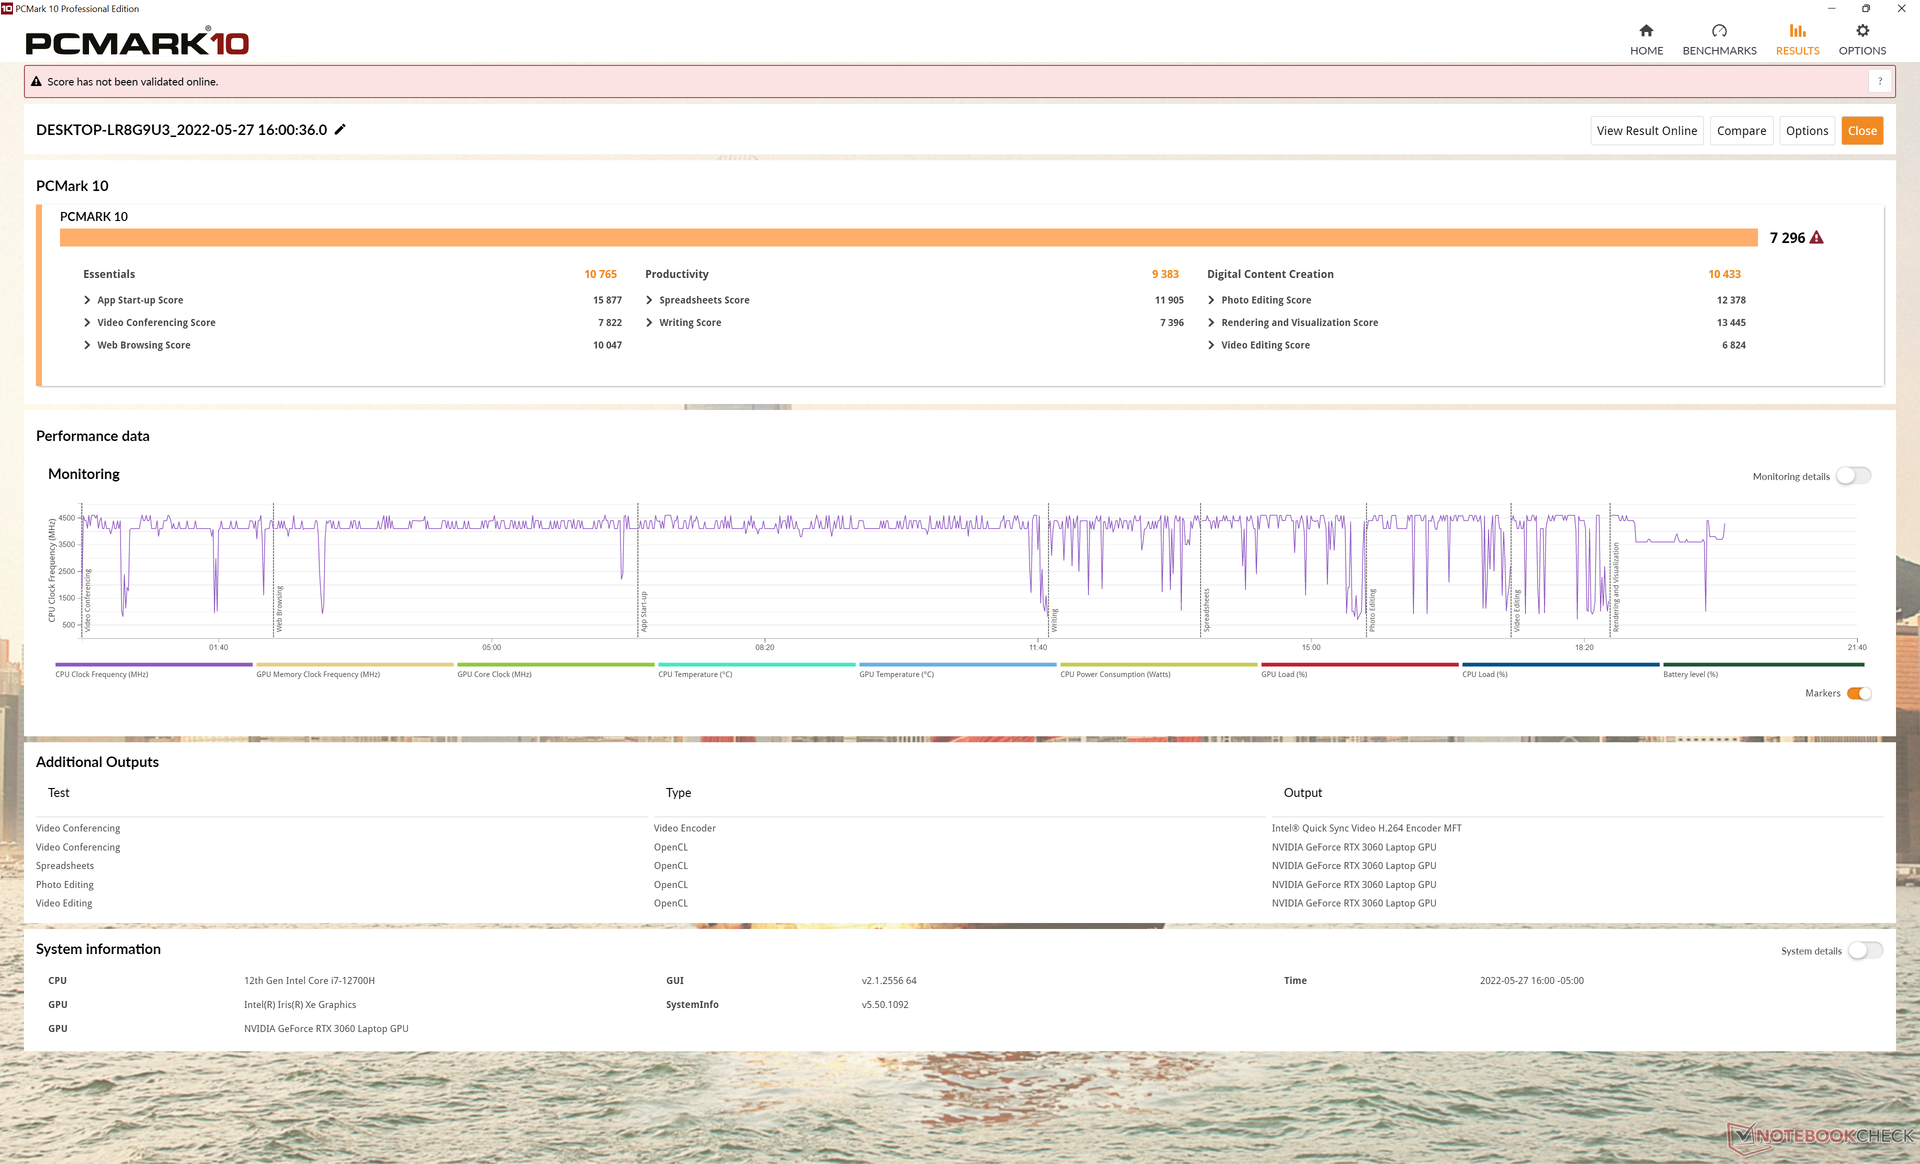
Systeemprestaties
PCMark 10 resultaten zijn consistent hoger dan wat we op de XPS 17 9710 hebben geregistreerd, al is het maar net. Onze XPS 17 9720 scores behoren nog steeds tot de snelste in de multimedia categorie.
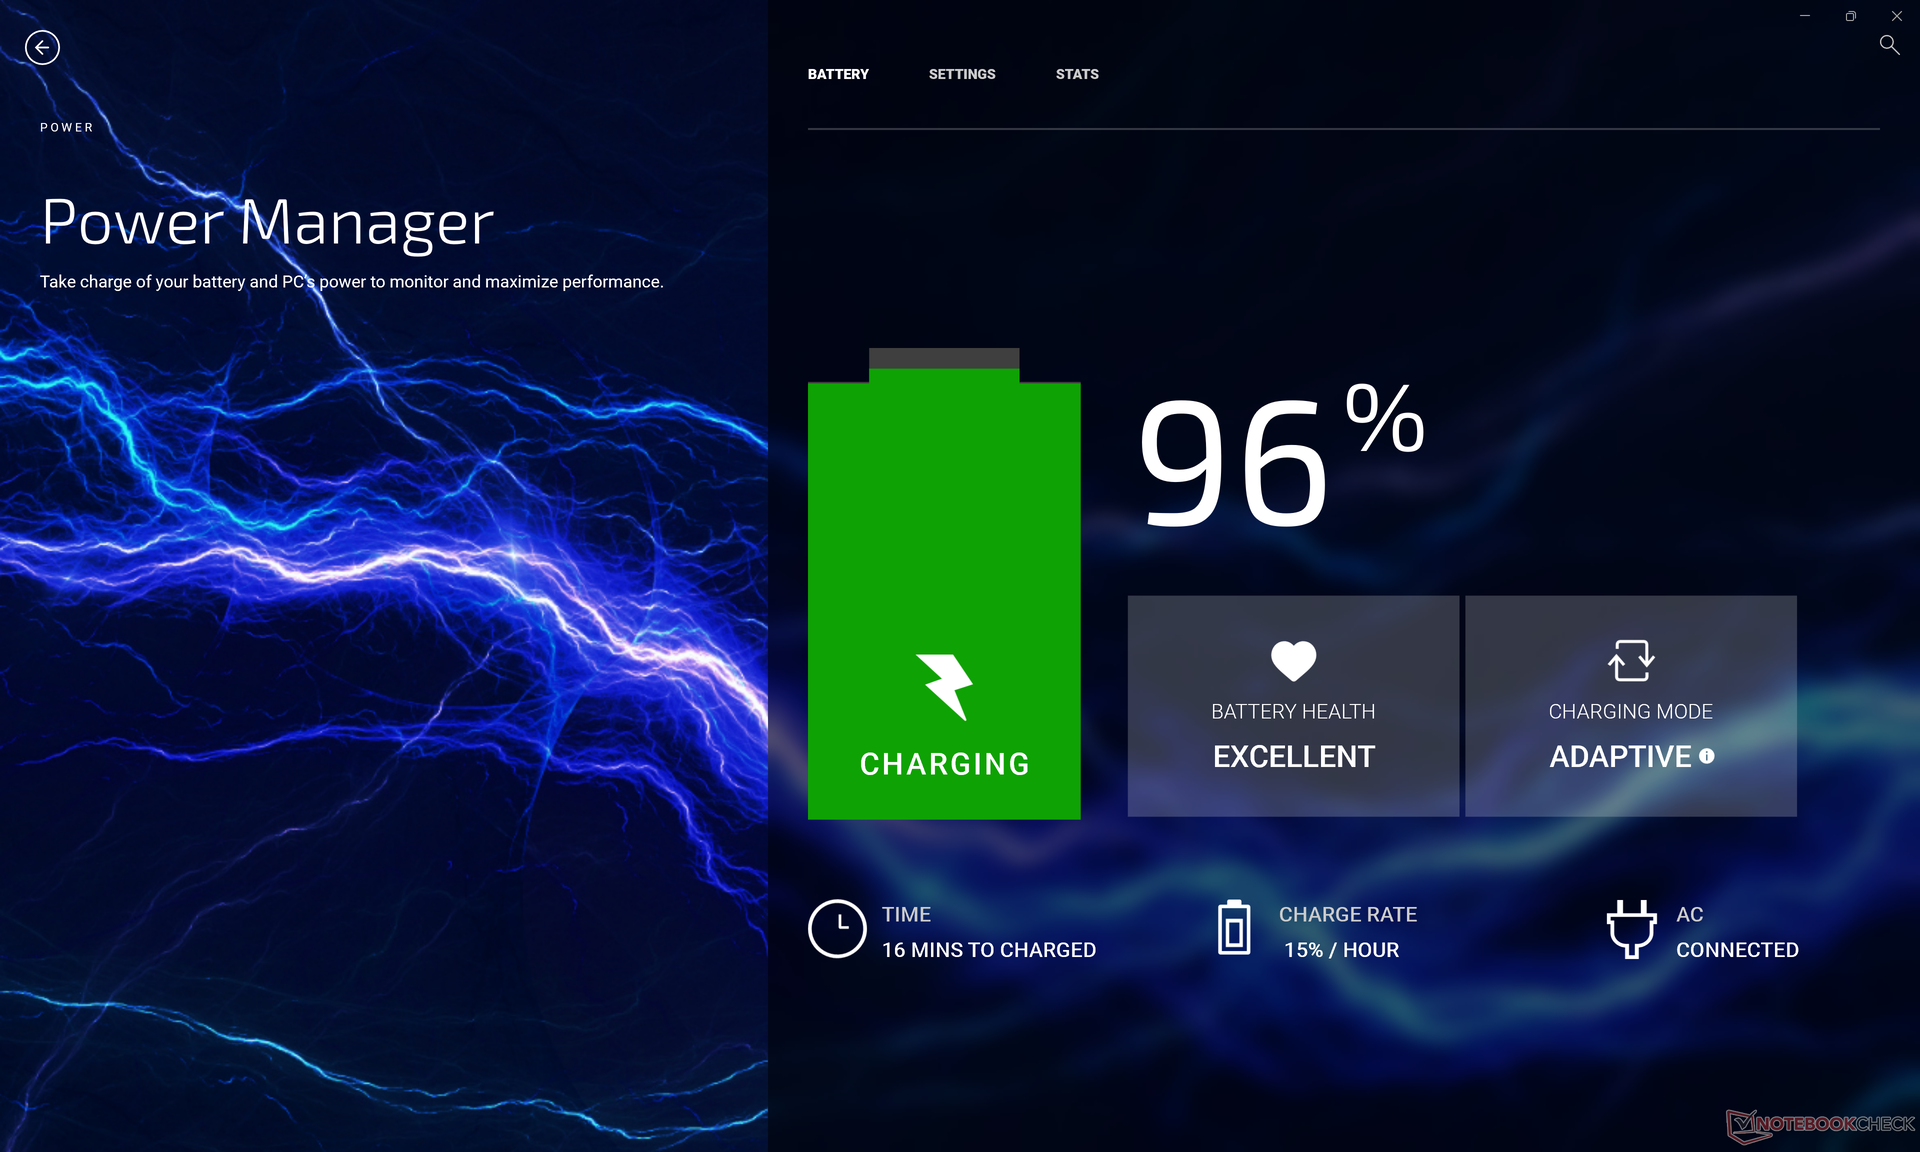
We ondervonden een bug op ons apparaat waarbij het stroomverbruik zich vreemd genoeg stabiliseerde op 40 W in de slaapstand in plaats van de gebruikelijke <2 W, wat leidde tot zeer warme oppervlaktetemperaturen en energieverspilling. Het wijzigen van de energieprofielen via Mijn Dell lijkt een tijdelijke oplossing voor het probleem te zijn.
CrossMark: Overall | Productivity | Creativity | Responsiveness
| PCMark 10 / Score | |
| Gemiddelde van klas Multimedia (4325 - 10386, n=52, laatste 2 jaar) | |
| Dell XPS 17 9720 RTX 3060 | |
| Razer Blade 17 (i7-12800H, RTX 3070 Ti) | |
| Gemiddeld Intel Core i7-12700H, NVIDIA GeForce RTX 3060 Laptop GPU (5986 - 8156, n=12) | |
| Dell XPS 17 9710 Core i7 RTX 3060 | |
| Lenovo Legion 5 17ACH6H-82JY0003GE | |
| Dell XPS 17 9700 Core i7 RTX 2060 Max-Q | |
| HP Envy 17-cg | |
| Asus VivoBook 17 F712JA-AU708W | |
| PCMark 10 / Essentials | |
| Dell XPS 17 9720 RTX 3060 | |
| Gemiddeld Intel Core i7-12700H, NVIDIA GeForce RTX 3060 Laptop GPU (9289 - 12144, n=12) | |
| Gemiddelde van klas Multimedia (8025 - 11664, n=51, laatste 2 jaar) | |
| Razer Blade 17 (i7-12800H, RTX 3070 Ti) | |
| Dell XPS 17 9710 Core i7 RTX 3060 | |
| Lenovo Legion 5 17ACH6H-82JY0003GE | |
| Dell XPS 17 9700 Core i7 RTX 2060 Max-Q | |
| HP Envy 17-cg | |
| Asus VivoBook 17 F712JA-AU708W | |
| PCMark 10 / Productivity | |
| Gemiddelde van klas Multimedia (7323 - 18233, n=51, laatste 2 jaar) | |
| Dell XPS 17 9720 RTX 3060 | |
| Gemiddeld Intel Core i7-12700H, NVIDIA GeForce RTX 3060 Laptop GPU (6161 - 10362, n=12) | |
| Razer Blade 17 (i7-12800H, RTX 3070 Ti) | |
| Lenovo Legion 5 17ACH6H-82JY0003GE | |
| Dell XPS 17 9710 Core i7 RTX 3060 | |
| HP Envy 17-cg | |
| Dell XPS 17 9700 Core i7 RTX 2060 Max-Q | |
| Asus VivoBook 17 F712JA-AU708W | |
| PCMark 10 / Digital Content Creation | |
| Razer Blade 17 (i7-12800H, RTX 3070 Ti) | |
| Gemiddeld Intel Core i7-12700H, NVIDIA GeForce RTX 3060 Laptop GPU (8950 - 12554, n=12) | |
| Gemiddelde van klas Multimedia (3651 - 16240, n=51, laatste 2 jaar) | |
| Dell XPS 17 9720 RTX 3060 | |
| Dell XPS 17 9710 Core i7 RTX 3060 | |
| Lenovo Legion 5 17ACH6H-82JY0003GE | |
| Dell XPS 17 9700 Core i7 RTX 2060 Max-Q | |
| HP Envy 17-cg | |
| Asus VivoBook 17 F712JA-AU708W | |
| CrossMark / Overall | |
| Dell XPS 17 9720 RTX 3060 | |
| Gemiddelde van klas Multimedia (866 - 2728, n=60, laatste 2 jaar) | |
| Gemiddeld Intel Core i7-12700H, NVIDIA GeForce RTX 3060 Laptop GPU (1649 - 2017, n=11) | |
| Razer Blade 17 (i7-12800H, RTX 3070 Ti) | |
| Lenovo Legion 5 17ACH6H-82JY0003GE | |
| Asus VivoBook 17 F712JA-AU708W | |
| CrossMark / Productivity | |
| Gemiddelde van klas Multimedia (931 - 2489, n=60, laatste 2 jaar) | |
| Dell XPS 17 9720 RTX 3060 | |
| Gemiddeld Intel Core i7-12700H, NVIDIA GeForce RTX 3060 Laptop GPU (1536 - 1958, n=11) | |
| Razer Blade 17 (i7-12800H, RTX 3070 Ti) | |
| Lenovo Legion 5 17ACH6H-82JY0003GE | |
| Asus VivoBook 17 F712JA-AU708W | |
| CrossMark / Creativity | |
| Gemiddelde van klas Multimedia (907 - 3465, n=60, laatste 2 jaar) | |
| Dell XPS 17 9720 RTX 3060 | |
| Gemiddeld Intel Core i7-12700H, NVIDIA GeForce RTX 3060 Laptop GPU (1816 - 2084, n=11) | |
| Razer Blade 17 (i7-12800H, RTX 3070 Ti) | |
| Lenovo Legion 5 17ACH6H-82JY0003GE | |
| Asus VivoBook 17 F712JA-AU708W | |
| CrossMark / Responsiveness | |
| Dell XPS 17 9720 RTX 3060 | |
| Gemiddeld Intel Core i7-12700H, NVIDIA GeForce RTX 3060 Laptop GPU (1210 - 2207, n=11) | |
| Razer Blade 17 (i7-12800H, RTX 3070 Ti) | |
| Gemiddelde van klas Multimedia (605 - 2024, n=60, laatste 2 jaar) | |
| Lenovo Legion 5 17ACH6H-82JY0003GE | |
| Asus VivoBook 17 F712JA-AU708W | |
| PCMark 10 Score | 7296 punten | |
Help | ||
| AIDA64 / Memory Copy | |
| Dell XPS 17 9720 RTX 3060 | |
| Gemiddeld Intel Core i7-12700H (25615 - 80511, n=64) | |
| Razer Blade 17 (i7-12800H, RTX 3070 Ti) | |
| Dell XPS 17 9700 Core i7 RTX 2060 Max-Q | |
| Lenovo Legion 5 17ACH6H-82JY0003GE | |
| Asus VivoBook 17 F712JA-AU708W | |
| AIDA64 / Memory Read | |
| Dell XPS 17 9720 RTX 3060 | |
| Gemiddeld Intel Core i7-12700H (25586 - 79442, n=64) | |
| Razer Blade 17 (i7-12800H, RTX 3070 Ti) | |
| Lenovo Legion 5 17ACH6H-82JY0003GE | |
| Dell XPS 17 9700 Core i7 RTX 2060 Max-Q | |
| Asus VivoBook 17 F712JA-AU708W | |
| AIDA64 / Memory Write | |
| Dell XPS 17 9720 RTX 3060 | |
| Gemiddeld Intel Core i7-12700H (23679 - 88660, n=64) | |
| Razer Blade 17 (i7-12800H, RTX 3070 Ti) | |
| Dell XPS 17 9700 Core i7 RTX 2060 Max-Q | |
| Lenovo Legion 5 17ACH6H-82JY0003GE | |
| Asus VivoBook 17 F712JA-AU708W | |
* ... kleiner is beter
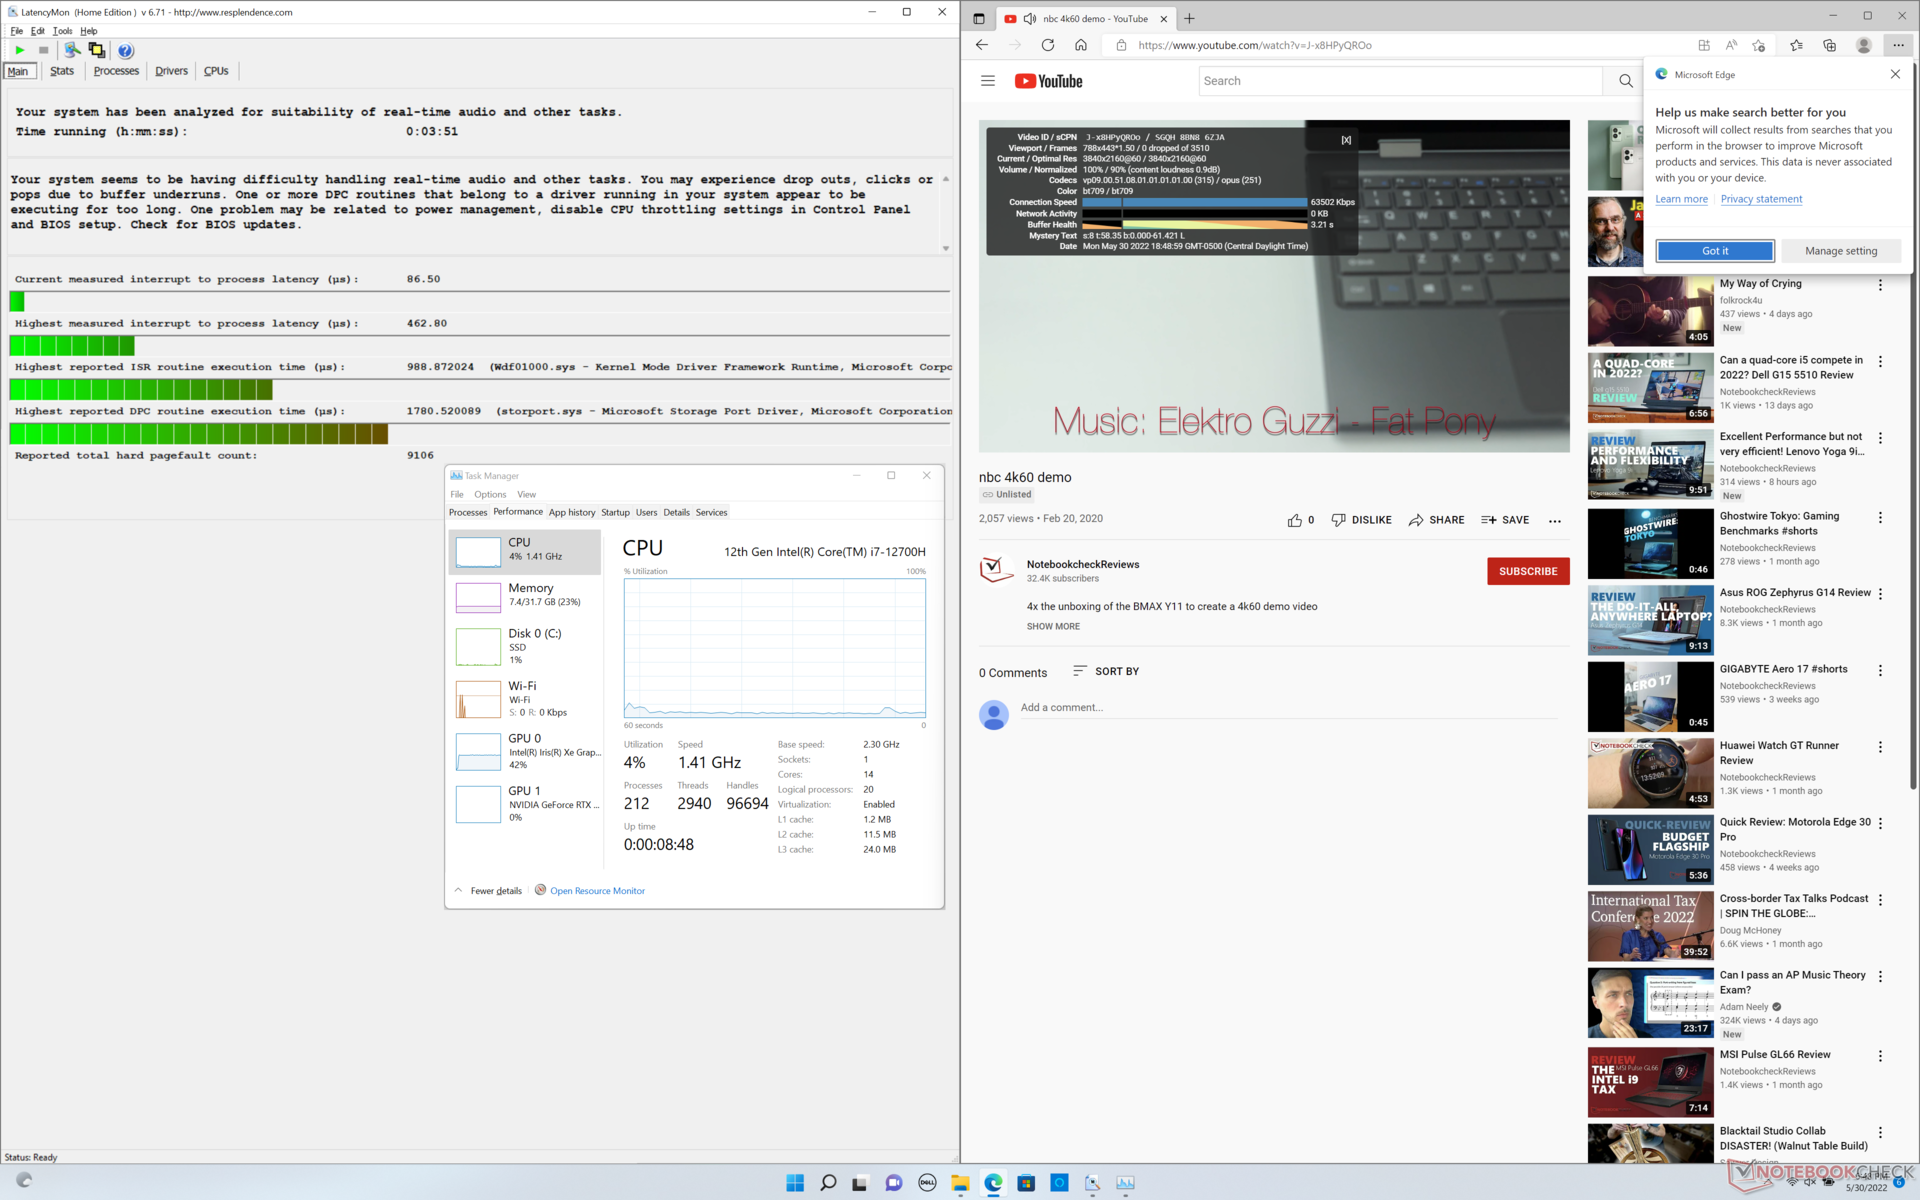
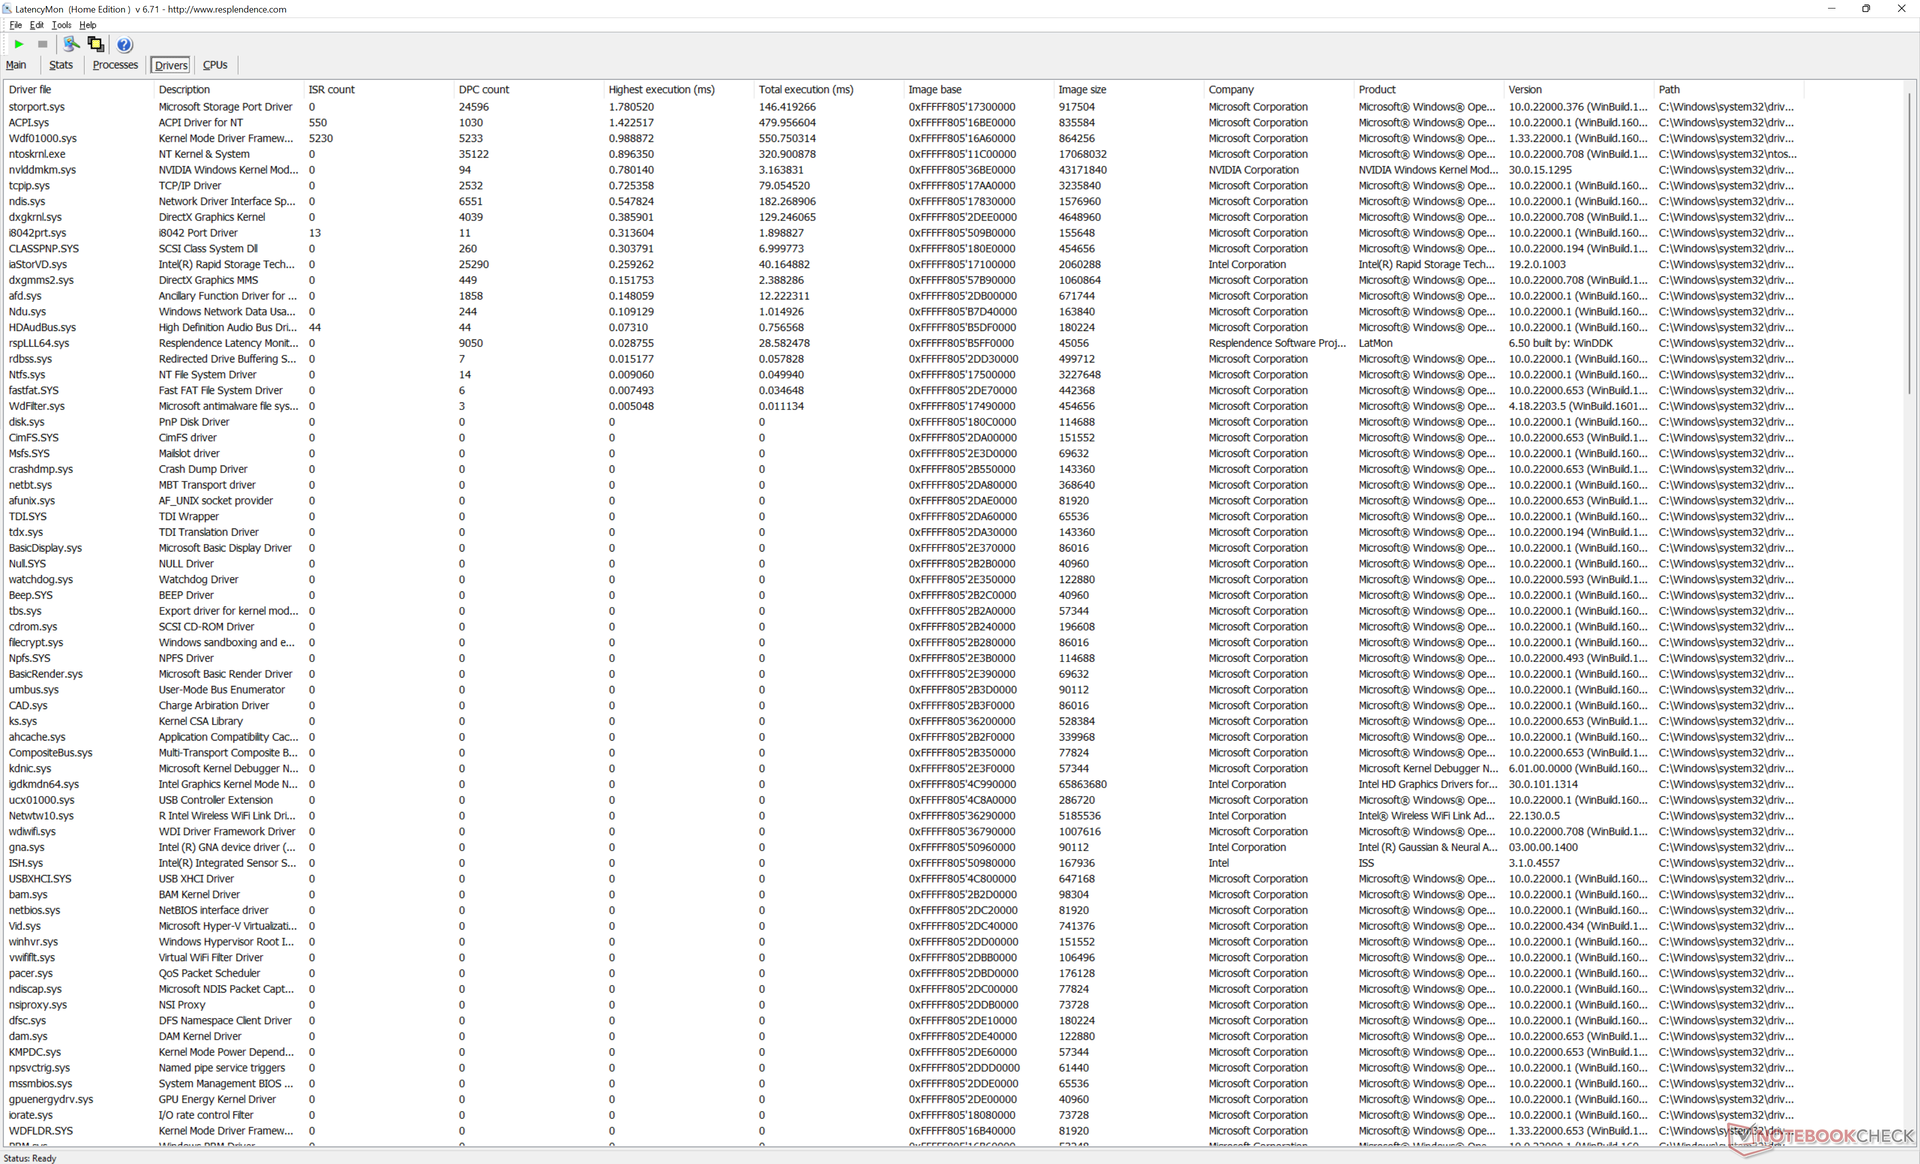
DPC latentie
LatencyMon onthult kleine DPC-problemen bij het openen van meerdere browsertabbladen op onze startpagina, vergelijkbaar met wat we waarnamen op de XPS 17 9710 en 9700. het afspelen van 4K-video's bij 60 FPS verloopt verder perfect vloeiend, zonder wegvallende frames, zoals verwacht mag worden van een met Core H aangedreven multimedia laptop.
| DPC Latencies / LatencyMon - interrupt to process latency (max), Web, Youtube, Prime95 | |
| HP Envy 17-cg | |
| Lenovo Legion 5 17ACH6H-82JY0003GE | |
| Asus VivoBook 17 F712JA-AU708W | |
| Razer Blade 17 (i7-12800H, RTX 3070 Ti) | |
| Dell XPS 17 9700 Core i7 RTX 2060 Max-Q | |
| Dell XPS 17 9710 Core i7 RTX 3060 | |
| Dell XPS 17 9720 RTX 3060 | |
* ... kleiner is beter
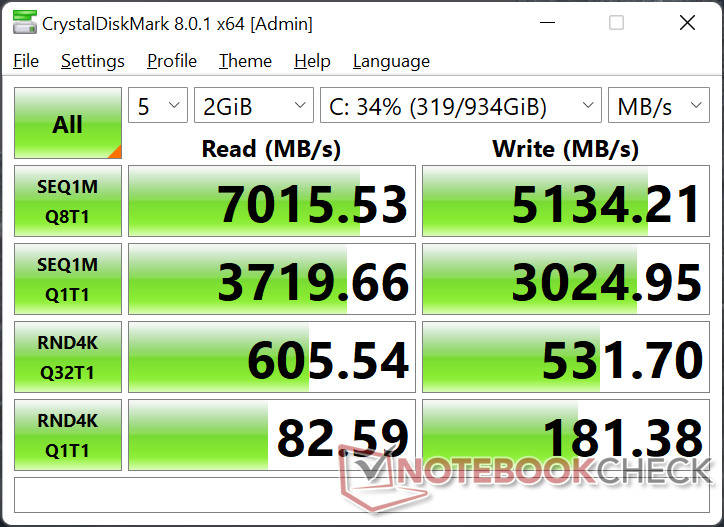
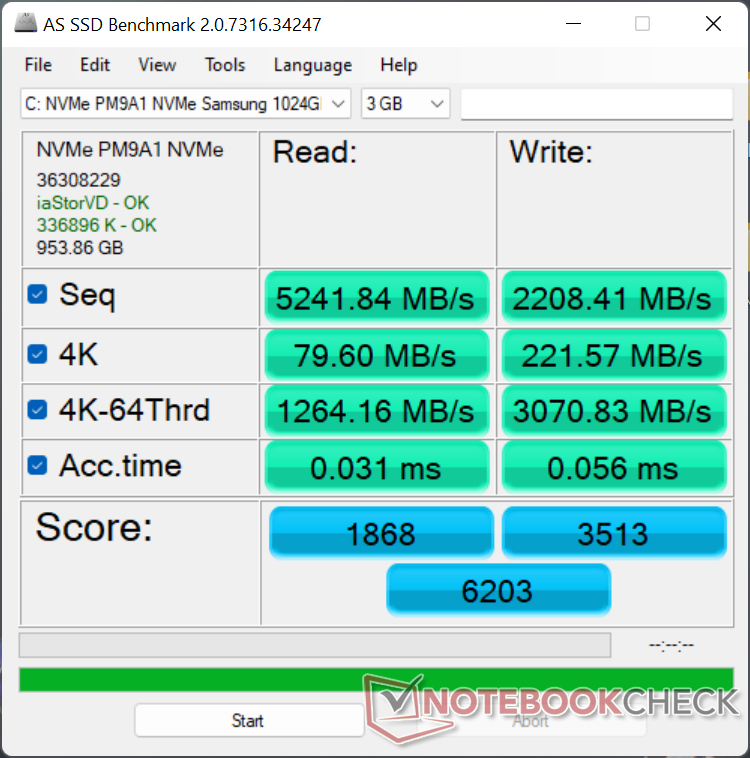
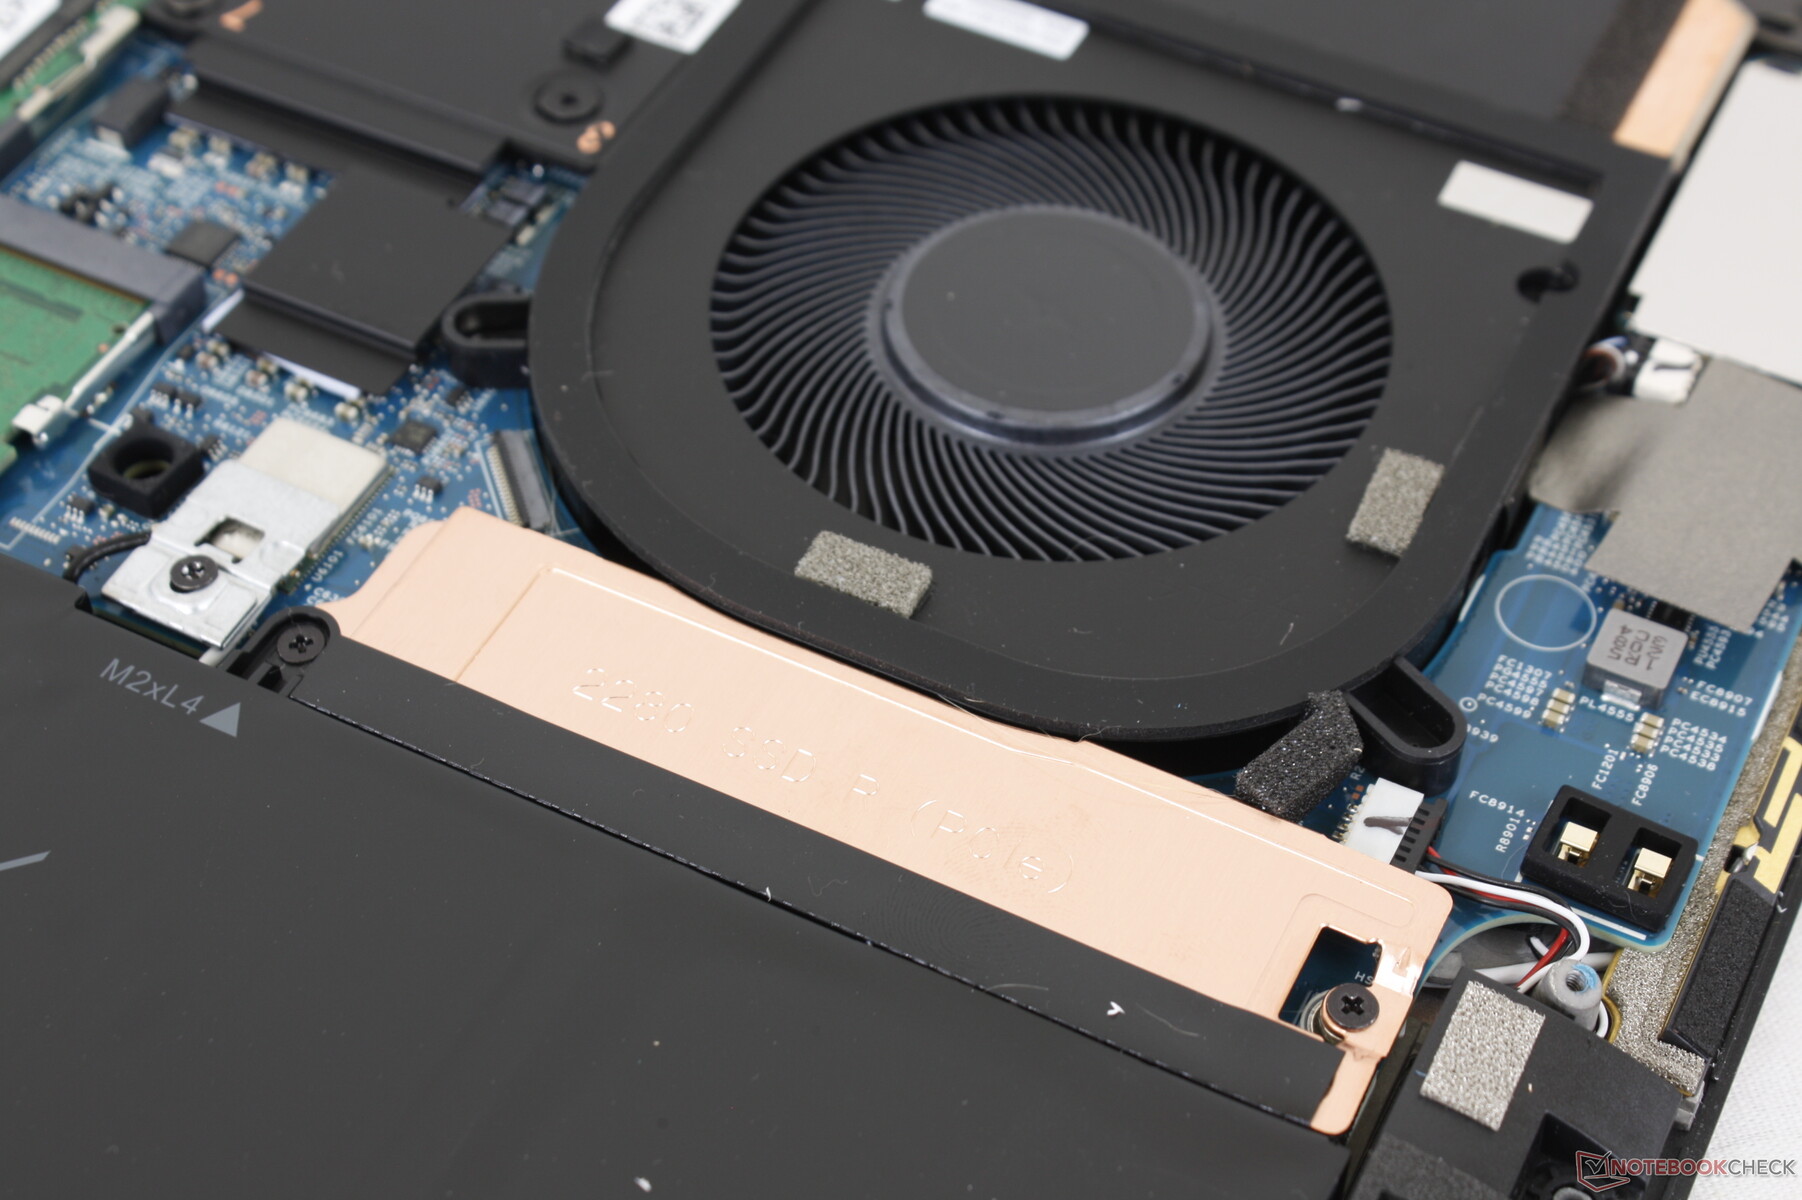
Opslagapparaten
De XPS 17 9710 werd geleverd in een tijd dat PCIe4 x4 NVMe SSD's nog niet overal beschikbaar waren en dus werden SKU's alleen geleverd met PCIe3 x4 opties in plaats daarvan. PCIe4-schijven zijn tegenwoordig gelukkig algemener en het is goed om te zien dat de XPS 17 9720 is voorzien van een snelleSamsung PM9A1 oplossing heeft gekozen. Onze stresstests tonen aan dat de schijf in ons apparaat zonder problemen de maximale sequentiële leessnelheid van meer dan 7000 MB/s gedurende langere perioden kon vasthouden zonder gas te hoeven geven, hoewel de algehele prestaties nog steeds langzamer zijn dan wat we registreerden op deRazer Blade 17 uitgerust met dezelfde 1 TB Samsung schijf.

* ... kleiner is beter
Disk Throttling: DiskSpd Read Loop, Queue Depth 8
GPU prestatie
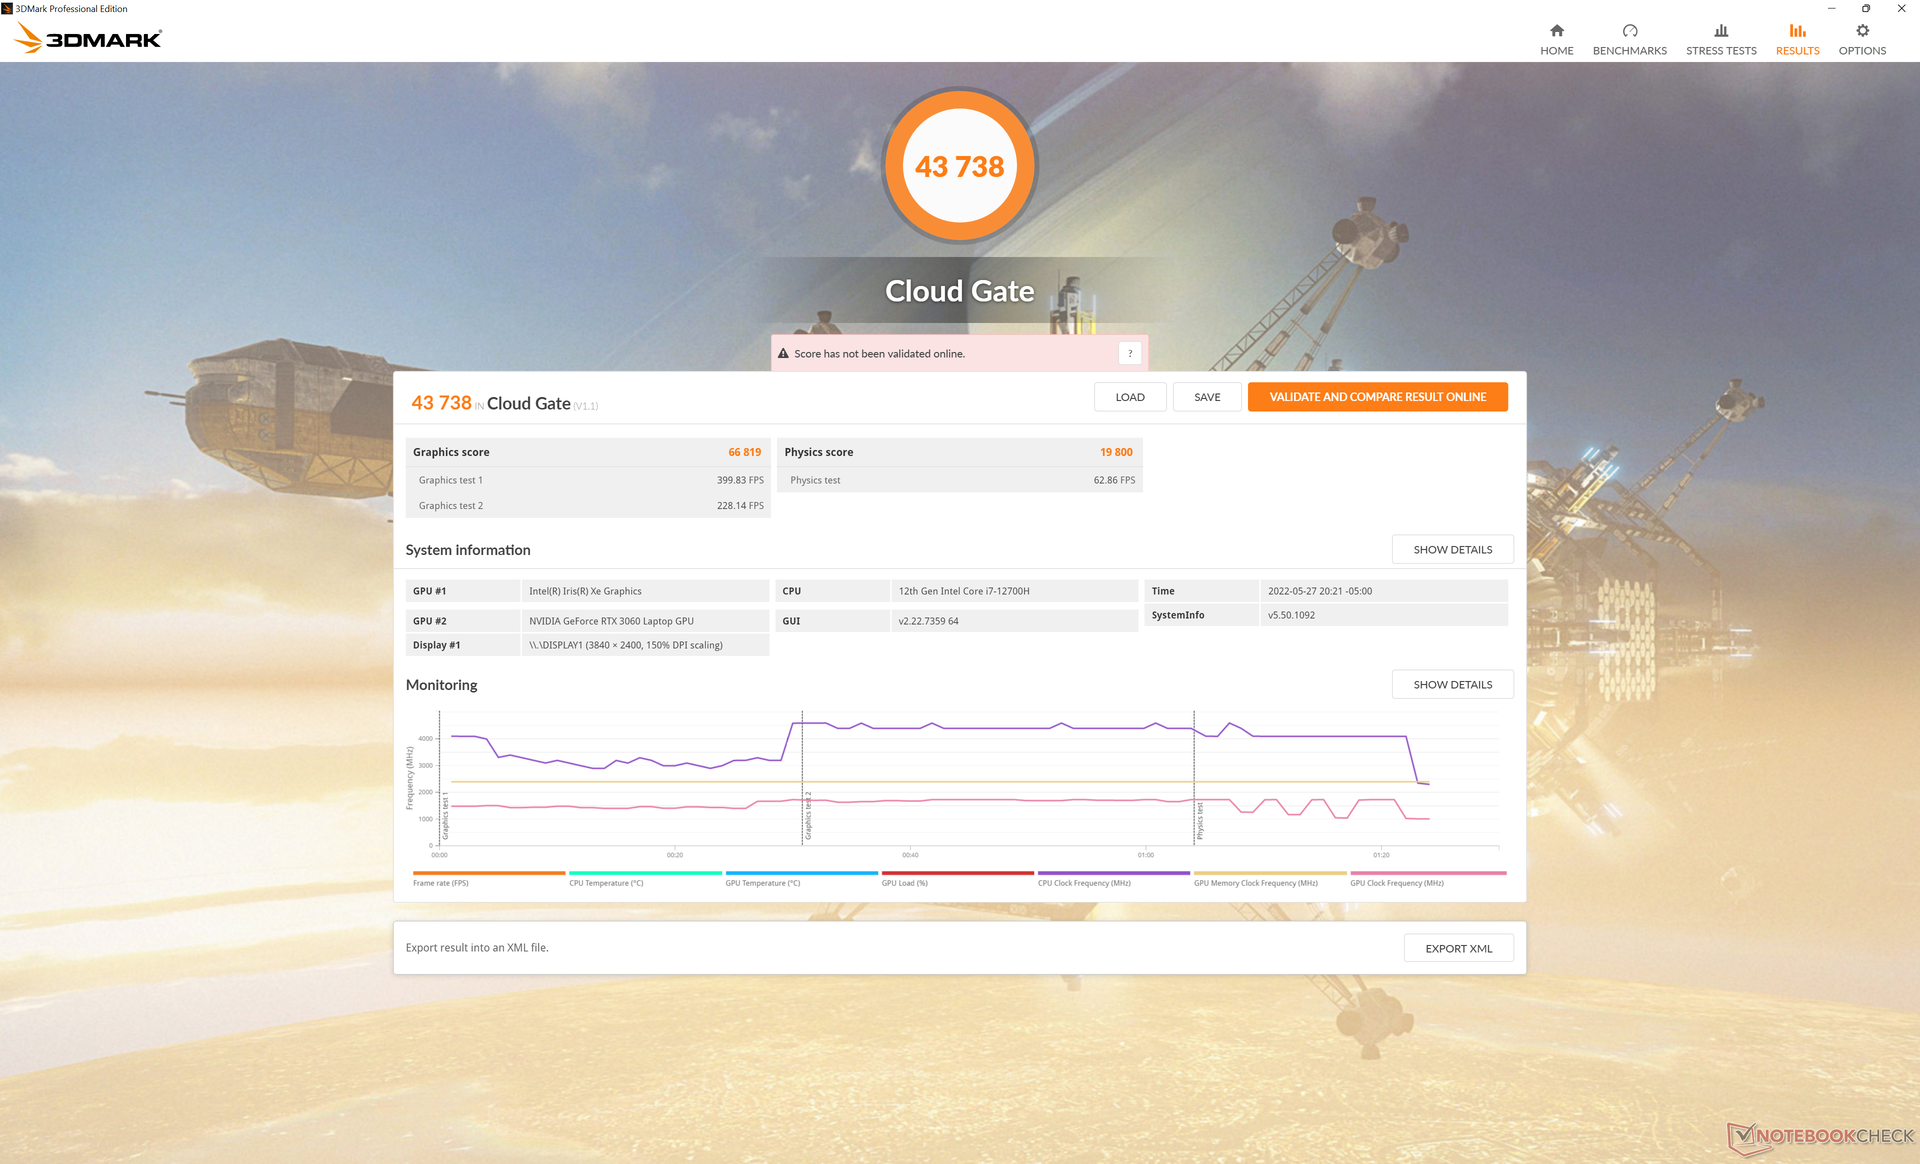
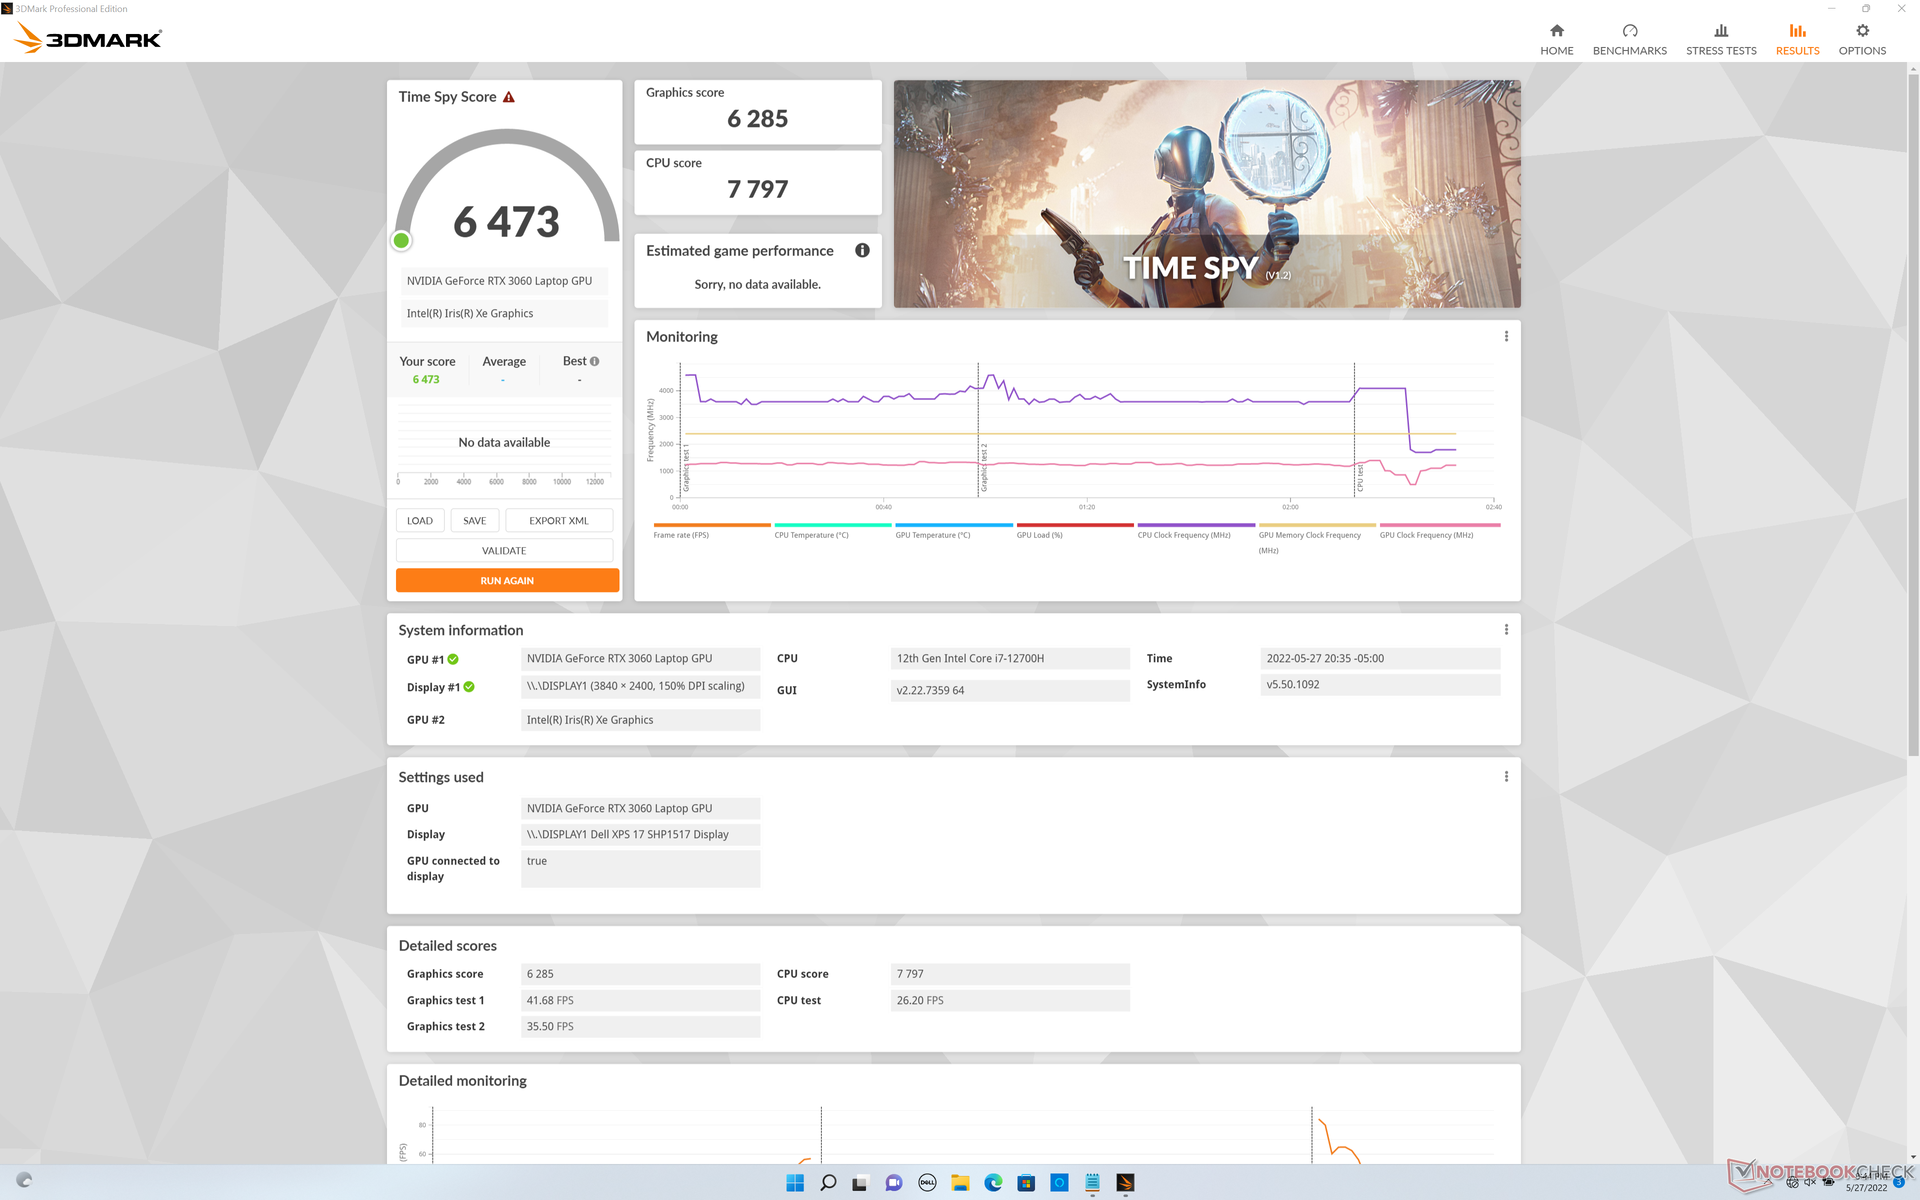
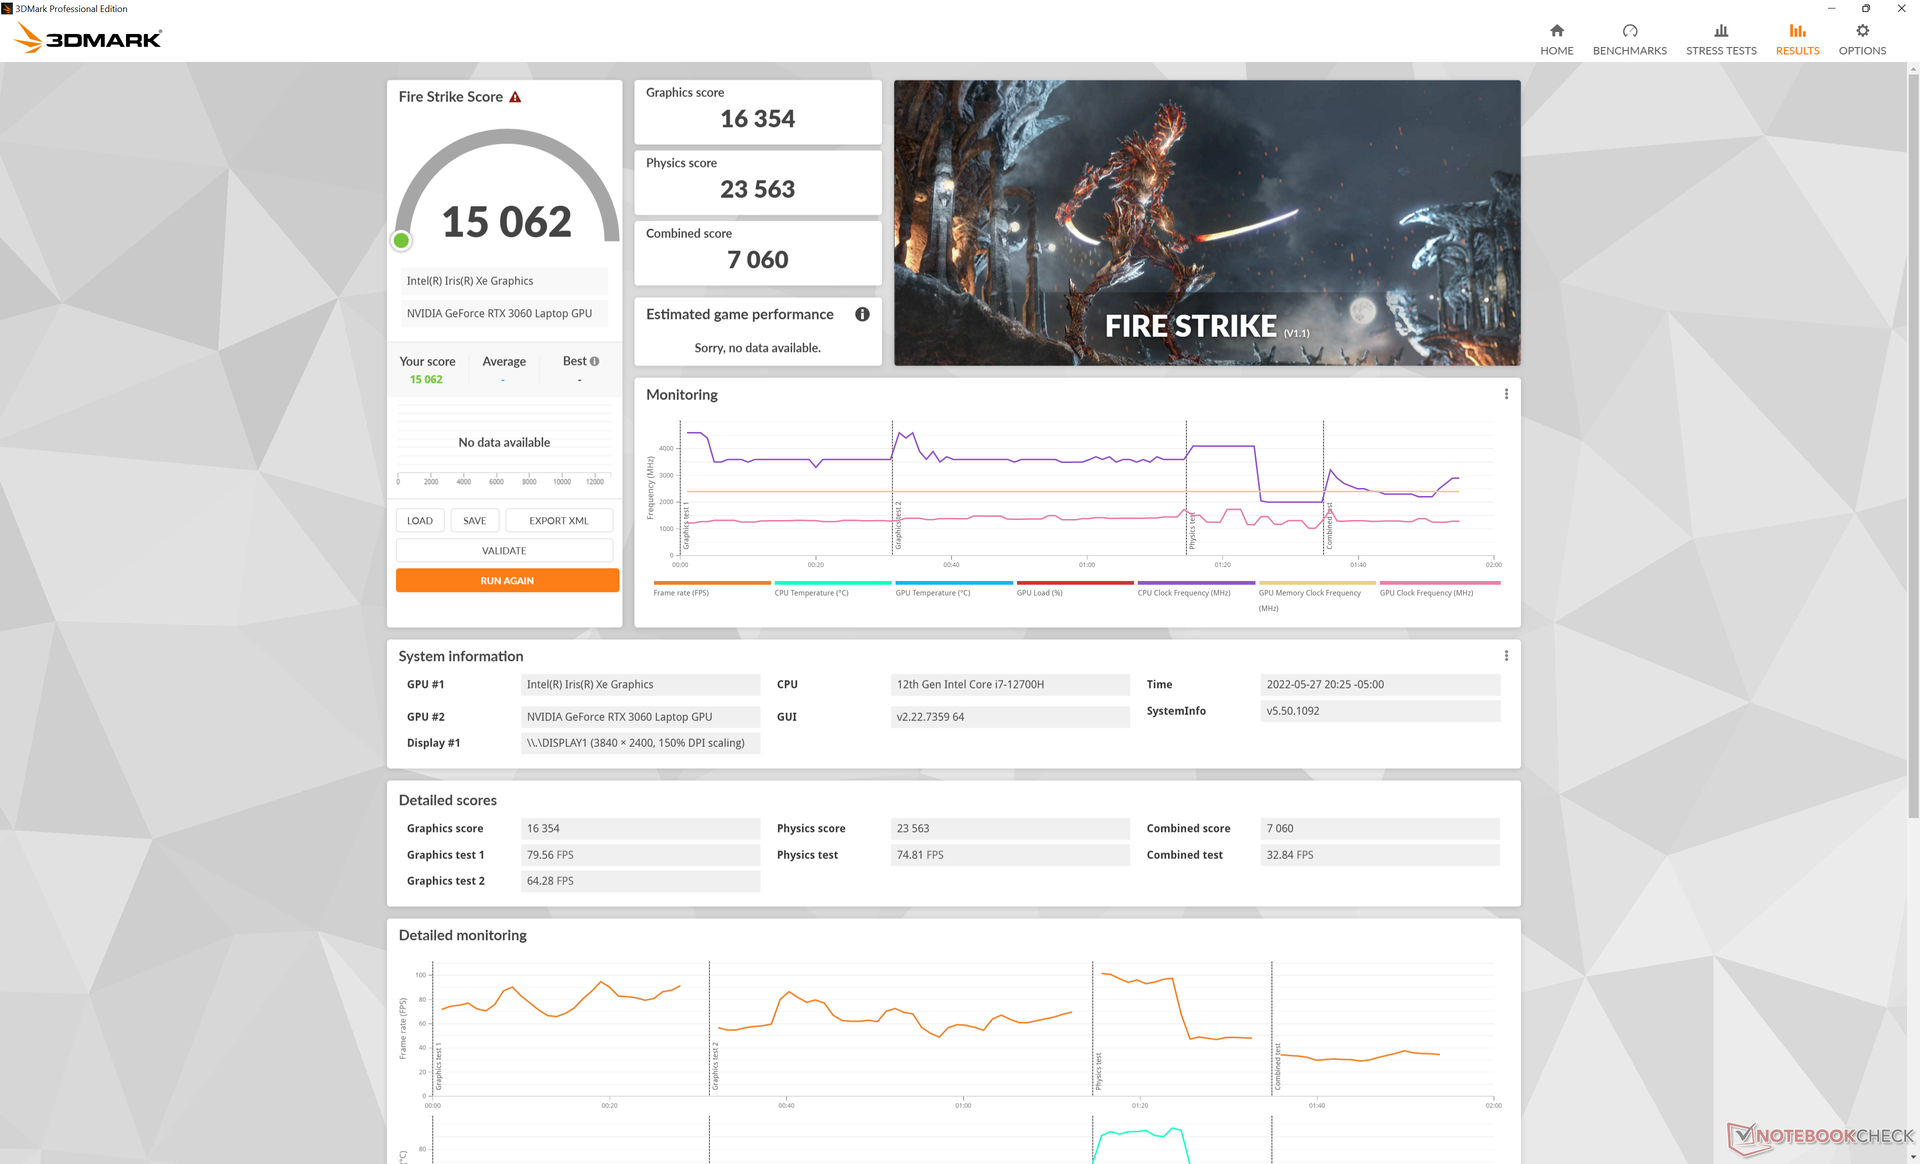
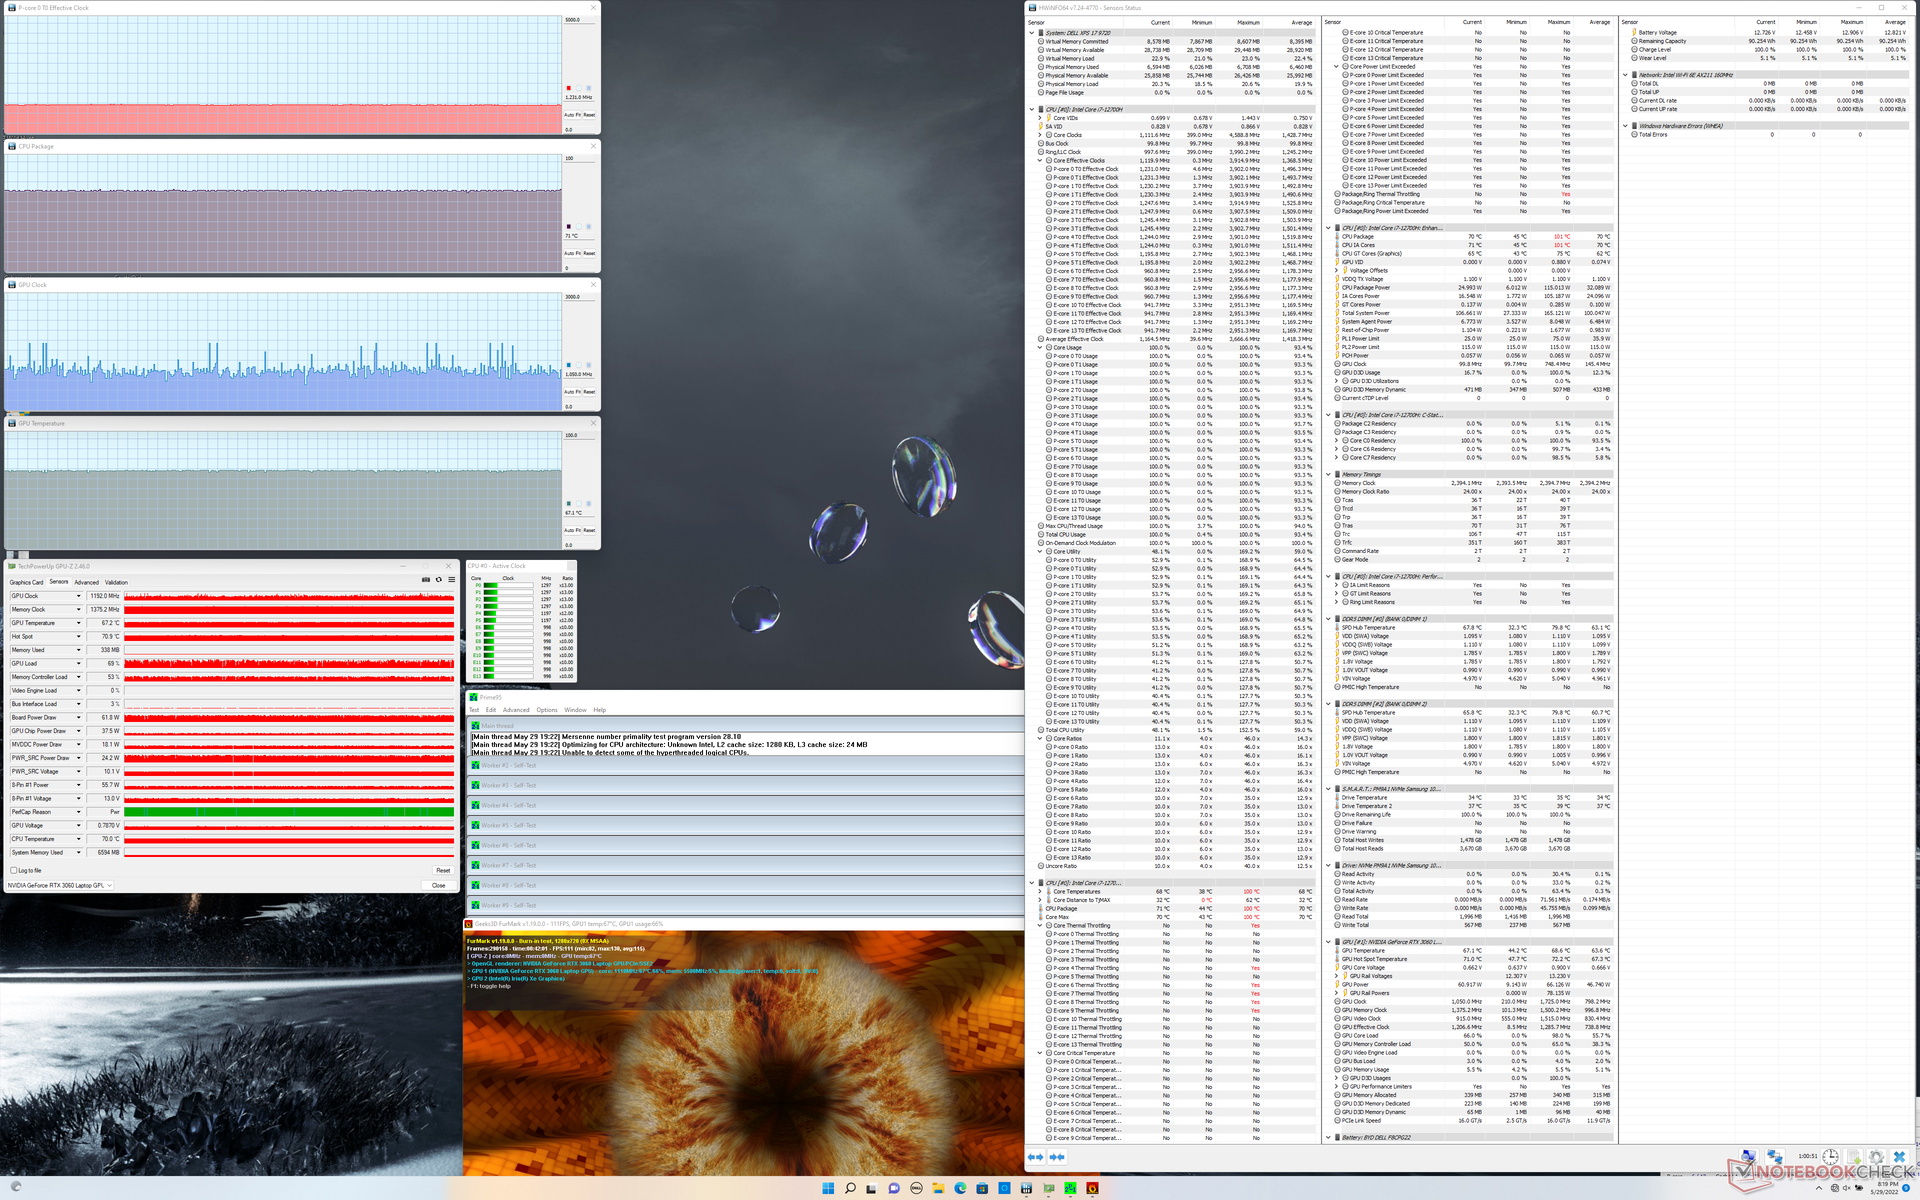
Dell heeft de GeForce RTX 3060 TGP verlaagd van 70 W op de XPS 17 9710 naar 65 W op de XPS 17 9720. Hoewel Dell een GPU van 60 W adverteert voor de 9720, kunnen we bevestigen dat het Nvidia configuratiescherm in plaats daarvan 65 W aangeeft, wat beter overeenkomt met onze eigen onafhankelijke resultaten tijdens het testen. Het effect is een afname van 10 procent in ruwe grafische prestaties volgens 3DMark benchmarks en geteste GPU-gebonden games zoals Witcher 3, Final Fantasy XV, of Strange Brigade.
In vergelijking met de gemiddelde laptop met dezelfde GeForce RTX 3060 GPU, is die in de XPS 17 9720 ongeveer 20 procent langzamer. Het is vermeldenswaard dat de meeste andere laptops met de RTX 3060 doorgaans streven naar hogere TGP-plafonds van 80 W of meer. Op zijn minst is de GPU hier nog steeds beter dan de RTX 2060 Max-Q in de originele XPS 17 9700 met ongeveer 15 procent. Ondertussen zou downgraden naar de RTX 3050 Ti SKU resulteren in een prestatieachterstand van 25 tot 30 procent.
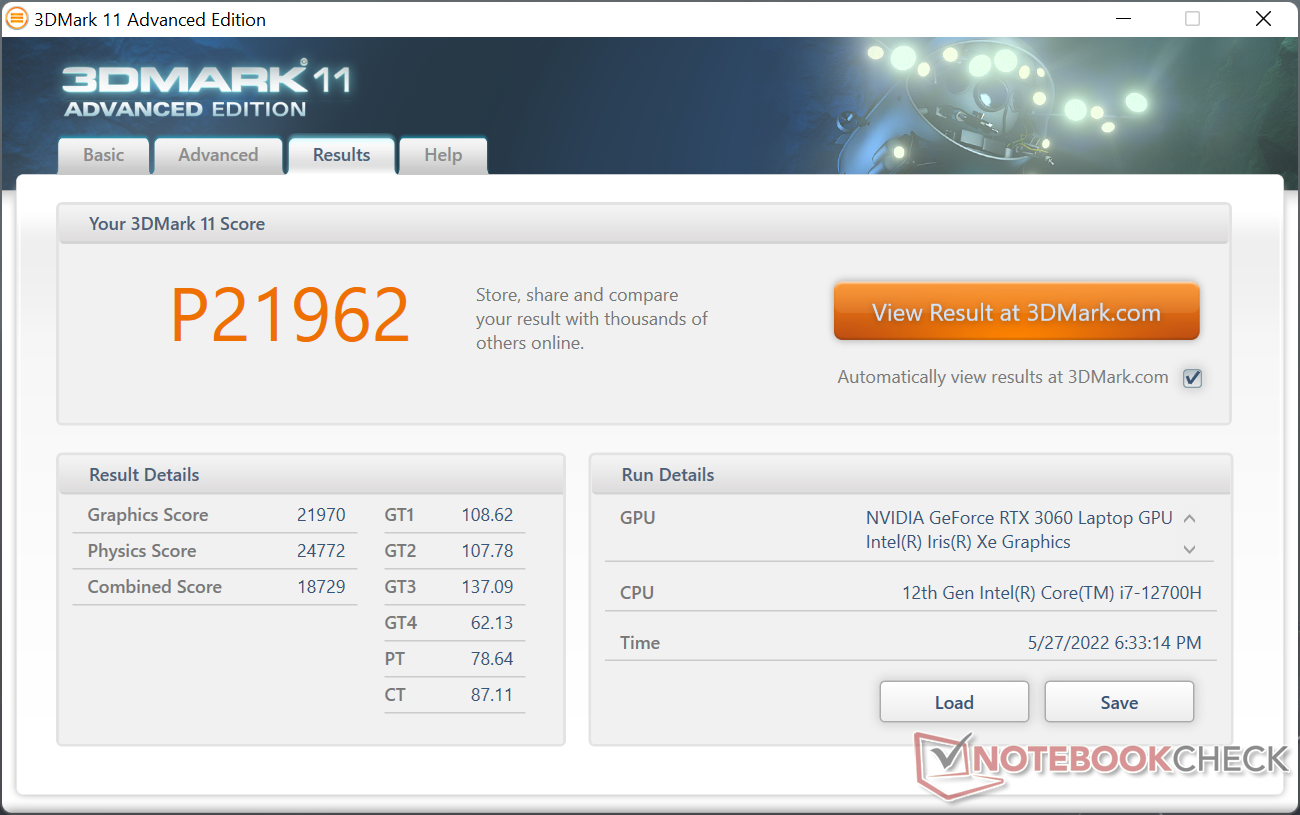
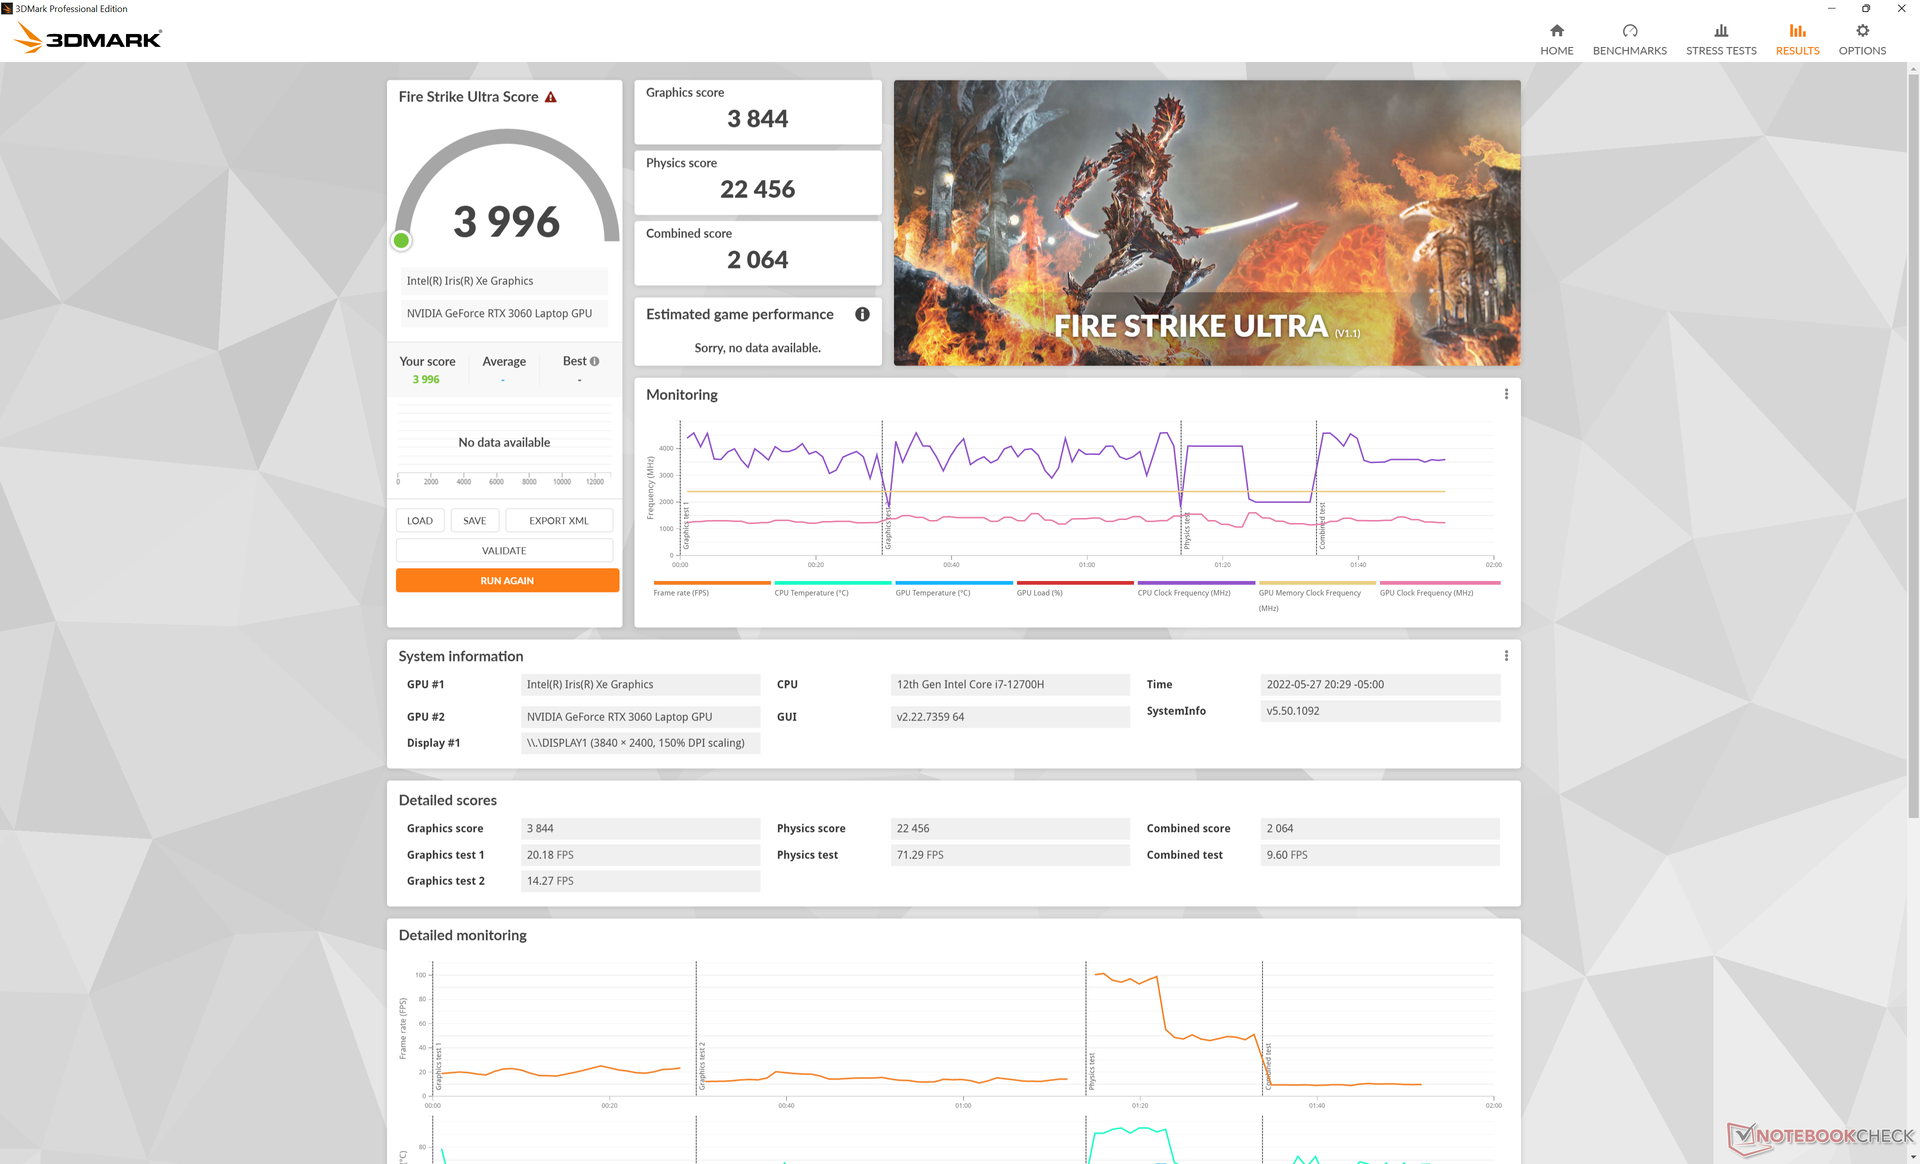
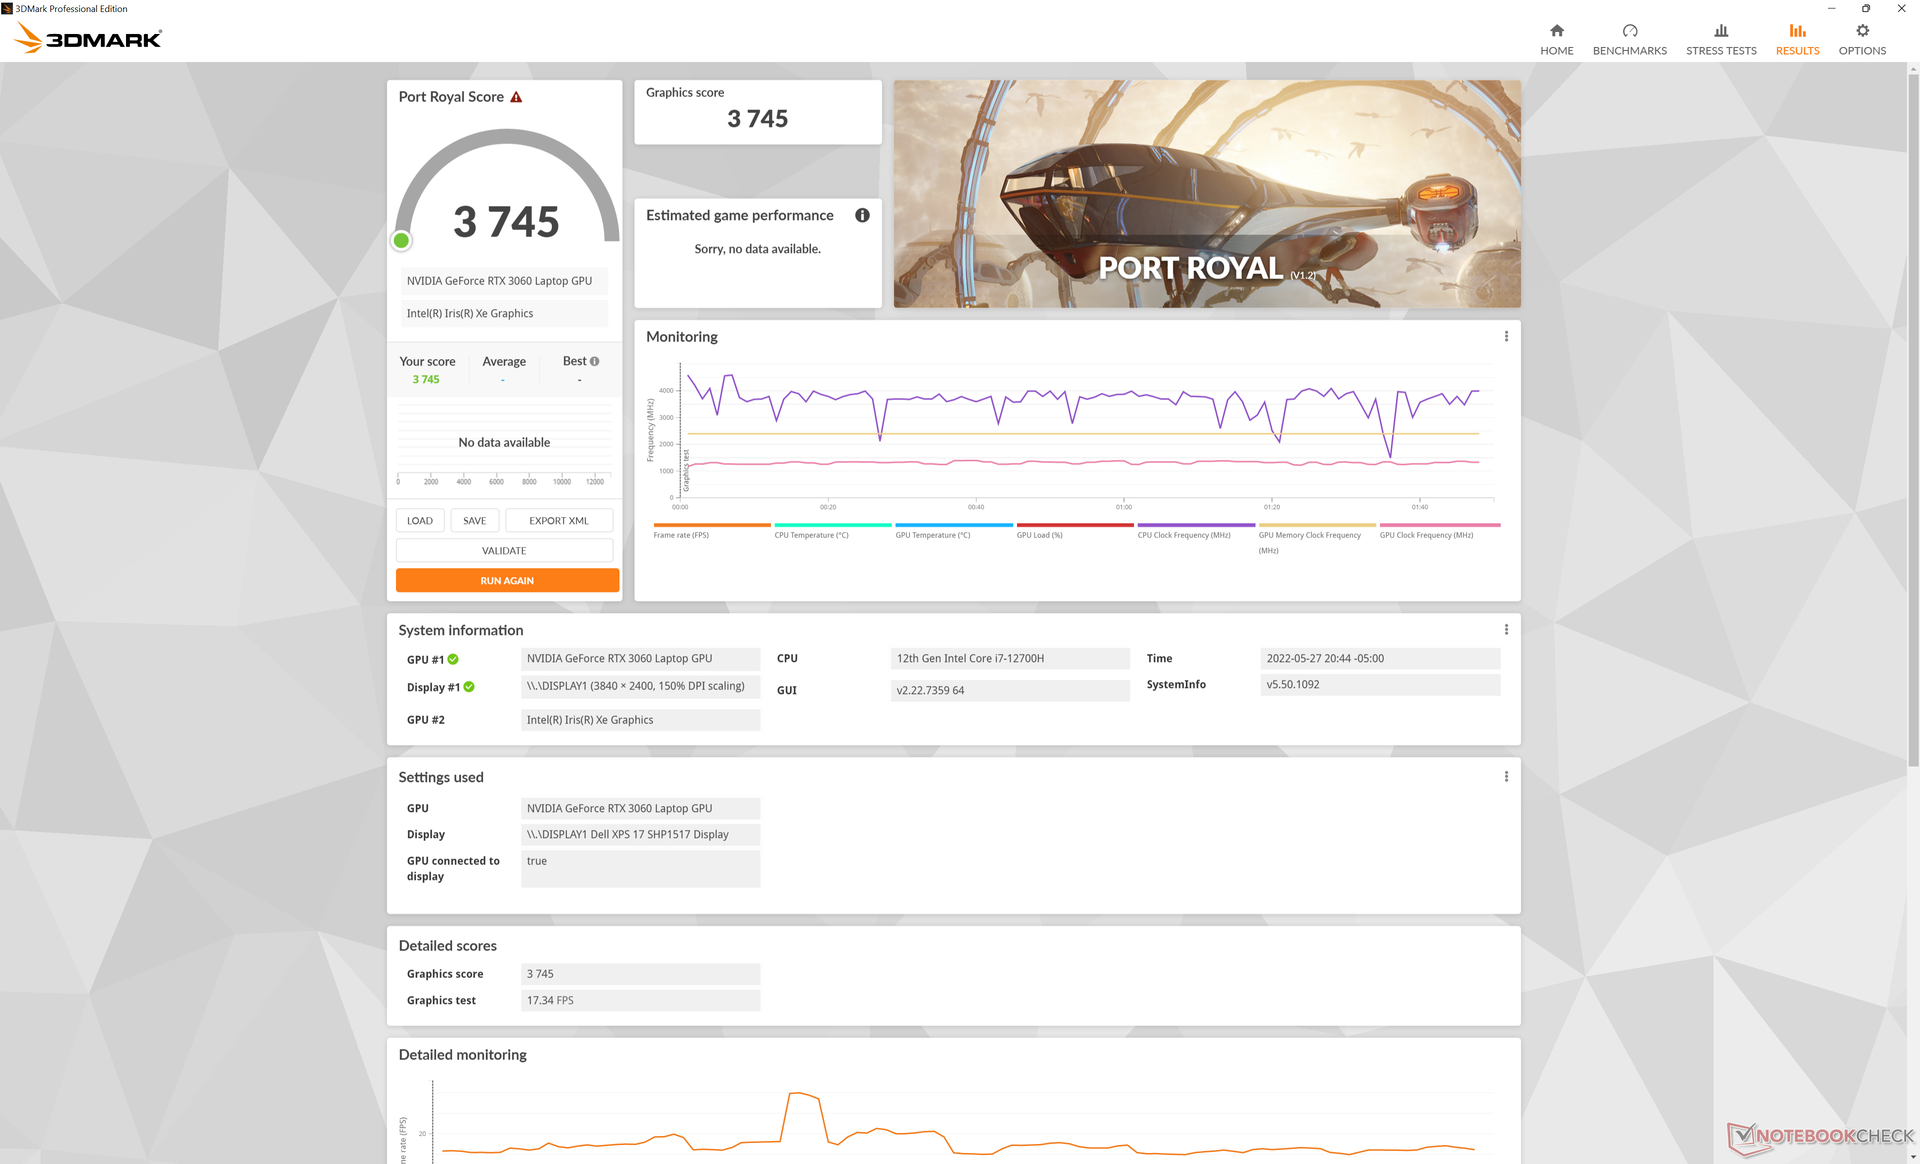
| 3DMark 11 Performance | 21962 punten | |
| 3DMark Cloud Gate Standard Score | 43738 punten | |
| 3DMark Fire Strike Score | 15062 punten | |
| 3DMark Time Spy Score | 6473 punten | |
Help | ||
Witcher 3 FPS Chart
| lage | gem. | hoge | ultra | QHD | 4K | |
|---|---|---|---|---|---|---|
| GTA V (2015) | 186.6 | 179 | 152.8 | 83.8 | 63.4 | |
| The Witcher 3 (2015) | 347.7 | 214.6 | 133.9 | 67.8 | ||
| Dota 2 Reborn (2015) | 185.7 | 169.9 | 163 | 133.5 | 84.6 | |
| Final Fantasy XV Benchmark (2018) | 137.9 | 90.5 | 69.3 | 49.1 | 28.3 | |
| X-Plane 11.11 (2018) | 133.3 | 111.6 | 93.8 | 92.3 | ||
| Strange Brigade (2018) | 352 | 162.6 | 130.6 | 113.4 | 82.3 | |
| Cyberpunk 2077 1.6 (2022) | 95.4 | 78.1 | 60 | 48.9 | 29 | 11.6 |
Emissies - Gaming Laptop Geluid en Temperaturen
Systeemgeluid
Het geluid en gedrag van de ventilator zijn niet veranderd sinds de oorspronkelijke XPS 17 9700, wat betekent dat het geluid van de ventilator nog steeds een top van bijna 50 db(A) haalt bij gaming of andere hoge belastingen. Het geluid is vergelijkbaar met dat van veel gaminglaptops onder dergelijke stressvolle omstandigheden.
De ventilatoren pulseren vrij snel van stil naar luidruchtig wanneer middelhoge tot hoge belastingen worden geïntroduceerd en daarom raden we het Quiet power profiel aan om het pulseren van de ventilator te beperken als de extra paardenkracht niet nodig is.
Geluidsniveau
| Onbelast |
| 24.1 / 24.1 / 24.1 dB (A) |
| Belasting |
| 43.2 / 48 dB (A) |
 | ||
30 dB stil 40 dB(A) hoorbaar 50 dB(A) luid |
||
min: | ||
| Dell XPS 17 9720 RTX 3060 GeForce RTX 3060 Laptop GPU, i7-12700H, Samsung PM9A1 MZVL21T0HCLR | HP Envy 17-cg GeForce MX450, i5-1135G7, Samsung PM991 MZVLQ1T0HALB | Dell XPS 17 9710 Core i7 RTX 3060 GeForce RTX 3060 Laptop GPU, i7-11800H, Micron 2300 1TB MTFDHBA1T0TDV | Dell XPS 17 9700 Core i7 RTX 2060 Max-Q GeForce RTX 2060 Max-Q, i7-10875H, Micron 2200S 1TB MTFDHBA1T0TCK | Lenovo Legion 5 17ACH6H-82JY0003GE GeForce RTX 3060 Laptop GPU, R5 5600H, Samsung PM991a MZALQ512HBLU | Asus VivoBook 17 F712JA-AU708W Iris Plus Graphics G7 (Ice Lake 64 EU), i7-1065G7, Kingston OM8PCP3512F-AB | Razer Blade 17 (i7-12800H, RTX 3070 Ti) GeForce RTX 3070 Ti Laptop GPU, i7-12800H, Samsung PM9A1 MZVL21T0HCLR | |
|---|---|---|---|---|---|---|---|
| Noise | -9% | -5% | -10% | -6% | -14% | 4% | |
| uit / omgeving * (dB) | 23.8 | 26 -9% | 25.5 -7% | 28 -18% | 25 -5% | 29.6 -24% | 23 3% |
| Idle Minimum * (dB) | 24.1 | 26 -8% | 25.2 -5% | 28 -16% | 25 -4% | 31.4 -30% | 23 5% |
| Idle Average * (dB) | 24.1 | 31.7 -32% | 25.2 -5% | 28 -16% | 25 -4% | 31.4 -30% | 23 5% |
| Idle Maximum * (dB) | 24.1 | 25.2 -5% | 28 -16% | 30.5 -27% | 31.4 -30% | 23 5% | |
| Load Average * (dB) | 43.2 | 43.2 -0% | 45.9 -6% | 43.2 -0% | 37.5 13% | 36.1 16% | 36.92 15% |
| Witcher 3 ultra * (dB) | 48 | 49 -2% | 49 -2% | 50 -4% | |||
| Load Maximum * (dB) | 48 | 46.6 3% | 50.4 -5% | 50.5 -5% | 51 -6% | 40.1 16% | 50 -4% |
* ... kleiner is beter
Temperatuur
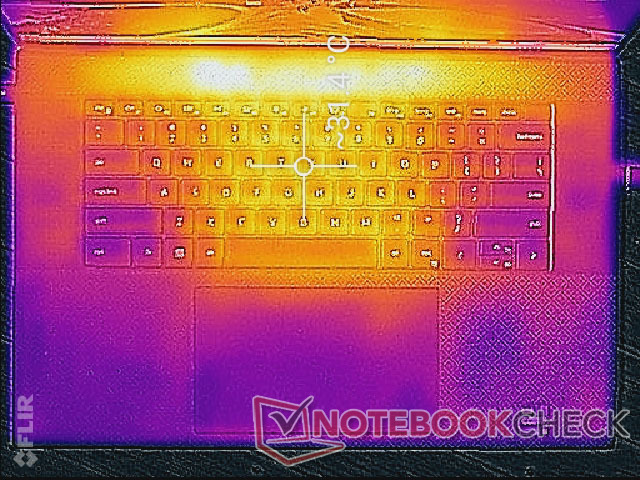
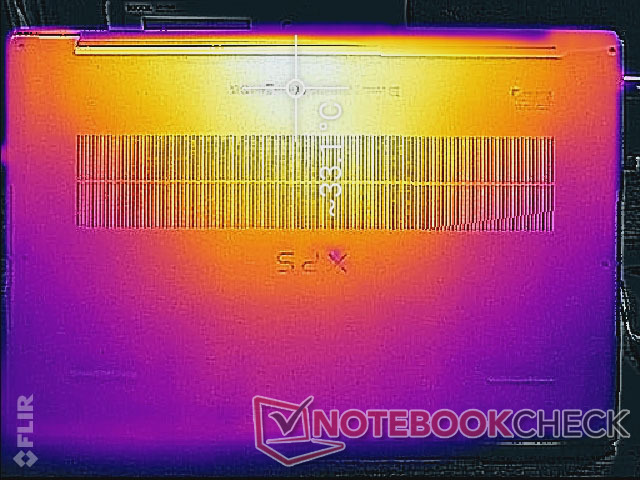
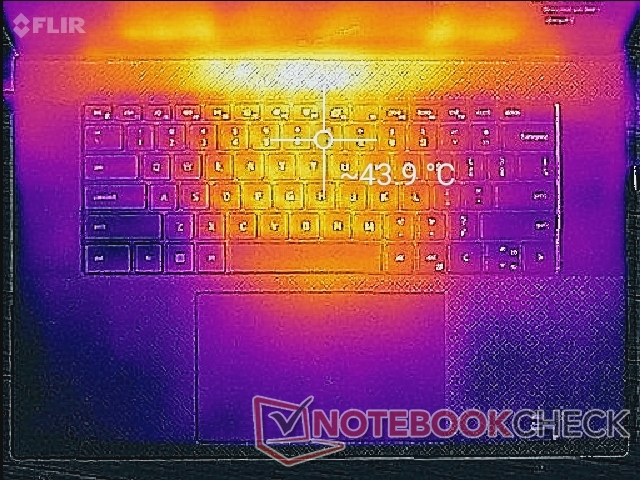
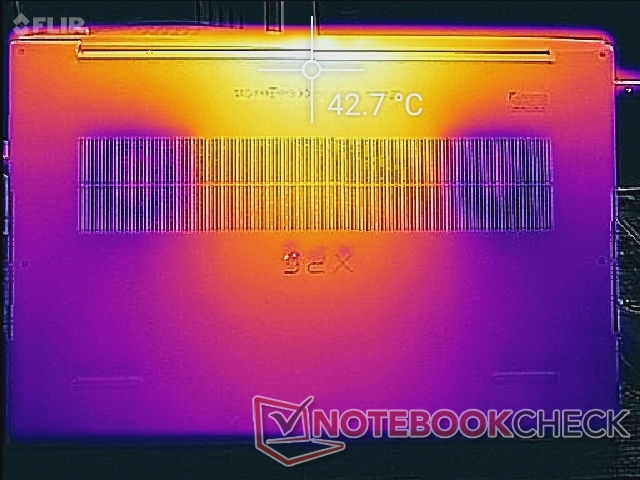
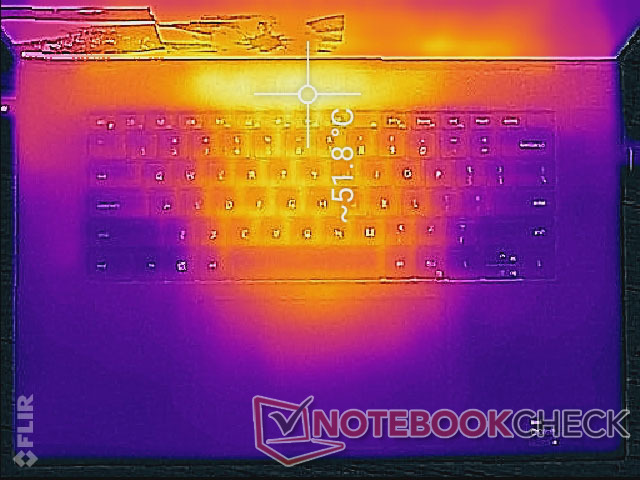
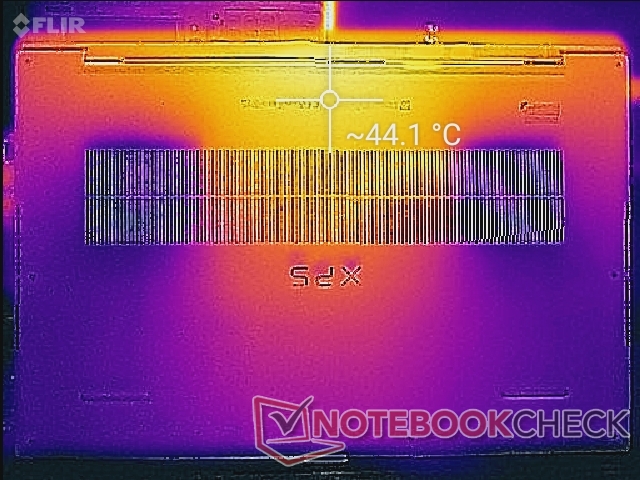
Hete plekken kunnen oplopen tot respectievelijk 52 C en 44 C aan de boven- en onderzijde, wanneer gedurende lange perioden zware belastingen worden uitgevoerd. Deze gebieden liggen strategisch aan de achterkant van het chassis en uit de buurt van de palmsteunen en de meeste toetsen. De onderzijde zal echter nog steeds erg warm aanvoelen, aangezien de bodemplaat uit één stuk metaal bestaat.
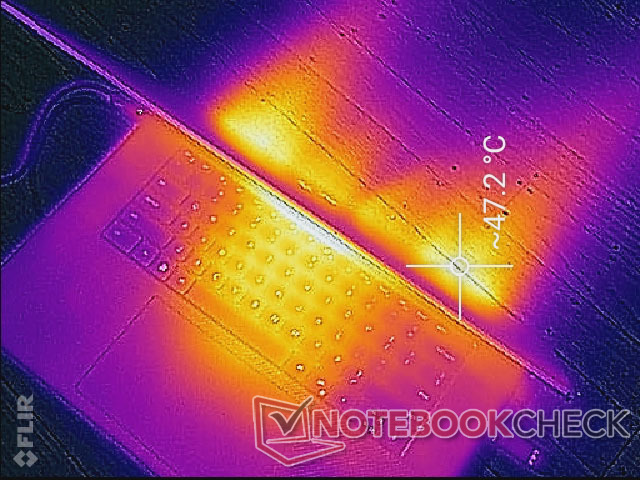
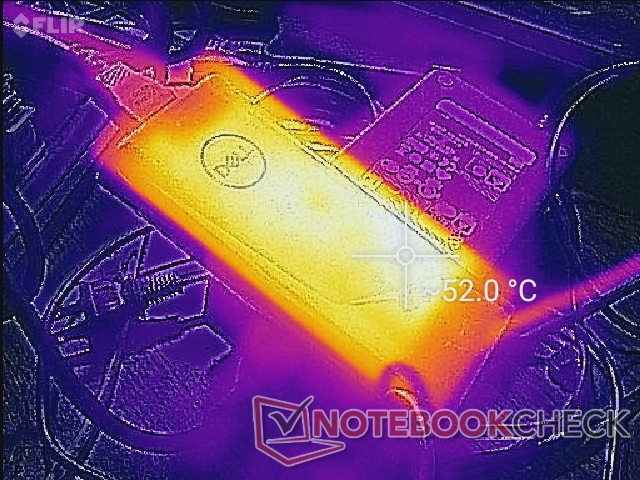
(-) De maximumtemperatuur aan de bovenzijde bedraagt 51.8 °C / 125 F, vergeleken met het gemiddelde van 36.8 °C / 98 F, variërend van 21 tot 71 °C voor de klasse Multimedia.
(±) De bodem warmt op tot een maximum van 44.2 °C / 112 F, vergeleken met een gemiddelde van 39.1 °C / 102 F
(+) Bij onbelast gebruik bedraagt de gemiddelde temperatuur voor de bovenzijde 28.6 °C / 83 F, vergeleken met het apparaatgemiddelde van 31.3 °C / 88 F.
(±) Bij het spelen van The Witcher 3 is de gemiddelde temperatuur voor de bovenzijde 33.9 °C / 93 F, vergeleken met het apparaatgemiddelde van 31.3 °C / 88 F.
(+) De handpalmsteunen en het touchpad bereiken maximaal de huidtemperatuur (33.2 °C / 91.8 F) en zijn dus niet heet.
(-) De gemiddelde temperatuur van de handpalmsteun van soortgelijke toestellen bedroeg 28.7 °C / 83.7 F (-4.5 °C / -8.1 F).
| Dell XPS 17 9720 RTX 3060 Intel Core i7-12700H, NVIDIA GeForce RTX 3060 Laptop GPU | HP Envy 17-cg Intel Core i5-1135G7, NVIDIA GeForce MX450 | Dell XPS 17 9710 Core i7 RTX 3060 Intel Core i7-11800H, NVIDIA GeForce RTX 3060 Laptop GPU | Dell XPS 17 9700 Core i7 RTX 2060 Max-Q Intel Core i7-10875H, NVIDIA GeForce RTX 2060 Max-Q | Lenovo Legion 5 17ACH6H-82JY0003GE AMD Ryzen 5 5600H, NVIDIA GeForce RTX 3060 Laptop GPU | Asus VivoBook 17 F712JA-AU708W Intel Core i7-1065G7, Intel Iris Plus Graphics G7 (Ice Lake 64 EU) | Razer Blade 17 (i7-12800H, RTX 3070 Ti) Intel Core i7-12800H, NVIDIA GeForce RTX 3070 Ti Laptop GPU | |
|---|---|---|---|---|---|---|---|
| Heat | 14% | 1% | -1% | 2% | 12% | 6% | |
| Maximum Upper Side * (°C) | 51.8 | 45.9 11% | 50.2 3% | 53 -2% | 42.2 19% | 40.2 22% | 43 17% |
| Maximum Bottom * (°C) | 44.2 | 49.7 -12% | 38.4 13% | 39.2 11% | 50.9 -15% | 47.9 -8% | 44 -0% |
| Idle Upper Side * (°C) | 34.8 | 24.2 30% | 37.6 -8% | 37 -6% | 34.3 1% | 27.3 22% | 32 8% |
| Idle Bottom * (°C) | 33.2 | 24.8 25% | 34.2 -3% | 35.8 -8% | 32 4% | 28.9 13% | 34 -2% |
* ... kleiner is beter
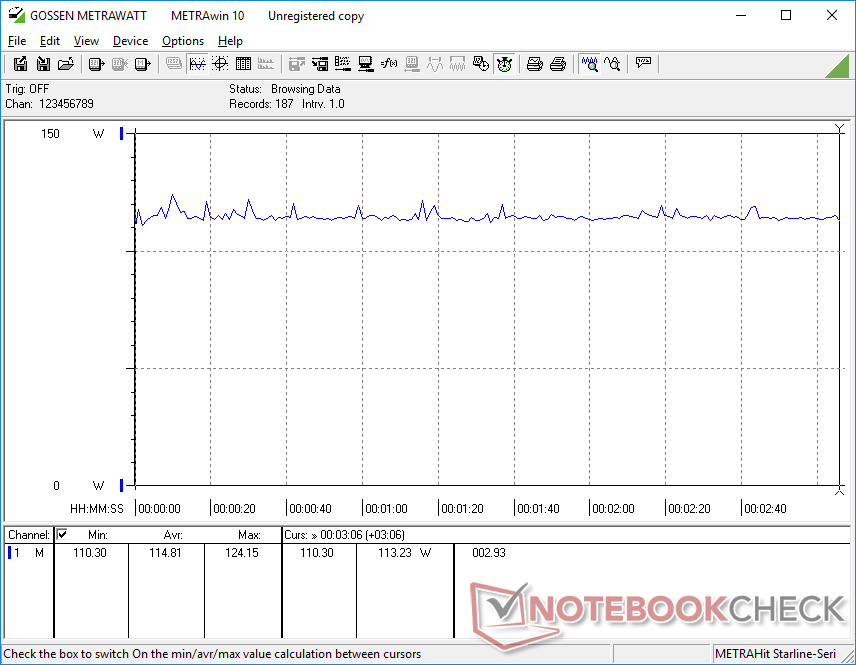
Stresstest
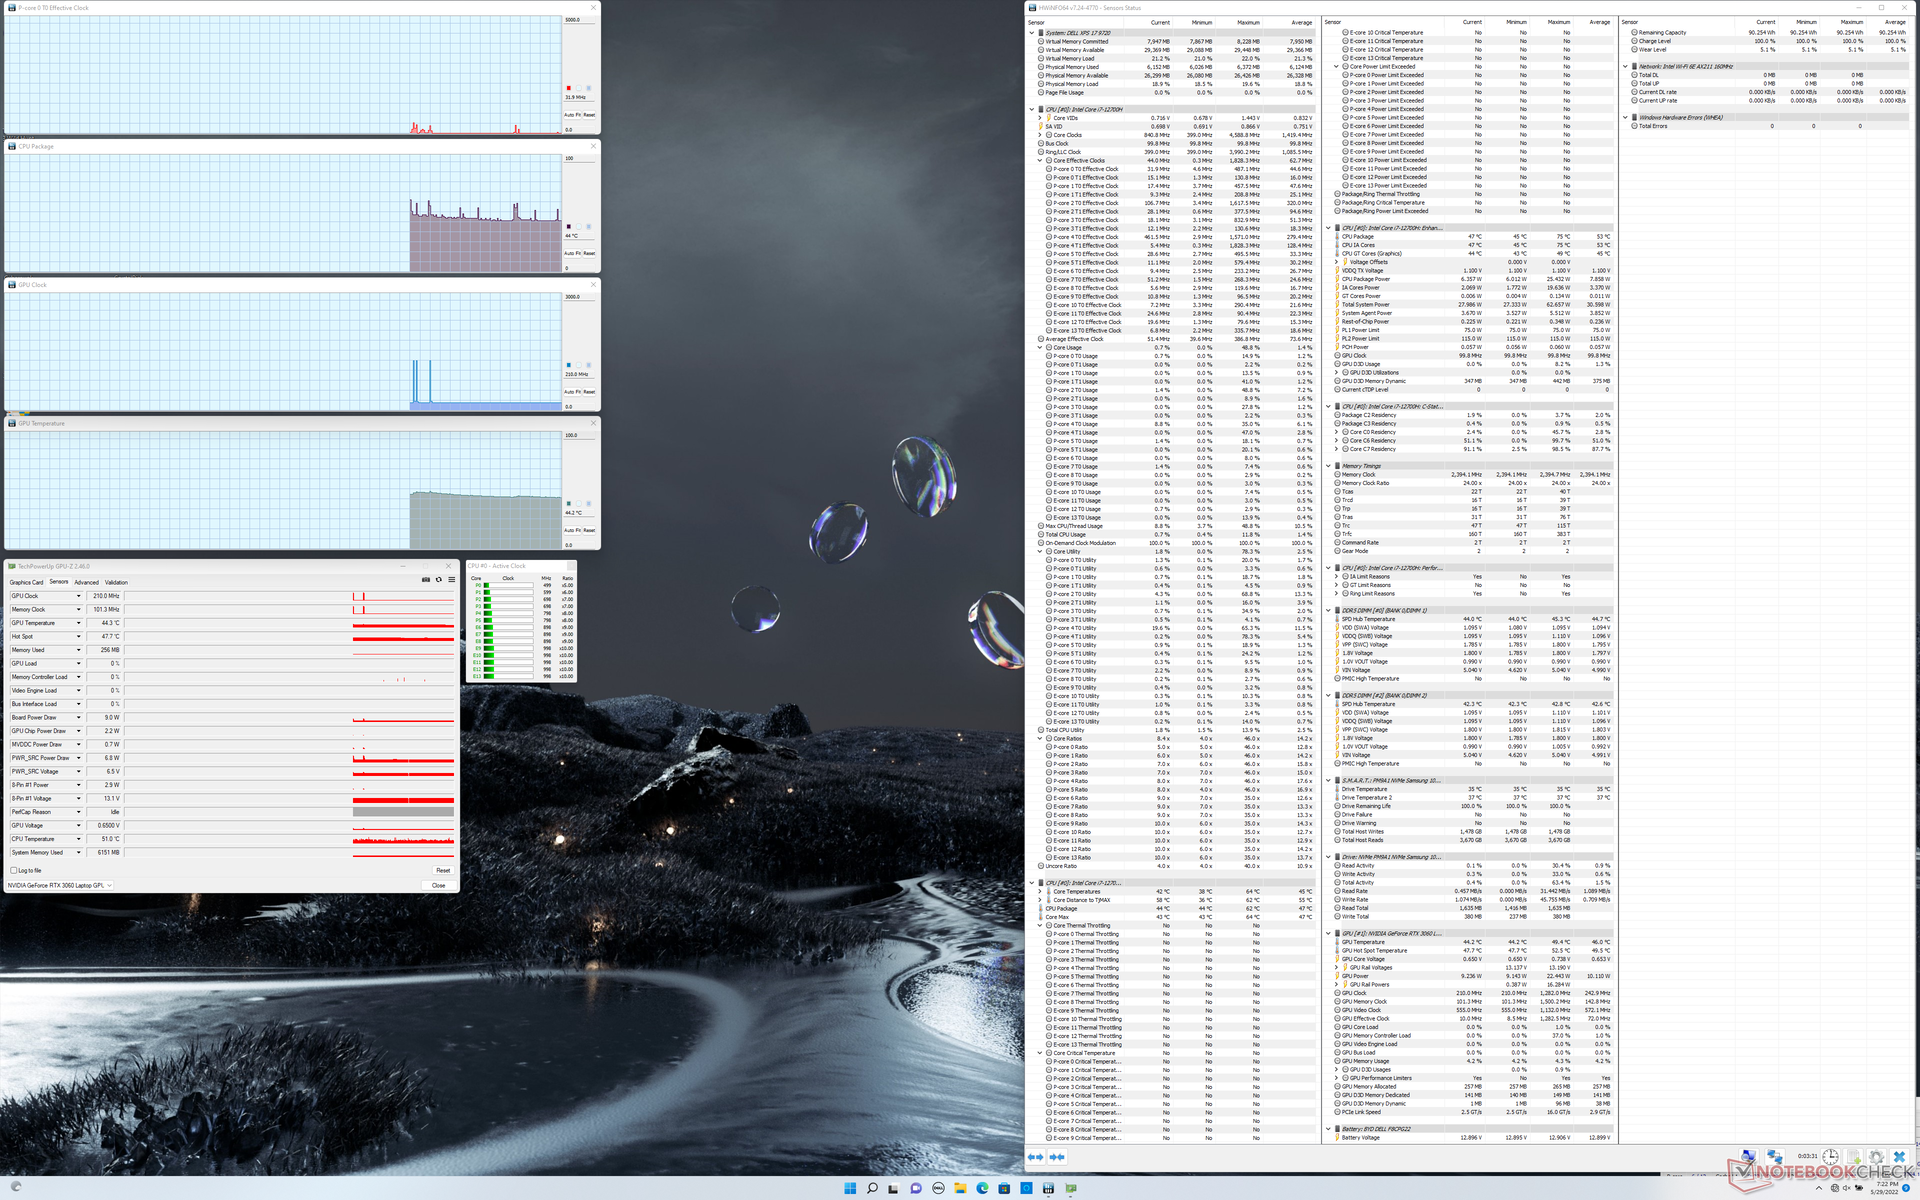
Onder belasting van Prime95 accelereert de CPU gedurende ongeveer 10 tot 15 seconden naar 3,8 GHz, 100 C en 115 W, om vervolgens te dalen en te stabiliseren op 2,5 GHz, 75 C en 55 W. Vergeleken met de Core i7-11800H XPS 17 9710 kan onze 9720-eenheid een hoger initieel stroomverbruik bereiken (115 W vs. 87 W), terwijl hij stabiliseert op een koelere kerntemperatuur (75 C vs. 82 C) en bij een identiek stroomverbruik (55 W). Het XPS-systeem kan dus slechts korte tijd profiteren van de hogere TDP-waarden of kloksnelheden van het Alder Lake platform voordat thermische beperkingen optreden.
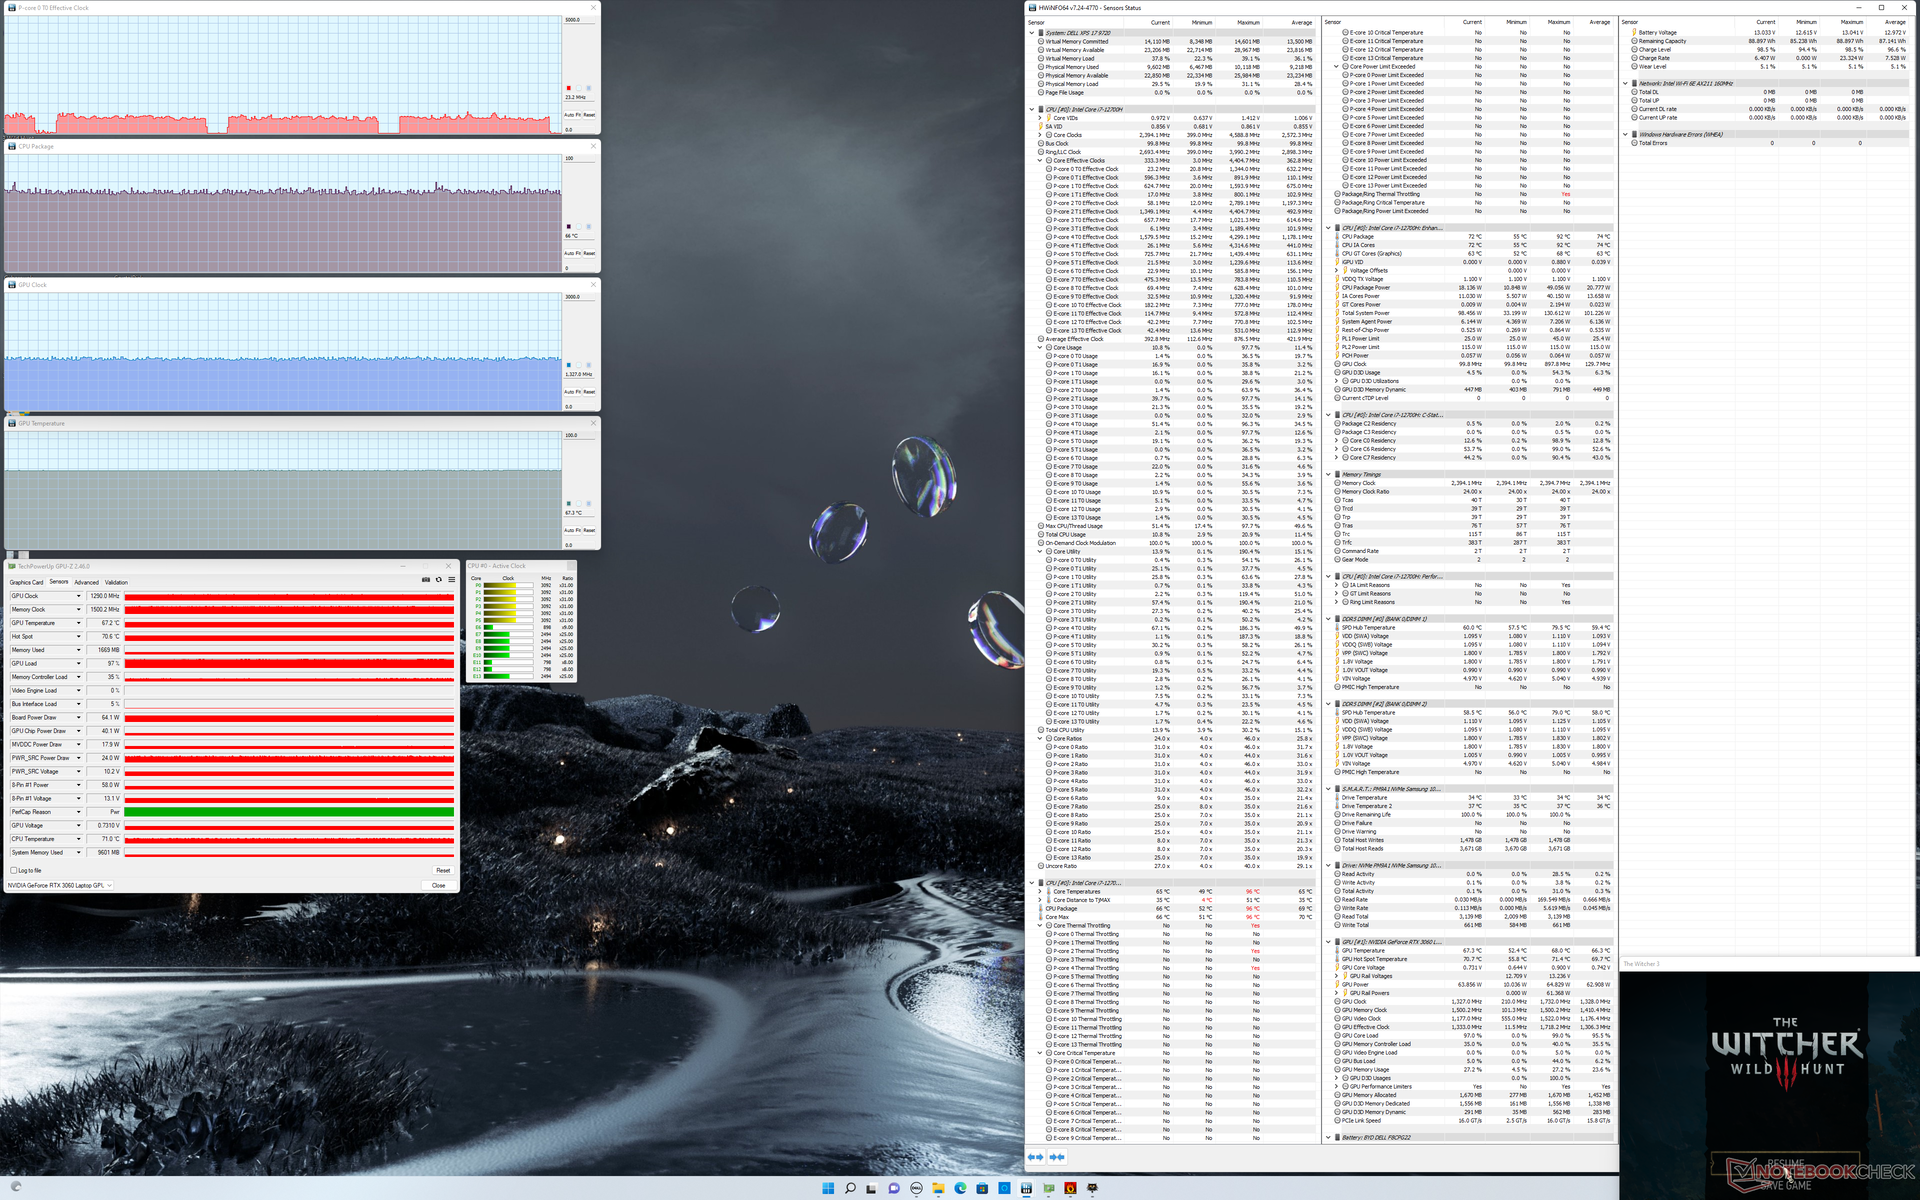
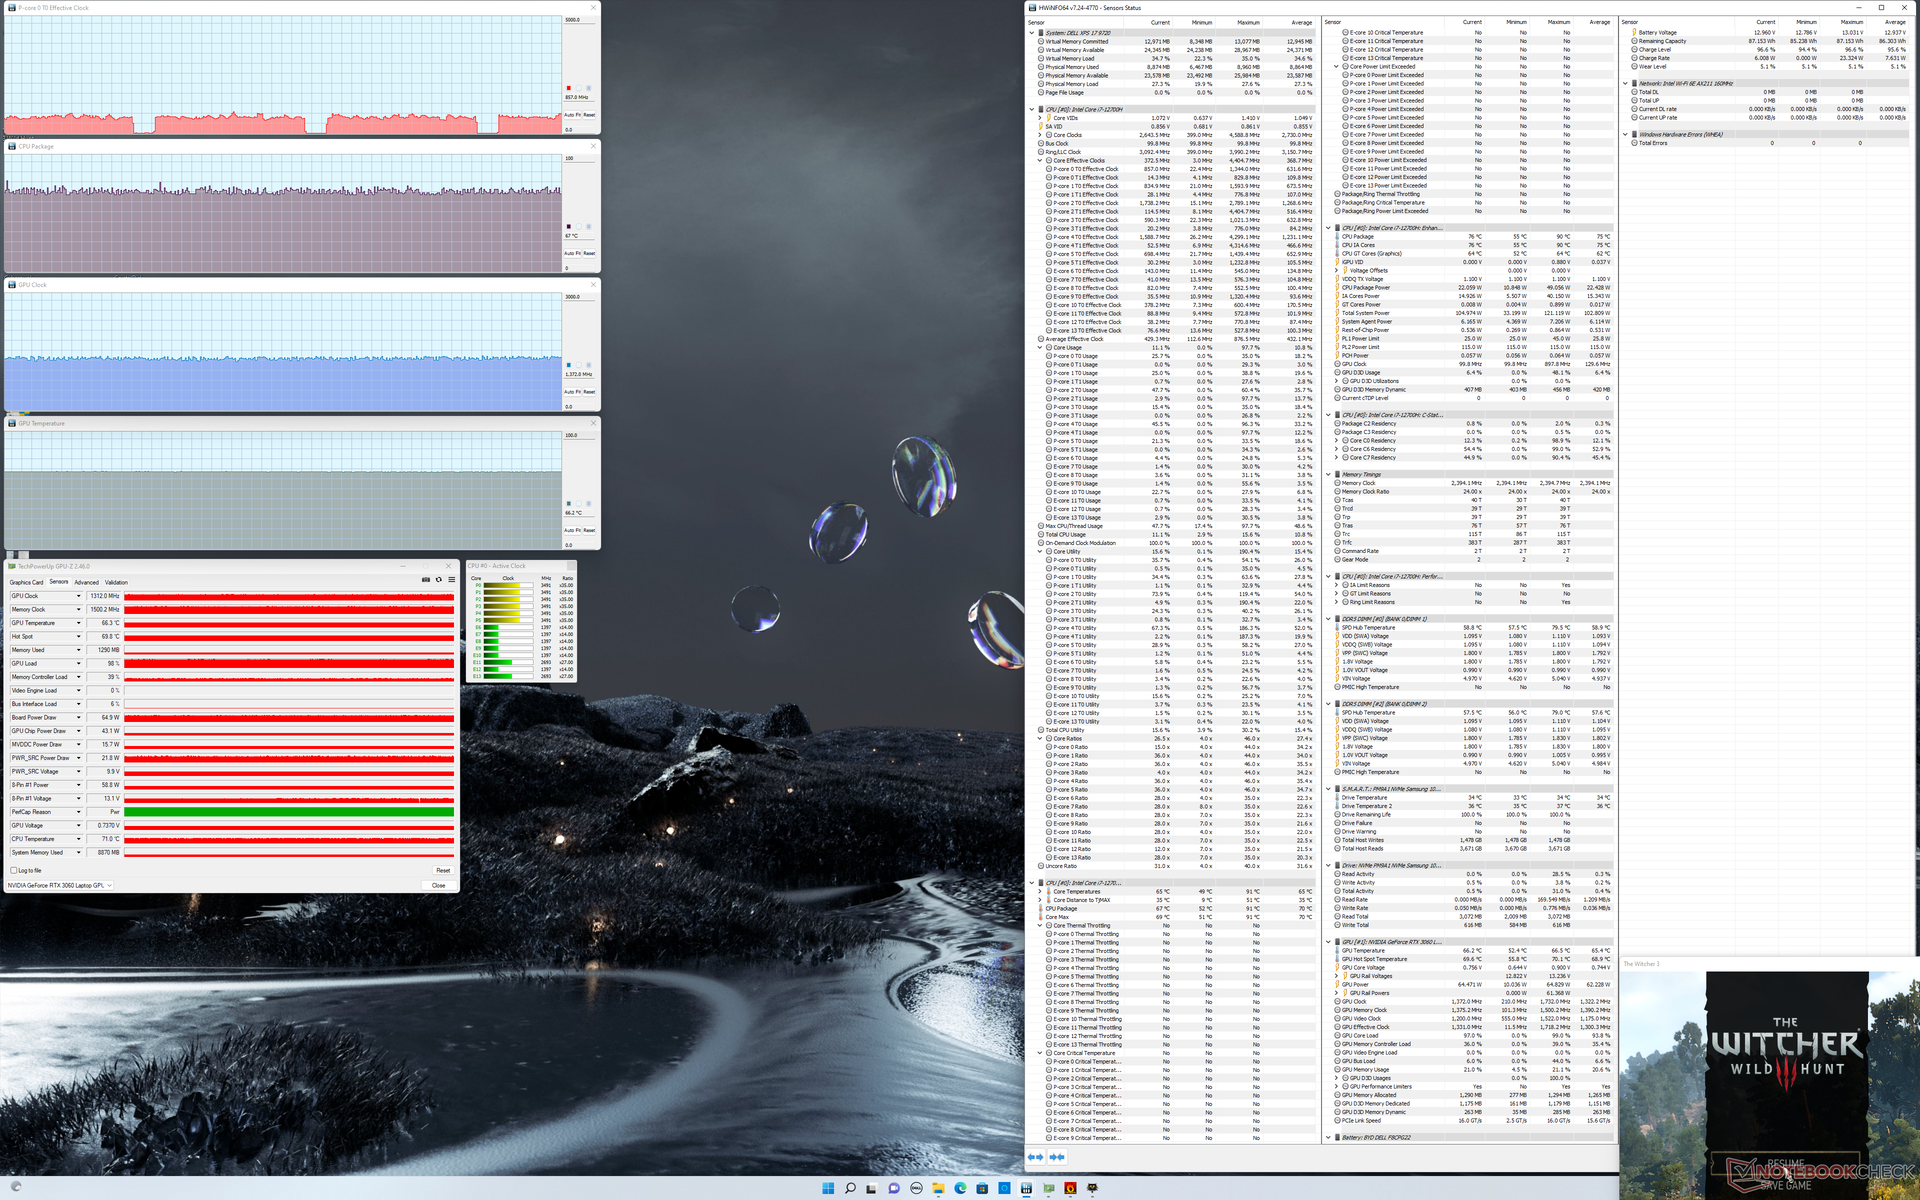
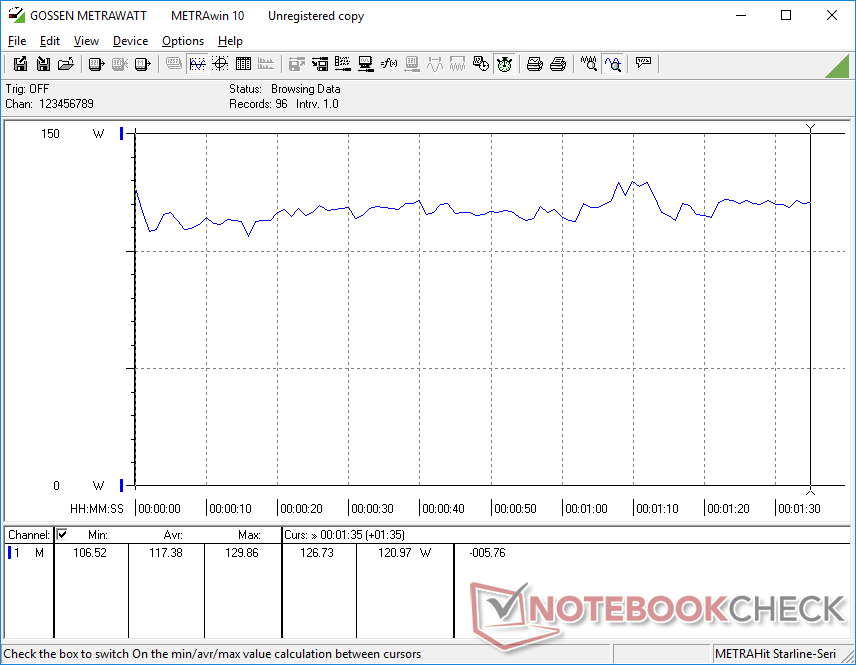
GPU kloksnelheden, temperatuur, en stroomverbruik van het bord tijdens het draaien Witcher 3 zouden stabiliseren op respectievelijk 1312 MHz, 66 C en 65 W, vergeleken met 1530 MHz, 67 C en 69 W op de XPS 17 9710. De algehele langzamere grafische prestaties ten opzichte van vorig jaar weerspiegelen onze slechtere 3DMark-resultaten die we hierboven hebben genoteerd.
De GPU prestatiewinst bij gebruik in de Ultra Performance modus versus de Optimized modus lijkt verwaarloosbaar.
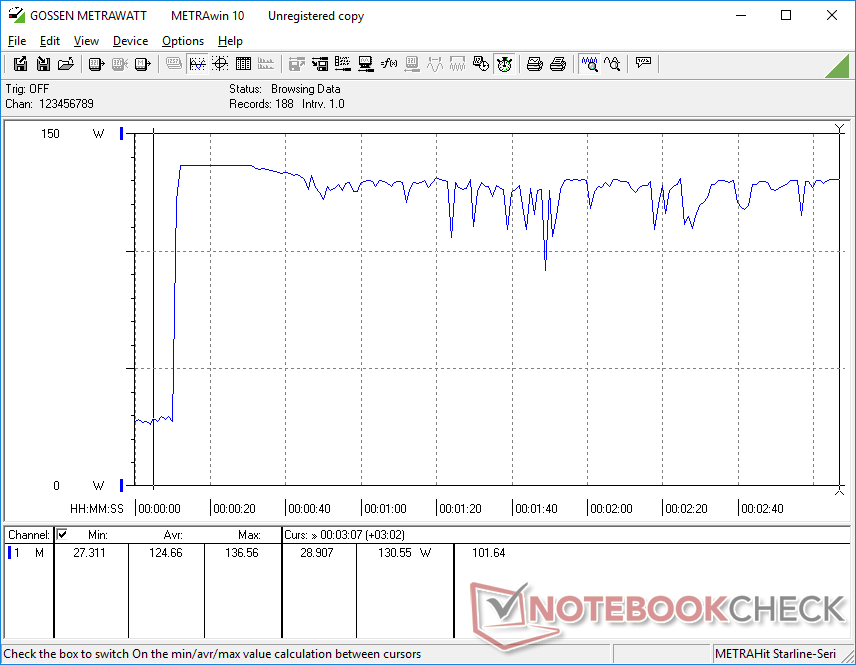
Het werken op batterijen beperkt zowel CPU als GPU prestaties. Een Fire Strike test op batterijvoeding zou een Physics en Graphics score opleveren van respectievelijk 14770 en 24927 punten, vergeleken met 16354 en 23563 punten op netstroom.
| CPU Klok (GHz) | GPU Klok (MHz) | Gemiddelde CPU Temperatuur (°C) | Gemiddelde GPU Temperatuur (°C) | |
| Systeem in rusttoestand | -- | -- | 44 | 44 |
| Prime95 Stress | 2.5 | -- | 75 | 59 |
| Prime95 + FurMark Stress | ||||
| Witcher 3 Stress(geoptimaliseerde modus) | ~0.7 | 1290 | 66 | 67 |
| Witcher 3 Stress(Ultra Performance-modus) | ~0.8 | 1312 | 67 | 66 |
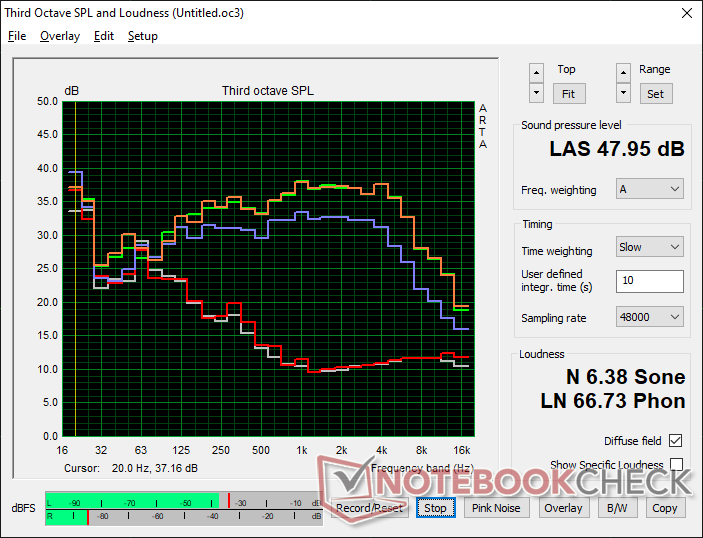
Sprekers
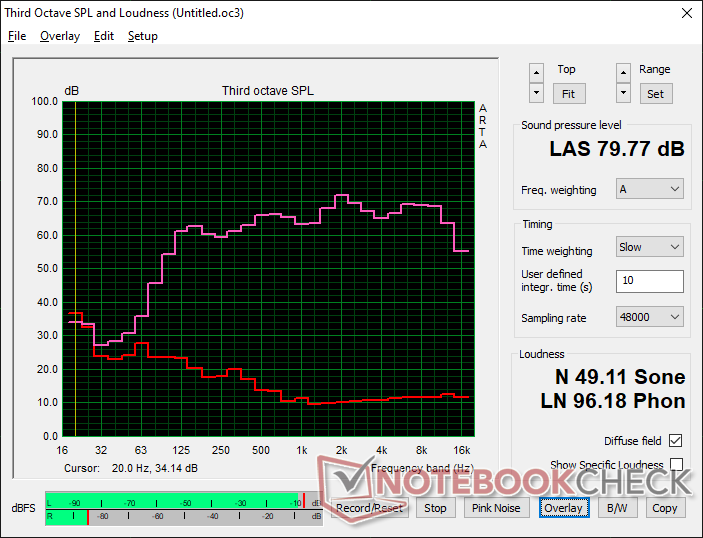
Dell XPS 17 9720 RTX 3060 audioanalyse
(±) | luidspreker luidheid is gemiddeld maar goed (79.8 dB)
Bas 100 - 315 Hz
(±) | verminderde zeebaars - gemiddeld 5.2% lager dan de mediaan
(±) | lineariteit van de lage tonen is gemiddeld (7% delta ten opzichte van de vorige frequentie)
Midden 400 - 2000 Hz
(+) | evenwichtige middens - slechts 2.2% verwijderd van de mediaan
(+) | de middentonen zijn lineair (3.8% delta ten opzichte van de vorige frequentie)
Hoog 2 - 16 kHz
(+) | evenwichtige hoogtepunten - slechts 2.8% verwijderd van de mediaan
(+) | de hoge tonen zijn lineair (3.1% delta naar de vorige frequentie)
Algemeen 100 - 16.000 Hz
(+) | het totale geluid is lineair (8.3% verschil met de mediaan)
Vergeleken met dezelfde klasse
» 9% van alle geteste apparaten in deze klasse waren beter, 2% vergelijkbaar, 89% slechter
» De beste had een delta van 5%, het gemiddelde was 17%, de slechtste was 45%
Vergeleken met alle geteste toestellen
» 2% van alle geteste apparaten waren beter, 1% gelijk, 97% slechter
» De beste had een delta van 4%, het gemiddelde was 23%, de slechtste was 134%
Apple MacBook Pro 16 2021 M1 Pro audioanalyse
(+) | luidsprekers kunnen relatief luid spelen (84.7 dB)
Bas 100 - 315 Hz
(+) | goede baars - slechts 3.8% verwijderd van de mediaan
(+) | de lage tonen zijn lineair (5.2% delta naar de vorige frequentie)
Midden 400 - 2000 Hz
(+) | evenwichtige middens - slechts 1.3% verwijderd van de mediaan
(+) | de middentonen zijn lineair (2.1% delta ten opzichte van de vorige frequentie)
Hoog 2 - 16 kHz
(+) | evenwichtige hoogtepunten - slechts 1.9% verwijderd van de mediaan
(+) | de hoge tonen zijn lineair (2.7% delta naar de vorige frequentie)
Algemeen 100 - 16.000 Hz
(+) | het totale geluid is lineair (4.6% verschil met de mediaan)
Vergeleken met dezelfde klasse
» 0% van alle geteste apparaten in deze klasse waren beter, 0% vergelijkbaar, 100% slechter
» De beste had een delta van 5%, het gemiddelde was 17%, de slechtste was 45%
Vergeleken met alle geteste toestellen
» 0% van alle geteste apparaten waren beter, 0% gelijk, 100% slechter
» De beste had een delta van 4%, het gemiddelde was 23%, de slechtste was 134%
Energiebeheer - Hoger stroomverbruik van Turbo Boost
Stroomverbruik
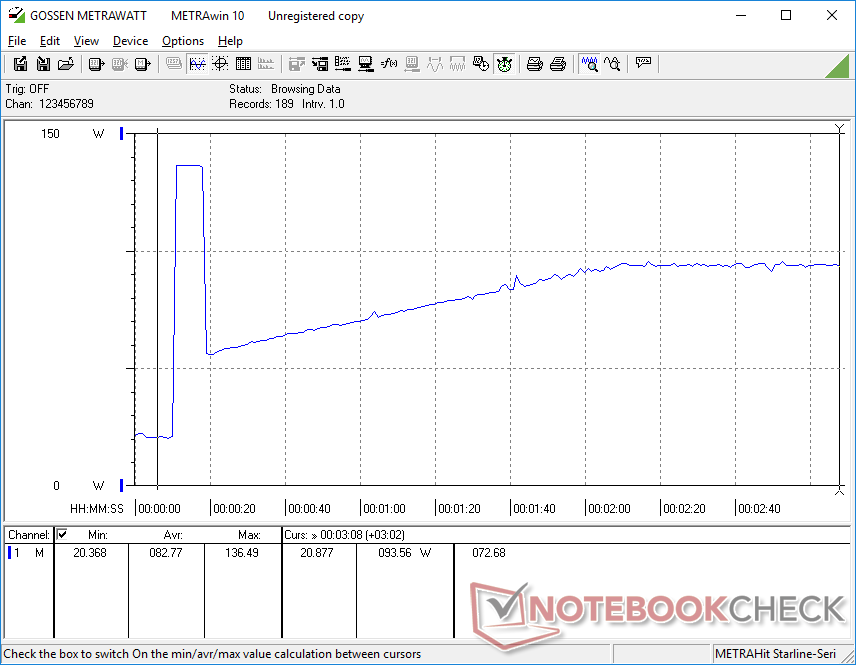
De XPS 17 9700 vertoonde oplaadproblemen waarbij het systeem niet in staat was meer dan 100 W te onttrekken aan de 130 W AC-adapter. Gelukkig pakte Dell het probleem aan bij de opvolger, de XPS 17 9710, en de 9720 is niet anders. Wanneer we Witcher 3trok onze 9720 unit 115 W en dat is bijna identiek aan wat we op de oudere 9710 registreerden. De XPS 15-serie en XPS 17-serie zijn nog steeds de enige modellen op de markt die worden geleverd met een 130 W USB-C-adapter.
Met name het stroomverbruik tijdens het uitvoeren van Prime95 is iets hoger dan op de 9710 tijdens het begin van de test, voordat het stabiliseert op ongeveer 94 W elk. Het hogere stroomverbruik van de 12e gen CPU is dus van korte duur voordat het vergelijkbaar wordt met het 9710 model met 11e gen processors
Het opladen wordt aanzienlijk vertraagd tijdens gamen of het uitvoeren van hoge belastingen. Bij gebruik Witcher 3 op 13 procent batterijcapaciteit en op netvoeding, bijvoorbeeld, zou de batterij slechts met nog eens 12 procent toenemen in de loop van een uur.
| Uit / Standby | |
| Inactief | |
| Belasting |
|
Key:
min: | |
| Dell XPS 17 9720 RTX 3060 i7-12700H, GeForce RTX 3060 Laptop GPU, Samsung PM9A1 MZVL21T0HCLR, IPS, 3840x2400, 17" | HP Envy 17-cg i5-1135G7, GeForce MX450, Samsung PM991 MZVLQ1T0HALB, IPS, 1920x1080, 17.3" | Dell XPS 17 9710 Core i7 RTX 3060 i7-11800H, GeForce RTX 3060 Laptop GPU, Micron 2300 1TB MTFDHBA1T0TDV, IPS, 3840x2400, 17" | Dell XPS 17 9700 Core i7 RTX 2060 Max-Q i7-10875H, GeForce RTX 2060 Max-Q, Micron 2200S 1TB MTFDHBA1T0TCK, IPS, 3840x2400, 17" | Lenovo Legion 5 17ACH6H-82JY0003GE R5 5600H, GeForce RTX 3060 Laptop GPU, Samsung PM991a MZALQ512HBLU, IPS, 1920x1080, 17.3" | Asus VivoBook 17 F712JA-AU708W i7-1065G7, Iris Plus Graphics G7 (Ice Lake 64 EU), Kingston OM8PCP3512F-AB, IPS, 1920x1080, 17.3" | Razer Blade 17 (i7-12800H, RTX 3070 Ti) i7-12800H, GeForce RTX 3070 Ti Laptop GPU, Samsung PM9A1 MZVL21T0HCLR, IPS, 2560x1440, 17.3" | |
|---|---|---|---|---|---|---|---|
| Power Consumption | 46% | 3% | 7% | -40% | 61% | -54% | |
| Idle Minimum * (Watt) | 5.9 | 3.8 36% | 7.5 -27% | 5.8 2% | 15.6 -164% | 4.2 29% | 14.4 -144% |
| Idle Average * (Watt) | 15.8 | 9.4 41% | 15.7 1% | 20.6 -30% | 20.7 -31% | 7.9 50% | 20 -27% |
| Idle Maximum * (Watt) | 26.7 | 10.1 62% | 23.1 13% | 21 21% | 22.9 14% | 8.8 67% | 21.5 19% |
| Load Average * (Watt) | 117.4 | 64.4 45% | 87.2 26% | 104.7 11% | 134 -14% | 29.7 75% | 119 -1% |
| Witcher 3 ultra * (Watt) | 114.8 | 64.4 44% | 116 -1% | 99.2 14% | 135 -18% | 28.8 75% | 218 -90% |
| Load Maximum * (Watt) | 136.6 | 68 50% | 131.6 4% | 107.6 21% | 170 -24% | 44 68% | 248 -82% |
* ... kleiner is beter
Power Consumption Witcher 3 / Stresstest
Power Consumption external Monitor
Levensduur batterij
De runtimes zijn niet significant veranderd ten opzichte van de vorige generatie 9710 of 9700 modellen. Verwacht iets minder dan 9 uur WLAN-gebruik in de praktijk bij gebruik van het Balanced of Optimized energieprofiel met de geïntegreerde GPU actief. Opladen van leeg naar volledig duurt iets meer dan 2 uur, ervan uitgaande dat u geen veeleisende toepassingen uitvoert zoals hierboven vermeld.
| Dell XPS 17 9720 RTX 3060 i7-12700H, GeForce RTX 3060 Laptop GPU, 97 Wh | HP Envy 17-cg i5-1135G7, GeForce MX450, 55.67 Wh | Dell XPS 17 9710 Core i7 RTX 3060 i7-11800H, GeForce RTX 3060 Laptop GPU, 97 Wh | Dell XPS 17 9700 Core i7 RTX 2060 Max-Q i7-10875H, GeForce RTX 2060 Max-Q, 97 Wh | Lenovo Legion 5 17ACH6H-82JY0003GE R5 5600H, GeForce RTX 3060 Laptop GPU, 80 Wh | Asus VivoBook 17 F712JA-AU708W i7-1065G7, Iris Plus Graphics G7 (Ice Lake 64 EU), 32 Wh | Razer Blade 17 (i7-12800H, RTX 3070 Ti) i7-12800H, GeForce RTX 3070 Ti Laptop GPU, 82 Wh | |
|---|---|---|---|---|---|---|---|
| Batterijduur | 46% | 74% | 56% | 21% | 11% | 24% | |
| WiFi v1.3 (h) | 8.7 | 7.9 -9% | 7.6 -13% | 9.7 11% | 4.4 -49% | 4.4 -49% | 5.9 -32% |
| Load (h) | 1 | 2 100% | 2.6 160% | 2 100% | 1.9 90% | 1.7 70% | 1.8 80% |
| Reader / Idle (h) | 17.7 | 17.7 | 23.8 | 5.5 | |||
| H.264 (h) | 3.5 | 4.9 |
Pro
Contra
Verdict - Alles over die CPU
Er valt weinig te klagen over de vernieuwde CPU. Hoewel het waar is dat het Alder Lake-platform erg energieverslindend kan zijn, zijn de prestatieverbeteringen op zijn minst respectabel. Krachtige gebruikers die weten dat ze de extra prestaties kunnen benutten, zullen de afweging in dit opzicht zeker waarderen.
De Dell XPS 17 9720 introduceert een gloednieuwe processor met aanzienlijke prestatieverbeteringen ten opzichte van oudere 10th gen en 11th gen opties. Buiten de CPU blijven echter dezelfde nadelen van de XPS 17 9710 of 9700 bestaan.
Helaas zijn er een paar kleine nadelen die twee jaar na dit ontwerp nog moeten worden aangepakt. De videokwaliteit van de webcam blijft slecht, het opladen gaat beduidend langzamer bij veeleisende belastingen, het deksel is moeilijk te openen met zijn slechte grip, en er is nog steeds geen webcam privacy shutter of Wi-Fi 6E ondersteuning. Het feit dat de GPU schijnbaar uit het niets een klap heeft gekregen, kan voor XPS-liefhebbers een harde pil zijn om te slikken. De grootste voordelen van de XPS 17 9720 in vergelijking met alternatieven met meer mogelijkheden zoals de Gigabyte Aero 17 zijn nog steeds de compactere afmetingen van het chassis en de 16:10 beeldverhouding.
Prijs en beschikbaarheid
Amazon heeft op dit moment slechts één XPS 17 9720 SKU beschikbaar voor $2250 USD met de Core i7-12700H, GeForce RTX 3050, en 1200p beeldscherm. Voor meer opties kunnen gebruikers rechtstreeks bij Dell bestellen in plaats daarvan.
Dell XPS 17 9720 RTX 3060
- 31-05-2022 v7 (old)
Allen Ngo
Price comparison

