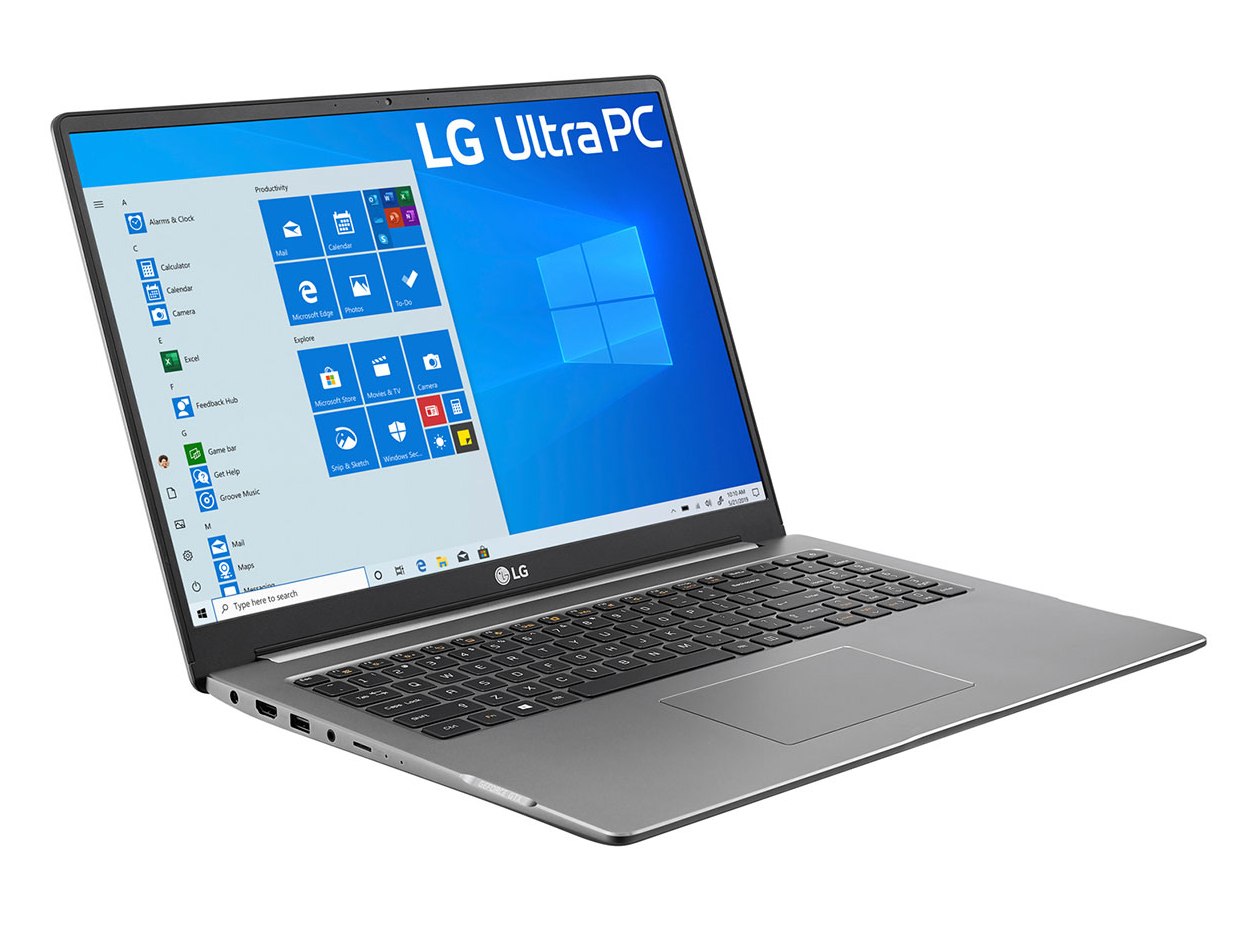
Kort testrapport LG Ultra 17 Laptop: Zoals een Dell XPS 17, maar slechter
Evaluatie | Datum | Model | Gewicht | Hoogte | Formaat | Resolutie | Beste prijs |
|---|---|---|---|---|---|---|---|
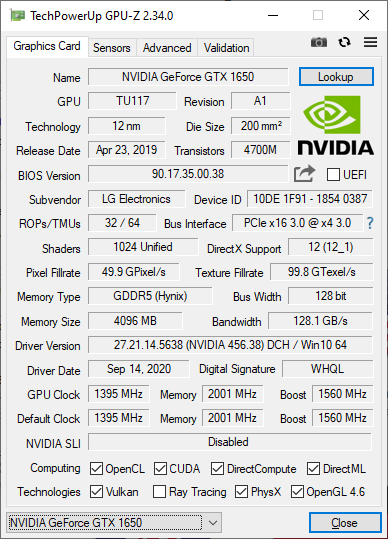
| 82.8 % v7 (old) | 09-2020 | LG Ultra 17U70N i5-10210U, GeForce GTX 1650 Mobile | 2 kg | 20.4 mm | 17.00" | 2560x1600 | |
| 87.9 % v7 (old) | 07-2020 | Dell XPS 17 9700 Core i7 RTX 2060 Max-Q i7-10875H, GeForce RTX 2060 Max-Q | 2.5 kg | 19.5 mm | 17.00" | 3840x2400 | |
| 85.2 % v7 (old) | 08-2020 | LG Gram 17 17Z90N-V.AA77G i7-1065G7, Iris Plus Graphics G7 (Ice Lake 64 EU) | 1.4 kg | 17.4 mm | 17.00" | 2560x1600 | |
| 84.3 % v7 (old) | 08-2020 | Eluktronics RP-17 R7 4800H, GeForce RTX 2060 Mobile | 2.6 kg | 30 mm | 17.30" | 1920x1080 | |
| 80.9 % v7 (old) | 07-2020 | MSI Bravo 17 A4DDR R7 4800H, Radeon RX 5500M | 2.2 kg | 23 mm | 17.30" | 1920x1080 | |
| 80.9 % v7 (old) | 06-2020 | HP Envy 17t-cg000 i7-1065G7, GeForce MX330 | 2.7 kg | 19.3 mm | 17.30" | 3840x2160 |
| SD Card Reader | |
| average JPG Copy Test (av. of 3 runs) | |
| Dell XPS 17 9700 Core i7 RTX 2060 Max-Q (Toshiba Exceria Pro SDXC 64 GB UHS-II) | |
| LG Gram 17 17Z90N-V.AA77G (Toshiba Exceria Pro M501 microSDXC 64GB) | |
| LG Ultra 17U70N (Toshiba Exceria Pro M501 microSDXC 64GB) | |
| HP Envy 17t-cg000 (Toshiba Exceria Pro SDXC 64 GB UHS-II) | |
| Eluktronics RP-17 (Toshiba Exceria Pro SDXC 64 GB UHS-II) | |
| maximum AS SSD Seq Read Test (1GB) | |
| Dell XPS 17 9700 Core i7 RTX 2060 Max-Q (Toshiba Exceria Pro SDXC 64 GB UHS-II) | |
| LG Gram 17 17Z90N-V.AA77G (Toshiba Exceria Pro M501 microSDXC 64GB) | |
| LG Ultra 17U70N (Toshiba Exceria Pro M501 microSDXC 64GB) | |
| HP Envy 17t-cg000 (Toshiba Exceria Pro SDXC 64 GB UHS-II) | |
| Eluktronics RP-17 (Toshiba Exceria Pro SDXC 64 GB UHS-II) | |


| |||||||||||||||||||||||||
Helderheidsverdeling: 88 %
Helderheid in Batterij-modus: 354 cd/m²
Contrast: 1731:1 (Zwart: 0.24 cd/m²)
ΔE ColorChecker Calman: 2.42 | ∀{0.5-29.43 Ø4.73}
calibrated: 1.68
ΔE Greyscale Calman: 2.9 | ∀{0.09-98 Ø4.97}
94.2% sRGB (Argyll 1.6.3 3D)
60.2% AdobeRGB 1998 (Argyll 1.6.3 3D)
65.2% AdobeRGB 1998 (Argyll 3D)
94.5% sRGB (Argyll 3D)
64.2% Display P3 (Argyll 3D)
Gamma: 2.21
CCT: 6864 K
| LG Ultra 17U70N LG LP170WQ1-SPA1, IPS, 17", 2560x1600 | Dell XPS 17 9700 Core i7 RTX 2060 Max-Q Sharp LQ170R1, IPS, 17", 3840x2400 | LG Gram 17 17Z90N-V.AA77G LG Display LP170WQ1-SPA1, IPS, 17", 2560x1600 | Eluktronics RP-17 BOE NV173FHM-N44, IPS, 17.3", 1920x1080 | MSI Bravo 17 A4DDR AU Optronics B173HAN04.7 (AUO479D), IPS, 17.3", 1920x1080 | HP Envy 17t-cg000 AU Optronics AUO168E, IPS, 17.3", 3840x2160 | |
|---|---|---|---|---|---|---|
| Display | 33% | -2% | -0% | -36% | 31% | |
| Display P3 Coverage (%) | 64.2 | 90.5 41% | 62.9 -2% | 64.7 1% | 40.54 -37% | 86.2 34% |
| sRGB Coverage (%) | 94.5 | 100 6% | 92.7 -2% | 92 -3% | 60.1 -36% | 100 6% |
| AdobeRGB 1998 Coverage (%) | 65.2 | 99.8 53% | 63.6 -2% | 65.8 1% | 41.88 -36% | 99.8 53% |
| Response Times | -19% | 4% | 52% | -1% | -7% | |
| Response Time Grey 50% / Grey 80% * (ms) | 41.2 ? | 51.2 ? -24% | 43 ? -4% | 22.4 ? 46% | 40 ? 3% | 45.2 ? -10% |
| Response Time Black / White * (ms) | 28.4 ? | 32 ? -13% | 25 ? 12% | 12 ? 58% | 29.6 ? -4% | 29.6 ? -4% |
| PWM Frequency (Hz) | 943 | |||||
| Screen | -11% | -41% | -28% | -33% | -48% | |
| Brightness middle (cd/m²) | 415.4 | 539.4 30% | 393 -5% | 311.5 -25% | 264 -36% | 383.4 -8% |
| Brightness (cd/m²) | 385 | 494 28% | 354 -8% | 301 -22% | 244 -37% | 382 -1% |
| Brightness Distribution (%) | 88 | 84 -5% | 84 -5% | 91 3% | 88 0% | 86 -2% |
| Black Level * (cd/m²) | 0.24 | 0.32 -33% | 0.365 -52% | 0.31 -29% | 0.23 4% | 0.34 -42% |
| Contrast (:1) | 1731 | 1686 -3% | 1077 -38% | 1005 -42% | 1148 -34% | 1128 -35% |
| Colorchecker dE 2000 * | 2.42 | 4.12 -70% | 4.83 -100% | 4.13 -71% | 3.85 -59% | 6.24 -158% |
| Colorchecker dE 2000 max. * | 5.55 | 7.65 -38% | 11.6 -109% | 7.32 -32% | 9.13 -65% | 10.18 -83% |
| Colorchecker dE 2000 calibrated * | 1.68 | 3.91 -133% | 1.22 27% | 2.93 -74% | 3.4 -102% | 3.7 -120% |
| Greyscale dE 2000 * | 2.9 | 1.5 48% | 7.37 -154% | 3.3 -14% | 1.95 33% | 6.6 -128% |
| Gamma | 2.21 100% | 2.15 102% | 2.36 93% | 2.17 101% | 2.52 87% | 2.272 97% |
| CCT | 6864 95% | 6438 101% | 6668 97% | 7157 91% | 6371 102% | 5973 109% |
| Color Space (Percent of AdobeRGB 1998) (%) | 60.2 | 90.4 50% | 59 -2% | 59.5 -1% | 42 -30% | 88 46% |
| Color Space (Percent of sRGB) (%) | 94.2 | 100 6% | 93 -1% | 91.6 -3% | 60 -36% | 100 6% |
| Totaal Gemiddelde (Programma / Instellingen) | 1% /
-4% | -13% /
-28% | 8% /
-13% | -23% /
-30% | -8% /
-28% |
* ... kleiner is beter
Responstijd Scherm
| ↔ Responstijd Zwart naar Wit | ||
|---|---|---|
| 28.4 ms ... stijging ↗ en daling ↘ gecombineerd | ↗ 16.4 ms stijging | 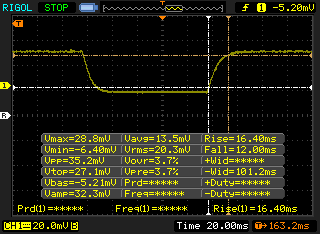 |
| ↘ 12 ms daling | ||
| Het scherm vertoonde relatief trage responstijden in onze tests en is misschien te traag voor games. Ter vergelijking: alle testtoestellen variëren van 0.1 (minimum) tot 240 (maximum) ms. » 75 % van alle toestellen zijn beter. Dit betekent dat de gemeten responstijd slechter is dan het gemiddelde (19.9 ms) van alle geteste toestellen. | ||
| ↔ Responstijd 50% Grijs naar 80% Grijs | ||
| 41.2 ms ... stijging ↗ en daling ↘ gecombineerd | ↗ 22.4 ms stijging | 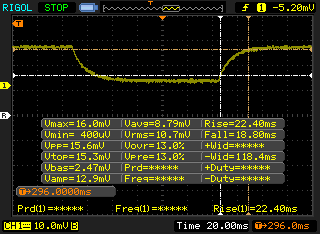 |
| ↘ 18.8 ms daling | ||
| Het scherm vertoonde trage responstijden in onze tests en is misschien te traag voor games. Ter vergelijking: alle testtoestellen variëren van 0.165 (minimum) tot 636 (maximum) ms. » 66 % van alle toestellen zijn beter. Dit betekent dat de gemeten responstijd slechter is dan het gemiddelde (31.1 ms) van alle geteste toestellen. | ||
Screen Flickering / PWM (Pulse-Width Modulation)
| Screen flickering / PWM niet waargenomen | 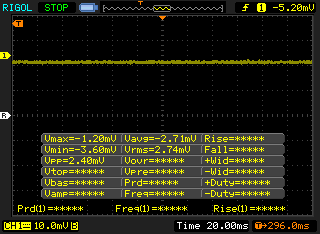 | ||
Ter vergelijking: 52 % van alle geteste toestellen maakten geen gebruik van PWM om de schermhelderheid te verlagen. Als het wel werd gebruikt, werd een gemiddelde van 7794 (minimum: 5 - maximum: 343500) Hz waargenomen. | |||
Cinebench R15: CPU Multi 64Bit | CPU Single 64Bit
Blender: v2.79 BMW27 CPU
7-Zip 18.03: 7z b 4 -mmt1 | 7z b 4
Geekbench 5.5: Single-Core | Multi-Core
HWBOT x265 Benchmark v2.2: 4k Preset
LibreOffice : 20 Documents To PDF
R Benchmark 2.5: Overall mean
| Cinebench R20 / CPU (Multi Core) | |
| Dell XPS 13 7390 Core i7-10710U | |
| Dell XPS 13 7390 2-in-1 Core i7 | |
| Lenovo IdeaPad 5 15IIL05 | |
| Asus ZenBook 15 UX534FT-DB77 | |
| Lenovo Ideapad C340-15IWL-81N5004QGE | |
| Gemiddeld Intel Core i5-10210U (722 - 1820, n=30) | |
| Acer Aspire 3 A317-51G-72MD | |
| LG Ultra 17U70N | |
| LG Gram 17 17Z90N-V.AA77G | |
| Cinebench R20 / CPU (Single Core) | |
| Dell XPS 13 7390 2-in-1 Core i7 | |
| Dell XPS 13 7390 Core i7-10710U | |
| Asus ZenBook 15 UX534FT-DB77 | |
| Lenovo IdeaPad 5 15IIL05 | |
| Acer Aspire 3 A317-51G-72MD | |
| LG Gram 17 17Z90N-V.AA77G | |
| Gemiddeld Intel Core i5-10210U (322 - 428, n=30) | |
| Lenovo Ideapad C340-15IWL-81N5004QGE | |
| LG Ultra 17U70N | |
| Cinebench R15 / CPU Multi 64Bit | |
| Dell XPS 13 7390 Core i7-10710U | |
| Dell XPS 13 7390 2-in-1 Core i7 | |
| Lenovo IdeaPad 5 15IIL05 | |
| Lenovo Ideapad C340-15IWL-81N5004QGE | |
| Asus ZenBook 15 UX534FT-DB77 | |
| Gemiddeld Intel Core i5-10210U (320 - 790, n=35) | |
| LG Gram 17 17Z90N-V.AA77G | |
| Acer Aspire 3 A317-51G-72MD | |
| LG Ultra 17U70N | |
| Cinebench R15 / CPU Single 64Bit | |
| Asus ZenBook 15 UX534FT-DB77 | |
| Dell XPS 13 7390 Core i7-10710U | |
| Dell XPS 13 7390 2-in-1 Core i7 | |
| Lenovo IdeaPad 5 15IIL05 | |
| Acer Aspire 3 A317-51G-72MD | |
| Gemiddeld Intel Core i5-10210U (134 - 174, n=35) | |
| LG Ultra 17U70N | |
| LG Gram 17 17Z90N-V.AA77G | |
| Lenovo Ideapad C340-15IWL-81N5004QGE | |
| Blender / v2.79 BMW27 CPU | |
| LG Gram 17 17Z90N-V.AA77G | |
| LG Ultra 17U70N | |
| Acer Aspire 3 A317-51G-72MD | |
| Gemiddeld Intel Core i5-10210U (585 - 1339, n=24) | |
| Dell XPS 13 7390 2-in-1 Core i7 | |
| Lenovo IdeaPad 5 15IIL05 | |
| Dell XPS 13 7390 Core i7-10710U | |
| 7-Zip 18.03 / 7z b 4 -mmt1 | |
| Acer Aspire 3 A317-51G-72MD | |
| Dell XPS 13 7390 2-in-1 Core i7 | |
| Dell XPS 13 7390 Core i7-10710U | |
| Lenovo IdeaPad 5 15IIL05 | |
| Gemiddeld Intel Core i5-10210U (3504 - 4467, n=24) | |
| LG Gram 17 17Z90N-V.AA77G | |
| LG Ultra 17U70N | |
| 7-Zip 18.03 / 7z b 4 | |
| Dell XPS 13 7390 Core i7-10710U | |
| Dell XPS 13 7390 2-in-1 Core i7 | |
| Lenovo IdeaPad 5 15IIL05 | |
| Gemiddeld Intel Core i5-10210U (10920 - 21679, n=24) | |
| Acer Aspire 3 A317-51G-72MD | |
| LG Ultra 17U70N | |
| LG Gram 17 17Z90N-V.AA77G | |
| Geekbench 5.5 / Single-Core | |
| LG Gram 17 17Z90N-V.AA77G | |
| Lenovo IdeaPad 5 15IIL05 | |
| Acer Aspire 3 A317-51G-72MD | |
| Gemiddeld Intel Core i5-10210U (949 - 1133, n=27) | |
| LG Ultra 17U70N | |
| Geekbench 5.5 / Multi-Core | |
| Lenovo IdeaPad 5 15IIL05 | |
| LG Gram 17 17Z90N-V.AA77G | |
| LG Ultra 17U70N | |
| Gemiddeld Intel Core i5-10210U (2079 - 4256, n=27) | |
| Acer Aspire 3 A317-51G-72MD | |
| HWBOT x265 Benchmark v2.2 / 4k Preset | |
| Lenovo IdeaPad 5 15IIL05 | |
| Dell XPS 13 7390 2-in-1 Core i7 | |
| Dell XPS 13 7390 Core i7-10710U | |
| Gemiddeld Intel Core i5-10210U (2.36 - 6.28, n=24) | |
| Acer Aspire 3 A317-51G-72MD | |
| LG Ultra 17U70N | |
| LG Gram 17 17Z90N-V.AA77G | |
| LibreOffice / 20 Documents To PDF | |
| Gemiddeld Intel Core i5-10210U (49.6 - 80.3, n=18) | |
| Acer Aspire 3 A317-51G-72MD | |
| LG Gram 17 17Z90N-V.AA77G | |
| Lenovo IdeaPad 5 15IIL05 | |
| LG Ultra 17U70N | |
| R Benchmark 2.5 / Overall mean | |
| LG Gram 17 17Z90N-V.AA77G | |
| Gemiddeld Intel Core i5-10210U (0.658 - 0.901, n=24) | |
| Lenovo IdeaPad 5 15IIL05 | |
| LG Ultra 17U70N | |
| Acer Aspire 3 A317-51G-72MD | |
* ... kleiner is beter
| PCMark 8 | |
| Home Score Accelerated v2 | |
| Eluktronics RP-17 | |
| HP Envy 17t-cg000 | |
| Dell XPS 17 9700 Core i7 RTX 2060 Max-Q | |
| LG Ultra 17U70N | |
| LG Gram 17 17Z90N-V.AA77G | |
| Work Score Accelerated v2 | |
| Eluktronics RP-17 | |
| HP Envy 17t-cg000 | |
| LG Gram 17 17Z90N-V.AA77G | |
| LG Ultra 17U70N | |
| Dell XPS 17 9700 Core i7 RTX 2060 Max-Q | |
| PCMark 8 Home Score Accelerated v2 | 3463 punten | |
| PCMark 8 Work Score Accelerated v2 | 4608 punten | |
| PCMark 10 Score | 4742 punten | |
Help | ||
| DPC Latencies / LatencyMon - interrupt to process latency (max), Web, Youtube, Prime95 | |
| HP Envy 17t-cg000 | |
| Eluktronics RP-17 | |
| MSI Bravo 17 A4DDR | |
| LG Ultra 17U70N | |
| Dell XPS 17 9700 Core i7 RTX 2060 Max-Q | |
| LG Gram 17 17Z90N-V.AA77G | |
* ... kleiner is beter
| LG Ultra 17U70N Samsung SSD PM981a MZVLB512HBJQ | Dell XPS 17 9700 Core i7 RTX 2060 Max-Q Micron 2200S 1TB MTFDHBA1T0TCK | LG Gram 17 17Z90N-V.AA77G Samsung PM981a MZVLB1T0HBLR | MSI Bravo 17 A4DDR Toshiba KBG30ZMV512G | HP Envy 17t-cg000 WDC PC SN520 SDAPNUW-512G | |
|---|---|---|---|---|---|
| AS SSD | -69% | -2% | -47% | -17% | |
| Seq Read (MB/s) | 1977 | 1141 -42% | 2722 38% | 1420 -28% | 1161 -41% |
| Seq Write (MB/s) | 2333 | 994 -57% | 2649 14% | 922 -60% | 809 -65% |
| 4K Read (MB/s) | 53.6 | 31.98 -40% | 52.2 -3% | 48.51 -9% | 40.63 -24% |
| 4K Write (MB/s) | 122.4 | 61 -50% | 132.4 8% | 116.8 -5% | 138.6 13% |
| 4K-64 Read (MB/s) | 1344 | 790 -41% | 886 -34% | 928 -31% | 857 -36% |
| 4K-64 Write (MB/s) | 1687 | 845 -50% | 1074 -36% | 345.4 -80% | 1041 -38% |
| Access Time Read * (ms) | 0.054 | 0.063 -17% | 0.041 24% | 0.089 -65% | 0.067 -24% |
| Access Time Write * (ms) | 0.102 | 0.679 -566% | 0.03 71% | 0.189 -85% | 0.026 75% |
| Score Read (Points) | 1595 | 966 -39% | 1211 -24% | 1119 -30% | 1013 -36% |
| Score Write (Points) | 2042 | 1005 -51% | 1471 -28% | 554 -73% | 1260 -38% |
| Score Total (Points) | 4480 | 2448 -45% | 3309 -26% | 2232 -50% | 2783 -38% |
| Copy ISO MB/s (MB/s) | 1998 | 1732 -13% | 2096 5% | 1350 -32% | |
| Copy Program MB/s (MB/s) | 514 | 717 39% | 395.6 -23% | 766 49% | |
| Copy Game MB/s (MB/s) | 1295 | 1343 4% | 1096 -15% | 1190 -8% | |
| CrystalDiskMark 5.2 / 6 | -28% | 3% | -37% | -28% | |
| Write 4K (MB/s) | 162.7 | 64.1 -61% | 162.8 0% | 94.6 -42% | 124.2 -24% |
| Read 4K (MB/s) | 65.2 | 39.93 -39% | 51 -22% | 47.12 -28% | 46.11 -29% |
| Write Seq (MB/s) | 1680 | 1191 -29% | 2078 24% | 850 -49% | |
| Read Seq (MB/s) | 1754 | 1418 -19% | 1991 14% | 1157 -34% | |
| Write 4K Q32T1 (MB/s) | 380.8 | 450.3 18% | 440.1 16% | 277.7 -27% | 447 17% |
| Read 4K Q32T1 (MB/s) | 496.2 | 365 -26% | 450.1 -9% | 546 10% | 350.1 -29% |
| Write Seq Q32T1 (MB/s) | 2959 | 1563 -47% | 2998 1% | 908 -69% | 1463 -51% |
| Read Seq Q32T1 (MB/s) | 3548 | 2683 -24% | 3562 0% | 1632 -54% | 1751 -51% |
| Write 4K Q8T8 (MB/s) | 445.5 | ||||
| Read 4K Q8T8 (MB/s) | 926 | ||||
| Totaal Gemiddelde (Programma / Instellingen) | -49% /
-54% | 1% /
-0% | -42% /
-43% | -23% /
-21% |
* ... kleiner is beter

Disk Throttling: DiskSpd Read Loop, Queue Depth 8
| 3DMark 11 Performance | 10278 punten | |
| 3DMark Cloud Gate Standard Score | 17757 punten | |
| 3DMark Fire Strike Score | 7414 punten | |
| 3DMark Time Spy Score | 3263 punten | |
Help | ||
| Final Fantasy XV Benchmark | |
| 1920x1080 Standard Quality | |
| Gigabyte Aero 17 HDR XB | |
| MSI RTX 2060 Gaming Z 6G | |
| Eluktronics RP-17 | |
| Asus ROG Zephyrus G15 GA502IU-ES76 | |
| Dell G7 15-7588 | |
| LG Ultra 17U70N | |
| Gemiddeld NVIDIA GeForce GTX 1650 Mobile (47.7 - 52.4, n=5) | |
| Apple MacBook Pro 16 2019 i9 5500M | |
| Lenovo IdeaPad 330-15ICH | |
| 1920x1080 High Quality | |
| Gigabyte Aero 17 HDR XB | |
| MSI RTX 2060 Gaming Z 6G | |
| Eluktronics RP-17 | |
| Asus ROG Zephyrus G15 GA502IU-ES76 | |
| Dell G7 15-7588 | |
| LG Ultra 17U70N | |
| Gemiddeld NVIDIA GeForce GTX 1650 Mobile (31.8 - 37.6, n=6) | |
| Lenovo IdeaPad 330-15ICH | |
| Apple MacBook Pro 16 2019 i9 5500M | |
| The Witcher 3 - 1920x1080 Ultra Graphics & Postprocessing (HBAO+) | |
| Gigabyte Aero 17 HDR XB | |
| MSI RTX 2060 Gaming Z 6G | |
| Eluktronics RP-17 | |
| Dell XPS 17 9700 Core i7 RTX 2060 Max-Q | |
| Asus TUF A17 FA706IU-AS76 | |
| Asus ROG Zephyrus G15 GA502IU-ES76 | |
| MSI Bravo 17 A4DDR | |
| Apple MacBook Pro 16 2019 i9 5500M | |
| Dell G7 15-7588 | |
| Gemiddeld NVIDIA GeForce GTX 1650 Mobile (29.9 - 40.3, n=31) | |
| LG Ultra 17U70N | |
| Asus ZenBook 15 UX534FT-DB77 | |
| Asus TUF FX705GE-EW096T | |
| Lenovo IdeaPad 330-15ICH | |
| Lenovo IdeaPad 5 15IIL05 | |
| Acer Aspire 3 A317-51G-72MD | |
| Lenovo Ideapad C340-15IWL-81N5004QGE | |
| Dell XPS 13 7390 2-in-1 Core i7 | |
| lage | gem. | hoge | ultra | |
|---|---|---|---|---|
| The Witcher 3 (2015) | 163 | 95.4 | 57 | 33.1 |
| Dota 2 Reborn (2015) | 112 | 97.6 | 92.9 | 88.2 |
| Final Fantasy XV Benchmark (2018) | 82.3 | 50.2 | 35.9 | |
| X-Plane 11.11 (2018) | 59.3 | 54.4 | 49.3 |
| LG Ultra 17U70N GeForce GTX 1650 Mobile, i5-10210U, Samsung SSD PM981a MZVLB512HBJQ | Dell XPS 17 9700 Core i7 RTX 2060 Max-Q GeForce RTX 2060 Max-Q, i7-10875H, Micron 2200S 1TB MTFDHBA1T0TCK | LG Gram 17 17Z90N-V.AA77G Iris Plus Graphics G7 (Ice Lake 64 EU), i7-1065G7, Samsung PM981a MZVLB1T0HBLR | Eluktronics RP-17 GeForce RTX 2060 Mobile, R7 4800H, Phison PS5013 PRO-X-1TB-G2R NVMe SSD | MSI Bravo 17 A4DDR Radeon RX 5500M, R7 4800H, Toshiba KBG30ZMV512G | HP Envy 17t-cg000 GeForce MX330, i7-1065G7, WDC PC SN520 SDAPNUW-512G | |
|---|---|---|---|---|---|---|
| Noise | -3% | 13% | 0% | -11% | 0% | |
| uit / omgeving * (dB) | 27 | 28 -4% | 26 4% | 26.2 3% | 30 -11% | 28.2 -4% |
| Idle Minimum * (dB) | 27.3 | 28 -3% | 26 5% | 26.2 4% | 33 -21% | 28.2 -3% |
| Idle Average * (dB) | 27.3 | 28 -3% | 26.8 2% | 26.2 4% | 34 -25% | 28.2 -3% |
| Idle Maximum * (dB) | 31.7 | 28 12% | 27.5 13% | 30 5% | 35 -10% | 29.5 7% |
| Load Average * (dB) | 43.6 | 43.2 1% | 32.2 26% | 38.5 12% | 39 11% | 43.9 -1% |
| Witcher 3 ultra * (dB) | 45.3 | 49 -8% | 47.2 -4% | 48 -6% | 43.9 3% | |
| Load Maximum * (dB) | 44.7 | 50.5 -13% | 32.7 27% | 54.6 -22% | 52 -16% | 43.9 2% |
* ... kleiner is beter
Geluidsniveau
| Onbelast |
| 27.3 / 27.3 / 31.7 dB (A) |
| Belasting |
| 43.6 / 44.7 dB (A) |
 | ||
30 dB stil 40 dB(A) hoorbaar 50 dB(A) luid |
||
min: | ||
(-) De maximumtemperatuur aan de bovenzijde bedraagt 49.4 °C / 121 F, vergeleken met het gemiddelde van 36.8 °C / 98 F, variërend van 21 tot 71 °C voor de klasse Multimedia.
(-) De bodem warmt op tot een maximum van 49.4 °C / 121 F, vergeleken met een gemiddelde van 39.1 °C / 102 F
(+) Bij onbelast gebruik bedraagt de gemiddelde temperatuur voor de bovenzijde 25.9 °C / 79 F, vergeleken met het apparaatgemiddelde van 31.3 °C / 88 F.
(±) Bij het spelen van The Witcher 3 is de gemiddelde temperatuur voor de bovenzijde 35.8 °C / 96 F, vergeleken met het apparaatgemiddelde van 31.3 °C / 88 F.
(+) De palmsteunen en het touchpad zijn met een maximum van ###max## °C / 86.4 F koeler dan de huidtemperatuur en voelen daarom koel aan.
(±) De gemiddelde temperatuur van de handpalmsteun van soortgelijke toestellen bedroeg 28.7 °C / 83.7 F (-1.5 °C / -2.7 F).
LG Ultra 17U70N audioanalyse
(±) | luidspreker luidheid is gemiddeld maar goed (79.1 dB)
Bas 100 - 315 Hz
(-) | bijna geen lage tonen - gemiddeld 17.2% lager dan de mediaan
(-) | de lage tonen zijn niet lineair (15.3% delta naar de vorige frequentie)
Midden 400 - 2000 Hz
(+) | evenwichtige middens - slechts 4.2% verwijderd van de mediaan
(±) | lineariteit van de middentonen is gemiddeld (9.5% delta ten opzichte van de vorige frequentie)
Hoog 2 - 16 kHz
(+) | evenwichtige hoogtepunten - slechts 2.8% verwijderd van de mediaan
(+) | de hoge tonen zijn lineair (5.7% delta naar de vorige frequentie)
Algemeen 100 - 16.000 Hz
(±) | lineariteit van het totale geluid is gemiddeld (18.4% verschil met de mediaan)
Vergeleken met dezelfde klasse
» 57% van alle geteste apparaten in deze klasse waren beter, 7% vergelijkbaar, 36% slechter
» De beste had een delta van 5%, het gemiddelde was 17%, de slechtste was 45%
Vergeleken met alle geteste toestellen
» 41% van alle geteste apparaten waren beter, 8% gelijk, 52% slechter
» De beste had een delta van 4%, het gemiddelde was 24%, de slechtste was 134%
Apple MacBook 12 (Early 2016) 1.1 GHz audioanalyse
(+) | luidsprekers kunnen relatief luid spelen (83.6 dB)
Bas 100 - 315 Hz
(±) | verminderde zeebaars - gemiddeld 11.3% lager dan de mediaan
(±) | lineariteit van de lage tonen is gemiddeld (14.2% delta ten opzichte van de vorige frequentie)
Midden 400 - 2000 Hz
(+) | evenwichtige middens - slechts 2.4% verwijderd van de mediaan
(+) | de middentonen zijn lineair (5.5% delta ten opzichte van de vorige frequentie)
Hoog 2 - 16 kHz
(+) | evenwichtige hoogtepunten - slechts 2% verwijderd van de mediaan
(+) | de hoge tonen zijn lineair (4.5% delta naar de vorige frequentie)
Algemeen 100 - 16.000 Hz
(+) | het totale geluid is lineair (10.2% verschil met de mediaan)
Vergeleken met dezelfde klasse
» 7% van alle geteste apparaten in deze klasse waren beter, 2% vergelijkbaar, 91% slechter
» De beste had een delta van 5%, het gemiddelde was 18%, de slechtste was 53%
Vergeleken met alle geteste toestellen
» 5% van alle geteste apparaten waren beter, 1% gelijk, 94% slechter
» De beste had een delta van 4%, het gemiddelde was 24%, de slechtste was 134%
| Uit / Standby | |
| Inactief | |
| Belasting |
|
Key:
min: | |
| LG Ultra 17U70N i5-10210U, GeForce GTX 1650 Mobile, Samsung SSD PM981a MZVLB512HBJQ, IPS, 2560x1600, 17" | LG Gram 17 17Z90N-V.AA77G i7-1065G7, Iris Plus Graphics G7 (Ice Lake 64 EU), Samsung PM981a MZVLB1T0HBLR, IPS, 2560x1600, 17" | Eluktronics RP-17 R7 4800H, GeForce RTX 2060 Mobile, Phison PS5013 PRO-X-1TB-G2R NVMe SSD, IPS, 1920x1080, 17.3" | MSI Bravo 17 A4DDR R7 4800H, Radeon RX 5500M, Toshiba KBG30ZMV512G, IPS, 1920x1080, 17.3" | HP Envy 17t-cg000 i7-1065G7, GeForce MX330, WDC PC SN520 SDAPNUW-512G, IPS, 3840x2160, 17.3" | |
|---|---|---|---|---|---|
| Power Consumption | 38% | -145% | -40% | -4% | |
| Idle Minimum * (Watt) | 3.7 | 3.2 14% | 20.2 -446% | 9 -143% | 6.1 -65% |
| Idle Average * (Watt) | 8.8 | 8.4 5% | 24.5 -178% | 10 -14% | 13 -48% |
| Idle Maximum * (Watt) | 30.6 | 11.7 62% | 28.7 6% | 13 58% | 13.5 56% |
| Load Average * (Watt) | 67.4 | 39.6 41% | 110.4 -64% | 69 -2% | 72.7 -8% |
| Witcher 3 ultra * (Watt) | 84.5 | 166.3 -97% | 128 -51% | 62.2 26% | |
| Load Maximum * (Watt) | 114 | 34 70% | 217.4 -91% | 214 -88% | 97.1 15% |
* ... kleiner is beter
| LG Ultra 17U70N i5-10210U, GeForce GTX 1650 Mobile, 72 Wh | Dell XPS 17 9700 Core i7 RTX 2060 Max-Q i7-10875H, GeForce RTX 2060 Max-Q, 97 Wh | LG Gram 17 17Z90N-V.AA77G i7-1065G7, Iris Plus Graphics G7 (Ice Lake 64 EU), 80 Wh | Eluktronics RP-17 R7 4800H, GeForce RTX 2060 Mobile, 62 Wh | MSI Bravo 17 A4DDR R7 4800H, Radeon RX 5500M, 51 Wh | HP Envy 17t-cg000 i7-1065G7, GeForce MX330, 55 Wh | |
|---|---|---|---|---|---|---|
| Batterijduur | 7% | 55% | -42% | -44% | -32% | |
| Reader / Idle (h) | 24.8 | 23.8 -4% | 24 -3% | 7.7 -69% | 15.4 -38% | |
| WiFi v1.3 (h) | 13.7 | 9.7 -29% | 11.4 -17% | 4.4 -68% | 5.2 -62% | 4.6 -66% |
| Load (h) | 1.3 | 2 54% | 3.7 185% | 1.1 -15% | 1.3 0% | 1.4 8% |
Pro
Contra
Dit is de verkorte versie van het originele artikel. Het volledige, Engelse testrapport vind je hier.
De belangrijkste kenmerken van de LG Ultra 17 lijken elkaar tegen te werken. De beeldverhouding van 16:10 is geweldig, maar multimediagebruikers geven misschien de voorkeur aan 16:9. Aan de andere kant kunnen content-creators de hogere beeldverhouding waarderen, maar door de trage processorprestaties kan het bewerken en coderen langer duren dan verwacht. Het ontbreken van AdobeRGB-dekking zou ook een dealbreker kunnen zijn. Tot slot zullen occasionele gamers tevreden zijn met de krachtige GeForce GTX 1650-GPU, maar de merkbare ghosting en de CPU uit de U-serie zouden wel eens kunnen tegenvallen. De laptop blinkt niet uit in één bepaalde categorie, wat het een vreemde hybride laptop voor kantoor/multimedia maakt met zowel goede grafische prestaties als trage processorprestaties.
Het enige opvallende voordeel van de Ultra 17 is het relatief lage gewicht voor een 17-inch laptop met GTX-graphics. Anders ben je beter af met de XPS 17 als je niet van plan bent veel te reizen met de Ultra 17.
Deels content-creator-, deels gaming-, deels multimediamachine. De LG Ultra 17 is handig als je veel reist en nood hebt aan een krachtige GPU in combinatie met een groot 17-inch sRGB-beeldscherm.
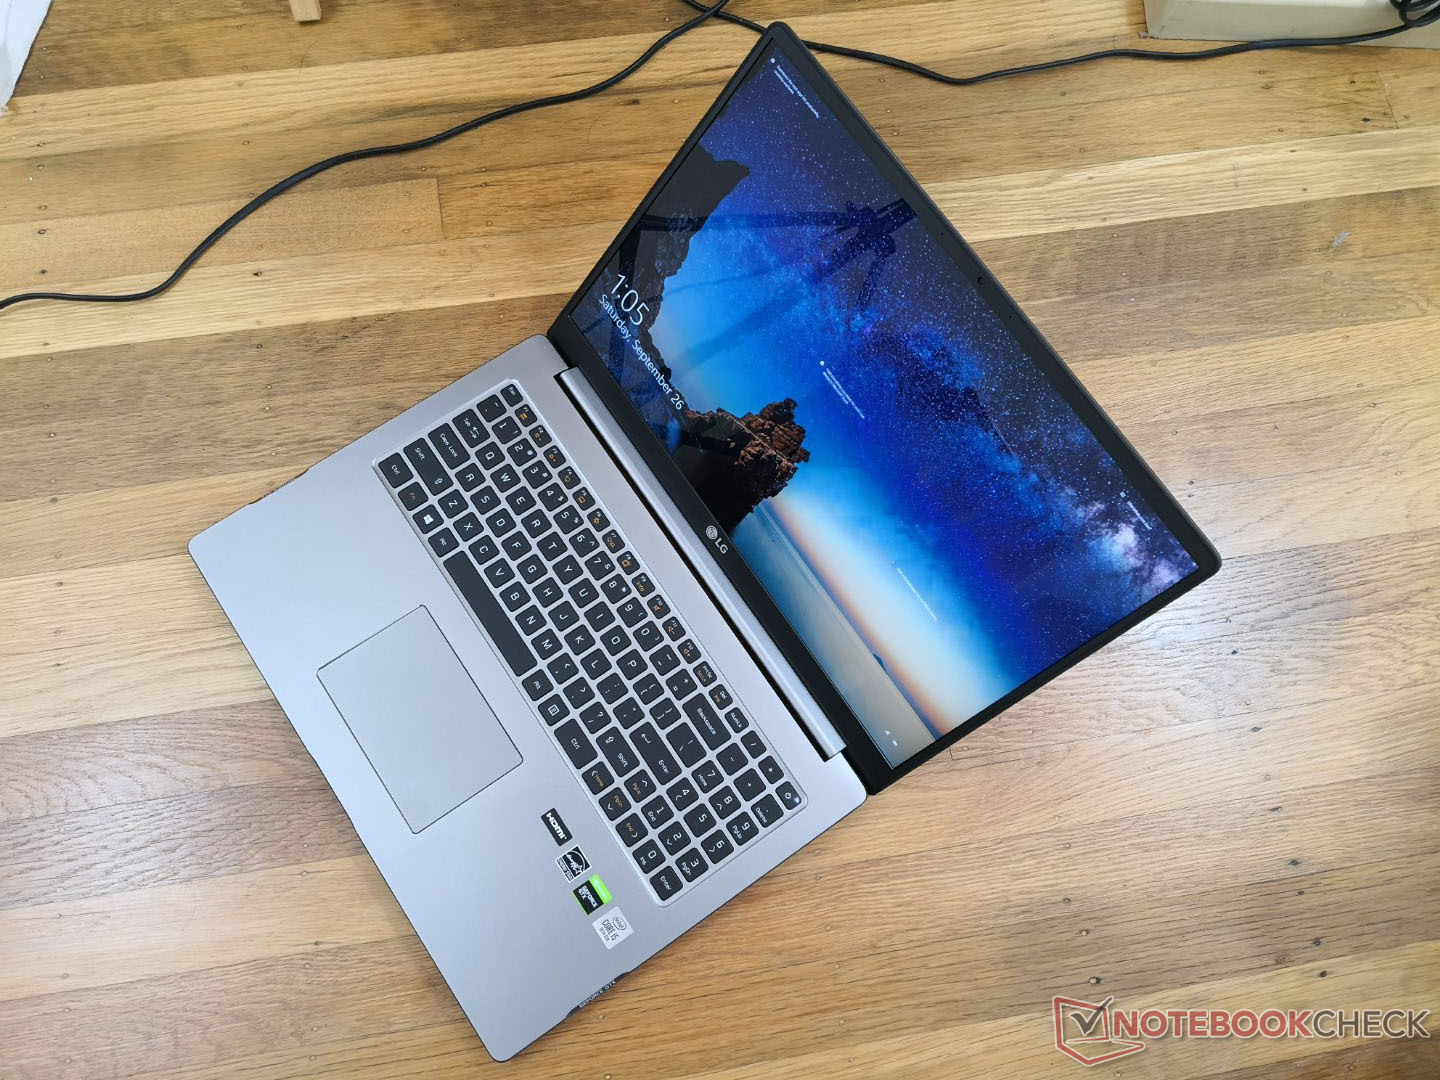
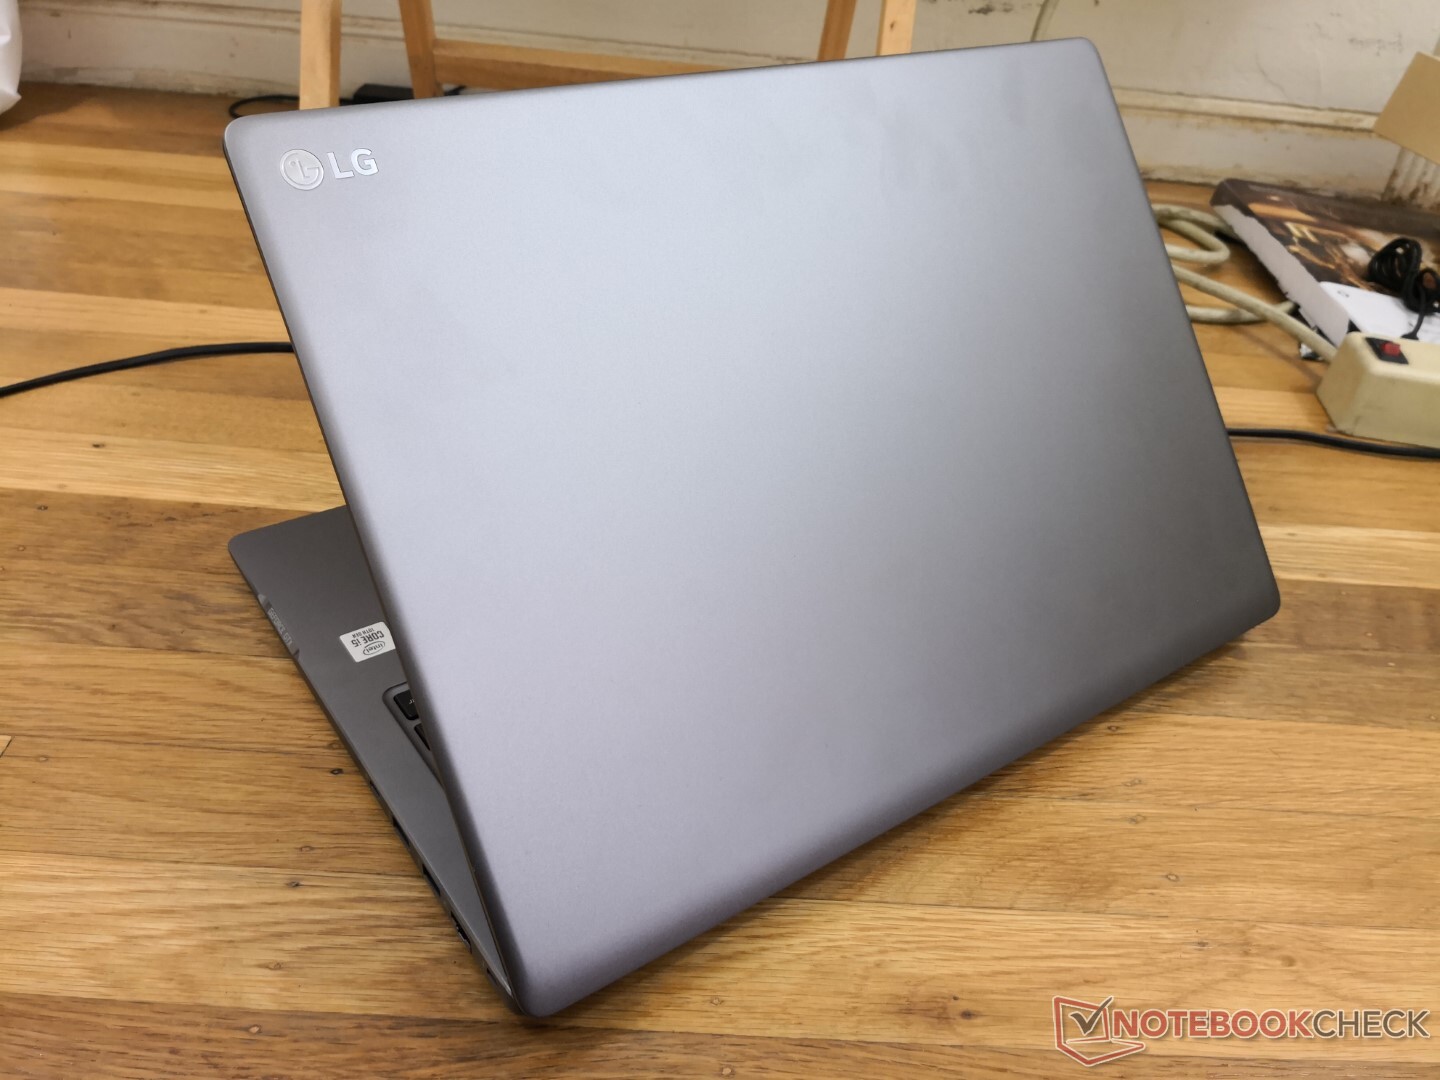
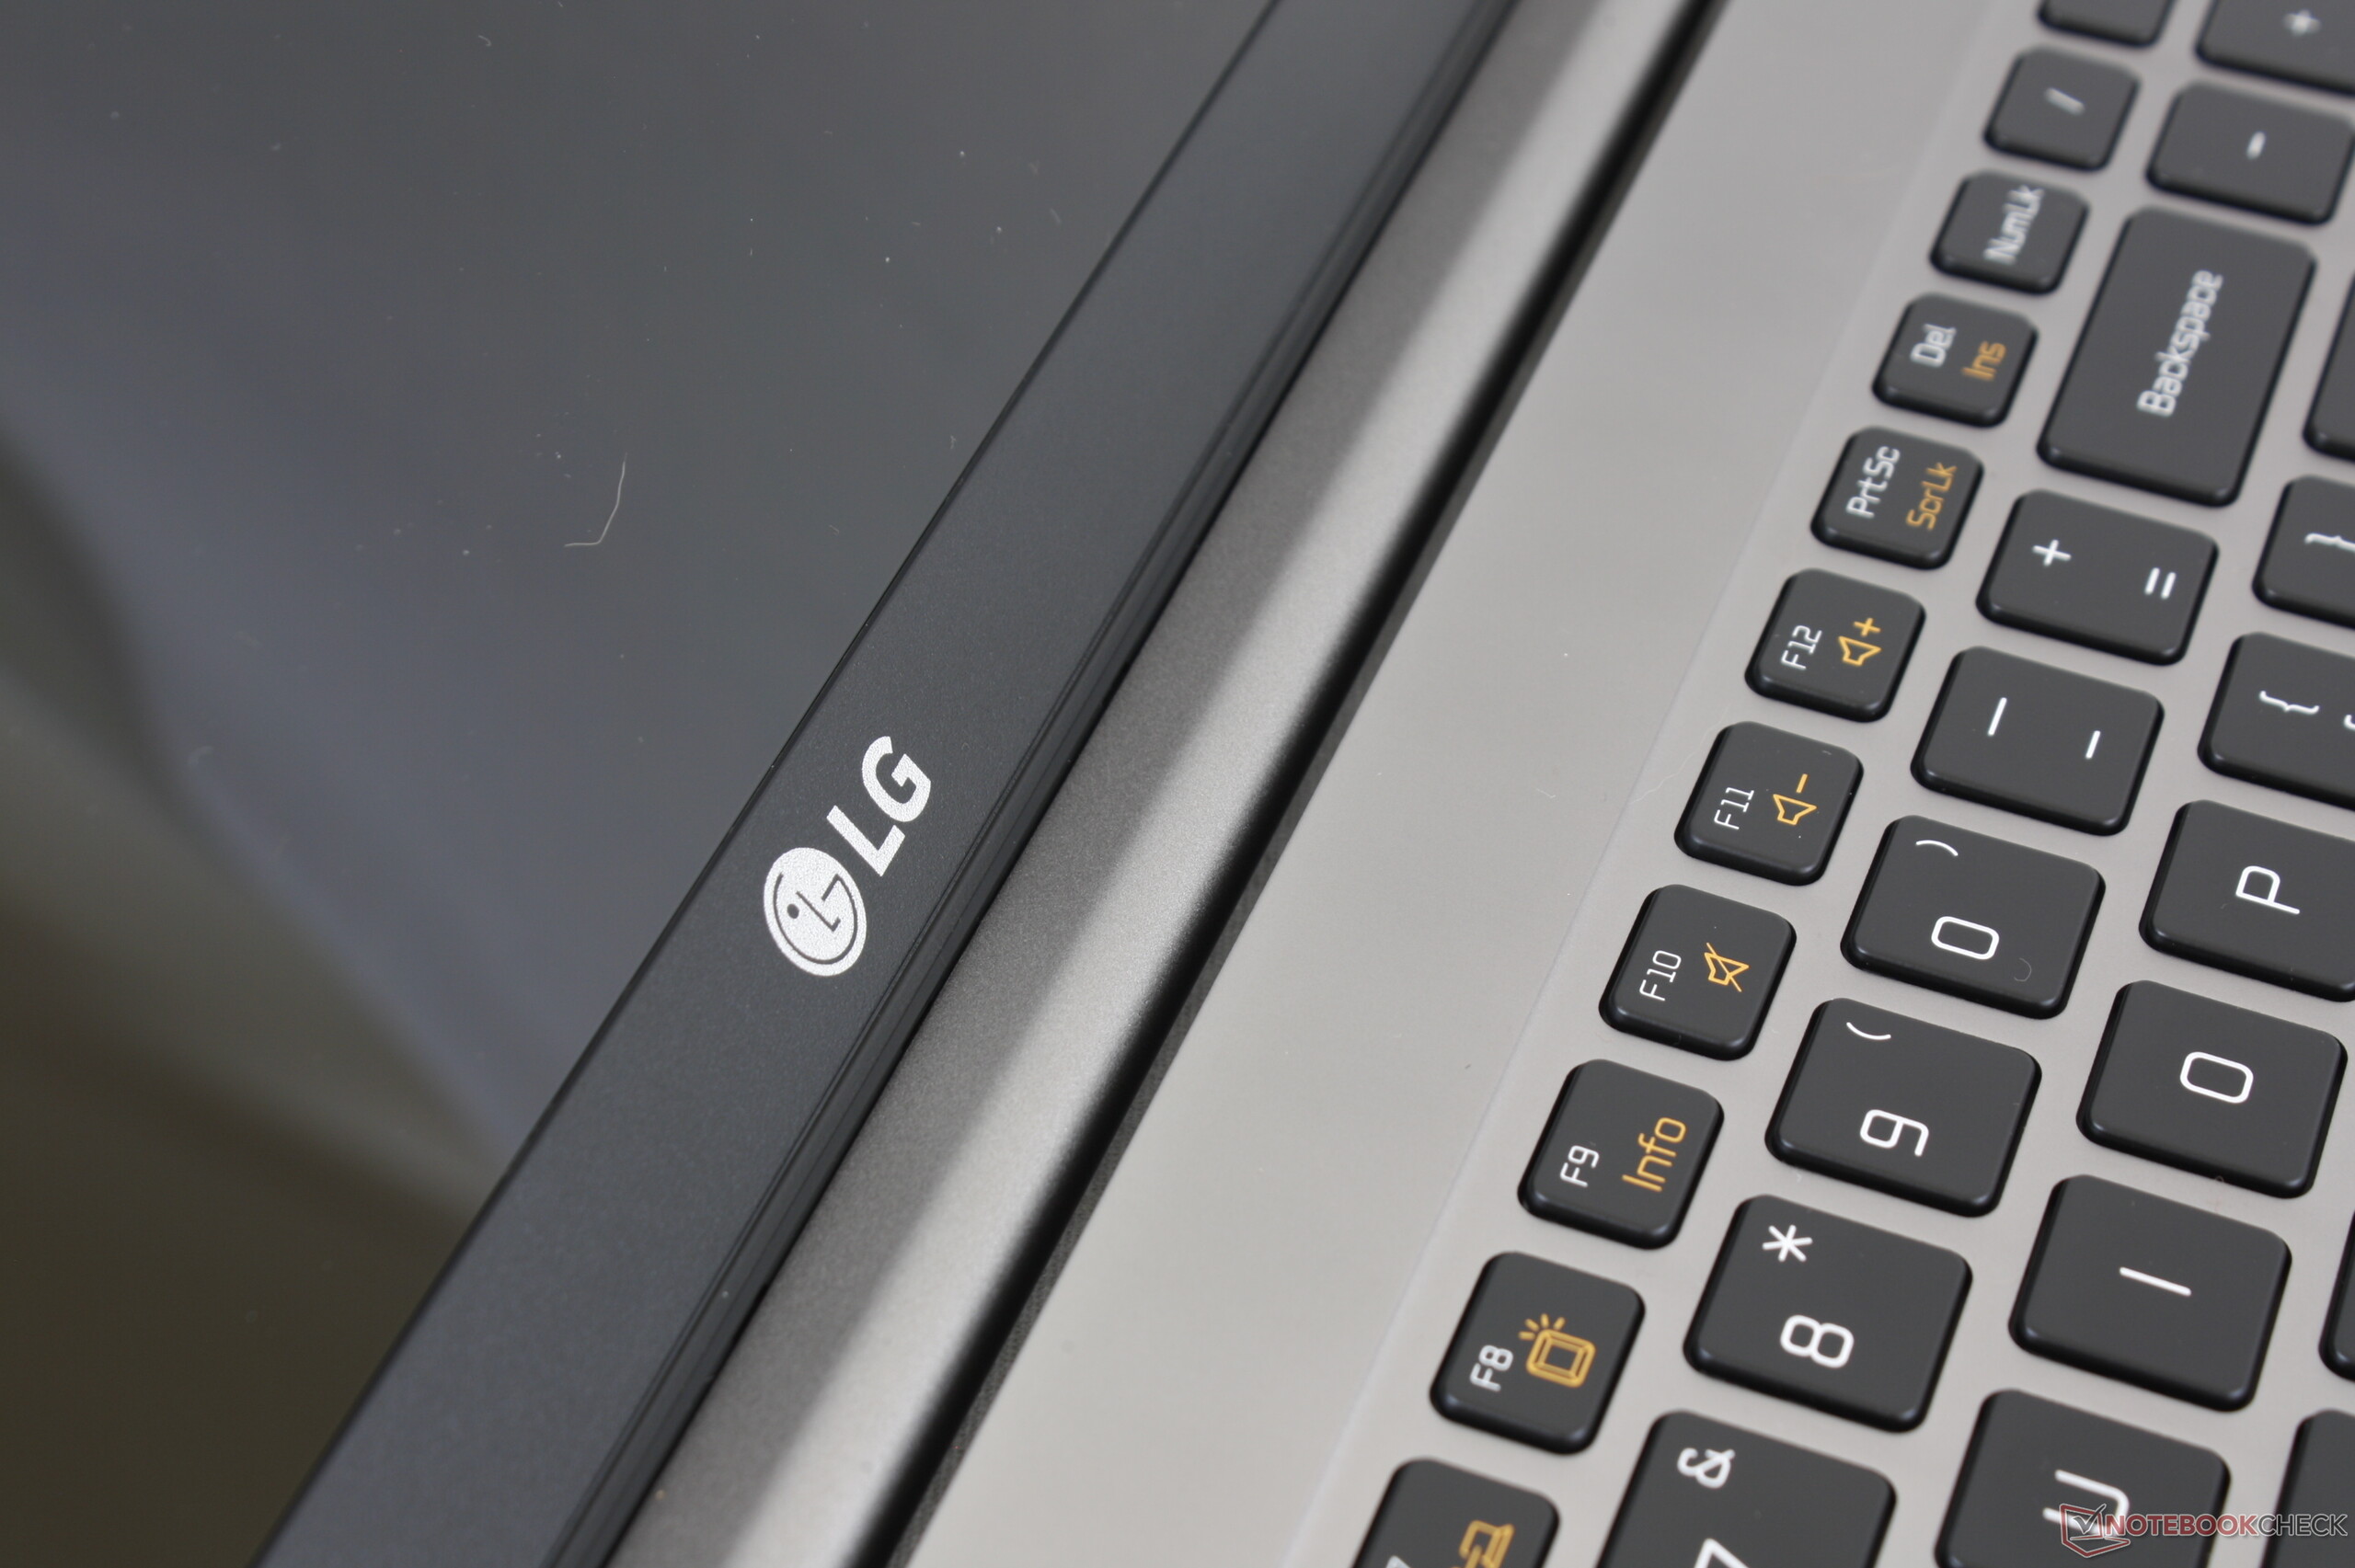
LG Ultra 17U70N
- 30-09-2020 v7 (old)
Allen Ngo
Price comparison
