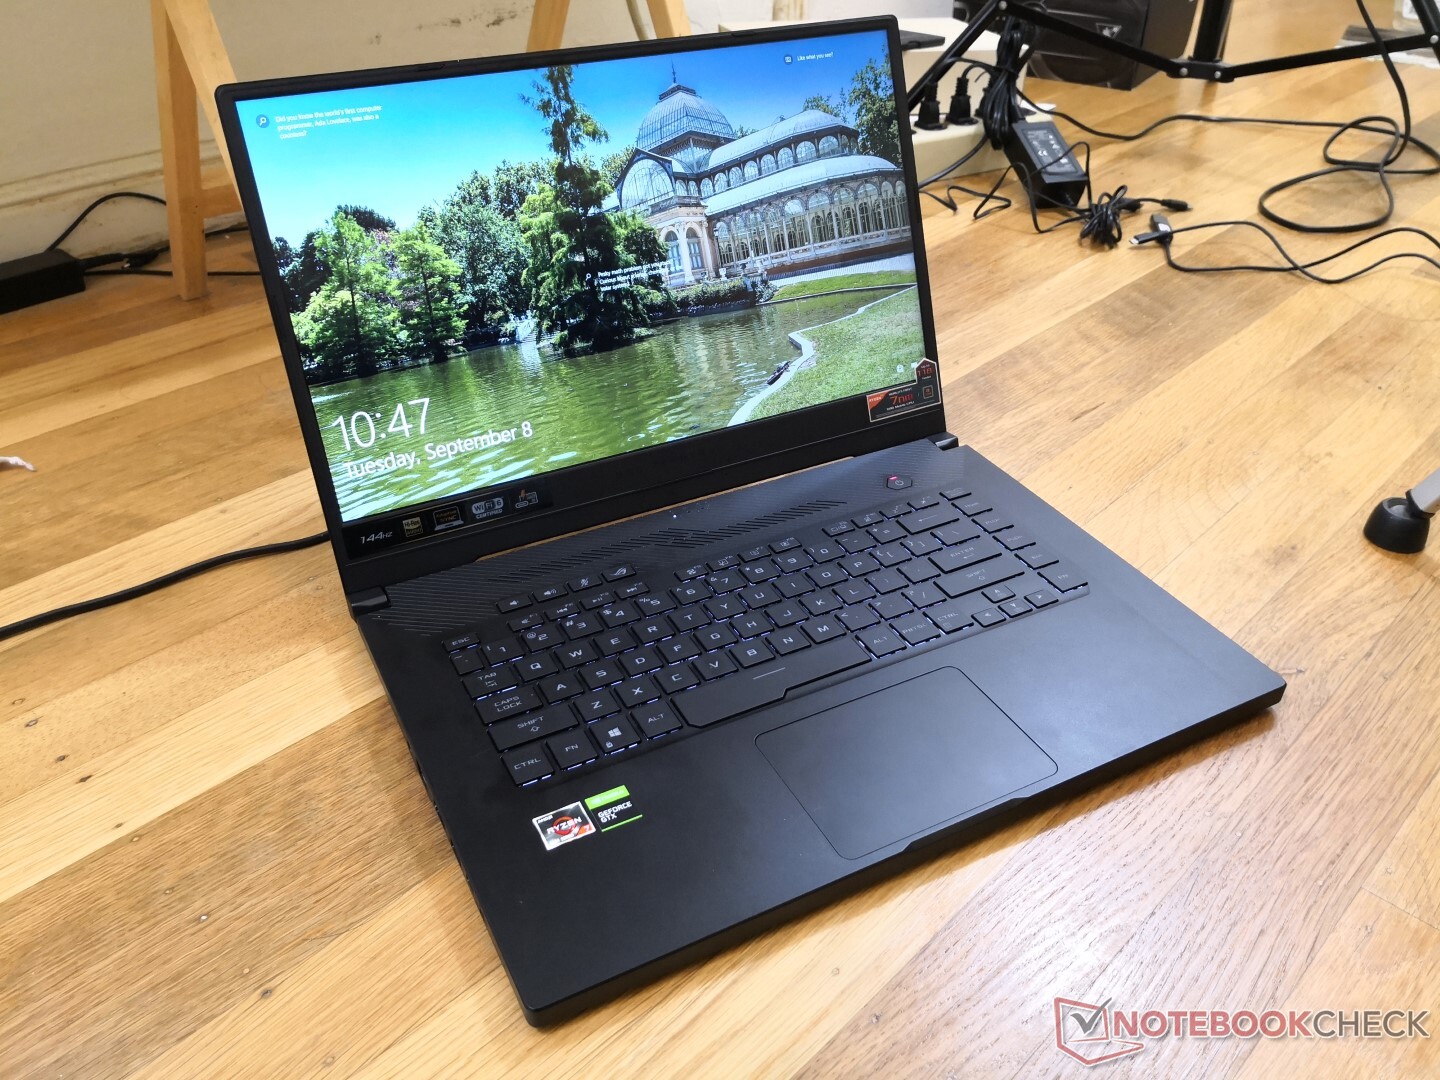
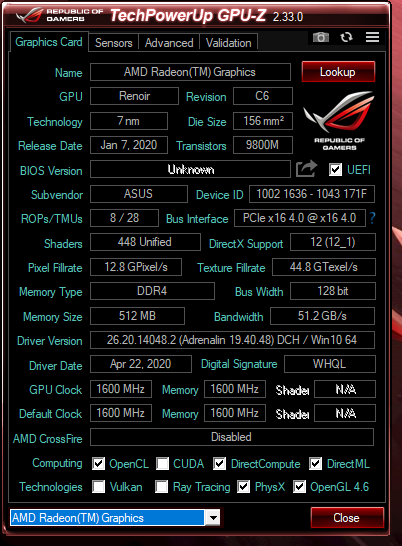
Kort testrapport Asus Zephyrus G15 GA502IU Laptop - debuut van de AMD Ryzen 7 4800HS
Evaluatie | Datum | Model | Gewicht | Hoogte | Formaat | Resolutie | Beste prijs |
|---|---|---|---|---|---|---|---|
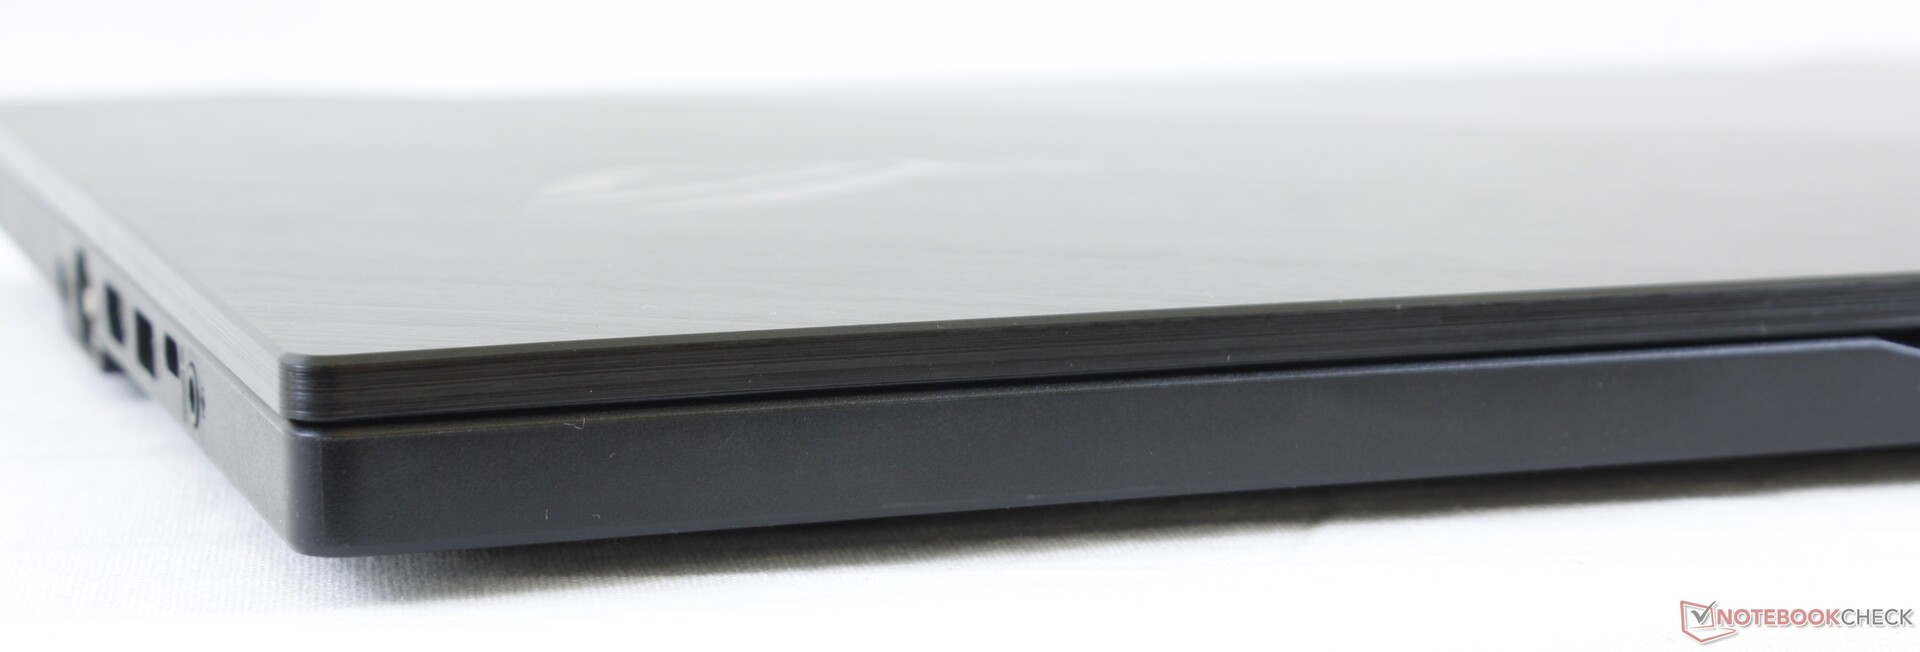
| 81.2 % v7 (old) | 09-2020 | Asus ROG Zephyrus G15 GA502IU-ES76 R7 4800HS, GeForce GTX 1660 Ti Max-Q | 2.1 kg | 19.9 mm | 15.60" | 1920x1080 | |
| 84.5 % v7 (old) | 07-2020 | Asus ROG Zephyrus Duo 15 GX550LXS i9-10980HK, GeForce RTX 2080 Super Max-Q | 2.5 kg | 20 mm | 15.60" | 3840x2160 | |
| 83.3 % v6 (old) | 05-2019 | Asus ROG Zephyrus G15 GA502DU R7 3750H, GeForce GTX 1660 Ti Max-Q | 2.1 kg | 20.4 mm | 15.60" | 1920x1080 | |
| 86.9 % v7 (old) | 08-2020 | Razer Blade 15 RTX 2070 Super Max-Q i7-10875H, GeForce RTX 2070 Super Max-Q | 2.1 kg | 17.8 mm | 15.60" | 1920x1080 | |
| 83.3 % v7 (old) | 07-2020 | Lenovo Legion 5 15IMH05H i5-10300H, GeForce RTX 2060 Mobile | 2.5 kg | 26.1 mm | 15.60" | 1920x1080 | |
| 82.5 % v7 (old) | 08-2020 | MSI GS66 Stealth 10SE-045 i7-10750H, GeForce RTX 2060 Mobile | 2.2 kg | 19.8 mm | 15.60" | 1920x1080 | |
| 82.6 % v7 (old) | 05-2020 | Eluktronics RP-15 R7 4800H, GeForce RTX 2060 Mobile | 1.9 kg | 20 mm | 15.60" | 1920x1080 |
| |||||||||||||||||||||||||
Helderheidsverdeling: 89 %
Helderheid in Batterij-modus: 255.9 cd/m²
Contrast: 1163:1 (Zwart: 0.22 cd/m²)
ΔE ColorChecker Calman: 5.15 | ∀{0.5-29.43 Ø4.71}
calibrated: 4.83
ΔE Greyscale Calman: 4.2 | ∀{0.09-98 Ø4.96}
58% sRGB (Argyll 1.6.3 3D)
36.9% AdobeRGB 1998 (Argyll 1.6.3 3D)
40.22% AdobeRGB 1998 (Argyll 3D)
58.5% sRGB (Argyll 3D)
38.9% Display P3 (Argyll 3D)
Gamma: 2.16
CCT: 7500 K
| Asus ROG Zephyrus G15 GA502IU-ES76 Panda LM156LF-2F01, IPS, 15.6", 1920x1080 | Asus ROG Zephyrus Duo 15 GX550LXS AU Optronics B156ZAN03.1, IPS, 15.6", 3840x2160 | Asus ROG Zephyrus G15 GA502DU Panda LM156LF-CL03, IPS, 15.6", 1920x1080 | Razer Blade 15 RTX 2070 Super Max-Q AU Optronics B156HAN12.0, IPS, 15.6", 1920x1080 | Lenovo Legion 5 15IMH05H BOE CQ NV156FHM-NX1, IPS, 15.6", 1920x1080 | MSI GS66 Stealth 10SE-045 Sharp LQ156M1JW03, IPS, 15.6", 1920x1080 | Eluktronics RP-15 BOE NV156FHM-N4G, IPS, 15.6", 1920x1080 | |
|---|---|---|---|---|---|---|---|
| Display | 114% | 4% | 74% | -0% | 71% | 61% | |
| Display P3 Coverage (%) | 38.9 | 87 124% | 40.33 4% | 69.4 78% | 38.8 0% | 67.5 74% | 63.7 64% |
| sRGB Coverage (%) | 58.5 | 100 71% | 60.6 4% | 98.8 69% | 57.8 -1% | 98.3 68% | 92 57% |
| AdobeRGB 1998 Coverage (%) | 40.22 | 99.9 148% | 41.69 4% | 70.5 75% | 40.09 0% | 68.9 71% | 65.2 62% |
| Response Times | -63% | -24% | 78% | 14% | 55% | 45% | |
| Response Time Grey 50% / Grey 80% * (ms) | 24.4 ? | 56.4 ? -131% | 34 ? -39% | 3.2 ? 87% | 26 ? -7% | 12 ? 51% | 17.2 ? 30% |
| Response Time Black / White * (ms) | 25.6 ? | 24.4 ? 5% | 28 ? -9% | 8 ? 69% | 17 ? 34% | 10.4 ? 59% | 10.4 ? 59% |
| PWM Frequency (Hz) | 21280 ? | 23580 ? | |||||
| Screen | 57% | -4% | 30% | 6% | 28% | 13% | |
| Brightness middle (cd/m²) | 255.9 | 398 56% | 240.1 -6% | 345.4 35% | 301 18% | 272 6% | 298.6 17% |
| Brightness (cd/m²) | 246 | 385 57% | 231 -6% | 342 39% | 277 13% | 259 5% | 289 17% |
| Brightness Distribution (%) | 89 | 90 1% | 85 -4% | 90 1% | 77 -13% | 91 2% | 90 1% |
| Black Level * (cd/m²) | 0.22 | 0.28 -27% | 0.34 -55% | 0.34 -55% | 0.26 -18% | 0.27 -23% | 0.35 -59% |
| Contrast (:1) | 1163 | 1421 22% | 706 -39% | 1016 -13% | 1158 0% | 1007 -13% | 853 -27% |
| Colorchecker dE 2000 * | 5.15 | 1.53 70% | 4.2 18% | 3.18 38% | 5.12 1% | 2.42 53% | 5.01 3% |
| Colorchecker dE 2000 max. * | 17.11 | 3.69 78% | 17.8 -4% | 6.57 62% | 8.86 48% | 6.93 59% | 7.06 59% |
| Colorchecker dE 2000 calibrated * | 4.83 | 0.77 84% | 4.09 15% | 1.77 63% | 4.88 -1% | 0.88 82% | 2.52 48% |
| Greyscale dE 2000 * | 4.2 | 2.4 43% | 2.8 33% | 3.8 10% | 3.47 17% | 4.5 -7% | 5.4 -29% |
| Gamma | 2.16 102% | 2.19 100% | 2.2 100% | 2.15 102% | 2.37 93% | 2.188 101% | 2.54 87% |
| CCT | 7500 87% | 6996 93% | 6925 94% | 7109 91% | 7062 92% | 7369 88% | 7461 87% |
| Color Space (Percent of AdobeRGB 1998) (%) | 36.9 | 100 171% | 38.4 4% | 64.3 74% | 37 0% | 69 87% | 59.1 60% |
| Color Space (Percent of sRGB) (%) | 58 | 100 72% | 60.4 4% | 99 71% | 57 -2% | 91 57% | 91.6 58% |
| Totaal Gemiddelde (Programma / Instellingen) | 36% /
53% | -8% /
-5% | 61% /
44% | 7% /
6% | 51% /
39% | 40% /
26% |
* ... kleiner is beter
Responstijd Scherm
| ↔ Responstijd Zwart naar Wit | ||
|---|---|---|
| 25.6 ms ... stijging ↗ en daling ↘ gecombineerd | ↗ 15.2 ms stijging | 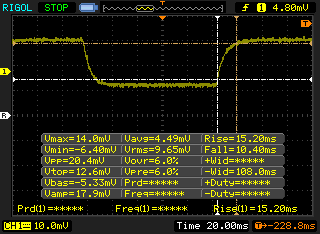 |
| ↘ 10.4 ms daling | ||
| Het scherm vertoonde relatief trage responstijden in onze tests en is misschien te traag voor games. Ter vergelijking: alle testtoestellen variëren van 0.1 (minimum) tot 240 (maximum) ms. » 61 % van alle toestellen zijn beter. Dit betekent dat de gemeten responstijd slechter is dan het gemiddelde (19.8 ms) van alle geteste toestellen. | ||
| ↔ Responstijd 50% Grijs naar 80% Grijs | ||
| 24.4 ms ... stijging ↗ en daling ↘ gecombineerd | ↗ 11.6 ms stijging | 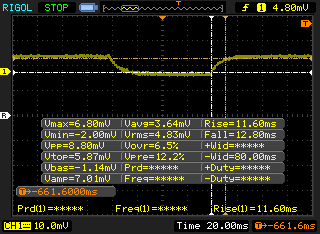 |
| ↘ 12.8 ms daling | ||
| Het scherm vertoonde prima responstijden in onze tests maar is misschien wat te traag voor competitieve games. Ter vergelijking: alle testtoestellen variëren van 0.165 (minimum) tot 636 (maximum) ms. » 35 % van alle toestellen zijn beter. Dit betekent dat de gemeten responstijd beter is dan het gemiddelde (31 ms) van alle geteste toestellen. | ||
Screen Flickering / PWM (Pulse-Width Modulation)
| Screen flickering / PWM niet waargenomen | 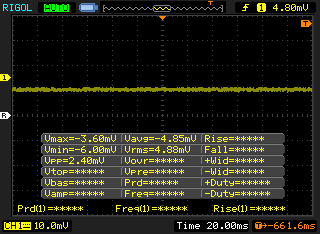 | ||
Ter vergelijking: 52 % van alle geteste toestellen maakten geen gebruik van PWM om de schermhelderheid te verlagen. Als het wel werd gebruikt, werd een gemiddelde van 7754 (minimum: 5 - maximum: 343500) Hz waargenomen. | |||
Cinebench R15: CPU Multi 64Bit | CPU Single 64Bit
Blender: v2.79 BMW27 CPU
7-Zip 18.03: 7z b 4 -mmt1 | 7z b 4
Geekbench 5.5: Single-Core | Multi-Core
HWBOT x265 Benchmark v2.2: 4k Preset
LibreOffice : 20 Documents To PDF
R Benchmark 2.5: Overall mean
| Cinebench R20 / CPU (Multi Core) | |
| Eluktronics RP-17 | |
| Alienware m17 R3 P45E | |
| Eurocom Sky X4C i9-9900KS | |
| Asus Zephyrus G14 GA401IV | |
| MSI GS75 10SF-609US | |
| Asus ROG Zephyrus G15 GA502IU-ES76 | |
| Alienware m15 R3 P87F | |
| HP Pavilion Gaming 15-ec1206ng | |
| Walmart EVOO Gaming 17 | |
| Dell G5 15 5590 | |
| Asus ROG Zephyrus G15 GA502DU | |
| Cinebench R20 / CPU (Single Core) | |
| Eurocom Sky X4C i9-9900KS | |
| Asus Zephyrus G14 GA401IV | |
| Eluktronics RP-17 | |
| Asus ROG Zephyrus G15 GA502IU-ES76 | |
| Alienware m15 R3 P87F | |
| MSI GS75 10SF-609US | |
| Alienware m17 R3 P45E | |
| Walmart EVOO Gaming 17 | |
| HP Pavilion Gaming 15-ec1206ng | |
| Dell G5 15 5590 | |
| Asus ROG Zephyrus G15 GA502DU | |
| Cinebench R15 / CPU Multi 64Bit | |
| Eurocom Sky X4C i9-9900KS | |
| Eluktronics RP-17 | |
| Asus Zephyrus G14 GA401IV | |
| Alienware m17 R3 P45E | |
| MSI GS75 10SF-609US | |
| Asus ROG Zephyrus G15 GA502IU-ES76 | |
| HP Pavilion Gaming 15-ec1206ng | |
| Alienware m15 R3 P87F | |
| Walmart EVOO Gaming 17 | |
| Dell G5 15 5590 | |
| Asus ROG Zephyrus G15 GA502DU | |
| Cinebench R15 / CPU Single 64Bit | |
| Eurocom Sky X4C i9-9900KS | |
| Alienware m17 R3 P45E | |
| Alienware m15 R3 P87F | |
| MSI GS75 10SF-609US | |
| Asus Zephyrus G14 GA401IV | |
| Eluktronics RP-17 | |
| Asus ROG Zephyrus G15 GA502IU-ES76 | |
| Walmart EVOO Gaming 17 | |
| HP Pavilion Gaming 15-ec1206ng | |
| Dell G5 15 5590 | |
| Asus ROG Zephyrus G15 GA502DU | |
| Blender / v2.79 BMW27 CPU | |
| Asus ROG Zephyrus G15 GA502DU | |
| HP Pavilion Gaming 15-ec1206ng | |
| Alienware m15 R3 P87F | |
| Asus Zephyrus G14 GA401IV | |
| Asus ROG Zephyrus G15 GA502IU-ES76 | |
| MSI GS75 10SF-609US | |
| Eluktronics RP-17 | |
| Eurocom Sky X4C i9-9900KS | |
| Alienware m17 R3 P45E | |
| 7-Zip 18.03 / 7z b 4 -mmt1 | |
| Eurocom Sky X4C i9-9900KS | |
| Alienware m17 R3 P45E | |
| MSI GS75 10SF-609US | |
| Asus ROG Zephyrus G15 GA502IU-ES76 | |
| Asus Zephyrus G14 GA401IV | |
| Eluktronics RP-17 | |
| Alienware m15 R3 P87F | |
| HP Pavilion Gaming 15-ec1206ng | |
| Asus ROG Zephyrus G15 GA502DU | |
| Geekbench 5.5 / Single-Core | |
| Eurocom Sky X4C i9-9900KS | |
| Alienware m17 R3 P45E | |
| MSI GS75 10SF-609US | |
| Alienware m15 R3 P87F | |
| Asus Zephyrus G14 GA401IV | |
| Asus ROG Zephyrus G15 GA502IU-ES76 | |
| Eluktronics RP-17 | |
| HP Pavilion Gaming 15-ec1206ng | |
| Geekbench 5.5 / Multi-Core | |
| Eurocom Sky X4C i9-9900KS | |
| MSI GS75 10SF-609US | |
| Alienware m17 R3 P45E | |
| Eluktronics RP-17 | |
| Asus ROG Zephyrus G15 GA502IU-ES76 | |
| Asus Zephyrus G14 GA401IV | |
| Alienware m15 R3 P87F | |
| HP Pavilion Gaming 15-ec1206ng | |
| HWBOT x265 Benchmark v2.2 / 4k Preset | |
| Eurocom Sky X4C i9-9900KS | |
| Alienware m17 R3 P45E | |
| Eluktronics RP-17 | |
| MSI GS75 10SF-609US | |
| Asus Zephyrus G14 GA401IV | |
| Asus ROG Zephyrus G15 GA502IU-ES76 | |
| Alienware m15 R3 P87F | |
| HP Pavilion Gaming 15-ec1206ng | |
| Asus ROG Zephyrus G15 GA502DU | |
| LibreOffice / 20 Documents To PDF | |
| HP Pavilion Gaming 15-ec1206ng | |
| Alienware m15 R3 P87F | |
| Eluktronics RP-17 | |
| Asus ROG Zephyrus G15 GA502IU-ES76 | |
| MSI GS75 10SF-609US | |
| Alienware m17 R3 P45E | |
| R Benchmark 2.5 / Overall mean | |
| Alienware m15 R3 P87F | |
| HP Pavilion Gaming 15-ec1206ng | |
| MSI GS75 10SF-609US | |
| Eluktronics RP-17 | |
| Asus ROG Zephyrus G15 GA502IU-ES76 | |
| Alienware m17 R3 P45E | |
* ... kleiner is beter
| PCMark 8 Home Score Accelerated v2 | 4913 punten | |
| PCMark 8 Work Score Accelerated v2 | 5901 punten | |
| PCMark 10 Score | 5291 punten | |
Help | ||
| DPC Latencies / LatencyMon - interrupt to process latency (max), Web, Youtube, Prime95 | |
| Asus ROG Zephyrus Duo 15 GX550LXS | |
| Razer Blade 15 RTX 2070 Super Max-Q | |
| MSI GS66 Stealth 10SE-045 | |
| Asus ROG Zephyrus G15 GA502IU-ES76 | |
| Lenovo Legion 5 15IMH05H | |
| Eluktronics RP-15 | |
* ... kleiner is beter
| Asus ROG Zephyrus G15 GA502IU-ES76 Intel SSD 660p 1TB SSDPEKNW010T8 | Asus ROG Zephyrus Duo 15 GX550LXS 2x Samsung PM981a MZVLB1T0HBLR (RAID 0) | Asus ROG Zephyrus G15 GA502DU Intel SSD 660p SSDPEKNW512G8 | Razer Blade 15 RTX 2070 Super Max-Q Samsung SSD PM981a MZVLB512HBJQ | Lenovo Legion 5 15IMH05H Samsung PM991 MZALQ512HALU | MSI GS66 Stealth 10SE-045 Samsung SSD PM981 MZVLB1T0HALR | |
|---|---|---|---|---|---|---|
| AS SSD | 60% | -20% | 56% | 1% | 72% | |
| Seq Read (MB/s) | 1197 | 2981 149% | 907 -24% | 1957 63% | 2012 68% | 2612 118% |
| Seq Write (MB/s) | 1637 | 2783 70% | 926 -43% | 2092 28% | 1261 -23% | 2368 45% |
| 4K Read (MB/s) | 56.3 | 43.98 -22% | 47.26 -16% | 50.2 -11% | 43.66 -22% | 51.1 -9% |
| 4K Write (MB/s) | 159 | 113.9 -28% | 98.7 -38% | 96.5 -39% | 109.3 -31% | 135.9 -15% |
| 4K-64 Read (MB/s) | 583 | 1519 161% | 321.5 -45% | 1594 173% | 851 46% | 1635 180% |
| 4K-64 Write (MB/s) | 838 | 1296 55% | 736 -12% | 2005 139% | 780 -7% | 1831 118% |
| Access Time Read * (ms) | 0.062 | 0.062 -0% | 0.064 -3% | 0.057 8% | 0.117 -89% | 0.042 32% |
| Access Time Write * (ms) | 0.128 | 0.033 74% | 0.045 65% | 0.112 12% | 0.036 72% | 0.028 78% |
| Score Read (Points) | 759 | 1861 145% | 459 -40% | 1840 142% | 1096 44% | 1947 157% |
| Score Write (Points) | 1160 | 1688 46% | 927 -20% | 2310 99% | 1016 -12% | 2204 90% |
| Score Total (Points) | 2350 | 4492 91% | 1641 -30% | 5103 117% | 2643 12% | 5138 119% |
| Copy ISO MB/s (MB/s) | 1376 | 2438 77% | 905 -34% | 1793 30% | 1481 8% | 2334 70% |
| Copy Program MB/s (MB/s) | 568 | 604 6% | 496.9 -13% | 573 1% | 467.5 -18% | 569 0% |
| Copy Game MB/s (MB/s) | 1180 | 1404 19% | 819 -31% | 1418 20% | 734 -38% | 1401 19% |
| CrystalDiskMark 5.2 / 6 | 35% | -33% | 21% | -14% | 16% | |
| Write 4K (MB/s) | 189.6 | 127.6 -33% | 132.2 -30% | 139.8 -26% | 145.4 -23% | 156.3 -18% |
| Read 4K (MB/s) | 61.7 | 48.4 -22% | 55.5 -10% | 48.62 -21% | 51.6 -16% | 47.65 -23% |
| Write Seq (MB/s) | 1730 | 2958 71% | 986 -43% | 2260 31% | 1007 -42% | 2374 37% |
| Read Seq (MB/s) | 1620 | 2984 84% | 1318 -19% | 2135 32% | 1145 -29% | 2045 26% |
| Write 4K Q32T1 (MB/s) | 474.2 | 472.7 0% | 220.3 -54% | 499.3 5% | 468.4 -1% | 431.3 -9% |
| Read 4K Q32T1 (MB/s) | 528 | 529 0% | 315.5 -40% | 552 5% | 528 0% | 509 -4% |
| Write Seq Q32T1 (MB/s) | 1795 | 3431 91% | 987 -45% | 2960 65% | 1381 -23% | 2385 33% |
| Read Seq Q32T1 (MB/s) | 1880 | 3536 88% | 1416 -25% | 3269 74% | 2291 22% | 3505 86% |
| Totaal Gemiddelde (Programma / Instellingen) | 48% /
51% | -27% /
-25% | 39% /
43% | -7% /
-5% | 44% /
51% |
* ... kleiner is beter

Disk Throttling: DiskSpd Read Loop, Queue Depth 8
| 3DMark 06 Standard Score | 25384 punten | |
| 3DMark 11 Performance | 17377 punten | |
| 3DMark Cloud Gate Standard Score | 38220 punten | |
| 3DMark Fire Strike Score | 12739 punten | |
| 3DMark Time Spy Score | 5461 punten | |
Help | ||
| lage | gem. | hoge | ultra | |
|---|---|---|---|---|
| The Witcher 3 (2015) | 257.5 | 166.5 | 94.5 | 51.3 |
| Dota 2 Reborn (2015) | 119 | 112 | 106 | 103 |
| Final Fantasy XV Benchmark (2018) | 131 | 74.1 | 54.6 | |
| X-Plane 11.11 (2018) | 93.7 | 80.4 | 67.8 | |
| Shadow of the Tomb Raider (2018) | 113 | 85 | 75 | 67 |
| Metro Exodus (2019) | 129.5 | 66.5 | 49.1 | 38.3 |
| Borderlands 3 (2019) | 116.5 | 81.5 | 54.9 | 42.3 |
| Asus ROG Zephyrus G15 GA502IU-ES76 GeForce GTX 1660 Ti Max-Q, R7 4800HS, Intel SSD 660p 1TB SSDPEKNW010T8 | Asus ROG Zephyrus Duo 15 GX550LXS GeForce RTX 2080 Super Max-Q, i9-10980HK, 2x Samsung PM981a MZVLB1T0HBLR (RAID 0) | Asus ROG Zephyrus G15 GA502DU GeForce GTX 1660 Ti Max-Q, R7 3750H, Intel SSD 660p SSDPEKNW512G8 | Razer Blade 15 RTX 2070 Super Max-Q GeForce RTX 2070 Super Max-Q, i7-10875H, Samsung SSD PM981a MZVLB512HBJQ | Lenovo Legion 5 15IMH05H GeForce RTX 2060 Mobile, i5-10300H, Samsung PM991 MZALQ512HALU | MSI GS66 Stealth 10SE-045 GeForce RTX 2060 Mobile, i7-10750H, Samsung SSD PM981 MZVLB1T0HALR | Eluktronics RP-15 GeForce RTX 2060 Mobile, R7 4800H, Phison PM81000GPMQCN28BTF-E12S4 M.2 NVM SSD | |
|---|---|---|---|---|---|---|---|
| Noise | -12% | -7% | -0% | -3% | -9% | -3% | |
| uit / omgeving * (dB) | 26.3 | 30 -14% | 28 -6% | 27 -3% | 30.7 -17% | 25 5% | 28 -6% |
| Idle Minimum * (dB) | 26.7 | 33 -24% | 29.4 -10% | 27 -1% | 30.7 -15% | 29 -9% | 28 -5% |
| Idle Average * (dB) | 26.7 | 34 -27% | 31.9 -19% | 27 -1% | 30.7 -15% | 30 -12% | 28 -5% |
| Idle Maximum * (dB) | 31.9 | 35 -10% | 33 -3% | 27 15% | 30.7 4% | 40 -25% | 31.5 1% |
| Load Average * (dB) | 38.9 | 48 -23% | 41.2 -6% | 44.7 -15% | 36.6 6% | 51 -31% | 44 -13% |
| Witcher 3 ultra * (dB) | 51 | 48 6% | 53.8 -5% | 51.2 -0% | 47 8% | 48 6% | 48.8 4% |
| Load Maximum * (dB) | 54.9 | 49 11% | 55.7 -1% | 54 2% | 50.9 7% | 54 2% | 54.1 1% |
* ... kleiner is beter
Geluidsniveau
| Onbelast |
| 26.7 / 26.7 / 31.9 dB (A) |
| Belasting |
| 38.9 / 54.9 dB (A) |
 | ||
30 dB stil 40 dB(A) hoorbaar 50 dB(A) luid |
||
min: | ||
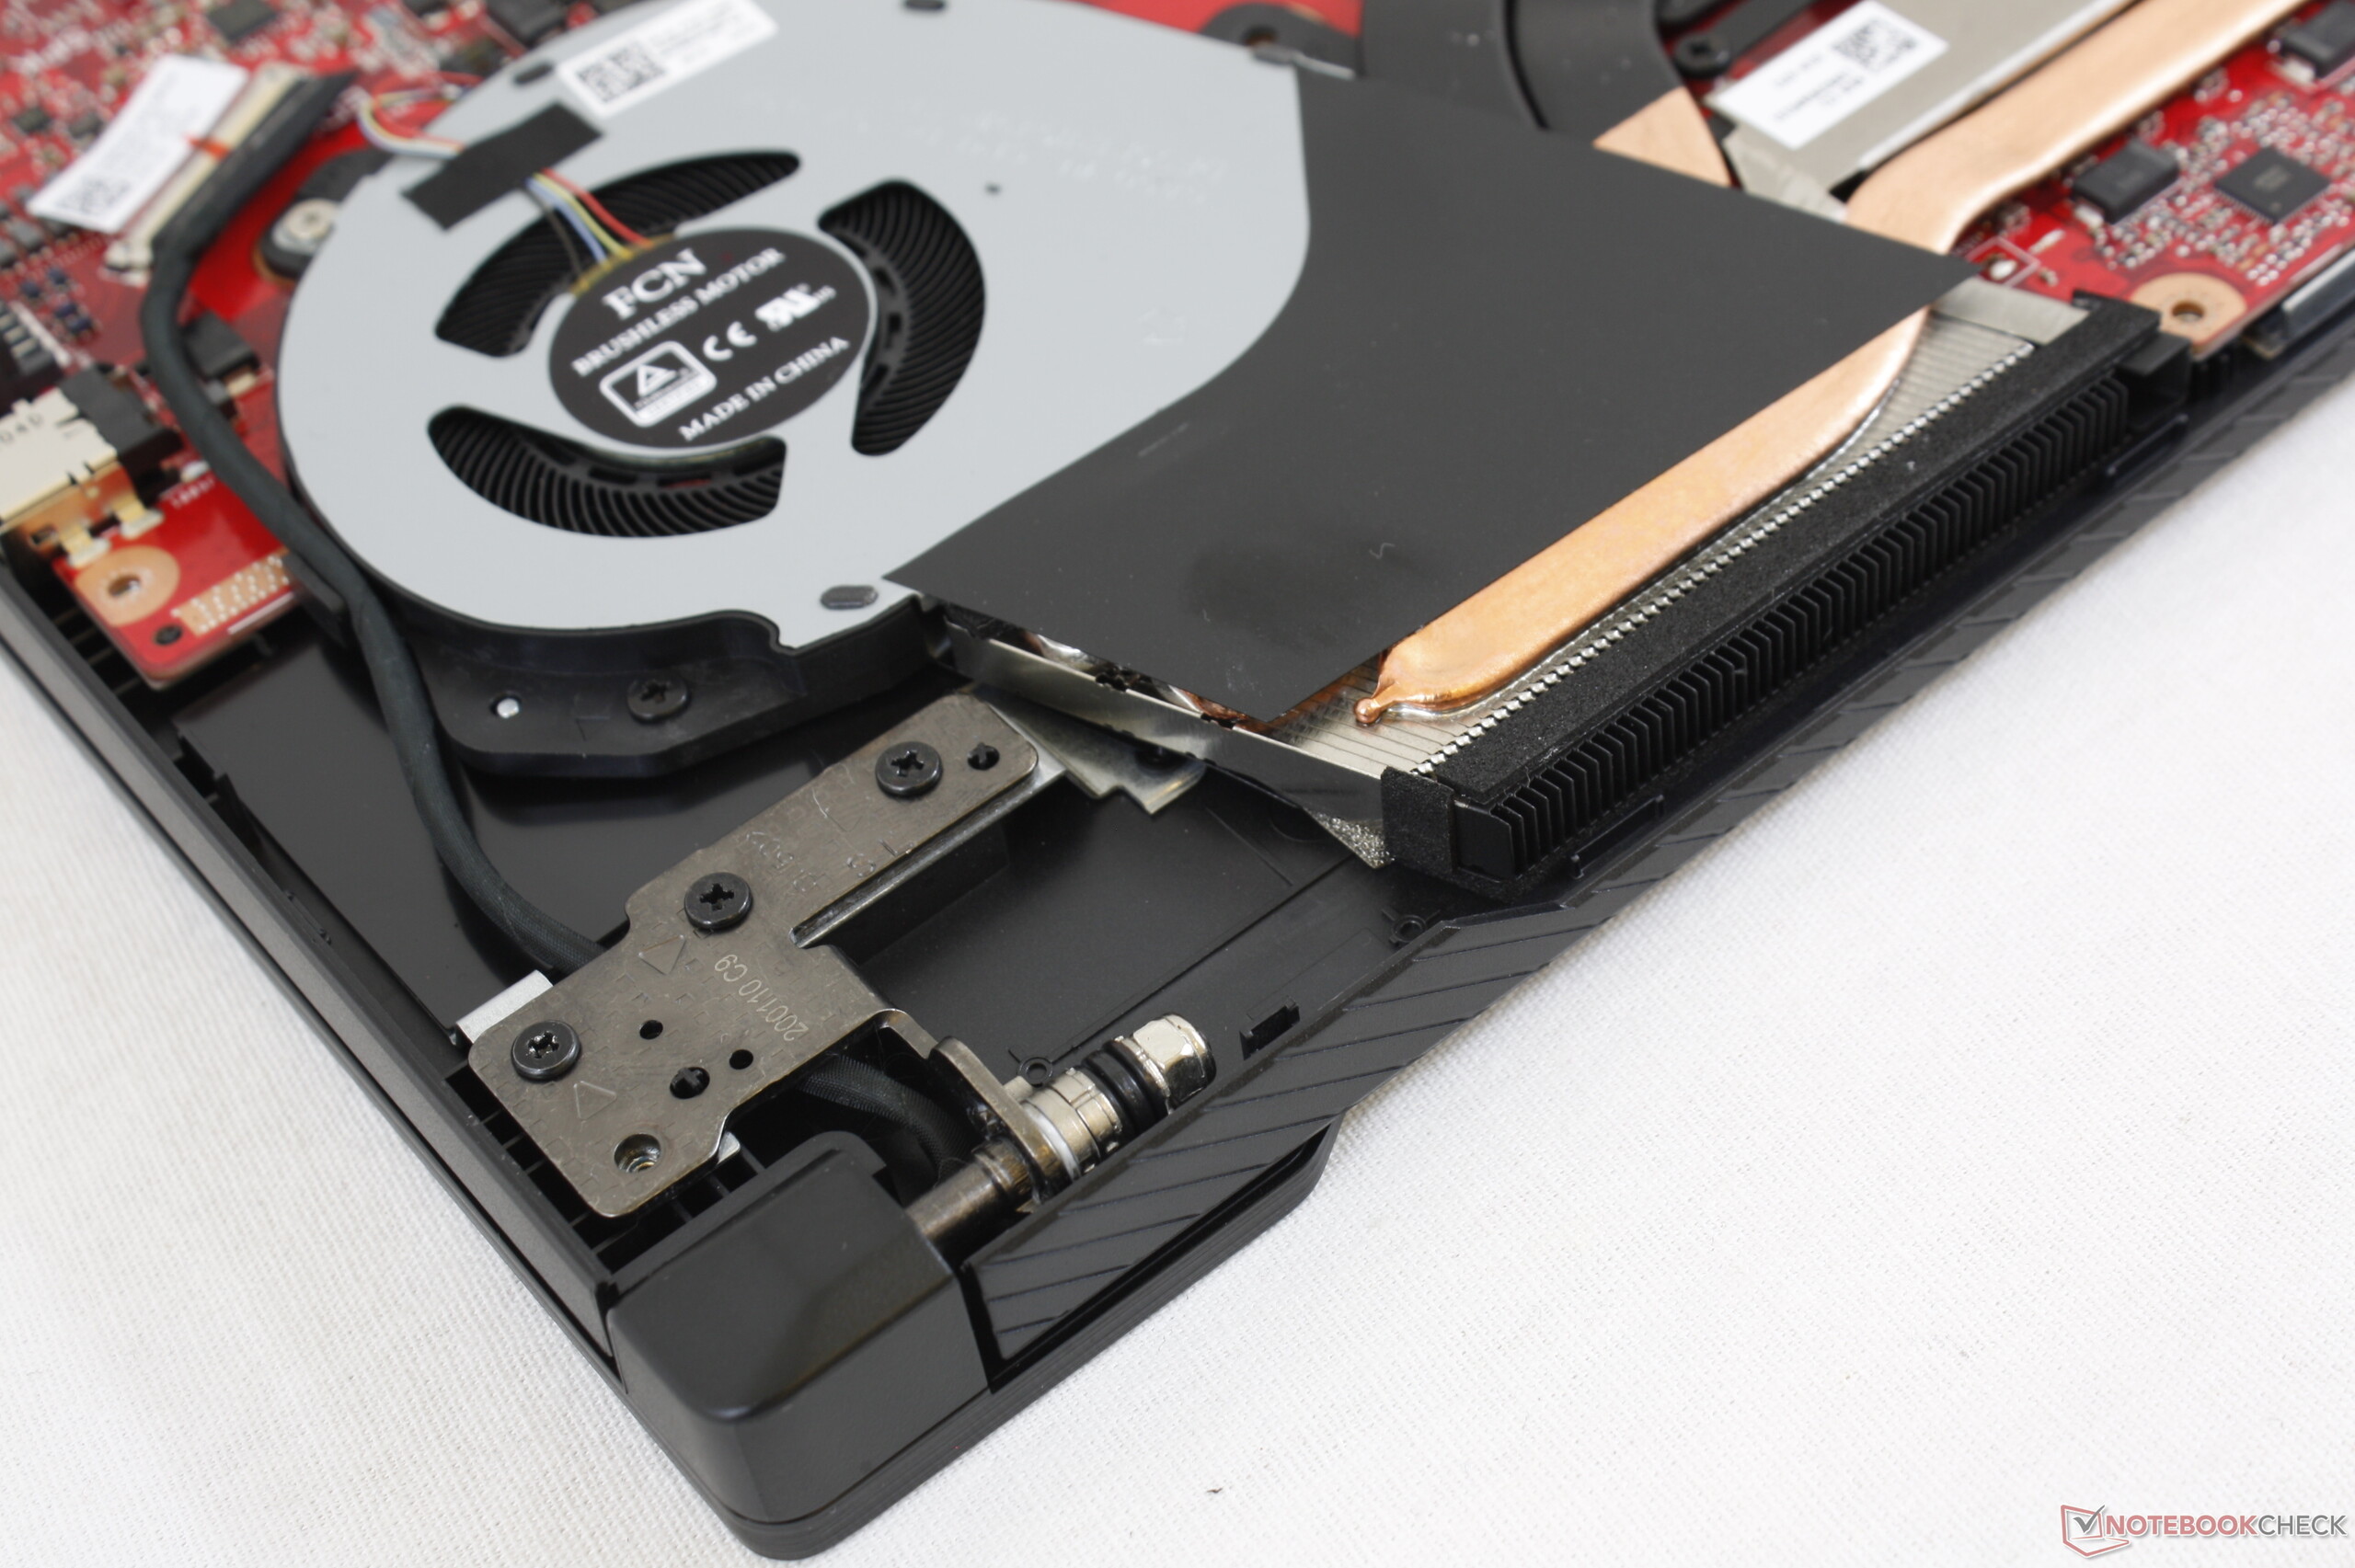
(-) De maximumtemperatuur aan de bovenzijde bedraagt 52.2 °C / 126 F, vergeleken met het gemiddelde van 40.4 °C / 105 F, variërend van 21.2 tot 68.8 °C voor de klasse Gaming.
(-) De bodem warmt op tot een maximum van 65 °C / 149 F, vergeleken met een gemiddelde van 43.2 °C / 110 F
(+) Bij onbelast gebruik bedraagt de gemiddelde temperatuur voor de bovenzijde 27.2 °C / 81 F, vergeleken met het apparaatgemiddelde van 33.9 °C / 93 F.
(±) Bij het spelen van The Witcher 3 is de gemiddelde temperatuur voor de bovenzijde 35.8 °C / 96 F, vergeleken met het apparaatgemiddelde van 33.9 °C / 93 F.
(+) De palmsteunen en het touchpad zijn met een maximum van ###max## °C / 77.7 F koeler dan de huidtemperatuur en voelen daarom koel aan.
(+) De gemiddelde temperatuur van de handpalmsteun van soortgelijke toestellen bedroeg 28.8 °C / 83.8 F (+3.4 °C / 6.1 F).
Asus ROG Zephyrus G15 GA502IU-ES76 audioanalyse
(±) | luidspreker luidheid is gemiddeld maar goed (81 dB)
Bas 100 - 315 Hz
(±) | verminderde zeebaars - gemiddeld 5.9% lager dan de mediaan
(±) | lineariteit van de lage tonen is gemiddeld (11.4% delta ten opzichte van de vorige frequentie)
Midden 400 - 2000 Hz
(+) | evenwichtige middens - slechts 2.2% verwijderd van de mediaan
(+) | de middentonen zijn lineair (4% delta ten opzichte van de vorige frequentie)
Hoog 2 - 16 kHz
(±) | higher highs - on average 6.5% higher than median
(+) | de hoge tonen zijn lineair (6.5% delta naar de vorige frequentie)
Algemeen 100 - 16.000 Hz
(+) | het totale geluid is lineair (13.1% verschil met de mediaan)
Vergeleken met dezelfde klasse
» 18% van alle geteste apparaten in deze klasse waren beter, 4% vergelijkbaar, 78% slechter
» De beste had een delta van 6%, het gemiddelde was 18%, de slechtste was 132%
Vergeleken met alle geteste toestellen
» 13% van alle geteste apparaten waren beter, 3% gelijk, 84% slechter
» De beste had een delta van 4%, het gemiddelde was 23%, de slechtste was 134%
Apple MacBook 12 (Early 2016) 1.1 GHz audioanalyse
(+) | luidsprekers kunnen relatief luid spelen (83.6 dB)
Bas 100 - 315 Hz
(±) | verminderde zeebaars - gemiddeld 11.3% lager dan de mediaan
(±) | lineariteit van de lage tonen is gemiddeld (14.2% delta ten opzichte van de vorige frequentie)
Midden 400 - 2000 Hz
(+) | evenwichtige middens - slechts 2.4% verwijderd van de mediaan
(+) | de middentonen zijn lineair (5.5% delta ten opzichte van de vorige frequentie)
Hoog 2 - 16 kHz
(+) | evenwichtige hoogtepunten - slechts 2% verwijderd van de mediaan
(+) | de hoge tonen zijn lineair (4.5% delta naar de vorige frequentie)
Algemeen 100 - 16.000 Hz
(+) | het totale geluid is lineair (10.2% verschil met de mediaan)
Vergeleken met dezelfde klasse
» 7% van alle geteste apparaten in deze klasse waren beter, 2% vergelijkbaar, 90% slechter
» De beste had een delta van 5%, het gemiddelde was 18%, de slechtste was 53%
Vergeleken met alle geteste toestellen
» 5% van alle geteste apparaten waren beter, 1% gelijk, 94% slechter
» De beste had een delta van 4%, het gemiddelde was 23%, de slechtste was 134%
| Uit / Standby | |
| Inactief | |
| Belasting |
|
Key:
min: | |
| Asus ROG Zephyrus G15 GA502IU-ES76 R7 4800HS, GeForce GTX 1660 Ti Max-Q, Intel SSD 660p 1TB SSDPEKNW010T8, IPS, 1920x1080, 15.6" | Asus ROG Zephyrus Duo 15 GX550LXS i9-10980HK, GeForce RTX 2080 Super Max-Q, 2x Samsung PM981a MZVLB1T0HBLR (RAID 0), IPS, 3840x2160, 15.6" | Asus ROG Zephyrus G15 GA502DU R7 3750H, GeForce GTX 1660 Ti Max-Q, Intel SSD 660p SSDPEKNW512G8, IPS, 1920x1080, 15.6" | Razer Blade 15 RTX 2070 Super Max-Q i7-10875H, GeForce RTX 2070 Super Max-Q, Samsung SSD PM981a MZVLB512HBJQ, IPS, 1920x1080, 15.6" | Lenovo Legion 5 15IMH05H i5-10300H, GeForce RTX 2060 Mobile, Samsung PM991 MZALQ512HALU, IPS, 1920x1080, 15.6" | MSI GS66 Stealth 10SE-045 i7-10750H, GeForce RTX 2060 Mobile, Samsung SSD PM981 MZVLB1T0HALR, IPS, 1920x1080, 15.6" | Eluktronics RP-15 R7 4800H, GeForce RTX 2060 Mobile, Phison PM81000GPMQCN28BTF-E12S4 M.2 NVM SSD, IPS, 1920x1080, 15.6" | |
|---|---|---|---|---|---|---|---|
| Power Consumption | -204% | -68% | -147% | -17% | -95% | -176% | |
| Idle Minimum * (Watt) | 5.1 | 23 -351% | 7.4 -45% | 14.3 -180% | 3.2 37% | 7 -37% | 21.7 -325% |
| Idle Average * (Watt) | 8.4 | 30 -257% | 8.6 -2% | 22.3 -165% | 8.3 1% | 18 -114% | 30.1 -258% |
| Idle Maximum * (Watt) | 9.1 | 39 -329% | 39.1 -330% | 36.9 -305% | 8.7 4% | 31 -241% | 35 -285% |
| Load Average * (Watt) | 55.1 | 156 -183% | 65.9 -20% | 118.4 -115% | 82 -49% | 107 -94% | 112.6 -104% |
| Witcher 3 ultra * (Watt) | 97.5 | 152 -56% | 106.9 -10% | 153.7 -58% | 151 -55% | 146 -50% | 134.4 -38% |
| Load Maximum * (Watt) | 140.2 | 208 -48% | 141.3 -1% | 220.8 -57% | 195 -39% | 186 -33% | 201.5 -44% |
* ... kleiner is beter
| Asus ROG Zephyrus G15 GA502IU-ES76 R7 4800HS, GeForce GTX 1660 Ti Max-Q, 76 Wh | Asus ROG Zephyrus Duo 15 GX550LXS i9-10980HK, GeForce RTX 2080 Super Max-Q, 90 Wh | Asus ROG Zephyrus G15 GA502DU R7 3750H, GeForce GTX 1660 Ti Max-Q, 76 Wh | Razer Blade 15 RTX 2070 Super Max-Q i7-10875H, GeForce RTX 2070 Super Max-Q, 80 Wh | Lenovo Legion 5 15IMH05H i5-10300H, GeForce RTX 2060 Mobile, 60 Wh | MSI GS66 Stealth 10SE-045 i7-10750H, GeForce RTX 2060 Mobile, 99.9 Wh | Eluktronics RP-15 R7 4800H, GeForce RTX 2060 Mobile, 46.7 Wh | |
|---|---|---|---|---|---|---|---|
| Batterijduur | -22% | 59% | 19% | 36% | 4% | -32% | |
| Reader / Idle (h) | 7.1 | 8 13% | 15.3 115% | 14.1 99% | 9 27% | ||
| WiFi v1.3 (h) | 5.3 | 3.1 -42% | 8 51% | 6.3 19% | 7.2 36% | 6.4 21% | 3.6 -32% |
| Load (h) | 1.9 | 1.2 -37% | 2.1 11% | 1.4 -26% | 1.2 -37% |
Pro
Contra

Voor het volledige, Engelse testrapport, klik hier.
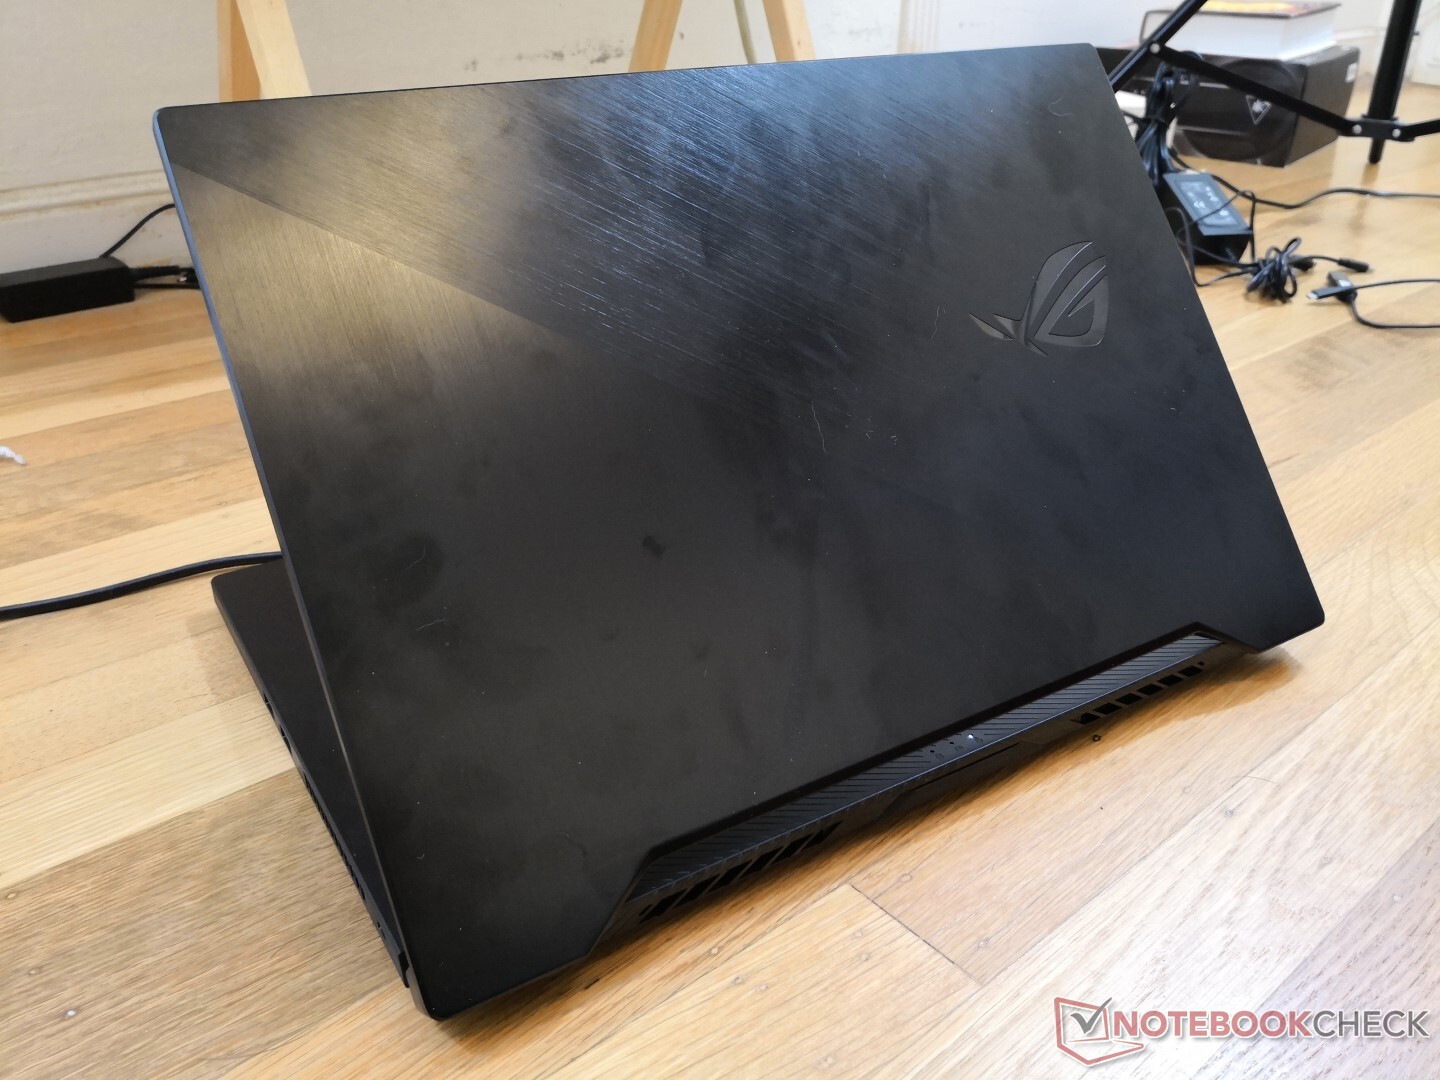
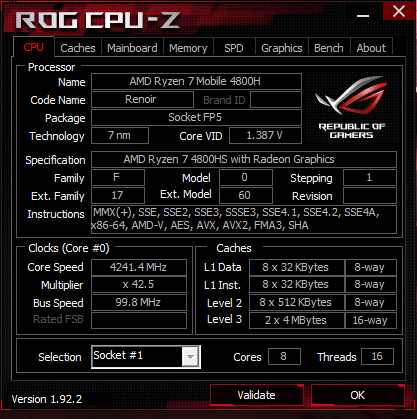
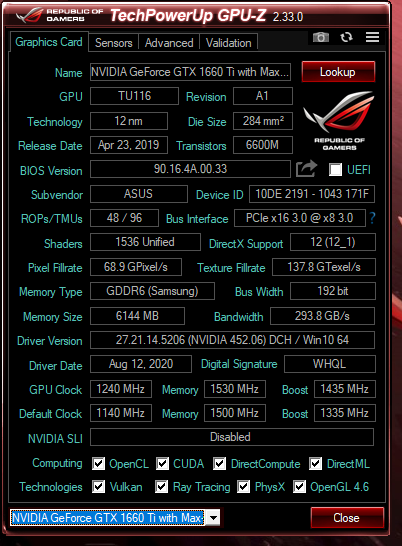
Het staat vast dat de Zephyrus G15 GA502IU een enorme verbetering is ten opzichte van de GA502DU in termen van processorkracht. De prestaties per watt zijn verbazingwekkend door de combinatie van een 7 nm Ryzen CPU en GeForce Max-Q GPU, terwijl het chassis zowel klein als aantrekkelijk is voor de prijs. In vergelijking met budgetconcurrenten als de Acer Nitro 5, MSI GL/GF-serie, Dell G series of Aorus G series zal de Zephyrus G15 zeker opvallen.
De belangrijkste nadelen van de GA502IU zijn de prijs en het display. Voor €1300 USD is het systeem duurder dan de meeste andere alternatieven die er zijn met dezelfde GeForce GTX 1660 Ti GPU. U betaalt in wezen extra voor de nieuwe AMD CPU en het gestroomlijnde chassisontwerp dat veel budgetgame-laptops niet hebben. Ondertussen zijn de gemiddelde kleurruimte en de reactietijden van het 144 Hz paneel enigszins teleurstellend. De hoger gelegen 240 Hz-configuratie richt zich zogenaamd op deze zorgen, maar zo'n optie vereist meer van uw portemonnee. Dit is nog steeds een geweldige budget mid-range gaming laptop, vooral als je er een kunt vinden in de aanbieding.
De Asus Zephyrus G15 GA502IU biedt uitstekende processorprestaties in een aantrekkelijk chassisontwerp dat moeilijk te verslaan is voor de prijs. Het grafische vermogen, de feedback van het toetsenbord, de reactietijden van de display en de kleurnauwkeurigheid zijn echter een beetje ondermaats. Het is jammer dat zo'n geweldige processor op dit moment niet breder beschikbaar is op andere modellen.
Asus ROG Zephyrus G15 GA502IU-ES76
- 10-09-2020 v7 (old)
Allen Ngo
Price comparison
